SECURITIES AND EXCHANGE COMMISSION
(Mark One)
þ |
| |
| þ | ANNUAL REPORT PURSUANT TO SECTION 13 OR 15(d) OF THE SECURITIES EXCHANGE ACT OF 1934 |
For the fiscal year ended June 30, 20102012 ¨ |
| |
| ¨ | TRANSITION REPORT PURSUANT TO SECTION 13 OR 15(d) OF THE SECURITIES EXCHANGE ACT OF 1934 |
For the transition period from to
Commission file number: 001-34249
(Exact Name of Registrant as Specified in Its Charter)
|
| | |
Delaware | | 95-0725980 |
| Delaware | | 95-0725980 |
| (State of Incorporation) | | (I.R.S. Employer Identification No.) |
20333 South Normandie Avenue, Torrance, California 90502
(Address of Principal Executive Offices; Zip Code)
310-787-5200
Registrant’s telephone number, including area code
310-787-5200
Securities registered pursuant to Section 12(b) of the Act:
|
| | |
| Title of Each Class | | Name of Each Exchange on Which Registered |
| Common Stock, $1.00 par value | | The NASDAQ Stock Market LLC |
Securities registered pursuant to Section 12(g) of the Act:
| | |
Title of Each Class
| | Name of Each Exchange on Which Registered
|
Common Stock, $1.00 par value | | NASDAQ |
None
Indicate by check mark if the registrant is a well-known seasoned issuer, as defined in Rule 405 of the Securities Act. YES þ NO ¨ Indicate by check mark if the registrant is not required to file reports pursuant to Section 13 or Section 15(d) of the Act. YES ¨ NO þ Indicate by check mark whether the registrant: (1) has filed all reports required to be filed by Section 13 or 15(d) of the Securities Exchange Act of 1934 during the preceding 12 months (or for such shorter period that the registrant was required to file such reports), and (2) has been subject to such filing requirements for the past 90 days. YES þ NO ¨ Indicate by check mark whether the registrant has submitted electronically and posted on its corporate Web site, if any, every Interactive Data File required to be submitted and posted pursuant to Rule 405 of Regulation S-T (§232.405 of this chapter) during the preceding 12 months (or for such shorter period that the registrant was required to submit and post such files). YES þ NO ¨ NO ¨
Indicate by check mark if disclosure of delinquent filers pursuant to Item 405 of Regulation S-K (§229.405) is not contained herein, and will not be contained, to the best of registrant’s knowledge, in definitive proxy or information statements incorporated by reference in Part III of this Form 10-K or any amendment to this Form 10-K. þ Indicate by check mark whether the registrant is a large accelerated filer, an accelerated filer, a non-accelerated filer or a smaller reporting company.
Large accelerated filer ¨ Accelerated filer þ Non-accelerated filer ¨ Smaller reporting company ¨ Indicate by check mark whether the registrant is a shell company (as defined in Rule 12b-2 of the Exchange Act). YES ¨ NO þ The aggregate market value of the voting and non-voting common equity held by non-affiliates computed by reference to the closing price at which the Farmer Bros. Co. common stock was sold on December 31, 200930, 2011 was approximately $158 million.DOCUMENTS INCORPORATED BY REFERENCE$61.5 million
The following documents are incorporated by reference into Part III.
As of this Form 10-K: certain portions of the definitive proxy statement for the fiscal year ended June 30, 2010 that is expected to be filed with the U.S. Securities and Exchange Commission on or before October 28, 2010.On
September 10, 20106, 2012 the registrant had 16,164,01916,307,324 shares outstanding of its common stock, par value $1.00 per share, which is the registrant’s only class of common stock. DOCUMENTS INCORPORATED BY REFERENCE
Portions of the registrant’s definitive proxy statement to be filed with the U.S. Securities and Exchange Commission (“SEC”) pursuant to Regulation 14A in connection with the registrant’s 2012 Annual Meeting of Stockholders (the “Proxy Statement”) or portions of the registrant’s 10-K/A, to be filed subsequent to the date hereof, are incorporated by reference into Part III of this report. Such Proxy Statement or 10-K/A will be filed with the SEC not later than 120 days after the conclusion of the registrant’s fiscal year ended June 30, 2012.
CAUTIONARY NOTE REGARDING FORWARD-LOOKING STATEMENTS
Certain statements contained in this annual report on Form 10-K are not based on historical fact and are forward-looking statements within the meaning of federal securities laws and regulations. These statements are based on management’s current expectations, assumptions, estimates and observations of future events and include any statements that do not directly relate to any historical or current fact. These forward-looking statements can be identified by the use of words like “anticipates,” “estimates,” “projects,” “expects,” “plans,” “believes,” “intends,” “will,” “assumes” and other words of similar meaning. Owing to the uncertainties inherent in forward-looking statements, actual results could differ materially from those set forth in forward-looking statements. We intend these forward-looking statements to speak only at the time of this report and do not undertake to update or revise these statements as more information becomes available except as required under federal securities laws and the rules and regulations of the SEC. Factors that could cause actual results to differ materially from those in forward-looking statements include, but are not limited to, fluctuations in availability and cost of green coffee, competition, organizational changes, the impact of a weaker economy, business conditions in the coffee industry and food industry in general, our continued success in attracting new customers, variances from budgeted sales mix and growth rates, weather and special or unusual events, changes in the quality or dividend stream of third parties’ securities and other investment vehicles in which we have invested our assets, as well as other risks described in this report and other factors described from time to time in our filings with the SEC.
Farmer Bros. Co., a Delaware corporation (including its consolidated subsidiaries unless the context otherwise requires, the “Company,” “we,” “our” or “Farmer Bros.”), is a manufacturer, wholesaler and distributor of coffee, tea and culinary productsproducts. We are a direct distributor of coffee to institutional food service establishments including restaurants, hotels, casinos, hospitals and food serviceother foodservice providers, as well asand a provider of private brand coffee programs to Quick Serve Restaurants ("QSR's"), grocery retailers, such asnational drugstore chains, restaurant chains, convenience stores, and independent coffee houses, general merchandisers, private-label retailers and grocery stores.nationwide. We were founded in 1912, were incorporated in California in 1923, and reincorporated in Delaware in 2004. We operate in one business segment and are in the business of roasting, packaging, and distributingsegment.
Business Strategy
Our mission is to “sell great coffee, tea and culinary products and provide superior service—one customer at a time.” We reach our customers in two ways: through directour nationwide Direct-Store-Delivery (“DSD”) network of approximately 500 delivery routes, 117 branch warehouses and brokered salessix distribution centers, and by using the distribution channels of our national retail and institutional customers. We differentiate ourselves in the marketplace through our customer service model. We offer value-added services including beverage equipment service, menu solutions, wherein we recommend products, how these products are prepared in the kitchen and presented on the menu, and hassle-free inventory and product procurement management to our customers throughoutfoodservice customers. These services are conducted primarily in person through Regional Sales Representatives, or RSR’s, who develop personal relationships with chefs, restaurant owners and food buyers at their drop off locations. We also provide comprehensive coffee programs, including private brand development, green coffee procurement, category management, and supply chain management to our national retail customers.
We manufacture and distribute products under our own brands, as well as under private labels on behalf of certain customers. Our branded products are sold primarily into the contiguous United States.foodservice channel, and are comprised of both national and regional brands. National foodservice brands include The Artisan Collection by Farmer Brothers™, Farmer Brothers
Business Strategy®On April 27,, Superior®, Metropolitan®, Island Medley Iced Tea®, Farmer Brothers Spice Products™, Sierra Tea™ and Orchard Hills Estate™. Regional foodservice and retail brands include Cain's®, Ireland® and McGarvey®.
Since 2007, to enhance our product offerings to include specialty coffee products, we completedFarmer Bros. has achieved growth, primarily through the acquisition in 2007 of Coffee Bean Holding Co., Inc., a Delaware corporation (“CBH”("CBH"), the parent company of Coffee Bean International, Inc., an Oregon corporation (“CBI”), a specialty coffee manufacturer and wholesaler headquartered in Portland, Oregon, (the “CBI Acquisition”). To expand our national presence and improve our channel penetration, on February 28, 2009, we completed the acquisition in 2009 from Sara Lee Corporation a Maryland corporation (“Sara Lee”), and Saramar, L.L.C., a Delaware limited liability company (“Saramar” and collectively with Sara Lee, “Seller Parties”) of certain assets used in connection with Seller Parties’ direct store deliveryits DSD coffee business in the United States (the “DSD Coffee Business”). The acquired business also included the distribution, sale and service of brewed and liquid coffee equipment, as well as the right to distribute sauces and dressings to customers of the DSD Coffee Business. Our mission is to “sell great coffee, tea and culinary products and provide superior service—one customer at a time.” The acquisition of the DSD Coffee Business in fiscal 2009 furthered our efforts to achieve this mission. As a primary result of this acquisition, our sales grew to $450.3 million in fiscal 2010 from $266.5 million in fiscal 2008, and we acquired over 2,000 new SKU’s and over 60 trademarks, tradenames and service marks including the major regional brands MCGARVEY®, CAIN’S®, IRELAND®, JUSTIN LLOYD®, METROPOLITAN®, PREBICA®, WECHSLER®, WORLD’S FINEST® and CAFÉ ROYAL®, and the national brand SUPERIOR®, broadened and diversified our customer base to include a major presence in the gaming industry as well as significant national chain accounts, and expanded geographically from our previous 28 state marketing area into all 48 contiguous states. In fiscal 2010 we completed the post-acquisition integration of the DSD Coffee Business in an effort to realize the selling and operating efficiencies of the combined organization through consolidation of product offerings and SKU’s, streamlining of routes and distribution logistics, and consolidation of warehouses and distribution centers, with an expanded, customer-focused organization enabled by enhanced information management tools and training.Business Operations
Our product line is specifically focused on the needs of our market segment: institutional food service establishments includingthe markets we serve: restaurants, hotels, casinos, hospitals and food serviceother foodservice providers, as well as private brand retailers such asin the QSR, grocery, drugstore, restaurant, convenience stores, coffee houses, general merchandisers, private-label retailersstore and grocery stores.independent coffeehouse channels. Our product line of over 3,000 SKU's (excluding private label), includes roasted coffee, liquid coffee, coffee relatedcoffee-related products such as coffee filters, sugar and creamers, assorted teas, cappuccino, cocoa, spices, gelatins and puddings, soup bases, gravy and sauce mixes, pancake and biscuit mixes, and jellies and preserves. Our product line presently includes over 400 core product offerings. For the past three fiscal years, sales of roasted coffee products represented approximately 50% of our total sales and no single product other than roasted coffee accounted for more than 10% of our total sales.
Coffee purchasing, roasting and packaging takes place at our Torrance, California; Portland, Oregon; and Houston, Texas plants.Spice blending and packaging takes place at our Torrance, California and Oklahoma City, Oklahoma plants.plant. Our distribution centers include our Torrance, Houston,Portland and PortlandHouston plants, and distribution centers in Fridley, Minnesota; Northlake, Illinois; Oklahoma City, Oklahoma; and Moonachie, New Jersey.
In
July 2011, we closed our distribution center in Fridley, Minnesota. We are focused on distributing our owned brands through our DSD network, while continuing to support and grow our private brand national accounts customers. To provide value to our current and potential customers, in fiscal 2012, we made the following investments:
•Specialty coffee: We have developed a specialty line of coffees called "The Artisan Collection by Farmers Brothers™." Pre-launched at the National Restaurant Association tradeshow in May 2012, this new line of coffees establishes an owned brand presence in the growing specialty coffee market, leveraging the blending, roasting and packaging capabilities of CBI.
•Unified brand: We have developed a unified corporate identity for our business nationwide that is reflected in our updated packaging, our website, many of our fleet vehicles, and in all of our sales materials.
•Optimized portfolio: In fiscal 2012, we continued to optimize and simplify our product portfolio. We eliminated over
1,000 SKU's and plan to eliminate a significant number of additional SKU's in fiscal 2013. These SKU reductions allow us to focus our resources on promoting and supporting fewer brands while lowering inventory and production costs.
•Service improvements: We have invested in sales and training for all of our RSRs, allowing us to expand the role we play as beverage consultants for our DSD customers.
We have also made the following investments to support our private brand national accounts business:
•Coffee industry leadership: Through our dedication to the craft of sourcing, blending and roasting coffee, and our leadership positions with the Specialty Coffee Association of America, World Coffee Research and Coffee Quality Institute, we work to help shape the future of the coffee industry. We believe that due to our commitment to the industry and our leadership role in shaping the industry's future, large retail and foodservice operators are drawn to working with us.
•Market insight: We have developed a market insight capability internally that reinforces our business-to-business positioning as a thought leader in the coffee industry. We provide trend insights that help our customers create winning products and integrated marketing strategies for their own coffee brands.
•Sustainability leadership: Due to our proactive efforts in counting carbon, creating programs for waste and energy reduction, and creating farmer relationship programs abroad, we are in a unique position to help retailers and foodservice operators create differentiated coffee sustainability programs such as carbon neutrality programs, direct trade coffee programs, and packaging material reductions.
Raw Materials and Supplies
Our primary raw material is green coffee, an agricultural commodity.
GreenThe bulk of the world's green coffee
supplies is
mainly grown outside the United States and can be subject to volatile price fluctuations. Weather, real or perceived
supply shortages,
speculation in the commodity markets, political unrest, labor actions, currency fluctuations, armed conflict in coffee producing nations, and government actions, including treaties and trade controls between the U.S. and coffee producing nations can affect the price of green coffee. Green specialty coffees sell at a premium to other green coffees due to the inability of producers to increase supply in the short run to meet rising demand. As a result, the price spread between specialty coffee and non-specialty coffee is likely to widen as demand
for specialty coffee continues to increase.
Producer organizations
Green coffee prices can also
affect green coffee prices.be affected by the actions of producer organizations. The most prominent of these are the Colombian Coffee Federation, Inc. (CCF) and the International Coffee Organization (ICO). These organizations seek to increase green coffee prices largely by attempting to restrict supplies, thereby limiting the availability of green coffee to coffee consuming nations.
As a result, these organizations or others may succeed in raising green coffee prices.
Other raw materials used in the manufacture of our tea and culinary products include a wide variety of spices, such as pepper, chilies, oregano and thyme, as well as cocoa, dehydrated milk products, salt and sugar. These raw materials are agricultural products and can be subject to wide cost fluctuations.
SuchIn fiscal 2011 and in the first half of fiscal 2012, fluctuations
however, historically have notin commodity prices, specifically coffee commodity prices, had a material effect on our operating results.
We own 120160 registered trademarks which are integral to customer identification of our products. It is not possible to assess the impact of the loss of such identification. TheAdditionally, in connection with the DSD Coffee Business acquisition, the Company and Sara Lee have entered into certain operational agreements that include trademark and formula license agreements. In
February 2012, the trademark agreements and formula license agreements with Sara Lee were assigned to the J.M. Smucker Company ("J.M. Smucker") as part of an acquisition transaction between J.M. Smucker and Sara Lee. We experience some seasonal influences. The winter months are generally the
beststrongest sales months. However, our product line and geographic diversity provide some sales stability during the warmer months when coffee consumption ordinarily decreases. Additionally, we usually experience an increase in sales during the summer
and early fall months from seasonal businesses located in vacation
areas.areas, and from grocery retailers ramping up inventory for the winter selling season.
Distribution
DistributionMost sales are made “off-truck” to our customers at their places of business by our sales representatives who are responsible for soliciting, selling and collecting from and otherwise maintaining our customer accounts. We serve our customers from sevensix distribution centers strategically located for national coverage. Our distribution trucks are replenished from 115117 branch warehouses located throughout the contiguous United States. We operate our own trucking fleet to support our long-haul distribution requirements. A portion of our products areis distributed by third parties or areis direct shipped via common
carrier. We maintain inventory levels at each branch warehouse to allow for minimal interruption in supply.
We serve a wide variety of customers, from small restaurants and donut shops to large institutional buyers like restaurant chains, hotels, casinos, hospitals,
food servicefoodservice providers,
and convenience
stores. As a result of the CBI Acquisition we added additional customer categories includingstores, gourmet coffee houses,
private-labelbakery/café chains, national drugstore chains, large regional and national grocery and specialty food retailers, national mass market merchandisersQSR's and other national accounts, and grocery stores. Wegaming establishments. Within our DSD channel, we believe on-premise customer contact, our large distribution network, and our relationship-based high quality service quality,model are integral to our sales effort.past and future success. No single customer represents a significant concentration of sales. As a result, the loss of one or more of our larger customer accounts is not likely to have a material adverse effect on our results of operations.
We face competition from many sources, including the institutional
food servicefoodservice divisions of multi-national manufacturers of retail products such as
The J.M. Smucker
Company (Folgers Coffee),
Dunkin' Donuts and Kraft Foods Inc. (Maxwell House Coffee)
and Sara Lee Corporation,, wholesale
groceryfoodservice distributors such as Sysco Corporation and U.S.
Food Service,Foods, regional institutional coffee roasters such as S & D Coffee, Inc. and Boyd Coffee Company, and specialty coffee suppliers such as Green Mountain Coffee Roasters, Inc.
, Rogers Family Company, Distant Lands Coffee, Mother Parkers Tea & Coffee, Inc., and Peet’s Coffee & Tea, Inc.
As many of our customers are small foodservice operators, we also compete with club stores such as Costco and Restaurant Depot. We believe our longevity, the quality of our products, our national distribution network and our
comprehensive and superior customer service are the major factors that differentiate us from our competitors.
Competition is robust and is primarily based on products and price, with distribution
and service often a major factor. Most of our customers rely on us for distribution; however, some of our customers use third party distribution or conduct their own distribution. Some of our customers are “price” buyers, seeking the low cost provider with little concern about service, while others find great value in the service programs we provide. We compete well when service and distribution are valued by our customers, and are less effective when only price matters. Our customer base is price sensitive, and we are often faced with price competition.
We finance our operations internally and through borrowings under our $50.0$85.0 million senior secured revolving credit facility with Wells Fargo Bank, National Association, successor by merger to Wachovia Bank, National Association (“Wells Fargo”). We believe this credit facility, to the extent available, in addition to our cash flows from operations and other liquid assets, providesare sufficient to fund our working capital resources and flexibilitycapital expenditure requirements for the next twelve months to allow us to meet necessary working capital requirements and implement our business plan without relying solely on cash flow from operations.12 months.
We have no material revenues from foreign operations.
Other
OtherOn June 30, 20102012 we employed 2,0301,821 employees, 692624 of whom are subject to collective bargaining agreements.Compliance with government regulations relating to the discharge of materials into the environment, or otherwise relating to protection of the environment, has not had a material effect on our financial condition or results of operations. The nature of our business does not provide for maintenance of or reliance upon a sales backlog. None of our business is subject to renegotiation of profits or termination of contracts or subcontracts at the election of the government.
Our Internet website address is http://www.farmerbros.com (the website address is not intended to function as a hyperlink, and the information contained in our website is not intended to be part of this filing), where we make available, free of charge, copies of our annual report on Form 10-K, quarterly reports on Form 10-Q and current reports on Form 8-K including amendments thereto as soon as reasonably practicable after filing such material electronically or otherwise furnishing it to the Securities and Exchange Commission (“SEC”).
Certain statements contained in this annual report on Form 10-K are not based on historical fact and are forward-looking statements within the meaning of federal securities laws and regulations. These statements are based on management’s current expectations, assumptions, estimates and observations of future events and include any statements that do not directly relate to any historical or current fact. These forward-looking statements can be identified by the use of words like “anticipates,” “estimates,” “projects,” “expects,” “plans,” “believes,” “intends,” “will,” “assumes” and other words of similar meaning. Owing to the uncertainties inherent in forward-looking statements, actual results could differ materially from those set forth in forward-looking statements. We intend these forward-looking statements to speak only at the time of this report and do not undertake to update or revise these statements as more information becomes available except as required under federal securities laws and the rules and regulations of the SEC. Factors that could cause actual results to differ materially from those in forward-looking statements include, but are not limited to, fluctuations in availability and cost of green coffee, competition, organizational changes, our ability to successfully integrate the CBI and DSD Coffee Business acquisitions, the impact of a weaker economy, business conditions in the coffee industry and food industry in general, our continued success in attracting new customers, variances from budgeted sales mix and growth rates, weather and special or unusual events, changes in the quality or dividend stream of third parties’ securities and other investment vehicles in which we have invested our assets, as well as other risks described in this report and other factors described from time to time in our filings with the SEC.
You should consider each of the following factors as well as the other information in this report, including our
consolidated financial statements and the related notes, in evaluating our business and our prospects. The risks and uncertainties described below are not the only ones we face. Additional risks and uncertainties not presently known to us or that we currently consider immaterial may also negatively affect our business operations. If any of the following risks actually occurs, our business and financial results could be harmed. In that case, the trading price of our common stock could decline.
INCREASES IN THE COST OF GREEN COFFEE COULD REDUCE OUR GROSS MARGIN AND PROFIT.
Our primary raw material is green coffee, an agricultural commodity. GreenThe bulk of the world's green coffee supply is mainly grown outside the United States and can be subject to volatile price fluctuations. Weather, real or perceived supply shortages, speculation in the commodity markets, political unrest, labor actions, currency fluctuations, armed conflict in coffee producing nations, and government actions, including treaties and trade controls between the U.S. and coffee producing nations, can affect the price of green coffee. GreenIn fiscal 2011, the market for green Arabica coffee increased approximately 80% per pound compared to the prior fiscal year. Additionally, green specialty coffees sell at a premium to other green coffees due to the inability of producers to increase supply in the short run to meet rising demand. As a result, the price spread between specialty coffee and non-specialty coffee is likely to widen as demand for specialty coffee continues to increase. Green coffee prices can also be affected by the actions of producer organizations. The most prominent of these are the Colombian Coffee Federation, Inc. (CCF) and the International Coffee Organization (ICO). These organizations seek to increase green coffee prices largely by attempting to restrict supplies, thereby limiting the availability of green coffee to coffee consuming nations. As a result, these organizations or others may succeed in raising green coffee prices.
In the past, we generally have been able to pass on increases in green coffee costs to our customers. However, there
There can be no assurance that we will be successful in passing
such fluctuationscommodity price increases on to our customers without losses in sales volume or gross margin in the future.
Similarly, rapid, sharp decreases in the cost of green coffee could also force us to lower sales prices before realizing cost reductions in our green coffee inventory. Additionally, if green coffee beans from a region become unavailable or prohibitively expensive, we could be forced to use alternative coffee beans or discontinue certain blends, which could adversely impact our sales.
OUR EFFORTS TO SECURE AN ADEQUATE SUPPLY OF QUALITY COFFEES MAY BE UNSUCCESSFUL AND IMPACT OUR ABILITY TO SUPPLY OUR CUSTOMERS OR EXPOSE US TO COMMODITY PRICE RISK.
Some of the Arabica coffee beans of the quality we purchase do not trade directly on the commodity markets. Rather, we purchase
the high-end Arabicathese coffee beans
that we use on a negotiated
basis. We depend onour relationships withbasis from coffee brokers, exporters and growers for the supply of our primary raw material, high quality Arabica coffee beans.growers. If any of ourthese supply relationships with coffee brokers, exporters or growers deteriorate, we may be unable to procure a sufficient quantity of high quality coffee beans at prices acceptable to us or at all. In such case, we may not be able to fulfill the demand of our existing customers, supply new customers or expand other channels of distribution. A raw material shortage could result in a deterioration of our relationship with our customers, decreased revenues or could impair our ability to expand our business.
OUR EFFORTS TO SECURE AN ADEQUATE SUPPLY OF QUALITY COFFEES MAY BE UNSUCCESSFUL AND EXPOSE US TO COMMODITY PRICE RISK.
Maintaining a steady supply of green coffee is essential to keep inventory levels low and secure sufficient stock to meet customer needs. To help ensure future supplies, we may purchase coffee
on forward contracts for delivery,
as long as twelvein some instances, up to 18 months in the future. Non-performance by suppliers could expose us to credit and supply risk. Additionally, entering into such future commitments exposes us to purchase price risk. Because we are not always able to pass price changes through to our customers due to competitive pressures, unpredictable price changes can have an immediate effect on operating results that cannot be corrected in the short run. To reduce our potential price risk exposure we have, from time to time, entered into futures contracts to hedge coffee purchase commitments. Open contracts associated with these hedging activities are described in
Part II, Item
7A. “Quantitative7A, "Quantitative and Qualitative Disclosures About Market
Risk.”WE RELY ON INFORMATION TECHNOLOGY AND ARE DEPENDENT ON ENTERPRISE RESOURCE PLANNING SOFTWARERisk" of this report.
DECLINES IN OF GREEN COFFEE COMMODITY PRICES MAY NOT BE IMMEDIATELY REFLECTED IN OUR
OPERATIONS. ANY MATERIAL FAILURE, INADEQUACY, INTERRUPTION OR SECURITY FAILURECOST OF
THAT TECHNOLOGY COULD AFFECTGOODS SOLD AND MAY INCREASE VOLATILITY IN OUR
ABILITY TO EFFECTIVELY OPERATE OUR BUSINESS.RESULTS.
We
relyroutinely use futures contracts to lock-in green coffee market prices, in some instances, as much as 18 months prior to the actual delivery date. Accounting rules require that we value our open futures contracts by marking them to market price at the end of each reporting period and include in our financial results the unrealized gains or losses based on
information technology systems acrosswhether the market price is higher or lower than the price we locked-in. If green coffee commodity prices decline below our
operations, including management of our supply chain, point-of-sale processing, and various other processes and transactions. Our ability to effectively manage our business and coordinate the production, distribution and sale of our products depends significantly on the reliability and capacity of these systems. The failure of these systems to operate effectively, problems with transitioning to upgraded or replacement systems, or a breach in security of these systems could result in delays in processing replenishment orders from our branches, our inability to record product sales and reduced operational efficiency. Significant capital investments couldlocked-in price, we will be required to
remediate any potential problems.recognize the resulting losses in our results. Although such losses are offset by future gains when we sell the coffee, such transactions could potentially cause volatility in our results because the recognition of losses and the offsetting gains may occur in different fiscal periods. Rapid, sharp decreases in the cost of green coffee could also force us to lower sales prices before realizing cost reductions in our green coffee inventory.
WE FACE EXPOSURE TO OTHER COMMODITY COST FLUCTUATIONS, WHICH COULD IMPACT OUR MARGINS AND PROFITABILITY.
We relyare exposed to cost fluctuations in other commodities, including milk, spices, natural gas and gasoline. In addition, an increase in the cost of fuel could indirectly lead to higher electricity costs, transportation costs and other commodity costs. Much like green coffee costs, the costs of these commodities depend on WTS, a company affiliated with Oracle,various factors beyond our control, including economic and political conditions, foreign currency fluctuations, and global weather patterns. To the extent we are unable to pass along such costs to our customers through price increases, our margins and profitability will decrease.
IMPAIRMENT CHARGES RELATED TO OUR DEFINITE-LIVED AND INDEFINITE-LIVED INTANGIBLE ASSETS COULD ADVERSELY AFFECT OUR FUTURE OPERATING RESULTS.
Indefinite-lived intangible assets (other than goodwill) are not amortized but instead are reviewed for impairment annually and on an interim basis if events or changes in circumstances between annual tests indicate that an asset might be impaired. A definite-lived intangible asset is only deemed to have become impaired if the sum of the projected undiscounted future cash flows related to the asset is less than the carrying value of the asset. If the sum of the projected cash flows is less than the carrying value, then we must write down the carrying value to its employees,estimated fair value in the period in which the determination is made. An indefinite-lived intangible asset (other than goodwill) is deemed impaired if its estimated fair value is less than its carrying value.
In the fourth quarter of fiscal 2012, we determined that certain indefinite-lived intangible asset consisting of trademarks acquired in connection with the hostingCBI acquisition were impaired and recorded an impairment charge of $0.5 million in operating expenses. In the fourth quarter of fiscal 2011, we determined that definite-lived intangible assets consisting of the customer relationships acquired, and the distribution agreement and co-pack agreement entered into, in connection with the DSD Coffee Business acquisition were impaired and recorded an impairment charge of $7.8 million in operating expenses. Failure to achieve our forecasted operating results, due to further weakness in the economic environment or other factors, and further declines in our market capitalization, among other things, could result in further impairment of our integrated management information system. This system is essential to our operationsdefinite-lived and currently includes all accounting and production software applications. WTS also hosts our route sales application software. If WTS were to experience financial, operational or quality assurance difficulties, or if there were any other disruption in our relationship with WTS, we might be unable to produce financial statements, fill replenishment orders for our branch warehouses, issue payroll checks, process payments to our vendors or bill customers. Any of these items could have a material adverse effect on the Company.indefinite-lived intangible assets.
OUR LEVEL OF INDEBTEDNESS COULD ADVERSELY AFFECT OUR ABILITY TO RAISE ADDITIONAL CAPITAL TO FUND OUR OPERATIONS, AND LIMIT OUR ABILITY TO REACT TO CHANGES IN THE ECONOMY OR OUR INDUSTRY.
We have a $50an $85.0 million senior secured revolving credit facility. As of September 9 August 31, 2012, we had estimated outstanding borrowings of $24.0 million, 2010, approximately $32.5excluding $0.2 million was outstanding in loan extension fees, utilized $11.9 million of the letters of credit sublimit, and had excess availability under thisthe credit facility.facility of $39.5 million. Maintaining a large loan balance under our credit facility could adversely affect our business and limit our ability to plan for or respond to changes in our business. Additionally, our borrowings under the credit facility are at variable rates of interest, exposing us to the risk of interest rate volatility, which could lead to a decreasean increase in our net income.loss. Our debt obligations could also: increase our vulnerability to general adverse economic and industry conditions;
require us to dedicate a portion of our cash flow from operations to payments on our indebtedness, thereby reducing the availability of our cash flow for other purposes, including the payment of dividends, funding daily operations, investing in future business opportunities and capital expenditures;
limit our flexibility in planning for, or reacting to, changes in our business and the industry in which we operate thereby placing us at a competitive disadvantage compared to our competitors that may have less debt or debt with less restrictive debt covenants;
limit, by the financial and other restrictive covenants in our loan agreement, our ability to borrow additional funds; and
have a material adverse effect on us if we fail to comply with the covenants in our loan agreement because such failure could result in an event of default which, if not cured or waived, could result in our indebtedness becoming immediately due and payable.
RESTRICTIVE COVENANTS IN OUR CREDIT FACILITY MAY RESTRICT OUR ABILITY TO PURSUE OUR BUSINESS STRATEGIES.
Our revolving credit facility contains various covenants that limit our ability and/or our subsidiaries’ ability to, among other things:
incur additional indebtedness;
pay dividends on or make distributions in respect of capital stock or make certain other restricted payments or investments;
sell assets;
create liens on certain assets to secure debt; and
consolidate, merge, sell or otherwise dispose of all or substantially all of our assets.
Our credit facility also contains restrictive covenants that require the Company and its subsidiaries to satisfy financial condition and liquidity tests. Our ability to meet those tests may be affected by events beyond our control, and there can be no assurance that we will meet those tests. The breach of any of these covenants or our failure to meet the financial condition or liquidity tests could result in a default under the credit facility, and the lender could elect to declare all amounts borrowed thereunder, together with accrued interest, to be due and payable and could proceed against the collateral securing that indebtedness.
OUR BUSINESS IS SUBJECT TO RISKS ASSOCIATED WITH THE CURRENT ECONOMIC CLIMATE.
Our success depends to a significant extent on a number of factors that affect discretionary consumer spending, including economic conditions, disposable consumer income and consumer confidence, which have deteriorated due to current economic conditions. In a slow economy, businesses and individuals scale back their discretionary spending on travel and entertainment, including “dining out” as well as the purchase of high-end consumables like specialty coffee. Economic conditions may also cause businesses to reduce travel and entertainment expenses, and may even cause office coffee benefits to be eliminated. The current economic downturn and decrease in consumer spending may continue to adversely impact our revenues, and may affect our ability to market our products or otherwise implement our business strategy. Additionally, many of the effects and consequences of the global financial crisis and a broader global economic downturn are currently unknown; any one or all of them could potentially have a material adverse effect on our liquidity and capital resources, including our ability to sell third party securities in which we have invested some of our short-term assets or raise additional capital, if needed, or the ability of our lender to honor draws on our credit facility, or otherwise negatively affect our business, financial condition, operating results and cash flows.
WE RELY ON INFORMATION TECHNOLOGY AND ARE DEPENDENT ON ENTERPRISE RESOURCE PLANNING SOFTWARE IN OUR OPERATIONS. ANY MATERIAL FAILURE, INADEQUACY, INTERRUPTION OR SECURITY FAILURE OF THAT TECHNOLOGY COULD AFFECT OUR ABILITY TO EFFECTIVELY OPERATE OUR BUSINESS.
We rely on information technology systems across our operations, including management of our supply chain, point-of-sale processing, and various other processes and transactions. Our ability to effectively manage our business and coordinate the production, distribution and sale of our products depends significantly on the reliability and capacity of these systems. The failure of these systems to operate effectively, problems with transitioning to upgraded or replacement systems, or a breach in security of these systems could result in delays in processing replenishment orders from our branch warehouses, our inability to record product sales and reduced operational efficiency. Significant capital investments could be required to remediate any potential problems.
VOLATILITY IN THE EQUITY MARKETS COULD REDUCE THE VALUE OF OUR INVESTMENT PORTFOLIO.
We maintain a portfolio of fixed-income based investments disclosed as cash equivalents and short-term investments on our consolidated balance sheets. The value of our investments may be adversely affected by interest rate fluctuations, downgrades in credit ratings, illiquidity in the capital markets and other factors which may result in other than temporary declines in the value of our investments. Any of these events could cause us to record impairment charges with respect to our investment portfolio or to realize losses on the sale of investments. If our operating losses continue, a portion or this entire investment portfolio may be liquidated to fund those losses.
WE ARE LARGELY RELIANT ON MAJOR FACILITIES IN CALIFORNIA, TEXAS AND OREGON FOR PRODUCTION OF OUR PRODUCT LINE.
A significant interruption in operations at our manufacturing facilities in Torrance, California (our largest facility); Houston, Texas; or Portland, Oregon, whether as a result of
an earthquake, hurricane,a natural disaster, terrorism or other causes, could significantly impair our ability to operate our business. The majority of our green coffee comes through the Ports of Los Angeles, Long Beach, Houston, San Francisco and Portland. Any interruption to port operations, highway arteries, gas mains or electrical service in these areas could restrict our ability to supply our
branchesbranch warehouses with product and would adversely impact our business.
WE MAY NOT BE SUCCESSFUL IN REALIZING THE EXPECTED SYNERGIES AND OTHER BENEFITS OF THE INTEGRATION OF THE DSD COFFEE BUSINESS, WHICH COULD ADVERSELY AFFECT OUR FUTURE RESULTS.
In fiscal 2010, we completed the integration of the DSD Coffee Business into our existing business. This was a complex, costly and time-consuming process which presented significant challenges and risks to our business, including:
distraction of management from ongoing business concerns;
assimilation and retention of employees and customers of the DSD Coffee Business;
differences in the culture of the DSD Coffee Business and the Company’s culture;
unforeseen difficulties in integrating the DSD Coffee Business, including information systems and accounting controls;
failure of the DSD Coffee Business to continue to generate income at the levels upon which we based our acquisition decision;
managing the DSD Coffee Business operations through offices in Downers Grove, Illinois, which is distant from the Company’s headquarters in Torrance, California;
expansion into new geographical markets in which we have limited or no experience;
integration of technologies, services and products; and
achievement of appropriate internal control over financial reporting.
We may fail to realize the operating efficiencies, synergies, economies of scale, cost savings and other benefits expected from the acquisition. We may fail to grow and build profits in the DSD Coffee Business or achieve sufficient cost savings through the integration of customers or administrative and other operational activities. Furthermore, we must achieve these objectives without adversely affecting our revenues. If we are not able to successfully achieve these objectives, the anticipated benefits of the acquisition may not be realized fully or at all, or it may take longer to realize them than expected, and our results of operations could be adversely affected.
INCREASED SEVERE WEATHER PATTERNS MAY INCREASE COMMODITY COSTS, DAMAGE OUR FACILITIES, AND IMPACT OR DISRUPT OUR PRODUCTION CAPABILITIES AND SUPPLY CHAIN.
There is increasing concern that a gradual increase in global average temperatures due to increased concentration of carbon dioxide and other greenhouse gases in the atmosphere have caused and will continue to cause significant changes in weather patterns around the globe and an increase in the frequency and severity of extreme weather events. Major weather phenomena like El Niño and La Niña are dramatically affecting coffee growing countries. The wet and dry seasons are becoming unpredictable in timing and duration causing improper development of the coffee cherries. Decreased agricultural productivity in certain regions as a result of changing weather patterns may affect the quality, limit availability or increase the cost of key agricultural commodities, such as green coffee, sugar and tea, which are important ingredients for our products. Increased frequency or duration of extreme weather conditions could also damage our facilities, impair production capabilities, disrupt our supply chain or impact demand for our products. As a result, the effects of climate change could have a long-term adverse impact on our business and results of operations.
RESTRICTIVE COVENANTS IN OUR CREDIT FACILITY MAY RESTRICT OUR ABILITY TO PURSUE OUR BUSINESS STRATEGIES.
Our senior secured revolving credit facility contains various covenants that limit our ability and/or our subsidiaries’ ability to, among other things:
incur additional indebtedness;
pay dividends on or make distributions in respect of capital stock or make certain other restricted payments or investments;
create liens on certain assets to secure debt; and
consolidate, merge, sell or otherwise dispose of all or substantially all of our assets.
Our credit facility also contains restrictive covenants that require the Company and its subsidiaries to satisfy financial condition and liquidity tests. Our ability to meet those tests may be affected by events beyond our
control, and there can be no assurance that we will meet those tests. The breach of any of these covenants or our failure to meet the financial condition or liquidity tests could result in a default under the credit facility, and the lender could elect to declare all amounts borrowed thereunder, together with accrued interest, to be due and payable and could proceed against the collateral securing that indebtedness.
OUR INDUSTRY IS HIGHLY COMPETITIVE AND WE MAY NOT HAVE THE RESOURCES TO COMPETE EFFECTIVELY.
We primarily compete with other coffee companies, including multi-national firms with substantially greater financial, marketing and operating resources than the Company. We face competition from many sources including the
food serviceinstitutional foodservice divisions of multi-national manufacturers of retail products such as
The J.M. Smucker
Company (Folgers Coffee),
Dunkin' Donuts and Kraft Foods Inc. (Maxwell House Coffee)
and Sara Lee Corporation,, wholesale
groceryfoodservice distributors such as Sysco Corporation and U.S.
Food Service,Foods, regional
institutional coffee roasters such as S & D Coffee, Inc. and Boyd Coffee Company, and specialty coffee suppliers such as Green Mountain Coffee Roasters, Inc.
, Rogers Family Company, Distant Lands Coffee, Mother Parkers Tea & Coffee, Inc., and Peet’s Coffee & Tea, Inc.
As many of our customers are small foodservice operators, we also compete with club stores such as Costco and Restaurant Depot. If we do not succeed in differentiating ourselves from our competitors or our competitors adopt our strategies, then our competitive position may be weakened. In addition, from time to time, we may need to reduce our prices in response to competitive and customer pressures and to maintain our market share. Competition and customer pressures, however, also may restrict our ability to increase prices in response to commodity and other cost increases. Our results of operations will be adversely affected if our profit margins decrease, as a result of a reduction in prices or an increase in costs, and if we are unable to increase sales volumes to offset those profit margin decreases.
VOLATILITY IN THE EQUITY MARKETS OR INTEREST RATE FLUCTUATIONS COULD SUBSTANTIALLY INCREASE OUR PENSION
COSTSFUNDING REQUIREMENTS AND NEGATIVELY IMPACT OUR
OPERATING RESULTS.FINANCIAL POSITION.
At the end of fiscal 2010,June 30, 2012, the projected benefit obligation ofunder our single employer defined benefit pension plans was $114.7$130.4 million and the fair value of plan assets were $66.0 million.was $85.8 million. The difference between plan obligations and assets, or the funded status of the plans, significantly affects the net periodic benefit costs of our pension planscost and the ongoing funding requirements of those plans. Among other factors, changes in interest rates, mortality rates, early retirement rates, investment returns and the market value of plan assets can affect the level of plan funding, cause volatility in the net periodic pension costs,benefit cost and increase our future funding requirements. As of June 30, 2012, we have made $7.3 million in contributions to these pension plans and accrued $1.2 million in expense. We expect to make approximately $4.9$4.3 million in contributions to our single employer defined benefit pension plans in fiscal 20112013 and record an accruedaccrue expense of approximately $9.8$1.2 million per year beginning in fiscal 2011.2013. These pension payments are expected to continue at this level for several years, and the current economic environment increases the risk that we may be required to make even larger contributions in the future.
OUR SALES AND DISTRIBUTION NETWORK IS COSTLY TO MAINTAIN.
Our sales and distribution network requires a large investment to maintain and operate. Costs include the fluctuating cost of gasoline, diesel and oil, costs associated with managing, purchasing, leasing, maintaining and insuring a fleet of delivery vehicles, the cost of maintaining distribution centers and branch warehouses throughout the country, and the cost of hiring, training and managing our route sales professionals. Many of these costs are beyond our control, and
othersmany are fixed rather than variable. Some competitors use alternate methods of distribution that eliminate many of the costs associated with our method of distribution.
EMPLOYEE STRIKES AND OTHER LABOR-RELATED DISRUPTIONS MAY ADVERSELY AFFECT OUR OPERATIONS.
We have union contracts relating to a significant portion of our workforce. Although we believe union relations have been amicable in the past, there is no assurance that this will continue in the future. There are potential adverse effects of labor disputes with our own employees or by others who provide transportation (shipping lines, truck drivers) or cargo handling (longshoremen), both domestic and foreign, of our raw materials or other products. These actions could restrict our ability to obtain, process and/or distribute our products.
IMPAIRMENT CHARGES RELATED TO OUR GOODWILL OR LONG-LIVED ASSETS
GOVERNMENT MANDATORY HEALTHCARE REQUIREMENTS COULD ADVERSELY AFFECT OUR
FUTURE OPERATING RESULTS.PROFITS.
We
perform an analysis on our goodwill balancesoffer healthcare benefits to
testall employees who work at least 40 hours a week and meet service eligibility requirements. In the past, some states, including California, have proposed legislation mandating that employers pay healthcare premiums into a state-run fund for
impairment on an annual basisall employees immediately upon hiring or
whenever events occur that may indicate impairment possibly exists. Goodwill is deemedpay a penalty for failing to do so. If legislation similar to this were to be
impaired if the net book value of a reporting unit exceeds the estimated fair value. A long-lived intangible asset (other than goodwill) is only deemed to have become impaired if the sum of the forecasted undiscounted future cash flows related to the asset are less than its carrying value. If the forecasted cash flows are less than the carrying value, then we must write down the carrying value to its estimated fair value.For the purposes of analysis of our goodwill balances, our estimates of fair value were based on a combination of the income approach, which estimates the fair value of our reporting units based on the future discounted cash flows, and the market approach, which estimates the fair value of our reporting units based on comparable market prices. Our estimates of future cash flows included estimated growth rates and assumptions about the extent and duration of the current economic downturn and operating results of our subsidiary, CBI.
As of June 30, 2010, we had a goodwill balance of $5.3 million. Goodwill impairment analysis and measurement is a process that requires significant judgment and the use of significant estimates related to valuation such as discount rates, long term growth rates and the level and timing of future cash flows. As a result, several factors could resultenacted in impairment of a material amount of our $5.3 million goodwill balance in future periods, including, but not limited to:
a decline in our stock price and resulting market capitalization, if we determine that the decline is sustained and is indicative of a reductionCalifornia, or in the fair value of any of our reporting units below its carrying value; and
further weakening of the economy or the failure of CBI to reach our internal forecasts thereby impacting our ability to achieve our forecasted levels of cash flows and reducing the estimated discounted cash flow value of our reporting units.
It is not possible at this time to determine if any such future impairment charge would result from these factors, or, ifother states in which we do business, it does, whether such charge would be material. We will continue to review our goodwill and other intangible assets for possible impairment. We cannot be certain that a future downturn in CBI’s business, changes in market conditions or a longer-term decline in the quoted market price of our stock will not result incould have an impairment of goodwill and the recognition of resulting expenses in future periods, which could adversely affectadverse effect on our results of operations for those periods.
We also test our other long-lived assets for impairment whenever events or changesoperations. In addition, comprehensive health care legislation (the Patient Protection and Affordable Care Act and the Health Care and Education Reconciliation Act of 2010) was passed and signed into law in circumstances indicate that their carrying amountMarch 2010. Due to the breadth and complexity of this legislation, it is difficult to predict the financial and operational impacts this legislation will have on us. Our expenses may be impaired. Failure to achieve our forecasted operating results, due to further weakness insignificantly increase over the economic environment or other factors, couldlong-term as a result in impairment of a significant amount of our long-lived intangible or tangible assets. As of June 30, 2010, we had $25.2 million of long-lived intangible assets, including $5.3 million of goodwill.
this legislation.
POSSIBLE LEGISLATION OR REGULATION INTENDED TO ADDRESS CONCERNS ABOUT CLIMATE CHANGE COULD ADVERSELY AFFECT OUR RESULTS OF OPERATIONS, CASH FLOWS AND FINANCIAL CONDITION.
Governmental agencies are evaluating changes in laws to address concerns about the possible effects of greenhouse gas emissions on climate. Increased public awareness and concern over climate change may increase the likelihood of more proposals to reduce or mitigate the emission of greenhouse gases. Laws enacted that directly or indirectly affect our suppliers (through an increase in the cost of production or their ability to produce satisfactory products) or our business (through an impact on our inventory availability, cost of goods sold, operations or demand for the products we sell) could adversely affect our business, financial condition, results of operations and cash flows. Compliance with any new or more stringent laws or regulations, or stricter
interpretations of existing laws, including increased government regulations to limit carbon dioxide and other greenhouse gas emissions as a result of concern over climate change, could require us to reduce emissions and to incur compliance costs which could affect our profitability or impede the production or distribution of our products, which could affect our results of operations, cash flows and financial condition. In addition, public expectations for reductions in greenhouse gas emissions could result in increased energy, transportation and raw material costs and may require us and to make additional investments in facilities and equipment.
CHANGES IN CONSUMER PREFERENCES COULD ADVERSELY AFFECT OUR BUSINESS.
Our continued success depends, in part, upon the demand for coffee. We believe that competition from other beverages continues to dilute the demand for coffee. Consumers who choose soft drinks, juices, bottled water, teas and other beverages
all reduce spending on coffee. Consumer trends away from coffee could negatively impact our business.
WE ARE SELF-INSURED. OUR RESERVES MAY NOT BE SUFFICIENT TO COVER FUTURE CLAIMS.
We are self-insured for many risks up to significant deductible amounts. The premiums associated with our insurance continue to increase. General liability, fire, workers’ compensation, directors and officers liability, life, employee medical, dental and vision and automobile risks present a large potential liability. While we accrue for this liability based on historical
experience, future claims may exceed claims we have incurred in the past. Should a different number of claims occur compared
to what was estimated or the cost of the claims increase beyond what was anticipated, reserves recorded may not be sufficient and the accruals may need to be adjusted accordingly in future periods. In
OUR ROASTING AND BLENDING METHODS ARE NOT PROPRIETARY, SO May 2011, we did not meet the minimum credit rating criteria for participation in the alternative security program for California self-insurers. As a result we were required to post a $5.9 million letter of credit as a security deposit to the State of California Department of Industrial Relations Self-Insurance Plans. As of June 30, 2012, this letter of credit continues to serve as a security deposit. COMPETITORS MAY BE ABLE TO DUPLICATE
THEM,OUR ROASTING AND BLENDING METHODS, WHICH COULD HARM OUR COMPETITIVE POSITION.
We consider our roasting and blending methods essential to the flavor and richness of our coffees and, therefore, essential to our brand. Because our roasting methods cannot be patented, we would be unable to prevent competitors from copying these methods if such methods became known. If our competitors copy our roasts or blends, the value of our brand may be diminished, and we may lose customers to our competitors. In addition, competitors may be able to develop roasting or blending methods that are more advanced than our production methods, which may also harm our competitive position.
OUR OPERATING RESULTS MAY HAVE SIGNIFICANT FLUCTUATIONS FROM QUARTER TO QUARTER WHICH COULD HAVE A NEGATIVE EFFECT ON OUR STOCK PRICE.
Our operating results may fluctuate from period to period or within certain periods as a result of a number of factors, including fluctuations in the price and supply of green coffee, fluctuations in the selling prices of our products, the success of our hedging strategy, competition from existing or new competitors in our industry, changes in consumer preferences, and our ability to manage inventory and fulfillment operations and maintain gross margins.
At the end of each quarter, we record the expected effect of the liquidation of LIFO inventory quantities and record the actual impact at fiscal year end. Fluctuations in our operating results as a result of these factors or for any other reason, could cause our stock price to decline. Accordingly, we believe that period-to-period comparisons of our operating results are not necessarily meaningful, and such comparisons should not be relied upon as indicators of future performance.
OPERATING LOSSES MAY CONTINUE AND, AS A RESULT,
THE PRICECOULD LEAD TO INCREASED LEVERAGE WHICH MAY HARM OUR FINANCIAL CONDITION AND RESULTS OF
OUR STOCK MAY BE NEGATIVELY AFFECTED.OPERATIONS.
We have incurred
an operating
losslosses and
a net
losslosses for each of the prior three fiscal years. If our current strategies are unsuccessful we may not achieve the levels of sales and earnings we expect. As a result, we could suffer additional losses in future years and our stock price could
decline.FUTURE FUNDING DEMANDS UNDERdecline leading to deterioration in our credit rating, which could limit the availability of additional financing and increase the cost of obtaining financing. In addition, an increase in leverage could raise the likelihood of a financial covenant breach which in turn could limit our access to existing funding under our revolving credit facility.
Our ability to satisfy our operating lease obligations and make payments of principal and interest on our indebtedness depends on our future performance. Should we experience deterioration in operating performance, we will have less cash flow available to meet these obligations. In addition, if such deterioration were to lead to the closure of branch warehouses or distribution centers, we would need to fund the costs of terminating those leases. If we are unable to generate sufficient cash flow from operations in the future to satisfy these financial obligations, we may be required to, among other things:
seek additional financing in the debt or equity markets;
refinance or restructure all or a portion of our indebtedness;
sell selected assets; or
reduce or delay planned capital or operating expenditures.
Such measures might not be sufficient to enable us to satisfy our financial obligations. In addition, any such financing, refinancing or sale of assets might not be available on economically favorable terms.
WE COULD FACE SIGNIFICANT WITHDRAWAL LIABILITY IF WE WITHDRAW FROM PARTICIPATION IN THE MULTIEMPLOYER PENSION PLANS
FOR CERTAIN UNION EMPLOYEES ARE UNKNOWN.IN WHICH WE PARTICIPATE.
We participate in several multi-employera multiemployer defined benefit planspension plan and a multiemployer defined contribution pension plan for certain union employees. The management, funding status and future viabilityWe make periodic contributions to these plans to allow them to meet their pension benefit obligations to their participants. In the event we withdraw from participation in one or both of these plans, is not known at this time. The naturewe could be required to make an additional lump-sum contribution to the plan, which would be reflected as an expense in our consolidated statement of operations and a liability on our consolidated balance sheet. Our withdrawal liability for any multiemployer plan
would depend on the extent of the contractplan’s funding of vested benefits. In fiscal 2012, in connection with thesethe withdrawal from one of the multiemployer pension plans allows for future funding demands that are outsidein which we participated, we recorded a charge of $4.3 million, representing the present value of the estimated withdrawal liability expected to be paid in quarterly installments of $0.1 million over 80 quarters. The installment payments will commence once the final amount of withdrawal liability is established, which determination may take up to 24 months from the date of withdrawal from the pension plan. Future collective bargaining negotiations may result in the Company withdrawing from the remaining multiemployer pension plans in which we participate and, if successful, may result in a withdrawal liability, the amount of which could be material to our control or ability to estimate.results of operations and cash flows.
WE DEPEND ON THE EXPERTISE OF KEY PERSONNEL. THE UNEXPECTED LOSS OF ONE OR MORE OF THESE KEY EMPLOYEES COULD HAVE A MATERIAL ADVERSE EFFECT ON OUR OPERATIONS AND COMPETITIVE POSITION.
Our continued success largely depends on the efforts and abilities of our executive officers and other key personnel. There is limited management depth in certain key positions throughout the Company. We must continue to recruit, retain and motivate management and other employees
sufficient to maintain our current business and support our projected growth. The loss of key employees could adversely affect our operations and competitive position. We do not maintain key person life insurance policies on any of our executive officers.
CONCENTRATION OF OWNERSHIP AMONG OUR PRINCIPAL STOCKHOLDERS MAY PREVENT NEW INVESTORS FROM INFLUENCING SIGNIFICANT CORPORATE DECISIONS AND MAY RESULT IN A LOWER TRADING PRICE FOR OUR STOCK THAN IF OWNERSHIP OF OUR STOCK WAS LESS CONCENTRATED.
As of August 31, 2010,September 6, 2012, members of the Farmer family or entities controlled by the Farmer family (including trusts and a family partnership)trusts) as a group beneficially owned approximately 40%39.3% of our outstanding common stock. As a result, these stockholders, acting together, may be able to influence the outcome of stockholder votes, including votes concerning the election and removal of directors and approval of significant corporate transactions. This level of concentrated ownership may have the effect of delaying or preventing a change in the management or voting control of the Company. In addition, this significant concentration of share ownership may adversely affect the trading price of our common stock if investors perceive disadvantages in owning stock in a company with such concentrated ownership.
FUTURE SALES OF SHARES BY EXISTING STOCKHOLDERS COULD CAUSE OUR STOCK PRICE TO DECLINE.
All of our outstanding shares are eligible for sale in the public market, subject in certain cases to limitations under Rule 144 of the Securities Act of 1933, as amended (the “Securities Act”). Also, shares subject to outstanding options and restricted stock under the Farmer Bros. Co. 2007 Omnibus Plan (the
“Omnibus Plan”"Omnibus Plan") are eligible for sale in the public market to the extent permitted by the provisions of various vesting agreements, our stock ownership guidelines, and Rule 144 under the Securities Act. If these shares are sold, or if it is perceived that they will be sold in the public market, the trading price of our common stock could decline.
ANTI-TAKEOVER PROVISIONS COULD MAKE IT MORE DIFFICULT FOR A THIRD PARTY TO ACQUIRE US.
We have adopted a stockholder rights plan (the “Rights Plan”) pursuant to which each share of our outstanding common stock is accompanied by one preferred share purchase right (a “Right”). Each Right, when exercisable, will entitle the registered holder to purchase from the Company one one-hundredth of a share of Series A Junior Participating Preferred Stock, $1.00 par value per share, at a purchase price of $112.50, subject to adjustment. The Rights expire on March 28, 2015, unless they are earlier redeemed, exchanged or terminated as provided in the Rights Plan. Because the Rights may substantially dilute the stock ownership of a person or group attempting to take us over without the approval of our Board of Directors, our Rights Plan could make it more difficult for a third party to acquire us (or a significant percentage of our outstanding capital stock) without first negotiating with our Board of Directors regarding such acquisition.
In addition, our Board of Directors has the authority to issue up to 500,000 shares of preferred stock (of which 200,000 shares have been designated as Series A Junior Participating Preferred Stock) and to determine the price, rights, preferences, privileges and restrictions, including voting rights, of those shares without any further vote or action by stockholders. The rights of the holders of our common stock may be subject to, and may be adversely affected by, the rights of the holders of any preferred stock that may be issued in the future. The issuance of preferred stock may have the effect of delaying, deterring or preventing a change
ofin control of the Company without further action by stockholders and may adversely affect the voting and other rights of the holders of our common stock.
Further, certain provisions of our charter documents, including a classified board of directors, provisions eliminating the ability of stockholders to take action by written consent, and provisions limiting the ability of stockholders to raise
matters at a meeting of stockholders without giving advance notice, may have the effect of delaying or preventing changes in control or management of the Company, which could have an adverse effect on the market price of our stock. In addition, our charter documents do not permit cumulative voting, which may make it more difficult for a third party to gain control of our Board of Directors. Further, we are subject to the anti-takeover provisions of Section 203 of the Delaware General Corporation Law, which will prohibit us from engaging in a “business combination” with an “interested stockholder” for a period of three years after the date of the transaction in which the person became an interested stockholder, even if such combination is favored by a majority of stockholders, unless the business combination is approved in a prescribed manner. The application of Section 203 also could have the effect of delaying or preventing a change
ofin control or management.
VOLATILITY IN THE EQUITY MARKETS COULD REDUCE THE VALUE OF OUR INVESTMENT PORTFOLIO.
We maintain a significant portfolio of fixed-income based investments disclosed as cash equivalents and short term investments on our consolidated balance sheet. The value of our investments may be adversely affected by interest rate fluctuations, downgrades in credit ratings, illiquidity in the capital markets and other factors which may result in other than temporary declines in the value of our investments. Any of these events could cause us to record impairment charges with respect to our investment portfolio or to realize losses on the sale of investments. We seek to mitigate these risks with the help of our investment advisors by generally investing in high quality securities and continuously monitoring the overall risk of our portfolio. To date, we have not realized any material impairment within our investment portfolio.
QUALITY CONTROL PROBLEMS MAY ADVERSELY AFFECT OUR BRANDS THEREBY NEGATIVELY IMPACTING OUR SALES.
Our success depends on our ability to provide customers with high quality products and service. Although we take measures to ensure that we sell only fresh coffee, tea and culinary products, we have no control over our products once they are purchased by our customers. Accordingly, customers may store our products for longer periods of time, potentially affecting product quality. If consumers do not perceive our products and service to be of high quality, then the value of our brands may be diminished and, consequently, our operating results and sales may be adversely affected.
ADVERSE PUBLIC OR MEDICAL OPINIONS ABOUT CAFFEINE AND REPORTS OF INCIDENTS INVOLVING FOOD BORNE ILLNESS AND TAMPERING MAY HARM OUR BUSINESS.
Coffee contains significant amounts of caffeine and other active compounds, the health effects of some of which are not fully understood. A number of research studies conclude or suggest that excessive consumption of caffeine may lead to increased adverse health effects. An unfavorable report on the health effects of caffeine or other compounds present in coffee could significantly reduce the demand for coffee which could harm our business and reduce our sales.
Similarly, instances or reports, whether true or not, of unclean water supply, food-borne illnesses and food tampering have in the past severely injured the reputations of companies in the food processing sector and could in the future affect us as well. Any report linking us to the use of unclean water, food-borne illnesses or food tampering could damage the value of our brands, negatively impact sales of our products, and potentially lead to product liability claims. Clean water is critical to the preparation of coffee beverages. We have no ability to ensure that our customers use a clean water supply to prepare coffee beverages.
PRODUCT RECALLS AND INJURIES CAUSED BY PRODUCTS COULD REDUCE OUR SALES AND HARM OUR BUSINESS.
Selling products for human consumption involves inherent legal risks. We could be required to recall products due to product contamination, spoilage or other adulteration, product misbranding or product tampering. We may also suffer losses if our products or operations violate applicable laws or regulations, or if our products cause injury, illness or death. A significant product liability claim against us, whether or not successful, or a widespread product recall may reduce our sales and harm our business.
GOVERNMENT REGULATIONS COULD
INCREASE OUR OPERATING COSTS, REDUCE DEMAND FOR OUR PRODUCTS OR RESULT IN
ADDITIONAL COSTS THEREBY AFFECTING OUR PROFITABILITY.NewLITIGATION.
The conduct of our business, including the production, distribution, sale, advertising, marketing, labeling, safety, transportation and use of many of our products, are subject to various federal, state and local laws and regulations. These laws and regulations and interpretations thereof are subject to change as a result of political, economic or social events. Such changes may be introduced that could resultinclude changes in: food and drug laws; laws relating to product labeling, advertising and marketing practices; laws regarding ingredients used in additional compliance costs, seizures, confiscations, recallsour products; and increased regulatory scrutiny of, and increased litigation involving, product claims and concerns regarding the effects on health of ingredients in, or monetary fines, any of which could prevent or inhibit the development, distribution and saleattributes of, our products. Legislation titled “The Food SafetyFor example, we are subject to the California Safe Drinking Water and EnhancementToxic Enforcement Act of 2009”1986 (commonly known as “Proposition 65”), a law which requires that a specific warning appear on any product sold in California that contains a substance listed by that State as having been found to cause cancer or birth defects. Proposition 65 exposes all food and beverage producers to the possibility of having to provide warnings on their products in California because it does not provide for any generally applicable quantitative threshold below which the presence of a listed substance is currently being reviewed byexempt from the U.S. Senatewarning requirement. Consequently, the detection of even a trace amount of a listed substance can subject an affected product to the requirement of a warning label.
On June 21, 2012, the Council for Education and Research on Toxics, a public interest group, issued a pre-litigation notice of intent to sue a number of companies, including CBI, which
if signed into law, may requiresell coffee in California for allegedly failing to issue clear and reasonable warnings that the coffee they produce, distribute and/or sell contains acrylamide in accordance with Proposition 65. Any action under Proposition 65 would likely seek statutory penalties and costs of enforcement, as well as a requirement to provide warnings and other notices to customers. If we were required to add warning labels to any of our products or place warnings in certain
food manufacturing and packaging facilities to adhere to stricter food safety standards thanlocations where our products are
currently required. We continually monitor and modify our packaging to besold, sales of those products could suffer not only in
compliance with applicable laws and regulations.those locations but elsewhere. Any change in labeling requirements for our products
also may lead to an increase in packaging costs or interruptions or delays in packaging deliveries. If we fail to comply with applicable laws and regulations, we may be subject to civil remedies, including fines, injunctions, recalls or seizures, as well as potential criminal sanctions, which could have a material adverse effect on our results of operations.
FAILURE TO MAINTAIN EFFECTIVE INTERNAL CONTROLS IN ACCORDANCE WITH SECTION 404 OF THE SARBANES OXLEY ACT OF 2002 COULD HAVE A MATERIAL ADVERSE EFFECT ON OUR BUSINESS AND STOCK PRICE.
As directed by Section 404 of the Sarbanes Oxley Act of 2002 (“SOX”), the SEC adopted rules requiring us, as a public company, to include a report of management on our internal controls over financial reporting in our annual report on Form
10-K10‑K and quarterly reports on Form
10-Q10‑Q that contains an assessment by management of the effectiveness of our internal controls over financial reporting. In addition, our independent auditors must attest to and report on management’s assessment of the effectiveness of our internal controls over financial reporting as of the end of the fiscal year. Compliance with SOX Section 404 has been a challenge for many companies. Our ability to continue to comply is uncertain as we expect that our internal controls will continue to evolve as our business activities change. If, during any year, our independent auditors are not satisfied with our internal controls over financial reporting or the level at which these controls are
designed, documented,
designed, operated, tested or assessed, or if the independent auditors interpret the requirements, rules or regulations differently than we do, then they may decline to attest to management’s assessment or may issue a report that is qualified. In addition, if we fail to maintain the adequacy of our internal controls, we may not be able to ensure that we can conclude on an ongoing basis that we have effective internal controls over financial reporting in accordance with SOX Section 404. Failure to maintain an effective internal control environment could have a material adverse effect on our stock price. In addition, there can be no assurance that we will be able to remediate material weaknesses, if any, which may be identified in future periods.
|
| |
| Item 1.B. | Unresolved Staff Comments |
Our largest and most significant facility
consists ofis our
roasting plant, warehouses and administrative officescorporate headquarters in Torrance, California.
ThisOur Torrance facility is
our primarya manufacturing facility and the distribution hub for our long-haul trucking
fleet.fleet and houses our primary administrative offices. Coffee purchasing, roasting and packaging takes place at our Torrance, California; Portland, Oregon; and Houston, Texas plants. Spice blending and packaging takes place at our Torrance, California
and Oklahoma City, Oklahoma plants.plant. Our distribution centers include our Torrance,
HoustonPortland and
PortlandHouston plants as well as distribution centers in
Fridley, Minnesota; Northlake, Illinois; Oklahoma City, Oklahoma; and Moonachie, New Jersey.
During fiscal 2008 we completed improvements to a new 125,000 square foot leased manufacturing facility in Portland, Oregon that serves as the manufacturing and distribution point for our specialty coffee customers. CBI relocated to this new facility in August 2008.
We stage our products in 115117 branch warehouses throughout the contiguous United States. These branch warehouses and our seven6 distribution centers, taken together, represent a vital part of our business, but no individual branch warehouse is material to the business as a whole. Our branch warehouses vary in size from approximately 2,500 to 50,000 square feet.
Approximately 45%55% of our facilities are leased with a variety of expiration dates through 2018.2019, although our two largest facilities, in Torrance and Houston, are owned. The lease on the CBIPortland facility expires in 2018 and has a 10 year renewal option. We believe our plants, distribution centers and branch warehouses will continue to provide adequate capacity for the foreseeable future.
A complete list of properties and facilities operated by Farmer Bros. is attached hereto as Exhibit 99.1 and incorporated herein by reference, as Exhibit 99.1.
reference.We are both defendant and plaintiff in various legal proceedings incidental to our business which are ordinary and routine. It is our opinion that the resolution of these lawsuits will not have a material impact on our financial condition or results of operations.
|
| |
| Item 4. | [Removed and Reserved]Mine Safety Disclosures |
Not applicable.
|
| |
| Item 5. | Market for Registrant’s Common Equity, Related Stockholder Matters and Issuer Purchases of Equity Securities |
We have one class of common stock which is traded on the NASDAQ Global Market under the symbol “FARM.” The following table sets forth, for the periods indicated, the cash dividends declared and the high and low sales prices of the shares of common stock of the Company as quoted on the NASDAQ Global Market. | | | | | | | | | | | | | | | | | | |
| | | Fiscal year ended June 30, 2010 | | Fiscal year ended June 30, 2009 |
| | | High | | Low | | Dividend | | High | | Low | | Dividend |
1st Quarter | | $ | 24.07 | | $ | 18.55 | | $ | 0.115 | | $ | 28.49 | | $ | 20.21 | | $ | 0.115 |
2nd Quarter | | $ | 21.21 | | $ | 16.31 | | $ | 0.115 | | $ | 25.46 | | $ | 17.00 | | $ | 0.115 |
3rd Quarter | | $ | 20.52 | | $ | 16.36 | | $ | 0.115 | | $ | 25.49 | | $ | 14.26 | | $ | 0.115 |
4th Quarter | | $ | 19.49 | | $ | 14.81 | | $ | 0.115 | | $ | 25.49 | | $ | 17.31 | | $ | 0.115 |
|
| | | | | | | | | | | | | | | | | | | | | | | | |
| | | Fiscal year ended June 30, 2012 | | Fiscal year ended June 30, 2011 |
| | | High | | Low | | Dividend | | High | | Low | | Dividend |
| 1st Quarter | | $ | 12.45 |
| | $ | 4.43 |
| | $ | — |
| | $ | 17.46 |
| | $ | 13.94 |
| | $ | 0.115 |
|
| 2nd Quarter | | $ | 8.00 |
| | $ | 4.96 |
| | $ | — |
| | $ | 18.93 |
| | $ | 15.55 |
| | $ | 0.060 |
|
| 3rd Quarter | | $ | 12.25 |
| | $ | 7.67 |
| | $ | — |
| | $ | 18.13 |
| | $ | 10.28 |
| | $ | — |
|
| 4th Quarter | | $ | 10.92 |
| | $ | 6.73 |
| | $ | — |
| | $ | 13.38 |
| | $ | 8.59 |
| | $ | — |
|
Holders
HoldersThere were 2,292approximately 2,300 holders of record on August 31, 2010.September 6, 2012. Determination of Holdersholders of record is based upon the number of record holders and individual participants in security position listings.
Dividends
DividendsAlthough historically the Company has paid a dividend to stockholders, in light of the Company’s current financial position, the Company’s Board of Directors has omitted the payment of a quarterly dividend since the third quarter of Dividends have been or will be funded through cash flow from operations and available cash on hand.fiscal 2011. The amount, if any, of the dividends to be paid in the future will depend upon ourthe Company’s then available cash, anticipated cash needs, overall financial condition, loan agreement restrictions, future prospects for earnings and cash flows, as well as other relevant factors. For a description of the loan agreement restrictions on the payment of dividends, see “Management’s Discussion and Analysis of Financial Condition and Results of Operations—Liquidity and Capital Resources” included in Part II, Item 7 of this Form 10-Kreport, and Note 98 “Bank Loans”Loan” to the consolidated financial statements included in Part II, Item 8 of this Form 10-K.
report.
Equity Compensation Plan Information
This information appears in Part III, Item 12
hereof.of this report.
The chart set forth below shows the value of an investment of $100
at the close of trading on June 30,
20052006 in each of Farmer Bros. Co. common stock, the Russell 2000 Index and the Value Line Food Processing Index. All values assume reinvestment of the pre-tax value of dividends paid by companies included in these indices and are calculated as of June 30 of each year. The historical stock price performance of the Company’s common stock shown in the performance graph below is not necessarily indicative of future stock price performance.
Comparison of Five-Year Cumulative Total Return
Farmer Bros. Co., Russell 2000 Index And Value Line Food Processing Index
(Performance Results Through 6/30/10)12)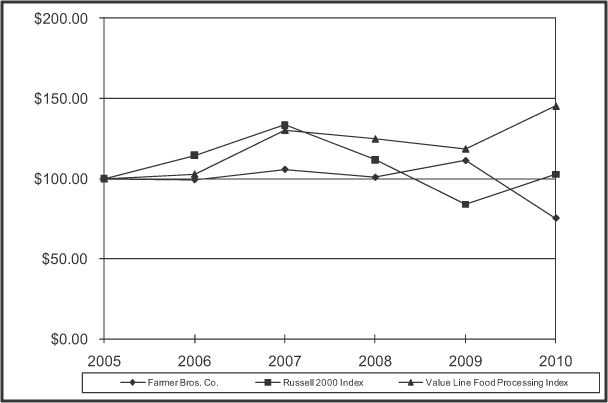
| | | | | | | | | | | | | | | | | | |
| | | 2005 | | 2006 | | 2007 | | 2008 | | 2009 | | 2010 |
Farmer Bros Co. | | $ | 100.00 | | $ | 99.28 | | $ | 105.72 | | $ | 100.75 | | $ | 111.30 | | $ | 75.09 |
Russell 2000 Index | | $ | 100.00 | | $ | 114.58 | | $ | 133.41 | | $ | 111.81 | | $ | 83.84 | | $ | 102.67 |
Value Line Food Processing Index | | $ | 100.00 | | $ | 102.76 | | $ | 130.24 | | $ | 124.76 | | $ | 118.55 | | $ | 145.17 |
Source: Value Line
Inc.Publishing, LLC
|
| | | | | | | | | | | | | | | | | | | | | | | | |
| | | 2007 | | 2008 | | 2009 | | 2010 | | 2011 | | 2012 |
| Farmer Bros. Co. | | $ | 100.00 |
| | $ | 95.29 |
| | $ | 105.28 |
| | $ | 71.02 |
| | $ | 48.65 |
| | $ | 38.19 |
|
| Russell 2000 Index | | $ | 100.00 |
| | $ | 83.81 |
| | $ | 62.85 |
| | $ | 76.36 |
| | $ | 104.92 |
| | $ | 102.74 |
|
| Value Line Food Processing Index | | $ | 100.00 |
| | $ | 95.79 |
| | $ | 91.02 |
| | $ | 111.46 |
| | $ | 144.37 |
| | $ | 156.86 |
|
|
| |
| Item 6. | Selected Financial Data |
| | | | | | | | | | | | | | | | | | | | |
| | | Fiscal years ended June 30, | |
| | | 2010 | | | 2009(1) | | | 2008(2) | | | 2007 | | | 2006 | |
| | | (In thousands, except per share data) | |
Net sales | | $ | 450,318 | | | $ | 341,724 | | | $ | 266,485 | | | $ | 216,259 | | | $ | 207,453 | |
Loss from operations | | $ | (39,192 | ) | | $ | (15,203 | ) | | $ | (10,644 | ) | | $ | (4,076 | ) | | $ | (2,965 | ) |
Net (loss) income(3) | | $ | (23,953 | ) | | $ | (33,270 | ) | | $ | (7,924 | ) | | $ | 6,815 | | | $ | 4,756 | |
Net (loss) income per common share | | $ | (1.61 | ) | | $ | (2.29 | ) | | $ | (0.55 | ) | | $ | 0.48 | | | $ | 0.34 | |
Total assets | | $ | 339,121 | | | $ | 330,017 | | | $ | 312,984 | | | $ | 337,609 | | | $ | 317,237 | |
Capital lease obligations(4) | | $ | 3,861 | | | $ | 1,252 | | | $ | — | | | $ | — | | | $ | — | |
Cash dividends declared per common share | | $ | 0.46 | | | $ | 0.46 | | | $ | 0.46 | | | $ | 0.44 | | | $ | 0.42 | |
(1) | Includes the results of operations of the DSD Coffee Business since it was acquired by the Company on February 28, 2009. |
(2) | Includes the results of operations of CBH since it was acquired by the Company on April 27, 2007. |
(3) | Includes deferred tax asset valuation allowance in the amount of $19.7 million recorded as a tax expense in fiscal 2009. |
(4) | Excludes imputed interest. |
|
| | | | | | | | | | | | | | | | | | | | |
| | | Fiscal year ended June 30, |
| | | 2012 | | 2011 | | 2010 | | 2009(1) | | 2008(2) |
| | | (In thousands, except per share data) |
| Net sales | | $ | 495,442 |
| | $ | 463,945 |
| | $ | 450,318 |
| | $ | 341,724 |
| | $ | 266,485 |
|
| Cost of goods sold | | $ | 322,618 |
| | $ | 306,771 |
| | $ | 252,754 |
| | $ | 181,508 |
| | $ | 147,073 |
|
| Loss from operations | | $ | (24,867 | ) | | $ | (68,422 | ) | | $ | (39,192 | ) | | $ | (15,203 | ) | | $ | (10,644 | ) |
| Loss from operations per common share | | (1.61 | ) | | (4.54 | ) | | (2.64 | ) | | (1.05 | ) | | (0.75 | ) |
| Net loss(3) | | $ | (29,329 | ) | | $ | (54,317 | ) | | $ | (23,953 | ) | | $ | (33,270 | ) | | $ | (7,924 | ) |
| Net loss per common share | | $ | (1.89 | ) | | $ | (3.61 | ) | | $ | (1.61 | ) | | $ | (2.29 | ) | | $ | (0.55 | ) |
| Total assets | | $ | 255,359 |
| | $ | 290,053 |
| | $ | 339,121 |
| | $ | 330,017 |
| | $ | 312,984 |
|
| Capital lease obligations(4) | | $ | 15,867 |
| | $ | 8,636 |
| | $ | 3,861 |
| | $ | 1,252 |
| | $ | — |
|
| Cash dividends declared per common share | | $ | — |
| | $ | 0.18 |
| | $ | 0.46 |
| | $ | 0.46 |
| | $ | 0.46 |
|
_______________
(1) Includes the results of operations of the DSD Coffee Business since its acquisition by the Company effective February 28, 2009.
(2) Includes the results of operations of CBH since its acquisition by the Company effective April 27, 2007.
(3) Includes: (a) $5.6 million in impairment losses on goodwill and intangible assets, $4.6 million in pension withdrawal expense and $14.2 million in beneficial effect of liquidation of LIFO inventory quantities in fiscal 2012; (b) $7.8 million in impairment losses on intangible assets, $1.5 million in pension curtailment charge, $1.1 million in beneficial effect of liquidation of LIFO inventory quantities and $9.2 million in income tax benefit in fiscal 2011; (c) $0.8 million in beneficial effect of liquidation of LIFO inventory quantities and $2.5 million in income tax benefit in fiscal 2010; and (d) a deferred tax asset valuation allowance of $19.7 million recorded as income tax expense in fiscal 2009.
(4) Excludes imputed interest.
The Notes to Consolidated Financial Statements and Management’s Discussion and Analysis of Financial Condition and Results of Operations included elsewhere in this report should be read in conjunction with the selected financial data in order to understand factors such as business combinations and unusual items which may affect the comparability of the information shown above.
|
| |
| Item 7. | Management’s Discussion and Analysis of Financial Condition and Results of Operations |
The following discussion contains forward-looking statements that involve risks and uncertainties. Our actual results could differ materially from those anticipated in these forward-looking statements as a result of many factors. The results of operations for the fiscal years ended June 30, 2010, 20092012, 2011 and 20082010 are not necessarily indicative of the results that may be expected for any future period. The following discussion should be read in combination with the consolidated financial statements and the notes thereto included in Part II, Item 8 of this report and with the “Risk Factors” described in Part I, Item 1A of this report. Overview
OverviewFarmer Bros. Co., a Delaware corporation (including its consolidated subsidiaries unless the context otherwise requires, the “Company,” “we,” “our” or “Farmer Bros.”), is a manufacturer, wholesaler and distributor of coffee, tea and culinary products throughproducts. We are a direct and brokered salesdistributor of coffee to our customers throughout the contiguous United States. Our product line is specifically focused on the needs of our market segment: institutional food service establishments including restaurants, hotels, casinos, hospitals and food serviceother foodservice providers, as well asand a provider of private brand coffee programs to Quick Serve Restaurants ("QSR's"), grocery retailers, such asnational drugstore chains, restaurant chains, convenience stores, and independent coffee houses, general merchandisers, private-label retailersnationwide. We were founded in 1912, were incorporated in California in 1923, and grocery stores. Our product line includes roasted coffee, liquid coffee, coffee related products such as coffee filters, sugar and creamers, assorted teas, cappuccino, cocoa, spices, gelatins and puddings, soup, gravy and sauce mixes, pancake and biscuit mixes, and jellies and preserves.
In Aprilreincorporated in Delaware in 2004. We operate in one business segment.
Since 2007, we acquired all of the outstanding shares of CBH for a purchase price of $23.6 million in cash, including transaction costs of approximately $1.4 million, net of the amount of all outstanding indebtedness of CBH and its subsidiaries. The results of operations of CBH have been included in our consolidated financial statements since April 27, 2007.On February 28, 2009, we completedFarmer Bros. has achieved growth, primarily through the acquisition in
2007of Coffee Bean Holding Co., Inc., a Delaware corporation ("CBH"), the DSDparent company of Coffee Business. The purchase price of $45.6 million was paid with approximately $16.1 million of Company cashBean International, Inc., an Oregon corporation (“CBI”), a specialty coffee manufacturer and $29.5 million of proceeds from a bank loan. In addition, we paid approximately $2.7 million of acquisition related expenseswholesaler headquartered in cash. At closing, we assumed certain liabilities, including obligations under contracts, environmental liabilities with respect to the transferred facilities, pension liabilities, advertising and trade promotion accruals, and accrued vacation as of the closing for hired personnel. As of June 30, 2010, these liabilities are estimated to be a total of $0.6 million consisting of estimated pension liabilities. The results of operations of the DSD Coffee Business have been included in our consolidated financial statements since March 1, 2009.In connection with the closing, Seller PartiesPortland, Oregon, and the Company entered into certain operational agreements, including trademark and formula license agreements, co-pack agreements, a liquid coffee distribution agreement, a transition services agreement, and a green coffee and tea purchase agreement. One of the co-pack agreements provided that Sara Lee would manufacture branded products for us for a period of three years. Under this agreement, we had agreed to purchase certain minimum product quantitiesacquisition in
2009 from Sara Lee subject toCorporation (“Sara Lee”) of certain permitted reductions. This agreement was terminated effective June 30, 2010. Underassets used in connection with its DSD coffee business in the other co-pack agreement, we have agreed to perform co-packing services for Sara Lee as Sara Lee’s agent. As a result, we recognize revenue from this arrangement on a net basis, net of direct costs of revenue. The transition services agreement pursuant to which Sara Lee agreed to provide a number of services for us on an interim basis, including hosting, maintaining and supporting IT infrastructure and communications, was scaled back in February 2010 to include only certain IT infrastructure support, and was terminated on August 31, 2010.United States (the “DSD Coffee Business”).
Critical Accounting Policies and Estimates
Management’s discussion and analysis of financial condition and results of operations is based upon our consolidated financial statements, which have been prepared in accordance with U.S. generally accepted accounting
principles.principles ("GAAP"). Our significant accounting policies are discussed in Note 1 to our consolidated financial statements, included herein at
Part II, Item 8. The preparation of these financial statements requires us to make estimates, judgments and assumptions that affect the reported amounts of assets, liabilities, revenues and expenses, and
related disclosure of contingent assets and liabilities. On an ongoing basis, we evaluate our estimates, including those related to inventory valuation, including LIFO reserves, the allowance for doubtful accounts, deferred tax assets, liabilities relating to retirement benefits, liabilities resulting from self-insurance of our workers’ compensation liabilities, tax liabilities and litigation. We base our estimates, judgments and assumptions on historical experience and other relevant factors that are believed to be reasonable based on information available to us at the time these estimates are made.
While we believe that the historical experience and other factors considered provide a meaningful basis for the accounting policies applied in the preparation of the consolidated financial statements, actual results may differ from these estimates, which could require us to make adjustments to these estimates in future periods.
We believe that the estimates, judgments and assumptions involved in the accounting policies described below require the most subjective judgment and have the greatest potential impact on our financial statements, so we consider these to be our critical accounting policies. Our senior management has reviewed the development and selection of these critical accounting policies and estimates, and their related disclosure in this report, with the Audit Committee of our Board of Directors.
Coffee Brewing Equipment and Service
Our
We classify certain expenses related to coffee brewing equipment provided to customers
as cost of goods sold. These costs include the cost of the equipment as well as the cost of servicing that equipment (including service
employees’employees' salaries,
the cost of transportation and the cost of supplies and parts)
. and are considered directly attributable to the generation of revenues from our customers. We capitalize coffee brewing equipment and depreciate it over a three
or five year
period;period, depending on the assessment of its useful life and report the depreciation expense
is reported in cost of goods sold.
Since we believe the costs of servicing the equipment are better characterized as direct costs of generating revenues from our customers, we have reported such costs as cost of goods sold in the accompanying financial statements. Investments
InvestmentsOur investments consist of money market instruments, marketable debt and equity securities, and various derivative instruments, primarily exchange traded treasury and green coffee futures and options, green coffee forward purchase contracts and commodity purchase agreements.options. All derivative instruments not designated as accounting hedges are marked to market and changes are recognized in current earnings. At June 30, 20102012 and 2009,2011, no derivative instruments were designated as accounting hedges. The fair value of derivative instruments is based upon broker
quotes. The cost of investments sold is determined on the specific identification method. Dividend and interest income is accrued as earned.
Allowance for Doubtful Accounts
We maintain an allowance for estimated losses resulting from the inability of our customers to meet their obligations. In fiscal 2010, based on a larger customer base due to the recent Company acquisitions and in response to slower collection of our accounts receivable resulting from the impact of the economic downturn on our customers, we increased our allowance for doubtful accounts. In
fiscal 2011, we decreased the allowance for doubtful accounts by $0.4 million due to improved collections of outstanding receivables. In fiscal 2012, we continued to improve the collection of past due accounts, and further decreased the allowance for doubtful accounts by $1.0 million. Inventories are valued at the lower of cost or market.
Costs ofWe account for coffee, tea and culinary products
are determined on
thea last in, first out
(LIFO) basis. We account for the costs of("LIFO") basis, and coffee brewing equipment manufactured on
thea first in, first out
(FIFO)("FIFO") basis. We regularly evaluate
theseour inventories to determine whether market conditions are correctly reflected in the recorded carrying value.
At the end of each quarter, we record the expected effect of the liquidation of LIFO inventory quantities and record the actual impact at fiscal year-end. An actual valuation of inventory under the LIFO method is made only at the end of each fiscal year based on the inventory levels and costs at that time.
If inventory quantities decline at the end of the fiscal year compared to the beginning of the fiscal year, the reduction results in the liquidation of LIFO inventory quantities carried at the cost prevailing in prior years. This LIFO inventory liquidation may result in a decrease or increase in cost of goods sold depending on whether the cost prevailing in prior years was lower or higher, respectively, than the current year cost. In fiscal 2012, 2011 and 2010, the beneficial effect of this liquidation of LIFO inventory quantities reduced cost of goods sold and net loss in the amounts of $14.2 million, $1.1 million and $0.8 million, respectively.
Impairment of Goodwill and
Indefinite-lived Intangible Assets
We perform our annual goodwill and indefinite-lived intangible assets impairment test as of June 30 of each fiscal year. Goodwill and other indefinite-lived intangible assets are not amortized but instead are reviewed for impairment annually and on an interim basis if events or changes in circumstances between annual tests indicate that an asset might be impaired. Indefinite-lived intangible assets are tested for impairment by comparing their fair values to their carrying values. Testing for impairment of goodwill is a two-step process. The first step requires us to compare the fair value of our reporting units to the carrying value of the net assets of the respective reporting units, including goodwill. If the fair value of thea reporting unit is less than theits carrying value, goodwill of the reporting unit is potentially impaired and we then complete step two to measure the impairment loss, if any. The second step requires the calculation of the implied fair value of goodwill, bywhich is the residual fair value remaining after deducting the fair value of all tangible and intangible net assets of the reporting unit from the fair value of the reporting unit. If the implied fair value of goodwill is less than the carrying amount of goodwill, an impairment loss is recognized equal to the difference. Indefinite-lived intangible assets are tested for impairment by comparing their fair values to their carrying values.
In addition to anthe fourth quarter of fiscal 2012, during our annual test for impairment of goodwill, we identified indicators of impairment including a decline in market capitalization and indefinite-livedcontinuing losses from operations. We performed impairment tests to determine the recoverability of the carrying values of the assets or if impairment should be measured. We were required to make estimates of the fair value of the Company's intangible assets, must also be testedand all assets of CBI, the reporting unit. As a result of these impairment tests, we determined that the Company's trademarks acquired in connection with the CBI acquisition were impaired and the carrying value of all of the assets of CBI excluding goodwill exceeded their estimated fair values resulting in an implied fair value of zero for CBI's goodwill. Accordingly, in the fourth quarter of fiscal 2012, we recorded a total impairment charge of $5.6 million including $5.1 million in impairment losses on an interim basis ifgoodwill, which is included in operating expenses.
Long-Lived Assets, Excluding Goodwill and Indefinite-lived Intangible Assets
We review the recoverability of our long-lived assets whenever events or changes in circumstances indicate that the carrying amount of such assets may not be recoverable. Long-lived assets evaluated for impairment are grouped with other assets to the lowest level for which identifiable cash flows are largely independent of the cash flows of other groups of assets and liabilities. The estimated future cash flows are based upon, among other things, assumptions about expected future operating performance, and may differ from actual cash flows. If the sum of the projected undiscounted cash flows (excluding interest) is less than the carrying value of the assets, the assets will be written down to the estimated fair value in the period in which the determination is made. In our annual test of suchimpairment as of the end of fiscal 2011, we identified indicators of
impairment including a decline in market capitalization and continuing losses from operations. We performed impairment tests to determine the recoverability of the carrying values of the assets has decreased belowor if impairment should be measured. The carrying value of these intangible assets was higher than the sum of each of their carrying value. Thereprojected undiscounted cash flows. We determined that definite-lived intangible assets consisting of the customer relationships acquired, and the distribution agreement and co-pack agreement entered into, in connection with the DSD Coffee Business acquisition were no such events or circumstances during theimpaired. As a result, in fiscal years ended June 30, 2010 or 2009.2011 we recorded an impairment charge of
$7.8 million in operating expenses. We are self-insured for California workers’ compensation insurance subject to specific retention levels and use historical analysis to determine and record the estimates of expected future expenses resulting from workers’ compensation claims. The estimated outstanding losses are the accrued cost of unpaid claims valued as of June 30, 2010.2012. The estimated outstanding losses, including allocated loss adjustment expenses (“ALAE”), include case reserves, the development onof known claims and incurred but not reported (IBNR) claims. ALAE are the direct expenses for settling specific claims. The amounts reflect per occurrence and annual aggregate limits maintained by the Company. The analysis does not include estimating a provision for unallocated loss adjustment expenses. Management believes that the amount accrued is adequate to cover all known claims at June 30, 2010.2012. If the actual costs of such claims and related expenses exceed the amount estimated, additional reserves may be required which could have a material negative effect on operating results. If our estimate were off by as much as 15%, the reserve could be under or overstated by approximately $0.7$0.8 million as of June 30, 2010.2012
. In May 2011, we did not meet the minimum credit rating criteria for participation in the alternative security program for California self-insurers. As a result, we were required to post a $5.9 million letter of credit as a security deposit to the State of California Department of Industrial Relations Self-Insurance Plans. As of June 30, 2012, this letter of credit continues to serve as a security deposit.
Estimated Company liability resulting from our general liability and automobile liability policies, within our deductible limits, is accounted for by specific identification. Large losses have historically been infrequent, and the lag between incurred but not reported claims has historically been short. Once a potential loss has been identified, the case is monitored by our risk manager to try and determine a likely outcome. Lawsuits arising from injury that are expected to reach our deductible are not reserved until we have consulted with legal counsel, become aware of the likely amount of loss and determined when payment is expected.
The estimated liability related to our self-insured group medical insurance is recorded on an incurred but not reported basis, within deductible limits, based on actual claims and the average lag time between the date insurance claims are filed and the date those claims are paid.
We have a defined benefit pension plan,
the Farmer Bros. Salaried Employees Pension Plan (the “Farmer Bros. Plan”), for the majority of our employees who are not covered under a collective bargaining agreement,
(Farmer Bros. Plan) and two defined benefit pension plans for certain hourly employees covered under a collective bargaining agreement
(Brewmatic Plan(the "Brewmatic Plan" and the
Hourly"Hourly Employees’
Plan)Plan"). In addition, we contribute to
several multi-employera multiemployer defined benefit pension
plansplan and a multiemployer defined contribution plan for certain union employees.
As of June 30, 2011, we amended the Farmer Bros. Plan, freezing the benefit for all participants effective June 30, 2011. After the plan freeze, participants do not accrue any benefits under the plan, and new hires are not eligible to participate in the plan. However, account balances continue to be credited with interest until paid out. As a result, we recorded $1.5 million in curtailment charge in the fourth quarter of fiscal 2011. Beginning in fiscal 2012, pension expense is significantly lower than in prior fiscal years due to the freeze in benefits as of June 30, 2011.
We obtain actuarial valuations for our plans and at presentin fiscal 2012 we discountdiscounted the pension obligations using a 5.60%4.55% discount rate and we estimateestimated an 8.25% long-term return on plan assets. The performance of the stock market and other investments as well as the overall health of the economy can have a material effect on pension investment returns and these assumptions. A change in these assumptions could affect our operating results. At the end of fiscal 2010,June 30, 2012, the projected benefit obligation ofunder our single employer defined benefit pension plans was $114.7$130.4 million and the fair value of the plan assets was $66.0 million.$85.8 million. The difference between the projected benefit obligation and the fair value of plan assets is recognized as a decrease in other comprehensive income (loss) (“OCI”) and an increase in pension liability and deferred tax assets. The difference between plan obligations and assets, or the funded status of the plans,
significantly affects the net periodic benefit costs of our pension plans and the ongoing funding requirements of those plans. Among other factors, changes in interest rates, mortality rates, early retirement rates, investment returns and the market value of plan assets can affect the level of plan funding, cause volatility in the net periodic pension costs,benefit cost and increase our future funding requirements. As of June 30, 2012, we have made $7.3 million in contributions to these plans and accrued $1.2 million in expense. We expect to make approximately $4.9$4.3 million in contributions to our single employer defined benefit pension plans in fiscal 20112013 and record an accruedaccrue expense of approximately $9.7$1.2 million per year beginning in fiscal 2011.2013. These pension payments are expected to continue at this level for several years, and the current economic environment increases the risk that we may be required to make even larger contributions in the future. The following chart quantifies the effect on the projected benefit obligation and the net periodic benefit cost of a change in the discount rate assumption and the impact on the net periodic benefit cost of a change in the assumed long term rate of return on plan assets for fiscal 2011. | | | | | | | | | |
| | | (In thousands) |
Farmer Bros. Plan Discount Rate | | 5.10% | | Actual 5.60% | | 6.10% |
Net periodic benefit cost | | $ | 10,048 | | $ | 9,022 | | $ | 8,102 |
Projected benefit obligation | | $ | 118,327 | | $ | 110,449 | | $ | 103,373 |
| | | |
Long Term Rate of Return | | 7.75% | | Actual 8.25% | | 8.75% |
Net periodic benefit cost | | $ | 9,342 | | $ | 9,022 | | $ | 8,703 |
| | | |
Brewmatic Plan Discount Rate | | 5.10% | | Actual 5.60% | | 6.10% |
Net periodic benefit cost | | $ | 223 | | $ | 214 | | $ | 207 |
Projected benefit obligation | | $ | 3,888 | | $ | 3,707 | | $ | 3,541 |
| | | |
Long Term Rate of Return | | 7.75% | | Actual 8.25% | | 8.75% |
Net periodic benefit cost | | $ | 226 | | $ | 214 | | $ | 203 |
| | | |
Hourly Employees’ Plan Discount Rate | | 5.10% | | Actual 5.60% | | 6.10% |
Net periodic benefit cost | | $ | 472 | | $ | 432 | | $ | 400 |
Projected benefit obligation | | $ | 629 | | $ | 578 | | $ | 533 |
| | | |
Long Term Rate of Return | | 7.75% | | Actual 8.25% | | 8.75% |
Net periodic benefit cost | | $ | 433 | | $ | 432 | | $ | 431 |
2013
: |
| | | | | | | | | | | | |
| | | (Dollars in thousands) |
| Farmer Bros. Plan Discount Rate | | 4.05% | | Actual 4.55% | | 5.05% |
| Net periodic benefit cost | | $ | 673 |
| | $ | 617 |
| | $ | 549 |
|
| Projected benefit obligation | | $ | 133,619 |
| | $ | 124,828 |
| | $ | 116,928 |
|
| | | | | | | |
| Farmer Bros. Plan Rate of Return | | 7.50% | | Actual 8.00% | | 8.50% |
| Net periodic benefit cost | | $ | 1,026 |
| | $ | 617 |
| | $ | 207 |
|
| | | | | | | |
| Brewmatic Plan Discount Rate | | 4.05% | | Actual 4.55% | | 5.05% |
| Net periodic benefit cost | | $ | 194 |
| | $ | 184 |
| | $ | 175 |
|
| Projected benefit obligation | | $ | 4,242 |
| | $ | 4,022 |
| | $ | 3,823 |
|
| | | | | | | |
| Brewmatic Plan Rate of Return | | 7.50% | | Actual 8.00% | | 8.50% |
| Net periodic benefit cost | | $ | 197 |
| | $ | 184 |
| | $ | 171 |
|
| | | | | | | |
| Hourly Employees’ Plan Discount Rate | | 4.05% | | Actual 4.55% | | 5.05% |
| Net periodic benefit cost | | $ | 441 |
| | $ | 400 |
| | $ | 369 |
|
| Projected benefit obligation | | $ | 1,654 |
| | $ | 1,520 |
| | $ | 1,402 |
|
| | | | | | | |
| Hourly Employees' Rate of Return | | 7.50% | | Actual 8.00% | | 8.50% |
| Net periodic benefit cost | | $ | 406 |
| | $ | 400 |
| | $ | 395 |
|
Deferred income taxes are determined based on the temporary differences between the financial reporting and tax bases of assets and liabilities using enacted tax rates in effect for the year in which
the differences are expected to reverse. Estimating our tax liabilities involves judgments related to uncertainties in the application of complex tax regulations. We make certain estimates and judgments to determine tax expense for financial statement purposes as we evaluate the effect of tax credits, tax benefits and deductions, some of which result from differences in timing of recognition of revenue or expense for tax and financial statement purposes.
Changes to these estimates may result in significant changes to our tax provision in future periods. Each fiscal quarter we reevaluate our tax provision and reconsider our estimates and our assumptions related to specific tax assets and liabilities, making adjustments as circumstances change.
Deferred Tax Asset Valuation Allowance
We assess whether a valuation allowance should be recorded against deferred tax assets based on the likelihood that the benefits of the deferred tax assets will or will not ultimately be realized in future periods. In making such assessment, significant weight is to be given to evidence that can be objectively verified such as recent operating results and less consideration is to be given to less objective indicators such as future earnings projections. We have evaluated our deferred tax assets in accordance with these requirements.
A significant
After consideration of positive and negative factor wasevidence, including the Company’s three-year historical cumulative loss asrecent history of losses, the end of the fourth quarter of fiscal 2009, compared to the size of deferred tax assets. TheCompany is maintaining a valuation allowance against its deferred tax assets as of June 30, 2012. The valuation allowance increased to $85.0 millionin fiscal 2012, from $60.4 million and $43.9 million in fiscal 2011 and 2010, respectively.
Deferred tax assets increased to $53.7$88.6 million as of June 30, 2012 compared to $41.4$68.8 million and $53.7 million in fiscal 2009.2011 and 2010, respectively. In fiscal 2010,2012, deferred tax assets increased primarily due to net loss carryovers and a decrease in expected pension asset values.values related to a change in actuarial assumptions. In fiscal 2009,2011, deferred tax assets increased primarily due to decreased pension asset values whichnet loss carryovers partially offset by a reduction in turn created increased pension plan contribution obligations. These considerations outweighed our ability to rely on projections of future taxable income and future appreciation of pension assets, and as a result, in fiscal 2009, we established a valuation allowance against the deferred tax assets due to an increase in the amount of $33.3 million. Of this amount $19.7 million was recorded as a fiscal 2009 tax expense and $13.6 million was recorded as a reduction in other comprehensive income.expected pension asset values.
We sponsor a defined benefit postretirement medical and dental plan that covers qualified non-union employees and retirees, and certain qualified union locals. Theretirees. Under this postretirement plan, is contributoryour contributions toward premiums for retiree medical, dental and retireevision coverage for participants and dependents are scaled based on length of service, with greater Company contributions are fixed atfor retirees with greater length of service, but subject to a current level. maximum monthly Company contribution.
Our retiree medical plan is not fundedunfunded and its liability was calculated using an assumed discount rate of 6.61%4.4% at June 30, 2010.2012. We project an initial medical trend rate of 8.0%7.0% ultimately reducing to 5.0% in 65 years.Effective January 1, 2008, we adopted a new plan for retiree medical benefits. The new plan is a cost sharing approach between the Company and covered employees and dependents in which the Company subsidizes a larger proportion of covered expenses for retirees who were long-term employees, and provides less coverage for retirees who were short-term employees. Additionally, the plan establishes a maximum Company contribution.
The effect of adopting this new plan was recorded on the effective date of the plan, January 1, 2008, as an increase in accumulated other comprehensive income of $16.7 million (net of related tax effects of $10.6 million), and a reduction to the retiree medical liability of $27.3 million. The accumulated other comprehensive income amount is expected to be amortized as a reduction in expense over a period of 7 to 12 years. Amortization in fiscal 2010 and 2009 was $4.2 million and $0.7 million, respectively.
We measure all share-based compensation cost at the grant date, based on the fair value of the award, and recognize such cost as an expense in our consolidated statement of operations over the requisite service period. The process of estimating the fair value of share-based compensation awards and recognizing share-based compensation cost over the requisite service period involves significant assumptions and judgments. We estimate the fair value of stock option awards on the date of grant using the Black-Scholes option valuation model which requires that we make certain assumptions regarding: (i) the expected volatility in the market price of our common stock; (ii) dividend yield; (iii) risk-free interest rates; and (iv) the period of time employees are expected to hold the award prior to exercise (referred to as the expected holding period). In addition, we estimate theexpected impact of forfeited awards and recognize share-based compensation cost only for those awards expected to vest. If actual forfeiture rates differ materially from our estimates, share-based compensation expense could differ significantly from the amounts we have recorded in the current period. We will periodically review actual forfeiture experience and revise our estimates, as necessary. We will recognize as compensation cost the cumulative effect of the change in estimated forfeiture rates on current and prior periods in earnings of the period of revision. As a result, if we revise our assumptions and estimates, our share-based compensation expense could change materially in the future. In
fiscal 2010,2012 and 2011, we used an estimated 6.5% annual forfeiture rate to calculate share-based compensation expense based on actual forfeiture experience from the inception of the Omnibus Plan.
Liquidity and Capital Resources
On March 2, 2009,September 12, 2011, we entered into aan Amended and Restated Loan and Security Agreement (the “Loan Agreement”) withamong the Company and CBI, as Borrowers, certain of the Company’s other subsidiaries, as Guarantors, the Lenders party thereto, and Wells Fargo Bank, National Association ("Wells Fargo"), as Lender, providingAgent
The Loan Agreement provides for a $50 million senior secured revolving credit facility expiring in February 2012of up to help finance$85.0 million, with a letter of credit sublimit of $20.0 million. The revolving credit facility provides for advances of 85% of eligible accounts receivable and 75% of eligible inventory (subject to a $60.0 million inventory loan limit), as defined. The Loan Agreement provides for interest rates based on modified Monthly Average Excess Availability levels with a range of PRIME + 0.25% to PRIME + 0.75% or Adjusted Eurodollar Rate + 2.0% to Adjusted Eurodollar Rate + 2.5%. The Loan Agreement has an amendment fee of 0.375% and an unused line fee of 0.25%. Outstanding obligations under the DSD Coffee Business acquisition and for general corporate purposes. Loan Agreement are collateralized by all of the Borrowers’ assets, including the Company’s preferred stock portfolio. The term of the Loan Agreement expires on March 2, 2015.
The Loan Agreement contains a variety of
restrictiveaffirmative and negative covenants
of types customary in an
asset basedasset-based lending facility, including
a minimum excess availability requirementthose relating to reporting requirements, maintenance of records, properties and
a minimum total liquidity requirement,corporate existence, compliance with laws, incurrence of other indebtedness and
it places limitsliens, limitations on
dividends.certain payments, including the payment of dividends and capital expenditures, and transactions and extraordinary corporate events. The Loan Agreement allows us to pay dividends,
at the current rate, subject to certain liquidity requirements.
All The Loan Agreement also contains financial covenants requiring the Borrowers to maintain minimum Excess Availability and Total Liquidity levels. The Loan Agreement allows the Lender to establish reserve requirements, which may reduce the amount of credit otherwise available to us, to reflect events, conditions, or risks that would have a reasonable likelihood of adversely affecting the Lender’s collateral or our assets, including our green coffee inventory.
The Loan Agreement provides that an event of default includes, among other things, subject to certain grace periods: (i) payment defaults; (ii) failure by any guarantor to perform any guarantee in favor of Lender; (iii) failure to abide by loan covenants; (iv) default with respect to other material indebtedness; (v) final judgment in a material amount not discharged or stayed; (vi) any change of control; (vii) bankruptcy or insolvency; and (viii) the failure of the Farmer Bros. Co. Employee Stock Ownership Benefit Trust, created by the Company to implement the Farmer Bros. Co. Employee Stock Ownership Plan ("ESOP"), to be duly qualified under Section 401(a) of the Internal Revenue Code of 1986, as amended, or exempt from federal income taxation, or if the ESOP engages in a material non-exempt prohibited transaction.
On January 9, 2012, the Loan Agreement was amended (“Amendment No. 1”) in connection with JPMorgan Chase Bank, N.A. (“JPMorgan Chase”), becoming an additional Lender thereunder. Pursuant to Amendment No. 1, Wells Fargo will provide a commitment of $60.0 million and JPMorgan Chase will provide a commitment of $25.0 million.
The interest rate on our outstanding obligationsborrowings under the Loan Agreement are collateralized by perfected security interests in our assets, excluding the preferred stock held in investment accounts. The revolving line provides for advanceswas 3.5% at June 30, 2012. As of 85% of eligible accounts receivable and 65% of eligible inventory, as defined. The Loan Agreement has an unused commitment fee of 0.375%. The interest rate varies based upon line usage, borrowing base availability and market conditions. The interest rate on the Company’sJune 30, 2012, we had outstanding borrowings was 3.75% at June 30, 2010.of $29.1 million, excluding loan extension fees of $0.2 million, utilized $11.9 million of the letters of credit sublimit, and had excess availability under the credit facility of $31.4 million. Due to the short-term nature of the credit facility and the variable interest rate, fair value of the balance outstanding approximates carrying value.On August 31, 2010, As of
June 30, 2012, we entered into Amendment No. 4 towere in compliance with all restrictive covenants under the Loan and Security Agreement with Wells Fargo (the “Amendment”) pursuant to which effective March 31, 2010, certain collateral reporting, dividend payment, and financial covenants were modified. Effective September 1, 2010, the Amendment also amended the range of interest rates on the line usage based on modified Monthly Average Excess Availability levels. The range is PRIME + 0.25% to PRIME + 0.75% or Adjusted Eurodollar Rate + 2.5% to Adjusted Eurodollar Rate + 3.0% (also see Note 17 “Subsequent Event” to the consolidated financial statements included in Part II, Item 8 of this Form 10-K).The foregoing description of the Amendment is not complete and is qualified in its entirety by the actual terms of the Amendment, a copy of which is incorporated herein by reference and attached hereto as Exhibit 10.9.Agreement. There can be no assurance that our lenderthe Lender will issue a waiver or grant an amendment to the covenants in future periods, if we requirethe Company required one.
As of June 30, 2010, we were eligible to borrow up to a total of $50.0 million under the credit facility. As of June 30, 2010,August 31, 2012, we had borrowed $37.2estimated outstanding borrowings of
$24.0 million, excluding loan extension fees of $0.2 million, utilized $3.1$11.9 million of ourthe letters of credit sub-limit,sublimit, and had excess availability under the credit facility of $9.7 million.$39.5 million. Liquidity
We generally finance our operations through cash flow from operations and borrowings under our revolving credit facility described above. As of September 9, 2010,June 30, 2012, we had $32.5$3.9 million outstanding under in cash and cash equivalents and $21.0 million in short-term investments. We believe our revolving credit facility, to the credit facility.extent available, in addition to our cash flows from operations and other liquid assets, are sufficient to fund our working capital and capital expenditure requirements for the next 12 months.
LiquidityIn fiscal 2010, we incurred significant costsWe generate cash from operating activities primarily from cash collections related to the integration of the DSD Coffee Business into our existing operations. This broad based effort required SKU optimization, branch and route consolidation, conversion to the Company’s IT systems, including implementationsale of our mobile sales software acrossproducts. Net cash provided by operating activities was $18.1 million in fiscal 2012, compared with $33.9 million in fiscal 2011 and net cash used in operating activities of $1.0 million in fiscal 2010. The lower level of net cash provided by operating activities in fiscal 2012 was primarily due to an increase in accounts payable payments. In fiscal 2011, net cash provided by operating activities was larger primarily due to a decrease in accounts payable payments and higher proceeds from the DSD Coffee Business sales network,sale of investments.
Net cash used in investing activities decreased to $14.5 million in fiscal 2012, compared to $17.4 million and supply chain$28.0 million in fiscal 2011 and manufacturing streamlining. During fiscal 2010 we incurred, respectively, primarily due to reduced levels of capital expenditures.
Net cash used in financing activities was $5.8 million in fiscal 2012, compared to $14.6 million in fiscal 2011 and chargednet cash provided by financing activities of $13.2 million in fiscal 2010. Net cash used in financing activities in fiscal 2012 included net repayments on our credit facility of $4.0 million compared to expense $10.1net repayments of $8.5 million and net borrowings of $21.0 million in fiscal 2011 and 2010, respectively. In addition, there were no dividend payments in fiscal 2012, compared to dividend payments of $4.7 million and $6.9 million in integration costs related to the DSD Coffee Businessacquisitionfiscal 2011 and incurred and2010, respectively.
In fiscal 2012, we capitalized $5.0$17.5 million in property, plant and equipment purchases related to the DSD Coffee Business acquisition. During the same period, we also incurred approximately $6.8which included $13.9 million in expenditures associated with the installationto replace normal wear and tear of two roasterscoffee brewing equipment, $0.1 million in building and other productionfacility improvements, $3.0 million in expenditures for vehicles, and machinery and equipment, at our Torrance facility and$0.5 million in information technology related expenditures. In addition, during fiscal 2012 we acquired equipment and trucks under capital leases totaling $9.5 million.
Our expected capital expenditures for fiscal 2013 include expenditures to replace normal wear and tear of coffee brewing equipment, vehicles, and machinery and
equipment. Of the total capital expenditures in fiscal 2010 of approximately $28.5 million, $21.7 million was for machinery and equipment including $6.8 million in expenditures for the roasters and production equipment, including machinery and equipment for the DSD Coffee Business, and $1.0 million was for vehicles.As described above, we maintain a $50 million senior secured revolving line of credit with Wells Fargo. Although we expect cost reductions and other positive synergies from integrating the DSD Coffee Business with our operations, the timing of these improvements is uncertain. We believe this credit facility, to the extent available, in addition to our other liquid assets, provides sufficient capital resources and flexibility for the next twelve months to allow us to meet necessary working capital requirements and implement our business plan without relying solely on cash flows from operations.
Our expected capital expenditures for fiscal 2011 include completion of the installation of the two roasters and other production equipment, and expendituresare expected not to replace normal wear and tear of coffee brewing equipment, vehicles, and machinery and equipment.
deviate significantly from fiscal 2012 levels.
Our working capital is comprised of the following: | | | | | | |
| | | June 30, |
| | | 2010 | | 2009 |
| | | (In thousands) |
Current assets | | $ | 189,956 | | $ | 186,546 |
Current liabilities | | | 98,546 | | | 74,756 |
| | | | | | |
Working capital | | $ | 91,410 | | $ | 111,790 |
| | | | | | |
|
| | | | | | | | |
| | | June 30, |
| | | 2012 | | 2011 |
| | | (In thousands) |
| Current assets | | $ | 135,851 |
| | $ | 157,410 |
|
| Current liabilities | | 92,689 |
| | 103,462 |
|
| Working capital | | $ | 43,162 |
| | $ | 53,948 |
|
Liquidity Information: | | | | | | | | | |
| | | June 30, |
| | | 2010 | | 2009 | | 2008 |
| | | (In thousands) |
Capital expenditures | | $ | 28,483 | | $ | 38,901 | | $ | 24,852 |
Purchase of business | | $ | — | | $ | 48,287 | | $ | — |
Dividends paid | | $ | 6,938 | | $ | 6,631 | | $ | 6,670 |
Dividend payable | | $ | 1,849 | | $ | 1,849 | | $ | 1,849 |
|
| | | | | | | | | | | | |
| | | June 30, |
| | | 2012 | | 2011 | | 2010 |
| | | (In thousands) |
| Capital expenditures | | $ | 17,498 |
| | $ | 19,416 |
| | $ | 28,484 |
|
| Dividends paid | | $ | — |
| | $ | 4,657 |
| | $ | 6,939 |
|
| Dividends payable | | $ | — |
| | $ | — |
| | $ | 1,849 |
|
Fiscal Years Ended June 30, 20102012 and 20092011
Overview
In Overviewfiscal 2012
Fiscal 2010 was, commodity prices remained high through the first half of the fiscal year and started to fall during the second half of the fiscal year, with the exception of fuel costs which remained high throughout fiscal 2012. We utilize several strategies to minimize the impact of increasing green coffee prices, including the purchase of future coffee contracts, in some instances, up to 18 months in advance of the actual delivery date, to enable us to lock-in green coffee prices within a yearpre-established range. Although this strategy minimizes the impact of increasing green coffee prices, if green coffee prices decline after we lock the purchase cost, the cost of our purchases reflected in our financial results may be higher compared to the current market cost of green coffee. To address the increase in freight and fuel expense, in fiscal 2011 we instituted an energy surcharge which continued in fiscal 2012.
To address downward margin pressures, we primarily focusedcontinued to focus on integratingstreamlining our operations in fiscal 2012. Specifically, we continued our focus on expense reductions and asset redeployment to improve our operating results. The benefit of initiatives we implemented in fiscal 2011 intended to reduce the DSD Coffee Business intocost of our existing operations. We streamlinedoperations, including headcount reduction, inventory reduction, implementation of improved collection practices of past due accounts, cost-sharing measures to address increases in employee healthcare costs, automation of certain functions, centralization of certain IT functions, and in-sourcing of certain business support functions, also started to be realized. In fiscal 2012, we also implemented employee benefit plan restructuring, and continued to improve our routesreal-estate asset management by divesting underutilized properties and distribution logistics and consolidatedrenegotiating our warehouses and distribution centers from 179lease terms in response to 115 locations. Our netmore favorable market conditions in certain markets.
Operations
Net sales grew $108.6in fiscal 2012 increased $31.5 million, or 32%6.8%, to $450.3$495.4 million from $463.9 million in fiscal 2010 from $341.7 million in fiscal 20092011, primarily due to increases in list prices of our coffee, cappuccino, cocoa and selected spice products implemented in the acquisitionsecond half of fiscal 2011, offset in part by the DSD Coffee Business. Net sales from CBI also increased approximately 8% fromeffect of a decrease in the number of customers who purchased our products as compared to the prior fiscal year. Although our net sales increased and our geographic reach widened in fiscal 2010, the weakness in the economy and reduced consumer spending negatively impacted our net sales. OperationsNet sales in fiscal 2010 increased $108.6 million, or 32%, to $450.3 million from $341.7 million in fiscal 2009, primarily due to the addition of DSD Coffee Business net sales beginning on March 1, 2009. Cost of goods sold in fiscal 20102012 increased $71.2$15.8 million, or 39%5.2%, to $252.8$322.6 million, or 56%65.1% of sales, from $181.5$306.8 million, or 53%66.1% of sales, in fiscal 20092011, primarily due to the increase in net sales. The decrease in cost of goods sold as a percent of net sales in fiscal 2012 is primarily due to a reduction in coffee inventory, which resulted in the liquidation of LIFO inventory quantities carried at lower costs prevailing in prior years. The beneficial effect of this liquidation of LIFO inventory quantities reduced cost of goods sold by $14.2 million compared to $1.1 million in fiscal 2011. This reduction in cost of goods sold was offset, in part, by a 16.0% increase in the average cost of green coffee purchased in fiscal 2012 compared to the prior fiscal year.
Gross profit in fiscal 2012 increased $15.7 million, or 10.0%, to $172.8 million from $157.2 million in fiscal 2011. Gross margin increased to 35% in fiscal 2012 from 34% in the prior fiscal year. The increase in gross profit and gross margin is primarily due to the beneficial effect of the liquidation of LIFO inventory quantities and the full year benefit of price increases for our coffee, cappuccino, cocoa and selected spice products in fiscal 2012, offset by changes in the mix of our customers and the products we sell to them and a 16.0% increase in the average cost of green coffee purchased in fiscal 2012.
In fiscal 2012, operating expenses decreased $27.9 million, or 12.4%, to $197.7 million, or 40% of sales, from $225.6 million, or 49% of sales, in fiscal 2011. The reduction in operating expenses in fiscal 2012 is primarily due to lower payroll and related expenses resulting from a decreased employee headcount, savings from employee benefit plan restructuring and ongoing cost control measures. The decrease if operating expenses was offset, in part, by impairment losses on goodwill and intangible assets in the amount of $5.6 million and charges related to withdrawal from multiemployer pension plans in the amount of $4.6 million.
In our annual test of impairment of long-lived assets, we determined that goodwill and certain trademarks acquired in connection with the CBI acquisition were impaired. Accordingly, in the fourth quarter of fiscal 2012, we recorded total impairment charges of $5.6 million including $5.1 million in impairment losses on goodwill.
In fiscal 2012, we withdrew from two multiemployer defined benefit pension plans and recorded a charge of $4.3 million associated with withdrawal from one of these plans, representing the present value of the estimated withdrawal liability expected to be paid in quarterly installments of $0.1 million over 80 quarters. Installment payments will commence once the final determination of the amount of withdrawal liability is established, which determination may take up to 24 months from the date of withdrawal from the pension plan. Upon withdrawal, the employees covered under one of these multiemployer pension plans were included in our 401(k) plan ("401(k) Plan") and the other defined benefit multiemployer pension plan was replaced with a defined contribution pension plan. The $4.3 million charge is included in our consolidated statement of operations for the year ended June 30, 2012 as “Pension withdrawal expense” and in current and long-term liabilities on the Company’s balance sheet at June 30, 2012. In addition, ofwe also recorded $0.3 million in pension withdrawal expense for acquisition-related pension withdrawal liability assumed in connection with the DSD Coffee Business beginningacquisition that was fully paid in fiscal 2012.
Loss from operations in fiscal 2012 was $(24.9) million compared to $(68.4) million in fiscal 2011, due to improvement in gross profit and reduction in operating expenses.
Total other income (expense)
Total other expense in fiscal 2012 was $4.8 million compared to total other income of $4.9 million in fiscal 2011, primarily due to net derivative losses of $4.1 million in fiscal 2012 compared to net derivative gains of $4.2 million in fiscal 2011. The net derivative losses and gains were primarily due to coffee-related futures contracts.
Income taxes
In fiscal 2012, we recorded an income tax benefit of $0.3 million compared to $9.2 million in fiscal 2011. Income tax benefit for fiscal 2012 was primarily attributable to the settlement of certain tax issues with the Internal Revenue Service and the State of California during our exam appeals. In fiscal 2012, unrecognized tax benefits related to certain tax refunds were released and the resulting benefit was recorded.
Income tax benefit for fiscal 2011 was primarily attributable to gains on March 1, 2009.postretirement benefits. Income tax expense or benefit from continuing operations is generally determined without regard to other categories of earnings, such as discontinued operations and OCI. An exception is provided in Accounting Standards Codification ("ASC") 740, "Income Taxes," when there is aggregate income from categories other than continuing operations and a loss from continuing operations in the current year. In this case, the tax benefit allocated to continuing operations is the amount by which the loss from continuing operations reduces the tax expenses recorded with respect to the other categories of earnings, even when a valuation allowance has been established against the deferred tax assets. In instances where a valuation allowance is established against current year losses, income from other sources, including gain from postretirement benefits recorded as a component of OCI, is considered when determining whether sufficient future taxable income exists to realize the deferred tax assets. As a result, for the fiscal year ended June 30, 2011, we recorded a tax expense of $9.8 million in OCI related to the gain on postretirement benefits, and recorded a corresponding tax benefit of $9.8 million in continuing operations.
Net Loss
As a result of the above operating factors, net loss decreased to $(29.3) million, or $(1.89) per common share, in fiscal 2012 compared to a net loss of $(54.3) million, or $(3.61) per common share, in fiscal 2011.
Fiscal Years Ended June 30, 2011 and 2010
Overview
Fiscal 2011 was a period of rapid commodity inflation, which impacted our cost of green coffee, sugar and cocoa and freight expense. Since we value our inventory on a LIFO basis rather than on a FIFO basis, the escalating coffee prices had a significant negative impact on our cost of goods sold and the resulting gross profit. To address the increase in freight and fuel expense, we instituted an energy surcharge in fiscal 2011 and, to minimize gross margin erosion, we increased pricing to our customers several times in fiscal 2011 although the price increases, at times, lagged the relatively rapid and steep cost increases we incurred. In an environment of record-high costs, rising unemployment and a severe economic downturn, we were unable to fully pass along our costs to our customers.
To address downward margin pressures, we continued to focus on streamlining our operations in fiscal 2011. Specifically, we focused on expense reductions, asset redeployment and automation intended to improve our operating results. We implemented a number of initiatives intended to reduce the cost of our operations, including headcount reduction, inventory reduction, implementation of improved collection practices of past due accounts, cost-sharing measures to address increases in employee healthcare costs, automation of certain functions, centralization of certain IT functions, and in-sourcing of certain business support functions. We have and expect to continue to improve our real-estate asset management by divesting underutilized properties and renegotiating our lease terms in response to more favorable market conditions in certain markets.
In fiscal 2011, we significantly modified our retirement benefit program. Specifically, we amended the Farmer Bros. Plan, freezing the benefit for all participants effective June 30, 2011. After the plan freeze, participants do not accrue any benefits under the plan, and new hires are not eligible to participate in the plan. However, account balances continue to be credited with interest until paid out. The freeze of the Farmer Bros. Plan coincided with an enhanced defined contribution
401(k) Plan with a discretionary Company match of the employees’ annual contributions. In fiscal 2011, the Company accrued $0.1 million towards this Company match. The pension freeze was anticipated to save over $8.0 million annually in future pension expense accrual, which is expected to be offset by any discretionary Company match under the 401(k) Plan.
In fiscal 2011, we also sold a portion of our investments in preferred stock in order to pay down a portion of the outstanding balance on our revolving credit facility.
Operations
Net sales in fiscal 2011 increased $13.6 million, or 3%, to $463.9 million from $450.3 million in fiscal 2010, primarily due to increases in list prices of our coffee, cappuccino, cocoa and selected spice products implemented in the second half of fiscal 2011, offset in part by a decrease in the number of customers who purchased our products as compared to the prior fiscal year.
Cost of goods sold in fiscal 2011 increased $54.0 million, or 21%, to $306.8 million, or 66% of sales, from $252.8 million, or 56% of sales, in fiscal 2010 primarily due to the increase in the cost of green coffee beans. Green coffee costs increased 80% in fiscal 2011 compared to the prior fiscal year. Additionally, the cost of coffee brewing equipment and related service included in cost of goods sold also contributed to the increase in cost of goods sold. Cost of coffee brewing equipment and related service for the in fiscal year ended June 30, 20102011 was $21.5$27.1 million compared to $13.1$21.5 million for the in fiscal year ended June 30, 2009.2010
. Gross profit in fiscal 2010 increased $37.32011 decreased $(40.4) million, or 23%(20)%, to $197.6$157.2 million from $160.2$197.6 million in fiscal 2009. However, gross2010. Gross margin decreased to 44%34% in fiscal 20102011 from 47%44% in the prior fiscal year. As with net sales, the increase in gross profit is directly attributable to the acquisition of the DSD Coffee Business. TheThis decrease in gross margin is primarily due to the(1) increased raw material costs including an 80% increase in the cost of green coffee beans in fiscal 2011 compared to the prior fiscal year partially offset by price increases for finished goods during the period, (2) increased coffee brewing equipment and service costs, and (3) changes in the mix of our customers and the products we sell to them.
In fiscal 2011, operating expenses decreased $(11.2) million, or (5)%, to $225.6 million, or 49% of sales, from $236.8 million, or 53% of sales, in fiscal 2010. The reduction in operating expenses in fiscal 2011, as compared to the prior fiscal year, is primarily due to lower payroll and related service costexpenses resulting from a reduction in costthe number of goods soldemployees offset in part by higher freight and fuel costs, and severance costs associated with the reduction in headcount of approximately 200 employees in the amount of $21.5$3.1 million in fiscal 2010 from $13.1 million in the prior fiscal year, and the addition of a new class of DSD Coffee Business customers who require a different mix of products.. Operating expenses in fiscal 2010 increased $61.32011 also include $7.8 million or 35%, to $236.8 million, or 52% of sales, from $175.4 million, or 51% of sales, in fiscal 2009. Operating expenses in fiscal 2010 consisted of a full year of expensesimpairment losses related to the DSD Coffee Business compared to fiscal 2009 which included only four months of expenses relatedintangible assets, $1.5 million in pension curtailment charges, and $0.7 million in severance costs recorded pursuant to the DSD Coffee Business. Additionally, operating expenses included $10.1 million related toSeparation Agreement between the integration ofCompany and Roger M. Laverty III, the DSD Coffee Business including expenses related to SKU optimizationCompany’s former President and streamlining of facilities and routes, $8.5 million in higher depreciation and amortization expense, $8.4 million in higher pension expense and $3.2 million in higher bad debt expense compared to the prior year.For the reasons noted above, lossChief Executive Officer.
Loss from operations in fiscal 2011 was $(68.4) million compared to $(39.2) million in fiscal 2010 increased, primarily due to $(39.2) million from $(15.2) milliondecline in fiscal 2009.gross profit.
Total other income (expense)
Total other income in fiscal 20102011 was $12.7$4.9 million compared to $12.7 million in fiscal 2010. The decrease in total other expense of $(3.8) million in fiscal 2009. Thisincome was primarily due to improved results from our preferred stock portfolio which recordedlower net realized and unrealized gains in fiscal 2010 compared to net realizedon a smaller investment portfolio and unrealized losses in fiscal 2009, partially offset by $1.5 million in higher interest expense related to borrowings under our revolving credit line.facility in
Net Lossfiscal 2011As a result as compared to fiscal 2010.
Income taxes
In fiscal 2011, we recorded an income tax benefit of the above operating factors, net loss decreased$9.2 million compared to $(24.0)$2.5 million or $(1.61) per common share, in fiscal 2010 compared2010. Income tax expense or benefit from continuing operations is generally determined without regard to other categories of earnings, such as
discontinued operations and OCI. An exception is provided in ASC 740 when there is aggregate income from categories other than continuing operations and a net loss from continuing operations in the current year. In this case, the tax benefit allocated to continuing operations is the amount by which the loss from continuing operations reduces the tax expenses recorded with respect to the other categories of $(33.3) million, or $(2.29) per common share, in fiscal 2009, which included the recognition ofearnings, even when a valuation allowance forhas been established against the deferred tax assetsassets. In instances where a valuation allowance is established against current year losses, income from other sources, including gain from postretirement benefits recorded as a component of $(19.7) million, or $(1.35) per common share in fiscal 2009.Fiscal Years Ended June 30, 2009 and 2008
Overview
Fiscal 2009 was another year of acquisition for us as we acquiredOCI, is considered when determining whether sufficient future taxable income exists to realize the DSD Coffee Business in February 2009, anddeferred tax assets. As a year in which we continued integrating CBI (acquired in April 2007) and made extensive plans for integrating the DSD Coffee Business into our operations. Our sales revenue grew to $341.7 million in fiscal 2009 from $266.5 million in fiscal 2008, we acquired over 2,000 new SKU’s and over 60 trademarks, tradenames and service marks including the major regional brands MCGARVEY®, CAIN’S®, IRELAND®, JUSTIN LLOYD®, METROPOLITAN®, PREBICA®, WECHSLER®, WORLD’S FINEST® and CAFÉ ROYAL®, and the national
brand SUPERIOR®, broadened and diversified our customer base to include a major presence in the gaming industry as well as significant national chain accounts, and expanded geographically from our old 28 state marketing area into all 48 contiguous states.
Operations
Net sales in fiscal 2009 increased $75.2 million, or 28%, to $341.7 million from $266.5 million in fiscal 2008. Approximately 81% of this increase resulted from the addition of DSD Coffee Business net sales beginning on March 1, 2009. Non-DSD net sales increased $14.5 million, or 5%, in fiscal 2009 as compared to fiscal 2008. Unit sales increased approximately 35% in fiscal 2009 as compared to fiscal 2008, and approximately 54% of this increase resulted from the addition of the DSD Coffee Business.
Cost of goods sold in fiscal 2009 increased $34.4 million, or 23%, to $181.5 million, or 53% of sales, from $147.1 million, or 55% of sales, in fiscal 2008. Approximately 87% of this increase resulted from the addition of the DSD Coffee Business. Our annual LIFO adjustment for inventory on hand at the end of fiscal 2009 increased cost of goods sold by $1.5 million compared to $5.8 million in fiscal 2008. In a rising market LIFO costs represent replacement costs of inventory, not actual cost, and in fiscal 2009 we added additional inventory with the purchase of the DSD Coffee Business. Cost of coffee brewing equipment included in cost of goods soldresult, for the fiscal year ended June 30, 20092011, we recorded a tax expense of $9.8 million in OCI related to the gain on postretirement benefits, and recorded a corresponding tax benefit of $9.8 million in continuing operations. Income tax benefit for
fiscal 2010 was $13.1 million comparedprimarily attributable to $20.4 millionfederal legislation allowing a five year net operating loss carryback period for net operating losses incurred in tax years that ended in 2008 and 2009. This legislation allowed us to claim additional income tax receivable and record a corresponding decrease in our deferred tax assets relating to our net operating loss carryovers, thereby reducing the fiscal year endedvaluation allowance recorded as of June 30, 2008. In years prior to fiscal 2007, these costs were presented as selling expenses. This change reduces reported gross profit in the years presented by these amounts but has no impact on net income, total assets, or cash flows in any year.Gross profit in fiscal 2009 increased $40.8 million, or 34%, to $160.2 million from $119.4 million in fiscal 2008. Approximately 76% of this change resulted from the addition of the DSD Coffee Business.
Operating expenses in fiscal 2009 increased $45.4 million, or 35%, to $175.4 million, or 51% of sales, from $130.1 million, or 49% of sales, in fiscal 2008. Approximately 54% of this increase reflects the addition of the DSD Coffee Business, and approximately 16% of this increase reflects expenses associated with the relocation of CBI’s operations to the new manufacturing facility in Portland, Oregon, together with associated start-up costs and related depreciation and amortization from the plant investment. Additional increases in operating expenses in fiscal 2009 include approximately $2.0 million of additional overhead associated with the operation of the DSD Coffee Business from March 1, 2009 through the end of fiscal 2009 and one-time costs of approximately $2.1 million related to CBI’s move and plant start-up.
For the reasons noted above, loss from operationsresulting in income tax benefit for
fiscal 2009 increased to $(15.2) million from$(10.6) million in fiscal 2008.2010
Total other (expense) income.Total other (expense) income improved in fiscal 2009 to $(3.8) million from $(4.7) million in fiscal 2008. This is primarily the result of smaller realized and unrealized investment losses in fiscal 2009 compared to fiscal 2008, partially offset by lower dividend and interest income. Other, net (expense) income was $(8.2) million in fiscal 2009 as compared to $(12.3) million in fiscal 2008. Losses in other, net (expense) income incurred in fiscal 2009 are primarily the result of conditions in the U.S. financial markets which resulted in lower expense in fiscal 2009 compared to fiscal 2008.
As a result of the above operating factors, net loss increased to $(33.3)$(54.3) million, or $(2.29) per common share, including the reserve against deferred tax assets of $(19.7) million or $(1.35) in fiscal 2009, from $(7.9) million or $(0.55)$(3.61) per common share, in fiscal 2008.2011
compared to a net loss of $(24.0) million, or $(1.61) per common share, in fiscal 2010. Non-GAAP Financial Measures
In addition to net income (loss) determined in accordance with GAAP, we use certain non-GAAP financial measures, such as “Net income (loss) excluding LIFO impact,” “EBITDAE” and “Adjusted EBITDAE,” in assessing our operating performance. We believe the non-GAAP measures serve as appropriate measures to be used in evaluating the performance of our business.
We define “Net income (loss) excluding LIFO impact” as net income (loss) excluding the impact of LIFO charge or credit. LIFO charge or credit includes: (1) the effect of the liquidation of LIFO inventory quantities as of the fiscal year end recorded in cost of goods sold, and (2) an estimate of the difference between cost of goods sold recorded on a LIFO basis and cost of goods sold that would have been recorded if we had used the FIFO method of inventory valuation.
We define “EBITDAE” as net income (loss) excluding the impact of income taxes, interest expense, depreciation
and amortization, ESOP and share-based compensation expense, non-cash impairment losses, pension withdrawal expense, and gains and losses from derivatives and investments. We reference this particular non-GAAP financial measure frequently in our decision-making because it provides supplemental information that facilitates internal comparisons to the historical operating performance of prior periods. In addition, incentive compensation is based, in part, on EBITDAE and we base certain of our forward-looking estimates on EBITDAE to facilitate quantification of planned business activities and enhance subsequent follow-up with comparisons of actual to planned EBITDAE.
We define “Adjusted EBITDAE” as EBITDAE excluding the impact of LIFO charges or credits. While we believe the use of the LIFO method of inventory valuation for coffee, tea and culinary products results in a better matching of costs and revenues, we believe Adjusted EBITDAE provides a basis for comparisons to companies that do not use LIFO and enhances the understanding of our historical operating performance.
Net income (loss) excluding LIFO, EBITDAE and Adjusted EBITDAE as defined by us may not be comparable to similarly titled measures reported by other companies. We do not intend for non-GAAP financial measures to be considered in isolation or as a substitute for other measures prepared in accordance with GAAP.
Set forth below is a reconciliation of reported net loss and reported basic and diluted net loss per common share to net loss excluding LIFO impact and basic and diluted net loss per common share excluding LIFO impact, respectively:
|
| | | | | | | | | | | | |
| | | Year Ended June 30, |
| | | 2012 | | 2011 | | 2010 |
| | | (In thousands, except share and per share data) |
| Net loss, as reported | | $ | (29,329 | ) | | $ | (54,317 | ) | | $ | (23,953 | ) |
| LIFO (credit) charge: | | | | | | |
| Effect of liquidation of LIFO inventory quantities, net of taxes of zero(1) | | (14,206 | ) | | (1,100 | ) | | (800 | ) |
| Estimated difference in cost of goods sold—LIFO basis vs. FIFO basis, net of taxes of zero(1)(2) | | 1,847 |
| | 32,854 |
| | 1,033 |
|
| Net loss, excluding LIFO impact | | $ | (41,688 | ) | | $ | (22,563 | ) | | $ | (23,720 | ) |
| Weighted average common shares outstanding, basic and diluted | | 15,492,314 |
| | 15,066,663 |
| | 14,866,306 |
|
| Net loss per common share—basic and diluted, as reported | | $ | (1.89 | ) | | $ | (3.61 | ) | | $ | (1.61 | ) |
| Net loss per common share, excluding LIFO impact—basic and diluted | | $ | (2.69 | ) | | $ | (1.50 | ) | | $ | (1.60 | ) |
Set forth below is a reconciliation of reported net loss to EBITDAE and Adjusted EBITDAE:
|
| | | | | | | | | | | | |
| | | Year Ended June 30, |
| | | 2012 | | 2011 | | 2010 |
| | | (In thousands) |
| Net loss, as reported | | $ | (29,329 | ) | | $ | (54,317 | ) | | $ | (23,953 | ) |
| Income tax benefit | | (347 | ) | | (9,167 | ) | | (2,529 | ) |
| Interest expense | | 2,137 |
| | 1,965 |
| | 986 |
|
| Depreciation and amortization expense | | 32,113 |
| | 31,758 |
| | 26,778 |
|
| ESOP and share-based compensation expense | | 3,287 |
| | 3,825 |
| | 4,785 |
|
| Impairment losses on goodwill and intangible assets | | 5,585 |
| | 7,805 |
| | — |
|
| Pension withdrawal expense | | 4,568 |
| | — |
| | — |
|
| Net loss (gain) on derivatives and investments | | 4,117 |
| | (4,191 | ) | | (10,169 | ) |
| EBITDAE | | $ | 22,131 |
| | $ | (22,322 | ) | | $ | (4,102 | ) |
| LIFO (credit) charge: | | | | | | |
| Effect of liquidation of LIFO inventory quantities, net of taxes of zero(1) | | (14,206 | ) | | (1,100 | ) | | (800 | ) |
| Estimated difference in cost of goods sold—LIFO basis vs. FIFO basis, net of taxes of zero(1)(2) | | 1,847 |
| | 32,854 |
| | 1,033 |
|
| LIFO (credit) charge, net of taxes of zero(1) | | (12,359 | ) | | 31,754 |
| | 233 |
|
| Adjusted EBITDAE | | $ | 9,772 |
| | $ | 9,432 |
| | $ | (3,869 | ) |
______________
(1) LIFO (credit) charge had no impact on income tax (benefit) expense since we have recorded a 100% valuation allowance against deferred tax assets.
(2) Effective October 1, 2011, we refined the methodology that we use to estimate the LIFO impact and use the average purchase cost over the months of inventory-on-hand instead of the latest purchase cost to value the ending inventory. In an environment of volatile prices, using the average purchase cost provides a more accurate inventory value than using the latest purchase cost for that period. The effect of this refinement in methodology on previously disclosed non-GAAP financial measures is included in the fiscal year ended June 30, 2011 and 2010 columns above and is summarized below:
|
| | | | | | | | | | | | | | | | |
| | | As Previously Reported | | As Refined |
| | | Fiscal Year Ended June 30, | | Fiscal Year Ended June 30, |
| | 2011 | | 2010 | | 2011 | | 2010 |
| (In thousands, except per share data) | | | | | | | | |
| LIFO charge (credit), net of taxes of zero | | $ | 40,317 |
| | $ | 1,033 |
| | $ | 31,754 |
| | $ | 233 |
|
| Net loss, excluding LIFO impact | | $ | (14,000 | ) | | $ | (22,920 | ) | | $ | (22,563 | ) | | $ | (23,720 | ) |
| Net loss per common share, excluding LIFO impact—basic and diluted | | $ | (0.93 | ) | | $ | (1.54 | ) | | $ | (1.50 | ) | | $ | (1.60 | ) |
| Adjusted EBITDAE | | $ | 17,995 |
| | $ | (3,070 | ) | | $ | 9,432 |
| | $ | (3,869 | ) |
The following table contains supplemental information regarding total contractual obligations as of June 30, 2010,2012, including capital leases: | | | | | | | | | | | | | | | |
| | | Payment due by period (in thousands) |
| | | Total | | Less Than
One Year | | 2-3
Years | | 4-5
Years | | More Than
5 Years |
Operating lease obligations | | $ | 17,319 | | $ | 4,725 | | $ | 6,875 | | $ | 4,483 | | $ | 1,236 |
Capital lease obligations(a) | | | 4,781 | | | 1,006 | | | 1,627 | | | 1,588 | | | 560 |
Pension plan obligations | | | 68,790 | | | 5,285 | | | 11,208 | | | 12,397 | | | 39,900 |
Revolving credit facility | | | 37,163 | | | 37,163 | | | — | | | — | | | — |
| | | | | | | | | | | | | | | |
| | $ | 128,053 | | $ | 48,179 | | $ | 19,710 | | $ | 18,468 | | $ | 41,696 |
| | | | | | | | | | | | | | | |
(a) | Includes imputed interest of $920. |
|
| | | | | | | | | | | | | | | | | | | | |
| | Payment due by period |
| (In thousands) | | Total | | Less Than One Year | | 1-3 Years | | 3-5 Years | | More Than 5 Years |
| Contractual obligations: | | | | | | | | | | |
| Operating lease obligations | | $ | 15,456 |
| | $ | 3,979 |
| | $ | 6,139 |
| | $ | 3,291 |
| | $ | 2,047 |
|
| Capital lease obligations(1) | | 17,939 |
| | 4,523 |
| | 7,532 |
| | 4,926 |
| | 958 |
|
| Pension plan obligations | | 74,570 |
| | 6,364 |
| | 13,200 |
| | 14,063 |
| | 40,943 |
|
| Postretirement benefits other than pension plans | | 24,686 |
| | 1,363 |
| | 3,296 |
| | 4,468 |
| | 15,559 |
|
| Revolving credit facility(2) | | 29,126 |
| | 29,126 |
| | — |
| | — |
| | — |
|
| | | $ | 161,777 |
| | $ | 45,355 |
| | $ | 30,167 |
| | $ | 26,748 |
| | $ | 59,507 |
|
______________
(1) Includes imputed interest of $2,072.
(2) Revolving credit facility expires March 2, 2015, but is presented as a current liability on the Company's consolidated balance sheets.
Off-Balance Sheet Arrangements
We have no off-balance sheet arrangements.
|
| |
| Item 7A. | Quantitative and Qualitative Disclosures About Market Risk |
We are exposed to market value risk arising from changes in interest rates on our securities portfolio. Our portfolio of preferred securities has sometimes included investments in derivatives that provide a natural economic hedge of interest rate risk. We review the interest rate sensitivity of these securities and
(a) may enter into “short positions” in futures contracts on U.S. Treasury securities or
(b) may hold put options on such futures contracts
in order to reduce the impact of certain interest rate
changes on such preferred stocks.changes. Specifically, we attempt to manage the risk arising from changes in the general level of interest rates. We do not transact in futures contracts or put options for speculative purposes.
The following table demonstrates the impact of varying interest rate changes based on the preferred stock holdings, futures and options positions, and market yield and price relationships at June 30, 2010. This table is predicated on an instantaneous change in the general level of interest rates and assumes predictable relationships between the prices of preferred securities holdings, the yields on U.S. Treasury securities, and related futures and options.
The number and type of futures and options contracts entered into depends on, among other items, the specific maturity and issuer redemption provisions for each preferred stock held, the slope of the Treasury yield curve, the expected volatility of U.S. Treasury yields, and the costs of using futures and/or options. At
The following table demonstrates the impact of varying interest rate changes based on our preferred securities holdings and market yield and price relationships at June 30, 2010,2012. This table is predicated on an “instantaneous” change in the general level of interest rates and assumes predictable relationships between the prices of our preferred securities holdings and the yields on U.S. Treasury securities. At June 30, 2012, we had no futures contracts or put options designated as interest rate risk hedges. | | | | | | | | | | | | | |
| | | Market Value at June 30, 2010 | | Changes in Market
Value of Total
Portfolio | |
Interest Rate Changes | | Preferred
Securities | | Futures
and
Options | | Total
Portfolio | |
| | | (In thousands) | |
–150 basis points | | $ | 51,593 | | $ | — | | $ | 51,593 | | $ | 909 | |
–100 basis points | | $ | 51,436 | | $ | — | | $ | 51,436 | | $ | 751 | |
Unchanged | | $ | 50,685 | | $ | — | | $ | 50,685 | | $ | — | |
+100 basis points | | $ | 48,486 | | $ | — | | $ | 48,486 | | $ | (2,199 | ) |
+150 basis points | | $ | 47,052 | | $ | — | | $ | 47,052 | | $ | (3,633 | ) |
|
| | | | | | | | |
| | | Market Value of Preferred Securities at June 30, 2012 | | Change in Market Value |
| Interest Rate Changes | | (In thousands) |
| –150 basis points | | $ | 20,159 |
| | $ | 764 |
|
| –100 basis points | | $ | 19,962 |
| | $ | 567 |
|
| Unchanged | | $ | 19,395 |
| | $ | — |
|
| +100 basis points | | $ | 18,628 |
| | $ | (767 | ) |
| +150 basis points | | $ | 18,272 |
| | $ | (1,123 | ) |
Our revolving line of credit facility with Wells Fargo is at a variable rate. The interest rate varies based upon line usage, borrowing base availability and market conditions. As of June 30, 2010,2012, we had borrowed $37.2outstanding borrowings of $29.1 million, excluding loan extension fees of this amount,$0.2 million, utilized $3.1$11.9 million of ourthe letters of credit sub-limit,sublimit, and had excess availability of $9.7 million under the credit facility.facility of $31.4 million. The interest rate on the outstanding borrowings at June 30, 20102012 was 3.75%3.5%. Effective September 1, 2010, theThe Loan Agreement provides for interest rate on the line usage was amended to a range of PRIME + 0.25% to PRIME + 0.75% or Adjusted Eurodollar Rate + 2.5% to Adjusted Eurodollar Rate + 3.0%rates based on modified Monthly Average Excess Availability levels.levels with a range of
PRIME + 0.25% to PRIME + 0.75% or Adjusted Eurodollar Rate + 2.0% to Adjusted Eurodollar Rate + 2.5%. The following table demonstrates the impact of interest rate changes on our annual interest expense onunder the revolving credit facility for a full year based on the outstanding balance and interest rate as of June 30, 2010: | | | | | | |
Interest Rate Changes | | Interest Rate | | | Annual Interest Expense |
| | | | | | (In thousands) |
–150 basis points | | 2.25 | % | | $ | 907 |
–100 basis points | | 2.75 | % | | $ | 1,108 |
Unchanged | | 3.75 | % | | $ | 1,512 |
+100 basis points | | 4.75 | % | | $ | 1,915 |
+150 basis points | | 5.25 | % | | $ | 2,116 |
2012
: |
| | | | | | | |
| | | Interest Rate | | Annual Interest Expense |
| Interest Rate Changes | | | | (In thousands) |
| –150 basis points | | 2.0 | % | | $ | 585 |
|
| –100 basis points | | 2.5 | % | | $ | 732 |
|
| Unchanged | | 3.5 | % | | $ | 1,025 |
|
| +100 basis points | | 4.5 | % | | $ | 1,317 |
|
| +150 basis points | | 5.0 | % | | $ | 1,464 |
|
We are exposed to commodity price risk arising from changes in the market price of green coffee. We pricevalue green coffee inventory on the last-in, first-out (LIFO)LIFO basis. In the normal course of business we hold a large green coffee inventory and enter into forward commodity purchase agreements with suppliers. We are subject to price risk resulting from the volatility of green coffee prices. Due to competition and market conditions, volatile price increases cannot always be passed on to our customers. From time
We routinely enter into specialized hedging transactions to
time we maypurchase future coffee contracts to enable us to lock in green coffee prices within a pre-established range, and hold a mix of futures contracts and options to help hedge against
volatilevolatility in green coffee
price decreases.prices. Gains and losses on these derivative instruments are realized immediately in
“Other, net (expense) income.”On "Other, net."
For the fiscal year ended June 30, 2012, 2011 and 2010, we had no open hedgerecorded $(8.6) million, $0.9 million and $29,000, respectively, in coffee-related net realized derivative contracts,(losses) and our entire exposure to commodity risk wasgains. For the fiscal years ended June 30, 2012, 2011 and 2010, we recorded $1.2 million, $(2.4) million and $1.5 million, respectively, in the potential change of our inventory value resulting from changes in the market price of green coffee. coffee-related net unrealized derivative gains (losses).
The following table demonstrates the impact of changes in the market value of coffee cost on the market value of coffee inventory and forward purchase contracts: | | | | | | | | | | | | | | | | | | |
| | | Market Value (in thousands) | | | |
| | | Coffee
Inventory | | Futures &
Options | | | Total | | Change in Market Value | |
Coffee Cost Change | | | | | Derivatives | | | Inventory | |
– 10% | | $ | 35,000 | | $ | (673 | ) | | $ | 34,327 | | $ | (673 | ) | | $ | (3,995 | ) |
unchanged | | $ | 38,995 | | $ | 258 | | | $ | 39,253 | | $ | — | | | $ | — | |
10% | | $ | 43,000 | | $ | 673 | | | $ | 43,673 | | $ | 673 | | | $ | 4,005 | |
|
| | | | | | | | | | | | | | | | | | | | |
| | Market Value | | (Decrease) Increase in Market Value |
| | | Coffee Inventory | | Futures & Options | | Total | | Derivatives | | Inventory |
| Coffee Cost (Decrease) Increase | | |
| | | (In thousands) |
| – 10% | | $ | 25,000 |
| | $ | (486 | ) | | $ | 24,514 |
| | $ | (486 | ) | | $ | (2,321 | ) |
| Unchanged | | $ | 27,321 |
| | $ | 1,626 |
| | $ | 28,947 |
| | $ | — |
| | $ | — |
|
| +10% | | $ | 30,000 |
| | $ | 486 |
| | $ | 30,486 |
| | $ | 486 |
| | $ | 2,679 |
|
|
| |
| Item 8. | Financial Statements and Supplementary Data |
Report of Independent Registered Public Accounting Firm
The Board of Directors and Stockholders of
Farmer Bros. Co. and Subsidiaries
We have audited the accompanying consolidated balance sheets of Farmer Bros. Co. and Subsidiaries as of June 30,
20102012 and
2009,2011, and the related consolidated statements of operations,
comprehensive income (loss), stockholders’ equity and cash flows for each of the three years in the period ended June 30,
2010.2012. These financial statements are the responsibility of the Company’s management. Our responsibility is to express an opinion on these financial statements based on our audits.
We conducted our audits in accordance with the standards of the Public Company Accounting Oversight Board (United States). Those standards require that we plan and perform the audit to obtain reasonable assurance about whether the financial statements are free of material misstatement. An audit includes examining, on a test basis, evidence supporting the amounts and disclosures in the financial statements. An audit also includes assessing the accounting principles used and significant estimates made by management, as well as evaluating the overall financial statement presentation. We believe that our audits provide a reasonable basis for our opinion.
In our opinion, the financial statements referred to above present fairly, in all material respects, the consolidated financial position of Farmer Bros. Co. and Subsidiaries at June 30,
20102012 and
2009,2011, and the consolidated results of their operations and their cash flows for each of the three years in the period ended June 30,
2010,2012, in conformity with U.S. generally accepted accounting principles.
We also have audited, in accordance with the standards of the Public Company Accounting Oversight Board (United States), the effectiveness of Farmer Bros. Co. and Subsidiaries’ internal control over financial reporting as of June 30,
2010,2012, based on criteria established in Internal Control-Integrated Framework issued by the Committee of Sponsoring Organizations of the Treadway Commission and our report dated September
13, 20107, 2012 expressed an unqualified opinion thereon.
September
13, 20107, 2012
CONSOLIDATED BALANCE SHEETS
(
Dollars inIn thousands, except share and per share data)
| | | | | | | | |
| | | June 30,
2010 | | | June 30,
2009 | |
ASSETS | | | | | | | | |
Current assets: | | | | | | | | |
Cash and cash equivalents | | $ | 4,149 | | | $ | 20,038 | |
Short term investments | | | 50,942 | | | | 42,926 | |
Accounts and notes receivable, net of allowance for doubtful accounts of $3,293 and $1,173, respectively | | | 42,596 | | | | 45,744 | |
Inventories | | | 83,712 | | | | 68,961 | |
Income tax receivable | | | 5,840 | | | | 4,163 | |
Deferred income taxes | | | 4 | | | | 1,089 | |
Prepaid expenses | | | 2,713 | | | | 3,625 | |
| | | | | | | | |
Total current assets | | | 189,956 | | | | 186,546 | |
| | | | | | | | |
Property, plant and equipment, net | | | 120,372 | | | | 112,063 | |
Goodwill and other intangible assets, net | | | 25,242 | | | | 28,758 | |
Other assets | | | 2,492 | | | | 1,758 | |
Deferred income taxes | | | 1,059 | | | | 892 | |
| | | | | | | | |
Total assets | | $ | 339,121 | | | $ | 330,017 | |
| | | | | | | | |
LIABILITIES AND STOCKHOLDERS’ EQUITY | | | | | | | | |
Current liabilities: | | | | | | | | |
Accounts payable | | $ | 34,053 | | | $ | 34,627 | |
Accrued payroll expenses | | | 14,661 | | | | 13,121 | |
Short term borrowings under revolving credit facility | | | 37,163 | | | | 16,182 | |
Short term obligations under capital leases | | | 724 | | | | 908 | |
Deferred income taxes | | | 264 | | | | — | |
Other current liabilities | | | 11,681 | | | | 9,918 | |
| | | | | | | | |
Total current liabilities | | | 98,546 | | | | 74,756 | |
Accrued postretirement benefits | | | 22,185 | | | | 18,259 | |
Other long term liabilities—capital leases | | | 3,137 | | | | 344 | |
Accrued pension liabilities | | | 43,497 | | | | 33,638 | |
Accrued workers’ compensation liabilities | | | 4,388 | | | | 4,333 | |
Deferred income taxes | | | 1,773 | | | | 2,198 | |
| | | | | | | | |
Total liabilities | | $ | 173,526 | | | $ | 133,528 | |
| | | | | | | | |
Commitments and contingencies (Note 15) | | | | | | | | |
Stockholders’ equity: | | | | | | | | |
Preferred stock, $1.00 par value, 500,000 shares authorized and none issued | | $ | — | | | $ | — | |
Common stock, $1.00 par value, 25,000,000 shares authorized; 16,164,179 and 16,078,111 issued and outstanding at June 30, 2010 and 2009, respectively | | | 16,164 | | | | 16,078 | |
Additional paid-in capital | | | 37,468 | | | | 31,135 | |
Retained earnings | | | 186,900 | | | | 217,792 | |
Unearned ESOP shares | | | (35,238 | ) | | | (33,604 | ) |
Less accumulated other comprehensive loss | | | (39,699 | ) | | | (34,912 | ) |
| | | | | | | | |
Total stockholders’ equity | | $ | 165,595 | | | $ | 196,489 | |
| | | | | | | | |
Total liabilities and stockholders’ equity | | $ | 339,121 | | | $ | 330,017 | |
| | | | | | | | |
|
| | | | | | | |
| | June 30, 2012 |
| | June 30, 2011 |
|
| ASSETS | | | |
| Current assets: | | | |
| Cash and cash equivalents | $ | 3,906 |
| | $ | 6,081 |
|
| Short-term investments | 21,021 |
| | 24,874 |
|
| Accounts and notes receivable, net of allowance for doubtful accounts of $1,872 and $2,852, respectively | 40,736 |
| | 43,501 |
|
| Inventories | 65,981 |
| | 79,759 |
|
| Income tax receivable | 762 |
| | 448 |
|
| Prepaid expenses | 3,445 |
| | 2,747 |
|
| Total current assets | 135,851 |
| | 157,410 |
|
| Property, plant and equipment, net | 108,135 |
| | 114,107 |
|
| Goodwill and other intangible assets, net | 7,615 |
| | 14,639 |
|
| Other assets | 2,904 |
| | 2,892 |
|
| Deferred income taxes | 854 |
| | 1,005 |
|
| Total assets | $ | 255,359 |
| | $ | 290,053 |
|
| LIABILITIES AND STOCKHOLDERS’ EQUITY | | | |
| Current liabilities: | | | |
| Accounts payable | $ | 27,676 |
| | $ | 42,473 |
|
| Accrued payroll expenses | 20,494 |
| | 15,675 |
|
| Short-term borrowings under revolving credit facility | 29,126 |
| | 31,362 |
|
| Short-term obligations under capital leases | 3,737 |
| | 1,570 |
|
| Deferred income taxes | 1,480 |
| | 500 |
|
| Other current liabilities | 10,176 |
| | 11,882 |
|
| Total current liabilities | 92,689 |
| | 103,462 |
|
| Accrued postretirement benefits | 34,557 |
| | 23,585 |
|
| Other long-term liabilities—capital leases | 12,130 |
| | 7,066 |
|
| Accrued pension liabilities | 42,513 |
| | 22,371 |
|
| Accrued workers’ compensation liabilities | 4,131 |
| | 3,639 |
|
| Deferred income taxes | 607 |
| | 1,815 |
|
| Total liabilities | $ | 186,627 |
| | $ | 161,938 |
|
| Commitments and contingencies (Note 14) |
| |
|
| Stockholders’ equity: | | | |
| Preferred stock, $1.00 par value, 500,000 shares authorized and none issued | $ | — |
| | $ | — |
|
| Common stock, $1.00 par value, 25,000,000 shares authorized; 16,308,859 and 16,186,372 issued and outstanding at June 30, 2012 and 2011, respectively | 16,309 |
| | 16,186 |
|
| Additional paid-in capital | 34,834 |
| | 36,470 |
|
| Retained earnings | 100,455 |
| | 129,784 |
|
| Unearned ESOP shares | (25,637 | ) | | (30,437 | ) |
| Less accumulated other comprehensive loss | (57,229 | ) | | (23,888 | ) |
| Total stockholders’ equity | $ | 68,732 |
| | $ | 128,115 |
|
| Total liabilities and stockholders’ equity | $ | 255,359 |
| | $ | 290,053 |
|
The accompanying notes are an integral part of these financial statements.
CONSOLIDATED STATEMENTS OF OPERATIONS
(
Dollars inIn thousands, except share and per share data)
| | | | | | | | | | | | |
| | | Years ended June 30, | |
| | | 2010 | | | 2009 | | | 2008 | |
Net sales | | $ | 450,318 | | | $ | 341,724 | | | $ | 266,485 | |
Cost of goods sold | | | 252,754 | | | | 181,508 | | | | 147,073 | |
| | | | | | | | | | | | |
Gross profit | | | 197,564 | | | | 160,216 | | | | 119,412 | |
| | | | | | | | | | | | |
Selling expenses | | | 187,685 | | | | 138,876 | | | | 98,918 | |
General and administrative expenses | | | 49,071 | | | | 36,543 | | | | 31,138 | |
| | | | | | | | | | | | |
Operating expenses | | | 236,756 | | | | 175,419 | | | | 130,056 | |
| | | | | | | | | | | | |
Loss from operations | | | (39,692 | ) | | | (15,203 | ) | | | (10,644 | ) |
| | | | | | | | | | | | |
Other income (expense): | | | | | | | | | | | | |
Dividend income | | | 3,224 | | | | 3,563 | | | | 4,056 | |
Interest income | | | 303 | | | | 1,236 | | | | 3,608 | |
Interest expense | | | (986 | ) | | | (335 | ) | | | — | |
Other, net income (expense) | | | 10,169 | | | | (8,248 | ) | | | (12,343 | ) |
| | | | | | | | | | | | |
Total other income (expense) | | | 12,710 | | | | (3,784 | ) | | | (4,679 | ) |
| | | | | | | | | | | | |
Loss before taxes | | | (26,482 | ) | | | (18,987 | ) | | | (15,323 | ) |
Income tax (benefit) expense | | | (2,529 | ) | | | 14,283 | | | | (7,399 | ) |
| | | | | | | | | | | | |
Net loss | | $ | (23,953 | ) | | $ | (33,270 | ) | | $ | (7,924 | ) |
| | | | | | | | | | | | |
Basic and diluted net loss per common share | | $ | (1.61 | ) | | $ | (2.29 | ) | | $ | (0.55 | ) |
| | | | | | | | | | | | |
Weighted average common shares outstanding-basic and diluted | | | 14,866,306 | | | | 14,508,320 | | | | 14,284,324 | |
Cash dividends declared per common share | | $ | 0.46 | | | $ | 0.46 | | | $ | 0.46 | |
|
| | | | | | | | | | | |
| | Year ended June 30, |
| | 2012 | | 2011 | | 2010 |
| Net sales | $ | 495,442 |
| | $ | 463,945 |
| | $ | 450,318 |
|
| Cost of goods sold | 322,618 |
| | 306,771 |
| | 252,754 |
|
| Gross profit | 172,824 |
| | 157,174 |
| | 197,564 |
|
| Selling expenses | 150,641 |
| | 170,670 |
| | 187,685 |
|
| General and administrative expenses | 36,897 |
| | 47,121 |
| | 49,071 |
|
| Impairment losses on goodwill and intangible assets | 5,585 |
| | 7,805 |
| | — |
|
| Pension withdrawal expense | 4,568 |
| | — |
| | — |
|
| Operating expenses | 197,691 |
| | 225,596 |
| | 236,756 |
|
| Loss from operations | (24,867 | ) | | (68,422 | ) | | (39,192 | ) |
| Other (expense) income: | | | | |
|
| Dividend income | 1,231 |
| | 2,534 |
| | 3,224 |
|
| Interest income | 214 |
| | 178 |
| | 303 |
|
| Interest expense | (2,137 | ) | | (1,965 | ) | | (986 | ) |
| Other, net | (4,117 | ) | | 4,191 |
| | 10,169 |
|
| Total other (expense) income | (4,809 | ) | | 4,938 |
| | 12,710 |
|
| Loss before taxes | (29,676 | ) | | (63,484 | ) | | (26,482 | ) |
| Income tax benefit | (347 | ) | | (9,167 | ) | | (2,529 | ) |
| Net loss | $ | (29,329 | ) | | $ | (54,317 | ) | | $ | (23,953 | ) |
| Net loss per common share—basic and diluted | $ | (1.89 | ) | | $ | (3.61 | ) | | $ | (1.61 | ) |
| Weighted average common shares outstanding—basic and diluted | 15,492,314 |
| | 15,066,663 |
| | 14,866,306 |
|
| Cash dividends declared per common share | $ | — |
| | $ | 0.18 |
| | $ | 0.46 |
|
The accompanying notes are an integral part of these financial statements.
CONSOLIDATED STATEMENTS OF COMPREHENSIVE INCOME (LOSS)
(In thousands)
|
| | | | | | | | | | | | |
| | | Year Ended June 30, |
| | | 2012 | | 2011 | | 2010 |
| Net loss | | $ | (29,329 | ) | | $ | (54,317 | ) | | $ | (23,953 | ) |
| Other comprehensive loss, net of tax: | | | | | | |
| Retiree benefits | | (33,341 | ) | | 25,634 |
| | (4,787 | ) |
| Income tax benefit | | — |
| | (9,823 | ) | | — |
|
| Total comprehensive loss, net of tax | | $ | (62,670 | ) | | $ | (38,506 | ) | | $ | (28,740 | ) |
FARMER BROS. CO.
CONSOLIDATED STATEMENTS OF CASH FLOWS
(
Dollars inIn thousands)
| | | | | | | | | | | | |
| | | Years ended June 30, | |
| | | 2010 | | | 2009 | | | 2008 | |
Cash flows from operating activities: | | | | | | | | | | | | |
Net loss | | $ | (23,953 | ) | | $ | (33,270 | ) | | $ | (7,924 | ) |
Adjustments to reconcile net loss to net cash (used in) provided by operating activities: | | | | | | | | | | | | |
Depreciation and amortization | | | 26,778 | | | | 18,292 | | | | 9,757 | |
Allowance for doubtful accounts | | | 3,188 | | | | 810 | | | | 311 | |
Deferred income taxes | | | 758 | | | | 15,556 | | | | 719 | |
Loss (gain) on sales of assets | | | 430 | | | | (46 | ) | | | (1,325 | ) |
Share-based compensation expense | | | 4,784 | | | | 5,452 | | | | 5,501 | |
Net (gain) loss on investments | | | (9,382 | ) | | | 8,989 | | | | 13,992 | |
Change in operating assets and liabilities: | | | | | | | | | | | | |
Short term investments | | | 1,365 | | | | 61,371 | | | | 30,772 | |
Accounts and notes receivable | | | (40 | ) | | | (26,698 | ) | | | (2,516 | ) |
Inventories | | | (14,751 | ) | | | 1,730 | | | | (9,257 | ) |
Income tax receivable | | | (1,677 | ) | | | (1,283 | ) | | | (2,998 | ) |
Prepaid expenses and other assets | | | 179 | | | | 6,518 | | | | 5,877 | |
Accounts payable | | | (738 | ) | | | 22,457 | | | | 3,466 | |
Accrued payroll, expenses and other liabilities | | | 2,904 | | | | 3,776 | | | | (1,655 | ) |
Accrued postretirement benefits | | | 3,926 | | | | 638 | | | | (17,224 | ) |
Other long term liabilities | | | 5,182 | | | | 2,952 | | | | — | |
| | | | | | | | | | | | |
Net cash (used in) provided by operating activities | | $ | (1,047 | ) | | $ | 87,244 | | | $ | 27,496 | |
Cash flows from investing activities: | | | | | | | | | | | | |
Acquisition of businesses, net of cash acquired | | | — | | | | (48,287 | ) | | | — | |
Purchases of property, plant and equipment | | | (28,484 | ) | | | (38,901 | ) | | | (24,852 | ) |
Proceeds from sales of property, plant and equipment | | | 437 | | | | 605 | | | | 1,413 | |
| | | | | | | | | | | | |
Net cash used in investing activities | | $ | (28,047 | ) | | $ | (86,583 | ) | | $ | (23,439 | ) |
Cash flows from financing activities: | | | | | | | | | | | | |
Proceeds from revolving line of credit | | | 33,737 | | | | 29,500 | | | | — | |
Repayments on revolving line of credit | | | (12,756 | ) | | | (13,318 | ) | | | — | |
Payments of capital lease obligations | | | (837 | ) | | | (147 | ) | | | — | |
Dividends paid | | | (6,939 | ) | | | (6,631 | ) | | | (6,670 | ) |
| | | | | | | | | | | | |
Net cash provided by (used in) financing activities | | $ | 13,205 | | | $ | 9,404 | | | $ | (6,670 | ) |
Net (decrease) increase in cash and cash equivalents | | $ | (15,889 | ) | | $ | 10,065 | | | $ | (2,613 | ) |
Cash and cash equivalents at beginning of year | | | 20,038 | | | | 9,973 | | | | 12,586 | |
| | | | | | | | | | | | |
Cash and cash equivalents at end of year | | $ | 4,149 | | | $ | 20,038 | | | $ | 9,973 | |
| | | | | | | | | | | | |
Supplemental disclosure of cash flow information: | | | | | | | | | | | | |
Cash paid for interest | | $ | 890 | | | $ | 812 | | | $ | — | |
Cash paid for income taxes | | $ | — | | | $ | 136 | | | $ | 3,742 | |
Non-cash financing and investing activities: | | | | | | | | | | | | |
Equipment acquired under capital leases | | $ | 3,954 | | | $ | 1,252 | | | $ | — | |
Dividends accrued, but not paid | | $ | 1,849 | | | $ | 1,849 | | | $ | 1,849 | |
|
| | | | | | | | | | | | |
| | | Year ended June 30, |
| | | 2012 | | 2011 | | 2010 |
| Cash flows from operating activities: | | | | | | |
| Net loss | | $ | (29,329 | ) | | $ | (54,317 | ) | | $ | (23,953 | ) |
| Adjustments to reconcile net loss to net cash provided by (used in) operating activities: | | | | | | |
| Depreciation and amortization | | 32,113 |
| | 31,758 |
| | 26,778 |
|
| Provision for doubtful accounts | | — |
| | 2,024 |
| | 3,188 |
|
| Deferred income taxes | | (78 | ) | | 336 |
| | 758 |
|
| Impairment losses on goodwill and intangible assets | | 5,585 |
| | 7,805 |
| | — |
|
| (Gain) loss on sales of assets | | (268 | ) | | 358 |
| | 430 |
|
| ESOP and share-based compensation expense | | 3,287 |
| | 3,825 |
| | 4,785 |
|
| Net loss (gain) on investments | | 6,175 |
| | (1,312 | ) | | (9,382 | ) |
| Change in operating assets and liabilities: | | | | | | |
| Short-term investments | | (2,322 | ) | | 27,381 |
| | 1,365 |
|
| Accounts and notes receivable | | 2,765 |
| | (2,929 | ) | | (40 | ) |
| Inventories | | 13,314 |
| | 3,952 |
| | (14,751 | ) |
| Income tax receivable | | (314 | ) | | 5,392 |
| | (1,677 | ) |
| Prepaid expenses and other assets | | (711 | ) | | (434 | ) | | 178 |
|
| Accounts payable | | (13,083 | ) | | 12,997 |
| | (738 | ) |
| Accrued payroll, expenses and other liabilities | | 3,112 |
| | 2,112 |
| | 2,904 |
|
| Accrued postretirement benefits | | 995 |
| | 1,399 |
| | 3,926 |
|
| Other long-term liabilities | | (3,108 | ) | | (6,410 | ) | | 5,182 |
|
| Net cash provided by (used in) operating activities | | $ | 18,133 |
| | $ | 33,937 |
| | $ | (1,047 | ) |
| Cash flows from investing activities: | | | | | | |
| Purchases of property, plant and equipment | | (17,498 | ) | | (19,416 | ) | | (28,484 | ) |
| Proceeds from sales of property, plant and equipment | | 3,037 |
| | 2,021 |
| | 437 |
|
| Net cash used in investing activities | | $ | (14,461 | ) | | $ | (17,395 | ) | | $ | (28,047 | ) |
| Cash flows from financing activities: | | | | | | |
| Proceeds from revolving credit facility | | 17,250 |
| | 35,450 |
| | 33,737 |
|
| Repayments on revolving credit facility | | (21,200 | ) | | (43,970 | ) | | (12,756 | ) |
| Payments of capital lease obligations | | (1,897 | ) | | (1,433 | ) | | (837 | ) |
| Dividends paid | | — |
| | (4,657 | ) | | (6,939 | ) |
| Net cash (used in) provided by financing activities | | $ | (5,847 | ) | | $ | (14,610 | ) | | $ | 13,205 |
|
| Net (decrease) increase in cash and cash equivalents | | $ | (2,175 | ) | | $ | 1,932 |
| | $ | (15,889 | ) |
| Cash and cash equivalents at beginning of year | | 6,081 |
| | 4,149 |
| | 20,038 |
|
| Cash and cash equivalents at end of year | | $ | 3,906 |
| | $ | 6,081 |
| | $ | 4,149 |
|
(continued on next page)
FARMER BROS. CO.
CONSOLIDATED STATEMENTS OF CASH FLOWS (continued from previous page)
(In thousands)
|
| | | | | | | | | | | | |
| | | Year ended June 30, |
| | | 2012 | | 2011 | | 2010 |
| Supplemental disclosure of cash flow information: | | | | | | |
| Cash paid for interest | | $ | 2,123 |
| | $ | 1,945 |
| | $ | 890 |
|
| Cash paid for income taxes | | $ | 317 |
| | $ | 324 |
| | $ | 154 |
|
| Non-cash financing and investing activities: | | | | | | |
| Equipment acquired under capital leases | | $ | 9,508 |
| | $ | 5,659 |
| | $ | 3,954 |
|
| Dividends accrued, but not paid | | $ | — |
| | $ | — |
| | $ | 1,849 |
|
The accompanying notes are an integral part of these financial statements.
CONSOLIDATED STATEMENTS OF STOCKHOLDERS’ EQUITY
(Dollars inIn thousands, except share and per share data) | | | | | | | | | | | | | | | | | | | | | | | | | |
| | | Common
Shares | | Stock
Amount | | Additional
Paid-in
Capital | | | Retained
Earnings | | | Unearned
ESOP
Shares | | | Accumulated
Other
Comprehensive
Income
(Loss) | | | Total | |
Balance at June 30, 2007 | | 16,075,080 | | $ | 16,075 | | $ | 30,823 | | | $ | 272,406 | | | $ | (44,240 | ) | | $ | (8,848 | ) | | $ | 266,216 | |
Comprehensive income | | | | | | | | | | | | | | | | | | | | | | | | | |
Net loss | | | | | | | | | | | | (7,924 | ) | | | | | | | | | | | (7,924 | ) |
Retiree benefits | | | | | | | | | | | | | | | | | | | | 9,452 | | | | 9,452 | |
Other comprehensive income net of tax | | | | | | | | | | | | | | | | | | | | | | | | — | |
| | | | | | | | | | | | | | | | | | | | | | | | | |
Total comprehensive income | | | | | | | | | | | | | | | | | | | | | | | | 1,528 | |
Dividends ($0.46 per share) | | | | | | | | | | | | (6,670 | ) | | | | | | | | | | | (6,670 | ) |
ESOP compensation expense | | | | | | | | (364 | ) | | | | | | | 5,711 | | | | | | | | 5,347 | |
Share based compensation | | | | | | | | 153 | | | | | | | | | | | | | | | | 153 | |
Adoption FIN 48 | | | | | | | | | | | | (119 | ) | | | | | | | | | | | (119 | ) |
| | | | | | | | | | | | | | | | | | | | | | | | | |
Balance at June 30, 2008 | | 16,075,080 | | $ | 16,075 | | $ | 30,612 | | | $ | 257,693 | | | $ | (38,529 | ) | | $ | 604 | | | $ | 266,455 | |
Comprehensive income | | | | | | | | | | | | | | | | | | | | | | | | | |
Net income | | | | | | | | | | | | (33,270 | ) | | | | | | | | | | | (33,270 | ) |
Retiree benefits | | | | | | | | | | | | | | | | | | | | (35,516 | ) | | | (35,516 | ) |
Other comprehensive income net of tax | | | | | | | | | | | | | | | | | | | | | | | | — | |
| | | | | | | | | | | | | | | | | | | | | | | | | |
Total comprehensive loss | | | | | | | | | | | | | | | | | | | | | | | | (68,786 | ) |
Dividends ($0.46 per share) | | | | | | | | | | | | (6,631 | ) | | | | | | | | | | | (6,631 | ) |
ESOP compensation expense | | | | | | | | (151 | ) | | | | | | | 4,925 | | | | | | | | 4,774 | |
Share based compensation | | 3,031 | | | 3 | | | 674 | | | | | | | | | | | | | | | | 678 | |
| | | | | | | | | | | | | | | | | | | | | | | | | |
Balance at June 30, 2009 | | 16,078,111 | | $ | 16,078 | | $ | 31,135 | | | $ | 217,792 | | | $ | (33,604 | ) | | $ | (34,912 | ) | | $ | 196,489 | |
Comprehensive income | | | | | | | | | | | | | | | | | | | | | | | | | |
Net loss | | | | | | | | | | | | (23,953 | ) | | | | | | | | | | | (23,953 | ) |
Retiree benefits | | | | | | | | | | | | | | | | | | | | (4,787 | ) | | | (4,787 | ) |
Other comprehensive income net of tax | | | | | | | | | | | | | | | | | | | | | | | | — | |
| | | | | | | | | | | | | | | | | | | | | | | | | |
Total comprehensive loss | | | | | | | | | | | | | | | | | | | | | | | | (28,740 | ) |
Dividends ($0.46 per share) | | | | | | | | | | | | (6,939 | ) | | | | | | | | | | | (6,939 | ) |
ESOP compensation expense, including reclassifications | | | | | | | | 5,344 | | | | | | | | (1,634 | ) | | | | | | | 3,710 | |
Share based compensation | | 86,068 | | | 86 | | | 989 | | | | | | | | | | | | | | | | 1,075 | |
| | | | | | | | | | | | | | | | | | | | | | | | | |
Balance at June 30, 2010 | | 16,164,179 | | $ | 16,164 | | $ | 37,468 | | | $ | 186,900 | | | $ | (35,238 | ) | | $ | (39,699 | ) | | $ | 165,595 | |
| | | | | | | | | | | | | | | | | | | | | | | | | |
|
| | | | | | | | | | | | | | | | | | | | | | | | | | | |
| | | Common Shares | | Stock Amount | | Additional Paid-in Capital | | Retained Earnings | | Unearned ESOP Shares | | Accumulated Other Comprehensive Income (Loss) | | Total |
| Balance at June 30, 2009 | | 16,078,111 |
| | $ | 16,078 |
| | $ | 31,135 |
| | $ | 217,792 |
| | $ | (33,604 | ) | | $ | (34,912 | ) | | $ | 196,489 |
|
| Net loss | | | | | | | | (23,953 | ) | | | | | | (23,953 | ) |
| Retiree benefits, net of tax of $0 | | | | | | | | | | | | (4,787 | ) | | (4,787 | ) |
| Dividends ($0.46 per share) | | | | | | | | (6,939 | ) | | | | | | (6,939 | ) |
| ESOP compensation expense, including reclassifications | | | | | | 5,344 |
| | | | (1,634 | ) | | | | 3,710 |
|
| Share-based compensation | | 86,068 |
| | 86 |
| | 989 |
| | | | | | | | 1,075 |
|
| Balance at June 30, 2010 | | 16,164,179 |
| | $ | 16,164 |
| | $ | 37,468 |
| | $ | 186,900 |
| | $ | (35,238 | ) | | $ | (39,699 | ) | | $ | 165,595 |
|
| Net loss | | | | | | | | (54,317 | ) | | | | | | (54,317 | ) |
| Retiree benefits, net of tax benefit of $9,823 | | | | | | | | | | | | 15,811 |
| | 15,811 |
|
| Dividends ($0.18 per share) | | | | | | | | (2,799 | ) | | | | | | (2,799 | ) |
| ESOP contributions | | 1,040 |
| | 1 |
| | 8 |
| | | | (9 | ) | | | | — |
|
| ESOP compensation expense, including reclassifications | | | | | | (2,173 | ) | | | | 4,810 |
| | | | 2,637 |
|
| Share-based compensation | | 21,153 |
| | 21 |
| | 1,167 |
| | | | | | | | 1,188 |
|
| Balance at June 30, 2011 | | 16,186,372 |
| | $ | 16,186 |
| | $ | 36,470 |
| | $ | 129,784 |
| | $ | (30,437 | ) | | $ | (23,888 | ) | | $ | 128,115 |
|
| Net loss | | | | | | | | (29,329 | ) | | | | | | (29,329 | ) |
| Retiree benefits, net of tax of $0 | | | | | | | | | | | | (33,341 | ) | | (33,341 | ) |
| ESOP compensation expense, including reclassifications | | | | | | (3,327 | ) | | | | 4,800 |
| | | | 1,473 |
|
| Share-based compensation | | 122,487 |
| | 123 |
| | 1,691 |
| | | | — |
| | | | 1,814 |
|
| Balance at June 30, 2012 | | 16,308,859 |
| | $ | 16,309 |
| | $ | 34,834 |
| | $ | 100,455 |
| | $ | (25,637 | ) | | $ | (57,229 | ) | | $ | 68,732 |
|
The accompanying notes are an integral part of these financial statements.
NOTES TO CONSOLIDATED FINANCIAL STATEMENTS
Note 1. Summary of Significant Accounting Policies
Organization
OrganizationThe Company, which operates in one business segment,Farmer Bros. Co., a Delaware corporation (including its consolidated subsidiaries unless the context otherwise requires, the “Company,” or “Farmer Bros.”), is a manufacturer, wholesaler and distributor of coffee, tea and culinary products throughproducts. The Company is a direct and brokered sales throughout the contiguous United States. The Company’s customers includedistributor of coffee to restaurants, hotels, casinos, hospitals and food serviceother foodservice providers, as well asand is a provider of private brand coffee programs to Quick Serve Restaurants ("QSR's"), grocery retailers, such asnational drugstore chains, restaurant chains, convenience stores and independent coffee houses, general merchandisers, private-label retailersnationwide. The Company was founded in 1912, was incorporated in California in 1923, and grocery stores. reincorporated in Delaware in 2004. The Company operates in one business segment.
The Company’s product line includes roasted coffee, liquid coffee, coffee relatedcoffee-related products such as coffee filters, sugar and creamers, assorted teas, cappuccino, cocoa, spices, gelatins and puddings, soup bases, gravy and sauce mixes, pancake and biscuit mixes, and jellies and preserves. Most sales are made “off-truck” by the Company to its customers at their places of business.
The Company serves its customers from sevensix distribution centers. The Company’scenters and its distribution trucks are replenished from 115117 branch warehouses located throughout the contiguous United States. The Company operates its own trucking fleet to support its long-haul distribution requirements. A portion of the Company’s products areis distributed by third parties or areis direct shipped via common carrier.
Principles of Consolidation
The consolidated financial statements include the accounts of the Company and its wholly owned subsidiaries FBC Finance Company and Coffee Bean Holding Co.
, Inc. All inter-company balances and transactions have been eliminated.
Financial Statement Preparation
The preparation of financial statements in conformity with U.S. generally accepted accounting principles
("GAAP") requires management to make estimates and assumptions that affect the reported amounts of assets and liabilities and disclosure of contingent assets and liabilities at the date of the financial statements and the reported amounts of revenue and expenses during the reporting period. Actual results could differ from those estimates.
The Company considers all highly liquid investments with original maturity dates of 90 days or less to be cash equivalents. Fair values of cash equivalents approximate cost due to the short period of time to maturity. Investments
InvestmentsThe Company’s investments consist of money market instruments, marketable debt and equity securities, money market instruments and various derivative instruments, primarily exchange traded treasury and green coffee futures and options, green coffee forward purchase contractsoptions. Investments are held for trading purposes and commodity purchase agreements.stated at fair value. All derivative instruments not designated as accounting hedges are marked to market and changes are recognized in current earnings. At June 30, 20102012 and 2009,2011, no derivative instruments were designated as accounting hedges. The fair value of derivative instruments is based upon broker quotes. The cost of investments sold is determined on the specific identification method. Dividend and interest income is accrued as earned.
Concentration of Credit Risk
At June 30, 2010,2012, the financial instruments which potentially expose the Company to concentration of credit risk consist of cash in financial institutions (which exceeds federally insured limits), cash equivalents (principally commercial paper), short termshort-term investments, investments in the preferred stocks of other companies and trade receivables. Cash equivalents and short termshort-term investments are not concentrated by issuer, industry or geographicFARMER BROS. CO.
NOTES TO CONSOLIDATED FINANCIAL STATEMENTS—(Continued)
area. Maturities are generally shorter than
180 days. Other investments are in U.S. government securities.days. Investments in the preferred stocks of other companies are limited to high quality issuers and are not concentrated by geographic area or issuer. Concentration of credit risk with respect to trade receivables for the Company is limited due to the large number of customers comprising the Company’s customer base and their dispersion across many different geographic areas. The trade receivables are generally short term,short-term and all probable bad debt losses have been appropriately considered in establishing the allowance for doubtful accounts. In fiscal 2010, based on a larger customer base due to the recent Company acquisitions and in response to slower collection of the Company’s accounts receivable resulting from the impact of the economic downturn on the Company’s customers, the Company increased its allowance for doubtful accounts from the previous fiscal year by$2.1 millionand recorded a $2.5$3.2 million charge to bad debt expense. In
fiscal 2012 and fiscal 2011, due to improvements in the collection of past due accounts, the Company reduced its allowance for doubtful accounts by $1.0 million and $0.4 million, respectively. Inventories are valued at the lower of cost or market. Costs ofThe Company accounts for coffee, tea and culinary products for the Company are determined on thea last in, first out (LIFO) basis. Costs of(“LIFO”) basis, and coffee brewing equipment manufactured are accounted for on thea first in, first out (FIFO)(“FIFO”) basis. The Company regularly evaluates these inventories to determine whether market conditions are correctly reflected in the recorded carrying value. At the end of each quarter, the Company records the expected beneficial effect of the liquidation of LIFO inventory quantities and records the actual impact at fiscal year-end. An actual valuation of inventory under the LIFO method is made only at the end of each fiscal year based on the inventory levels and costs at that time.
If inventory quantities decline at the end of the fiscal year compared to the beginning of the fiscal year, the reduction results in the liquidation of LIFO inventory quantities carried at the cost prevailing in prior years. This LIFO inventory liquidation may result in a decrease or increase in cost of goods sold depending on whether the cost prevailing in prior years was lower or higher, respectively, than the current year cost.
Property, Plant and Equipment
Property, plant and equipment is carried at cost, less accumulated depreciation. Depreciation is computed using the straight-line method. The following useful lives are used:
|
| |
BuildingBuildings and facilities
| | 10 to 30 years |
Machinery and equipment | | 3 to 5 years |
Equipment under capital lease | leases | Term of lease |
Office furniture and equipment | | 5 years |
Capitalized software | | 3 years |
When assets are sold or retired, the asset and related
accumulated depreciation
allowance are removed from the respective account balances and any gain or loss on disposal is included in operations. Maintenance and repairs are charged to expense, and betterments are capitalized.
Coffee Brewing Equipment and Service
The Company classifies certain expenses related to coffee brewing equipment provided to customers as cost of goods sold. These costs include the cost of the equipment as well as the cost of servicing that equipment (including service employees’ salaries, cost of transportation and the cost of supplies and parts) and are considered directly attributable to the generation of revenues from its customers. Accordingly, such costs included in cost of goods sold in the accompanying consolidated financial statements for the years ended June 30, 2010, 20092012, 2011 and 20082010 are $21.5$24.9 million $13.1, $27.1 million and $20.4$21.5 million, respectively.During the fourth quarter of fiscal 2008, the
The Company changed its convention for capitalizing coffee brewing equipment provided to customers and as a result has capitalized coffee brewing equipment in the amounts of $14.1$13.9 million and $5.4$12.7 million in fiscal 20102012 and 2009,2011, respectively. During fiscal 20102012, 2011 and 20092010, the Company had depreciation expense related to the capitalized coffee brewing equipment reported as cost of goods sold in the amounts of $6.1$12.2 million, $9.6 million and $1.7$6.1 million, respectively. Prior to the change in its convention forFARMER BROS. CO.
NOTES TO CONSOLIDATED FINANCIAL STATEMENTS—(Continued)
capitalization, the Company had immediately expensed all coffee brewing equipment provided to its customers. Prior to the change in its convention, the amount of coffee brewing equipment charged immediately to expense totaled $3.0 million in fiscal 2008.
Deferred income taxes are determined based on the temporary differences between the financial reporting and tax bases of assets and liabilities using enacted tax rates in effect for the year in which differences are expected to reverse. Estimating the Company’s tax liabilities involves judgments related to uncertainties in the application of complex tax regulations. The Company makes certain estimates and judgments to determine tax expense for financial statement purposes as they evaluate the effect of tax credits, tax benefits and deductions, some of which result from differences in
the timing of recognition of revenue or expense for tax and financial statement purposes. Changes to these estimates may result in significant changes to the Company’s tax provision in future periods. Each fiscal quarter the Company reevaluates their tax provision and reconsiders their estimates and their assumptions related to specific tax assets and liabilities, making adjustments as circumstances change.
Most
productsproduct sales are
sold and deliveredmade “off-truck” to the Company’s customers at their places of business by the Company’s
route sales
employees.representatives. Revenue is recognized at the time the Company’s sales representatives physically deliver products to customers and title passes or when it is accepted by the customer when shipped by
third partythird-party delivery.
In connection with the
The Company sells roast and ground coffee and tea to The J.M. Smucker Company ("J.M. Smucker") pursuant to a co‑packing agreement as J.M. Smucker's agent. The co-packing agreement was assigned by Sara Lee Corporation ("Sara Lee") to J.M. Smucker on February 17, 2012, as part of J.M. Smucker's acquisition of the DSD Coffee Business described in Note 2, the Company entered into an agreement with Sara Lee pursuant to which the Company performs co-packing services for Sara Lee as Sara Lee’s agent.Lee's coffee business. The Company recognizes revenue from this arrangement on a net basis, net of direct costs of revenue. As of June 30, 20102012 and 2009,2011, the Company had $4.1$0.8 million and $8.1$4.9 million, respectively, of other receivables from Sara Lee recordedrelating to this arrangement which are included in accounts and notes receivable.Net Income"Other receivables" (see Note 3).
Earnings (Loss) Per Common Share
Basic earnings (loss) per share (EPS) is computed by dividing(“EPS”) represents net income (loss)earnings attributable to common stockholders divided by the weighted averageweighted-average number of common shares outstanding for the period (see Note 14)13), excluding unallocated shares held by the Company’sCompany's Employee Stock Ownership Plan. Diluted EPS includesrepresents net earnings attributable to common stockholders divided by the effectweighted-average number of any potentialcommon shares outstanding, which for the Company consists of dilutive stock options. The dilutive effect of stock options is calculated using the treasury stock method with an offset from expected proceeds upon exerciseinclusive of the dilutive impact of common equivalent shares outstanding during the period. However, nonvested restricted stock optionsawards (referred to as participating securities) are excluded from the dilutive impact of common equivalent shares outstanding in accordance with authoritative guidance under the two-class method since the nonvested restricted stockholders are entitled to participate in dividends declared on common stock as if the shares were fully vested and unrecognized compensation expense. Dilutedhence are deemed to be participating securities. Under the two-class method, earnings (loss) attributable to nonvested restricted stockholders are excluded from net earnings (loss) attributable to common stockholders for purposes of calculating basic and diluted EPS. Computation of EPS for the yearyears ended June 30, 20102012, 2011 and 20092010 does not include the dilutive effect of 3,397667,235, 497,810 and 39,231404,943 shares, respectively, issuable under stock options since their inclusion would be anti-dilutive. In the year ended June 30, 2008 the Company had no dilutive shares. Accordingly, the consolidated financial statements present only basic net income (loss) per common share.share (see Note 13).
Dividends Declared
Although historically the Company has paid a dividend to stockholders, in light of the Company’s current financial position, the Company’s Board of Directors has omitted the payment of a quarterly dividend since the third quarter of fiscal 2011. The amount, if any, of dividends to be paid in the future will depend upon the Company’s then available cash, anticipated cash needs, overall financial condition, loan agreement restrictions, future prospects for earnings and cash flows, as well as other relevant factors.
Employee Stock Ownership Plan (“ESOP”)
Compensation cost for the ESOP is based on the fair market value of shares released or deemed to be released for the period. Dividends on allocated shares retain the character of true dividends, but dividends on unallocated shares are considered compensation cost. As a leveraged ESOP with the Company as lender, a contra equity account is established to offset the Company’s note receivable. The contra account will change as compensation is recognized.
FARMER BROS. CO.
NOTES TO CONSOLIDATED FINANCIAL STATEMENTS—(Continued)
Impairment of Goodwill and Intangible Assets
The Company performs its annual goodwill and indefinite-lived intangible assets impairment test as of June 30 of each fiscal year. Goodwill and other indefinite-lived intangible assets are not amortized but instead are reviewed for impairment annually and on an interim basis if events or changes in circumstances between annual tests indicate that an asset might be impaired. Indefinite-lived intangible assets are tested for impairment by comparing their fair values to their carrying values. Testing for impairment of goodwill is a two-step process. The first step requires the Company to compare the fair value of its reporting units to the carrying value of the net assets of the respective reporting units, including goodwill. If the fair value of the reporting unit is less than the carrying value, goodwill of the reporting unit is potentially impaired and the Company then completes step two to measure the impairment loss, if any. The second step requires the calculation of the implied fair value of goodwill,
bywhich is the residual fair value remaining after deducting the fair value of all tangible and intangible net assets of the reporting unit from the fair value of the reporting unit. If the implied fair value of goodwill is less than the carrying amount of goodwill, an impairment loss is recognized equal to the difference.
In addition to anits annual test goodwillof impairment in the fourth quarter of fiscal 2012, the Company identified indicators of impairment including a decline in market capitalization and indefinite-lived intangiblecontinuing losses from operations arising from its DSD coffee business. The Company performed impairment tests to determine the recoverability of the carrying values of the assets must alsoor if impairment should be tested on an interim basis if events or circumstances indicate thatmeasured. The Company was required to make estimates of the estimated fair value of suchthe Company's intangible assets, has decreased belowand all assets of CBI, the reporting unit, which were based on the use of the income approach and/or market approach.
The Company used the relief from royalty method under the income approach to estimate the fair value of its indefinite-lived intangible assets. Inputs to this method included estimated royalty rates associated with licensing and franchise royalty agreements in related industries, which are Level 3 inputs within the fair value hierarchy. To estimate the fair value of CBI, the Company used discounted cash flow analysis under the income approach and the guideline public company method under the market approach. Inputs to the discounted cash flow analysis included the projection of future cash flows which are Level 3 inputs within the fair value hierarchy. Inputs to the guideline public company analysis included valuation multiples of publicly traded companies similar to CBI, which are Level 2 inputs within the fair value hierarchy.
As a result of these impairment tests, the Company determined that the Company's trademarks acquired in connection with the CBI acquisition were impaired and that the carrying value of all of the assets of CBI excluding goodwill exceeded their carrying value. There were no such events or circumstances duringestimated fair values resulting in an implied fair value of zero for CBI's goodwill. Accordingly, in the fourth quarter of fiscal years ended June 30, 2010 or 2009.2012, the Company recorded total impairment charges of
$5.6 million including $5.1 million in impairment losses on goodwill. Long-Lived Assets, Excluding Goodwill and Indefinite-lived Intangible Assets
The Company reviews the recoverability of its long-lived assets whenever events or changes in circumstances indicate that the carrying amount of such assets may not be recoverable. The estimated future cash flows are based upon, among other things, assumptions about expected future operating performance, and may differ from actual cash flows. Long-lived assets evaluated for impairment are grouped with other assets to the lowest level for which identifiable cash flows are largely independent of the cash flows of other groups of assets and liabilities. The estimated future cash flows are based upon, among other things, assumptions about expected future operating performance, and may differ from actual cash flows. If the sum of the projected undiscounted cash flows (excluding interest) is less than the carrying value of the assets, the assets will be written down to the estimated fair value in the period in which the determination is made. TheIn its annual test of impairment as of the end of fiscal 2011, the Company has determined that noidentified indicators of impairment including a decline in market capitalization and continuing losses from operations. The Company performed impairment tests to determine the recoverability of long-livedthe carrying values of the assets existedor if impairment should be measured. The carrying value of these intangible assets was higher than the sum of each of their projected undiscounted cash flows. The Company was required to make estimates of the fair value of the intangible assets in this group, which were based on the use of the income approach. Inputs to the analysis include the projection of future cash flows which are Level 3 inputs within the fair value hierarchy. The Company determined that definite-lived intangible assets consisting of the customer relationships acquired, and the distribution agreement and co-pack agreement entered into, in connection with the DSD Coffee Business acquisition were impaired. The total impairment charge recorded in operating expenses on the consolidated statement of operations as a result of or during the fiscal year ended June 30, 2010.impairment test was
$7.8 million. Shipping and Handling Costs
The Company distributes its products directly to its customers and shipping and handling costs are recorded as Company selling expenses.
Collective Bargaining Agreements
Certain Company employees are subject to collective bargaining agreements. The duration of these agreements extend from 2010 to 2014.2014. Approximately 34% of the workforce is covered by such agreements.
Certain reclassifications have been made to prior year balances to conform to the current year presentation.
Recently Adopted Accounting Standards
On February 24, 2010,
In September 2011, the Financial Accounting Standards Board (“FASB”) issued Accounting Standards Update (“ASU”) No.
2010-09, “Subsequent Events (Topic 855): Amendments to Certain Recognition andFARMER BROS. CO.
NOTES TO CONSOLIDATED FINANCIAL STATEMENTS—(Continued)
Disclosure Requirements”2011-09, “Compensation-Retirement Benefits-Multiemployer Plans (Subtopic 715-80), Disclosures about an Employer's Participation in a Multiemployer Plan” (“ASU No. 2010-09”2011-09”), which amends FASB ASC 855, “Subsequent Events.” According to this standard, SEC filers are no longer required. ASU 2011-09 requires companies participating in multiemployer pension plans to disclose more information about the date through which subsequent events have been evaluatedmultiemployer plan(s), the employer's level of participation in originally issued and revisedthe multiemployer plan(s), the financial statements. ASU No. 2010-09 was effective immediatelyhealth of the plan(s), and the nature of the employer's commitments to the plan(s). The Company adopted these new requirements on February 24, 2010.
In January 2010, the Company adoptedamendments effective fiscal year ended June 30, 2012. Since ASU No. 2010-06, “Fair Value Measurements and Disclosures (Topic 820): Improving Disclosures about Fair Value Measurements,” which amends ASC 820. This new2011-09 does not change the accounting guidance requires expanded fair value measurement disclosuresfor an employer's participation in quarterly and annual financial statements. The new guidance clarifies existing disclosure requirements for the Level 2 and Level 3 fair value measurement. Additionally, the new guidance also requires details of significant transfers of assets between Level 1 and Level 2 fair value measurement categories, including the reasons for such transfers, as well as gross presentation of activity within the Level 3 fair value measurement category. ASU No. 2010-06 is effective for the Company on January 1, 2010, except for the gross presentation of Level 3 activity, which is effective January 1, 2011. Adoptiona multiemployer plan, adoption of ASU No. 2010-062011-09 did not impact the results of operations, financial position or cash flows of the Company.
Effective July 1, 2009,
In June 2011, the FASB issued
StatementASU No. 2011-05, “Comprehensive Income (Topic 220), Presentation of
Financial Accounting StandardComprehensive Income” (“
SFAS”) No. 168, “The FASB Accounting Standards Codification and the Hierarchy of Generally Accepted Accounting Principles—a replacement of FASB Statement No. 162” (“SFAS No. 168”ASU 2011-05”).
Under SFAS No. 168,The new GAAP guidance gives companies two choices of how to present items of net income, items of other comprehensive income (loss) ("OCI") and total comprehensive income (loss): Companies can create one continuous statement of comprehensive income or two separate consecutive statements. Companies will no longer be allowed to present OCI in the
historical GAAP hierarchy was eliminatedstatement of stockholders’ equity. Earnings per share would continue to be based on net income. Although existing guidance related to items that must be presented in OCI has not changed, companies will be required to display reclassification adjustments for each component of OCI in both net income and
ASC becameOCI. Also, companies will need to present the
single official sourcecomponents of
authoritative, non-governmental GAAP, other than guidance issued by the SEC. All other literature became non-authoritative. SFAS No. 168 became effective for financial statements issued forOCI in their interim and annual
financial statements. The amendments in the ASU should be applied retrospectively. For public entities, the amendments are effective for fiscal years, and interim periods
endingwithin those years, beginning after
SeptemberDecember 15,
2009. It has been codified within ASC 105, “Generally Accepted Accounting Principles” (“ASC 105”).2011. The Company adopted
ASC 105 on July 1, 2009. Since ASC 105 does not change GAAP, adoptionthe amendments effective fiscal year ended June 30, 2012. Adoption of
ASC 105ASU 2011-05 did not impact the results of operations, financial position or cash flows of the Company.
New Accounting Pronouncements
In
December 2008,January 2012, the FASB
issued FSP SFAS 132(R)-1, “Employers’ Disclosures about Postretirement Benefit Plan Assets” (“FSP SFAS 132(R)-1”). FSP SFAS 132(R)-1 amends SFAS No. 132(R), “Employer’s Disclosures about Pensionsproposed guidance that would give companies the option to first perform a qualitative assessment to determine whether it more likely than not that an indefinite-lived intangible asset is impaired. The proposed guidance is similar to ASU 2011-08, "Testing Goodwill for Impairment." Companies would consider relevant events and
Other Postretirement Benefits,”circumstances that may affect the significant inputs used in determining the fair value of an indefinite-lived intangible asset. A company that concludes that it is more likely than not that the fair value of such an asset exceeds its carrying amount would not need to
require additional disclosures about assets heldcalculate the fair value of the asset in
an employer’s defined benefit pension or other postretirement plan. FSP SFAS 132(R)-1 was codified within ASC 715, “Compensation-Retirement Benefits.”the current year. However, if a company concludes that it is more likely than not that the asset is impaired, it must calculate the fair value of the asset and compare that value with its carrying amount, as is required by current guidance. The final amendments would be applied prospectively for annual and interim impairment tests performed for fiscal years beginning after September 15, 2012, with early adoption permitted, and, for the Company, the amendments are effective beginning in July 1, 2013. The Company
adopted the provisions of FSP SFAS 132(R)-1 effective July 1, 2009. Although the Company’s disclosures about postretirement benefit plans changed,believes that adoption of
ASC 715 didASU 2011-04 will not impact the results of operations, financial position or cash flows of the Company.
In
June 2008,May 2011, the FASB issued
FSPASU No.
EITF 03-6-1, “Determining Whether Instruments Granted2011-04, “Fair Value Measurement (Topic 820), Amendments to Achieve Common Fair Value Measurement and Disclosure Requirements in
Share Based Payment Transactions Are Participating Securities”U.S. GAAP and IFRSs” (“
FSP No. EITF 03-6-1”ASU 2011-04”).
FSP No. EITF 03-6-1 clarifies that share based payment awards that entitle their holdersThe ASU amends the fair value measurement and disclosure guidance in ASC 820, “Fair Value Measurement,” to
receive non-forfeitable dividends before vesting should be considered participating securitiesconverge GAAP and
includedInternational Financial Reporting Standards requirements for measuring amounts at fair value as well as disclosures about these measurements. Many of the amendments clarify existing concepts and are generally not expected to result in
significant changes to how many companies currently apply the
calculation of basic EPS.fair value principles. In certain instances, however, the FASB changed a principle to achieve convergence, and while limited, these amendments have the potential to significantly change practice for some companies. For public entities, the amendments are effective during interim and annual periods beginning after December 15, 2011 and, for the Company, the amendments are effective beginning in July 1, 2012. The Company
adopted FSP No. EITF 03-6-1 on July 1, 2009. FSP No. EITF 03-6-1 was codified within ASC 260, “Earnings Per Share.” Adoptionbelieves that adoption of
ASC 260 didASU 2011-04 will not impact the results of operations, financial position or cash flows of the Company.
In April 2008, the FASB issued FSP No. FAS 142-3, “Determination of the Useful Life of Intangible Assets” (“FSP No. FAS 142-3”). FSP No. FAS 142-3 amends the factors that should be considered in developing renewal or extension assumptions used to determine the useful life of a recognized intangible asset under SFAS No. 142, “Goodwill and Other Intangible Assets.” The Company adopted FSP No. FAS 142-3 effective July 1, 2009 on a prospective basis. FSP No. FAS 142-3 was codified within ASC 275, “Risks and Uncertainties,” and ASC 350, “Intangibles-Goodwill and Other.” Adoption of FSP No. FAS 142-3 did not have a material impact on the Company’s consolidated financial statements.
FARMER BROS. CO.
NOTES TO CONSOLIDATED FINANCIAL STATEMENTS—(Continued)
In December 2007, the FASB issued SFAS No. 141 (Revised), “Business Combinations” (“SFAS 141(R)”), replacing SFAS No. 141, “Business Combinations” (“SFAS 141”), and SFAS No. 160, “Noncontrolling Interests in Consolidated Financial Statements—An Amendment of ARB No. 51” (“SFAS 160”). SFAS 141(R) retains the fundamental requirements of SFAS 141, broadens its scope by applying the acquisition method to all transactions and other events in which one entity obtains control over one or more other businesses, and requires, among other things, that assets acquired and liabilities assumed be measured at fair value as of the acquisition date, that liabilities related to contingent considerations be recognized at the acquisition date and re-measured at fair value in each subsequent reporting period, that acquisition related costs be expensed as incurred, and that income be recognized if the fair value of the net assets acquired exceeds the fair value of the consideration transferred. SFAS 160 establishes accounting and reporting standards for noncontrolling interests (i.e., minority interests) in a subsidiary, including changes in a parent’s ownership interest in a subsidiary and requires, among other things, that noncontrolling interests in subsidiaries be classified as a separate component of equity. Except for the presentation and disclosure requirements of SFAS 160, which are to be applied retrospectively for all periods presented, SFAS 141(R) and SFAS 160 are to be applied prospectively in financial statements issued for fiscal years beginning after December 15, 2008. SFAS 141(R) and SFAS 160 were effective for the Company beginning July 1, 2009. Although the accounting on future transactions is expected to be impacted, the Company did not have any material impact to its historical financial statements from the adoption of SFAS 141(R) and SFAS 160.
Additionally, for business combinations for which the acquisition date occurs prior to the effective date of SFAS 141(R), the acquirer is required to apply the requirements of ASC 740, “Income Taxes,” as amended by SFAS 141(R), prospectively. After the effective date of SFAS 141(R), changes in the valuation allowance for acquired deferred tax assets and dispositions of uncertain income tax positions must be recognized as an adjustment to income tax expense, rather than through goodwill. The impact of the adoption of SFAS 141(R) on the Company’s consolidated financial statements will largely be dependent on the size and nature of the business combinations completed after July 1, 2009. SFAS 141(R) was codified within ASC 805, “Business Combinations” (“ASC 805”).
In April 2009, the FASB issued FSP No. 141R-1, “Accounting for Assets Acquired and Liabilities Assumed in a Business Combination That Arise from Contingencies” (“FSP No. 141R-1”). FSP No. 141R-1 amends the provisions in SFAS 141(R) for the initial recognition and measurement, subsequent measurement and accounting, and disclosures for assets and liabilities arising from contingencies in business combinations. FSP No. 141R-1 eliminates the distinction between contractual and non-contractual contingencies, including the initial recognition and measurement criteria in SFAS 141(R), and instead carries forward most of the provisions in SFAS 141(R) for acquired contingencies. FSP No. 141R-1 is effective for contingent assets and contingent liabilities acquired in business combinations for which the acquisition date is on or after the beginning of the first annual reporting period beginning on or after December 15, 2008. The Company adopted FSP No. 141R-1 on July 1, 2009. Adoption of the standard did not have a material impact on the results of operations, financial position or cash flows of the Company. FSP No. 141R-1 was codified within ASC 805.
In April 2009, the FASB issued FSP No. 107-1 and Accounting Principles Board Opinion (“APB”) No. 28-1, “Interim Disclosures about Fair Value of Financial Instruments” (“FSP FAS No. 107-1 and APB No. 28-1”). FSP FAS No. 107-1 and APB No. 28-1 amend SFAS No. 107, “Disclosures about Fair Value of Financial Instruments,” to require disclosures about the fair value of financial instruments for interim reporting periods ending after June 15, 2009. The Company adopted FSP FAS No. 107-1 and APB No. 28-1 on July 1, 2009. Adoption of the standards did not have an impact on the Company’s financial statement disclosures. FSP FAS No. 107-1 and APB No. 28-1 were codified within ASC 825, “Financial Instruments.”
FARMER BROS. CO.
NOTES TO CONSOLIDATED FINANCIAL STATEMENTS—(Continued)
In August 2009, the FASB issued ASU No. 2009-5, which amends subtopic ASC 820-10, “Fair Value Measurements,” as it relates to the fair value measurement of liabilities. ASU No. 2009-5 provides clarification that in circumstances in which a quoted price in an active market for the identical liability is not available, an entity is required to measure fair value utilizing one or more of the following techniques: (1) a valuation technique that uses the quoted market price of an identical liability or similar liabilities when traded as assets; or (2) another valuation technique that is consistent with the principles of ASC 820, such as a present value technique. The Company adopted ASU No. 2009-5 on October 1, 2009. Adoption of ASU No. 2009-5 did not impact the results of operations, financial position or cash flows of the Company.
New Accounting Pronouncements
In June 2008, the FASB released a proposed SFAS, “Disclosure of Certain Loss Contingencies, an amendment of FASB Statements No. 5 and 141” (the “Proposed Statement”), for a comment period that ended during August 2008. The Proposed Statement would (a) expand the population of loss contingencies that are required to be disclosed, (b) require disclosure of specific quantitative and qualitative information about those loss contingencies, (c) require a tabular reconciliation of recognized loss contingencies and (d) provide an exemption from disclosing certain required information if disclosing that information would be prejudicial to an entity’s position in a dispute. The Proposed Statement would be effective for financial statements issued for fiscal years ending after December 15, 2008, and for interim and annual periods in subsequent fiscal years. Following the effective date of the ASC, SFAS No. 5 was codified within Topic 450, “Contingencies.” When and if the Proposed Statement is approved in final form by the FASB, the Company will evaluate whether the adoption of the Proposed Statement will have any material impact on its results of operations, financial condition or cash flows.
In October 2009, the multiple-element arrangements guidance codified in ASC 605-25, “Revenue Recognition–Multiple Element Arrangements,” was modified by the FASB as a result of the final consensus reached on EITF Issue No. 08-1, “Revenue Arrangements with Multiple Deliverables,” which was codified by ASU No. 2009-13. The guidance in ASU No. 2009-13 supersedes the existing guidance on such arrangements and is effective for the first annual reporting period after June 15, 2010 and is effective for the Company beginning on July 1, 2010. Adoption of ASU No. 2009-13 is not expected to materially affect the results of operations, financial condition or cash flows of the Company.
In April 2010, the FASB issued ASU 2010-12, “Income Taxes (ASC 740): Accounting for Certain Tax Effects of the 2010 Health Care Reform Acts.” After consultation with the FASB, the SEC stated that it “would not object to a registrant incorporating the effects of the Health Care and Education Reconciliation Act of 2010 when accounting for the Patient Protection and Affordable Care Act.” The Company does not expect the provisions of ASU 2010-12 to have a material impact on the financial position, results of operations or cash flows of the Company.
Note 2. Acquisitions
Acquisition of DSD Coffee Business
Effective as of February 28, 2009, the Company completed the acquisition from Sara Lee Corporation, a Maryland corporation (“Seller”), and Saramar, L.L.C., a Delaware limited liability company (“Saramar” and collectively with Seller, “Seller Parties”) of certain assets used in connection with Seller Parties’ direct store delivery coffee business in the United States (the “DSD Coffee Business”). The acquired business generally consists of manufacturing and selling coffee, tea and related products through a network of facilities and vehicles which was acquired to complement and expand the Company’s previously existing operations. This business also
FARMER BROS. CO.
NOTES TO CONSOLIDATED FINANCIAL STATEMENTS—(Continued)
includes the distribution, sale and service of brewed and liquid coffee equipment, as well as the right to distribute sauces and dressings to customers of the DSD Coffee Business. The results of operations of the DSD Coffee Business have been included in the Company’s consolidated financial statements since March 1, 2009.
The assets purchased include, among other things, the following: (i) a manufacturing plant in Houston, Texas, a spice plant in Oklahoma City, Oklahoma, and a warehouse in Indianapolis, Indiana; (ii) 64 leased branch facilities in 31 states; (iii) a vehicle fleet consisting of 431 owned and leased vehicles; (iv) certain tangible personal property; (v) inventories of raw materials, work in process, finished goods and packaging; (vi) certain contracts, permits, books and records; (vii) prepaid expenses relating to the DSD Coffee Business; and (viii) all goodwill relating to the DSD Coffee Business. The Company also acquired Seller Parties’ rights (including related goodwill) in the trademarks and trade names relating to the SUPERIOR®, MCGARVEY®, CAIN’S®, IRELAND®, JUSTIN LLOYD®, METROPOLITAN®, PREBICA®, WECHSLER®, WORLD’S FINEST® and CAFÉ ROYAL® brands.
Subject to certain post-closing adjustments relating to the amount of consumable inventory and prepaid expenses at closing, and after giving effect to certain reimbursement obligations of the parties relating to accounting costs, IT carve-out costs, and transfer taxes and fees, as well as real and personal property tax and utility prorations, the amount paid to Seller was $45.6 million, which consisted of $16.1 million of Company cash and proceeds of a bank loan of $29.5 million. The Company paid approximately $2.7 million of acquisition related expenses. At closing, the Company assumed certain liabilities, including obligations under contracts, environmental liabilities with respect to the transferred facilities, pension liabilities, advertising and trade promotion accruals, and accrued vacation as of the closing for hired personnel. Seller Parties retained all liabilities that were not specifically assumed by the Company. The Company re-financed and replaced certain leases relating to the DSD Coffee Business vehicles in the fourth quarter of fiscal 2009 as described in Note 15. Additionally, the Company assumed lease liabilities for sixty-four warehouse leases with lease terms that generally do not exceed three years.
In connection with the closing, Seller Parties and the Company entered into certain operational agreements, including trademark and formula license agreements, co-pack agreements, a liquid coffee distribution agreement, a transition services agreement, and a green coffee and tea purchase agreement. One of the co-pack agreements provided that Seller would manufacture branded products for the Company for a period of three years. Under this agreement the Company had agreed to purchase certain minimum product quantities from Seller subject to certain permitted reductions. This agreement was terminated effective June 30, 2010. Under the other co-pack agreement, the Company has agreed to perform co-packing services for Seller as Seller’s agent. As a result, the Company recognizes revenue from this arrangement on a net basis, net of direct costs of revenue. The transition services agreement pursuant to which the Seller agreed to provide a number of services for the Company on an interim basis, including hosting, maintaining and supporting IT infrastructure and communications, was scaled back in February 2010 to include only certain IT infrastructure support, and was terminated on August 31, 2010.
The accompanying consolidated financial statements do not include pro-forma historical information, as if the results of the DSD Coffee Business had been included from the beginning of the periods presented, since the use of forward-looking information would be necessary in order to meaningfully present the effects of the acquisition. Forward-looking information, rather than historical information, would be required since the DSD Coffee Business was operated as part of a larger business within Seller and there will be a different operating cost structure and different operations support under the Company’s ownership. The Company has not provided forward-looking information with respect to incremental costs and expenses to be incurred because such information is not determinable.
FARMER BROS. CO.
NOTES TO CONSOLIDATED FINANCIAL STATEMENTS—(Continued)
The DSD Coffee Business acquisition has been accounted for as an asset purchase. The total purchase price has been allocated to tangible and intangible assets based on their estimated fair values as of February 28, 2009 as determined by management based upon a third-party valuation. The purchase price allocation was finalized in the Company’s third quarter ended March 31, 2010 and the estimated initial total fair value of net assets acquired was reduced from $48.3 million to $47.8 million as summarized in the following table (dollars in thousands):
| | | | | | |
| | | Fair Value
of Assets
Acquired | | | Estimated Useful
Life (years) |
Inventory | | $ | 16,437 | | | |
Prepaid expense | | | 1,138 | | | |
| | | | | | |
Current assets | | | 17,575 | | | |
Vehicles | | | 1,027 | | | 5 |
Machinery | | | 10,774 | | | 3-5 |
Property, plant & equipment | | | 5,486 | | | 30 |
Land | | | 1,913 | | | |
| | | | | | |
Fixed assets | | | 19,200 | | | |
Trademarks | | | 2,080 | | | indefinite |
Customer relationships | | | 7,726 | | | 8 |
Distribution agreement | | | 2,452 | | | 10 |
Co-pack agreement | | | 743 | | | 6 |
| | | | | | |
Intangible assets | | | 13,001 | | | |
| | | | | | |
Total assets acquired | | | 49,776 | | | |
Liabilities | | | (2,026 | ) | | |
| | | | | | |
Net assets acquired | | $ | 47,750 | | | |
| | | | | | |
Note
3.2. Investments and Derivative Instruments
The Company purchases various derivative instruments as investments or to create economic hedges of its interest rate risk and commodity price risk. At June 30, 20102012 and 2009,2011, derivative instruments were not designated as accounting hedges as defined by ASC 815, “Accounting for Derivative Instruments and Hedging Activities.” The fair value of derivative instruments is based upon broker quotes. The Company records unrealized gains and losses on trading securities and changes in the market value of certain coffee contracts meeting the definition of derivatives in Other, net (expense) income."Other, net."
The
Company adopted ASC 820, “Fair Value Measurements” (“ASC 820”) on July 1, 2008. ASC 820 defines fair value and expands disclosure for each major asset and liability category measured at fair value on either a recurring or nonrecurring basis. Under ASC 820, the Company groups its assets and liabilities at fair value in three levels, based on the markets in which the assets and liabilities are traded and the reliability of the assumptions used to determine fair value. These levels are:
Level 1—Valuation is based upon quoted prices for identical instruments traded in active markets.
Level 2—Valuation is based upon quoted prices for similar instruments in active markets, quoted prices for identical or similar instruments in markets that are not active, and model-based valuation techniques for which all significant assumptions are observable in the market.
FARMER BROS. CO.
NOTES TO CONSOLIDATED FINANCIAL STATEMENTS—(Continued)
Level 3—Valuation is generated from model-based techniques that use significant assumptions not observable in the market. These unobservable assumptions reflect estimates of assumptions that market participants would use in pricing the asset or liability. Valuation techniques include use of option pricing models, discounted cash flow models and similar techniques.
The Company’s investments have been grouped
Assets and liabilities measured and recorded at fair value on a recurring basis were as follows (in thousands): | | | | | | | | | | | | |
As of June 30, 2010 | | Total | | Level 1 | | Level 2 | | Level 3 |
Preferred stock | | $ | 50,684 | | $ | 11,946 | | $ | 38,738 | | $ | — |
Futures, options and other derivatives | | $ | 258 | | $ | 258 | | $ | — | | $ | — |
| | | | |
As of June 30, 2009 | | Total | | Level 1 | | Level 2 | | Level 3 |
Preferred stock | | $ | 42,466 | | $ | 11,759 | | $ | 30,707 | | $ | — |
Futures, options and other derivatives | | $ | 460 | | $ | 460 | | $ | — | | $ | — |
|
| | | | | | | | | | | | | | | | |
| As of June 30, 2012 | | Total | | Level 1 | | Level 2 | | Level 3 |
| Preferred stock(1) | | $ | 19,395 |
| | $ | 14,078 |
| | $ | 5,317 |
| | $ | — |
|
| Futures, options and other derivative assets(1) | | $ | 1,626 |
| | $ | — |
| | $ | 1,626 |
| | $ | — |
|
| Derivative liabilities(2) | | $ | 410 |
| | $ | — |
| | $ | 410 |
| | $ | — |
|
| | | | | | | | | |
| | | | | | | | | |
| As of June 30, 2011 | | Total | | Level 1 | | Level 2 | | Level 3 |
| Preferred stock(1) | | $ | 24,407 |
| | $ | 7,181 |
| | $ | 17,226 |
| | $ | — |
|
| Futures, options and other derivatives(1) | | $ | 467 |
| | $ | — |
| | $ | 467 |
| | $ | — |
|
| Derivative liabilities(2) | | $ | 1,647 |
| | $ | — |
| | $ | 1,647 |
| | $ | — |
|
____________________
| |
| (1) | Included in "Short-term investments" on the consolidated balance sheet. |
| |
| (2) | Included in "Accounts Payable" on the consolidated balance sheet. |
There were no significant transfers of securities between Level 1 and Level 2.
Investments, consisting of marketable debt and equity securities, money market instruments and various derivative instruments, are held for trading purposes and are stated at fair value.
Investments are:
| | | | | | |
| | | June 30, |
| | | 2010 | | 2009 |
| | | (In thousands) |
Trading securities at fair value | | | | | | |
Preferred Stock | | $ | 50,684 | | $ | 42,466 |
Futures, options and other derivatives | | | 258 | | | 460 |
| | | | | | |
| | $ | 50,942 | | $ | 42,926 |
| | | | | | |
Gains and losses, both realized and unrealized, are included in
Other, net income (expense)."Other, net" on the statement of operations and in the "Net loss (gain) on investments" in the statement of cash flows. Net realized and unrealized gains and losses are as follows:
| | | | | | | | | | | | |
| | | June 30, | |
| | | 2010 | | | 2009 | | | 2008 | |
| | | (In thousands) | |
Investments | | | | | | | | | | | | |
Unrealized gains | | $ | 9,647 | | | $ | — | | | $ | — | |
Unrealized losses | | | — | | | | (3,584 | ) | | | (9,271 | ) |
Realized gains | | | — | | | | 238 | | | | 372 | |
Realized losses | | | (265 | ) | | | (5,643 | ) | | | (5,093 | ) |
| | | | | | | | | | | | |
Net realized and unrealized gains (losses) | | | 9,382 | | | | (8,989 | ) | | | (13,992 | ) |
Net gains from sales of assets | | | 201 | | | | 475 | | | | 1,413 | |
Other gains, net | | | 586 | | | | 266 | | | | 236 | |
| | | | | | | | | | | | |
Other, net income (expense) | | $ | 10,169 | | | $ | (8,248 | ) | | $ | (12,343 | ) |
| | | | | | | | | | | | |
|
| | | | | | | | | | | | |
| | | June 30, |
| | | 2012 | | 2011 | | 2010 |
| | | (In thousands) |
| Investments and coffee-related derivatives: | | | | | | |
| Unrealized gains | | $ | 1,940 |
| | $ | 865 |
| | $ | 9,647 |
|
| Unrealized losses | | (1,013 | ) | | — |
| | — |
|
| Realized gains | | 1,545 |
| | 447 |
| | — |
|
| Realized losses | | (8,647 | ) | | — |
| | (265 | ) |
| Net realized and unrealized (losses) gains | | (6,175 | ) | | 1,312 |
| | 9,382 |
|
| Net gains from sales of assets | | 1,375 |
| | 1,359 |
| | 201 |
|
| Other gains, net | | 683 |
| | 1,520 |
| | 586 |
|
| Other, net | | $ | (4,117 | ) | | $ | 4,191 |
| | $ | 10,169 |
|
FARMER BROS. CO.NOTES TO CONSOLIDATED FINANCIAL STATEMENTS—(Continued)
Preferred stock investments as of June 30, 20102012 consisted of securities with a fair value of $36.3$16.5 million in an unrealized gain position and securities with a fair value of $14.4$2.9 million in an unrealized loss position. Preferred stock investments as of June 30, 20092011 consisted of securities with a fair value of $16.5$18.1 million in an unrealized gain position and securities with a fair value of $26.0$6.3 million in an unrealized loss position.
The following tables show gross unrealized losses (although such losses have been recognized in the consolidated statements of operations) and fair value for those investments that were in an unrealized loss position as of June 30, 20102012 and 2009,2011, aggregated by the length of time those investments have been in a continuous loss position: | | | | | | | | | | | | | | |
| | | June 30, 2010 | |
| | | Less than 12 Months | | | Total | |
(In thousands) | | Fair Value | | Unrealized Loss | | | Fair Value | | Unrealized Loss | |
Preferred stock | | $ | 1,889 | | $ | (97 | ) | | $ | 14,358 | | $ | (6,044 | ) |
| |
| | | June 30, 2009 | |
| | | Less than 12 Months | | | Total | |
(In thousands) | | Fair Value | | Unrealized Loss | | | Fair Value | | Unrealized Loss | |
Preferred stock | | $ | 3,438 | | $ | (714 | ) | | $ | 26,009 | | $ | (11,718 | ) |
|
| | | | | | | | | | | | | | | | |
| | | June 30, 2012 |
| | | Less than 12 Months | | Total |
| (In thousands) | | Fair Value | | Unrealized Loss | | Fair Value | | Unrealized Loss |
| Preferred stock | | $ | 1,750 |
| | $ | (16 | ) | | $ | 2,891 |
| | $ | (40 | ) |
| | | | | | | | | |
| | | June 30, 2011 |
| | | Less than 12 Months | | Total |
| (In thousands) | | Fair Value | | Unrealized Loss | | Fair Value | | Unrealized Loss |
| Preferred stock | | $ | 319 |
| | $ | (3 | ) | | $ | 6,326 |
| | $ | (1,122 | ) |
Note
4.3. Accounts and Notes Receivable, net
| | | | | | | | |
| | | June 30, | |
| | | 2010 | | | 2009 | |
| | | (In thousands) | |
Trade receivables | | $ | 39,600 | | | $ | 37,076 | |
Other receivables | | | 6,289 | | | | 9,841 | |
Allowance for doubtful accounts | | | (3,293 | ) | | | (1,173 | ) |
| | | | | | | | |
| | $ | 42,596 | | | $ | 45,744 | |
| | | | | | | | |
|
| | | | | | | | |
| | | June 30, |
| | | 2012 | | 2011 |
| | | (In thousands) |
| Trade receivables | | $ | 40,687 |
| | $ | 40,716 |
|
| Other receivables | | 1,921 |
| | 5,637 |
|
| Allowance for doubtful accounts | | (1,872 | ) | | (2,852 | ) |
| | | $ | 40,736 |
| | $ | 43,501 |
|
In fiscal 2010, based on a larger customer base due to recent Company acquisitions and in response to slower collection of the Company’s accounts receivable resulting from the impact of the economic downturn on the Company’s customers, the Company increasedrecorded a $3.2 million charge to bad debt expense resulting in a net increase of $2.1 million in its allowance for doubtful accounts. In fiscal 2012 and fiscal 2011, due to improvements in the collection of past due accounts, the Company reduced its allowance for doubtful accounts by $1.0 millionand recorded a $2.5$0.4 million charge to bad debt expense., respectively. Allowance for doubtful accounts (in thousands): | | | | |
Balance at June 30, 2007 | | $ | (451 | ) |
Additions | | | (311 | ) |
Write-offs | | | 268 | |
| | | | |
Balance at June 30, 2008 | | | (494 | ) |
Additions | | | (810 | ) |
Write-offs | | | 131 | |
| | | | |
Balance at June 30, 2009 | | | (1,173 | ) |
Additions | | | (3,188 | ) |
Write-offs | | | 1,068 | |
| | | | |
Balance at June 30, 2010 | | $ | (3,293 | ) |
| | | | |
FARMER BROS. CO.accounts:
NOTES TO CONSOLIDATED FINANCIAL STATEMENTS—(Continued)
|
| | | |
| (In thousands) | |
| Balance at June 30, 2009 | $ | (1,173 | ) |
| Additions | (3,188 | ) |
| Write-offs | 1,068 |
|
| | |
| Balance at June 30, 2010 | (3,293 | ) |
| Additions | (2,024 | ) |
| Write-offs | 2,465 |
|
| | |
| Balance at June 30, 2011 | (2,852 | ) |
| Additions | — |
|
| Write-offs | 980 |
|
| | |
| Balance at June 30, 2012 | $ | (1,872 | ) |
| | |
Note 5.4. Inventories | | | | | | | | | |
June 30, 2010 | | Processed | | Unprocessed | | Total |
| | | (In thousands) |
Coffee | | $ | 22,230 | | $ | 16,765 | | $ | 38,995 |
Tea and culinary products | | | 28,833 | | | 3,145 | | | 31,978 |
Coffee brewing equipment | | | 5,849 | | | 6,890 | | | 12,739 |
| | | | | | | | | |
| | $ | 56,912 | | $ | 26,800 | | $ | 83,712 |
| | | | | | | | | |
| | | |
June 30, 2009 | | Processed | | Unprocessed | | Total |
| | | (In thousands) |
Coffee | | $ | 15,612 | | $ | 19,816 | | $ | 35,428 |
Tea and culinary products | | | 20,760 | | | 4,686 | | | 25,446 |
Coffee brewing equipment | | | 4,745 | | | 3,342 | | | 8,087 |
| | | | | | | | | |
| | $ | 41,117 | | $ | 27,844 | | $ | 68,961 |
| | | | | | | | | |
|
| | | | | | | | | | | | |
| | | Processed | | Unprocessed | | Total |
| June 30, 2012 | | (In thousands) |
| Coffee | | $ | 15,485 |
| | $ | 11,836 |
| | $ | 27,321 |
|
| Tea and culinary products | | 24,502 |
| | 4,817 |
| | 29,319 |
|
| Coffee brewing equipment | | 3,977 |
| | 5,364 |
| | 9,341 |
|
| | | $ | 43,964 |
| | $ | 22,017 |
| | $ | 65,981 |
|
| | | | | | | |
| | | Processed | | Unprocessed | | Total |
| June 30, 2011 | | (In thousands) |
| Coffee | | $ | 22,464 |
| | $ | 17,220 |
| | $ | 39,684 |
|
| Tea and culinary products | | 25,469 |
| | 4,100 |
| | 29,569 |
|
| Coffee brewing equipment | | 3,930 |
| | 6,576 |
| | 10,506 |
|
| | | $ | 51,863 |
| | $ | 27,896 |
| | $ | 79,759 |
|
Current cost of coffee, tea and culinary inventories exceeds the LIFO cost by (in thousands): | | | | | | | | | |
| | | June 30, |
| | | 2010 | | 2009 | | 2008 |
Coffee | | $ | 22,998 | | $ | 22,094 | | $ | 22,932 |
Tea and culinary products | | | 4,816 | | | 5,064 | | | 4,239 |
| | | | | | | | | |
Total | | $ | 27,814 | | $ | 27,158 | | $ | 27,171 |
| | | | | | | | | |
by:
|
| | | | | | | | |
| | June 30, |
| (In thousands) | | 2012 | | 2011 |
| Coffee | | $ | 34,844 |
| | $ | 62,870 |
|
| Tea and culinary products | | 7,239 |
| | 6,695 |
|
| Total | | $ | 42,083 |
| | $ | 69,565 |
|
The changeCompany routinely enters into specialized hedging transactions to purchase future coffee contracts to enable it to lock in the Company’s green coffee teaprices within a pre-established range, and culinary product inventories duringholds a mix of futures contracts and options to help hedge against volatility in green coffee prices. None of these hedging transactions, futures contracts or options is designated as an accounting hedge. Gains and losses on these derivative instruments are realized immediately in “Other, net.”
For the fiscal years ended June 30, 2012, 2011 and 2010, 2009the Company recorded $(8.6) million, $0.9 million, and 2008 resulted$29,000, respectively, in LIFO (increments) decrements which resultedcoffee-related net realized derivative (losses) gains. For the fiscal years ended June 30, 2012, 2011 and 2010, the Company recorded $1.2 million, $(2.4) million and $1.5 million in acoffee-related net increase (decrease) in gross profit for those years by $(0.7) million, $(1.5) millionunrealized derivative gains (losses).
In fiscal 2012 and $(5.8) million, respectively.In fiscal 2010,2011, certain inventory quantities were reduced. This reduction resulted in athe liquidation of LIFO inventory quantities carried at lower costs prevailing in prior years as compared with the cost in fiscal 2010.years. The beneficial effect of this liquidation was to reduceof LIFO inventory quantities reduced net loss for fiscal 2012, 2011 and 2010 by $0.8 million.
$14.2 million and $1.1 million, $0.8 million respectively. Note 6.5. Property, Plant and Equipment | | | | | | | | |
| | | June 30, | |
| | | 2010 | | | 2009 | |
| | | (In thousands) | |
Buildings and facilities | | $ | 79,312 | | | $ | 74,857 | |
Machinery and equipment | | | 109,738 | | | | 93,379 | |
Equipment under capital leases | | | 7,192 | | | | 3,239 | |
Capitalized software costs | | | 15,488 | | | | 15,464 | |
Office furniture and equipment | | | 15,583 | | | | 13,328 | |
| | | | | | | | |
| | $ | 227,313 | | | $ | 200,267 | |
Accumulated depreciation | | | (116,887 | ) | | | (98,184 | ) |
Land | | | 9,946 | | | | 9,980 | |
| | | | | | | | |
Property, plant and equipment, net | | $ | 120,372 | | | $ | 112,063 | |
| | | | | | | | |
|
| | | | | | | | |
| | | June 30, |
| | | 2012 | | 2011 |
| | | (In thousands) |
| Buildings and facilities | | $ | 78,608 |
| | $ | 80,352 |
|
| Machinery and equipment | | 129,845 |
| | 119,209 |
|
| Equipment under capital leases | | 19,731 |
| | 10,675 |
|
| Capitalized software | | 18,524 |
| | 18,294 |
|
| Office furniture and equipment | | 16,818 |
| | 16,839 |
|
| | | $ | 263,526 |
| | $ | 245,369 |
|
| Accumulated depreciation | | (164,662 | ) | | (140,996 | ) |
| Land | | 9,271 |
| | 9,734 |
|
| Property, plant and equipment, net | | $ | 108,135 |
| | $ | 114,107 |
|
Capital leases consist mainly of vehicle leases at June 30, 20102012 and 2009.2011
FARMER BROS. CO.. NOTES TO CONSOLIDATED FINANCIAL STATEMENTS—(Continued)The Company has capitalized coffee brewing equipment (included in machinery and equipment) in the amounts of $14.1$13.9 million $5.4 and $12.7 million in fiscal 2012 and $1.2 million in fiscal years 2010, 2009 and 2008,2011, respectively. Depreciation expense related to the capitalized coffee brewing equipment reported as cost of goods sold was $6.1$12.2 million $1.7, $9.6 million and $0.1$6.1 million in fiscal years2012, 2011 and 2010 2009 and 2008,, respectively. Depreciation and amortization expense includes amortization expense for assets recorded under capitalized leases.
Maintenance and repairs to property, plant and equipment charged to expense for the years ended June 30, 2010, 20092012, 2011 and 20082010 were $15.0$7.9 million $15.2, $10.3 million and $13.5$15.0 million, respectively.
Note
7.6. Goodwill and Intangible Assets
The following is a summary of the Company’s amortized and unamortized intangible assets other than goodwill, along with amortization expense on these intangible assets for the past three fiscal years and estimated aggregate amortization expense for each of the next five fiscal years:
| | | | | | | | | | | | | | |
| | | 2010 | | | 2009 | |
| | | Gross
Carrying
Amount | | Accumulated
Amortization | | | Gross
Carrying
Amount | | Accumulated
Amortization | |
| | | (In thousands) | |
Amortized intangible assets: | | | | | | | | | | | | | | |
Customer relationships | | $ | 18,216 | | $ | (7,934 | ) | | $ | 17,968 | | $ | (4,491 | ) |
Distribution agreement | | | 2,452 | | | (327 | ) | | | 2,493 | | | (83 | ) |
Co-pack agreement | | | 743 | | | (165 | ) | | | 755 | | | (41 | ) |
Other | | | 3,430 | | | (2,643 | ) | | | 2,139 | | | (1,487 | ) |
| | | | | | | | | | | | | | |
Total amortized intangible assets | | $ | 24,841 | | $ | (11,069 | ) | | $ | 23,355 | | $ | (6,102 | ) |
| | | | | | | | | | | | | | |
Unamortized intangible assets: | | | | | | | | | | | | | | |
Tradenames with indefinite lives | | $ | 4,080 | | $ | — | | | $ | 4,080 | | $ | — | |
Trademarks with indefinite lives | | | 2,080 | | | — | | | | 2,115 | | | — | |
Goodwill | | | 5,310 | | | — | | | | 5,310 | | | — | |
| | | | | | | | | | | | | | |
Total unamortized intangible assets | | $ | 11,470 | | $ | — | | | $ | 11,505 | | $ | — | |
| | | | | | | | | | | | | | |
Total intangible assets | | $ | 36,311 | | $ | (11,069 | ) | | $ | 34,860 | | $ | (6,102 | ) |
| | | | | | | | | | | | | | |
Aggregate amortization expense for the past three fiscal years: | | | | | | | | | | | | | | |
For the year ended June 30, 2010 | | $ | 4,016 | | | | | | | | | | | |
For the year ended June 30, 2009 | | $ | 3,263 | | | | | | | | | | | |
For the year ended June 30, 2008 | | $ | 1,695 | | | | | | | | | | | |
Estimated amortization expense for each of the next five fiscal years: | | | | | | | | | | | | | | |
For the year ended June 30, 2011 | | $ | 3,697 | | | | | | | | | | | |
For the year ended June 30, 2012 | | $ | 3,306 | | | | | | | | | | | |
For the year ended June 30, 2013 | | $ | 2,770 | | | | | | | | | | | |
For the year ended June 30, 2014 | | $ | 2,056 | | | | | | | | | | | |
For the year ended June 30, 2015 | | $ | 1,293 | | | | | | | | | | | |
The remaining weighted average amortization periods for intangible assets with finite lives are as follows: | | | | | | | | | | | | | | |
Customer relationships | | | 7 years | | | | | | | | | | | |
Distribution agreement | | | 9 years | | | | | | | | | | | |
Co-pack agreement | | | 5 years | | | | | | | | | | | |
The following is a summary of the changes in the carrying value of goodwill: | | | | | | | | | | | | | | |
Balance at July 1, 2008 | | $ | 5,310 | | | | | | | | | | | |
Acquisitions during year | | | — | | | | | | | | | | | |
| | | | | | | | | | | | | | |
Balance at June 30, 2009 | | $ | 5,310 | | | | | | | | | | | |
Acquisitions during year | | | — | | | | | | | | | | | |
| | | | | | | | | | | | | | |
Balance at June 30, 2010 | | $ | 5,310 | | | | | | | | | | | |
| | | | | | | | | | | | | | |
FARMER BROS. CO.
NOTES TO CONSOLIDATED FINANCIAL STATEMENTS—(Continued)
|
| | | | | | | | | | | | | | | | |
| | | As of June 30, 2012 | | As of June 30, 2011 |
| | | Gross Carrying Amount | | Accumulated Amortization | | Gross Carrying Amount | | Accumulated Amortization |
| | | (In thousands) |
| Amortized intangible assets: | | | | | | | | |
| Customer relationships | | $ | 10,083 |
| | $ | (8,188 | ) | | $ | 10,460 |
| | $ | (7,291 | ) |
| Total amortized intangible assets | | $ | 10,083 |
| | $ | (8,188 | ) | | $ | 10,460 |
| | $ | (7,291 | ) |
| Unamortized intangible assets: | | | | | | | | |
| Tradenames with indefinite lives | | $ | 3,640 |
| | $ | — |
| | $ | 4,080 |
| | $ | — |
|
| Trademarks with indefinite lives | | 2,080 |
| | — |
| | 2,080 |
| | — |
|
| CBI Goodwill | | — |
| | — |
| | 5,310 |
| | — |
|
| Total unamortized intangible assets | | $ | 5,720 |
| | $ | — |
| | $ | 11,470 |
| | $ | — |
|
| Total intangible assets | | $ | 15,803 |
| | $ | (8,188 | ) | | $ | 21,930 |
| | $ | (7,291 | ) |
| | | | | | | | | |
| Aggregate amortization expense for the past three fiscal years: | | | | | | |
| For the fiscal year ended June 30, 2012 | | $ | 1,439 |
| | | | | | |
| For the fiscal year ended June 30, 2011 | | $ | 2,948 |
| | | | | | |
| For the fiscal year ended June 30, 2010 | | $ | 2,849 |
| | | | | | |
| | | | | | | | | |
| Estimated amortization expense for each of the next five fiscal years: | | | | |
| For the fiscal year ended June 30, 2013 | | $ | 1,246 |
| | | | | | |
| For the fiscal year ended June 30, 2014 | | $ | 649 |
| | | | | | |
| | | | | | | | | |
| The remaining weighted average amortization periods for intangible assets with finite lives are as follows: | | | | | | |
| Customer relationships (years) | | 1.4 |
| | | | | | |
| | | | | | | | | |
|
| | | | |
| Summary of the changes in the carrying value of goodwill: |
| Balance at July 1, 2010 | | $ | 5,310 |
|
| Acquisitions during year | | — |
|
| Balance at July 1, 2011 | | $ | 5,310 |
|
| Reclassification | | (165 | ) |
| Impairment loss | | (5,145 | ) |
| Balance at June 30, 2012 | | $ | — |
|
Note
8.7. Employee Benefit Plans
The Company provides pension plans for most full time employees. Generally the plans provide benefits based on years of service and/or a combination of years of service and earnings.
RetireesCertain retirees are also eligible for medical,
dental and
life insurancevision benefits.
The Company is required to recognize the funded status of a benefit plan in its balance sheet. The Company is also required to recognize in
other comprehensive incomeOCI certain gains and losses that arise during the period but are deferred under pension accounting rules.
The recognition and disclosure elements are effective as of the end of fiscal years ending after December 15, 2006 and measurement elements are effective for fiscal years ending after December 15, 2008. The Company adopted these recognition provisions in fiscal 2008 and applied them to the funded status of its defined benefit and postretirement plans resulting in a decrease in stockholders’ equity of $8.8 million.Union
Single Employer Pension Plans
The Company contributes to several multi-employer defined benefit pension plans for certain union employees. The contributions to these multi-employer pension plans were approximately $4.0 million, $2.8 million, and $2.5 million for the fiscal years ended June 30, 2010, 2009 and 2008, respectively.
Company Pension PlansThe Company has a defined benefit pension plan, the Farmer Bros. Salaried Employees Pension Plan (the “Farmer Bros. Plan”), for the majority of its employees who are not covered under a collective bargaining agreement (Farmeragreement. The Company amended the Farmer Bros. Plan)Plan, freezing the benefit for all participants effective June 30, 2011. After the plan freeze, participants do not accrue any benefits under the plan, and new hires are not eligible to participate in the plan. As a result, the Company recorded a curtailment charge of $1.5 million in the fourth quarter of fiscal 2011. As all plan participants became inactive following this curtailment, net (gain) loss is now amortized based on the remaining life expectancy of these participants instead of the remaining service period of these participants.
The Company also has two defined benefit pensions plan for certain hourly employees covered under a collective bargaining agreement
(Brewmatic Plan(the “Brewmatic Plan” and the
Hourly“Hourly Employees’
Plan)Plan”). All assets and benefit obligations were determined using a measurement date of June 30.
FARMER BROS. CO.
NOTES TO CONSOLIDATED FINANCIAL STATEMENTS—(Continued)
Obligations and Funded Status | | | | | | | | | | | | | | | | | | | | | | | |
| | | Farmer Bros. Plan
June 30, | | | Brewmatic Plan
June 30, | | | Hourly Employees’ Plan
June 30, |
| | | 2010 | | | 2009 | | | 2010 | | | 2009 | | | 2010 | | | 2009 |
| | | (In thousands) | | | (In thousands) | | | (In thousands) |
Change in projected benefit obligation | | | | | | | | | | | | | | | | | | | | | | | |
Benefit obligation at the beginning of the year | | $ | 96,652 | | | $ | 85,681 | | | $ | 3,476 | | | $ | 3,352 | | | $ | — | | | $ | — |
Service cost | | | 4,340 | | | | 2,757 | | | | 48 | | | | 47 | | | | 519 | | | | — |
Interest cost | | | 5,900 | | | | 5,689 | | | | 208 | | | | 219 | | | | — | | | | — |
Plan participant contributions | | | 732 | | | | 492 | | | | — | | | | — | | | | — | | | | — |
Actuarial (gain)/loss | | | 7,410 | | | | 6,156 | | | | 241 | | | | 122 | | | | 59 | | | | — |
Benefits paid | | | (4,585 | ) | | | (4,123 | ) | | | (266 | ) | | | (264 | ) | | | — | | | | — |
| | | | | | | | | | | | | | | | | | | | | | | |
Projected benefit obligation at the end of the year | | $ | 110,449 | | | $ | 96,652 | | | $ | 3,707 | | | $ | 3,476 | | | $ | 578 | | | $ | — |
Change in plan assets | | | | | | | | | | | | | | | | | | | | | | | |
Fair value of plan assets at the beginning of the year | | | 59,266 | | | | 84,219 | | | | 2,395 | | | | 3,541 | | | | — | | | | — |
Actual return on plan assets | | | 8,049 | | | | (21,322 | ) | | | 333 | | | | (910 | ) | | | — | | | | — |
Employer contributions | | | — | | | | — | | | | 28 | | | | 28 | | | | — | | | | — |
Plan participant contributions | | | 732 | | | | 492 | | | | — | | | | — | | | | — | | | | — |
Benefits paid | | | (4,585 | ) | | | (4,123 | ) | | | (266 | ) | | | (264 | ) | | | — | | | | — |
| | | | | | | | | | | | | | | | | | | | | | | |
Fair value of plan assets at the end of the year | | $ | 63,462 | | | $ | 59,266 | | | $ | 2,490 | | | $ | 2,395 | | | $ | — | | | $ | — |
Funded status at end of year (underfunded)/overfunded | | $ | (46,987 | ) | | $ | (37,386 | ) | | $ | (1,217 | ) | | $ | (1,081 | ) | | $ | (578 | ) | | $ | — |
Amounts recognized in balance sheet | | | | | | | | | | | | | | | | | | | | | | | |
Noncurrent assets | | $ | — | | | $ | — | | | $ | — | | | $ | — | | | $ | — | | | $ | — |
Current liabilities | | | (4,970 | ) | | | (4,520 | ) | | | (310 | ) | | | (310 | ) | | | (5 | ) | | | — |
Noncurrent liabilities | | | (42,017 | ) | | | (32,866 | ) | | | (907 | ) | | | (772 | ) | | | (573 | ) | | | — |
| | | | | | | | | | | | | | | | | | | | | | | |
Total | | $ | (46,987 | ) | | $ | (37,386 | ) | | $ | (1,217 | ) | | $ | (1,082 | ) | | $ | (578 | ) | | $ | — |
Amounts recognized in balance sheet | | | | | | | | | | | | | | | | | | | | | | | |
Total net (gain)/loss | | $ | 50,037 | | | $ | 49,325 | | | $ | 2,186 | | | $ | 2,235 | | | $ | 59 | | | $ | — |
Transition (asset)/obligation | | | — | | | | — | | | | — | | | | — | | | | — | | | | — |
Prior service cost/(credit) | | | 1,577 | | | | 1,724 | | | | 82 | | | | 102 | | | | — | | | | — |
| | | | | | | | | | | | | | | | | | | | | | | |
Total accumulated OCI (not adjusted for applicable tax) | | $ | 51,614 | | | $ | 51,049 | | | $ | 2,268 | | | $ | 2,337 | | | $ | 59 | | | $ | — |
| | | | | | | | | | | | | | | | | | | | | | | |
Weighted-average assumptions used to determine benefit obligations | | | | | | | | | | | | | | | | | | | | | | | |
Discount rate | | | 5.60 | % | | | 6.25 | % | | | 5.60 | % | | | 6.25 | % | | | 5.60 | % | | | N/A |
Rate of compensation increase | | | 3.00 | % | | | 3.00 | % | | | N/A | | | | N/A | | | | 3.00 | % | | | N/A |
FARMER BROS. CO.
NOTES TO CONSOLIDATED FINANCIAL STATEMENTS—(Continued)
|
| | | | | | | | | | | | | | | | | | | | | | | | |
| | | Farmer Bros. Plan June 30, | | Brewmatic Plan June 30, | | Hourly Employees’ Plan June 30, |
| | | 2012 | | 2011 | | 2012 | | 2011 | | 2012 | | 2011 |
| | | (In thousands) | | (In thousands) | | (In thousands) |
| Change in projected benefit obligation | | | | | | | | | | | | |
| Benefit obligation at the beginning of the year | | $ | 107,071 |
| | $ | 110,449 |
| | $ | 3,662 |
| | $ | 3,707 |
| | $ | 1,055 |
| | $ | 578 |
|
| Service cost | | — |
| | 4,609 |
| | 39 |
| | 57 |
| | 456 |
| | 409 |
|
| Interest cost | | 5,846 |
| | 5,999 |
| | 197 |
| | 199 |
| | 59 |
| | 32 |
|
| Plan participant contributions | | 81 |
| | 1,005 |
| | — |
| | — |
| | — |
| | — |
|
| Actuarial (gain) loss | | 17,066 |
| | (1,409 | ) | | 416 |
| | (24 | ) | | (38 | ) | | 39 |
|
| Benefits paid | | (5,236 | ) | | (5,022 | ) | | (292 | ) | | (284 | ) | | (12 | ) | | (3 | ) |
| Effect of curtailment | | — |
| | (8,560 | ) | | — |
| | 7 |
| | — |
| | — |
|
| Projected benefit obligation at the end of the year | | $ | 124,828 |
| | $ | 107,071 |
| | $ | 4,022 |
| | $ | 3,662 |
| | $ | 1,520 |
| | $ | 1,055 |
|
| Change in plan assets | | | | | | | | | | | | |
| Fair value of plan assets at the beginning of the year | | 80,448 |
| | 63,462 |
| | 2,871 |
| | 2,490 |
| | 421 |
| | — |
|
| Actual return on plan assets | | 246 |
| | 16,619 |
| | (25 | ) | | 635 |
| | (4 | ) | | 11 |
|
| Employer contributions | | 6,571 |
| | 4,384 |
| | 164 |
| | 30 |
| | 608 |
| | 413 |
|
| Plan participant contributions | | 81 |
| | 1,005 |
| | — |
| | — |
| | — |
| | — |
|
| Benefits paid | | (5,236 | ) | | (5,022 | ) | | (292 | ) | | (284 | ) | | (12 | ) | | (3 | ) |
| Fair value of plan assets at the end of the year | | $ | 82,110 |
| | $ | 80,448 |
| | $ | 2,718 |
| | $ | 2,871 |
| | $ | 1,013 |
| | $ | 421 |
|
| Funded status at end of year (underfunded) overfunded | | $ | (42,718 | ) | | $ | (26,623 | ) | | $ | (1,304 | ) | | $ | (791 | ) | | $ | (507 | ) | | $ | (634 | ) |
| Amounts recognized in balance sheet | | | | | | | | | | | | |
| Noncurrent assets | | $ | — |
| | $ | — |
| | $ | — |
| | $ | — |
| | $ | — |
| | $ | — |
|
| Current liabilities | | (5,700 | ) | | (5,360 | ) | | (300 | ) | | (310 | ) | | (17 | ) | | (8 | ) |
| Noncurrent liabilities | | (37,018 | ) | | (21,263 | ) | | (1,004 | ) | | (481 | ) | | (490 | ) | | (626 | ) |
| Total | | $ | (42,718 | ) | | $ | (26,623 | ) | | $ | (1,304 | ) | | $ | (791 | ) | | $ | (507 | ) | | $ | (634 | ) |
| Amounts recognized in balance sheet | | | | | | | | | | | | |
| Total net (gain) loss | | $ | 48,720 |
| | $ | 25,900 |
| | $ | 2,154 |
| | $ | 1,587 |
| | $ | 90 |
| | $ | 96 |
|
| Transition (asset) obligation | | — |
| | — |
| | — |
| | — |
| | — |
| | — |
|
| Prior service cost (credit) | | — |
| | — |
| | 53 |
| | 71 |
| | — |
| | — |
|
| Total accumulated OCI (not adjusted for applicable tax) | | $ | 48,720 |
| | $ | 25,900 |
| | $ | 2,207 |
| | $ | 1,658 |
| | $ | 90 |
| | $ | 96 |
|
| Weighted average assumptions used to determine benefit obligations | | | | | | | | | | | | |
| Discount rate | | 4.55 | % | | 5.60 | % | | 4.55 | % | | 5.60 | % | | 4.55 | % | | 5.60 | % |
| Rate of compensation increase | | N/A |
| | 3.00 | % | | N/A |
| | N/A |
| | N/A |
| | 3.00 | % |
Components of Net Periodic Benefit Cost and
Other Changes Recognized in Other Comprehensive Income (Loss) (OCI) | | | | | | | | | | | | | | | | | | | | | | | |
| | | Farmer Bros. Plan
June 30, | | | Brewmatic Plan
June 30, | | | Hourly Employees’ Plan
June 30, |
| | | 2010 | | | 2009 | | | 2010 | | | 2009 | | | 2010 | | | 2009 |
| | | (In thousands) | | | (In thousands) | | | (In thousands) |
Components of net periodic benefit cost | | | | | | | | | | | | | | | | | | | | | | | |
Service cost | | $ | 4,340 | | | $ | 2,757 | | | $ | 48 | | | $ | 47 | | | $ | 519 | | | $ | — |
Interest cost | | | 5,899 | | | | 5,689 | | | | 208 | | | | 219 | | | | — | | | | — |
Expected return on plan assets | | | (4,642 | ) | | | (6,793 | ) | | | (175 | ) | | | (282 | ) | | | — | | | | — |
Amortization of net (gain)/loss | | | 3,291 | | | | 535 | | | | 131 | | | | 45 | | | | — | | | | — |
Amortization of prior service cost/(credit) | | | 146 | | | | 146 | | | | 19 | | | | 55 | | | | — | | | | — |
| | | | | | | | | | | | | | | | | | | | | | | |
Net periodic benefit cost | | $ | 9,034 | | | $ | 2,334 | | | $ | 231 | | | $ | 84 | | | $ | 519 | | | $ | — |
Other changes recognized in OCI | | | | | | | | | | | | | | | | | | | | | | | |
Net (gain)/loss | | $ | 4,003 | | | $ | 34,271 | | | $ | 82 | | | $ | 1,314 | | | $ | 59 | | | $ | — |
Prior service cost/(credit) | | | — | | | | — | | | | — | | | | — | | | | — | | | | — |
Amortization of net gain/(loss) | | | (3,291 | ) | | | (535 | ) | | | (131 | ) | | | (45 | ) | | | — | | | | — |
Amortization of transition asset/(obligation) | | | — | | | | — | | | | — | | | | — | | | | — | | | | — |
Amortization of prior service (cost)/credit | | | (146 | ) | | | (146 | ) | | | (19 | ) | | | (55 | ) | | | — | | | | — |
| | | | | | | | | | | | | | | | | | | | | | | |
Total recognized in other comprehensive income | | $ | 566 | | | $ | 33,590 | | | $ | (68 | ) | | $ | 1,214 | | | $ | 59 | | | $ | — |
Total recognized in net periodic benefit cost and OCI | | $ | 9,600 | | | $ | 35,924 | | | $ | 163 | | | $ | 1,298 | | | $ | 578 | | | $ | — |
Weighted-average assumptions used to determine net periodic benefit cost | | | | | | | | | | | | | | | | | | | | | | | |
Discount rate | | | 6.25 | % | | | 6.80 | % | | | 6.25 | % | | | 6.80 | % | | | 6.25 | % | | | N/A |
Expected long-term return on plan assets | | | 8.25 | % | | | 8.25 | % | | | 8.25 | % | | | 8.25 | % | | | 8.25 | % | | | N/A |
Rate of compensation increase | | | 3.00 | % | | | 3.00 | % | | | N/A | | | | N/A | | | | 3.00 | % | | | N/A |
|
| | | | | | | | | | | | | | | | | | | | | | | | |
| | | Farmer Bros. Plan June 30, | | Brewmatic Plan June 30, | | Hourly Employees’ Plan June 30, |
| | | 2012 | | 2011 | | 2012 | | 2011 | | 2012 | | 2011 |
| | | (In thousands) | | (In thousands) | | (In thousands) |
| Components of net periodic benefit cost | | | | | | | | | | | | |
| Service cost | | $ | — |
| | $ | 4,609 |
| | $ | 39 |
| | $ | 57 |
| | $ | 456 |
| | $ | 409 |
|
| Interest cost | | 5,846 |
| | 5,999 |
| | 197 |
| | 199 |
| | 59 |
| | 32 |
|
| Expected return on plan assets | | (6,569 | ) | | (5,323 | ) | | (213 | ) | | (179 | ) | | (28 | ) | | (9 | ) |
| Amortization of net (gain) loss | | 570 |
| | 2,871 |
| | 87 |
| | 119 |
| | — |
| | — |
|
| Amortization of prior service cost (credit) | | — |
| | 122 |
| | 18 |
| | 18 |
| | — |
| | — |
|
| Amount recognized due to special event (curtailment) | | — |
| | 1,456 |
| | — |
| | — |
| | — |
| | — |
|
| Net periodic benefit cost | | $ | (153 | ) | | $ | 9,734 |
| | $ | 128 |
| | $ | 214 |
| | $ | 487 |
| | $ | 432 |
|
| Other changes recognized in OCI | | | | | | | | | | | | |
| Net (gain) loss | | $ | 23,389 |
| | $ | (12,705 | ) | | $ | 654 |
| | $ | (480 | ) | | $ | (6 | ) | | $ | 37 |
|
| Prior service cost (credit) | | — |
| | — |
| | — |
| | 7 |
| | — |
| | — |
|
| Amortization of net gain (loss) | | (570 | ) | | (2,871 | ) | | (87 | ) | | (119 | ) | | — |
| | — |
|
| Amortization of transition asset (obligation) | | — |
| | — |
| | — |
| | — |
| | — |
| | — |
|
| Amortization of prior service (cost) credit | | — |
| | (122 | ) | | (18 | ) | | (18 | ) | | — |
| | — |
|
| Amount recognized due to special event (curtailment) | | — |
| | (10,016 | ) | | — |
| | — |
| | — |
| | — |
|
| Total recognized in OCI | | $ | 22,819 |
| | $ | (25,714 | ) | | $ | 549 |
| | $ | (610 | ) | | $ | (6 | ) | | $ | 37 |
|
| Total recognized in net periodic benefit cost and OCI | | $ | 22,666 |
| | $ | (15,980 | ) | | $ | 677 |
| | $ | (396 | ) | | $ | 481 |
| | $ | 469 |
|
| Weighted-average assumptions used to determine net periodic benefit cost | | | | | | | | | | | | |
| Discount rate | | 5.60 | % | | 5.60 | % | | 5.60 | % | | 5.60 | % | | 5.60 | % | | 5.60 | % |
| Expected long-term return on plan assets | | 8.25 | % | | 8.25 | % | | 8.25 | % | | 8.25 | % | | 8.25 | % | | 8.25 | % |
| Rate of compensation increase | | N/A |
| | N/A |
| | N/A |
| | N/A |
| | 3.00 | % | | 3.00 | % |
All qualifying employees of the DSD Coffee Business who accepted the Company’s offer of employment were allowed to enroll in the Farmer Bros. Plan during March 2009.2009. Those who enrolled in the Farmer Bros. Plan were granted full service credit for plan vesting and eligibility but not for purposes of benefit accruals.
Basis Used to Determine Expected Long-term Return on Plan Assets
Historical and future projected returns of multiple asset classes were analyzed to develop a risk-free real rate of return and risk premiums for each asset class. The overall rate for each asset class was developed by combining a long-term inflation component, the risk-free real rate of return, and the associated risk premium. A weighted average rate was developed based on those overall rates and the target asset allocations of the plans.
Description of Investment Policy
The Company’s investment strategy is to build an efficient, well-diversified portfolio based on a long-term, strategic outlook of the investment markets. The investment markets outlook utilizes both the historical-based and forward-looking return forecasts to establish future return expectations for various asset classes. These return expectations are used to develop a core asset allocation based on the specific needs of each plan. The core asset allocation utilizes
investment portfolios of various asset classes and multiple investment managers in order to maximize the plan’s return while
minimizingproviding multiple layers of diversification to help minimize risk.
FARMER BROS. CO.
NOTES TO CONSOLIDATED FINANCIAL STATEMENTS—(Continued)
Additional Disclosures | | | | | | | | | | | | | | | | | | | | | | |
| | | Farmer Bros. Plan
June 30, | | | Brewmatic Plan
June 30, | | | Hourly Employees’ Plan
June 30, |
| | | 2010 | | | 2009 | | | 2010 | | | 2009 | | | 2010 | | 2009 |
| | | ($ In thousands) | | | ($ In thousands) | | | ($ In thousands) |
Comparison of obligations to plan assets | | | | | | | | | | | | | | | | | | | | | | |
Projected benefit obligation | | $ | 110,449 | | | $ | 96,652 | | | $ | 3,707 | | | $ | 3,476 | | | $ | 578 | | $ | — |
Accumulated benefit obligation | | $ | 101,280 | | | $ | 88,269 | | | $ | 3,707 | | | $ | 3,476 | | | $ | 574 | | $ | — |
Fair value of plan assets at measurement date | | $ | 63,462 | | | $ | 59,266 | | | $ | 2,490 | | | $ | 2,395 | | | $ | — | | $ | — |
Plan assets by category | | | | | | | | | | | | | | | | | | | | | | |
Equity securities | | $ | 44,398 | | | $ | 41,904 | | | $ | 1,675 | | | $ | 1,731 | | | | N/A | | | N/A |
Debt securities | | | 13,995 | | | | 12,464 | | | | 616 | | | | 459 | | | | N/A | | | N/A |
Real estate | | | 5,069 | | | | 4,898 | | | | 199 | | | | 205 | | | | N/A | | | N/A |
| | | | | | | | | | | | | | | | | | | | | | |
Total | | $ | 63,462 | | | $ | 59,266 | | | $ | 2,490 | | | $ | 2,395 | | | | N/A | | | N/A |
| | | | | | | | | | | | | | | | | | | | | | |
Plan assets by category | | | | | | | | | | | | | | | | | | | | | | |
Equity securities | | | 70 | % | | | 71 | % | | | 70 | % | | | 72 | % | | | N/A | | | N/A |
Debt securities | | | 22 | % | | | 21 | % | | | 22 | % | | | 19 | % | | | N/A | | | N/A |
Real estate | | | 8 | % | | | 8 | % | | | 8 | % | | | 9 | % | | | N/A | | | N/A |
| | | | | | | | | | | | | | | | | | | | | | |
Total | | | 100 | % | | | 100 | % | | | 100 | % | | | 100 | % | | | N/A | | | N/A |
| | | | | | | | | | | | | | | | | | | | | | |
|
| | | | | | | | | | | | | | | | | | | | | | | | |
| | | Farmer Bros. Plan June 30, | | Brewmatic Plan June 30, | | Hourly Employees’ Plan June 30, |
| | | 2012 | | 2011 | | 2012 | | 2011 | | 2012 | | 2011 |
| | | ($ In thousands) | | ($ In thousands) | | ($ In thousands) |
| Comparison of obligations to plan assets | | | | | | | | | | | | |
| Projected benefit obligation | | $ | 124,828 |
| | $ | 107,071 |
| | $ | 4,022 |
| | $ | 3,662 |
| | $ | 1,520 |
| | $ | 1,055 |
|
| Accumulated benefit obligation | | $ | 124,828 |
| | $ | 107,071 |
| | $ | 4,022 |
| | $ | 3,662 |
| | $ | 1,520 |
| | $ | 1,055 |
|
| Fair value of plan assets at measurement date | | $ | 82,110 |
| | $ | 80,448 |
| | $ | 2,718 |
| | $ | 2,871 |
| | $ | 1,013 |
| | $ | 421 |
|
| Plan assets by category | | | | | | | | | | | | |
| Equity securities | | $ | 53,396 |
| | $ | 56,792 |
| | $ | 1,767 |
| | $ | 2,016 |
| | $ | 686 |
| | $ | 297 |
|
| Debt securities | | 24,610 |
| | 18,945 |
| | 815 |
| | 688 |
| | 261 |
| | 99 |
|
| Real estate | | 4,104 |
| | 4,711 |
| | 136 |
| | 167 |
| | 66 |
| | 25 |
|
| Total | | $ | 82,110 |
| | $ | 80,448 |
| | $ | 2,718 |
| | $ | 2,871 |
| | $ | 1,013 |
| | $ | 421 |
|
| Plan assets by category | | | | | | | | | | | | |
| Equity securities | | 65 | % | | 70 | % | | 65 | % | | 70 | % | | 68 | % | | 70 | % |
| Debt securities | | 30 | % | | 24 | % | | 30 | % | | 24 | % | | 26 | % | | 24 | % |
| Real estate | | 5 | % | | 6 | % | | 5 | % | | 6 | % | | 6 | % | | 6 | % |
| Total | | 100 | % | | 100 | % | | 100 | % | | 100 | % | | 100 | % | | 100 | % |
As of June 30, 2010,2012, fair values of plan assets arewere as follows (in thousands): | | | | | | | | | | | | |
| | | Total | | Level 1 | | Level 2 | | Level 3 |
Farmer Bros. Plan | | $ | 63,462 | | $ | — | | $ | 60,315 | | $ | 3,147 |
Brewmatic Plan | | $ | 2,490 | | $ | — | | $ | 2,358 | | $ | 132 |
Hourly Employees’ Plan | | $ | — | | $ | — | | $ | — | | $ | — |
Approximately 95%follows:
|
| | | | | | | | | | | | | | | | |
| (In thousands) | | Total | | Level 1 | | Level 2 | | Level 3 |
| Farmer Bros. Plan | | $ | 82,110 |
| | $ | — |
| | $ | 78,006 |
| | $ | 4,104 |
|
| Brewmatic Plan | | $ | 2,718 |
| | $ | — |
| | $ | 2,582 |
| | $ | 136 |
|
| Hourly Employees’ Plan | | $ | 1,013 |
| | $ | — |
| | $ | 947 |
| | $ | 66 |
|
As of June 30, 2011, fair values of plan assets were as follows:
|
| | | | | | | | | | | | | | | | |
| (In thousands) | | Total | | Level 1 | | Level 2 | | Level 3 |
| Farmer Bros. Plan | | $ | 80,447 |
| | $ | — |
| | $ | 75,736 |
| | $ | 4,711 |
|
| Brewmatic Plan | | $ | 2,871 |
| | $ | — |
| | $ | 2,704 |
| | $ | 167 |
|
| Hourly Employees’ Plan | | $ | 421 |
| | $ | — |
| | $ | 396 |
| | $ | 25 |
|
As of June 30, 2012 and 2011, approximately 95.0% and 94.0%, respectively, of the assets in each of the Farmer Bros. Plan, and the Brewmatic Plan areand the Hourly Employees’ Plan were invested in pooled separate accounts which dodid not have publicly quoted prices. The pooled separate accounts invest in publicly traded mutual funds. The fair values of the mutual funds arewere publicly quoted pricing input (Level 1) and arewere used to determine the net asset value of the pooled separate accounts. Therefore, these assets have Level 2 pricing inputs.Approximately 5%
As of June 30, 2012 and 2011, approximately 5.0% and 6.0% respectively, of the assets in each of the Farmer Bros. Plan, and the Brewmatic Plan areand the Hourly Employees’ Plan were invested in commercial real estate and include mortgage loans which are backed by the associated properties. These underlying real estate investments have unobservable Level 3 pricing inputs. The fair value of the underlying real estate is estimated using discounted cash flow valuation models that utilize public real estate market data inputs such as transaction prices, market rents, vacancy levels, leasing absorption, market capitalization rates and discount rates. In addition, each property is appraised annually by an independent appraiser. The amounts and types of investments within plan assets did not change significantly from June 30, 2009.2011
FARMER BROS. CO..NOTES TO CONSOLIDATED FINANCIAL STATEMENTS—(Continued)
The following is a reconciliation of asset balances with Level 3 input pricing:
| | | | | | | | | | | | | | |
Plan | | Beginning
Balance | | Total Gains or
Losses | | | Ending Balance | | Unrealized
Gains or Losses | |
Farmer Bros. Plan | | $ | 3,458 | | $ | (311 | ) | | $ | 3,147 | | $ | (311 | ) |
Brewmatic Plan | | $ | 145 | | $ | (13 | ) | | $ | 132 | | $ | (13 | ) |
Hourly Employees’ Plan | | | N/A | | | N/A | | | | N/A | | | N/A | |
|
| | | | | | | | | | | | | | | | | | | | |
| | | Beginning Balance | | Total Gains | | Settlements | | Ending Balance | | Unrealized Gains |
| As of June 30, 2012 | | (In thousands) |
| Farmer Bros. Plan | | $ | 4,711 |
| | $ | 561 |
| | $ | (1,168 | ) | | $ | 4,104 |
| | $ | 561 |
|
| Brewmatic Plan | | $ | 167 |
| | $ | 19 |
| | $ | (50 | ) | | $ | 136 |
| | $ | 19 |
|
| Hourly Employees’ Plan | | $ | 25 |
| | $ | 5 |
| | $ | 36 |
| | $ | 66 |
| | $ | 5 |
|
|
| | | | | | | | | | | | | | | | | | | | |
| | | Beginning Balance | | Total Gains | | Settlements | | Ending Balance | | Unrealized Gains |
| As of June 30, 2011 | | (In thousands) |
| Farmer Bros. Plan | | $ | 3,147 |
| | $ | 652 |
| | $ | 912 |
| | $ | 4,711 |
| | $ | 652 |
|
| Brewmatic Plan | | $ | 132 |
| | $ | 28 |
| | $ | 7 |
| | $ | 167 |
| | $ | 28 |
|
| Hourly Employees’ Plan | | $ | — |
| | $ | — |
| | $ | 25 |
| | $ | 25 |
| | $ | — |
|
Target Plan Asset Allocation for Farmer Bros. Plan and Brewmatic Plan |
| | |
| | | Fiscal 2011 | 2013 |
U.S. large cap equity securities | | 42.735.8 | % |
U.S. small cap equity securities | | 8.09.2 | % |
International equity securities | | 16.815.0 | % |
Debt securities | | 24.030.0 | % |
Real estate | | 8.510.0 | % |
| | |
|
Total | | 100.0 | % |
| | | |
Estimated Amounts in
Other Comprehensive IncomeOCI Expected To Be Recognized
In fiscal 2011,2013, the Company expects to recognize $3.4$0.6 million as a component of net periodic benefit cost for the Farmer Bros. Plan, $0.1$0.2 million for the Brewmatic Plan, and $0$0.4 million for the Hourly Employees’ Plan.
Estimated Future Contributions and Refunds
In fiscal 2011,2013, the Company expects to contribute $4.5$3.9 million to the Farmer Bros. Plan, $28,000$0.4 million to the Brewmatic Plan, and $0.4$0.1 million to the Hourly Employees’ Plan. The Company is not aware of any refunds expected from postretirement plans.
Estimated Future Benefit Payments
The following benefit payments are expected to be paid over the next 10 fiscal years:
Estimated future benefit payments | | | | | | | | | |
Year ending | | Farmer Bros. Plan | | Brewmatic Plan | | Hourly Employees’
Plan |
| | | (In thousands) | | |
June 30, 2011 | | $ | 4,970 | | $ | 310 | | $ | 5 |
June 30, 2012 | | $ | 5,140 | | $ | 300 | | $ | 9 |
June 30, 2013 | | $ | 5,440 | | $ | 300 | | $ | 19 |
June 30, 2014 | | $ | 5,660 | | $ | 290 | | $ | 37 |
June 30, 2015 | | $ | 6,080 | | $ | 280 | | $ | 50 |
June 30, 2016 – June 30, 2020 | | $ | 37,900 | | $ | 1,430 | | $ | 570 |
|
| | | | | | | | | | | | |
| Year ending | | Farmer Bros. Plan | | Brewmatic Plan | | Hourly Employees’ Plan |
| | | (In thousands) |
| June 30, 2013 | | $ | 5,700 |
| | $ | 300 |
| | $ | 17 |
|
| June 30, 2014 | | $ | 5,840 |
| | $ | 290 |
| | $ | 31 |
|
| June 30, 2015 | | $ | 6,010 |
| | $ | 290 |
| | $ | 45 |
|
| June 30, 2016 | | $ | 6,200 |
| | $ | 290 |
| | $ | 61 |
|
| June 30, 2017 | | $ | 6,460 |
| | $ | 280 |
| | $ | 78 |
|
| June 30, 2018 to June 30, 2022 | | $ | 36,230 |
| | $ | 1,420 |
| | $ | 680 |
|
These amounts are based on current data and assumptions and reflect expected future service, as appropriate.
FARMER BROS. CO.
NOTES TO CONSOLIDATED FINANCIAL STATEMENTS—(Continued)
Defined Contribution
Multiemployer Pension Plans
The Company alsoparticipates in a multiemployer defined benefit pension plan, the Western Conference of Teamsters Pension Plan (“WCTPP”), that is union sponsored and collectively bargained for the benefit of certain employees subject to collective bargaining agreements. The Company makes contributions to WCTPP generally based on the number of hours worked by the participants in accordance with the provisions of negotiated labor contracts.
The risks of participating in multiemployer pension plans are different from single-employer plans in that: (i) assets contributed to a multiemployer plan by one employer may be used to provide benefits to employees of other participating employers; (ii) if a participating employer stops contributing to the plan, the unfunded obligations of the plan may be borne by the remaining participating employers; and (iii) if the Company stops participating in the multiemployer plan, the Company may be required to pay the plan an amount based on the underfunded status of the plan, referred to as a withdrawal liability.
The Company's participation in WCTPP is outlined in the table below. The Pension Protection Act (“PPA”) Zone Status available in the Company's fiscal year 2012 and fiscal year 2011 is for the plan's year ended December 31, 2010 and December 31, 2009, respectively. The zone status is based on information obtained from WCTPP and is certified by WCTPP's actuary. Among other factors, plans in the green zone are generally more than 80% funded. Based on WCTPP's annual report on Form 5500, WCTPP was 90.3% and 93.4% funded for its plan year beginning January 1, 2012 and 2011, respectively. The “FIP/RP Status Pending/Implemented” column indicates if a funding improvement plan (“FIP”) or a rehabilitation plan (“RP”) is either pending or has been implemented.
|
| | | | | | | | | | | | | | | |
| Pension Plan | | Employer Identification Number | | Pension Plan Number | | PPA Zone Status | | FIP/RP Status Pending/ Implemented | | Surcharge Imposed | | Expiration Date of Collective Bargaining Agreements |
|
| July 1, 2012 | | July 1, 2011 | |
|
| Western Conference of Teamsters Pension Plan | | 91-6145047 | | 001 | | Green | | Green | | No | | No | | January 2014 to August 2014 |
Based upon the most recent information available from the trustees managing WCTPP, the Company's share of the unfunded vested benefit liability for the plan was estimated to be approximately $7.7 million if the withdrawal had occurred in calendar year 2011. These estimates were calculated by the trustees managing WCTPP. Although the Company believes the most recent plan data available from WCTPP was used in computing this 2011 estimate, the actual withdrawal liability amount is subject to change based on, among other things, the plan's investment returns and benefit levels, interest rates, financial difficulty of other participating employers in the plan such as bankruptcy, and continued participation by the Company and other employers in the plan, each of which could impact the ultimate withdrawal liability.
If withdrawal liability were to be triggered, the withdrawal liability assessment can be paid in a lump sum or on a monthly basis. The amount of the monthly payment is determined as follows: Average number of hours reported to the pension plan trust during the three consecutive years with highest number of hours in the 10-year period prior to the withdrawal is multiplied by the highest hourly contribution rate during the 10-year period to determine the amount of withdrawal liability that has to be paid annually. The annual amount is divided by 12 to arrive at the monthly payment due. If monthly payments are elected, interest is assessed on the unpaid balance after 12 months at the rate of 7% per annum.
Effective October 2011, the Company withdrew from the defined benefit pension plan, United Teamsters Pension Fund, and replaced it with the defined contribution pension plan, “United Teamsters Annuity Fund” (“Annuity Fund”), for its employees covered by a certain collective bargaining agreement with a term expiring in 2014. The Company incurred no withdrawal liabilities related to the withdrawal from the United Teamsters Pension Fund. The Company's contributions to the Annuity Fund are based on the number of compensable hours worked by the Company's employees who participate in the Annuity Fund.
In fiscal 2012, the Company withdrew from the Labor Management Pension Fund and recorded a charge of $4.3 million associated with withdrawal from this plan, representing the present value of the estimated withdrawal liability expected to be paid in quarterly installments of $0.1 million over 80 quarters. Installment payments will commence once the final determination of the amount of withdrawal liability is established, which determination may take up to 24 months from the date of withdrawal from the pension plan. Upon withdrawal, the employees covered under this multiemployer pension plan were included in the Company's 401(k) plan (the “401(k) Plan”). The $4.3 million estimated withdrawal charge is included in the Company's consolidated statement of operations for the fiscal year ended June 30, 2012 as “Pension withdrawal expense” and in current and long-term liabilities on the Company's balance sheet at June 30, 2012. In the fourth quarter ended June 30, 2012, the Company paid a final settlement of $0.3 million towards withdrawal from the Central States Pension Fund that was part of the DSD Coffee Business acquisition and recorded the charge as "Pension withdrawal expense."
Future collective bargaining negotiations may result in the Company withdrawing from the remaining multiemployer pension plans for all its eligible employees. No in which it participates and, if successful, the Company may incur a withdrawal liability, the amount of which could be material to the Company's results of operations and cash flows.
Company contributions have been made nor were any required to be madethe multiemployer pension plans:
|
| | | | | | | | |
| (In thousands) | | WCTPP(1)(2)(3) | | All other Plans(4) |
| Fiscal Year Ended: | | | | |
| June 30, 2012 | | $ | 3,048 |
| | $ | 113 |
|
| June 30, 2011 | | $ | 2,929 |
| | $ | 254 |
|
| June 30, 2010 | | $ | 2,820 |
| | $ | 282 |
|
____________
| |
| (1) | Individually significant plan. |
| |
| (2) | Less than 5% of total contribution to WCTPP based on WCTPP's most recent annual report on Form 5500 for the calendar year ended December 31, 2010. |
| |
| (3) | The Company guarantees that one hundred seventy-three (173) hours will be contributed upon for all employees who are compensated for all available straight time hours for each calendar month. An additional 6.5% of the basic contribution must be paid for PEER or the Program for Enhanced Early Retirement. |
| |
| (4) | Includes plans that are not individually significant. |
For the fiscal year ending June 30, 2013, the Company expects to thesemake $3.2 million in contributions to multiemployer pension plans.
Multiemployer Plans Other Than Pension Plans
The Company participates in nine defined contribution multiemployer plans duringother than pension plans that provide medical, vision and dental healthcare and disability benefits for certain retirees subject to collective bargaining agreements who meet the eligibility rules in effect when they retire and/or qualified members of their families. The plans are subject to the provisions of the Employee Retirement Income Security Act of 1974, and provide that participating employers make monthly contributions to the plans in an amount as specified in the collective bargaining agreements. Also, the plans provide that retired participants make self-payments to the plans, the amounts of which are fixed from time to time by the boards of trustees of the plans. The Company's participation in these plans is governed by the collective bargaining agreements which expire on or before September 2014. The Company's contributions in the fiscal years ended June 30, 2012, 2011 and 2010 2009were $5.8 million, $5.4 million and $4.8 million, respectively. The Company expects to contribute $6.4 million towards multiemployer plans other than pension plans in fiscal 2013.
401(k) Plan
The Company's 401(k) Plan is available to all eligible employees who have worked more than 1,000 hours during a calendar year and were employed at the end of the calendar year. Participants in the 401(k) Plan may choose to contribute 1% to 15% of their annual pay subject to the maximum contribution allowed by the Internal Revenue Service. The Company's matching contribution is discretionary based on approval by the Company's Board of Directors. For the calendar years 2011 and 2012, the Company's Board of Directors approved a Company matching contribution of 50.0% of an employee's annual contribution to the 401(k) Plan, up to 6.0% of the employee's eligible income. The matching contributions (and any earnings thereon) vest at the rate of 20.0% for each of the participant's first 5 years of vesting service, so that a participant is fully vested in his or 2008. CBI’s definedher matching contribution plan was merged withaccount after 5 years of vesting service. A participant is automatically vested in the Farmer Bros. defined contribution plan duringevent of death, disability or attainment of age 65 while employed by the Company. Employees are 100% vested in their contributions. For employees subject to a collective bargaining agreement, the match is only available if so provided in the labor agreement.
The Company recorded matching contributions of $1.4 million and $0.1 million in operating expenses for the fiscal 2008.years ended June 30, 2012 and June 30, 2011.
No contributions were recorded in the Company's consolidated financial statements for the fiscal year ended June 30, 2010. The Company sponsors
defined benefitan unfunded postretirement medical,
dental and
dental plansvision plan that
covercovers qualified non-union
employees and retirees and certain
qualified union
locals. Theretirees. Under this postretirement plan,
is contributory and retireethe Company’s contributions
are fixed at a current level. The plan is not funded. Effective January 1, 2008, the Company adopted a new plantoward premiums for retiree medical,
benefits. The new plan is a cost sharing approach between the Companydental and
covered employeesvision coverage for participants and dependents
in which theare scaled based on length of service, with greater Company
subsidizes a larger proportion of covered expensescontributions for retirees
who were long-term employees, and provides less coverage for retirees who were short-term employees. Additionally, the plan establisheswith greater length of service, but subject to a maximum
monthly Company contribution.
The following table shows the components of net periodic postretirement benefit cost for the fiscal years ended June 30, 20102012 and 2009. Fiscal 2010 postretirement cost/2011. Postretirement cost (income) for fiscal 2012 was based on employee census information as of July 1, 20092011 and asset information as of June 30, 2009. | | | | | | | | |
Components of Net Periodic Postretirement Benefit Cost | | June 30, | |
| | | 2010 | | | 2009 | |
| | | (In thousands) | |
Service cost | | $ | 1,490 | | | $ | 788 | |
Interest cost | | | 1,239 | | | | 1,278 | |
Expected return on plan assets | | | — | | | | — | |
Amortization of unrecognized net gain | | | (1,032 | ) | | | (1,082 | ) |
Amortization of unrecognized transition (asset)/obligation | | | — | | | | — | |
Amortization of unrecognized prior service cost/(credit) | | | (230 | ) | | | (230 | ) |
| | | | | | | | |
Net periodic benefit cost | | $ | 1,467 | | | $ | 754 | |
| | | | | | | | |
2012
. |
| | | | | | | | |
| | | June 30, |
| | | 2012 | | 2011 |
| Components of Net Periodic Postretirement Benefit Cost | | (In thousands) |
| Service cost | | $ | 1,634 |
| | $ | 1,564 |
|
| Interest cost | | 1,319 |
| | 1,205 |
|
| Expected return on plan assets | | — |
| | — |
|
| Amortization of net gain | | (794 | ) | | (802 | ) |
| Amortization of unrecognized transition (asset) obligation | | — |
| | — |
|
| Amortization of prior service cost (credit) | | (230 | ) | | (230 | ) |
| Net periodic benefit cost | | $ | 1,929 |
| | $ | 1,737 |
|
The difference between the assets and the Accumulated Postretirement Benefit Obligation (APBO) at the adoption of ASC 715-60, "Defined Benefit Plans-Other Postretirement," was established as a transition (asset)/obligation and is amortized over the average expected future service for active employees as measured at the date of adoption. Any plan amendments that retroactively increase benefits create prior service cost. The increase in the APBO due to any plan amendment is established as a base and amortized over the average remaining years of service to the full eligibility date of active participants who are not yet fully eligible for benefits at the plan amendment date. Gains and losses due to experience different than that assumed or from changes in actuarial assumptions are not immediately recognized. The tables below show the remaining bases for the transition (asset)/obligation, prior service cost/cost (credit), and the calculation of the amortizable gain or loss.FARMER BROS. CO.
NOTES TO CONSOLIDATED FINANCIAL STATEMENTS—(Continued)
|
| | |
Amortization Schedule | | |
Transition (Asset)/Obligation | | Obligation: The transition (asset) obligations have been fully amortized. |
The transition (asset)/obligations have been fully amortized.
Prior Service
Cost/Cost (Credit) (dollars in thousands):
| | | | | | | | | | | | | | | | |
Date Established | | Balance at
July 1, 2009 | | | Annual
Amortization | | | Years Remaining | | Curtailment | | Balance at
June 30, 2010 | |
January 1, 2008 | | $ | (2,344 | ) | | $ | (230 | ) | | 10.18 | | 0 | | $ | (2,114 | ) |
| | | | |
Amortization of Net (Gain)/Loss (dollars in thousands) | | | |
Net (gain)/loss as of July 1, 2009 | | $ | (16,510 | ) |
Asset (gains)/losses not yet recognized in market related value of assets | | | — | |
| | | | |
Net (gain)/loss subject to amortization | | $ | (16,510 | ) |
Corridor (10% of greater of APBO or assets) | | | 1,922 | |
| | | | |
Net (gain)/loss in excess of corridor | | $ | (14,588 | ) |
| | | | |
Amortization years | | | 14.14 | |
Amortization of net (gain)/loss for the year | | $ | (1,032 | ) |
|
| | | | | | | | | | | | | | | | | | |
| Date Established | | Balance at July 1, 2011 | | Annual Amortization | | Years Remaining | | Curtailment | | Balance at June 30, 2012 |
| January 1, 2008 | | $ | (1,884 | ) | | $ | 230 |
| | 8.20 |
| | — |
| | $ | (1,654 | ) |
|
| | | | |
| Amortization of Net (Gain) Loss (dollars in thousands): | | |
| Net (gain) loss as of July 1, 2011 | | $ | (12,086 | ) |
| Asset (gains) losses not yet recognized in market related value of assets | | — |
|
| Net (gain) loss subject to amortization | | $ | (12,086 | ) |
| Corridor (10% of greater of APBO or assets) | | 2,473 |
|
| Net (gain) loss in excess of corridor | | $ | (9,613 | ) |
| Amortization years | | 12.11 |
|
| Amortization of net (gain) loss for the year | | $ | (794 | ) |
The following tables provide a reconciliation of the benefit obligation and plan assets: | | | | | | | | |
| | | Year Ended June 30, | |
Change in Benefit Obligation | | 2010 | | | 2009 | |
| | | (In thousands) | |
Projected benefit obligation at beginning of year | | $ | 19,222 | | | $ | 18,631 | |
Service cost | | | 1,490 | | | | 788 | |
Interest cost | | | 1,239 | | | | 1,278 | |
Losses (gains) | | | 2,969 | | | | (601 | ) |
Benefits paid | | | (1,659 | ) | | | (874 | ) |
| | | | | | | | |
Projected benefit obligation at end of year | | $ | 23,261 | | | $ | 19,222 | |
| | | | | | | | |
| | | | | | | | |
| | | Year Ended June 30, | |
Change in Plan Assets | | 2010 | | | 2009 | |
| | | (In thousands) | |
Fair value of plan assets at beginning of year | | $ | — | | | $ | — | |
Actual return on assets | | | — | | | | — | |
Employer contributions | | | 1,659 | | | | 874 | |
Benefits paid | | | (1,659 | ) | | | (874 | ) |
| | | | | | | | |
Fair value of plan assets at end of year | | $ | — | | | $ | — | |
Funded status of plan | | $ | (23,261 | ) | | $ | (19,222 | ) |
| | | | | | | | |
| | | | | | |
| | | As of June 30, |
Amounts Recognized in the Balance Sheet Consist of: | | 2010 | | 2009 |
| | | (In thousands) |
Noncurrent assets | | $ | — | | $ | — |
Current liabilities | | | 1,076 | | | 963 |
Noncurrent liabilities | | | 22,185 | | | 18,259 |
| | | | | | |
Total | | $ | 23,261 | | $ | 19,222 |
|
| | | | | | | | |
| | | Year Ended June 30, |
| | | 2012 | | 2011 |
| Change in Benefit Obligation | | (In thousands) |
| Projected benefit obligation at beginning of year | | $ | 24,733 |
| | $ | 23,261 |
|
| Service cost | | 1,634 |
| | 1,564 |
|
| Interest cost | | 1,319 |
| | 1,205 |
|
| Participant contributions | | 665 |
| | 1,103 |
|
| Losses (gains) | | 8,953 |
| | (378 | ) |
| Benefits paid | | (1,384 | ) | | (2,022 | ) |
| Projected benefit obligation at end of year | | $ | 35,920 |
| | $ | 24,733 |
|
|
| | | | | | | | |
| | | Year Ended June 30, |
| | | 2012 | | 2011 |
| Change in Plan Assets | | (In thousands) |
| Fair value of plan assets at beginning of year | | $ | — |
| | $ | — |
|
| Actual return on assets | | — |
| | — |
|
| Employer contributions | | 719 |
| | 919 |
|
| Participant contributions | | 665 |
| | 1,103 |
|
| Benefits paid | | (1,384 | ) | | (2,022 | ) |
| Fair value of plan assets at end of year | | $ | — |
| | $ | — |
|
| Funded status of plan | | $ | (35,920 | ) | | $ | (24,733 | ) |
|
| | | | | | | | |
| | | As of June 30, |
| | | 2012 | | 2011 |
| Amounts Recognized in the Balance Sheet Consist of: | | (In thousands) |
| Noncurrent assets | | $ | — |
| | $ | — |
|
| Current liabilities | | 1,363 |
| | 1,148 |
|
| Noncurrent liabilities | | 34,557 |
| | 23,585 |
|
| Total | | $ | 35,920 |
| | $ | 24,733 |
|
|
| | | | | | | | |
| | | Year Ended June 30, |
| | 2012 | | 2011 |
Amounts Recognized in Accumulated OCI
Consist of: | | (In thousands) |
| Net gain | | $ | (2,338 | ) | | $ | (12,086 | ) |
| Transition obligation | | — |
| | — |
|
| Prior service credit | | (1,654 | ) | | (1,884 | ) |
| Total accumulated OCI | | $ | (3,992 | ) | | $ | (13,970 | ) |
|
| | | | | | | | |
| | | Year Ended June 30, |
| | | 2012 | | 2011 |
| Other Changes in Plan Assets and Benefit Obligations Recognized in OCI | | (In thousands) |
| Unrecognized actuarial loss (gain) | | $ | 8,953 |
| | $ | (379 | ) |
| Unrecognized transition (asset) obligation | | — |
| | — |
|
| Unrecognized prior service cost | | — |
| | — |
|
| Amortization of net loss | | 794 |
| | 802 |
|
| Amortization of prior service cost | | 230 |
| | 230 |
|
| Total recognized in OCI | | 9,977 |
| | 653 |
|
| Net periodic benefit cost | | 1,929 |
| | 1,737 |
|
| Total recognized in OCI and net periodic benefit cost | | $ | 11,906 |
| | $ | 2,390 |
|
FARMER BROS. CO.NOTES TO CONSOLIDATED FINANCIAL STATEMENTS—(Continued)
| | | | | | | | |
| | | Year Ended June 30, | |
Amounts Recognized in Accumulated Other Comprehensive Income
Consist of: | | 2010 | | | 2009 | |
| | | (In thousands) | |
Net gain | | $ | (12,509 | ) | | $ | (16,510 | ) |
Transition obligation | | | — | | | | — | |
Prior service credit | | | (2,114 | ) | | | (2,344 | ) |
| | | | | | | | |
Total accumulated other comprehensive income | | $ | (14,623 | ) | | $ | (18,854 | ) |
| | | | | | | |
| | | Year Ended June 30, | |
Other Changes in Plan Assets and Benefit Obligations Recognized in Other Comprehensive
Income | | 2010 | | 2009 | |
| | | (In thousands) | |
Unrecognized actuarial loss/(gain) | | $ | 2,969 | | $ | (601 | ) |
Unrecognized transition (asset)/obligation | | | — | | | — | |
Unrecognized prior service cost | | | — | | | — | |
Amortization of net loss | | | 1,032 | | | 1,082 | |
Amortization of prior service cost | | | 230 | | | 230 | |
| | | | | | | |
Total recognized in other comprehensive income | | | 4,231 | | | 711 | |
Net periodic benefit cost | | | 1,467 | | | 754 | |
| | | | | | | |
Total recognized in other comprehensive income and net periodic benefit cost | | $ | 5,698 | | $ | 1,465 | |
| | | | | | | |
The estimated net gain and prior service cost credit that will be amortized from accumulated other comprehensive incomeOCI into net periodic benefit cost in fiscal 20112013 are $0.7$0.8 million and $0.2$0.2 million, respectively.
| | | |
Estimated Future Benefit Payments (in thousands) | | |
Fiscal 2011 | | $ | 1,076 |
Fiscal 2012 | | $ | 1,146 |
Fiscal 2013 | | $ | 1,227 |
Fiscal 2014 | | $ | 1,330 |
Fiscal 2015 | | $ | 1,523 |
Fiscal 2016-2020 | | $ | 9,903 |
| |
Expected Contributions for the Year ending June 30, 2011 (in thousands) | | |
Fiscal 2011 | | $ | 1,076 |
|
| | | |
| | |
| Estimated Future Benefit Payments (in thousands) | |
| Fiscal 2013 | $ | 1,363 |
|
| Fiscal 2014 | $ | 1,450 |
|
| Fiscal 2015 | $ | 1,846 |
|
| Fiscal 2016 | $ | 2,106 |
|
| Fiscal 2017 | $ | 2,362 |
|
| Fiscal 2018-2022 | $ | 15,559 |
|
| | |
| | |
| | |
| Expected Contributions (in thousands) | |
| Fiscal 2013 | $ | 1,363 |
|
Sensitivity in Fiscal 20102012 Results Assumed health care cost trend rates have a significant effect on the amounts reported for the health care plan. A one percentage point change in assumed health care cost trend rates would have the following effects in fiscal 20112012 (in thousands): | | | | | | | |
| | | 1-Percentage Point | |
| | | Increase | | Decrease | |
Effect on total of service and interest cost components | | $ | 466 | | $ | (373 | ) |
Effect on accumulated postretirement benefit obligation | | $ | 3,320 | | $ | (2,722 | ) |
|
| | | | | | | | |
| | | 1-Percentage Point |
| | | Increase | | Decrease |
| Effect on total of service and interest cost components | | $ | 81 |
| | $ | (89 | ) |
| Effect on accumulated postretirement benefit obligation | | $ | 1,816 |
| | $ | (1,854 | ) |
Farmer Bros. Co.
FARMER BROS. CO.Notes to Consolidated Financial Statements (continued)NOTES TO CONSOLIDATED FINANCIAL STATEMENTS—(Continued)
On March 2, 2009,September 12, 2011, the Company and its wholly owned subsidiary, CBI, as Borrowers, entered into aan Amended and Restated Loan and Security Agreement (the “Loan Agreement”) among the Company and Coffee Bean International, Inc. (“CBI”), withas Borrowers, certain of the Company’s other subsidiaries, as Guarantors, the Lenders party thereto, and Wells Fargo Bank, National Association, successor by merger to Wachovia Bank, National Association (“Wells Fargo”), as Lender, providingAgent.
The Loan Agreement provides for a $50 million senior secured revolving credit facility expiring in February 2012of up to help finance the DSD Coffee Business acquisition$85.0 million, with a letter of credit sublimit of $20.0 million. The revolving credit facility provides for advances of 85% of eligible accounts receivable and 75% of eligible inventory (subject to a $60.0 million inventory loan limit), as defined. The Loan Agreement provides for general corporate purposes.All outstandinginterest rates based on modified Monthly Average Excess Availability levels with a range of
PRIME + 0.25% to PRIME + 0.75% or Adjusted Eurodollar Rate + 2.0% to Adjusted Eurodollar Rate + 2.5%. The Loan Agreement has an amendment fee of 0.375% and an unused line fee of 0.25%. Outstanding obligations under the Loan Agreement are collateralized by perfected security interests in the assetsall of the Borrowers, excludingBorrowers’ assets, including the Company’s preferred stock held in investment accounts. The revolving line provides for advances of 85% of eligible accounts receivable and 65% of eligible inventory, as defined.portfolio. The Loan Agreement hasexpires on March 2, 2015. The Loan Agreement contains a variety of affirmative and negative covenants of types customary in an unusedasset-based lending facility, including those relating to reporting requirements, maintenance of records, properties and corporate existence, compliance with laws, incurrence of other indebtedness and liens, limitations on certain payments, including the payment of dividends and capital expenditures, and transactions and extraordinary corporate events. The Loan Agreement allows the Company to pay dividends, subject to certain liquidity requirements. The Loan Agreement also contains financial covenants requiring the Borrowers to maintain minimum Excess Availability and Total Liquidity levels. The Loan Agreement allows the Lender to establish reserve requirements, which may reduce the amount of credit otherwise available to the Company, to reflect events, conditions, or risks that would have a reasonable likelihood of adversely affecting the Lender’s collateral or the Company’s assets, including the Company’s green coffee inventory.
On January 9, 2012, the Loan Agreement was amended (“Amendment No. 1”) in connection with JPMorgan Chase Bank, N.A. (“JPMorgan Chase”), becoming an additional Lender thereunder. Pursuant to Amendment No. 1, Wells Fargo will provide a commitment fee of 0.375%$60.0 million and JPMorgan Chase will provide a commitment of $25.0 million. The interest rate was 3.75% at
On June 30, 2010.2012, the Company was eligible to borrow up to a total of $72.6 million under the credit facility. As of June 30, 2010,2012, the Company had borrowed $37.2outstanding borrowings of $29.1 million, excluding loan extension fees of $0.2 million, utilized $3.1$11.9 million of theits letters of credit sub-limit,sublimit, and had excess availability under the credit facility of $9.7 million.On August 31, 2010,
$31.4 million. Due to the Companyshort-term nature of the credit facility and its wholly owned subsidiaries entered into Amendment No. 4 to Loan and Security Agreement (the “Amendment”) with Wells Fargo pursuant to which effective March 31, 2010, certain collateral reporting, dividend payment, and financial covenants were modified. Effective September 1, 2010, the Amendment also amendedvariable interest rate, fair value of the rangebalance outstanding approximates carrying value. As of June 30, 2012, the interest ratesrate on the line usage based on modified Monthly Average Excess Availability levels. The range is PRIME + 0.25% to PRIME + 0.75% or Adjusted Eurodollar Rate + 2.5% to Adjusted Eurodollar Rate + 3.0% (also see Note 17 “Subsequent Event”)Company’s outstanding borrowings under the credit facility was 3.5%. As of June 30, 2010,2012, the Company was in compliance with all restrictive covenants.covenants under the credit facility. There can be no assurance that the Company’s lenderLender will issue a waiver or grant an amendment to the covenants in future periods, if the Company required one. Note
10.9. Employee Stock Ownership Plan
The Company’s ESOP was established in 2000 to provide benefits to all employees.. The plan is a leveraged ESOP in which the Company is the lender. The loans will be repaid from the Company’s discretionary plan contributions over the original fifteen15 year terms with a variable rate of interest. The annual interest rate was 1.83%1.66% at June 30, 2010,2012, which is updated on a quarterly basis. | | | | | | | | | |
| | | As of and for the years ended
June 30, |
| | | 2010 | | 2009 | | 2008 |
Loan amount (in thousands) | | $ | 35,238 | | $ | 40,039 | | $ | 44,840 |
Shares purchased | | | — | | | — | | | — |
|
| | | | | | | | | | | | |
| | | As of and for the years ended June 30, |
| | | 2012 | | 2011 | | 2010 |
| Loan amount (in thousands) | | $ | 25,637 |
| | $ | 30,437 |
| | $ | 35,238 |
|
| Shares purchased | | — |
| | — |
| | — |
|
Shares are held by the plan trustee for allocation among participants as the loan is repaid. The unencumbered shares are allocated to participants using a compensation-based formula. Subject to vesting requirements, allocated shares are owned by participants and shares are held by the plan trustee until the participant retires.
In fiscal 2011 and 2010, the Company used $1.3 million and $0.7 million, respectively, of the dividends on ESOP shares to pay down the loans, and allocated to the ESOP participants shares equivalent to the fair market value of the dividends they would have received. No dividends were paid in fiscal 2012. In fiscal 2011, the Company issued 1,040 shares of common stock to the ESOP to compensate for a shortfall in unallocated, uncommitted shares.
The Company reports compensation expense equal to the fair market
pricevalue of shares committed to be released to employees in the period in which they are committed. The cost of shares purchased by the ESOP which have not been committed to be released or allocated to participants are shown as a contra-equity account “Unearned ESOP Shares” and are excluded from earnings per share calculations.
FARMER BROS. CO.NOTES TO CONSOLIDATED FINANCIAL STATEMENTS—(Continued)
During the fiscal years ended June 30, 2010, 20092012, 2011 and 2008,2010, the Company charged $3.7$1.5 million $4.8, $2.6 million and $5.7$3.7 million to compensation expense related to the ESOP. The difference between cost and fair market value of committed to be released shares, which was $(0.2)$0.1 million $(0.2), $(1.4) million and $(0.4)$(0.2) million for the fiscal years ended June 30, 2010, 20092012, 2011 and 2008,2010, respectively, is recorded as additional paid-in capital.
| | | | | | |
| | | June 30, |
| | | 2010 | | 2009 |
Allocated shares | | | 1,680,793 | | | 1,497,454 |
Committed to be released shares | | | 192,069 | | | 202,897 |
Unallocated shares | | | 1,283,719 | | | 1,475,787 |
| | | | | | |
Total ESOP shares | | | 3,156,581 | | | 3,176,138 |
| | | | | | |
| |
| | | (In thousands) |
Fair value of ESOP shares | | $ | 47,633 | | $ | 72,670 |
|
| | | | | | | | |
| | | June 30, |
| | | 2012 | | 2011 |
| Allocated shares | | 1,763,742 |
| | 1,533,578 |
|
| Committed to be released shares | | 185,538 |
| | 186,582 |
|
| Unallocated shares | | 911,599 |
| | 1,097,136 |
|
| Total ESOP shares | | 2,860,879 |
| | 2,817,296 |
|
| | | | | |
| | | | | |
| | | (In thousands) |
| Fair value of ESOP shares | | $ | 22,773 |
| | $ | 28,567 |
|
Note
11.10. Share-based Compensation
On August 23, 2007, the Company’s Board of Directors approved the Farmer Bros. Co. 2007 Omnibus Plan (the “Omnibus Plan”), which was approved by stockholders on December 6, 2007.2007. Prior to adoption of the Omnibus Plan the Company had no share-based compensation plan. Awards issued under the Omnibus Plan may take the form of stock options, stock appreciation rights, restricted stock, restricted stock units, dividend equivalents, performance-based awards, stock payments, cash-based awards or other incentives payable in cash or shares of stock, or any combination thereof. Each award will be set forth in a separate agreement with the person receiving the award and will indicate the type, terms and conditions of the award. The maximum number of shares of common stock as to which awards may be granted under the Omnibus Plan is 1,000,000, subject to adjustment as provided in the Omnibus Plan. The Company measures and recognizes compensation expense for all share-based payment awards made under the Omnibus Plan based on estimated fair values.
The Company estimates the fair value of share-based payment awards on the date of grant using an option-pricing model. The value of the portion of the award that is ultimately expected to vest is recognized as expense over the requisite service period in the Company’s consolidated
statementstatements of operations.
Prior to fiscal 2008, the Company did not have share-based compensation.Share-based compensation expense recognized during the period is based on the value of the portion of share-based payment awards that is ultimately expected to vest during the period. Compensation expense recognized for all stock option awards granted is recognized using the straight-line method over the vesting period. The options generally vest ratably over a period of three years. 3 years, however, fiscal 2012 grants included nonqualified stock option awards to executive officers with different vesting periods, in each case, subject to certain events of acceleration as provided in the applicable employment agreement or award agreement with the executive officer.
The share-based compensation expense recognized in the Company’s consolidated statement of operations for the fiscal years ended June 30, 2010, 20092012, 2011 and 20082010 is based on awards ultimately expected to vest. Currently, management estimates aan annual forfeiture rate of 6.5% based on actual forfeiture experience from the Company’s historical turnover.inception of the Omnibus Plan. Forfeitures are estimated at the time of grant and revised, if necessary, in subsequent periods if actual forfeitures differ from those estimates. The Company uses the Black-Scholes option valuation model, which requires management to make certain assumptions for estimating the fair value of stock options at the date of the grant. The Black-Scholes option valuation model was developed for use in estimating the fair value of traded options that have no vesting
FARMER BROS. CO.
NOTES TO CONSOLIDATED FINANCIAL STATEMENTS—(Continued)
restrictions and are fully transferable. In addition, option valuation models require the input of highly subjective assumptions including the expected stock price volatility. Because the Company’s stock options have characteristics significantly different from those of traded options, and because changes in the subjective input assumptions can materially affect the fair value estimates, in management’s opinion the existing models may not necessarily provide a reliable single measure of the fair value of the Company’s stock options. Although the fair value of stock options is determined using an option valuation model that value may not be indicative of the fair value observed in a willing buyer/willing seller market transaction.
The following are the weighted average assumptions used in the Black-Scholes valuation model: | | | | | | | | | | | | |
| | | Year Ended June 30, | |
| | | 2010 | | | 2009 | | | 2008 | |
Average fair value of options | | $ | 6.09 | | | $ | 6.68 | | | $ | 6.12 | |
Forfeiture rate | | | 6.50 | % | | | — | | | | — | |
Risk-free interest rate | | | 2.59 | % | | | 5.45 | % | | | 2.95 | % |
Dividend yield | | | 2.50 | % | | | 2.20 | % | | | 2.03 | % |
Average expected life | | | 6 years | | | | 5 years | | | | 5 years | |
Expected stock price volatility | | | 41.20 | % | | | 32.38 | % | | | 32.38 | % |
|
| | | | | | | | | | | | |
| | | Year Ended June 30, |
| | | 2012 | | 2011 | | 2010 |
| Average fair value of options | | $ | 4.42 |
| | $ | 7.05 |
| | $ | 6.09 |
|
| Forfeiture rate | | 6.5 | % | | 6.5 | % | | 6.5 | % |
| Risk-free interest rate | | 1.1 | % | | 2.7 | % | | 2.6 | % |
| Dividend yield | | — | % | | 1.3 | % | | 2.5 | % |
| Average expected life | | 6 years |
| | 6 years |
| | 6 years |
|
| Expected stock price volatility | | 52.5 | % | | 54.7 | % | | 41.2 | % |
The Company’s assumption regarding expected stock price volatility is based on the historical volatility of the Company’s stock price. The risk-free interest rate is based on U.S. Treasury zero-coupon issues at the date of grant with a remaining term equal to the expected life of the stock options.
The average expected life is based on the midpoint between the vesting date and the end of the contractual term of the award.
The following
tables summarizetable summarizes stock option activity
from adoption offor the
Omnibus Plan through June 30, 2010:three most recent fiscal years:
|
| | | | | | | | | | | |
| Outstanding Stock Options | | Number of Stock Options | | Weighted Average Exercise Price ($) | | Weighted Average Grant Date Fair Value ($) | | Weighted Average Remaining Life (Years) | | Aggregate Intrinsic Value (Dollars in thousands) |
| Outstanding at June 30, 2009 | | 239,000 |
| | 22.22 | | 6.41 | | 6.1 | | 60 |
| Granted | | 220,789 |
| | 18.25 | | 6.09 | | — | | — |
| Cancelled/Forfeited | | (54,846 | ) | | 21.65 | | 6.87 | | — | | — |
| Outstanding at June 30, 2010 | | 404,943 |
| | 20.17 | | 6.25 | | 5.8 | | — |
| Granted | | 327,656 |
| | 14.95 | | 7.05 | | — | | — |
| Cancelled/Forfeited | | (234,789 | ) | | 19.21 | | 6.97 | | — | | — |
| Outstanding at June 30, 2011 | | 497,810 |
| | 17.19 | | 6.44 | | 5.7 | | 61 |
| Granted | | 356,834 |
| | 8.90 | | 4.42 | | — | | — |
| Cancelled/Forfeited | | (187,409 | ) | | 16.89 | | 5.06 | | — | | — |
| Outstanding at June 30, 2012 | | 667,235 |
| | 12.84 | | 4.78 | | 4.8 | | 143 |
| Vested and exercisable, June 30, 2012 | | 323,996 |
| | 15.04 | | 5.39 | | 3.1 | | — |
| Vested and expected to vest, June 30, 2012 | | 641,455 |
| | 12.84 | | 4.80 | | 3.1 | | 128 |
Outstanding Stock Options | | | | | | | | | | | | | | |
| | | Number
of
Stock
Options | | | Weighted
Average
Exercise
Price | | Weighted
Average
Grant Date
Fair Value | | Weighted
Average
Remaining
Life
(Years) | | Aggregate
Intrinsic
Value
(In thousands) |
Outstanding at January 1, 2008 | | 0 | | | | | | | | | | | | |
Granted | | 117,500 | | | $ | 22.62 | | $ | 6.16 | | 6.6 | | $ | — |
| | | | | | | | | | | | | | |
Outstanding at June 30, 2008 | | 117,500 | | | $ | 22.62 | | $ | 6.16 | | 6.6 | | $ | — |
Granted | | 121,500 | | | $ | 21.76 | | $ | 6.68 | | — | | $ | 2 |
| | | | | | | | | | | | | | |
Outstanding at June 30, 2009 | | 239,000 | | | $ | 22.22 | | $ | 6.41 | | 6.1 | | $ | 60 |
Granted | | 220,789 | | | $ | 18.25 | | $ | 6.09 | | — | | $ | — |
Cancelled/Forfeited | | (54,846 | ) | | $ | 21.65 | | $ | 6.87 | | — | | $ | — |
| | | | | | | | | | | | | | |
Outstanding at June 30, 2010 | | 404,943 | | | $ | 20.17 | | $ | 6.25 | | 5.8 | | $ | — |
| | | | | | | | | | | | | | |
Vested and exercisable, June 30, 2010 | | 104,149 | | | $ | 22.35 | | $ | 6.34 | | 4.9 | | $ | — |
Vested and expected to vest, June 30, 2010 | | 384,112 | | | $ | 20.28 | | $ | 6.26 | | 5.8 | | $ | — |
FARMER BROS. CO.
NOTES TO CONSOLIDATED FINANCIAL STATEMENTS—(Continued)
Nonvested Stock Options
| | | | | | | | | | | |
| | | Number
of
Stock
Options | | | Weighted
Average
Exercise
Price | | Weighted
Average
Grant Date
Fair Value | | Weighted
Average
Remaining
Amortization
Period (Years) |
Outstanding at January 1, 2008 | | — | | | | | | | | | |
Granted | | 117,500 | | | $ | 22.62 | | $ | 6.16 | | — |
Vested | | — | | | | — | | | — | | — |
| | | | | | | | | | | |
Outstanding at June 30, 2008 | | 117,500 | | | $ | 22.62 | | $ | 6.16 | | — |
Granted | | 121,500 | | | $ | 21.76 | | $ | 6.68 | | — |
Vested | | (40,490 | ) | | $ | 22.66 | | $ | 6.16 | | — |
| | | | | | | | | | | |
Outstanding at June 30, 2009 | | 198,510 | | | $ | 22.13 | | $ | 6.46 | | 2.1 |
Granted | | 220,789 | | | $ | 18.25 | | $ | 6.09 | | — |
Vested | | (68,990 | ) | | $ | 22.20 | | $ | 6.43 | | — |
Cancelled/Forfeited | | (49,515 | ) | | $ | 21.21 | | $ | 6.35 | | — |
| | | | | | | | | | | |
Outstanding at June 30, 2010 | | 300,794 | | | $ | 19.42 | | $ | 6.22 | | 2.1 |
| | | | | | | | | | | |
The aggregate intrinsic values in the table above represent the total pretax intrinsic value, based on the Company’s closing stock price of $15.09$7.96 at June 29, 2012, $10.14 at June 30, 2011 and $15.09 at June 30, 2010 $22.88 at June 30, 2009 and $21.15 at June 30, 2008,, representing the last trading day of the respective years, which would have been received by award holders had all award holders exercised their awards that were in-the-money as of those dates. Total fair value of options vested during fiscal 2012, 2011 and 2010 was $1.2 million,
$0.7 million and $0.4 million, respectively.
|
| | | | | | | | | |
| Nonvested Stock Options | | Number of Stock Options | | Weighted Average Exercise Price ($) | | Weighted Average Grant Date Fair Value ($) | | Weighted Average Remaining Life (Years) |
| Outstanding at June 30, 2009 | | 198,510 |
| | 22.13 | | 6.46 | | 2.1 |
| Granted | | 220,789 |
| | 18.25 | | 6.09 | | — |
| Vested | | (68,990 | ) | | 22.20 | | 6.43 | | — |
| Cancelled/Forfeited | | (49,515 | ) | | 21.21 | | 6.35 | | — |
| Outstanding at June 30, 2010 | | 300,794 |
| | 19.42 | | 6.22 | | 2.1 |
| Granted | | 327,656 |
| | 14.95 | | 7.05 | | — |
| Vested | | (105,458 | ) | | 20.29 | | 6.30 | | — |
| Cancelled/Forfeited | | (200,123 | ) | | 18.74 | | 7.09 | | — |
| Outstanding at June 30, 2011 | | 322,869 |
| | 15.02 | | 6.50 | | 1.7 |
| Granted | | 356,834 |
| | 8.90 | | 4.42 | | — |
| Vested | | (243,518 | ) | | 13.00 | | 5.85 | | — |
| Cancelled/Forfeited | | (92,946 | ) | | 12.54 | | 5.80 | | — |
| Outstanding at June 30, 2012 | | 343,239 |
| | 10.76 | | 4.20 | | 6.3 |
As of June 30, 2010, June 30, 20092012, 2011 and 2008, respectively,2010, there was approximately $1.4$1.3 million $1.0, $1.5 million, and $0.5$1.4 million, respectively, of unrecognized compensation cost related to stock options. Compensation expense recognized in general and administrative expenseexpenses was $0.6$1.2 million $0.4, $0.7 million and $0.1$0.6 million for fiscal 2010, 20092012, 2011 and 2008,2010, respectively.FARMER BROS. CO.
NOTES TO CONSOLIDATED FINANCIAL STATEMENTS—(Continued)
During each of fiscal 2010, 2009,2012, 2011 and 20082010 the Company granted a total of 48,722142,070 shares, 26,10063,979 shares and 25,60048,722 shares of restricted stock, respectively, with a weighted average grant date fair value of $18.31, $21.76$7.70, $16.67 and $22.67$18.31 per share, respectively, to eligible employees, officers and directors under the Omnibus Plan. Shares of restricted stock generally vest at the end of three years for eligible employees and officers who are employees. The fiscal 2012 grants included awards to executive officers with different vesting periods, in each case, subject to accelerated vesting as provided in the applicable employment agreement or award agreement with the executive officer.
Shares of restricted stock generally vest ratably over a period of three years for directors and officers who are not employees. Compensation expense is recognized on a straight-line basis over the service period based on the estimated fair value of the restricted stock. Compensation expense recognized in general and administrative expense was $0.4$0.6 million $0.3, $0.5 million and $0.1$0.4 million respectively,, for the fiscal years ended June 30, 2010, 20092012, 2011 and 2008.2010, respectively. As of June 30, 2010, 20092012, 2011 and 2008,2010, there was approximately $0.9$1.3 million $0.8, $0.9 million and $0.5$0.9 million, respectively, of unrecognized compensation cost related to restricted stock.
The following tables summarize restricted stock activity from adoption of the Omnibus Plan through June 30, 2010:Outstanding Restricted Stock Awardsactivity:
| | | | | | | | | | | |
| | | Shares
Awarded | | | Weighted
Average
Grant Date
Fair Value | | Weighted
Average
Remaining
Life
(Years) | | Aggregate
Intrinsic
Value
(In thousands) |
Outstanding at January 1, 2008 | | — | | | | | | | | | |
Granted | | 25,600 | | | $ | 22.67 | | | | $ | 545.3 |
Exercised/Released | | — | | | | | | | | | |
Cancelled/Forfeited | | — | | | | | | | | | |
| | | | | | | | | | | |
Outstanding June 30, 2008 | | 25,600 | | | $ | 22.67 | | | | $ | 545.3 |
Granted | | 26,100 | | | $ | 21.76 | | | | $ | 568.2 |
Exercised/Released | | (3,031 | ) | | $ | 22.70 | | | | $ | 57.5 |
Cancelled/Forfeited | | (500 | ) | | $ | 21.76 | | | | $ | 11.4 |
| | | | | | | | | | | |
Outstanding at June 30, 2009 | | 48,169 | | | $ | 22.19 | | 2.1 | | $ | 1072.2 |
Granted | | 48,722 | | | $ | 18.31 | | | | $ | 892.0 |
Exercised/Released | | (5,860 | ) | | $ | 22.18 | | | | $ | 105.0 |
Cancelled/Forfeited | | (10,823 | ) | | $ | 21.79 | | | | $ | 235.0 |
| | | | | | | | | | | |
Outstanding at June 30, 2010 | | 80,208 | | | $ | 19.91 | | 2.0 | | $ | 1,210.0 |
| | | | | | | | | | | |
Vested and exercisable, June 30, 2010 | | — | | | | | | | | | |
Vested and expected to vest, June 30, 2010 | | 73,971 | | | $ | 20.05 | | 2.0 | | $ | 1,116.0 |
FARMER BROS. CO.
NOTES TO CONSOLIDATED FINANCIAL STATEMENTS—(Continued)
Nonvested Restricted Stock Awards
| | | | | | |
| | | Shares
Awarded | | | Weighted
Average
Grant Date
Fair Value |
Outstanding at January 1, 2008 | | — | | | | |
Granted | | 25,600 | | | $ | 22.67 |
Vested | | — | | | | |
Cancelled/Forfeited | | — | | | | |
| | | | | | |
Outstanding at June 30, 2008 | | 25,600 | | | $ | 22.67 |
Granted | | 26,100 | | | $ | 21.76 |
Vested | | (3,031 | ) | | $ | 22.70 |
Cancelled/Forfeited | | (500 | ) | | $ | 21.76 |
| | | | | | |
Outstanding at June 30, 2009 | | 48,169 | | | $ | 22.19 |
Granted | | 48,722 | | | $ | 18.31 |
Vested | | (5,860 | ) | | $ | 22.18 |
Cancelled/Forfeited | | (10,823 | ) | | $ | 21.49 |
| | | | | | |
Outstanding at June 30, 2010 | | 80,208 | | | $ | 19.91 |
| | | | | | |
|
| | | | | | | | | | | |
| Outstanding and Nonvested Restricted Stock Awards | | Shares Awarded | | Weighted Average Grant Date Fair Value ($) | | Weighted Average Remaining Life (Years) | | Aggregate Intrinsic Value ($ in thousands) |
| Outstanding at June 30, 2009 | | 48,169 |
| | 22.19 |
| | 2.1 | | 1,072 |
|
| Granted | | 48,722 |
| | 18.31 |
| | — | | 892 |
|
| Exercised/Released | | (5,860 | ) | | 22.18 |
| | — | | 105 |
|
| Cancelled/Forfeited | | (10,823 | ) | | 21.79 |
| | — | | 235 |
|
| Outstanding at June 30, 2010 | | 80,208 |
| | 19.91 |
| | 2.0 | | 1,210 |
|
| Granted | | 63,979 |
| | 16.67 |
| | — | | 1,066 |
|
| Exercised/Released | | (20,674 | ) | | 21.52 |
| | — | | 332 |
|
| Cancelled/Forfeited | | (42,826 | ) | | 19.19 |
| | — | | 497 |
|
| Outstanding at June 30, 2011 | | 80,687 |
| | 17.31 |
| | 2.6 | | 818 |
|
| Granted | | 142,070 |
| | 7.70 |
| | — | | 1,094 |
|
| Exercised/Released | | (27,227 | ) | | 15.80 |
| | — | | 202 |
|
| Cancelled/Forfeited | | (19,583 | ) | | 13.92 |
| | — | | — |
|
| Outstanding June 30, 2012 | | 175,947 |
| | 10.16 |
| | 1.9 | | 1,401 |
|
| Expected to vest, June 30, 2012 | | 143,819 |
| | 10.16 |
| | 1.9 | | 1,401 |
|
Note
12.11. Other Current Liabilities
Other current liabilities consist of the following: | | | | | | |
| | | June 30, |
| | | 2010 | | 2009 |
| | | (In thousands) |
Accrued workers’ compensation liabilities | | $ | 1,293 | | $ | 1,657 |
Dividends payable | | | 1,849 | | | 1,849 |
Postretirement medical liability | | | 1,076 | | | 963 |
Accrued pension liabilities | | | 5,285 | | | 4,830 |
Other (including net taxes payable) | | | 2,178 | | | 928 |
| | | | | | |
| | $ | 11,681 | | $ | 10,227 |
| | | | | | |
FARMER BROS. CO.
NOTES TO CONSOLIDATED FINANCIAL STATEMENTS—(Continued)
|
| | | | | | | | |
| | | June 30, |
| | | 2012 | | 2011 |
| | | (In thousands) |
| Accrued workers’ compensation liabilities | | $ | 1,244 |
| | $ | 1,320 |
|
| Dividends payable | | — |
| | 9 |
|
| Postretirement medical liability | | 1,363 |
| | 1,148 |
|
| Accrued pension liabilities | | 6,364 |
| | 5,678 |
|
| Other (including net taxes payable) | | 1,205 |
| | 3,727 |
|
| | | $ | 10,176 |
| | $ | 11,882 |
|
The current and deferred components of the provision for income taxes consist of the following: | | | | | | | | | | | | |
| | | June 30, | |
| | | 2010 | | | 2009 | | | 2008 | |
| | | (In thousands) | |
Current: | | | | | | | | | | | | |
Federal | | $ | (3,514 | ) | | $ | (1,433 | ) | | $ | (1,431 | ) |
State | | | 227 | | | | (5 | ) | | | (596 | ) |
| | | | | | | | | | | | |
Total current income tax benefit | | | (3,287 | ) | | | (1,439 | ) | | | (2,027 | ) |
Deferred: | | | | | | | | | | | | |
Federal | | | 629 | | | | 11,916 | | | | (3,924 | ) |
State | | | 129 | | | | 3,805 | | | | (1,449 | ) |
| | | | | | | | | | | | |
Total deferred expense (benefit) | | | 758 | | | | 15,721 | | | | (5,373 | ) |
| | | | | | | | | | | | |
Income tax (benefit) expense | | $ | (2,529 | ) | | $ | 14,283 | | | $ | (7,399 | ) |
| | | | | | | | | | | | |
|
| | | | | | | | | | | | |
| | | June 30, |
| | | 2012 | | 2011 | | 2010 |
| | | (In thousands) |
| Current: | | | | | | |
| Federal | | $ | (385 | ) | | $ | (4 | ) | | $ | (3,514 | ) |
| State | | 115 |
| | 324 |
| | 227 |
|
| Total current income tax (benefit) expense | | (270 | ) | | 320 |
| | (3,287 | ) |
| Deferred: | | | | | | |
| Federal | | (63 | ) | | (7,867 | ) | | 629 |
|
| State | | (14 | ) | | (1,620 | ) | | 129 |
|
| Total deferred income tax (benefit) expense | | (77 | ) | | (9,487 | ) | | 758 |
|
| Income tax benefit | | $ | (347 | ) | | $ | (9,167 | ) | | $ | (2,529 | ) |
Farmer Bros. Co.
Notes to Consolidated Financial Statements (continued)
Income tax expense or benefit from continuing operations is generally determined without regard to other categories of earnings, such as discontinued operations and OCI. An exception is provided in ASC 740 when there is aggregate income from categories other than continuing operations and a loss from continuing operations in the current year. In this case, the tax benefit allocated to continuing operations is the amount by which the loss from continuing operations reduces the tax expenses recorded with respect to the other categories of earnings, even when a valuation allowance has been established against the deferred tax assets. In instances where a valuation allowance is established against current year losses, income from other sources, including gain from post retirement benefits recorded as a component of OCI, is considered when determining whether sufficient future taxable income exists to realize the deferred tax assets. As a result, for the year ended June 30, 2011, the Company recorded a tax expense of $9.8 million in OCI related to the gain on postretirement benefits, and recorded a corresponding tax benefit of $9.8 million in continuing operations.
A reconciliation of income tax expense (benefit)benefit to the federal statutory tax rate is as follows: | | | | | | | | | | | | |
| | | June 30,
2010 | | | June 30,
2009 | | | June 30,
2008 | |
Statutory tax rate | | | 34 | % | | | 34 | % | | | 34 | % |
| |
| | | (In thousands) | |
Income tax expense at statutory rate | | $ | (9,004 | ) | | $ | (6,456 | ) | | $ | (5,210 | ) |
State income tax (net of federal tax benefit) | | | (1,238 | ) | | | (985 | ) | | | (779 | ) |
Dividend income exclusion | | | (765 | ) | | | (840 | ) | | | (974 | ) |
Valuation allowance | | | 8,752 | | | | 19,663 | | | | — | |
Change in contingency reserve (net) | | | 7 | | | | 3,578 | | | | (427 | ) |
Research tax credit (net) | | | (66 | ) | | | (97 | ) | | | (91 | ) |
Other (net) | | | (215 | ) | | | (580 | ) | | | 81 | |
| | | | | | | | | | | | |
Income tax (benefit) expense | | $ | (2,529 | ) | | $ | 14,283 | | | $ | (7,399 | ) |
| | | | | | | | | | | | |
|
| | | | | | | | | | | | |
| | | June 30, 2012 |
| | June 30, 2011 |
| | June 30, 2010 |
|
| Statutory tax rate | | 34 | % | | 34 | % | | 34 | % |
| | | | | | | |
| | | (In thousands) |
| Income tax benefit at statutory rate | | $ | (10,090 | ) | | $ | (21,585 | ) | | $ | (9,004 | ) |
| State income tax (net of federal tax benefit) | | (1,167 | ) | | (2,765 | ) | | (1,238 | ) |
| Dividend income exclusion | | (85 | ) | | (532 | ) | | (765 | ) |
| Valuation allowance | | 11,794 |
| | 16,529 |
| | 8,752 |
|
| Change in contingency reserve (net) | | (561 | ) | | (1,308 | ) | | 7 |
|
| Research tax credit (net) | | (15 | ) | | (16 | ) | | (66 | ) |
| Other (net) | | (223 | ) | | 510 |
| | (215 | ) |
| Income tax benefit | | $ | (347 | ) | | $ | (9,167 | ) | | $ | (2,529 | ) |
FARMER BROS. CO.NOTES TO CONSOLIDATED FINANCIAL STATEMENTS—(Continued)
The primary components of the temporary differences which give rise to the Company’s net deferred tax assetsliabilities are as follows:
| | | | | | | | | | | | |
| | | June 30, | |
| | | 2010 | | | 2009 | | | 2008 | |
| | | (In thousands) | |
Deferred tax assets: | | | | | | | | | | | | |
Postretirement benefits | | $ | 27,589 | | | $ | 22,110 | | | $ | 7,701 | |
Accrued liabilities | | | 4,376 | | | | 4,594 | | | | 3,947 | |
Capital loss carryforward | | | 1,971 | | | | 2,757 | | | | 4,668 | |
Net operating loss carryforward | | | 17,261 | | | | 5,564 | | | | 0 | |
Other | | | 2,464 | | | | 6,362 | | | | 5,240 | |
| | | | | | | | | | | | |
Total deferred tax assets | | | 53,661 | | | | 41,387 | | | | 21,556 | |
Deferred tax liabilities: | | | | | | | | | | | | |
Fixed assets | | | (5,551 | ) | | | (5,056 | ) | | | — | |
Intangible assets | | | (4,498 | ) | | | (2,725 | ) | | | — | |
Other | | | (726 | ) | | | (545 | ) | | | (6,217 | ) |
| | | | | | | | | | | | |
Total deferred tax liabilities | | | (10,775 | ) | | | (8,326 | ) | | | (6,217 | ) |
Valuation allowance | | | (43,860 | ) | | | (33,278 | ) | | | — | |
| | | | | | | | | | | | |
Net deferred tax (liability) asset | | $ | (974 | ) | | $ | (217 | ) | | $ | 15,339 | |
| | | | | | | | | | | | |
|
| | | | | | | | | | | | |
| | | June 30, |
| | | 2012 | | 2011 | | 2010 |
| | | (In thousands) |
| Deferred tax assets: | | | | | | |
| Postretirement benefits | | $ | 32,481 |
| | $ | 20,226 |
| | $ | 27,589 |
|
| Accrued liabilities | | 3,958 |
| | 4,138 |
| | 4,376 |
|
| Capital loss carryforward | | 2,865 |
| | 2,945 |
| | 1,971 |
|
| Net operating loss carryforward | | 47,114 |
| | 37,170 |
| | 17,261 |
|
| Intangible assets | | 919 |
| | — |
| | — |
|
| Other | | 1,295 |
| | 4,328 |
| | 2,464 |
|
| Total deferred tax assets | | 88,632 |
| | 68,807 |
| | 53,661 |
|
| Deferred tax liabilities: | | | | | | |
| Fixed assets | | (4,117 | ) | | (7,881 | ) | | (5,551 | ) |
| Intangible assets | | — |
| | (1,032 | ) | | (4,498 | ) |
| Other | | (794 | ) | | (814 | ) | | (726 | ) |
| Total deferred tax liabilities | | (4,911 | ) | | (9,727 | ) | | (10,775 | ) |
| Valuation allowance | | (84,954 | ) | | (60,390 | ) | | (43,860 | ) |
| Net deferred tax liability | | $ | (1,233 | ) | | $ | (1,310 | ) | | $ | (974 | ) |
The Company has approximately $44.3$121.7 million and $50.7$132.9 million of federal and state net operating loss carryforwards that will begin to expire in the year ended years ending June 30, 2025 and June 30, 2020, respectively. The Company also has approximately $5.1$7.6 million and $8.1$6.5 million of federal and state capital loss carryforwards, respectively, that may only be used to offset capital gains that begin expiring in June 30, 2013.2013
.
Farmer Bros. Co.
Notes to Consolidated Financial Statements (continued)
At June 30, 2010,2012, the Company had total deferred tax assets of $53.7$88.6 million and a net deferred tax assetassets before valuation allowance of $42.9 million.$83.7 million. The Company considered whether a valuation allowance should be recorded against deferred tax assets based on the likelihood that the benefits of the deferred tax assets would or would not ultimately be realized in future periods. In making such assessment, significant weight was given to evidence that could be objectively verified such as recent operating results and less consideration was given to less objective indicators such as future earnings projections. After consideration of positive and negative evidence, including the recent history of losses, the Company cannot conclude that it is more likely than not to generate future earnings sufficient to realize the Company’s deferred tax assets as of June 30, 2010.2012. Accordingly, a valuation allowance of $43.9$85.0 million has been recorded to offset this deferred tax asset. The valuation allowance increased by $10.6$24.6 million $33.3, $16.5 million, and $0$10.6 million in the fiscal years ended June 30, 2010, 20092012, 2011 and 2008,2010, respectively.The “Worker, Homeownership, and Business Assistance Act of 2009,” which was signed into law on November 6, 2009, extended the carryback period for certain net operating losses from two years to five years. As a result of the extended carryback period, the Company recorded a tax benefit in the current year of $3.5 million.
The Company recorded a cumulative change of $0.1 million as a decrease to retained earnings and an increase to long term liabilities for uncertain tax positions and related interest and penalties on July 1, 2007.
FARMER BROS. CO.NOTES TO CONSOLIDATED FINANCIAL STATEMENTS—(Continued)
A tabular reconciliation of the total amounts (in absolute values) of unrecognized tax benefits is as follows (in thousands):
| | | | | | | | | | | |
| | | Year Ended June 30, | |
| | | 2010 | | 2009 | | | 2008 | |
Unrecognized tax benefits at beginning of year | | $ | 4,382 | | $ | 807 | | | $ | 1,455 | |
Increases in tax positions for prior years | | | — | | | 4,005 | | | | 158 | |
Increases in tax positions for current year | | | 836 | | | — | | | | 31 | |
Settlements | | | — | | | (430 | ) | | | (836 | ) |
Lapse in statute of limitations | | | — | | | — | | | | — | |
| | | | | | | | | | | |
Unrecognized tax benefits at end of year | | $ | 5,218 | | $ | 4,382 | | | $ | 807 | |
| | | | | | | | | | | |
follows:
|
| | | | | | | | | | | | |
| | | Year Ended June 30, |
| | 2012 | | 2011 | | 2010 |
| | | (In thousands) |
| Unrecognized tax benefits at beginning of year | | $ | 3,902 |
| | $ | 5,218 |
| | $ | 4,382 |
|
| Increases in tax positions for prior years | | — |
| | — |
| | — |
|
| (Decreases) increases in tax positions for current year | | — |
| | (1,316 | ) | | 836 |
|
| Settlements | | (691 | ) | | — |
| | — |
|
| Lapse in statute of limitations | | — |
| | — |
| | — |
|
| Unrecognized tax benefits at end of year | | $ | 3,211 |
| | $ | 3,902 |
| | $ | 5,218 |
|
At June 30, 20102012 and 2009,2011, the Company has approximately $5.0$3.1 million and $4.1$3.6 million, respectively, of unrecognized tax benefits that, if recognized, would affect the effective tax rate, subject to the valuation allowance.The Internal Revenue Service and the State of California are currently conducting a examinations of the Company’s open tax years. The Company believes it is reasonably possible that a portionapproximately
$41,000 of its total unrecognized tax benefits will decreasecould be released in the next twelve months upon12 months. The Company is currently appealing a decision reached by the conclusionInternal Revenue Service regarding its June 30, 2003 through June 30, 2008 tax returns, and in January 2012 the appeals officer gave a preliminary indication that the audit result will be upheld. Additionally, in January 2012, the State of California completed an audit of the Company's June 30, 2006 and June 30, 2007 tax returns, and the Company also reached a Settlement Agreement with the State of California regarding the Company's June 30, 2002 to June 30, 2005 research and development tax credit claims. As a result of these examinations. However, it is premature to assessdecisions, the range or the natureCompany released $0.7 million of the reasonably possible changes to the Company’s unrecognized tax benefits.benefit in the third quarter of
fiscal 2012, which resulted in a tax benefit of $0.7 million excluding interest and penalties. The Company files income tax returns in the U.S. and in various state jurisdictions with varying statutes of limitations. The Company is no longer subject to U.S. income tax examinations for the fiscal years prior to June 30, 2003.2003
. The Company’s policy is to recognize interest expense and penalties related to income tax matters as a component of income tax expense. As of June 30, 20102012 and 2009,2011, the Company recorded $36,000$10,000 and $25,000,$47,000, respectively, in accrued interest and penalties associated with uncertain tax positions. Additionally, the Company recorded income/income (expense) of $10,000, ($38,000)$37,000, $(12,000), and ($52,000)$(10,000) related to interest and penalties on uncertain tax positions in the years ended June 30, 2010, 20092012, 2011 and 2008,2010, respectively. Note 14.13. Earnings (Loss) Per Common Share | | | | | | | | | | | | |
(In thousands, except share and per share amounts) | | Year ended June 30, | |
| | 2010 | | | 2009 | | | 2008 | |
Net loss attributable to common stockholders-basic | | $ | (23,847 | ) | | $ | (33,160 | ) | | $ | (7,924 | ) |
Net loss attributable to unvested restricted stockholders | | | (106 | ) | | | (110 | ) | | | — | |
| | | | | | | | | | | | |
Total net loss | | $ | (23,953 | ) | | $ | (33,270 | ) | | $ | (7,924 | ) |
| | | | | | | | | | | | |
| |
(In thousands, except share and per share amounts) | | Year ended June 30, | |
| | 2010 | | | 2009 | | | 2008 | |
Weighted average shares outstanding-basic | | | 14,866,306 | | | | 14,508,320 | | | | 14,284,324 | |
Effect of dilutive securities: | | | | | | | | | | | | |
Shares issuable under stock options | | | — | | | | — | | | | — | |
| | | | | | | | | | | | |
Weighted average shares outstanding-diluted | | | 14,866,306 | | | | 14,508,320 | | | | 14,284,324 | |
| | | | | | | | | | | | |
Basic and diluted net loss per common share | | $ | (1.61 | ) | | $ | (2.29 | ) | | $ | (0.55 | ) |
| | | | | | | | | | | | |
FARMER BROS. CO.
NOTES TO CONSOLIDATED FINANCIAL STATEMENTS—(Continued)
|
| | | | | | | | | | | | |
| | | Year ended June 30, |
| 2012 | | 2011 | | 2010 |
| | | (In thousands, except share and per share amounts) |
| Net loss attributable to common stockholders—basic | | $ | (28,996 | ) | | $ | (53,897 | ) | | $ | (23,847 | ) |
| Net loss attributable to nonvested restricted stockholders | | (333 | ) | | (420 | ) | | (106 | ) |
| Total net loss | | $ | (29,329 | ) | | $ | (54,317 | ) | | $ | (23,953 | ) |
| | | |
| Weighted average shares outstanding—basic | | 15,492,314 |
| | 15,066,663 |
| | 14,866,306 |
|
| Effect of dilutive securities: | | | | | | |
| Shares issuable under stock options | | — |
| | — |
| | — |
|
| Weighted average shares outstanding—diluted | | 15,492,314 |
| | 15,066,663 |
| | 14,866,306 |
|
| Net loss per common share—basic and diluted | | $ | (1.89 | ) | | $ | (3.61 | ) | | $ | (1.61 | ) |
Note
15.14. Commitments and Contingencies
With the acquisition of the DSD Coffee Business in the fiscal year ended June 30, 2009, the Company assumed some of the operating lease obligations associated with the acquired vehicles. The Company also refinanced some of the existing leases and entered into new capital leases for certain vehicles. The terms of the capital leases vary from 1312 months to 2684 months with varying expiration dates through 2011. 2019.
The Company is also obligated under operating leases for branch warehouses. Some operating leases have renewal options that allow the Company, as lessee, to extend the leases. The Company has one operating lease with a term greater than five years that expires in 2018 and has a 10ten year renewal option, and operating leases for computer hardware with terms that do not exceed four years.five years. Rent expense for the fiscal years ended June 30, 2010, 20092012, 2011 and 20082010 was $6.6$4.5 million $3.2, $6.3 million and $1.5$6.6 million, respectively. In May 2011, the Company did not meet the minimum credit rating criteria for participation in the alternative security program for California self-insurers. As a result, the Company was required to post a $5.9 million letter of credit as a security deposit to the State of California Department of Industrial Relations Self-Insurance Plans. As of June 30, 2012, this letter of credit continues to serve as a security deposit.
Contractual obligations for future fiscal years are as follows (in thousands): | | | | | | | | | | |
| | | Contractual Obligations |
Year Ended June 30, | | Capital Lease
Obligations | | | Operating Lease
Obligations | | Pension Plan
Obligations |
2011 | | $ | 1,006 | | | $ | 4,725 | | $ | 5,285 |
2012 | | | 833 | | | | 3,909 | | | 5,449 |
2013 | | | 794 | | | | 2,966 | | | 5,759 |
2014 | | | 794 | | | | 2,585 | | | 5,987 |
2015 | | | 794 | | | | 1,898 | | | 6,410 |
Thereafter | | | 560 | | | | 1,236 | | | 39,900 |
| | | | | | | | | | |
| | | | | | $ | 17,319 | | $ | 68,790 |
| | | | | | | | | | |
Total minimum lease payments | | $ | 4,781 | | | | | | | |
Less: imputed interest (6.74% to 13.16%) | | | (920 | ) | | | | | | |
| | | | | | | | | | |
Present value of future minimum lease payments | | $ | 3,861 | | | | | | | |
Less: current portion | | | 724 | | | | | | | |
| | | | | | | | | | |
Long-term capital lease obligation | | $ | 3,137 | | | | | | | |
| | | | | | | | | | |
|
| | | | | | | | | | | | | | | | |
| | | Contractual Obligations |
Year Ended June 30, | | Capital Lease Obligations | | Operating Lease Obligations | | Pension Plan Obligations | | Postretirement Benefits Other Than Pensions |
| 2013 | | $ | 4,523 |
| | $ | 3,979 |
| | $ | 6,364 |
| | $ | 1,363 |
|
| 2014 | | 3,790 |
| | 3,382 |
| | 6,508 |
| | 1,450 |
|
| 2015 | | 3,742 |
| | 2,757 |
| | 6,692 |
| | 1,846 |
|
| 2016 | | 3,425 |
| | 1,950 |
| | 6,898 |
| | 2,106 |
|
| 2017 | | 1,501 |
| | 1,341 |
| | 7,165 |
| | 2,362 |
|
| Thereafter | | 958 |
| | 2,047 |
| | 40,943 |
| | 15,559 |
|
| | | | | $ | 15,456 |
| | $ | 74,570 |
| | $ | 24,686 |
|
| Total minimum lease payments | | $ | 17,939 |
| | | | | | |
| Less: imputed interest (0.82% to 10.7%) | | (2,072 | ) | | | | | | |
| Present value of future minimum lease payments | | $ | 15,867 |
| | | | | | |
| Less: current portion | | 3,737 |
| | | | | | |
| Long-term capital lease obligations | | $ | 12,130 |
| | | | | | |
The Company is a party to various pending legal and administrative proceedings. It is management’s opinion that the outcome of such proceedings will not have a material impact on the Company’s financial position, results of operations, or cash flows.
FARMER BROS. CO.
NOTES TO CONSOLIDATED FINANCIAL STATEMENTS—(Continued)
Note
16.15. Quarterly Financial Data (Unaudited)
| | | | | | | | | | | | | | | | |
| | | September 30,
2009 | | | December 31,
2009 | | | March 31,
2010 | | | June 30,
2010 | |
| | | (In thousands, except share data) | |
Net sales | | $ | 112,127 | | | $ | 120,225 | | | $ | 111,002 | | | $ | 106,964 | |
Gross profit | | $ | 54,304 | | | $ | 51,092 | | | $ | 49,261 | | | $ | 42,907 | |
Income (loss) from operations | | $ | 2,595 | | | $ | (5,102 | ) | | $ | (9,288 | ) | | $ | (27,397 | ) |
Net income (loss) | | $ | 2,199 | | | $ | 1,417 | | | $ | (6,575 | ) | | $ | (20,994 | ) |
Net income (loss) per common share | | $ | 0.15 | | | $ | 0.10 | | | $ | (0.44 | ) | | $ | (1.40 | ) |
| | | | |
| | | September 30,
2008 | | | December 31,
2008 | | | March 31,
2009 | | | June 30,
2009 | |
| | | (In thousands, except share data) | |
Net sales | | $ | 66,524 | | | $ | 76,530 | | | $ | 85,604 | | | $ | 113,066 | |
Gross profit | | $ | 30,951 | | | $ | 37,318 | | | $ | 42,658 | | | $ | 49,289 | |
(Loss) income from operations | | $ | (4,255 | ) | | $ | 213 | | | $ | (1,606 | ) | | $ | (9,555 | ) |
Net loss | | $ | (6,085 | ) | | $ | (106 | ) | | $ | (1,437 | ) | | $ | (25,642 | ) |
Net loss per common share | | $ | (0.42 | ) | | $ | (0.01 | ) | | $ | (0.10 | ) | | $ | (1.76 | ) |
|
| | | | | | | | | | | | | | | | |
| | | September 30,
2011 | | December 31,
2011 | | March 31,
2012 | | June 30,
2012 |
| | | (In thousands, except per share data) |
| Net sales | | $ | 121,197 |
| | $ | 131,770 |
| | $ | 121,527 |
| | $ | 120,948 |
|
| Gross profit | | $ | 39,685 |
| | $ | 44,541 |
| | $ | 43,147 |
| | $ | 45,451 |
|
| Loss from operations | | $ | (4,630 | ) | | $ | (5,649 | ) | | $ | (4,107 | ) | | $ | (10,481 | ) |
| Net loss | | $ | (7,584 | ) | | $ | (4,110 | ) | | $ | (5,501 | ) | | $ | (12,134 | ) |
| Net loss per common share | | $ | (0.50 | ) | | $ | (0.27 | ) | | $ | (0.35 | ) | | $ | (0.77 | ) |
| | | | | | | | | |
| | | September 30,
2010 | | December 31,
2010 | | March 31,
2011 | | June 30,
2011 |
| | | (In thousands, except per share data) |
| Net sales | | $ | 108,743 |
| | $ | 119,227 |
| | $ | 116,732 |
| | $ | 119,243 |
|
| Gross profit | | $ | 43,945 |
| | $ | 45,016 |
| | $ | 41,861 |
| | $ | 26,352 |
|
| Loss from operations | | $ | (12,019 | ) | | $ | (10,543 | ) | | $ | (14,463 | ) | | $ | (31,397 | ) |
| Net loss | | $ | (9,873 | ) | | $ | (8,912 | ) | | $ | (13,196 | ) | | $ | (22,336 | ) |
| Net loss per common share | | $ | (0.66 | ) | | $ | (0.59 | ) | | $ | (0.87 | ) | | $ | (1.47 | ) |
During the fourth quarter and for the fiscal year ended June 30, 2010,2012, the Company identified two errorsrecorded $5.1 million in impairment loss on goodwill and $0.5 million in impairment loss on its consolidated financial statements. The first error was an understatement of coffee brewing equipment parts inventory and an overstatement of cost of sales by $1.8 million, of which $1.5 millionindefinite-lived intangible assets related to CBI (see Note 6). During the fourth quarter and for the fiscal year 2009 and $0.3 million related to the first three quarters of fiscal 2010. The error resulted from the Company charging the cost of coffee brewing equipment at one recently acquired location to cost of sales upon receipt rather than accounting for parts on hand as inventory. The second error was an understatement of accrued liabilities and operating expense by $1.8 million, of which $0.5 million related to fiscal year 2009 and $1.3 million related to the first three quarters of fiscal 2010. This error resulted from a misapplication of a system configuration at a recently acquired location. In accordance with relevant guidance, management evaluated the materiality of these errors from a qualitative and quantitative perspective both individually and in the aggregate. Based on such evaluation, the Company concluded that correcting the cumulative errors would be immaterial to the expected full year results for fiscal 2010 and correcting the error would not have had a material impact to any of the individual prior period financial statements or affect the trend of financial results. Accordingly,ended June 30, 2011, the Company recorded an adjustmentimpairment loss of $7.8 million on definite-lived intangible assets that the Company acquired or entered into during the DSD Coffee Business acquisition. During the fourth quarter of fiscal 2010 to increase total inventory and reduce cost of sales by $1.8 million and to increase accrued liabilities and operating expense by $1.8 million.2011
Note 17. Subsequent EventOn August 31, 2010,, the Company entered into Amendment No. 4 to Loan and Security Agreement with Wells Fargo.
Seealso recorded $9.2 million in income tax benefit (see Note 9.
12).
|
| |
| Item 9. | Changes in and Disagreements with Accountants on Accounting and Financial Disclosure |
|
| |
| Item 9A. | Controls and Procedures |
Disclosure Controls and Procedures
Disclosure controls and procedures, as defined in Rules 13a-15(e) and 15d-15(e) promulgated under the Securities Exchange Act of 1934, as amended (the “Exchange Act”), are controls and other procedures that are designed to ensure that information required to be disclosed by us in the reports that we file or submit under the Exchange Act is recorded, processed, summarized and reported, within the time periods specified in the rules and forms of the SEC. Disclosure controls and procedures include, without limitation, controls and procedures designed to ensure that information we are required to disclose in the reports that we file or submit under the Exchange Act is accumulated and communicated to our management, including our Chief Executive Officer and Chief Financial Officer, as appropriate to allow timely decisions regarding required disclosures.
As of June 30,
2010,2012, our management, with the participation of our Chief Executive Officer and Chief Financial Officer, carried out an evaluation of the effectiveness of our disclosure controls and procedures pursuant to Rule 13a-15(e) promulgated under the Exchange Act. Based upon this evaluation, our Chief Executive Officer and
our Chief Financial Officer concluded that, as of June 30,
2010,2012, our disclosure controls and procedures were effective.
Management Report on Internal Control Over Financial Reporting
Our management is responsible for establishing and maintaining adequate internal control over financial reporting as such term is defined in Exchange Act Rules 13a-15(f) and 15d-15(f). With the participation of the Chief Executive Officer and Chief Financial Officer, our management conducted an evaluation of the effectiveness of our internal control over financial reporting based on the framework and criteria established in Internal Control—Integrated Framework, issued by the Committee of Sponsoring Organizations of the Treadway Commission. Based on this evaluation, our management has concluded that our internal control over financial reporting was effective as of June 30,
2010.2012.
Ernst & Young LLP, an independent registered public accounting firm, issued an attestation report on the Company’s internal control over financial reporting as of June 30,
2010,2012, as stated in their report which is included herein.
Changes in Internal Control Over Financial Reporting
There has been no change in our internal control over financial reporting (as defined in Rules 13a-15(f) and 15d-15(f) promulgated under the Exchange Act) during our fiscal quarter ended June 30,
2010,2012, that has materially affected, or is reasonably likely to materially affect, our internal control over financial reporting.
During the fiscal quarter ended March 31, 2009, the Company entered into a transition services agreement with Sara Lee to host, maintain and support the IT infrastructure of the DSD Coffee Business for up to eighteen months. This agreement was scaled back in February 2010 to include only IT infrastructure support and terminated on August 31, 2010.
Report of Independent Registered Public Accounting Firm
The Board of Directors and Stockholders of
Farmer Bros. Co. and Subsidiaries
We have audited Farmer Bros. Co. and Subsidiaries’ internal control over financial reporting as of June 30,
2010,2012, based on criteria established in Internal Control—Integrated Framework issued by the Committee of Sponsoring Organizations of the Treadway Commission (the COSO criteria). Farmer Bros. Co. and Subsidiaries’ management is responsible for maintaining effective internal control over financial reporting, and for its assessment of the effectiveness of internal control over financial reporting included in the accompanying “Management Report on Internal Control
overOver Financial Reporting.” Our responsibility is to express an opinion on the company’s internal control over financial reporting based on our audit.
We conducted our audit in accordance with the standards of the Public Company Accounting Oversight Board (United States). Those standards require that we plan and perform the audit to obtain reasonable assurance about whether effective internal control over financial reporting was maintained in all material respects. Our audit included obtaining an understanding of internal control over financial reporting, assessing the risk that a material weakness exists, testing and evaluating the design and operating effectiveness of internal control based on the assessed risk, and performing such other procedures as we considered necessary in the circumstances. We believe that our audit provides a reasonable basis for our opinion.
A company’s internal control over financial reporting is a process designed to provide reasonable assurance regarding the reliability of financial reporting and the preparation of financial statements for external purposes in accordance with generally accepted accounting principles. A company’s internal control over financial reporting includes those policies and procedures that (1) pertain to the maintenance of records that, in reasonable detail, accurately and fairly reflect the transactions and dispositions of the assets of the company; (2) provide reasonable assurance that transactions are recorded as necessary to permit preparation of financial statements in accordance with generally accepted accounting principles, and that receipts and expenditures of the company are being made only in accordance with authorizations of management and directors of the company; and (3) provide reasonable assurance regarding prevention or timely detection of unauthorized acquisition, use, or disposition of the company’s assets that could have a material effect on the financial statements.
Because of its inherent limitations, internal control over financial reporting may not prevent or detect misstatements. Also, projections of any evaluation of effectiveness to future periods are subject to the risk that controls may become inadequate because of changes in conditions, or that the degree of compliance with the policies or procedures may deteriorate.
In our opinion, Farmer Bros. Co. and Subsidiaries maintained, in all material respects, effective internal control over financial reporting as of June 30,
2010,2012, based on the COSO criteria.
We also have audited, in accordance with the standards of the Public Company Accounting Oversight Board (United States), the consolidated balance sheets of Farmer Bros. Co. and Subsidiaries as of June 30,
20102012 and
2009,2011, and the related consolidated statements of operations,
shareholders’comprehensive income (loss), stockholders’ equity, and cash flows for each of the three years in the period ended June 30,
20102012 of Farmer Bros. Co. and Subsidiaries and our report dated September
13, 20107, 2012 expressed an unqualified opinion thereon.
September
13, 20107, 2012
Item 9A(T). Controls and Procedures
Not applicable.
|
| |
| Item 9B. | Other Information |
|
| |
| Item 10. | Directors, Executive Officers and Corporate Governance |
The information required by this item will be
subsequently incorporated herein by reference to ourset forth in the Proxy Statement
expected to be datedor Form 10-K/A and
filed with the SEC on or before October 28, 2010.is incorporated in this report by reference.
To the Company’s knowledge, based solely on a review of the copies of such reports furnished to the Company and written representations that no other reports were required during the fiscal year ended June 30, 2010,2012, its officers, directors and ten percent shareholders complied with all applicable Section 16(a) filing requirements, with the exception of those filings listed in the Registrant’sCompany's Proxy Statement expected to be dated and filed with the SEC on or before October 28, 2010.not later than 120 days after the conclusion of the Company's fiscal year ended June 30, 2012. |
| |
| Item 11. | Executive Compensation |
The information required by this item will be subsequently incorporated herein by reference to ourset forth in the Proxy Statement expected to be datedor Form 10-K/A and filed with the SEC on or before October 28, 2010.is incorporated in this report by reference. |
| |
| Item 12. | Security Ownership of Certain Beneficial Owners and Management and Related Stockholder Matters |
The information required by this item will be
subsequently incorporated herein by reference to ourset forth in the Proxy Statement
expected to be datedor Form 10-K/A and
filed with the SEC on or before October 28, 2010.is incorporated in this report by reference.
Equity Compensation Plan Information
Information about our equity compensation plans at June 30, 20102012 that were either approved or not approved by our stockholders was as follows: | | | | | | | |
Plan Category | | Number of
Shares to be
Issued Upon
Exercise of
Outstanding
Options | | Weighted
Average
Exercise
Price of
Outstanding
Options | | Number of
Shares
Remaining
Available
for Future
Issuance(b) |
Equity compensation plans approved by stockholders(a) | | 404,943 | | $ | 20.17 | | 505,958 |
Equity compensation plans not approved by stockholders | | — | | | — | | — |
Total | | 404,943 | | $ | 20.17 | | 505,958 |
(a) | Includes the Omnibus Plan. |
(b) | Shares available for future issuance under the Omnibus Plan may be awarded in the form of stock options, stock appreciation rights, restricted stock, restricted stock units, dividend equivalents, performance-based awards, stock payments, or other incentives payable in shares of stock, or any combination thereof. |
|
| | | | | | | | |
| Plan Category | | Number of Shares to be Issued Upon Exercise of Outstanding Options | | Weighted Average Exercise Price of Outstanding Options | | Number of Shares Remaining Available for Future Issuance(2) |
| Equity compensation plans approved by stockholders(1) | | 667,235 | | $ | 12.84 |
| | 100,026 |
| Equity compensation plans not approved by stockholders | | — | | $ | — |
| | — |
| Total | | 667,235 | | $ | 12.84 |
| | 100,026 |
________________
(1) Includes the Omnibus Plan.
(2) Shares available for future issuance under the Omnibus Plan may be awarded in the form of stock options, stock appreciation rights, restricted stock, restricted stock units, dividend equivalents, performance-based awards, stock payments, or other incentives payable in shares of stock, or any combination thereof. Shares covered by an award will be counted as used at the time the award is granted to a participant. If any award lapses, expires, terminates or is canceled prior to the issuance of shares thereunder or if shares are issued under the Omnibus Plan to a participant and are thereafter reacquired by the Company, the shares subject to such awards and the reacquired shares will again be available for issuance under the Omnibus Plan. In addition to the shares that are actually issued to a participant, the following items will be counted against the total number of shares available for issuance under the Omnibus Plan: (i) shares subject to an award that are not delivered to a participant because the award is exercised through a reduction of shares subject to the award (i.e., “net exercised”); (ii) shares subject to an award that are not delivered to a participant because such shares are withheld in satisfaction of the withholding of taxes incurred in connection with the exercise of or issuance of shares under certain types of awards; and (iii) shares that are tendered to the Company to pay the exercise price of any stock award. The following items will not be counted against the total number of shares available for issuance under the Omnibus Plan: (A) the payment in cash of dividends or dividend equivalents; and (B) any award that is settled in cash rather than by issuance of stock.
|
| |
| Item 13. | Certain Relationships and Related Transactions, and Director Independence |
The information required by this item will be
subsequently incorporated herein by reference to ourset forth in the Proxy Statement
expected to be datedor Form 10-K/A and
filed with the SEC on or before October 28, 2010.is incorporated in this report by reference. |
| |
| Item 14. | Principal Accountant Fees and Services |
The information required by this item will be subsequently incorporated herein by reference to ourset forth in the Proxy Statement expected to be datedor Form 10-K/A and filed with the SEC on or before October 28, 2010.is incorporated in this report by reference.
|
| |
| Item 15. | Exhibits and Financial Statement Schedules |
| |
| (a) | List of Financial Statements and Financial Statement Schedules: |
1. Financial Statements included in Part II, Item 8:8 of this report: | | |
|
|
Consolidated Balance Sheets as of June 30, 20102012 and 2009 | | 302011 |
| |
Consolidated Statements of Operations for the Years Ended June 30, 2010, 20092012, 2011 and 2008 | | 312010 |
| |
Consolidated Statements of Comprehensive Income (Loss) for the Years Ended June 30, 2012, 2011 and 2010 |
|
Consolidated Statements of Cash Flows for the Years Ended June 30, 2010, 20092012, 2011 and 2008 | | 322010 |
| |
Consolidated Statements of Stockholders’ Equity for the Years Ended June 30, 2010, 20092012, 2011 and 2008 | | 332010 |
| |
Notes to Consolidated Financial Statements | | 34 |
2. Financial Statement Schedules: Financial Statement Schedules are omitted as they are not applicable, or the required information is given in the consolidated financial statements and notes thereto.
3. The exhibits to this Annual Report on Form 10-K are listed on the accompanying index to exhibits and are incorporated herein by reference or are filed as part of the Annual Report on Form 10-K. Each management contract or compensation plan required to be filed as an exhibit is identified by an asterisk (*).
| |
| (b) | Exhibits: See Exhibit Index. |
Pursuant to the requirements of Section 13 or 15(d) of the Securities Exchange Act of 1934, the
Registrantregistrant has duly caused this report to be signed on its behalf by the undersigned, thereunto duly authorized.
|
| | | | | |
FARMER BROS. CO. | | | | | |
| FARMER BROS. CO. |
| | |
| By: | | /s/ ROGER M. LAVERTY III S/ MICHAEL H. KEOWN |
| | Roger M. Laverty III
| Michael H. Keown
President and Chief Executive Officer
(principalchief executive officer)
Date: September 13, 2010
7, 2012 |
| | |
| By: | | /s/ JEFFREYS/ JEFFREY A. WAHBA WAHBA |
| | | Jeffrey A. Wahba
Treasurer and Chief Financial Officer
(principal financial and accounting officer)
Date: September 13, 2010
7, 2012 |
| | |
| By: | | /s/S/ HORTENSIA R. GÓMEZ |
| | | Hortensia R. Gómez
Vice President and Controller
(controller)
Date: September 13, 2010
7, 2012 |
Pursuant to the requirements of the Securities Exchange Act of 1934, this report has been signed below by the following persons on behalf of the
Registrantregistrant and in the capacities and on the dates indicated.
|
| | | | |
/s/ ROGER M. LAVERTY III
Roger M. Laverty III
| | President, Chief Executive Officer
| | |
| | |
/S/ GUENTER W. BERGER Guenter W. Berger | | Chairman of the Board and Director | | September 13, 20107, 2012 |
| | |
/S/ HAMIDEH ASSADI Hamideh Assadi | | Director | | September 7, 2012 |
| | | | |
Jeanne Farmer Grossman | | Director | | |
| | | | |
/S/ MARTIN A. LYNCH Martin A. Lynch | | Director | | September 7, 2012 |
| | |
/S/ JAMES J. MCGARRY James J. McGarry | | Director | | September 7, 2012 |
| | |
/S/ JOHN H. MERRELL John H. Merrell | | Director | | September 7, 2012 |
| | |
/S/ MICHAEL H. KEOWN Michael H. Keown | | Director | | September 7, 2012 |
EXHIBIT INDEX
|
| | |
/s/ GUENTER W. BERGER
Guenter W. Berger
| | Chairman of the Board and Director
| | September 13, 2010 |
| | |
/s/ MARTIN A. LYNCH
Martin A. Lynch
| | Director
| | September 13, 2010 |
| | |
/s/ THOMAS A. MALOOF
Thomas A. Maloof
| | Director
| | September 13, 2010 |
| | |
/s/ JAMES J. MCGARRY
James J. McGarry
| | Director
| | September 13, 2010 |
| | |
/s/ JOHN H. MERRELL
John H. Merrell
| | Director
| | September 13, 2010 |
| | |
Jeanne Farmer Grossman
| | Director
| | |
EXHIBIT INDEX
| | |
3.1 | | Certificate of Incorporation (filed as Exhibit 3.1 to the Company’s Quarterly Report on Form 10-Q for the quarter ended March 31, 2009 filed with the SEC on May 11, 2009 and incorporated herein by reference). |
| |
3.2 | | Amended and Restated Bylaws (filed as Exhibit 3.2 to the Company’s Current Report on Form 8-K filed with the SEC on June 8, 2006April 25, 2011 and incorporated herein by reference). |
| |
4.1 | | Certificate of Designation, Preferences and Rights of Series A Junior Participating Preferred Stock (filed as Exhibit 4.1 to the Company’s Quarterly Report on Form 10-Q for the quarter ended March 31, 2010 filed with the SEC on May 10, 2010 and incorporated herein by reference). |
| |
4.2 | | Rights Agreement, dated March 17, 2005, by and between Farmer Bros. Co. and Wells Fargo Bank, N.A., as Rights Agent (filed as Exhibit 4.2 to the Company’s Quarterly Report on Form 10-Q for the quarter ended March 31, 2010 filed with the SEC on May 10, 2010 and incorporated herein by reference). |
| |
4.3 | | Specimen Stock Certificate (filed as Exhibit 4.1 to the Company’s Form 8-A/A filed with the SEC on February 6, 2009 and incorporated herein by reference). |
|
| | |
10.1 | | Asset Purchase Agreement dated as of December 2, 2008, byAmended and among Sara Lee Corporation, Saramar, LLC and Farmer Bros. Co. (filed as Exhibit 10.1 to the Company’s Quarterly Report on Form 10-Q for the quarter ended December 31, 2008 filed with the SEC on February 10, 2009 and incorporated herein by reference). |
| |
10.2
| | Amendment No. 1 to Asset Purchase Agreement, dated February 27, 2009, by and among Sara Lee Corporation, Saramar, LLC and Farmer Bros. Co. (filed as Exhibit 10.2 to the Company’s Annual Report on Form 10-K/A for the fiscal year ended June 30, 2009 filed with the SEC on September 15, 2009 and incorporated herein by reference). |
| |
10.3
| | Second Amendment to Asset Purchase Agreement, dated December 17, 2009, by and among Sara Lee Corporation, Saramar, LLC and Farmer Bros. Co. (filed as Exhibit 10.3 to the Company’s Quarterly Report on Form 10-Q for the quarter ended December 31, 2009 and incorporated herein by reference). |
| |
10.4
| | Stock Purchase Agreement, dated April 27, 2007, by and among Farmer Bros. Co., Coffee Bean Holding Co., Inc., and the Stockholders of Coffee Bean Holding Co., Inc. (filed as Exhibit 10.1 to the Company’s Current Report on Form 8-K filed with the SEC on May 1, 2007 and incorporated herein by reference). |
| |
10.5
| | Restated Loan and Security Agreement, dated March 2, 2009, by and among Farmer Bros. Co. and Coffee Bean International, Inc., as Borrowers, Coffee Bean Holding Co., Inc., FBC Finance Company and SL Realty, LLC, as Guarantors, and Wells Fargo Bank, National Association, successor by merger to Wachovia Bank, National Association, as Lender (filed as Exhibit 10.1 to the Company’s Quarterly Report on Form 10-Q for the quarter ended December 31, 2008 filed with the SEC on February 10, 2009 and incorporated herein by reference). |
| |
10.6
| | Amendment No. 1 to Loan and Security Agreement and Consent, dated March 2, 2009,September 12, 2011, by and among Farmer Bros. Co. and Coffee Bean International, Inc., as Borrowers, Coffee Bean Holding Co., Inc. and FBC Finance Company, as Guarantors, the Lenders party thereto, and Wells Fargo Bank, National Association, successor by merger to Wachovia Bank, National Association, as LenderAgent (filed as Exhibit 10.510.12 to the Company’s Annual Report on Form 10-K/A10-K for the fiscal year ended June 30, 20092011 filed with the SEC on September 15, 200912, 2011 and incorporated herein by reference). |
| | |
| |
10.7
10.2 | | Amendment No. 21 to Amended and Restated Loan and Security Agreement, and Consent, dated July 27, 2009,effective January 9, 2012, by and among Farmer Bros. Co. and Coffee Bean International, Inc., as Borrowers, Coffee Bean Holding Co., Inc. and FBC Finance Company, as Guarantors, the Lenders party thereto, and Wells Fargo Bank, National Association, successor by merger to Wachovia Bank, National Association, as LenderAgent (filed as Exhibit 10.6 to the Company’s Quarterly Report on Form 10-Q for the quarter ended September 30, 2009 filed with the SEC on November 9, 2009 and incorporated herein by reference). |
| |
10.8
| | Amendment No. 3 to Loan and Security Agreement, dated November 20, 2009, by and among Farmer Bros. Co. and Coffee Bean International, Inc., as Borrowers, Coffee Bean Holding Co., Inc. and FBC Finance Company, as Guarantors, and Wells Fargo Bank, National Association, successor by merger to Wachovia Bank, National Association, as Lender (filed as Exhibit 10.810.2 to the Company’s Quarterly Report on Form 10-Q for the quarter ended December 31, 20092011 filed with the SEC on February 9, 20108, 2012 and incorporated herein by reference). |
| |
10.9
| | Amendment No. 4 to Loan and Security Agreement and Consent, dated August 31, 2010, by and among Farmer Bros. Co. and Coffee Bean International, Inc., as Borrowers, Coffee Bean Holding Co., Inc. and FBC Finance Company, as Guarantors, and Wells Fargo Bank, National Association, successor by merger to Wachovia Bank, National Association, as Lender (filed herewith). |
| |
10.10
| | Letter Agreement regarding Waiver of Event of Default dated May 7, 2010, by and among Farmer Bros. Co. and Coffee Bean International, Inc., as Borrowers, Coffee Bean Holding Co., Inc. and FBC Finance Company, as Guarantors, and Wells Fargo Bank, National Association, successor by merger to Wachovia Bank, National Association, as Lender (filed as Exhibit 10.9 to the Company’s Quarterly Report on Form 10-Q for the quarter ended March 31, 2010 filed with the SEC on May 10, 2010 and incorporated herein by reference). |
| |
10.11
10.3 | | Farmer Bros. Co. Pension Plan for Salaried Employees (filed as Exhibit 10.1 to the Company’sCompany's Annual Report on Form 10-K for the fiscal year ended June 30, 2007 filed with the SEC on September 13, 2007 and incorporated herein by reference).* |
| | |
10.12
10.4 | | Amendment No. 1 to Farmer Bros. Co. Retirement Plan effective June 30, 2011 (filed as Exhibit 10.14 to the Company’s Annual Report on Form 10-K for the fiscal year ended June 30, 2011 filed with the SEC on September 12, 2011 and incorporated herein by reference).* |
| |
| 10.5 | | Farmer Bros. Co. 2005 Incentive Compensation Plan (Amended and Restated as of December 31, 2008) (filed as Exhibit 10.4 to the Company’s Quarterly Report on Form 10-Q for the quarter ended December 31, 2008 filed with the SEC on February 10, 2009 and incorporated herein by reference).* |
| |
10.13
10.6 | | Farmer Bros. Co. Amended and Restated Employee Stock Ownership Plan, as adopted by the Board of Directors on December 9, 2010 and effective as of January 1, 2010 (filed as Exhibit 10.510.12 to the Company’s AnnualQuarterly Report on Form 10-K10-Q for the fiscal yearquarter ended June 30, 2007December 31, 2010 filed with the SEC on September 13, 2007February 9, 2011 and incorporated herein by reference).* |
|
| | |
10.7 | | Action of the Administrative Committee of the Farmer Bros. Co. qualified Employee Retirement Plans amending the Farmer Bros. Co. Amended and Restated Employee Stock Ownership Plan, effective as of January 1, 2012 (filed herewith). |
| | |
| 10.8 | | ESOP Loan Agreement including ESOP Pledge Agreement and Promissory Note, dated March 28, 2000, between Farmer Bros. Co. and Wells Fargo Bank, N.A., Trustee for the Farmer Bros Co. Employee Stock Ownership Plan (filed as Exhibit 10.13 to the Company’s Quarterly Report on Form 10-Q for the quarter ended December 31, 2010 filed with the SEC on February 9, 2011 and incorporated herein by reference). |
|
| | |
| |
| 10.9 | | Amendment No. 1 to ESOP Loan Agreement, dated June 30, 2003, between Farmer Bros. Co. and Wells Fargo Bank, N.A., Trustee for the Farmer Bros Co. Employee Stock Ownership Plan (filed as Exhibit 10.14 to the Company’s Quarterly Report on Form 10-Q for the quarter ended December 31, 2010 filed with the SEC on February 9, 2011 and incorporated herein by reference). |
| |
| 10.10 | | ESOP Loan Agreement No. 2 including ESOP Pledge Agreement and Promissory Note, dated July 21, 2003 between Farmer Bros. Co. and Wells Fargo Bank, N.A., Trustee for the Farmer Bros Co. Employee Stock Ownership Plan (filed as Exhibit 10.610.15 to the Company’s Quarterly Report on Form 10-Q for the quarter ended December 31, 20082010 filed with the SEC on February 10, 20099, 2011 and incorporated herein by reference). |
| |
10.15
10.11 | | Amendment 2008-1 to the Farmer Bros. Co. Amended and Restated Employee Stock Ownership Plan (filed as Exhibit 10.30 to the Company’s Quarterly Report on Form 10-Q for the quarter ended December 31, 2008 filed with the SEC on February 10, 2009 and incorporated herein by reference).* |
| |
10.16
| | Good Faith Amendment to comply with Code Section 401(a)(31)(B) as amended by the Economic Growth and Tax Relief Reconciliation Act of 2001 (EGTRRA) for the Farmer Bros. Co. Amended and Restated Employee Stock Ownership Plan (filed as Exhibit 10.31 to the Company’s Quarterly Report on Form 10-Q for the quarter ended December 31, 2008 filed with the SEC on February 10, 2009 and incorporated herein by reference).* |
| | |
| |
10.17
| | EmploymentSeparation Agreement, dated as of June 2, 2006,April 1, 2011, by and between Farmer Bros. Co. and Roger M. Laverty III (filed as Exhibit 10.1 to the Company’s Current Report on Form 8-K filed with the SEC on June 8, 2006April 6, 2011 and incorporated herein by reference).* |
| |
10.18
10.12 | | Amendment No. 1 to Employment Agreement, dated as of December 5, 2007,March 9, 2012, by and between Farmer Bros. Co. and Roger M. Laverty III (filed as Exhibit 10.1 to the Company’s Current Report on Form 8-K/A filed with the SEC on December 11, 2007 and incorporated herein by reference).* |
| |
10.19
| | Amendment No. 2 to Employment Agreement, dated as of December 31, 2008, by and between Farmer Bros. Co. and Roger M. Laverty III (filed as Exhibit 10.13 to the Company’s Quarterly Report on Form 10-Q for the quarter ended December 31, 2008 filed with the SEC on February 10, 2009 and incorporated herein by reference).* |
| |
10.20
| | Employment Agreement, dated as of March 3, 2008, by and between Farmer Bros. Co. and DrewMichael H. WebbKeown (filed as Exhibit 10.1 to the Company’s Current Report on Form 8-K filed with the SEC on March 7, 200813, 2012 and incorporated herein by reference).* |
| |
10.21
| | Amendment No. 1 to |
| 10.13 | | Amended and Restated Employment Agreement, datedeffective as of December 31, 2008, by and between Farmer Bros. Co. and Drew H. Webb (filed as Exhibit 10.15 to the Company’s Quarterly Report on Form 10-Q for the quarter ended December 31, 2008 filed with the SEC on February 10, 2009 and incorporated herein by reference).* |
| |
10.22
| | Amendment No. 2 to Employment Agreement, dated as of February 25, 2010, by and between Farmer Bros. Co. and Drew H. Webb (filed as Exhibit 10.4 to the Company’s Current Report on Form 8-K filed with the SEC on March 3, 2010 and incorporated herein by reference).* |
| |
10.23
| | Employment Agreement, dated as of March 14, 2009, by and between Farmer Bros. Co. and Heidi L. Modaro (filed as Exhibit 10.15 to the Company’s Annual Report on Form 10-K/A for the fiscal year ended June 30, 2009 filed with the SEC on September 15, 2009 and incorporated herein by reference).* |
| |
10.24
| | Employment Agreement, dated as of February 25, 2010,April 19, 2011, by and between Farmer Bros. Co. and Jeffrey A. Wahba (filed as Exhibit 10.1 to the Company’s Current Report on Form 8-K filed with the SEC on March 3, 2010May 23, 2011 and incorporated herein by reference).* |
| |
10.25
10.14 | | ConsultingAmendment No. 1 to Amended and Restated Employment Agreement, dated as of March 2, 2009,August 30, 2011, by and between Farmer Bros. Co. and Michael J. King (filed as Exhibit 10.16 to the Company’s Annual Report on Form 10-K/A for the fiscal year ended June 30, 2009 filed with the SEC on September 15, 2009 and incorporated herein by reference).* |
| |
10.26
| | Interim Services Agreement, dated as of December 17, 2009, by and between Farmer Bros. Co. and Tatum, LLCJeffrey A. Wahba (filed as Exhibit 10.1 to the Company’s Current Report on Form 8-K filed with the SEC on February 10, 2010September 2, 2011 and incorporated herein by reference).* |
| |
10.27
10.15 | | 2007 Omnibus PlanSecond Amended and Restated Employment Agreement, effective as of February 13, 2012, by and between Farmer Bros. Co. and Jeffrey A. Wahba (filed as Exhibit 10.1 to the Company’s Current Report on Form 8-K filed with the SEC on February 17, 2012 and incorporated herein by reference).* |
| | |
| 10.16 | | Letter Agreement, effective as of April 19, 2011, by and between Farmer Bros. Co. and Mark A. Harding (filed as Exhibit 10.3 to the Company’s Current Report on Form 8-K filed with the SEC on August 29, 2007May 23, 2011 and incorporated herein by reference).*
|
| | |
| 10.17 | | Employment Agreement, dated as of April 4, 2012, by and between Farmer Bros. Co. and Thomas W. Mortensen (filed as Exhibit 10.1 to the Company’s Current Report on Form 8-K/A filed with the SEC on April 10, 2012 and incorporated herein by reference).* |
| | |
| 10.18 | | Employment Agreement, effective as of April 19, 2011, by and between Farmer Bros. Co. and Patrick G. Criteser (filed as Exhibit 10.2 to the Company’s Current Report on Form 8-K filed with the SEC on May 23, 2011 and incorporated herein by reference).* |
| |
| 10.19 | | Amended and Restated Employment Agreement, effective as of February 13, 2012, by and between Farmer Bros. Co. and Patrick G. Criteser (filed as Exhibit 10.2 to the Company’s Current Report on Form 8-K filed with the SEC on February 17, 2012 and incorporated herein by reference).* |
| |
| 10.20 | | Employment Agreement, dated as of December 1, 2010, by and between Farmer Bros. Co. and Larry B. Garrett (filed as Exhibit 10.29 to the Company’s Annual Report on Form 10-K for the fiscal year ended June 30, 2011 filed with the SEC on September 12, 2011 and incorporated herein by reference).* |
|
| | |
10.28
| | |
| 10.21 | | Resignation Agreement, dated as of July 20, 2012, by and between Farmer Bros. Co. and Larry B. Garrett (filed as Exhibit 10.1 to the Company's Current Report on Form 8-K/A filed with the SEC on July 24, 2012 and incorporated herein by reference).* |
|
| | |
| | |
| 10.22 | | 2007 Omnibus Plan (filed herewith).* |
| |
| 10.23 | | Form of 2007 Omnibus Plan Stock Option Grant Notice and Stock Option Agreement (filed as Exhibit 10.1 to the Company’s Current Report on Form 8-K filed with the SEC on February 26, 2008 and incorporated herein by reference).* |
| |
10.29
10.24 | | Form of 2007 Omnibus Plan Restricted Stock Award Grant Notice and Restricted Stock Award Agreement (filed as Exhibit 10.2 to the Company’s Current Report on Form 8-K filed with the SEC on February 26, 2008 and incorporated herein by reference).* |
| |
10.30
10.25 | | Stock Ownership Guidelines for Directors and Executive Officers (filed as Exhibit 10.3 to the Company’s Current Report on Form 8-K filed with the SEC on February 26, 2008 and incorporated herein by reference).* |
| | |
| |
10.31
10.26 | | Form of Target Award Notification Letter (Fiscal 2010) under Farmer Bros. Co. 2005 Incentive Compensation Plan (filed as Exhibit 10.2 to the Company’s Current Report on Form 8-K filed with the SEC on December 16, 2009 and incorporated herein by reference).* |
| |
10.32
| | Form of Fiscal 2008 Award Letter2012) under Farmer Bros. Co. 2005 Incentive Compensation Plan (filed as Exhibit 10.1 to the Company’s Current Report on Form 8-K filed with the SEC on October 3, 2008September 21, 2011 and incorporated herein by reference).* |
| | |
10.33
10.27 | | Form of Target Award Notification Letter (Fiscal 2011) under Farmer Bros. Co. 2005 Incentive Compensation Plan (filed as Exhibit 10.1 to the Company’s Current Report on Form 8-K filed with the SEC on September 30, 2010 and incorporated herein by reference).* |
| |
| 10.28 | | Form of Change in Control Severance Agreement for Executive Officers of the Company (with schedule of executive officers attached) (filed as Exhibit 10.210.3 to the Company’s Current Report on Form 8-K8-K/A filed with the SEC on September 1, 2010April 10, 2012 and incorporated herein by reference).* |
| |
10.34
10.29 | | Form of Indemnification Agreement for Directors and Officers of the Company, as adopted on May 18, 2006 and as amended on December 31, 2008 (with updated schedule of indemnitees attached) (filed as Exhibit 10.110.2 to the Company’s Current Report on Form 8-K8-K/A filed with the SEC on September 1, 2010April 10, 2012 and incorporated herein by reference).* |
| |
14.1 | | Farmer Bros. Co. Code of Conduct and Ethics adopted on August 26, 2010 (filed as Exhibit 14.1 to the Company’s Current Report on Form 8-K filed with the SEC on September 1, 2010 and incorporated herein by reference). |
| |
21.1 | | List of all Subsidiaries of Farmer Bros. Co. (filed herewith). |
| |
23.1 | | Consent of Independent Registered Accounting Firm (filed herewith). |
| |
31.1 | | Principal Executive Officer Certification Pursuant to Securities Exchange Act Rules 13a-14 and 15d-14 as Adopted Pursuant to Section 302 of the Sarbanes-Oxley Act of 2002 (filed herewith). |
| |
31.2 | | Principal Financial and Accounting Officer Certification Pursuant to Securities Exchange Act Rules 13a-14 and 15d-14 as Adopted Pursuant to Section 302 of the Sarbanes-Oxley Act of 2002 (filed herewith). |
| |
32.1 | | Principal Executive Officer Certification Pursuant to 18 U.S.C. Section 1350 as Adopted Pursuant to Section 906 of the Sarbanes-Oxley Act of 2002 (furnished herewith). |
| |
32.2 | | Principal Financial and Accounting Officer Certification Pursuant to 18 U.S.C. Section 1350 as Adopted Pursuant to Section 906 of the Sarbanes-Oxley Act of 2002 (furnished herewith). |
| |
99.1 | | Properties List (filed herewith). |
| | |
|
| | |
| 99.2 | | Amended and Restated Audit Committee Charter (filed herewith). |
| | |
| 99.3 | | Amended and Restated Compensation Committee Charter (filed herewith). |
| | |
| 101 | | The following financial statements from the Company's Annual Report on Form 10-K for the fiscal year ended June 30, 2012, formatted in eXtensible Business Reporting Language: (i) Consolidated Balance Sheets, (ii) Consolidated Statements of Operations, (iii) Consolidated Statements of Comprehensive Income (Loss), (iv) Consolidated Statements of Cash Flows, (v) Consolidated Statements of Stockholders' Equity, and (vi) Notes to Consolidated Financial Statements (furnished herewith). |
| | |
________________
|
| |
| * | Management contract or compensatory plan or arrangement. |
75