UNITED STATES SECURITIES AND EXCHANGE COMMISSION
[ x ] ANNUAL REPORT PURSUANT TO SECTION 13 OR 15(d) OF THE
SECURITIES EXCHANGE ACT OF 1934
For the fiscal year ended August 31, 20102011
[ ] TRANSITION REPORT PURSUANT TO SECTION 13 OR 15(d)
OF THE SECURITIES EXCHANGE ACT OF 1934.
For the transition period fromto Commission File Number 0-22496
SCHNITZER STEEL INDUSTRIES, INC.
(Exact name of registrant as specified in its charter)
|
| | |
| OREGON | | 93-0341923 |
| (State of Incorporation) | | (I.R.S. Employer Identification No.) |
|
| | |
Portland, OR
| | 97210 |
| (Address of principal executive offices) | | (Zip Code) |
Registrant’s telephone number, including area code: (503) 224-9900
Securities registered pursuant to Section 12(b) of the Act:
|
| | |
Class A Common Stock, $1$1.00 par value | | The NASDAQ Global Select Market |
| (Title of Each Class) | | (Name of each Exchange on which registered) |
Securities registered pursuant to Section 12(g) of the Act:
Indicate by check mark if the registrant is a well-known seasoned issuer, as defined in Rule 405 of the Securities Act.
Indicate by check mark if the registrant is not required to file reports pursuant to Section 13 or Section 15(d) of the Act.
Indicate by check mark whether the registrant (1) has filed all reports required to be filed by Section 13 or 15(d) of the Securities Exchange Act of 1934 during the preceding 12 months (or for such shorter period that the registrant was required to file such reports), and (2) has been subject to such filing requirements for the past 90 days. Yes [ x ] No [ ]
Indicate by check mark whether the registrant has submitted electronically and posted on its corporate Website, if any, every Interactive Data File required to be submitted and posted pursuant to Rule 405 of Regulation S-T
(§232.405 of this chapter) during the preceding 12 months (or for such shorter period that the registrant was required to submit and post such files) Yes [
x ] No [ ]
Indicate by check mark if disclosure of delinquent filers pursuant to Item 405 of Regulation S-K
(§229.405) is not contained herein, and will not be contained, to the best of registrant’s knowledge, in definitive proxy or information statements incorporated by reference in Part III of this Form 10-K or any amendment to this Form 10-K. [
x ]
Indicate by check mark whether the registrant is a large accelerated filer, an accelerated filer, a non-accelerated filer or a smaller reporting company. See definitions of “large accelerated filer,” “accelerated filer” and “smaller reporting company” in Rule 12b-2 of the Exchange Act. (check one)
|
| | |
| Large Accelerated Filer [ x ] | | Accelerated Filer [ ] |
| Non-Accelerated Filer [ ] | | Smaller Reporting company [ ] |
Indicate by check mark whether the registrant is a shell company (as defined in Rule 12b-2 of the Exchange Act).
The aggregate market value of the registrant’s votingoutstanding common stock outstanding held by non-affiliates on February 28, 20102011 was $1,012,089,697.$1,504,015,968. The Registrantregistrant had 22,699,65724,183,138 shares of Class A common stock, par value of $1.00 per share, and 4,720,7603,048,522 shares of Class B common stock, par value of $1.00 per share, outstanding as of October 12, 2010.2011. DOCUMENTS INCORPORATED BY REFERENCE
Portions of the registrant’s definitive Proxy Statement for the January
20112012 Annual Meeting of Shareholders are incorporated
herein by reference
ininto Part
III.III of this report.
SCHNITZER STEEL INDUSTRIES, INC.
|
| | | |
| | | | | PAGE |
| |
| | 1 |
| | |
| | | |
| Item 1 | | | |
Item 1 1A | | | |
| Item 1B | | 2 |
Item 1A
| | Risk Factors | | 14 |
Item 1B
| | | |
| Item 2 | | 19 | |
Item 2 3 | | | |
| Item 4 | | 20 | |
Item 3
| | |
| | 20 | |
Item 4 5 | | Reserved | | 20 |
| | |
PART II
| | | | |
Item 5
| | | |
| Item 6 | | 21 |
Item 6
| | | |
| Item 7 | | 23 |
Item 7
| | | |
| Item 7A | | 24 |
Item 7A
| | | |
| Item 8 | | 43 |
Item 8
| | | |
| Item 9 | | 44 |
Item 9
| | | |
| Item 9A | | 84 |
Item 9A
| | | |
| Item 9B | | 84 | |
Item 9B
| | |
| | 84 | |
| | |
PART III
Item 10 | | | | |
Item 10
| | | |
| Item 11 | | 85 | |
Item 11 12 | | Executive Compensation | | 86 |
Item 12
| | | |
| Item 13 | | 86 |
Item 13
| | | |
| Item 14 | | 86 |
Item 14
| | | |
| | 86 |
| | |
| | | |
| Item 15 | | |
Item 15
| | | |
| | 87 |
| |
| | 90 |
FORWARD-LOOKING STATEMENTS
Statements and information included in this Annual Report on Form 10-K by Schnitzer Steel Industries, Inc. (the “Company”) that are not purely historical are forward-looking statements within the meaning of Section 21E of the Securities Exchange Act of 1934 and are made pursuant to the “safe harbor” provisions of the Private Securities Litigation Reform Act of 1995.
AllExcept as noted herein or as the context may otherwise require, all references to “we,” “our,” “us” and “SSI” refer to the
Company.Company and its consolidated subsidiaries.
Forward-looking statements in this Annual Report on Form 10-K include statements regarding our expectations, intentions, beliefs and strategies regarding the future, including statements regarding trends, cyclicality and changes in the markets we sell into; strategic direction; changes to manufacturing
and production processes; the cost of compliance with environmental and other laws; expected tax rates,
deductions and
deductions;credits; the realization of deferred tax assets; planned capital expenditures; liquidity positions; ability to generate cash from continuing operations; the potential impact of adopting new accounting pronouncements; expected results, including pricing, sales volumes and profitability; obligations under our retirement plans; savings or additional costs from business realignment and cost containment programs; and the adequacy of accruals.
When used in this report, the words “believes,” “expects,” “anticipates,” “intends,” “assumes,” “estimates,” “evaluates,” “may,” “could,” “opinions,” “forecasts,” “future,” “forward,” “potential,” “probable,” and similar expressions are intended to identify forward-looking statements.
We may make other forward-looking statements from time to time, including in press releases and public conference calls. All forward-looking statements we make are based on information available to us at the time the statements are made, and we assume no obligation to update any forward-looking statements, except as may be required by law. Our business is subject to the effects of changes in domestic and global economic conditions and a number of other risks and uncertainties that could cause actual results to differ materially from those included in, or implied by, such forward-looking statements. Some of these risks and uncertainties are discussed in Item 1A. Risk Factors of Part I of this Form 10-K. Other examples includeExamples of these risks include: potential environmental cleanup costs related to the Portland Harbor Superfund site; volatile supply and demand conditions affecting prices and volumes in the markets for both our products and raw materials we purchase; world economic conditions; world political conditions;difficulties associated with acquisitions and integration of acquired businesses; the impact of goodwill impairment charges; the inability of customers to fulfill their contractual obligations; the impact of foreign currency fluctuations; potential limitations on our ability to match raw material intake and finished product output with demand; changes in federal and state income tax laws; government regulations and environmental matters;access credit facilities; the impact of pending or new laws and regulations regardingthe consolidation in the steel industry; the impact of imports of foreign steel into and exportsthe U.S.; inability to realize expected benefits from the United States and other countries; foreign currency fluctuations; competition; seasonality, including weather; energy supplies;investments in technology; freight rates and availability of transportation; loss of key personnel; the inability to obtain sufficient quantities of scrap metal to support current orders; purchase price estimates made during acquisitions; business integration issues relating to acquisitions of businesses; creditworthiness of and availability of credit to suppliers and customers; new accounting pronouncements; availability of capital resources; business disruptions resulting from installation or replacement of major capital assets; andproduct liability claims; costs associated with compliance with environmental regulations; the adverse impact of climate change, including as a resultchange; inability to obtain or renew business licenses and permits; compliance with greenhouse gas emission regulations; reliance on employees subject to collective bargaining agreements; and the impact of treaties, legislation or regulations.the underfunded status of multiemployer plans in which we participate.
1 / Schnitzer Steel Industries, Inc. Form 10-K 2010 / 12011
PART I
Founded in 1906, Schnitzer Steel Industries, Inc., an Oregon corporation, is one of the nation’s largest recyclers of ferrous and nonferrous scrap metal, a leading recycler of used and salvaged vehicles and a manufacturer of finished steel products.
Our foundingThe foundation of our business
practice is a commitment to sustainability – recycling metal to generate additional value while achieving profitable growth.
TheIn recent years, the worldwide demand for scrap metal
ishas been driven by continued
strong demand for new steel products, electric arc furnace
(“EAF”) steel mill technology which relies on scrap metal as its primary feedstock and, to a certain extent, the use by blast furnaces of scrap metal,
because itwhich reduces energy costs
and use of virgin
materials use, water use and mining wastes.materials. The emerging markets, the primary end markets for our recycled scrap metal, currently generate insufficient levels of scrap metal to feed their steel production. This results in a need to source recycled scrap metal from developed economies, including the United States, which, together with domestic requirements, creates ongoing demand for our products.
Through our North American metals recycling business, we collect and recycle autobodies, rail cars, home appliances, industrial machinery, manufacturing scrap and construction demolition from bridges, buildings and other obsolete structures. With 4356 operating facilities located in 14 states, Western Canada and Puerto Rico, we are uniquely positionedwell-positioned to efficiently collect scrap metal throughout North America and export product to where demand is greatest. Utilizing our seven deep water ports, weWe sold to customers in 19 countries in fiscal 2011 and have the capability to export to customers around the world.world from our seven deep water ports.
Our metals recycling business also benefits from synergies with our auto parts business.business in certain geographic regions. Our auto parts business, which has 4550 retail locations, buys end-of-life vehicles, sells parts to retail and wholesale customers and sells scrap metal to metals recyclers, including our metals recycling business depending upon location.where geographically feasible. In addition, our metals recyclingsteel manufacturing business benefits from synergies with our steel manufacturingmetals recycling business, by sellingwhich is the sole supplier of the scrap metal toutilized by our steel mini-mill that producesto produce finished steel products such as rebar, wire rod, coiled rebar, merchant bar and other specialty products using nearly 100% recycled metal. In fiscal 2011, our metals recycling operations processed or brokered 5.3 million tons of ferrous scrap metal and 569 million pounds of nonferrous scrap metal; our revenues by major scrap product were approximately 79% ferrous and 20% nonferrous; and 82% of our revenues were from export sales.
We report the operations of these three businesses in three reporting segments: the Metals Recycling Business (“MRB”), the Auto Parts Business (“APB”) and the Steel Manufacturing Business (“SMB”). See Note 20 – Segment Information in the notesNotes to the consolidated financial statementsConsolidated Financial Statements in Part II, Item 8 of this report.report for a discussion of revenues from external customers, operating results from continuing operations and total assets by reporting segment.
Metals Recycling Business
MRB buys, collects, processes, recycles, sells and brokers ferrous scrap metal (containing iron) to foreign and domestic steel producers, including SMB, and nonferrous scrap metal (not containing iron) to both foreign and domestic markets. MRB processes mixed and large pieces of scrap metal into smaller pieces by
crushing, sorting, shearing, shredding, and torching, resulting in scrap metal pieces of a size, density and purity required by customers to meet their production needs. The manufacturing process includes physical separation of materials through
manualautomated and
sophisticated mechanicalmanual processes into ferrous and nonferrous sub-classifications, each of which has a value and metal content of importance to different customers for their end product.
To prepare scrap metal, we crush, sort and bale the material by classification for easier handling and sale. One of the most efficient ways to process and sort recycled scrap metal is through the use of shredding systems. Currently, each of MRB’s
port locations is equipped with shredders. Our largest port facilities in Everett, Massachusetts; Portland, Oregon; Oakland, California; and Tacoma, Washington
haseach operate a mega-shredder
capable of processing over 2,500 tons of scrap metal per day.with 7,000 to 9,000 horsepower. MRB’s Johnston, Rhode
Island facility operates a large shredder capable of processing up to 1,500 tons of scrap metal per day, MRB’sIsland; Salinas, Puerto
Rico facility operates a shredder that can process up to 500 tons of scrap metal per day and theRico; Kapolei, Hawaii; Anchorage, Alaska; and Concord, New Hampshire facilities
each operate smaller
shredders.shredders with 1,500 to 6,000 horsepower. Mega-shredders are designed to provide a denser product and, in conjunction with new separation equipment, a more refined and preferable form of ferrous scrap metal which can be more efficiently used by steel mills.
The larger shredders are also able to accept more types of material, resulting in more efficient processing. Shredders can reduce autobodies, home appliances and other scrap metal into fist-size pieces of shredded recycled scrap metal. The shredded material is then carried by conveyor under magnetized drums that attract the recycled ferrous scrap metal and separate it from the nonferrous scrap metal and other residue found in the shredded material, resulting in a consistent and high quality shredded ferrous product. The remaining nonferrous scrap metal and residue then pass through a series of
2 / Schnitzer Steel Industries, Inc. Form 10-K 2010
additional mechanical and manual sorting systems designed to separate the nonferrous metal from the residue. The remaining nonferrous metal is then hand-sorted and graded before being sold or sold as a mixed product. MRB continues to invest in nonferrous metal extraction and separation technologies in order to maximize the recoverability of valuable nonferrous metal. MRB also purchases nonferrous metal directly from industrial
2 / Schnitzer Steel Industries, Inc. Form 10-K 2011
vendors and other suppliers and
bundlesbales this metal to sell to customers.
MRB sells both ferrous and nonferrous scrap metal. The primary product produced is ferrous scrap metal, which is a key feedstock used in the production of finished steel products. Ferrous scrap metal is
primarily categorized into plate and structural
or “bonus,”(“bonus”), heavy melting steel (“HMS”) and shredded
scrap.scrap, although there are various grades of each category depending on cleanliness, size of individual pieces, and residual alloy content. These attributes affect the product’s relative value. Our nonferrous products include aluminum, copper, stainless steel, nickel, brass, titanium, lead, high temperature alloys and joint products such as zorba (primarily mixed nonferrous material) and zurik (predominantly stainless steel).
MRB sells its products
globally to steel mills,
foundries and smelters,
located inand is the
United States (“US”) and around the world and provides substantially allsole supplier of the ferrous scrap metal required by SMB.
Presented below are MRB revenues by continent for the last three
fiscal years ended August 31 (dollars in thousands):
| | | | | | | | | | | | | | | | | | | | | |
| | | 2010 | | | % of
Revenue | | | 2009 | | | % of
Revenue | | | 2008 | | | % of
Revenue | |
Asia | | $ | 1,228,022 | | | 67 | % | | $ | 981,127 | | | 70 | % | | $ | 1,437,850 | | | 53 | % |
North America | | | 503,651 | | | 28 | % | | | 301,093 | | | 22 | % | | | 917,485 | | | 34 | % |
Europe | | | 162,284 | | | 9 | % | | | 176,754 | | | 13 | % | | | 446,012 | | | 16 | % |
Africa | | | 85,813 | | | 5 | % | | | 48,681 | | | 3 | % | | | 261,503 | | | 9 | % |
Sales to SMB | | | (155,310 | ) | | (9 | %) | | | (109,985 | ) | | (8 | %) | | | (328,412 | ) | | (12 | %) |
| | | | | | | | | | | | | | | | | | | | | |
Total revenues (net of
intercompany) | | $ | 1,824,460 | | | 100 | % | | $ | 1,397,670 | | | 100 | % | | $ | 2,734,438 | | | 100 | % |
| | | | | | | | | | | | | | | | | | | | | |
|
| | | | | | | | | | | | | | | | | | | | |
| | 2011 | | % of Revenue | | 2010 | | % of Revenue | | 2009 | | % of Revenue |
| Asia | $ | 1,837,011 |
| | 63 | % | | $ | 1,228,022 |
| | 67 | % | | $ | 981,127 |
| | 70 | % |
| North America | 691,678 |
| | 24 | % | | 503,651 |
| | 28 | % | | 301,093 |
| | 22 | % |
| Europe | 325,191 |
| | 11 | % | | 162,284 |
| | 9 | % | | 176,754 |
| | 13 | % |
| Africa | 216,124 |
| | 7 | % | | 85,813 |
| | 5 | % | | 48,681 |
| | 3 | % |
| Sales to SMB | (169,331 | ) | | (5 | )% | | (155,310 | ) | | (9 | )% | | (109,985 | ) | | (8 | )% |
| Total (net of intercompany) | $ | 2,900,673 |
| | 100 | % | | $ | 1,824,460 |
| | 100 | % | | $ | 1,397,670 |
| | 100 | % |
In fiscal 2010,2011, MRB generated revenues of $10 million or more from customers in 1214 countries, including China, the United States, China, South Korea, Turkey, Egypt, Thailand, Taiwan, Malaysia, Thailand,Japan, Indonesia, Italy, India, Turkey, Egypt, Greece, IndonesiaSpain and Japan.Greece. MRB generated revenues of $10 million or more from customers in 12 countries in fiscal 20092010 and 14 countries2009.
MRB’s five largest external ferrous scrap metal customers accounted for 46% of recycled ferrous metal revenues in fiscal 2008.2011 and 35% in fiscal 2010 and 2009. MRB had no external customers that accounted for 10% or more of consolidated revenues in fiscal 2011, 2010 2009 or 2008.MRB’s five largest external ferrous scrap metal customers accounted for 35%, 35% and 37% of recycled ferrous metal revenues in fiscal 2010, 2009 and 2008, respectively.
. Customer purchase volumes of ferrous scrap metal vary from year to year due to demand, competition, economic growth, infrastructure spending, relative currency values, availability of credit and other factors. Ferrous metal sales are generallyprimarily denominated in USU.S. dollars, and almost all of the largestlarge shipments of ferrous scrap metal to foreign customers are supported by letters of credit. The table below sets forth, on a revenue and volume basis, the amount of recycled ferrous scrap metal sold by MRB to foreign and domestic customers during the last three fiscal years ended August 31:
| | | | | | | | | | | | | | | |
| | | 2010 | | 2009 | | 2008 |
| | | Revenues(1) | | Volume(2) | | Revenues(1) | | Volume(2) | | Revenues(1) | | Volume(2) |
Foreign | | $ | 1,188,490 | | 3,122 | | $ | 1,032,571 | | 3,436 | | $ | 1,935,084 | | 3,655 |
SMB | | | 155,310 | | 458 | | | 109,985 | | 335 | | | 328,412 | | 737 |
Other domestic | | | 214,864 | | 651 | | | 106,752 | | 418 | | | 327,300 | | 805 |
| | | | | | | | | | | | | | | |
Total | | $ | 1,558,664 | | 4,231 | | $ | 1,249,308 | | 4,189 | | $ | 2,590,796 | | 5,197 |
| | | | | | | | | | | | | | | |
|
| | | | | | | | | | | | | | | | | | | | |
| | 2011 | | 2010 | | 2009 |
| | Revenues(1) | | Volume(2) | | Revenues(1) | | Volume(2) | | Revenues(1) | | Volume(2) |
| Foreign | $ | 1,974,972 |
| | 4,236 |
| | $ | 1,188,490 |
| | 3,122 |
| | $ | 1,032,571 |
| | 3,436 |
|
| SMB | 166,259 |
| | 404 |
| | 155,310 |
| | 458 |
| | 109,985 |
| | 335 |
|
| Other domestic | 284,257 |
| | 689 |
| | 214,864 |
| | 651 |
| | 106,752 |
| | 418 |
|
| Total | $ | 2,425,488 |
| | 5,329 |
| | $ | 1,558,664 |
| | 4,231 |
| | $ | 1,249,308 |
| | 4,189 |
|
| |
| (1) | Revenues stated in thousands of dollars. |
| |
| (2) | Volume stated in thousands of long tons (one long ton = 2,240 pounds). |
Schnitzer Steel Industries, Inc. Form 10-K 2010 / 3
MRB
also sells
processed nonferrous scrap metal to
foreignspecialty steelmakers, foundries, aluminum sheet and
domestic customers.ingot manufacturers, copper refineries and smelters, brass and bronze ingot manufacturers and wire and cable producers globally. MRB continues to
growincrease its nonferrous volumes available for sale by extracting higher amounts of nonferrous products
due to improvements in the extraction processes used to recover nonferrous metal from the shredding process
due to investments in advanced separation technology and by expanding its nonferrous collection facilities.
3 / Schnitzer Steel Industries, Inc. Form 10-K 2011
The table below sets forth, on a revenue and volume basis, the amount of recycled nonferrous scrap metal sold by MRB to foreign and domestic customers during the last three fiscal years ended August 31:
| | | | | | | | | | | | | | | |
| | | 2010 | | 2009 | | 2008 |
| | | Revenues(1) | | Volume(2) | | Revenues(1) | | Volume(2) | | Revenues(1) | | Volume(2) |
Foreign | | $ | 288,472 | | 351,821 | | $ | 174,756 | | 294,016 | | $ | 239,765 | | 260,798 |
Domestic | | | 124,455 | | 126,665 | | | 76,752 | | 103,040 | | | 220,874 | | 178,672 |
| | | | | | | | | | | | | | | |
Total | | $ | 412,927 | | 478,486 | | $ | 251,508 | | 397,056 | | $ | 460,639 | | 439,470 |
| | | | | | | | | | | | | | | |
|
| | | | | | | | | | | | | | | | | | | | |
| | 2011 | | 2010 | | 2009 |
| | Revenues(1) | | Volume(2) | | Revenues(1) | | Volume(2) | | Revenues(1) | | Volume(2) |
| Foreign | $ | 412,891 |
| | 399,933 |
| | $ | 288,472 |
| | 351,821 |
| | $ | 174,756 |
| | 294,016 |
|
| Domestic | 206,749 |
| | 168,627 |
| | 124,455 |
| | 126,665 |
| | 76,752 |
| | 103,040 |
|
| Total | $ | 619,640 |
| | 568,560 |
| | $ | 412,927 |
| | 478,486 |
| | $ | 251,508 |
| | 397,056 |
|
| |
| (1) | Revenues stated in thousands of dollars. |
| |
| (2) | Volume stated in thousands of pounds. |
Pricing
PricingDomestic and foreign prices for ferrous scrap metal are generally based on prevailing market rates, which can differ by region and are subject to market cycles that are influenced by worldwide demand from steel and other metal producers and by the availability of materials that can be processed into saleable scrap metal, among other factors. Export recycled ferrous metal sales contracts generally provide for shipment within 30 to 9060 days after the price is agreed to which, in most cases, includes freight. Nonferrous metal sales contracts generally provide for shipment in less than 30 days after the price is agreed and typically include freight.
MRB responds to
changing price levelschanges in selling prices by adjusting scrap metal purchase prices at its recycling facilities in order to manage the impact on its operating income. The spread between selling prices and the cost of purchased material is subject to a number of factors, including differences in the market conditions in the domestic regions where recycled metal is acquired and the areas in the world where the processed materials are sold, market volatility from the time the selling price is agreed with the customer until the time the raw material is purchased, and changes in the
assumedestimated costs of transportation to the buyer’s facility. We believe MRB generally benefits from rising recycled metal selling prices, which allow it to better maintain or expand both operating income and unprocessed metal flow into its facilities, and suffers when recycled metal selling prices decline, which tend to compress its operating margins.
Markets
MarketsIn recent years, worldwide demand for finished steel products has been steadily growing, at a faster rate than the available supply ofwhich has increased demand for raw materials, in particular recycled ferrous metal, which is one of the primary raw materialsfeedstocks used in manufacturingEAFs to manufacture steel. During this time,In recent years, the demand for finished steel has been growing most rapidly in developing countriesemerging markets in Asia and the Mediterranean, which currently do not possess an adequate supply of raw materialsprocessed scrap metal to produce steel. As a result of this demand, MRB’s ferrous exports have made up 74%79%, 82%74% and 70%82% of its total ferrous sales volume in fiscal 2011, 2010 2009 and 2008,2009, respectively. The Asian developing countries have also been the primary recipients ofmarkets for MRB’s nonferrous products, with nonferrous exports making up 74%, 74% and 59%70% of its total nonferrous sales volumes in fiscal 2010, 20092011 and 2008, respectively. Unlike74% of its total nonferrous sales volumes in fiscal 2010 and 2009. While the ferrous export market is highly diversified with no single country dominating sales from year to year, in the nonferrous markets, China hasand the U.S. have been the largest destination for MRB’s nonferrous export sales.
Consolidation in the Scrap Metal Industrysales destinations.
The metals recycling industry has been consolidating over the last several years, primarily due to a high degree of fragmentation and the ability of large, well-capitalized processors to achieve competitive advantages by investing in capital improvements to improve efficiencies and lower processing costs. We believe that we are in a position to make reasonably priced acquisitions in the metals recycling industry as a result of our low levels of debt, historical ability to generate cash from operations and available borrowing capacity.
4 / Schnitzer Steel Industries, Inc. Form 10-K 2010
MRB delivers recycled ferrous and nonferrous scrap metal to foreign customers by ship and to domestic customers by barge, rail and
over the roadover-the-road transportation networks. Cost efficiencies are achieved by operating deep water terminal facilities at Everett, Massachusetts; Portland, Oregon; Oakland, California; Tacoma, Washington; and Providence, Rhode Island, all of which are owned except for the Providence, Rhode Island facility, which is operated under a long-term lease. We also have access to deep water terminal facilities at Kapolei, Hawaii and Salinas, Puerto Rico through public docks. These seven deep water terminals enable us to load
ferrous material in large vessels capable of
holding up to 50,000 tons for trans-oceanic shipments. Additionally, because we own most of the terminal facilities
inat which MRB operates, MRB is not normally subject to the same berthing delays often experienced by users of unaffiliated terminals. We believe that MRB’s loading costs are lower than they would be if it utilized
only third party terminal facilities. From time to time, MRB may enter into contracts of affreightment, which guarantee the availability of ocean going vessels, in order to manage the risks associated with ship availability and freight costs.
Our nonferrous products are shipped in containers which hold 20 to 30 tons from container ports and rail ramps located in close proximity to our recycling facilities. Containerized shipments are exported by marine vessels to customers all over the world and domestic shipments are typically shipped by rail or by truck.
Sources of Unprocessed Metal
The most common forms of purchased raw metal are obsolete machinery and equipment, such as automobiles, railroad cars,
4 / Schnitzer Steel Industries, Inc. Form 10-K 2011
railroad tracks, home appliances and other consumer goods, waste metal from manufacturing operations and demolition metal from buildings and other obsolete structures.
ThisRaw metal is acquired from
a diverse base of suppliers who unload at MRB’s facilities, from drop boxes at
a diverse base of suppliers’ industrial sites and through negotiated purchases from other large suppliers, including railroads, industrial manufacturers, automobile salvage facilities, metal dealers, various government entities and individuals. The majority of MRB’s scrap metal collection and processing facilities receive raw metal via major railroad routes, waterways or major highways.
MetalMetals recycling facilities situated near unprocessed metal sellers and major transportation routes have the competitive advantage of reduced freight costs because of the significant cost of freight relative to the cost of metal. The locations of MRB’s West Coast facilities allow it to competitively purchase raw metal from the Northern California region, northwards up the West Coast to Western Canada and Alaska and to the east, including Idaho, Montana, Utah, Colorado and Nevada. The locations of the East Coast facilities provide access to sources of unprocessed metal in New York, Connecticut, Maine, Massachusetts, New Hampshire, Rhode Island, Vermont, Eastern Canada and, from time to time, the Midwest. In the Southeastern
US,U.S., approximately half of MRB’s ferrous and nonferrous unprocessed metal volume is purchased from industrial companies, including
domestic and international auto manufacturers, with the remaining volume being purchased from smaller dealers and individuals. These industrial companies provide MRB with metals that are by-products of their manufacturing processes. The supply of scrap metal from these manufacturers can fluctuate with the level of automotive and other manufacturing production in the region.
Backlog
BacklogAs of October 13, 2010,September 30, 2011, MRB had a backlog of orders to sell $221$249 million of export ferrous metal compared to $73$221 million as of October 13, 2009.2010. Additionally, as of September 30, 2010,2011, MRB had a backlog of orders to sell $20$30 million of export nonferrous metal compared to $18$20 million as of September 30, 2009.
2010.
Competition
MRB faces stiff competition for both the purchase and sale of scrap metal.
MRB competes domestically for the purchase of scrap metal with large, well-financed recyclers of scrap metal, steel mills that own scrap yards and smaller metal facilities and dealers. In general, the competitive factors impacting the purchase of scrap metal are the price offered by the purchaser and the proximity of the purchaser to the scrap metal source. MRB also competes with brokers who buy scrap metal on behalf of domestic and foreign steel mills.
MRB competes globally for the sale of processed recycled metal to finished steel producers. The predominant competitive factors that impact recycled metal sales are price (including shipping cost), reliability of service, product quality and availability of scrap metal and scrap metal substitutes.
Schnitzer Steel Industries, Inc. Form 10-K 2010 / 5
No single scrap metals recycler has a dominant market share in the markets in which we do business.
We believe MRB’s ability to process substantial volumes of scrap metal products,
state of the artstate-of-the-art equipment, number of locations, access to a variety of different modes of transportation, geographic dispersion and cross-divisional synergies provide its business with competitive advantages.
Consolidation in the Scrap Metal Industry
The metals recycling industry has been consolidating over the last several years, primarily due to a high degree of fragmentation and the ability of large, well-capitalized processors to achieve competitive advantages by investing in capital improvements to improve efficiencies and lower processing costs. We believe that we are in a position to continue to make acquisitions in the metals recycling industry as a result of our historical ability to generate cash from operations and available borrowing capacity.
APB procures used and salvaged vehicles and sells serviceable used auto parts from these vehicles through its 4550 self-service auto parts stores which are located across the USU.S. and Western Canada. The remaining portions of the vehicles, primarily autobodies, cores (which include engines, transmissions, alternators and catalytic converters) and nonferrous materials, are sold to metal recyclers, including MRB where geographically feasible. APB completed the sale of its full-service used auto parts operation to LKQ Corporation in October 2009.
Self-service stores generally serve customers who are looking to obtain serviceable used auto parts at a competitive price. These customers remove the used auto parts from vehicles in inventory without the assistance of store employees. In addition, APB sells the cores to a variety of wholesale buyers and the scrap metal from end-of-life vehicles to MRB and third party recycling yards throughout the
USU.S. and Western Canada.
We believe that APB has an enhanceda competitive advantage throughbecause of: its various information technology systems, which are used to centrally manage and operate the geographically diverse network of stores; by applying aits consistent approach to offering customers a large selection of vehicles from which to obtain parts; and by its efficient processing of autobodies. APB had no external customers that accounted for 10% or more of consolidated revenues in fiscal 2011, 2010 and 2009 or 2008..
5 / Schnitzer Steel Industries, Inc. Form 10-K 2011
APB is dedicated to supplying low-cost used auto parts to its customers. In general, we believe that the sale prices of auto parts at APB’s self-service stores are significantly lower than those offered at full-service auto dismantlers, retail car parts stores and car dealerships. Each self-service store offers an extensive selection of vehicles (including domestic and foreign cars, vans and light trucks) from which consumers can remove parts. APB regularly rotates its vehicle inventory to provide its customers greater access to a continually changing parts inventory.
The table below sets forth APB revenues from domestic and foreign customers for the last three fiscal years ended August 31 (in thousands):
| | | | | | | | | | | | |
| | | 2010 | | | 2009 | | | 2008 | |
Domestic | | $ | 225,403 | | | $ | 144,346 | | | $ | 213,643 | |
Foreign | | | 15,830 | | | | 8,861 | | | | 14,439 | |
Sales to MRB | | | (49,538 | ) | | | (26,916 | ) | | | (48,759 | ) |
| | | | | | | | | | | | |
Total revenues (net of intercompany) | | $ | 191,695 | | | $ | 126,291 | | | $ | 179,323 | |
| | | | | | | | | | | | |
Fragmentation of the Auto Parts Industry
The auto parts industry is characterized by diverse and fragmented competition and is comprised of a large number of aftermarket and used auto parts suppliers of all sizes. These companies range from large, multinational corporations, which serve both original equipment manufacturers and the aftermarket on a worldwide basis, to small, local producers which supply only a few parts for a particular car model.
|
| | | | | | | | | | | |
| | 2011 | | 2010 | | 2009 |
| Domestic | $ | 296,554 |
| | $ | 225,403 |
| | $ | 144,346 |
|
| Foreign | 23,279 |
| | 15,830 |
| | 8,861 |
|
| Sales to MRB | (78,795 | ) | | (49,538 | ) | | (26,916 | ) |
| Total (net of intercompany) | $ | 241,038 |
| | $ | 191,695 |
| | $ | 126,291 |
|
APB sells used auto parts from each of its self-service retail stores. Upon arriving at a self-service store, a customer
typically pays an admission charge and signs a liability waiver before entering the car lot. When a customer finds a desired part on a vehicle, the customer removes it and pays a
pre-establishedlisted price for the part.
The wholesale component of APB’s business consists of core and scrapped vehicle sales. Catalytic converters are removed from the vehicle prior to it being placed in the customer area. Once the vehicle is removed from the customer area, coresthe remaining core parts, including engines, transmissions and alternators, are removed from the vehicle and consolidated at central facilities in California, Florida,6 / Schnitzer Steel Industries, Inc. Form 10-K 2010
Oregon, Texas and Calgary, Canada. From these facilities, the cores are sold to a variety of wholesale buyers through a competitive bidding process. Due to the larger quantities generated by this consolidation process, APB is able to obtain higher prices by focusing on larger wholesale customers that purchase in volume. After the core removal process is complete, the remaining autobody is crushed and sold as scrap metal in the wholesale market. The autobodies are sold on a price per ton basis, which is subject to fluctuations in the recycled ferrous metal markets. During fiscal 2010, 2009 and 2008, APB generated revenues of $50
$79 million $27, $50 million and $49$27 million during fiscal 2011, 2010 and 2009, respectively, from sales to MRB, making MRB the single largest customer of APB.
APB has customized marketing initiatives that are unique to its self-service brand. The brand marketing plan focuses on the acquisition of private party vehicles and attracting auto parts customers into the stores. The marketing plan targets the local markets surrounding the stores and incorporates various strategies, including the use of radio
and television advertising to promote vehicle purchasing, regularly scheduled in-store promotions and other forms of product promotion. Each store has a customized marketing calendar designed for its market and the community it serves.
APB typically seeks to locate its facilities with convenient access to major streets and in major population centers. By operating at locations that are convenient and visible to the target customer, the stores seek to become the customer’s first stop
inwhen acquiring used auto parts.
APB obtains vehicles from five primary sources: private parties, tow companies, charities, auto auctions and city contracts. APB has a program to purchase vehicles from private parties called “Cash for Junk Cars,” which is advertised in local markets. Private parties call a toll-free number and receive a quote for their vehicle. The private party can either deliver the vehicle to one of APB’s retail locations or arrange for the vehicle to be picked up. APB also employs car buyers who travel to vendors and bid on vehicles. In fiscal 2010, APB’s ability to obtain additional and higher quality vehicles was temporarily enhanced through the government’s Cash-For-Clunkers stimulus program.
The auto parts industry is characterized by diverse and fragmented competition and comprises a large number of aftermarket and used auto parts suppliers of all sizes. These companies range from large, multinational corporations, which serve both original equipment manufacturers and the aftermarket on a worldwide basis to small, local producers which supply only a few parts for a particular car model.
APB competes for the purchase of vehicles with other auto dismantlers, used car dealers, auto auctions and metal recyclers. In general, the main competitive factors impacting the purchase of vehicles are the price offered by the purchaser and the proximity of the purchaser to the source of the vehicle.
APB competes for the sale of used auto parts with other self-service and full-service auto dismantlers as well as larger well-financedwell-
6 / Schnitzer Steel Industries, Inc. Form 10-K 2011
financed retail auto parts businesses.
For sales of cores and scrapped vehicles, APB competes globally with other metal recyclers. The main competitive factors impacting the sale of APB’s products are price, availability of parts, quality and availability of scrapped product, and location of the retail stores that is convenient to customers.
Steel Manufacturing Business
SMB operates a steel mini-mill in McMinnville, Oregon that produces a wide range of finished steel products using recycled metal and other raw materials.
MRB is the sole supplier for SMB’s scrap metal requirements, which SMB purchases
substantially all of its recycled metal from MRB at rates that approximate export market prices for shipments from the West Coast of the
US.U.S.
Manufacturing
ManufacturingSMB’s melt shop includes an electric arc furnace (“EAF”),EAF, a ladle refining furnace, and a five-strand continuous billet caster and has enhanced steel chemistry refining capabilities, permitting the mill to produce special alloy grades of steel not currently produced by other mills on the USU.S. West Coast. The melt shop produced 454 thousand, 494 thousand and 401 thousand and 802 thousand tons of steel in the form of billets during fiscal 2011, 2010 2009 and 2008,2009, respectively. SMB continues to reinvest in its melt shop to improve efficiencies in the melting process.
SMB also operates two computerized rolling mills that allow for synchronized operations of the rolling mills and related equipment. Billets produced in SMB’s melt shop are reheated in two natural gas-fueled furnaces and are then hot-rolled through one of the two rolling mills to produce finished products. SMB has completed a number of improvement projects to both mills designed to increase both their operating efficiency and the types of products that can be competitively produced. SMB continues to monitor the market for new products and, through discussions with customers, identify additional opportunities to expand its product lines and sales.Schnitzer Steel Industries, Inc. Form 10-K 2010 / 7
SMB’s effective annual finished goods production capacity is approximately
800 thousand tons under current conditions.
SMB produces semi-finished goods (billets) and finished goods, consisting of rebar, coiled rebar, wire rod, merchant bar and other specialty products. Semi-finished goods are predominantly used for SMB’s finished products, but also have been produced for sale to other steel mills. Rebar is produced in either straight length steel bars or coils and used to increase the tensile strength of poured concrete. Coiled rebar is preferred by some manufacturers because it reduces the waste generated by cutting individual lengths to meet customer specifications and, therefore, improves yield. Wire rod is steel rod, delivered in coiled form, used by manufacturers to produce a variety of products such as chain link fencing, nails, wire and stucco netting. Merchant bar consists of round, flat, angle and square steel bars used by manufacturers to produce a wide variety of products, including gratings, steel floor and roof joists, safety walkways, ornamental furniture, stair railings and farm equipment. SMB is also certified to produce high quality rebar to support nuclear power plant construction.
The table below sets forth, on a revenue and volume basis, the sales of these products during the last three fiscal years ended August 31:
| | | | | | | | | | | | | | | |
| | | 2010 | | 2009 | | 2008 |
| | | Revenues(1) | | Volume(2) | | Revenues(1) | | Volume(2) | | Revenues(1) | | Volume(2) |
Rebar | | $ | 122,879 | | 217,302 | | $ | 129,750 | | 226,796 | | $ | 352,087 | | 470,111 |
Wire rod | | | 102,690 | | 157,677 | | | 67,800 | | 88,512 | | | 133,815 | | 178,508 |
Coiled rebar | | | 25,762 | | 43,005 | | | 25,404 | | 38,618 | | | 51,020 | | 67,598 |
Merchant bar | | | 19,381 | | 25,432 | | | 22,221 | | 27,181 | | | 49,324 | | 59,565 |
Other products(3) | | | 14,373 | | 40,199 | | | 18,094 | | 32,664 | | | 16,943 | | 32,048 |
| | | | | | | | | | | | | | | |
Total | | $ | 285,085 | | 483,615 | | $ | 263,269 | | 413,771 | | $ | 603,189 | | 807,830 |
| | | | | | | | | | | | | | | |
|
| | | | | | | | | | | | | | | | | | | | |
| | 2011 | | 2010 | | 2009 |
| | Revenues(1) | | Volume(2) | | Revenues(1) | | Volume(2) | | Revenues(1) | | Volume(2) |
| Finished steel products | $ | 317,338 |
| | 438,874 |
| | $ | 270,712 |
| | 443,416 |
| | $ | 245,175 |
| | 381,107 |
|
Semi-finished steel products(3) | 145 |
| | 199 |
| | 14,373 |
| | 40,199 |
| | 18,094 |
| | 32,664 |
|
| Total | $ | 317,483 |
| | 439,073 |
| | $ | 285,085 |
| | 483,615 |
| | $ | 263,269 |
| | 413,771 |
|
| |
| (1) | Revenues stated in thousands of dollars. |
| |
| (2) | Volume stated in short tons (one short ton = 2,000 pounds). |
| |
| (3) | Includes primarily sales of billets (semi-finished goods). billets. |
Customers
CustomersSMB’s customers are principally steel service centers, construction industry subcontractors, steel fabricators, wire drawers and major farm and wood products suppliers. During fiscal 2010,2011, SMB sold its finished steel products to customers located primarily in the Western USU.S. and Canada and its billets to customers in Asia.Canada. Customers in California accounted for 34%35% of SMB’s revenuerevenues in fiscal 2010.2011. SMB’s ten largest customers accounted for 54%53%, 47%54% and 36%47% of its revenues during fiscal 2011, 2010 2009 and 2008,2009, respectively. No SMB had no external customers thatcustomer accounted for 10% or more of consolidated revenues in fiscal 2011, 2010 and 2009 or 2008.
.
7 / Schnitzer Steel Industries, Inc. Form 10-K 2011
The table below sets forth SMB revenues from domestic and foreign customers for the last three fiscal years ended August 31 (in thousands):
| | | | | | | | | |
| | | 2010 | | 2009 | | 2008 |
Domestic | | $ | 206,943 | | $ | 226,675 | | $ | 515,629 |
Foreign(1) | | | 78,142 | | | 36,594 | | | 87,560 |
| | | | | | | | | |
Total | | $ | 285,085 | | $ | 263,269 | | $ | 603,189 |
| | | | | | | | | |
|
| | | | | | | | | | | |
| | 2011 | | 2010 | | 2009 |
| Domestic | $ | 256,888 |
| | $ | 206,943 |
| | $ | 226,675 |
|
Foreign(1) | 60,595 |
| | 78,142 |
| | 36,594 |
|
| Total | $ | 317,483 |
| | $ | 285,085 |
| | $ | 263,269 |
|
| |
| (1) | Includes sales to Canada of $56$59 million $27, $56 million and $52$27 million in fiscal 2011, 2010 2009 and 2008,2009, respectively. |
8 / Schnitzer Steel Industries, Inc. Form 10-K 2010
Consolidation in the Steel Industry
While the
The pace of consolidation in the
global steel industry has slowed
duein recent years consistent with the sluggish economic growth, particularly in the U.S. As the current outlook for construction and infrastructure spending in the U.S. remains weak, there is likely to
the impact of the global economic crisis, we continue to see consolidation ofbe some contraction domestically as smaller,
less well-capitalized steel producers
or fabricators. In addition,and fabricators exit the market and other firms reduce production. However, cross-border consolidation remains attractive due to
stronger demand from developing countries and the potential for achieving greater efficiency and economies of scale, particularly in response to the consolidation undertaken by raw material suppliers and consumers of steel products.
SMB sells directly from its mini-mill in McMinnville, Oregon
and its owned distribution center in El Monte, California (Los Angeles area)
and a third party distribution center in Lathrop, California (Central California). Products are shipped from the mini-mill to the distribution
centerscenter, primarily by rail. The distribution
centers facilitatecenter facilitates sales by maintaining an inventory of products close to major customers for just-in-time delivery. SMB communicates regularly with major customers to determine their anticipated needs and plans its rolling mill production schedule accordingly. Shipments to customers are made by common carrier, primarily truck or rail.
Recycled
Supply of Scrap Metal
Supply We believe SMB operates the only mini-mill in the Western
USU.S. that obtains
substantially all of its
recycledscrap metal requirements from
an affiliated metal
recycling operations.recycler. MRB
is able to deliverprovides a mix of recycled metal grades to
SMB, which allows SMB to achieve optimum efficiency in
SMB’sits melting operations.
As the steel mill and various MRB facilities are located on railway routes, SMB benefits from the ability to ship by either rail or truck.
SMB needs a significant amount of electricity to run its operations, primarily its EAF. SMB
purchasespurchased electricity under a long-term contract with McMinnville Water & Light,
that expires in September 2011, which in turn relies on the Bonneville Power Administration.
Electricity represented 4%, 3%The contract expired in September 2011 and
3% of SMB’s cost of goods sold in fiscal 2010, 2009 and 2008, respectively.SMB is currently negotiating a new contract with the same supplier.
SMB also needs a significant amount of natural gas to run its reheat furnaces, which are used to reheat billets prior to running them through the rolling mills. SMB meets this demand through a take-or-pay natural gas contractagreement with a utility provider that expires on May 31, 2011 and obligates itSMB at each month-end to purchase minimum quantitiesa set volume of gas for the immediately subsequent month on a take-or-pay basis priced using published natural gas per day through October 2010, whether or not the amount is utilized. Natural gasindices.
Energy costs represented 3%5%, 2%7% and 2%5% of SMB’s cost of goods sold in fiscal 2011, 2010 2009 and 2008,2009, respectively. See Note 14 – Derivative Financial Instruments and Fair Value Measurements in the notes to the consolidated financial statements in Part II, Item 8 of this report for further detail. Backlog
BacklogSMB generally ships products within days after the receipt of purchase orders. As of September 30, 20102011, SMB had a backlog of orders of $24$23 million, compared to $6$24 million as of September 30, 2009.
2010.
SMB’s primary domestic competitors for the sale of finished steel products include Nucor Corporation’s manufacturing facilities in Arizona, Utah and Washington,
TAMCO Steel’sGerdau Long Steel North America’s facility in California and Commercial Metals Company’s manufacturing facility in Arizona. In addition to domestic competition, SMB has historically competed with foreign steel producers, principally located in Asia, Canada, Mexico and Central and South America, primarily in shorter length rebar and certain wire rod grades.
TheCertain U.S. manufacturers have also expanded downstream distribution operations to include import products which are highly competitive due to lower production costs.The principal competitive factors in SMB’s market are price, product availability, quality and service. In addition, demand and the resulting level of steel imports are impacted by general economic conditions and the value of the
USU.S. dollar.
In 2002, the
US GovernmentU.S. government imposed anti-dumping and countervailing duties against wire rod products from eight foreign countries. These duties remain in effect today, are periodically reviewed and do not have a set expiration date. In 2007, the International Trade Commission extended existing rebar anti-dumping duties of up to 233% on imports from seven nations through
2012.
8 / Schnitzer Steel Industries, Inc. Form 10-K 2010 / 92011
2012.
Use of our Seven Deep Water Ports to Access Global Demand
We maintain
Our seven deep water terminal facilities
adjacent to our operating facilities in Everett, Massachusetts; Portland, Oregon; Oakland, California; Tacoma, Washington; and Providence, Rhode Island and also have access to deep water terminal facilities at Kapolei, Hawaii and Salinas, Puerto Rico through public docks. These seven deep water terminals enable us to
bulk load large vessels capable of trans-oceanic shipments,
which allowsthereby allowing us to
efficiently ship product globally to wherever demand is highest. Cost efficiencies are achieved because we own the majority of these terminal facilities,
asso we are not normally subject to the same berthing delays often experienced by users of unaffiliated
terminals.terminals, and because we are able to use bulk cargoes of up to 50,000 tons, which we believe to be more cost-efficient than containerized shipments that hold 20 to 30 tons because freight is generally lower on a per ton basis.
Acquisitions and Divestitures
We continue to focus on growth through
value-creating acquisitions
and will pursue acquisition opportunities we believe will create shareholder value and generate long-term returns in excess ofconsistent with our
cost of capital.strategy. With our historically strong balance sheet,
ability to generate positive cash flows from operations and available borrowing capacity, we believe we are in a position to continue to complete
reasonably priced acquisitions fitting our long-term strategic plans.
During fiscal 2011, we made the following acquisitions:
In September 2010, we acquired substantially all of the assets of SOS Metals Island Recycling, LLC, a metals recycler in Maui, Hawaii, to provide an additional source of scrap metal for our MRB Hawaii facility.
In November 2010, we acquired substantially all of the assets utilized by Specialized Parts Planet, Inc. at its Stockton, California used auto parts facility, which expanded APB’s presence in the Western U.S.
In December 2010, we acquired substantially all of the assets of Waco U-Pull It, Inc., a used auto parts store in Waco, Texas, which expanded APB’s presence in the Southwestern U.S.
In December 2010, we acquired substantially all of the assets of Macon Iron & Paper Stock Co., a metals recycler with two yards in Macon, Georgia, which expanded MRB’s presence in the Southeastern U.S.
In December 2010, we acquired substantially all of the assets of Steel Pacific Recycling Inc., a metals recycler with six yards on Vancouver Island, British Columbia, Canada, that previously supplied ferrous scrap to MRB’s Tacoma, Washington facility. This acquisition marked MRB’s initial expansion into Canada.
In January 2011, we acquired substantially all of the assets of State Line Scrap Co., Inc., a metals recycler with one yard in Attleboro, Massachusetts, which expanded MRB’s presence in the Northeastern U.S.
In January 2011, we acquired substantially all of the mobile car crushing assets of Northwest Recycling, Inc., based in Portland, Oregon, which provides scrap metal for MRB’s Portland, Oregon facility.
In February 2011, we acquired substantially all of the assets of Ferrill’s Auto Parts, Inc., a used auto parts business with three stores in Seattle, Washington, which expanded APB’s presence in the Northwestern U.S.
In March 2011, we acquired substantially all of the metals recycling business assets of Amix Salvage & Sales Ltd., which operated four metals recycling yards in British Columbia, Canada and two metals recycling yards in Alberta, Canada that previously supplied ferrous scrap to MRB’s Tacoma, Washington facility. This acquisition expanded MRB’s presence in Western Canada. As part of the consideration paid, we issued the seller common shares equal to 20% of the issued and outstanding capital stock of our acquisition subsidiary.
In April 2011, we acquired substantially all of the assets of American Metal Group, Inc. and certain of its affiliates, a metals recycler with yards in San Jose and Santa Clara, California that previously supplied ferrous scrap to MRB’s Oakland, California facility. This acquisition expanded MRB’s presence in the Western U.S.
During fiscal 2010, we
spent $41 million to acquire six self-service used auto parts stores and a metals recycler. These acquisitions were as follows:made the following acquisitions:In October 2009, we acquired substantially all of the assets of four of LKQ Corporation’s self-service used auto parts stores located near our MRB export facility in Portland, Oregon. This acquisition represented our first used auto parts operations in the Pacific Northwest.
In January 2010, we acquired substantially all of the assets of two of LKQ Corporation's self-service used auto parts stores, which increased to four the number of used auto parts facilities that we operate in the Dallas-Fort Worth Metroplex.
In April 2010, we acquired substantially all of the assets of Golden Recycling and Salvage, Inc., a metals recycler
9 / Schnitzer Steel Industries, Inc. Form 10-K 2011
in Montana, to provide an additional source of scrap metal for our Tacoma, Washington export facility.
In October 2009, we sold our full-service used auto parts operation, which had operated as part of the APB reporting segment, to LKQ Corporation. The full-service used auto parts operation is not included in APB’s results of operations in fiscal 2010
2009 or
20082009 because the results of this discontinued operation have been reclassified for all periods presented.
In
During fiscal 2009, we
acquiredmade the
following:following acquisitions: In December 2008, we acquired substantially all of the assets of Arrow Metals Corporation, a metals recycler in Washington, to provide an additional source of scrap metal to MRB’s Tacoma, Washington export facility.
In February 2009, we acquired Ponce Resources, Inc., the leading metals recycler in Puerto Rico. This acquisition expanded our presence into a new region, increased our processing capability and provided new sources of scrap metal and access to international export facilities.
In February 2009, we acquired an additional 16.66% equity interest in an auto parts business located in California, and in April 2009, we acquired the remaining 8.34% minority equity interest in this business, thus increasing our equity ownership in this business to 100%. The acquired equity was previously consolidated into our financial statements because we maintained operating control over the entity.
In February 2009, we acquired asubstantially all of the assets of two self-service used auto parts business with two locationsbusinesses in California operated by Specialized Parts Planet, Inc., thereby strengthening our presence in Northern California.
In March 2009, we acquired substantially all of the assets of Solid Waste Reduction Services, Inc., a metals recycler in Nevada, providing an additional source of scrap metal for MRB’s Oakland, California export facility.
In fiscal 2008, we acquired the following:
In September 2007, we acquired a mobile metals recycling business that provides additional sources of scrap metal to MRB’s Everett, Massachusetts facility.
In November 2007, we acquired two metals recycling businesses and in February 2008 we acquired one metals recycling business that expanded our presence in the Southeastern US.
10 / Schnitzer Steel Industries, Inc. Form 10-K 2010
In February 2008, we acquired the remaining 50% equity interest in an auto parts business located in Nevada in exchange for our 50% interest in the land and buildings owned by the business. The acquired business was previously consolidated into our financial statements because we maintained operating control over the entity.
In August 2008, we acquired a self-service used auto parts business with three locations in the Southern US.
Processing and Manufacturing Technology Improvements
We aim to be an efficient and competitive producer of both recycled metal and finished steel products in order to maximize the operating income for both operations. To meet this objective, we have historically focused on, and will continue to emphasize,
the cost-effective purchasing and efficient processing of scrap metal.During fiscal 2010, 2009 and 2008, we spent $64 million, $59 million and $84 million, respectively on capital improvements. These capital expenditures primarily reflect our significant investments in modern equipment to improve the efficiency and capabilities of our businesses and to further maximize our economies of scale. Our capital expenditures in fiscal 2010 included further investments in technology to improve the recovery of nonferrous materials from the shredding process and investments to further improve efficiency and increase capacity, increase worker safety and enhance environmental systems, including investments in storm water systems and in equipment to ensure ongoing compliance with air quality and other environmental regulations.
Capital projects in fiscal 2011 are expected to include continued investments in technology to improve the recovery of nonferrous materials from the shredding process, material handling and processing equipment, enhancements to our information technology infrastructure, improvements to our facilities’ environmental and safety infrastructure and normal equipment replacement and maintenance. We believe these investments will create or protect value for our shareholders.
Continued Improvements in Productivity and Focus on Cost Containment
We have continuous improvement programs that focus on increasing production from shredders, improving existing scrap metal recovery processes and ongoing performance initiatives throughout our operations. The objective of these programs is to identify areas in existing processes that may be inefficient or where current performance could be improved and to recommend and implement solutions that maycould increase revenues or reduce costs by increasing output or recovery.
During fiscal 2011, 2010 and 2009, we spent $105 million, $64 million and $59 million, respectively on capital improvements. These capital expenditures primarily reflect our significant investments in modern equipment to improve the efficiency and capabilities of our businesses and to further maximize our economies of scale. Our capital expenditures in fiscal 2011 included investments in technology to improve the recovery and separation of nonferrous materials from the shredding process and investments in infrastructure to improve efficiency, increase capacity, improve worker safety and enhance environmental systems.
Capital projects in fiscal 2012 are expected to include continued investments in technology to improve the recovery and separation of nonferrous materials from the shredding process, material handling and processing equipment, enhancements to our information technology infrastructure, improvements to our facilities’ environmental and safety infrastructure and normal equipment replacement and maintenance. We plan to invest up to $125 million in capital expenditures in fiscal 2012.
Impact of Legislation and Regulation
Compliance with environmental laws and regulations is a significant factor in our operations. Our businesses are subject to extensive local, state and federal environmental protection, health, safety and transportation laws and regulations relating to, among others:
The USU.S. Environmental Protection Agency (“EPA”);
Remediation under the Comprehensive Environmental Response, Compensation and Liability Act (“CERCLA”);
The discharge of materials and emissions into the air;
The prevention and remediation of soil and groundwater contamination;
The management and treatment of wastewater and storm water;
The treatment, handling and/or disposal of solid waste and hazardous waste; and
The protection of our employees’ health and safety.
10 / Schnitzer Steel Industries, Inc. Form 10-K 2011
These environmental laws regulate, among other things, the release and discharge of hazardous materials into the air, water and ground; exposure to hazardous materials; and the identification, storage, treatment, handling and disposal of hazardous materials. Environmental legislation and regulations have changed rapidly in recent years, and it is likely that we will be subject to even more stringent environmental standards in the future.
Schnitzer Steel Industries, Inc. Form 10-K 2010 / 11
Concern over climate change, including the impact of global warming, has led to significant
USU.S. and international regulatory and legislative initiatives to limit greenhouse gas (“GHG”) emissions. In 2007, the
USU.S. Supreme Court ruled that the EPA was authorized to regulate carbon dioxide under the
USU.S. Clean Air Act. As a consequence, the EPA initiated a series of regulatory efforts aimed at addressing greenhouse gases as pollutants, including finding that GHG emissions endanger public health, implementing mandatory GHG emission reporting requirements, setting carbon emission standards for light-duty vehicles and promulgating a New Source Review/Title V “tailoring rule” setting emissions thresholds beyond which stationary sources will require permits. Legislation has also been proposed in the
USU.S. Congress to address GHG emissions and global climate change, including “cap and trade” programs, and some form of federal climate change legislation or additional federal regulation is possible. In addition, we are required to annually report
our GHG emissions
from our steel mill to the State of Oregon Department of Environmental Quality
effective March 2010, and
to the
US EPA effective March 2011.EPA. A number of other states, including states in which we have operations and facilities, have considered, are considering or have already enacted legislation to develop information or address climate change and GHG emissions as well.
We
Although our objective is to maintain compliance with applicable environmental regulations, we have, in the past, been found not to be in compliance with certain environmental laws and regulations and have incurred liabilities, expenditures, fines and penalties associated with such violations. Our objective is to maintain compliance with applicable environmental regulations, andIn December 2000, we believewere notified by the EPA that we are materially in compliance with currently applicable environmental regulationsone of the potentially responsible parties that own or operate or formerly owned or operated sites which are part of or adjacent to the Portland Harbor Superfund site (see Note 1211 – Commitments and Contingencies in the notesNotes to the consolidated financial statementsConsolidated Financial Statements in Part II, Item 8 of this report). In fiscal 2010,2011, capital expenditures related to ongoing environmental compliance were $13$14 million, and we expect to spend approximately $18$14 million on capital expenditures for ongoing environmental compliance in fiscal 2011.2012. Indirect Consequences of Future Legislation and Regulation
Increased regulation regarding climate change and GHG emissions could impose significant costs on our business and our customers and suppliers, including increased energy, capital equipment, environmental monitoring and reporting and other costs in order to comply with regulations concerning
and limitations imposed on climate change and GHG emissions. The potential costs of allowances, offsets or credits that may be part of “cap and trade” programs or similar future regulatory measures are still uncertain. Any adopted future climate change and GHG regulations could negatively impact our ability (and that of our customers and suppliers) to compete with companies situated in areas not subject to such limitations. Furthermore, even without such regulation, increased awareness and any adverse publicity in the global marketplace about the GHGs emitted by companies in the
metalmetals recycling and steel manufacturing industries could harm our reputation and reduce customer demand for our products.
GHG legislation and regulation is also expected to have an effect on the price of electricity, especially when generated using carbon-based fuels.
As such,Accordingly, demand for SMB’s steel products could increase as its costs of production become more competitive, since they are manufactured using an EAF, which uses less energy than the blast furnaces of some of our competitors. Since the electricity supply for SMB includes a significant element of hydro-generated production, SMB’s energy costs are less likely to be impacted than those of our competitors using electricity generated by carbon-based fuels. In addition, demand for scrap metal may increase as a result of mills with blast furnaces seeking to maximize the scrap metal component of raw material infeed, as melting scrap metal involves less energy than is required for melting iron ore.
Since the use of recycled iron and steel instead of iron ore to make new steel results in savings in the consumption of energy, virgin materials and water and reduces mining wastes, we believe our recycled metal products position us to be more competitive in the future for business from companies wishing to reduce their carbon footprint and impact on the environment. In addition, our
electric arc furnaces generateEAF generates fewer
greenhouse gasGHG emissions than
the traditional blast furnaces.
Physical Impacts of Climate Change on Our Costs and Operations
There has been public discussion that climate change may be associated with
rising sea levels as well as extreme weather conditions such as
rising sea levels and more intense hurricanes, thunderstorms,
tornadostornadoes and snow or ice storms. Extreme weather conditions
12 / Schnitzer Steel Industries, Inc. Form 10-K 2010
may increase our costs or cause damage to our facilities, and any damage resulting from extreme weather may not be fully insured. As many of our recycling facilities are located near deep water ports, significantly rising sea levels may disrupt our ability to receive scrap metal, process the scrap metal through our mega-shredders and ship product to our customers. Our MRB and APB operations can also be impacted by severe weather conditions. Periods of extended adverse weather conditions may inhibit ourthe supply of scrap metal to MRB and SMB and end-of-life vehicles to APB which could cause us to fail to meet our sales commitments. In addition, ifsustained periods of increased temperature levels in the summer were to significantly increase for a sustained period in areas where our APB operations are located this could result in less customer traffic, thus resulting in reduced admissions and parts sales.
Employees
EmployeesAs of September 30, 2010,2011, we had 3,2374,090 full-time employees, consisting of 1,4912,161 employees at MRB, 1,1781,345 employees at APB, 413
11 / Schnitzer Steel Industries, Inc. Form 10-K 2011
416 employees at SMB and 155168 corporate administrative employees. Of these employees, 832869 were covered by collective bargaining agreements. The SMB contract with the United Steelworkers of America, which covers 297302 of these employees, was ratified in June 2008 and will expire on March 31, 2012. We believe that in general our labor relations are good. Our internet address iswww.schnitzersteel.com. The content of our website is not incorporated by reference into this Annual Report on Form 10-K. We make all filings with the Securities and Exchange Commission (“SEC”) available on our website, free of charge, under the caption “Investors – SEC Filings.” Included in these filings areFilings” our annual reports on Form 10-K, quarterly reports on Form 10-Q, current reports on Form 8-K, and any amendments to those reports, which are available as soon as reasonably practicable after electronically filing with or furnishing such materials to the SECSecurities and Exchange Commission (“SEC”) pursuant to Sections 13(a) or 15(d) of the Securities Exchange Act of 1934. The publicFrom time to time, we may readuse our website as a channel of distribution of material company information. Financial and copy any materials that are filed withother material information regarding our Company is routinely posted on and accessible at http://www.schnitzersteel.com/investors.aspx. In addition, you may automatically receive e-mail alerts and other information about our Company by enrolling your e-mail address by visiting the SEC“E-mail Alerts” section at the SEC’s Public Reference Room located at 100 F Street NE, Washington, DC 20549. The public may obtain information on the operation of the Public Reference Room by calling the SEC at 1-800-SEC-0330. The SEC also maintains electronic versions of reports on its website,www.sec.govhttp://www.schnitzersteel.com/investors.aspx.Schnitzer Steel Industries, Inc. Form 10-K 2010 / 13
Described below are risks, which are categorized as “Risk Factors Relating to Our Business,” “Risk Factors Relating to the Regulatory Environment” and “Risk Factors Relating to Our Employees,” that could have a material adverse effect on our results of operations,
and financial condition
and cash flows or could cause actual results to differ materially from the results contemplated by the forward-looking statements contained in this Annual Report. See “Forward-Looking Statements” that precedes Part I of this report. Additional risks and uncertainties that we are unaware of or that we currently deem immaterial may in the future have a material adverse effect on our results of operations,
financial condition and
financial condition.cash flows.
Risk Factors Relating to Our Business
Potential costs related to the environmental cleanup of Portland Harbor may be material to our financial position and liquidity
We have been
In December 2000, we were notified by the EPA under
the CERCLA that we are a potentially responsible party (“PRP”) that owns or operates or formerly owned or operated sites
which are part of or adjacent to the Portland Harbor Superfund site (the “Site”). The precise nature and extent of any cleanup of the Site, the parties to be involved, the process to be followed for any cleanup and the allocation of the costs for any cleanup among responsible parties have not yet been determined. A group of PRPs is currently conducting a remedial investigation and feasibility study (“RI/FS”) to identify and characterize the contamination at the Site and develop alternative approaches to remediation of the contamination. A separate process to allocate the costs of the RI/FS and the ultimate remedy is also currently underway. The EPA has indicated that it expects to issue a record of decision that will discuss remedial alternatives for the Site sometime in
2012.2013. Separately, the natural resource damages trustees for the Site are conducting a process to determine the amount of natural resource damages at the Site and identify the persons
potentially liable for such damages. It is currently unclear to what extent we will be liable for environmental costs or damages associated with the Site or for natural resource damage claims or third party contribution or damage claims with respect to the Site; however, given the size of the Site, the costs to date of the RI/FS and the nature of the conditions identified to date, the total cost of the investigations, remediation and natural resource damages claims are likely to be substantial. Significant cash outflows in the future related to the Site could reduce the amount of our borrowing capacity that could otherwise be used for investment in capital expenditures and acquisitions.
Any material liabilities incurred in the future related to the Site could result in our failure to maintain compliance with certain covenants in our debt agreements. Because there has not been a determination of the total investigation costs, the remediation that will be required, the amount of natural resource damages or how the costs of the ongoing investigations and any remedy and natural resource damages will be allocated among the PRPs, it is not
presentlycurrently possible to estimate the costs which we are likely to incur in connection with the Site, although such costs could be significant and material to our financial position, results of operations,
cash flows and
cash flows.liquidity. See
Contingencies“Contingencies –
EnvironmentalEnvironmental” in Note
1211 – Commitments and Contingencies in the
notesNotes to the
consolidated financial statementsConsolidated Financial Statements in Part II, Item 8 of this report.
Consolidation in the steel industry may reduce demand for our products
There has been a significant amount of consolidation in the steel industry in recent years that has included steel mills acquiring steel fabricators. This activity has been accelerated by the recent economic downturn where steel mills have acquired these customers to ensure demand for their products. If any of our significant customers were to be acquired by competing steel mills, this could reduce the demand for our products and force us to lower our prices, reducing our revenues, or to reduce production, which could increase our unit costs and have a material adverse effect on our financial condition and results of operations.
Significant decreases in scrap metal prices may adversely impact our operating results
The timing and magnitude of the cycles in the industries in which we operate are difficult to predict and are influenced by different economic conditions in domestic (where we typically acquire our raw materials) and foreign (where we typically sell a significant portion of our products) markets. Purchase prices for autobodies and scrap metal and selling prices for scrap and recycled metal are volatile and beyond our control. While we attempt to respond to changing recycled metal selling prices through adjustments to our metal purchase prices, our ability to do so is limited
14 / Schnitzer Steel Industries, Inc. Form 10-K 2010
by competitive and other market factors. A significant reduction in selling prices for recycled metal may adversely impact both our operating income and our ability to recover purchase costs from end customers.
Changes in the availability or price of raw materials
and end of life vehicles could
restrict our ability to meetreduce our sales
commitmentsOur businesses require certain materials that are sourced from third party suppliers. Although our cross-divisional synergies allow us to be our own source for some raw materials, particularly with respect to scrap metal for SMB, we rely on other suppliers as well as industryfor most of our raw material needs. Industry supply conditions generally which involvesinvolve risks, including the possibility of shortages of raw materials, increases in raw material costs and reduced control over delivery schedules. We procure our scrap inventory from numerous sources. These suppliers generally are not bound by long-term contracts and have no obligation to sell scrap metal to us. In periods of low scrap metal prices, suppliers may elect to hold scrap metal to wait for higher prices or intentionally slow their metal collection activities. If a substantial number of suppliers cease selling scrap metal to us, we will be unable to recycle metal at desired levels, and our results of operations and financial condition could be materially adversely affected. A slowdown
12 / Schnitzer Steel Industries, Inc. Form 10-K 2011
of industrial production in the U.S. may also reduce the supply of industrial grades of metal to the metals recycling industry, resulting in our having less recyclable metal available to process and market. In addition, increased foreign demand for scrap metal due to economic expansion in developing countries may result in increased competition for available domestic scrap metal. Failure to obtain a steady supply of scrap material could both adversely impact our ability to meet sales commitments and reduce our operating margins. Failure to obtain an adequate supply of end-of-life vehicles could adversely impact our ability to attract customers and charge admission fees and reduce our parts sales. Failure to obtain raw materials, such as alloys used in the steel-making process, could adversely impact our ability to make steel to the specifications of our customers.
Significant decreases in scrap metal prices may adversely impact our operating results
The timing and magnitude of the cycles in the industries in which we operate are difficult to predict and are influenced by different economic conditions in the domestic market, where we typically acquire our raw materials, and foreign markets, where we typically sell the majority of our products. Purchase prices for autobodies and scrap metal and selling prices for scrap metal are volatile and beyond our control. While we attempt to respond to changing scrap metal selling prices through adjustments to our metal purchase prices, our ability to do so is limited by competitive and other market factors. As a result, we may not be able to reduce our metal purchase prices to offset a sudden reduction in scrap metal sales prices, which may adversely impact our operating income and cash flows.
Acquisitions and integration of acquired businesses may result in operating difficulties and other unintended consequences
We have completed a number of recent acquisitions and expect to continue making acquisitions of complementary businesses to enable us to enhance our customer base and grow our revenues. Execution of our acquisition strategy involves a number of risks, including:
Difficulty integrating the acquired businesses’ personnel and operations;
Potential loss of key employees or customers of the acquired business;
Difficulties in realizing anticipated cost savings, efficiencies and synergies;
Inaccurate assessment of or undisclosed liabilities;
Inability to maintain uniform standards, controls and procedures; and
Managing the growth of a larger company.
If we do not successfully execute our acquisition strategy and the acquired businesses do not perform as projected, our financial condition and results of operations could be materially adversely affected.
Goodwill impairment charges may adversely affect our operating results
Goodwill is generated in connection with our acquisition strategy and represents the excess purchase price over the fair value of net assets acquired in business combinations. We test our goodwill balances for impairment on an annual basis and if events occur or circumstances change that indicate that the fair value of one or more of our reporting units may be below its carrying amount. In determining fair value, we use an income approach based on the present value of expected future cash flows utilizing a market-based weighted average cost of capital. Given that market prices of our reporting units are not readily available, we make various estimates and assumptions in determining the estimated fair values of the reporting units, including forecasts of future sales and operating costs, prices, capital expenditures, working capital requirements, discount rates, growth rates and general market conditions. Fair value determinations require considerable judgment and are sensitive to inherent uncertainties and changes in the factors described above. A sustained decline in the quoted market prices of our stock could denote a triggering event indicating that the fair value of goodwill may be impaired. As a result of our testing to evaluate the recoverability of goodwill, we may assess the need for an impairment charge, which could have an adverse effect on our results of operations.
Uncertain economic conditions may cause customers to be unable to fulfill their contractual obligations
We enter into export ferrous sales contracts preceded by negotiations that include fixing price, quantity, shipping terms and other contractual elements.terms. Upon finalization of these terms and satisfactory completion of other contractual contingencies, the customer typically opens a letter of credit to satisfy its obligation under the contract prior to our shipment of the cargo. Although not considered normal course of business, during uncertain economic conditions, we are at risk on consummating the transaction until successful completion ofthe customer successfully opens the letter of credit. As a result, customersCustomers may not be able to fulfill their contractual obligations or open letters of credit in times of illiquid market conditions. As of August 31, 2011 and 2010, 44%and 2009, 43% and 49%, respectively, of our trade accounts receivable balance was covered by letters of credit.Fluctuations
Increases in the value of the
USU.S. dollar relative to other currencies may reduce the demand for our products
A significant portion of MRB’s revenues and operating income earned is generated from sales to foreign customers, which are denominated in U.S. dollars, including customers located in Asia, Africa and Europe. A strong USU.S. dollar would make our products more expensive for non-USnon-U.S. customers, which could negatively impact export sales. A strong USU.S. dollar would also make imported metal products less expensive, resulting in an increase in imports of scrap metal, scrap substitutes and steel products into the US.U.S. As a result, our finished steel
13 / Schnitzer Steel Industries, Inc. Form 10-K 2011
products, which are made in the US,U.S., may become more expensive for our U.S. customers relative to imported raw metalsteel products.
We are exposed to translation and transaction risks associated with fluctuations in foreign currency exchange rates. Hedging instruments may not be effective in mitigating such risks and may expose us to losses or limit our potential gains.
Our operations in Canada expose us to translation and transaction risks associated with fluctuations in foreign currency exchange rates as compared to the U.S. dollar, our reporting currency. As a result, we are subject to foreign currency exchange risks due to exchange rate movements in connection with the translation of the operating costs and the assets and liabilities of our foreign operations into our functional currency for inclusion in our Consolidated Financial Statements.
We are also exposed to foreign currency exchange transaction risk. As part of our risk management program, we may use financial instruments, including foreign currency exchange forward contracts. While intended to reduce the effects of fluctuations in foreign currency exchange rates, these instruments may not be effective in reducing all risks related to such fluctuations and may limit our potential gains or expose us to losses. Although we do not enter into these instruments for trading purposes or speculation, and our management believes all such instruments are entered into as hedges of underlying physical transactions, these instruments are dependent on timely performance by our counterparties. Should our counterparties to such instruments or the sponsors of the exchanges through which these transactions are offered fail to honor their obligations due to financial distress or otherwise, we would be exposed to potential losses or the inability to recover anticipated gains from the transactions covered by these instruments.
Potential limitations on our ability to access capital resources may restrict our ability to operate
Our operations are capital intensive. For the five-year period ended August 31, 2011, our total capital expenditures, excluding acquisitions, were approximately $393 million. Our business also requires substantial expenditures for routine maintenance. While we expect that our cash requirements, including the funding of capital expenditures, debt service and any contingencies, will be financed by internally generated funds or from borrowings under our unsecured committed bank credit facility, there can be no assurance that this will be the case. Additional acquisitions could require financing from external sources.
Although we believe we have adequate access to contractually committed borrowings, we could be adversely affected if our banks refused to honor their contractual commitments or ceased lending. While we believe the lending institutions participating in our credit arrangements are financially capable, recent events in the global credit markets, including the failure, takeover or rescue by various government entities of major financial institutions, have created uncertainty of credit availability to an extent not experienced in recent decades. Failure to access our credit facilities could restrict our ability to fund operations, make capital expenditures or execute acquisitions.
The agreement governing our bank credit facility imposes certain restrictions on our business and contains financial covenants
Our unsecured committed bank credit agreement contains certain restrictions on our business, including our ability to create liens, enter into transactions with affiliates, acquire and dispose of businesses, guarantee debt, and consolidate or merge. These restrictions may affect our ability to operate our business and may limit our ability to take advantage of potential business opportunities as they arise. Our bank credit agreement also requires that we maintain certain financial and other covenants, including a minimum fixed charge coverage ratio and a maximum leverage ratio. Our ability to comply with these covenants may be affected by events beyond our control, including prevailing economic, financial and industry conditions. Our failure to comply with any of these restrictions or financial covenants could result in an event of default under the bank credit agreement, and permit our lenders to declare all amounts borrowed from them to be due and payable, together with accrued and unpaid interest, which we may not be able to do at terms acceptable to us, or at all.
Consolidation in the steel industry may reduce demand for our products
There has been a significant amount of consolidation in the steel industry in recent years that has included steel mills acquiring steel fabricators to ensure demand for their products. If any of our significant remaining customers were to be acquired by competing steel mills, this could reduce the demand for our products and force us to lower our prices, reducing our revenues, or to reduce production, which could
increase our unit costs and have a material adverse effect on our financial condition and results of operations.
Increases in imports of foreign steel into the
USU.S. may reduce domestic demand for our products
Economic expansion in China and other foreign countries has affected the availability, and increased the price volatility, of recycled metal and steel products. Expansions and contractions in these economies can significantly affect the price of commodities used and sold by our business, as well as the price of finished steel products. Additionally, in a number of foreign countries, such as China, steel producers are generally government-owned and may therefore make production decisions based on political or other factors that do not reflect market conditions. Disruptions in foreign markets from excess steel production may encourage importers to target the USU.S. with excess capacity at aggressive prices, and existing trade laws and regulations may be inadequate to prevent unfair trade practices, which could have a material adverse effect on our financial condition and results of operations. IfAlthough
14 / Schnitzer Steel Industries, Inc. Form 10-K 2011
trade regulations restrict the importation of certain products, if foreign steel production significantly exceeds consumption in those countries, imports of steel products into the
USU.S. could increase, resulting in lower volumes and selling prices for SMB’s steel products.
Failure to realize expected benefits from investments in processing and manufacturing technology may impact our operating results
We make significant investments in processing and manufacturing technology improvements aimed at increasing the efficiency and capabilities of our businesses and to maximize our economies of scale. Failure to realize the anticipated benefits and generate adequate returns on such capital improvement projects may have a material adverse effect on our results of operations and cash flows.
Reliance on third party shipping companies may restrict our ability to ship our products
MRB and SMB generally rely on third parties to handle and transport
their raw materials to their production facilities and finished products to end users.
DueDespite our practice of utilizing a diversified group of suppliers, due to factors beyond our control, including changes in fuel prices, political events, governmental regulation of transportation, changes in market rates, carrier availability and disruptions in transportation infrastructure,
our suppliersthird party shipping companies may be forced to increase their charges for transportation services or
Schnitzer Steel Industries, Inc. Form 10-K 2010 / 15
otherwise reduce the availability of their vehicles or ships, and thus we may not be able to transport our products in a timely and cost-effective manner, which could have a material adverse effect on our financial condition and results of operations and may harm our reputation.
Equipment upgrades and equipment failures may lead to production curtailments or shutdowns
Our recycling and manufacturing processes depend upon critical pieces of equipment, including shredders and furnaces, which may be out of service occasionally for scheduled upgrades or maintenance. Our equipment is also subject to failure and the risk of catastrophic loss due to unanticipated events such as fires, accidents or violent weather conditions. As a result, we may experience interruptions in our processing and production capabilities, which could inhibit our ability to meet our sales commitments and thus have a material adverse effect on our financial condition and results of operations.
The cost and availability of electricity and natural gas are subject to volatile market conditions and may restrict our ability to manufacture our products
We rely on third parties for our supply of energy resources that are consumed in the manufacturing of our products. The prices for and availability of electricity, natural gas and other energy resources are subject to volatile market conditions which can be affected by weather conditions and political and economic factors that are beyond our control. Disruptions in the supply of energy resources could impair our ability to process and manufacture our products for our customers or result in increases in our energy costs, which could have a material adverse effect on our financial condition and results of operations.
Goodwill impairment charges may adversely affect our operating results
We test our goodwill balances for impairment on an annual basis and if events occur or circumstances change that would reduce the fair value of the reporting segment below the reporting segment’s carrying amount. In determining fair value, we use an income approach based on the present value of expected future cash flows utilizing a market-based weighted average cost of capital. Given that market prices of our reporting segments are not readily available, we make various estimates and assumptions in determining the estimated fair values of the reporting segments, including forecasts of future sales and operating costs, prices, capital expenditures, working capital requirements, discount rates, growth rates and general market conditions. Fair value determinations require considerable judgment and are sensitive to inherent uncertainties and changes in the factors described above. However, in light of current economic conditions, impairments to one or more of our reporting segments could occur in interim periods, whether or not connected to the annual goodwill impairment analysis. A sustained decline in the quoted market prices of our stock could denote a triggering event indicating that the fair value of goodwill may be impaired. At that time, additional testing would be performed to evaluate the recoverability of goodwill and assess the need for an impairment charge, which could have an adverse effect on our financial condition and results of operations.
Inability to integrate future acquisitions may adversely impact our operating results
We have completed a number of recent acquisitions and expect to continue making acquisitions of, and strategic alliances with, complementary businesses to enable us to enhance our customer base and grow our revenues. Execution of this strategy involves a number of risks, including:
Inaccurate assessment of or undisclosed liabilities;
Difficulty integrating the acquired businesses’ personnel and operations;
Potential loss of key employees or customers of the acquired business;
Difficulties in realizing anticipated cost savings, efficiencies and synergies;
Competition for such acquisitions and alliances;
Inability to maintain uniform standards, controls and procedures; and
Managing the growth of a larger company.
Failure to successfully integrate acquisitions could have a material adverse effect on our financial condition and results of operations.
16 / Schnitzer Steel Industries, Inc. Form 10-K 2010
Potential limitations on our ability to access credit facilities may restrict our ability to operate
Although we believe we have adequate access to contractually committed borrowings, we could be adversely affected if our banks refused to honor their contract commitments or ceased lending. While we believe the lending institutions participating in our credit arrangements are financially capable, recent events in the global credit markets, including the failure, takeover or rescue by various government entities of major financial institutions, have created uncertainty of credit availability to an extent not experienced in recent decades. Failure to access our credit facilities could restrict our ability to fund operations or make strategic acquisitions.
Product liability claims may adversely impact our operating results
We could inadvertently acquire radioactive scrap metal that could potentially end up in mixed scrap metal shipped to consumers worldwide. Although we have invested in radiation detection equipment in
certainthe majority of our locations,
including the facilities from which we ship directly to
address this risk,customers, failure to detect radioactive scrap metal remains a possibility. Even though we maintain insurance to address the risk of this failure in detection, there can be no assurance that the insurance coverage would be adequate or will continue to be available on acceptable terms. In addition, if we fail to meet contractual requirements for a product, we may be subject to product warranty costs and claims. These costs
are generally not insured and
claims could both have a material adverse effect on our financial condition and results of operations and harm our reputation.
Increases in consumer fuel costs and decreases in the miles they drive may decrease demand for our auto parts
In times of rapid increases in crude oil and gasoline prices, motorists may reduce the amount of travel by automobile. As the economy slows, consumer confidence weakens and fuel costs become a more significant factor in buying decisions and discretionary driving. Over time, significantly reduced driving leads to fewer accidents and lower demand for replacement parts, which may impact APB’s parts sales.
Risk Factors Relating to the Regulatory Environment
Environmental regulations may cause us to incur significant compliance costs
Compliance with environmental laws and regulations is a significant factor in our business. We are subject to local, state and federal environmental laws and regulations in the
USU.S. and other countries relating to, among other matters:
Waste water and storm water management and treatment;
Soil and groundwater contamination remediation;
The discharge, storage, handling and disposal of hazardous materials; and
Employee health and safety.
We are also required to obtain environmental permits from governmental authorities for certain operations. Violation of or failure to obtain permits or comply with these laws or regulations could result in our business being fined or otherwise sanctioned by regulators or becoming subject to litigation by private parties. Our operations use,
handle and generate hazardous substances. In addition, previous operations by others at facilities that we currently or formerly owned, operated or otherwise used may have caused contamination from hazardous substances. As a result, we are exposed to possible claims under environmental laws and regulations, especially for the remediation of waterways and soil or groundwater contamination. These laws can impose liability for the cleanup of hazardous substances even if the owner or operator was neither aware of nor responsible for the release of the hazardous substances. We have, in the past, been found not to be in compliance with certain of these laws and regulations, and have incurred liabilities, expenditures, fines and penalties associated with such violations. Although we believe that we are currently in material compliance with all applicable environmental laws and regulations, future environmental compliance costs may increase because of new laws and regulations and changing interpretations by regulatory authorities, uncertainty regarding adequate pollution control levels, the future costs of pollution control technology and issues related to global climate change. Environmental compliance costs and potential environmental liabilities could have a material adverse effect on our financial condition and results of operations.
15 / Schnitzer Steel Industries, Inc. Form 10-K 2010 / 172011
Climate change may adversely impact our facilities and our ongoing operations
The potential physical impacts of climate change on our operations are highly uncertain and will be particular to the geographic circumstances. These may include
significant rising sea levels at our deep water port facilities, changing storm patterns and intensities, and changing temperature levels. As many of our recycling facilities are located near deep water ports, rising sea levels may disrupt our ability to receive scrap metal, process the scrap metal through our mega-shredders and
to ship
productproducts to our customers.
Our MRB and APB operations are also dependent upon weather conditions. Periods of extended adverse weather conditions may inhibit
ourthe supply of scrap metal
to MRB and SMB and end-of-life vehicles to APB which could cause us to fail to meet our sales commitments. In addition,
ifsustained periods of increased temperature levels in the summer
were to significantly increase for a sustained period in areas where our APB operations are located
this could result in less customer traffic, thus resulting in reduced admissions and parts sales.
Our effective tax rate
Governmental agencies may refuse to grant or renew our licenses and permits, thus restricting our ability to operate
We conduct certain of our operations subject to licenses, permits and approvals from state and local governments. Governmental agencies often resist the establishment of certain types of facilities in their communities, including auto parts facilities. In addition, from time to time, both the U.S. and foreign governments impose regulations and restrictions on trade in the markets in which we operate. In some countries, governments can require us to apply for certificates or registration before allowing shipment of recycled metal to customers in those countries. There can be no assurance that future approvals, licenses and permits will be granted or that we will be able to maintain and renew the approvals, licenses and permits we currently hold. Failure to obtain these approvals could
increase if our earnings fromcause us to limit or discontinue operations in
Puerto Rico are taxed at higher ratesWe currently calculate the taxesthese locations or prevent us from developing or acquiring new facilities, which could have a material adverse effect on our earnings in Puerto Rico to include benefits from industrial tax exemptions available to companies doing business there. Should it be determined by Puerto Rican taxing authorities that we are not entitled to all or a portion of these exemptions, the taxes on our earnings from operations in Puerto Ricofinancial condition and our consolidated effective tax rate could increase, which would adversely impact our results of operations and financial position.
operations.
Compliance with existing and new greenhouse gas emission regulations may adversely impact our operating results
Increased regulation regarding climate change and GHG emissions could impose significant costs on our business and our customers and suppliers, including increased energy, capital equipment, environmental monitoring and reporting and other costs in order to comply with regulations concerning and limitations imposed on climate change and GHG emissions. The potential costs of allowances, offsets or credits that may be part of “cap and trade” programs or similar future regulatory measures are still uncertain. Any adopted future climate change and GHG regulations could negatively impact our ability (and that of our customers and suppliers) to compete with companies situated in areas not subject to such limitations. Until the timing, scope and extent of any future regulation becomes known, we cannot predict the effect on our financial condition, operating performance or ability to compete. Furthermore, even without such regulation, increased awareness and any adverse publicity in the global marketplace about the GHGs emitted by companies in the metal recycling and steel manufacturing industries could harm our reputation and reduce customer demand for our products. See
“Business - Environmental
MattersMatters” in Part I, Item 1 of this report for further detail.
Governmental agencies may refuse to grant or renew our licenses and permits, thus restricting our ability to operate
We conduct certain of our operations subject to licenses, permits and approvals from state and local governments. Governmental agencies often resist the establishment of certain types of facilities in their communities, including auto parts facilities. In addition, from time to time, both the US and foreign governments impose regulations and restrictions on trade in the markets in which we operate. In some countries, governments can require us to apply for certificates or registration before allowing shipment of recycled metal to customers in those countries. There can be no assurance that future approvals, licenses and permits will be granted or that we will be able to maintain and renew the approvals, licenses and permits we currently hold. Failure to obtain these approvals could cause us to limit or discontinue operations in these locations or prevent us from developing or acquiring new facilities, which could have a material adverse effect on our financial condition and results of operations.
Risk Factors Relating to Our Employees
Reliance on employees subject to collective bargaining may restrict our ability to operate
Approximately 26%21% of our full-time employees are represented by unions under collective bargaining agreements.agreements, including substantially all of the manufacturing employees at our SMB steel manufacturing facility. As these agreements expire, we may not be able to negotiate extensions or replacements of such agreements on acceptable terms. Any failure to reach an agreement with one or more of our unions may result in strikes, lockouts or other labor actions, including work slowdowns or stoppages, which could have a material adverse effect on our results of operations.18 / Schnitzer Steel Industries, Inc. Form 10-K 2010
The underfunded status of our multiemployer pension plans may cause us to increase our contributions to the plans
As discussed in Note 15 – Employee Benefits in the
notesNotes to the
consolidated financial statementsConsolidated Financial Statements in Part II, Item 8 of this report, we have been notified that the multiemployer plan benefiting union employees of SMB has an accumulated funding deficiency (i.e., a failure to satisfy the minimum funding requirements)
for the current plan year and is
therefore “in critical status.”in a certified Red Zone Status as defined by the Pension Protection Act of 2006 as of August 31, 2011. Because the plan is in
“critical status,”Red Zone Status, it is required to adopt a rehabilitation plan, which may involve contribution increases, benefit reductions or a combination of the two. At this time, we are not required to make surcharge payments as we are already signatory to an agreement that requires annual six percent contribution increases.
Our withdrawal liability, which would be triggered if we were to withdraw or partially withdraw from the plan, was calculated by the plan actuary to be $28 million as of September 30, 2009. Because we have no current intention of withdrawing from the plan, we have not recognized a
withdrawal liability
for this contingency.in our consolidated financial statements. However, if such a liability were triggered, it
wouldcould have a material adverse effect on our results of operations and cash flows. Our contributions to this plan could also increase as a result of a diminished contribution base due to the insolvency or withdrawal of other employers who currently contribute to the plan, the inability or failure of withdrawing employers to pay their withdrawal liability or other funding deficiencies, as we would need to fund the retirement obligations of these employers.
Approximately 60% of our multiemployer pension plan contributions are made to the Western Independent Shops Pension Trust (the “WISP Trust”) for the benefit of union employees of SMB. In 2004, the Internal Revenue Service (“IRS”) approved a seven-year extension of the period over which the WISP Trust may amortize unfunded liabilities, conditioned upon maintenance of certain minimum funding levels. Based on the actuarial valuation for the WISP Trust as of October 1, 2009 (the latest available actuarial information), the funded percentage of the WISP Trust (based on the ratio of the market value of assets to the accumulated benefits liability (present value of accrued benefits)) was 65.4%, which is below the targeted funding ratio specified in the agreement with the IRS. As a result, the WISP Trust is in the process of seeking relief from the specified funding requirement from the IRS. If the WISP Trust cannot obtain relief, revocation by the IRS of the amortization extension retroactively to the 2002 plan year could occur and result in a material liability for our share of the resulting funding deficiency, the extent of which currently cannot be estimated.
ITEM 1B. UNRESOLVED STAFF COMMENTS
None.
16There are currently no unresolved issues with respect to any SEC staff written comments that were received 180 days or more before the end of fiscal 2010 that relate to our periodic or current reports under the Securities and Exchange Act of 1934.
/ Schnitzer Steel Industries, Inc. Form 10-K 2010 / 192011
Our facilities and administrative offices by type, including their total acreage, were as follows as of August 31, 2010: | | | | | | | | |
Division | | No. of Facilities | | Acreage |
| | | Leased | | Owned | | Total |
Corporate offices – Domestic | | 2 | | 1 | | 0 | | 1 |
Metal Recycling Business: | | | | | | | | |
Domestic: | | | | | | | | |
Collection and processing | | 37 | | 26 | | 652 | | 678 |
Collection | | 6 | | 2 | | 21 | | 23 |
Inactive | | 5 | | 0 | | 24 | | 24 |
Auto Parts Business: | | | | | | | | |
Domestic(1) | | 42 | | 563 | | 108 | | 671 |
Foreign(2) | | 3 | | 46 | | 0 | | 46 |
Steel Manufacturing Business: | | | | | | | | |
Domestic: | | | | | | | | |
Steel mill and administrative offices | | 2 | | 0 | | 85 | | 85 |
Inactive | | 2 | | 2 | | 51 | | 53 |
| | | | | | | | |
Total company: | | | | | | | | |
Domestic | | 96 | | 594 | | 941 | | 1,535 |
Foreign(2) | | 3 | | 46 | | 0 | | 46 |
| | | | | | | | |
Total | | 99 | | 640 | | 941 | | 1,581 |
| | | | | | | | |
|
| | | | | | | | | | | |
| Division | No. of Facilities | | Acreage |
| Leased | | Owned | | Total |
| Corporate offices – Domestic | 2 |
| | 1 |
| | — |
| | 1 |
|
| Metal Recycling Business: | | | | | | | |
| Domestic: | | | | | | | |
| Collection and processing | 42 |
| | 36 |
| | 712 |
| | 748 |
|
| Collection | 6 |
| | 3 |
| | 21 |
| | 24 |
|
| Inactive | 5 |
| | 8 |
| | 11 |
| | 19 |
|
Foreign:(2) | | | | | | | |
| Collection and processing | 5 |
| | 40 |
| | 4 |
| | 44 |
|
| Collection | 3 |
| | 22 |
| | 2 |
| | 24 |
|
| Inactive | 2 |
| | 10 |
| | — |
| | 10 |
|
| Other | 1 |
| | 12 |
| | — |
| | 12 |
|
| Auto Parts Business: | | | | | | | |
Domestic:(1) | | | | | | | |
| Administrative offices and other | 3 |
| | 5 |
| | — |
| | 5 |
|
| Stores | 47 |
| | 612 |
| | 107 |
| | 719 |
|
| Inactive | 1 |
| | — |
| | 1 |
| | 1 |
|
Foreign stores(2) | 3 |
| | 46 |
| | — |
| | 46 |
|
| Steel Manufacturing Business: | | | | | | | |
| Domestic: | | | | | | | |
| Steel mill and administrative offices | 2 |
| | — |
| | 85 |
| | 85 |
|
| Inactive | 1 |
| | — |
| | 51 |
| | 51 |
|
| Total company: | | | | | | | |
| Domestic | 109 |
| | 665 |
| | 988 |
| | 1,653 |
|
Foreign(2) | 14 |
| | 130 |
| | 6 |
| | 136 |
|
Total(3) | 123 |
| | 795 |
| | 994 |
| | 1,789 |
|
_____________________________
| |
| (1) | We jointly own 36 acres in California at three of our sites with minority interest partners. |
| |
| (2) | ForeignAll foreign facilities are located in Canada.
|
| |
| (3) | For long-lived assets by geography, see Note 20 – Segments in the Notes to the Consolidated Financial Statements in Part II, Item 8 of this report. |
We consider all properties, both owned and leased, to be well-maintained, in good operating condition and suitable and adequate to carry on our business.
ITEM 3. LEGAL PROCEEDINGS
From time to time, we are involved in various litigation matters that arise in the normalordinary course of business involving normal and routine claims. Environmentalclaims, including environmental compliance issues representmatters. Except in connection with our status as a significant portionpotentially responsible party with respect to the Portland Harbor Superfund Site, which is described in Note 11 – Commitments and Contingencies in the Notes to the Consolidated Financial Statements in Part II, Item 8 of those claims. Managementthis report and is incorporated into this item, management currently believes that the ultimate outcome of these proceedings, individually or in the aggregate, will not have a material adverse effect on our consolidated financial position, results of operations, cash flows or business. For additional information regarding litigation to which we are a party, which
ITEM 4. [REMOVED AND RESERVED]
EXECUTIVE OFFICERS OF THE REGISTRANT
Information about our executive officers is incorporated
into this item, see Note 12 – Commitments and Contingencies in the notes to the consolidated financial statements inby reference from Part
II,III, Item
810 of this
annual report.
ITEM 4. RESERVED1720 / Schnitzer Steel Industries, Inc. Form 10-K 20102011
PART II
ITEM 5. MARKET FOR REGISTRANT’S COMMON EQUITY, RELATED STOCKHOLDER MATTERS AND ISSUER PURCHASES OF EQUITY SECURITIES
Our Class A common stock is listed on the NASDAQ Global Select Market (“NASDAQ”) under the symbol SCHN. There were 217203 holders of record of Class A common stock on October 12, 2010. The2011. Our Class A common stock has been trading since November 16, 1993. The following table sets forth the high and low trading stock prices reported at the close of trading on NASDAQ and the dividends paid per share for the periods indicated. | | | | | | | | | | | | |
| | | Fiscal 2010 | |
| | | High Price | | | Low Price | | | Dividends Per Share | |
First Quarter | | $ | 59.00 | | | $ | 41.59 | | | $ | 0.017 | |
Second Quarter | | $ | 56.95 | | | $ | 40.03 | | | $ | 0.017 | |
Third Quarter | | $ | 60.12 | | | $ | 43.46 | | | $ | 0.017 | |
Fourth Quarter | | $ | 49.53 | | | $ | 37.00 | | | $ | 0.017 | |
| |
| | | Fiscal 2009 | |
| | | High Price | | | Low Price | | | Dividends Per Share | |
First Quarter | | $ | 67.84 | | | $ | 16.45 | | | $ | 0.017 | |
Second Quarter | | $ | 47.70 | | | $ | 22.52 | | | $ | 0.017 | |
Third Quarter | | $ | 55.92 | | | $ | 23.35 | | | $ | 0.017 | |
Fourth Quarter | | $ | 63.98 | | | $ | 44.75 | | | $ | 0.017 | |
|
| | | | | | | | | | | |
| | Fiscal 2011 |
| | High Price | | Low Price | | Dividends Per Share |
| First Quarter | $ | 58.00 |
| | $ | 45.21 |
| | $ | 0.017 |
|
| Second Quarter | $ | 69.43 |
| | $ | 58.00 |
| | $ | 0.017 |
|
| Third Quarter | $ | 67.14 |
| | $ | 54.32 |
| | $ | 0.017 |
|
| Fourth Quarter | $ | 59.41 |
| | $ | 38.49 |
| | $ | 0.017 |
|
| | Fiscal 2010 |
| | High Price | | Low Price | | Dividends Per Share |
| First Quarter | $ | 59.00 |
| | $ | 41.59 |
| | $ | 0.017 |
|
| Second Quarter | $ | 56.95 |
| | $ | 40.03 |
| | $ | 0.017 |
|
| Third Quarter | $ | 60.12 |
| | $ | 43.46 |
| | $ | 0.017 |
|
| Fourth Quarter | $ | 49.53 |
| | $ | 37.00 |
| | $ | 0.017 |
|
Our Class B common stock is not publicly traded. There were 1244 holders of record of Class B common stock on October 12, 2010.2011. Issuer Purchases of Equity Securities
Pursuant to a share repurchase program as amended in 2001 and 2006, we were authorized to repurchase up to 6 million shares of our Class A common stock when management deems such repurchases to be appropriate. In November 2008, our Board of Directors approved an increase in the shares authorized for repurchase by 3 million, to 9 million.million. Prior to fiscal 2010,2011, we had repurchased approximately 5.15.5 million shares of our Class A common stock under the program. In fiscal 2010,2011, we repurchased a total of 412,994254,332 shares of our Class A common stock under this program, leaving approximately 3.53.2 million shares available for repurchase under existing authorizations. The share repurchase program does not require us to acquire any specific number of shares, and we may suspend, extend or terminate the program at any time without prior notice and the program may be executed through open-market purchases, privately negotiated transactions or utilizing Rule
10b5-110(b)5-1 programs. We evaluate long- and short-range forecasts as well as anticipated sources and uses of cash before determining the course of action that would best enhance shareholder value.
Schnitzer Steel Industries, Inc. Form 10-K 2010 / 21
During the fourth quarter of fiscal 2010,2011, we repurchased 412,994254,332 shares of our Class A common stock in open-market transactions at a cost of $17 million.$10 million. The table below presents a summary of our share repurchases during the quarter ended August 31, 2010:
| | | | | | | | | | | | | | | | |
| Period | | Total Number of Shares
Purchased | | | Average Price Paid per Share | | | Total Number of Shares
Purchased as
Part of Publicly
Announced
Plans or Programs | | | Maximum Number of Shares that may
yet be Purchased
Under the Plans or
Programs | |
June 1, 2010 – June 30, 2010 | | | 0 | | | $ | 0 | | | | 0 | | | | 3,864,290 | |
July 1, 2010 – July 31, 2010 | | | 412,994 | | | $ | 41.53 | | | | 412,994 | | | | 3,451,296 | |
August 1, 2010 – August 31, 2010 | | | 0 | | | $ | 0 | | | | 0 | | | | 3,451,296 | |
| | | | | | | | | | | | | | | | |
Total Fourth Quarter | | | 412,994 | | | $ | 41.53 | | | | 412,994 | | | | | |
2011:
|
| | | | | | | | | | | | |
| Period | Total Number of Shares Purchased | | Average Price Paid per Share | | Total Number of Shares Purchased as Part of Publicly Announced Plans or Programs | | Maximum Number of Shares that may yet be Purchased Under the Plans or Programs |
| June 1, 2011 – June 30, 2011 | — |
| | — |
| | — |
| | 3,451,296 |
|
| July 1, 2011 – July 31, 2011 | — |
| | — |
| | — |
| | 3,451,296 |
|
| August 1, 2011 – August 31, 2011 | 254,332 |
| | $ | 40.51 |
| | 254,332 |
| | 3,196,964 |
|
| Total Fourth Quarter | 254,332 |
| | | | 254,332 |
| | |
18 / Schnitzer Steel Industries, Inc. Form 10-K 2011
The following graph and related information compares cumulative total shareholder return on our Class A common stock for the five-year period from September 1, 20052006 through August 31, 20102011 with the cumulative total return for the same period of (i) the S&P 500 Index, (ii) the S&P Steel Index and (iii) the NASDAQ Composite Index. These comparisons assume an investment of $100 at the commencement of the period and that all dividends are reinvested. The stock performance outlined in the performance graph below is not necessarily indicative of our future performance, and we do not endorse any predictions as to future stock performance.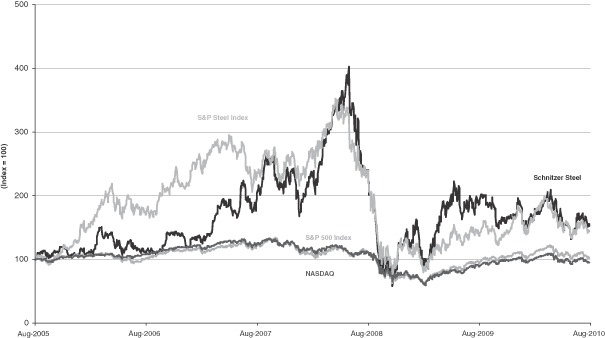
| | | | | | | | | | | | | | | | | | | | | | | | |
| | | Year ended August 31, | |
| | | 2005 | | | | 2006 | | | | 2007 | | | | 2008 | | | | 2009 | | | | 2010 | |
Schnitzer Steel Industries | | $ | 100 | | | $ | 111 | | | $ | 205 | | | $ | 240 | | | $ | 190 | | | $ | 156 | |
S&P 500 | | | 100 | | | | 109 | | | | 125 | | | | 111 | | | | 91 | | | | 96 | |
S&P Steel Index | | | 100 | | | | 172 | | | | 238 | | | | 239 | | | | 142 | | | | 146 | |
NASDAQ | | | 100 | | | | 102 | | | | 122 | | | | 112 | | | | 96 | | | | 102 | |
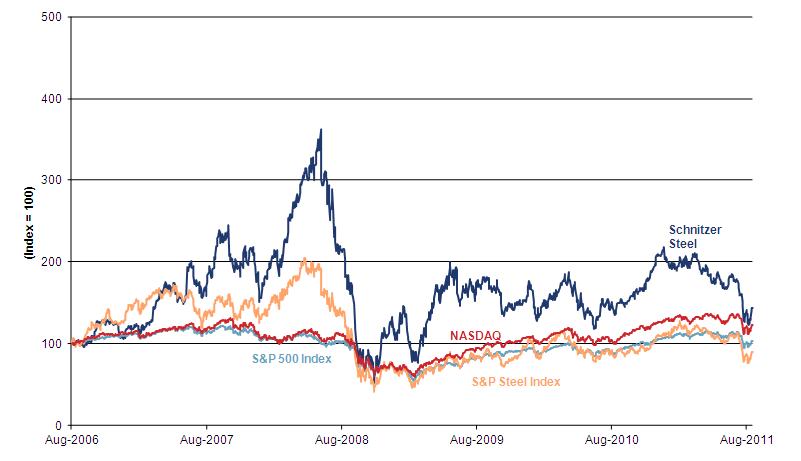
|
| | | | | | | | | | | | | | | | | | | | | | | |
| | Year ended August 31, |
| | 2006 | | 2007 | | 2008 | | 2009 | | 2010 | | 2011 |
Schnitzer Steel Industries(1) | $ | 100 |
| | $ | 184 |
| | $ | 216 |
| | $ | 171 |
| | $ | 140 |
| | $ | 144 |
|
| S&P 500 | 100 |
| | 115 |
| | 102 |
| | 84 |
| | 88 |
| | 104 |
|
| S&P Steel Index | 100 |
| | 138 |
| | 139 |
| | 83 |
| | 85 |
| | 90 |
|
| NASDAQ | 100 |
| | 120 |
| | 110 |
| | 94 |
| | 100 |
| | 123 |
|
_____________________________
| |
| (1) | Because we operate in three distinct but related businesses, we have no direct market peer issuers. |
2219 / Schnitzer Steel Industries, Inc. Form 10-K 20102011
ITEM 6. SELECTED FINANCIAL DATA
| | | | | | | | | | | | | | | | | | |
| | | Year ended August 31, |
| | | 2010 | | | 2009 | | | 2008 | | | 2007 | | 2006 |
STATEMENT OF OPERATIONS DATA: | | | | | | | | | | | | | | | | | | |
(in thousands, except per share and dividend data) | | | | | | | | | | | | | | | | | | |
Revenues | | $ | 2,301,240 | | | $ | 1,787,230 | | | $ | 3,516,950 | | | $ | 2,462,077 | | $ | 1,767,832 |
Operating income (loss) | | $ | 125,897 | | | $ | (51,124 | ) | | $ | 403,235 | | | $ | 211,959 | | $ | 174,093 |
Income (loss) from continuing operations | | $ | 84,508 | | | $ | (27,149 | ) | | $ | 254,653 | | | $ | 133,974 | | $ | 145,147 |
Income (loss) from discontinued operations, net of tax(1) | | $ | (13,832 | ) | | $ | (4,214 | ) | | $ | (613 | ) | | $ | 1,015 | | $ | 615 |
Net income (loss) attributable to SSI | | $ | 66,750 | | | $ | (32,229 | ) | | $ | 248,683 | | | $ | 131,334 | | $ | 143,068 |
Income (loss) per share from continuing operations attributable to SSI (diluted) | | $ | 2.86 | | | $ | (0.99 | ) | | $ | 8.63 | | | $ | 4.29 | | $ | 4.63 |
Net income (loss) per share attributable to SSI (diluted) | | $ | 2.37 | | | $ | (1.14 | ) | | $ | 8.61 | | | $ | 4.32 | | $ | 4.65 |
Dividends declared per common share | | $ | 0.068 | | | $ | 0.068 | | | $ | 0.068 | | | $ | 0.068 | | $ | 0.068 |
| | | | | |
OTHER DATA: | | | | | | | | | | | | | | | | | | |
Shipments (in thousands)(2): | | | | | | | | | | | | | | | | | | |
Recycled ferrous metal (tons)(3) | | | 4,231 | | | | 4,189 | | | | 5,197 | | | | 5,504 | | | 4,561 |
Recycled nonferrous metal (pounds) | | | 478,486 | | | | 397,056 | | | | 439,470 | | | | 383,086 | | | 301,610 |
Finished steel products (tons) | | | 444 | | | | 381 | | | | 776 | | | | 710 | | | 703 |
| | | | | |
Average net selling price(2,4): | | | | | | | | | | | | | | | | | | |
Recycled ferrous metal (per ton) | | $ | 328 | | | $ | 264 | | | $ | 436 | | | $ | 267 | | $ | 218 |
Recycled nonferrous metal (per pound) | | $ | 0.83 | | | $ | 0.61 | | | $ | 1.03 | | | $ | 1.02 | | $ | 0.87 |
Finished steel products (per ton) | | $ | 587 | | | $ | 617 | | | $ | 728 | | | $ | 575 | | $ | 528 |
Number of auto parts stores(1) | | | 45 | | | | 39 | | | | 38 | | | | 35 | | | 34 |
| | | August 31, |
| | | 2010 | | | 2009 | | | 2008 | | | 2007 | | 2006 |
BALANCE SHEET DATA (in thousands): | | | | | | | | | | | | | | | | | | |
Total assets | | $ | 1,343,418 | | | $ | 1,268,233 | | | $ | 1,554,853 | | | $ | 1,151,414 | | $ | 1,044,724 |
Long-term debt and capital lease obligations, net of current maturities | | $ | 99,240 | | | $ | 110,414 | | | $ | 158,933 | | | $ | 124,079 | | $ | 102,829 |
|
| | | | | | | | | | | | | | | | | | | |
| | Year ended August 31, |
| | 2011 | | 2010 | | 2009 | | 2008 | | 2007 |
| STATEMENT OF OPERATIONS DATA: | | | | | | | | | |
| (in thousands, except per share and dividend data) | | | | | | | | | |
| Revenues | $ | 3,459,194 |
| | $ | 2,301,240 |
| | $ | 1,787,230 |
| | $ | 3,516,950 |
| | $ | 2,462,077 |
|
| Operating income (loss) | $ | 185,964 |
| | $ | 125,897 |
| | $ | (51,124 | ) | | $ | 403,235 |
| | $ | 211,959 |
|
| Income (loss) from continuing operations | $ | 123,637 |
| | $ | 84,508 |
| | $ | (27,149 | ) | | $ | 254,653 |
| | $ | 133,974 |
|
Income (loss) from discontinued operations, net of tax(1) | $ | (101 | ) | | $ | (13,832 | ) | | $ | (4,214 | ) | | $ | (613 | ) | | $ | 1,015 |
|
| Net income (loss) attributable to SSI | $ | 118,355 |
| | $ | 66,750 |
| | $ | (32,229 | ) | | $ | 248,683 |
| | $ | 131,334 |
|
| Income (loss) per share from continuing operations attributable to SSI (diluted) | $ | 4.24 |
| | $ | 2.86 |
| | $ | (0.99 | ) | | $ | 8.63 |
| | $ | 4.29 |
|
| Net income (loss) per share attributable to SSI (diluted) | $ | 4.23 |
| | $ | 2.37 |
| | $ | (1.14 | ) | | $ | 8.61 |
| | $ | 4.32 |
|
| Dividends declared per common share | $ | 0.068 |
| | $ | 0.068 |
| | $ | 0.068 |
| | $ | 0.068 |
| | $ | 0.068 |
|
| OTHER DATA: | | | | | | | | | |
Shipments (in thousands)(2): | | | | | | | | | |
Recycled ferrous metal (tons)(3) | 5,329 |
| | 4,231 |
| | 4,189 |
| | 4,753 |
| | 4,292 |
|
| Recycled nonferrous metal (pounds) | 568,560 |
| | 478,486 |
| | 397,056 |
| | 439,470 |
| | 383,086 |
|
| Finished steel products (tons) | 439 |
| | 444 |
| | 381 |
| | 776 |
| | 710 |
|
Average net selling price(2)(4): | | | | | | | | | |
| Recycled ferrous metal (per ton) | $ | 416 |
| | $ | 328 |
| | $ | 264 |
| | $ | 436 |
| | $ | 267 |
|
| Recycled nonferrous metal (per pound) | $ | 1.06 |
| | $ | 0.83 |
| | $ | 0.61 |
| | $ | 1.03 |
| | $ | 1.02 |
|
| Finished steel products (per ton) | $ | 697 |
| | $ | 587 |
| | $ | 617 |
| | $ | 728 |
| | $ | 575 |
|
| Number of auto parts stores(1) | 50 |
| | 45 |
| | 39 |
| | 38 |
| | 35 |
|
| Cars purchased (in thousands) | 353 |
| | 329 |
| | 258 |
| | 311 |
| | 265 |
|
| | | | | | | | | | |
| | August 31, |
| | 2011 | | 2010 | | 2009 | | 2008 | | 2007 |
| BALANCE SHEET DATA (in thousands): | | | | | | | | | |
| Total assets | $ | 1,890,169 |
| | $ | 1,343,418 |
| | $ | 1,268,233 |
| | $ | 1,554,853 |
| | $ | 1,151,414 |
|
| Long-term debt and capital lease obligations, net of current maturities | $ | 403,287 |
| | $ | 99,240 |
| | $ | 110,414 |
| | $ | 158,933 |
| | $ | 124,079 |
|
| Redeemable noncontrolling interests | $ | 19,053 |
| | — |
| | — |
| | — |
| | — |
|
_____________________________
| |
| (1) | In fiscal 2010, the Company sold its full-service used auto parts operation, which had been operated as part of the Auto Parts Business reporting segment. The Company concluded that the divestiture met the definition of a discontinued operation. Accordingly, the results of this discontinued operation have been removed from continuing operationsother data for all periods presented. |
| |
| (2) | Tons for recycled ferrous metal are long tons (2,240 pounds) and for finished steel products are short tons (2,000 pounds). |
| |
| (3) | In fiscal 20102008 and 2009,2007, the Schnitzer Global Exchange trading business accounted for no shipments. In fiscal 2008, 2007 and 2006 it accounted for shipments of recycled ferrous metal (in thousands) of 444 tons, 1,212thousand tons and 1,2721,212 thousand tons, respectively.respectively, which are not included in the processed ferrous metal amounts presented. |
| |
| (4) | In accordance with generally accepted accounting principles, the Company reports revenues that include amounts billed for freight to customers, however, average net selling prices are shown net of amounts billed for freight. |
20 / Schnitzer Steel Industries, Inc. Form 10-K 2010 / 232011
ITEM 7. MANAGEMENT’S DISCUSSION AND ANALYSIS OF FINANCIAL CONDITION AND RESULTS OF OPERATIONS
This section includes a discussion of our operations for the three fiscal years ended August 31, 2010.2011, 2010 and 2009. The following discussion and analysis provides information which management believes is relevant to an assessment and understanding of our results of operations and financial condition. The discussion should be read in conjunction with the Consolidated Financial Statements and the related notes thereto in Part II, Item 8 of this report and the Selected Financial Data contained in Part II, Item 6 of this report.
Business
We are one of the nation’s largest recyclers of ferrous and nonferrous scrap metal, a leading recycler of used and salvaged vehicles and a manufacturer of finished steel products.
BusinessWe operate in three reporting segments (MRB, APB and SMB) that collectively provide an end-of-life cycle solution for a variety of products through our integrated businesses. We use operating income (loss) to measure our segment performance. Corporate expense consists primarily of unallocated expense for management and administrative services that benefit all three reporting segments. As a result of this unallocated expense, the operating income (loss) of each reporting segment does not reflect the operating income (loss) the reporting segment would have as a stand-alone business. For further information regarding our reporting segments, including financialinformation about geographic areas, see Note 20 – Segment Information in the notesNotes to the consolidated financial statementsConsolidated Financial Statements in Part II, Item 8 of this report.
MRB buys, collects, processes, recycles, sells and brokers ferrous scrap metal (containing iron) to foreign and domestic steel producers, including SMB, and nonferrous scrap metal (not containing iron) to both foreign and domestic markets. MRB processes mixed and large pieces of scrap metal into smaller pieces by
crushing, sorting, shearing, shredding and torching, resulting in scrap metal pieces of a size, density and purity required by customers to meet their production needs.
APB procures used and salvaged vehicles and sells serviceable used auto parts from these vehicles through its self-service auto parts stores. The remaining portions of the vehicles, primarily autobodies,
corescore parts and nonferrous materials, are sold to metal recyclers, including MRB where geographically feasible.
SMB operates a steel mini-mill that produces a wide range of finished steel products.
MRB is the sole supplier for SMB’s scrap metal requirements, which SMB purchases
substantially all of its recycled metal from MRB at rates that approximate export market prices for shipments from the West Coast of the
US andU.S. SMB uses its mini-mill near Portland, Oregon to melt recycled metal and other raw materials to produce finished steel products. SMB also maintains
a mill
depotsdepot in
Central and Southern California.
Our results of operations depend in large part on the demand and prices for recycled metal in foreign and domestic
markets and steel products in the Western US.markets. Our deep water port facilities on both the East and West coasts of the
USU.S. (in Everett, Massachusetts; Oakland, California; Portland, Oregon; Tacoma, Washington; and Providence, Rhode Island) and access to public deep water port facilities (in Kapolei, Hawaii and Salinas, Puerto Rico) allow us to
efficiently meet the
global demand for
recycledferrous scrap metal by
shipping bulk cargoes to steel manufacturers located in Europe, Asia, Central America and Africa. Our
exports of nonferrous processed scrap metal are shipped in containers through various public docks to specialty steelmakers, foundries, aluminum sheet and ingot manufacturers, copper refineries and smelters, brass and bronze ingot manufacturers and wire and cable producers globally. We also transport both ferrous and nonferrous metals by truck and rail to meet regional domestic demand. In particular, our processing facilities in the Southeastern
USU.S. also provide
efficient access to the automobile and steel manufacturing industries in that region.
Key economic factors and trends affecting the industries in which we operate
Our financial results largely depend on supply of raw materials in the
USU.S. and demand for recycled metal in foreign and domestic markets and for
finished steel products in the Western
US.U.S. Fluctuating or volatile supply and demand conditions affect market prices for and volumes of recycled ferrous and nonferrous metal in global markets and for steel products in the Western
USU.S. and can have a significant impact on the results of operations for all three reporting segments.
In fiscal 2010, we continued to experience2011, the effects of the 2009 global economic crisis. The USU.S. economy began to show some signs of a gradual recovery throughas evidenced by increased USU.S. steel mill utilization over the prior year and slightly improved availability of raw materials. BetterContinued growth and positive economic conditions in overseas markets, particularly in Asia, led to a continuing strong demand for exports of ferrous and nonferrous recycled materials. However, the global economy was
2421 / Schnitzer Steel Industries, Inc. Form 10-K 20102011
still hampered by other factors, including the European sovereign debt crisis and the tightening
As we continue to closely monitor the economic situation, we remain focused on
ourthe following core strategies
which we believe willto meet our business objectives:
Use of our seven deep water ports to access customers directly around the world and to meet demand wherever it is greatest;
Growth through acquisitions in existing and new geographic regions that create value and generate returns in excess of our cost of capital;
attractive returns;Continued investment in and benefit from technologies and process improvements which increase the separation and recovery of recycled materials from our shredding process; and
Continued improvement in our productivity, focus on cost containmentincreasing efficiency and optimization of the spreads between our selling prices and the cost of acquiring materials.
In addition, we highly value the strategic synergies within our integrated operations. APB is a key supplier to MRB, and we opportunistically look to enhance the geographic proximity of the two businesses. In fiscal
2010,2011, we acquired
from LKQ Corporation four self-servicesubstantially all of the assets of two metals recycling businesses in Canada, with a total of nine metal collection and processing facilities, which marked MRB’s first expansion into Canada. APB has three facilities in Western Canada that will be able to supply these new MRB facilities in addition to shipping to our Tacoma, WA facility. We also acquired substantially all of the assets of a used auto parts
business with three stores
which are located near MRB’s export facility in
Portland, Oregon and two self-service used auto parts stores which increased ourSeattle, WA, expanding APB’s presence in the
Dallas-Fort Worth Metroplex. We also acquiredNorthwestern U.S. MRB has a
metals recyclersignificant presence in
MontanaTacoma, WA, which will benefit from the synergies of this enhanced access to
provide an additional source of scrap metal for our Tacoma, Washington export facility and sold our full-service used auto parts operation to LKQ Corporation.supply.
Executive Overview of Financial Results
In fiscal 2010,2011, our operating results benefited from increased average selling prices due to continuing strong demand from export markets as well as recovering domestic demand for scrap and recycled metal products and saw us returnincremental revenues from acquisitions. The increased demand led to profitability, withhigher average net selling prices and increased availability of raw materials, which resulted in revenues growing by $514 million$1.2 billion to $2.3$3.5 billion and net income attributable to SSI of $67$118 million compared to a loss of ($32)$67 million in fiscal 2009.2010. Diluted net income attributable to SSI was $2.37$4.23 per share for fiscal 20102011 compared to a net loss of ($1.14)$2.37 per share in fiscal 2009.2010. During fiscal 2011, we continued to expand our presence in regions in which we operate and in new locations through the acquisition of ten businesses. The aggregate purchase price paid for acquisitions during fiscal 2011 was $314 million, compared to $41 million during fiscal 2010.
The following items summarize our consolidated financial performance for fiscal 2010:2011: Revenues of $2.3$3.5 billion, compared to $1.8$2.3 billion in the prior year;
Operating income of $126$186 million, compared to operating loss of ($51)$126 million in the prior year;
Net income
Income from continuing operations attributable to SSI of $81$118 million, or $2.86$4.24 per share (diluted), compared to a net loss from continuing operations attributable to SSI of ($28)$81 million, or ($0.99)$2.86 per share (diluted), in the prior year; and
Net income attributable to SSI of $67$118 million, or $2.37$4.23 per share (diluted), compared to a net loss attributable to SSI of ($32)$67 million, or ($1.14)$2.37 per share (diluted), in the prior year.
22 / Schnitzer Steel Industries, Inc. Form 10-K 2010 / 252011
| | |
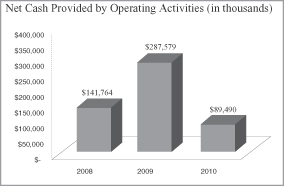 | | 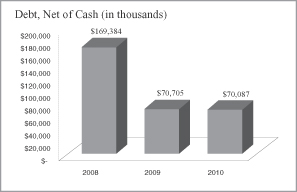 |
The following items summarize our consolidated cash flow and balance sheet information for fiscal 2010:2011: Net cash provided by operating activities of $90$140 million, compared to $288$89 million in the prior year; and
Cash on hand of $30 million, compared to $41 million as of the prior year-end; and
Debt, net of cash, of $70$354 million, compared to $71$70 million as of the prior year-end (see the reconciliation of Debt, net of cash in Non-GAAP Financial Measures at the end of Item 7).
, primarily as a result of acquisitions.In fiscal 2010,2011, our MRB segment generated revenues of $2.0$3.1 billion, a $472 million$1.1 billion increase from fiscal 2009,2010, which included a $309an $867 million, or 25%56%, increase in ferrous revenues and a $161$207 million, or 64%50%, increase in nonferrous revenues.revenues due to increased demand from both export and domestic markets, which, together with increased availability of raw materials, contributed to higher average net selling prices and sales volumes. The increase in ferrous revenues was primarily driven by a 24%27% increase in average net selling price resulting from strong demandand a 26% increase in Asian markets and to a lesser extent improved domestic markets for scrap metal.long tons sold. The increase in nonferrous revenues was driven by a 36%28% increase in the average net selling price and a 21%19% increase in pounds sold due to higher demand and increased availability of raw materials.sold. MRB had operating income of $118$165 million compared to $13$118 million in fiscal 2009.2010. In fiscal 2010,2011, our APB segment set records for self-service revenues and operating income withgenerated revenues of $241$320 million and operating income of $51 million., a $79 million increase from fiscal 2010. The $88 million increase in revenues over the prior yearfiscal 2010 was primarily driven by a $37$41 million increase in scrap vehicle revenue and a $32$28 million increase in core revenue primarilymainly due to higher selling prices and sales volumes, and selling prices, and a $15$5 million increase in parts revenues. APB had operating income of $51$64 million compared to $4$51 million in fiscal 2009.2010. In fiscal 2010,2011, our SMB segment generated revenues of $285$317 million, a $22$32 million increase from fiscal 2009.2010. The increase over prior yearfiscal 2010 reflected an increase in the average net selling price of finished steel products of $110 per ton, or 19%, to $697 per ton. This was partly offset by a decrease in sales volumes for finished steel products of 635 thousand tons, or 17%(1)%, to 444439 thousand tons in fiscal 2010. However, the2011. The increases in average net selling price decreased $30 per ton, or (5%), to $587 per ton in fiscal 2010. The increases in sales volume reflected improved, but still weak, demand for finished steel products in western North America. SMB had operating income of $3 million compared to an operating loss of ($6)$(6) million compared to ($42) million in fiscal 2009.Share Repurchases2010During fiscal 2010, we repurchased 412,994 shares of Class A common stock, or approximately 2% of the total Class A and Class B shares outstanding, at a total cost of $17 million under the authority granted by our Board of Directors.
26.
23 / Schnitzer Steel Industries, Inc. Form 10-K 20102011
Results of Operations
| | | | | | | | | | | | | | | | | | |
| | | For the year ended August 31, | |
| | | | | | | | | | | | % Increase/(Decrease) | |
| ($ in thousands) | | 2010 | | | 2009 | | | 2008 | | | 2010 vs 2009 | | | 2009 vs 2008 | |
Revenues: | | | | | | | | | | | | | | | | | | |
Metals Recycling Business | | $ | 1,979,770 | | | $ | 1,507,655 | | | $ | 3,062,850 | | | 31 | % | | (51 | %) |
Auto Parts Business | | | 241,233 | | | | 153,207 | | | | 228,082 | | | 57 | % | | (33 | %) |
Steel Manufacturing Business | | | 285,085 | | | | 263,269 | | | | 603,189 | | | 8 | % | | (56 | %) |
Intercompany revenue eliminations(1) | | | (204,848 | ) | | | (136,901 | ) | | | (377,171 | ) | | 50 | % | | (64 | %) |
| | | | | | | | | | | | | | | | | | |
Total revenues | | | 2,301,240 | | | | 1,787,230 | | | | 3,516,950 | | | 29 | % | | (49 | %) |
| | | | | | | | | | | | | | | | | | |
Cost of goods sold: | | | | | | | | | | | | | | | | | | |
Metals Recycling Business | | | 1,791,221 | | | | 1,419,237 | | | | 2,619,376 | | | 26 | % | | (46 | %) |
Auto Parts Business | | | 147,511 | | | | 112,887 | | | | 137,866 | | | 31 | % | | (18 | %) |
Steel Manufacturing Business | | | 284,258 | | | | 299,311 | | | | 522,200 | | | (5 | %) | | (43 | %) |
Intercompany cost of goods sold eliminations(1) | | | (203,226 | ) | | | (149,493 | ) | | | (368,108 | ) | | 36 | % | | (59 | %) |
| | | | | | | | | | | | | | | | | | |
Total cost of goods sold | | | 2,019,764 | | | | 1,681,942 | | | | 2,911,334 | | | 20 | % | | (42 | %) |
| | | | | | | | | | | | | | | | | | |
Selling, general and administrative expense: | | | | | | | | | | | | | | | | | | |
Metals Recycling Business | | | 73,467 | | | | 82,381 | | | | 97,959 | | | (11 | %) | | (16 | %) |
Auto Parts Business | | | 42,426 | | | | 36,719 | | | | 43,895 | | | 16 | % | | (16 | %) |
Steel Manufacturing Business | | | 6,689 | | | | 5,958 | | | | 8,689 | | | 12 | % | | (31 | %) |
Corporate(2) | | | 36,223 | | | | 38,352 | | | | 63,990 | | | (6 | %) | | (40 | %) |
| | | | | | | | | | | | | | | | | | |
Total SG&A expense | | | 158,805 | | | | 163,410 | | | | 214,533 | | | (3 | %) | | (24 | %) |
| | | | | | | | | | | | | | | | | | |
Environmental matters: | | | | | | | | | | | | | | | | | | |
Metals Recycling Business | | | (291 | ) | | | (5,846 | ) | | | 919 | | | (95 | %) | | NM | |
Auto Parts Business | | | 200 | | | | 37 | | | | (1,365 | ) | | 441 | % | | NM | |
| | | | | | | | | | | | | | | | | | |
Total environmental matters | | | (91 | ) | | | (5,809 | ) | | | (446 | ) | | (98 | %) | | 1202 | % |
| | | | | | | | | | | | | | | | | | |
(Income) loss from joint ventures: | | | | | | | | | | | | | | | | | | |
Metals Recycling Business | | | (3,076 | ) | | | (669 | ) | | | (12,277 | ) | | 360 | % | | (95 | %) |
Change in intercompany (profit) loss elimination(3) | | | (59 | ) | | | (520 | ) | | | 571 | | | (89 | %) | | NM | |
| | | | | | | | | | | | | | | | | | |
Total income from joint ventures | | | (3,135 | ) | | | (1,189 | ) | | | (11,706 | ) | | 164 | % | | (90 | %) |
| | | | | | | | | | | | | | | | | | |
Operating income (loss): | | | | | | | | | | | | | | | | | | |
Metals Recycling Business | | | 118,449 | | | | 12,552 | | | | 356,873 | | | 844 | % | | (96 | %) |
Auto Parts Business | | | 51,096 | | | | 3,564 | | | | 47,686 | | | 1334 | % | | (93 | %) |
Steel Manufacturing Business | | | (5,862 | ) | | | (42,000 | ) | | | 72,300 | | | (86 | %) | | NM | |
| | | | | | | | | | | | | | | | | | |
Segment operating income (loss) | | | 163,683 | | | | (25,884 | ) | | | 476,859 | | | NM | | | NM | |
Corporate expense | | | (36,223 | ) | | | (38,352 | ) | | | (63,990 | ) | | (6 | %) | | (40 | %) |
Change in intercompany (profit) loss elimination(4) | | | (1,563 | ) | | | 13,112 | | | | (9,634 | ) | | NM | | | NM | |
| | | | | | | | | | | | | | | | | | |
Total operating income (loss) | | $ | 125,897 | | | $ | (51,124 | ) | | $ | 403,235 | | | NM | | | NM | |
| | | | | | | | | | | | | | | | | | |
|
| | | | | | | | | | | | | | | | | |
| | For the year ended August 31, |
| | | | | | | | % Increase/(Decrease) |
| ($ in thousands) | 2011 | | 2010 | | 2009 | | 2011 vs 2010 | | 2010 vs 2009 |
| Revenues: | | | | | | | | | |
| Metals Recycling Business | $ | 3,070,004 |
| | $ | 1,979,770 |
| | $ | 1,507,655 |
| | 55 | % | | 31 | % |
| Auto Parts Business | 319,833 |
| | 241,233 |
| | 153,207 |
| | 33 | % | | 57 | % |
| Steel Manufacturing Business | 317,483 |
| | 285,085 |
| | 263,269 |
| | 11 | % | | 8 | % |
Intercompany revenue eliminations(1) | (248,126 | ) | | (204,848 | ) | | (136,901 | ) | | 21 | % | | 50 | % |
| Total revenues | 3,459,194 |
| | 2,301,240 |
| | 1,787,230 |
| | 50 | % | | 29 | % |
| Cost of goods sold: | | | | | | | | | |
| Metals Recycling Business | 2,810,128 |
| | 1,791,221 |
| | 1,419,237 |
| | 57 | % | | 26 | % |
| Auto Parts Business | 203,094 |
| | 147,511 |
| | 112,887 |
| | 38 | % | | 31 | % |
| Steel Manufacturing Business | 308,319 |
| | 284,258 |
| | 299,311 |
| | 8 | % | | (5 | )% |
Intercompany cost of goods sold eliminations(1) | (249,376 | ) | | (203,226 | ) | | (149,493 | ) | | 23 | % | | 36 | % |
| Total cost of goods sold | 3,072,165 |
| | 2,019,764 |
| | 1,681,942 |
| | 52 | % | | 20 | % |
| Selling, general and administrative expense: | | | | | | | | | |
| Metals Recycling Business | 99,447 |
| | 73,467 |
| | 82,381 |
| | 35 | % | | (11 | )% |
| Auto Parts Business | 52,582 |
| | 42,426 |
| | 36,719 |
| | 24 | % | | 16 | % |
| Steel Manufacturing Business | 6,602 |
| | 6,689 |
| | 5,958 |
| | (1 | )% | | 12 | % |
Corporate(2) | 46,394 |
| | 36,223 |
| | 38,352 |
| | 28 | % | | (6 | )% |
| Total SG&A expense | 205,025 |
| | 158,805 |
| | 163,410 |
| | 29 | % | | (3 | )% |
| Environmental matters: | | | | | | | | | |
| Metals Recycling Business | 532 |
| | (291 | ) | | (5,846 | ) | | NM |
| | (95 | )% |
| Auto Parts Business | 130 |
| | 200 |
| | 37 |
| | (35 | )% | | 441 | % |
| Total environmental matters | 662 |
| | (91 | ) | | (5,809 | ) | | NM |
| | (98 | )% |
| Income from joint ventures: | | | | | | | | | |
| Metals Recycling Business | (4,749 | ) | | (3,076 | ) | | (669 | ) | | 54 | % | | 360 | % |
Change in intercompany profit elimination(3) | 127 |
| | (59 | ) | | (520 | ) | | NM |
| | (89 | )% |
| Total income from joint ventures | (4,622 | ) | | (3,135 | ) | | (1,189 | ) | | 47 | % | | 164 | % |
| Operating income (loss): | | | | | | | | | |
| Metals Recycling Business | 164,646 |
| | 118,449 |
| | 12,552 |
| | 39 | % | | 844 | % |
| Auto Parts Business | 64,027 |
| | 51,096 |
| | 3,564 |
| | 25 | % | | 1,334 | % |
| Steel Manufacturing Business | 2,562 |
| | (5,862 | ) | | (42,000 | ) | | NM |
| | (86 | )% |
| Segment operating income (loss) | 231,235 |
| | 163,683 |
| | (25,884 | ) | | 41 | % | | NM |
|
| Corporate expense | (46,394 | ) | | (36,223 | ) | | (38,352 | ) | | 28 | % | | (6 | )% |
Change in intercompany profit elimination(4) | 1,123 |
| | (1,563 | ) | | 13,112 |
| | NM |
| | NM |
|
| Total operating income (loss) | $ | 185,964 |
| | $ | 125,897 |
| | $ | (51,124 | ) | | 48 | % | | NM |
|
_____________________________
NM = Not Meaningful
| |
| (1) | MRB sells recycled ferrous metal to SMB at rates per ton that approximate West Coast export market prices. In addition, APB sells auto bodies to MRB. These intercompany revenues and cost of goods sold are eliminated in consolidation. |
| |
| (2) | Corporate expense consists primarily of unallocated expenses for services that benefit all three business segments. As a consequence of this unallocated expense, the operating income of each segment does not reflect the operating income the segment would have as a stand-alone business. |
| |
| (3) | The joint ventures sell recycled ferrous metal to MRB and then subsequentelysubsequently to SMB at rates per ton that approximate West Coast export market prices. Consequently, these intercompany revenues produce intercompany operating income (loss), which is not recognized until the finished products are sold to third parties; therefore, intercompany profit is eliminated while the products remain in inventory. |
| |
| (4) | Intercompany (profits) lossesprofits are not recognized until the finished products are sold to third parties,parties; therefore, intercompany profit is eliminated while the products remain in inventory. |
24 / Schnitzer Steel Industries, Inc. Form 10-K 2010 / 272011
Fiscal 20102011 compared with fiscal 2009Consolidated revenues2010
Revenues for fiscal 20102011 increased $514for all reporting segments primarily due to higher average net selling prices and higher sales volumes resulting from stronger worldwide demand from export markets as well as recovering domestic demand for scrap and recycled metal, increased availability of raw materials, including improved recovery through enhanced processing technologies. Incremental revenues from third party sales generated by fiscal 2011 acquisitions were $93 million or 29%, to $2.3 billion. .
Fiscal 2010 compared with fiscal 2009
Revenues in fiscal 2010 increased for all reporting segments primarily due to continuing strong worldwide demand for scrap and recycled metal, which led to higher average net selling prices and sales volumes, and to a lesser extent increased Western USU.S. demand for finished steel products. Operating Income (Loss)
Fiscal 20092011 compared with fiscal 2008Consolidated revenues for fiscal 2009 decreased $1.7 billion, or 49%, to $1.8 billion. Revenues2010
The increase in fiscal 2009 decreased for all reporting segmentsoperating income was primarily due to the worldwide economic crisis which reduced demand for scraphigher average net selling prices and recycled metal and finished steel products throughout the period. This reduced demand resulted in lower scrap and recycled metal and finished steelhigher sales volumes as a result of continuing strong export market conditions, increased availability of raw materials, increased yield from higher production and enhanced shredding and sorting technologies, and incremental operating income from acquisitions.
Operating income reflected an increase of $46 million in consolidated selling, general and administrative (“SG&A”) expense for fiscal 2011, primarily due to an $18 million increase in compensation expenses mainly related to increased headcount from recent acquisitions and a $12 million increase in professional and other third party services, including transaction costs associated with acquisitions completed in fiscal 2011. In fiscal 2011, SG&A expense was reduced by $6 million for favorable customer contract settlements, compared to a reduction of $3 million in fiscal 2010. In addition, SG&A expense was lower average selling prices.in fiscal 2010 as it included
Operating Income (Loss)$9 million in benefits from favorable legal settlements and environmental cost reimbursements.
Fiscal 2010 compared with fiscal 2009Consolidated operating income was $126 million for fiscal 2010 compared to a consolidated operating loss of ($51) million for fiscal 2009.
As a percentage of consolidated revenues, consolidated operating income increased by 8.3 percentage points for fiscal 2010 compared to fiscal 2009.2009. This improvement in consolidated operating income was primarily due to higher average net selling prices, which increased more than the average cost of raw materials, and increased availability of raw materials, which widenedimproved operating margins. The improvement in consolidated operating income also benefited from a decrease in consolidated selling, general and administrative (“SG&A”)&A expense of $5$5 million to $159$159 million for fiscal 2010.2010. The decrease included $9 million in higher bad debt expense recognized in the prior year, $6 million in current yearfiscal 2010 benefits recognized from favorable customer contract and legal settlements, $6 million in environmental and legal cost reimbursements, including $3 million in the fourth quarter of fiscal 2010, and $6 million in reduced professional service fees. These decreases were partially offset by an $18 million increase in incentive compensation due to improvements in financial performance and the reinstatement of employer contributions to our defined contribution plans effective April 2010, and by $2 million of increased expense related to the amortization of intangibles.Fiscal 2009 compared with fiscal 2008
Consolidated operating loss was ($51) million for fiscal 2009 compared to a consolidated operating income of $403 million for fiscal 2008. As a percentage of consolidated revenues, consolidated operating income decreased by 14.3 percentage points for fiscal 2009 compared to fiscal 2008. Weaker year-over-year demand and the impact of declines in selling prices, which outpaced the decline in purchase prices, resulted in the reduction in operating income that included a non-cash net realizable value (“NRV”) inventory write down of $52 million in fiscal 2009. This decrease in consolidated operating income (loss) was partially offset by a $4 million release of environmental reserves and a $3 million gain recognized in fiscal 2009, primarily related to resolution of the Hylebos Waterway litigation. Additionally, decreases in consolidated cost of goods sold and consolidated SG&A expense were due to our implementation of cost containment measures that included a decrease in headcount of 8%, the suspension of employer contributions to our defined contribution plans effective in March 2009 and other non-labor cost reductions for fiscal 2009. Consolidated SG&A expense decreased $51 million to $163 million for fiscal 2009 compared to $214 million for fiscal 2008 primarily due to decreased compensation-related expenses of $49 million, and reduced expenses of $7 million resulting from cost containment measures and other non-compensation related costs including professional and outside services expense. The reduction in compensation-related expenses was primarily due to a decrease in annual incentive and share-based compensation expense resulting from operating losses incurred and a $5 million benefit arising from nondeductible executive incentive compensation that was awarded and included as nondeductible officers’ compensation for fiscal 2008 but was voluntarily and irrevocably declined in fiscal 2009. The decline in professional services expense was primarily the result of reduced consulting fees in fiscal 2009. Also included in the consolidated operating loss for fiscal 2009 was a $2 million gain related to a settlement agreement
28 / Schnitzer Steel Industries, Inc. Form 10-K 2010
to resolve disputes that had arisen from the separation and termination agreement relating to the dissolution of our joint venture with Hugo Neu in September 2005. These reductions were partially offset by a $5 million increase in bad debt expense for fiscal 2009 compared to the prior year resulting from bankruptcies and adverse financial conditions experienced by certain of our customers, which affected their ability to satisfy their obligations.
Interest expense was $2$8 million $3, $2 million and $9$3 million for fiscal 2011, 2010 2009 and 2008,2009, respectively. The decreaseincrease from fiscal 20092010 to fiscal 20102011 is the result of lowerhigher outstanding debt and higher average interest rates and lower outstanding debt.under our amended bank credit facility. For more information about our outstanding debt balances, see Note 1110 – Long-Term Debt and Capital Lease Obligations in the notesNotes to the consolidated financial statementsConsolidated Financial Statements in Part II, Item 8 of this report.
Other Income, Net, Excluding Interest Expense
Other income, net, excluding interest expense was $2$3 million $7, $2 million and $3$7 million for fiscal 2011, 2010 2009 and 2008,2009, respectively. Other income decreased by $5 million in fiscal 2010 compared to the prior year because fiscal 2009 included a pre-tax gain of $5 million from a settlement agreement relating to the dissolution of one of our joint venture with Hugo Neuventures in September 2005.
Income Tax Expense (Benefit)
Income tax expense (benefit) was $57 million, $41 million and $(20) million for fiscal 2011, 2010 and 2009, respectively.
Fiscal 20102011 compared with fiscal 20092010
Our effective tax rate for fiscal 20102011 was 31.6% compared to 32.6% for fiscal 2010. The effective tax rate differed from the U.S. federal statutory rate of 35%, primarily due to the lower tax rate for foreign income and domestic production activities deductions. The fiscal 2011 effective tax rate also benefited from certain adjustments recorded in the period, including a recognition of research and development credits and a reduction in a reserve for unrecognized state income tax benefits. In addition, during the fourth
25 / Schnitzer Steel Industries, Inc. Form 10-K 2011
quarter of fiscal 2011, we recorded an adjustment to correct an error that originated in a prior period pertaining to deferred tax liabilities related to our investment in a subsidiary. The correction of this error resulted in a reduction of income tax expense and an increase to net income of $3 million for the year ended August 31, 2011. See Note 17 - Income Taxes in the Notes to the Consolidated Financial Statements in Part II, Item 8 of this report for further discussion of the correction.
Fiscal 2010 compared with fiscal 2009
Our effective tax rate for fiscal 2010 was 32.6% (provision on income) compared to (42.3%)(42.3)% (benefit on a loss) for fiscal 2009.2009. The level of the decrease in the effective rate primarily reflects the impact of tax credits on lower taxable income (loss) in fiscal 2009 compared with fiscal 2010, a lower state tax rate in fiscal 2010 resulting from the reduction in the reserve for unrecognized tax benefits and a more favorable manufacturing deduction in fiscal 2010 which included the restoration of a previously disallowed deduction due to a newly enacted law. Fiscal 2009 also included a reduction in the reserve for unrecognized tax benefits, which increased the effective rate benefit on the loss.
Fiscal 2009 compared with fiscal 200826Our effective tax rate for fiscal 2009 was (42.3%) (benefit on a loss) compared to 35.9% (provision on income) for fiscal 2008. The increase in the effective rate primarily reflects our net loss in fiscal 2009, the contingent state tax liabilities that were reduced because a settlement was negotiated with one state and the statute / Schnitzer Steel Industries, Inc. Form 10-K 2011
Financial results by reporting segment
We operate our business across three reporting segments: MRB, APB and SMB. Additional financial information relating to these reporting segments is contained in Note 20 – Segment Information in the notesNotes to the consolidated financial statementsConsolidated Financial Statements in Part II, Item 8 of this report.Schnitzer Steel Industries, Inc. Form 10-K 2010 / 29
Metals Recycling Business
| | | | | | | | | | | | | | | | | | |
| | | For the Year Ended August 31, | |
| | | | | | | | | | | | % Increase/(Decrease) | |
| ($ in thousands, except for prices) | | 2010 | | | 2009 | | | 2008 | | | 2010 vs 2009 | | | 2009 vs 2008 | |
Ferrous revenues | | $ | 1,558,664 | | | $ | 1,249,308 | | | $ | 2,590,796 | | | 25 | % | | (52 | %) |
Nonferrous revenues | | | 412,927 | | | | 251,508 | | | | 460,639 | | | 64 | % | | (45 | %) |
Other | | | 8,179 | | | | 6,839 | | | | 11,415 | | | 20 | % | | (40 | %) |
| | | | | | | | | | | | | | | | | | |
Total segment revenues | | | 1,979,770 | | | | 1,507,655 | | | | 3,062,850 | | | 31 | % | | (51 | %) |
Cost of goods sold | | | 1,791,221 | | | | 1,419,237 | | | | 2,619,376 | | | 26 | % | | (46 | %) |
Selling, general and administrative expense | | | 73,467 | | | | 82,381 | | | | 97,959 | | | (11 | %) | | (16 | %) |
Environmental matters | | | (291 | ) | | | (5,846 | ) | | | 919 | | | (95 | %) | | NM | |
(Income) from joint ventures | | | (3,076 | ) | | | (669 | ) | | | (12,277 | ) | | 360 | % | | (95 | %) |
| | | | | | | | | | | | | | | | | | |
Segment operating income | | $ | 118,449 | | | $ | 12,552 | | | $ | 356,873 | | | 844 | % | | (96 | %) |
| | | | | | | | | | | | | | | | | | |
Average ferrous recycled metal sales prices ($/LT):(1) | | | | | | | | | | | | | | | | | | |
Steel Manufacturing Business(2) | | $ | 339 | | | $ | 328 | | | $ | 446 | | | 3 | % | | (26 | %) |
Other domestic | | $ | 311 | | | $ | 232 | | | $ | 388 | | | 34 | % | | (40 | %) |
Foreign | | $ | 330 | | | $ | 262 | | | $ | 445 | | | 26 | % | | (41 | %) |
Average | | $ | 328 | | | $ | 264 | | | $ | 436 | | | 24 | % | | (39 | %) |
Ferrous sales volume (LT, in thousands): | | | | | | | | | | | | | | | | | | |
Steel Manufacturing Business | | | 458 | | | | 335 | | | | 737 | | | 37 | % | | (55 | %) |
Other domestic | | | 651 | | | | 418 | | | | 805 | | | 56 | % | | (48 | %) |
| | | | | | | | | | | | | | | | | | |
Total domestic | | | 1,109 | | | | 753 | | | | 1,542 | | | 47 | % | | (51 | %) |
Foreign | | | 3,122 | | | | 3,436 | | | | 3,655 | | | (9 | %) | | (6 | %) |
| | | | | | | | | | | | | | | | | | |
Total ferrous sales volume (LT, in thousands) | | | 4,231 | | | | 4,189 | | | | 5,197 | | | 1 | % | | (19 | %) |
| | | | | | | | | | | | | | | | | | |
Average nonferrous sales price ($/pound)(1) | | $ | 0.83 | | | $ | 0.61 | | | $ | 1.03 | | | 36 | % | | (41 | %) |
Nonferrous sales volumes (pounds, in thousands) | | | 478,486 | | | | 397,056 | | | | 439,470 | | | 21 | % | | (10 | %) |
Outbound freight included in cost of goods sold (in thousands) | | $ | 187,454 | | | $ | 150,775 | | | $ | 332,777 | | | 24 | % | | (55 | %) |
|
| | | | | | | | | | | | | | | | | |
| | For the Year Ended August 31, |
| | | | | | | | % Increase/(Decrease) |
| ($ in thousands, except for prices) | 2011 | | 2010 | | 2009 | | 2011 vs 2010 | | 2010 vs 2009 |
| Ferrous revenues | $ | 2,425,488 |
| | $ | 1,558,664 |
| | $ | 1,249,308 |
| | 56 | % | | 25 | % |
| Nonferrous revenues | 619,640 |
| | 412,927 |
| | 251,508 |
| | 50 | % | | 64 | % |
| Other | 24,876 |
| | 8,179 |
| | 6,839 |
| | 204 | % | | 20 | % |
| Total segment revenues | 3,070,004 |
| | 1,979,770 |
| | 1,507,655 |
| | 55 | % | | 31 | % |
| Cost of goods sold | 2,810,128 |
| | 1,791,221 |
| | 1,419,237 |
| | 57 | % | | 26 | % |
| Selling, general and administrative expense | 99,447 |
| | 73,467 |
| | 82,381 |
| | 35 | % | | (11 | )% |
| Environmental matters | 532 |
| | (291 | ) | | (5,846 | ) | | NM |
| | (95 | )% |
| (Income) from joint ventures | (4,749 | ) | | (3,076 | ) | | (669 | ) | | 54 | % | | 360 | % |
| Segment operating income | $ | 164,646 |
| | $ | 118,449 |
| | $ | 12,552 |
| | 39 | % | | 844 | % |
Average ferrous recycled metal sales prices ($/LT):(1) | | | | | | | | | |
Steel Manufacturing Business(2) | $ | 412 |
| | $ | 339 |
| | $ | 328 |
| | 22 | % | | 3 | % |
| Other domestic | $ | 389 |
| | $ | 311 |
| | $ | 232 |
| | 25 | % | | 34 | % |
| Foreign | $ | 421 |
| | $ | 330 |
| | $ | 262 |
| | 28 | % | | 26 | % |
| Average | $ | 416 |
| | $ | 328 |
| | $ | 264 |
| | 27 | % | | 24 | % |
| Ferrous sales volume (LT, in thousands): | | | | | | | | | |
| Steel Manufacturing Business | 404 |
| | 458 |
| | 335 |
| | (12 | )% | | 37 | % |
| Other domestic | 689 |
| | 651 |
| | 418 |
| | 6 | % | | 56 | % |
| Total domestic | 1,093 |
| | 1,109 |
| | 753 |
| | (1 | )% | | 47 | % |
| Foreign | 4,236 |
| | 3,122 |
| | 3,436 |
| | 36 | % | | (9 | )% |
| Total ferrous sales volume (LT, in thousands) | 5,329 |
| | 4,231 |
| | 4,189 |
| | 26 | % | | 1 | % |
Average nonferrous sales price ($/pound)(1) | $ | 1.06 |
| | $ | 0.83 |
| | $ | 0.61 |
| | 28 | % | | 36 | % |
| Nonferrous sales volumes (pounds, in thousands) | 568,560 |
| | 478,486 |
| | 397,056 |
| | 19 | % | | 21 | % |
| Outbound freight included in cost of goods sold (in thousands) | $ | 225,747 |
| | $ | 187,454 |
| | $ | 150,775 |
| | 20 | % | | 24 | % |
_____________________________
LT = Long Ton, which is 2,240 pounds
NM = Not Meaningful
| |
| (1) | Price information is shown after netting the cost of freight incurred to deliver the product to the customer. |
| |
| (2) | The fiscal 2009 average ferrous recycled metal sales price to SMB was significantly higher than the average foreign sales price because when compared to foreign customers, sales to SMB were greater in volume during the first quarter of the fiscal year, when sales prices were higher, thenthan in the latter three quarters. |
LT = Long Ton, which is 2,240 pounds
NM = Not Meaningful
30Fiscal 2011 compared with fiscal 2010
Revenues
The increase in revenues was primarily attributable to higher average net selling prices and higher sales volumes caused by increased demand, availability of raw materials and incremental volume from acquisitions.
The increase in ferrous revenues was primarily driven by higher average net selling prices and higher sales volumes. The average net ferrous selling price increased $88 per long ton during fiscal 2011 primarily due to stronger demand from export markets as
27 / Schnitzer Steel Industries, Inc. Form 10-K 2011
well as gradually recovering domestic demand which drove increases in foreign and domestic selling prices. Ferrous sales volumes increased by 1.1 million long tons driven by increased availability of raw materials, our focus on maximizing throughput, which is being accomplished through increased purchases of raw materials, increased production as a result of our investments in technology and continuous improvement programs, and incremental volume from acquisitions.
The increase in nonferrous revenues was driven by increases in both the average nonferrous net selling price and sales volumes. The average net selling price increased $0.23 per pound during fiscal 2011 primarily due to stronger demand and higher commodity prices. In addition, nonferrous volumes sold increased 90 million pounds for fiscal 2011, reflecting stronger global market conditions, improved recovery of nonferrous materials processed through our enhanced shredding and sorting technologies, more nonferrous collection activity and incremental volume from acquisitions.
Segment Operating Income
The increase in operating income in fiscal 2011 was primarily due to higher average net selling prices and higher sales volumes for both ferrous and nonferrous scrap metal as a result of continuing strong export market conditions, increased availability of raw materials, increased yield from higher production and enhanced shredding and sorting technologies, and incremental operating income from acquisitions. While we were able to increase the spread between selling prices and purchase prices, operating income as a percentage of revenues decreased from 6.0% in fiscal 2010
to 5.4% in fiscal 2011, primarily due to the escalation in selling prices.
Included in fiscal 2011 operating income for MRB was an increase in SG&A expense of $26 million compared to the prior year primarily due to a $10 million increase in compensation expense as a result of increased headcount from new acquisitions and a $6 million increase in expenses for professional and other third party services primarily related to transaction costs associated with acquisitions. In fiscal 2011, SG&A expense was reduced by $6 million for favorable customer contract settlements, which represented a $3 million increase over the prior year. In addition, SG&A expense was lower in fiscal 2010 as it included $3 million in benefits from environmental expense reimbursements.
Fiscal 2010 compared with fiscal 2009
The increase in revenues
increased $472 million, or 31%, to $2.0 billion for fiscal 2010. This increase was primarily attributable to higher ferrous average net selling prices and higher nonferrous sales volumes, caused by increased demand for and availability of scrap metal.
Ferrous revenues increased $309$309 million, or 25%, to $1.6$1.6 billion for fiscal 2010.2010. The increase in ferrous revenues was primarily driven by higher average net selling prices. We experienced increasing prices during the year as the average net ferrous selling price increased $64$64 per long ton, or 24%, compared to the prior year due to strong demand in Asian markets and to a lesser extent improved demand in domestic markets, which provided support to both domestic and foreign selling prices. Nonferrous revenues increased $161$161 million, or 64%, to $413$413 million for fiscal 2010.2010. The increase in nonferrous revenues was driven by increases in both the average nonferrous net selling price and sales volumes. The average net selling price increased $0.22,$0.22, or 36%, to $0.83$0.83 per pound during fiscal 2010 primarily due to stronger demand. In addition, nonferrous volumes sold increased 81 million pounds, or 21%, to 478 million pounds for fiscal 2010, caused by increased recovery of nonferrous materials from the shredding process, more nonferrous collection activity and higher demand due to stronger global market conditions.
Segment Operating Income
Operating income for MRB was $118 million, or 6.0% of revenues for fiscal 2010 compared to $13 million, or 0.8%, of revenues for fiscal 2009.
The increase in operating income reflectsreflected the impact of improved worldwide demand for scrap and recycled metal, which led to higher average net selling prices that increased more than the average cost of raw materials, increased availability of raw materials and continued benefits from improved production operating efficiencies. In addition, income from joint ventures increased by $2$2 million over the prior year primarily due to the stronger demand for scrap metal. Included in fiscal 2010 operating income for MRB was a decrease in SG&A expense of $9$9 million compared to the prior year, primarily due to a reduction of $8$8 million in bad debt expense, $6$6 million in current year benefits from legal settlements and $3$3 million in environmental cost reimbursements. Offsetting these decreases were a $7$7 million increase in incentive compensation due to improvements in financial performance and a $1$1 million increase in expense related to the amortization of intangibles.
Fiscal 2009 compared with fiscal 200828Revenues /
MRB revenues decreased $1.6 billion, or 51%, to $1.5 billion for fiscal 2009. This decrease was primarily attributable to lower average net selling prices and lower sales volumes, caused by lower demand and reduced availability of raw materials due to weaker global market conditions in fiscal 2009.
Ferrous revenues decreased $1.4 billion, or 52%, to $1.2 billion for fiscal 2009. This decrease was driven by reductions in both ferrous sales volumes and average net selling prices. Ferrous sales volumes decreased 1.0 million tons, or 19%, to 4.2 million tons in fiscal 2009. Ferrous foreign sales volumes decreased 219 thousand tons, or 6%, to 3.4 million tons for fiscal 2009 due to a reduction in trading volumes. Ferrous domestic sales volumes decreased 789 thousand tons, or 51%, to 753 thousand tons in fiscal 2009. These decreases in volume were primarily due to a combination of lower demand and reduced availability of raw materials. We also experienced declining prices during the year as the average net ferrous selling price decreased $172 per long ton, or 39%, compared to the prior year due to lower demand and weaker global market conditions.
Nonferrous revenues decreased $209 million, or 45%, to $252 million for fiscal 2009. This decrease was primarily driven by a decrease in both the average nonferrous net selling price and sales volumes, caused by lower demand and weaker global market conditions. The average net selling price decreased $0.42 per pound, or 41%, to $0.61 per
Schnitzer Steel Industries, Inc. Form 10-K 2010 / 312011
pound during fiscal 2009 primarily due to weaker demand. In addition, due to a combination
Table of lower demand and reduced availability, nonferrous pounds shipped decreased 42 million pounds, or 10%, to 397 million pounds for fiscal 2009.Contents
Segment Operating Income
Operating income for MRB was $13 million, or 0.8% of revenues for fiscal 2009 compared to $357 million, or 11.7% of revenues for fiscal 2008. The decrease in operating income reflects the impact of the lower net selling prices for ferrous and nonferrous metal, which declined more than the costs of raw materials and freight, and decreased processed ferrous and nonferrous volumes that resulted in a non-cash NRV inventory write down of $29 million in fiscal 2009. In addition, income from joint ventures decreased by $12 million, or 95% over the prior year primarily due to the weaker demand for scrap metal.
Weaker year-over-year demand and the impact of declines in selling prices, which outpaced the decline in purchase prices, combined with a number of customer renegotiations, deferrals, and cancellations during the first quarter of fiscal 2009, resulted in the reduction in operating income. Offsetting the decreases in average selling prices and volume was a $16 million decrease in MRB’s SG&A expense compared to the prior year, primarily due to $12 million of lower compensation-related expenses, including annual incentive compensation expense, resulting from our weaker financial and operating performance and decreased headcount, a $5 million decrease in professional and outside services, and a $4 million decrease in share-based compensation expense, partially offset by an increase in bad debt of $4 million and a $3 million increase in legal reserves due to ongoing trade disputes. Also included in the operating income loss was a $4 million release of environmental reserves and a $3 million gain recognized in the first quarter of fiscal 2009, primarily related to the resolution of the Hylebos Waterway litigation.
Outlook
MRB’s results are dependent upon the worldwide demand for scrap metal which is used in the production of steel products, and on the available supply and cost of raw materials which are sourced in the United States. Despite the depressed worldwide economic conditions that continue to inhibit production by industrial producers of steel, we believe that the long-term fundamentals supporting the demand for recycled metals remain positive. As the market prices for scrap metal are subject to short-term movements caused by changes in economic conditions, we are not able to provide guidance for market prices of scrap metal; however we expect volumes to be above those seen in fiscal 2010.
Auto Parts Business
| | | | | | | | | | | | | | | | | | | | |
| | | For the Year Ended August 31, | |
| | | | | | | | | | | | % Increase/(Decrease) | |
| ($ in thousands) | | 2010 | | | 2009 | | | 2008 | | | 2010 vs 2009 | | | 2009 vs 2008 | |
Revenues | | $ | 241,233 | | | $ | 153,207 | | | $ | 228,082 | | | | 57 | % | | | (33 | %) |
Cost of goods sold | | | 147,511 | | | | 112,887 | | | | 137,866 | | | | 31 | % | | | (18 | %) |
Selling, general and administrative expense | | | 42,426 | | | | 36,719 | | | | 43,895 | | | | 16 | % | | | (16 | %) |
Environmental matters | | | 200 | | | | 37 | | | | (1,365 | ) | | | 441 | % | | | NM | |
| | | | | | | | | | | | | | | | | | | | |
Segment operating income | | $ | 51,096 | | | $ | 3,564 | | | $ | 47,686 | | | | 1334 | % | | | (93 | %) |
| | | | | | | | | | | | | | | | | | | | |
Number of stores at period end | | | 45 | | | | 39 | | | | 38 | | | | 15 | % | | | 3 | % |
Cars purchased (in thousands) | | | 329 | | | | 258 | | | | 311 | | | | 28 | % | | | (17 | %) |
NM = Not Meaningful
|
| | | | | | | | | | | | | | | | | |
| | For the Year Ended August 31, |
| | | | | | | | % Increase/(Decrease) |
| ($ in thousands) | 2011 | | 2010 | | 2009 | | 2011 vs 2010 | | 2010 vs 2009 |
| Revenues | $ | 319,833 |
| | $ | 241,233 |
| | $ | 153,207 |
| | 33 | % | | 57 | % |
| Cost of goods sold | 203,094 |
| | 147,511 |
| | 112,887 |
| | 38 | % | | 31 | % |
| Selling, general and administrative expense | 52,582 |
| | 42,426 |
| | 36,719 |
| | 24 | % | | 16 | % |
| Environmental matters | 130 |
| | 200 |
| | 37 |
| | (35 | )% | | 441 | % |
| Segment operating income | $ | 64,027 |
| | $ | 51,096 |
| | $ | 3,564 |
| | 25 | % | | 1,334 | % |
| Number of stores at period end | 50 |
| | 45 |
| | 39 |
| | 11 | % | | 15 | % |
| Cars purchased (in thousands) | 353 |
| | 329 |
| | 258 |
| | 7 | % | | 28 | % |
Fiscal 20102011 compared with fiscal 20092010
Revenues
APB’s record self-service revenues of $241 million in fiscal 2010 represented an $88 million, or 57%, increase over fiscal 2009.
The increase in revenues included a $37$41 million increase in scrap vehicle revenue, a $32$28 million increase32 / Schnitzer Steel Industries, Inc. Form 10-K 2010
in core revenue and a $15
$5 million increase in parts revenue compared to fiscal 2009.2010. The increase in revenues was driven by higher commodity prices, increased car volumes, further enhancement of production operating efficiencies, and an increase in the number of self-service store locations. In fiscal 2011, APB did not benefit from the Cash-For-Clunkers government stimulus program that increased sales volumes in the prior year. Segment Operating Income
The increase in operating income for fiscal 2011 reflected the impact of higher prices, increased volumes of scrap and core sales, and improved production operating efficiencies. The decrease in operating income as a percentage of revenues from 21.2% in fiscal 2010 to 20.0% in fiscal 2011 reflected an increase in car purchasing costs which outpaced the increase in selling prices and an increase in SG&A expense of $10 million for fiscal 2011, primarily due to a $4 million increase in compensation expense as a result of additional headcount from acquisitions.
Fiscal 2010 compared with fiscal 2009
Revenues
The increase in revenues included a $37 million increase in scrap vehicle revenue, a $32 million increase in core revenue and a $15 million increase in parts revenue compared to fiscal 2009. These recordincreases in revenues were driven by an increase from 39 to 45 self-service store locations, improved production operating efficiencies, improvements in commodity prices, increased sales of used auto parts attributable to benefits recognized from purchasing higher quality vehicles and increased volumes of purchases of scrapped vehicles including additional vehicles purchased pursuant to the Cash-For-Clunkers government stimulus program.
Segment Operating Income
Operating income for APB was $51 million, or 21% of revenues, for fiscal 2010 compared to $4 million, or 2% of revenues, for fiscal 2009.
The increase in operating income for fiscal 2010 reflected the impact of higher selling prices and volumes for scrapped vehicles, cores and parts, which resulted primarily from increases in commodity prices, an increase from 39 to 45 self-service store locations and improved production operating efficiencies. Included in operating income was an increase in SG&A expense of $6$6 million for fiscal 2010, primarily due to a $4$4 million increase in compensation expenses, including increases in share-based and incentive compensation, due to improvements in operating results over the prior year and a $1$1 million increase in expense related to the amortization of intangibles. APB’s results of operations do not include operating results from discontinued operations. See Note 7 – Business CombinationsDiscontinued Operations in the notesNotes to the consolidated financial statementsConsolidated Financial Statements in Part II, Item 8 of this report.
Fiscal 2009 compared with fiscal 200829Revenues /
APB revenues decreased $75 million, or 33%, to $153 million for fiscal 2009, driven by reduced sales volumes and lower average selling prices for scrapped vehicles and cores resulting from the impact of the economic downturn. This included a $46 million decrease in scrap vehicle revenue due to a $126 decrease in the average selling price for scrapped vehicles and a decrease of 49 thousand tons, or 13%, in volumes shipped. Core revenue decreased $31 million over the prior year, primarily due to a $101 decrease in the average selling price per core. Partially offsetting these decreases was parts revenue that increased $2 million over the prior year.
Segment Operating Income
Operating income for APB was $4 million, or 2% of revenues, for fiscal 2009 compared to $48 million, or 21% of revenues, for fiscal 2008. The decrease in operating income for fiscal 2009 reflects the impact of lower sales volumes and prices for scrapped vehicles and cores, and the impact of inventory costs not falling as rapidly as selling prices. Included in the operating income were reductions in SG&A expense of $7 million for fiscal 2009, due to $4 million in lower compensation-related expenses, including incentive compensation, and reduced expenses resulting from cost containment measures which reduced headcount and other non-compensation related costs compared to the same periods in the prior year.
Outlook
APB’s results are dependent upon both the supply and cost of end-of-life vehicles as well as the market prices of ferrous and nonferrous scrap metals, which are in turn a function of overall global economic conditions. As average ferrous and nonferrous selling prices increased in fiscal 2010 compared to fiscal 2009 due to improved worldwide demand for these metals, APB was able to raise its purchase prices of vehicles and still maintain its margins, which contributed to a record year in terms of revenue and operating income. Given current price levels, APB expects volumes in fiscal 2011 to be slightly above those seen in fiscal 2010, with volumes from new stores acquired in fiscal 2010 likely offsetting the one-time benefits of the government’s Cash-For-Clunkers program.
Schnitzer Steel Industries, Inc. Form 10-K 2010 / 332011
Steel Manufacturing Business
| | | | | | | | | | | | | | | | | | | | |
| | | For the Year Ended August 31, | |
| | | | | | | | | | | | % Increase/(Decrease) | |
| ($ in thousands, except price) | | 2010 | | | 2009 | | | 2008 | | | 2010 vs 2009 | | | 2009 vs 2008 | |
Revenues(1) | | $ | 285,085 | | | $ | 263,269 | | | $ | 603,189 | | | | 8 | % | | | (56 | %) |
Cost of goods sold | | | 284,258 | | | | 299,311 | | | | 522,200 | | | | (5 | %) | | | (43 | %) |
Selling, general and administrative expense | | | 6,689 | | | | 5,958 | | | | 8,689 | | | | 12 | % | | | (31 | %) |
| | | | | | | | | | | | | | | | | | | | |
Segment operating income (loss) | | $ | (5,862 | ) | | $ | (42,000 | ) | | $ | 72,300 | | | | (86 | %) | | | NM | |
| | | | | | | | | | | | | | | | | | | | |
Finished goods average sales price ($/ton)(2) | | $ | 587 | | | $ | 617 | | | $ | 728 | | | | (5 | %) | | | (15 | %) |
Finished steel products sold (tons, in thousands) | | | 444 | | | | 381 | | | | 776 | | | | 17 | % | | | (51 | %) |
Rolling mill utilization | | | 58 | % | | | 46 | % | | | 99 | % | | | 26 | % | | | (54 | %) |
|
| | | | | | | | | | | | | | | | | | |
| | | For the Year Ended August 31, |
| | | | | | | | | % Increase/(Decrease) |
| ($ in thousands, except price) | | 2011 | | 2010 | | 2009 | | 2011 vs 2010 | | 2010 vs 2009 |
Revenues(1) | | $ | 317,483 |
| | $ | 285,085 |
| | $ | 263,269 |
| | 11 | % | | 8 | % |
| Cost of goods sold | | 308,319 |
| | 284,258 |
| | 299,311 |
| | 8 | % | | (5 | )% |
| Selling, general and administrative expense | | 6,602 |
| | 6,689 |
| | 5,958 |
| | (1 | )% | | 12 | % |
| Segment operating income (loss) | | $ | 2,562 |
| | $ | (5,862 | ) | | $ | (42,000 | ) | | NM |
| | (86 | )% |
Finished goods average sales price ($/ton)(2) | | $ | 697 |
| | $ | 587 |
| | $ | 617 |
| | 19 | % | | (5 | )% |
| Finished steel products sold (tons, in thousands) | | 439 |
| | 444 |
| | 381 |
| | (1 | )% | | 17 | % |
| Rolling mill utilization | | 56 | % | | 58 | % | | 46 | % | | (3 | )% | | 26 | % |
_____________________________
NM = Not Meaningful
| |
| (1) | Revenues include sales of semi-finished goods (billets) and finished steel products. |
| |
| (2) | Price information is shown after netting the cost of freight incurred to deliver the product to the customer. |
NM = Not Meaningful
Fiscal 20102011 compared with fiscal 20092010
SMB revenues increased $22 million, or 8%,primarily as a result of increased average selling prices for finished steel products, reflecting our ability to $285 millionpass through higher purchase prices for scrap and other raw materials to end customers. The increase in average selling prices for finished steel products was driven by increased scrap metal purchase prices in global markets as a result of improved worldwide demand and was partially offset by a decrease in the volume of finished steel products sold for fiscal 2011 due to continuing weak demand in our West Coast markets as a result of slow economic growth that hampers construction spending recovery.
Segment Operating Income (Loss)
The increase in operating income reflected the impact of increased average selling prices, which outpaced the increase in scrap and other raw material purchase costs. SMB acquired its scrap metal requirements from MRB at rates that approximated export market prices for shipments from the West Coast of the U.S.
Fiscal 2010 compared with fiscal 2009
Revenues
SMB revenues increased as a result of higher sales volumes. Finished goods sales volumes increased 63 thousand tons, or 17%, to 444 thousand tons in fiscal 2010.2010. The increase in volume was partially offset by a $30$30 per ton, or (5%)(5)%, decrease in the finished goods average sales price to $587$587 per ton for fiscal 2010.2010. The increase in sales volumes and the decrease in averages sales prices reflected global market conditions as well as improved, but still weak, Western USU.S. demand for finished steel products.
Segment Operating Loss
Operating loss for SMB was ($6) million for fiscal 2010 compared to ($42) million for fiscal 2009.
As a percentage of revenues, operating loss decreased by 13.9 percentage points in fiscal 2010.2010. This improvement reflects the impact of increased sales volumes in the current year. Included in operating incomeloss were increases in SG&A expense of $1$1 million for fiscal 2010, resulting from an increase in incentive compensation, including share-based compensation, due to improvements in operating results over the prior year. SMB acquired substantially all of its scrap metal requirements from MRB at rates that approximateapproximated export market prices for shipments from the West Coast of the US.Fiscal 2009 compared with fiscal 2008U.S.
Revenues
SMB revenues decreased $340 million, or 56%, to $263 million for fiscal 2009 as a result of both reduced sales volumes and average selling prices for finished steel products. Finished goods sales volumes decreased by 395 thousand tons, or 51%, to 381 thousand tons for fiscal 2009 primarily due to reduced demand resulting from the weakened market conditions. Average finished goods selling prices for fiscal 2009 decreased $111 per ton, or 15%, to $617 per ton as a result of the reduced demand.
Segment Operating Income (Loss)
Operating loss for SMB was ($42) million for fiscal 2009 compared to an operating income of $72 million for fiscal 2008. As a percentage of revenues, operating income decreased by 27.9 percentage points in fiscal 2009. The decrease in operating income reflects the impact of lower sales volumes caused by weaker market conditions, selling prices that declined faster than costs and lower anticipated future selling prices that resulted in a non-cash NRV inventory write down of $32 million in fiscal 2009. Included in the operating loss were reductions in SG&A expense of $3 million for fiscal 2009, due to lower compensation-related expenses, including incentive compensation, and reduced expenses resulting from cost containment measures which reduced headcount and other non-compensation related costs
34 / Schnitzer Steel Industries, Inc. Form 10-K 2010
compared to the same periods in the prior year. SMB acquired substantially all of its scrap metal requirements from MRB at rates that approximate export market prices for shipments from the West Coast of the US.
Outlook
SMB’s results are dependent upon demand for its products by companies operating in the construction industry on the West Coast of the US and Canada. As the economic downturn continues to hamper construction spending, demand for SMB’s finished steel products is expected to remain soft in fiscal 2011. Sales volumes and margins are heavily dependent upon the timing and strength of the US economic recovery and we are currently unable to provide any guidance for prices and volumes for the fiscal year as a whole.
Liquidity and Capital Resources
We rely on cash provided by operating activities as a primary source of liquidity, supplemented by current cash on hand and
borrowings under our existing credit facilities.
We had cash balances of $30$49 million and $41$30 million as of August 31, 20102011 and 2009,2010, respectively. Cash balances are intended to be used primarily for working capital and capital expenditures. We use excess cash on hand to reduce amounts outstanding onunder our credit facilities. As of August 31, 2010,2011, debt, net of cash, was $70$354 million compared to $71$70 million as of August 31, 20092010 (see the Non-GAAP Financial Measures below). This increase in our debt, net of cash, was primarily due to acquisitions. Our cash balances as of August 31, 2011 and 2010 include an amount of
$11 million and $16 million, respectively, which is
30 / Schnitzer Steel Industries, Inc. Form 10-K 2011
indefinitely reinvested in Puerto Rico and Canada.
Net cash provided by operating activities in fiscal 20102011 was $89$140 million, compared to $288$89 million in fiscal 20092010 and $142$288 million in fiscal 2008.2009. Cash provided by operating activities in fiscal 2011 included an increase of $45 million in accounts payable due to higher volumes of material purchases and the timing of payments and an increase in accrued income taxes of $22 million due to the improved results. Uses of cash included an increase in accounts receivable of $92 million due to higher sales and the timing of collections and a $45 million increase in inventory due to higher purchase costs and higher volumes of material on hand at year-end.
Cash provided by operating activities in fiscal 2010 included income tax refunds of $49 million, an increase in accrued payroll liabilities of $12$12 million due to increased incentive compensation and an increase of $8$8 million in accounts payable due to timing of payments. Uses of cash included a $109$109 million increase in inventory (excluding $35 million of inventory sold as a part of the divestiture of the full-service auto parts operation) due to higher purchase costs and higher volumes of material on hand at year-end and an increase in accounts receivable of $12$12 million due to the timing of collections. Cash provided by operating activities in fiscal 2009 included a $199$199 million decrease in inventory due to lower purchase costs and lower volumes of material purchased and a decrease in accounts receivable of $190$190 million resulting from cash collections of receivables. These sources of cash were partially offset by uses of cash that included a $79$79 million decrease in accounts payable due to the reduction in price and volumes of material purchases, a $46$46 million increase in refundable income taxes, a $42$42 million decrease in accrued income taxes due to tax payments related to fiscal 2008 and a $36$36 million decrease in accrued payroll liabilities mainly due to the payment of fiscal 2008 incentive compensation awards.Cash provided by operating activities in fiscal 2008 included a $54 million increase in accounts payable due to the timing of payments and higher material costs, a $38 million increase in accrued income taxes and a $21 million increase in compensation-related liabilities, including performance incentive related liabilities, principally due to our improved financial and operating performance. These sources of cash were partially offset by an increase in inventory of $216 million due to higher material costs and volumes and a $135 million increase in accounts receivable mainly due to increased sales and timing of collections.
Net cash used in investing activities in fiscal 20102011 was $64$400 million, compared to $150$64 million in fiscal 20092010 and $128$150 million in fiscal 2008.Schnitzer Steel Industries, Inc. Form 10-K 2010 / 352009
.
Cash used in investing activities in fiscal 20102011 included $64$294 million for completed acquisitions and $105 million in capital expenditures to upgrade our equipment and infrastructure.
Cash used in investing activities in fiscal 2010 included $64 million in capital expenditures to upgrade our equipment and infrastructure and $41$41 million for completed acquisitions, partially offset by $41$41 million in proceeds from the sale of the full-service auto parts business and other assets. Cash used in investing activities in fiscal 2009 included $93$93 million for completed acquisitions and $59$59 million in capital expenditures to upgrade our equipment and infrastructure.Cash used in investing
Financing Activities
Net cash provided by financing activities infor fiscal 2008 included $842011 was $280 million in capital expenditures to upgrade our equipment and infrastructure and $47 million for completed acquisitions.Financing ActivitiesNet, compared with net cash used in financing activities for fiscal 2010 was $36of $36 million compared to $111 million in fiscal 20092010 and $12$111 million in fiscal 2008.
2009.
Cash used inprovided by financing activities in 20102011 was primarily due to an $11$303 million reduction in long-termadditional net debt and $17borrowings (refer to Non-GAAP Financial Measures below) which were mainly used to fund our acquisitions, partly offset by $10 million in repurchases of outstanding shares of our Class A common stock. Cash used in financing activities in 2010 was primarily due to $11 million in net debt repayments (refer to Non-GAAP Financial Measures below) and $17 million in repurchases of outstanding shares of our Class A common stock.
Cash used in financing activities in fiscal 2009 was primarily due to $76$76 million in net debt repayments (refer to Non-GAAP Financial Measures below) which were funded by higher levels of cash generation and $30$30 million in repurchases of outstanding shares of our Class A common stock.Cash used in financing activities in fiscal 2008 was primarily due to $45 million in repurchases
31 / Schnitzer Steel Industries, Inc. Form 10-K 2011
Credit Facilities
Following is a summary of our
Class A common stock, which was financed with a $40 million increase in debt.Credit Facilities
Our short-term borrowings consist primarily of a one year, unsecured, uncommitted $25 millionoutstanding balances and availability on credit line with Wells Fargo Bank, N.A. that expires on March 1, 2011. Interest rates on outstanding indebtedness under the unsecured line of credit are set by the bank at the time of borrowing. We had no borrowings outstanding under this credit line as of August 31, 2010 or August 31, 2009.
We maintain a $450 million revolving credit facility that matures in July 2012 pursuant to anfacilities and long-term debt (in thousands):
|
| | | | | | | | |
| | | Outstanding as of 8/31/2011 | | Remaining Availability |
| Unsecured, uncommitted credit line | | $ | — |
| | $ | 25,000 |
|
| Bank unsecured revolving credit facility | | $ | 393,428 |
| | $ | 256,572 |
|
| Tax-exempt economic development revenue bonds due January 2021 | | $ | 7,700 |
| | N/A |
|
In February 2011, we amended and restated our unsecured committed bank credit agreement with Bank of America, N.A., as administrative agent, and the other lenders party thereto.thereto to increase the amount available to $650 million from $450 million, including $30 million in Canadian Dollar availability. The final maturity was also extended to February 2016. Interest rates on outstanding indebtedness under the amended agreement are based, at our option, on either the London Interbank Offered Rate (or the Canadian equivalent) plus a spread of between 0.50%1.75% and 1.00%2.75%, with the amount of the spread based on a pricing grid tied to our leverage ratio, or the greater of the prime rate or the federal fundsbase rate plus 0.50%a spread of between 0% and 1%. In addition, annual commitment fees are payable on the unused portion of the credit facility at rates between 0.10%0.25% and 0.25%0.45%, which is also based on a pricing grid tied to our leverage ratio. As of August 31, 2010 and 2009, weWe had borrowings outstanding under the credit facility of $90$393 million and $100$90 million as of August 31, 2011 and 2010, respectively. The increased borrowings were primarily used to finance acquisitions. The weighted average interest rate on amounts outstanding under this linefacility was 0.79%2.48% and 0.78%0.79% as of August 31, 20102011 and 2009,2010, respectively. We also have an unsecured, uncommitted $25 million credit line with Wells Fargo Bank, N.A. that expires on March 1, 2012. Interest rates are set by the bank at the time of borrowing. We had no borrowings outstanding under this facility as of August 31, 2011 and 2010.
The two bank credit agreements contain various representations and warranties, events of default and financial and other covenants, including covenants regarding maintenance of a minimum fixed charge coverage ratio and a maximum leverage ratio. As of August 31, 2010,2011, we were in compliance with all such covenants. We use these credit facilities to fund share repurchases, acquisitions, capital expenditures, share repurchases, and working capital requirements. In addition, as of August 31, 20102011 and 2009,2010, we had $8$8 million of long-term indebtedness in the form oftax-exempt bonds maturingthat mature in January 2021. Acquisitions
AcquisitionsThe aggregate purchase price paid for acquisitions during fiscal 2010 was $41 million compared to $96 million during fiscal 2009 which included cash acquired and amounts to be paid of $3 million. During fiscal 2010,2011, we continued to expand our presence in the regions in which we operate and in new locations through the acquisition of value-creating businesses. The aggregate purchase price paid for acquisitions during fiscal 2011 was $314 million (comprising $293 million in cash, $19 million in shares of a subsidiary and $2 million in contingent consideration) compared to $41 million during fiscal 2010 and $96 million during fiscal 2009 (which included cash acquired and amounts to be paid of $3 million). See Note 76 – Business Combinations in the notesNotes to the consolidated financial statementsConsolidated Financial Statements in Part II, Item 8 of this report for additional information on business acquisitions.
36 / Schnitzer Steel Industries, Inc. Form 10-K 2010
Capital expenditures totaled $64$105 million $59, $64 million and $84$59 million for fiscal 2011, 2010 2009 and 2008,2009, respectively. During fiscal 2010,2011, we continued our investmentinvestments in general improvements at a numberthe replacement of our metals recycling facilities, includingexisting equipment and infrastructure, investments in technology to improve the recovery and separation of nonferrous materials from the shredding process and investments to further improve efficiency and increase capacity, increaseimprove worker safety and enhance environmental systems.
We plan to invest up to $135$125 million in capital expenditures in fiscal 2011,2012, which is expected to be spent on continued investments in technology to improve the recovery and separation of nonferrous materials from the shredding process, material handling and processing equipment, enhancements to our information technology infrastructure, improvements for the facilities,to our facilities’ environmental and safety infrastructure and normal equipment replacement and maintenance.replacement. We believe these investments will create value for our shareholders. We expect to use cash generated from operations and available lines of credit to fund capital expenditures in fiscal 2011.2012. Our commitment to sustainable recycling and operating our business in an environmentally responsible manner requires us to continue to invest in facilities that improve our environmental presence in the communities in which we operate. Consistent with this commitment,As part of our capital expenditures, we invested $13$14 million $9, $13 million and $10$9 million for environmental projects in fiscal 2011, 2010 and 2009, respectively. We plan to invest an additional $14 million in capital expenditures for environmental projects in fiscal 2010, 2009 and 2008, respectively. We plan to invest a further $18 million in capital expenditures for environmental projects in fiscal 2011. 2012.
32 / Schnitzer Steel Industries, Inc. Form 10-K 2011
These projects include investments in storm water systems and equipment to ensure ongoing compliance with air quality and other environmental regulations.
Our environmental programs also require us to incur costs to remediate conditions at existing sites and to monitor previously remediated sites. We incurred $2 million, $2 million and $3 million in environmental expenditures, which were either expensed or reduced recorded reserves, in fiscal 2010, 2009 and 2008, respectively. We expect to incur similar amounts of expenditures going forward.
We have been identified by the EPA as a PRP that owns or operates or formerly owned or operated sites which are part of or adjacent to the Portland Harbor Superfund site. Because there has not been a determination of the total investigation costs, the remediation that will be required, the amount of natural resource damages or how the costs of the ongoing investigations and any remedy and natural resource damages will be allocated among the PRPs, it is not presently possible to estimate the costs which we are likely to incur in connection with the Site, although such costs could be significant and material to our future cash flows. Recording ofAny material liabilities recorded in the future related to the Site could result in our failure to maintain compliance with certain covenants in our debt agreements. Significant cash outflows in the future related to the Site could reduce the amount of ouramounts available for borrowing capacity that could otherwise be used for investment in capital expenditures and acquisitions. The EPA has indicated that it expects to issue a record of decision sometime in 2013 that will discuss remedial alternatives for the Site sometime in 2012.Site. See Contingencies – Environmental in Note 1211 – Commitments and Contingencies in the notesNotes to the consolidated financial statementsConsolidated Financial Statements in Part II, Item 8 of this report.
Pursuant to a share repurchase program, as amended, in 2001 and 2006, we wereare authorized to repurchase up to 6.09 million shares of our Class A common stock when management deems such repurchases to be appropriate. In November 2008, our Board of Directors approved an increase in the shares authorized for repurchase by 3.0 million, to 9.0 million. We evaluate long- and short-range forecasts as well as anticipated sources and uses of cash before determining the course of action that would best enhance shareholder value.in our share repurchase program. Prior to fiscal 2010,2011, we had repurchased approximately 5.15.5 million shares under the program. In fiscal 2010,2011, we repurchased a total of 412,994254,332 shares of our Class A common stock under this program. Asprogram in open-market transactions at a result, ascost of August 31, 2010 there were$10 million, leaving approximately 3.53.2 million shares available for repurchase under existing authorizations. Redeemable Noncontrolling Interest
Pension ContributionsWe make contributions to a defined benefit pension plan, several defined contribution plans and several multiemployer defined benefit pension plans. Contributions vary depending on the plan and are based upon plan provisions, actuarial valuations and negotiated labor agreements. In fiscal 2006,March 2011, we froze further benefit accruals in
Schnitzer Steel Industries, Inc. Form 10-K 2010 / 37
our defined benefit plan. In fiscal 2010, we made a $2 million contributionissued common stock to the defined benefit plan duenoncontrolling interest holder of one of our subsidiaries that is redeemable both at the option of the holder and upon the occurrence of an event that is not solely within the Company’s control. Under the terms of an agreement related to a reduction inthe acquisition, the noncontrolling interest owner has the right to require the Company to purchase its funding status as a result of a reduction20% interest in the single discount rate assumptions usedCompany’s subsidiary for determining pension obligations. While we dofair value. The noncontrolling interest becomes redeemable within 60 days after the later of (i) the third anniversary of the date of the acquisition and (ii) the date on which certain principals of the minority shareholder are no longer employed by the Company. The conditions for redemption of the noncontrolling interest had not anticipate making additional contributionsbeen met as of August 31, 2011. If the interest were to be redeemed, the defined benefit plan in fiscal 2011, we may elect orCompany would be required to do so.
In addition, during fiscalpurchase all of such interest at fair value on the date of redemption. As of August 31, 2011 we anticipate making $4, the fair value of the redeemable noncontrolling interest was $19 million of contributions. See Note 12 – Redeemable Noncontrolling Interest in the Notes to the multiemployer plans in which we participate, including contributions totaling $2 million for the multiemployer plan benefiting union employees of SMB. We believe any additional funding requirements will not have a material impact on our financial condition. See Note 15 – Employee Benefits in the notes to the consolidated financial statementsConsolidated Financial Statements in Part II, Item 8 of this report for further discussion of our retirement benefit plans.
Effective in March 2009, we suspended employer contributions to our defined contribution plans. We resumed contributions to these plans in April 2010 and expect to make contributions of $3 million to our defined contribution plans in fiscal 2011.
report.
Assessment of Liquidity and Capital Resources
Historically, our available cash resources, internally generated funds, credit facilities and equity offerings have financed our acquisitions, capital expenditures, working capital and other financing needs.
We generally believe our current cash resources, internally generated funds, existing credit facilities and access to the capital markets will provide adequate
financingshort-term and long-term liquidity needs for acquisitions, capital expenditures, working capital, joint ventures,
stockshare repurchases, debt service requirements,
post-retirement obligations and
future environmental
obligations forobligations. However, in the
next 12 months. However, continued weak generalevent market conditions
deteriorate, we may
result in further utilizing our available credit lines and curtailing capital and operating expenditures, delaying or restricting acquisitions and share repurchases and reassessing working capital requirements. Should we determine, at any time, that weneed additional liquidity, which would require
additional short-term liquidity, we willus to evaluate available alternatives and take appropriate steps to obtain sufficient additional
funds, but therefunds. There can be no assurance that any such supplemental funding, if sought, could be obtained or, if obtained, would be adequate or on acceptable terms.
However, we believe that our balance sheet as of August 31, 2010, expected cash flow from operations and existing credit facilities should provide additional sources of liquidity if required.Off-Balance Sheet Arrangements
With the exception of operating leases and letters of credit, we are not a party to any off-balance sheet arrangements that have, or are reasonably likely to have, a current or future material effect on our financial condition, results of operations or cash flows. We enter into operating leases for both new equipment and property. See Note 1211 – Commitments and Contingencies in the notesNotes to the consolidated financial statementsConsolidated Financial Statements in Part II, Item 8 of this report for additional information on our operating leases.
3833 / Schnitzer Steel Industries, Inc. Form 10-K 20102011
Contractual Obligations and Commitments
We have certain contractual obligations to make future payments. The following table summarizes these future obligations as of August 31, 20102011 (in thousands): | | | | | | | | | | | | | | | | | | | | | |
| | | Payment Due by Period |
| | | 2011 | | 2012 | | 2013 | | 2014 | | 2015 | | Thereafter | | Total |
Contractual Obligations | | | | | | | | | | | | | | | | | | | | | |
Long-term debt | | $ | 645 | | $ | 90,000 | | $ | 0 | | $ | 0 | | $ | 0 | | $ | 7,700 | | $ | 98,345 |
Interest payments on long-term debt | | | 736 | | | 678 | | | 29 | | | 29 | | | 29 | | | 159 | | | 1,660 |
Capital leases, including interest | | | 673 | | | 645 | | | 589 | | | 397 | | | 90 | | | 2 | | | 2,396 |
Pension funding obligations | | | 150 | | | 239 | | | 181 | | | 180 | | | 179 | | | 1,902 | | | 2,831 |
Other accrued liabilities | | | 524 | | | 300 | | | 457 | | | 300 | | | 0 | | | 0 | | | 1,581 |
Reserve for uncertain tax positions | | | 1,553 | | | 406 | | | 0 | | | 0 | | | 0 | | | 0 | | | 1,959 |
Operating leases | | | 15,178 | | | 13,196 | | | 11,070 | | | 8,348 | | | 4,731 | | | 5,205 | | | 57,728 |
Service obligation | | | 1,399 | | | 418 | | | 83 | | | 30 | | | 30 | | | 0 | | | 1,960 |
Purchase obligations: | | | | | | | | | | | | | | | | | | | | | |
Materials purchase commitment | | | 1,124 | | | 749 | | | 0 | | | 0 | | | 0 | | | 0 | | | 1,873 |
Natural gas contract(1) | | | 2,204 | | | 0 | | | 0 | | | 0 | | | 0 | | | 0 | | | 2,204 |
Electricity contract(2) | | | 1,553 | | | 141 | | | 0 | | | 0 | | | 0 | | | 0 | | | 1,694 |
| | | | | | | | | | | | | | | | | | | | | |
Total | | $ | 25,739 | | $ | 106,772 | | $ | 12,409 | | $ | 9,284 | | $ | 5,059 | | $ | 14,968 | | $ | 174,231 |
| | | | | | | | | | | | | | | | | | | | | |
|
| | | | | | | | | | | | | | | | | | | | | | | | | | | |
| | Payment Due by Period |
| | 2012 | | 2013 | | 2014 | | 2015 | | 2016 | | Thereafter | | Total |
| Contractual Obligations | | | | | | | | | | | | | |
Long-term debt(1) | $ | — |
| | $ | — |
| | $ | — |
| | $ | — |
| | $ | 393,428 |
| | $ | 7,700 |
| | $ | 401,128 |
|
Interest payments on long-term debt(2) | 9,944 |
| | 9,944 |
| | 9,944 |
| | 9,944 |
| | 4,598 |
| | 113 |
| | 44,487 |
|
| Capital leases, including interest | 859 |
| | 827 |
| | 597 |
| | 279 |
| | 187 |
| | 762 |
| | 3,511 |
|
| Operating leases | 20,434 |
| | 18,116 |
| | 15,383 |
| | 11,092 |
| | 5,975 |
| | 20,146 |
| | 91,146 |
|
| Purchase obligations | 26,841 |
| | 144 |
| | 45 |
| | 20 |
| | — |
| | — |
| | 27,050 |
|
Other(3) | 528 |
| | 769 |
| | 609 |
| | 278 |
| | 201 |
| | 2,256 |
| | 4,641 |
|
| Total | $ | 58,606 |
| | $ | 29,800 |
| | $ | 26,578 |
| | $ | 21,613 |
| | $ | 404,389 |
| | $ | 30,977 |
| | $ | 571,963 |
|
| |
| (1) | SMB has a take-or-pay natural gas contract that currently requires a minimum purchase per day through October 2010, whether or notLong-term debt represents the amount is utilized.
principal amounts of all outstanding long-term debt, maturities of which extend to 2021. |
| |
| (2) | SMB has an electricity contract with MWL that requires a minimum purchaseInterest payments on long-term debt are based on interest rates in effect as of electricity at a rate subject toAugust 31, 2011. As the contractual interest rates are variable, pricing, whether or notactual cash payments may differ from the amount is utilized. The fixed portionestimates provided.
|
| |
| (3) | Other contractual obligations consist of the contract obligates SMB to pay $141 thousand per monthpension funding obligations, other accrued liabilities and reserves for eleven months each year until the contract expires in September 2011.uncertain tax positions. |
Our reserve for uncertain tax positions was $2 million and $4 million as of August 31, 2010 and 2009, respectively. See Note 17 – Income Taxes in the notes to the consolidated financial statements in Part II, Item 8 of this report for additional information.
Critical Accounting Policies and Estimates
The preparation of financial statements in accordance with accounting principles generally accepted in the United States of America requires us to make certain judgments, estimates, and assumptions regarding uncertainties that affect the reported amounts of assets, liabilities, revenues and expenses, and related disclosure of contingent assets and liabilities. An accounting policy is deemed to be critical if it requires an accounting estimate to be made based on assumptions and judgments about matters that are inherently uncertain at the time the estimate is made, if different estimates reasonably could have been used, or if changes in the estimate that are reasonably likely to occur could materially impact our consolidated financial statements. We have identified certaindeem critical accounting estimates, which arepolicies to be those that are most important to the portrayal of our financial condition and operating results. These estimates require difficult and subjective judgments, including whether estimates are required to be made aboutresults of operations. Because of the uncertainty inherent in these matters, that are inherently uncertain, if different estimates reasonablyactual results could have been used, or if changes indiffer from the estimates thatwe use in applying the critical accounting policies. We are not currently aware of any reasonably likely events or circumstances that would result in materially different amounts being reported.
Our critical accounting estimates include those related to
occur could materially impact the financial statements. Significant estimates underlying the accompanying consolidated financial statements include inventory,
valuation, goodwill
and other intangible asset valuation, environmental costs, accounting for business combinations,
revenue recognition and
revenue recognition.redeemable noncontrolling interest.
Our inventories primarily consist of scrap metal (ferrous, nonferrous, processed and unprocessed), nonferrous recovered joint product, used and salvaged vehicles, semi-finished steel products (billets) and finished steel products (primarily rebar, merchant bar and wire rod). Inventories are stated at the lower of cost or market.
MRB determines the cost of ferrous and nonferrous inventories principally using the average cost method and capitalizes substantially all direct costs and yard costs into inventory. MRB allocates material and production costs to joint products using the gross margin method. APB establishes cost for used and salvaged vehicle inventory based on the average price paid for a vehicle, capitalizing the vehicle cost into inventory. SMB establishes its finished steel product inventory cost based on a weighted average cost and capitalizes all direct and indirect costs of manufacturing into inventory. Indirect costs of manufacturing include general plant costs, maintenance and yard costs. We evaluate whether our inventory is properly valued at the lower of cost or market on a quarterly basis. We consider estimated future selling prices when
Schnitzer Steel Industries, Inc. Form 10-K 2010 / 39
determining the estimated net realizable value for our inventory. However, asAs MRB generally sells its export recycled ferrous metal under contracts that provide for shipment within 30 to 9060 days after the price is agreed, it utilizes the selling prices under committed contracts and sales orders for determining the estimated market price of quantities on hand that will be shipped under these contracts and orders.
hand.
The accounting process we use to record
unprocessed metal
and used and salvaged vehicle inventory quantities relies on significant estimates. With respect to unprocessed metal inventory, we rely on weighed quantities that are reduced by estimated amounts that are moved into production. These estimates utilize estimated recoveries and yields that are based on historical trends. Over time, these estimates are reasonably good indicators of what is ultimately produced; however, actual recoveries and yields can vary depending on product quality, moisture content and source of the unprocessed metal. If ultimate recoveries and yields are significantly different than estimated, the value of our inventory could be materially overstated or understated. To assist in validating the reasonableness of these estimates, we
run periodic testsperiodically review shrink factors and perform monthly physical inventory estimates. However, due to variations in product density, holding period and production processes utilized to manufacture the product, physical inventories will not necessarily detect all variances. To mitigate this risk, we adjust the ferrous physical inventories when the volume of a commodity is low and a physical inventory count can more accurately predict the remaining volume.
34 / Schnitzer Steel Industries, Inc. Form 10-K 2011
Goodwill
and Other Intangible AssetsWe evaluate goodwill
and intangibles with an indefinite lifefor impairment annually during the second fiscal quarter and upon the occurrence of certain triggering events or substantive changes in circumstances that indicate that the fair value of goodwill
or indefinite lived intangible assets may be impaired. Impairment of goodwill is tested at the reporting
unit level. A reporting unit is an operating segment
level. Ouror one level below an operating segment (referred to as a ‘component’). The Company has determined that its reporting
segments,units, for which goodwill has been allocated, are equivalent to
ourthe Company’s operating segments
(MRB, APB and SMB), as all of the components of
the respective segmentseach segment have similar economic characteristics.
The goodwill impairment test follows a two step process. In the first step, the fair value of a reporting
segmentunit is compared to its carrying value. If the carrying value of a reporting
segmentunit exceeds its fair value, the second step of the impairment test is performed for purposes of measuring the impairment. In the second step, the fair value of the reporting
segmentunit is allocated to all of the assets and liabilities of the reporting
segmentunit to determine an implied goodwill value. This allocation is similar to a purchase price allocation. If the carrying amount of the reporting
segment’sunit’s goodwill exceeds the implied fair value of goodwill, an impairment loss will be recognized in an amount equal to that excess. In the event of a divestiture of a business unit within a reporting
segment,unit, goodwill of the reporting
segmentunit is allocated to that business unit based on the
estimated fair value of the unit being divested to the total
estimated fair value of the reporting
segmentunit and a gain or loss is determined. The remaining goodwill in the reporting
segmentunit from which the assets were divested is subsequently re-evaluated for impairment.
Given that market prices of our reporting units are not readily available, determining their fair value involves the use of significant estimates and assumptions about matters that are inherently uncertain. We estimate the fair value of the reporting
segmentsunits using an income approach based on the present value of expected future cash flows utilizing a market-based weighted average cost of capital (“WACC”).
Forecasts of future cash flows are based on our best estimate of future sales and operating costs, pricing expectations and general market conditions. To estimate
the present value of the cash flows that extend beyond the final year of the discounted cash flow model, we employ a terminal value technique, whereby we use estimated operating cash flows minus capital expenditures and adjust for changes in working capital requirements in the final year of the model, then discount it by the WACC to establish the terminal value.
We includeIn addition, we compare the
present value of the terminal value in theaggregated estimated fair value
estimate. Given that market prices of our reporting
segments are not readily available, we make various estimates and assumptions in determiningunits to our market capitalization, including consideration of a control premium. The control premium represents the estimated amount an investor would pay to obtain a controlling interest. We believe this reconciliation is consistent with a market participant perspective. Based on our impairment test performed during the second quarter of fiscal year 2011, the estimated fair
values of the reporting segments, which is the price that would be received to sell the reporting segment as a whole in an orderly transaction between market participants. Forecasts of future cash flows are based on our best estimate of future sales and operating costs, pricing expectations and general market conditions.In addition, we test indefinite-lived intangibles for impairment by either comparing the carrying value of the intangible to the projected discounted cash flows from the intangible or using the relief from royalties method. If theour reporting units substantially exceeded their carrying value exceeds the projected discounted cash flows attributed to the intangible asset, the carrying value is no longer considered recoverable and we will record an impairment.
40 / Schnitzer Steel Industries, Inc. Form 10-K 2010
values.
We operate in industries that inherently possess environmental risks. To manage these risks, we employ both our own environmental staff and outside consultants. Environmental staff and finance personnel meet regularly to
stay updated ondiscuss environmental risks. We estimate future costs for known environmental remediation requirements and accrue for them on an undiscounted basis when it is probable that we have incurred a liability and the related costs can be reasonably estimated but the timing of incurring the estimated costs is unknown. The regulatory and government management of these projects is complex, which is one of the primary factors that make it difficult to assess the cost of potential and future remediation. When only a wide range of estimated amounts can be reasonably established and no other amount within the range is better than
another,any other, the low end of the range is recorded in the financial statements. If further developments or resolution of an environmental matter result in facts and circumstances that are significantly different than the assumptions used to develop these reserves, the accrual for environmental remediation could be materially understated or overstated. Adjustments to these liabilities are made when additional information becomes available that affects the estimated costs to study or remediate any environmental issues or when expenditures for which reserves are established are made. The factors we consider in the recognition and measurement of environmental liabilities include:
Current regulations, both at the time the reserve is established and during the course of the investigation or remediation process, which specify standards for acceptable remediation;
Information about the site which becomes available as the site is studied and remediated;
The professional judgment of senior-level internal staff, who take into account similar, recent instances of environmental remediation issues, and studies of our sites, among other considerations;
Technologies available that can be used for remediation; and
The number and financial condition of other potentially responsible parties and the extent of their responsibility for the costs of study and remediation.
The
Our accrued environmental liabilities as of August 31, 20102011 included $1 million related to third party investigation costs for the Portland Harbor Superfund site. Although future costs for the Portland Harbor Superfund site could be material to our financial
35 / Schnitzer Steel Industries, Inc. Form 10-K 2011
position, results of operations, liquidity or cash flows, it is not possible to estimate additional costs which we might incur in connection with the ongoing investigations and remediation because there has not been a determination of the total investigation costs, the remediation that will be required, the amount of natural resource damages or how the costs of the ongoing investigations and any remedy and natural resource damages will be allocated among the PRPs. As such, it is not presently possible to estimate the costs which we are likely to incur in connection with the site and thereforeTherefore, no additional amounts have been accrued. See Contingencies – Environmental in Note 1211 – Commitments and Contingencies in the notesNotes to the consolidated financial statementsConsolidated Financial Statements in Part II, Item 8 of this report.
Business Combinations
On September 1, 2009,
In a business combination, we
adopted the revised accounting standard for business combinations, which requires us to recognize the assets acquired, the liabilities assumed, and any noncontrolling interests in the acquiree at the acquisition date, measured at their fair values as of that date, generally using a market-based income approach. Measuring assets and liabilities at fair value requires us to determine the price that would be paid by a third party market participant based on the highest and best use of the assets or interests acquired. We utilize management estimates that incorporate input from an independent third party valuation firm in our determination of these fair values. Such estimates and valuations require us to make significant assumptions, including projections of future events and operating performance and determining the highest and best use of the assets or interests acquired.
In addition, following the adoption of this standard, acquisitionAcquisition costs are expensed as incurred.
We recognize revenue when we have a contract or purchase order from a customer with a fixed price, the title and risk of loss transfer to the buyer and collectibility is reasonably assured. Title for both metal and finished steel products
Schnitzer Steel Industries, Inc. Form 10-K 2010 / 41
transfers based on contract terms. A significant portion of our ferrous export sales of recycled metal are made with letters of credit, reducing credit risk. However, domestic recycled ferrous metal sales, nonferrous sales and sales of finished steel are generally made on open account. Nonferrous export sales typically require a deposit prior to shipment. All sales made on open account are evaluated for collectibility prior to revenue recognition. Additionally, we recognize revenues on partially loaded shipments when detailed documents support revenue recognition based on transfer of title and risk of loss.loss we recognize revenues on partially loaded shipments, which requires an estimate of the product weight involved in any partial shipments at period end. For APB, retail revenues are recognized when customers pay for parts and wholesale product revenues are recognized when customer weight certificates are received following shipment. Historically, there have been very few sales returns and adjustments that impact the ultimate collection of revenues; therefore, no material provisions have been made when the sale is recognized. We present taxes assessed by governmental authorities collected from customers on a net basis. Therefore, the taxes are excluded from revenue and are shown as a liability on our consolidated balance sheetsheets until remitted. See the discussion on credit risk contained in Item 7a7A of this report.
Redeemable Noncontrolling Interest
We have issued redeemable common stock to the noncontrolling interest holder of one of our subsidiaries that is redeemable both at the option of the holder and upon the occurrence of an event that is not solely within our control. If the interest were to be redeemed, we would be required to purchase all of such interest at fair value on the date of redemption. We estimate fair value using Level 3 inputs under the fair value hierarchy based on standard valuation techniques using a discounted cash flow analysis. Any adjustments to the carrying amount of the redeemable noncontrolling interest prior to exercise of the redemption option will be recorded to equity. Since redemption of the noncontrolling interest is outside of our control, these interests are presented on the consolidated balance sheets in the mezzanine section under the caption “Redeemable noncontrolling interests.”
The determination of fair value requires management to apply significant judgment in formulating estimates and assumptions. These estimates and assumptions primarily include forecasts of future cash flows based on management’s best estimate of future sales and operating costs; pricing expectations; capital expenditures; working capital requirements; discount rates; growth rates; tax rates and general market conditions. As a result of the inherent uncertainty associated with forming these estimates, actual results could differ from those estimates.
Recently Issued Accounting Standards
For a description of recent accounting pronouncements that may have an impact on our financial condition, results of operations or cash flows, see Note 3 – Recent Accounting Pronouncements in the notesNotes to the consolidated financial statementsConsolidated Financial Statements in Part II, Item 8 of this report. Non-GAAP Financial Measures
Debt, net of cash is the difference between (i) the sum of long-term debt and short-term debt (i.e., total debt) and (ii) cash and cash equivalents. Management believes that debt, net of cash is a useful measure for
investors. In management’s view,investors because,
as cash and cash equivalents can be used, among other things, to repay indebtedness, netting this against total debt is a useful measure of our leverage.
36 / Schnitzer Steel Industries, Inc. Form 10-K 2011
The following is a reconciliation of debt, net of cash (in thousands):
|
| | | | | | | | | | | |
| | August 31, 2011 | | August 31, 2010 | | August 31, 2009 |
| Short-term borrowings and capital lease obligations, current | $ | 643 |
| | $ | 1,189 |
| | $ | 1,317 |
|
| Long-term debt and capital lease obligations, net of current maturities | 403,287 |
| | 99,240 |
| | 110,414 |
|
| Total debt | 403,930 |
| | 100,429 |
| | 111,731 |
|
| Less: cash and cash equivalents | 49,462 |
| | 30,342 |
| | 41,026 |
|
| Total debt, net of cash | $ | 354,468 |
| | $ | 70,087 |
| | $ | 70,705 |
|
Net borrowings (repayment) of debt
Net borrowings (repayment) of debt is the sum of borrowings from long-term debt, repayments of long-term debt, proceeds from line of credit, and repayment of line of credit. Management presents this amount as the net change in the Company’s borrowings for the period because it believes it is useful for investors as a meaningful presentation of the change in debt.
|
| | | | | | | | | | | |
| ($ in thousands) | Fiscal 2011 | | Fiscal 2010 | | Fiscal 2009 |
| Borrowings from long-term debt | $ | 811,531 |
| | $ | 577,900 |
| | $ | 440,500 |
|
| Proceeds from line of credit | 655,500 |
| | 402,600 |
| | 331,700 |
|
| Repayment of long-term debt | (508,675 | ) | | (589,242 | ) | | (491,329 | ) |
| Repayment of line of credit | (655,500 | ) | | (402,600 | ) | | (356,700 | ) |
| Net borrowings (repayment) of debt | $ | 302,856 |
| | $ | (11,342 | ) | | $ | (75,829 | ) |
Management believes that
thisthese non-GAAP financial
measure allowsmeasures allow for a better understanding of our operating and financial performance.
ThisThese non-GAAP financial
measuremeasures should be considered in addition to, but not as a substitute for, the most directly comparable
USU.S. GAAP
measure. The following is a reconciliation of debt, net of cash (in thousands): | | | | | | | | | | | | |
| | | August 31,
2010 | | | August 31,
2009 | | | August 31,
2008 | |
Short-term borrowings and capital lease obligations, current | | $ | 1,189 | | | $ | 1,317 | | | $ | 25,490 | |
Long-term debt and capital lease obligations, net of current maturities | | | 99,240 | | | | 110,414 | | | | 158,933 | |
| | | | | | | | | | | | |
Total debt | | | 100,429 | | | | 111,731 | | | | 184,423 | |
Less: cash and cash equivalents | | | 30,342 | | | | 41,026 | | | | 15,039 | |
| | | | | | | | | | | | |
Total debt, net of cash | | $ | 70,087 | | | $ | 70,705 | | | $ | 169,384 | |
| | | | | | | | | | | | |
measures.
4237 / Schnitzer Steel Industries, Inc. Form 10-K 20102011
ITEM 7A. QUANTITATIVE AND QUALITATIVE DISCLOSURES ABOUT MARKET RISK
We are exposed to commodity price risk, mainly associated with variations in the market price for finished steel products, ferrous and nonferrous metals, including scrap metal, autobodies and other commodities. The timing and magnitude of industry cycles are difficult to predict and are impacted by general economic conditions. We respond to increases and decreases in forward selling prices by adjusting purchase prices on a timely basis. We actively manage our exposure to commodity price risk and monitor the actual and expected spread between forward selling prices and purchase costs and processing and shipping expense. Sales contracts are based on prices negotiated with our customers, and generally orders are placed 30 to 9060 days ahead of shipment date. However, financial results may be negatively impacted when forward selling prices fall more quickly than we can adjust purchase prices or when customers fail to meet their contractual obligations. We assess the net realizable value of inventory (“NRV”) each quarter based upon contracted sales orders and estimated future selling prices. Based on contracted sales and estimates of future selling prices at August 31, 2011 and 2010, a 10% decrease in the selling price per ton of finished steel products would causehave caused an NRV inventory write down of approximately $3$3 million at SMB. We are exposed to market risk associated with changes in interest rates related to our debt obligations. Our credit line and revolving credit facility are subject to variable in rateinterest rates and therefore have exposure to changes in interest rates. If market interest rates had changed 10% from actual interest rate levels in fiscal 20102011 or 2009,2010, the effect on our interest expense and net income would not have been material. Credit risk relates to the risk of loss that might occur as a result of non-performance by counterparties of their contractual obligations to take delivery of scrap metal and finished steel products and to make financial settlements of these obligations. We manage our exposure to credit risk through a variety of methods, including shipping ferrous scrap metal exports under letters of credit, collection of deposits prior to shipment for certain nonferrous export customers and establishment of credit limits for sales on open terms.
MRB generally ships ferrous bulk sales to foreign customers under contracts supported by letters of credit issued or confirmed by banks it deems
credit worthy.creditworthy. The letters of credit ensure payment by the customer. As MRB generally sells its export recycled ferrous metal under contracts or orders that generally provide for shipment within 30 to
9060 days after the price is agreed, MRB’s customers typically do not have difficulty obtaining letters of credit from their banks in periods of rising ferrous prices, as the value of the letters of credit are collateralized by the value of the inventory on the ship. However, in periods of
significantly declining prices, MRB’s customers may not be able to obtain letters of credit for the full sales value of the inventory to be shipped. As such, we may need to extend credit on open terms for the difference between the sales value under the contract and the value supported by the letter of credit. In addition, we could be exposed to loss if a customer fails to pay or the bank providing the letter of credit fails.
As of August 31, 20102011 and 2009, 43%2010, 44% and 49%43%, respectively, of our trade accounts receivable balance was covered by letters of credit. Of the remaining balance as of August 31, 2010, 89%2011, 93% was less than 60 days past due, compared to 85%89% as of August 31, 2009.2010.
38 / Schnitzer Steel Industries, Inc. Form 10-K 2010 / 432011
ITEM 8. FINANCIAL STATEMENTS AND SUPPLEMENTARY DATA
Management’s Annual Report on Internal Control Over Financial Reporting
Management of the Company is responsible for establishing and maintaining adequate internal control over financial reporting, as such term is defined in Rules 13a-15(f) and 15d-15(f) under the Securities Exchange Act of 1934. The Company’s internal control over financial reporting is a process designed by, or under the supervision of, the Company’s principal executive and principal financial officers and effected by the Company’s Board of Directors, management and other personnel to provide reasonable assurance regarding the reliability of financial reporting and the preparation of financial statements for external purposes in accordance with generally accepted accounting principles.
The Company’s internal control over financial reporting includes policies and procedures that relate to the maintenance of records that, in reasonable detail, accurately and fairly reflect the transactions and dispositions of assets of the Company; provide reasonable assurance that all transactions are recorded as necessary to permit the preparation of the Company’s consolidated financial statements in accordance with generally accepted accounting principles and that the proper authorization of receipts and expenditures of the Company are being made in accordance with authorization of the Company’s management and directors; and provide reasonable assurance regarding prevention or timely detection of unauthorized acquisition, use or disposition of the Company’s assets that could have a material effect on the Company’s consolidated financial statements.
Because of its inherent limitations, internal control over financial reporting may not prevent or detect misstatements. Also, projection of any evaluation of effectiveness to future periods is subject to the risk that controls may become inadequate because of changes in conditions or that the degree of compliance with the policies and procedures may deteriorate.
Management of the Company assessed the effectiveness of the Company’s internal control over financial reporting using the criteria established inInternal Control – Integrated Framework issued by the Committee of Sponsoring Organizations of the Treadway Commission (COSO). Based on its assessment, management determined that the Company’s internal control over financial reporting was effective as of August 31, 2010.2011.
PricewaterhouseCoopers LLP, the independent registered public accounting firm that audited the Company’s consolidated financial statements included in this Annual Report, also audited the effectiveness of the Company’s internal control over financial reporting as of August 31, 2010,2011, as stated in their report included herein.
|
| | |
Tamara L. Lundgren | | Richard D. Peach |
President and Chief Executive Officer | | Sr.Senior Vice President and Chief Financial Officer |
October 20, 2010 2011 | | October 20, 20102011 |
4439 / Schnitzer Steel Industries, Inc. Form 10-K 20102011
Report of Independent Registered Public Accounting Firm
To the Board of Directors and Shareholders of Schnitzer Steel Industries, Inc.:
In our opinion, the consolidated financial statements listed in the accompanying index present fairly, in all material respects, the financial position of Schnitzer Steel Industries, Inc. and its subsidiaries as of August 31, 20102011 and 2009,2010, and the results of their operations and their cash flows for each of the three years in the period ended August 31, 20102011 in conformity with accounting principles generally accepted in the United States of America. In addition, in our opinion, the financial statement schedule listed in the accompanying index presents fairly, in all material respects, the information set forth therein when read in conjunction with the related consolidated financial statements. Also in our opinion, the Company maintained, in all material respects, effective internal control over financial reporting as of August 31, 2010,2011, based on criteria established inInternal Control – Integrated Framework issued by the Committee of Sponsoring Organizations of the Treadway Commission (COSO). The Company’s management is responsible for these financial statements and financial statement schedule, for maintaining effective internal control over financial reporting and for its assessment of the effectiveness of internal control over financial reporting, included in the accompanying Management’s Annual Report on Internal Control Over Financial Reporting. Our responsibility is to express opinions on these financial statements, on the financial statement schedule, and on the Company’s internal control over financial reporting based on our integrated audits. We conducted our audits in accordance with the standards of the Public Company Accounting Oversight Board (United States). Those standards require that we plan and perform the audits to obtain reasonable assurance about whether the financial statements are free of material misstatement and whether effective internal control over financial reporting was maintained in all material respects. Our audits of the financial statements included examining, on a test basis, evidence supporting the amounts and disclosures in the financial statements, assessing the accounting principles used and significant estimates made by management, and evaluating the overall financial statement presentation. Our audit of internal control over financial reporting included obtaining an understanding of internal control over financial reporting, assessing the risk that a material weakness exists, and testing and evaluating the design and operating effectiveness of internal control based on the assessed risk. Our audits also included performing such other procedures as we considered necessary in the circumstances. We believe that our audits provide a reasonable basis for our opinions.As discussed in Note 7 to the consolidated financial statements, the Company changed the manner in which it accounts for business combinations as of September 1, 2009. As discussed in Note 3 to the consolidated financial statements, the Company changed the manner in which it accounts for noncontrolling interests as of September 1, 2009.
A company’s internal control over financial reporting is a process designed to provide reasonable assurance regarding the reliability of financial reporting and the preparation of financial statements for external purposes in accordance with generally accepted accounting principles. A company’s internal control over financial reporting includes those policies and procedures that (i) pertain to the maintenance of records that, in reasonable detail, accurately and fairly reflect the transactions and dispositions of the assets of the company; (ii) provide reasonable assurance that transactions are recorded as necessary to permit preparation of financial statements in accordance with generally accepted accounting principles, and that receipts and expenditures of the company are being made only in accordance with authorizations of management and directors of the company; and (iii) provide reasonable assurance regarding prevention or timely detection of unauthorized acquisition, use, or disposition of the company’s assets that could have a material effect on the financial statements.
Because of its inherent limitations, internal control over financial reporting may not prevent or detect misstatements. Also, projections of any evaluation of effectiveness as to future periods are subject to the risk that controls may become inadequate because of changes in conditions, or that the degree of compliance with the policies or procedures may deteriorate.
PricewaterhouseCoopers LLP
40 / Schnitzer Steel Industries, Inc. Form 10-K 2010 / 452011
SCHNITZER STEEL INDUSTRIES, INC.
CONSOLIDATED BALANCE SHEETS
(in thousands)
| | | | | | | | |
| | | August 31, | |
| | | 2010 | | | 2009 | |
| Assets | | | | | | | | |
Current assets: | | | | | | | | |
Cash and cash equivalents | | $ | 30,342 | | | $ | 41,026 | |
Accounts receivable, net | | | 126,156 | | | | 117,666 | |
Inventories, net | | | 268,103 | | | | 184,455 | |
Deferred income taxes | | | 9,037 | | | | 10,027 | |
Refundable income taxes | | | 14,610 | | | | 46,972 | |
Prepaid expenses and other current assets | | | 12,546 | | | | 10,868 | |
| | | | | | | | |
Total current assets | | | 460,794 | | | | 411,014 | |
Property, plant and equipment, net | | | 460,810 | | | | 447,228 | |
Other assets: | | | | | | | | |
Investments in joint venture partnerships | | | 13,706 | | | | 10,812 | |
Goodwill | | | 380,332 | | | | 366,559 | |
Intangibles, net | | | 20,444 | | | | 20,422 | |
Other assets | | | 7,332 | | | | 12,198 | |
| | | | | | | | |
Total assets | | $ | 1,343,418 | | | $ | 1,268,233 | |
| | | | | | | | |
| Liabilities and Equity | | | | | | | | |
Current liabilities: | | | | | | | | |
Long-term debt and capital lease obligations | | $ | 1,189 | | | $ | 1,317 | |
Accounts payable | | | 91,879 | | | | 72,289 | |
Accrued payroll and related liabilities | | | 34,162 | | | | 23,636 | |
Environmental liabilities | | | 2,588 | | | | 3,148 | |
Accrued income taxes | | | 1,816 | | | | 776 | |
Other accrued liabilities | | | 28,479 | | | | 38,963 | |
| | | | | | | | |
Total current liabilities | | | 160,113 | | | | 140,129 | |
Deferred income taxes | | | 58,630 | | | | 44,523 | |
Long-term debt and capital lease obligations, net of current maturities | | | 99,240 | | | | 110,414 | |
Environmental liabilities, net of current portion | | | 37,286 | | | | 38,760 | |
Other long-term liabilities | | | 8,517 | | | | 11,657 | |
| | | | | | | | |
Total liabilities | | | 363,786 | | | | 345,483 | |
| | | | | | | | |
Commitments and contingencies (Note 12) | | | | | | | | |
| | |
Schnitzer Steel Industries, Inc. (“SSI”) shareholders’ equity: | | | | | | | | |
Preferred stock – 20,000 shares $1.00 par value authorized, none issued | | | 0 | | | | 0 | |
Class A common stock – 75,000 shares $1.00 par value authorized, | | | | | | | | |
22,700 and 21,402 shares issued and outstanding | | | 22,700 | | | | 21,402 | |
Class B common stock – 25,000 shares $1.00 par value authorized, | | | | | | | | |
4,721 and 6,268 shares issued and outstanding | | | 4,721 | | | | 6,268 | |
Additional paid-in capital | | | 1,815 | | | | 0 | |
Retained earnings | | | 948,642 | | | | 894,243 | |
Accumulated other comprehensive loss | | | (2,552 | ) | | | (2,546 | ) |
| | | | | | | | |
Total SSI shareholders’ equity | | | 975,326 | | | | 919,367 | |
Noncontrolling interests | | | 4,306 | | | | 3,383 | |
| | | | | | | | |
Total equity | | | 979,632 | | | | 922,750 | |
| | | | | | | | |
Total liabilities and equity | | $ | 1,343,418 | | | $ | 1,268,233 | |
| | | | | | | | |
|
| | | | | | | |
| | August 31, |
| | 2011 | | 2010 |
| Assets | | | |
| Current assets: | | | |
| Cash and cash equivalents | $ | 49,462 |
| | $ | 30,342 |
|
| Accounts receivable, net | 229,975 |
| | 126,156 |
|
| Inventories, net | 335,120 |
| | 268,103 |
|
| Deferred income taxes | 11,784 |
| | 9,037 |
|
| Refundable income taxes | 3,541 |
| | 14,610 |
|
| Prepaid expenses and other current assets | 24,117 |
| | 12,546 |
|
| Total current assets | 653,999 |
| | 460,794 |
|
| Property, plant and equipment, net | 555,284 |
| | 460,810 |
|
| Investments in joint venture partnerships | 17,208 |
| | 13,706 |
|
| Goodwill | 627,805 |
| | 380,332 |
|
| Intangibles, net | 20,906 |
| | 20,444 |
|
| Other assets | 14,967 |
| | 7,332 |
|
| Total assets | $ | 1,890,169 |
| | $ | 1,343,418 |
|
| Liabilities and Equity | | | |
| Current liabilities: | | | |
| Short-term borrowings and capital lease obligations, current | $ | 643 |
| | $ | 1,189 |
|
| Accounts payable | 141,011 |
| | 91,879 |
|
| Accrued payroll and related liabilities | 36,475 |
| | 34,162 |
|
| Environmental liabilities | 2,983 |
| | 2,588 |
|
| Accrued income taxes | 13,833 |
| | 1,816 |
|
| Other accrued liabilities | 38,368 |
| | 28,479 |
|
| Total current liabilities | 233,313 |
| | 160,113 |
|
| Deferred income taxes | 85,378 |
| | 58,630 |
|
| Long-term debt and capital lease obligations, net of current maturities | 403,287 |
| | 99,240 |
|
| Environmental liabilities, net of current portion | 37,872 |
| | 37,286 |
|
| Other long-term liabilities | 10,030 |
| | 8,517 |
|
| Total liabilities | 769,880 |
| | 363,786 |
|
| Commitments and contingencies (Note 11) |
| |
|
| Redeemable noncontrolling interest | 19,053 |
| | — |
|
| Schnitzer Steel Industries, Inc. (“SSI”) shareholders’ equity: | | | |
| Preferred stock – 20,000 shares $1.00 par value authorized, none issued | — |
| | — |
|
| Class A common stock – 75,000 shares $1.00 par value authorized, | | | |
| 24,241 and 22,700 shares issued and outstanding | 24,241 |
| | 22,700 |
|
| Class B common stock – 25,000 shares $1.00 par value authorized, | | | |
| 3,060 and 4,721 shares issued and outstanding | 3,060 |
| | 4,721 |
|
| Additional paid-in capital | 762 |
| | 1,815 |
|
| Retained earnings | 1,065,109 |
| | 948,642 |
|
| Accumulated other comprehensive income (loss) | 1,540 |
| | (2,552 | ) |
| Total SSI shareholders’ equity | 1,094,712 |
| | 975,326 |
|
| Noncontrolling interests | 6,524 |
| | 4,306 |
|
| Total equity | 1,101,236 |
| | 979,632 |
|
| Total liabilities and equity | $ | 1,890,169 |
| | $ | 1,343,418 |
|
See Notes to the Consolidated Financial Statements
4641 / Schnitzer Steel Industries, Inc. Form 10-K 20102011
SCHNITZER STEEL INDUSTRIES, INC.
CONSOLIDATED STATEMENTS OF OPERATIONS
(in thousands, except per share amounts)
| | | | | | | | | | | | |
| | | Year Ended August 31, | |
| | | 2010 | | | 2009 | | | 2008 | |
Revenues | | $ | 2,301,240 | | | $ | 1,787,230 | | | $ | 3,516,950 | |
Operating expense: | | | | | | | | | | | | |
Cost of goods sold | | | 2,019,764 | | | | 1,681,942 | | | | 2,911,334 | |
Selling, general and administrative | | | 158,805 | | | | 163,410 | | | | 214,533 | |
Environmental matters | | | (91 | ) | | | (5,809 | ) | | | (446 | ) |
Income from joint ventures | | | (3,135 | ) | | | (1,189 | ) | | | (11,706 | ) |
| | | | | | | | | | | | |
Operating income (loss) | | | 125,897 | | | | (51,124 | ) | | | 403,235 | |
Other income (expense): | | | | | | | | | | | | |
Interest income | | | 459 | | | | 1,179 | | | | 748 | |
Interest expense | | | (2,343 | ) | | | (3,342 | ) | | | (8,649 | ) |
Other income, net | | | 1,320 | | | | 6,223 | | | | 1,887 | |
| | | | | | | | | | | | |
Total other income (expense) | | | (564 | ) | | | 4,060 | | | | (6,014 | ) |
| | | | | | | | | | | | |
Income (loss) from continuing operations before income taxes | | | 125,333 | | | | (47,064 | ) | | | 397,221 | |
Income tax (expense) benefit | | | (40,825 | ) | | | 19,915 | | | | (142,568 | ) |
| | | | | | | | | | | | |
Income (loss) from continuing operations | | | 84,508 | | | | (27,149 | ) | | | 254,653 | |
Loss from discontinued operations, net of tax | | | (13,832 | ) | | | (4,214 | ) | | | (613 | ) |
| | | | | | | | | | | | |
Net income (loss) | | | 70,676 | | | | (31,363 | ) | | | 254,040 | |
Net income attributable to noncontrolling interests | | | (3,926 | ) | | | (866 | ) | | | (5,357 | ) |
| | | | | | | | | | | | |
Net income (loss) attributable to SSI | | $ | 66,750 | | | $ | (32,229 | ) | | $ | 248,683 | |
| | | | | | | | | | | | |
Basic: | | | | | | | | | | | | |
Income (loss) per share from continuing operations attributable to SSI | | $ | 2.90 | | | $ | (0.99 | ) | | $ | 8.81 | |
Loss per share from discontinued operations attributable to SSI | | | (0.50 | ) | | | (0.15 | ) | | | (0.02 | ) |
| | | | | | | | | | | | |
Net income (loss) per share attributable to SSI | | $ | 2.40 | | | $ | (1.14 | ) | | $ | 8.79 | |
| | | | | | | | | | | | |
Diluted: | | | | | | | | | | | | |
Income (loss) per share from continuing operations attributable to SSI | | $ | 2.86 | | | $ | (0.99 | ) | | $ | 8.63 | |
Loss per share from discontinued operations attributable to SSI | | | (0.49 | ) | | | (0.15 | ) | | | (0.02 | ) |
| | | | | | | | | | | | |
Net income (loss) per share attributable to SSI | | $ | 2.37 | | | $ | (1.14 | ) | | $ | 8.61 | |
| | | | | | | | | | | | |
Weighted average number of common shares: | | | | | | | | | | | | |
Basic | | | 27,832 | | | | 28,159 | | | | 28,278 | |
Diluted | | | 28,147 | | | | 28,159 | | | | 28,894 | |
| | | |
Dividends declared per common share | | $ | 0.068 | | | $ | 0.068 | | | $ | 0.068 | |
|
| | | | | | | | | | | |
| | Year Ended August 31, |
| | 2011 | | 2010 | | 2009 |
| Revenues | $ | 3,459,194 |
| | $ | 2,301,240 |
| | $ | 1,787,230 |
|
| Operating expense: | | | | | |
| Cost of goods sold | 3,072,165 |
| | 2,019,764 |
| | 1,681,942 |
|
| Selling, general and administrative | 205,025 |
| | 158,805 |
| | 163,410 |
|
| Environmental matters | 662 |
| | (91 | ) | | (5,809 | ) |
| Income from joint ventures | (4,622 | ) | | (3,135 | ) | | (1,189 | ) |
| Operating income (loss) | 185,964 |
| | 125,897 |
| | (51,124 | ) |
| Other income (expense): | | | | | |
| Interest income | 384 |
| | 459 |
| | 1,179 |
|
| Interest expense | (8,436 | ) | | (2,343 | ) | | (3,342 | ) |
| Other income, net | 2,893 |
| | 1,320 |
| | 6,223 |
|
| Total other income (expense) | (5,159 | ) | | (564 | ) | | 4,060 |
|
| Income (loss) from continuing operations before income taxes | 180,805 |
| | 125,333 |
| | (47,064 | ) |
| Income tax (expense) benefit | (57,168 | ) | | (40,825 | ) | | 19,915 |
|
| Income (loss) from continuing operations | 123,637 |
| | 84,508 |
| | (27,149 | ) |
| Loss from discontinued operations, net of tax | (101 | ) | | (13,832 | ) | | (4,214 | ) |
| Net income (loss) | 123,536 |
| | 70,676 |
| | (31,363 | ) |
| Net income attributable to noncontrolling interests | (5,181 | ) | | (3,926 | ) | | (866 | ) |
| Net income (loss) attributable to SSI | $ | 118,355 |
| | $ | 66,750 |
| | $ | (32,229 | ) |
| Basic: | | | | | |
| Income (loss) per share from continuing operations attributable to SSI | $ | 4.28 |
| | $ | 2.90 |
| | $ | (0.99 | ) |
| Loss per share from discontinued operations | — |
| | (0.50 | ) | | (0.15 | ) |
| Net income (loss) per share attributable to SSI | $ | 4.28 |
| | $ | 2.40 |
| | $ | (1.14 | ) |
| Diluted: | | | | | |
| Income (loss) per share from continuing operations attributable to SSI | $ | 4.24 |
| | $ | 2.86 |
| | $ | (0.99 | ) |
| Loss per share from discontinued operations | (0.01 | ) | | (0.49 | ) | | (0.15 | ) |
| Net income (loss) per share attributable to SSI | $ | 4.23 |
| | $ | 2.37 |
| | $ | (1.14 | ) |
| Weighted average number of common shares: | | | | | |
| Basic | 27,649 |
| | 27,832 |
| | 28,159 |
|
| Diluted | 27,959 |
| | 28,147 |
| | 28,159 |
|
| Dividends declared per common share | $ | 0.068 |
| | $ | 0.068 |
| | $ | 0.068 |
|
See Notes to the Consolidated Financial Statements
42 / Schnitzer Steel Industries, Inc. Form 10-K 2010 / 472011
SCHNITZER STEEL INDUSTRIES, INC.
CONSOLIDATED STATEMENTS OF EQUITY
(in thousands)
|
| | | | | | | | | | | | | | | | | | | | | | | | | | | | | | | | | | | | | |
| | Common Stock | | Additional Paid-in Capital | | Retained Earnings | | Accumulated Other Comprehensive Income (loss) | | Total SSI Shareholders’ Equity | | Noncontrolling Interests | | Total Equity |
| Class A | | Class B | |
| Shares | | Amount | | Shares | | Amount | |
| Balance as of August 31, 2008 | 21,592 |
| | $ | 21,592 |
| | 6,345 |
| | $ | 6,345 |
| | $ | 11,425 |
| | $ | 939,181 |
| | $ | (391 | ) | | $ | 978,152 |
| | $ | 4,399 |
| | $ | 982,551 |
|
| Net income (loss) | — |
| | — |
| | — |
| | — |
| | — |
| | (32,229 | ) | | — |
| | (32,229 | ) | | 866 |
| | (31,363 | ) |
| Foreign currency translation adjustment (net of tax benefit of $268) | — |
| | — |
| | — |
| | — |
| | — |
| | — |
| | (358 | ) | | (358 | ) | | — |
| | (358 | ) |
| Pension obligations, net (net of tax benefit of $796) | — |
| | — |
| | — |
| | — |
| | — |
| | — |
| | (1,260 | ) | | (1,260 | ) | | — |
| | (1,260 | ) |
| Change in net unrealized loss on cash flow hedges (net of tax benefit of $313) | — |
| | — |
| | — |
| | — |
| | — |
| | — |
| | (537 | ) | | (537 | ) | | — |
| | (537 | ) |
| Comprehensive income (loss) | | | | | | | | | | | | | | | (34,384 | ) | | 866 |
| | (33,518 | ) |
| Distributions to noncontrolling interests | — |
| | — |
| | — |
| | — |
| | — |
| | — |
| | — |
| | — |
| | (1,286 | ) | | (1,286 | ) |
| Noncontrolling interest buyout | — |
| | — |
| | — |
| | — |
| | — |
| | — |
| | — |
| | — |
| | (596 | ) | | (596 | ) |
| Share repurchases | (600 | ) | | (600 | ) | | — |
| | — |
| | (18,495 | ) | | (10,801 | ) | | — |
| | (29,896 | ) | | — |
| | (29,896 | ) |
| Class A common stock issued | 106 |
| | 106 |
| | — |
| | — |
| | (106 | ) | | — |
| | — |
| | — |
| | — |
| | — |
|
| Restricted stock withheld for taxes | (132 | ) | | (132 | ) | | — |
| | — |
| | (3,863 | ) | | — |
| | — |
| | (3,995 | ) | | — |
| | (3,995 | ) |
| Issuance of restricted stock | 239 |
| | 239 |
| | — |
| | — |
| | (239 | ) | | — |
| | — |
| | — |
| | — |
| | — |
|
| Stock options exercised | 120 |
| | 120 |
| | — |
| | — |
| | 1,561 |
| | — |
| | — |
| | 1,681 |
| | — |
| | 1,681 |
|
| Class B common stock converted to Class A common stock | 77 |
| | 77 |
| | (77 | ) | | (77 | ) | | — |
| | — |
| | — |
| | — |
| | — |
| | — |
|
| Share-based compensation expense | — |
| | — |
| | — |
| | — |
| | 8,898 |
| | — |
| | — |
| | 8,898 |
| | — |
| | 8,898 |
|
| Excess tax benefits from share-based payment arrangements | — |
| | — |
| | — |
| | — |
| | 819 |
| | — |
| | — |
| | 819 |
| | — |
| | 819 |
|
| Cash dividends ($0.068 per share) | — |
| | — |
| | — |
| | — |
| | — |
| | (1,908 | ) | | — |
| | (1,908 | ) | | — |
| | (1,908 | ) |
| Balance as of August 31, 2009 | 21,402 |
| | 21,402 |
| | 6,268 |
| | 6,268 |
| | — |
| | 894,243 |
| | (2,546 | ) | | 919,367 |
| | 3,383 |
| | 922,750 |
|
| Net income | — |
| | — |
| | — |
| | — |
| | — |
| | 66,750 |
| | — |
| | 66,750 |
| | 3,926 |
| | 70,676 |
|
| Foreign currency translation adjustment (net of tax of $210) | — |
| | — |
| | — |
| | — |
| | — |
| | — |
| | 523 |
| | 523 |
| | — |
| | 523 |
|
| Pension obligations, net (net of tax benefit of $550) | — |
| | — |
| | — |
| | — |
| | — |
| | — |
| | (949 | ) | | (949 | ) | | — |
| | (949 | ) |
| Change in net unrealized gain on cash flow hedges (net of tax of $247) | — |
| | — |
| | — |
| | — |
| | — |
| | — |
| | 420 |
| | 420 |
| | — |
| | 420 |
|
| Comprehensive income | | | | | | | | | | | | | | | 66,744 |
| | 3,926 |
| | 70,670 |
|
| Distributions to noncontrolling interests | — |
| | — |
| | — |
| | — |
| | — |
| | — |
| | — |
| | — |
| | (3,003 | ) | | (3,003 | ) |
| Share repurchases | (413 | ) | | (413 | ) | | — |
| | — |
| | (6,266 | ) | | (10,468 | ) | | — |
| | (17,147 | ) | | — |
| | (17,147 | ) |
| Class A common stock issued | 13 |
| | 13 |
| | — |
| | — |
| | (13 | ) | | — |
| | — |
| | — |
| | — |
| | — |
|
| Restricted stock withheld for taxes | (81 | ) | | (81 | ) | | — |
| | — |
| | (3,518 | ) | | — |
| | — |
| | (3,599 | ) | | — |
| | (3,599 | ) |
| Issuance of restricted stock | 196 |
| | 196 |
| | — |
| | — |
| | (196 | ) | | — |
| | — |
| | — |
| | — |
| | — |
|
| Stock options exercised | 36 |
| | 36 |
| | — |
| | — |
| | 901 |
| | — |
| | — |
| | 937 |
| | — |
| | 937 |
|
| Class B common stock converted to Class A common stock | 1,547 |
| | 1,547 |
| | (1,547 | ) | | (1,547 | ) | | — |
| | — |
| | — |
| | — |
| | — |
| | — |
|
| Share-based compensation expense | — |
| | — |
| | — |
| | — |
| | 11,035 |
| | — |
| | — |
| | 11,035 |
| | — |
| | 11,035 |
|
| Excess tax deficiency from stock options exercised and restricted stock units vested | — |
| | — |
| | — |
| | — |
| | (128 | ) | | — |
| | — |
| | (128 | ) | | — |
| | (128 | ) |
| Cash dividends ($0.068 per share) | — |
| | — |
| | — |
| | — |
| | — |
| | (1,883 | ) | | — |
| | (1,883 | ) | | — |
| | (1,883 | ) |
43 | | | | | | | | | | | | | | | | | | | | | | | | | | | | | | | | | | | | | | | | |
| | | Common Stock | | | Additional Paid-in Capital | | | Retained Earnings | | | Accumulated Other Comprehensive Income (loss) | | | Total SSI Shareholders’ Equity | | | Noncontrolling Interests | | | Total Equity | |
| | Class A | | | Class B | | | | | | | |
| | Shares | | | Amount | | | Shares | | | Amount | | | | | | | |
Balance as of August 31, 2007 | | | 21,231 | | | $ | 21,231 | | | | 7,328 | | | $ | 7,328 | | | $ | 41,344 | | | $ | 693,470 | | | $ | 1,691 | | | $ | 765,064 | | | $ | 5,373 | | | $ | 770,437 | |
Net income | | | 0 | | | | 0 | | | | 0 | | | | 0 | | | | 0 | | | | 248,683 | | | | 0 | | | | 248,683 | | | | 5,357 | | | | 254,040 | |
Foreign currency translation adjustment (net of tax benefit of $194) | | | 0 | | | | 0 | | | | 0 | | | | 0 | | | | 0 | | | | 0 | | | | (251 | ) | | | (251 | ) | | | 0 | | | | (251 | ) |
Pension obligations, net (net of tax benefit of $939) | | | 0 | | | | 0 | | | | 0 | | | | 0 | | | | 0 | | | | 0 | | | | (1,831 | ) | | | (1,831 | ) | | | 0 | | | | (1,831 | ) |
| | | | | | | | | | | | | | | | | | | | | | | | | | | | | | | | | | | | | | | | |
Comprehensive income | | | | | | | | | | | | | | | | | | | | | | | | | | | | | | | 246,601 | | | | 5,357 | | | | 251,958 | |
Distributions to noncontrolling interests | | | 0 | | | | 0 | | | | 0 | | | | 0 | | | | 0 | | | | 0 | | | | 0 | | | | 0 | | | | (4,705 | ) | | | (4,705 | ) |
Noncontrolling interest buyout | | | 0 | | | | 0 | | | | 0 | | | | 0 | | | | 0 | | | | 0 | | | | 0 | | | | 0 | | | | (1,626 | ) | | | (1,626 | ) |
Cummulative effect related to adoption of tax standard | | | 0 | | | | 0 | | | | 0 | | | | 0 | | | | 0 | | | | (1,055 | ) | | | 0 | | | | (1,055 | ) | | | 0 | | | | (1,055 | ) |
Share repurchases | | | (694 | ) | | | (694 | ) | | | 0 | | | | 0 | | | | (44,165 | ) | | | 0 | | | | 0 | | | | (44,859 | ) | | | 0 | | | | (44,859 | ) |
Class A common stock issued | | | 8 | | | | 8 | | | | 0 | | | | 0 | | | | 527 | | | | 0 | | | | 0 | | | | 535 | | | | 0 | | | | 535 | |
Restricted stock withheld for taxes | | | (22 | ) | | | (22 | ) | | | 0 | | | | 0 | | | | (2,212 | ) | | | 0 | | | | 0 | | | | (2,234 | ) | | | 0 | | | | (2,234 | ) |
Issuance of restricted stock | | | 60 | | | | 60 | | | | 0 | | | | 0 | | | | (60 | ) | | | 0 | | | | 0 | | | | 0 | | | | 0 | | | | 0 | |
Stock options exercised and restricted stock units vested | | | 26 | | | | 26 | | | | 0 | | | | 0 | | | | 497 | | | | 0 | | | | 0 | | | | 523 | | | | 0 | | | | 523 | |
Class B common stock converted to Class A common stock | | | 983 | | | | 983 | | | | (983 | ) | | | (983 | ) | | | 0 | | | | 0 | | | | 0 | | | | 0 | | | | 0 | | | | 0 | |
Share-based compensation expense | | | 0 | | | | 0 | | | | 0 | | | | 0 | | | | 14,487 | | | | 0 | | | | 0 | | | | 14,487 | | | | 0 | | | | 14,487 | |
Excess tax benefits from share-based payment arrangements | | | 0 | | | | 0 | | | | 0 | | | | 0 | | | | 1,007 | | | | 0 | | | | 0 | | | | 1,007 | | | | 0 | | | | 1,007 | |
Cash dividends ($0.068 per share) | | | 0 | | | | 0 | | | | 0 | | | | 0 | | | | 0 | | | | (1,917 | ) | | | 0 | | | | (1,917 | ) | | | 0 | | | | (1,917 | ) |
| | | | | | | | | | | | | | | | | | | | | | | | | | | | | | | | | | | | | | | | |
Balance as of August 31, 2008 | | | 21,592 | | | | 21,592 | | | | 6,345 | | | | 6,345 | | | | 11,425 | | | | 939,181 | | | | (391 | ) | | | 978,152 | | | | 4,399 | | | | 982,551 | |
Net income (loss) | | | 0 | | | | 0 | | | | 0 | | | | 0 | | | | 0 | | | | (32,229 | ) | | | 0 | | | | (32,229 | ) | | | 866 | | | | (31,363 | ) |
Foreign currency translation adjustment (net of tax benefit of $268) | | | 0 | | | | 0 | | | | 0 | | | | 0 | | | | 0 | | | | 0 | | | | (358 | ) | | | (358 | ) | | | 0 | | | | (358 | ) |
Pension obligations, net (net of tax benefit of $796) | | | 0 | | | | 0 | | | | 0 | | | | 0 | | | | 0 | | | | 0 | | | | (1,260 | ) | | | (1,260 | ) | | | 0 | | | | (1,260 | ) |
Change in net unrealized loss on cash flow hedges (net of tax benefit of $313) | | | 0 | | | | 0 | | | | 0 | | | | 0 | | | | 0 | | | | 0 | | | | (537 | ) | | | (537 | ) | | | 0 | | | | (537 | ) |
| | | | | | | | | | | | | | | | | | | | | | | | | | | | | | | | | | | | | | | | |
Comprehensive income (loss) | | | | | | | | | | | | | | | | | | | | | | | | | | | | | | | (34,384 | ) | | | 866 | | | | (33,518 | ) |
Distributions to noncontrolling interests | | | 0 | | | | 0 | | | | 0 | | | | 0 | | | | 0 | | | | 0 | | | | 0 | | | | 0 | | | | (1,286 | ) | | | (1,286 | ) |
Noncontrolling interest buyout | | | 0 | | | | 0 | | | | 0 | | | | 0 | | | | 0 | | | | 0 | | | | 0 | | | | 0 | | | | (596 | ) | | | (596 | ) |
Share repurchases | | | (600 | ) | | | (600 | ) | | | 0 | | | | 0 | | | | (18,495 | ) | | | (10,801 | ) | | | 0 | | | | (29,896 | ) | | | 0 | | | | (29,896 | ) |
Class A common stock issued | | | 106 | | | | 106 | | | | 0 | | | | 0 | | | | (106 | ) | | | 0 | | | | 0 | | | | 0 | | | | 0 | | | | 0 | |
Restricted stock withheld for taxes | | | (132 | ) | | | (132 | ) | | | 0 | | | | 0 | | | | (3,863 | ) | | | 0 | | | | 0 | | | | (3,995 | ) | | | 0 | | | | (3,995 | ) |
Issuance of restricted stock | | | 239 | | | | 239 | | | | 0 | | | | 0 | | | | (239 | ) | | | 0 | | | | 0 | | | | 0 | | | | 0 | | | | 0 | |
Stock options exercised | | | 120 | | | | 120 | | | | 0 | | | | 0 | | | | 1,561 | | | | 0 | | | | 0 | | | | 1,681 | | | | 0 | | | | 1,681 | |
Class B common stock converted to Class A common stock | | | 77 | | | | 77 | | | | (77 | ) | | | (77 | ) | | | 0 | | | | 0 | | | | 0 | | | | 0 | | | | 0 | | | | 0 | |
Share-based compensation expense | | | 0 | | | | 0 | | | | 0 | | | | 0 | | | | 8,898 | | | | 0 | | | | 0 | | | | 8,898 | | | | 0 | | | | 8,898 | |
Excess tax benefits from share-based payment arrangements | | | 0 | | | | 0 | | | | 0 | | | | 0 | | | | 819 | | | | 0 | | | | 0 | | | | 819 | | | | 0 | | | | 819 | |
Cash dividends ($0.068 per share) | | | 0 | | | | 0 | | | | 0 | | | | 0 | | | | 0 | | | | (1,908 | ) | | | 0 | | | | (1,908 | ) | | | 0 | | | | (1,908 | ) |
| | | | | | | | | | | | | | | | | | | | | | | | | | | | | | | | | | | | | | | | |
Balance as of August 31, 2009 | | | 21,402 | | | | 21,402 | | | | 6,268 | | | | 6,268 | | | | 0 | | | | 894,243 | | | | (2,546 | ) | | | 919,367 | | | | 3,383 | | | | 922,750 | |
Net income | | | 0 | | | | 0 | | | | 0 | | | | 0 | | | | 0 | | | | 66,750 | | | | 0 | | | | 66,750 | | | | 3,926 | | | | 70,676 | |
Foreign currency translation adjustment (net of tax of $210) | | | 0 | | | | 0 | | | | 0 | | | | 0 | | | | 0 | | | | 0 | | | | 523 | | | | 523 | | | | 0 | | | | 523 | |
Pension obligations, net (net of tax benefit of $550) | | | 0 | | | | 0 | | | | 0 | | | | 0 | | | | 0 | | | | 0 | | | | (949 | ) | | | (949 | ) | | | 0 | | | | (949 | ) |
Change in net unrealized gain on cash flow hedges (net of tax of $247) | | | 0 | | | | 0 | | | | 0 | | | | 0 | | | | 0 | | | | 0 | | | | 420 | | | | 420 | | | | 0 | | | | 420 | |
| | | | | | | | | | | | | | | | | | | | | | | | | | | | | | | | | | | | | | | | |
Comprehensive income | | | | | | | | | | | | | | | | | | | | | | | | | | | | | | | 66,744 | | | | 3,926 | | | | 70,670 | |
Distributions to noncontrolling interests | | | 0 | | | | 0 | | | | 0 | | | | 0 | | | | 0 | | | | 0 | | | | 0 | | | | 0 | | | | (3,003 | ) | | | (3,003 | ) |
Share repurchases | | | (413 | ) | | | (413 | ) | | | 0 | | | | 0 | | | | (6,266 | ) | | | (10,468 | ) | | | 0 | | | | (17,147 | ) | | | 0 | | | | (17,147 | ) |
Class A common stock issued | | | 13 | | | | 13 | | | | 0 | | | | 0 | | | | (13 | ) | | | 0 | | | | 0 | | | | 0 | | | | 0 | | | | 0 | |
Restricted stock withheld for taxes | | | (81 | ) | | | (81 | ) | | | 0 | | | | 0 | | | | (3,518 | ) | | | 0 | | | | 0 | | | | (3,599 | ) | | | 0 | | | | (3,599 | ) |
Issuance of restricted stock | | | 196 | | | | 196 | | | | 0 | | | | 0 | | | | (196 | ) | | | 0 | | | | 0 | | | | 0 | | | | 0 | | | | 0 | |
Stock options exercised | | | 36 | | | | 36 | | | | 0 | | | | 0 | | | | 901 | | | | 0 | | | | 0 | | | | 937 | | | | 0 | | | | 937 | |
Class B common stock converted to Class A common stock | | | 1,547 | | | | 1,547 | | | | (1,547 | ) | | | (1,547 | ) | | | 0 | | | | 0 | | | | 0 | | | | 0 | | | | 0 | | | | 0 | |
Share-based compensation expense | | | 0 | | | | 0 | | | | 0 | | | | 0 | | | | 11,035 | | | | 0 | | | | 0 | | | | 11,035 | | | | 0 | | | | 11,035 | |
Excess tax deficiency from stock options exercised and restricted stock units vested | | | 0 | | | | 0 | | | | 0 | | | | 0 | | | | (128 | ) | | | 0 | | | | 0 | | | | (128 | ) | | | 0 | | | | (128 | ) |
Cash dividends ($0.068 per share) | | | 0 | | | | 0 | | | | 0 | | | | 0 | | | | 0 | | | | (1,883 | ) | | | 0 | | | | (1,883 | ) | | | 0 | | | | (1,883 | ) |
| | | | | | | | | | | | | | | | | | | | | | | | | | | | | | | | | | | | | | | | |
Balance as of August 31, 2010 | | | 22,700 | | | $ | 22,700 | | | | 4,721 | | | $ | 4,721 | | | $ | 1,815 | | | $ | 948,642 | | | $ | (2,552 | ) | | $ | 975,326 | | | $ | 4,306 | | | $ | 979,632 | |
| | | | | | | | | | | | | | | | | | | | | | | | | | | | | | | | | | | | | | | | |
/ Schnitzer Steel Industries, Inc. Form 10-K 2011
|
| | | | | | | | | | | | | | | | | | | | | | | | | | | | | | | | | | | | | |
| | Common Stock | | Additional Paid-in Capital | | Retained Earnings | | Accumulated Other Comprehensive Income (loss) | | Total SSI Shareholders’ Equity | | Noncontrolling Interests | | Total Equity |
| Class A | | Class B | |
| Shares | | Amount | | Shares | | Amount | |
| Balance as of August 31, 2010 | 22,700 |
| | 22,700 |
| | 4,721 |
| | 4,721 |
| | 1,815 |
| | 948,642 |
| | (2,552 | ) | | 975,326 |
| | 4,306 |
| | 979,632 |
|
Net income(1) | — |
| | — |
| | — |
| | — |
| | — |
| | 118,355 |
| | — |
| | 118,355 |
| | 5,081 |
| | 123,436 |
|
Foreign currency translation adjustment (net of tax of $876)(2) | — |
| | — |
| | — |
| | — |
| | — |
| | — |
| | 3,032 |
| | 3,032 |
| | — |
| | 3,032 |
|
| Pension obligations, net (net of tax of $564) | — |
| | — |
| | — |
| | — |
| | — |
| | — |
| | 969 |
| | 969 |
| | — |
| | 969 |
|
| Change in net unrealized gain on cash flow hedges (net of tax of $52) | — |
| | — |
| | — |
| | — |
| | — |
| | — |
| | 91 |
| | 91 |
| | — |
| | 91 |
|
| Comprehensive income | | | | | | | | | | | | | | | 122,447 |
| | 5,081 |
| | 127,528 |
|
| Distributions to noncontrolling interests | — |
| | — |
| | — |
| | — |
| | — |
| | — |
| | — |
| | — |
| | (2,863 | ) | | (2,863 | ) |
| Share repurchases | (254 | ) | | (254 | ) | | — |
| | — |
| | (10,049 | ) | | — |
| | — |
| | (10,303 | ) | | — |
| | (10,303 | ) |
| Restricted stock withheld for taxes | (70 | ) | | (70 | ) | | — |
| | — |
| | (3,730 | ) | | — |
| | — |
| | (3,800 | ) | | — |
| | (3,800 | ) |
| Issuance of restricted stock | 185 |
| | 185 |
| | — |
| | — |
| | (185 | ) | | — |
| | — |
| | — |
| | — |
| | — |
|
| Stock options exercised | 19 |
| | 19 |
| | — |
| | — |
| | 548 |
| | — |
| | — |
| | 567 |
| | — |
| | 567 |
|
| Class B common stock converted to Class A common stock | 1,661 |
| | 1,661 |
| | (1,661 | ) | | (1,661 | ) | | — |
| | — |
| | — |
| | — |
| | — |
| | — |
|
| Share-based compensation expense | — |
| | — |
| | — |
| | — |
| | 12,830 |
| | — |
| | — |
| | 12,830 |
| | — |
| | 12,830 |
|
| Excess tax deficiency from stock options exercised and restricted stock units vested | — |
| | — |
| | — |
| | — |
| | (467 | ) | | — |
| | — |
| | (467 | ) | | — |
| | (467 | ) |
| Cash dividends ($0.068 per share) | — |
| | — |
| | — |
| | — |
| | — |
| | (1,888 | ) | | — |
| | (1,888 | ) | | — |
| | (1,888 | ) |
| Balance as of August 31, 2011 | 24,241 |
| | $ | 24,241 |
| | 3,060 |
| | $ | 3,060 |
| | $ | 762 |
| | $ | 1,065,109 |
| | $ | 1,540 |
| | $ | 1,094,712 |
| | $ | 6,524 |
| | $ | 1,101,236 |
|
_____________________________
| |
| (1) | Net income attributable to noncontrolling interests at August 31, 2011 excludes $100 thousand allocable to the redeemable noncontrolling interest, which is reported in the mezzanine section of the Consolidated Balance Sheets at August 31, 2011. See Note 12 - Redeemable Noncontrolling Interest for further detail. |
| |
| (2) | Foreign currency translation adjustments exclude $509 thousand relating to redeemable noncontrolling interests for the year ended August 31, 2011, which is reported in the mezzanine section of the Consolidated Balance Sheets at August 31, 2011. See Note 12 - Redeemable Noncontrolling Interest for further detail. |
See Notes to the Consolidated Financial Statements
4844 / Schnitzer Steel Industries, Inc. Form 10-K 20102011
SCHNITZER STEEL INDUSTRIES, INC.
CONSOLIDATED STATEMENTS OF CASH FLOWS
(in thousands)
| | | | | | | | | | | | |
| | | Year Ended August 31, | |
| | | 2010 | | | 2009 | | | 2008 | |
Cash flows from operating activities: | | | | | | | | | | | | |
Net income (loss) | | $ | 70,676 | | | $ | (31,363 | ) | | $ | 254,040 | |
Adjustments to reconcile net income (loss) to cash provided by operating activities: | | | | | | | | | | | | |
Depreciation and amortization | | | 63,418 | | | | 60,681 | | | | 51,362 | |
Inventory write-down | | | 368 | | | | 51,968 | | | | 48,967 | |
Deferred income taxes | | | 10,891 | | | | 24,727 | | | | 2,582 | |
Undistributed equity in earnings of joint ventures | | | (3,076 | ) | | | (537 | ) | | | (12,277 | ) |
Share-based compensation expense | | | 11,035 | | | | 8,898 | | | | 14,487 | |
Excess tax (benefit) deficiency from share-based payment arrangements | | | 128 | | | | (819 | ) | | | (1,007 | ) |
(Gain) loss on disposal of a business and other assets | | | 16,943 | | | | (2,034 | ) | | | 414 | |
Environmental matters | | | (1,391 | ) | | | (3,510 | ) | | | (603 | ) |
Voluntary incentive award forfeitures | | | 0 | | | | (5,504 | ) | | | 0 | |
Unrealized (gain) loss on derivatives | | | (4,299 | ) | | | 1,161 | | | | 2,541 | |
Bad debt expense (recoveries), net | | | (255 | ) | | | 8,916 | | | | 4,445 | |
Gain on settlement of joint venture separation and termination agreement | | | 0 | | | | (6,761 | ) | | | 0 | |
Changes in assets and liabilities: | | | | | | | | | | | | |
Accounts receivable | | | (11,569 | ) | | | 189,511 | | | | (135,140 | ) |
Inventories | | | (109,138 | ) | | | 198,840 | | | | (215,812 | ) |
Refundable income taxes | | | 32,237 | | | | (46,147 | ) | | | 881 | |
Prepaid expenses and other current assets | | | (2,640 | ) | | | 4,185 | | | | (3,756 | ) |
Intangibles and other long-term assets | | | (206 | ) | | | (4,514 | ) | | | (3,564 | ) |
Accounts payable | | | 8,479 | | | | (79,086 | ) | | | 54,108 | |
Accrued payroll liabilities | | | 12,010 | | | | (35,851 | ) | | | 21,251 | |
Other accrued liabilities | | | (2,519 | ) | | | (4,858 | ) | | | 15,396 | |
Accrued income taxes | | | 1,040 | | | | (41,998 | ) | | | 38,162 | |
Environmental liabilities | | | (944 | ) | | | (577 | ) | | | (1,243 | ) |
Other long-term liabilities | | | (2,128 | ) | | | (1,574 | ) | | | (320 | ) |
Distributed equity in earnings of joint ventures | | | 430 | | | | 3,825 | | | | 6,850 | |
| | | | | | | | | | | | |
Net cash provided by operating activities | | | 89,490 | | | | 287,579 | | | | 141,764 | |
| | | | | | | | | | | | |
Cash flows from investing activities: | | | | | | | | | | | | |
Capital expenditures | | | (64,324 | ) | | | (59,044 | ) | | | (84,262 | ) |
Acquisitions, net of cash acquired | | | (40,944 | ) | | | (93,053 | ) | | | (46,888 | ) |
(Advances to) payments from joint ventures, net | | | (340 | ) | | | (1,876 | ) | | | 3,092 | |
Proceeds from sale of business and other assets | | | 41,319 | | | | 3,497 | | | | 917 | |
Cash flows used in non-hedge derivatives | | | 0 | | | | 0 | | | | (822 | ) |
| | | | | | | | | | | | |
Net cash used in investing activities | | | (64,289 | ) | | | (150,476 | ) | | | (127,963 | ) |
| | | | | | | | | | | | |
Cash flows from financing activities: | | | | | | | | | | | | |
Proceeds from line of credit | | | 402,600 | | | | 331,700 | | | | 490,500 | |
Repayment of line of credit | | | (402,600 | ) | | | (356,700 | ) | | | (485,500 | ) |
Borrowings from long-term debt | | | 577,900 | | | | 440,500 | | | | 1,414,600 | |
Repayment of long-term debt | | | (589,242 | ) | | | (491,329 | ) | | | (1,379,946 | ) |
Repurchase of Class A common stock | | | (17,147 | ) | | | (29,896 | ) | | | (44,859 | ) |
Stock withheld for taxes under employee share-based compensation plan | | | (3,599 | ) | | | (3,995 | ) | | | (2,234 | ) |
Excess tax benefit (deficiency) from share-based payment arrangements | | | (128 | ) | | | 819 | | | | 1,007 | |
Stock options exercised and restricted stock units vested | | | 937 | | | | 1,681 | | | | 523 | |
Distributions to noncontrolling interests | | | (3,003 | ) | | | (1,286 | ) | | | (4,705 | ) |
Dividends paid | | | (1,416 | ) | | | (2,386 | ) | | | (1,434 | ) |
| | | | | | | | | | | | |
Net cash used in financing activities | | | (35,698 | ) | | | (110,892 | ) | | | (12,048 | ) |
| | | | | | | | | | | | |
Effect of exchange rate changes on cash | | | (187 | ) | | | (224 | ) | | | (124 | ) |
Net increase (decrease) in cash and cash equivalents | | | (10,684 | ) | | | 25,987 | | | | 1,629 | |
Cash and cash equivalents at beginning of year | | | 41,026 | | | | 15,039 | | | | 13,410 | |
| | | | | | | | | | | | |
Cash and cash equivalents at end of year | | $ | 30,342 | | | $ | 41,026 | | | $ | 15,039 | |
| | | | | | | | | | | | |
SUPPLEMENTAL DISCLOSURES: | | | | | | | | | | | | |
Cash paid (received) during the year for: | | | | | | | | | | | | |
Interest | | $ | 2,569 | | | $ | 3,329 | | | $ | 8,400 | |
Income taxes paid (refunds received), net | | $ | (3,783 | ) | | $ | 42,443 | | | $ | 97,825 | |
|
| | | | | | | | | | | |
| | Year Ended August 31, |
| | 2011 | | 2010 | | 2009 |
| Cash flows from operating activities: | | | | | |
| Net income (loss) | $ | 123,536 |
| | $ | 70,676 |
| | $ | (31,363 | ) |
| Adjustments to reconcile net income (loss) to cash provided by operating activities: | | | | | |
| Depreciation and amortization | 74,866 |
| | 63,418 |
| | 60,681 |
|
| Inventory write-down | — |
| | 368 |
| | 51,968 |
|
| Deferred income taxes | 21,004 |
| | 10,891 |
| | 24,727 |
|
| Undistributed equity in earnings of joint ventures | (4,622 | ) | | (3,076 | ) | | (537 | ) |
| Share-based compensation expense | 13,655 |
| | 11,035 |
| | 8,898 |
|
| Excess tax benefit from share-based payment arrangements | (689 | ) | | 128 |
| | (819 | ) |
| Loss (gain) on disposal of a business and other assets | 1,529 |
| | 16,943 |
| | (2,034 | ) |
| Environmental matters | 662 |
| | (1,391 | ) | | (3,510 | ) |
| Voluntary incentive award forfeitures | — |
| | — |
| | (5,504 | ) |
| Net (gain) loss on derivatives | (772 | ) | | (4,299 | ) | | 1,161 |
|
| Unrealized foreign exchange loss, net | 758 |
| | — |
| | — |
|
| Bad debt expense (recoveries), net | 334 |
| | (255 | ) | | 8,916 |
|
| Gain on settlement of joint venture separation and termination agreement | — |
| | — |
| | (6,761 | ) |
| Changes in assets and liabilities, net of acquisitions: | | | | | |
| Accounts receivable | (91,715 | ) | | (11,569 | ) | | 189,511 |
|
| Inventories | (45,268 | ) | | (109,138 | ) | | 198,840 |
|
| Refundable income taxes | 520 |
| | 32,237 |
| | (46,147 | ) |
| Prepaid expenses and other current assets | (11,486 | ) | | (2,640 | ) | | 4,185 |
|
| Intangibles and other long-term assets | (133 | ) | | (206 | ) | | (4,514 | ) |
| Accounts payable | 45,447 |
| | 8,479 |
| | (79,086 | ) |
| Accrued payroll and related liabilities | 2,276 |
| | 12,010 |
| | (35,851 | ) |
| Other accrued liabilities | (15,676 | ) | | (2,519 | ) | | (4,858 | ) |
| Accrued income taxes | 22,183 |
| | 1,040 |
| | (41,998 | ) |
| Environmental liabilities | (759 | ) | | (944 | ) | | (577 | ) |
| Other long-term liabilities | (167 | ) | | (2,128 | ) | | (1,574 | ) |
| Distributed equity in earnings of joint ventures | 4,980 |
| | 430 |
| | 3,825 |
|
| Net cash provided by operating activities | 140,463 |
| | 89,490 |
| | 287,579 |
|
| Cash flows from investing activities: | | | | | |
| Capital expenditures | (104,964 | ) | | (64,324 | ) | | (59,044 | ) |
| Acquisitions, net of cash acquired | (293,880 | ) | | (40,944 | ) | | (93,053 | ) |
| Joint venture payments, net | (1,587 | ) | | (340 | ) | | (1,876 | ) |
| Proceeds from sale of business and other assets | 530 |
| | 41,319 |
| | 3,497 |
|
| Net cash used in investing activities | (399,901 | ) | | (64,289 | ) | | (150,476 | ) |
| Cash flows from financing activities: | | | | | |
| Proceeds from line of credit | 655,500 |
| | 402,600 |
| | 331,700 |
|
| Repayment of line of credit | (655,500 | ) | | (402,600 | ) | | (356,700 | ) |
| Borrowings from long-term debt | 811,531 |
| | 577,900 |
| | 440,500 |
|
| Repayment of long-term debt | (508,675 | ) | | (589,242 | ) | | (491,329 | ) |
| Debt financing fees | (5,310 | ) | | — |
| | — |
|
| Repurchase of Class A common stock | (10,303 | ) | | (17,147 | ) | | (29,896 | ) |
| Taxes paid related to net share settlement of share-based payment arrangements | (3,800 | ) | | (3,599 | ) | | (3,995 | ) |
| Excess tax benefit from share-based payment arrangements | 689 |
| | (128 | ) | | 819 |
|
| Stock options exercised | 567 |
| | 937 |
| | 1,681 |
|
| Distributions to noncontrolling interests | (2,863 | ) | | (3,003 | ) | | (1,286 | ) |
| Dividends paid | (1,885 | ) | | (1,416 | ) | | (2,386 | ) |
| Net cash provided by (used in) financing activities | 279,951 |
| | (35,698 | ) | | (110,892 | ) |
| Effect of exchange rate changes on cash | (1,393 | ) | | (187 | ) | | (224 | ) |
| Net increase (decrease) in cash and cash equivalents | 19,120 |
| | (10,684 | ) | | 25,987 |
|
| Cash and cash equivalents as of beginning of year | 30,342 |
| | 41,026 |
| | 15,039 |
|
| Cash and cash equivalents as of end of year | $ | 49,462 |
| | $ | 30,342 |
| | $ | 41,026 |
|
| SUPPLEMENTAL DISCLOSURES: | | | | | |
| Cash paid (received) during the year for: | | | | | |
| Interest | $ | 7,072 |
| | $ | 2,569 |
| | $ | 3,329 |
|
| Income taxes paid (refunds received), net | $ | 14,330 |
| | $ | (3,783 | ) | | $ | 42,443 |
|
See Notes to the Consolidated Financial Statements
45 / Schnitzer Steel Industries, Inc. Form 10-K 2010 / 492011
SCHNITZER STEEL INDUSTRIES, INC.
NOTES TO THE CONSOLIDATED FINANCIAL STATEMENTS
Note 1 – Nature of Operations Founded in 1906, Schnitzer Steel Industries, Inc. (the “Company”), an Oregon corporation, is
currently one of the nation’s largest recyclers of ferrous and nonferrous scrap metal, a leading recycler of used and salvaged vehicles and a manufacturer of finished steel products.
The Company operates in three reporting segments that includeas follows: the Metals Recycling Business (“MRB”), the Auto Parts Business (“APB”) and the Steel Manufacturing Business (“SMB”). MRB buys, collects, processes, recycles, sells and brokers recycled metal by operating one of the largest metal recycling businesses in the United States (“US”U.S.”). APB is one of the country’s leading self-service used auto parts networks. Additionally, APB is a supplier of autobodies to MRB, which processes the autobodies into sellable recycled metal. SMB purchases recycled metal from MRB and uses its mini-mill to process the recycled metal into finished steel products. The Company provides an end-of-life cycle solution for a variety of products through its cross-divisional synergies, including sale of used auto parts, procuring autobodies and other metal products, recycling them into scrap metal and manufacturing them into finished steel products. As of August 31, 2010,2011, all of the Company’s facilities were located in the USU.S. and its territories and Canada.
Note 2 – Summary of Significant Accounting Policies
Principles of Consolidation
The
consolidated financial statementsConsolidated Financial Statements include the accounts of the Company and its majority-owned and wholly-owned subsidiaries.
In addition,The equity method of accounting is used for investments in joint ventures over which the Company
holds a 50% interest in five joint ventures which are accounted for under the equity method.has significant influence but does not have effective control. All significant intercompany account balances, transactions, profits and losses have been
eliminated as of August 31, 2010 and 2009 and for the years ended August 31, 2010, 2009 and 2008.eliminated.
Cash and Cash Equivalents
Cash and cash equivalents include short-term securities that are not restricted by third parties and have an original maturity date of 90 days or less. Included in accounts payable are book overdrafts of $25$40 million and $23$25 million as of August 31, 20102011 and 2009,2010, respectively.
Accounts receivable represent amounts due from customers on product and other sales. These accounts receivable, which are reduced by an allowance for doubtful accounts, are recorded at the invoiced amount and do not bear interest. The Company evaluates the collectibility of its accounts receivable based on a combination of factors, including whether sales were made pursuant to letters of credit. In cases where management is aware of circumstances that may impair a specific customer’s ability to meet its financial obligations, management records a specific allowance against amounts due and reduces the net recognized receivable to the amount the Company believes will be collected. For all other customers, the Company maintains a reserve that considers the total receivables outstanding, historical collection rates and economic trends. Accounts are written off when all efforts to collect have been exhausted. The allowance for doubtful accounts was $6$6 million and $8 million as of August 31, 20102011 and 2009, respectively.2010
. The Company’s inventories primarily consist of scrap metal (ferrous, nonferrous, processed and unprocessed), nonferrous recovered joint product (nonferrous arising from the manufacturing process), used and salvaged vehicles, semi-finished steel products (billets) and finished steel products (primarily rebar, merchant bar and wire rod). Inventories are stated at the lower of cost or market. MRB determines the cost of ferrous and nonferrous inventories principally using the average cost method and capitalizes substantially all direct costs and yard costs into inventory. MRB allocates material and production costs to joint products using the gross margin method. APB determines the cost for used and salvaged vehicle inventory based on the average price the Company pays for a vehicle and capitalizes the vehicle cost into inventory. SMB determines the cost of its finished steel product inventory based on weighted average costs and capitalizes all direct and indirect costs of manufacturing into inventory. Indirect costs of manufacturing include general plant costs, maintenance and yard50 / Schnitzer Steel Industries, Inc. Form 10-K 2010
SCHNITZER STEEL INDUSTRIES, INC.
NOTES TO THE CONSOLIDATED FINANCIAL STATEMENTS
costs. The Company evaluates whether its inventory is properly valued at the lower of cost or market on a quarterly basis. The Company considers estimated future selling prices when determining the estimated net realizable value for its inventory. However, asAs MRB generally sells its export recycled ferrous metal under contracts that provide for shipment within
30 to 9060 days after the price is agreed, it utilizes the selling prices under committed contracts and sales orders for determining the estimated market price of quantities on hand that will be shipped under these contracts and orders. The Company performs periodic physical inventories to verify the quantity of inventory on hand. Due to variations in product density, holding period and production processes utilized to manufacture the product, physical inventories will not necessarily detect all variances.variances for metal inventory such that estimates of quantities are required. To mitigate this risk, the Company adjusts its ferrous physical inventories when the volume of a commodity is low and a physical inventory count can more accurately predict
46 / Schnitzer Steel Industries, Inc. Form 10-K 2011
SCHNITZER STEEL INDUSTRIES, INC.
NOTES TO THE CONSOLIDATED FINANCIAL STATEMENTS
Property, Plant and Equipment, net
Property, plant and equipment are recorded at cost. Expenditures for major additions and improvements are capitalized, while routine repair and maintenance costs are expensed as incurred.
Capitalized interest for fiscal 2010, 2009Interest related to the construction of qualifying assets is capitalized as part of the construction costs, and
2008 was not
material.material to any of the periods presented. When assets are retired or sold, the related cost and accumulated depreciation are removed from the accounts and resulting gains or losses are generally included in operating expenses. Depreciation is recorded on a straight-line basis over the estimated useful lives of the assets. Leasehold improvements are amortized over the
shorter of their estimated useful lives
of the property or the remaining lease
term, whichever is less.term.
As of August 31, 2010,2011, the useful lives used for depreciation and amortization were as follows: | | |
| |
| | | (in years)
| | Weighted average
useful life
(in years)
|
| | |
Machinery and equipment | | 3 to 40 | | 13 |
Land improvements | | 3 to 35 | | 13 |
Buildings and leasehold improvements | | 5 to 40 | | 24 |
Office equipment | | 2 to 20 | | 6 |
ERPEnterprise Resource Planning (“ERP”) systems
| | 8 to 10 | | 9 |
Impairment of Long-Lived Assets
The Company estimates the future undiscounted cash flows and Amortizable Intangible Assets
Long-lived assets and intangible assets subject to be derived fromamortization are subject to an asset to assess whether or not a potential impairment existsassessment when certain triggering events or circumstances indicate that thetheir carrying value of a long-lived asset may be impaired. If the carrying value exceeds the Company’s estimate of future undiscounted cash flows of the Company recordsoperations related to the asset, an impairment is recorded for the difference between the carrying amount and the fair value of the asset. There were no material adjustments to the carrying value of long-lived assets and intangible assets subject to amortization during the years ended August 31, 2011, 2010 2009 and 2008.2009
. Investment in Joint Ventures
As of August 31, 2011 and 2010, the Company had five50%-owned joint venture interests which were accounted for under the equity method of accounting and presented as part of MRB operations. The Company’s investment in equity method joint venture investments has resulted in cumulative undistributed earnings of $11 million and $12 million as of August 31, 2011 and 2010, respectively, that are included as a part of partners’ equity of the joint ventures. See Note 19 - Related Party Transactions for further detail on transactions with joint ventures.
Goodwill and Other Intangible Assets, net
Goodwill represents the excess of the purchase price over the estimated fair value of the net tangible and intangible assets of the acquired entities. The Company evaluates goodwill and intangibles with an indefinite life
for impairment annually during the second fiscal quarter and upon the occurrence of certain triggering events or substantive changes in circumstances that indicate that the fair value of goodwill or
indefinite lived intangible assets may be impaired. Impairment of goodwill is tested at the reporting
unit level. A reporting unit is an operating segment
level.or one level below an operating segment (referred to as a ‘component’). The
Company’sCompany has determined that its reporting
segments,units, for which goodwill has been allocated, are equivalent to the Company’s operating segments
(MRB, APB and SMB), as all of the components of
the respective segmentseach segment have similar economic characteristics.
The goodwill impairment test follows a two step process. In the first step, the fair value of a reporting
segmentunit is compared to its carrying value. If the carrying value of a reporting
segmentunit exceeds its fair value, the second step of the
Schnitzer Steel Industries, Inc. Form 10-K 2010 / 51
SCHNITZER STEEL INDUSTRIES, INC.
NOTES TO THE CONSOLIDATED FINANCIAL STATEMENTS
impairment test is performed for purposes of measuring the impairment. In the second step, the fair value of the reporting segmentunit is allocated to all of the assets and liabilities of the reporting segmentunit to determine an implied goodwill value. This allocation is similar to a purchase price allocation where the Company must assign fair values using market participant assumptions. If the carrying amount of the reporting segment’sunit’s goodwill exceeds the implied fair value of goodwill, an impairment loss will be recognized in an amount equal to that excess. In the event of a divestiture of a business unit within a reporting segment,unit, goodwill of the reporting segmentunit is allocated to that business unit based on the fair value of the unit being divested to the total fair value of the reporting segmentunit and a gain or loss is determined. The remaining goodwill in the reporting segmentunit from which the assets were divested is subsequently re-evaluated for impairment.
The Company estimates the fair value of
theits reporting
segmentsunits using an income approach based on the present value of expected future cash flows,
including terminal value, utilizing a market-based weighted average cost of
capital (“WACC”). To estimate the cash flows that extend beyond the final year of the discounted cash flow model, the Company employs a terminal value technique, whereby the Company uses estimated operating cash flows minus capital expenditures and adjusts for changes in working capital requirements in the final year of the model, then discounts it by the WACC to establish the terminal value. The Company includes the present value of the terminal value in the fair value estimate. Given that market prices of the Company’s reporting segments are not readily available, the Company makes various estimates and assumptions in determining the estimated fair values of the reporting segments, which is the price that would be received to sell the reporting segment as a whole in an orderly transaction between market participants.capital. Forecasts of future cash flows are based on
management’sthe best estimate of future sales and operating costs, pricing expectations and general market conditions.
In addition, the aggregated estimated fair value of the reporting units are compared to the Company’s market capitalization, including
47 / Schnitzer Steel Industries, Inc. Form 10-K 2011
SCHNITZER STEEL INDUSTRIES, INC.
NOTES TO THE CONSOLIDATED FINANCIAL STATEMENTS
consideration of a control premium. The Company believes this reconciliation is consistent with a market participant perspective.
The Company tests indefinite-lived intangiblesintangible assets for impairment by either comparing the carrying value of the intangible to the projected discounted cash flows from the intangible or using the relief from royalties method. If the carrying value exceeds the projected discounted cash flows attributed to the indefinite-lived intangible asset, the carrying value is no longer considered recoverable and the Company will record an impairment. The Company did not record any material impairment charges on indefinite-lived intangible assets in any of the periods presented. See Note 98 – Goodwill and Other Intangibles Assets, net for further detail.Allocation
Acquisitions
On September 1, 2009, the Company adopted the revised accounting standard for business combinations, which requires the Company to recognize the assets acquired, the liabilities assumed, and any noncontrolling interest in the acquiree at the acquisition date, measured at their fair values as of
Acquisition Purchase Pricethat date. The Company allocatesrevised accounting standard has been applied prospectively to all business combinations completed after the date of adoption. Contingent purchase consideration is recorded at fair value at the date of acquisition. Any excess purchase price over the fair value of acquisitionsthe net assets acquired is recorded as goodwill. Within one year from the date of acquisition, the Company may update the value allocated to identified tangible and intangiblethe assets acquired and liabilities assumed based on their estimated fair valuesand the resulting goodwill balances as a result of information received regarding the valuation of such assets and liabilities that was not available at the datetime of acquisition, with any residual amounts allocated to goodwill.purchase. Measuring assets and liabilities at fair value requires usthe Company to determine the price that would be paid by a third party market participant based on the highest and best use of the assets or interests acquired. In addition, the Company accrues for any contingent purchase price consideration at fair value at the date of the acquisition.
Acquisition costs are expensed as incurred.
Accrued Workers’ Compensation Costs
The Company is self-insured for workers’ compensation claims with exposure limited by various stop-loss insurance policies. The Company estimates the costs of workers’ compensation claims based on the nature of the injury incurred and on guidelines established by the applicable state. A reserve is recorded based upon the amount of unpaid claims as of the balance sheet date. Reserve amounts recorded for individual claims are reviewed periodically as treatment progresses and adjusted to reflect additional information that becomes available. The estimated cost of claims incurred but not reported is included in the reserve. As of August 31, 2010 and 2009, theThe Company accrued $6$10 million and $6 million for the estimated cost of workers’ compensation claims.claims as of
August 31, 2011 and 2010, respectively, which are included in other accrued liabilities in the Consolidated Balance Sheets. Environmental Liabilities
The Company estimates future costs for known environmental remediation requirements and accrues for them on an undiscounted basis when it is probable that the Company has incurred a liability and the related costs can be reasonably estimated but the timing of incurring the estimated costs is unknown. The Company considers various factors when estimating its environmental liabilities. Adjustments to the liabilities are made when additional information becomes available that affects the estimated costs to study or remediate any environmental issues or when
52 / Schnitzer Steel Industries, Inc. Form 10-K 2010
SCHNITZER STEEL INDUSTRIES, INC.
NOTES TO THE CONSOLIDATED FINANCIAL STATEMENTS
expenditures are made for which reserves were established. Legal costs incurred in connection with environmental contingencies are expensed as incurred.
When only a wide range of estimated amounts can be reasonably established and no other amount within the range is
a better
estimate than another, the low end of the range is recorded in the financial statements. In a number of cases, it is possible that the Company may receive reimbursement through insurance or from other potentially responsible parties for a site. In these situations, recoveries of environmental remediation costs from other parties are recognized when the claim for recovery is actually realized. The amounts recorded for environmental liabilities are reviewed periodically as site assessment and remediation progresses at individual sites and adjusted to reflect additional information that becomes available. Due to evolving remediation technology, changing regulations, possible third party contributions, the
inherent shortcomingssubjective nature of the
estimation processassumptions used and other factors, amounts accrued could vary significantly from amounts paid.
Fair Value of
The Company’s financial instruments include cash and cash equivalents, accounts receivable, accounts payable, debt and
natural gas derivative.derivative contracts. The carrying amounts of the non-derivative financial instruments approximate fair value, including debt
as it consists of primarily
at variable interest
rate notes.rates. The Company uses the market approach to value its financial assets and liabilities, determined using available market information.
Fair value disclosures are included in Note 14 – Derivative Financial Instruments and Fair Value Measurements.
Fair value is measured using inputs from the three levels of the fair value hierarchy. Classification within the hierarchy is determined based on the lowest level input that is significant to the fair value measurement. The three levels are described as follows: Level 1 – Unadjusted quoted prices in active markets.markets for identical assets and liabilities.
48 / Schnitzer Steel Industries, Inc. Form 10-K 2011
SCHNITZER STEEL INDUSTRIES, INC.
NOTES TO THE CONSOLIDATED FINANCIAL STATEMENTS
Level 2 – Directly and indirectly observable market data.
Level 3 – Unobservable inputs with no market data correlation.Significant unobservable inputs.
When developing the fair value measurements, the Company uses quoted market prices whenever available or seeks to maximize the use of observable inputs and minimize the use of unobservable inputs when quoted market prices are not available. The Company’s natural gas contract for SMB is measured at fair value using a model derived from observable market data. This model considers various inputs including: (a) quoted futures prices for commodities, (b) time value,See Note 12 - Redeemable Noncontrolling Interest and (c) the Company’s credit risk, as well as other relevant economic measures. See Note 14 – Derivative Financial Instruments and Fair Value Measurements for further detail. Derivatives
DerivativesThe Company’s accounting policies forCompany records derivative instruments are based on whether the instruments are designated as hedgein other assets or non-hedge instruments. Derivative instruments are recordedother liabilities in the Consolidated Balance Sheets at fair value and changes in the fair value are either recognized in accumulated other comprehensive income (loss) in the Consolidated Balance Sheets or net income (loss) in the Consolidated Statements of Operations, as either assetsapplicable, depending on the nature of the underlying exposure, whether the derivative has been designated as a hedge, and if designated as a hedge, the extent to which the hedge is effective. Amounts included in accumulated other comprehensive income (loss) are reclassified to earnings in the period in which earnings are impacted by the hedged items or liabilities unless theyin the period that the hedged transaction is deemed no longer likely to occur. For cash flow hedges, a formal assessment is made, both at the hedge’s inception and on an ongoing basis, to determine whether the derivatives that are designated as hedging instruments have been highly effective in offsetting changes in the cash flows of hedged items and qualify for the normal purchases and normal sales exemption. Derivative contracts for commodities used in normal business operations that are settled by physical delivery, among other criteria, are eligible for andwhether those derivatives may be designated as normal purchases and normal sales pursuantexpected to remain highly effective in future periods. To the exemption. Contracts that qualify as normal purchases or normal sales are not marked–to-market.
extent the hedge is determined to be ineffective, the ineffective portion is immediately recognized in earnings. When available, quoted market prices or prices obtained through external sources are used to measure a contract’s fair value. The fair value of these instruments is a function of underlying forward commodity prices, related volatility, counterparty creditworthiness and duration of the contracts.
Cash flows from derivatives are recognized in the Consolidated Statements of Cash Flows in a manner consistent with the underlying transactions. See Note 14 - Derivative Financial Instruments.
Derivative contracts for commodities used in normal business operations that are settled by physical delivery, among other criteria, are eligible for and may be designated as normal purchases and normal sales. Contracts that qualify as normal purchases or normal sales are not marked-to-market. The Company does not use derivative instruments for trading or speculative purposes.
Foreign Currency Translation and Transactions
Assets and liabilities of foreign operations are translated into USU.S. dollars at the period-end exchange rate and revenues and expenses of foreign operations are translated into USU.S. dollars at the average exchange rate for the period. Translation adjustments are not included in determining net income (loss) for the period, but are recorded in accumulated other comprehensive loss,income (loss), a separate component of SSI shareholders’ equity. Foreign currency transactionSchnitzer Steel Industries, Inc. Form 10-K 2010 / 53
SCHNITZER STEEL INDUSTRIES, INC.
NOTES TO THE CONSOLIDATED FINANCIAL STATEMENTS
gains and losses are generated from the effects of exchange rate changes on transactions denominated in a currency other than the functional currency of the Company, which is the USU.S. dollar. Gains and losses on foreign currency transactions are generally required to be recognized in the determination of net income (loss) for the period. The Company records these gains and losses in other income (expense).
Net realized and unrealized foreign currency transaction gains were less than $1 millionnot material for each of the years ended August 31,
2011, 2010 and 2009. Redeemable Noncontrolling Interest
The Company has issued common stock to the noncontrolling interest holder of one of our subsidiaries that is redeemable both at the option of the holder and $1 millionupon the occurrence of an event that is not solely within the Company’s control. If the interest were to be redeemed, the Company would be required to purchase all of such interest at fair value on the date of redemption. As such, the redeemable noncontrolling interest is measured at fair value at each reporting period. Any adjustments to the carrying amount of the redeemable noncontrolling interest prior to exercise of the redemption option will be recorded to equity. Since redemption of the noncontrolling interest is outside of the Company’s control, these interests are presented on the Consolidated Balance Sheets in the mezzanine section under the caption “Redeemable noncontrolling interests.” See Note 12 – Redeemable Noncontrolling Interest for the year ended August 31, 2008.further detail.
Each share of Class A and Class B common stock is entitled to one vote. Additionally, each share of Class B common stock may be converted to one share of Class A common stock. As such, the Company reserves one share of Class A common stock for each share of Class B common stock outstanding. There are currently no meaningful distinctions between the rights of holders of Class A shares and Class B shares.
Under its shareholder rights plan, the Company issued a dividend distribution of one preferred share purchase right (a “Right”) for each share of Class A common stock or Class B common stock held by shareholders of record as of the close of business on April 4, 2006. The Rights generally become exercisable if a person or group has acquired 15% or more of the Company’s outstanding
49 / Schnitzer Steel Industries, Inc. Form 10-K 2011
SCHNITZER STEEL INDUSTRIES, INC.
NOTES TO THE CONSOLIDATED FINANCIAL STATEMENTS
common stock or announces a tender offer or exchange offer which, if consummated, would result in ownership by a person or group of 15% or more of the Company’s outstanding common stock (“Acquiring Person”). The Schnitzer Steel Industries, Inc. Voting Trust and its trustees, in their capacity as trustees, are not deemed to beneficially own any common stock by virtue of being bound by the Voting Trust Agreement governing the trust. Each Right entitles shareholders to buy one one-thousandth of a share of Series A Participating Preferred Stock (“Series A Shares”) of the Company at an exercise price of $110,$110, subject to adjustments. Holders of Rights (other than an Acquiring Person) are entitled to receive upon exercise Series A Shares, or in lieu thereof, Class A common stock of the Company having a value of twice the Right’s then-current exercise price. The Series A Shares are not redeemable by the Company and have voting privileges and certain dividend and liquidation preferences. The Rights will expire on March 21, 2016, unless such date is extended or the Rights are redeemed or exchanged on an earlier date.
The Company accounts for the repurchase of stock at par value. All shares repurchased are deemed retired. Upon retirement of the shares, the Company records the difference between the weighted average cost of such shares and the par value of the stock as an adjustment to additional paid-in-capital, with the excess to retained earnings when additional paid-in-capital is not sufficient.
The Company recognizes revenue when it has a contract or purchase order from a customer with a fixed price, the title and risk of loss transfer to the buyer and collectibility is reasonably assured. Title for both metal and finished steel products transfers based on contract terms. A significant portion of the Company’s ferrous export sales of recycled metal are made with letters of credit, reducing credit risk. However, domestic recycled ferrous metal sales, nonferrous sales and sales of finished steel are generally made on open account. Nonferrous export sales typically require a deposit prior to shipment. All sales made on open account are evaluated for collectibility prior to revenue recognition. Additionally, the Company recognizes revenues on partially loaded shipments when detailed documents support revenue recognition based on transfer of title and risk of loss. For APB, retail revenues are recognized when customers pay for parts and wholesale product revenues are recognized when customer weight certificates are received following shipments. Historically, there have been very few sales returns and adjustments that impact the ultimate collection of revenues; therefore, no material provisions have been made when the sale is recognized. The Company presents taxes assessed by governmental authorities collected from customers on a net basis. Therefore, the taxes are excluded from revenue and are shown as a liability on the
consolidated balance sheetConsolidated Balance Sheets until remitted.
54 / Schnitzer Steel Industries, Inc. Form 10-K 2010
SCHNITZER STEEL INDUSTRIES, INC.
NOTES TO THE CONSOLIDATED FINANCIAL STATEMENTS
The Company classifies shipping and handling costs billed to customers as revenue and the related costs incurred as a component of cost of goods sold.
The Company recognizes share-based compensation cost relating to share-based payment transactions over the vesting period, with the cost measured based on the estimated fair value of the equity instruments issued. See Note 16 – Share-Based Compensation for further detail.
Income taxes are accounted for using the asset and liability method. This requires the recognition of taxes currently payable or refundable and the recognition of deferred tax assets and liabilities for the future tax consequences of events that are recognized in one reporting period on the consolidated financial statementsConsolidated Financial Statements but in a different reporting period on the tax returns. Tax credits are recognized as a reduction of income tax expense in the year the credit arises. Valuation allowances are recorded to reduce deferred tax assets when it is more likely than not that a tax benefit will not be realized. Tax benefits arising from uncertain tax positions are recognized when it is more likely than not that the position will be sustained upon examination by the relevant tax authorities. The amount recognized in the financial statements is the largest amount of tax benefit that is greater than 50 percent likely of being realized upon ultimate settlement with a taxing authority that has full knowledge of all relevant information. We recognize interest and penalties, if any, related to uncertain tax positions in income tax expense. See Note 17 – Income Taxes for further detail.
Net Income (Loss) per Share
Basic net income (loss) per share attributable to SSI is based oncomputed by dividing net income (loss) by the weighted average number of outstanding common shares during the periods presented including vested deferred stock units (“DSUs”) and restricted stock units (“RSUs”). Diluted net income (loss) per share attributable to SSI is based oncomputed by dividing net income (loss) by the weighted average number of common shares outstanding, assuming dilution. Potentially dilutive common shares include the assumed exercise of stock options and assumed vesting of performance shares, DSU and RSU awards using the treasury stock method.
50 / Schnitzer Steel Industries, Inc. Form 10-K 2011
SCHNITZER STEEL INDUSTRIES, INC.
NOTES TO THE CONSOLIDATED FINANCIAL STATEMENTS
Certain of the Company’s stock options, RSUs and performance share awards were excluded from the calculation of diluted net income (loss) per share because they were antidilutive, buthowever these options and awards could be dilutive in the future. See Note 18 – Net Income (Loss) Per Share for further detail.Effective September 1, 2009, the Company adopted the accounting standard for noncontrolling interests in consolidated financial statements. Certain provisions of this accounting standard are required to be adopted retrospectively for all periods presented and include a requirement that the carrying value of noncontrolling interests (previously referred to as minority interests) be removed from the mezzanine section of the balance sheet and reclassified as equity. Further, as a result of adopting this accounting standard, net (income) loss attributable to noncontrolling interests is now deducted from the income (loss) from continuing operations to arrive at the net income (loss) from continuing operations attributable to SSI for purposes of calculating net income (loss) per share.
See
Note 18 – Net Income (Loss) Per Share for further detail. The preparation of the Company’s
consolidated financial statementsConsolidated Financial Statements in accordance with generally accepted accounting principles in the
USU.S. of America (“
USU.S. GAAP”) requires management to make estimates and assumptions that affect the reported amounts of assets and liabilities and disclosure of contingent assets and liabilities at the date of the
consolidated financial statementsConsolidated Financial Statements and reported amounts of revenue and expenses during the reporting period. Examples include valuation of assets received in acquisitions; revenue recognition; the allowance for doubtful accounts; estimates of contingencies, including environmental liabilities; intangible asset valuation; inventory valuation;
redeemable non-controlling interest valuation; pension plan assumptions; and the assessment of the valuation of deferred income taxes and income tax contingencies. Actual results may differ from estimated amounts.
Concentration of Credit Risk
Financial instruments that potentially subject the Company to significant concentration of credit risk consist primarily of cash and cash equivalents and accounts receivable. The majority of cash and cash equivalents are maintained with two major financial institutions (Bank of America and Wells Fargo Bank, N.A.). Balances in these institutions exceeded the FDIC insuranceFederal Deposit Insurance Corporation insured amount of $250,000$250,000 as of August 31, 2010.2011. Concentration of credit risk with respect to accounts receivable is limited because a large number of geographically diverse customers make up the Company’s customer base. The Company controls credit risk through credit approvals, credit limits, letters of credit and monitoring procedures.Schnitzer Steel Industries, Inc. Form 10-K 2010 / 55
SCHNITZER STEEL INDUSTRIES, INC.
NOTES TO THE CONSOLIDATED FINANCIAL STATEMENTS
In addition, the The Company is exposed to a residual credit risk with respect to open letters of credit as most shipments to foreign customers are supported by lettersvirtue of the possibility of the failure of a bank providing a letter of credit. The Company had $85
$176 million and $99$85 million of open letters of credit, as of August 31, 20102011 and 2009,2010, respectively.Reclassifications
Certain prior year amounts in the statement of cash flows have been reclassified within cash flows from operating activities to conform to the current year presentation. These changes had no impact on previously reported operating income, net income (loss) or net cash provided by operating activities.
Note 3 – Recent Accounting PronouncementsRecently Adopted Accounting Standards
In
September 2006,December 2010, an accounting standard update was issued regarding the
Financial Accounting Standards Board (“FASB”) issued guidanceinterpretation of the disclosure of supplementary pro forma information for business combinations. The standard clarifies that
defines fair value, establishesan entity is required to disclose pro forma revenue and earnings as though the business combination(s) that occurred during the current year had occurred as of the beginning of the comparable prior annual reporting period only. In addition, this standard expands the supplemental pro forma disclosures to include a
framework for measuring fair value,description of the nature and
expands fair value measurement disclosure. This guidance, as it relatesamount of material, nonrecurring pro forma adjustments directly attributable to
non-financial assets and liabilities that are recognized or disclosed at fair valuethe business combination included in the
financial statements on a non-recurring basis, wasreported pro forma revenue and earnings. This standard will be effective for the Company for
the fiscal year
ended August 31, 2010. Assets acquired through business combinations completed during the year ended August 31, 2010 were valued in accordance2012. The Company currently complies with
this guidance. Non-recurring, non-financial asset fair value measurements also include those used in the Company’s test of recoverability of goodwill and indefinite-lived intangible assets, in which the Company determines whether fair values of its applicable reporting segments exceed their carrying values.In December 2007, the FASB issued amended guidance regarding business combinations, establishing principles and requirements for how an acquirer recognizes and measures identifiable assets acquired, liabilities assumed, any resulting goodwill and any noncontrolling interest in an acquiree in its financial statements, as well as requiring that all transaction costs be expensed as incurred. This guidance also provides forthese disclosures to enable users of the financial statements to evaluate the nature and financial effects of a business combination. This amended guidance became effective for the Company beginning September 1, 2009 and has been applied prospectively to all business combinations completed in fiscal 2010. Transaction costs of $1 million related to acquisitions that had not been completed at the time of adoption were expensed and all subsequent transaction costs have been expensed as incurred.
In December 2007, the FASB issued new guidance regarding the accounting and reporting for noncontrolling interests in subsidiaries. This guidance clarifies that noncontrolling interests in subsidiaries should be accounted for as a component of equity separate from the parent’s equity. Additionally, the guidance requires that income from noncontrolling interests be presented below net income to derive a net income figure attributable to the parent entity. This guidance became effective for the Company beginning September 1, 2009 and the applicable classification and presentation provisions were applied retrospectively.
In December 2008, the FASB issued guidance relating to an employer’s disclosures about the plan assets of a defined benefit pension or post retirement plan. The guidance requires additional disclosure regarding investment policies and strategies, fair value of each major asset category based on risks of the assets, inputs and valuation techniques used to estimate fair value, fair value measurement hierarchy for each asset category and significant concentrations of risk information. This guidance was effective for the Company for the fiscal year ended August 31, 2010 and the disclosures have been incorporated accordingly. See Note 15 – Employee Benefits.
In June 2009, the FASB established the FASB Accounting Standards Codification (the “Codification”) as the single source of authoritative US GAAP for all non-governmental entities. The Codification changes the referencing and organization of accounting guidance and became effective for us beginning September 1, 2009. There were no changes to US GAAP as a result of the issuance of the FASB Codification.
In January 2010, an accounting standards update was issued by the FASB to improve disclosure requirements related to fair value measurement. This update requires additional disclosures relating to significant transfers in and out of Levels 1 and 2 fair value measurements, along with the reason for the transfer and separate presentation of purchases, sales, issuances and settlements in the reconciliation of Level 3 fair value measurements. The update was effective for
56 / Schnitzer Steel Industries, Inc. Form 10-K 2010
SCHNITZER STEEL INDUSTRIES, INC.
NOTES TO THE CONSOLIDATED FINANCIAL STATEMENTS
the Company in the third quarter of the fiscal year ended August 31, 2010, except for disclosures relating to Level 3 activity, which will be effective for the fiscal year ending August 31, 2012 and will be applied prospectively and thus this standard will not have any impact on previously issued financial information. See Note 14 – Derivative Financial Instrumentsstatements.
In May 2011, an accounting standard update was issued to clarify existing fair value measurement guidance and
Fair Value Measurements.In February 2010,expand the FASB issued amended guidance on subsequent events. Under this amended guidance, SEC filersdisclosure requirements for fair value measurements estimated using unobservable inputs (Level 3 inputs). New disclosures are no longer required to disclosereport quantitative information about the date through which subsequent events have been evaluatedunobservable inputs used in originally issuedthe measurement of Level 3 valuations and revised financial statements. This guidance was effective immediatelyto include the valuation process used to determine the fair value of the item and the Company adopted these new requirements in the second quarter of fiscal 2010. In preparing the accompanying audited financial statements the Company has reviewed events that occurred after August 31, 2010, the balance sheet date, noting no material subsequent events.
Recently Issued Accounting Standards
In June 2009, the FASB issued a new accounting standard that revised the guidance for the consolidation of variable interest entities (“VIE”). This new guidance requires a qualitative approach to identifying a controlling financial interest in a VIE and requires an ongoing assessment of whether an entity is a VIE and whether an interest in a VIE makes the holder the primary beneficiarysensitivity of the VIE. This guidance is effective for the Company beginning September 1, 2010 and it is expected that the adoption will not have an impact on the Company’s consolidated financial position or results of operations.
In July 2010, the FASB issued an accounting standards updatemeasurement to require further disaggregated disclosures that improve financial statement users’ understanding of (1) the nature of an entity’s credit risk associated with its financing receivables and (2) the entity’s assessment of that risk in estimating its allowance for credit losses as well as changes in the allowance and the reasons for those changes.unobservable inputs. This updatestandard will be effective for the Company in the second quarter of fiscal 2011, except for the disclosures relating to activity that occurred during a reporting period which is effective for the Company in the third quarter of fiscal year 2012. The standard is unlikely to impact the fair value measurement of any of the Company’s existing assets, liabilities, or equity valuations, but additional disclosures will be required for the Company’s redeemable noncontrolling interest, which is measured using Level 3 inputs.
In June 2011, an accounting standard update was issued regarding the presentation of other comprehensive income in the financial statements. The standard eliminates the option of presenting other comprehensive income as part of the statement of changes in stockholders’ equity and instead requires the entity to present other comprehensive income as either a single statement of comprehensive income combined with net income or as two separate but continuous statements. This amendment will be effective for the Company for fiscal year 2013 and interim periods therein. The Company currently reports other comprehensive income in the summary of changes in equity and comprehensive income and will be required to update the presentation of comprehensive income to be in compliance with the new standard.
In September 2011, an accounting standard update was issued that simplifies how an entity tests goodwill for impairment by allowing an entity to first assess qualitative factors to determine whether it is necessary to perform the two-step quantitative goodwill impairment test. If an entity believes, as a result of its qualitative assessment, that it is more-likely-than-not that the fair value of a reporting unit is less than its carrying amount, the quantitative impairment test is required. Otherwise, no further testing is required. The revised standard includes examples of types of factors to consider in conducting the qualitative assessment. These include macro-economic conditions, such as a deterioration in the entity’s operating environment, entity-specific events, such as
51 / Schnitzer Steel Industries, Inc. Form 10-K 2011
SCHNITZER STEEL INDUSTRIES, INC.
NOTES TO THE CONSOLIDATED FINANCIAL STATEMENTS
declining financial performance, and other events, such as an expectation that a reporting unit will be sold. The revised standard is effective for annual and interim goodwill impairment tests performed for fiscal years beginning after December 15, 2011. SinceEarly adoption is permitted. The Company is likely to early adopt this standard for the goodwill impairment test to be performed in fiscal 2012. Upon adoption, this standard will impact how the Company assesses goodwill for impairment but will not change the measurement or recognition of a potential goodwill impairment charge.
In September 2011, an accounting standard update addresses onlywas issued that requires additional disclosures related to credit qualityabout an employer’s participation in multiemployer pension plans. The revised disclosures provide additional information about the plans in which an employer participates, the level of financing receivablesits participation, the financial health of significant plans, and the allowancenature of the employer’s commitments to the plans, including when the collective-bargaining agreements that require contributions to the significant plans are set to expire and whether those agreements require minimum contributions to be made to the plans. The revised disclosures also require additional information about significant plans from sources available outside of the basic financial statements, including the funded status of such plans. The revised standard does not change the existing recognition, measurement, and disclosure provisions for credit losses, it is not expected thatwithdrawal liabilities. The revised standard will be effective for the adoptionCompany for fiscal year 2012. The Company currently complies with the disclosure requirements of this update will have a material impact on the Company’s consolidated financial position, results of operations or cash flows.revised standard.
Note 4 – Inventories, net Inventories consisted of the following as of August 31 (in thousands):
| | | | | | | | |
| | | 2010 | | | 2009 | |
Processed and unprocessed scrap metal | | $ | 189,618 | | | $ | 77,607 | |
Semi-finished goods (billets) | | | 5,593 | | | | 9,600 | |
Finished goods | | | 43,352 | | | | 66,936 | |
Supplies | | | 30,639 | | | | 31,581 | |
Inventory reserve | | | (1,099 | ) | | | (1,269 | ) |
| | | | | | | | |
Inventories, net | | $ | 268,103 | | | $ | 184,455 | |
| | | | | | | | |
Schnitzer Steel Industries, Inc. Form 10-K 2010 / 57
SCHNITZER STEEL INDUSTRIES, INC.
NOTES TO THE CONSOLIDATED FINANCIAL STATEMENTS
|
| | | | | | | |
| | 2011 | | 2010 |
| Processed and unprocessed scrap metal | $ | 241,093 |
| | $ | 189,618 |
|
| Semi-finished goods (billets) | 9,237 |
| | 5,593 |
|
| Finished goods | 54,395 |
| | 43,352 |
|
| Supplies | 30,395 |
| | 29,540 |
|
| Inventories, net | $ | 335,120 |
| | $ | 268,103 |
|
Note 5 – Property, Plant and Equipment, net Property, plant and equipment, net consisted of the following as of August 31 (in thousands):
| | | | | | | | |
| | | 2010 | | | 2009 | |
Machinery and equipment | | $ | 533,373 | | | $ | 507,651 | |
Land and improvements | | | 190,673 | | | | 183,979 | |
Buildings and leasehold improvements | | | 62,663 | | | | 64,656 | |
Office equipment | | | 32,380 | | | | 31,850 | |
ERP systems | | | 13,773 | | | | 13,761 | |
Construction in progress | | | 39,039 | | | | 11,100 | |
| | | | | | | | |
| | | 871,901 | | | | 812,997 | |
Less: accumulated depreciation | | | (411,091 | ) | | | (365,769 | ) |
| | | | | | | | |
Property, plant and equipment, net | | $ | 460,810 | | | $ | 447,228 | |
| | | | | | | | |
|
| | | | | | | |
| | 2011 | | 2010 |
| Machinery and equipment | $ | 640,573 |
| | $ | 533,373 |
|
| Land and improvements | 216,230 |
| | 190,673 |
|
| Buildings and leasehold improvements | 85,131 |
| | 62,663 |
|
| Office equipment | 40,580 |
| | 32,380 |
|
| ERP systems | 14,087 |
| | 13,773 |
|
| Construction in progress | 29,988 |
| | 39,039 |
|
| Property, plant and equipment, gross | 1,026,589 |
| | 871,901 |
|
| Less: accumulated depreciation | (471,305 | ) | | (411,091 | ) |
| Property, plant and equipment, net | $ | 555,284 |
| | $ | 460,810 |
|
Depreciation expense for property, plant and equipment, which includes amortization of assets under capital leases, was $57$68 million $56, $57 million and $48$56 million for the years ended August 31, 2010, 2009 and 2008, respectively.Note 6 – Investment in and Advances to Joint Ventures
As of August 31, 2010, the Company had five joint venture interests which were accounted for under the equity method of accounting and presented as part of the MRB operations.
The following tables present summarized unaudited financial information for the Company’s joint ventures in which the Company was a partner (in thousands):
| | | | | | | | | | | | |
| | | | | | August 31, | |
| | | | | | 2010 | | | 2009 | |
Current assets | | | | | | $ | 27,569 | | | $ | 20,685 | |
Non-current assets | | | | | | | 14,971 | | | | 17,299 | |
| | | | | | | | | | | | |
Total assets | | | | | | $ | 42,540 | | | $ | 37,984 | |
| | | | | | | | | | | | |
Current liabilities | | | | | | $ | 10,727 | | | $ | 9,273 | |
Non-current liabilities | | | | | | | 1,610 | | | | 1,908 | |
Partners’ equity | | | | | | | 30,203 | | | | 26,803 | |
| | | | | | | | | | | | |
Total liabilities and partners’ equity | | | | | | $ | 42,540 | | | $ | 37,984 | |
| | | | | | | | | | | | |
| |
| | | Year Ended August 31, | |
| | | 2010 | | | 2009 | | | 2008 | |
Revenues | | $ | 63,610 | | | $ | 53,907 | | | $ | 105,952 | |
Operating income | | $ | 5,765 | | | $ | 2,266 | | | $ | 24,707 | |
Net income | | $ | 6,259 | | | $ | 2,532 | | | $ | 25,113 | |
The Company’s investment in equity method joint venture investments has resulted in cumulative undistributed earnings of $12 million and $9 million as of August 31,2011, 2010 and 2009 respectively, that are included as a part of partners’ equity of the joint ventures.
, respectively. Note 76 – Business CombinationsOn September 1, 2009,
During fiscal 2011, the Company adoptedmade the revised accounting standard for business combinations issued by the FASB in December 2007. This standard requires the Company to recognize the assets acquired, the liabilities assumed, and any noncontrolling interest in the acquiree at the acquisition date, measured at their fair values as of that date and requires acquisition costs to be expensed as incurred.58 / Schnitzer Steel Industries, Inc. Form 10-K 2010following acquisitions:
SCHNITZER STEEL INDUSTRIES, INC.
NOTES TO THE CONSOLIDATED FINANCIAL STATEMENTS
During the year ended August 31, 2010, the Company spent $41 million to acquire six self-service used auto parts stores and a metals recycler. These acquisitions were as follows:
In October 2009, the Company acquired four self-service used auto parts stores located near MRB’s export facility in Portland, Oregon. This acquisition represented the Company’s first used auto parts operations in the Pacific Northwest.
In JanuarySeptember 2010, the Company acquired two self-service used auto parts stores, which increased to foursubstantially all of the numberassets of used auto parts stores that the Company operates in the Dallas-Fort Worth Metroplex.
In April 2010, the Company acquiredSOS Metals Island Recycling, LLC, a metals recycler in MontanaMaui, Hawaii, to provide an additional source of scrap metal for the MRB Hawaii facility.
In November 2010, the Company acquired substantially all of the assets utilized by Specialized Parts Planet, Inc. at its Stockton, California used auto parts facility, which expanded APB’s presence in the Western U.S.
In December 2010, the Company acquired substantially all of the assets of Waco U-Pull It, Inc., a used auto parts store in Waco, Texas, which expanded APB’s presence in the Southwestern U.S.
In December 2010, the Company acquired substantially all of the assets of Macon Iron & Paper Stock Co., a metals recycler with two yards in Macon, Georgia, which expanded MRB’s presence in the Southeastern U.S.
52 / Schnitzer Steel Industries, Inc. Form 10-K 2011
SCHNITZER STEEL INDUSTRIES, INC.
NOTES TO THE CONSOLIDATED FINANCIAL STATEMENTS
In December 2010, the Company acquired substantially all of the assets of Steel Pacific Recycling Inc., a metals recycler with six yards on Vancouver Island, British Columbia, Canada, that previously supplied ferrous scrap to MRB’s Tacoma, Washington export facility.
For each This acquisition marked MRB’s initial expansion into Canada.
In January 2011, the Company acquired substantially all of the assets of State Line Scrap Co., Inc., a metals recycler with one yard in Attleboro, Massachusetts, which expanded MRB’s presence in the Northeastern U.S.
In January 2011, the Company acquired substantially all of the mobile car crushing assets of Northwest Recycling, Inc., based in Portland, Oregon, which provides scrap metal for MRB’s Portland, Oregon facility.
In February 2011, the Company acquired substantially all of the assets of Ferrill’s Auto Parts, Inc., a used auto parts business with three stores in Seattle, Washington, which expanded APB’s presence in the Northwestern U.S.
In March 2011, the Company acquired substantially all of the metals recycling business assets of Amix Salvage & Sales Ltd., which operated four metals recycling yards in British Columbia, Canada and two metals recycling yards in Alberta, Canada that previously supplied ferrous scrap to MRB’s Tacoma, Washington facility. This acquisition expanded MRB’s presence in Western Canada. As part of the consideration paid, the Company issued the seller common shares equal to 20% of the issued and outstanding capital stock of the Company’s acquisition subsidiary.
In April 2011, the Company acquired substantially all of the assets of American Metal Group, Inc. and certain of its affiliates, a metals recycler with yards in San Jose and Santa Clara, California that previously supplied ferrous scrap to MRB’s Oakland, California facility. This acquisition expanded MRB’s presence in the Western U.S.
The total purchase price of $314 million, comprising $293 million in cash and $21 million in non-cash consideration ($19 million in shares of a subsidiary and $2 million in contingent consideration) for the acquisitions in fiscal 2011, was allocated to tangible and identifiable intangible assets acquired and liabilities assumed based on their respective estimated fair values on the date of acquisition. The excess of the aggregate purchase pricesprice over the fair value of the identifiable net assets acquired of $27$246 million for the year ended August 31, 2011 was recorded as goodwill, of which$232 million is expected to be deductible for tax purposes.The acquisitions completed in fiscal 2010 were not material, individually or in the aggregate, to the Company’s financial position or results of operations. Pro forma operating results for the fiscal 2010 acquisitions are not presented, since the aggregate results would not be significantly different than reported results.
During the year ended August 31, 2009, the Company acquired the following:
In December 2008, the Company acquired a metals recycler in Washington to provide an additional source of scrap metal for MRB’s Tacoma, Washington export facility.
In February 2009, the Company acquired a metals recycler in Puerto Rico. This acquisition expanded the Company’s presence into a new region, increased the Company’s processing capability and provided new sources of scrap metal and access to international export facilities.
In February 2009, the Company acquired an additional 16.66% equity interest in an auto parts business located in California, and in April 2009 acquired the remaining 8.34% minority equity interest in this business, thus increasing the Company’s equity ownership in this business to 100%. The acquired equity was previously consolidated into the Company’s financial statements because the Company maintained operating control over the entity.
In February 2009, the Company acquired a self-service used auto parts business with two locations in California. This acquisition strengthened the Company’s presence in Northern California.
In March 2009, the Company acquired a metals recycler in Nevada to provide an additional source of scrap metal for MRB’s Oakland, California export facility.
For each acquisition the purchase price was allocated to tangible and identifiable intangible assets acquired and liabilities assumed based on their respective estimated fair values on the date of acquisition. The excess of the aggregate purchase prices over the fair value of the identifiable net assets acquired of $61 million was recorded as goodwill, of which $14 million is expected to be deductible for tax purposes.
Schnitzer Steel Industries, Inc. Form 10-K 2010 / 59
SCHNITZER STEEL INDUSTRIES, INC.
NOTES TO THE CONSOLIDATED FINANCIAL STATEMENTS
The following is a summary of the aggregate fair values of assets acquired and liabilities assumed for acquisitions completed during the year ended August 31, 2009 (in thousands):
| | | | |
Assets: | | | | |
Cash and cash equivalents | | $ | 336 | |
Accounts receivable | | | 935 | |
Inventories, net | | | 5,185 | |
Prepaid expenses and other current assets | | | 934 | |
Deferred income taxes | | | 456 | |
Property, plant and equipment, net | | | 23,466 | |
Intangibles, net | | | 8,974 | |
Other assets | | | 2,065 | |
Goodwill | | | 60,853 | |
Liabilities: | | | | |
Other accrued liabilities | | | (1,097 | ) |
Environmental liabilities | | | (2,290 | ) |
Other long-term liabilities | | | (1,837 | ) |
Deferred income taxes | | | (1,487 | ) |
| | | | |
Aggregate purchase price | | | 96,493 | |
Less: Amounts to be paid | | | (3,104 | ) |
Less: Cash received | | | (336 | ) |
| | | | |
Net cash paid | | $ | 93,053 | |
| | | | |
The following table presents the intangible assets associated with the acquisitions completed during the year ended August 31, 2009 (dollars in thousands):
| | | | | | |
| | | Life
In Years | | Gross
Carrying
Amount | |
Tradename | | 1 | | $ | 76 | |
Employment agreements | | 2 | | | 1,117 | |
Covenants not to compete | | 5 – 20 | | | 5,646 | |
Permit and licenses | | 3 | | | 80 | |
Supply contracts | | 6 | | | 2,055 | |
| | | | | | |
| | | | $ | 8,974 | |
| | | | | | |
The following unaudited pro forma summary presents the effect on the consolidated financial results of the Company of the businesses acquired during the year ended
August 31, 20092011 as though the businesses had been acquired as of the beginning of the years ended August 31fiscal 2010 (in thousands): | | | | | | | | |
| | | 2009 | | | 2008 | |
Revenues | | $ | 1,794,139 | | | $ | 3,597,062 | |
Operating income (loss) | | $ | (54,276 | ) | | $ | 429,792 | |
Net income (loss) | | $ | (35,091 | ) | | $ | 271,684 | |
Net income (loss) per share – basic | | $ | (1.24 | ) | | $ | 9.60 | |
Net income (loss) per share – diluted | | $ | (1.24 | ) | | $ | 9.41 | |
60 / Schnitzer Steel Industries, Inc. Form 10-K 2010
SCHNITZER STEEL INDUSTRIES, INC.
NOTES TO THE CONSOLIDATED FINANCIAL STATEMENTS
|
| | | | | | | |
| | 2011 | | 2010 |
| Revenues | $ | 3,539,677 |
| | $ | 2,466,547 |
|
Operating income(1) | $ | 204,613 |
| | $ | 149,328 |
|
Net income(1) | $ | 134,921 |
| | $ | 82,481 |
|
Net income attributable to SSI(1) | $ | 127,954 |
| | $ | 78,106 |
|
_____________________________
| |
| (1) | Excludes nonrecurring executive compensation paid to the management of acquired companies that will not be incurred in the future. |
These pro forma results are not necessarily indicative of what actual results would have been had these acquisitions occurred for the periods presented. In addition, the pro forma results are not intended to be a projection of future results and do not reflect any synergies that may be achieved from combining operations.
During
Since the year ended dates of the acquisitions, the acquired operations generated aggregate revenues from sales to third parties of $93 million and operating income of $10 million through August 31, 2008,2011 excluding the benefits realized by our geographically proximate export facilities from integrating the acquired businesses with our existing operations.
During fiscal 2010, the Company made the following acquisitions:
In October 2009, the Company acquired substantially all of the following:In September 2007, the Company acquired a mobile metals recycling business that provides additional sourcesassets of scrap metal to MRB’s Everett, Massachusetts facility.
In November 2007, the Company acquired two metals recycling businesses and in February 2008 the Company acquired one metals recycling business that expanded the Company’s presence in the Southeastern US.
In February 2008, the Company acquired the remaining 50% equity interest in an auto parts business located in Nevada in exchange for its 50% interest in the land and buildings, owned by the entity. The acquired business was previously consolidated into the Company’s financial statements because the Company maintained operating control over the entity.
In August 2008, the Company acquired afour of LKQ Corporation’s self-service used auto parts business with three locationsstores located near MRB’s export facility in Portland, Oregon. This acquisition represented the Company’s first used auto parts operations in the Southeastern US.
Pacific Northwest. In January 2010, the Company acquired substantially all of the assets of two of LKQ Corporation’s self-service used auto parts stores, which increased to four the number of used auto parts stores that the Company operates in the Dallas-Fort Worth Metroplex.
In April 2010, the Company acquired substantially all of the assets of Golden Recycling and Salvage, Inc., a
53 / Schnitzer Steel Industries, Inc. Form 10-K 2011
SCHNITZER STEEL INDUSTRIES, INC.
NOTES TO THE CONSOLIDATED FINANCIAL STATEMENTS
metals recycler in Montana, to provide an additional source of scrap metal for MRB’s Tacoma, Washington export facility.
The total purchase price of $41 million in cash for the acquisitions in fiscal 2010 was allocated to tangible and identifiable intangible assets acquired and liabilities assumed based on their respective estimated fair values on the date of acquisition. The excess of the aggregate purchase price over the fair value of the identifiable net assets acquired of $27 million was recorded as goodwill, which is expected to be deductible for tax purposes.
The acquisitions completed in fiscal
20082010 were not material, individually or in the aggregate, to the Company’s financial position or results of operations. Pro forma operating results for the fiscal
20082010 acquisitions are not presented, since the aggregate results would not be significantly different than reported results.
During fiscal 2009, the Company made the following acquisitions:
In December 2008, the Company acquired substantially all of the assets of Arrow Metals Corporation, a metals recycler in Washington, to provide an additional source of scrap metal for MRB’s Tacoma, Washington export facility.
In February 2009, the Company acquired Ponce Resources, Inc., the leading metals recycler in Puerto Rico. This acquisition expanded the Company’s presence into a new region, increased the Company’s processing capability and provided new sources of scrap metal and access to international export facilities.
In February 2009, the Company acquired an additional 16.66% equity interest in an auto parts business located in California, and in April 2009 acquired the remaining 8.34% minority equity interest in this business, thus increasing the Company’s equity ownership in this business to 100%. The acquired equity was previously consolidated into the Company’s financial statements because the Company maintained operating control over the entity.
In February 2009, the Company acquired substantially all of the assets of two self-service used auto parts businesses in California operated by Specialized Parts Planet, Inc., thereby strengthening the Company’s presence in Northern California.
In March 2009, the Company acquired substantially all of the assets of Solid Waste Reduction Services, Inc., a metals recycler in Nevada, to provide an additional source of scrap metal for MRB’s Oakland, California export facility.
The total purchase price of $96 million (comprising $93 million in cash and $3 million in notes payable) for the acquisitions in fiscal 2009 was allocated to tangible and identifiable intangible assets acquired and liabilities assumed based on their respective estimated fair values on the date of acquisition. The excess of the aggregate purchase prices over the fair value of the identifiable net assets acquired of $61 million was recorded as goodwill, of which $14 million is expected to be deductible for tax purposes.
The following unaudited pro forma summary presents the effect on the consolidated financial results of the Company of the businesses acquired during the year ended August 31, 2009 as though the businesses had been acquired as of the beginning of fiscal 2008 (in thousands):
|
| | | | | | | |
| | 2009 | | 2008 |
| Revenues | $ | 1,794,139 |
| | $ | 3,597,062 |
|
| Operating income (loss) | $ | (54,276 | ) | | $ | 429,792 |
|
| Net income (loss) | $ | (34,225 | ) | | $ | 277,041 |
|
| Net income (loss) attributable to SSI | $ | (35,091 | ) | | $ | 271,684 |
|
These pro forma results are not necessarily indicative of what actual results would have been had these acquisitions occurred for the periods presented. In addition, the pro forma results are not intended to be a projection of future results and do not reflect any synergies that may be achieved from combining operations.
54 / Schnitzer Steel Industries, Inc. Form 10-K 2011
SCHNITZER STEEL INDUSTRIES, INC.
NOTES TO THE CONSOLIDATED FINANCIAL STATEMENTS
The following is a summary of the aggregate fair values of assets acquired and liabilities assumed for acquisitions completed during the years ended August 31 (in thousands):
|
| | | | | | | |
| Assets: | 2011 | | 2009 |
| Cash and cash equivalents | $ | 285 |
| | $ | 336 |
|
| Accounts receivable | 5,490 |
| | 935 |
|
| Inventories | 21,988 |
| | 5,185 |
|
| Prepaid expenses and other current assets | 777 |
| | 934 |
|
| Deferred tax assets | 830 |
| | 456 |
|
| Property, plant and equipment | 59,065 |
| | 23,466 |
|
| Intangible assets | 7,182 |
| | 8,974 |
|
| Other assets | 16 |
| | 2,065 |
|
| Goodwill | 245,894 |
| | 60,853 |
|
| Liabilities: | | | |
| Short-term liabilities | (22,291 | ) | | (1,097 | ) |
| Environmental liabilities | (1,069 | ) | | (2,290 | ) |
| Long-term debt and capital lease obligations | (1,224 | ) | | (1,837 | ) |
| Deferred tax liability - long-term | (2,467 | ) | | (1,487 | ) |
Net assets acquired(1) | $ | 314,476 |
| | $ | 96,493 |
|
_____________________________
| |
(1) | The acquisitions completed in fiscal 2010 were not material, individually or in the aggregate, to the Company’s financial position or results of operations. |
The following table presents the fair value of intangible assets acquired with the acquisitions completed during the year ended August 31, 2011 (dollars in thousands):
|
| | | | | |
| | Weighted Average Life In Years | | Gross Carrying Amount |
| Covenants not to compete | 4.8 | | $ | 6,062 |
|
Other intangible assets subject to amortization(1) | 1.5 | | 863 |
|
Indefinite-lived intangible assets(2) | Indefinite | | 257 |
|
| Total | 4.4 | | $ | 7,182 |
|
_____________________________
| |
(1) | Other intangible assets subject to amortization include supply contracts, permits and licenses and leasehold interests. |
| |
| (2) | Indefinite-lived intangible assets include tradenames and real property options. |
The following table presents the intangible assets associated with the acquisitions completed during the year ended August 31, 2009 (dollars in thousands):
|
| | | | | |
| | Weighted Average Life In Years | | Gross Carrying Amount |
| Covenants not to compete | 18.0 | | $ | 5,646 |
|
Other intangible assets subject to amortization(1) | 4.5 | | 3,328 |
|
| Total | 13.0 | | $ | 8,974 |
|
_____________________________
| |
| (1) | Other intangible assets subject to amortization include tradenames, employment agreements, permits and licenses and supply contracts. |
The Company paid a premium (i.e., goodwill) over the fair value of the net tangible and identified
intangible assets acquired in the transactions described above for a number of reasons, including but not limited to the following:
The Company will benefit from the assets and capabilities of these acquisitions, including additional resources, skills and industry expertise;
The acquired businesses enhanceincrease the Company’s regional market position;presence in new and
existing regions; andThe Company anticipates cost savings, efficiencies and synergies.
55 / Schnitzer Steel Industries, Inc. Form 10-K 2011
SCHNITZER STEEL INDUSTRIES, INC.
NOTES TO THE CONSOLIDATED FINANCIAL STATEMENTS
Note 87 – Discontinued Operations In October 2009, the Company sold its full-service used auto parts operation, which had been operated as part of the APB reporting segment.segment, for proceeds of $41 million. The Company concluded that the divestiture met the definition of a discontinued operation. Accordingly, the results of this discontinued operation have been reclassified for all periods presented. The sale resulted in a loss of $15$15 million, net of tax, and included the write-off of $12$12 million of goodwill that was allocated to the full-service operation from the APB reporting segment. Operating results of the discontinued operations are summarized below. Operating results in fiscal 2011 were not material. The amounts exclude general corporate overhead previously allocated to the full-service used auto parts operation. | | | | | | | | | | | | |
| | | Year Ended August 31, | |
| (In thousands) | | 2010 | | | 2009 | | | 2008 | |
Revenues | | $ | 9,991 | | | $ | 112,996 | | | $ | 124,600 | |
| | | | | | | | | | | | |
Gain (loss) from discontinued operations before income taxes | | $ | 761 | | | $ | (6,484 | ) | | $ | (943 | ) |
Loss on sale of full-service operation, including adjustments | | | (16,468 | ) | | | 0 | | | | 0 | |
Income tax benefit | | | 1,875 | | | | 2,270 | | | | 330 | |
| | | | | | | | | | | | |
Loss from discontinued operations, net of tax | | $ | (13,832 | ) | | $ | (4,214 | ) | | $ | (613 | ) |
| | | | | | | | | | | | |
Schnitzer Steel Industries, Inc. Form 10-K 2010 / 61
SCHNITZER STEEL INDUSTRIES, INC.
NOTES TO THE CONSOLIDATED FINANCIAL STATEMENTS
Assets and liabilities of discontinued operations consisted of the following as of August 31, 2009 (in thousands):
| | | | |
Current assets | | $ | 41,670 | |
Noncurrent assets | | $ | 8,538 | |
Current liabilities | | $ | 8,740 | |
Noncurrent liabilities | | $ | 5,167 | |
|
| | | | | | | |
| | Year Ended August 31, |
| (In thousands) | 2010 | | 2009 |
| Revenues | $ | 9,991 |
| | $ | 112,996 |
|
| Income (loss) from discontinued operations before income taxes | $ | 761 |
| | $ | (6,484 | ) |
| Loss on sale of full-service operation, including adjustments | (16,468 | ) | | — |
|
| Income tax benefit | 1,875 |
| | 2,270 |
|
| Loss from discontinued operations, net of tax | $ | (13,832 | ) | | $ | (4,214 | ) |
Note 98 – Goodwill and Other Intangible Assets, net In the second quarter of fiscal 2011, the Company performed its annual goodwill impairment testing by comparing the fair value of each reporting unit with its carrying value, including goodwill. As a result of this testing, the Company determined that the fair value of each reporting unit was substantially in excess of its respective carrying value and each reporting unit’s goodwill balance and indefinite-lived intangible assets were not impaired as of February 28, 2011. There were no triggering events during the remainder of fiscal 2011 that required a goodwill impairment test. There are no accumulated goodwill impairment charges as of August 31, 2011.
The gross changes in the carrying amount of goodwill by reporting segment for the years ended August 31, 20102011 and 20092010 were as follows (in thousands): | | | | | | | | | | | | |
| | | MRB | | | APB | | | Total | |
Balance as of August 31, 2008 | | $ | 170,202 | | | $ | 135,984 | | | $ | 306,186 | |
Acquisitions | | | 58,775 | | | | 2,078 | | | | 60,853 | |
Foreign currency translation adjustment | | | 0 | | | | (480 | ) | | | (480 | ) |
| | | | | | | | | | | | |
Balance as of August 31, 2009 | | | 228,977 | | | | 137,582 | | | | 366,559 | |
Acquisitions | | | 3,091 | | | | 23,927 | | | | 27,018 | |
Divestitures | | | 0 | | | | (12,030 | ) | | | (12,030 | ) |
Purchase accounting adjustments | | | (1,870 | ) | | | 204 | | | | (1,666 | ) |
Foreign currency translation adjustment | | | 0 | | | | 451 | | | | 451 | |
| | | | | | | | | | | | |
Balance as of August 31, 2010 | | $ | 230,198 | | | $ | 150,134 | | | $ | 380,332 | |
| | | | | | | | | | | | |
|
| | | | | | | | | | | |
| | MRB | | APB | | Total |
| Balance as of August 31, 2009 | $ | 228,977 |
| | $ | 137,582 |
| | $ | 366,559 |
|
| Acquisitions | 3,091 |
| | 23,927 |
| | 27,018 |
|
| Divestitures | — |
| | (12,030 | ) | | (12,030 | ) |
| Purchase accounting adjustments | (1,870 | ) | | 204 |
| | (1,666 | ) |
| Foreign currency translation adjustment | — |
| | 451 |
| | 451 |
|
| Balance as of August 31, 2010 | 230,198 |
| | 150,134 |
| | 380,332 |
|
| Acquisitions | 232,341 |
| | 11,583 |
| | 243,924 |
|
| Purchase accounting adjustments | 1,086 |
| | (51 | ) | | 1,035 |
|
| Foreign currency translation adjustment | 1,021 |
| | 1,493 |
| | 2,514 |
|
| Balance as of August 31, 2011 | $ | 464,646 |
| | $ | 163,159 |
| | $ | 627,805 |
|
56 / Schnitzer Steel Industries, Inc. Form 10-K 2011
SCHNITZER STEEL INDUSTRIES, INC.
NOTES TO THE CONSOLIDATED FINANCIAL STATEMENTS
The following table presents the Company’s intangible assets
and their related lives as of August 31
(dollars in(in thousands):
| | | | | | | | | | | | | | | | | | | | |
| | | Life In
Years | | | 2010 | | | 2009 | |
| | | Gross
Carrying
Amount | | | Accumulated
Amortization | | | Gross
Carrying
Amount | | | Accumulated
Amortization | |
Identifiable intangibles: | | | | | | | | | | | | | | | | | | | | |
Tradename | | | Indefinite | | | $ | 750 | | | $ | 0 | | | $ | 750 | | | $ | 0 | |
Tradename | | | 20 | | | | 0 | | | | 0 | | | | 972 | | | | (227 | ) |
Tradename | | | 1 – 6 | | | | 583 | | | | (423 | ) | | | 583 | | | | (275 | ) |
Marketing agreement | | | 5 | | | | 563 | | | | (159 | ) | | | 0 | | | | 0 | |
Employment agreements | | | 2 | | | | 1,117 | | | | (884 | ) | | | 1,117 | | | | (326 | ) |
Covenants not to compete | | | 3 – 20 | | | | 27,797 | | | | (13,329 | ) | | | 22,782 | | | | (9,949 | ) |
Leasehold interests | | | 4 – 25 | | | | 862 | | | | (266 | ) | | | 1,550 | | | | (540 | ) |
Lease termination fee | | | 15 | | | | 200 | | | | (200 | ) | | | 200 | | | | (191 | ) |
Permits and licenses | | | 3 – 9 | | | | 780 | | | | (54 | ) | | | 80 | | | | (13 | ) |
Supply contracts | | | Indefinite | | | | 361 | | | | 0 | | | | 361 | | | | 0 | |
Supply contracts | | | 5 – 6 | | | | 4,571 | | | | (2,035 | ) | | | 5,269 | | | | (1,931 | ) |
Real property options | | | Indefinite | | | | 210 | | | | 0 | | | | 210 | | | | 0 | |
| | | | | | | | | | | | | | | | | | | | |
Total | | | | | | $ | 37,794 | | | $ | (17,350 | ) | | $ | 33,874 | | | $ | (13,452 | ) |
| | | | | | | | | | | | | | | | | | | | |
|
| | | | | | | | | | | | | | | |
| | 2011 | | 2010 |
Gross Carrying Amount | | Accumulated Amortization | | Gross Carrying Amount | | Accumulated Amortization |
| Covenants not to compete | $ | 30,831 |
| | $ | (15,254 | ) | | $ | 27,797 |
| | $ | (13,329 | ) |
| Supply contracts | 5,274 |
| | (3,376 | ) | | 4,571 |
| | (2,035 | ) |
Other intangible assets subject to amortization(1) | 4,392 |
| | (2,216 | ) | | 3,905 |
| | (1,786 | ) |
Indefinite-lived intangibles(2) | 1,255 |
| | — |
| | 1,321 |
| | — |
|
| Total | $ | 41,752 |
| | $ | (20,846 | ) | | $ | 37,594 |
| | $ | (17,150 | ) |
_____________________________
| |
| (1) | Other intangibles assets subject to amortization include tradenames, marketing agreements, employment agreements, leasehold interests, permits and licenses and real property options. |
| |
| (2) | Indefinite-lived intangibles include tradenames, permits and licenses and real property options. |
The total intangible asset amortization expense for the years ended August 31, 2011, 2010 2009 and 20082009 was $6$7 million $5, $6 million and $4$5 million, respectively.62 / Schnitzer Steel Industries, Inc. Form 10-K 2010
SCHNITZER STEEL INDUSTRIES, INC.
NOTES TO THE CONSOLIDATED FINANCIAL STATEMENTS
The estimated amortization expense, based on current intangible asset balances, during the next five fiscal years and thereafter is as follows (in thousands):
| | | | |
| Years ending August 31, | | Estimated
Amortization
Expense | |
2011 | | $ | 4,603 | |
2012 | | | 3,590 | |
2013 | | | 2,752 | |
2014 | | | 2,258 | |
2015 | | | 767 | |
Thereafter | | | 5,153 | |
| | | | |
| | $ | 19,123 | |
| | | | |
|
| | | |
| Years ending August 31, | Estimated Amortization Expense |
| 2012 | $ | 5,430 |
|
| 2013 | 4,277 |
|
| 2014 | 3,370 |
|
| 2015 | 1,880 |
|
| 2016 | 865 |
|
| Thereafter | 3,829 |
|
| Total | $ | 19,651 |
|
Note 109 – Short-Term Borrowings The Company’s short-term borrowings consist primarily of a one year,Company has an unsecured, uncommitted $25$25 million credit line with Wells Fargo Bank, N.A. that expires on March 1, 2011.2012. Interest rates on outstanding indebtedness under the unsecured line of credit are set by the bank at the time of borrowing. The Company had no borrowings outstanding under this facility as of August 31, 2011 and 2010 or 2009.. The credit agreement contains various representations and warranties, events of default and financial and other covenants, including covenants regarding maintenance of a minimum fixed charge coverage ratio and a maximum leverage ratio. As of August 31, 2010 and 2009, the Company was in compliance with all such covenants.
Note 1110 – Long-Term Debt and Capital Lease Obligations Long-term debt and capital lease obligations consisted of the following as of August 31 (in thousands):
| | | | | | | | |
| | | 2010 | | | 2009 | |
Bank unsecured revolving credit facility, interest at LIBOR plus a spread (0.79% as of August 31, 2010) | | $ | 90,000 | | | $ | 100,000 | |
Tax-exempt economic development revenue bonds due January 2021, interest payable monthly at a variable rate (0.40% as of August 31, 2010), secured by a letter of credit | | | 7,700 | | | | 7,700 | |
Capital lease obligations due through September 2015, interest at rates ranging from 3.40% to 6.37% as of August 31, 2010 | | | 2,084 | | | | 2,674 | |
Other | | | 645 | | | | 1,357 | |
| | | | | | | | |
Total long-term debt | | | 100,429 | | | | 111,731 | |
Less: current maturities | | | (1,189 | ) | | | (1,317 | ) |
| | | | | | | | |
Long-term debt and capital lease obligations, net of current maturities | | $ | 99,240 | | | $ | 110,414 | |
| | | | | | | | |
The
|
| | | | | | | |
| | 2011 | | 2010 |
| Bank unsecured revolving credit facility, interest at LIBOR plus a spread | $ | 393,428 |
| | $ | 90,000 |
|
| Tax-exempt economic development revenue bonds due January 2021, interest payable monthly at a variable rate (0.13% as of August 31, 2011), secured by a letter of credit | 7,700 |
| | 7,700 |
|
| Capital lease obligations due through February 2021, interest at rates ranging from 0.99% to 9.39% as of August 31, 2011 | 2,802 |
| | 2,084 |
|
| Other | — |
| | 645 |
|
| Total long-term debt and capital lease obligations | 403,930 |
| | 100,429 |
|
| Less current maturities | (643 | ) | | (1,189 | ) |
| Long-term debt and capital lease obligations, net of current maturities | $ | 403,287 |
| | $ | 99,240 |
|
57 / Schnitzer Steel Industries, Inc. Form 10-K 2011
SCHNITZER STEEL INDUSTRIES, INC.
NOTES TO THE CONSOLIDATED FINANCIAL STATEMENTS
In February 2011, the Company maintains a $450 million revolving credit facility that matures in July 2012 pursuant to anamended and restated its unsecured committed bank credit agreement with Bank of America, N.A., as administrative agent, and the other lenders party thereto.thereto to increase the amount available to $650 million from $450 million, including $30 million in Canadian Dollar availability. The maturity was also extended to February 2016. Interest rates on outstanding indebtedness under the amended agreement are based, at the Company’s option, on either the London Interbank Offered Rate (or the Canadian equivalent) plus a spread of between 0.50%1.75% and 1.00%2.75%, with the amount of the spread based on a pricing grid tied to the Company’s leverage ratio, or the greater of the prime rate or the federal fundsbase rate plus 0.50%a spread of between 0% and 1%. In addition, annual commitment fees are payable on the unused portion of the credit facility at rates between 0.10%0.25% and 0.25%0.45%, which is based on a pricing grid tied to the Company’s leverage ratio. The Company paid commitment feeshad borrowings outstanding under the credit facility of less than $1$393 million for the years ended and $90 million as of August 31, 2010, 20092011 and 2008.2010, respectively. The weighted average interest rate on amounts outstanding under this facility was 0.79%2.48% and 0.78%0.79% as of August 31, 20102011 and 2009,2010, respectively. The bank credit agreement contains various representations and warranties, events of default and financial and other covenants, including covenants regarding maintenance of a minimum fixed charge coverage ratioSchnitzer Steel Industries, Inc. Form 10-K 2010 / 63
SCHNITZER STEEL INDUSTRIES, INC.
NOTES TO THE CONSOLIDATED FINANCIAL STATEMENTS
and a maximum leverage ratio. As of August 31, 2010 and 2009, the Company was in compliance with all such covenants.
Principal payments on long-term debt and capital lease obligations during the next five fiscal years and thereafter are as follows (in thousands):
| | | | | | | | | | | | |
| Years ending August 31, | | Long-term
Debt | | | Capital
Lease
Obligations | | | Total | |
2011 | | $ | 645 | | | $ | 673 | | | $ | 1,318 | |
2012 | | | 90,000 | | | | 645 | | | | 90,645 | |
2013 | | | 0 | | | | 589 | | | | 589 | |
2014 | | | 0 | | | | 397 | | | | 397 | |
2015 | | | 0 | | | | 90 | | | | 90 | |
Thereafter | | | 7,700 | | | | 2 | | | | 7,702 | |
| | | | | | | | | | | | |
| | | 98,345 | | | | 2,396 | | | | 100,741 | |
Amounts representing interest | | | 0 | | | | (312 | ) | | | (312 | ) |
| | | | | | | | | | | | |
| | $ | 98,345 | | | $ | 2,084 | | | $ | 100,429 | |
| | | | | | | | | | | | |
Letters
|
| | | | | | | | | | | | |
| Years ending August 31, | | Long-Term Debt | | Capital Lease Obligations | | Total |
| 2012 | | $ | — |
| | $ | 859 |
| | $ | 859 |
|
| 2013 | | — |
| | 827 |
| | 827 |
|
| 2014 | | — |
| | 597 |
| | 597 |
|
| 2015 | | — |
| | 279 |
| | 279 |
|
| 2016 | | 393,428 |
| | 187 |
| | 393,615 |
|
| Thereafter | | 7,700 |
| | 762 |
| | 8,462 |
|
| Total | | 401,128 |
| | 3,511 |
| | 404,639 |
|
| Amounts representing interest and executory costs | | — |
| | (709 | ) | | (709 | ) |
| Total less interest | | $ | 401,128 |
| | $ | 2,802 |
| | $ | 403,930 |
|
The Company had outstanding letters of credit totaling $18$18 million were outstanding as of August 31, 2011 and 2010, related to certain obligations, including workers’ compensation and performance bonds.
Note 1211 – Commitments and Contingencies Commitments
CommitmentsThe Company leases a portion of its capital equipment and certain of its facilities under leases that expire at various dates through July 2024. Rent expense was $18$25 million $19, $18 million and $21$19 million for fiscal 2011, 2010 2009 and 2008,2009, respectively. See Note 19 – Related Party Transactions for a discussion of leases with related parties.
The Company’s steel manufacturing operations are exposed to market risk due to variations in the market price of natural gas. As a result, the Company uses derivative instruments, specifically forward purchases, to manage these inherent commodity price risks. SMB has a take-or-pay natural gas contract that expires on May 31, 2011 and obligates it to purchase minimum quantities per day through October 31, 2010, whether or not the amount is utilized.
The fair value of the natural gas contract is determined using a forward price curve based on observable market price quotations at a major natural gas trading hub. Effective for the delivery period from November 1, 2009 through October 31, 2010, the committed rate is $10.99 per million British Thermal Units (“MMBTU”). See Note 14 – Derivative Financial Instruments and Fair Value Measurements for further disclosures.
SMB also has an electricity contract with McMinnville Water and Light that requires a minimum purchase of electricity at a rate subject to variable pricing, whether or not the amount is utilized. The contract expires in September 2011.
64 / Schnitzer Steel Industries, Inc. Form 10-K 2010
SCHNITZER STEEL INDUSTRIES, INC.
NOTES TO THE CONSOLIDATED FINANCIAL STATEMENTS
The table below sets forth the Company’s future minimum obligations under non-cancelable operating leases from unrelated parties, service obligations and purchase commitments as of August 31, 20102011 (in thousands):
| | | | | | | | | | | | |
| Fiscal Year | | Operating
Leases | | Service
Obligations | | Purchase
Commitments | | Total |
2011 | | $ | 14,459 | | $ | 1,399 | | $ | 4,881 | | $ | 20,739 |
2012 | | | 12,476 | | | 418 | | | 890 | | | 13,784 |
2013 | | | 10,350 | | | 83 | | | 0 | | | 10,433 |
2014 | | | 7,628 | | | 30 | | | 0 | | | 7,658 |
2015 | | | 4,012 | | | 30 | | | 0 | | | 4,042 |
Thereafter | | | 4,965 | | | 0 | | | 0 | | | 4,965 |
| | | | | | | | | | | | |
Total | | $ | 53,890 | | $ | 1,960 | | $ | 5,771 | | $ | 61,621 |
| | | | | | | | | | | | |
|
| | | | |
| Years ending August 31, | | Operating Leases |
| 2012 | | $ | 20,434 |
|
| 2013 | | 18,116 |
|
| 2014 | | 15,383 |
|
| 2015 | | 11,092 |
|
| 2016 | | 5,975 |
|
| Thereafter | | 20,146 |
|
| Total | | $ | 91,146 |
|
Contingencies – Environmental
The Company evaluates the adequacy of its reserves for environmental liabilities on a quarterly basis in accordance with Company policy. Adjustments to the liabilitiespolicy and adjustments are made when additional information becomes available that affects the estimated costs to study or
58 / Schnitzer Steel Industries, Inc. Form 10-K 2011
SCHNITZER STEEL INDUSTRIES, INC.
NOTES TO THE CONSOLIDATED FINANCIAL STATEMENTS
remediate any environmental issues or expenditures are made for which reserves were established.
Changes in the Company’s reserves for environmental liabilities for the years ended August 31, 20102011 and 20092010 were as follows (in thousands): | | | | | | | | | | | | | | | | | | | | | | | | | | | | | | | |
Reporting
Segment | | Balance
9/1/2008 | | Reserves
Released,
Net(1) | | | Payments | | | Ending
Balance
8/31/2009 | | Reserves
Established
(Released),
Net(2) | | | Payments | | | Ending
Balance
8/31/2010 | | Short-Term | | Long-Term |
Metals Recycling Business | | $ | 26,704 | | $ | (519 | ) | | $ | (577 | ) | | $ | 25,608 | | $ | 710 | | | $ | (944 | ) | | $ | 25,374 | | $ | 2,034 | | $ | 23,340 |
Auto Parts Business | | | 17,000 | | | (700 | ) | | | 0 | | | | 16,300 | | | (1,800 | ) | | | 0 | | | | 14,500 | | | 554 | | | 13,946 |
| | | | | | | | | | | | | | | | | | | | | | | | | | | | | | | |
Total | | $ | 43,704 | | $ | (1,219 | ) | | $ | (577 | ) | | $ | 41,908 | | $ | (1,090 | ) | | $ | (944 | ) | | $ | 39,874 | | $ | 2,588 | | $ | 37,286 |
| | | | | | | | | | | | | | | | | | | | | | | | | | | | | | | |
|
| | | | | | | | | | | | | | | | | | | | | | | | | | | | | | | | | | | |
Reporting Segment | Balance 9/1/2009 |
| | Reserves Established (Released), Net(1) | | Payments | | Ending Balance 8/31/2010 |
| | Reserves Established (Released), Net(2) | | Payments | | Ending Balance 8/31/2011 |
| | Short-Term | | Long-Term |
| Metals Recycling Business | $ | 25,608 |
| | $ | 710 |
| | $ | (944 | ) | | $ | 25,374 |
| | $ | 1,040 |
| | $ | (759 | ) | | $ | 25,655 |
| | $ | 2,429 |
| | $ | 23,226 |
|
| Auto Parts Business | 16,300 |
| | (1,800 | ) | | — |
| | 14,500 |
| | 700 |
| | — |
| | 15,200 |
| | 554 |
| | 14,646 |
|
| Total | $ | 41,908 |
| | $ | (1,090 | ) | | $ | (944 | ) | | $ | 39,874 |
| | $ | 1,740 |
| | $ | (759 | ) | | $ | 40,855 |
| | $ | 2,983 |
| | $ | 37,872 |
|
_____________________________
| |
| (1) | During fiscal 2009,2010, the Company released $4$2 million in environmental reserves, primarily related to the resolution of the Hylebos Waterway litigation, which was partially offset by $2 million in environmental liabilities recorded in purchase accounting related to acquisitions completed in fiscal 2009 and $1 million in new reserves. |
(2) | During fiscal 2010, the Company released $2 million in environmental reserves through discontinued operations related to the full-service auto parts operation, which was partially offset by $1$1 million in environmental liabilities recorded in purchase accounting.
|
| |
| (2) | During fiscal 2011, the Company recorded $1 million in environmental liabilities in purchase accounting related to acquisitions completed in fiscal 2011. |
Metals Recycling Business
As of August 31, 2010,2011, MRB had environmental reserves of $25$26 million for the potential remediation of locations where it has conducted business andor has environmental liabilities from historical or recent activities.
In December 2000, the Company
has beenwas notified by the
USUnited States Environmental Protection Agency (“EPA”) under the Comprehensive Environmental Response, Compensation and Liability Act (“CERCLA”) that it is one of
at least 100the potentially responsible parties (“PRPs”) that own or operate or formerly owned or operated sites
which are part of or adjacent to the Portland Harbor Superfund site (the “Site”). The precise nature and extent of any cleanup of the Site, the parties to be involved, the process to be followed for any cleanup and the allocation of the costs for any cleanup among responsible parties have not yet been determined, but the process of identifying additional PRPs and beginning allocation of costs is underway.
The EPA has indicated that it expects to issue a record of decision that will discuss remedial alternatives for the Site sometime in 2013. It is unclear to what extent the Company will be liable for environmental costs or natural resource damage claims or third party contribution or damage claims with respect to the Site. While the Company participated in certain
Schnitzer Steel Industries, Inc. Form 10-K 2010 / 65
SCHNITZER STEEL INDUSTRIES, INC.
NOTES TO THE CONSOLIDATED FINANCIAL STATEMENTS
preliminary Site study efforts, it is not party to the consent order entered into by the EPA with certain other PRPs, referred to as the “Lower Willamette Group” (“LWG”), for a remedial investigation/feasibility study (“RI/FS”).
During fiscal 2007, the Company and certain other parties agreed to an interim settlement with the LWG under which the Company made a cash contribution to the LWG RI/FS. The Company has also joined with more than 80 other PRPs, including the LWG, in a voluntary process to establish an allocation of costs at the Site. These parties have selected an allocation team and are finalizingfinalized an allocation process design agreement. The LWG has also commenced federal court litigation, which has been stayed, seeking to bring additional parties into the allocation process. In January 2008, the Natural Resource Damages Trustee Council (“Trustees”) for Portland Harbor invited the Company and other PRPs to participate in funding and implementing the Natural Resource Injury Assessment for the Site. Following meetings among the Trustees and the PRPs, a funding and participation agreement was negotiated under which the participating PRPs agreed to fund the first phase of
the natural resource damage assessment. The Company joined in that
Phase I agreement and paid a portion of those costs. The Company did not participate in funding the second phase of the natural resource damage assessment.
The cost of the investigations and any remediation associated with the Site will not be reasonably estimable until completion of the data review and further investigations now being conducted by the LWG and the Trustees and the selection and approval of a remedy by the EPA. However, given the size of the Site and the nature of the conditions identified to date, the total cost of the investigations and remediation is likely to be substantial. In addition, because there has not been a determination of the total cost of the investigations, the remediation that will be required, the amount of natural resource damages or how the costs of the ongoing investigations and any remedy and natural resource damages will be allocated among the PRPs, it is not possible to estimate the costs which the Company might incur in connection with the Site, although such costs could be material to the Company’s financial position, or results of operations.operations, cash flows or liquidity. The Company has insurance policies that we believeit believes will provide reimbursement for costs we incurit incurs for defense and remediation in connection with the Site, although there is no assurance that those
59 / Schnitzer Steel Industries, Inc. Form 10-K 2011
SCHNITZER STEEL INDUSTRIES, INC.
NOTES TO THE CONSOLIDATED FINANCIAL STATEMENTS
policies will cover all of the costs which wethe Company may incur. In fiscal 2006, the Company recorded a liability for its then estimated share of the costs of the investigation incurred by the LWG to date. As of August 31, 20102011 and 2009,2010, the Company’s reserve for third party investigation costs of the Site was $1 million.$1 million. The Oregon Department of Environmental Quality is separately providing oversight of voluntary
investigationinvestigations by the Company involving the Company’s sites adjacent to the Portland Harbor which are focused on controlling any current “uplands” releases of contaminants into the Willamette River. No reserves have been established in connection with these investigations because the extent of contamination (if any) and the Company’s responsibility for the contamination (if any) has not yet been determined.
Other Metals Recycling Business Sites
As of August 31, 2010,2011, the Company had environmental reserves related to various MRB sites other than Portland Harbor of $24 million.$25 million. The reserves, which range in amounts from less than $1up to $2 million to $2 million per site, relate to the potential future remediation of soil contamination, groundwater contamination and storm water runoff issues. No material environmental compliance enforcement proceedings are currently pending related to these sites.
As of August 31, 2010,2011, the Company had environmental reserves related to various APB sites of $15 million.$15 million. The reserves, which range in amounts from less than $1up to $2 million to $2 million per site, relate to the potential future remediation of soil contamination, groundwater contamination and storm water runoff issues. No material environmental compliance enforcement proceedings are currently pending related to these sites.66 / Schnitzer Steel Industries, Inc. Form 10-K 2010
SCHNITZER STEEL INDUSTRIES, INC.
NOTES TO THE CONSOLIDATED FINANCIAL STATEMENTS
Steel Manufacturing Business
SMB’s electric arc furnace generates dust (“EAF dust”) that is classified as hazardous waste by the EPA because of its zinc and lead content. As a result, the Company captures the EAF dust and ships it in specialized rail cars to a domestic firm that applies a treatment that allows the EAF dust to be delisted as hazardous waste so it can be disposed of as a non-hazardous solid waste.
SMB has an operating permit issued under Title V of the Clean Air Act Amendments of 1990, which governs certain air quality standards. The permit was first issued in 1998, and has since been renewed through 2012.March 1, 2012 and is expected to be renewed again prior to its expiration. The permit is based onupon an annual production capacity of 950 thousand tons. SMB had no environmental reserves as of August 31, 2010.2011
. Other than
the Portland Harbor
Superfund site, which is discussed above, management currently believes that adequate provision has been made in the
financial statementsConsolidated Financial Statements for the potential impact of these issues and that the
ultimate outcomes will not
significantly impacthave a material adverse effect on the
financial position or the results of operationsConsolidated Financial Statements of the Company
although they may haveas a
material impact on earnings for a particular quarter.whole. Historically, the amounts the Company has ultimately paid for such remediation activities have not been
material.material in any given period.
Note 12 - Redeemable Noncontrolling Interest
In March 2011, the Company, through a wholly-owned acquisition subsidiary, acquired substantially all of the metals recycling business assets of Amix Salvage & Sales Ltd. As part of the purchase consideration, the Company issued the seller common shares equal to 20% of the issued and outstanding capital stock of the Company’s acquisition subsidiary. Under the terms of an agreement related to the acquisition, the noncontrolling interest owner has the right to require the Company to purchase its 20% interest in the Company’s acquisition subsidiary for fair value (the “Redemption Option”). The noncontrolling interest becomes redeemable within 60 days after the later of (i) the third anniversary of the date of the acquisition and (ii) the date on which certain principals of the minority shareholder are no longer employed by the Company. The conditions for redemption of the noncontrolling interest had not been met as of August 31, 2011.
As of August 31, 2011, the fair value of the redeemable noncontrolling interest was $19 million. No material changes in fair value were recorded since the initial measurement of the noncontrolling interest. The Company estimates fair value using Level 3 inputs under the fair value hierarchy based on standard valuation techniques using a discounted cash flow analysis. The determination of fair value requires management to apply significant judgment in formulating estimates and assumptions. These estimates and assumptions primarily include forecasts of future cash flows based on management’s best estimate of future sales and operating costs; pricing expectations; capital expenditures; working capital requirements; discount rates; growth rates; tax rates; and general market conditions.
60 / Schnitzer Steel Industries, Inc. Form 10-K 2011
SCHNITZER STEEL INDUSTRIES, INC.
NOTES TO THE CONSOLIDATED FINANCIAL STATEMENTS
Note 13 – Accumulated Other Comprehensive LossIncome (Loss) The components of accumulated other comprehensive
loss,income (loss), net of tax, are as follows as of August 31 (in thousands):
| | | | | | | | |
| | | 2010 | | | 2009 | |
Cumulative foreign currency translation adjustment | | $ | 2,419 | | | $ | 1,896 | |
Pension obligations, net | | | (4,855 | ) | | | (3,906 | ) |
Net unrealized loss on cash flow hedges | | | (116 | ) | | | (536 | ) |
| | | | | | | | |
| | $ | (2,552 | ) | | $ | (2,546 | ) |
| | | | | | | | |
|
| | | | | | | |
| | 2011 | | 2010 |
| Foreign currency translation adjustment | $ | 5,451 |
| | $ | 2,419 |
|
| Pension obligations, net | (3,886 | ) | | (4,855 | ) |
| Net unrealized loss on cash flow hedges | (25 | ) | | (116 | ) |
| Total accumulated other comprehensive income (loss) | $ | 1,540 |
| | $ | (2,552 | ) |
Note 14 – Derivative Financial Instruments
Foreign Currency Exchange Rate Risk Management
To manage exposure to foreign exchange rate risk, the Company may enter into foreign currency forward contracts to stabilize the U.S. dollar amount of the transaction at settlement. When such contracts are not designated as hedging instruments for accounting purposes, the realized and
Fair Value Measurementsunrealized gains and losses on settled and unsettled forward contracts measured at fair value are recognized as other income or expense in the Consolidated Statement of Operations. No undesignated contracts were outstanding as of August 31, 2011 and 2010, and realized gains and losses on such derivatives were not material to any of the periods presented.
The Company entered into forward contracts during fiscal 2011 to mitigate exposure to exchange rate fluctuations on Euro-denominated fixed asset purchases, which have been designated as cash flow hedges for accounting purposes. These foreign currency forward contracts are measured using forward exchange rates based on observable exchange rates quoted in an active market and are classified as a Level 1 fair value measurement under the fair value hierarchy. As of August 31, 2011, the nominal amount of open forward contracts, their fair value and the related unrealized losses recognized in other comprehensive income (loss) were not material to the Consolidated Financial Statements.
Natural gas price risk management
In order to minimize the volatility of its natural gas costs, SMB entered into a take-or-pay natural gas contract that obligatesobligated it to purchase a minimum of 2,000 MMBTUs per day through October 31, 2010, whether or not the amount iswas utilized. The contract expiresexpired on May 31, 2011.Fair value measurement
SMB’s natural gas The contract is classified asmet the definition of a derivative instrument and carried at fair value. Fair value for this instrument, the Company’s only financial instrumentwas carried at fair value is determined using a forward price curve based on observable market price quotations at a major natural gas trading hub. The Company considers nonperformancehub, under consideration of non-performance risk, in calculating fair value adjustments. This includes a credit risk adjustment based on the credit spreads of the counterparty when the Companywhich is in an unrealized gain position or on the Company’s own credit spread when the Company is in an unrealized loss position. This assessment of nonperformance risk is generally derived from the credit default swap market or from bond market credit spreads. The impact of the credit risk adjustments for the Company’s outstanding derivative was not material to the fair value calculation as of August 31, 2010. Mark-to-market adjustments on this instrument resulted in a derivative liability of $1 million as of August 31, 2010 compared to $6 million as of August 31, 2009. This amount is classified asconsidered a Level 2 fair value measurement under the fair value hierarchy described in Note 2 – Summary of Significant Accounting Policies.
Derivative designated as a hedging instrument
On September 1, 2008, the Company designated the entire remaininghierarchy. A portion of the natural gas contract as a cash flow hedge. Dueequivalent to changes in the expectation of the Company’s future production as a result of changes in market conditions, the Company de-designated the contract as a hedge and re-designated only a portion,
20,000 MMBTUs MMBTU per month was designated as a cash flow hedge inon October 1, 2008. The remaining portion of the contract is accounted for as a derivative not designated as a hedge.Schnitzer Steel Industries, Inc. Form 10-K 2010 / 67
SCHNITZER STEEL INDUSTRIES, INC.
NOTES TO THE CONSOLIDATED FINANCIAL STATEMENTS
Amounts included in accumulated other comprehensive income (“AOCI”) are reclassified to cost of goods sold when the forecasted purchase transaction is recognized in earnings and when ineffectiveness arises out of the hedge. Included in other accrued liabilities is the fair value of the designated hedge portion of thenatural gas derivative of less than $1 million and $2 millioncontract was not material as of August 31, 2010 and 2009, respectively. The effective portion of realized losses reclassified into cost of goods sold was $1 million2010. All amounts recognized for the years ended August 31, 2010effective and 2009. The ineffective portion of unrealized losses included in cost of goods sold was less than $1 million for the years ended August 31, 2010 and 2009. The unrealized loss, net of tax, for the effective portion of the hedge was less than $1 million and $1 million for the years ended August 31, 2010 and 2009, respectively. Upon de-designation of the cash flow hedge in October 2008, $1 million was reclassified from AOCI to cost of goods sold. Existing unrealized losses, net of tax, of less than $1 million currently recorded in AOCI are expected to be reclassified into cost of goods sold in the first quarter of the year ending August 31, 2011. No derivatives were designated as hedges in fiscal 2008.
Derivative not designated as a hedging instrument
For theundesignated portion of the natural gas contract were not designated as a hedge, the Company recognizes the change in fair value in cost of goods sold in the period of change. Included in other accrued liabilities is the fair value of the derivative not designated as a hedge of $1 million and $4 million as of August 31, 2010 and 2009, respectively. Net gains (losses) of $3 million, ($1) million and ($3) million were recognized in cost of goods soldmaterial for the years ended August 31, 2010, 2009 and 2008, respectively.
all periods presented. Note 15 – Employee Benefits The Company and certain of its subsidiaries have qualified and nonqualified retirement plans covering substantially all employees of these companies. These plans include a defined benefit pension plan, a supplemental executive retirement benefit plan (“SERBP”), multiemployer pension plans and defined contribution plans.
Defined Benefit Pension Plan and Supplemental Executive Retirement Benefit Plan
The Company maintains a qualified defined benefit pension plan for certain nonunion employees. Effective June 30, 2006, the Company froze this plan and ceased accruing further benefits. The Company reflects the funded status of the defined benefit pension plan as a net asset in its consolidated balance sheets.Consolidated Balance Sheets. Changes in its funded status are recognized in comprehensive income. Net periodic pension benefit cost was $1 millionnot material for the years ended August 31, 2011, 2010 and 2009 respectively and income of less than $1 million was recognized in the year ended August 31, 2008.. The fair value of the plan assets was $15$17 million and $14$15 million as of August 31, 20102011 and 2009,2010, respectively and the projected benefit obligation was $15$15 million and $14$15 million as of August 31, 20102011 and 2009,2010, respectively. The plan was fully funded with plan assets exceeding the projected benefit obligation by $2 million and less than $1$1 million and $1 million as of August 31, 20102011 and 2009,2010, respectively. Plan assets arewere comprised of $14$16 million and $14 million of Level 1 investments and $1$1 million and $1 million of Level 2 investments as of August 31, 2010.2011 and August 31, 2010, respectively. Level 1 assets are valued based on quoted market price of identical securities in the principal market. Level 2 investments are valued at the net asset value of the fund which is provided by the fund’s manager and independent administrator. No contributions are expected to be made to the defined benefit pension plan in the future; however, changes in the discount rate or actual investment returns that are lower than the long-term expected return on plan assets could result in the need for the Company to make additional contributions. The assumed discount rate used to calculate the projected
61 / Schnitzer Steel Industries, Inc. Form 10-K 2011
SCHNITZER STEEL INDUSTRIES, INC.
NOTES TO THE CONSOLIDATED FINANCIAL STATEMENTS
benefit obligations was 4.87%4.97% and 5.36%4.87% as of August 31, 20102011 and 2009,2010, respectively. The Company estimates future annual benefit payments to approximate $1be between $1 million and $3 million per year. The Company also has a nonqualified SERBP for certain executives. A restricted trust fund has been established with assets invested in life insurance policies that can be used for plan benefits, although the fund is subject to claims of the Company’s general creditors. The trust fund is included in other assets and the pension liability is included in other long-term liabilities in the Company’s consolidated balance sheets.Consolidated Balance Sheets. The trust fund is valued at $2$2 million as of August 31, 20102011 and 2009.2010. The trust fund assets’ gains and losses are included in other income (expense) in the Company’s consolidated statementsConsolidated Statements of operations.Operations. The benefit obligation and the unfunded amount each were $3$3 million and $2 million as of August 31, 20102011 and 2009,2010, respectively. The Company estimates future annual benefit68 / Schnitzer Steel Industries, Inc. Form 10-K 2010
SCHNITZER STEEL INDUSTRIES, INC.
NOTES TO THE CONSOLIDATED FINANCIAL STATEMENTS
payments to approximate less than $1 million per year. Net periodic pension benefit cost recognized for the SERBP, consisting primarily of interest cost, was less than $1 million for the years ended August 31, 2010, 2009 and 2008.
Because the defined benefit pension plan and the SERBP are
immaterialnot material to the
consolidated financial statementsConsolidated Financial Statements other disclosures required by
generally accepted accounting principlesU.S. GAAP have been omitted.
Multiemployer Pension Plans
The Company contributes to various13 multiemployer pension plans in accordance with its collective bargaining agreements. Multiemployer pension plans are defined benefit plans sponsored by multiple employers in accordance with one or more collective bargaining agreements. The plans are jointly managed by trustees that include representatives from both management and labor unions. Contributions to the plans are made based upon a fixed rate per hour worked and are agreed to by contributing employers and the unions in collective bargaining. Benefit levels are set by a joint board of trustees based on the advice of an independent actuary regarding the level of benefits that agreed-upon contributions can be expected to support. To the extent that the pension obligation of other participating employers is unfunded, the Company may be required to make additional contributions in the future to fund these obligations. Company contributions to
One of the multiemployer plans were $3that the Company contributes to is the Steelworkers Western Independent Shops Pension Plan (EIN 90-0169564, Plan No. 001) benefiting the union employees of SMB. The collective bargaining agreement associated with this plan expires on March 31, 2012. This plan had a certified zone status, as required by the Pension Protection Act of 2006, of Red as of August 31, 2011 and 2010 for the plan’s year-end at September 30, 2010 and 2009, respectively. The zone status is based on information the Company received from the plan’s administrator and is certified by the plan’s actuary. Although the plan is 81.4% funded, the plan is considered to be in Red Zone because there was a projected deficiency in the funding standard account within one year. The plan did not utilize any extended amortization provisions in its calculation of zone status. As a result of being in Red Zone Status, the plan has adopted a rehabilitation plan which requires annual contribution rate increases of 6%. The rehabilitation plan was adopted by all contributing employers. The Company was not required to pay a surcharge to the Plan. The Company contributed $2 million $3 million and $4 million for to the plan in each of the years ended August 31, 2011, 2010 2009 and 2008, respectively.Approximately 60%2009. These contributions represented more than
5% of the Company’s multiemployer pension plan contributions are made to the Western Independent Shops Pension Trust (the “WISP Trust”) for the benefit of union employees of SMB. In 2004, the Internal Revenue Service (“IRS”) approved a seven-year extension of the period over which the WISP Trust may amortize unfunded liabilities, conditioned upon maintenance of certain minimum funding levels. Based on the actuarial valuation for the WISP Trust as of October 1, 2009 (the latest available actuarial information), the funded percentage of the WISP Trust (based on the ratio of the market value of assets to the accumulated benefits liability (present value of accrued benefits)) was 65.4%, which is below the targeted funding ratio specified in the agreement with the IRS. As a result, the WISP Trust is in the process of seeking relief from the specified funding requirement from the IRS. If the WISP Trust cannot obtain relief, revocation by the IRS of the amortization extension retroactively to the 2002 plan year could occur and result in a material liability for the Company’s share of the resulting funding deficiency, the extent of which currently cannot be estimated.In 2006, the Pension Protection Act (the “Act”) became law and, together with related regulations, established new minimum funding requirements for multiemployer pension plans. The Act mandates that multiemployer pension plans that are below certain funding levels or that have projected funding deficiencies adopt a funding improvement plan or a rehabilitation program to improve the funding levels over a defined period of time. In January 2010, the Company was notified by the plan administrator of the WISP Trust that the plan is in “critical status” for 2009 because without the benefit of the relief from the IRS discussed above, the WISP Trust’s funding standard account is expected to show a funding deficiency as of September 30, 2010. As a result, the trustees of the WISP Trust are required to update the WISP Trust’s rehabilitation plan. Adoption of any updates to the rehabilitation plan is subject to collective bargaining. The current contribution rate increases 6% per year. At this time, the Company is not required to increase itstotal contributions to the WISP Trust beyond the 6%.
In December 2008, the Worker, Retiree, and Employer Recovery Act of 2008 (the “Recovery Act”) became law. For plan years beginning October 1, 2008 through September 30, 2009, the Recovery Act allows multiemployer plansfor each year.
Company contributions to freeze their funding certification based on the funding status of the previous plan year. In addition, the Recovery Act provides multiemployer plans in “endangered” or “critical” status in plan years beginning in 2008 or 2009 a three-year extension of the plan’s funding improvement or rehabilitation period. The Company has been notified by several of the other multiemployer plans to which it contributes that the underlying plans would have been in “critical status” had they not frozen their 2008 funding status under the Recovery Act.Schnitzer Steel Industries, Inc. Form 10-K 2010 / 69
SCHNITZER STEEL INDUSTRIES, INC.
NOTES TO THE CONSOLIDATED FINANCIAL STATEMENTS
The Company also has contingent liabilities for its share of the unfunded liabilities of each plan to which it contributes, including a withdrawal liability of $28 million for the WISP Trust (calculated by the trust’s actuary as of September 30, 2009). The withdrawal liabilities would be triggered only if the Company were to withdraw or partially withdraw from the respective plans. Because the Company has no current intention of withdrawing from anyall of the multiemployer plans in which it participates, it has not recognized a liabilitywere
$3 million for these contingencies.the years ended
August 31, 2011, 2010 and 2009. Defined Contribution Plans
The Company has several defined contribution plans covering certain employees. Company contributions to the defined contribution plans totaled $3$3 million $4, $1 million and $7$4 million for the years ended August 31, 2011, 2010 2009 and 2008,2009, respectively. The Company suspended employer contributions to these plans in March 2009 and resumed certain contributions to these plans in April 2010. The Company expects to make contributions of $3 million to its defined contribution plans in the year ending August 31, 2011.
Note 16 – Share-Based Compensation The Company’s 1993 Stock Incentive Plan, as amended, (“the Plan”) was established for its employees, consultants and directors. At the 2006 Annual Meeting of Shareholders, the Company’s shareholders approved amendments to the Plan to (a) authorize the grant of performance-based long-term incentive awards (“performance-based awards”) under the Plan that would be eligible for treatment as performance-based compensation under Section 162(m) of the Internal Revenue Code of 1986 and (b) increase the per-employee limit on grants of options and stock appreciation rights under the Plan from 100,000 shares to 150,000 shares annually. At the Annual Meeting of Shareholders on January 28, 2009, the Company’s shareholders approved an amendment to the Plan to increase the number ofThere are 12.2 million shares of Class A common stock reserved for issuance under the Plan, from 7.2of which 6.5 million shares to 12.2 million shares. are available for future grants as of August 31, 2011. Share-based compensation expense was $11$14 million $9, $11 million and $14$9 million for the years ended August 31, 2011, 2010 2009 and 2008,2009, respectively. Tax benefits used for option exercises and vesting of restricted stock units of less than $1 million were recognizednot material for the year ended August 31, 2010 and tax benefits realized were $1 million and $2 million for the years ended August 31, 2009 and 2008, respectively.In connection with former Chief Executive Officer John D. Carter’s planned transition from Chief Executive Officer to executive Chairman of the Board effective December 1, 2008, the Company entered into an amended and restated employment agreement which reduced Mr. Carter’s annual salary, capped future annual bonus awards, limited his entitlement to forward participation in the Company’s Long Term Incentive Plan to vesting of prior awards and granted Mr. Carter a stock award having a grant date fair value of $2 million, which fully vested on the grant date. The $2 million is included in the total share-based compensation expense for the year ended August 31, 2009 described above.
all periods presented.
The Plan provides for the issuance of RSUs. The estimated fair value of the RSUs is based on the market closing price of the underlying Class A common stock on the date of grant. The compensation expense associated with the RSUs granted is recognized over the respective requisite service period of the
awards.awards, net of estimated forfeitures.
During the years ended August 31, 2011, 2010 2009 and 2008,2009, the Compensation Committee granted 115,179135,255 RSUs, 104,399153,986 RSUs and 74,593106,387 RSUs, respectively, to its key employees, officers and officersdirectors under the Plan. The RSUs have a five-yearfive-year term and vest 20% per year commencing June 1 of the year after grant.On April 27, 2010, the Compensation Committeegrant, except for an immaterial number of awards granted 25,000 RSUs to Tamara Lundgren, the Company’s President and Chief Executive Officer. The RSUs have a two-year term and vest 100% on April 27, 2012.
with different terms. The estimated fair value of the RSUs granted during the years ended
August 31, 2011, 2010 2009 and 20082009 was $7$7 million $5, $7 million and $7$5 million, respectively.
7062 / Schnitzer Steel Industries, Inc. Form 10-K 20102011
SCHNITZER STEEL INDUSTRIES, INC.
NOTES TO THE CONSOLIDATED FINANCIAL STATEMENTS
A summary of the Company’s restricted stock unit activity is as follows:
| | | | | | | | | |
| | | Number of
Shares (in thousands) | | | Weighted
Average Grant
Date Fair Value | | Fair Value(1) |
Outstanding as of August 31, 2007 | | 248 | | | $ | 44.83 | | | |
| | | | | | | | | |
Granted | | 75 | | | $ | 87.52 | | | |
Vested | | (60 | ) | | | 44.36 | | $ | 102.85 |
Forfeited | | (2 | ) | | | 43.75 | | | |
| | | | | | | | | |
Outstanding as of August 31, 2008 | | 261 | | | $ | 57.19 | | | |
| | | | | | | | | |
Granted | | 106 | | | $ | 51.08 | | | |
Vested | | (80 | ) | | | 53.56 | | $ | 53.95 |
Forfeited | | (26 | ) | | | 56.93 | | | |
| | | | | | | | | |
Outstanding as of August 31, 2009 | | 261 | | | $ | 56.20 | | | |
| | | | | | | | | |
Granted | | 154 | | | $ | 48.83 | | | |
Vested | | (88 | ) | | | 52.45 | | $ | 46.48 |
Forfeited | | (16 | ) | | | 57.37 | | | |
| | | | | | | | | |
Outstanding as of August 31, 2010 | | 311 | | | $ | 53.55 | | | |
| | | | | | | | | |
|
| | | | | | | | | |
| | Number of Shares (in thousands) | | Weighted Average Grant Date Fair Value | | Fair Value(1) |
| Outstanding as of August 31, 2008 | 261 | | $ | 57.19 |
| | |
| Granted | 106 | | $ | 51.08 |
| | |
| Vested | (80) | | 53.56 |
| | $ | 53.95 |
|
| Forfeited | (26) | | 56.93 |
| | |
| Outstanding as of August 31, 2009 | 261 | | $ | 56.20 |
| | |
| Granted | 154 | | $ | 48.83 |
| | |
| Vested | (88) | | 52.45 |
| | $ | 46.48 |
|
| Forfeited | (16) | | 57.37 |
| | |
| Outstanding as of August 31, 2010 | 311 | | $ | 53.55 |
| | |
| Granted | 135 | | $ | 53.65 |
| | |
| Vested | (94) | | 51.86 |
| | $ | 57.63 |
|
| Forfeited | (4) | | 52.42 |
| | |
| Outstanding as of August 31, 2011 | 348 | | $ | 54.06 |
| | |
_____________________________
| |
| (1) | Amounts represent the value of the Company’s Class A common stock on the date that the restricted stock units vested. |
The Company recognized compensation expense associated with RSUs of $5$7 million $4, $5 million and $4$4 million for the years ended August 31, 2011, 2010 2009 and 2008,2009, respectively. As of August 31, 2010,2011, total unrecognized compensation costs related to unvested RSUs amounted to $14$13 million, which is expected to be recognized over a weighted average period of 3three years. Tax benefits used of less than $1 million were recognized for RSUs vested in each of the years ended August 31, 2010 and 2009, and tax benefits realized were $1 million for the year ended August 31, 2008.
The Plan authorizes performance-based awards to certain employees subject to certain conditions and restrictions. A participant generally must be employed by the Company on October 31 following the end of the performance period to receive an award payout, although adjusted awards will be paid if employment terminates earlier on account of death, disability, retirement, termination without cause after the first year of the performance period or a sale of the Company or the reporting segments for which the participant works. Awards will be paid in Class A common stock as soon as practicable after October 31 following the end of the performance period.
The Company accrues compensation cost for performance share awards based on the probable outcome of specified performance conditions, net of estimated forfeitures. The Company accrues compensation cost if it is probable that the performance conditions will be achieved. The Company reassesses whether achievement of the performance conditions are probable at each reporting date. If it is probable that the actual performance results will exceed the stated target performance conditions, the Company accrues additional compensation cost for the additional performance shares to be awarded. If, upon reassessment, it is no longer probable that the actual performance results will exceed the stated target performance conditions, or that it is no longer probable that the target performance condition will be achieved, the Company reverses any recognized compensation cost for shares no longer probable of being issued. If the performance conditions are not achieved at the end of the service period, all related compensation cost previously recognized is reversed.Schnitzer Steel Industries, Inc. Form 10-K 2010 / 71
SCHNITZER STEEL INDUSTRIES, INC.
NOTES TO THE CONSOLIDATED FINANCIAL STATEMENTS
Fiscal
20062009 –
20082011 Performance Share Awards
On November 29, 2005, the
The Compensation Committee approved performance-based awards under the Plan. The Compensation Committee approved additional awards on the same terms to two executive officers and one officer inPlan with a division on January 30, 2006 and April 28, 2006, respectively.The Compensation Committee established a series of performance targets, which included the Company’s total shareholder return for the performance period relative to the S&P 500 Industrials (weighted at 50%), the operating income per ton of MRB for the performance period (weighted at 16 2/3%), the number of Economic Value Added positive stores of APB for the last year of the performance period (weighted at 16 2/3%) and the man hours per ton of SMB for the performance period (weighted at 16 2/3%), corresponding to award payouts ranging from 25% to 300% of the weighted portions of the target awards. For participants who worked exclusively in one reporting segment, the awards were weighted 50% on the performance measure for their segment and 50% on total shareholder return.
The fair value of performance-based awards granted during the period was determined by multiplying the total number of shares of Class A common stock expected to be issued by the Company’s closing stock price as of thegrant date of the grant and was recognized over the requisite service period of 2.9 years. The weighted average fair value of performance-based awards granted during the year ended August 31, 2006 was $34.27. These performance-based awards vested during the year ended August 31, 2009.
Fiscal 2007 – 2009 Performance Share AwardsOn November 27, 2006, the Compensation Committee approved performance-based awards under the Plan.24, 2008. The Compensation Committee established performance targets based on the Company’s average growth in earnings per share (weighted at 50%) and the Company’s average return on capital employed (weighted at 50%) for the three years of the performance period, with award payouts ranging from a threshold of 50% to a maximum of 200% for each portion of the target awards. For measuring earnings per share growth in the year ended August 31, 2007, the Compensation Committee set the fiscal 2006 diluted earnings per share amount lower than the actual amount, reflecting the elimination of certain large non-recurring items. The weighted average grant date fair value of performance-based awards granted during the year ended August 31, 2007 was $39.72. These performance-based awards vested during the year ended August 31, 2010.
Fiscal
20082010 –
20102012 Performance Share Awards
On October 31, 2007, the
The Compensation Committee approved performance-based awards under the Plan. The Compensation Committee established performance targets based on the Company’s average growth in earnings per share (weighted at 50%) and the Company’s average return on capital employed (weighted at 50%) for the three years of the performance period,Plan with award payouts ranging from a threshold of 50% to a maximum of 200% for each portion of the target awards. The weighted average grant date fair value of performance-based awards granted during the year ended August 31, 2008 was $63.82.Fiscal 2009 – 2011 Performance Share AwardsOn November 24, 2008, the Compensation Committee approved performance-based awards under the Plan. The Compensation Committee established performance targets based on the Company’s average growth in earnings per share (weighted at 50%) and the Company’s average return on capital employed (weighted at 50%) for the three years of the performance period, with award payouts ranging from a threshold of 50% to a maximum of 200% for each portion of the target awards. The weighted average grant date fair value of performance-based awards granted during the year ended August 31, 2009 was $22.30.
Fiscal 2010 – 2012 Performance Share Awards
On November 20, 2009 the Compensation Committee approved performance-based awards under the Plan.. The Compensation Committee established performance targets based on the Company’s earnings per share (weighted at 50%) and the average return on capital employed on a divisional basis (weighted at 50%) for the three years of the performance period, with award payouts ranging from a threshold of 50% to a maximum of 200% for each portion of
the target awards.
7263 / Schnitzer Steel Industries, Inc. Form 10-K 20102011
SCHNITZER STEEL INDUSTRIES, INC.
NOTES TO THE CONSOLIDATED FINANCIAL STATEMENTS
Fiscal 2011 – 2013 Performance Share Awards
The Compensation Committee approved performance-based awards under the target awards. The weighted averagePlan with a grant date fair value of performance-based awards granted duringDecember 3, 2010. The Compensation Committee established performance targets based on the year ended August 31, 2010 was $47.10.Company’s earnings per share (weighted at
50%) and the average return on capital employed on a divisional basis (weighted at 50%) for the three years of the performance period, with award payouts ranging from a threshold of 50% to a maximum of 200% for each portion of the awards. A summary of the Company’s performance-based awards activity is as follows:
| | | | | | | | |
| | | Number of
Shares (in thousands) | | | Weighted
Average Grant
Date Fair Value | |
Outstanding as of August 31, 2007 | | | 462 | | | $ | 38.77 | |
| | | | | | | | |
Granted | | | 103 | | | $ | 63.82 | |
Forfeited | | | (8 | ) | | | 38.60 | |
| | | | | | | | |
Outstanding as of August 31, 2008 | | | 557 | | | $ | 43.41 | |
| | | | | | | | |
Granted | | | 57 | | | $ | 22.30 | |
Vested | | | (153 | ) | | | 34.46 | |
Forfeited | | | (182 | ) | | | 40.17 | |
| | | | | | | | |
Outstanding as of August 31, 2009 | | | 279 | | | $ | 44.64 | |
| | | | | | | | |
Granted | | | 125 | | | $ | 46.71 | |
Vested | | | (121 | ) | | | 39.72 | |
Forfeited | | | (17 | ) | | | 42.77 | |
| | | | | | | | |
Outstanding as of August 31, 2010 | | | 266 | | | $ | 47.95 | |
| | | | | | | | |
|
| | | | | | | | | | |
| | Number of Shares (in thousands) | | Weighted Average Grant Date Fair Value | | Fair Value(1) |
| Outstanding as of August 31, 2008 | 557 |
| | $ | 43.41 |
| | |
| Granted | 57 |
| | $ | 22.30 |
| | |
| Vested | (153 | ) | | 34.46 |
| | $ | 26.93 |
|
| Forfeited | (182 | ) | | 40.17 |
| | |
| Outstanding as of August 31, 2009 | 279 |
| | $ | 44.64 |
| | |
| Granted | 125 |
| | $ | 46.71 |
| | |
| Vested | (121 | ) | | 39.72 |
| | $ | 43.24 |
|
| Forfeited | (17 | ) | | 42.77 |
| | |
| Outstanding as of August 31, 2010 | 266 |
| | $ | 47.95 |
| | |
| Granted | 115 |
| | $ | 59.45 |
| | |
| Vested | (90 | ) | | 63.82 |
| | $ | 52.13 |
|
| Forfeited | (6 | ) | | 53.35 |
| | |
| Outstanding as of August 31, 2011 | 285 |
| | $ | 47.48 |
| | |
_____________________________
| |
| (1) | Amounts represent the value of the Company’s Class A common stock on the date that the performance share awards vested. |
Compensation expense associated with performance-based awards was calculated using management’s current estimate of the expected level of achievement of the performance targets under the Plan. Compensation expense for anticipated awards based on the Company’s financial performance was $3$6 million, $3 million and less than $1$1 million and $8 million for the years ended August 31, 2011, 2010 2009 and 2008,2009, respectively. As of August 31, 2010,2011, unrecognized compensation costs related to non-vested performance shares amounted to $5$8 million, which is expected to be recognized over a weighted average period of 1.31.6 years.
The Deferred Compensation Plan for Non-Employee Directors (“DSU Plan”) provides for the issuance of DSUs to non-employee directors to be granted under the Plan. One DSU gives the director the right to receive one share of Class A common stock at a future date.
Annually, immediatelyImmediately following the annual meeting of shareholders, each non-employee director will receive DSUs which will become fully vested on the day before the next annual meeting, subject to continued service on the Board. The
compensation expense associated with the DSUs
will also become fully vested ongranted is recognized over the
death or disability of a director or a change in controlrespective requisite service period of the
Company (as defined in the DSU award agreement).After the DSUs vest, directors are credited with additional whole or fractional shares to reflect dividends that would have been paid on the stock subject to the DSUs. awards.
The Company will issue Class A common stock to a director pursuant to vested DSUs in a lump sum in January of the first year after the director ceases to be a director of the Company, subject to the right of the director to elect an installment payment program under the DSU Plan.
The compensation expense associated with the DSUs granted is recognized over the respective requisite service period of the awards.During the years ended August 31, 2010, 2009 and 2008, each non-employee director was granted DSUs equal to $120,000. During the years ended August 31, 2010, 2009 (and 2008 for Mr. Carter), John Carter, the Chairman, and Tamara Lundgren, the President and Chief Executive Officer, received compensation pursuant to their employment agreements and did not receive DSUs. During the year ended August 31, 2008, the then Chairman of the Board was granted DSUs equal to $180,000.
Schnitzer Steel Industries, Inc. Form 10-K 2010 / 73
SCHNITZER STEEL INDUSTRIES, INC.
NOTES TO THE CONSOLIDATED FINANCIAL STATEMENTS
In April 2009, two new non-employee directors were elected to the Company’s Board of Directors, and each received DSUs equal to $90,000. These DSUs vested on January 26, 2010, the day before the 2010 annual meeting.
DSUs granted during the years ended August 31, 2011, 2010 2009 and 20082009 were for a total of 30,83417,459 shares, 28,63830,834 shares and 20,35628,638 shares, respectively. The Company recognized compensation expense associated with DSUs and the total value of $1 millionshares vested during each of the years ended August 31, 2011, 2010 2009 and 2008. The total value of shares vested during2009, as well as the years ended August 31, 2010, 2009 and 2008 was $1 million. Asunrecognized compensation expense as of August 31, 2010, unrecognized compensation costs related to non-vested DSUs amounted to $1 million, which will be recognized during the year ending August 31, 2011.
2011, were not material.
Under the Plan, stock options are granted to employees at exercise prices equal to the fair market value of the Company’s Class A common stock at the dates of grant at the sole discretion of the Board of Directors. Generally, stock options vest ratably over a five-yearfive-year period from the date of grant and have a contractual term of ten years. The fair value of each option grant under the Plan wasis estimated at the date of grant using the Black-Scholes Option Pricing Model, which utilizes assumptions related to volatility, the risk-free interest rate, the dividend yield and employee exercise behavior. No options were granted in the years ended August
64 / Schnitzer Steel Industries, Inc. Form 10-K 2011
SCHNITZER STEEL INDUSTRIES, INC.
NOTES TO THE CONSOLIDATED FINANCIAL STATEMENTS
31, 2011, 2010 and 2009 or 2008.. A summary of the Company’s stock option activity and related information is as follows:
| | | | | | | | | | | | | | | | |
| | | Options (in thousands) | | | Weighted
Average
Exercise
Price | | | Weighted
Average
Remaining
Contractual
Term (in years) | | | Aggregate
Intrinsic Value
(in thousands)(1) | |
Outstanding as of August 31, 2007 | | | 535 | | | $ | 24.84 | | | | 7.3 | | | $ | 17,958 | |
| | | | | | | | | | | | | | | | |
Exercises | | | (26 | ) | | $ | 20.04 | | | | | | | | | |
Forfeitures/Cancellations | | | (3 | ) | | | 34.46 | | | | | | | | | |
| | | | | | | | | | | | | | | | |
Outstanding as of August 31, 2008 | | | 506 | | | $ | 25.03 | | | | 6.3 | | | $ | 21,931 | |
| | | | | | | | | | | | | | | | |
Exercises | | | (120 | ) | | $ | 14.01 | | | | | | | | | |
Forfeitures/Cancellations | | | (9 | ) | | | 34.53 | | | | | | | | | |
| | | | | | | | | | | | | | | | |
Outstanding as of August 31, 2009 | | | 377 | | | $ | 28.32 | | | | 5.6 | | | $ | 9,683 | |
| | | | | | | | | | | | | | | | |
Exercises | | | (36 | ) | | $ | 26.08 | | | | | | | | | |
Forfeitures/Cancellations | | | (3 | ) | | | 34.46 | | | | | | | | | |
| | | | | | | | | | | | | | | | |
Outstanding as of August 31, 2010 | | | 338 | | | $ | 28.51 | | | | 4.8 | | | $ | 5,324 | |
| | | | | | | | | | | | | | | | |
Vested and expected to vest as of August 31, 2010 | | | 338 | | | $ | 28.51 | | | | 4.8 | | | $ | 5,324 | |
Options exercisable as of: | | | | | | | | | | | | | | | | |
August 31, 2008 | | | 365 | | | $ | 22.83 | | | | 6.0 | | | $ | 16,658 | |
August 31, 2009 | | | 323 | | | $ | 27.94 | | | | 5.5 | | | $ | 8,431 | |
August 31, 2010 | | | 334 | | | $ | 28.44 | | | | 4.7 | | | $ | 5,285 | |
|
| | | | | | | | | | | | | |
| | Options (in thousands) | | Weighted Average Exercise Price | | Weighted Average Remaining Contractual Term (in years) | | Aggregate Intrinsic Value (in thousands)(1) |
| Outstanding as of August 31, 2008 | 506 |
| | $ | 25.03 |
| | 6.3 |
| | $ | 21,931 |
|
| Exercises | (120 | ) | | $ | 14.01 |
| | | | |
| Forfeitures/Cancellations | (9 | ) | | 34.53 |
| | | | |
| Outstanding as of August 31, 2009 | 377 |
| | $ | 28.32 |
| | 5.6 |
| | $ | 9,683 |
|
| Exercises | (36 | ) | | $ | 26.08 |
| | | | |
| Forfeitures/Cancellations | (3 | ) | | 34.46 |
| | | | |
| Outstanding as of August 31, 2010 | 338 |
| | $ | 28.51 |
| | 4.8 |
| | $ | 5,324 |
|
| Exercises | (19 | ) | | $ | 28.70 |
| | | | |
| Outstanding and exercisable as of August 31, 2011 | 319 |
| | $ | 28.50 |
| | 3.9 |
| | $ | 5,430 |
|
_____________________________
| |
| (1) | Amounts represent the difference between the exercise price and the closing price of the Company’s stock on the last trading day of the corresponding fiscal year, multiplied by the number of in-the-money options. |
As
All outstanding stock options were vested as of August 31, 2010, the total number of unvested stock options was 4,081 shares.2011. The aggregate intrinsic value of stock options exercised, which was $1$1 million $4, $1 million and $2$4 million for the years ended August 31, 2011, 2010 2009 and 2008,2009, respectively, represents the difference between the exercise price and the value of the Company’s stock at the time of exercise. The total fair value of stock options vested, was $1 millioncompensation expense associated with stock options, the total proceeds received from option exercises and the tax benefits realized from options exercised were not material during each of the years ended74 / Schnitzer Steel Industries, Inc. Form 10-K 2010
SCHNITZER STEEL INDUSTRIES, INC.
NOTES TO THE CONSOLIDATED FINANCIAL STATEMENTS
August 31, 2011, 2010 2009 and 2008. The Company recognized compensation expense associated with stock options of less than $1 million, $1 million and $1 million for the years ended August 31, 2010, 2009 and 2008, respectively. As of August 31, 2010, the total unrecognized compensation costs related to stock options amounted to less than $1 million. The Company expects to recognize these costs over the next year. Total proceeds received from option exercises for the years ended August 31, 2010, 2009 and 2008 were $1 million, $2 million and $1 million, respectively. The tax benefits realized from options exercised amounted to less than $1 million, $1 million and less than $1 million for the years ended August 31, 2010, 2009 and 2008, respectively.
.
Income (loss) from continuing operations before income taxes was as follows for the years ended August 31 (in thousands):
| | | | | | | | | | | | |
| | | 2010 | | | 2009 | | | 2008 | |
United States | | $ | 117,104 | | | $ | (50,634 | ) | | $ | 389,761 | |
Foreign | | | 8,229 | | | | 3,570 | | | | 7,460 | |
| | | | | | | | | | | | |
| | $ | 125,333 | | | $ | (47,064 | ) | | $ | 397,221 | |
| | | | | | | | | | | | |
Income tax expense (benefit) consisted of the following for the years ended August 31 (in thousands): | |
| | | 2010 | | | 2009 | | | 2008 | |
Current: | | | | | | | | | | | | |
Federal | | $ | 25,187 | | | $ | (44,249 | ) | | $ | 128,082 | |
State | | | 1,801 | | | | (838 | ) | | | 9,862 | |
Foreign | | | 2,320 | | | | (134 | ) | | | 2,445 | |
| | | | | | | | | | | | |
Total current | | | 29,308 | | | | (45,221 | ) | | | 140,389 | |
| | | | | | | | | | | | |
Deferred: | | | | | | | | | | | | |
Federal | | | 10,466 | | | | 25,536 | | | | 2,998 | |
State | | | 812 | | | | (886 | ) | | | (819 | ) |
Foreign | | | 239 | | | | 656 | | | | 0 | |
| | | | | | | | | | | | |
Total deferred | | | 11,517 | | | | 25,306 | | | | 2,179 | |
| | | | | | | | | | | | |
Total income tax expense (benefit) | | $ | 40,825 | | | $ | (19,915 | ) | | $ | 142,568 | |
| | | | | | | | | | | | |
A reconciliation of the difference between the federal statutory rate and the Company’s effective tax rate for the years ended August 31 is as follows: | |
| | | 2010 | | | 2009 | | | 2008 | |
Federal statutory rate | | | 35.0 | % | | | (35.0 | %) | | | 35.0 | % |
State taxes, net of credits | | | 0.7 | | | | (8.7 | ) | | | 1.7 | |
Foreign income taxed at different rates | | | (0.6 | ) | | | (1.4 | ) | | | 0.0 | |
Section 199 deduction | | | (2.4 | ) | | | 3.4 | | | | (1.9 | ) |
Non-deductible officers’ compensation | | | 1.0 | | | | (2.2 | ) | | | 1.6 | |
Noncontrolling interests | | | (1.1 | ) | | | (0.6 | ) | | | (0.5 | ) |
Other | | | 0.0 | | | | 2.2 | | | | 0.0 | |
| | | | | | | | | | | | |
Effective tax rate | | | 32.6 | % | | | (42.3 | %) | | | 35.9 | % |
| | | | | | | | | | | | |
|
| | | | | | | | | | | |
| | 2011 | | 2010 | | 2009 |
| United States | $ | 171,329 |
| | $ | 117,104 |
| | $ | (50,634 | ) |
| Foreign | 9,476 |
| | 8,229 |
| | 3,570 |
|
| Total | $ | 180,805 |
| | $ | 125,333 |
| | $ | (47,064 | ) |
Income tax expense (benefit) from continuing operations consisted of the following for the years ended August 31 (in thousands):
|
| | | | | | | | | | | |
| | 2011 | | 2010 | | 2009 |
| Current: | | | | | |
| Federal | $ | 33,499 |
| | $ | 25,187 |
| | $ | (44,249 | ) |
| State | 2,583 |
| | 1,801 |
| | (838 | ) |
| Foreign | 82 |
| | 2,320 |
| | (134 | ) |
| Total current tax expense (benefit) | 36,164 |
| | 29,308 |
| | (45,221 | ) |
| Deferred: | | | | | |
| Federal | 19,164 |
| | 10,466 |
| | 25,536 |
|
| State | 383 |
| | 812 |
| | (886 | ) |
| Foreign | 1,457 |
| | 239 |
| | 656 |
|
| Total deferred tax expense | 21,004 |
| | 11,517 |
| | 25,306 |
|
| Total income tax expense (benefit) | $ | 57,168 |
| | $ | 40,825 |
| | $ | (19,915 | ) |
65 / Schnitzer Steel Industries, Inc. Form 10-K 2010 / 752011
SCHNITZER STEEL INDUSTRIES, INC.
NOTES TO THE CONSOLIDATED FINANCIAL STATEMENTS
A reconciliation of the difference between the federal statutory rate and the Company's effective tax rate for the years ended August 31 is as follows:
|
| | | | | | | | |
| | 2011 | | 2010 | | 2009 |
| Federal statutory rate | 35.0 | % | | 35.0 | % | | (35.0 | )% |
| State taxes, net of credits | 0.7 |
| | 0.7 |
| | (8.7 | ) |
| Foreign income taxed at different rates | (0.6 | ) | | (0.6 | ) | | (1.4 | ) |
| Section 199 deduction | (1.0 | ) | | (2.4 | ) | | 3.4 |
|
| Non-deductible officers’ compensation | 0.3 |
| | 1.0 |
| | (2.2 | ) |
| Noncontrolling interests | (1.0 | ) | | (1.1 | ) | | (0.6 | ) |
| Research and development credits | (0.5 | ) | | — |
| | — |
|
| Other | (1.3 | ) | | — |
| | 2.2 |
|
| Effective tax rate | 31.6 | % | | 32.6 | % | | (42.3 | )% |
The effective tax rate differed from the U.S. federal statutory rate of 35.0%, primarily due to the lower tax rate for foreign income and domestic production activities deductions. The fiscal 2011 effective tax rate also benefited from certain adjustments recorded in the period, including a recognition of research and development credits and a reduction in a reserve for unrecognized state income tax benefits. In addition, during the fourth quarter of fiscal 2011, the Company recorded an adjustment to correct an error that originated in a prior period pertaining to deferred tax liabilities related to the Company’s investment in a subsidiary. The correction of this error resulted in a reduction of income tax expense and an increase to net income of $3 million for the year ended August 31, 2011. Management determined that this error was not material to any previously reported consolidated financial statements and the resulting correction was not material to the Consolidated Financial Statements for the year ended August 31, 2011.
Deferred tax assets and liabilities were comprised of the following as of August 31 (in thousands):
| | | | | | | | |
| | | 2010 | | | 2009 | |
Deferred tax assets: | | | | | | | | |
Environmental liabilities | | $ | 9,341 | | | $ | 10,117 | |
Employee benefit accruals | | | 10,067 | | | | 9,851 | |
State income tax and other | | | 3,297 | | | | 9,771 | |
Net operating loss carryforwards | | | 1,107 | | | | 6,866 | |
State credit carryforwards | | | 2,671 | | | | 2,202 | |
Inventory valuation methods | | | 4,768 | | | | 1,054 | |
Alternative minimum tax credit carryforwards | | | 742 | | | | 742 | |
Valuation allowances | | | (855 | ) | | | (455 | ) |
| | | | | | | | |
Total deferred tax assets | | | 31,138 | | | | 40,148 | |
| | | | | | | | |
Deferred tax liabilities: | | | | | | | | |
Accelerated depreciation and basis differences | | | 77,457 | | | | 71,200 | |
Prepaid expense acceleration | | | 2,064 | | | | 2,444 | |
Translation adjustment | | | 1,210 | | | | 1,000 | |
| | | | | | | | |
Total deferred tax liabilities | | | 80,731 | | | | 74,644 | |
| | | | | | | | |
Net deferred tax liability | | $ | 49,593 | | | $ | 34,496 | |
| | | | | | | | |
|
| | | | | | | |
| | 2011 | | 2010 |
| Deferred tax assets: | | | |
| Environmental liabilities | $ | 9,727 |
| | $ | 9,341 |
|
| Employee benefit accruals | 12,547 |
| | 10,067 |
|
| State income tax and other | 2,948 |
| | 3,297 |
|
| Net operating loss carryforwards | 988 |
| | 1,107 |
|
| State credit carryforwards | 2,294 |
| | 2,671 |
|
| Inventory valuation methods | 4,321 |
| | 4,768 |
|
| Alternative minimum tax credit carryforwards | — |
| | 742 |
|
| Valuation allowances | (589 | ) | | (855 | ) |
| Total deferred tax assets | 32,236 |
| | 31,138 |
|
| Deferred tax liabilities: | | | |
| Accelerated depreciation and basis differences | 101,457 |
| | 77,457 |
|
| Prepaid expense acceleration | 2,287 |
| | 2,064 |
|
| Translation adjustment | 2,086 |
| | 1,210 |
|
| Total deferred tax liabilities | 105,830 |
| | 80,731 |
|
| Net deferred tax liability | $ | 73,594 |
| | $ | 49,593 |
|
Deferred taxes included the benefits from state net operating loss carry forwards of $1 million and state tax credits of $2 million that will expire if not used between 20112012 and 2029. A valuation allowance2029.
66 / Schnitzer Steel Industries, Inc. Form 10-K 2011
SCHNITZER STEEL INDUSTRIES, INC.
NOTES TO THE CONSOLIDATED FINANCIAL STATEMENTS
Accounting for Uncertainty in Income Taxes
As of August 31, 2010, the Company had a reserve of $2 million for unrecognized tax benefits, which included less than $1 million of interest and penalties.
The following table summarizes the activity related to the Company’s reserve for unrecognized tax benefits, excluding interest and penalties, for the years ended August 31 (in thousands):
| | | | | | | | | | | | |
| | | 2010 | | | 2009 | | | 2008 | |
Unrecognized tax benefits, as of the beginning of the year | | $ | 3,372 | | | $ | 5,761 | | | $ | 3,986 | |
Additions for tax positions of prior years | | | 0 | | | | 201 | | | | 0 | |
Reductions for tax positions of prior years | | | (274 | ) | | | (645 | ) | | | (26 | ) |
Settlements with tax authorities | | | (315 | ) | | | (1,159 | ) | | | 0 | |
Additions for tax positions of the current year | | | 0 | | | | 657 | | | | 1,801 | |
Reductions for lapse of statutes | | | (1,152 | ) | | | (1,443 | ) | | | 0 | |
| | | | | | | | | | | | |
Unrecognized tax benefits, as of the end of the year | | $ | 1,631 | | | $ | 3,372 | | | $ | 5,761 | |
| | | | | | | | | | | | |
Recognition of the unrecognized tax benefits as of August 31, 2010 would reduce income tax expense by $2 million.
|
| | | | | | | | | | | |
| | 2011 | | 2010 | | 2009 |
| Unrecognized tax benefits, as of the beginning of the year | $ | 1,631 |
| | $ | 3,372 |
| | $ | 5,761 |
|
| Additions for tax positions of prior years | — |
| | — |
| | 201 |
|
| Reductions for tax positions of prior years | (75 | ) | | (274 | ) | | (645 | ) |
| Settlements with tax authorities | (875 | ) | | (315 | ) | | (1,159 | ) |
| Additions for tax positions of the current year | 160 |
| | — |
| | 657 |
|
| Reductions for lapse of statutes | (538 | ) | | (1,152 | ) | | (1,443 | ) |
| Unrecognized tax benefits, as of the end of the year | $ | 303 |
| | $ | 1,631 |
| | $ | 3,372 |
|
The Company does not anticipate any material changes to the reserve in the next 12 months.
The
Company’s policy is to recordrecognized amounts of tax-related penalties and interest
in income tax expense. The amounts recognized were
less than $1 million in each of the years ended August 31, 2010, 2009 and 2008.not material for all periods presented.
The Company files federal and state income tax returns in the
USU.S. and foreign tax returns in Puerto Rico and Canada. The federal statute of limitations has expired for fiscal
20032007 and prior
years, and the Company is no longer subject to76 / Schnitzer Steel Industries, Inc. Form 10-K 2010
SCHNITZER STEEL INDUSTRIES, INC.
NOTES TO THE CONSOLIDATED FINANCIAL STATEMENTS
state and foreign tax examinations for those years. Federal, Canadian and several state tax authorities are currently examining the Company’s income tax returns for fiscal years 2004 to 2008.
The Company currently pays a 7% tax rate on earnings in the Commonwealth of Puerto Rico. The Company is aware that regulatory agencies in Puerto Rico are reevaluatingbased on its qualification as a manufacturer. In 2010, a local regulatory agency issued a letter challenging the Company’s entitlement to athe manufacturing tax exemption. While the Company currently believes it will continue to be entitled to the 7% tax rate under existing exemptions, a change inexemption, which, if upheld, could have increased the Company’s tax exemption status could cause an increaserate in Puerto Rico. In September 2011, that agency withdrew its challenge, and the Company continues to benefit from the manufacturing tax rate on Puerto Rico earnings and in its overall effective tax rate on consolidated earnings. Based upon known facts a range of reasonably possible changes cannot currently be estimated.exemption.
Note 18 – Net Income (Loss) Per Share The following table sets forth the information used to compute basic and diluted net income (loss) per share attributable to SSI for the years ended August 31 (in thousands):
| | | | | | | | | | | | |
| | | 2010 | | | 2009 | | | 2008 | |
Income (loss) from continuing operations | | $ | 84,508 | | | $ | (27,149 | ) | | $ | 254,653 | |
Net income attributable to noncontrolling interests | | | (3,926 | ) | | | (866 | ) | | | (5,357 | ) |
| | | | | | | | | | | | |
Income (loss) from continuing operations attributable to SSI | | | 80,582 | | | | (28,015 | ) | | | 249,296 | |
Loss from discontinued operations, net of tax | | | (13,832 | ) | | | (4,214 | ) | | | (613 | ) |
| | | | | | | | | | | | |
Net income (loss) attributable to SSI | | $ | 66,750 | | | $ | (32,229 | ) | | $ | 248,683 | |
| | | | | | | | | | | | |
Computation of shares: | | | | | | | | | | | | |
Weighted average common shares outstanding, basic | | | 27,832 | | | | 28,159 | | | | 28,278 | |
Incremental common shares attributable to dilutive stock options, performance share awards, DSUs and RSUs | | | 315 | | | | 0 | | | | 616 | |
| | | | | | | | | | | | |
Weighted average common shares outstanding, diluted | | | 28,147 | | | | 28,159 | | | | 28,894 | |
| | | | | | | | | | | | |
Basic net income (loss) per share is computed by dividing net income (loss) by the weighted average number of common shares outstanding during the periods presented, including vested DSUs and RSUs. Diluted net income (loss) per share is computed by dividing net income (loss) by the weighted average number of common shares outstanding, assuming dilution. For the years ended August 31, 2010, 2009 and 2008, 50,702, 828,869 and 74,593 common
|
| | | | | | | | | | | |
| | 2011 | | 2010 | | 2009 |
| Income (loss) from continuing operations | $ | 123,637 |
| | $ | 84,508 |
| | $ | (27,149 | ) |
| Net income attributable to noncontrolling interests | (5,181 | ) | | (3,926 | ) | | (866 | ) |
| Income (loss) from continuing operations attributable to SSI | 118,456 |
| | 80,582 |
| | (28,015 | ) |
| Loss from discontinued operations, net of tax | (101 | ) | | (13,832 | ) | | (4,214 | ) |
| Net income (loss) attributable to SSI | $ | 118,355 |
| | $ | 66,750 |
| | $ | (32,229 | ) |
| Computation of shares: | | | | | |
| Weighted average common shares outstanding, basic | 27,649 |
| | 27,832 |
| | 28,159 |
|
| Incremental common shares attributable to dilutive stock options, performance share awards, DSUs and RSUs | 310 |
| | 315 |
| | — |
|
| Weighted average common shares outstanding, diluted | 27,959 |
| | 28,147 |
| | 28,159 |
|
Common stock equivalent shares respectively,of 39,820, 50,702 and 828,869 were considered anti-dilutiveantidilutive and were excluded from the calculation of diluted net income (loss) per share.share for the years ended August 31, 2011, 2010 and 2009, respectively.
Note 19 – Related Party Transactions The Company purchases recycled metal from its joint venture operations at prices that approximate fair market value. These purchases totaled $29$48 million $16, $29 million and $52$16 million for the years ended August 31, 2011, 2010 2009 and 2008,2009, respectively. Advances to (payments from) these joint ventures were $(2) million, less than $1$1 million $2 and $2 million and ($3) million for the years ended August 31, 2011, 2010 2009 and 2008,2009, respectively. The Company owed $1$2 million and $2$1 million to joint ventures as of August 31, 2011 and 2010, respectively.
In November 2010,
the Company and
2009, respectively.a joint venture partner entered into a series of agreements to facilitate the expansion of their
67 / Schnitzer Steel Industries, Inc. Form 10-K 2011
SCHNITZER STEEL INDUSTRIES, INC.
NOTES TO THE CONSOLIDATED FINANCIAL STATEMENTS
joint venture operations in order to increase the flow of scrap into MRB yards. In order to fund this growth, the Company and its joint venture partner each contributed an additional $2 million in equity to the joint venture.
In connection with the acquisition of the metals recycling business assets of Amix Salvage & Sales Ltd. during fiscal 2011, the Company entered into a series of agreements to lease property or obtain services with entities owned by the minority shareholder of the Company’s subsidiary that operates its MRB facilities in British Columbia and Alberta, Canada. The Company paid $3 million under these agreements for the year ended August 31, 2011.
Thomas D. Klauer, Jr., President of the Company’s Auto Parts Business, is the sole shareholder of a corporation that is the 25% minority partner in a partnership in which the Company is the 75% partner and which operates four self-service stores in Northern California. Mr. Klauer’s 25% share of the profits of this partnership totaled $2$2 million $1, $2 million and $2$1 million in the years ended August 31, 2011, 2010 2009 and 2008,2009, respectively. The Company and a company owned by Mr. Klauer jointly own the real property at one of these stores, which is leased to the partnership. Mr. Klauer’s share of the annual rent paid by the partnership is less than $1 million.$1 million. The term of this lease expires in December 2015, and the partnership has the option to renew the lease, upon its expiration, for multiple five-year periods. Rent under the lease is adjusted annually based on the Consumer Price Index. Also in fiscal 2009, Mr. Klauer, through a company of which he is the sole shareholder, acquired ownership of a contiguous parcel of real property, a portion of which is leased to the partnership. The term of this lease expires in December 2015, and the partnershipSchnitzer Steel Industries, Inc. Form 10-K 2010 / 77
SCHNITZER STEEL INDUSTRIES, INC.
NOTES TO THE CONSOLIDATED FINANCIAL STATEMENTS
has the option to renew the lease, upon its expiration, for multiple five-year periods. Rent under the lease is adjusted annually based on the Consumer Price Index. The rent paid by the partnership to Mr. Klauer’s company for this parcel was less than $1
$1 million in the years ended August 31, 2011, 2010 and 2009.2009. In addition, in July 2011, the Company leased a parcel of land in San Jose from a company of which Mr. Klauer is sole shareholder. The term of this lease expires on January 31, 2012, and the Company has the option to renew the lease for an additional six months. The rent paid to Mr. Klauer’s company in fiscal 2011 for this parcel was less than $1 million. In addition, during the year ended August 31, 2008, the Company loaned this partnership $5$5 million to fund the exercise of an option to purchase another property occupied by the partnership from an unrelated third party. The loan incurredaccrued interest at 5% per annum, and the partnership was prohibited from making distributions to its partners (other than for taxes on the income of the partnership) until the loan was repaid. The principal balance was repaid in the first quarter of fiscal 2010, compared to a balance of $1 million as of August 31, 2009.In February 2008, the Company acquired the remaining 50% equity interest in Pick-N-Pull Auto Dismantlers, LLC Nevada in exchange for its 50% interest in the land and buildings owned by the entity. The acquired business was previously consolidated into the Company’s financial statements because the Company maintained operating control over the entity. See Note 7 – Business Combinations for further detail.
2010.
Certain shareholders of the Company own significant interests in, or are related to owners of, the entities discussed below. As such, these entities are considered related parties for financial reporting purposes. All transactions with the Schnitzer family (including Schnitzer family companies) require the approval of the Company’s Audit Committee, and the Company is in compliance with this policy.Schnitzer family employees are considered related parties for financial reporting purposes because members of the Schnitzer family own significant interests in the Company. Gary Schnitzer and Gregory Schnitzer, each a member of the Schnitzer family, are employed by the Company. Joshua Philip, also a member of the Schnitzer family, was employed by the Company until his resignation effective January 8, 2010. These members of the Schnitzer family collectively earned total compensation of $1 million, $1 million and $2 million for the years ended August 31, 2010, 2009 and 2008, respectively.
Members of the Schnitzer family own all of the outstanding stock of Schnitzer Investment Corp. (“SIC”), which is engaged in the real estate business and was a subsidiary of the Company prior to 1989. The Company and SIC are both potentially responsible parties with respect to Portland Harbor, which has been designated as a Superfund site since December 2000. The Company has incurred $6 million, net of insurance reimbursements, in legal and consulting fees related to the investigation of this site, which includes the Company’s Portland scrap metal operations. The Company and SIC have worked together in response to Portland Harbor matters, and the Company has paid all of the legal and consulting fees for the joint defense, in part due to its environmental indemnity obligation to SIC with respect to the Portland scrap metal operations property. As these costs have increased substantially in the last two years, the Company and SIC have agreed to an equitable cost sharing arrangement with respect to defense costs under which SIC will pay
50% of the legal and consulting costs, net of insurance recoveries. The Company has recognized $3$1 million and $3 million in reimbursement of environmental expenses in the year ended August 31, 2011 and 2010, respectively, for SIC’s share of costs incurred to date.costs. Amounts receivable from SIC under this agreement were $1less than $1 million and $1 million as of August 31, 2010.2011 and 2010
, respectively. The Company’s Restated Articles of Incorporation and Bylaws obligate it to indemnify current or former directors and officers to the fullest extent not prohibited by law, and further obligates it to advance expenses incurred in defending any pending or threatened proceeding to any such person in advance of a final disposition of such matters, but only if the involved officer or director affirms a good faith belief of entitlement to indemnification and undertakes to repay such expenses if it is ultimately determined by a court that the person is not entitled to be indemnified. In connection with the continuing investigation of certain former employees related to the Company’s past practice of making improper payments to purchasing managers of customers in Asia, Robert W. Philip, former Chairman, President and Chief Executive Officer of the Company, and Gary Schnitzer, Executive Vice President of the Company, have requested advancement of expenses and have provided the required undertaking. During each of the years ended August 31, 2010, 2009 and 2008, theThe Company advanced $1$1 million to Mr. Philip for legal expenses in connection with the investigation.investigation during fiscal 2010 and 2009. During the fourth quarter of fiscal 2010, the Company was reimbursed by its D&O insurance carrier for approximately $3$3 million of the amounts advanced.advanced to former officers and directors.
78 / Schnitzer Steel Industries, Inc. Form 10-K 2010
SCHNITZER STEEL INDUSTRIES, INC.
NOTES TO THE CONSOLIDATED FINANCIAL STATEMENTS
William Furman, a director of the Company, is the Chairman and Chief Executive Officer of The Greenbrier Companies (with its subsidiaries, “Greenbrier”). During the years ended August 31, 2011, 2010 2009 and 2008,2009, the Company engaged in a series of transactions with Greenbrier in which the Company sold as well as purchased goods.goods on an arm’s length’s basis. During the years ended August 31, 2011, 2010 2009 and 2008,2009, the Company sold goods to Greenbrier in the amount of $1 million, less than $1$1 million, $1 million and $1less than $1 million, respectively. Purchases of goods from Greenbrier were less than $1$1 million during each of the years ended August 31, 2011, 2010 2009 and 2008.
2009.
68 / Schnitzer Steel Industries, Inc. Form 10-K 2011
SCHNITZER STEEL INDUSTRIES, INC.
NOTES TO THE CONSOLIDATED FINANCIAL STATEMENTS
Note 20 – Segment Information The accounting standards for reporting information about operating segments define operating segments as components of an enterprise about which separate financial information is available that is evaluated regularly by the chief operating decision maker in deciding how to allocate resources and in assessing performance. The Company’s chief operating decision maker is the Chief Executive Officer. The Company is organized by line of business. While the Chief Executive Officer evaluates results in a number of different ways, the line of business management structure is the primary basis for which the allocation of resources and financial results are assessed. Under the aforementioned criteria, the Company operates in three operating and reporting segments: metal purchasing, processing, recycling and selling (MRB), used auto parts (APB) and mini-mill steel manufacturing (SMB). Additionally, the Company is a noncontrolling partner in joint ventures, which are either in the metals recycling business or are suppliers of unprocessed metal. The Company’s reporting segments are based on the nature of the business activities (nature of different products and production processes) from which it earns revenues and incurs expenses, financial information reviewed by the chief operating decision-maker, capital allocation and performance assessment process, organizational structure and financial information presented to the Board of Directors and investors. MRB buys and processes ferrous and nonferrous metal for sale to foreign and other domestic steel producers or their representatives and to SMB. MRB also purchases ferrous metal from other processors for shipment directly to SMB.
APB purchases used and salvaged vehicles, sells parts from those vehicles through its retail facilities and wholesale operations, and sells the remaining portion of the vehicles to metal recyclers, including MRB.
SMB operates a steel mini-mill that produces a wide range of finished steel products using recycled metal and other raw materials.
Intersegment sales from MRB to SMB are made at rates that approximate export market prices for shipments from the West Coast of the US. In addition, the Company has intersegment sales of autobodies from APB to MRB at rates that approximate market prices. These intercompany sales tend to produce intercompany profits which are not recognized until the finished products are ultimately sold to third parties.
The information provided below is obtained from internal information that is provided to the Company’s chief operating decision-maker for the purpose of corporate management. The Company uses operating income (loss) to measure segment performance. The Company does not allocate corporate interest income and expense, income taxes, other income and expenses related to corporate activity or corporate expense for management and administrative services that benefit all three segments. Because of this unallocated expense, the operating income (loss) of each reporting segment does not reflect the operating income (loss) the reporting segment would have as a stand-alone business. All amounts presented exclude the results of operations of the Company’s discontinued full-service used auto parts operation.
The following is a summary of the Company’s total assets as of August 31 (in thousands):
| | | | | | | | |
| | | 2010 | | | 2009 | |
Total assets: | | | | | | | | |
Metals Recycling Business(1) | | $ | 1,405,765 | | | $ | 1,266,222 | |
Auto Parts Business | | | 243,976 | | | | 272,983 | |
Steel Manufacturing Business | | | 322,601 | | | | 331,811 | |
| | | | | | | | |
Total segment assets | | | 1,972,342 | | | | 1,871,016 | |
Corporate and eliminations | | | (628,924 | ) | | | (602,783 | ) |
| | | | | | | | |
Total assets | | $ | 1,343,418 | | | $ | 1,268,233 | |
| | | | | | | | |
Property, plant and equipment, net | | $ | 460,810 | | | $ | 447,228 | |
| | | | | | | | |
|
| | | | | | | |
| | 2011 | | 2010 |
| Total assets: | | | |
Metals Recycling Business(1) | $ | 1,668,778 |
| | $ | 1,405,765 |
|
| Auto Parts Business | 304,060 |
| | 243,976 |
|
| Steel Manufacturing Business | 324,596 |
| | 322,601 |
|
| Total segment assets | 2,297,434 |
| | 1,972,342 |
|
| Corporate and eliminations | (407,265 | ) | | (628,924 | ) |
| Total assets | $ | 1,890,169 |
| | $ | 1,343,418 |
|
Property, plant and equipment, net (2) | $ | 555,284 |
| | $ | 460,810 |
|
_____________________________
| |
| (1) | MRB total assets include $14$17 million and $11$14 million as of August 31, 20102011 and 2009,2010, respectively, for investments in joint venture partnerships. |
| |
| (2) | Property, plant and equipment, net includes $49 million and $3 million as of August 31, 2011 and 2010, respectively, at our Canadian locations. |
69 / Schnitzer Steel Industries, Inc. Form 10-K 2010 / 792011
SCHNITZER STEEL INDUSTRIES, INC.
NOTES TO THE CONSOLIDATED FINANCIAL STATEMENTS
Long-lived assets consist primarily of net property, plant and equipment. Substantially all of the Company’s long-lived assets are located in the US.
The table below illustrates the Company’s
operating results
from continuing operations by reporting segment for the years ended August 31 (in thousands):
| | | | | | | | | | | | |
| | | 2010 | | | 2009 | | | 2008 | |
Revenues: | | | | | | | | | | | | |
Metals Recycling Business | | $ | 1,979,770 | | | $ | 1,507,655 | | | $ | 3,062,850 | |
Auto Parts Business | | | 241,233 | | | | 153,207 | | | | 228,082 | |
Steel Manufacturing Business | | | 285,085 | | | | 263,269 | | | | 603,189 | |
| | | | | | | | | | | | |
Segment revenue | | | 2,506,088 | | | | 1,924,131 | | | | 3,894,121 | |
Intersegment eliminations | | | (204,848 | ) | | | (136,901 | ) | | | (377,171 | ) |
| | | | | | | | | | | | |
Total revenues | | $ | 2,301,240 | | | $ | 1,787,230 | | | $ | 3,516,950 | |
| | | | | | | | | | | | |
Depreciation and amortization: | | | | | | | | | | | | |
Metals Recycling Business | | $ | 38,516 | | | $ | 35,649 | | | $ | 30,329 | |
Auto Parts Business | | | 7,568 | | | | 6,627 | | | | 5,436 | |
Steel Manufacturing Business | | | 12,879 | | | | 12,097 | | | | 11,093 | |
| | | | | | | | | | | | |
Segment depreciation and amortization | | | 58,963 | | | | 54,373 | | | | 46,858 | |
Corporate | | | 4,265 | | | | 4,027 | | | | 2,284 | |
| | | | | | | | | | | | |
Total depreciation and amortization | | $ | 63,228 | | | $ | 58,400 | | | $ | 49,142 | |
| | | | | | | | | | | | |
Capital expenditures: | | | | | | | | | | | | |
Metals Recycling Business | | $ | 53,753 | | | $ | 40,875 | | | $ | 46,246 | |
Auto Parts Business | | | 4,682 | | | | 9,574 | | | | 12,676 | |
Steel Manufacturing Business | | | 3,255 | | | | 6,205 | | | | 13,710 | |
| | | | | | | | | | | | |
Segment capital expenditures | | | 61,690 | | | | 56,654 | | | | 72,632 | |
Corporate | | | 2,634 | | | | 2,390 | | | | 11,630 | |
| | | | | | | | | | | | |
Total capital expenditures | | $ | 64,324 | | | $ | 59,044 | | | $ | 84,262 | |
| | | | | | | | | | | | |
Reconciliation of the Company’s segment operating income (loss) to income (loss) from continuing operations before income taxes: | | | | | | | | | | | | |
Metals Recycling Business(1)(2) | | $ | 118,449 | | | $ | 12,552 | | | $ | 356,873 | |
Auto Parts Business | | | 51,096 | | | | 3,564 | | | | 47,686 | |
Steel Manufacturing Business | | | (5,862 | ) | | | (42,000 | ) | | | 72,300 | |
| | | | | | | | | | | | |
Segment operating income (loss) | | | 163,683 | | | | (25,884 | ) | | | 476,859 | |
Corporate and eliminations | | | (37,786 | ) | | | (25,240 | ) | | | (73,624 | ) |
| | | | | | | | | | | | |
Operating income (loss) | | | 125,897 | | | | (51,124 | ) | | | 403,235 | |
Interest income | | | 459 | | | | 1,179 | | | | 748 | |
Interest expense | | | (2,343 | ) | | | (3,342 | ) | | | (8,649 | ) |
Other income | | | 1,320 | | | | 6,223 | | | | 1,887 | |
| | | | | | | | | | | | |
Income (loss) from continuing operations before income taxes | | $ | 125,333 | | | $ | (47,064 | ) | | $ | 397,221 | |
| | | | | | | | | | | | |
|
| | | | | | | | | | | |
| | 2011 | | 2010 | | 2009 |
| Metals Recycling Business: | | | | | |
| Revenues | $ | 3,070,004 |
| | $ | 1,979,770 |
| | $ | 1,507,655 |
|
| Less: Intersegment revenues | (169,331 | ) | | (155,310 | ) | | (109,985 | ) |
| MRB external customer revenues | 2,900,673 |
| | 1,824,460 |
| | 1,397,670 |
|
| Auto Parts Business: | | | | | |
| Revenues | 319,833 |
| | 241,233 |
| | 153,207 |
|
| Less: Intersegment revenues | (78,795 | ) | | (49,538 | ) | | (26,916 | ) |
| APB external customer revenues | 241,038 |
| | 191,695 |
| | 126,291 |
|
| Steel Manufacturing Business: | | | | | |
| Revenues | 317,483 |
| | 285,085 |
| | 263,269 |
|
| Total revenues | $ | 3,459,194 |
| | $ | 2,301,240 |
| | $ | 1,787,230 |
|
| Depreciation and amortization: | | | | | |
| Metals Recycling Business | $ | 49,773 |
| | $ | 38,516 |
| | $ | 35,649 |
|
| Auto Parts Business | 10,131 |
| | 7,568 |
| | 6,627 |
|
| Steel Manufacturing Business | 10,782 |
| | 12,879 |
| | 12,097 |
|
| Segment depreciation and amortization | 70,686 |
| | 58,963 |
| | 54,373 |
|
| Corporate | 4,180 |
| | 4,265 |
| | 4,027 |
|
| Total depreciation and amortization | $ | 74,866 |
| | $ | 63,228 |
| | $ | 58,400 |
|
| Capital expenditures: | | | | | |
| Metals Recycling Business | $ | 88,917 |
| | $ | 53,753 |
| | $ | 40,875 |
|
| Auto Parts Business | 7,099 |
| | 4,682 |
| | 9,574 |
|
| Steel Manufacturing Business | 3,328 |
| | 3,255 |
| | 6,205 |
|
| Segment capital expenditures | 99,344 |
| | 61,690 |
| | 56,654 |
|
| Corporate | 5,620 |
| | 2,634 |
| | 2,390 |
|
| Total capital expenditures | $ | 104,964 |
| | $ | 64,324 |
| | $ | 59,044 |
|
| Reconciliation of the Company’s segment operating income (loss) to income (loss) from continuing operations before income taxes: | | | | | |
Metals Recycling Business(1)(2) | $ | 164,646 |
| | $ | 118,449 |
| | $ | 12,552 |
|
| Auto Parts Business | 64,027 |
| | 51,096 |
| | 3,564 |
|
| Steel Manufacturing Business | 2,562 |
| | (5,862 | ) | | (42,000 | ) |
| Segment operating income (loss) | 231,235 |
| | 163,683 |
| | (25,884 | ) |
| Corporate and eliminations | (45,271 | ) | | (37,786 | ) | | (25,240 | ) |
| Operating income (loss) | 185,964 |
| | 125,897 |
| | (51,124 | ) |
| Interest income | 384 |
| | 459 |
| | 1,179 |
|
| Interest expense | (8,436 | ) | | (2,343 | ) | | (3,342 | ) |
| Other income, net | 2,893 |
| | 1,320 |
| | 6,223 |
|
| Income (loss) from continuing operations before income taxes | $ | 180,805 |
| | $ | 125,333 |
| | $ | (47,064 | ) |
_____________________________
| |
| (1) | MRB operating income for fiscal 2009 includes bad debt expense of $8 million.$8 million. |
| |
| (2) | MRB operating income includes $3$5 million $1, $3 million and $12$1 million in income from joint ventures accounted for by the equity method in fiscal 2011, 2010 2009 and 2008,2009, respectively. |
8070 / Schnitzer Steel Industries, Inc. Form 10-K 20102011
SCHNITZER STEEL INDUSTRIES, INC.
NOTES TO THE CONSOLIDATED FINANCIAL STATEMENTS
The following revenues from external customers are presented based on the sales destination
by reporting segment and by major product for the years ended August 31 (in thousands):
| | | | | | | | | | | | |
| | | 2010 | | | 2009 | | | 2008 | |
Revenues based on sales destination: | | | | | | | | | | | | |
Foreign | | $ | 1,570,936 | | | $ | 1,252,782 | | | $ | 2,276,848 | |
Domestic | | | 730,304 | | | | 534,448 | | | | 1,240,102 | |
| | | | | | | | | | | | |
Total revenues from external customers | | $ | 2,301,240 | | | $ | 1,787,230 | | | $ | 3,516,950 | |
| | | | | | | | | | | | |
Reporting segment: | | | | | | | | | | | | |
Metals Recycling Business | | $ | 1,824,460 | | | $ | 1,397,670 | | | $ | 2,734,438 | |
Auto Parts Business | | | 191,695 | | | | 126,291 | | | | 179,323 | |
Steel Manufacturing Business | | | 285,085 | | | | 263,269 | | | | 603,189 | |
| | | | | | | | | | | | |
Total revenues from external customers | | $ | 2,301,240 | | | $ | 1,787,230 | | | $ | 3,516,950 | |
| | | | | | | | | | | | |
Major product information: | | | | | | | | | | | | |
Ferrous scrap metal | | $ | 1,403,354 | | | $ | 1,139,323 | | | $ | 2,262,384 | |
Nonferrous scrap metal | | | 421,106 | | | | 258,347 | | | | 472,054 | |
Auto parts | | | 191,695 | | | | 126,291 | | | | 179,323 | |
Finished steel products | | | 270,712 | | | | 245,175 | | | | 586,246 | |
Semi-finished steel products | | | 14,373 | | | | 18,094 | | | | 16,943 | |
| | | | | | | | | | | | |
Total revenues from external customers | | $ | 2,301,240 | | | $ | 1,787,230 | | | $ | 3,516,950 | |
| | | | | | | | | | | | |
|
| | | | | | | | | | | |
| | 2011 | | 2010 | | 2009 |
| Revenues based on sales destination: | | | | | |
| Foreign | $ | 2,471,737 |
| | $ | 1,570,936 |
| | $ | 1,252,782 |
|
| Domestic | 987,457 |
| | 730,304 |
| | 534,448 |
|
| Total revenues from external customers | $ | 3,459,194 |
| | $ | 2,301,240 |
| | $ | 1,787,230 |
|
| | | | | | |
| Major product information: | | | | | |
| Ferrous scrap metal | $ | 2,259,229 |
| | $ | 1,403,354 |
| | $ | 1,139,323 |
|
| Nonferrous scrap metal and other | 641,444 |
| | 421,106 |
| | 258,347 |
|
| Auto parts | 241,038 |
| | 191,695 |
| | 126,291 |
|
| Finished steel products | 317,338 |
| | 270,712 |
| | 245,175 |
|
| Semi-finished steel products | 145 |
| | 14,373 |
| | 18,094 |
|
| Total revenues from external customers | $ | 3,459,194 |
| | $ | 2,301,240 |
| | $ | 1,787,230 |
|
In fiscal 2011, 2010 2009 and 20082009, there were no external customers that accounted for more than 10% of the Company’s consolidated revenues. Sales to customers in foreign countries are a significant part of the Company’s business. The schedule below identifies those foreign countries in which the Company’s sales exceeded 10% of consolidated revenues in any of the last three years ended August 31: | | | | | | | | | | | | | | | | | | | | | | | | |
| | | 2010 | | | % of
Revenue | | | 2009 | | | % of
Revenue | | | 2008 | | | % of
Revenue | |
China | | $ | 487,098 | | | | 21.2 | % | | $ | 570,400 | | | | 31.9 | % | | $ | 236,589 | | | | 6.7 | % |
South Korea | | $ | 260,456 | | | | 11.3 | % | | $ | 83,821 | | | | 4.7 | % | | $ | 288,461 | | | | 8.2 | % |
31 (in thousands):
|
| | | | | | | | | | | | | | | | | | | | |
| | 2011 | | % of Revenue | | 2010 | | % of Revenue | | 2009 | | % of Revenue |
| China | $ | 884,744 |
| | 25.6 | % | | $ | 487,098 |
| | 21.2 | % | | $ | 570,400 |
| | 31.9 | % |
| South Korea | $ | 310,977 |
| | 9.0 | % | | $ | 260,456 |
| | 11.3 | % | | $ | 83,821 |
| | 4.7 | % |
71 / Schnitzer Steel Industries, Inc. Form 10-K 2010 / 812011
Quarterly Financial Data (Unaudited)
In the opinion of management, this unaudited quarterly financial summary includes all adjustments necessary to present fairly the results for the periods represented (in thousands, except per share amounts):
| | | | | | | | | | | | | | | | |
| | | Fiscal 2010 | |
| | | First | | | Second | | | Third | | | Fourth | |
Revenues | | $ | 394,282 | | | $ | 564,328 | | | $ | 703,539 | | | $ | 639,091 | |
Operating income | | $ | 9,282 | | | $ | 28,537 | | | $ | 63,775 | | | $ | 24,303 | |
Income (loss) from discontinued operations, net of tax | | $ | (14,974 | ) | | $ | (72 | ) | | $ | 23 | | | $ | 1,191 | |
Net income (loss) attributable to SSI | | $ | (8,569 | ) | | $ | 17,459 | | | $ | 40,453 | | | $ | 17,407 | |
Basic net income (loss) per share attributable to SSI | | $ | (0.31 | ) | | $ | 0.63 | | | $ | 1.45 | | | $ | 0.63 | |
Diluted net income (loss) per share attributable to SSI | | $ | (0.30 | ) | | $ | 0.62 | | | $ | 1.43 | | | $ | 0.62 | |
| |
| | | Fiscal 2009 | |
| | | First | | | Second | | | Third | | | Fourth | |
Revenues | | $ | 471,964 | | | $ | 406,679 | | | $ | 382,029 | | | $ | 526,558 | |
Operating income (loss) | | $ | (48,205 | ) | | $ | (14,483 | ) | | $ | (4,242 | ) | | $ | 15,806 | |
Income (loss) from discontinued operations, net of tax | | $ | (1,430 | ) | | $ | (1,997 | ) | | $ | (1,058 | ) | | $ | 271 | |
Net income (loss) attributable to SSI | | $ | (34,002 | ) | | $ | (6,965 | ) | | $ | (1,527 | ) | | $ | 10,265 | |
Basic net income (loss) per share attributable to SSI | | $ | (1.21 | ) | | $ | (0.25 | ) | | $ | (0.05 | ) | | $ | 0.37 | |
Diluted net income (loss) per share attributable to SSI | | $ | (1.21 | ) | | $ | (0.25 | ) | | $ | (0.05 | ) | | $ | 0.36 | |
|
| | | | | | | | | | | | | | | |
| | Fiscal 2011 |
| | First | | Second | | Third | | Fourth |
| Revenues | $ | 675,104 |
| | $ | 721,842 |
| | $ | 981,062 |
| | $ | 1,081,186 |
|
| Operating income | $ | 28,440 |
| | $ | 45,937 |
| | $ | 55,332 |
| | $ | 56,255 |
|
| Income (loss) from discontinued operations, net of tax | $ | 23 |
| | $ | 11 |
| | $ | 282 |
| | $ | (417 | ) |
| Net income attributable to SSI | $ | 17,794 |
| | $ | 30,825 |
| | $ | 33,028 |
| | $ | 36,708 |
|
| Basic net income per share attributable to SSI | $ | 0.65 |
| | $ | 1.12 |
| | $ | 1.19 |
| | $ | 1.32 |
|
| Diluted net income per share attributable to SSI | $ | 0.64 |
| | $ | 1.10 |
| | $ | 1.18 |
| | $ | 1.31 |
|
| | Fiscal 2010 |
| | First | | Second | | Third | | Fourth |
| Revenues | $ | 394,282 |
| | $ | 564,328 |
| | $ | 703,539 |
| | $ | 639,091 |
|
| Operating income | $ | 9,282 |
| | $ | 28,537 |
| | $ | 63,775 |
| | $ | 24,303 |
|
| Income (loss) from discontinued operations, net of tax | $ | (14,974 | ) | | $ | (72 | ) | | $ | 23 |
| | $ | 1,191 |
|
| Net income (loss) attributable to SSI | $ | (8,569 | ) | | $ | 17,459 |
| | $ | 40,453 |
| | $ | 17,407 |
|
| Basic net income (loss) per share attributable to SSI | $ | (0.31 | ) | | $ | 0.63 |
| | $ | 1.45 |
| | $ | 0.63 |
|
| Diluted net income (loss) per share attributable to SSI | $ | (0.30 | ) | | $ | 0.62 |
| | $ | 1.43 |
| | $ | 0.62 |
|
82During the fourth quarter of fiscal 2011, the Company recorded an adjustment to correct an error that originated in a prior period pertaining to deferred tax liabilities related to the Company’s investment in a subsidiary. The correction of this error resulted in a reduction of income tax expense and an increase to net income of $3 million for the fourth quarter of fiscal 2011.
72 / Schnitzer Steel Industries, Inc. Form 10-K 20102011
Schedule II – Valuation and Qualifying Accounts
For the Years Ended August 31,
2011, 2010
2009 and
20082009
(In thousands)
| | | | | | | | | | | | | | | | |
| Column A | | Column B | | | Column C | | | Column D | | | Column E | |
| Description | | Balance at
beginning
of period | | | Charges to cost
and expenses | | | Deductions | | | Balance at
end of
period | |
Fiscal 2010 | | | | | | | | | | | | | | | | |
Allowance for doubtful accounts | | $ | 7,509 | | | $ | (255 | ) | | $ | (1,045 | ) | | $ | 6,209 | |
Inventory reserves | | $ | 1,269 | | | $ | 153 | | | $ | (323 | ) | | $ | 1,099 | |
Deferred tax valuation allowance | | $ | 455 | | | $ | 400 | | | $ | 0 | | | $ | 855 | |
| | | | |
Fiscal 2009 | | | | | | | | | | | | | | | | |
Allowance for doubtful accounts | | $ | 3,049 | | | $ | 8,916 | | | $ | (4,456 | ) | | $ | 7,509 | |
Inventory reserves | | $ | 1,125 | | | $ | 144 | | | $ | 0 | | | $ | 1,269 | |
Deferred tax valuation allowance | | $ | 520 | | | $ | 0 | | | $ | (65 | ) | | $ | 455 | |
| | | | |
Fiscal 2008 | | | | | | | | | | | | | | | | |
Allowance for doubtful accounts | | $ | 1,821 | | | $ | 4,445 | | | $ | (3,217 | ) | | $ | 3,049 | |
Inventory reserves | | $ | 1,866 | | | $ | (741 | ) | | $ | 0 | | | $ | 1,125 | |
Deferred tax valuation allowance | | $ | 0 | | | $ | 520 | | | $ | 0 | | | $ | 520 | |
|
| | | | | | | | | | | | | | | | |
| Column A | | Column B | | Column C | | Column D | | Column E |
| Description | | Balance at beginning of period | | Charges to cost and expenses | | Deductions | | Balance at end of period |
| Fiscal 2011 | | | | | | | | |
| Allowance for doubtful accounts | | $ | 6,209 |
| | $ | 334 |
| | $ | (395 | ) | | $ | 6,148 |
|
| Inventory reserves | | $ | 1,099 |
| | $ | 395 |
| | $ | — |
| | $ | 1,494 |
|
| Deferred tax valuation allowance | | $ | 855 |
| | $ | 189 |
| | $ | (455 | ) | | $ | 589 |
|
| Fiscal 2010 | | | | | | | | |
| Allowance for doubtful accounts | | $ | 7,509 |
| | $ | (255 | ) | | $ | (1,045 | ) | | $ | 6,209 |
|
| Inventory reserves | | $ | 1,269 |
| | $ | 153 |
| | $ | (323 | ) | | $ | 1,099 |
|
| Deferred tax valuation allowance | | $ | 455 |
| | $ | 400 |
| | $ | — |
| | $ | 855 |
|
| Fiscal 2009 | | | | | | | | |
| Allowance for doubtful accounts | | $ | 3,049 |
| | $ | 8,916 |
| | $ | (4,456 | ) | | $ | 7,509 |
|
| Inventory reserves | | $ | 1,125 |
| | $ | 144 |
| | $ | — |
| | $ | 1,269 |
|
| Deferred tax valuation allowance | | $ | 520 |
| | $ | — |
| | $ | (65 | ) | | $ | 455 |
|
73 / Schnitzer Steel Industries, Inc. Form 10-K 2010 / 832011
ITEM 9. CHANGES IN AND DISAGREEMENTS WITH ACCOUNTANTS ON ACCOUNTING AND FINANCIAL DISCLOSURE
None.
ITEM 9A. CONTROLS AND PROCEDURES
Disclosure Controls and Procedures
The
Company’s management, with the participation of the Chief Executive Officer and Chief Financial Officer, has completed an evaluation of the effectiveness of the design and operation of the Company’sCompany maintains disclosure controls and procedures (as defined in Rules 13a-15(e) and 15d-15(e) of the Securities and Exchange Act of 1934, as amended (the “Exchange Act”))
. Based on this evaluation, the Company’s Chief Executive Officer and Chief Financial Officer have concluded that
as of August 31, 2010, the Company’s disclosure controls and procedures were effectiveare designed to ensure that information required to be disclosed by the Company in
the reports that it files or submits under the Exchange Act is recorded, processed, summarized and reported within the time periods specified by the Securities and Exchange Commission’s rules and forms and that such information is accumulated and communicated to management, including the Chief Executive Officer and Chief Financial Officer, as appropriate, to allow timely decisions regarding required disclosures.
Any controls and procedures, no matter how well designed and operated, can only provide reasonable assurance of achieving the desired control objectives. The Company’s management, with the participation of the Chief Executive Officer and Chief Financial Officer, has completed an evaluation of the effectiveness of the design and operation of the Company’s disclosure controls and procedures. Based on this evaluation, the Company’s Chief Executive Officer and Chief Financial Officer have concluded that, as of August 31, 2011, the Company’s disclosure controls and procedures were effective at the reasonable assurance level.
Management’s Annual Report on Internal Control Over Financial Reporting
Management’s Annual Report on Internal Control Over Financial Reporting is presented within Part II, Item 8 of this
report.report and is incorporated herein by reference.
Changes in Internal Control Over Financial Reporting
There
has beenwas no change in the Company’s internal control over financial reporting
(as that term is defined in Rules 13a-15(f) and 15d-15(f) under the Exchange Act) during its most recent fiscal quarter that has materially affected, or is reasonably likely to materially affect, the Company’s internal control over financial reporting.
Chief Executive Officer and Chief Financial Officer Certifications
The certifications of the Company’s Chief Executive Office and Chief Financial Officer required under Section 302 of the Sarbanes-Oxley Act have been filed with as Exhibits 31.1 and 31.2 to this report.
ITEM 9B. OTHER INFORMATION
None.
74None.
84 / Schnitzer Steel Industries, Inc. Form 10-K 20102011
PART III
ITEM 10. DIRECTORS, EXECUTIVE OFFICERS AND CORPORATE GOVERNANCE
Information required by Item 401 of Regulation S-K regarding directors, and information required by Items 405, 407(c)(3), 407(d)(4) and 407(d)(5) of Regulation S-K, will be included under “Election of Directors,” “Corporate Governance” and “Section 16(a) Beneficial Ownership Reporting Compliance” in the Company’s Proxy Statement for its
20112012 Annual Meeting of Shareholders and is incorporated herein by reference.
Executive Officers of the Registrant
|
| | | | | |
| Name | | Age | | | Office |
Tamara L. Lundgren | | 54 | 53 |
| | President and Chief Executive Officer |
Richard D. Peach | | 48 | 47 |
| | Senior Vice President and Chief Financial Officer |
Gary A. Schnitzer | | 69 | 68 |
| | Executive Vice President |
Donald W. Hamaker | | 59 | 58 |
| | Senior Vice President and President, Metals Recycling Business |
Thomas D. Klauer, Jr. | | 57 | 56 |
| | Senior Vice President and President, Auto Parts Business |
Jeffrey Dyck | | 48 | 47 |
| | Senior Vice President and President, Steel Manufacturing Business |
Richard C. Josephson | | 63 | 62 |
| | Senior Vice President, General Counsel and Secretary |
George P. Nutwell | | 64 | 63 |
| | Senior Vice President and Chief of Operations – Capital and Interdivisional Programs |
Jeff P. Poeschl | | 46 | 45 |
| | Vice President, Corporate Controller and Principal Accounting Officer |
Tamara L. Lundgren joined us in September 2005 as Vice President and Chief Strategy Officer. She became Executive Vice President, Strategy and Investments in April 2006 and was elected Executive Vice President and Chief Operating Officer in November 2006. In December 2008, Ms. Lundgren became the President and Chief Executive Officer. Prior to joining us, Ms. Lundgren was a Managing Director in the Investment Banking Division of JPMorgan Chase, which she joined in 2001. From 1996 until 2001, Ms. Lundgren was a Managing Director at Deutsche Bank AG in New York and London. Prior to joining Deutsche Bank, Ms. Lundgren was a partner at the law firm of Hogan & Hartson, LLP in Washington, D.C. Richard D. Peach joined us in March 2007 and was appointed Chief Financial Officer in December 2007. Mr. Peach was the Chief Financial Officer and Senior Vice President with the Western US energy utility, PacifiCorp, from 2003 to 2006. From 1995 to 2002, he served in a variety of senior management positions with ScottishPower, the international energy company, including Group Controller, Managing Director of United Kingdom Customer Services and Director of Energy Supply Finance. Prior to joining ScottishPower, Mr. Peach was a senior manager with Coopers & Lybrand andLybrand. Mr. Peach is a member of the Institute of Chartered Accountants of Scotland. Gary A. Schnitzer is Executive Vice President and was in charge of our California metals recycling operations from 1980 until 2007. Mr. Schnitzer currently serves on our Executive Committee and assists in developing the strategic direction of our Metals Recycling Business and Auto Parts Business. Mr. Schnitzer is a brother-in-law of Kenneth Novack and a first cousin of Jill Schnitzer Edelson and Jean S. Reynolds. Ms. Edelson,Scott Lewis is the son of a first cousin of Mr. Novack’s wife. Mr. Novack, and Ms. Reynolds and Mr. Lewis are all directors of the Company and members of the Schnitzer family. Donald W. Hamaker joined us as President of the Metals Recycling Business in September 2005. Mr. Hamaker was employed in management positions by Hugo Neu Corporation for nearly 20 years, serving as President from 1999 to 2005. Thomas D. Klauer, Jr. has been the President of the Auto Parts Business since our acquisition of Pick-N-Pull Auto Dismantling, Inc. in 2003. Before that Mr. Klauer was employed by Pick-N-Pull, having joined that Company in 1989. Jeffrey Dyck joined the Steel Manufacturing Business in February 1994 and served in a variety of positions, including Manager of the Rolling Mills and Director of Operations of the Steel Manufacturing Business, before his promotion to President of SMB in June 2005. Schnitzer Steel Industries, Inc. Form 10-K 2010 / 85
Richard C. Josephson joined us in January 2006 as Vice President, General Counsel and Secretary. Before that Mr. Josephson was a Member of the law firm Stoel Rives LLP, where he had practiced law since 1973.
George P. Nutwelljoined us in October 2008 as Senior Vice President and Chief Administrative Officer and was appointed Chief of Operations – Capital and Interdivisional Programs in March 2010. Before joining us, Mr. Nutwell was employed from April 1970 until April 2007 in a number of senior management positions by Bechtel Corporation, most recently as the Corporate Manager
75 / Schnitzer Steel Industries, Inc. Form 10-K 2011
of Contracts and Procurement.
Jeff P. Poeschl joined us in February 2007 as Vice President and Corporate Controller. He became our Principal Accounting Officer in December 2007. Mr. Poeschl was the Vice President – Finance at Mesa Air Group, Inc., based in Phoenix, Arizona from 2000 to 2007. Prior to joining Mesa Air Group, Mr. Poeschl was a senior manager with Deloitte & Touche in Milwaukee, Wisconsin. Mr. Poeschl is a member of the American Institute of Certified Public Accountants and the Wisconsin Institute of Certified Public Accountants. On April 28, 2010, the Board of Directors approved a revised Company’s Code of Conduct that is applicable to all of its directors and employees. It includes additional provisions that apply to the Company’s principal executive officer, principal financial officer, principal accounting officer or controller, and persons performing similar functions (the “Senior Financial Officers”). This document is posted on the Corporate Governance page of the Company’s internet website (www.schnitzersteel.com) and is available free of charge by calling the Company or submitting a request to ir@schn.com. The Company intends to disclose onsatisfy its websitedisclosure obligations with respect to any amendments to or waivers of the Code for directors, executive officers or Senior Financial Officers.Officers by posting such information on its internet website set forth above rather than by filing a Form 8-K.
ITEM 11. EXECUTIVE COMPENSATION
The information required by Items 402, 407(e)(4) and 407(e)(5) of Regulation S-K will be included under “Compensation of Executive Officers,” “Compensation Discussion and Analysis”, “Director Compensation”, “Corporate Governance – Assessment of Compensation Risk” and “Compensation Committee Report” in the Company’s Proxy Statement to be filed for its 20112012 Annual Meeting of Shareholders and is incorporated herein by reference.
ITEM 12. SECURITY OWNERSHIP OF CERTAIN BENEFICIAL OWNERS AND MANAGEMENT AND RELATED STOCKHOLDER MATTERS
Information with respect to security ownership of certain beneficial owners and management, as required by Item 403 of Regulation S-K, will be included under “Voting Securities and Principal Shareholders” in the Company’s Proxy Statement for its 20112012 Annual Meeting of Shareholders and is incorporated herein by reference. Information with respect to securities authorized for issuance under equity compensation plans, as required by Item 201(d) of Regulation S-K, will be included under “Compensation Plan Information” in the Company’s Proxy Statement for its 20112012 Annual Meeting of Shareholders and is incorporated herein by reference.
ITEM 13. CERTAIN RELATIONSHIPS AND RELATED TRANSACTIONS, AND DIRECTOR INDEPENDENCE
The information required by Items 404 and 407(a) of Regulation S-K will be included under “Certain Transactions” and “Corporate Governance – Director Independence” in the Company’s Proxy Statement for its 20112012 Annual Meeting of Shareholders and is incorporated herein by reference.
ITEM 14. PRINCIPAL
ACCOUNTINGACCOUNTANT FEES AND SERVICES
Information regarding the Company’s principal accountant fees and services required by Item 9(e) of Schedule 14A will be included under “Independent Registered Public Accounting Firm” in the Company’s Proxy Statement for its 20112012 Annual Meeting of Shareholders and is incorporated herein by reference.
8676 / Schnitzer Steel Industries, Inc. Form 10-K 20102011
PART IV
ITEM 15. EXHIBITS AND FINANCIAL STATEMENT SCHEDULES
| | |
| | | | | |
(a) | | 1.
1 |
| | The following financial statements are filed as part of this report: |
| | | | |
| | | |
| | | | The Report of Independent Registered Public Accounting Firm, the Company’s consolidated financial statements,Consolidated Financial Statements, the notesNotes thereto and the quarterly financial data (unaudited) are on pages 4440 through 8272 of this report. |
| | 2 | | |
| | | |
| | 2.
| | The following financial statement schedule is filed as part of this report: | | | | |
|
| | | |
| 3 | | |
| | 3.1
The following exhibits are filed as part of this report: |
| | |
| 3.1 |
| | 2006 Restated Articles of Incorporation of the Registrant. Filed as Exhibit 3.1 to the Registrant’s Current Report on Form 8-K filed on June 9, 2006, and incorporated herein by reference. |
| | |
| | |
| 3.2 |
| | Restated Bylaws of the Registrant. Filed as Exhibit 3.1 to the Registrant’s Current Report on Form 8-K filed on October 30, 2009, and incorporated herein by reference. |
| | |
| | 4.1
|
| 4.4 |
| | Amended and Restated Credit Agreement, dated November 8, 2005, between the Registrant, Bank of America, NA, and the Other Lenders Party Thereto. Filed as Exhibit 4.1 to the Registrant’s Annual Report on Form 10-K for the fiscal year ended August 31, 2005, and incorporated herein by reference.
|
| | |
| | 4.2
| | Amendment to Amended and Restated Credit Agreement, dated as of July 3, 2007, between the Company, Bank of America, NA, and Other Lenders Party Thereto. Filed as Exhibit 4.1 to the Registrant’s Current Report on Form 8-K filed on July 24, 2007, and incorporated herein by reference.
|
| | |
| | 4.3
| | Second Amendment to Amended and Restated Credit Agreement, dated as of June 10, 2008, between the Company, Bank of America, NA, and Other Lenders Party Thereto. Filed as Exhibit 4.3 to the Registrant’s Annual Report on Form 10-K for the fiscal year ended August 31, 2009, and incorporated herein by reference.
|
| | |
| | 4.4
| | Rights Agreement, dated March 21, 2006, between the Registrant and Wells Fargo Bank, N.A. Filed as Exhibit 4.1 to the Registrant’s Current Report on Form 8-K filed on March 22, 2006, and incorporated herein by reference. |
| | |
| | 9.1
|
| 4.6 |
| | Second Amended and Restated Credit Agreement, dated February 9, 2011, between the Registrant, Bank of America, NA, and the Other Lenders Party Thereto. Filed as Exhibit 4.1 to the Registrant's Quarterly Report on Form 10-Q for the quarter ended May 31, 2011, and incorporated herein by reference. |
| | |
| 9.1 |
| | Schnitzer Steel Industries, Inc. 2001 Restated Voting Trust and Buy-Sell Agreement, dated March 26, 2001. Filed as Exhibit 9.1 to the Registrant’s Annual Report on Form 10-K for the fiscal year ended August 31, 2001, and incorporated herein by reference. |
| | |
| | |
| 10.1 |
| | Lease Agreement, dated September 1, 1988, between Schnitzer Investment Corp. and the Registrant, as amended, relating to the Portland Metals Recycling operation and which has terminated except for surviving indemnity obligations. Filed as Exhibit 10.3 to the Registrant’s Registration Statement on Form S-1 filed on September 24, 19961993 (Commission File No. 33-69352), and incorporated herein by reference. |
| | |
| | |
| 10.2 |
| | Purchase and Sale Agreement, dated May 4, 2005, between Schnitzer Investment Corp. and the Registrant, relating to purchase by the Registrant of the Portland Metals Recycling operations real estate. Filed as Exhibit 10.1 to the Registrant’s Current Report on Form 8-K filed on May 10, 2005, and incorporated herein by reference. |
| | |
| | |
| 10.3 |
| | Third Amended Shared Services Agreement, dated July 26, 2006, between the Registrant, Schnitzer Investment Corp. and Island Equipment Company, Inc. Filed as Exhibit 10.5 to the Registrant’s Current Report on Form 8-K filed on July 28, 2006, and incorporated herein by reference. |
77 / Schnitzer Steel Industries, Inc. Form 10-K 2010 / 872011
| | | | |
| | |
| 10.4 |
| 10.4
| | Lease Agreement, dated January 1, 2010, between Commercial One Properties, LLC and Pick-N-Pull San Jose Auto Dismantlers relating to the San Jose North Location. Filed as Exhibit 10.1 to the Registrant’s Quarterly Report on Form 10-Q for the quarter ended February 28, 2010, and incorporated herein by reference. |
| | |
| 10.5 |
| 10.5
| | Lease Agreement, dated January 1, 2010, between Commercial Court Properties, LLC, Pick-N-Pull Auto Dismantlers and Pick-N-Pull San Jose Auto Dismantlers relating to the San Jose North Location. Filed as Exhibit 10.2 to the Registrant’s Quarterly Report on Form 10-Q for the quarter ended February 28, 2010, and incorporated herein by reference. |
| | |
| *10.6 |
| *10.6
| | Executive Annual Bonus Plan. Filed as Exhibit 10.1 to the Registrant’s Current Report on Form 8-K filed on February 1, 2010, and incorporated herein by reference. |
| | |
| *10.7 |
| *10.7
| | Fiscal 2010 Annual Performance Bonus Program for John D. Carter and Tamara L. Lundgren. Filed as Exhibit 10.1 to the Registrant’s Quarterly Report on Form 10-Q for the quarter ended November 30, 2009, and incorporated herein by reference. |
| | |
| *10.8 |
| *10.8
| | Annual Incentive Compensation Plan, effective September 1, 2006. Filed as Exhibit 10.1 to the Registrant’s Quarterly Report on Form 10-Q for the quarter ended February 28, 2007, and incorporated herein by reference. |
| | |
| *10.9 |
| *10.9
| | 1993 Stock Incentive Plan of the Registrant. Filed as Exhibit 10.1 to the Registrant’s Current Report on Form 8-K filed on January 30, 2009, and incorporated herein by reference. |
| | |
| *10.10 |
| *10.10
| | Form of Stock Option Agreement used for option grants to employees under the 1993 Stock Incentive Plan. Filed as Exhibit 10.49 to the Registrant’s Annual Report on Form 10-K for the fiscal year ended August 31, 2007, and incorporated herein by reference. |
| | |
| *10.11 |
| *10.11
| | Form of Stock Option Agreement used for option grants to non-employee directors under the 1993 Stock Incentive Plan. Filed as Exhibit 10.15 to the Registrant’s Annual Report on Form 10-K for the fiscal year ended August 31, 2004, and incorporated herein by reference. |
| | |
| *10.12 |
| *10.12
| | Form of Restricted Stock Unit Award Agreement under the 1993 Stock Incentive Plan. Filed as Exhibit 10.6 to the Registrant’s Quarterly Report on Form 10-Q for the quarter ended November 30, 2008, and incorporated herein by reference. |
| | |
| *10.13 |
| *10.13
| | Form of Long-Term Incentive Award Agreement under the 1993 Stock Incentive Plan used for awards granted in fiscal 2008 and 2009. Filed as Exhibit 10.48 to the Registrant’s Annual Report on Form 10-K for the fiscal year ended August 31, 2007, and incorporated herein by reference. |
| | |
| *10.14 |
| *10.14
| | Form of Long-Term Incentive Award Agreement under the 1993 Stock Incentive Plan used for awards granted in fiscal 2010. Filed as Exhibit 10.2 to the Registrant’s Quarterly Report on Form 10-Q for the quarter ended November 30, 2009, and incorporated herein by reference. |
| | |
| *10.15 |
| *10.15
| | Form of Deferred Stock Unit Award Agreement under the 1993 Stock Incentive Plan used for non-employee directors. Filed as Exhibit 10.1 to the Registrant’s Current Report on Form 8-K filed on July 28, 2006, and incorporated herein by reference. |
| | |
| *10.16 |
| *10.16
| | Deferred Compensation Plan for Non-Employee Directors. Filed as Exhibit 10.2 to the Registrant’s Current Report on Form 8-K filed on July 28, 2006, and incorporated herein by reference. |
| | |
| *10.17 |
| *10.17
| | Amended and Restated Supplemental Executive Retirement Bonus Plan of the Registrant effective January 1, 2009. Filed as Exhibit 10.1 to the Registrant’s Quarterly Report on Form 10-Q for the quarter ended May 31, 2009, and incorporated herein by reference. |
| | |
| *10.18 |
| *10.18
| | Form of Change in Control Severance Agreement between the Registrant and each executive officer other than John D. Carter and Tamara L. Lundgren. Filed as Exhibit 10.1 to the Registrant’s Current Report on Form 8-K filed on May 5, 2008, and incorporated herein by reference. |
8878 / Schnitzer Steel Industries, Inc. Form 10-K 20102011
| | | | |
| | |
| *10.19 |
| *10.19
| | Amended and Restated Employment Agreement by and between the Registrant and Tamara L. Lundgren dated October 29, 2008. Filed as Exhibit 10.1 to the Registrant’s Current Report on Form 8-K filed on November 4, 2008, and incorporated herein by reference. |
| | |
| *10.20 |
| *10.20
| | Amended and Restated Change in Control Severance Agreement by and between the Registrant and Tamara L. Lundgren dated October 29, 2008. Filed as Exhibit 10.2 to the Registrant’s Current Report on Form 8-K filed on November 4, 2008, and incorporated herein by reference. |
| | |
| *10.21 |
| *10.21
| | Amended and Restated Employment Agreement by and between the Registrant and John D. Carter dated October 29, 2008. Filed as Exhibit 10.3 to the Registrant’s Current Report on Form 8-K filed on November 4, 2008, and incorporated herein by reference. |
| | |
| *10.22 |
| *10.22
| | Amended and Restated Change in Control Severance Agreement by and between the Registrant and John D. Carter dated October 29, 2008. Filed as Exhibit 10.4 to the Registrant’s Current Report on Form 8-K filed on November 4, 2008, and incorporated herein by reference. |
| | |
| *10.23 |
| *10.23
| | Employment Agreement by and between the Registrant and Gary A. Schnitzer dated June 29, 2009. Filed as Exhibit 10.1 to the Registrant’s Current Report on Form 8-K filed on July 1, 2009, and incorporated herein by reference. |
| | |
| *10.24 |
| *10.24
| | Form of Indemnity Agreement for Directors and Executive Officers. Filed as Exhibit 10.3 to the Registrant’s Current Report on Form 8-K filed on July 28, 2006, and incorporated herein by reference. |
| | |
| *10.25 |
| Fiscal 2011 Annual Performance Bonus Program for John D. Carter and Tamara L. Lundgren. Filed as Exhibit 10.1 to the Registrant's Quarterly Report on Form 10-Q for the quarter ended November 30, 2010 and incorporated herein by reference. |
| |
21.1
*10.26 |
| Amendment No. 1 dated June 29, 2011 to Amended and Restated Employment Agreement by and between the Registrant and Tamara L. Lundgren dated October 29, 2008. Filed as Exhibit 10.1 to the Registrant's Quarterly Report on Form 10-Q for the quarter ended May 31, 2011 and incorporated herein by reference. |
| |
*10.27 |
| Amended and Restated Employment Agreement by and between the Registrant and John D. Carter dated June 29, 2011. Filed as Exhibit 10.2 to the Registrant's Quarterly Report on Form 10-Q for the quarter ended May 31, 2011 and incorporated herein by reference. |
| |
| 21.1 |
| Subsidiaries of Registrant. |
| | |
| 23.1 |
| 23.1
| | Consent of Independent Registered Public Accounting Firm. |
| | |
| 24.1 |
| 24.1
| | Powers of Attorney. |
| | |
| 31.1 |
| 31.1
| | Certification of Chief Executive Officer pursuant to Section 302 of the Sarbanes-Oxley Act of 2002. |
| | |
| 31.2 |
| 31.2
| | Certification of Chief Financial Officer pursuant to Section 302 of the Sarbanes-Oxley Act of 2002. |
| | |
| 32.1 |
| 32.1
| | Certification of Chief Executive Officer pursuant to 18 U.S.C. Section 1350, as adopted pursuant to Section 906 of the Sarbanes-Oxley Act of 2002. |
| | |
| 32.2 |
| 32.2
| | Certification of Chief Financial Officer pursuant to 18 U.S.C. Section 1350, as adopted pursuant to Section 906 of the Sarbanes-Oxley Act of 2002. |
| |
| 101 |
| The following financial information from Schnitzer Steel Industries, Inc.'s Annual Report on Form 10-K for the year ended August 31, 2011, formatted in XBRL (eXtensible Business Reporting Language): (i) Consolidated Statements of Operations for the year ended August 31, 2011, 2010 and 2009, (ii) Consolidated Balance Sheets as of August 31, 2011, and August 31, 2010, (iii) Consolidated Statements of Cash Flows for the year ended August 31, 2011, 2010 and 2009, and (iv) the Notes to Consolidated Financial Statements.(1) |
*Management contract or compensatory plan or arrangement.
*Management | contract
|
| (1) | In accordance with Rule 406T of Regulation S-T, the information in these exhibits is furnished and deemed not filed or compensatory plana part of a registration statement or arrangement. |
79 / Schnitzer Steel Industries, Inc. Form 10-K 20102011
prospectus for purposes of Sections 11 or 12 of the Securities Act of 1933, is deemed not filed for purposes of Section 18 of the Exchange Act of 1934, and otherwise is not subject to liability under these sections and shall not be incorporated by reference into any registration statement or other document filed under the Securities Act of 1933, as amended, except as expressly set forth by the specific reference in such filing.
The agreements and other documents filed as exhibits to this report are not intended to provide factual information or other disclosure other than with respect to the terms of the agreements or other documents themselves, and you should not rely on them for that purpose. In particular, any representations and warranties made by us in these agreements or other documents were made solely within the specific context of the relevant agreement or document and may not describe the actual state of affairs as of the date they were made or at any other time.
80 / 89Schnitzer Steel Industries, Inc. Form 10-K 2011
Pursuant to the requirements of Section 13 or 15(d) of the Securities Exchange Act of 1934, the registrant has duly caused this report to be signed on its behalf by the undersigned, thereunto duly authorized.
|
| | | |
| | SCHNITZER STEEL INDUSTRIES, INC. |
Dated: October 20, 2010 | 2011 | By: | | /s/ RICHARD D. PEACH |
| | | Richard D. Peach |
| | Richard D. Peach
|
| | | | Sr.Senior Vice President and Chief Financial Officer
|
Pursuant to the requirements of the Securities Exchange Act of 1934, this report has been signed below by the following persons on behalf of the
registrant:registrant on October 20,
20102011 in the capacities indicated.
|
| | |
| Signature | | Title |
| |
Principal Executive Officer: | | |
| |
/s/ TAMARA L. LUNDGREN | | President and Chief Executive Officer |
Tamara L. Lundgren | | |
| |
Principal Financial Officer: | | |
| |
/s/ RICHARD D. PEACH | | Sr.Senior Vice President and Chief Financial Officer
|
Richard D. Peach | | |
| |
Principal Accounting Officer: | | |
| |
/s/ JEFF P. POESCHL | | Vice President, Corporate Controller and Principal Accounting Officer |
Jeff P. Poeschl | | |
| |
*DAVID J. ANDERSON | | Director |
| |
David J. Anderson | | |
| |
*ROBERT S. BALL | | Director |
Robert S. Ball | | |
| |
*JOHN D. CARTER | | Director |
John D. Carter | | |
| |
*WILLIAM A. FURMAN | | Director |
William A. Furman | | |
| |
*JUDITH A. JOHANSEN | | Director |
Judith A. Johansen | | |
| |
*WAYLAND R. HICKS | | Director |
Wayland R. Hicks | | |
| |
*WILLIAM D. LARSSON
| | Director
|
William D. Larsson
| | |
| |
*SCOTT LEWIS
| | Director
|
Scott Lewis
| | |
9081 / Schnitzer Steel Industries, Inc. Form 10-K 20102011
|
| | |
| Signature | | Title |
| | |
*WILLIAM D. LARSSON | | Director |
| William D. Larsson | | |
| |
| *SCOTT LEWIS | | Director |
| Scott Lewis | | |
| |
| *KENNETH M. NOVACK | | Director |
Kenneth M. Novack | | |
| |
*JEAN S. REYNOLDS | | Director |
Jean S. Reynolds | | |
| |
*JILL SCHNITZER EDELSON
| | Director
|
Jill Schnitzer Edelson
| | |
| |
*RALPH R. SHAW
| | Director
|
Ralph R. Shaw
| | |
| | | | |
*By:
| | | | |
| *By: | | /s/ RICHARD D. PEACH | | |
| | Attorney-in-fact, Richard D. Peach | | |
82 / Schnitzer Steel Industries, Inc. Form 10-K 2010 / 912011