UNITED STATES
SECURITIES AND EXCHANGE COMMISSION
Washington, D.C. 20549
FORM 10 – K
| x | ANNUAL REPORT PURSUANT TO SECTION 13 OR 15(d) OF THE SECURITIES EXCHANGE ACT OF 1934 |
For the Fiscal Year Ended September 30, 20102012
| ¨ | TRANSITION REPORT PURSUANT TO SECTION 13 OR 15(d) OF THE SECURITIES EXCHANGE ACT OF 1934 |
Commission File No. 001-11703
GENCOR INDUSTRIES, INC.
| Incorporated in the | I.R.S. Employer Identification | |
| State of Delaware | No. 59-0933147 |
5201 North Orange Blossom Trail
Orlando, Florida 32810
Registrant’s Telephone Number, Including Area Code: (407) 290-6000
SECURITIES REGISTERED PURSUANT TO SECTION 12(b) OF THE ACT:
Common Stock ($.10 Par Value)
SECURITIES REGISTERED PURSUANT TO SECTION 12(g) OF THE ACT: None
Indicate by check mark if the registrant is a well-known seasonal issuer, as defined in Rule 405 of the Securities ActAct. ¨ Yes xþ No
Indicate by check mark if the registrant is not required to file reports pursuant to Section 13 or Section 15 (d) of the ActAct. ¨ Yes xþ No
Indicate by check mark whether the Registrant (1) has filed all reports required to be filed by Section 13 or 15(d) of the Securities Exchange Act of 1934 during the preceding 12 months (or for such shorter period that the Registrant was required to file such reports), and (2) has been subject to such filing requirements for the past 90 days. xþ Yes ¨ No
Indicate by check mark whether the registrant has submitted electronically and posted on its corporate Web site, if any, every Interactive Data File required to be submitted and posted pursuant to Rule 405 of Regulation S-T (§ 232.405 of this chapter) during the preceding 12 months (or for such shorter period that the registrant was required to submit and post such files). ¨þ Yes ¨ No
Indicate by check mark if disclosure of delinquent filers pursuant to Item 405 of Regulation S-K is not contained herein, and will not be contained, to the best of registrant’s knowledge, in definitive proxy or information statements incorporated by reference in Part III of this Form 10-K or any amendment to this Form 10-K. ¨
Indicate by check mark whether the registrant is a large accelerated filer, an accelerated filer, a non-accelerated filer or a smaller reporting company. See definitions of “large accelerated filer” and “accelerated filer” and “smaller reporting company” in Rule 12b-2 of the Exchange Act (check one):
| Large Accelerated Filer | ¨ | Accelerated Filer | ¨ | |||
| Non-Accelerated Filer | ¨ (Do not check if a smaller reporting Company) | Smaller Reporting Company | ||||
Indicate by check mark whether the registrant is a shell company (as defined in Rule 12b-2 of the Exchange Act). ¨ Yes xþ No
The aggregate market value of the common equity held by non-affiliates computed by reference to the price at which the common equity was last sold as of the last business day of the most recently completed second fiscal quarter was $50,453,032.$46,932,200.
Indicate the number of shares outstanding of each of the Registrant’s classes of Common Stock, as of the latest practicable date: 8,008,632 shares of Common Stock ($.10 par value) and 1,509,238 shares of Class B Stock ($.10 par value) as of December 17, 2010.3, 2012.
DOCUMENTS INCORPORATED BY REFERENCE
Part III of this Form 10-K is incorporated by reference from the Registrant’s 20112013 Proxy Statement for the Annual Meeting of the Stockholders.
Introductory Note: Caution Concerning Forward-Looking Statements
This annual report on Form 10-K (“Report”) and the Company’s other communications and statements may contain “forward-looking statements,” including statements about the Company’s beliefs, plans, objectives, goals, expectations, estimates, projections and intentions. These statements are subject to significant risks and uncertainties and are subject to change based on various factors, many of which are beyond the Company’s control. The words “may,” “could,” “should,” “would,” “believe,” “anticipate,” “estimate,” “expect,” “intend,” “plan,” “target,” “goal,” and similar expressions are intended to identify forward-looking statements. All forward-looking statements, by their nature, are subject to risks and uncertainties. The Company’s actual future results may differ materially from those set forth in the Company’s forward-looking statements. For information concerning these factors and related matters, see “Risk Factors” in Part I, Item 1A in this Report, and “Management’s Discussion and Analysis of Financial Condition and Results of Operations” in Part II, Item 7 in this Report. However, other factors besides those referenced could adversely affect the Company’s results, and you should not consider any such list of factors to be a complete set of all potential risks or uncertainties. Any forward-looking statements made by the Company herein speak as of the date of this Report. The Company does not undertake to update any forward-looking statement, except as required by law.
PART I
| ITEM 1. | BUSINESS |
General
Gencor Industries, Inc. and its subsidiaries (the “Company”, “Gencor”, “we”, “us” or “our”) is a leading manufacturer of heavy machinery used in the production of highway construction materials, synthetic fuels, and environmental control equipment. The Company’s products are manufactured in two facilities in the United States and one facility, until June 30, 2009, located in the United Kingdom.States. The Company’s products are sold through a combination of Company sales representatives and independent dealers and agents located throughout the world.
The Company designs, manufactures and sells machinery and related equipment used primarily for the production of asphalt and highway construction materials. The Company’s principal core products include asphalt plants, combustion systems and fluid heat transfer systems. The Company believes that its technical and design capabilities, environmentally friendly process technology, and wide range of products have enabled it to become a leading producer of highway construction materials, synthetic fuels and environmental control equipment worldwide. The Company believes it has the largest installed base of asphalt production plants in the United States.
Because the Company’s products are sold primarily to the highway construction industry, the business is seasonal in nature. Traditionally, the Company’s customers do not purchase new equipment for shipment during the summer and fall months to avoid disrupting their peak season for highway construction and repair work. The majority of orders for the Company’s products are typically received between October and February, with a significant volume of shipments occurring prior to May.June. The principal factors driving demand for the Company’s products are the level of government funding for domestic highway construction and repair, infrastructure development in emerging economies, the need for spare parts, and a trend towards larger plants resulting from industry consolidation.
In 1968, the Company was formed by the merger of Mechtron Corporation with General Combustion, Inc. and Genco Manufacturing, Inc. The new entity reincorporated in Delaware in 1969 and adopted the name Mechtron International Corporation in 1970. In 1985, the Company began a series of acquisitions into related fields starting with the Beverley Group Ltd. in the United Kingdom (the “UK”). Hy-Way Heat Company, Inc. and the Bituma Group were acquired in 1986. In 1987, the Company changed its name to Gencor Industries, Inc. and acquired the Davis Line Inc. and its subsidiaries in 1988.
In January 1998, the Company finalizedentered into agreements with Carbontronics, LLC (“CLLC”) pursuant to which the Company sold, designed, manufactured, sold and installed four synthetic fuel production plants. These plants were subsequently sold by CLLC to a limited partnership (“LP”), Carbontronics Synfuels Investors, L.P., which was the owner of the plants. The Company was paid in full for these plants in 1998. In addition to payment for the plants, the Company received a member interest of 45%membership interests in CLLC. Revenue to CLLC was based upon the production of these plants continuing to qualify for tax credits under Section 29 of the Internal Revenue Code, and the ability to economically produce and successfully markettwo synthetic fuel produced by the plants. To the extent the LP was successful in producing fuel which qualifies for tax credits, sold the synthetic fuel, sold the tax credits to investors, and had sufficiententities (“Synfuelcos”). The Synfuelcos derived significant cash flow to cover all operating expenses, then the LP remitted cash to CLLC as additional purchase price forfrom the sale of the plants. CLLC generallysynthetic fuel and tax credits (Internal Revenue Code, Section 29) and consequently distributed anysignificant cash receipts to its investors.
Also, the Company received a 25% partnership positionbeginning in the General Partner (“GP”) of the LP2001 and in Carbontronics II, LLC (“C2LLC”). C2LLC received royalty payments from the LP only if the LP had been successful in producing fuel which qualified for tax credits, sold the synthetic fuel, sold the tax credits to investors, and had sufficient cash flow to cover all other operating expenses. The remaining interests in the GP, CLLC, and C2LLC were owned by other, unrelated entities. An administrative member of the GP, not the Company, was responsible for administration of the day-to-day affairs of the GP and LP. The Company was entitled to appoint one of the three members of the GP Management Committee and had 1/3 of the voting rights thereof. As a part of the member positions in CLLC, C2LLC, and the GP (collectively “Investees”), the Company had the potential for income subject to the performance of the LP.through 2010.
The tax credit legislation expired at the end of calendar year 2007. Consequently, the four synthetic fuel plants were decommissioned. The plants were sold or transferred to site owners in exchange for a release of all contracted liabilities related to the removal of plants from the sites. The administrative partner informedGencor no longer has any position in the Company that there were no operations in calendar 2008Synfuelcos and almost allto the best of the partnership affairs were finalized in 2008. It is not possible to predict the amount of final distributions from the partnerships upon the final disposition and winding-down of operations. Futures distributions are not anticipated to be material.
The Company received $48,000 of distributions in fiscal 2009 and $163,000 of distributions in fiscal 2010.our knowledge those entities have been dissolved.
Products
Asphalt Plants. The Company manufactures and produces hot-mix asphalt plants used in the production of asphalt paving materials. The Company also manufactures related asphalt plant equipment including hot mix storage silos, fabric filtration systems, cold feed bins and other plant components. The Company’s H&B (Hetherington and Berner) product line is the world’s oldest asphalt plant line, first manufactured in 1894. The Company’s subsidiary, Bituma Corporation, formerly known as Boeing Construction Company, developed the first continuous process for asphalt production, which has been adopted as the United States industry’s standard technology, as well asproduction. Gencor developed and patented the Gencorfirst counter flow drum mix technology, several adaptations of which have become the industry standard, which recaptures and burns emissions and vapors, resulting in a cleaner and more efficient process. The Company manufactures a very comprehensive range of fully mobile batch plants, as well as trommel screens.
Combustion Systems and Industrial Incinerators. The Company manufactures combustion systems, which are large burners that can transform most solid, liquid or gaseous fuels into usable energy, or burn multiple fuels, alternately or simultaneously. Through its subsidiary General Combustion, the Company has been a significant source of combustion systems for the asphalt and aggregate drying industries since the 1950’s. The Company also manufactures soil remediation machinery, as well as combustion systems for rotary dryers, kilns, fume and liquid incinerators and fuel heaters. The Company believes maintenance and fuel costs are lower for its burners because of their superior design.
Fluid Heat Transfer Systems. The Company’s General Combustion subsidiary also manufactures the Hy-Way heat and Beverley lines of thermal fluid heat transfer systems and specialty storage tanks for a wide array of industry uses. Thermal fluid heat transfer systems are similar to boilers, but use high temperature oil instead of water. Thermal fluid heaters have been replacing steam pressure boilers as the best method of heat transfer for storage, heating and pumping viscous materials (i.e., asphalt, chemicals, heavy oils, etc.) in many industrial and petrochemical applications worldwide. The Company believes the high efficiency design of its thermal fluid heaters can outperform competitive units in many types of process applications.
Product Engineering and Development
The Company is engaged in product engineering and development efforts to expand its product lines and to further develop more energy efficient and environmentally compatible systems.
Significant developments include the use of cost effective, non-fossil fuels, biomass (bagasse, municipal solid waste, sludge and wood waste), refuse-derived fuel, coal and coal mixtures, the economical recycling of old asphalt and new designs of environmentally compatible asphalt plants. Product engineering and development activities are directed toward more efficient methods of producing asphalt and lower cost fluid heat transfer systems. In addition, efforts are also focused on developing combustion systems that operate at higher efficiency and offer a higher level of environmental compatibility. The Company also continues to evaluate opportunities in the energy field.
Sources of Supply and Manufacturing
Substantially all products and components sold by the Company and its subsidiaries are manufactured orand assembled by the Company, except for procured raw materials and hardware. The Company purchases a large quantity of steel, raw materials and hardware used to manufacture its products from hundreds of suppliers and is not dependent on any single supplier. Periodically, the Company reviews the cost effectiveness of internal manufacturing versus outsourcing its product lines to independent third parties and currently believes it has the internal capability to produce the highest quality product at the lowest cost. This, however, may change from time to time.
Seasonality
The Company is concentrated in the asphalt-related business and subject to a seasonal slow-down during the third and fourth quarters of the calendar year. Traditionally, the Company’s customers do not purchase new equipment for shipment during the summer and fall months to avoid disrupting their peak season for highway construction and repair work. This slow-down often results in lower reported sales and earnings and/or losses during the first and fourth quarters of the Company’s fiscal year.
Competition
The markets for the Company’s products are highly competitive. Within a given product line, the industry remains fairly concentrated, with typically a small number of companies competing for the majority of a product line’s industry sales. The principal competitive factors include technology and overall product design,design. The Company believes it manufactures the heaviest equipment in the industry. In addition, dependability and reliability of performance, brand recognition, pricing and after-the-sale customer support.support are significant factors. Management believes its ability to compete depends upon its continual efforts to maintain and improve product performance, availability and dependability, competitively price its products, and provide the best customer support and service in the industry.
Sales and Marketing
The Company’s products and services are marketed internationally through a combination of Company employed sales representatives and independent dealers and agents.
Sales Backlog
The Company’s manufacturing processes allow for a relatively short turnaround from the order date to shipment date of usually less than ninety days. Therefore, the size of the Company’s backlog should not be viewed as an indicator of the Company’s annualized revenues or future financial results. The Company’s backlog was approximately $11.4$7.8 million and $13$18.6 million as of December 1, 20102012 and December 1, 2009,2011, respectively.
Financial Information about Geographic Areas Reporting Segments
The Company sold its operations in the United Kingdom in June 2009. For a geographic breakdown of revenues and long-term assets see the table captioned Reporting Segments in Note 1 to the Consolidated Financial Statements in Item 8.Statements.
Licenses, Patents and Trademarks
The Company holds numerous patents covering technology and applications related to various products, equipment and systems, and numerous trademarks and trade names registered with the U.S. Patent and Trademark Office and in various foreign countries. In general, the Company depends upon technological capabilities, manufacturing quality control and application know-how, rather than patents or other proprietary rights in the conduct of its business. The Company believes the expiration of any one of these patents, or a group of related patents, would not have a material adverse effect on the overall operations of the Company.
Government Regulations
The Company believes its design and manufacturing processes meet all industry and governmental agency standards that may apply to its entire line of products, including all domestic and foreign environmental, structural, electrical and safety codes. The Company’s products are designed and manufactured to comply with U.S. Environmental Protection Agency regulations. Certain state and local regulatory authorities have strong environmental impact regulations. While the Company believes that such regulations have helped, rather than restricted its marketing efforts and sales results, there is no assurance that changes to federal, state, local, or foreign laws and regulations will not have a material adverse effect on the Company’s products and earnings in the future.
Environmental Matters
The Company is subject to various federal, state, local and foreign laws and regulations relating to the protection of the environment. The Company believes it is in material compliance with all applicable environmental laws and regulations. The Company does not expect any material impact on future operating costs as a result of compliance with currently enacted environmental regulations.
Employees
As of September 30, 2010,2012, the Company employed a total of 214 employees, all in its domestic operations.263 employees. The Company has a collective bargaining agreementsagreement covering production and maintenance employees at its Marquette, Iowa facility. The remaining domestic employees are not represented by a labor union or collective bargaining agreement. The Company believes that its relationship with its employees is good.
Available Information
For further discussion concerning the Company’s business, see the information included in Item 7 (Management’s Discussion and Analysis of Financial Condition and Results of Operations) and Item 8 (Financial Statements and Supplementary Data) of this Report.
The Company makes available free of charge through its web site at www.gencor.com the Company’s Annual Report on Form 10-K, quarterly reports on Form 10-Q, current reports on Form 8-K and all amendments to those
reports, if applicable, filed or furnished pursuant to Sections 13(a) and 15(d) of the Securities Exchange Act of 1934, as amended, as soon as reasonably practicable after the material is electronically filed with or furnished to the Securities and Exchange Commission (“SEC”). The information posted on the web site is not incorporated into this Annual Report on Form 10-K.
| ITEM 1A. | RISK FACTORS |
The following risk factors and other information included in this Annual Report on Form 10-K should be carefully considered. The risks and uncertainties described below are not the only ones the Company faces. Additional risks and uncertainties not presently known to the Company or that the Company presently deems less significant may also impair the Company’s business operations. If any of the following risks actually occur, the Company’s business operating results and financial condition could be materially adversely affected. The order of these risk factors does not reflect their relative importance or likelihood of occurrence.
The business may be adversely affected by the current economic downturn.
The domestic and international economies are experiencinghave experienced a significant downturn. This downturn has been magnified by the tightening of the credit markets. The domestic and international markets may remain depressed for an undeterminable period of time. The Company’s sales to contractors are dependent on construction and infrastructure spending and availability of credit to its customers. Changes in construction and governmental spending have had and could continue to have a material adverse effect on the Company’s results of operations.
The business is affected by the cyclical nature of the markets it serves.
The demand for the Company’s products and service is dependent on general economic conditions and more specifically, the commercial construction industry. Adverse economic conditions may cause customers to forego or delay new purchases and rely more on repairing existing equipment thus negatively impacting the Company’s sales and profits. Rising gas and oil prices, increasing steel prices and shortage of qualified workers can have adverse effects on the Company. Market conditions could limit the Company’s ability to raise selling prices to offset increases in inventory costs.
The business is affected by the level of government funding for highway construction.construction in the United States and Canada.
Many contractors depend on funding by federal and state agencies for highway, transit and infrastructure programs. Future legislation may increase or decrease government spending, which if decreased, could have a negative affect on the Company’s financial condition or results of operations. Federal funding ofallocated to infrastructure may be decreased in the future.
In fiscal year 2012 the Company depended on one customer for a significant portion of its revenue. The loss of this relationship could have adverse consequences on the Company’s future especially sincebusiness.
The percentage of the United States is currently experiencing an economic downturn.Company’s net revenue that was derived from sales to one customer was 26% in fiscal 2012 and 7% in fiscal 2011. Prior to fiscal 2010, no customer accounted for more than 10% of annual net revenue.
If the Company fails to comply with requirements relating to internal control over financial reporting under Section 404 of the Sarbanes-Oxley Act, the business could be harmed and its stock price could decline.
Rules adopted by the Securities and Exchange Commission pursuant to Section 404 of the Sarbanes-Oxley Act of 2002 require the Company to assess its internal control over financial reporting annually. The rules governing the standards that must be met for management to assess its internal control over financial reporting are complex. They require significant documentation, testing, and possible remediation of any significant deficiencies in and/or material weaknesses of internal controls in order to meet the detailed standards under these rules. The Company has evaluated its internal control over financial reporting as effective as of September 30, 2010.2012. See Item 9A(T)9A – Controls and Procedures – Management’s Annual Report on Internal Control over Financial Reporting. Although the Company has evaluated its internal control over financial reporting as effective as of September 30, 2010,2012, in future fiscal years, the Company may encounter unanticipated delays or problems in assessing its internal control over financial reporting as effective or in completing its assessments by the required dates. In addition, the Company cannot assure you that its independent registered public accountants will attest that internal control over financial reporting are effective in future fiscal years. If the Company cannot assess its internal control over financial reporting as effective, investor confidence and share value may be negatively impacted.
The Company may be required to reduce its profit margins on contracts on which it uses the percentage-of-completion accounting method.
The Company records revenues and profits on many of its contracts using the percentage-of-completion method of accounting. As a result, revisions made to the estimates of revenues and profits are recorded in the period in which the conditions that require such revisions become known and can be estimated. Although the Company
believes that its profit margins are fairly stated and that adequate provisions for losses for its fixed-price contracts are recorded in the financial statements, as required under U.S. generally accepted accounting principles (GAAP), the Company cannot assure you that its contract profit margins will not decrease or its loss provisions will not increase materially in the future.
The Company may encounter difficulties with future acquisitions.acquisitions.
As part of its growth strategy, the Company intends to evaluate the acquisitions of other companies, assets or product lines that would complement or expand the Company’s existing businesses or broaden its customer relationships. Although the Company conducts due diligence reviews of potential acquisition candidates, it may not be able to identify all material liabilities or risks related to potential acquisition candidates. There can be no assurance that the Company will be able to locate and acquire any business, retain key personnel and customers of an acquired business or integrate any acquired business successfully. Additionally, there can be no assurance that financing for any acquisition, if necessary, will be available on acceptable terms, if at all, or that the Company will be able to accomplish its strategic objectives in connection with any acquisition. Although the Company periodically considers possible acquisitions, no specific acquisitions are probable as of the date of this Report on Form 10-K.
Demand for the Company’s products is cyclical in nature.nature.
Orders for the Company’s products slow down during the summer and fall months since its customers generally do not purchase new equipment for shipment in their peak season for highway construction and repair work. In addition, demand for the Company’s products depends in part upon the level of capital and maintenance expenditures by the highway construction industry. The highway construction industry historically has been cyclical in nature and vulnerable to general downturns in the economy. Decreases in industry spending could have a material adverse effect upon demand for the Company’s products and negatively impact its business, financial condition, results of operations and the market price of its common stock.
The Company’s marketable securities are comprised of cash and cash equivalents, stocks and bonds invested through a professional investment advisormanagement firm and are subject to various risks such as interest rates, markets, and credit.
Due to the level of risk associated with certain investment securities and the level of uncertainty related to changes in the value of securities, changes in these risk factors could have a material adverse impact on the Company’s results of operations.
There are and will continue to be quarterly fluctuations of the Company’s operating results.
The Company’s operating results historically have fluctuated from quarter to quarter as a result of a number of factors, including the value, timing and shipment of individual orders and the mix of products sold. Revenues from certain large contracts are recognized using the percentage of completion method of accounting. The Company recognizes product revenues upon shipment for the rest of its products. The Company’s asphalt production equipment operations are subject to seasonal fluctuation, which may lower revenues and result in possible losses in the first and fourth fiscal quarters of each year. Traditionally, asphalt producers do not purchase new equipment for shipment during the summer and fall months to avoid disruption of their activities during peak periods of highway construction.
If the Company is unable to attract and retain key personnel, its business could be adversely affected.
The success of the Company will continue to depend substantially upon the efforts, abilities and services of its management team and certain other key employees. The loss of one or more key employees could adversely affect the Company’s operations. The Company’s ability to attract and retain qualified personnel, either through direct hiring, or acquisition of other businesses employing such persons, will also be an important factor in determining its future success.
The Company may be required to defend its intellectual property against infringement or against infringement claims of others.
The Company holds numerous patents covering technology and applications related to various products, equipment and systems, and numerous trademarks and trade names registered with the U.S. Patent and Trademark Office and in various foreign countries. There can be no assurance as to the breadth or degree of protection that existing or future patents or trademarks may afford the Company, or that any pending patent or trademark applications will result in issued patents or trademarks, or that the Company’s patents, registered trademarks or patent applications, if any, will be upheld if challenged, or that competitors will not develop similar or superior methods or products outside the protection of any patents issued, licensed or sublicensed to the Company. Although the Company believes that none of its patents, technologies, products or trademarks infringe upon the patents, technologies, products or trademarks of others, it is possible that the Company’s existing patents, trademarks or other rights may not be valid or that infringement of existing or future patents, trademarks or proprietary rights may occur. In the event that the Company’s products are deemed to infringe upon the patent or proprietary rights of others, the Company could be required to modify the design of its products, change the name of its products or obtain a license for the use of certain technologies incorporated into its products. There can be no assurance that the Company would be able to do any of the foregoing in a timely manner, upon acceptable terms and conditions, or at all, and the failure to do so could have a material adverse effect on the Company. In addition, there can be no assurance that the Company will have the financial or other resources necessary to enforce or defend a patent, registered trademark or other proprietary right, and, if the Company’s products are deemed to infringe upon the patents, trademarks or other proprietary rights of others, the Company could become liable for damages, which could also have a material adverse effect on the Company.
The Company may be subject to substantial liability for the products it produces.
The Company is engaged in a business that could expose it to possible liability claims for personal injury or property damage due to alleged design or manufacturing defects in its products. The Company believes that it meets existing professional specification standards recognized or required in the industries in which it operates, and there are no material product liability claims pending against the Company as of the date hereof. Although the Company currently maintains product liability coverage which it believes is adequate for the continued operation of its business, such insurance may prove inadequate or become difficult to obtain or unobtainable in the future on terms acceptable to the Company.
The Company is subject to extensive environmental laws and regulations, and the costs related to compliance with, or the Company’s failure to comply with, existing or future laws and regulations, could adversely affect the business and results of operations.
The Company’s operations are subject to federal, state, local and foreign laws and regulations relating to the protection of the environment. Sanctions for noncompliance may include revocation of permits, corrective action orders, significant administrative or civil penalties and criminal prosecution. The Company’s business involves environmental management and issues typically associated with historical manufacturing operations. To date, the Company’s cost of complying with environmental laws and regulations has not been material, but the fact that such laws or regulations are changed frequently makes predicting the cost or impact of such laws and regulations on the Company’s future operations uncertain.
The loss of one or more of the Company’s raw materials suppliers, or increase in prices, could cause production delays, a reduction of revenues or an increase in costs.
The principal raw materials the Company uses are steel and related products. The Company has no long-term supply agreements with any of its major suppliers. However, the Company has generally been able to obtain sufficient supplies of raw materials for its operations. Although the Company believes that such raw materials are readily available from alternate sources, an interruption in the supply of steel and related products or a substantial increase in the price of any of these raw materials could have a material adverse effect on the Company’s business, financial condition and results of operations.
The Company is subject to significant government regulations.
The Company is subject to a variety of governmental regulations relating to the manufacturing of its products. Any failure by the Company to comply with present or future regulations could subject it to future liabilities, or the suspension of production that could have a material adverse effect on the Company’s results of operations. Such regulations could also restrict the Company’s ability to expand its facilities, or could require the Company to acquire costly equipment or to incur other expenses to comply with such regulations. Although the Company believes it has the design and manufacturing capability to meet all industry or governmental agency standards that may apply to its product lines, including all domestic and foreign environmental, structural, electrical and safety codes, there can be no assurance that governmental laws and regulations will not become more stringent over time, imposing greater compliance costs and increasing risks and penalties associated with a violation. The cost to the Company of such compliance to date has not materially affected its business, financial condition or results of operations. There can be no assurance, however, that violations will not occur in the future as a result of human error, equipment failure or other causes. The Company’s customers are also subject to extensive regulations, including those related to the workplace. The Company cannot predict the nature, scope or effect of governmental legislation, or regulatory requirements that could be imposed or how existing or future laws or regulations will be administered, or interpreted. Compliance with more stringent laws or regulations, as well as more vigorous enforcement policies of regulatory agencies, could require substantial expenditures by the Company and could adversely affect its business, financial condition and results of operations.
The Company’s management has effective voting control.
The Company’s officers and directors beneficially own an aggregate of approximately 94.6%96.8% of the outstanding shares of the Company’s $.10 par value Class B stock. The Class B stock is entitled to elect 75% (calculated to the nearest whole number, rounding five-tenths to next highest whole number) of the members of its Board of Directors. Further, approval of a majority of the Class B stock is generally required to effect a sale of the Company and certain other corporate transactions. As a result, these stockholders can elect more than a majority of the Board of Directors and exercise significant influence over most matters requiring approval by the Company’s stockholders. This concentration of control may also have the effect of delaying or preventing a change in control.
The issuance of preferred stock may impede a change of control or may be dilutive to existing stockholders.
The Company’s Certificate of Incorporation, as amended, authorizes the Company’s Board of Directors, without stockholder vote, to issue up to 300,000 shares of preferred stock in one or more series and to determine for any series the dividend, liquidation, conversion, voting or other preferences, rights and terms that are senior, and not available, to the holders of the Company’s common stock. Thus, issuances of series of preferred stock could adversely affect the relative voting power, distributions and other rights of the common stock. The issuance of preferred stock could deter or impede a merger, tender offer or other transaction that some, or a majority of the Company’s common stockholders might believe to be in their best interest or in which the Company’s common stockholders might receive a premium for their shares over the then current market price of such shares.
The Company may be required to indemnify its directors and executive officers.
The Company has authority under Section 145 of the Delaware General Corporation Law to indemnify its directors and officers to the extent provided in that statute. The Company’s Certificate of Incorporation, as amended, provides that a director shall not be personally liable to the Company for breach of fiduciary duty as a director, except to the extent such exemption from liability or limitation thereof is not permitted under the Delaware General Corporation Law. The Company’s Bylaws provide in part that it indemnify each of its directors and officers against liabilities imposed upon them (including reasonable amounts paid in settlement) and expenses incurred by them in connection with any claim made against them or any action, suit or proceeding to which they may be a party by reason of their being or having been a director or officer. The Company maintains officer’s and director’s liability insurance coverage. There can be no assurance that such insurance will be available in the future, or that if available, it will be available on terms that are acceptable to the Company. Furthermore, there can be no assurance that the insurance coverage provided will be sufficient to cover the amount of any judgment awarded against an officer or director (either individually or in the aggregate).
Consequently, if such judgment exceeds the coverage under the policy, the Company may be forced to pay such difference.
The Company enters into indemnification agreements with each of its executive officers and directors containing provisions that may require the Company, among other things, to indemnify them against certain liabilities that may arise by reason of their status or service as officers or directors (other than liabilities arising from willful misconduct of a culpable nature) and to advance their expenses incurred as a result of any proceeding against them as to which they could be indemnified. Management believes that such indemnification provisions and agreements are necessary to attract and retain qualified persons as directors and executive officers.
The Company does not expect to pay dividends for the foreseeable future.
For the foreseeable future, the Company intends to retain any earnings to finance its business requirements, and it does not anticipate paying any cash dividends on its common stock or Class B stock. Any future determination to pay dividends will be at the discretion of the Company’s Board of Directors and will be dependent upon then existing conditions, including the financial condition and results of operations, capital requirements, contractual restrictions, business prospects, and other factors that the Board of Directors considers relevant.
Competition could reduce revenue from the Company’s products and services and cause it to lose market share.
The Company currently faces strong competition in product performance, price and service. Some of the Company’s national competitors have greater financial, product development and marketing resources than the Company. If competition in the Company’s industry intensifies or if the current competitors enhance their products or lower their prices for competing products, the Company may lose sales or be required to lower the prices it charges for its products. This may reduce revenues from the Company’s products and services, lower its gross margins or cause it to lose market share.
The Company’s quarterly operating results are likely to fluctuate, which may decrease its stock price.
The Company’s quarterly revenues, expenses and operating results have varied significantly in the past and are likely to vary significantly from quarter to quarter in the future. As a result, the Company’s operating results may fall below the expectations of securities analysts and investors in some quarters, which could result in a decrease in the market price of its common stock. The reasons the Company’s quarterly results may fluctuate include:
General competitive and economic conditions
Delays in, or uneven timing in, delivery of customer orders
The seasonal nature of the industry
The introduction of new products by the Company or its competitors
Product supply shortages, and
Reduced demand due to adverse weather conditions.
Period-to-period comparisons of such items should not be relied on as indications of future performance.
The Company’s stock has been, and likely will continue to be, subject to substantial price and volume fluctuations due to a number of factors, many of which will be beyond the Company’s control.
In recent years, the stock market in general and the market for the Company’s common stock has experienced extreme price fluctuations. The market price of the Company’s common stock may be significantly affected by various factors such as:
Quarterly variations in operating results
Changes in revenue growth rates as a whole or for specific geographic areas or products
Changes in earningearnings estimates by market analysts
The announcement of new products or product enhancements by the Company or its competitors
Speculation in the press or analyst community, and
General market conditions or market conditions specific to particular industries.
The market price of the Company’s common stock may experience significant fluctuations in the future.
| ITEM 1B. | UNRESOLVED STAFF COMMENTS |
None
| ITEM 2. | PROPERTIES |
The following table lists the operating properties owned by the Company as of September 30, 2010:2012:
Location | Owned Acreage | Building Square Footage | Principal Function | Owned Acreage | Building Square Footage | Principal Function | ||||||||||||||
Marquette, Iowa | 72.0 | 137,000 | Offices and manufacturing | 72.0 | 137,000 | Offices and manufacturing | ||||||||||||||
Orlando, Florida | 27.0 | 215,000 | Corporate offices and manufacturing | 27.0 | 215,000 | Corporate offices and manufacturing | ||||||||||||||
Billingshurst, West Sussex, England | 1.2 | 5,000 | Offices | |||||||||||||||||
| ITEM 3. | LEGAL PROCEEDINGS |
The Company has various litigation and claims, either as a plaintiff or defendant, pending as of the date of this Form 10-K which have occurred in the ordinary course of business, and which may be covered in whole or in part by insurance. Management has reviewed all litigation matters arising in the ordinary course of business and, upon advice of counsel, has made provisions, not deemed material, for any estimable losses and expenses of litigation.
| ITEM 4. |
There were no matters submitted during the fourth quarter of this fiscal year to a vote of security holders.
PART II
| ITEM 5. | MARKET FOR THE REGISTRANT’S COMMON EQUITY, RELATED STOCKHOLDER MATTERS AND ISSUER’S PURCHASES OF EQUITY SECURITIES |
The Company’s stock has been traded on the NASDAQ Global Market under the symbol “GENC” since December 20, 2007.
Following are the high and low closing prices for the Company’s common stock for the periods indicated:
2010 | HIGH | LOW | ||||||||||||||
2012 | HIGH | LOW | ||||||||||||||
First Quarter | $ | 8.56 | $ | 7.03 | $ | 7.25 | $ | 6.75 | ||||||||
Second Quarter | $ | 7.91 | $ | 6.76 | $ | 7.45 | $ | 6.70 | ||||||||
Third Quarter | $ | 8.15 | $ | 7.30 | $ | 7.55 | $ | 6.76 | ||||||||
Fourth Quarter | $ | 7.86 | $ | 6.83 | $ | 7.94 | $ | 7.22 | ||||||||
2009 | HIGH | LOW | ||||||||||||||
2011 | HIGH | LOW | ||||||||||||||
First Quarter | $ | 8.73 | $ | 4.81 | $ | 7.62 | $ | 6.94 | ||||||||
Second Quarter | $ | 8.44 | $ | 5.60 | $ | 8.10 | $ | 7.17 | ||||||||
Third Quarter | $ | 8.70 | $ | 6.25 | $ | 8.03 | $ | 7.45 | ||||||||
Fourth Quarter | $ | 8.70 | $ | 6.05 | $ | 7.75 | $ | 7.11 | ||||||||
As of September 30, 2010,2012, there were 294276 holders of common stock of record and six5 holders of Class B Stock of record. The Company has not paid any dividends during the last two fiscal years and there is no intention to pay cash dividends in the foreseeable future.
EQUITY COMPENSATION PLANS
The following table includes information about the Company’s common stock that may be issued upon exercise of options, warrants and rights under all of the existing equity compensation plans and arrangements previously approved by security holders as of September 30, 2010:2012:
Plan | Number of Securities to be Issued upon Exercise of Outstanding Options, Warrants and Rights (a) | Weighted-average Exercise Price of Outstanding Options, Warrants and Rights | Number of Securities Remaining Available for Future Issuance under Equity Compensation Plans (excluding securities reflected in column (a)) | Number of Securities to be Issued upon Exercise of Outstanding Options, Warrants and Rights (a) | Weighted-average Exercise Price of Outstanding Options, Warrants and Rights | Number of Securities Remaining Available for Future Issuance under Equity Compensation Plans (excluding securities reflected in column (a)) | ||||||||||||||||||
1997 Stock Option Plan | 27,500 | $ | 9.32 | — | 27,500 | $ | 9.320 | — | ||||||||||||||||
2009 Incentive Compensation Plan | — | — | 960,000 | 318,000 | $ | 7.655 | 642,000 | (b) | ||||||||||||||||
| (b) | Includes 160,000 of Class B securities |
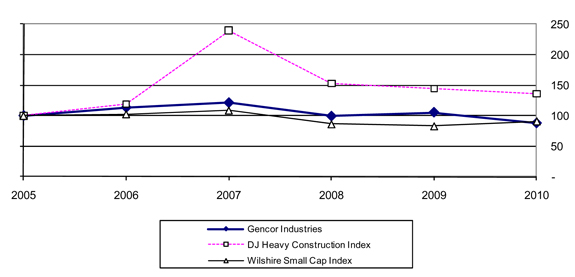
COMPARATIVE 5 YEAR CUMULATIVE RETURN GRAPH
The following graph sets forth the cumulative total stockholder return (assuming reinvestment of dividends) to the Company’s stockholders during the five-year period ended September 30, 2010,2012, as well as the Wilshire Small Capitalization Index and the Dow Jones Heavy Construction Index. The stock performance assumes $100 was invested on October 1, 2005.2007.
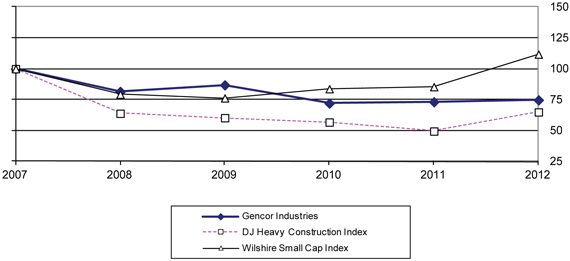
Comparison of Cumulative Total Return among Gencor Industries, Inc., the
Wilshire Small Capitalization Index and the Dow Jones Heavy Construction Index
With Base Year of 2005: | 9/30/2005 | 9/30/2006 | 9/30/2007 | 9/30/2008 | 9/30/2009 | 9/30/2010 | ||||||||||||||||||||||||||||||||||||||||||
With Base Year of 2007: | 9/30/2007 | 9/30/2008 | 9/30/2009 | 9/30/2010 | 9/30/2011 | 9/30/2012 | ||||||||||||||||||||||||||||||||||||||||||
Gencor Industries, Inc. | 100.00 | 113.50 | 121.47 | 99.14 | 105.52 | 87.61 | 100.00 | 81.62 | 86.87 | 72.12 | 73.23 | 74.75 | ||||||||||||||||||||||||||||||||||||
DJ Heavy Construction Index | 100.00 | 118.83 | 239.58 | 153.07 | 144.56 | 136.10 | 100.00 | 63.89 | 60.34 | 56.81 | 49.52 | 64.99 | ||||||||||||||||||||||||||||||||||||
Wilshire Small Cap Index | 100.00 | 102.47 | 108.56 | 86.17 | 82.85 | 90.94 | 100.00 | 79.37 | 76.32 | 83.76 | 85.44 | 111.77 | ||||||||||||||||||||||||||||||||||||
On December 17, 2010,12, 2012, the Company’s stock was available for trading on the NASDAQ Global Market under the symbol “GENC”.
| ITEM 6. | SELECTED FINANCIAL DATA |
| Years Ended September 30 | Years Ended September 30 | |||||||||||||||||||||||||||||||||||||||
| 2010 | 2009 | 2008 | 2007 | 2006 | 2012 | 2011 | 2010 | 2009 | 2008 | |||||||||||||||||||||||||||||||
| (in thousands, except per share data) | (in thousands, except per share data) | |||||||||||||||||||||||||||||||||||||||
Net Revenue | $ | 55,587 | $ | 56,789 | $ | 88,343 | $ | 75,286 | $ | 67,107 | $ | 63,182 | $ | 59,692 | $ | 55,587 | $ | 56,789 | $ | 88,343 | ||||||||||||||||||||
Operating Income (Loss) | (3,049 | ) | (4,769 | ) | 6,848 | 6,333 | 1,359 | 393 | (1,743 | ) | (3,049 | ) | (4,769 | ) | 6,848 | |||||||||||||||||||||||||
Net Income (Loss) | 2,969 | (2,551 | ) | 15,247 | 18,495 | 11,587 | 4,472 | 224 | 2,969 | (2,551 | ) | 15,247 | ||||||||||||||||||||||||||||
Per Share Data: | ||||||||||||||||||||||||||||||||||||||||
Basic – Net Income (Loss) | $ | 0.31 | $ | (0.27 | ) | $ | 1.59 | $ | 1.91 | $ | 1.17 | $ | 0.47 | $ | 0.02 | $ | 0.31 | $ | (0.27 | ) | $ | 1.59 | ||||||||||||||||||
Diluted – Net Income (Loss) | $ | 0.31 | $ | (0.27 | ) | $ | 1.59 | $ | 1.91 | $ | 1.17 | $ | 0.47 | $ | 0.02 | $ | 0.31 | $ | (0.27 | ) | $ | 1.59 | ||||||||||||||||||
| Selected Balance Sheet Data: | September 30 | |||||||||||||||||||||||||||||||||||||||
| 2010 | 2009 | 2008 | 2007 | 2006 | September 30 | |||||||||||||||||||||||||||||||||||
| (in thousands) | 2012 | 2011 | 2010 | 2009 | 2008 | |||||||||||||||||||||||||||||||||||
| (in thousands) | ||||||||||||||||||||||||||||||||||||||||
Current Assets | $ | 99,096 | $ | 95,806 | $ | 105,216 | $ | 96,392 | $ | 67,634 | $ | 102,090 | $ | 95,424 | $ | 99,096 | $ | 95,806 | $ | 105,216 | ||||||||||||||||||||
Current Liabilities | 6,174 | 5,707 | 12,807 | 14,048 | 11,888 | 5,878 | 5,576 | 6,174 | 5,707 | 12,807 | ||||||||||||||||||||||||||||||
Total Assets | 107,227 | 104,457 | 114,217 | 104,227 | 80,974 | 110,312 | 104,375 | 107,227 | 104,457 | �� | 114,217 | |||||||||||||||||||||||||||||
Long Term Debt | — | — | — | — | — | — | — | — | — | — | ||||||||||||||||||||||||||||||
Shareholders’ Equity | 98,528 | 96,297 | 99,015 | 83,781 | 63,043 | 103,460 | 98,799 | 98,528 | 96,297 | 99,015 | ||||||||||||||||||||||||||||||
| ITEM 7. | MANAGEMENT’S DISCUSSION AND ANALYSIS OF FINANCIAL CONDITION AND RESULTS OF OPERATIONS |
“Forward-Looking” Information
This Form 10-K contains certain “forward-looking statements” within the meaning of Section 21E of the Securities Exchange Act of 1934, as amended (the “Exchange Act”), which represent the Company’s expectations and beliefs, including, but not limited to, statements concerning gross margins, sales of the Company’s products and future financing plans, income from investees and litigation. These statements by their nature involve substantial risks and uncertainties, certain of which are beyond the Company’s control. Actual results may differ materially depending on a variety of important factors, including the financial condition of the Company’s customers, changes in the economic and competitive environments, the performance of the investment portfolio and the demand for the Company’s products.
For information concerning these factors and related matters, see “Risk Factors” in Part I, Item 1A in this Report. However, other factors besides those referenced could adversely affect the Company’s results, and you should not consider any such list of factors to be a complete set of all potential risks or uncertainties. Any forward-looking statements made by the Company herein speak as of the date of this Report. The Company does not undertake to update any forward-looking statement, except as required by law.
Overview
Gencor Industries, Inc., (the “Company”) is a leading manufacturer of heavy machinery used in the production of highway construction materials, synthetic fuels, and environmental control equipment. The Company’s core products include asphalt plants, combustion systems and fluid heat transfer systems. The Company’s products are manufactured in two facilities in the United States.
Because the Company’s products are sold primarily to the highway construction industry, the business is seasonal in nature. Traditionally, the Company’s customers do not purchase new equipment for shipment during the summer and fall months to avoid disrupting their peak season for highway construction and repair work. The majority of orders for the Company’s products are thus received between October and February, with a significant volume of shipments occurring prior to May.June. The principal factors driving demand for the Company’s products are the overall economic conditions, the level of government funding for domestic highway construction and repair, infrastructure development in emerging economies, the need for spare parts, fluctuations in the price of crude oil (liquid asphalt as well as fuel costs), and a trend towards larger plants resulting from industry consolidation.
In August 2005, the federal government passed the Safe, Accountable, Flexible and Efficient Transportation Equity Act - -– A Legacy for Users (“SAFETEA-LU”). This bill appropriated a multi-year guaranteed funding of $286.5 billion for federal highway, transit and safety programs that expired on September 30, 2009. On February 17, 2009, President Obama signed into law the American Recovery and Reinvestment Act of 2009 (“ARRA”), which included approximately $27.5 billion for highway and bridge construction activities. The ARRA and any future legislation approved by Congress could reduce infrastructure funding levels. In addition, funding restrictions can be imposed on states that do not comply with certain federal policies. On March 18, 2010, President Obama signed into law the Hiring Incentives to Restore Employment (“HIRE”) Act. This law extendsextended authorization of the surface transportation programs previously funded under SAFETEA-LU through December 31, 2010 at 2009 levels. In addition, the HIRE Act authorizesauthorized a one-time transfer of $19.5 billion from the general fund to the highway trust fund related to previously foregone interest payments. AlthoughOn December 22, 2010, President Obama signed into law the HIREContinuing Appropriations and Surface Transportation Extensions Act, should help stabilize2011 extending funding for federal surface transportation programs authorized under SAFETEA-LU through March 4, 2011. On March 4, 2011, President Obama signed into law the Surface Transportation Extension Act of 2011 providing an extension of Federal-aid highway, transit and other programs funded out of the Highway Trust Fund through September 30, 2011. On September 17, 2011, President Obama signed an eighth extension of SAFETEA-LU, authorizing funding at 2011 levels through March 31, 2012, and on March 30, 2012, the President signed into law the Surface Transportation Extension Act of 2012, a 90-day extension of the existing federal transportation reauthorization. The bill contained no policy changes and extended current programs and funding levels through June 30, 2012, pending enactment of a multi-year law reauthorizing such programs.
On July 6, 2012, President Obama signed a $118 billion transportation bill, Moving Ahead for Progress in the 21st Century Act (“MAP-21”). MAP-21 includes a final three-month extension of SAFETEA-LU at current spending levels combined with a new two-year, $105 billion authorization of the federal highway, program, thetransit, and safety programs effective October 1, 2012. The new bill will provide states and communities with two years of steady funding needed to build roads, bridges, and transit systems. The Company believes this will have a new multi-year highway program would have the greatest positivemodest impact on the road construction industry and will allow its customers to plan and execute longer term projects. The Company believes that its customers are waiting on the states to move forward with potential projects as their purchasing decisions are significantly influenced by the federal government’s legislation on federal road building funding. The Company believes any new funding will have a positive impact on the Company’s financial performance, although the magnitude of that improvement cannot be determined.
In January 2009,addition, the Canadian government announced itsenacted major infrastructure stimulus programs which have benefitted the Company. In 2007, the Building Canada Plan provided $33 billion in infrastructure funding through 2014. As part of the Building Canada Plan, the Gas Tax Fund was approved in 2009, providing $2 billion in annual infrastructure spending. The Infrastructure Canada Plan provided $4 billion additional infrastructure funding from 2009 through 2011.
The economic action plan to stimulate economic growth which includeddownturn over the past several years and the lack of a $12 billion two year investment in new infrastructure including roads, bridges and other infrastructure. The Company believes that certain programs associated with this funding willmulti-year federal highway bill have a positive impact on its financial performance although the magnitude of that impact cannot be determined.
Economic downturns like the one currently being experienced generally resultresulted in reduced purchasing within the Company’s served markets and thus have a directmarkets. This had an adverse impact on sales and tend to increase the pricing pressures on the Company’s products, resulting in lower pricingrevenues and margins. The Company’s typical sales of asphalt plants are in the $2 to $4 million range and may require the Company’s customers to obtain some sort of financing. The current state of the financial industry, the tightening of the credit markets and the higher interest rates, have had an adverse impact on the Company’s customers’ attitudes toward purchasing new equipment. On the positive side, the reduced value of the US dollar has resulted in more interest from international customers.
In addition to government funding and the overall economic conditions, fluctuations in the price of oil, which is a major component of asphalt mix, may affect the Company’s financial performance. An increase in the price of oil increases the cost of manufacturingliquid asphalt and could, therefore, decrease demand for asphalt and certain of the Company’s products. The Company does not currently foresee the fluctuationsIncreases in oil prices havingalso drive up the cost of gasoline, which results in increased freight costs. Where possible, the Company will pass increased freight costs on to its customers. However, the Company may not be able to recapture all of the increased costs and thus could have a significantnegative impact on itsthe Company’s financial performance.
Steel is a major component used in manufacturing the Company’s equipment. Steel prices were at historically high levels during 2008 andFluctuations in the price of steel can have a significant impact on the Company’s financial results. Where possible, the Company will pass on increased sales prices during 2008steel costs to offset the rising steel costs. During the fourth quarter of 2008, steel prices retreated sharply from their 2008 highs and continued the downward trend through the first half of 2009 with subsequent moderate increases during the remainder of 2009 and first half of 2010. In the current economy and competitive environment,its customers. However, the Company doesmay not expect to be able to raise prices to coverrecapture all of the increasingincreased steel costs of steel and thus its financial results could be negatively affected.
For the long term, the Company believes theits strategy of continuing to invest heavily in product engineering and development and its focus on delivering a high-quality productproducts and superior service will strengthen the Company’s market position when demand for capital equipment rebounds.its products rebound. In response to the short-term outlook, the Company has taken aggressive actions to conserve cash, right sizeright-size its operations and cost structure, and will continue to do so based on its forecasts.structure. These actions included adjustments to workforce, and staffing, reduced purchases of raw materials and reductions in selling, general, and administrative expenses. The Company continues to review its internal processes to identify efficienciesinefficiencies and cost reductions and will continue scrutinizingreviewing its relationships with external suppliers to ensure the Company is achieving the highest-qualityhighest quality products and services at the most competitive cost.prices.
Results of Operations
Year ended September 30, 20102012 compared with the year ended September 30, 20092011
Net revenues for the year ended September 30, 2010 decreased $1.22012 increased 5.8% or $3.5 million to $55.6$63.2 million from $56.8$59.7 million for the year ended September 30, 2009. Net2011. The increase in net revenues in fiscal 2009 included $1.1 million related towas the Company’s former operations in the United Kingdom which were sold in June 2009. The Company’s revenues are concentrated in the asphalt-related business and are subject to a seasonal slow-down during the third and fourth quartersresult of the calendar year.Company selling larger asphalt plants as well as continued strong sales in Canada.
Gross margins for fiscal 2010 and 20092012 were $9.2$12.0 million, and as a percentor 19.0% of net revenues, were 16.5%versus $9.4 million in 20102011, or 15.8% of net revenues. Gross margin increased in 2012 due to the higher revenues and 16.3% in 2009. Margins were positively impacted by a $641,000 reduction in LIFO reserves in 2010 and a $1.1 million reduction in LIFO reserves in 2009.improved manufacturing efficiencies.
Product engineering and development costsexpenses increased $128,000 to $2,339,000 in fiscal 2010 were relatively unchanged from 2009.2012 consistent with the increased revenues. Selling, general and administrative expenses decreased $1.2 millionincreased $352,000 to $9.5 million during 2010$9,298,000 in 2012 compared to 2011 primarily due primarily to a decrease in professional fees and reduced bad debthigher legal expenses.
Fiscal 20102012 had operating income of $393,000 versus an operating loss of $3.0 million versus a loss of $4.8 million$(1,743,000) in 2009.2011. The 2009 operating loss includes a $0.6 million loss relatedimproved results in 2012 were due to the sale of the UK operations. Overall the reduced losses in 2010 primarily resulted from reduced selling, generalincreased revenues and administrative expenses and the absence of the 2009 loss on disposal of the UK operations.
In June 2010, the Company was the recipient of ninety-five thousand shares of Company common stock as a result of a settlement and release agreement on a lawsuit against certain Company shareholders. The lawsuit related to alleged short-swing profits arising from purchases and sales of Company common stock by the defendants to the suit. The parties to the suit entered into the agreement for the sole purpose of resolving contested claims and disputes and avoiding the substantial costs associated with litigating the claims and disputes. No wrongdoing or liability was admitted to by the defendants. In 2010, other non-operating income and treasury stock include $738,000 related to the estimated fair value of the stock received.
During the year ended September 30, 2010, the Company transferred a net $11,450,000 from its operating cash accounts to its investment portfolio. As of September 30, 20102012 and 2009,2011, the cost basis of the investment portfolio was $69.5$80.6 million and $56.7$76.3 million, respectively. For$2.5 million of cash from operations was transferred into the yearinvestment portfolio during fiscal 2012. In each of years ended September 30, 2010,2012 and September 30, 2011, net investment interest and dividend income (“Investment Income”) was $3.1 million versus Investment Income of $2.2 million in 2009.$2.3 million. The net realized and unrealized gains on marketable securities were $1.4$4.1 million in 20102012 versus net realized and unrealized losses of $2.5$(3.1) million in 2009.2011. Total cash and investment balance at September 30, 20102012 was $76.3$84.7 million compared to the September 30, 20092011 cash and investment balance of $61.2$74.2 million.
The Company recognized income from Investees of $163,000 for the year ended September 30, 2010 and $48,000 for the year ended September 30, 2009 (see Part 1, Item 1 of this Report).
The effective income tax rate for 20102012 was a benefit of 25.9%34.7% whereas the effective income tax rate was a benefit of 50.1%108.8% for 2009.2011. The tax benefit in fiscal 2011 was primarily due to a decrease of $1,724,000 in unrecognized tax benefits following the conclusion of examinations by a state taxing authority during the second fiscal quarter of 2011. The change in the effective tax rate between years is mainlyalso due to operating lossesincome incurred during 20092012 versus profitlosses in 2010, the tax effect of the benefit from prior year net operating loss carry forward, the effect of the tax exempt stock settlement2011, and the effect of tax exempt interest income and unrealized gainsin the respective years (see Note 6 to Consolidated Financial Statements).
Net income for the year ended September 30, 2012 was $4,472,000 or $.47 per share versus $224,000 or $.02 per share for the year ended September 30, 2011.
Liquidity and Capital Resources
The Company generates capital resources through operations and returns on its investments. During fiscal 2009 and 2010, the Company received cash distributions from Investees of $48,000 and $163,000, respectively. The Company does not expect to receive any significant distributions from Investees in subsequent periods.
The Company had maintained a Revolving Credit and Security Agreement (“Credit Agreement”) with PNC Bank, N.A. The Credit Agreement originally established a three year revolving $20 million credit facility (“Credit Facility”) and was renewed through July 31, 2009. The Credit Facility provided for advances based on accounts receivable, inventory, and real estate. The facility included a $2 million limit on letters of credit. The interest rateno long term debt outstanding at September 30, 2009, was LIBOR plus 2.00%. The Company was required to maintain a fixed charge coverage ratio of 1.1:1. There were no required repayments as long as there were no defaults and there was adequate eligible collateral. Substantially all of the Company’s assets were pledged as security under the Credit Agreement. However, the Company had no indebtedness under the Credit Agreement during the years ended September 30, 2010 and 2009.
The Company amended the Credit Agreement on July 23, 2009 (the “Third Amendment”). The Credit Agreement was set to expire on July 31, 2009, and rather than let it expire, the Company elected to amend the agreement and reduce the amount of the Credit Facility from $20 million to $1.5 million. The Credit Facility also includes a $1.285 million limit on letters of credit, which was reduced from the original $2 million limit. The Company elected to reduce its Credit Facility because it believed the higher amount associated with the original line was not needed and was an unnecessary cost. Pursuant to the Third Amendment, the Company’s Credit Facility was extended through April 30, 2010. Under the Third Amendment, substantially all representations, warranties, covenants, rights, duties and obligations set forth in the original agreement continued to apply.
The Credit Agreement expired on April 30, 2010.2012 or 2011. The Company does not currently require a credit facility but continues to review and evaluate its needs and options for such a facility.
The Company had no long term debt outstanding at As of September 30, 2010 or 2009. In March 2010,2012, the Company replaced its outstanding letters of credit by funding $975,000has funded $402,000 in cash deposits at insurance companies to cover related collateral needs.
As of September 30, 2010,2012, the Company had $3.0$3.4 million in cash and cash equivalents, and $73.3$81.4 million in marketable securities. The marketable securities are invested through a professional investment advisor.management firm. The securities may be liquidated at any time into cash and cash equivalents.
The Company’s backlog was $7.8$3.4 million at September 30, 20102012 versus $4.2$6.5 million at September 30, 2009.2011. The Company’s working capital (defined as current assets less current liabilities) was $90.4$96.2 million at September 30, 2010 and $90.12012 versus $89.8 million at September 30, 2009.2011. Deferred taxes went from a net deferred tax asset of $1,187,000 as of September 30, 2011 to a net deferred tax liability of $974,000 as of September 30, 2012. The reductions in accounts receivableprimary reason for the change was related to unrealized returns on marketable equity securities which went from net unrealized losses of $3.1 million and costs$3,789,000 (a deferred tax asset of $1,413,000) at September 30, 2011 to net unrealized gains of $807,000 (a deferred tax liability of $310,000) at September 30, 2012 (refer to Note 6 to consolidated Financial Statements). Costs and estimated earnings in excess of billings of $4.0decreased $1.0 million were driven byprimarily due to the reduced order input and related revenues duringlevel of activity on percentage of completion jobs at the final two monthsend of fiscal 2010 versus the same period in 2009.2012 as compared to fiscal 2011. Inventories were reduced $5.0 million and accounts payable were down $1.0 million$960,000 as the Company drovecontinued its effort to drive down its investment in inventory to match the lower level of operations and produce cash. Prepaid expenses decreased $850,000 primarily from the return of cash in the recessionary economy.deposits used as collateral at insurance companies that were no longer required.
Cash usedprovided by operations during the year ended September 30, 20102012 was $297,000. Cash$2,517,000. The cash used for investing activities during the year ended September 30, 20102012 of $871,000 was $376,000.related to capital expenditures, primarily manufacturing equipment.
The Company historically operated a manufacturing facility and sales office in the United Kingdom. The revenues of the UK operations have been insignificant to the Company’s financial results. In June 2009, the Company sold its UK operations for $0.6 million (not including transaction costs of $22,000) and recognized a loss of $0.6 million. The Company retained ownership of the land and building, the brand name (“General Combustion”), and the associated intellectual property (e.g. engineering drawings).
In terms of financing activities, thereThere were no cash disbursements or receipts during the yearyears ended September 30, 2010.2012 or 2011 related to financing activities.
Critical Accounting Policies, Estimates and Assumptions
The Company believes the following discussion addresses itsit’s most critical accounting policies, which are those that are most important to the portrayal of the Company’s financial condition and results of operations and require management’s most difficult, subjective, or complex judgments, often as a result of the need to make estimates about the effect of matters that are inherently uncertain. Accounting policies, in addition to the critical accounting policies referenced below, are presented in Note 1 to the Consolidated Financial Statements, “Accounting Policies.”
Estimates and Assumptions
In preparing the Consolidated Financial Statements, the Company uses certain estimates and assumptions that may affect reported amounts and disclosures. Estimates and assumptions are used, among other places, when accounting for certain revenue (e.g. contract accounting), expense, and asset and liability valuations. The Company believes that the estimates and assumptions made in preparing the Consolidated Financial Statements are reasonable, but are inherently uncertain. Assumptions may be incomplete or inaccurate and unanticipated events may occur. The Company is subject to risks and uncertainties that may cause actual results to differ from estimated results.
Revenues & Expenses
Revenues from contracts for the design, manufacture and manufacturesale of certain custom equipmentasphalt plants are recognized under the percentage-of-completion method. The percentage-of-completion method of accounting for long termthese contracts recognizes revenue, net of any promotional discounts, and costs in proportion to actual labor costs incurred as compared with total estimated labor costs expected to be incurred during the entire contract. Pre-contract costs are expensed as incurred. Changes to total estimated contract costs or losses, if any, are recognized in the period in which they are determined. Revenue recognized in excess of amounts billed is classified as current assets under “costs and estimated earnings in excess of billings.” The Company anticipates that all incurred costs associated with these contracts at September 30, 2012, will be billed and collected within one year.
Revenues from all other contracts for the design and manufacture of custom equipment, for service and for parts sales, net of any discounts and return allowances, are recorded aswhen the productsfollowing four revenue recognition criteria are shippedmet: product is delivered or service is performed.performed, persuasive evidence of an arrangement exists, the selling price is fixed or determinable, and collectability is reasonably assured.
Returns and allowances, which reduce product revenue, are estimated using historical experience. Provisions for estimated returns and allowances and other adjustments are provided for in the same period the related sales are recorded.
Product warranty costs are estimated using historical experience and known issues and are charged to production costs as revenue is recognized.
All product engineering and development costs, and selling, general and administrative expenses are charged to operations as incurred. Provision is made for any anticipated contract losses in the period that the loss becomes evident.
The allowance for doubtful accounts is determined by performing a specific review of all account balances greater than 90 days past due and other higher risk amounts to determine collectability and also adjusting for any known customer payment issues with account balances in the less than 90 day past due aging buckets. Account balances are charged off against the allowance for doubtful accounts when they are determined to be uncollectable. Any recoveries of account balances previously considered in the allowance for doubtful accounts reduce future additions to the allowance for doubtful accounts.
Investment in Unconsolidated InvesteesInvestments
AsMarketable debt and equity securities are categorized as trading securities and are thus marked to market and stated at fair value. Fair value is determined using the quoted closing or latest bid prices for Level 1 investments and market standard valuation methodologies for Level 2 investments. Realized gains and losses on investment transactions are determined by specific identification and are recognized as incurred in the consolidated statements of September 30, 2010, 2009,operations. Net unrealized gains and 2008,losses are reported in the Company owns a 45% interestconsolidated statements of operations in Carbontronics LLCthe current period and a 25% interestrepresent the change in Carbontronics Fuels LLCthe fair value of investment holdings during the period.
Long Lived Asset Impairment
Property and Carbontronics II LLC. These interests were obtained as partequipment and intangible assets subject to amortization are reviewed for impairment whenever events or changes in circumstances indicate that the carrying amount of contractsan asset (or asset group) may not be recoverable. An impairment loss would be recognized when the carrying amount of an asset exceeds the estimated undiscounted cash flows expected to build four synthetic fuel production plants during 1998.result from the use of the asset and its eventual disposition. The Company has no basis in these equity investments or requirementamount of the impairment loss to provide future funding. Any income arising from these investments is dependent upon tax credits (adjusted for operating losses at the fuel plants) being generated as a result of synthetic fuel production, which will be recorded as received (see Part 1, Item 1is calculated by the excess over its fair value of this Report).the asset’s carrying value. Fair value is generally determined using a discounted cash flow analysis.
Inflation
The overall effects of inflation on the Company’s business during the periods discussed have not been significant. The Company monitors the prices it charges for its products and services on an ongoing basis and believes that it will be able to adjust those prices to take into account future changes in the rate of inflation.
Contractual Obligations
The following table summarizes the outstanding borrowings and long-term contractual obligations at September 30, 2010:2012:
| Total | Less than 1 Year | 1 – 3 Years | 3 – 5 Years | More than 5 Years | ||||||||||||||||
Long-term debt | $ | — | $ | — | $ | — | $ | — | $ | — | ||||||||||
Operating leases | 108,000 | 61,000 | 44,000 | 3,000 | — | |||||||||||||||
Total | $ | 108,000 | $ | 61,000 | $ | 44,000 | $ | 3,000 | $ | — | ||||||||||
| Total | Less than 1 Year | 1 – 3 Years | ||||||||||
Operating leases | $ | 60,000 | $ | 28,000 | $ | 32,000 | ||||||
The Company had no long-term or short-term debt as of September 30, 2012. There was no long-term debt facility in place and there were no outstanding letters of credit at September 30, 2010.2012.
Off-Balance Sheet Arrangements
None
| ITEM 7A. | QUANTITATIVE AND QUALITATIVE DISCLOSURES ABOUT MARKET RISK |
The Company operates manufacturing facilities and sales offices principally locatedat two locations in the United States and, until June 2009, the United Kingdom.States. The Company is subject to business risks inherent in non-U.S. activities, including political and economic uncertainty, import and export limitations, and market risk related to changes in interest rates and foreign currency exchange rates. Periodically, the Company may use derivative financial instruments consisting primarily of interest rate hedge agreements to manage exposures to interest rate changes. The Company’s objective in managing its exposure to changes in interest rates on any future variable rate debt is to limit the impact on earnings and cash flow and reduce overall borrowing costs.
At September 30, 20102012 and 20092011 the Company had no debt outstanding. At September 30, 20102012 there was no credit facility in place. The Company does not currently require a credit facility but continues to review and evaluate its needs and options for such a facility.
The Company’s marketable securities are invested in stocks and corporate and municipal bonds through a professional investment advisor. Investment securities are exposed to various risks, such as interest rate, market and credit.credit risks. Due to the level of risk associated with certain investment securities and the level of uncertainty related to changes in the value of securities, it is possible that changes in these risk factors could have an adverse material impact on the Company’s results of operations or equity.
The Company’s sensitivity analysis for interest rate risk excludes accounts receivable, accounts payable and accrued liabilities because of the short-term maturity of such instruments. The analysis does not consider the effect on other variables such as changes in sales volumes or management’s actions with respect to levels of capital expenditures, future acquisitions or planned divestures, all of which could be significantly influenced by changes in interest rates.
| ITEM 8. | FINANCIAL STATEMENTS AND SUPPLEMENTARY DATA |
INDEX TO FINANCIAL STATEMENTS AND FINANCIAL STATEMENT SCHEDULES
All other schedules are omitted because they are not applicable or the required information is shown in the consolidated financial statements or notes thereto.
MANAGEMENT ASSESSMENT REPORT
The management of Gencor Industries, Inc. (the “Company”) is responsible for establishing and maintaining adequate internal control over financial reporting for the Company. The Company’s internal control system is designed to provide reasonable assurance to the Company’s management and board of directors regarding the reliability of financial reporting and the preparation of financial statements for external purposes in accordance with generally accepted accounting principles. There are inherent limitations in the effectiveness of all internal control systems no matter how well designed. Therefore, even those systems determined to be effective can provide only reasonable assurance with respect to the preparation and presentation of financial statements. Furthermore, projections of any evaluation of effectiveness to future periods are subject to the risk that controls may become inadequate because of a change in circumstances or conditions.
In order to ensure that the Company’s internal control over financial reporting is effective, management regularly assesses such controls and did so most recently as of September 30, 2010.2012. This assessment was based on criteria for effective internal control over financial reporting described in Internal Control-Integrated Framework issued by the Committee of Sponsoring Organizations of the Treadway Commission. Based on this assessment, management believes the Company maintained effective internal control over financial reporting as of September 30, 2010.2012.
REPORT OF INDEPENDENT REGISTERED PUBLIC ACCOUNTING FIRM
To the Board of Directors and Shareholders of Gencor Industries, Inc.:
We have audited the accompanying consolidated balance sheets of Gencor Industries, Inc. and subsidiaries as of September 30, 20102012 and 2009,2011, and the related consolidated statements of operations, shareholders’ equity and comprehensive income (loss), and cash flows for each of the years in the two-year period ended September 30, 2010.2012. Gencor’s management is responsible for these financial statements. Our responsibility is to express an opinion on these financial statements based on our audits.
We conducted our audits in accordance with the standards of the Public Company Accounting Oversight Board (United States). Those standards require that we plan and perform the audits to obtain reasonable assurance about whether the financial statements are free of material misstatement. The Company is not required to have, nor were we engaged to perform, an audit of its internal control over financial reporting. Our audit included consideration of internal control over financial reporting as a basis for designing audit procedures that are appropriate in the circumstances, but not for the purpose of expressing an opinion on the effectiveness of the Company’s internal control over financial reporting. Accordingly, we express no such opinion. An audit also includes examining, on a test basis, evidence supporting the amounts and disclosures in the financial statements, assessing the accounting principles used and significant estimates made by management, as well as evaluating the overall financial statement presentation. We believe that our audits provide a reasonable basis for our opinion.
In our opinion, the consolidated financial statements referred to above present fairly, in all material respects, the financial position of Gencor Industries, Inc. as of September 30, 20102012 and 2009,2011, and the consolidated results of its operations, changes in shareholders’ equity and its cash flows for each of the years in the two-year period ended September 30, 2010,2012 in conformity with accounting principles generally accepted in the United States of America.
/s/ MOORE STEPHENS LOVELACE, P.A.
MOORE STEPHENS LOVELACE, P.A.
Certified Public Accountants
Orlando, Florida
December 22, 201014, 2012
Part I. Financial Information
Consolidated Balance Sheets
As of September 30, 2012 and 2011
| September 30 | September 30 | |||||||
| 2010 | 2009 | |||||||
ASSETS | ||||||||
Current assets: | ||||||||
Cash and cash equivalents | $ | 3,004,000 | $ | 3,677,000 | ||||
Marketable securities at fair value (Cost of $69,501,000 at September 30, 2010 and $56,651,000 at September 30, 2009) | 73,327,000 | 57,530,000 | ||||||
Account receivable, less allowance for doubtful accounts of $1,803,000 at September 30, 2010 and $2,458,000 at September 30, 2009 | 1,979,000 | 5,681,000 | ||||||
Costs and estimated earnings in excess of billings | 580,000 | 4,530,000 | ||||||
Inventories, net | 17,341,000 | 22,240,000 | ||||||
Deferred income taxes | 660,000 | 594,000 | ||||||
Prepaid expenses | 2,205,000 | 1,554,000 | ||||||
Total current assets | 99,096,000 | 95,806,000 | ||||||
Property and equipment, net | 7,773,000 | 8,207,000 | ||||||
Other assets | 358,000 | 444,000 | ||||||
Total assets | $ | 107,227,000 | $ | 104,457,000 | ||||
LIABILITIES AND SHAREHOLDERS’ EQUITY | ||||||||
Current Liabilities: | ||||||||
Account payable | $ | 1,373,000 | $ | 2,342,000 | ||||
Customer deposits | 1,478,000 | 786,000 | ||||||
Accrued expenses | 3,323,000 | 2,579,000 | ||||||
Total current liabilities | 6,174,000 | 5,707,000 | ||||||
Deferred and other income taxes | 2,525,000 | 2,453,000 | ||||||
Total liabilities | 8,699,000 | 8,160,000 | ||||||
Commitments and contingencies | ||||||||
Shareholder’s equity: | ||||||||
Preferred stock, par value $.10 share; authorized 300,000 shares; none issued | — | — | ||||||
Common stock, par value $.10 per share; 15,000,000 shares authorized; 8,103,632 shares issued and 8,008,632 outstanding at September 30, 2010, and 8,079,872 shares issued and outstanding at September 30, 2009 | 810,000 | 808,000 | ||||||
Class B Stock, par value $.10 per share; 6,000,000 shares authorized; 1,509,238 shares issued and outstanding at September 30, 2010 and 1,532,998 shares issued and outstanding at September 30, 2009 | 151,000 | 153,000 | ||||||
Capital in excess of par value | 10,542,000 | 10,542,000 | ||||||
Common shares held in treasury, at cost; 95,000 shares | (738,000 | ) | — | |||||
Retained earnings | 87,763,000 | 84,794,000 | ||||||
Total shareholder’s equity | 98,528,000 | 96,297,000 | ||||||
Total Liabilities and Shareholder’s Equity | $ | 107,227,000 | $ | 104,457,000 | ||||
| 2012 | 2011 | |||||||
ASSETS | ||||||||
Current assets: | ||||||||
Cash and cash equivalents | $ | 3,361,000 | $ | 1,715,000 | ||||
Marketable securities at fair value (Cost of $80,568,000 at September 30, 2012 and $76,275,000 at September 30, 2011) | 81,375,000 | 72,486,000 | ||||||
Account receivable, less allowance for doubtful accounts of $368,000 at September 30, 2012 and $582,000 at September 30, 2011 | 1,206,000 | 1,573,000 | ||||||
Costs and estimated earnings in excess of billings | 3,448,000 | 4,450,000 | ||||||
Inventories, net | 11,918,000 | 12,878,000 | ||||||
Deferred income taxes | — | 690,000 | ||||||
Prepaid expenses | 782,000 | 1,632,000 | ||||||
|
|
|
| |||||
Total current assets | 102,090,000 | 95,424,000 | ||||||
|
|
|
| |||||
Property and equipment, net | 8,127,000 | 8,349,000 | ||||||
Other assets | 95,000 | 602,000 | ||||||
|
|
|
| |||||
Total Assets | $ | 110,312,000 | $ | 104,375,000 | ||||
|
|
|
| |||||
LIABILITIES AND SHAREHOLDERS’ EQUITY | ||||||||
Current Liabilities: | ||||||||
Account payable | $ | 1,881,000 | $ | 1,978,000 | ||||
Customer deposits | 480,000 | 756,000 | ||||||
Accrued expenses | 3,517,000 | 2,842,000 | ||||||
|
|
|
| |||||
Total current liabilities | 5,878,000 | 5,576,000 | ||||||
|
|
|
| |||||
Deferred and other income taxes | 974,000 | — | ||||||
|
|
|
| |||||
Total liabilities | 6,852,000 | 5,576,000 | ||||||
|
|
|
| |||||
Commitments and contingencies | ||||||||
Shareholders’ equity: | ||||||||
Preferred stock, par value $.10 per share; 300,000 shares authorized; none issued | — | — | ||||||
Common stock, par value $.10 per share; 15,000,000 shares authorized; | ||||||||
8,008,632 shares issued and outstanding at September 30, 2012 and 2011 | 801,000 | 801,000 | ||||||
Class B Stock, par value $.10 per share; 6,000,000 shares authorized; | ||||||||
1,509,238 shares issued and outstanding at September 30, 2012 and 2011 | 151,000 | 151,000 | ||||||
Capital in excess of par value | 10,049,000 | 9,860,000 | ||||||
Retained earnings | 92,459,000 | 87,987,000 | ||||||
|
|
|
| |||||
Total shareholders’ equity | 103,460,000 | 98,799,000 | ||||||
|
|
|
| |||||
Total Liabilities and Shareholders’ Equity | $ | 110,312,000 | $ | 104,375,000 | ||||
|
|
|
| |||||
See accompanying Notes to Consolidated Financial Statements
Consolidated Statements of Operations
For the Years Ended September 30, 2012 and 2011
| For the Years Ended September 30, | ||||||||
| 2010 | 2009 | |||||||
Net revenue | $ | 55,587,000 | $ | 56,789,000 | ||||
Cost and expense: | ||||||||
Production costs | 46,436,000 | 47,541,000 | ||||||
Product engineering and development | 2,700,000 | 2,718,000 | ||||||
Selling, general and administrative | 9,500,000 | 10,739,000 | ||||||
Loss on sale of assets | — | 560,000 | ||||||
| 58,636,000 | 61,558,000 | |||||||
Operating loss | (3,049,000 | ) | (4,769,000 | ) | ||||
Other income (expenses): | ||||||||
Interest and dividend income, net of fees | 3,101,000 | 2,155,000 | ||||||
Interest expense | — | (50,000 | ) | |||||
Income from investees | 163,000 | 48,000 | ||||||
Realized and unrealized gains (losses) on marketable securities | 1,361,000 | (2,493,000 | ) | |||||
Other | 783,000 | (4,000 | ) | |||||
| 5,408,000 | (344,000 | ) | ||||||
Income (loss) before income taxes | 2,359,000 | (5,113,000 | ) | |||||
Income tax (benefit) | (610,000 | ) | (2,562,000 | ) | ||||
Net income (loss) | $ | 2,969,000 | $ | (2,551,000 | ) | |||
Basic earnings (loss) per common share: | ||||||||
Net income (loss) | $ | 0.31 | $ | (0.27 | ) | |||
Diluted earnings (loss) per common share: | ||||||||
Net income (loss) | $ | 0.31 | $ | (0.27 | ) | |||
| 2012 | 2011 | |||||||
Net revenue | $ | 63,182,000 | $ | 59,692,000 | ||||
Costs and expenses: | ||||||||
Production costs | 51,152,000 | 50,278,000 | ||||||
Product engineering and development | 2,339,000 | 2,211,000 | ||||||
Selling, general and administrative | 9,298,000 | 8,946,000 | ||||||
|
|
|
| |||||
| 62,789,000 | 61,435,000 | |||||||
|
|
|
| |||||
Operating income (loss) | 393,000 | (1,743,000 | ) | |||||
Other income (expenses): | ||||||||
Interest and dividend income, net of fees | 2,269,000 | 2,256,000 | ||||||
Realized and unrealized gains (losses) on marketable securities | 4,120,000 | (3,113,000 | ) | |||||
Other | 70,000 | 66,000 | ||||||
|
|
|
| |||||
| 6,459,000 | (791,000 | ) | ||||||
|
|
|
| |||||
Income (loss) before income taxes | 6,852,000 | (2,534,000 | ) | |||||
Income tax expense (benefit) | 2,380,000 | (2,758,000 | ) | |||||
|
|
|
| |||||
Net income | $ | 4,472,000 | $ | 224,000 | ||||
|
|
|
| |||||
Basic earnings per common share: | ||||||||
Net income | $ | 0.47 | $ | 0.02 | ||||
|
|
|
| |||||
Diluted earnings per common share: | ||||||||
Net income | $ | 0.47 | $ | 0.02 | ||||
|
|
|
| |||||
See accompanying Notes to Consolidated Financial Statements
Consolidated Statements of Shareholders’ Equity and Comprehensive Income (Loss)
For the Years Ended September 30, 20102012 and 20092011
(in thousands)
| Common Stock | Common Stock Held in Treasury | Class B Stock | Capital in Excess of | Retained | Comprehensive | Accumulated Other | Total Shareholders’ | |||||||||||||||||||||||||||||||||||||
| Shares | Amount | Shares | Amount | Shares | Amount | Par Value | Earnings | Income (Loss) | Income (Loss) | Equity | ||||||||||||||||||||||||||||||||||
September 30, 2008 | 8,080 | $ | 808 | — | $ | — | 1,533 | $ | 153 | $ | 10,542 | $ | 87,383 | $ | 129 | $ | 99,015 | |||||||||||||||||||||||||||
Net (loss) | — | — | — | — | — | — | — | (2,551 | ) | $ | (2,551 | ) | — | (2,551 | ) | |||||||||||||||||||||||||||||
Translation adjustment | — | — | — | — | — | — | — | (38 | ) | (129 | ) | (129 | ) | (167 | ) | |||||||||||||||||||||||||||||
Comprehensive (loss) | $ | (2,680 | ) | |||||||||||||||||||||||||||||||||||||||||
September 30, 2009 | 8,080 | $ | 808 | — | $ | — | 1,533 | $ | 153 | $ | 10,542 | $ | 84,794 | $ | — | $ | 96,297 | |||||||||||||||||||||||||||
Net income | — | — | — | — | — | — | — | 2,969 | $ | 2,969 | — | 2,969 | ||||||||||||||||||||||||||||||||
Treasury shares | — | — | (95 | ) | (738 | ) | — | — | — | — | — | (738 | ) | |||||||||||||||||||||||||||||||
Conversion of Class B Stock | 24 | 2 | — | — | (24 | ) | (2 | ) | — | — | — | — | ||||||||||||||||||||||||||||||||
Comprehensive income | $ | 2,969 | ||||||||||||||||||||||||||||||||||||||||||
September 30, 2010 | 8,104 | $ | 810 | (95 | ) | $ | (738 | ) | 1,509 | $ | 151 | $ | 10,542 | $ | 87,763 | $ | — | $ | 98,528 | |||||||||||||||||||||||||
| Common Stock | Common Stock Held in Treasury | Class B Stock | Capital in Excess of Par Value | Retained Earnings | Total Shareholders’ Equity | |||||||||||||||||||||||||||||||
| Shares | Amount | Shares | Amount | Shares | Amount | |||||||||||||||||||||||||||||||
September 30, 2010 | 8,104 | $ | 810 | (95 | ) | $ | (738 | ) | 1,509 | $ | 151 | $ | 10,542 | $ | 87,763 | $ | 98,528 | |||||||||||||||||||
Net income | — | — | — | — | — | — | — | 224 | 224 | |||||||||||||||||||||||||||
Treasury shares retired | (95 | ) | (9 | ) | 95 | 738 | — | — | (729 | ) | — | — | ||||||||||||||||||||||||
Stock-based compensation | — | — | — | — | — | — | 47 | — | 47 | |||||||||||||||||||||||||||
|
|
|
|
|
|
|
|
|
|
|
|
|
|
|
|
|
| |||||||||||||||||||
September 30, 2011 | 8,009 | 801 | — | — | 1,509 | 151 | 9,860 | 87,987 | 98,799 | |||||||||||||||||||||||||||
Net income | — | — | — | — | — | — | — | 4,472 | 4,472 | |||||||||||||||||||||||||||
Stock-based compensation | — | — | — | — | — | — | 189 | — | 189 | |||||||||||||||||||||||||||
|
|
|
|
|
|
|
|
|
|
|
|
|
|
|
|
|
| |||||||||||||||||||
September 30, 2012 | 8,009 | $ | 801 | — | $ | — | 1,509 | $ | 151 | $ | 10,049 | $ | 92,459 | $ | 103,460 | |||||||||||||||||||||
|
|
|
|
|
|
|
|
|
|
|
|
|
|
|
|
|
| |||||||||||||||||||
See accompanying Notes to Consolidated Financial Statements.Statements
Consolidated Statements of Cash Flows
For the Years Ended September 30, 2012 and 2011
| For the Years Ended September 30, | ||||||||
| 2010 | 2009 | |||||||
Cash flows from operations: | ||||||||
Net income (loss) | $ | 2,969,000 | $ | (2,551,000 | ) | |||
Adjustments to reconcile net income (loss) to cash provided (used) by operations: | ||||||||
Purchase of marketable securities | (76,062,000 | ) | (60,571,000 | ) | ||||
Proceeds from sale and maturity of marketable securities | 62,273,000 | 54,516,000 | ||||||
Change in value of marketable securities | (1,949,000 | ) | 2,501,000 | |||||
Deferred income taxes | 6,000 | (2,490,000 | ) | |||||
Depreciation and amortization | 905,000 | 899,000 | ||||||
Income from investees | (163,000 | ) | (48,000 | ) | ||||
Provision for doubtful accounts | 630,000 | 1,163,000 | ||||||
Loss on sale of assets | 2,000 | 560,000 | ||||||
Gain on legal settlement | (738,000 | ) | — | |||||
Change in assets and liabilities: | ||||||||
Accounts receivable | 3,081,000 | 122,000 | ||||||
Costs and estimated earnings in excess of billings | 3,950,000 | 4,427,000 | ||||||
Inventories | 4,962,000 | 3,838,000 | ||||||
Prepaid expenses | (651,000 | ) | 1,823,000 | |||||
Account payable | (969,000 | ) | (2,020,000 | ) | ||||
Customer deposits | 692,000 | (771,000 | ) | |||||
Accrued expenses and other | 765,000 | (839,000 | ) | |||||
Total adjustments | (3,266,000 | ) | 3,110,000 | |||||
Cash flows provided (used) by operations | (297,000 | ) | 559,000 | |||||
Cash flows (used) by investing activities: | ||||||||
Distributions from unconsolidated investees | 163,000 | 48,000 | ||||||
Capital expenditures | (539,000 | ) | (320,000 | ) | ||||
Proceeds from sale of UK operations, net of cash disposed | — | (345,000 | ) | |||||
Cash flows (used) by investing activities | (376,000 | ) | (617,000 | ) | ||||
Effect of exchange rate changes on cash | — | (333,000 | ) | |||||
Net (decrease) in cash | (673,000 | ) | (391,000 | ) | ||||
Cash and cash equivalents at: | ||||||||
Beginning of period | 3,677,000 | 4,068,000 | ||||||
End of period | $ | 3,004,000 | $ | 3,677,000 | ||||
| 2012 | 2011 | |||||||
Cash flows from operations: | ||||||||
Net income | $ | 4,472,000 | $ | 224,000 | ||||
Adjustments to reconcile net income to cash provided by operations: | ||||||||
Purchase of marketable securities | (67,123,000 | ) | (89,242,000 | ) | ||||
Proceeds from sale and maturity of marketable securities | 62,363,000 | 87,531,000 | ||||||
Change in value of marketable securities | (4,129,000 | ) | 2,553,000 | |||||
Deferred income taxes | 2,161,000 | (3,052,000 | ) | |||||
Depreciation and amortization | 1,075,000 | 890,000 | ||||||
Provision for doubtful accounts | 366,000 | 190,000 | ||||||
Loss on disposal of assets | 28,000 | — | ||||||
Stock-based compensation | 189,000 | 47,000 | ||||||
Change in assets and liabilities: | ||||||||
Accounts receivable | 1,000 | 468,000 | ||||||
Costs and estimated earnings in excess of billings | 1,002,000 | (3,870,000 | ) | |||||
Inventories | 960,000 | 4,463,000 | ||||||
Prepaid expenses | 850,000 | 573,000 | ||||||
Account payable | (97,000 | ) | 605,000 | |||||
Customer deposits | (276,000 | ) | (722,000 | ) | ||||
Accrued expenses and other | 675,000 | (481,000 | ) | |||||
|
|
|
| |||||
Total adjustments | (1,955,000 | ) | (47,000 | ) | ||||
|
|
|
| |||||
Cash flows provided by operations | 2,517,000 | 177,000 | ||||||
|
|
|
| |||||
Cash flows from investing activities: | ||||||||
Capital expenditures, net of disposals | (871,000 | ) | (1,466,000 | ) | ||||
|
|
|
| |||||
Cash flows used by investing activities | (871,000 | ) | (1,466,000 | ) | ||||
|
|
|
| |||||
Net increase (decrease) in cash | 1,646,000 | (1,289,000 | ) | |||||
Cash and cash equivalents at: | ||||||||
Beginning of period | 1,715,000 | 3,004,000 | ||||||
|
|
|
| |||||
End of period | $ | 3,361,000 | $ | 1,715,000 | ||||
|
|
|
| |||||
See accompanying Notes to Consolidated Financial Statements
Notes to Consolidated Financial Statements
For the Years Ended September 30, 2012 and 2011
NOTE 1 – NATURE OF OPERATIONS AND SUMMARY OF SIGNIFICANT ACCOUNTING POLICIES
Gencor Industries, Inc. and its subsidiaries (collectively, the “Company”) is a diversified, heavy machinery manufacturer for the production of highway construction materials, synthetic fuels and environmental control machinery and equipment.
These consolidated financial statements include the accounts of Gencor Industries, Inc. and its subsidiaries. All significant intercompany accounts and transactions have been eliminated in consolidation.
New Accounting Pronouncements and Policies
No new accounting pronouncements issued or effective during the fiscal year have had or are expected to have a material impact on the Company’s consolidated financial statements.
Use of Estimates
The preparation of the consolidated financial statements in conformity with generally accepted accounting principles requires management to make estimates and assumptions that affect the reported amounts of assets and liabilities, the disclosure of contingent assets and liabilities at the date of the financial statements, and the reported amounts of revenues and expenses during the reporting period. Actual results could differ from those estimates.
Earnings (Loss) per Share (“EPS”)
The consolidated financial statements include basic and diluted earnings per share information. Basic earnings (loss) per share are based on the weighted average number of shares outstanding. Diluted earnings (loss) per share are based on the sum of the weighted average number of shares outstanding plus common stock equivalents. As of September 30, 2012 and 2011, there were no common stock equivalents included in the diluted earnings per share equivalents.calculations, as to do so would have been anti-dilutive.
The following presents the calculation of the basic and diluted income (loss) per share for the years ended September 30, 20102012 and 20092011 (in thousands, except per share data):
| 2010 | 2009 | 2012 | 2011 | |||||||||||||||||||||||||||||||||||||||||||||
| Net Income | Shares | EPS | Net (Loss) | Shares | EPS | Net Income | Shares | EPS | Net Income | Shares | EPS | |||||||||||||||||||||||||||||||||||||
Basic EPS | $ | 2,969 | 9,581 | $ | 0.31 | $ | (2,551 | ) | 9,613 | $ | (0.27 | ) | $ | 4,472 | 9,518 | $ | 0.47 | $ | 224 | 9,518 | $ | 0.02 | ||||||||||||||||||||||||||
Diluted EPS | $ | 2,969 | 9,581 | $ | 0.31 | $ | (2,551 | ) | 9,613 | $ | (0.27 | ) | $ | 4,472 | 9,518 | $ | 0.47 | $ | 224 | 9,518 | $ | 0.02 | ||||||||||||||||||||||||||
Cash Equivalents
Cash equivalents consist of short-term certificates of deposit and deposits in money market accounts with original maturities of three months or less.
Marketable Securities
Marketable debt and equity securities are categorized as trading securities and are thus marked to market and stated at fair value. Fair value is determined using the quoted closing or latest bid prices.prices for Level 1 investments and market standard valuation methodologies for Level 2 investments. Realized gains and losses on investment transactions are determined by specific identification and are recognized as incurred in the statementconsolidated statements of operations. Net unrealized gains and losses are reported in the statementconsolidated statements of operations in the current period and represent the change in the fair value of investment holdings during the period.
Fair Value Measurements
The fair value of financial instruments is presented based upon a hierarchy of levels that prioritizes the inputs of valuation techniques used to measure fair value. The hierarchy gives the highest priority to unadjusted quoted prices
in active markets for identical assets or liabilities (Level 1 measurements) and the lowest priority to unobservable inputs (Level 3 measurements). A financial instrument’s level within the fair value hierarchy is based on the lowest level of any input that is significant to the fair value measurement.
If available,The fair value of marketable equity securities and mutual funds are substantially based on quoted market prices are used to value investments. Municipal(Level 1). Corporate and municipal bonds and equity securities are valued atusing market standard valuation methodologies, including: discounted cash flow methodologies, and matrix pricing or other similar techniques. The inputs to these market standard valuation methodologies include, but are not limited to: interest rates, credit standing of the closing price reportedissuer or counterparty, industry sector of the issuer, coupon rate, call provisions, maturity, estimated duration and assumptions regarding liquidity and estimated future cash flows. In addition to bond characteristics, the valuation methodologies incorporate market data, such as actual trades completed, bids and actual dealer quotes, where such information is available. Accordingly, the estimated fair values are based on available market information and judgments about financial instruments (Level 2). Fair values of the Level 2 investments are provided by the most active market on which the individual securities are traded (Level 1).Company’s professional investment management firm.
The following tables set forth by level, within the fair value hierarchy, the Company’s assets measured at fair value as of September 30, 2010:2012:
| Fair Value Measurements | Fair Value Measurements | |||||||||||||||||||||||||||||||
| Level 1 | Level 2 | Level 3 | Total | Level 1 | Level 2 | Level 3 | Total | |||||||||||||||||||||||||
Equities | $ | 28,829,000 | $ | — | $ | — | $ | 28,829,000 | $ | 13,912,000 | $ | — | $ | — | $ | 13,912,000 | ||||||||||||||||
Corporate & Municipal Bonds | 43,229,000 | — | — | 43,229,000 | ||||||||||||||||||||||||||||
Mutual Funds | 18,588,000 | — | — | 18,588,000 | ||||||||||||||||||||||||||||
Corporate Bonds | — | 14,178,000 | — | 14,178,000 | ||||||||||||||||||||||||||||
Municipal Bonds | — | 28,513,000 | — | 28,513,000 | ||||||||||||||||||||||||||||
Government Securities | 6,000,000 | — | — | 6,000,000 | ||||||||||||||||||||||||||||
Cash and Money Funds | 1,269,000 | — | — | 1,269,000 | 184,000 | — | — | 184,000 | ||||||||||||||||||||||||
|
|
|
| |||||||||||||||||||||||||||||
Total | $ | 73,327,000 | $ | — | $ | — | $ | 73,327,000 | $ | 38,684,000 | $ | 42,691,000 | $ | — | $ | 81,375,000 | ||||||||||||||||
|
|
|
| |||||||||||||||||||||||||||||
UnrealizedNet unrealized gains as of September 30, 20102012, were $3,238,000.$807,000. Estimated interest accrued on the corporate and municipal bond portfolio was $588,000$545,000 at September 30, 2010.2012. There were no transfers of investments between Level 1 and Level 2 during the year ended September 30, 2012.
The following tables set forth by level, within the fair value hierarchy, the Company’s assets measured at fair value as of September 30, 2009:2011:
| Fair Value Measurements | Fair Value Measurements | |||||||||||||||||||||||||||||||
| Level 1 | Level 2 | Level 3 | Total | Level 1 | Level 2 | Level 3 | Total | |||||||||||||||||||||||||
Equities | $ | 7,148,000 | $ | — | $ | — | $ | 7,148,000 | $ | 24,213,000 | $ | — | $ | — | $ | 24,213,000 | ||||||||||||||||
Corporate & Municipal Bonds | 49,432,000 | — | — | 49,432,000 | ||||||||||||||||||||||||||||
Mutual Funds | 2,566,000 | — | — | 2,566,000 | ||||||||||||||||||||||||||||
Corporate Bonds | — | 7,845,000 | — | 7,845,000 | ||||||||||||||||||||||||||||
Municipal Bonds | — | 35,844,000 | — | 35,844,000 | ||||||||||||||||||||||||||||
Cash and Money Funds | 950,000 | — | — | 950,000 | 2,018,000 | — | — | 2,018,000 | ||||||||||||||||||||||||
|
|
|
| |||||||||||||||||||||||||||||
Total | $ | 57,530,000 | $ | — | $ | — | $ | 57,530,000 | $ | 28,797,000 | $ | 43,689,000 | $ | — | $ | 72,486,000 | ||||||||||||||||
|
|
|
| |||||||||||||||||||||||||||||
Unrealized gains and estimated accrued interest
Net unrealized losses as of September 30, 20092011, were $3,789,000. Estimated interest accrued on the corporate and municipal bond portfolio was $879,000.$568,000 at September 30, 2011.
The carrying amounts of cash and cash equivalents, accounts receivable and accounts payable approximate fair value because of the short-term nature of these items.
Foreign Currency TranslationTransactions
Assets and liabilities of the Company’s foreign subsidiaries are translated into U.S. dollars at the applicable rate of exchange in effect at the end of the fiscal year. Revenue and expense accounts are translated at the average rate of exchange during the period and equity accounts are translated at the rate in effect when the transactions giving rise to the balances took place. Gains and losses resulting from translation are included in Accumulated Other Comprehensive Income (Loss). Gains and losses resulting from foreign currency transactions are included in income.
Risk Management
Financial instruments that potentially subject the Company to concentrations of credit risk consist primarily of cash and cash equivalents, marketable securities, and accounts receivable. The Company maintains its cash accounts in various domestic financial institutions. Domestic funds are swept daily into interest-bearingOperating cash is retained overnight repurchase agreements invested in U.S. government securities.non-interest bearing accounts which allow for offsets to treasury service charges. The marketable securities are invested in money funds, stocks and corporate and municipal bonds through a professional investment advisor. Investment securities are exposed to various risks, such as interest rate, market and credit.credit risks. The Company’s customers are not concentrated in any specific geographic region, but are concentrated in the road and highway construction industry. The Company extends limited credit to its customers based upon their creditworthiness and generally requires a significant up-front deposit before beginning construction
and full payment subject to hold-back provisions prior to shipment on complete asphalt plant and component orders. The Company establishes an allowance for doubtful accounts based upon the credit risk of specific customers, historical trends and other pertinent information.
Inventories
Inventories are statedvalued at the lower of cost or market. The Company usesmarket, with cost being determined principally by using the last-in, first-out (LIFO)(“LIFO”) method of determiningand market defined as replacement cost for substantiallyraw materials and net realizable value for work in process and finished goods (see Note 2). Appropriate consideration is given to obsolescence, excessive levels, deterioration, possible alternative uses and other factors in determining net realizable value. The cost of work in process and finished goods includes materials, direct labor, variable costs and overhead. The Company evaluates the need to record inventory adjustments on all inventories. All other inventories, are accounted for using the first-in, first-out (FIFO) method.
including raw material, work in process, finished goods, spare parts and used equipment. Used equipment acquired by the Company byon trade-in from customers acquiring new equipment, is carried at the lower of trade-in value or estimated net realizable value. Unless specific circumstances warrant different treatment regarding inventory obsolescence, the cost basis of inventories three to four years old are reduced by 50%, while the cost basis of inventories four to five years old are reduced by 75%, and the cost basis of inventories greater than five years old are reduced to zero. Inventory is typically reviewed for obsolescence on an annual basis computed as of September 30th, the Company’s fiscal year end. If significant known changes in trends, technology or other specific circumstances that warrant consideration occur during the year, then the impact on obsolescence is considered at that time.
Property and Equipment
Property and equipment are stated at cost.cost (see Note 4). Depreciation of property and equipment is computed using straight-line and accelerated methods over the estimated useful lives of the related assets, as follows:
| Years | ||||
Land improvements | 5 | |||
Buildings and improvements | 6-40 | |||
Equipment | 2-10 |
Impairments
IfProperty and equipment and intangible assets subject to amortization are reviewed for impairment whenever events or changes in circumstances indicate that the carrying valueamount of an asset including associated intangibles and goodwill,(or asset group) may not be recoverable. An impairment loss would be recognized when the carrying amount of an asset exceeds the sum of estimated undiscounted future cash flows anexpected to result from the use of the asset and its eventual disposition. The amount of the impairment loss to be recorded is recognized forcalculated by the difference between estimatedexcess over its fair value andof the asset’s carrying value.
Investment in Unconsolidated Investees
The Company owns Fair value is generally determined using a 45% interest in Carbontronics LLC and a 25% interest in Carbontronics Fuels LLC and Carbontronics II, LLC. These interests were earned as part of value of risk on contracts to build four synthetic fuel production plants during 1998. The Company has no basis in these equity investments or requirement to provide future funding. The operations of Carbontronics LLC consist of the receipt of contingent payments from the sales of the plants and the distribution thereof to its members. Carbontronics LLC has no other significant operations or assets. The operations of Carbontronics II, LLC consist of the receipt of royalty payments from the plants and the distribution thereof to its members. Carbontronics II, LLC has no other significant operations or assets. Any income arising from these investments is dependent upon tax credits (adjusted for operating losses at the fuel plants) being generated as a result of synthetic fuel production, which is recorded as received. The Company received $163,000 in fiscal 2010 and $48,000 in fiscal 2009.
The existing tax credit legislation expired at the end of calendar year 2007. Consequently, the four synthetic fuel plants were decommissioned. They were sold or transferred to site owners in exchange for a release of all contracted liabilities related to the removal of plants from the sites. The administrative partner informed the Company that there were no operations in calendar years 2008, 2009 or 2010 and almost all of the partnership affairs were finalized in 2008. It is not possible to predict the amount, if any, of final distributions from the partnerships upon the final disposition and winding-up of operations.discounted cash flow analysis.
Revenues and Expenses
Revenues from contracts for the design, manufacture and manufacturesale of certain custom equipmentasphalt plants are recognized under the percentage-of-completion method. The percentage-of-completion method of accounting for long termthese contracts recognizes revenue, net of any promotional discounts, and costs in proportion to actual labor costs incurred, as compared with total estimated labor costs expected to be incurred during the entire contract. Pre-contract costs are expensed as incurred. Changes to total estimated contract costs or losses, if any, are recognized in the period in which they are determined. Revenue recognized in excess of amounts billed is classified as current assets under “costs and estimated earnings in excess of billings.” The Company anticipates that all incurred costs associated with these contracts at September 30, 2011, will be billed and collected within one year.
Revenues from all other contracts for the design and manufacture of custom equipment, for service and for parts sales, net of any discounts and return allowances, are recorded aswhen the productsfollowing four revenue recognition criteria are shippedmet: product is delivered or service is performed.
The Company’s customers may qualify for certain cash rebates generally based on the level of sales attained during a twelve-month period. Provisions for these rebates, as well as estimated returns and allowances and other adjustments are provided for in the same period the related sales are recorded. Return allowances, which reduce product revenue, are estimated using historical experience.
Product warranty costs are estimated using historical experience and known issues and are charged to production costs as revenue is recognized.
All product engineering and development costs, and selling, general and administrative expenses are charged to operations as incurred. Provision is made for any anticipated contract losses in the period that the loss becomes evident.
The estimated costsallowance for doubtful accounts is determined by performing a specific review of product warrantiesall account balances greater than 90 days past due and other higher risk amounts to determine collectability and also adjusting for any known customer payment issues with account balances in the less-than-90-day past due aging category. Account balances are charged off against the allowance for doubtful accounts when they are determined to production costs as revenue is recognized.be uncollectable. Any recoveries of account balances previously considered in the allowance for doubtful accounts reduce future additions to the allowance for doubtful accounts.
Shipping and Handling Costs
Shipping and handling costs are included in production costs in the Consolidated Statementsconsolidated statements of Operations.operations.
Income Taxes
Income taxes are provided for the tax effects of transactions reported in the consolidated financial statements and consist primarily of taxes currently due, plus deferred taxes (see Note 6).
The Company recognizes deferred tax liabilities and assets for the expected future tax consequences of events that have been included in the consolidated financial statements or tax returns using current tax rates. The Company and its domestic subsidiaries file a consolidated federal income tax return. The foreign subsidiaries provided income taxes based on the tax regulations of the countries in which they operate. Undistributed earnings of the Company’s foreign subsidiaries were intended to be indefinitely reinvested. No deferred taxes were provided on these earnings.
Deferred tax assets and liabilities are measured using the rates expected to apply to taxable income in the years in which the temporary differences are expected to reverse and the credits are expected to be used. The effect on deferred tax assets and liabilities of the change in tax rates is recognized in income in the period that includes the enactment date. All available evidence, both positive and negative, is considered to determine whether, based on the weight of that evidence, a valuation allowance is needed for some portion or all of a deferred tax asset. No such valuation allowances were recorded as of September 30, 20102012 and 2009.2011.
Comprehensive Income (Loss)
OtherFor the years ended September 30, 2012 and 2011, other comprehensive income (loss) consists ofis equal to net income and includes all other changes in shareholders’ equity except those resulting from investments by owners and distributions to them. For all years presented, the Company’s comprehensive income (loss), which encompasses net income and foreign currency translation adjustments, is separately displayed in the consolidated statement of shareholders’ equity.income.
Reporting Segments
Information concerning principal geographic areas is as follows (in thousands):follows:
| 2010 | 2009 | 2012 | 2011 | |||||||||||||||||||||||||||||
| Revenues | Long-Term Assets | Revenues | Long-Term Assets | Revenues | Long-Term Assets | Revenues | Long-Term Assets | |||||||||||||||||||||||||
United States | $ | 55,587,000 | $ | 7,850,000 | $ | 55,660,000 | $ | 8,331,000 | $ | 63,182,000 | $ | 7,978,000 | $ | 59,692,000 | $ | 8,703,000 | ||||||||||||||||
United Kingdom | — | 281,000 | 1,129,000 | 320,000 | — | 244,000 | — | 248,000 | ||||||||||||||||||||||||
|
|
|
| |||||||||||||||||||||||||||||
Total | $ | 55,587,000 | $ | 8,131,000 | $ | 56,789,000 | $ | 8,651,000 | $ | 63,182,000 | $ | 8,222,000 | $ | 59,692,000 | $ | 8,951,000 | ||||||||||||||||
|
|
|
| |||||||||||||||||||||||||||||
Revenues are attributed to geographic areas based on the location of the assets producing the revenues.
ReclassificationsCustomers with 10% (or greater) of Net Revenues
Certain reclassifications have been made toAs a result of timing and production schedules of a very large contract and resultant revenue recognition, approximately 21% of total net revenue in the Consolidated Financial Statements. To maintain comparability amongquarter ended September 30, 2012 and 7% of total net revenue for the periods presented,quarter ended September 30, 2011 was from one or more separate U.S. corporate entities ultimately affiliated with a foreign-based global company. For the Company has revised the presentationyears ended September 30, 2012 and 2011, this company represented 26% and 7% of certain prior period amounts reported within the Consolidated Financial Statements. These reclassifications had no impact on previously reportedtotal net income (loss).revenue, respectively.
NOTE 2 -– INVENTORIES, NET
Net inventories consist of the following:
| September 30, | September 30, | |||||||||||||||
| 2010 | 2009 | 2012 | 2011 | |||||||||||||
Raw materials | $ | 11,349,000 | $ | 13,063,000 | $ | 7,375,000 | $ | 8,846,000 | ||||||||
Work in process | 1,343,000 | 2,829,000 | 1,201,000 | 2,017,000 | ||||||||||||
Finished goods | 4,068,000 | 5,858,000 | 3,202,000 | 1,726,000 | ||||||||||||
Used equipment | 581,000 | 490,000 | 140,000 | 289,000 | ||||||||||||
|
| |||||||||||||||
| $ | 17,341,000 | $ | 22,240,000 | $ | 11,918,000 | $ | 12,878,000 | |||||||||
|
| |||||||||||||||
At September 30, 20102012 and 2009,2011, cost is determined by the last-in, first-out (“LIFO”) method for inventories. The estimated current cost of inventories exceeded their LIFO basis by approximately $4,091,000$4,992,000 and $4,732,000$4,435,000 at September 30, 20102012 and 2009,2011, respectively.
NOTE 3 -– COSTS AND ESTIMATED EARNINGS IN EXCESS OF BILLINGS
Costs and estimated earnings in excess of billings on uncompleted contracts consist of the following:
| September 30, | September 30, | |||||||||||||||
| 2010 | 2009 | 2012 | 2011 | |||||||||||||
Costs incurred on uncompleted contracts | $ | 357,000 | $ | 7,316,000 | $ | 4,986,000 | $ | 7,039,000 | ||||||||
Estimated earnings | 387,000 | 1,839,000 | 1,518,000 | 2,059,000 | ||||||||||||
|
| |||||||||||||||
| 744,000 | 9,155,000 | 6,504,000 | 9,098,000 | |||||||||||||
Billings to date | 164,000 | 4,625,000 | 3,056,000 | 4,648,000 | ||||||||||||
|
| |||||||||||||||
Costs and estimated earnings in excess of billings | $ | 580,000 | $ | 4,530,000 | $ | 3,448,000 | $ | 4,450,000 | ||||||||
|
| |||||||||||||||
NOTE 4 -– PROPERTY AND EQUIPMENT
Property and equipment consist of the following:
| September 30, | September 30, | |||||||||||||||
| 2010 | 2009 | 2012 | 2011 | |||||||||||||
Land and improvements | $ | 3,540,000 | $ | 3,540,000 | $ | 3,540,000 | $ | 3,540,000 | ||||||||
Buildings and improvements | 12,637,000 | 12,631,000 | 13,229,000 | 13,128,000 | ||||||||||||
Equipment | 10,284,000 | 9,918,000 | 9,975,000 | 11,154,000 | ||||||||||||
|
| |||||||||||||||
| 26,461,000 | 26,089,000 | 26,744,000 | 27,822,000 | |||||||||||||
Less: Accumulated depreciation and amortization | (18,688,000 | ) | (17,882,000 | ) | (18,617,000 | ) | (19,473,000 | ) | ||||||||
|
| |||||||||||||||
Property and equipment, net | $ | 7,773,000 | $ | 8,207,000 | $ | 8,127,000 | $ | 8,349,000 | ||||||||
|
| |||||||||||||||
Property and equipment includes approximately $10,566,000$8,899,000 and $8,478,000$10,304,000 of fully depreciated assets, which remainremained in service during fiscal 20102012 and 2009.2011, respectively.
NOTE 5 -– ACCRUED EXPENSES
Accrued expenses consist of the following:
| September 30, | September 30, | |||||||||||||||
| 2010 | 2009 | 2012 | 2011 | |||||||||||||
Payroll and related accruals | $ | 1,556,000 | $ | 1,291,000 | $ | 1,650,000 | $ | 1,509,000 | ||||||||
Warranty and related accruals | 709,000 | 396,000 | 524,000 | 727,000 | ||||||||||||
Professional fees | 175,000 | 108,000 | 286,000 | 181,000 | ||||||||||||
Other | 883,000 | 784,000 | 1,057,000 | 425,000 | ||||||||||||
|
| |||||||||||||||
Accrued expenses | $ | 3,323,000 | $ | 2,579,000 | $ | 3,517,000 | $ | 2,842,000 | ||||||||
|
| |||||||||||||||
NOTE 6 - INCOME TAXES
The provision for income tax expense (benefit) consists of:
| Year Ended September 30, | Years Ended September 30, | |||||||||||||||
| 2010 | 2009 | 2012 | 2011 | |||||||||||||
Current: | ||||||||||||||||
Federal | $ | (614,000 | ) | $ | (62,000 | ) | $ | 51,000 | $ | 87,000 | ||||||
State | 2,000 | (10,000 | ) | 168,000 | 207,000 | |||||||||||
|
| |||||||||||||||
Total current | 616,000 | (72,000 | ) | 219,000 | 294,000 | |||||||||||
|
| |||||||||||||||
Deferred | 6,000 | (2,490,000 | ) | |||||||||||||
Federal | 2,161,000 | (1,328,000 | ) | |||||||||||||
State | — | (1,724,000 | ) | |||||||||||||
|
| |||||||||||||||
Income tax (benefit) | $ | (610,000 | ) | $ | (2,562,000 | ) | ||||||||||
Total deferred | 2,161,000 | (3,052,000 | ) | |||||||||||||
|
| |||||||||||||||
Income tax expense (benefit) | $ | 2,380,000 | $ | (2,758,000 | ) | |||||||||||
|
| |||||||||||||||
A reconciliation of the federal statutory tax rate to the total tax provision is as follows:
| Year Ended September 30, | ||||||||
| 2010 | 2009 | |||||||
Federal income taxes computed at the statutory rate | 34.0 | % | -34.0 | % | ||||
Tax exempt interest income and unrealized gains | -16.7 | % | -13.1 | % | ||||
Non-taxable stock transaction | -10.6 | % | — | |||||
Benefit of federal refund | -33.7 | % | — | |||||
Other, net | 1.1 | % | -3.0 | % | ||||
| -25.9 | % | -50.1 | % | |||||
| Years Ended September 30, | ||||||||
| 2012 | 2011 | |||||||
Federal income taxes computed at the statutory rate | 34.0 | % | 34.0 | % | ||||
State income taxes, net of federal benefit | 2.5 | % | (8.2 | %) | ||||
Tax-exempt interest income | (2.2 | %) | 20.3 | % | ||||
Reversal of unrecognized tax benefits | — | 68.0 | % | |||||
Other, net | 0.4 | % | (5.3 | %) | ||||
|
|
|
| |||||
| 34.7 | % | 108.8 | % | |||||
|
|
|
| |||||
Deferred tax assets and liabilities consist of the following at September 30, 2010 and 2009:following:
| Year Ended September 30, | Years Ended September 30, | |||||||||||||||
| 2010 | 2009 | 2012 | 2011 | |||||||||||||
Deferred Tax Assets: | ||||||||||||||||
Accrued liabilities and reserves | $ | 868,000 | $ | 741,000 | $ | 823,000 | $ | 636,000 | ||||||||
Allowance for doubtful accounts | 672,000 | 917,000 | 137,000 | 217,000 | ||||||||||||
Inventory | 427,000 | 80,000 | 162,000 | 496,000 | ||||||||||||
Investment in Carbontronics | 28,000 | — | ||||||||||||||
Net operating loss carryforward | — | 498,000 | ||||||||||||||
Unrealized loss on investments | — | 1,413,000 | ||||||||||||||
Other | 98,000 | 28,000 | ||||||||||||||
|
| |||||||||||||||
Gross Deferred Tax Assets | 1,995,000 | 1,738,000 | 1,220,000 | 3,288,000 | ||||||||||||
|
| |||||||||||||||
Deferred and Other Tax Liabilities: | ||||||||||||||||
Unrealized gain on investments | (310,000 | ) | — | |||||||||||||
Percentage of completion | (566,000 | ) | (768,000 | ) | ||||||||||||
Property, plant and equipment | (1,006,000 | ) | (1,021,000 | ) | ||||||||||||
Unrecognized tax benefits | (300,000 | ) | (300,000 | ) | ||||||||||||
Other | (12,000 | ) | (12,000 | ) | ||||||||||||
|
| |||||||||||||||
Gross Deferred and Other Tax Liabilities | (2,194,000 | ) | (2,101,000 | ) | ||||||||||||
|
| |||||||||||||||
Net Deferred Income and Other Tax Assets (Liabilities) | $ | (974,000 | ) | $ | 1,187,000 | |||||||||||
|
| |||||||||||||||
Deferred and Other Tax Liabilities: Unrealized gain on investments Percentage of completion Property, plant and equipment Unrecognized tax benefits Investment in Carbontronics Gross Deferred and Other Tax Liabilities Net Deferred Income and Other Tax Liabilities (1,191,000 ) (331,000 ) (144,000 ) (686,000 ) (501,000 ) (477,000 ) (2,024,000 ) (2,024,000 ) — (79,000 ) (3,860,000 ) (3,597,000 ) $ (1,865,000 ) $ (1,859,000 )
There were no accumulated deficits of non-U.S. subsidiaries included in consolidated retained earnings as of September 30, 2009. The Company’s foreign operations in the United Kingdom were sold during 2009.
Total income taxes paid in 20092012 were $7,000. There were no$145,000. Total income taxes paid in 2010.2011 were $226,000. As of September 30, 2011, the deferred tax asset of $498,000 associated with the net operating loss carryforward is included in other long-term assets on the consolidated balance sheet. The net operating loss carryforward was used in 2012.
Generally Accepted Accounting Principles (“GAAP”) prescribes a comprehensive model for the financial recognition, measurement, classification, and disclosure of uncertain tax positions. GAAP contains a two-step approach to recognizing and measuring uncertain tax positions. The first step is to evaluate the tax position for recognitionsrecognition by determining if the weight of available evidence indicates that it is more likely than not that the position will be sustained on audit, based on the technical merits of the position. The second step is to measure the tax benefit as the largest amount that is more than 50% likely of being realized upon settlement.
Significant judgment is required in evaluating the Company’s uncertain tax position and determining the Company’s provision for taxes. Although the Company believes the reserves of unrecognized tax benefits (“UTB”UTB’s”) are reasonable, no assurance can be given that the final outcome of these matters will not be different from that which is reflected in the Company’s historical income tax provision and accruals. The Company adjusts these reserves in light of changing facts and circumstances. During the second fiscal quarter of 2011, the Company reversed $1,724,000 in unrecognized tax benefits following the conclusion of examinations by a state taxing authority. As of September 30, 20102012 and 20092011, the Company has UTBhad UTB’s of $2,024,000 at each year end. These amounts have been included in deferred and other income taxes in the accompanying consolidated balance sheets.$300,000. There were no additional accruals of UTBUTB’s during fiscal years ended September 30, 20092012 and 2010.2011.
The Company recognizes interest and penalties accrued related to UTBUTB’s as a component of income tax expense. There were no additional accruals of interest expense nor penalties during fiscal years ended September 30, 20092012 and 2010.2011. It is reasonably possible that the amount of the UTBUTB’s with respect to certain unrecognized tax positions will increase or decrease during the next 12 months. The Company does not expect the change to have a material effect on its results of operations or its financial position. The only expected potential reason for change would be the normal expiration of the statute of limitations or the ultimate results stemming from any examinations by taxing authorities. If recognized, the entire UTBamount of UTB’s would have an impact on the Company’s effective tax rate.
The Company files U.S. federal income tax returns, as well as income tax returns in various states. The Company’s U.S. federal income tax returns and most state returns, filed for tax years prior to fiscal year ended September 30, 20072009 are no longer subject to examination by taxing authorities due to the expiration of the statute of limitations. A state taxing authority is currently examiningThe statute of limitations for the Company’s U.S. federal income tax returnsreturn for the fiscal yearsyear ended September 30, 20072009 has been extended and will remain open to examination through 2009. Management believes the ultimate outcome of this matter will not have a material impact on the Company’s financial statements.June 30, 2014.
NOTE 7 -– RETIREMENT BENEFITS
The Company has a voluntary 401(k) employee benefit plan, which covers all eligible, domestic employees. The Company makes discretionary matching contributions subject to a maximum level, in accordance with the terms of the plan. The Company charged approximately $132,000$131,000 and $136,000$130,000 to expense under the provisions of the plan during the fiscal years 20102012 and 2009,2011, respectively.
The Company has a collective bargaining agreement covering production and maintenance employees at its Marquette, Iowa facility. Under this agreement, the Company contributed approximately $90,000 in fiscal 2012 and $69,000 in fiscal 2011 to an employee pension fund. The amount contributed by the Company is based on an hourly rate per hours worked up to a maximum of 40 hours per week per employee. The Company has no other obligations with respect to this fund.
NOTE 8 -– LONG-TERM DEBT
On August 1, 2003, the Company entered into a revolving credit and security agreement (“Credit Agreement”) with PNC Bank, N.A. The Credit Agreement established a three year revolving $20 million credit facility (“Credit Facility”) and was renewed through July 31, 2009. The Credit Agreement provided for advances based on accounts receivable, inventory and real property. The Credit Agreement also provided for up to $2 million of letters of credit capacity.
The Company amended the Credit Agreement on July 23, 2009 (the “Third Amendment”) by extending its maturity through April 30, 2010 and reducing the amount available under the Credit Facility from $20 million to $1.5 million. The amended Credit Agreement also reduced the amount available for letters of credit from $2 million to $1.285 million. The Third Amendment provided for substantially the same representations, warranties, covenants, rights, duties and obligations as set forth in the original Credit Agreement.
The Company was required to maintain a fixed charge coverage ratio (as defined in the Credit Agreement) of 1.1:1. There werehad no required repayments as long as there were no defaults under the Credit Agreement and there was adequate eligible collateral. The interest ratelong-term debt outstanding at September 30, 2009, was LIBOR plus 2%. Substantially all of the Company’s assets are pledged as security under the Credit Agreement.
The Credit Agreement expired on April 30, 2010.2012 or 2011. The Company does not currently require a credit facility, but continues to review and evaluate its needs and options for such a facility.
The Company had no long term debt outstanding atAs of September 30, 2010 or 2009. In March 2010, the Company replaced its outstanding letters of credit by funding $975,000 in2012, total cash deposits atwith insurance companies to cover relatedcovering collateral needs.needs were $402,000.
NOTE 9 -– COMMITMENTS AND CONTINGENCIES
Leases
The Company leases certain equipment under non-cancelable operating leases. Future minimum rental commitments under these leases at September 30, 20102012 totaled $108,000$60,000 and are due over the next fourthree years.
Total rental expense for the fiscal years ended September 30, 20102012 and 20092011 was $274,000$318,000 and $244,000,$302,000, respectively.
Litigation
The Company has various pending litigation and other claims. Those claims which are made in the ordinary course of business may be covered in whole or in part by insurance, and if found against the Company, management does not believe these matters will have a material effect on the Company’s financial position, results of operations or cash flows. Management has reviewed all litigation matters arising in the ordinary course of business and has made provisions, not deemed material, for any estimable losses and expenses of litigation.
NOTE 10 -– SHAREHOLDERS’ EQUITY
Under the Company’s amended certificate of incorporation, certain rights of the holders of the Company’s common stock are modified by shares of Class B stock for as long as such shares shall remain outstanding. During that period, holders of common stock will have the right to elect approximately 25% of the Company’s Board of Directors, and conversely, Class B stock will be entitled to elect approximately 75% of the Company’s Board of Directors. During the period when common stock and Class B stock are outstanding, certain matters submitted to a vote of shareholders will also require approval of the holders of common stock and Class B stock, each voting separately as a class. Common stock and Class B shareholders have equal rights with respect to dividends, preferences, and rights, including rights in liquidation.
In June 2010,During the first quarter of fiscal 2011, the Company was the recipient of ninety-five thousandretired 95,000 shares of Companyits common stock as a result of a settlement and release agreement on a lawsuit against certain Company shareholders. The lawsuit related to alleged short-swing profits arising from purchases and sales of Company common stock by the defendants to the suit. The parties to the suit entered into the agreement for the sole purpose of resolving contested claims and disputes and avoiding the substantial costs associated with litigating the claims and disputes. No wrongdoing or liability was admitted to by the defendants. In 2010, other non-operating income and treasury stock include $738,000 related to the estimated fair value of the stock received. Fair value was determined to be the closing bid price of the common stock received as of the date of receipt.held in treasury.
NOTE 11 - STOCK BASED– STOCK-BASED COMPENSATION
The Company maintains stock basedstock-based compensation plans, which provide for the issuance of Company stock to certain directors, officers, key employees and affiliates.
On March 17, 2009, the stockholdersshareholders of the Company approved the 2009 Incentive Compensation Plan (the “2009 Plan”). The 2009 Plan provides that the total number of shares of Company stock that may be subject to the granting of awards under the 2009 Plan (“Awards”) at any time during the term of the 2009 Plan shall be equal to 800,000 shares of common stock and 160,000 shares of Class B stock. The foregoing limit shall be increased, as provided for in the 2009 Plan. Persons eligible to receive Awards under the 2009 Plan include employees, directors, consultants and other persons who provide services to the Company. The 2009 Plan imposes individual limitations on the amount of certain Awards, in part, to comply with IRS Code, Section 162(m). The Awards can be in the form of stock options, restricted and deferred stock, performance awards and other stock basestock-based awards, as provided for in the 2009 Plan. There have been no
On July 1, 2011, 298,000 common stock options were issued to employees under the 2009 Plan. These options vest at 25% per year starting on October 1, 2012 and each year thereafter through October 1, 2015. As long as the employee remains employed by the Company, these options will be exercisable upon vesting and remain exercisable through October 1, 2021. The Company used the Black-Scholes pricing model to estimate the fair value of the options of $941,000 at time of grant. At September 30, 2012, $711,000 of compensation expense remained to be expensed over the next three years. The following assumptions were used to determine the fair value of the stock options at time of grant:
Risk-free interest rate | 2.0% | |
Expected life of options | 10.0 years | |
Dividend yield | 0.0% | |
Volatility | 34.2% |
On May 28, 2012, 20,000 common stock options were issued to an employee under the 2009 Plan. These options vest at 25% per year starting on May 28, 2013 and each year thereafter through May 28, 2016. As long as the employee remains employed by the Company, these options will be exercisable upon vesting and remain exercisable through October 1, 2021. The Company used the Black-Scholes pricing model to estimate the fair value of the options of $63,000 at time of grant. At September 30, 2012, $58,000 of compensation expense remained to be expensed through May 28, 2016. The following assumptions were used to determine the fair value of the stock options at time of grant:
Risk-free interest rate | 2.0% | |
Expected life of options | 9.4 years | |
Dividend yield | 0.0% | |
Volatility | 32.7% |
As of September 30, 2012, 482,000 shares of Company common stock and 160,000 shares of Class B stock are available for granting of awards madeunder the 2009 Plan.
The following table summarizes option activity under the 2009 Plan:
| Number of Shares | Average Exercise Price Per Share | |||||||
Options granted – July 1, 2011 | 298,000 | $ | 7.689 | |||||
|
| |||||||
Options outstanding at September 30, 2011 | 298,000 | $ | 7.689 | |||||
Options granted – May 28, 2012 | 20,000 | $ | 7.150 | |||||
|
| |||||||
Options outstanding at September 30, 2012 | 318,000 | $ | 7.655 | |||||
|
| |||||||
The weighted average remaining contractual life on the options outstanding as of September 30, 2012 is 9 years under the 2009 Plan.
The 1997 Stock Option Plan (the “1997 Plan”) provided for the issuance of incentive stock options and nonqualified stock options to purchase up to 1,200,000 shares of the Company’s common stock, 1,200,000 shares of the Company’s Class B stock and up to fifteen percent (15%)15% of the authorized common stock of any subsidiary. Under the terms of the 1997 Plan, option holders may tender previously owned shares with a market value equal to the exercise price of the options at exercise date, subject to compensation committee approval. Additionally, option holders may, upon compensation committee approval, surrender shares of stock to satisfy federal withholding tax requirements. Options become exercisable in a manner and on such dates and times, as determined by a committee of the Board of Directors. Options expire not more than ten years from the date of grant. The option holders have no shareholder rights until the date of issuance of a stock certificate for such shares.
As of September 30, 2010,2012, there were no options available for future grants under the 1997 Plan.
The following table summarizes option activity under the 1997 Plan:
| Number of Shares | Option Price Per Share | |||||||
Outstanding at September 30, 2010 and 2009 | 27,500 | $ | 9.32 | |||||
| Number of Shares | Exercise Price Per Share | |||||||
Outstanding at September 30, 2012 and 2011 | 27,500 | $ | 9.32 | |||||
The weighted average remaining contractual life on the options outstanding as of September 30, 20102012 is 6 years.4 years under the 1997 Plan.
NOTE 12 -– RELATED PARTY TRANSACTIONS
Marcar Leasing Corporation (“Marcar”) is engaged in leasing machinery and vehicles to the public and the Company. Marcar is owned by family members of the Company’s chairman. The terms of the leases are established based on the rates charged by independent leasing organizations and are believed to be more favorable than those generally available from independent third parties. New leases between the Company and Marcar generally provide for equal monthly payments over either thirty-six36 months or forty-eight48 months. During fiscal 20102012 and 2009,2011, the Company made lease payments to Marcar totaling $163,000$151,000 and $156,000,$179,000, respectively.
SCHEDULE Quarterly Financial Information
Quarterly Financial Information (Unaudited)
| Quarter Ended (in thousands except per share data) | Quarter Ended (in thousands except per share data) | |||||||||||||||||||||||||||||||
| December 31 | March 31 | June 30 | September 30 | December 31 | March 31 | June 30 | September 30 | |||||||||||||||||||||||||
2010 | ||||||||||||||||||||||||||||||||
Net sales | $ | 11,070 | $ | 24,042 | $ | 12,684 | $ | 7,791 | ||||||||||||||||||||||||
2012 | ||||||||||||||||||||||||||||||||
Net revenue | $ | 6,864 | $ | 19,339 | $ | 22,986 | $ | 13,993 | ||||||||||||||||||||||||
Production costs | 9,443 | 17,845 | 11,176 | 7,972 | 6,141 | 15,273 | 17,237 | 12,501 | ||||||||||||||||||||||||
Gross profit (loss) | 1,627 | 6,197 | 1,508 | (181 | ) | |||||||||||||||||||||||||||
Gross profit | 723 | 4,066 | 5,749 | 1,492 | ||||||||||||||||||||||||||||
Production engineering and development | 538 | 765 | 607 | 790 | 539 | 556 | 670 | 575 | ||||||||||||||||||||||||
Selling, general and administrative | 2,440 | 2,698 | 2,419 | 1,943 | 1,797 | 2,523 | 2,678 | 2,299 | ||||||||||||||||||||||||
Income (loss) from operations | (1,351 | ) | 2,734 | (1,518 | ) | (2,914 | ) | (1,613 | ) | 987 | 2,401 | (1,382 | ) | |||||||||||||||||||
Income from investees | 163 | — | — | — | ||||||||||||||||||||||||||||
Other income (expense) | 2,813 | 3,184 | (696 | ) | 1,158 | |||||||||||||||||||||||||||
Income (loss) before income tax expense | 1,200 | 4,171 | 1,705 | (224 | ) | |||||||||||||||||||||||||||
Income tax expense | 325 | 1,405 | 513 | 137 | ||||||||||||||||||||||||||||
Net income (loss) | (224 | ) | 2,696 | (1,576 | ) | 2,073 | $ | 875 | $ | 2,766 | $ | 1,192 | $ | (361 | ) | |||||||||||||||||
Net income (loss) – basic earnings (loss) per share | $ | (0.02 | ) | $ | 0.28 | $ | (0.16 | ) | $ | 0.22 | $ | 0.09 | $ | 0.29 | $ | 0.13 | $ | (0.04 | ) | |||||||||||||
Net income (loss) – diluted earnings (loss) per share | $ | (0.02 | ) | $ | 0.28 | $ | (0.16 | ) | $ | 0.22 | $ | 0.09 | $ | 0.29 | $ | 0.13 | $ | (0.04 | ) | |||||||||||||
2009 | ||||||||||||||||||||||||||||||||
Net sales | $ | 19,260 | $ | 15,416 | $ | 11,674 | $ | 10,439 | ||||||||||||||||||||||||
2011 | ||||||||||||||||||||||||||||||||
Net revenue | $ | 7,785 | $ | 16,727 | $ | 23,015 | $ | 12,165 | ||||||||||||||||||||||||
Production costs | 14,118 | 13,363 | 9,724 | 10,336 | 6,809 | 14,052 | 18,756 | 10,661 | ||||||||||||||||||||||||
Gross profit | 5,142 | 2,053 | 1,950 | 103 | 976 | 2,675 | 4,259 | 1,504 | ||||||||||||||||||||||||
Production engineering and development | 702 | 507 | 538 | 971 | 529 | 534 | 547 | 601 | ||||||||||||||||||||||||
Selling, general and administrative | 3,037 | 2,574 | 2,024 | 3,104 | 2,103 | 2,294 | 2,265 | 2,284 | ||||||||||||||||||||||||
Income (loss) from operations | 1,403 | (1,028 | ) | (1,059 | ) | (4,085 | ) | (1,656 | ) | (153 | ) | 1,447 | (1,381 | ) | ||||||||||||||||||
Income from investees | 48 | — | — | — | ||||||||||||||||||||||||||||
Net loss | (330 | ) | (338 | ) | (728 | ) | (1,150 | ) | ||||||||||||||||||||||||
Other income (expense) | 3,166 | 1,131 | 52 | (5,140 | ) | |||||||||||||||||||||||||||
Income before income tax expense (benefit) | 1,510 | 978 | 1,499 | (6,521 | ) | |||||||||||||||||||||||||||
Income tax expense (benefit) | 405 | (1,472 | ) | 409 | (2,100 | ) | ||||||||||||||||||||||||||
Net income (loss) | $ | 1,105 | $ | 2,450 | $ | 1,090 | $ | (4,421 | ) | |||||||||||||||||||||||
Net loss – basic loss per share | $ | (0.03 | ) | $ | (0.04 | ) | $ | (0.08 | ) | $ | (0.12 | ) | ||||||||||||||||||||
Net loss – diluted loss per share | $ | (0.03 | ) | $ | (0.04 | ) | $ | (0.08 | ) | $ | (0.12 | ) | ||||||||||||||||||||
Net income (loss) – basic earnings (loss) per share | $ | 0.12 | $ | 0.26 | $ | 0.11 | $ | (0.46 | ) | |||||||||||||||||||||||
Net income (loss) – diluted earnings (loss) per share | $ | 0.12 | $ | 0.26 | $ | 0.11 | $ | (0.46 | ) | |||||||||||||||||||||||
The net income (loss) per share on a year-to-date calculation may not equal the total of the quarterly calculations due to rounding.rounding ..
| ITEM 9. | CHANGES IN AND DISAGREEMENTS WITH ACCOUNTANTS ON ACCOUNTING AND FINANCIAL DISCLOSURE |
None
| ITEM 9A. | CONTROLS AND PROCEDURES |
Evaluation of Disclosure Controls and Procedures
The Company’s Chief Executive Officer and Acting Chief Financial Officer evaluated the effectiveness of the design and operation of the Company’s “disclosure controls and procedures” (as defined in Rule 13a-15(e) under the Securities Exchange Act of 1934, as amended (the “Exchange Act”) as of the end of the period covered by this Report. Based upon that evaluation, the Chief Executive Officer and the Acting Chief Financial Officer concluded that, as of the end of the period covered by this Report, the Company’s disclosure controls and procedures are effective.
Because of inherent limitations, the Company’s disclosure controls and procedures, no matter how well designed and operated, can provide only reasonable, and not absolute, assurance that the objectives of such disclosure controls and procedures are met and no evaluation can provide absolute assurance that all control issues and instances of fraud, if any, within the Company has been detected.
As of the end of the period covered by this Report the Company conducted an evaluation, under the supervision and with the participation of the Company’s management, including the Company’s principal executive officer and principal financial officer, of the effectiveness of the design and operation of the Company’s disclosure controls and procedures pursuant to Exchange Act Rules 13a-15(b). Based on this evaluation, the Company’s principal executive officer and principal financial officer concluded that the Company’s disclosure controls and procedures were effective as of September 30, 2010.2012.
Management’s Annual Report on Internal Control over Financial Reporting
This Annual Report does not include an attestation report of the Company’s registered public accounting firm regarding internal control over financial reporting. Management’s report was not subject to attestation by the Company’s registered public accounting firm pursuant to rules of the Securities and Exchange Commission that permit the Company to provide only management’s report in this Annual Report.
The management of the Company is responsible for establishing and maintaining adequate internal control over financial reporting (as defined in Rule 13a-15(f) under the Exchange Act) for the Company. The Company’s internal control system is designed to provide reasonable assurance to the Company’s management and board of directors regarding the reliability of financial reporting and the preparation of financial statements for external purposes in accordance with generally accepted accounting principles. There are inherent limitations in the effectiveness of all internal control systems no matter how well designed. Therefore, even those systems determined to be effective can provide only reasonable assurance with respect to the preparation and presentation of financial statements. Furthermore, projections of any evaluation of effectiveness to future periods are subject to the risk that controls may become inadequate because of a change in circumstances or conditions.
In order to ensure that the Company’s internal control over financial reporting is effective, management regularly assesses such controls and did so most recently as of September 30, 2010.2012. This assessment was based on criteria for effective internal control over financial reporting described in Internal Control-Integrated Framework issued by the Committee of Sponsoring Organizations of the Treadway Commission. Based on this assessment, management believes the Company maintained effective internal control over financial reporting as of September 30, 2010.2012.
Changes in Internal Control over Financial Reporting
The Company’s management, including the Chief Executive Officer and Acting Chief Financial Officer, has reviewed the Company’s internal control over financial reporting. There were no changes in the Company’s internal control over financial reporting during the quarteryear ended September 30, 20102012 that materially affected, or are reasonably likely to materially affect, the Company’s internal control over financial reporting.
| ITEM 9B. | OTHER INFORMATION |
None
PART III
| ITEM 10. | DIRECTORS, EXECUTIVE OFFICERS AND CORPORATE GOVERNANCE |
The names and ages of the Directors and Executive Officers of the Company as of September 30, 2010 are listed in the following table:
NAME AND PRINCIPAL OCCUPATION OR EMPLOYMENT (1) | AGE | FIRST BECAME A DIRECTOR | FIRST BECAME AN EXECUTIVE OFFICER | |||||||||
Directors for Class B Stockholders: | ||||||||||||
E. J. Elliott (2) (3) (6) | 81 | 1968 | 1968 | |||||||||
Marc G. Elliott (2) (3) (6) | 45 | 2007 | 1993 | |||||||||
Randolph H. Fields (2) (6) (8) | 69 | 2002 | ||||||||||
David A. Air (5) | 78 | 2004 | ||||||||||
James P. Sharp (7) Service – 2005 & 2006, respectively Ingersoll Rand, 1979 to 2004, President various divisions 2000 to 2004 | 58 | 2010 | ||||||||||
Director for Common Stock Stockholders: | ||||||||||||
Cort J. Dondero (5) (7) President of Georgia Aggregates for Florida Rock Industries – 2006 to 2007 Vice President & General Manager, Vulcan Materials Company – 2007 to 2008 Chief Operating Officer, Panadero Aggregates (parent of Bluegrass Materials Company) – 2009 to present | 59 | 2008 | ||||||||||
Executive Officers:(4) | ||||||||||||
Dennis B. Hunt Vice President, Vulcan Materials Company, Western Division – 1999 to 2004 | 54 | 2008 | ||||||||||
Jeanne M. Lyons | 52 | 1996 | ||||||||||
All other information required by this Item 10 is incorporated herein by reference to the Company’s definitive 2011Definitive 2013 Proxy Statement for the Annual Meeting of Stockholders.
| ITEM 11. | EXECUTIVE COMPENSATION |
The information required by this Item 11 is incorporated herein by reference to the Company’s definitive 2011Definitive 2013 Proxy Statement for the Annual Meeting of Stockholders.
| ITEM 12. | SECURITY OWNERSHIP OF CERTAIN BENEFICIAL OWNERS AND MANAGEMENT AND RELATED STOCKHOLDER MATTERS |
The information required by this Item 12 is incorporated herein by reference to the Company’s definitive 2011Definitive 2013 Proxy Statement for the Annual Meeting of Stockholders.
| ITEM 13. | CERTAIN RELATIONSHIPS AND RELATED TRANSACTIONS, AND DIRECTOR INDEPENDENCE |
The information required by this Item 13 is incorporated herein by reference to the Company’s definitive 2011Definitive 2013 Proxy Statement for the Annual Meeting of Stockholders.
| ITEM 14. | PRINCIPAL ACCOUNTING FEES AND SERVICES |
The information required by this Item 14 is incorporated herein by reference to the Company’s definitive 2011Definitive 2013 Proxy Statement for the Annual Meeting of Stockholders.
PART IV
| ITEM 15. | EXHIBITS AND FINANCIAL STATEMENT SCHEDULES |
| (a) | A listing of financial statements and financial statement schedules filed as part of this Report and which financial statements and schedules are incorporated into this report by reference, is set forth in the “Index to Financial Statements” in Item 8 hereof. |
| (b) | Exhibit Index |
EXHIBIT
| DESCRIPTION | FILED | ||||
| 3.1 | Restated Certificate of Incorporation of Company, incorporated by reference to Exhibit 3.1 to Registration No. | |||||
| 3.2 | Amended and Restated By-Laws of Gencor Industries, Inc., incorporated by reference Exhibit 3.2 to the Company’s Annual Report on Form 10-K for the year ended September 30, 2007. | |||||
| 3.3 | Certificate of Amendment, changing name of Mechtron International Corporation to Gencor Industries, Inc. and adding a “twelfth” article regarding director liability limitation, incorporated by reference to the Company’s annual report on Form 10-K for the year ended December 31, 1987. | |||||
| 4.1 | Form of Common Stock certificate, incorporated by reference to Exhibit 4.1 to Registration No. 33-627. | |||||
| 10.5 | Form of Agreement for Nonqualified Stock Options granted in 1986, incorporated by reference to the Annual Report on Form 10-K for the year ended December 31, 1986. | |||||
| 10.11 | 1997 Stock Option Plan incorporated by reference to Exhibit A to the Company’s Proxy Statement on 14A, filed March 3, 1997. | |||||
|
|
| ||||
| 10.12 | First Amendment to the Stock Option Plan Agreement incorporated by reference to Exhibit 10.12 to the Company’s Quarterly Report on Form 10-Q for the quarter ended June 30, 2006. | |||||
| 10.1 | The Company’s 2009 Incentive Compensation Plan, as incorporated by reference to the Company’s 2009 Proxy Statement filed with the Securities and Exchange Commission on Schedule 14A on January 28, | |||||
| 21.1 | Subsidiaries of the Registrant | X | ||||
| 23.1 | Consent of Independent | X | ||||
| 31.1 | Certification of Chief Executive Officer Pursuant to Rule 13a – 14(a) of the Securities Exchange Act of 1934, as amended | X | ||||
| 31.2 | Certification of | X | ||||
| 32.1 | Certifications of Chief Executive Officer and | X | ||||
EXHIBIT | DESCRIPTION | FILED HEREWITH | ||
| 101.INS | XBRL Instance Document | |||
| 101.SCH | XBRL Taxonomy Extension Schema | |||
| 101.CAL | XBRL Taxonomy Extension Calculation Linkbase | |||
| 101.DEF | XBRL Taxonomy Extension Definition Linkbase | |||
| 101.LAB | XBRL Taxonomy Extension Label Linkbase | |||
| 101.PRE | XBRL Taxonomy Extension Presentation Linkbase | |||
Pursuant to the requirements of Sections 13 or 15(d) of the Securities Exchange Act of 1934, the Registrant has duly caused this Report to be signed on its behalf by the undersigned, thereunto duly authorized.
| Dated: December | GENCOR INDUSTRIES, INC. | |||||
| (Registrant) | ||||||
| /s/ E.J. Elliott | ||||||
| E.J. Elliott | ||||||
| Chairman and Chief Executive Officer | ||||||
Pursuant to the requirements of the Securities Exchange Act of 1934, this Report has been signed below by the following persons on behalf of the Registrant and in the capacities and on the dates indicated. The signatures of Directors constitute a majority of Directors.
| /s/ E.J. Elliott | /s/ Marc G. Elliott | |||||||
| E.J. Elliott | December | Marc G. Elliott | December | |||||
| Chairman and Chief Executive Officer | President | |||||||
| (Principal Executive Officer) | ||||||||
/s/ | ||||||||
| Eric E. Mellen | December 14, 2012 | |||||||
| Chief Financial Officer | ||||||||
| (Principal Financial and Accounting Officer) | ||||||||
| /s/ James P. Sharp | /s/ Cort J. Dondero | |||||||
| James P. Sharp | December | Cort J. Dondero | December | |||||
| Director | Director | |||||||
/s/ Randolph H. Fields | /s/ David A. Air | |||||||
| Randolph H. Fields | December | David A. Air | December | |||||
| Director | Director | |||||||
EXHIBITS FILED HEREWITH
Exhibit No. | Description | |
| 21.1 | Subsidiaries of the Registrant | |
| 23.1 | Consent of Independent | |
| 31.1 | Certification of Chief Executive Officer Pursuant to Rule 13a – 14(a) of the Securities Exchange Act of 1934, as amended | |
| 31.2 | Certification of | |
| 32.1 | Certifications of Chief Executive Officer and | |
| 101.INS | XBRL Instance Document | |
| 101.SCH | XBRL Taxonomy Extension Schema | |
| 101.CAL | XBRL Taxonomy Extension Calculation Linkbase | |
| 101.DEF | XBRL Taxonomy Extension Definition Linkbase | |
| 101.LAB | XBRL Taxonomy Extension Label Linkbase | |
| 101.PRE | XBRL Taxonomy Extension Presentation Linkbase | |
45