10-K/A
2012


| Delaware | 95-4337490 | |
|
| |
Title of each class | Name of each exchange on which registered | |
Class A Common Stock, par value 10¢ | New York Stock Exchange | |
Class B Common Stock, par value 10¢ | New York Stock Exchange | |
Large accelerated filer | Accelerated filer | Non-accelerated filer | Smaller reporting company | |||
| (Do not check if a smaller reporting company) | ||||||
$4,280,079,309.
|
| |
| ||
PART I
Item 1. Business.
Overview of Lennar Corporation
We are one of the nation’s largest homebuilders, a provider of financial services and through our Rialto Investments (“Rialto”) segment, an investor in distressed real estate assets. Our homebuilding operations include the construction and sale of single-family attached and detached homes, as well as the purchase, development and sale of residential land directly and through unconsolidated entities in which we have investments. We have grouped our homebuilding activities into four reportable segments, which we refer to as Homebuilding East, Homebuilding Central, Homebuilding West and Homebuilding Houston. Information about homebuilding activities in states in which our homebuilding activities are not economically similar to those in other states in the same geographic area is grouped under “Homebuilding Other.” Our reportable homebuilding segments and Homebuilding Other have divisions located in:
East:Florida, Maryland, New Jersey and Virginia
Central:Arizona, Colorado and Texas (1)
West:California and Nevada
Houston: Houston, Texas
Other: Georgia, Illinois, Minnesota, North Carolina and South Carolina
We have one Financial Services reportable segment that provides primarily mortgage financing, title insurance and closing services for both buyers of our homes and others. Substantially all of the loans we originate are sold within a short period in the secondary mortgage market
Our Rialto segment is a new reportable segment. Rialto’s objective is to generate superior, risk-adjusted returns by focusing on commercial and residential real estate opportunities arising from dislocation in the United States real estate markets and the eventual restructure and recapitalization of those markets. Rialto expects to be able to deliver these returns through its abilities to source, underwrite, price, manage and ultimately monetize real estate assets, as well as by providing similar services to others in markets across the country.
For financial information about our Homebuilding, Lennar Financial Services and Rialto operations, you should review Management’s Discussion and Analysis of Financial Condition and Results of Operations, which is Item 7 of this Report, and our consolidated financial statements and the notes to our consolidated financial statements, which are included in Item 8 of this Report.
Form 10-K/A Brief History of Our Company
We are a national homebuilder that operates in various states with deliveries of 10,955 new homes in 2010. Our company was founded as a local Miami homebuilder in 1954. We completed our initial public offering in 1971, and listed our common stock on the New York Stock Exchange in 1972. During the 1980s and 1990s, we entered and expanded operations in some of our current major homebuilding markets including California, Florida and Texas through both organic growth and acquisitions such as Pacific Greystone Corporation in 1997, amongst others. In 1997, we completed the spin-off of our commercial real estate business to LNR Property Corporation. In 2000, we acquired U.S. Home Corporation, which expanded our operations into New Jersey, Maryland, Virginia, Minnesota and Colorado and strengthened our position in other states. From 2002 through 2005, we acquired several regional homebuilders, which brought us into new markets and strengthened our position in several existing markets. During 2010, we made several investments through our Rialto segment in distressed real estate assets to take advantage of opportunities arising from dislocation in the United States real estate market.
Recent Business Developments
Overview
During 2010, we continued to see a housing market that was trying to stabilize. As expected, this stabilization process was impacted by the expiration of the Federal homebuyer tax credit at the end of April, which resulted in a decline in the housing market sales pace. High unemployment, foreclosures, tight lending standards and low consumer confidence have continued to present challenges for the housing market.
Despite challenges in the housing market, we returned to profitability in 2010, ending the year with net earnings of $95.3 million, or $0.51 per diluted share, compared to a net loss of $417.1 million, or $2.45 per diluted share, for the year ended November 30, 2009. We also ended 2010 with $1.2 billion in Lennar Homebuilding cash and cash equivalents. We extended our debt maturities by issuing $250 million of 6.95% senior notes maturing in 2018, $276.5 million of 2.00% convertible senior notes and $446 million of 2.75% convertible senior notes, both maturing in 2020. In addition, during the year we repurchased and retired $624.9 million of senior notes and other debt. We continued to reduce the number of Lennar Homebuilding unconsolidated joint ventures in which we have investments to 42 at the end of 2010 from 61 at the end of 2009 and our maximum recourse debt exposure related to those investments was reduced to $173 million at the end of 2010 from $288 million at the end of 2009.
In 2010, we continued focusing on refining our product offering, reducing the number of floor plans and targeting first time and value oriented homebuyers. Our more efficient product offerings have significantly reduced our construction costs and allowed us to meet our customers’ demands. Our intense focus on construction costs, product re-engineering and reduced selling, general and administrative expenses, combined with reduced sales incentives, contributed to improved gross and operating margins year over year.
As demand in some of our markets showed signs of stabilization and our balance sheet strengthened, we continued to contract for new potentially high-margin communities to improve our profitability. These strategic land purchases utilize conservative underwriting standards and began generating high returns as we started delivering those homes in the second half of 2010.
During 2010, our Lennar Financial Services segment had operating earnings of $31.3 million, compared to $36.0 million in the same period last year. The decrease in operating earnings was primarily due to decreased volume in the segment’s mortgage and title operations.
In December 2009, Rialto became a sub-advisor to Alliance Bernstein L.P. (“AB”) with regard to a fund formed under the Federal government’s Public-Private Investment Program (“PPIP”(the “Amendment”) to purchase real estate related securities from banks and other financial institutions. Rialto receives management fees for sub-advisory services. We committed to invest $75 million of the total equity commitments of approximately $1.2 billion made by private investors in this fund, and the U.S. Treasury has committed to a matching amount of approximately $1.2 billion of equity in the fund, as well as agreed to extend up to approximately $2.3 billion of debt financing. During the year ended November 30, 2010, we invested $63.8 million in the AB PPIP fund. As of November 30, 2010, the carrying value of our investment in the AB PPIP fund was $77.3 million.
During 2010, we also invested in several distressed real estate opportunities through our Rialto segment. In February 2010, our Rialto segment acquired indirectly 40% managing member equity interests in two limited liability companies (“LLCs”), in partnership with the Federal Deposit Insurance Corporation (“FDIC”), for approximately $243 million (net of transaction costs and a $22 million working capital reserve). The LLCs hold performing and non-performing loans formerly owned by 22 failed financial institutions. The two portfolios originally consisted of more than 5,500 distressed residential and commercial real estate loans with an aggregate unpaid principal balance of approximately $3 billion and an initial fair value of approximately $1.2 billion. The FDIC retained a 60% equity interest in the LLCs and provided $626.9 million of notes with 0% interest, which are non-recourse to us.
In September 2010, Rialto completed the acquisitions of over $700 million of distressed real estate assets, in separate transactions, from three financial institutions. The combined portfolios included approximately 400 loans with a total aggregate unpaid principal balance of over $500 million and over 300 real estate owned (“REO”) properties with an original appraised value of approximately $200 million. We paid $310 million for the distressed real estate assets of which $125 million was financed through a 5-year senior unsecured note provided by one of the selling institutions.
In November 2010, Rialto completed its first closing of a real estate investment fund (the “Fund”) with initial equity commitments of $300 million (including $75 million committed by us). The Fund’s objective during its three-year investment period is to invest in distressed real estate assets and other related investments that fit within the Fund’s investment parameters.
Homebuilding Operations
Overview
We primarily sell single-family attached and detached homes in communities targeted to first-time, move-up and active adult homebuyers. The average sales price of a Lennar home was $243,000 in both fiscal 2010 and fiscal 2009, compared to $270,000 in fiscal 2008. We operate primarily under the Lennar brand name.
Through our own efforts and those of unconsolidated entities in which Lennar Homebuilding has investments, we are involved in all phases of planning and building in our residential communities including land acquisition, site planning, preparation and improvement of land and design, construction and marketing of homes. For additional information about our investments in and relationships with unconsolidated entities, see Management’s Discussion and Analysis of Financial Condition and Results of Operations in Item 7 of this Report.
Inventory Impairments and Valuation Adjustments related to Lennar Homebuilding Investments in Unconsolidated Entities
We continued evaluating our balance sheet quarterly for impairment on an asset-by-asset basis during fiscal 2010. Based on our evaluations and assessments, during the years ended November 30, 2010, 2009 and 2008, we recorded the following inventory impairments:
| Years Ended November 30, | ||||||||||||
| 2010 | 2009 | 2008 | ||||||||||
| (In thousands) | ||||||||||||
Valuation adjustments to finished homes, CIP and land on which we intend to build homes | $ | 44,717 | 180,239 | 195,518 | ||||||||
Valuation adjustments to land we intend to sell or have sold to third parties | 3,436 | 95,314 | 47,791 | |||||||||
Write-offs of option deposits and pre-acquisition costs | 3,105 | 84,372 | 97,172 | |||||||||
Total inventory impairments | $ | 51,258 | 359,925 | 340,481 | ||||||||
During the years ended November 30, 2010, 2009 and 2008, we recorded the following valuation adjustments related to Lennar Homebuilding investments in unconsolidated entities:
| Years Ended November 30, | ||||||||||||
| 2010 | 2009 | 2008 | ||||||||||
| (In thousands) | ||||||||||||
Our share of valuation adjustments related to assets of Lennar Homebuilding unconsolidated entities | $ | 10,461 | 101,893 | 32,245 | ||||||||
Valuation adjustments to Lennar Homebuilding investments in unconsolidated entities | 1,735 | 88,972 | 172,790 | |||||||||
Total valuation adjustments to Lennar Homebuilding investments in unconsolidated entities | $ | 12,196 | 190,865 | 205,035 | ||||||||
The inventory impairments and valuation adjustments to Lennar Homebuilding investments in unconsolidated entities recorded above were estimated based on market conditions and assumptions made by management at the time the valuation adjustments were recorded, which may differ materially from actual results if market conditions or our assumptions change.
Lennar Homebuilding Investments in Unconsolidated Entities
For a number of years, we created and participated in joint ventures that acquired and developed land for our homebuilding operations, for sale to third parties or for use in their own homebuilding operations. Through these joint ventures, we reduced the amount we had to invest in order to assure access to potential future homesites, thereby mitigating certain risks associated with land acquisitions, and, in some instances, we obtained access to land to which we could not otherwise have obtained access or could not have obtained access on as favorable terms. Although these ventures initially served their intended purpose of risk mitigation, as the homebuilding market deteriorated and asset impairments resulted in the loss of equity, some of our joint venture partners became financially unable or unwilling to fulfill their obligations. During 2010, we continued reevaluating all of our joint venture arrangements, with particular focus on those ventures with recourse indebtedness, and reduced
the number of joint ventures in which we were participating as well as the recourse indebtedness of those joint ventures. As of November 30, 2010, we had reduced the number of Lennar Homebuilding unconsolidated joint ventures in which we were participating to 42 from 270 joint ventures at the peak in 2006 and reduced our maximum recourse debt exposure related to Lennar Homebuilding unconsolidated joint ventures to $172.9 million from $1,764.4 million at the peak in 2006. At November 30, 2010, our net recourse exposure related to Lennar Homebuilding unconsolidated entities was $114.0 million.
Management and Operating Structure
We balance a local operating structure with centralized corporate level management. Decisions related to our overall strategy, acquisitions of land and businesses, risk management, financing, cash management and information systems are centralized at the corporate level. Our local operating structure consists of divisions, which are managed by individuals who generally have significant experience in the homebuilding industry and, in most instances, in their particular markets. They are responsible for operating decisions regarding land identification, entitlement and development, the management of inventory levels for our current volume levels, community development, home design, construction and marketing of our homes.
Diversified Program of Property Acquisition
We generally acquire land for development and for the construction of homes that we sell to homebuyers. Land is subject to specified underwriting criteria and is acquired through our diversified program of property acquisition, which may consist of the following:
Acquiring land directly from individual land owners/developers or homebuilders;
Acquiring local or regional homebuilders that own, or have options to purchase, land in strategic markets;
Acquiring land through option contracts, which generally enables us to control portions of properties owned by third parties (including land funds) and unconsolidated entities until we have determined whether to exercise the option;
Acquiring parcels of land through joint ventures, primarily to reduce and share our risk, among other factors, by limiting the amount of our capital invested in land, while increasing our access to potential future homesites and allowing us to participate in strategic ventures; and
Acquiring distressed assets from banks, government sponsored enterprises and opportunity funds.
At November 30, 2010, we owned 84,482 homesites and had access through option contracts to an additional 19,974 homesites, of which 8,490 were through option contracts with third parties and 11,484 were through option contracts with Lennar Homebuilding unconsolidated entities in which we have investments. At November 30, 2009, we owned 82,703 homesites and had access through option contracts to an additional 21,173 homesites, of which 7,423 were through option contracts with third parties and 13,750 were through option contracts with Lennar Homebuilding unconsolidated entities in which we have investments.
Construction and Development
We generally supervise and control the development of land and the design and building of our residential communities with a relatively small labor force. We hire subcontractors for site improvements and virtually all of the work involved in the construction of homes. Arrangements with our subcontractors generally provide that our subcontractors will complete specified work in accordance with price schedules and applicable building codes and laws. The price schedules may be subject to change to meet changes in labor and material costs or for other reasons. We believe that the sources and availability of raw materials to our subcontractors are adequate for our current and planned levels of operation. We generally do not own heavy construction equipment. We finance construction and land development activities primarily with cash generated from operations, debt issuances and equity offerings.
Marketing
We offer a diversified line of homes for first-time, move-up and active adult homebuyers available in a variety of environments ranging from urban infill communities to golf course communities. We sell our homes primarily from models that we have designed and constructed. During 2010, the homes we delivered had an average sales price of $243,000.
We employ sales associates who are paid salaries, commissions or both to complete on-site sales of homes. We also sell homes through independent brokers. We advertise our communities through newspapers, radio advertisements and other local and regional publications, on billboards and on the Internet, including our website, www.lennar.com. In addition, we advertise our active adult communities in areas where prospective active adult homebuyers live.
Quality Service
We strive to continually improve homeowner customer satisfaction throughout the pre-sale, sale, construction, closing and post-closing periods. Through the participation of sales associates, on-site construction supervisors and customer care associates, all working in a team effort, we strive to create a quality homebuying experience for our customers, which we believe leads to enhanced customer retention and referrals. The quality of our homes is substantially affected by the efforts of on-site management and others engaged in the construction process, by the materials we use in particular homes or by other similar factors.
We warrant our new homes against defective materials and workmanship for a minimum period of one year after the date of closing. Although we subcontract virtually all segments of construction to others and our contracts call for the subcontractors to repair or replace any deficient items related to their trades, we are primarily responsible to the homebuyers for the correction of any deficiencies.
Deliveries
The table below indicates the number of deliveries for each of our homebuilding segments and Homebuilding Other during our last three fiscal years:
| 2010 | 2009 | 2008 | ||||||||||
East | 4,195 | 3,817 | 4,957 | |||||||||
Central | 1,682 | 1,796 | 2,442 | |||||||||
West | 2,079 | 2,480 | 4,031 | |||||||||
Houston | 1,645 | 2,150 | 2,736 | |||||||||
Other | 1,354 | 1,235 | 1,569 | |||||||||
Total | 10,955 | 11,478 | 15,735 | |||||||||
Of the total home deliveries listed above, 96, 56 and 391, respectively, represent deliveries from unconsolidated entities for the years ended November 30, 2010, 2009 and 2008.
Backlog
Backlog represents the number of homes under sales contracts. Homes are sold using sales contracts, which are generally accompanied by sales deposits. In some instances, purchasers are permitted to cancel sales contracts if they fail to qualify for financing or under certain other circumstances. We experienced a cancellation rate of 17% in 2010, compared to 18% and 26%, respectively, in 2009 and 2008. Substantially all homes currently in backlog will be delivered in fiscal year 2011. We do not recognize revenue on homes under sales contracts until the sales are closed and title passes to the new homeowners.
The table below indicates the backlog dollar value for each of our homebuilding segments and Homebuilding Other as of the end of our last three fiscal years:
| 2010 | 2009 | 2008 | ||||||||||
| (In thousands) | ||||||||||||
East | $ | 190,095 | 179,175 | 202,791 | ||||||||
Central | 52,923 | 36,158 | 23,736 | |||||||||
West | 58,072 | 143,868 | 108,779 | |||||||||
Houston | 58,822 | 60,876 | 57,785 | |||||||||
Other | 47,380 | 59,494 | 63,179 | |||||||||
Total | $ | 407,292 | 479,571 | 456,270 | ||||||||
Of the dollar value of homes in backlog listed above, $2.1 million, $7.2 million and $12.5 million, respectively, represent the backlog dollar value from unconsolidated entities at November 30, 2010, 2009 and 2008.
Lennar Financial Services Operations
Mortgage Financing
We primarily originate conforming conventional, FHA-insured, VA-guaranteed residential mortgage loan products and other products to our homebuyers and others through our financial services subsidiaries, Universal American Mortgage Company, LLC and Eagle Home Mortgage, LLC, which are located generally in the same states as our homebuilding operations as well as other states. In 2010, our financial services subsidiaries provided loans to 85% of our homebuyers who obtained mortgage financing in areas where we offered services. Because of the availability of mortgage loans from our financial services subsidiaries, as well as independent mortgage lenders, we believe most creditworthy purchasers of our homes have access to financing.
During 2010, we originated approximately 15,200 mortgage loans totaling $3.3 billion, compared to 17,900 mortgage loans totaling $4.0 billion during 2009. Substantially all of the loans we originate are sold within a short period in the secondary mortgage market on a servicing released, non-recourse basis. After the loans are sold, we retain potential liability for possible claims by purchasers that we breached certain limited industry-standard representations and warranties in the loan sale agreements. Therefore, we have limited direct exposure related to the residential mortgages we originate.
We have a corporate risk management policy under which we hedge our interest rate risk on rate-locked loan commitments and loans held-for-sale to mitigate exposure to interest rate fluctuations. We finance our mortgage loan activities with borrowings under our financial services warehouse repurchase facilities or from our operating funds. One of our warehouse repurchase facilities with a maximum aggregate commitment of $150 million and an additional uncommitted amount of $50 million matures in April 2011, and the other warehouse repurchase facility with a maximum aggregate commitment of $175 million matures in July 2011. We expect the facilities to be renewed or replaced with other facilities when they mature.
Title Insurance and Closing Services
We provide title insurance and closing services to our homebuyers and others. During 2010, we provided title and closing services for approximately 102,500 real estate transactions, and issued approximately 107,600 title insurance policies through our underwriter, North American Title Insurance Company, compared to 120,500 real estate transactions and 92,500 title insurance policies issued during 2009. Title and closing services are provided by agency subsidiaries in Arizona, California, Colorado, District of Columbia, Florida, Illinois, Maryland, Minnesota, Nevada, New Jersey, New York, Pennsylvania, Texas, Virginia and Wisconsin.Title insurance services are provided in these same states, as well as in Alabama, Delaware, Georgia, North Carolina, Ohio, South Carolina and Tennessee.
Rialto Investments Operations
The Rialto segment was formed to focus on acquisitions of distressed debt and other real estate assets utilizing Rialto’s abilities to source, underwrite, price, turnaround and ultimately monetize such assets in markets across the United States. For more detail regarding the acquisitions and investments made by our Rialto segment during 2010, refer to the Overview of Lennar Corporation section discussed earlier in Item 1 of this Report.
Seasonality
We have historically experienced variability in our results of operations from quarter-to-quarter due to the seasonal nature of the homebuilding business.
Competition
The residential homebuilding industry is highly competitive. We compete for homebuyers in each of the market regions where we operate with numerous national, regional and local homebuilders, as well as with resales of existing homes and with the rental housing market. In recent years, lenders’ efforts to sell foreclosed homes have become an increasingly competitive factor within the homebuilding industry. We compete for homebuyers on the basis of a number of interrelated factors including location, price, reputation, amenities, design, quality and financing. In addition to competition for homebuyers, we also compete with other homebuilders for desirable properties, raw materials and reliable, skilled labor. We compete for land buyers with third parties in our efforts to sell land to homebuilders and others. We believe we are competitive in the market regions where we operate primarily due to our:
Balance sheet, where we continue to focus on inventory management and liquidity;
Access to land, particularly in land-constrained markets;
Pricing to current market conditions through sales incentives offered to homebuyers;
Cost efficiencies realized through our national purchasing programs and production of value-engineered homes; and
Quality construction and home warranty program, which are supported by a responsive customer care team.
Our financial services operations compete with other mortgage lenders, including national, regional and local mortgage bankers and brokers, banks, savings and loan associations and other financial institutions, in the origination and sale of mortgage loans. Principal competitive factors include interest rates and other features of mortgage loan products available to the consumer. We compete with other title insurance agencies and underwriters for closing services and title insurance. Principal competitive factors include service and price.
Rialto’s business of purchasing distressed assets is highly competitive and fragmented. A number of entities and funds have been formed recently for the purpose of acquiring real estate related assets at prices that reflect the depressed state of the real estate market, and it is likely that additional entities and funds will be formed for this purpose in the next several years. We compete with other purchasers of distressed assets. We compete in the marketplace for distressed asset portfolios based on many factors, including purchase price, representations, warranties and indemnities, timeliness of purchase decisions and reputation. We believe that our major distinction from the competition is that our team is made up of already in place managers who are already working out loans and dealing with similar borrowers. Additionally, because of the high content of loans made to developers, we believe having our homebuilding team participating in the underwriting process provides us with a distinct advantage in our evaluation of these assets. We believe that our experienced team and the infrastructure already in place, including our investment in a service provider, are ahead of our competitors. This has us well positioned for the large pipeline of opportunity that has been building.
Regulation
Homes and residential communities that we build must comply with state and local laws and regulations relating to, among other things, zoning, construction permits or entitlements, construction material requirements, density requirements, and requirements relating to building design and property elevation, building codes and handling of waste. These include laws requiring the use of construction materials that reduce the need for energy-consuming heating and cooling systems. These laws and regulations are subject to frequent change and often increase construction costs. In some instances, we must comply with laws that require commitments from us to provide roads and other offsite infrastructure to be in place prior to the commencement of new construction. These laws and regulations are usually administered by counties and municipalities and may result in fees and assessments or building moratoriums. In addition, certain new development projects are subject to assessments for schools, parks, streets and highways and other public improvements, the costs of which can be substantial.
The residential homebuilding industry is also subject to a variety of local, state and federal statutes, ordinances, rules and regulations concerning the protection of health and the environment. These environmental laws include such areas as storm water and surface water management, soil, groundwater and wetlands protection, subsurface conditions and air quality protection and enhancement. Environmental laws and existing conditions may result in delays, may cause us to incur substantial compliance and other costs and may prohibit or severely restrict homebuilding activity in environmentally sensitive regions or areas.
In recent years, several cities and counties in which we have developments have submitted to voters “slow growth” initiatives and other ballot measures that could impact the affordability and availability of land suitable for residential development within those localities. Although many of these initiatives have been defeated, we believe that if similar initiatives were approved, residential construction by us and others within certain cities or counties could be seriously impacted.
In order to make it possible for some of our homebuyers to obtain FHA-insured or VA-guaranteed mortgages, we must construct the homes they buy in compliance with regulations promulgated by those agencies.
Various states have statutory disclosure requirements relating to the marketing and sale of new homes. These disclosure requirements vary widely from state-to-state. In addition, some states require that each new home be registered with the state at or before the time title is transferred to a buyer (e.g., the Texas Residential Construction Commission Act).
In some states, we are required to be registered as a licensed contractor and comply with applicable rules and regulations. In various states, our new home consultants are required to be registered as licensed real estate agents and to adhere to the laws governing the practices of real estate agents.
Our mortgage and title subsidiaries must comply with applicable real estate laws and regulations. The subsidiaries are licensed in the states in which they do business and must comply with laws and regulations in those states. These laws and regulations include provisions regarding capitalization, operating procedures, investments, lending and privacy disclosures, forms of policies and premiums.
A subsidiary of Newhall, an unconsolidated entity of which we currently indirectly own 15%, provides water to a portion of Los Angeles County, California. This subsidiary is subject to extensive regulation by the California Public Utilities Commission.
Several federal, state and local laws, rules, regulations and ordinances, including, but not limited to, the Federal Fair Debt Collection Practices Act (“FDCPA”) and the Federal Trade Commission Act and comparable state statutes, regulate consumer debt collection activity. Although, for a variety of reasons, we may not be specifically subject to the FDCPA or certain state statutes that govern debt collectors, it is our policy to comply with applicable laws in our collection activities. To the extent that some or all of these laws apply to our collection activities or failure to comply with such laws could have a material adverse effect on us.
Compliance Policy
We have a Code of Business and Ethics that requires every associate (i.e., employee) and officer to at all times deal fairly with the Company’s customers, subcontractors, suppliers, competitors and associates, and states that all our associates, officers and directors are expected to comply at all times with all applicable laws, rules and regulations. Despite this, there are instances in which subcontractors or others through which we do business engage in practices that do not comply with applicable regulations and guidelines. There have been instances in which some of our associates were aware of these practices and did not take adequate steps to prevent them. When we learn of practices relating to homes we build or financing we provide that do not comply with applicable regulations or guidelines, we move actively to stop the non-complying practices as soon as possible and we have taken disciplinary action with regard to our associates who were aware of the practices, including in some instances terminating their employment. Our Code of Business and Ethics also has procedures in place that allows whistleblowers to submit their concerns regarding our operations, financial reporting, business integrity or any other related matter anonymously to the Audit Committee of our Board of Directors and/or to the non-management directors of our Board of Directors, thus helping protect them from any possibility of retaliation.
Associates
At December 31, 2010, we employed 4,087 individuals of whom 2,208 were involved in the Lennar Homebuilding operations, 1,767 were involved in the Lennar Financial Services operations, and 112 were involved in the Rialto operations, compared to November 30, 2009, when we employed 3,873 individuals of whom 2,204 were involved in the Lennar Homebuilding operations and 1,669 were involved in Lennar Financial Services operations. We do not have collective bargaining agreements relating to any of our associates. However, we subcontract many phases of our homebuilding operations and some of the subcontractors we use have associates who are represented by labor unions.
Relationship with LNR Property Corporation
In 1997, we transferred our commercial real estate investment and management business to LNR Property Corporation (“LNR”), and spun-off LNR to our stockholders. As a result, LNR became a publicly-traded company, and the family of Stuart A. Miller, our President, Chief Executive Officer and a Director, which had voting control of our company, became the controlling shareholder of LNR.
Since the spin-off, we have entered into a number of joint ventures and other transactions with LNR. Many of the joint ventures were formed to acquire and develop land, part of which was subsequently sold to us or other homebuilders for residential building and part of which was subsequently sold to LNR for commercial development. In February 2005, LNR was acquired by a privately-owned entity. Although Mr. Miller’s family was required to purchase a 20.4% financial interest in that privately-owned entity, this interest is non-voting and
neither Mr. Miller nor anyone else in his family is an officer or director, or otherwise is involved in the management, of LNR or its parent. Nonetheless, because the Miller family continues to have a financial, non-voting, interest in LNR’s parent, although reduced from the percentage interest initially acquired, significant transactions with LNR, or entities in which it has an interest, have historically been and continued to be reviewed and approved by the Independent Directors Committee of our Board of Directors.
LandSource/Newhall Transactions
In January 2004, a company of which we and LNR each owned 50% acquired The Newhall Land and Farming Company for approximately $1 billion, including $200 million we contributed and $200 million that LNR contributed (the remainder came from borrowings and sales of properties to LNR). Subsequently, we and LNR each transferred our interests in most of our joint ventures to the jointly-owned company that had acquired The Newhall Land and Farming Company, and that company was renamed LandSource Communities Development LLC (“LandSource”).
In February 2007, LandSource admitted MW Housing Partners as a new strategic partner. As part of the transaction, the joint venture obtained $1.6 billion of non-recourse financing, which consisted of a $200 million five-year Revolving Credit Facility, a $1.1 billion six-year Term Loan B Facility and a $244 million seven-year Second Lien Term Facility. The transaction resulted in a cash distribution to us of $707.6 million and a similar distribution to LNR. Our resulting ownership of LandSource was 16%.
In June 2008, LandSource and a number of its subsidiaries commenced proceedings under Chapter 11 of the Bankruptcy Code in the United States Bankruptcy Court for the District of Delaware. In November 2008, our land purchase options with LandSource were terminated, thus, in 2008 we recognized a deferred profit of $101.3 million (net of $31.8 million of write-offs of option deposits and pre-acquisition costs and other write-offs) related to the 2007 recapitalization of LandSource.
In July 2009, the United States Bankruptcy Court for the District of Delaware confirmed the plan of reorganization for LandSource. As a result of the bankruptcy proceedings, LandSource was reorganized into a new company named Newhall Land Development, LLC, (“Newhall”). The reorganized company emerged from Chapter 11 free of its previous bank debt. As part of the reorganization, we invested $140 million in exchange for approximately a 15% equity interest in the reorganized Newhall, ownership in several communities that were formerly owned by LandSource, the settlement and release of any claims that might have been asserted against us and certain other claims LandSource had against third parties.
NYSE Certification
We submitted our 2009 Annual CEO Certification to the New York Stock Exchange on April 16, 2010. The certification was not qualified in any respect.
Available Information
Our corporate website is www.lennar.com. We make available on our website, free of charge, our Annual Report on Form 10-K quarterly reports on Form 10-Q, current reports on Form 8-K and any amendments to these reports filed or furnished pursuant to section 13(a) or 15(d) of the Exchange Act, as soon as reasonably practicable after we electronically file these documents with, or furnish them to, the Securities and Exchange Commission. Information on our website is not part of this document.
Our website also includes printable versions of our Corporate Governance Guidelines, our Code of Business Conduct and Ethics and the charters(the “Form 10-K”) for each of our Audit, Compensation and Nominating and Corporate Governance Committees of our Board of Directors. Each of these documents is also available in print to any stockholder who requests a copy by addressing a request to:
Lennar Corporation
Attention: Office of the General Counsel
700 Northwest 107th Avenue
Miami, Florida 33172
Item 1A. Risk Factors.
The following are what we believe to be the principal risks that could cause a material adverse effect upon our business, financial condition, results of operations, cash flows, strategies and prospects.
Homebuilding Market and Economic Risks
The homebuilding industry has experienced a significant downturn over the last several years. A continuing decline in demand for new homes coupled with an increase in the inventory of available new homes and alternatives to new homes could adversely affect our sales volume and pricing even more than has occurred to date.
The homebuilding industry has experienced a significant downturn over the last several years. As a result, we have experienced a significant decline in demand for newly built homes in almost all of our markets. This decline in demand, together with an oversupply of alternatives to new homes, such as rental properties and used homes (including foreclosed homes), has depressed prices and reduced margins. This combination of lower demand and higher inventories affects both the number of homes we can sell and the prices at which we can sell them. In 2008 and 2009, we experienced periods of significant decline in our sales results, significant reductions in our margins as a result of higher levels of sales incentives and price concessions, and a higher than normal cancellation rate. In 2010, our margins improved to closer to normal market levels, but demand continued to be weak and there continued to be a significant stock of used homes, including foreclosed homes. We have no basis for predicting how long demand and supply will remain out of balance in various homebuilding markets or whether sales volumes or pricing will return to pre-2007 levels.
Demand for new homes is sensitive to economic conditions over which we have no control, such as the availability of mortgage financing and the level of employment.
Demand for new homes is sensitive to changes in economic conditions such as the level of employment, consumer confidence, consumer income, the availability of financing and interest rate levels. During 2008, 2009 and 2010, the mortgage lending industry experienced significant instability. As a result of increased default rates, particularly (but not entirely) with regard to sub-prime and other non-conforming loans, many lenders have reduced their willingness to make, and tightened their credit requirements with regard to, residential mortgage loans. Fewer loan products, stricter loan qualification standards and higher down payment requirements have made it more difficult for some borrowers to finance the purchase of our homes. Although our finance company subsidiaries offer mortgage loans to potential buyers of most of the homes we build, we may no longer be able to offer financing terms that are attractive to our potential buyers. Lack of availability of mortgage financing at acceptable rates reduces demand (the “Company”) for the homes we build, including in some instances causing potential buyers to cancel contracts they have signed.
There has also been a substantial loss of jobs in the United States during the last several years. People who are not employed or are concerned about loss of their jobs are unlikely to purchase new homes and may be forced to try to sell the homes they own. Therefore, the current employment situation can adversely affect us both by reducing demand for the homes we build and by increasing the supply of homes for sale.
Mortgage defaults by homebuyers who financed homes using non-traditional financing products are increasing the number of homes available for resale.
During the period of high demand in the homebuilding industry, many homebuyers financed their purchases using non-traditional adjustable rate or interest only mortgages or other mortgages, including sub-prime mortgages that involved, at least during initial years, monthly payments that were significantly lower than those required by conventional fixed rate mortgages. As a result, new homes became more affordable. However, as monthly payments for these homes have increased either as a result of increasing adjustable interest rates or as a result of principal payments coming due, some of these homebuyers have defaulted on their payments and had their homes foreclosed, which has increased the inventory of homes available for resale. This is likely to continue. Foreclosure sales and other distress sales may result in further declines in market prices for homes. In an environment of declining home prices, many homebuyers may delay purchases of homes in anticipation of lower prices in the future. In addition, as lenders perceive deterioration in credit quality among homebuyers, lenders have been eliminating some of the available non-traditional and sub-prime financing products and increasing the qualifications needed for mortgages or adjusting their terms to address increased credit risk. In general, to the extent mortgage rates increase or lenders make it more difficult for prospective buyers to finance home purchases, it becomes more difficult or costly for customers to purchase our homes, which has an adverse effect on our sales volume.
It has become more difficult for potential homebuyers to obtain mortgage financing, which is reducing demand for homes we offer.
Many lenders and other holders of mortgage loans have been adversely affected in recent years by a combination of reduced ability of homeowners to meet mortgage obligations and reduced value of the homes that secure mortgage loans. As a result, many lenders and secondary market mortgage purchasers have eliminated most of their non-traditional and sub-prime financing products and increased the qualifications needed to obtain mortgage loans. In addition, if a home appraises for less than the sales price, a greater down-payment may need to be provided by the potential homebuyer in order to meet the lender requirement or the sales price may need to be reduced. Although mortgage interest rates were very low during 2010, the factors that have made mortgage loans more difficult to obtain could lead to higher interest rates on mortgage loans that are made. To the extent lenders make it more difficult or more expensive for prospective buyers to finance home purchases, it becomes more difficult or costly for customers to purchase our homes, which has an adverse effect on our sales volume.
We have had to take significant write-downs of the carrying values of the land we own and of our investments in unconsolidated entities, and a continuing decline in land values could result in additional write-downs.
Some of the land we currently own was purchased at high prices and had to be written down to reduced values that reflect current market conditions. Also, prior to 2007, we obtained options to purchase land at prices that no longer are attractive, and in connection with those options, we made substantial non-refundable deposits and, in some instances, incurred pre-acquisition costs. When demand fell, we were required to take significant write-downs of the carrying value of our land inventory and we elected not to exercise many high price options, even though that required us to forfeit deposits and write-off pre-acquisition costs.
Additionally, as a result of these market conditions, we recorded significant valuation adjustments to our investments in unconsolidated entities and recorded our share of adjustments made by unconsolidated entities to the carrying values of their assets.
The combination of land inventory impairments, write-offs of option deposits and pre-acquisition costs and valuation adjustments relating to our investments in unconsolidated entities had a material negative effect on our operating results for fiscal 2007, 2008 and 2009, contributing to most of our net loss in fiscal 2008 and 2009. Write downs were a lot less during 2010, however, if market conditions deteriorate further or our strategy related to certain assets change, some of our assets may be subject to further write-downs in the future, decreasing the asset values reflected on our balance sheet and adversely affecting our stockholders’ equity.
Inflation can adversely affect us, particularly in a period of declining home sale prices.
Inflation can have a long-term impact on us because increasing costs of land, materials and labor require us to attempt to increase the sale prices of homes in order to maintain satisfactory margins. Although the rate of inflation has been low for the last several years, some economists predict that government spending programs and other factors could lead to significant inflation in the future. An excess of supply over demand for new homes, such as the one we are currently experiencing, requires that we reduce prices, rather than increase them, but it does not necessarily result in reductions, or prevent increases, in the costs of materials and labor. The effect of cost increases that we cannot recover by increasing prices would be to reduce the margins on the homes we sell. That would make it more difficult for us to recover the full cost of previously purchased land, and could lead to significant reductions in the value of our land inventory.
We face significant competition in our efforts to sell new homes.
The homebuilding industry is highly competitive. We compete in each of our markets with numerous national, regional and local homebuilders. This competition with other homebuilders could reduce the number of homes we deliver or cause us to accept reduced margins in order to maintain sales volume.
We also compete with the resale of existing homes, including foreclosed homes, sales by housing speculators and available rental housing. As demand for homes has slowed, competition, including competition with homes purchased for speculation rather than as places to live and competition with foreclosed homes, has created increased downward pressure on the prices at which we are able to sell homes, as well as upon the number of homes we can sell.
Operational Risks
Homebuilding is subject to warranty and liability claims in the ordinary course of business that can be significant.
As a homebuilder, we are subject to home warranty and construction defect claims arising in the ordinary course of business. We are also subject to liability claims for injuries that occur in the course of construction activities. We record warranty and other reserves for the homes we sell based on historical experience in our markets and our judgment of the qualitative risks associated with the types of homes we built. We have, and many of our subcontractors have, general liability, property, errors and omissions, workers compensation and other business insurance. These insurance policies protect us against a portion of our risk of loss from claims, subject to certain self-insured retentions, deductibles and other coverage limits. However, because of the uncertainties inherent in these matters, we cannot provide assurance that our insurance coverage or our subcontractors’ insurance and financial resources will be adequate to address all warranty, construction defect and liability claims in the future. Additionally, the coverage offered and the availability of general liability insurance for construction defects are currently limited and costly. As a result, an increasing number of our subcontractors are unable to obtain insurance, and we have in many cases waived our customary insurance requirements. There can be no assurance that coverage will not be further restricted and become even more costly.
Performance of subcontractors and quality and suitability of building materials.
We rely on subcontractors to perform the actual construction of our homes, and in many cases, to select and obtain raw materials. Despite our detailed specifications and quality control procedures, in some cases, improper construction processes or defective materials, such as Chinese drywall, were used in the construction of our homes. When we find these issues, we repair them in accordance with our warranty obligations. Defective products widely used by the homebuilding industry can result in the need to perform extensive repairs to large numbers of homes. The cost to the Company of complying with our warranty obligations in these cases may be significant if we are unable to recover the cost of repair from subcontractors, materials suppliers and insurers.
Natural disasters and severe weather conditions could delay deliveries, increase costs and decrease demand for new homes in affected areas.
Many of our homebuilding operations are conducted in areas that are subject to natural disasters and severe weather. The occurrence of natural disasters or severe weather conditions can delay new home deliveries, increase costs by damaging inventories and negatively impact the demand for new homes in affected areas. Furthermore, if our insurance does not fully cover business interruptions or losses resulting from these events, our results of operations, liquidity or capital resources could be adversely affected.
Supply shortages and other risks related to the demand for skilled labor and building materials could increase costs and delay deliveries.
Increased costs or shortages of skilled labor and/or lumber, framing, concrete, steel and other building materials could cause increases in construction costs and construction delays. We generally are unable to pass on increases in construction costs to customers who have already entered into sales contracts, as those sales contracts generally fix the price of the homes at the time the contracts are signed, which may be well in advance of the construction of the home. Sustained increases in construction costs may, over time, erode our margins, particularly if pricing competition restricts our ability to pass on any additional costs of materials or labor, thereby decreasing our margins.
Reduced numbers of home sales extend the time it takes us to recover land purchase and property development costs.
We incur many costs even before we begin to build homes in a community. These include costs of preparing land and installing roads, sewers and other utilities, as well as taxes and other costs related to ownership of the land on which we plan to build homes. Reducing the rate at which we build homes extends the length of time it takes us to recover these costs. Also, when we have terminated land purchase options, we have forfeited deposits we made with regard to the options, and in many instances, lost the benefit of pre-acquisition costs we incurred with regard to properties that were the subject of the options. We may never recover those costs.
We do not have a corporate credit line.
Our business requires that we be able to finance the development of our residential communities. In the past we have had a corporate credit facility (with Lennar Corporation as the borrower and most of our subsidiaries, other than finance company subsidiaries, as guarantors) that we used to help finance development activities. However, because of the decline in our land purchasing, development and building activities, and our ability to obtain debt and equity financing through the capital markets, we have had little need for the credit facility in recent years. Therefore, in February 2010, we terminated the Credit Facility in order to eliminate the cost of maintaining it. While we believe that under current circumstances, the funds we generate through our operations, together with our ability to sell debt and equity securities into capital markets, give us access to all the funds we need, if market conditions lead us to want to increase our homebuilding activities to a level that requires us to incur short-term borrowings, but we are not able to arrange a new credit facility, the absence of a credit facility may prevent us from taking full advantage of market opportunities.
We do not have an investment grade credit rating, which makes it more difficult and costly for us to access capital on favorable terms.
Our ability to access capital on favorable terms has been an important factor in growing our business and operations in a profitable manner. In 2007 and 2008, each of the principal credit rating agencies lowered our credit ratings, and as a result we no longer have investment grade ratings. This makes it more costly, and under some circumstances could make it more difficult, for us to access the debt capital markets for funds we may require in order to implement our business plans and achieve our growth objectives.
Despite not having an investment grade rating, during 2010, we were able to sell debt securities in capital market transactions at significantly lower interest rates than prior year. We sold $250 million principal amount of 6.95% senior notes due 2018, $276.5 million of 2.00% convertible senior notes and $446 million of 2.75% convertible senior notes, both due in 2020. The interest rates with regard to that debt are higher than they probably would have been if we had had an investment grade rating. However, unless and until our credit rating improves, our cost of borrowing in capital market transactions will almost always be higher than it would be if we had an investment grade rating. If we were subject to further downgrades, that would exacerbate such difficulties.
The repurchase warehouse credit facilities of our Financial Services segment will expire in 2011.
Our Lennar Financial Services segment has a warehouse repurchase facility with a maximum aggregate commitment of $150 million and an additional uncommitted amount of $50 million that matures in April 2011, and another warehouse repurchase facility with a maximum aggregate commitment of $175 million that matures in July 2011. The Financial Services segment uses these facilities to finance its mortgage lending activities until the mortgage loans are sold to investors and expects both facilities to be renewed or replaced with other facilities when they mature. If we are unable to renew or replace these facilities when they mature, that could seriously impede the activities of our Financial Services segment, unless we are willing and able to provide the funds our Financial Services segment needs to finance its mortgage originations until the mortgages can be sold.
We conduct some of our operations through unconsolidated joint ventures with independent third parties in which we do not have a controlling interest and we can be adversely impacted by joint venture partners’ failure to fulfill their obligations.
For a number of years, we created and participated in joint ventures that acquired and developed land for our homebuilding operations, for sale to third parties or for use in their own homebuilding operations. Through these joint ventures, we reduced the amount we had to invest in order to assure access to potential future homesites, and, in some instances, we obtained access to land to which we could not otherwise have obtained access or could not have obtained access on as favorable terms. However, as the homebuilding market deteriorated beginning in 2006, many of our joint venture partners became financially unable or unwilling to fulfill their obligations.
Most joint ventures borrowed money to help finance their activities, and although recourse on the loans was generally limited to the joint ventures and their properties, frequently we and our joint venture partners were required to provide maintenance guarantees (guarantees that the values of the joint ventures’ assets would be at least specified percentages of their borrowings) or limited repayment guarantees.
If a joint venture partner does not perform its obligations, we may be required to make significant financial expenditures or otherwise undertake the performance of obligations not satisfied by our partner at significant cost to us. Also, when we have guaranteed joint venture obligations, we have been given the right to be reimbursed by our joint venture partners for any amounts by which we pay more than our pro rata share of the joint ventures’ obligations. However, particularly if our joint venture partners are having financial problems, we may have difficulty collecting the sums they owe us, and therefore, we may be required to pay a disproportionately large portion of the guaranteed amounts. In addition, because we lack a controlling interest in these joint ventures, we are usually unable to require that they sell assets, return invested capital or take any other action without the consent of at least one of our joint venture partners. As a result, without joint venture partner consent, we may be unable to liquidate our joint venture investments to generate cash. Even if we are able to liquidate joint venture investments, the amounts received upon liquidation may be insufficient to cover the costs we have incurred in satisfying joint venture obligations.
During 2007 through 2010, we have significantly reduced the number of joint ventures in which we participate and our exposure to recourse indebtedness of such joint ventures. However, the risks to us from joint ventures in which we are a participant are likely to continue at least as long as the value of residential properties continues to decline.
The unconsolidated entities in which we have investments may not be able to modify the terms of their debt arrangements.
Some of the unconsolidated entities’ debt arrangements contain financial covenants they may not be able to meet. Additionally, certain joint venture loan agreements have minimum number of homesite takedown requirements in which the joint ventures are required to sell a minimum number of homesites over a stated period of time. Due to the deterioration of the homebuilding market, many of the joint ventures are in the process of repaying, refinancing, renegotiating or extending their loans. This action may be required, for example, in the case of an expired maturity date or a failure to comply with the loan’s covenants. There can be no assurance that the joint ventures will be able to finance, refinance, renegotiate or extend, on terms we and our joint venture partners deem acceptable, all of the joint venture loans that are currently being renegotiated. If joint ventures are unsuccessful in these efforts, we could be required to provide at least a portion of the funds the joint ventures need to be able to repay the loans.
We could be adversely impacted by the loss of key management personnel.
Our future success depends, to a significant degree, on the efforts of our senior management. Our operations could be adversely affected if key members of senior management cease to be active in our company. As a result of a decline in our stock price, previous retention mechanisms, such as equity awards, have diminished in value.
Our Financial Services segment is adversely affected by reduced demand for our homes.
A majority of the mortgage loans made by our Financial Services segment are made to buyers of homes we build. Therefore, a decrease in the demand for our homes adversely affects the financial results of this segment of our business.
If our ability to resell mortgages is impaired, we may be required to reduce home sales unless we are willing to become a long term investor in loans we originate.
Substantially all of the loans we originate are sold within a short period in the secondary mortgage market on a servicing released, non-recourse basis. After the loans are sold, we retain potential liability for possible claims by purchasers that we breached certain limited industry-standard representations and warranties in the loan sale agreements. The secondary mortgage market has been severely impacted by the decline in property values over the past several years. To date, our financial company subsidiaries have been able to sell substantially all the mortgages they have originated. If, however we became unable to sell loans into the secondary mortgage market or directly to Fannie Mae and Freddie Mac, we would either have to curtail our origination of mortgage loans, which among other things, could significantly reduce our ability to sell homes, or to commit our own funds to long term investments in mortgage loans, which could, among other things, delay the time when we recognize revenues from home sales on our statements of operations.
Our Financial Services segment receives demands that it repurchase mortgage loans it sold in the secondary mortgage market and we may be required to repurchase loans in excess of amounts reserved.
Particularly during 2008, 2009 and 2010, our Financial Services segment received demands that it repurchase certain loans that it sold to entities in the secondary mortgage market. The demands have related primarily to loans originated during 2005 through 2007 and are frequently based on assertions that information borrowers gave our Financial Services segment was not accurate. In many instances, we have successfully disputed the claims. However, in some instances we have settled claims to maintain our business relationships with the claimants or to avoid litigation costs. In other instances, there are active disputes regarding certain loans. While we believe we have significant defenses against virtually all of the currently unresolved repurchase demands, we have established a reserve based upon, among other things, an analysis of repurchase requests received, an estimate of potential repurchase claims not yet received, our actual past repurchases and losses through the disposition of affected loans. At November 30, 2010, this reserve was $9.9 million. If there is an unexpected increase in the amount of repurchase demands we receive, or if we are not able to resolve repurchase demands on a basis consistent with our experience to date, the cost to us with regard to the repurchase demands could exceed the reserve we have established.
Our Rialto segment invests in distressed loans and real estate related assets at significant discounts; however, if the real estate markets deteriorate significantly we could suffer losses.
Almost all the investments to date by our Rialto segment have involved acquisitions of portfolios of, or interests in portfolios of, distressed loans and other real estate related assets. That is consistent with the Rialto segment’s objective of focusing on commercial and residential real estate opportunities arising from dislocations in the United States real estate markets and the restructuring and recapitalization of those markets. However, the Rialto segment’s investing in distressed loans and other real estate related assets presents many risks in addition to those inherent in normal lending activities, including the risk that the anticipated restructuring and recapitalization of the United States real estate markets will not take place for many years, the risk that defaults on debt instruments in which the Rialto segment invests will be greater than anticipated and the risk that if the Rialto segment has to liquidate its investments into the market, it could suffer losses in doing so. There is also the possibility that, even if the Rialto segment’s investments perform as expected, absence of a liquid market for these investments will result in a need to reduce the value at which they are carried on our financial statements.
There is substantial competition for the types of investments on which our Rialto segment is focused, and this may limit the ability of the Rialto segment to make investments on terms that are attractive to it.
Our Rialto segment currently is focused on investments in distressed mortgage debt, foreclosed properties and other real estate related assets that have been adversely affected by the dislocations during the last several years in the markets for real estate, mortgage loans and real estate related securities. Many of the opportunities to acquire these types of assets arise under programs involving co-investments with and financing provided by agencies of the Federal government. There are many firms and investment funds that are trying to acquire the types of assets on which our Rialto segment is focused, and it is likely that a significant number of additional investment funds will be formed in the next year or more with the objective of acquiring those types of assets. At least some of the firms with which the Rialto segment competes, or will compete, for investment opportunities have, or will have, a cost of capital that is lower than that of the Rialto segment, and therefore may be able to pay more for investment opportunities than would be prudent for our Rialto segment.
Our Rialto segment could be adversely affected by court and governmental responses to improper residential mortgage foreclosure procedures.
During recent years it appears that residential mortgage lenders and residential mortgage loan servicers have in a number of instances failed to comply with the requirements for obtaining and foreclosing residential mortgage loans. Although our Rialto segment owns or manages entities that own large numbers of mortgage loans, those loans all were acquired by our Rialto segment and the entities it manages within the past year, and our Rialto segment has procedures designed to ensure that any mortgage foreclosures which it undertakes will comply with all applicable requirements. However, even if neither our Rialto segment nor any servicing organization it uses does anything improper in foreclosing mortgages held by the Rialto segment or entities it manages, reaction by courts and regulatory agencies against apparently widespread instances of improper mortgage foreclosure procedures could make it more difficult and more expensive for our Rialto segment to foreclose mortgages that secure loans that it or entities it manages own.
The ability of our Rialto segment to profit from the investments it makes may depend to a significant extent on its ability to manage resolutions related to the distressed loans and other real estate related assets.
A principal factor in a prospective purchaser’s decision regarding the price it will pay for a portfolio of mortgage loans or other real estate related assets is the cash flow the prospective purchaser expects the portfolio to generate. The cash flow a portfolio of distressed mortgage loans and related assets will generate can be affected by the way the assets in the portfolio are managed. We believe the backgrounds and experience of the personnel in our Rialto segment will enable the Rialto segment to generate better cash flows from the distressed assets it manages than what is generally expected with regard to similar assets. If it is not able to do that, the Rialto segment probably will not generate the returns it is seeking.
The supply of real estate related assets available at discounts from normal prices will likely decrease if and when the real estate markets improve, which could require our Rialto segment to change its investment objectives.
The current objectives of our Rialto segment is to focus on investments in commercial and residential real estate related assets that are available at below market prices because of the dislocations in the United States real estate markets over the past several years. A recovery of the real estate markets would probably benefit the investments the Rialto segment has made, but it probably would substantially reduce or end the availability of the types of investments the Rialto segment has made and currently is seeking. That would require the Rialto segment to rethink, and probably to change, its investment strategy.
Restrictions in agreements related to a fund that the Rialto segment manages could prevent the Rialto segment from making investments.
The Rialto segment manages the Rialto Real Estate Fund (the “Fund”), a fund that was formed to make investments in, among other things, distressed loans and real estate related assets. In order to protect investors in the Fund against the possibility that we would keep attractive investment opportunities for ourselves instead of presenting them to the Fund, we agreed that we would not make investments that are suitable for the Fund except to the extent an Advisory Committee consisting of representatives of Fund investors decides that the Fund should not make particular investments. There is an exception that permits us to purchase properties for use in connection with our homebuilding operations and to co-invest with the Fund (of which we will own between 10% and 25% depending on the total amount of the investments in the Fund).
Regulatory Risks
Federal laws and regulations that adversely affect liquidity in the secondary mortgage market could hurt our business.
There have been significant concerns about the continuing viability of Fannie Mae and Freddie Mac and a number of proposals to curtail their activities. These organizations provide significant liquidity to the secondary mortgage market. Any curtailment of their activities could increase mortgage interest rates and increase the effective cost of our homes, which could reduce demand for our homes and adversely affect our results of operations.
Our homebuyers’ ability to qualify for and obtain affordable mortgages could be impacted by changes in government sponsored entities and private mortgage insurance companies supporting the mortgage market.
Changes made by Fannie Mae, Freddie Mac, FHA/VA sponsored mortgage programs, as well as changes made by private mortgage insurance companies, have reduced the ability of many potential homebuyers to qualify for mortgages. Principal among these have been tighter lending standards such as higher income requirements, larger required down payments, increased reserves and higher required credit scores. Higher income requirements could reduce the amount that homebuyers can qualify for when buying new homes. Larger down payment requirements and increased asset reserve thresholds appear to be preventing or delaying some homebuyers from entering the market. Increased credit score requirements eliminate a segment of potential homebuyers.
Government entities in regions where we operate have adopted or may adopt, slow or no growth initiatives, which could adversely affect our ability to build or timely build in these areas.
Some state and local governments in areas where we operate have approved, and others where we operate may approve, various slow growth or no growth homebuilding initiatives and other ballot measures that could negatively impact the availability of land and building opportunities within those jurisdictions. Approval of slow growth, no growth or similar initiatives (including the effect of these initiatives on existing entitlements and zoning) could adversely affect our ability to build or timely build and sell homes in the affected markets and/or create additional administrative and regulatory requirements and costs, which, in turn, could have an adverse effect on our future revenues and earnings.
Compliance with federal, state and local regulations related to our business could create substantial costs both in time and money, and some regulations could prohibit or restrict some homebuilding ventures.
We are subject to extensive and complex laws and regulations that affect the land development and homebuilding process, including laws and regulations related to zoning, permitted land uses, levels of density, building design, elevation of properties, water and waste disposal and use of open spaces. In addition, we are subject to laws and regulations related to workers’ health and safety. We also are subject to a variety of local, state and federal laws and regulations concerning the protection of health and the environment. In some of the markets where we operate, we are required by law to pay environmental impact fees, use energy-saving construction materials and give commitments to municipalities to provide certain infrastructure such as roads and sewage systems. We generally are required to obtain permits, entitlements and approvals from local authorities to commence and carry out residential development or home construction. Such permits, entitlements and approvals may, from time-to-time, be opposed or challenged by local governments, neighboring property owners or other interested parties, adding delays, costs and risks of non-approval to the process. Our obligation to comply with the laws and regulations under which we operate, and our need to ensure that our associates, subcontractors and other agents comply with these laws and regulations, could result in delays in construction and land development, cause us to incur substantial costs and prohibit or restrict land development and homebuilding activity in certain areas in which we operate. Budget reductions by state and local governmental agencies may increase our builder fees and the time it takes to obtain required approvals and therefore may aggregate the delays we could encounter.
We can be injured by failures of persons who act on our behalf to comply with applicable regulations and guidelines.
Although we expect all of our associates (i.e., employees), officers and directors to comply at all times with all applicable laws, rules and regulations, there may be instances in which subcontractors or others through whom we do business engage in practices that do not comply with applicable regulations or guidelines. When we learn of practices relating to homes we build or financing we provide that do not comply with applicable regulations or guidelines, we move actively to stop the non-complying practices as soon as possible and we have taken disciplinary action with regard to our associates who were aware of the practices, including in some instances terminating their employment. However, regardless of the steps we take after we learn of practices that do not comply with applicable regulations or guidelines, we can in some instances be subject to fines or other governmental penalties, and our reputation can be injured, due to the practices’ having taken place.
Tax law changes could make home ownership more expensive or less attractive.
Significant expenses of owning a home, including mortgage interest expense and real estate taxes, generally are deductible expenses for the purpose of calculating an individual’s federal, and in some cases state, taxable income. If the government were to make changes to income tax laws that eliminate or substantially reduce these income tax deductions, the after-tax cost of owning a home would increase substantially. This could adversely impact demand for, and/or sales prices of, new homes.
Other Risks
We have a stockholder who can exercise significant influence over matters that are brought to a vote of our stockholders.
Stuart A. Miller, our President, Chief Executive Officer and a Director, has voting control, through personal holdings and family-owned entities, of Class A and Class B common stock that enables Mr. Miller to cast approximately 46% of the votes that may be cast by the holders of our outstanding Class A and Class B common
stock combined. That effectively gives Mr. Miller the power to control the election of our directors and the approval of matters that are presented to our stockholders. Mr. Miller’s voting power might discourage someone from acquiring us or from making a significant equity investment in us, even if we needed the investment to meet our obligations and to operate our business. Also, because of his voting power, Mr. Miller may be able to authorize actions that are contrary to our other stockholders’ desires.
We may not be able to benefit from net operating loss (“NOL”) carryforwards.
We suffered significant losses in 2007, 2008 and 2009 for tax (as well as for financial statement) purposes. We were able to carry back 100% of our 2007 tax loss and most of our 2008 tax loss to recover taxes we had paid with regard to prior years. However, we would not have been able to carry back our 2009 fiscal year tax loss without legislation enacted in November 2009 that expanded the NOL carryback to 5 years, but only allowed 50% of taxable income earned in 2004 to be offset with 2009 loss. We will not receive any tax benefits with regard to tax losses we could not carry back, except to the extent we have taxable income in the 20 year NOL carryforward period. In our financial statements, we have fully reserved against all our deferred tax assets due to the possibility that we may not have taxable income that will enable us to benefit from them. However, those reserves will be reversed when it becomes more likely than not that we will have sufficient future taxable income to take advantage of the deferred tax assets.
Trading in our shares could substantially reduce our ability to use tax loss carryforwards.
Under the Internal Revenue Code, if there is a greater than 50% change of ownership of our stock during any three-year period caused by more than 5% shareholders, the ability to utilize NOL carryforwards is limited to the market value of the Company times the long-term federal tax exempt rate. This change of ownership limitation can occur as a result of purchases and sales in the market by persons who become owners of more than 5% of our stock, even without becoming a new majority owner. During the past three years, there have not been any significant changes in our holdings by 5% shareholders. However, it is possible that as a result of future stock trading, within a three-year period buyers could acquire in the market 5% or greater ownership interests in our stock totaling more than 50%. If that occurred, our ability to apply our tax loss carryforwards could become limited.
Item 1B. Unresolved Staff Comments.
Not applicable.
Executive Officers of Lennar Corporation
The following individuals are our executive officers as of January 28, 2011:
|
| |||||
| ||||||
| ||||||
| ||||||
| ||||||
| ||||||
| ||||||
| ||||||
Mr. Miller is one of our Directors and has served as our President and Chief Executive Officer since 1997. Effective if and when our stockholders approve an amendment to our bylaws relating to the titles and functions of officers, Mr. Miller will cease to be our President, but will continue to serve as our Chief Executive Officer. Before 1997, Mr. Miller held various executive positions with us.
Mr. Beckwitt has served as our Executive Vice President since March 2006 and beginning January 12, 2011 was elected our President, subject to stockholders approval of an amendment to our bylaws. As our Executive Vice President, Mr. Beckwitt was involved in all operational aspects of our company. Mr. Beckwitt served on the Board of Directors of D.R. Horton, Inc. from 1993 to November 2003. From 1993 to March 2000, he held various executive officer positions at D.R. Horton, including President of the company. From March 2000 to April 2003, Mr. Beckwitt was the owner and principal of EVP Capital, L.P., (a venture capital and real estate advisory company). Mr. Beckwitt retired in May 2003 to design and personally construct a second home in Maine.
Mr. Jaffe has served as Vice President since 1994 and has served as our Chief Operating Officer since December 2004. Before that time, Mr. Jaffe served as a Regional President in our Homebuilding operations. Additionally, prior to his appointment as Chief Operating Officer, Mr. Jaffe was one of our Directors from 1997 through June 2004.
Mr. Gross has served as Vice President and our Chief Financial Officer since 1997. Before that, Mr. Gross was Senior Vice President, Controller and Treasurer of Pacific Greystone Corporation.
Ms. Bessette joined us in 1995 and served as our Controller from 1997 to 2008. Since February 2008, she has served as our Treasurer. She was appointed a Vice President in 2000.
Mr. Sustana has served as our Secretary and General Counsel since 2005.
Mr. Collins joined us in 1998 and has served as our Controller since February 2008. Before becoming Controller, Mr. Collins served as our Executive Director of Financial Reporting.
Item 2. Properties.
We lease and maintain our executive offices in an office complex in Miami, Florida. Our homebuilding, financial services and Rialto Investments offices are located in the markets where we conduct business, primarily in leased space. We believe that our existing facilities are adequate for our current and planned levels of operation.
Because of the nature of our homebuilding operations, significant amounts of property are held as inventory in the ordinary course of our homebuilding business. We discuss these properties in the discussion of our homebuilding operations in Item 1 of this Report.
Item 3. Legal Proceedings.
We are party to various claims and lawsuits which arise in the ordinary course of business, but we do not consider the volume of our claims and lawsuits unusual given the number of homes we deliver and the fact that the lawsuits often relate to homes delivered several years before the lawsuits are commenced. Although the specific allegations in the lawsuits differ, they most commonly involve claims that we failed to construct homes in particular communities in accordance with plans and specifications or applicable construction codes and seek reimbursement for sums allegedly needed to remedy the alleged deficiencies, assert contract issues or relate to personal injuries. Lawsuits of these types are common within the homebuilding industry. We are a plaintiff in many cases in which we seek contribution from our subcontractors for home repair costs. The costs incurred by us in construction defect lawsuits are offset by warranty reserves, our third party insurers, subcontractor insurers and indemnity contributions from subcontractors. We do not believe that the ultimate resolution of these claims or lawsuits will have a material adverse effect on our business, financial position, results of operations or cash flows. From time-to-time, we also receive notices from environmental agencies regarding alleged violations of environmental laws. We typically settle these matters before they reach litigation for amounts that are not material to us.
In April 2008, we were named as a nominal defendant in a derivative suit in the United States District Court for the Southern District of Florida, Miami Division, entitledDoris Staehr, Derivatively on Behalf of Lennar Corporation v. Stuart A. Miller, et al., Case No. 08-20990-CIV, in which the plaintiff purports to assert claims for our benefit against some of our current and former officers and directors, primarily relating to allegedly inadequate or incorrect disclosures about the likelihood of a decline in the housing market and the effects it would have on us. Because the suit was allegedly brought for our benefit, it did not seek any damages from us. In August 2008, we moved to dismiss the suit on the ground that the plaintiff failed to make a demand on our directors that under most circumstances is a prerequisite to a derivative suit. The director defendants moved to dismiss for that and other reasons. On March 31, 2010, the Court issued an order dismissing the plaintiff’s claims.
Item 4. Submission of Matters to a Vote of Security Holders.
Not applicable.
PART II
Item 5. Market for Registrant’s Common Equity, Related Stockholder Matters and Issuer Purchases of Equity Securities.
Our Class A and Class B common stock are listed on the New York Stock Exchange under the symbols “LEN” and “LEN.B,” respectively. The following table shows the high and low sales prices for our Class A and Class B common stock for the periods indicated, as reported by the NYSE, and cash dividends declared per share:
Class A Common Stock | Cash Dividends Per Class A Share | |||||||||||
Fiscal Quarter | 2010 | 2009 | 2010 | 2009 | ||||||||
First | $17.88 – 11.56 | $11.56 – 5.54 | 4 | ¢ | 4 | ¢ | ||||||
Second | $21.79 – 15.86 | $11.25 – 5.72 | 4 | ¢ | 4 | ¢ | ||||||
Third | $17.16 – 11.93 | $15.92 – 7.28 | 4 | ¢ | 4 | ¢ | ||||||
Fourth | $16.61 – 13.42 | $17.66 – 12.05 | 4 | ¢ | 4 | ¢ | ||||||
Class B Common Stock | Cash Dividends Per Class B Share | |||||||||||
Fiscal Quarter | 2010 | 2009 | 2010 | 2009 | ||||||||
First | $14.25 – 8.63 | $ 8.99 – 4.09 | 4 | ¢ | 4 | ¢ | ||||||
Second | $18.07 – 12.71 | $ 8.93 – 4.36 | 4 | ¢ | 4 | ¢ | ||||||
Third | $14.18 – 9.25 | $12.49 – 5.58 | 4 | ¢ | 4 | ¢ | ||||||
Fourth | $13.61 – 10.74 | $13.87 – 9.18 | 4 | ¢ | 4 | ¢ | ||||||
As of December 31, 2010, the last reported sale price of our Class A common stock was $18.75 and the last reported sale price of our Class B common stock was $15.57. As of December 31, 2010, there were approximately 970 and 700 holders of record, respectively, of our Class A and Class B common stock.
On January 12, 2011, our Board of Directors declared a quarterly cash dividend of $0.04 per share for both our Class A and Class B common stock, which is payable on February 8, 2011 to holders of record at the close of business on January 25, 2011. Our Board of Directors evaluates each quarter the decision whether to declare a dividend and the amount of the dividend.
In June 2001, our Board of Directors authorized a stock repurchase program to permit future purchases of up to 20 million shares of our outstanding common stock. During the three months and year ended November 30, 2010, there were no shares repurchased under this program.
The information required by Item 201(d) of Regulation S-K is provided in Item 12 of this Report.
Performance Graph
The following graph compares the five-year cumulative total return of our Class A common stock with the Dow Jones U.S. Home Construction Index and the Dow Jones U.S. Total Market Index. The graph assumes $100 invested on November 30, 2005 in our Class A common stock, the Dow Jones U.S. Home Construction Index and the Dow Jones U.S. Total Market Index, and the reinvestment of all dividends.
Comparison of Five-Year Cumulative Total Return
Fiscal Year Ended November 30
(2005=$100)
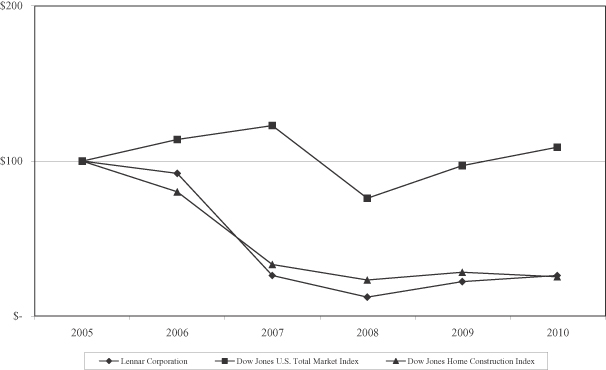
| 2005 | 2006 | 2007 | 2008 | 2009 | 2010 | |||||||||||||||||||
Lennar Corporation | $ | 100 | 92 | 26 | 12 | 22 | 26 | |||||||||||||||||
Dow Jones U.S. Home Construction Index | $ | 100 | 80 | 33 | 23 | 28 | 25 | |||||||||||||||||
Dow Jones U.S. Total Market Index | $ | 100 | 114 | 123 | 76 | 97 | 109 | |||||||||||||||||
Item 6. Selected Financial Data.
The following table sets forth our selected consolidated financial and operating information as of or for each of the years ended November 30, 2006 through 2010. The information presented below is based upon our historical financial statements.
| At or for the Years Ended November 30, | ||||||||||||||||||||
| 2010 | 2009 | 2008 | 2007 | 2006 | ||||||||||||||||
| (Dollars in thousands, except per share amounts) | ||||||||||||||||||||
Results of Operations: | ||||||||||||||||||||
Revenues: | ||||||||||||||||||||
Lennar Homebuilding | $ | 2,705,639 | 2,834,285 | 4,263,038 | 9,730,252 | 15,623,040 | ||||||||||||||
Lennar Financial Services | $ | 275,786 | 285,102 | 312,379 | 456,529 | 643,622 | ||||||||||||||
Rialto Investments | $ | 92,597 | — | — | — | — | ||||||||||||||
Total revenues | $ | 3,074,022 | 3,119,387 | 4,575,417 | 10,186,781 | 16,266,662 | ||||||||||||||
Operating earnings (loss): | ||||||||||||||||||||
Lennar Homebuilding (1) | $ | 100,060 | (676,293 | ) | (404,883 | ) | (2,912,072 | ) | 999,568 | |||||||||||
Lennar Financial Services (2) | $ | 31,284 | 35,982 | (30,990 | ) | 6,120 | 149,803 | |||||||||||||
Rialto Investments | $ | 57,307 | (2,528 | ) | — | — | — | |||||||||||||
Corporate general and administrative expenses | $ | (93,926 | ) | (117,565 | ) | (129,752 | ) | (173,202 | ) | (193,307 | ) | |||||||||
Earnings (loss) before income taxes | $ | 94,725 | (760,404 | ) | (565,625 | ) | (3,079,154 | ) | 956,064 | |||||||||||
Net earnings (loss) attributable to | $ | 95,261 | (417,147 | ) | (1,109,085 | ) | (1,941,081 | ) | 593,869 | |||||||||||
Diluted earnings (loss) per share | $ | 0.51 | (2.45 | ) | (7.01 | ) | (12.31 | ) | 3.68 | |||||||||||
Cash dividends declared per each—Class A and Class B common stock | $ | 0.16 | 0.16 | 0.52 | 0.64 | 0.64 | ||||||||||||||
Financial Position: | ||||||||||||||||||||
Total assets | $ | 8,787,851 | 7,314,791 | 7,424,898 | 9,102,747 | 12,408,266 | ||||||||||||||
Debt: | ||||||||||||||||||||
Lennar Homebuilding | $ | 3,128,154 | 2,761,352 | 2,544,935 | 2,295,436 | 2,613,503 | ||||||||||||||
Rialto Investments | $ | 752,302 | — | — | — | — | ||||||||||||||
Lennar Financial Services | $ | 271,678 | 217,557 | 225,783 | 541,437 | 1,149,231 | ||||||||||||||
Stockholders’ equity | $ | 2,608,949 | 2,443,479 | 2,623,007 | 3,822,119 | 5,701,372 | ||||||||||||||
Total equity | $ | 3,194,383 | 2,588,014 | 2,788,753 | 3,850,647 | 5,756,765 | ||||||||||||||
Shares outstanding (000s) | 186,636 | 184,896 | 160,558 | 159,887 | 158,155 | |||||||||||||||
Stockholders’ equity per share | $ | 13.98 | 13.22 | 16.34 | 23.91 | 36.05 | ||||||||||||||
Lennar Homebuilding Data (including unconsolidated entities): | ||||||||||||||||||||
Number of homes delivered | 10,955 | 11,478 | 15,735 | 33,283 | 49,568 | |||||||||||||||
New orders | 10,928 | 11,510 | 13,391 | 25,753 | 42,212 | |||||||||||||||
Backlog of home sales contracts | 1,604 | 1,631 | 1,599 | 4,009 | 11,608 | |||||||||||||||
Backlog dollar value | $ | 407,292 | 479,571 | 456,270 | 1,384,137 | 3,980,428 | ||||||||||||||
Item 7. Management’s Discussion and Analysis of Financial Condition and Results of Operations.
The following discussion and analysis of our financial condition and results of operations should be read in conjunction with “Selected Financial Data” and our audited consolidated financial statements and accompanying notes included elsewhere in this Report.
Special Note Regarding Forward-Looking Statements
Some of the statements in this Management’s Discussion and Analysis of Financial Condition and Results of Operations, and elsewhere in this Annual Report on Form 10-K, are “forward-looking statements,” as that term is defined in the Private Securities Litigation Reform Act of 1995. These forward-looking statements include statements regarding our business, financial condition, results of operations, cash flows, strategies and prospects. You can identify forward-looking statements by the fact that these statements do not relate strictly to historical or current matters. Rather, forward-looking statements relate to anticipated or expected events, activities, trends or results. Because forward-looking statements relate to matters that have not yet occurred, these statements are inherently subject to risks and uncertainties. Many factors could cause our actual activities or results to differ materially from the activities and results anticipated in forward-looking statements. These factors include those described under the caption “Risk Factors” in Item 1A of this Report. We do not undertake any obligation to update forward-looking statements, except as required by Federal securities laws.
Outlook
During our 2010 fiscal year, we continued to see a housing market that was trying to stabilize. This stabilization process was impacted by the expiration of the Federal homebuyer tax credit at the end of April 2010, which contributed to a reduction in the pace of home sales. The rate at which homes sold nationally was also adversely affected by high unemployment, lenders’ effort to sell foreclosed homes, tight lending standards and low consumer confidence. All these factors contributed to a 5% decline in our new orders during our 2010 fiscal year compared with prior year. Overall, recovery of the housing market is still sporadic, and how long it will take for the housing market to return to historical conditions is uncertain.
We have remained focused on improving our core business and we returned to profitability in 2010. Our principal focus in our homebuilding operations is on maintaining and improving our gross profit margin on the homes we sell. We have taken steps over the past several years to reduce costs and right-size our overhead structure. We have also repositioned our product offering to target first-time and value-focused homebuyers, the result of which has only recently begun to be reflected in our operating results. We continue to make carefully underwritten strategic land acquisitions in well-positioned markets that will support our homebuilding operations going forward. As a result, we are beginning to open communities with land that we purchased relatively recently at prices that reflect the recent depressed state of the market with respect to land that is suitable for residential homebuilding.
Our Rialto Investments (“Rialto”) segment added significant profits to our bottom line, generating operating earnings of $24.2 million (net of $33.2 million of net earnings attributable to noncontrolling interests) in year ended November 30, 2010. During our 2010 fiscal year, we acquired for $243 million, a 40% interest (with the FDIC holding the other 60%) in a pool of real estate loans with an aggregate unpaid principal balance of approximately $3 billion acquired by the FDIC from 22 failed banks, and acquired for approximately $310 million, portfolios of mortgage loans and REO from three financial institutions. In the fourth quarter, we also completed the first closing of our Rialto real estate investment fund (the “Fund”) with initial equity commitments of approximately $300 million (including $75 million committed by us). Through the Fund, we will continue to invest in distressed opportunities that we expect will contribute to our future earnings.
Although high unemployment, tight lending standards and low consumer confidence continue to present challenges for the housing market, we believe that 2011 will be another profitable year. We believe that our homebuilding operations are on track to achieving sustainable profitability as the housing market stabilizes and ultimately recovers and our financial services and Rialto Investments segments will continue to enhance our earnings.
Results of Operations
Overview
Our net earnings attributable to Lennar in 2010 were $95.3 million, or $0.51 per basic and diluted share, compared to a net loss attributable to Lennar of $417.1 million, or $2.45 per basic and diluted share, in 2009. Our gross margin percentage improved in 2010, compared to 2009, primarily due to a reduction in valuation adjustments and reduced sales incentives offered to homebuyers as a percentage of revenues from home sales.
The following table sets forth financial and operational information for the years indicated related to our operations.
| Years Ended November 30, | ||||||||||||
| 2010 | 2009 | 2008 | ||||||||||
| (Dollars in thousands, except average sales price) | ||||||||||||
Lennar Homebuilding revenues: | ||||||||||||
Sales of homes | $ | 2,631,314 | 2,776,850 | 4,150,717 | ||||||||
Sales of land | 74,325 | 57,435 | 112,321 | |||||||||
Total Lennar Homebuilding revenues | 2,705,639 | 2,834,285 | 4,263,038 | |||||||||
Lennar Homebuilding costs and expenses: | ||||||||||||
Cost of homes sold | 2,113,393 | 2,524,850 | 3,641,090 | |||||||||
Cost of land sold | 52,968 | 236,277 | 245,536 | |||||||||
Selling, general and administrative | 376,962 | 449,259 | 655,255 | |||||||||
Total Lennar Homebuilding costs and expenses | 2,543,323 | 3,210,386 | 4,541,881 | |||||||||
Lennar Homebuilding operating margins | 162,316 | (376,101 | ) | (278,843 | ) | |||||||
Lennar Homebuilding equity in loss from unconsolidated entities | (10,966 | ) | (130,917 | ) | (59,156 | ) | ||||||
Lennar Homebuilding other income (expense), net | 19,135 | (98,425 | ) | (172,387 | ) | |||||||
Other interest expense | (70,425 | ) | (70,850 | ) | (27,594 | ) | ||||||
Gain on recapitalization of unconsolidated entity | — | — | 133,097 | |||||||||
Lennar Homebuilding operating earnings (loss) | 100,060 | (676,293 | ) | (404,883 | ) | |||||||
Lennar Financial Services revenues | 275,786 | 285,102 | 312,379 | |||||||||
Lennar Financial Services costs and expenses (1) | 244,502 | 249,120 | 343,369 | |||||||||
Lennar Financial Services operating earnings (loss) | 31,284 | 35,982 | (30,990 | ) | ||||||||
Rialto Investments revenues | 92,597 | — | — | |||||||||
Rialto Investments costs and expenses | 67,904 | 2,528 | — | |||||||||
Rialto Investments equity in earnings from unconsolidated entities | 15,363 | — | — | |||||||||
Rialto Investments other income, net | 17,251 | — | — | |||||||||
Rialto Investments operating earnings (loss) | 57,307 | (2,528 | ) | — | ||||||||
Total operating earnings (loss) | 188,651 | (642,839 | ) | (435,873 | ) | |||||||
Corporate general and administrative expenses | (93,926 | ) | (117,565 | ) | (129,752 | ) | ||||||
Earnings (loss) before income taxes | $ | 94,725 | (760,404 | ) | (565,625 | ) | ||||||
Gross margin on home sales | 19.7 | % | 9.1 | % | 12.3 | % | ||||||
SG&A expenses as a % of revenues from home sales | 14.3 | % | 16.2 | % | 15.8 | % | ||||||
Operating margin as a % of revenues from home sales | 5.4 | % | (7.1 | )% | (3.5 | )% | ||||||
Gross margin on home sales excluding valuation adjustments (2) | 21.4 | % | 15.6 | % | 17.0 | % | ||||||
Operating margin as a % of revenues from home sales excluding valuation adjustments (2) | 7.1 | % | (0.6 | )% | 1.2 | % | ||||||
Average sales price | $ | 243,000 | 243,000 | 270,000 | ||||||||
2010 versus 2009
Revenues from home sales decreased 5% in the year ended November 30, 2010 to $2.6 billion from $2.8 billion in 2009. Revenues were lower primarily due to a 5% decrease in the number of home deliveries, excluding unconsolidated entities. New home deliveries, excluding unconsolidated entities, decreased to 10,859 homes in the year ended November 30, 2010 from 11,422 homes last year. The average sales price of homes delivered for both the years ended November 30, 2010 and 2009 was $243,000. Sales incentives offered to homebuyers were $32,800 per home delivered in the year ended November 30, 2010, or 11.9% as a percentage of home sales revenue, compared to $44,800 per home delivered in the prior year, or 15.6% as a percentage of home sales revenue.
Gross margins on home sales were $517.9 million, or 19.7%, in the year ended November 30, 2010, which included $44.7 million of valuation adjustments, compared to gross margins on home sales of $252.0 million, or 9.1%, in the year ended November 30, 2009, which included $180.2 million of valuation adjustments. Gross margins on home sales excluding valuation adjustments were $562.6 million, or 21.4%, in the year ended November 30, 2010, compared to $432.2 million, or 15.6%, in 2009. Gross margin percentage on home sales, excluding valuation adjustments, improved compared to last year, due primarily to reduced sales incentives offered to homebuyers as a percentage of revenues from home sales, reduced construction costs and product re-engineering, as well as third-party recoveries related to Chinese drywall. Gross margins on home sales excluding valuation adjustments is a non-GAAP financial measure, which is discussed in the Non-GAAP Financial Measure section.
Selling, general and administrative expenses were reduced by $72.3 million, or 16%, in the year ended November 30, 2010, compared to the same period last year, primarily due to reductions in legal, personnel and occupancy expenses. As a percentage of revenues from home sales, selling, general and administrative expenses improved to 14.3% in the year ended November 30, 2010, from 16.2% in 2009.
Gross profits on land sales totaled $21.4 million in the year ended November 30, 2010, primarily due to the reduction of an obligation related to a profit participation agreement. Gross profits on land sales were net of $3.4 million of valuation adjustments and $3.1 million in write-offs of deposits and pre-acquisitions costs. Losses on land sales totaled $178.8 million in the year ended November 30, 2009, which included $108.9 million of valuation adjustments and $84.4 million in write-offs of deposits and pre-acquisition costs.
Lennar Homebuilding equity in loss from unconsolidated entities was $11.0 million in the year ended November 30, 2010, which included $10.5 million of valuation adjustments related to assets of unconsolidated entities in which we have investments. In the year ended November 30, 2009, Lennar Homebuilding equity in loss from unconsolidated entities was $130.9 million, which included $101.9 million of valuation adjustments related to assets of unconsolidated entities in which we have investments.
Lennar Homebuilding other income (expense), net, totaled $19.1 million in the year ended November 30, 2010, which included a $19.4 million pre-tax gain on the extinguishment of other debt and other income, partially offset by a $10.8 million pre-tax loss related to the repurchase of senior notes through a tender offer and $1.7 million of valuation adjustments to our investments in unconsolidated entities. Lennar Homebuilding other income (expense), net, totaled ($98.4) million in the year ended November 30, 2009, which included $89.0 million of valuation adjustments to our investments in unconsolidated entities and $9.7 million of write-offs of notes and other receivables.
Homebuilding interest expense was $143.9 million in the year ended November 30, 2010 ($71.5 million was included in cost of homes sold, $2.0 million in cost of land sold and $70.4 million in other interest expense), compared to $147.4 million in the year ended November 30, 2009 ($67.4 million was included in cost of homes sold, $9.2 million in cost of land sold and $70.9 million in other interest expense). Despite an increase in debt, interest expense decreased primarily due to an increase in qualifying assets eligible for interest capitalization and savings resulting from the termination of our senior unsecured revolving credit facility during the first quarter of 2010.
Net earnings (loss) attributable to noncontrolling interests were $25.2 million and ($28.9) million, respectively, in the years ended November 30, 2010 and 2009. Net earnings attributable to noncontrolling interests during the year ended November 30, 2010 were primarily related to the FDIC’s interest in the portfolio of real estate loans that we acquired in partnership with the FDIC.
Sales of land, Lennar Homebuilding equity in loss from unconsolidated entities, other income (expense), net and net earnings (loss) attributable to noncontrolling interests may vary significantly from period to period depending on the timing of land sales and other transactions entered into by the Company and unconsolidated entities in which it has investments.
Operating earnings for the Lennar Financial Services segment were $31.3 million in the year ended November 30, 2010, compared to $36.0 million in the same period last year. The decrease in operating earnings was primarily due to decreased volume in the segment’s mortgage and title operations.
In the year ended November 30, 2010, operating earnings for the Rialto Investments segment were $57.3 million (which included $33.2 million of net earnings attributable to noncontrolling interests), compared to an operating loss of $2.5 million in the prior year. In the year ended November 30, 2010, revenues in this segment were $92.6 million, which consisted primarily of accretable interest income associated with the portfolios of real estate loans acquired in partnership with the FDIC. In the year ended November 30, 2010, other income, net was $17.3 million, which consisted primarily of gains on the sale of real estate owned (“REO”) and gains from acquisition of REO through foreclosure. The segment also had equity in earnings from unconsolidated entities of $15.4 million during the year ended November 30, 2010, consisting primarily of interest income and unrealized gains related to our investment in the AllianceBernstein L.P. (“AB”) fund formed under the Federal government’s Public-Private Investment Program (“PPIP”). In the year ended November 30, 2010, expenses in this segment were $67.9 million, which consisted primarily of the carrying costs related to its portfolio operations, underwriting expenses related to both completed and abandoned transactions, and other general and administrative expenses.
Corporate general and administrative expenses were reduced by $23.6 million, or 20%, in the year ended November 30, 2010, compared to the same period last year primarily due to our cost reduction initiatives implemented during the downturn. As a percentage of total revenues, corporate general and administrative expenses decreased to 3.1% in the year ended November 30, 2010, from 3.8% in the prior year.
A reduction of the carrying amounts of deferred tax assets by a valuation allowance is required if, based on available evidence, it is more likely than not that such assets will not be realized. Based upon an evaluation of all available evidence, during the year ended November 30, 2010, we recorded a reversal of the deferred tax asset valuation allowance of $37.9 million, primarily due to the recording of a deferred tax liability from the issuance of 2.75% convertible senior notes due 2020 and the net earnings generated during the year. The reversal of the deferred tax asset valuation allowance related to the issuance of the 2.75% convertible senior notes due 2020 was recorded as an adjustment to additional paid-in capital. At November 30, 2010, the deferred tax asset valuation allowance was $609.5 million.
At November 30, 2010, we owned 84,482 homesites and had access to an additional 19,974 homesites through either option contracts with third parties or agreements with unconsolidated entities in which we have investments. At November 30, 2010, 2% of the homesites we owned were subject to home purchase contracts. Our backlog of sales contracts was 1,604 homes ($407.3 million) at November 30, 2010, compared to 1,631 homes ($479.6 million) at November 30, 2009.
2009 versus 2008
Revenues from home sales decreased 33% in the year ended November 30, 2009 to $2.8 billion from $4.2 billion in 2008. Revenues were lower primarily due to a 26% decrease in the number of home deliveries, excluding unconsolidated entities, and a 10% decrease in the average sales price of homes delivered in 2009. New home deliveries, excluding unconsolidated entities, decreased to 11,422 homes in the year ended November 30, 2009 from 15,344 homes in 2008. In the year ended November 30, 2009, new home deliveries were lower in each of our Lennar Homebuilding segments and Homebuilding Other, compared to 2008. The average sales price of homes delivered decreased to $243,000 in the year ended November 30, 2009 from $270,000 in 2008. Sales incentives offered to homebuyers were $44,800 per home delivered in the year ended November 30, 2009, compared to $48,700 per home delivered in 2008.
Gross margins on home sales were $252.0 million, or 9.1%, in the year ended November 30, 2009, which included $180.2 million of valuation adjustments, compared to gross margins on home sales of $509.6 million, or 12.3%, in the year ended November 30, 2008, which included $195.5 million of valuation adjustments. Gross margins on home sales excluding valuation adjustments were $432.2 million, or 15.6%, in the year ended November 30, 2009, compared to $705.1 million, or 17.0%, in 2008. Gross margin percentage on home sales, excluding valuation adjustments, decreased compared to 2008, due primarily to reduced sales prices.
Selling, general and administrative expenses were reduced by $206.0 million, or 31%, in the year ended November 30, 2009, compared to 2008, primarily due to reductions in associate headcount, variable selling expenses and fixed costs. As a percentage of revenues from home sales, selling, general and administrative expenses increased to 16.2% in the year ended November 30, 2009, from 15.8% in 2008, due to lower revenues.
Losses on land sales totaled $178.8 million in the year ended November 30, 2009, which included $108.9 million of valuation adjustments and $84.4 million of write-offs of deposits and pre-acquisition costs related to homesites under option that we did not intend to purchase. In the year ended November 30, 2008, losses on land sales totaled $133.2 million, which included $47.8 million of valuation adjustments and $97.2 million of write-offs of deposits and pre-acquisition costs related to homesites that were under option.
Lennar Homebuilding equity in loss from unconsolidated entities was $130.9 million in the year ended November 30, 2009, which included $101.9 million of valuation adjustments related to assets of unconsolidated entities in which we have investments, compared to Lennar Homebuilding equity in loss from unconsolidated entities of $59.2 million in the year ended November 30, 2008, which included $32.2 million of valuation adjustments related to assets of unconsolidated entities in which we have investments.
Lennar Homebuilding other expense, net totaled $98.4 million in the year ended November 30, 2009, which included $89.0 million of valuation adjustments to our investments in unconsolidated entities and $9.7 million of write-offs of notes and other receivables, compared to Lennar Homebuilding other expense, net of $172.4 million in the year ended November 30, 2008, which included $172.8 million of valuation adjustments to our investments in unconsolidated entities and $25.0 million of write-offs of notes and other receivables.
Homebuilding interest expense was $147.4 million in the year ended November 30, 2009 ($67.4 million was included in cost of homes sold, $9.2 million in cost of land sold and $70.9 million in other interest expense), compared to $130.4 million in the year ended November 30, 2008 ($99.3 million was included in cost of homes sold, $3.4 million in cost of land sold and $27.6 million in other interest expense). Despite a decrease in deliveries during the year ended November 30, 2009, compared to 2008, interest expense increased primarily due to the interest related to the $400 million 12.25% senior notes due 2017 issued during the second quarter of 2009, as well as a reduction in qualifying assets eligible for interest capitalization as a result of a decrease in inventories from prior year.
Net loss attributable to noncontrolling interests was $28.9 million in the year ended November 30, 2009, which included $13.6 million of noncontrolling interest income as a result of $27.2 million of valuation adjustments to inventories of 50%-owned consolidated joint ventures, compared to net loss attributable to noncontrolling interests of $4.1 million in the year ended November 30, 2008.
Sales of land, Lennar Homebuilding equity in loss from unconsolidated entities, other income (expense), net and net earnings (loss) attributable to noncontrolling interests may vary significantly from period to period depending on the timing of land sales and other transactions entered into by us and unconsolidated entities in which we have investments.
Operating earnings for the Lennar Financial Services segment was $36.0 million in the year ended November 30, 2009, compared to an operating loss of $31.0 million in 2008. The increase in profitability in the Lennar Financial Services segment was primarily due to lower fixed costs as a result of successful cost reduction initiatives implemented throughout the downturn. In addition, in the year ended November 30, 2008, there was a $27.2 million write-off of goodwill related to the segment’s mortgage operations, compared to no write-off in the year ended November 30, 2009.
Operating loss for the Rialto Investments segment was $2.5 million in the year ended November 30, 2009, which related primarily to general and administrative expenses incurred to start up the Rialto Investments segment.
Corporate general and administrative expenses were reduced by $12.2 million, or 9%, for the year ended November 30, 2009, compared to 2008. As a percentage of total revenues, corporate general and administrative expenses increased to 3.8% in the year ended November 30, 2009, from 2.8% in 2008, due to lower revenues.
As a result of our net operating loss during the year ended November 30, 2009, we generated deferred tax assets of $269.6 million and recorded a non-cash valuation allowance against the entire amount of the deferred tax assets. In addition, we recorded a reversal of our deferred tax asset valuation allowance of $351.8 million during the fourth quarter of 2009, primarily due to a change in tax legislation, which allowed us to carry back our fiscal year 2009 tax loss to recover previously paid income taxes.
At November 30, 2009, we owned 82,703 homesites and had access to an additional 21,173 homesites through either option contracts with third parties or agreements with unconsolidated entities in which we have investments. At November 30, 2009, 2% of the homesites we owned were subject to home purchase contracts. Our backlog of sales contracts was 1,631 homes ($479.6 million) at November 30, 2009, compared to 1,599 homes ($456.3 million) at November 30, 2008.
Non-GAAP Financial Measure
Gross margins on home sales excluding valuation adjustments is a non-GAAP financial measure, and is defined by us as sales of homes revenue less cost of homes sold excluding valuation adjustments recorded during the period. Management finds this to be an important and useful measure in evaluating our performance because it discloses the profit we generate on homes we actually delivered during the period, as our valuation adjustments generally relate to inventory that we did not deliver during the period. Gross margins on home sales excluding valuation adjustments also is important to our management, because it assists our management in making strategic decisions regarding our construction pace, product mix and product pricing based upon the profitability we generated on homes we actually delivered during previous periods. We believe investors also find gross margins on home sales excluding valuation adjustments to be important and useful because it discloses a profitability measure on homes we actually delivered in a period that can be compared to the profitability on homes we delivered in a prior period without regard to the variability of valuation adjustments recorded from period to period. In addition, to the extent that our competitors provide similar information, disclosure of our gross margins on home sales excluding valuation adjustments helps readers of our financial statements compare our ability to generate profits with regard to the homes we deliver in a period to our competitors’ ability to generate profits with regard to the homes they deliver in the same period.
Although management finds gross margins on home sales excluding valuation adjustments to be an important measure in conducting and evaluating our operations, this measure has limitations as an analytical tool as it is not reflective of the actual profitability generated by our company during the period. This is because it excludes charges we recorded relating to inventory that was impaired during the period. In addition, because gross margins on home sales excluding valuation adjustments is a financial measure that is not calculated in accordance with generally accepted accounting principles (“GAAP”), it may not be completely comparable to similarly titled measures of our competitors due to differences in methods of calculation and charges being excluded. Our management compensates for the limitations of using gross margins on home sales excluding valuation adjustments by using this non-GAAP measure only to supplement our GAAP results in order to provide a more complete understanding of the factors and trends affecting our operations. In order to analyze our overall performance and actual profitability relative to our homebuilding operations, we also compare our gross margins on home sales during the period, inclusive of valuation adjustments, with the same measure during prior comparable periods. Due to the limitations discussed above, gross margins on home sales excluding valuation adjustments should not be viewed in isolation as it is not a substitute for GAAP measures of gross margins.
The table set forth below reconciles our gross margins on home sales excluding valuation adjustments for the years ended November 30, 2010, 2009 and 2008 to our gross margins on home sales for the years ended November 30, 2010, 2009 and 2008:
| Years Ended November 30, | ||||||||||||
| 2010 | 2009 | 2008 | ||||||||||
| (In thousands) | ||||||||||||
Sales of homes | $ | 2,631,314 | 2,776,850 | 4,150,717 | ||||||||
Cost of homes sold | 2,113,393 | 2,524,850 | 3,641,090 | |||||||||
Gross margins on home sales | 517,921 | 252,000 | 509,627 | |||||||||
Valuation adjustments to finished homes, CIP and land on which we intend to build homes | 44,717 | 180,239 | 195,518 | |||||||||
Gross margins on homes sales excluding valuation adjustments | $ | 562,638 | 432,239 | 705,145 | ||||||||
Homebuilding Segments
Our Homebuilding operations construct and sell homes primarily for first-time, move-up and active adult homebuyers primarily under the Lennar brand name. In addition, our homebuilding operations also purchase, develop and sell land to third parties. In certain circumstances, we diversify our operations through strategic alliances and attempt to minimize our risks by investing with third parties in joint ventures.
We have grouped our homebuilding activities into four reportable segments, which we refer to as Homebuilding East, Homebuilding Central, Homebuilding West and Homebuilding Houston. Information about homebuilding activities in states that do not have economic characteristics that are similar to those in other states in the same geographic area is grouped under “Homebuilding Other.” Reference in this Management’s Discussion and Analysis of Financial Condition and Results of Operations to homebuilding segments are to those reportable segments.
At November 30, 2010, our reportable homebuilding segments and Homebuilding Other consisted of homebuilding divisions located in:
East:Florida, Maryland, New Jersey and Virginia.
Central: Arizona, Colorado and Texas. (1)
West:California and Nevada.
Houston: Houston, Texas.
Other: Georgia, Illinois, Minnesota, North Carolina and South Carolina.
The following tables set forth selected financial and operational information related to our homebuilding operations for the years indicated:
Selected Financial and Operational Data
| Years Ended November 30, | ||||||||||||
| 2010 | 2009 | 2008 | ||||||||||
| (In thousands) | ||||||||||||
Revenues: | ||||||||||||
East: | ||||||||||||
Sales of homes | $ | 922,947 | 844,689 | 1,252,725 | ||||||||
Sales of land | 16,503 | 27,569 | 23,033 | |||||||||
Total East | 939,450 | 872,258 | 1,275,758 | |||||||||
Central: | ||||||||||||
Sales of homes | 348,486 | 361,273 | 512,957 | |||||||||
Sales of land | 9,246 | 5,910 | 20,153 | |||||||||
Total Central | 357,732 | 367,183 | 533,110 | |||||||||
West: | ||||||||||||
Sales of homes | 650,844 | 810,459 | 1,408,051 | |||||||||
Sales of land | 32,646 | 15,778 | 32,112 | |||||||||
Total West | 683,490 | 826,237 | 1,440,163 | |||||||||
Houston: | ||||||||||||
Sales of homes | 357,590 | 429,127 | 542,288 | |||||||||
Sales of land | 8,348 | 5,691 | 8,565 | |||||||||
Total Houston | 365,938 | 434,818 | 550,853 | |||||||||
Other: | ||||||||||||
Sales of homes | 351,447 | 331,302 | 434,696 | |||||||||
Sales of land | 7,582 | 2,487 | 28,458 | |||||||||
Total Other | 359,029 | 333,789 | 463,154 | |||||||||
Total homebuilding revenues | $ | 2,705,639 | 2,834,285 | 4,263,038 | ||||||||
Operating earnings (loss): East: Sales of homes Sales of land Equity in loss from unconsolidated entities Other income (expense), net Other interest expense Total East Central: Sales of homes Sales of land Equity in loss from unconsolidated entities Other expense, net Other interest expense Total Central West: Sales of homes Sales of land Equity in loss from unconsolidated entities Other income (expense), net Other interest expense Gain on recapitalization of unconsolidated entity Total West Houston: Sales of homes Sales of land Equity in earnings (loss) from unconsolidated entities Other income (expense), net Other interest expense Total Houston Other: Sales of homes Sales of land Equity in loss from unconsolidated entities Other income (expense), net Other interest expense Total Other Total homebuilding operating earnings (loss) Years Ended November 30, 2010 2009 2008 (In thousands) $ 122,235 (70,878 ) (37,361 ) 1,042 (92,968 ) (41,242 ) (871 ) (5,660 ) (31,422 ) 12,962 (11,900 ) (37,633 ) (22,376 ) (24,847 ) (9,376 ) 112,992 (206,253 ) (157,034 ) (7,910 ) (39,309 ) (67,124 ) (353 ) 406 (11,330 ) (4,727 ) (8,143 ) (1,310 ) (2,261 ) (13,371 ) (9,954 ) (10,661 ) (10,223 ) (5,369 ) (25,912 ) (70,640 ) (95,087 ) 4,019 (80,294 ) (67,757 ) 16,502 (48,125 ) (74,987 ) (6,113 ) (114,373 ) (25,113 ) 5,451 (66,568 ) (100,597 ) (25,720 ) (21,710 ) (8,339 ) — — 133,097 (5,861 ) (331,070 ) (143,696 ) 25,138 25,854 39,897 1,683 (3,424 ) 807 766 (1,801 ) (920 ) 1,413 (900 ) (978 ) (2,970 ) (3,287 ) — 26,030 16,442 38,806 (2,523 ) (32,632 ) (13,283 ) 2,483 (34,731 ) (6,463 ) (21 ) (940 ) (391 ) 1,570 (5,686 ) (23,226 ) (8,698 ) (10,783 ) (4,509 ) (7,189 ) (84,772 ) (47,872 ) $ 100,060 (676,293 ) (404,883 )
Summary of Homebuilding Data
Deliveries:
| Years Ended November 30, | ||||||||||||
| Homes | ||||||||||||
| 2010 | 2009 | 2008 | ||||||||||
East | 4,195 | 3,817 | 4,957 | |||||||||
Central | 1,682 | 1,796 | 2,442 | |||||||||
West | 2,079 | 2,480 | 4,031 | |||||||||
Houston | 1,645 | 2,150 | 2,736 | |||||||||
Other | 1,354 | 1,235 | 1,569 | |||||||||
Total | 10,955 | 11,478 | 15,735 | |||||||||
Of the total home deliveries above, 96, 56 and 391, respectively, represent deliveries from unconsolidated entities for the years ended November 30, 2010, 2009 and 2008.
| Years Ended November 30, | ||||||||||||||||||||||||
| Dollar Value (In thousands) | Average Sales Price | |||||||||||||||||||||||
| 2010 | 2009 | 2008 | 2010 | 2009 | 2008 | |||||||||||||||||||
East | $ | 922,947 | 844,689 | 1,276,454 | $ | 220,000 | 221,000 | 258,000 | ||||||||||||||||
Central | 348,486 | 361,273 | 512,957 | 207,000 | 201,000 | 210,000 | ||||||||||||||||||
West | 711,822 | 856,285 | 1,519,219 | 342,000 | 345,000 | 377,000 | ||||||||||||||||||
Houston | 357,590 | 429,127 | 542,288 | 217,000 | 200,000 | 198,000 | ||||||||||||||||||
Other | 351,447 | 331,852 | 504,336 | 260,000 | 269,000 | 321,000 | ||||||||||||||||||
Total | $ | 2,692,292 | 2,823,226 | 4,355,254 | $ | 246,000 | 246,000 | 277,000 | ||||||||||||||||
Of the total dollar value of home deliveries above, $61.0 million, $46.4 million and $204.5 million, respectively, represent the dollar value of home deliveries from unconsolidated entities for the years ended November 30, 2010, 2009 and 2008. The home deliveries from unconsolidated entities had an average sales price of $635,000, $828,000 and $523,000, respectively, for the years ended November 30, 2010, 2009 and 2008.
Sales Incentives (1):
| Years Ended November 30, | ||||||||||||
| (In thousands) | ||||||||||||
| 2010 | 2009 | 2008 | ||||||||||
East | $ | 130,170 | 190,600 | 260,118 | ||||||||
Central | 53,034 | 65,448 | 97,136 | |||||||||
West | 65,988 | 129,476 | 253,732 | |||||||||
Houston | 63,255 | 72,480 | 67,408 | |||||||||
Other | 44,040 | 54,030 | 68,124 | |||||||||
Total | $ | 356,487 | 512,034 | 746,518 | ||||||||
| Years Ended November 30, | ||||||||||||||||||||||||
| Average Sales Incentives Per Home Delivered | Sales Incentives as a % of Revenue | |||||||||||||||||||||||
| 2010 | 2009 | 2008 | 2010 | 2009 | 2008 | |||||||||||||||||||
East | $ | 31,000 | 49,900 | 53,400 | 12.3 | % | 18.4 | % | 17.2 | % | ||||||||||||||
Central | 31,500 | 36,400 | 39,800 | 13.2 | % | 15.4 | % | 15.9 | % | |||||||||||||||
West | 33,300 | 53,400 | 66,600 | 9.2 | % | 13.8 | % | 15.3 | % | |||||||||||||||
Houston | 38,500 | 33,700 | 24,600 | 15.0 | % | 14.4 | % | 11.1 | % | |||||||||||||||
Other | 32,500 | 43,800 | 45,900 | 11.1 | % | 14.0 | % | 13.6 | % | |||||||||||||||
Total | $ | 32,800 | 44,800 | 48,700 | 11.9 | % | 15.6 | % | 15.3 | % | ||||||||||||||
New Orders (2):
| Years Ended November 30, | ||||||||||||
| Homes | ||||||||||||
| 2010 | 2009 | 2008 | ||||||||||
East | 4,270 | 3,710 | 3,953 | |||||||||
Central | 1,769 | 1,840 | 2,280 | |||||||||
West | 1,922 | 2,569 | 3,396 | |||||||||
Houston | 1,641 | 2,130 | 2,416 | |||||||||
Other | 1,326 | 1,261 | 1,346 | |||||||||
Total | 10,928 | 11,510 | 13,391 | |||||||||
Of the new orders above, 90, 58 and 174, respectively, represent new orders from unconsolidated entities for the years ended November 30, 2010, 2009 and 2008.
| Years Ended November 30, | ||||||||||||||||||||||||
| Dollar Value (In thousands) | Average Sales Price | |||||||||||||||||||||||
| 2010 | 2009 | 2008 | 2010 | 2009 | 2008 | |||||||||||||||||||
East | $ | 940,311 | 820,209 | 910,749 | $ | 220,000 | 221,000 | 230,000 | ||||||||||||||||
Central | 365,667 | 373,084 | 470,721 | 207,000 | 203,000 | 206,000 | ||||||||||||||||||
West | 625,469 | 892,002 | 1,249,733 | 325,000 | 347,000 | 368,000 | ||||||||||||||||||
Houston | 355,771 | 432,380 | 471,733 | 217,000 | 203,000 | 195,000 | ||||||||||||||||||
Other | 339,393 | 328,858 | 357,718 | 256,000 | 261,000 | 266,000 | ||||||||||||||||||
Total | $ | 2,626,611 | 2,846,533 | 3,460,654 | $ | 240,000 | 247,000 | 258,000 | ||||||||||||||||
Of the total dollar value of new orders above, $55.9 million, $41.5 million and $97.5 million, respectively, represent the dollar value of new orders from unconsolidated entities for the years ended November 30, 2010, 2009 and 2008. The new orders from unconsolidated entities had an average sales price of $621,000, $716,000 and $560,000, respectively, for the years ended November 30, 2010, 2009 and 2008.
Backlog:
| November 30, | ||||||||||||
| Homes | ||||||||||||
| 2010 | 2009 | 2008 | ||||||||||
East | 757 | 682 | 787 | |||||||||
Central | 254 | 167 | 123 | |||||||||
West | 179 | 336 | 247 | |||||||||
Houston | 245 | 249 | 269 | |||||||||
Other | 169 | 197 | 173 | |||||||||
Total | 1,604 | 1,631 | 1,599 | |||||||||
Of the total homes in backlog above, 3 homes, 9 homes and 8 homes, respectively, represent homes in backlog from unconsolidated entities at November 30, 2010, 2009 and 2008.
| November 30, | ||||||||||||||||||||||||
| Dollar Value (In thousands) | Average Sales Price | |||||||||||||||||||||||
| 2010 | 2009 | 2008 | 2010 | 2009 | 2008 | |||||||||||||||||||
East | $ | 190,095 | 179,175 | 202,791 | 251,000 | 263,000 | 258,000 | |||||||||||||||||
Central | 52,923 | 36,158 | 23,736 | 208,000 | 217,000 | 193,000 | ||||||||||||||||||
West | 58,072 | 143,868 | 108,779 | 324,000 | 428,000 | 440,000 | ||||||||||||||||||
Houston | 58,822 | 60,876 | 57,785 | 240,000 | 244,000 | 215,000 | ||||||||||||||||||
Other | 47,380 | 59,494 | 63,179 | 280,000 | 302,000 | 365,000 | ||||||||||||||||||
Total | $ | 407,292 | 479,571 | 456,270 | 254,000 | 294,000 | 285,000 | |||||||||||||||||
Of the total dollar value of homes in backlog above, $2.1 million, $7.2 million and $12.5 million, respectively, represent the dollar value of homes in backlog from unconsolidated entities at November 30, 2010, 2009 and 2008. The homes in backlog from unconsolidated entities had an average sales price of $716,000, $804,000 and $1,558,000, respectively, at November 30, 2010, 2009 and 2008.
Backlog represents the number of homes under sales contracts. Homes are sold using sales contracts, which are generally accompanied by sales deposits. In some instances, purchasers are permitted to cancel sales if they fail to qualify for financing or under certain other circumstances. We experienced cancellation rates in our homebuilding segments and Homebuilding Other as follows:
| Years Ended November 30, | ||||||||||||
| 2010 | 2009 | 2008 | ||||||||||
Cancellation Rates | ||||||||||||
East | 16 | % | 22 | % | 31 | % | ||||||
Central | 18 | % | 17 | % | 22 | % | ||||||
West | 18 | % | 15 | % | 24 | % | ||||||
Houston | 18 | % | 19 | % | 27 | % | ||||||
Other | 18 | % | 16 | % | 23 | % | ||||||
Total | 17 | % | 18 | % | 26 | % | ||||||
During the fourth quarter of 2010, our cancellation rate was 20%. Our cancellation rate during 2010 was consistent with 2009. We do not recognize revenue on homes under sales contracts until the sales are closed and title passes to the new homeowners.
2010 versus 2009
East: Homebuilding revenues increased in 2010, compared to 2009, primarily due to an increase in the number of home deliveries in all of the states in this segment, except New Jersey. Gross margins on home sales were $232.4 million, or 25.2%, in 2010 including valuation adjustments of $10.4 million, compared to gross margins on home sales of $36.2 million, or 4.3%, in 2009 including $73.7 million of valuation adjustments. Gross margins on home sales excluding valuation adjustments were $242.8 million, or 26.3%, in 2010, compared to $109.8 million, or 13.0%, in 2009. Gross margin percentage on home sales, excluding valuation adjustments, improved compared to last year primarily due to reduced sales incentives offered to homebuyers as a percentage of revenues from home sales (12.3% in 2010 and 18.4% in 2009) and third-party recoveries related to Chinese drywall.
Gross profits on land sales were $1.0 million in 2010 (net of $2.7 million of write-offs of deposits and pre-acquisition costs related to land under option that we do not intend to purchase and $0.1 million of valuation adjustments), compared to losses on land sales of $93.0 million in 2009 (including $64.1 million of write-offs of deposits and pre-acquisition costs related to land under option that we do not intend to purchase and $37.0 million of valuation adjustments).
Central: Homebuilding revenues decreased in 2010, compared to 2009, primarily due to a decrease in the number of home deliveries in all of the states in this segment, except Colorado. Gross margins on home sales were $44.2 million, or 12.7%, in 2010 including valuation adjustments of $9.2 million, compared to gross margins on home sales of $29.2 million, or 8.1%, in 2009 including $13.6 million of valuation adjustments. Gross margins on home sales excluding valuation adjustments were $53.4 million, or 15.3%, in 2010, compared to $42.8 million, or 11.9%, in 2009. Gross margin percentage on home sales, excluding valuation adjustments, improved compared to last year primarily due to reduced sales incentives offered to homebuyers as a percentage of revenues from home sales (13.2% in 2010 and 15.4% in 2009).
Loss on land sales were $0.4 million in 2010 (including $2.1 million of valuation adjustments), compared to gross profits on land sales of $0.4 million in 2009 (net of $0.1 million of write-offs of deposits and pre-acquisition costs related to land under option that we do not intend to purchase and $1.3 million of valuation adjustments).
West: Homebuilding revenues decreased in 2010, compared to 2009, primarily due to a decrease in the number of home deliveries and average sales price of homes delivered in all of the states in this segment. Gross margins on home sales were $125.5 million, or 19.3%, in 2010 including valuation adjustments of $7.1 million, compared to gross margins on home sales of $92.8 million, or 11.5%, in 2009 including $64.1 million of valuation adjustments. Gross margins on home sales excluding valuation adjustments were $132.7 million, or 20.4%, in 2010, compared to $156.9 million, or 19.4%, in 2009. Gross margin percentage on home sales, excluding valuation adjustments, improved compared to last year primarily due to reduced sales incentives offered to homebuyers as a percentage of revenues from home sales (9.2% in 2010, compared to 13.8% in 2009).
Gross profits on land sales were $16.5 million in 2010, primarily due to the reduction of an obligation related to a profit participation agreement. Gross profits on land sales were net of $0.4 million of write-offs of deposits and pre-acquisition costs related to land under option that we do not intend to purchase and $1.2 million of valuation adjustments. Losses on land sales were $48.1 million in 2009 (including $13.9 million of write-offs of deposits and pre-acquisition costs related to land under option that we do not intend to purchase and $38.7 million of valuation adjustments).
Houston: Homebuilding revenues decreased in 2010, compared to 2009, primarily due to a decrease in the number of home deliveries in this segment. Gross margins on home sales were $68.1 million, or 19.0%, in 2010 including valuation adjustments of $0.2 million, compared to gross margins on home sales of $75.3 million, or 17.5%, in 2009 including $1.1 million of valuation adjustments. Gross margins on home sales excluding valuation adjustments were $68.3 million, or 19.1%, in 2010, compared to $76.4 million, or 17.8%, in 2009. Gross margin percentage on home sales, excluding valuation adjustments, improved compared to last year primarily due to an increase in average sales price.
Gross profits on land sales were $1.7 million in 2010, compared to losses on land sales of $3.4 million in 2009 (including $2.5 million of write-offs of deposits and pre-acquisition costs related to land under option that we do not intend to purchase and $0.7 million of valuation adjustments).
Other: Homebuilding revenues increased in 2010, compared to 2009, primarily due to an increase in the number of home deliveries in all of the states in Homebuilding Other except Illinois. Gross margins on home sales were $47.8 million, or 13.6% in 2010 including valuation adjustments of $17.7 million, compared to gross margins on home sales of $18.5 million, or 5.6%, in 2009 including $27.8 million of valuation adjustments. Gross margins on home sales excluding valuation adjustments were $65.5 million, or 18.6%, in 2010, compared to $46.2 million, or 14.0%, in 2009. Gross margin percentage on home sales, excluding valuation adjustments, improved compared to last year primarily due to reduced sales incentives offered to homebuyers as a percentage of revenues from home sales (11.1% in 2010, compared to 14.0% in 2009).
Gross profits on land sales were $2.5 million in 2010, compared to losses on land sales of $34.7 million in 2009 (including $3.8 million of write-offs of deposits and pre-acquisition costs related to land under option that we do not intend to purchase and $31.2 million of valuation adjustments).
2009 versus 2008
East: Homebuilding revenues decreased in 2009, compared to 2008, primarily due to a decrease in the number of home deliveries and in the average sales price of homes delivered in all of the states in this segment. Gross margins on home sales were $36.2 million, or 4.3%, in 2009 including valuation adjustments of $73.7 million, compared to gross margins on home sales of $164.5 million, or 13.1%, in 2008 including $76.8 million of valuation adjustments. Gross margins on home sales excluding valuation adjustments were $109.8 million, or 13.0%, in 2009, compared to $241.3 million, or 19.3%, in 2008. Gross margin percentage on home sales, excluding valuation adjustments, decreased compared to 2008 due to reduced pricing and higher sales incentives offered to homebuyers as a percentage of revenues from home sales (18.4% in 2009 and 17.2% in 2008).
Losses on land sales were $93.0 million in 2009 (including $64.1 million of write-offs of deposits and pre-acquisition costs related to land under option that we do not intend to purchase and $37.0 million of valuation adjustments), compared to losses on land sales of $41.2 million in 2008 (including $19.0 million of write-offs of deposits and pre-acquisition costs related to land under option that we do not intend to purchase and $23.3 million of valuation adjustments).
Central: Homebuilding revenues decreased in 2009, compared to 2008, primarily due to a decrease in the number of home deliveries in all of the states in this segment and a decrease in the average sales price of homes delivered in Arizona, partially offset by a slight increase in the average selling price in Colorado and Texas, excluding Houston. Gross margins on home sales were $29.2 million, or 8.1%, in 2009 including valuation adjustments of $13.6 million, compared to gross margins on home sales of $31.8 million, or 6.2%, in 2008 including $28.1 million of valuation adjustments. Gross margins on home sales excluding valuation adjustments were $42.8 million, or 11.9%, in 2009, compared to $59.9 million, or 11.7%, in 2008. Sales incentives offered to homebuyers as a percentage of revenues from home sales were 15.4% in 2009 and 15.9% in 2008.
Gross profits on land sales were $0.4 million in 2009 (net of $0.1 million of write-offs of deposits and pre-acquisition costs related to land under option that we do not intend to purchase and $1.3 million of valuation
adjustments), compared to losses on land sales of $11.3 million in 2008 (including $6.0 million of write-offs of deposits and pre-acquisition costs related to land under option that we do not intend to purchase and $12.4 million of valuation adjustments).
West: Homebuilding revenues decreased in 2009, compared to 2008, primarily due to a decrease in the number of home deliveries and average sales price of homes delivered in all of the states in this segment. Gross margins on home sales were $92.8 million, or 11.5%, in 2009 including valuation adjustments of $64.1 million, compared to gross margins on home sales of $154.1 million, or 10.9%, in 2008 including $75.6 million of valuation adjustments. Gross margins on home sales excluding valuation adjustments were $156.9 million, or 19.4%, in 2009, compared to $229.7 million, or 16.3%, in 2008. Gross margin percentage on home sales, excluding valuation adjustments, increased compared to 2008 primarily due to a decrease of sales incentives offered to homebuyers as a percentage of home sales revenues (13.8% in 2009, compared to 15.3% in 2008).
Losses on land sales were $48.1 million in 2009 (including $13.9 million of write-offs of deposits and pre-acquisition costs related to land under option that we do not intend to purchase and $38.7 million of valuation adjustments), compared to losses on land sales of $75.0 million in 2008 (including $62.4 million of write-offs of deposits and pre-acquisition costs related to land under option that we do not intend to purchase and $11.1 million of valuation adjustments).
Houston: Homebuilding revenues decreased in 2009, compared to 2008, primarily due to a decrease in the number of home deliveries in this segment. Gross margins on home sales were $75.3 million, or 17.5%, in 2009 including valuation adjustments of $1.1 million, compared to gross margins on home sales of $103.9 million, or 19.2%, in 2008 including $2.3 million of valuation adjustments. Gross margins on home sales excluding valuation adjustments were $76.4 million, or 17.8%, in 2009, compared to $106.2 million, or 19.6%, in 2008. Gross margin percentage on home sales, excluding valuation adjustments, decreased compared to 2008 primarily due to higher sales incentives offered to homebuyers as a percentage of revenues from home sales (14.4% in 2009, compared to 11.1% in 2008).
Losses on land sales were $3.4 million in 2009 (including $2.5 million of write-offs of deposits and pre-acquisition costs related to land under option that we do not intend to purchase and $0.7 million of valuation adjustments), compared to gross profits on land sales of $0.8 million in 2008 (net of $0.7 million of write-offs of deposits and pre-acquisition costs related to land under option that we do not intend to purchase and $0.1 million of valuation adjustments).
Other: Homebuilding revenues decreased in 2009, compared to 2008, primarily due to a decrease in the number of home deliveries in all of the states in Homebuilding Other except in North and South Carolina combined, and a decrease in the average sales price of homes delivered in North and South Carolina combined and Minnesota. Gross margins on home sales were $18.5 million, or 5.6% in 2009 including valuation adjustments of $27.8 million, compared to gross margins on home sales of $55.3 million, or 12.7%, in 2008 including $12.7 million of valuation adjustments. Gross margins on home sales excluding valuation adjustments were $46.2 million, or 14.0%, in 2009, compared to $68.0 million, or 15.7%, in 2008. Gross margin percentage on home sales, excluding valuation adjustments, decreased compared to 2008 due to reduced pricing and higher sales incentives offered to homebuyers as a percentage of revenues from home sales (14.0% in 2009, compared to 13.6% in 2008).
Losses on land sales were $34.7 million in 2009 (including $3.8 million of write-offs of deposits and pre-acquisition costs related to land under option that we do not intend to purchase and $31.2 million of valuation adjustments), compared to losses on land sales of $6.5 million in 2008 (including $9.0 million of write-offs of deposits and pre-acquisition costs related to land under option that we do not intend to purchase and $0.9 million of valuation adjustments).
Gross margins on home sales excluding valuation adjustments is a non-GAAP financial measure that is discussed previously under “Non-GAAP Financial Measure.” The table set forth below reconciles our gross margins on home sales excluding valuation adjustments for the years ended November 30, 2010, 2009 and 2008 for each of our reportable homebuilding segments and Homebuilding Other to our gross margins on home sales for the three respective years:
| Years Ended November 30, | ||||||||||||
| 2010 | 2009 | 2008 | ||||||||||
| (In thousands) | ||||||||||||
East: | ||||||||||||
Sales of homes | $ | 922,947 | 844,689 | 1,252,725 | ||||||||
Cost of homes sold | 690,584 | 808,528 | 1,088,229 | |||||||||
Gross margins on home sales | 232,363 | 36,161 | 164,496 | |||||||||
Valuation adjustments to finished homes, CIP and land on which we intend to build homes | 10,410 | 73,670 | 76,791 | |||||||||
Gross margins on homes sales excluding valuation adjustments | 242,773 | 109,831 | 241,287 | |||||||||
Central: | ||||||||||||
Sales of homes | 348,486 | 361,273 | 512,957 | |||||||||
Cost of homes sold | 304,329 | 332,040 | 481,176 | |||||||||
Gross margins on home sales | 44,157 | 29,233 | 31,781 | |||||||||
Valuation adjustments to finished homes, CIP and land on which we intend to build homes | 9,205 | 13,603 | 28,142 | |||||||||
Gross margins on homes sales excluding valuation adjustments | 53,362 | 42,836 | 59,923 | |||||||||
West: | ||||||||||||
Sales of homes | 650,844 | 810,459 | 1,408,051 | |||||||||
Cost of homes sold | 525,310 | 717,631 | 1,253,952 | |||||||||
Gross margins on home sales | 125,534 | 92,828 | 154,099 | |||||||||
Valuation adjustments to finished homes, CIP and land on which we intend to build homes | 7,139 | 64,095 | 75,614 | |||||||||
Gross margins on homes sales excluding valuation adjustments | 132,673 | 156,923 | 229,713 | |||||||||
Houston: | ||||||||||||
Sales of homes | 357,590 | 429,127 | 542,288 | |||||||||
Cost of homes sold | 289,474 | 353,838 | 438,368 | |||||||||
Gross margins on home sales | 68,116 | 75,289 | 103,920 | |||||||||
Valuation adjustments to finished homes, CIP and land on which we intend to build homes | 219 | 1,116 | 2,262 | |||||||||
Gross margins on homes sales excluding valuation adjustments | 68,335 | 76,405 | 106,182 | |||||||||
Other: | ||||||||||||
Sales of homes | 351,447 | 331,302 | 434,696 | |||||||||
Cost of homes sold | 303,696 | 312,813 | 379,365 | |||||||||
Gross margins on home sales | 47,751 | 18,489 | 55,331 | |||||||||
Valuation adjustments to finished homes, CIP and land on which we intend to build homes | 17,744 | 27,755 | 12,709 | |||||||||
Gross margins on homes sales excluding valuation adjustments | 65,495 | 46,244 | 68,040 | |||||||||
Total gross margins on home sales | $ | 517,921 | 252,000 | 509,627 | ||||||||
Total valuation adjustments | $ | 44,717 | 180,239 | 195,518 | ||||||||
Total gross margins on home sales excluding valuation adjustments | $ | 562,638 | 432,239 | 705,145 | ||||||||
Lennar Financial Services Segment
We have one Lennar Financial Services reportable segment that provides primarily mortgage financing, title insurance and closing services for both buyers of our homes and others. Substantially all of the loans the Lennar Financial Services segment originates are sold within a short period in the secondary mortgage market on a servicing released, non-recourse basis. After the loans are sold, we retain potential liability for possible claims by purchasers that we breached certain limited industry-standard representations and warranties in the loan sale agreements. The following table sets forth selected financial and operational information relating to the Lennar Financial Services segment:
| Years Ended November 30, | ||||||||||||
| 2010 | 2009 | 2008 | ||||||||||
| (Dollars in thousands) | ||||||||||||
Revenues | $ | 275,786 | 285,102 | 312,379 | ||||||||
Costs and expenses (1) | 244,502 | 249,120 | 343,369 | |||||||||
Operating earnings (loss) (1) | $ | 31,284 | 35,982 | (30,990 | ) | |||||||
Dollar value of mortgages originated | $ | 3,272,000 | 4,020,000 | 4,290,000 | ||||||||
Number of mortgages originated | 15,200 | 17,900 | 18,300 | |||||||||
Mortgage capture rate of Lennar homebuyers | 85 | % | 87 | % | 85 | % | ||||||
Number of title and closing service transactions | 102,500 | 120,500 | 105,900 | |||||||||
Number of title policies issued | 107,600 | 92,500 | 96,700 | |||||||||
Rialto Investments Segment
Our Rialto segment is a new reportable segment that met the reportable segment criteria set forth in GAAP beginning in fiscal 2010. All prior year segment information has been restated to conform with the 2010 presentation. The change had no effect on the Company’s consolidated financial statements, except for certain reclassifications. Rialto’s objective is to generate superior, risk-adjusted returns by focusing on commercial and residential real estate opportunities arising from dislocations in the United States real estate markets and the eventual restructure and recapitalization of those markets. Rialto believes it will be able to deliver these returns through its abilities to source, underwrite, price, manage and ultimately monetize real estate assets, as well as providing similar services to others in markets across the country.
The following table presents the results of operations of our Rialto segment for the periods indicated:
| Years Ended November 30, | ||||||||
| 2010 | 2009 | |||||||
| (In thousands) | ||||||||
Revenues | $ | 92,597 | — | |||||
Costs and expenses | 67,904 | 2,528 | ||||||
Rialto Investments equity in earnings from unconsolidated entities | 15,363 | — | ||||||
Rialto Investments other income, net | 17,251 | — | ||||||
Operating earnings (loss) (1) | $ | 57,307 | (2,528 | ) | ||||
Distressed Asset Portfolios
In February 2010, the Rialto segment acquired indirectly 40% managing member equity interests in two limited liability companies (“LLCs”), in partnership with the FDIC, for approximately $243 million (net of transactions costs and a $22 million working capital reserve). The LLCs hold performing and non-performing loans formerly owned by 22 failed financial institutions. The two portfolios originally consisted of more than 5,500 distressed residential and commercial real estate loans with an aggregate unpaid principal balance of approximately $3 billion and an initial fair value of approximately $1.2 billion. The FDIC retained a 60% equity
interest in the LLCs and provided $626.9 million of notes with 0% interest, which are non-recourse to us. In accordance with GAAP, interest has not been imputed because the notes are with, and guaranteed by, a governmental agency. The notes are secured by the loans held by the LLCs. Additionally, if the LLCs exceed expectations and meet certain internal rate of return and distribution thresholds, our equity interest in the LLCs could be reduced from 40% down to 30%, with a corresponding increase to the FDIC’s equity interest from 60% up to 70%. Although our equity interest could decrease, we believe we would most likely yield a higher return on our investment if the thresholds are met. As of November 30, 2010, the notes payable balance was $626.9 million; however, during the year ended November 30, 2010, $101.3 million of cash collections on loans in excess of expenses were deposited in a defeasance account, established for the repayment of the notes payable, under the agreement with the FDIC. The funds in the defeasance account will be used to retire the notes payable upon their maturity.
The LLCs met the accounting definition of variable interest entities (“VIEs”) and since we were determined to be the primary beneficiary, we consolidated the LLCs. We determined that we were the primary beneficiary because we have the power to direct the activities of the LLCs that most significantly impact the LLCs’ economic performance through our management and servicer contracts. At November 30, 2010, these consolidated LLCs had total combined assets and liabilities of $1.4 billion and $0.6 billion, respectively.
In September 2010, the Rialto segment completed the acquisitions of over $700 million of distressed real estate assets, in separate transactions, from three financial institutions. The combined portfolio includes approximately 400 loans with a total aggregate unpaid principal balance of over $500 million and over 300 real estate owned (“REO”) properties with an original appraised value of approximately $200 million. We paid $310 million for the distressed real estate assets of which $125 million was financed through a 5-year senior unsecured note provided by one of the selling institutions.
The loans consist primarily of non-performing residential and commercial acquisition development and construction loans. The largest concentration of collateral for these loans is finished/partially-finished homesites, undeveloped land and completed/partially-completed homes. The real estate properties primarily consist of land, homesites, and single-family and multi-family residential communities at varying stages of completion. In the combined portfolio, 65% of the assets are residential and 35% are commercial. The acquired assets are located in 17 states, primarily in the Mid-Atlantic and Southeast regions of the United States with the largest concentration of assets in Florida, Georgia and North Carolina.
Investments
An affiliate in the Rialto segment is a sub-advisor to the AB PPIP fund and receives management fees for sub-advisory services. During the year ended November 30, 2010, we invested $63.8 million, in the AB PPIP fund. As of November 30, 2010, the carrying value of our investment in the AB PPIP fund was $77.3 million.
In November 2010, the Rialto segment completed the closing of its Fund with initial equity commitments of approximately $300 million (including $75 million committed by us). The Fund’s objective during its three-year investment period is to invest in distressed real estate assets and other related investments that fit within the Fund’s investment parameters. In addition, the Rialto segment also invested in approximately $43 million of non-investment grade commercial mortgage-backed securities (“CMBS”) for $19.4 million, representing a 55% discount to par value.
We have grouped these investments in the Rialto segment, along with our $7.3 million, or approximately 5%, investment in a service and infrastructure provider to the residential home loan market (the “Service Provider”), which provides services to the LLCs.
Financial Condition and Capital Resources
At November 30, 2010, we had cash and cash equivalents related to our homebuilding, financial services and Rialto operations of $1.4 billion, compared to $1.5 billion and $1.2 billion, respectively, at November 30, 2009 and 2008.
We finance our land acquisition and development activities, construction activities, financial services activities, Rialto activities and general operating needs primarily with cash generated from our operations, debt issuances and equity offerings, as well as cash borrowed under our warehouse lines of credit.
Operating Cash Flow Activities
During 2010 and 2009, cash provided by operating activities totaled $274.2 million and $420.8 million, respectively. During 2010, cash provided by operating activities was positively impacted by the receipt of tax refunds of $343.0 million generated primarily from losses incurred prior to fiscal 2010 and our net earnings. This was partially offset by a net increase in inventories of $115.2 million, primarily due to a higher level of land purchases in strategic markets during the year ended November 30, 2010 and a decrease in accounts payable and other liabilities.
During 2009, cash provided by operating activities was positively impacted by a decrease in inventories as a result of reducing completed, unsold inventory, a reduction in construction in progress resulting from lower new home starts in early 2009 and write-offs and valuation adjustments pertaining to the respective inventory, which was partially offset by land acquisitions. Cash provided by operating activities was partially offset by our net loss, a decrease in accounts payable and other liabilities and an increase in our receivables as a result of an increase in our income tax receivables primarily due to a change in tax legislation, which allowed us to carryback our fiscal year 2009 tax loss to recover previously paid income taxes.
Investing Cash Flow Activities
During 2010 and 2009, cash used in investing activities totaled $673.4 million and $275.1 million, respectively. During the year ended November 30, 2010, our Rialto segment contributed $243 million of cash (net of $22 million working capital reserve) to acquire indirectly 40% managing member interests in two LLCs in partnership with the FDIC. Upon consolidation of the LLCs that hold the two portfolios of real estate loans acquired in the FDIC transaction, the Company consolidated $93.7 million of cash, resulting in net contributions to consolidated entities by the Rialto segment of $171.4 million during the year ended November 30, 2010. In addition, during 2010 cash collections of $101.3 million on loans in excess of expenses were deposited in a defeasance account established for the repayment of the notes payable under the agreement with the FDIC. In September 2010, our Rialto segment used $183.4 million of cash to acquire portfolios of distressed loans and real estate assets, in separate transactions, from three financial institutions. The Rialto segment also contributed $64.3 million of cash to unconsolidated entities related primarily to the AB PPIP fund.
Additionally, during 2010 we contributed $209.3 million of cash to Lennar Homebuilding unconsolidated entities of which $113.5 million was to retire and extend debt of the Lennar Homebuilding unconsolidated entities thereby decreasing leverage at the Lennar Homebuilding unconsolidated entities and $95.8 million was for working capital. Specifically, we contributed $69.6 million to one Lennar Homebuilding unconsolidated entity of which $50.3 million was a loan paydown, representing both our and our partner’s share, in return for a 4-year loan extension and the rights to obtain preferred returns and priority distributions at that unconsolidated entity. We also made a $19.3 million payment to extinguish debt at a discount and buy out the partner of a Lennar Homebuilding unconsolidated entity resulting in a net pre-tax gain of $7.7 million.
During the year ended November 30, 2009, we contributed $316.1 million of cash to Lennar Homebuilding unconsolidated entities of which $94.5 million related to our investment in the reorganized Newhall, as well as the purchase of equity interests in other joint ventures previously owned by LandSource.
We are always evaluating the possibility of acquiring homebuilders and other companies. However, at November 30, 2010, we had no agreements or understandings regarding any significant transactions.
Financing Cash Flow Activities
During 2010 and 2009, our cash provided by financing activities was primarily attributed to the issuance of new debt, partially offset by the redemption of senior notes and principal payments on other borrowings.
During 2010 and 2009, we exercised certain land option contracts from a land investment venture that we sold land to in 2007, reducing the liabilities reflected on our consolidated balance sheet related to consolidated inventory not owned by $39.3 million and $33.7 million, respectively. Due to our continuing involvement, the transaction did not qualify as a sale under GAAP; thus, the inventory remained on our balance sheet in consolidated inventory not owned.
Debt to total capital ratios are financial measures commonly used in the homebuilding industry and are presented to assist in understanding the leverage of our Lennar Homebuilding operations. Management believes providing a measure of leverage of our Lennar Homebuilding operations enables management and readers of our financial statements to better understand our financial position and performance. Lennar Homebuilding debt to total capital and net Lennar Homebuilding debt to total capital are calculated as follows:
| November 30, | ||||||||
| 2010 | 2009 | |||||||
| (Dollars in thousands) | ||||||||
Lennar Homebuilding debt | $ | 3,128,154 | 2,761,352 | |||||
Total stockholders’ equity | 2,608,949 | 2,443,479 | ||||||
Total capital | $ | 5,737,103 | 5,204,831 | |||||
Lennar Homebuilding debt to total capital | 54.5 | % | 53.1 | % | ||||
Lennar Homebuilding debt | $ | 3,128,154 | 2,761,352 | |||||
Less: Lennar Homebuilding cash and cash equivalents | 1,207,247 | 1,330,603 | ||||||
Net Lennar Homebuilding debt | $ | 1,920,907 | 1,430,749 | |||||
Net Lennar Homebuilding debt to total capital (1) | 42.4 | % | 36.9 | % | ||||
At November 30, 2010, net Lennar Homebuilding debt to total capital was higher compared to prior year primarily due to the increase in Lennar Homebuilding debt as a result of an increase in senior notes and other debts payable and a decrease in Lennar Homebuilding cash and cash equivalents, partially offset by an increase in stockholders’ equity.
In addition to the use of capital in our homebuilding, financial services and Rialto operations, we actively evaluate various other uses of capital, which fit into our homebuilding, financial services and Rialto strategies and appear to meet our profitability and return on capital goals. This may include acquisitions of, or investments in, other entities, the payment of dividends or repurchases of our outstanding common stock or debt. These activities may be funded through any combination of our warehouse lines of credit, cash generated from operations, sales of assets or the issuance into capital markets of debt, common stock or preferred stock.
The following table summarizes our Lennar Homebuilding senior notes and other debts payable:
| November 30, | ||||||||
| 2010 | 2009 | |||||||
| (Dollars in thousands) | ||||||||
5.95% senior notes due 2011 | 113,189 | 244,727 | ||||||
5.95% senior notes due 2013 | 266,319 | 347,471 | ||||||
5.50% senior notes due 2014 | 248,657 | 248,365 | ||||||
5.60% senior notes due 2015 | 501,216 | 501,424 | ||||||
6.50% senior notes due 2016 | 249,788 | 249,760 | ||||||
12.25% senior notes due 2017 | 393,031 | 392,392 | �� | |||||
6.95% senior notes due 2018 | 247,323 | — | ||||||
2.00% convertible senior notes due 2020 | 276,500 | — | ||||||
2.75% convertible senior notes due 2020 | 375,875 | — | ||||||
5.125% senior notes due 2010 | — | 249,955 | ||||||
Mortgage notes on land and other debt | 456,256 | 527,258 | ||||||
| $ | 3,128,154 | 2,761,352 | ||||||
Our Lennar Homebuilding average debt outstanding was $2.8 billion in 2010, compared to $2.6 billion in 2009. The average rate for interest incurred was 6.1% and 6.0%, respectively in 2010 and 2009. Interest incurred related to Lennar Homebuilding debt for the year ended November 30, 2010 was $181.5 million, compared to $172.1 million in 2009. The majority of our short-term financing needs, including financings for land acquisition and development activities and general operating needs, are met with cash generated from operations and proceeds of debt issuances.
In November 2010, we issued $446.0 million of 2.75% convertible senior notes due 2020 (the “2.75% Convertible Senior Notes”) at a price of 100% in a private placement. Proceeds from the offering, after payment of expenses, were $436.4 million. The net proceeds are being used for general corporate purposes, including repayments or repurchases of existing senior notes or other indebtedness. The 2.75% Convertible Senior Notes are convertible into cash, shares of Class A common stock or a combination of both, at our election. However, it is our intent to settle the face value of the 2.75% Convertible Senior Notes in cash. Holders may convert the 2.75% Convertible Senior Notes at the initial conversion rate of 45.1794 shares of common stock per $1,000 principal amount or 20,150,012 Class A common shares if all the 2.75% Convertible Senior Notes are converted, which is equivalent to an initial conversion price of approximately $22.13 per share of Class A common stock, subject to anti-dilution adjustments. The shares are not included in the calculation of diluted earnings per share primarily because it is our intent to settle the face value of the 2.75% Convertible Senior Notes in cash and our stock price does not exceed the conversion price.
Holders of the 2.75% Convertible Senior Notes will have the right to convert them, if during any fiscal quarter commencing after the fiscal quarter ended on November 30, 2010 (and only during such fiscal quarter), if the last reported sale price of our Class A common stock for at least 20 trading days (whether or not consecutive) during a period of 30 consecutive trading days ending on the last trading day of the immediately preceding fiscal quarter is greater than or equal to 130% of the conversion price on each applicable trading day. Holders of the 2.75% Convertible Senior Notes will have the right to require us to repurchase them for cash equal to 100% of their principal amount, plus accrued but unpaid interest, on December 15, 2015. We will have the right to redeem the 2.75% Convertible Senior Notes at any time on or after December 20, 2015 for 100% of their principal amount, plus accrued but unpaid interest. Interest on the 2.75% Convertible Senior Notes is due semi-annually beginning June 15, 2011. Beginning with the period commencing December 20, 2015, under certain circumstances based on the average trading price of the 2.75% Convertible Senior Notes, we may be required to pay contingent interest. The 2.75% Convertible Senior Notes are unsecured and unsubordinated, and currently are guaranteed by substantially all of our wholly-owned subsidiaries.
Certain provisions under ASC Topic 470,Debt, require the issuer of convertible debt instruments that may be settled in cash on conversion to separately account for the liability and equity components of the instrument in a manner that reflects the issuer’s non-convertible debt borrowing rate. We have applied these provisions related to our 2.75% Convertible Senior Notes. We estimated the fair value of the 2.75% Convertible Senior Notes using similar debt instruments at issuance that did not have a conversion feature and allocated the residual fair value to an equity component that represents the estimated fair value of the conversion feature at issuance. The debt discount of the 2.75% Convertible Senior Notes is being amortized over five years and the annual effective interest is 7.1% after giving effect to the amortization of the discount and deferred financing costs. At November 30, 2010, the principal amount of the 2.75% Convertible Senior Notes was $446.0 million, the unamortized discount included in stockholders’ equity was $70.1 million and the net carrying amount of the 2.75% Convertible Senior Notes was $375.9 million. The carrying amount of the equity component of the 2.75% Convertible Senior Notes was $71.2 million at November 30, 2010. During the year ended November 30, 2010, the amount of interest recognized relating to both the contractual interest and amortization of the discount was $1.7 million.
In May 2010, we issued $250 million of 6.95% senior notes due 2018 (the “6.95% Senior Notes”) at a price of 98.929% in a private placement. Proceeds from the offering, after payment of initial purchaser’s discount and expenses, were $243.9 million. We used the net proceeds of the sale of the 6.95% Senior Notes to fund purchases pursuant to our tender offer for our 5.125% senior notes due October 2010, our 5.95% senior notes due 2011 and our 5.95% senior notes due 2013. Interest on the 6.95% Senior Notes is due semi-annually beginning December 1, 2010. The 6.95% Senior Notes are unsecured and unsubordinated, and currently are guaranteed by substantially all of our wholly-owned subsidiaries. Subsequently, most of the privately placed 6.95% Senior Notes were exchanged for substantially identical 6.95% senior notes that had been registered under the Securities Act of 1933. At November 30, 2010, the carrying amount of the 6.95% Senior Notes was $247.3 million.
In May 2010, we also issued $276.5 million of 2.00% convertible senior notes due 2020 (the “2.00% Convertible Senior Notes”) at a price of 100% in a private placement. Proceeds from the offering, after payment of expenses, were $271.2 million. The net proceeds are being used for general corporate purposes, including repayments or repurchases of existing senior notes or other indebtedness. The 2.00% Convertible Senior Notes are convertible into shares of Class A common stock at the initial conversion rate of 36.1827 shares of common stock per $1,000 principal amount of the 2.00% Convertible Senior Notes or 10,004,517 Class A common shares if all the 2.00% Convertible Senior Notes are converted, which is equivalent to an initial conversion price of approximately $27.64 per share of Class A common stock, subject to anti-dilution adjustments. The shares are
included in the calculation of diluted earnings per share. Holders of the 2.00% Convertible Senior Notes will have the right to require us to repurchase them for cash equal to 100% of their principal amount, plus accrued but unpaid interest, on each of December 1, 2013 and December 1, 2015. We will have the right to redeem the 2.00% Convertible Senior Notes at any time on or after December 1, 2013 for 100% of their principal amount, plus accrued but unpaid interest. Interest on the 2.00% Convertible Senior Notes is due semi-annually beginning December 1, 2010. Beginning with the six-month interest period commencing December 1, 2013, under certain circumstances based on the average trading price of the 2.00% Convertible Senior Notes, we may be required to pay contingent interest. The 2.00% Convertible Senior Notes are unsecured and unsubordinated, and are currently guaranteed by substantially all of our wholly-owned subsidiaries. At November 30, 2010, the carrying amount of the 2.00% Convertible Senior Notes was $276.5 million.
In May 2010, we repurchased $289.4 million aggregate principal amount of our senior notes due 2010, 2011 and 2013 through a tender offer, resulting in a pre-tax loss of $10.8 million. Through the tender offer, we repurchased $76.4 million principal amount of our 5.125% senior notes due October 2010, $130.8 million principal amount of our 5.95% senior notes due 2011 and $82.3 million principal amount of our 5.95% senior notes due 2013.
During the years ended November 30, 2010 and 2009, we redeemed $150.8 million (including the amount redeemed through the tender offer) and $50.0 million, respectively, of our 5.125% senior notes due October 2010. In October 2010, we retired the remaining $99.2 million of our 5.125% senior notes due October 2010 for 100% of the outstanding principal amount plus accrued and unpaid interest as of the maturity date.
During the years ended November 30, 2010 and 2009, we redeemed $131.8 million (including the amount redeemed through the tender offer) and $5.0 million, respectively, of our 5.95% senior notes due 2011. At November 30, 2010 and 2009, the carrying amount of our 5.95% senior notes due 2011 was $113.2 million and $244.7 million, respectively.
During the year ended November 30, 2010, we redeemed $82.3 million (including the amount redeemed through the tender offer) of our 5.95% senior notes due 2013. At November 30, 2010 and 2009, the carrying amount of our 5.95% senior notes due 2013 was $266.3 million and $347.5 million, respectively.
Currently, substantially all of our wholly-owned subsidiaries are guaranteeing all our Senior Notes (the “Guaranteed Notes”). The guarantees are full and unconditional. The principal reason our wholly-owned subsidiaries guaranteed the Guaranteed Notes is so holders of the Guaranteed Notes will have rights at least as great with regard to our subsidiaries as any other holders of a material amount of our unsecured debt. Therefore, the guarantees of the Guaranteed Notes will remain in effect only while the guarantor subsidiaries guarantee a material amount of the debt of Lennar Corporation, as a separate entity, to others. At any time, when a guarantor subsidiary is no longer guaranteeing at least $75 million of Lennar Corporation’s debt other than the Guaranteed Notes, either directly or by guaranteeing other subsidiaries’ obligations as guarantors of Lennar Corporation’s debt, the guarantor subsidiaries’ guarantee of the Guaranteed Notes will be suspended. Therefore, if, the guarantor subsidiaries cease guaranteeing Lennar Corporation’s obligations under its letter of credit facility and are not guarantors of any new debt, the guarantor subsidiaries’ guarantees of the Guaranteed Notes will be suspended until such time, if any, as they again are guaranteeing at least $75 million of Lennar Corporation’s debt other than the Guaranteed Notes.
If our guarantor subsidiaries are guaranteeing a revolving credit lines totaling at least $75 million, we will treat the guarantees of the Guaranteed Notes as remaining in effect even during periods when Lennar Corporation’s borrowings under the revolving credit lines are less than $75 million.
In February 2010, we terminated our $1.1 billion senior unsecured revolving credit facility (the “Credit Facility”) and entered into cash-collateralized letter of credit agreements with two banks with a capacity totaling $225 million. At that time, we had no outstanding borrowings under the Credit Facility as it was only being used to issue letters of credit. In November 2010, we terminated our cash-collateralized letter of credit agreements and simultaneously entered into a $150 million Letter of Credit and Reimbursement Agreement (“LC Agreement”) with certain financial institutions. The LC Agreement may be increased to $200 million, although there are currently no commitments for the additional $50 million. At November 30, 2010, we believe we were in compliance with our debt covenants.
Our performance letters of credit outstanding were $78.9 million and $97.7 million, respectively, at November 30, 2010 and 2009. Our financial letters of credit outstanding were $195.0 million and $205.4 million, respectively, at November 30, 2010 and 2009. Performance letters of credit are generally posted with regulatory
bodies to guarantee our performance of certain development and construction activities, and financial letters of credit are generally posted in lieu of cash deposits on option contracts, for insurance risks, credit enhancements and as other collateral.
At November 30, 2010, our Lennar Financial Services segment had a warehouse repurchase facility with a maximum aggregate commitment of $150 million and an additional uncommitted amount of $50 million that matures in April 2011, and another warehouse repurchase facility with a maximum aggregate commitment of $175 million that matures in July 2011. The maximum aggregate commitment under these facilities totaled $325 million. Our Lennar Financial Services segment uses these facilities to finance its lending activities until the mortgage loans are sold to investors and expects the facilities to be renewed or replaced with other facilities when they mature. Borrowings under the facilities were $271.6 million and $217.5 million, respectively, at November 30, 2010 and 2009, and were collateralized by mortgage loans and receivables on loans sold to investors but not yet paid for with outstanding principal balances of $286.0 million and $266.9 million, respectively, at November 30, 2010 and 2009. These facilities have several interest rate-pricing options, which fluctuate with market rates. The combined effective interest rate on the facilities at November 30, 2010 was 3.9%.
Since our Lennar Financial Services segment’s borrowings under the warehouse repurchase facilities are generally repaid with the proceeds from the sale of mortgage loans and receivables on loans that secure those borrowings, the facilities are not likely to be a call on our current cash or future cash resources. If the facilities are not renewed, the borrowings under the lines of credit will be paid off by selling the mortgage loans held-for-sale and by collecting on receivables on loans sold but not yet paid. Without the facilities, our Lennar Financial Services segment would have to use cash from operations and other funding sources to finance its lending activities.
Our Lennar Financial Services segment, in the normal course of business, uses derivative financial instruments to reduce its exposure to fluctuations in interest rates. Our Lennar Financial Services segment enters into forward commitments and, to a lesser extent, option contracts to protect the value of loans held-for-sale from increases in market interest rates. We do not anticipate that we will suffer credit losses from counterparty non-performance.
Changes in Capital Structure
We have a stock repurchase program which permits the purchase of up to 20 million shares of our outstanding common stock. During 2010, 2009 and 2008, there were no share repurchases of common stock under the stock repurchase program. As of November 30, 2010, 6.2 million shares of common stock can be repurchased in the future under the program.
Treasury stock increased by 0.1 million Class A common shares and 0.3 million Class A common shares, respectively, during the years ended November 30, 2010 and November 30, 2009, due to activity related to our equity compensation plan and forfeitures of restricted stock.
In April 2009, we entered into distribution agreements with J.P Morgan Securities, Inc., Citigroup Global Markets Inc., Merril Lynch, Pierce, Fenner & Smith Incorporated and Deutsche Bank Securities Inc., relating to an offering of our Class A common stock into the market from time to time for an aggregate of up to $275 million. As of November 30, 2009, we had sold a total of 21.0 million shares of our Class A common stock under the equity offering for gross proceeds of $225.5 million, or an average of $10.76 per share. After compensation to the distributors of $4.5 million, we received net proceeds of $221.0 million. We used the proceeds from the offering for general corporate purposes. There was no activity related to these distribution agreements during 2010.
During 2010 and 2009, Class A and Class B common stock holders received a per share annual dividend of $0.16. In October 2008, the Company’s Board of Directors voted to decrease the annual dividend rate with regard to the Company’s Class A and Class B common stock to $0.16 per share per year (payable quarterly) from $0.64 per share per year (payable quarterly). During 2008, Class A and Class B common stockholders received per share annual dividends of $0.52.
Based on our current financial condition and credit relationships, we believe that our operations and borrowing resources will provide for our current and long-term capital requirements at our anticipated levels of activity.
Off-Balance Sheet Arrangements
Lennar Homebuilding—Investments in Unconsolidated Entities
At November 30, 2010, we had equity investments in 42 unconsolidated entities (of which 14 had recourse debt, 11 had non-recourse debt and 17 had no debt), compared to 61 unconsolidated entities at November 30, 2009. Historically, we invested in unconsolidated entities that acquire and develop land (1) for our homebuilding operations or for sale to third parties or (2) for the construction of homes for sale to third-party homebuyers. Through these entities, we primarily sought to reduce and share our risk by limiting the amount of our capital invested in land, while obtaining access to potential future homesites and allowing us to participate in strategic ventures. The use of these entities also, in some instances, enabled us to acquire land to which we could not otherwise obtain access, or could not obtain access on as favorable terms, without the participation of a strategic partner. Participants in these joint ventures have been land owners/developers, other homebuilders and financial or strategic partners. Joint ventures with land owners/developers have given us access to homesites owned or controlled by our partners. Joint ventures with other homebuilders have provided us with the ability to bid jointly with our partners for large land parcels. Joint ventures with financial partners have allowed us to combine our homebuilding expertise with access to our partners’ capital. Joint ventures with strategic partners have allowed us to combine our homebuilding expertise with the specific expertise (e.g. commercial or infill experience) of our partner. Each joint venture is governed by an executive committee consisting of members from the partners.
Although the strategic purposes of our joint ventures and the nature of our joint ventures partners vary, the joint ventures are generally designed to acquire, develop and/or sell specific assets during a limited life-time. The joint ventures are typically structured through non-corporate entities in which control is shared with our venture partners. Each joint venture is unique in terms of its funding requirements and liquidity needs. We and the other joint venture participants typically make pro-rata cash contributions to the joint venture. In many cases, our risk is limited to our equity contribution and potential future capital contributions. Additionally, most joint ventures obtain third-party debt to fund a portion of the acquisition, development and construction costs of their communities. The joint venture agreements usually permit, but do not require, the joint ventures to make additional capital calls in the future. However, capital calls relating to the repayment of joint venture debt under payment or maintenance guarantees generally is required.
Under the terms of our joint venture agreements, we generally have the right to share in earnings and distributions of the entities on a pro-rata basis based on our ownership percentage. Some joint venture agreements provide for a different allocation of profit and cash distributions if and when the cumulative results of the joint venture exceed specified targets (such as a specified internal rate of return). Lennar Homebuilding equity in earnings (loss) from unconsolidated entities excludes our pro-rata share of joint ventures’ earnings resulting from land sales to our homebuilding divisions. Instead, we account for those earnings as a reduction of our costs of purchasing the land from the joint ventures. This in effect defers recognition of our share of the joint ventures’ earnings related to these sales until we deliver a home and title passes to a third-party homebuyer.
In some instances, we are designated as the manager under the direction of a management committee that has shared power amongst the partners of the unconsolidated entity and receive fees for such services. In addition, we often enter into option contracts to acquire properties from our joint ventures, generally for market prices at specified dates in the future. Option contracts generally require us to make deposits using cash or irrevocable letters of credit toward the exercise price. These option deposits are generally negotiated by management on a case by case basis.
We regularly monitor the results of our unconsolidated joint ventures and any trends that may affect their future liquidity or results of operations. Joint ventures in which we have investments are subject to a variety of financial and non-financial debt covenants related primarily to equity maintenance, fair value of collateral and minimum homesite takedown or sale requirements. We monitor the performance of joint ventures in which we have investments on a regular basis to assess compliance with debt covenants. For those joint ventures not in compliance with the debt covenants, we evaluate and assess possible impairment of our investment.
Our arrangements with joint ventures generally do not restrict our activities or those of the other participants. However, in certain instances, we agree not to engage in some types of activities that may be viewed as competitive with the activities of these ventures in the localities where the joint ventures do business.
As discussed above, the joint ventures in which we invest generally supplement equity contributions with third-party debt to finance their activities. In many instances, the debt financing is non-recourse, thus neither we nor the other equity partners are a party to the debt instruments. In other cases, we and the other partners agree to provide credit support in the form of repayment or maintenance guarantees.
Material contractual obligations of our unconsolidated joint ventures primarily relate to the debt obligations described above. The joint ventures generally do not enter into lease commitments because the entities are managed either by us, or another of the joint venture participants, who supply the necessary facilities and employee services in exchange for market-based management fees. However, they do enter into management contracts with the participants who manage them. Some joint ventures also enter into agreements with developers, which may be us or other joint venture participants, to develop raw land into finished homesites or to build homes.
The joint ventures often enter into option agreements with buyers, which may include us or other joint venture participants, to deliver homesites or parcels in the future at market prices. Option deposits are recorded by the joint ventures as liabilities until the exercise dates at which time the deposit and remaining exercise proceeds are recorded as revenue. Any forfeited deposit is recognized as revenue at the time of forfeiture. Our unconsolidated joint ventures generally do not enter into off-balance sheet arrangements.
As described above, the liquidity needs of joint ventures in which we have investments vary on an entity-by-entity basis depending on each entity’s purpose and the stage in its life cycle. During formation and development activities, the entities generally require cash, which is provided through a combination of equity contributions and debt financing, to fund acquisition and development of properties. As the properties are completed and sold, cash generated is available to repay debt and for distribution to the joint venture’s members. Thus, the amount of cash available for a joint venture to distribute at any given time is primarily a function of the scope of the joint venture’s activities and the stage in the joint venture’s life cycle.
We track our share of cumulative earnings and cumulative distributions of our joint ventures. For purposes of classifying distributions received from joint ventures in our statements of cash flows, cumulative distributions are treated as returnson capital to the extent of cumulative earnings and included in our consolidated statements of cash flows as operating activities. Cumulative distributions in excess of our share of cumulative earnings are treated as returnsof capital and included in our consolidated statements of cash flows as investing activities.
Summarized financial information on a combined 100% basis related to Lennar Homebuilding’s unconsolidated entities that are accounted for by the equity method was as follows:
Statements of Operations and Selected Information | Years Ended November 30, | |||||||||||
| 2010 | 2009 | 2008 | ||||||||||
| (Dollars in thousands) | ||||||||||||
Revenues | $ | 236,752 | 339,993 | 862,728 | ||||||||
Costs and expenses | 378,997 | 1,212,866 | 1,394,601 | |||||||||
Net loss of unconsolidated entities (1) | $ | (142,245 | ) | (872,873 | ) | (531,873 | ) | |||||
Our share of net loss | $ | (13,301 | ) | (131,138 | ) | (55,598 | ) | |||||
Our share of net loss—recognized (2) | $ | (10,966 | ) | (130,917 | ) | (59,156 | ) | |||||
Our cumulative share of net earnings—deferred at November 30 | $ | 8,689 | 12,052 | 21,491 | ||||||||
Our investments in unconsolidated entities | $ | 626,185 | 599,266 | 766,752 | ||||||||
Equity of the unconsolidated entities | $ | 2,148,610 | 2,249,289 | 2,688,365 | ||||||||
Our investment % in the unconsolidated entities | 29 | % | 27 | % | 29 | % | ||||||
Balance Sheets Assets: Cash and cash equivalents Inventories Other assets Liabilities and equity: Accounts payable and other liabilities Debt Equity November 30, 2010 2009 (Dollars in thousands) $ 82,573 171,946 3,371,435 3,628,491 307,244 403,383 $ 3,761,252 4,203,820 $ 327,824 366,141 1,284,818 1,588,390 2,148,610 2,249,289 $ 3,761,252 4,203,820
In fiscal 2007, we sold a portfolio of land to a strategic land investment venture with Morgan Stanley Real Estate Fund II, L.P., an affiliate of Morgan Stanley & Co., Inc., in which we have a 20% ownership interest and 50% voting rights. Due to our continuing involvement, the transaction did not qualify as a sale under GAAP; thus, the inventory has remained on our consolidated balance sheet in consolidated inventory not owned. As of November 30, 2010 and 2009, the portfolio of land (including land development costs) of $424.5 million and $477.9 million, respectively, is reflected as inventory in the summarized condensed financial information related to unconsolidated entities in which we have investments.
In February 2007, LandSource Communities Development LLC (“LandSource”) admitted MW Housing Partners as a new strategic partner. As a result we received a distribution from LandSource of $707.6 million and our ownership in LandSource was reduced to 16%. In June 2008, LandSource and a number of its subsidiaries commenced proceedings under Chapter 11 of the Bankruptcy Code in the United States Bankruptcy Court for the District of Delaware. In November 2008, our land purchase options with LandSource were terminated, thus, in 2008, we recognized a deferred profit of $101.3 million (net of $31.8 million of write-offs of option deposits and pre-acquisition costs and other write-offs) related to the 2007 recapitalization of LandSource. In July 2009, the United States Bankruptcy Court for the District of Delaware confirmed the plan of reorganization for LandSource. As a result of the bankruptcy proceedings, LandSource was reorganized into a new company called Newhall Land Development, LLC, (“Newhall”). The reorganized company emerged from Chapter 11 free of its previous bank debt. As part of the reorganization plan, during the year ended November 30, 2009, we invested $140 million in exchange for approximately 15% equity interest in the reorganized Newhall, ownership in several communities that were formerly owned by LandSource, the settlement and release of all claims that might have been asserted against us and certain other claims LandSource had against third parties.
Debt to total capital of the Lennar Homebuilding unconsolidated entities in which we have investments was calculated as follows:
| November 30, | ||||||||
| 2010 | 2009 | |||||||
| (Dollars in thousands) | ||||||||
Debt | $ | 1,284,818 | 1,588,390 | |||||
Equity | 2,148,610 | 2,249,289 | ||||||
Total capital | $ | 3,433,428 | 3,837,679 | |||||
Debt to total capital of our unconsolidated entities | 37.4 | % | 41.4 | % | ||||
Our investments in Lennar Homebuilding unconsolidated entities by type of venture were as follows:
| November 30, | ||||||||
| 2010 | 2009 | |||||||
| (In thousands) | ||||||||
Land development | $ | 530,004 | 555,799 | |||||
Homebuilding | 96,181 | 43,467 | ||||||
Total investment | $ | 626,185 | 599,266 | |||||
During the year ended November 30, 2010, we recorded $10.5 million of our share of valuation adjustments related to the assets of unconsolidated entities in which we have investments, compared to $101.9 million for the year ended November 30, 2009. In addition, we recorded $1.7 million and $89.0 million, respectively, of valuation adjustments to our investments in unconsolidated entities for the years ended November 30, 2010 and 2009. We will continue to monitor our investments in joint ventures and the recoverability of assets owned by those joint ventures.
The summary of our net recourse exposure related to the Lennar Homebuilding unconsolidated entities in which we have investments was as follows:
| November 30, | ||||||||
| 2010 | 2009 | |||||||
| (In thousands) | ||||||||
Several recourse debt—repayment | $ | 33,399 | 42,691 | |||||
Several recourse debt—maintenance | 29,454 | 75,238 | ||||||
Joint and several recourse debt—repayment | 48,406 | 85,799 | ||||||
Joint and several recourse debt—maintenance | 61,591 | 81,592 | ||||||
Land seller debt and other debt recourse exposure | — | 2,420 | ||||||
Lennar’s maximum recourse exposure | 172,850 | 287,740 | ||||||
Less: joint and several reimbursement agreements with our partners | (58,878 | ) | (93,185 | ) | ||||
Lennar’s net recourse exposure | $ | 113,972 | 194,555 | |||||
During the year ended November 30, 2010, we reduced our maximum recourse exposure related to indebtedness of our Lennar Homebuilding unconsolidated entities by $114.9 million, of which $82.5 million was paid by us primarily through capital contributions to unconsolidated entities and $32.4 million related to a reduction in the number of joint ventures in which we have investments, the reduction of joint and several recourse debt and the joint ventures selling inventory.
As of November 30, 2010, we had $10.2 million of obligation guarantees recorded as a liability on our consolidated balance sheet, compared to $14.1 million as of November 30, 2009. During the year ended November 30, 2010, the liability was reduced by $11.0 million as a result of the debt extinguishment related to one of our unconsolidated entities and by $2.1 million due to cash paid related to an obligation guarantee previously recorded. This was partially offset by an accrual of $9.2 million established by us to cover claims arising under obligation guarantees. The obligation guarantees are estimated based on current facts and circumstances and any unexpected changes may lead us to incur additional liabilities under our obligation guarantees in the future.
Indebtedness of an unconsolidated entity is secured by its own assets. Some unconsolidated entities own multiple properties and other assets. There is no cross collateralization of debt to different unconsolidated entities. We also do not use our investment in one unconsolidated entity as collateral for the debt in another unconsolidated entity or commingle funds among our unconsolidated entities.
In connection with a loan to an unconsolidated entity, we and our partners often guarantee to a lender either jointly and severally or on a several basis, any, or all of the following: (i) the completion of the development, in whole or in part, (ii) indemnification of the lender from environmental issues, (iii) indemnification of the lender from “bad boy acts” of the unconsolidated entity (or full recourse liability in the event of unauthorized transfer or bankruptcy) and (iv) that the loan to value and/or loan to cost will not exceed a certain percentage (maintenance or remargining guarantee) or that a percentage of the outstanding loan will be repaid (repayment guarantee).
In connection with loans to an unconsolidated entity where there is a joint and several guarantee, we generally have a reimbursement agreement with our partner. The reimbursement agreement provides that neither party is responsible for more than its proportionate share of the guarantee. However, if our joint venture partner does not have adequate financial resources to meet its obligations under the reimbursement agreement, we may be liable for more than our proportionate share, up to our maximum exposure, which is the full amount covered by the joint and several guarantee.
The recourse debt exposure in the previous table represents our maximum exposure to loss from guarantees and does not take into account the underlying value of the collateral or the other assets of the borrowers that are
available to repay debt or to reimburse us for any payments on our guarantees. Our Lennar Homebuilding unconsolidated entities that have recourse debt have a significant amount of assets and equity. The summarized balance sheets of our Lennar Homebuilding unconsolidated entities with recourse debt were as follows.
| November 30, | ||||||||
| 2010 | 2009 | |||||||
| (In thousands) | ||||||||
Assets | $ | 990,028 | 1,324,993 | |||||
Liabilities | 487,606 | 777,836 | ||||||
Equity | 502,422 | 547,157 | ||||||
In addition, in most instances in which we have guaranteed debt of a Lennar Homebuilding unconsolidated entity, our partners have also guaranteed that debt and are required to contribute their share of the guarantee payment. Some of our guarantees are repayment guarantees and some are maintenance guarantees. In a repayment guarantee, we and our venture partners guarantee repayment of a portion or all of the debt in the event of a default before the lender would have to exercise its rights against the collateral. In the event of default, if our venture partner does not have adequate financial resources to meet its obligations under the reimbursement agreement, we may be liable for more than our proportionate share, up to our maximum recourse exposure, which is the full amount covered by the joint and several guarantee. The maintenance guarantees only apply if the value of the collateral (generally land and improvements) is less than a specified percentage of the loan balance. If we are required to make a payment under a maintenance guarantee to bring the value of the collateral above the specified percentage of the loan balance, the payment would generally constitute a capital contribution or loan to the Lennar Homebuilding unconsolidated entity and increase our share of any funds the unconsolidated entity distributes.
In connection with many of the loans to Lennar Homebuilding unconsolidated entities, we and our joint venture partners (or entities related to them) have been required to give guarantees of completion to the lenders. Those completion guarantees may require that the guarantors complete the construction of the improvements for which the financing was obtained. If the construction is to be done in phases, the guarantee generally is limited to completing only the phases as to which construction has already commenced and for which loan proceeds were used.
During the year ended November 30, 2010, there were: (1) payments of $10.0 million under our maintenance guarantees, (2) at our election, a loan paydown of $50.3 million, representing both our and our partner’s share, in return for 4-year loan extension and the rights to obtain preferred returns and priority distributions at one of our unconsolidated entities, and (3) a $19.3 million payment to extinguish debt at a discount and buy out the partner of one of our unconsolidated entities resulting in a net pre-tax gain of $7.7 million. In addition, during the year ended November 30, 2010, there were other loan paydowns of $28.1 million, a portion of which related to amounts paid under our repayment guarantees. During the year ended November 30, 2009, there were payments of $31.6 million under our maintenance guarantees and there were other loan repayments of $72.4 million, a portion of which related to amounts paid under our repayment guarantees. During the years ended November 30, 2010, there were no payments under completion guarantees. During the years ended November 30, 2009, there was a payment of $5.6 million under a completion guarantee related to one joint venture.
As of November 30, 2010, the fair values of the maintenance guarantees, completion guarantees and repayment guarantees were not material. We believe that as of November 30, 2010, in the event we become legally obligated to perform under a guarantee of the obligation of a Lennar Homebuilding unconsolidated entity due to a triggering event under a guarantee, most of the time the collateral should be sufficient to repay at least a significant portion of the obligation or we and our partners would contribute additional capital into the venture.
The total debt of Lennar Homebuilding unconsolidated entities in which we have investments was as follows:
| November 30, | ||||||||
| 2010 | 2009 | |||||||
| (Dollars in thousands) | ||||||||
Lennar’s net recourse exposure | $ | 113,972 | 194,555 | |||||
Reimbursement agreements from partners | 58,878 | 93,185 | ||||||
Lennar’s maximum recourse exposure | 172,850 | 287,740 | ||||||
Non-recourse bank debt and other debt (partner’s share of several recourse) | 79,921 | 140,078 | ||||||
Non-recourse land seller debt or other debt | 58,604 | 47,478 | ||||||
Non-recourse debt with completion guarantees | 600,297 | 608,397 | ||||||
Non-recourse debt without completion guarantees | 373,146 | 504,697 | ||||||
Non-recourse debt to Lennar | 1,111,968 | 1,300,650 | ||||||
Total debt | $ | 1,284,818 | 1,588,390 | |||||
Lennar’s maximum recourse exposure as a % of total JV debt | 13 | % | 18 | % | ||||
In view of current credit market conditions, it is not uncommon for lenders to real estate developers, including joint ventures in which we have interests, to assert non-monetary defaults (such as failure to meet construction completion deadlines or declines in the market value of collateral below required amounts) or technical monetary defaults against the real estate developers. In most instances, those asserted defaults are resolved by modifications of the loan terms, additional equity investments or other concessions by the borrowers. In addition, in some instances, real estate developers, including joint ventures in which we have interests, are forced to request temporary waivers of covenants in loan documents or modifications of loan terms, which are often, but not always obtained. However, in some instances developers, including joint ventures in which we have interests, are not able to meet their monetary obligations to lenders, and are thus declared in default. Because we sometimes guarantee all or portions of the obligations to lenders of joint ventures in which we have interests, when these joint ventures default on their obligations, lenders may or may not have claims against us. Normally, we do not make payments with regard to guarantees of joint venture obligations while the joint ventures are contesting assertions regarding sums due to their lenders. When it is determined that a joint venture is obligated to make a payment that we have guaranteed and the joint venture will not be able to make that payment, we accrue the amounts probable to be paid by us as a liability. Although we generally fulfill our guarantee obligations within a reasonable time after we determine that we are obligated with regard to them, at any point in time it is likely that we will have some balance of unpaid guarantee liability. At November 30, 2010, the liability for unpaid guarantees of joint venture indebtedness on our consolidated balance sheet totaled $10.2 million.
The following table summarizes the principal maturities of our Lennar Homebuilding unconsolidated entities (“JVs”) debt as per current debt arrangements as of November 30, 2010 and does not represent estimates of future cash payments that will be made to reduce debt balances. Many JV loans have extension options in the loan agreements that would allow the loans to be extended into future years.
| Principal Maturities of Unconsolidated JVs by Period | ||||||||||||||||||||||||||||
| Total JV Assets (1) | Total JV Debt | 2011 (2) | 2012 | 2013 | Thereafter | Other Debt (3) | ||||||||||||||||||||||
| (In thousands) | ||||||||||||||||||||||||||||
Net recourse debt to Lennar | $ | 113,972 | 68,237 | 24,983 | 13,548 | 7,204 | — | |||||||||||||||||||||
Reimbursement agreements | 58,878 | — | 23,444 | 8,434 | 27,000 | — | ||||||||||||||||||||||
Maximum recourse debt exposure to Lennar | $ | 990,028 | 172,850 | 68,237 | 48,427 | 21,982 | 34,204 | — | ||||||||||||||||||||
Debt without recourse to Lennar | 2,450,048 | 1,111,968 | 815,481 | 58,082 | 44,493 | 133,388 | 60,524 | |||||||||||||||||||||
Total | $ | 3,440,076 | 1,284,818 | 883,718 | 106,509 | 66,475 | 167,592 | 60,524 | ||||||||||||||||||||
|
|
The following table is a breakdown of the assets, debt and equity of the Lennar Homebuilding unconsolidated joint ventures by partner type as of November 30, 2010:
| Total JV Assets | Maximum Recourse Debt Exposure to Lennar | Reimbursement Agreements | Net Recourse Debt to Lennar | Total Debt Without Recourse to Lennar | Total JV Debt | Total JV Equity | JV Debt to Total Capital Ratio | Remaining Homes/ Homesites in JV | ||||||||||||||||||||||||||||
| (Dollars in thousands) | ||||||||||||||||||||||||||||||||||||
Partner Type: | ||||||||||||||||||||||||||||||||||||
Financial | $ | 2,464,122 | 30,000 | 27,000 | 3,000 | 823,857 | 853,857 | $ | 1,303,777 | 40 | % | 41,987 | ||||||||||||||||||||||||
Land Owners/Developers | 539,386 | 50,506 | — | 50,506 | 118,476 | 168,982 | 314,975 | 35 | % | 20,577 | ||||||||||||||||||||||||||
Other Builders | 371,919 | 32,152 | 8,434 | 23,718 | 76,282 | 108,434 | 247,806 | 30 | % | 6,549 | ||||||||||||||||||||||||||
Strategic | 385,825 | 60,192 | 23,444 | 36,748 | 32,829 | 93,021 | 282,052 | 25 | % | 6,711 | ||||||||||||||||||||||||||
Total | $ | 3,761,252 | 172,850 | 58,878 | 113,972 | 1,051,444 | 1,224,294 | $ | 2,148,610 | 36 | % | 75,824 | ||||||||||||||||||||||||
Land seller debt and other debt | $ | — | — | — | 60,524 | 60,524 | ||||||||||||||||||||||||||||||
Total JV debt | $ | 172,850 | 58,878 | 113,972 | 1,111,968 | 1,284,818 | ||||||||||||||||||||||||||||||
The table below indicates the assets, debt and equity of our 10 largest Lennar Homebuilding unconsolidated joint venture investments as of November 30, 2010:
| Lennar’s Investment | Total JV Assets | Maximum Recourse Debt Exposure to Lennar | Reimbursement Agreements | Net Recourse Debt to Lennar | Total Debt Without Recourse to Lennar | Total JV Debt | Total JV Equity | JV Debt to Total Capital Ratio | ||||||||||||||||||||||||||||
| (Dollars in thousands) | ||||||||||||||||||||||||||||||||||||
Top Ten JVs (1): | ||||||||||||||||||||||||||||||||||||
Platinum Triangle Partners | $ | 107,468 | 270,383 | 46,889 | 23,445 | 23,444 | — | 46,889 | 213,381 | 18 | % | |||||||||||||||||||||||||
Heritage Fields El Toro | 82,541 | 1,288,756 | — | — | — | 573,467 | 573,467 | 649,025 | 47 | % | ||||||||||||||||||||||||||
Central Park West Holdings | 62,268 | 197,745 | 30,000 | 27,000 | 3,000 | 120,251 | 150,251 | 44,697 | 77 | % | ||||||||||||||||||||||||||
Newhall Land Development | 47,085 | 452,832 | — | — | — | — | — | 271,961 | — | |||||||||||||||||||||||||||
Runkle Canyon | 37,014 | 75,375 | — | — | — | — | — | 74,029 | — | |||||||||||||||||||||||||||
Ballpark Village | 35,878 | 124,927 | — | — | — | 52,910 | 52,910 | 71,376 | 43 | % | ||||||||||||||||||||||||||
LS College Park | 34,649 | 68,300 | — | — | — | — | — | 67,805 | — | |||||||||||||||||||||||||||
MS Rialto Residential Holdings | 29,268 | 436,285 | — | — | — | 103,310 | 103,310 | 314,415 | 25 | % | ||||||||||||||||||||||||||
Treasure Island Community Development | 21,449 | 45,594 | — | — | — | — | — | 42,929 | — | |||||||||||||||||||||||||||
Rocking Horse Partners | 19,205 | 48,085 | — | — | — | 8,628 | 8,628 | 38,411 | 18 | % | ||||||||||||||||||||||||||
10 largest JV investments | 476,825 | 3,008,282 | 76,889 | 50,445 | 26,444 | 858,566 | 935,455 | 1,788,029 | 34 | % | ||||||||||||||||||||||||||
Other JVs | 149,360 | 752,970 | 95,961 | 8,433 | 87,528 | 192,878 | 288,839 | 360,581 | 44 | % | ||||||||||||||||||||||||||
Total | $ | 626,185 | 3,761,252 | 172,850 | 58,878 | 113,972 | 1,051,444 | 1,224,294 | 2,148,610 | 36 | % | |||||||||||||||||||||||||
Land seller debt and other debt | $ | — | — | — | 60,524 | 60,524 | ||||||||||||||||||||||||||||||
Total JV debt | $ | 172,850 | 58,878 | 113,972 | 1,111,968 | 1,284,818 | ||||||||||||||||||||||||||||||
The table below indicates the percentage of assets, debt and equity of our 10 largest Lennar Homebuilding unconsolidated joint venture investments as of November 30, 2010:
| % of Total JV Assets | % of Maximum Recourse Debt Exposure to Lennar | % of Net Recourse Debt to Lennar | % of Total Debt Without Recourse to Lennar | % of Total JV Equity | ||||||||||||||||
10 largest JVs | 80 | % | 44 | % | 23 | % | 82 | % | 83 | % | ||||||||||
Other | 20 | % | 56 | % | 77 | % | 18 | % | 17 | % | ||||||||||
Total | 100 | % | 100 | % | 100 | % | 100 | % | 100 | % | ||||||||||
Rialto Investments—Investments in Unconsolidated Entities
In March 2009, the Legacy Securities program was announced by the U.S. Department of the Treasury (the “U.S. Treasury”) under the Federal government’s PPIP. The PPIP matches private capital with public capital and financing provided by the U.S. Treasury, which provides an opportunity for private investors to invest in certain non-agency residential mortgage-backed securities and CMBS issued prior to 2009 that were originally rated AAA, or an equivalent rating, by two or more nationally recognized statistical organizations without ratings enhancements. These securities are backed directly by actual mortgage loans and not by other securities.
During fiscal 2009, we committed to invest $75 million in the Federal government’s PPIP fund managed by AB. An affiliate of Rialto is a sub-advisor to the AB PPIP fund and receives management fees for sub-advisory services. Total equity commitments of approximately $1.2 billion were made by private investors in this fund, and the U.S. Treasury has committed to a matching amount of approximately $1.2 billion of equity in the fund, as well as agreeing to extend up to approximately $2.3 billion of debt financing. As of November 30, 2010, 85% of committed capital has been called including our portion, $63.8 million of the $75 million we committed to invest. As of November 30, 2010, the AB PPIP has invested approximately $4.0 billion to purchase $6.4 billion in face amount of non-agency residential mortgage-backed securities and commercial mortgage-backed securities and it is reflected in investments in the summarized condensed balance sheets of Rialto’s unconsolidated entities. The gross yield of the fund since its inception has totaled approximately 39%. As of November 30, 2010, the carrying value of our investment in the AB PPIP fund was $77.3 million.
In November 2010, our Rialto segment completed the closing of its Fund with initial equity commitments of approximately $300 million (including $75 million committed by us). The Fund’s objective during its three-year investment period is to invest in distressed real estate assets and other related investments that fit within the Fund’s investment parameters.
As of November 30, 2010, a subsidiary in our Rialto segment also has a $7.3 million, or approximately 5%, investment in the Service Provider, which provides services to the consolidated LLCs.
Summarized condensed financial information on a combined 100% basis related to Rialto’s investment in unconsolidated entities in which Rialto has investments that are accounted for by the equity method as of November 30, 2010 was as follows:
Balance Sheets | November 30, | |||||||
| 2010 | 2009 (1) | |||||||
| (In thousands) | ||||||||
Assets: | ||||||||
Cash and cash equivalents | $ | 42,793 | 2,229 | |||||
Investments | 4,341,226 | — | ||||||
Other assets | 181,600 | 179,985 | ||||||
| $ | 4,565,619 | 182,214 | ||||||
Liabilities and equity: | ||||||||
Accounts payable and other liabilities | $ | 110,921 | 58,209 | |||||
Partner loans | 137,820 | 135,570 | ||||||
Debt due to the U.S. Treasury | 1,955,000 | — | ||||||
Equity | 2,361,878 | (11,565 | ) | |||||
| $ | 4,565,619 | 182,214 | ||||||
| Years Ended November 30, | ||||||||
Statements of Operations | 2010 | 2009 (1) | ||||||
| (In thousands) | ||||||||
Revenues | $ | 357,330 | 58,464 | |||||
Costs and expenses | 209,103 | 89,570 | ||||||
Other gains | 311,468 | — | ||||||
Net earnings (loss) of unconsolidated entities | $ | 459,695 | (31,106 | ) | ||||
Rialto Investments’ share of net earnings recognized | $ | 15,363 | — | |||||
Option Contracts
We have access to land through option contracts, which generally enables us to control portions of properties owned by third parties (including land funds) and unconsolidated entities until we have determined whether to exercise the option.
A majority of our option contracts require a non-refundable cash deposit or irrevocable letter of credit based on a percentage of the purchase price of the land. Until recently, these option deposits generally have approximated 10% of the exercise price. Our option contracts sometimes include price adjustment provisions, which adjust the purchase price of the land to its approximate fair value at the time of acquisition or are based on fair value at the time of takedown. The exercise periods of our option contracts generally range from one-to-ten years.
Our investments in option contracts are recorded at cost unless those investments are determined to be impaired, in which case our investments are written down to fair value. We review option contracts for indicators of impairment during each reporting period. The most significant indicator of impairment is a decline in the fair value of the optioned property such that the purchase and development of the optioned property would no longer meet our targeted return on investment. Such declines could be caused by a variety of factors including increased competition, decreases in demand or changes in local regulations that adversely impact the cost of development. Changes in any of these factors would cause us to re-evaluate the likelihood of exercising our land options.
Some option contracts contain a predetermined take-down schedule for the optioned land parcels. However, in almost all instances, we are not required to purchase land in accordance with those take-down schedules. In substantially all instances, we have the right and ability to not exercise our option and forfeit our deposit without further penalty, other than termination of the option and loss of any unapplied portion of our deposit and pre-acquisition costs. Therefore, in substantially all instances, we do not consider the take-down price to be a firm contractual obligation.
When we intend not to exercise an option, we write-off any deposit and pre-acquisition costs associated with the option contract. For the years ended November 30, 2010, 2009 and 2008, we wrote-off $3.1 million, $84.4 million and $97.2 million, respectively, of option deposits and pre-acquisition costs related to homesites under option that we do not intend to purchase.
The table below indicates the number of homesites owned and homesites to which we had access through option contracts with third parties (“optioned”) or unconsolidated joint ventures (“JVs”) (i.e., controlled homesites) at November 30, 2010 and 2009:
November 30, 2010 | Controlled Homesites | Owned Homesites | Total Homesites | |||||||||||||||||
| Optioned | JVs | Total | ||||||||||||||||||
East | 4,856 | 1,631 | 6,487 | 26,565 | 33,052 | |||||||||||||||
Central | 1,061 | 1,721 | 2,782 | 16,236 | 19,018 | |||||||||||||||
West | 304 | 7,753 | 8,057 | 26,213 | 34,270 | |||||||||||||||
Houston | 1,431 | 305 | 1,736 | 5,926 | 7,662 | |||||||||||||||
Other | 838 | 74 | 912 | 9,542 | 10,454 | |||||||||||||||
Total homesites | 8,490 | 11,484 | 19,974 | 84,482 | 104,456 | |||||||||||||||
| Controlled Homesites | Owned Homesites | Total Homesites | ||||||||||||||||||
November 30, 2009 | Optioned | JVs | Total | |||||||||||||||||
East | 4,701 | 1,900 | 6,601 | 28,406 | 35,007 | |||||||||||||||
Central | 1,273 | 2,381 | 3,654 | 15,607 | 19,261 | |||||||||||||||
West | 78 | 7,667 | 7,745 | 24,770 | 32,515 | |||||||||||||||
Houston | 901 | 1,728 | 2,629 | 6,672 | 9,301 | |||||||||||||||
Other | 470 | 74 | 544 | 7,248 | 7,792 | |||||||||||||||
Total homesites | 7,423 | 13,750 | 21,173 | 82,703 | 103,876 | |||||||||||||||
We evaluate all option contracts for land when entered into or upon a reconsideration event to determine whether they are VIEs and, if so, whether we are the primary beneficiary of certain of these option contracts. Although we do not have legal title to the optioned land, if we are deemed to be the primary beneficiary, we are required to consolidate the land under option at the purchase price of the optioned land. During the year ended November 30, 2010, the effect of consolidation of these option contracts was a net increase of $19.8 million to consolidated inventory not owned with a corresponding increase to liabilities related to consolidated inventory not owned in our consolidated balance sheet as of November 30, 2010. To reflect the purchase price of the inventory consolidated, we reclassified the related option deposits from land under development to consolidated inventory not owned in the accompanying consolidated balance sheet as of November 30, 2010. The liabilities related to consolidated inventory not owned primarily represent the difference between the option exercise prices for the optioned land and our cash deposits. However, consolidated inventory not owned decreased due to (1) our exercise of options to acquire land under certain contracts previously consolidated and (2) the deconsolidation of certain option contracts totaling $75.5 million related to the adoption of certain new provisions under ASC Topic 810,Consolidation, (“ASC 810”), resulting in a net decrease in consolidated inventory not owned of $139.2 million for the year ended November 30, 2010.
Our exposure to loss related to our option contracts with third parties and unconsolidated entities consisted of our non-refundable option deposits and pre-acquisition costs totaling $157.4 million and $127.4 million, respectively, at November 30, 2010 and 2009. Additionally, we had posted $48.9 million and $58.2 million, respectively, of letters of credit in lieu of cash deposits under certain option contracts as of November 30, 2010 and 2009.
Contractual Obligations and Commercial Commitments
The following table summarizes our contractual obligations at November 30, 2010:
Contractual Obligations | Payments Due by Period | |||||||||||||||||||
| Total | Less than 1 year | 1 to 3 years | 3 to 5 years | More than 5 years | ||||||||||||||||
| (In thousands) | ||||||||||||||||||||
Lennar Homebuilding—Senior notes and other debts payable | $ | 3,128,154 | 206,985 | 591,530 | 784,188 | 1,545,451 | ||||||||||||||
Lennar Financial Services—Notes and other debts payable | 271,678 | 271,623 | 42 | 13 | — | |||||||||||||||
Interest commitments under interest bearing debt (1) | 940,502 | 177,096 | 314,100 | 248,010 | 201,296 | |||||||||||||||
Rialto Investments—Notes payable (2) | 752,302 | — | 503,907 | 222,000 | 26,395 | |||||||||||||||
Operating leases | 115,254 | 35,031 | 40,730 | 24,012 | 15,481 | |||||||||||||||
Other contractual obligations (3) | 86,185 | 86,185 | — | — | — | |||||||||||||||
Total contractual obligations (4) | $ | 5,294,075 | 776,920 | 1,450,309 | 1,278,223 | 1,788,623 | ||||||||||||||
We are subject to the usual obligations associated with entering into contracts (including option contracts) for the purchase, development and sale of real estate in the routine conduct of our business. Option contracts for the purchase of land generally enable us to defer acquiring portions of properties owned by third parties and unconsolidated entities until we have determined whether to exercise our option. This reduces our financial risk associated with land holdings. At November 30, 2010, we had access to 19,974 homesites through option contracts with third parties and unconsolidated entities in which we have investments. At November 30, 2010, we had $157.4 million of non-refundable option deposits and pre-acquisition costs related to certain of these homesites and $48.9 million of letters of credit posted in lieu of cash deposits under certain option contracts.
At November 30, 2010, we had letters of credit outstanding in the amount of $273.9 million (which included the $48.9 million of letters of credit discussed above). These letters of credit are generally posted either with regulatory bodies to guarantee our performance of certain development and construction activities, or in lieu of cash deposits on option contracts, for insurance risks, credit enhancements and as other collateral. Additionally, at November 30, 2010, we had outstanding performance and surety bonds related to site improvements at various projects (including certain projects in our joint ventures) of $684.7 million. Although significant development and construction activities have been completed related to these site improvements, these bonds are generally not released until all of the development and construction activities are completed. As of November 30, 2010, there were approximately $314.7 million, or 46%, of costs to complete related to these site improvements. We do not presently anticipate any draws upon these bonds, but if any such draws occur, we do not believe they would have a material effect on our financial position, results of operations or cash flows.
Our Lennar Financial Services segment had a pipeline of loan applications in process of $546.9 million at November 30, 2010. Loans in process for which interest rates were committed to the borrowers and builder commitments for loan programs totaled $202.3 million as of November 30, 2010. Substantially all of these commitments were for periods of 60 days or less. Since a portion of these commitments is expected to expire without being exercised by the borrowers or borrowers may not meet certain criteria at the time of closing, the total commitments do not necessarily represent future cash requirements.
Our Lennar Financial Services segment uses mandatory mortgage-backed securities (“MBS”) forward commitments, option contracts and investor commitments to hedge our mortgage-related interest rate exposure.
These instruments involve, to varying degrees, elements of credit and interest rate risk. Credit risk associated with MBS forward commitments, option contracts and loan sales transactions is managed by limiting our counterparties to investment banks, federally regulated bank affiliates and other investors meeting our credit standards. Our risk, in the event of default by the purchaser, is the difference between the contract price and fair value of the MBS forward commitments and option contracts. At November 30, 2010, we had open commitments amounting to $270.8 million to sell MBS with varying settlement dates through February 2011.
The following sections discuss economic conditions, market and financing risk, seasonality and interest rates and changing prices that may have an impact on our business:
Economic Conditions
Throughout 2010, market conditions in the homebuilding industry have remained challenging. High unemployment and foreclosures have continued to present challenges for the housing market. Despite a decrease of 5% in our sales of homes revenue, home deliveries and new orders year over year, our gross margins on home sales improved to $517.9 million, or 19.7%, in the year ended November 30, 2010, from $252.0 million, or 9.1%, in the year ended November 30, 2009. The improvement in gross margins was primarily due to lower valuation adjustments, reduced sales incentives offered to homebuyers as a percentage of revenues from home sales, reduced construction costs and product re-engineering, as well as third-party recoveries relating to Chinese drywall. In addition, during the year ended November 30, 2010, we returned to profitability with net earnings of $95.3 million , or $0.51 per diluted share, compared to a net loss of $417.1 million, or $2.45 per diluted share during the year ended November 30, 2009. A continued decline in the sales pace could adversely affect our revenues and margins.
Market and Financing Risk
We finance our contributions to JVs, land acquisition and development activities, construction activities, financial services activities, Rialto activities and general operating needs primarily with cash generated from operations, debt issuances, equity issuances, as well as borrowings under our warehouse repurchase facilities. We also purchase land under option agreements, which enables us to control homesites until we have determined whether to exercise the option. We tried to manage the financial risks of adverse market conditions associated with land holdings by what we believed to be prudent underwriting of land purchases in areas we viewed as desirable growth markets, careful management of the land development process and, until recent years, limitation of risks by using partners to share the costs of purchasing and developing land, as well as obtaining access to land through option contracts. Although we believed our land underwriting standards were conservative, we did not anticipate the severe decline in land values and the sharply reduced demand for new homes encountered since 2007.
Seasonality
We have historically experienced variability in our results of operations from quarter-to-quarter due to the seasonal nature of the homebuilding business.
Interest Rates and Changing Prices
Inflation can have a long-term impact on us because increasing costs of land, materials and labor result in a need to increase the sales prices of homes. In addition, inflation is often accompanied by higher interest rates, which can have a negative impact on housing demand and the costs of financing land development activities and housing construction. Rising interest rates, as well as increased materials and labor costs, may reduce gross margins. An increase in material and labor costs is particularly a problem during a period, like the current period, of declining home prices. Conversely, deflation can impact the value of real estate and make it difficult for us to recover our land costs. Therefore, either inflation or deflation could adversely impact our future results of operations.
New Accounting Pronouncements
In January 2010, the Financial Accounting Standards Board (“FASB”) issued Accounting Standards Update (“ASU”) 2010-06,Improving Disclosures about Fair Value Measurements, (“ASU 2010-06”), which requires additional disclosures about transfers between Levels 1 and 2 of the fair value hierarchy and disclosures about purchases, sales, issuances and settlements in the rollforward of activity in Level 3 fair value measurements. We adopted ASU 2010-06 for our second quarter ending May 31, 2010, except for the Level 3 activity disclosures which will be effective for our fiscal year beginning December 1, 2011. ASU 2010-06 has not and is not expected to have a material effect on our consolidated financial statements.
In April 2010, the FASB issued ASU 2010-18,Effect of a Loan Modification When the Loan Is Part of a Pool That Is Accounted for as a Single Asset, (“ASU 2010-18”). Under ASU 2010-18, modification of loans accounted for within a pool under ASC Topic 310-30,Loans and Debt Securities Acquired with Deteriorated Credit Quality, (“ASC 310-30”) does not result in removal of such loans from the pool even if the modification would otherwise be considered a troubled debt restructuring. An entity must continue to consider whether the pool of assets in which the modified loan is included is impaired if expected cash flows for the pool change. ASU 2010-18 does not affect the accounting for loans acquired with deteriorated credit quality that are not accounted for within a pool. Loans accounted for individually that were acquired with deteriorated credit quality continue to be subject to the accounting provisions for troubled debt restructuring by creditors. The amended guidance is to be applied prospectively, with early application permitted. ASU 2010-18 is effective for modifications of loans accounted for within a pool that occur on or after September 1, 2010. The adoption of this ASU did not have a material effect on our consolidated financial statements.
In July 2010, the FASB issued ASU 2010-20,Disclosures About the Credit Quality of Financing Receivables and the Allowance for Credit Losses, (“ASU 2010-20”). ASU 2010-20 enhances current disclosure requirements to assist users of financial statements in assessing an entity’s credit risk exposure and evaluating the adequacy of an entity’s allowance for credit losses. ASU 2010-20 requires entities to disclose the nature of credit risk inherent in their finance receivables, the procedure for analyzing and assessing credit risk, and the changes in both the receivables and the allowance for credit losses by portfolio segment and class. ASU 2010-20 is effective for our fiscal year beginning December 1, 2010. We are evaluating the effect the ASU will have on the disclosures in our consolidated financial statements.
Critical Accounting Policies and Estimates
Our accounting policies are more fully described in Note 1 of the notes to our consolidated financial statements included in Item 8 of this document. As discussed in Note 1, the preparation of financial statements in conformity with accounting principles generally accepted in the United States of America requires management to make estimates and assumptions about future events that affect the amounts reported in our consolidated financial statements and accompanying notes. Future events and their effects cannot be determined with absolute certainty. Therefore, the determination of estimates requires the exercise of judgment. Actual results could differ from those estimates, and such differences may be material to our consolidated financial statements. Listed below are those policies and estimates that we believe are critical and require the use of significant judgment in their application.
Valuation of Deferred Tax Assets
We record income taxes under the asset and liability method, whereby deferred tax assets and liabilities are recognized based on the future tax consequences attributable to temporary differences between the financial statement carrying amounts of existing assets and liabilities and their respective tax bases, as well as attributable to operating loss and tax credit carryforwards. Deferred tax assets and liabilities are measured using enacted tax rates expected to apply in the years in which the temporary differences are expected to be recovered or paid. The effect on deferred tax assets and liabilities of a change in tax rates is recognized in earnings in the period when the changes are enacted.
A reduction of the carrying amounts of deferred tax assets by a valuation allowance is required if, based on the available evidence, it is more likely than not that such assets will not be realized. Accordingly, the need to establish valuation allowances for deferred tax assets are assessed each reporting period by us based on the more-likely-than-not realization threshold criterion. In the assessment for a valuation allowance, appropriate consideration is given to all positive and negative evidence related to the realization of the deferred tax assets. This assessment considers, among other matters, the nature, frequency and severity of current and cumulative losses, forecasts of future profitability, the duration of statutory carryforward periods, our experience with loss carryforwards not expiring unused and tax planning alternatives. Based upon an evaluation of all available evidence, we recorded a valuation allowance against our deferred tax assets of $730.8 million during the year ended November 30, 2008, and increased it by $269.6 million during the year ended November 30, 2009. In addition, for the year ended November 30, 2009, we recorded a reversal of our deferred tax asset valuation allowance of $351.8 million, primarily due to a change in tax legislation, which allowed us to carry back our fiscal year 2009 tax loss to recover previously paid income taxes. During the year ended November 30, 2010, we recorded a reversal of the deferred tax asset valuation allowance of $37.9 million primarily due to the recording of a deferred tax liability from the issuance of 2.75% Convertible Senior Notes, and the net earnings generated
during the year. The reversal of the deferred tax asset valuation allowance related to the issuance of the 2.75% Convertible Senior Notes was recorded as an adjustment to additional paid-in capital. At November 30, 2010 and 2009, our deferred tax asset valuation allowance was $609.5 million and $647.4 million, respectively. In future periods, the allowance could be reduced based on sufficient evidence indicating that it is more likely than not that a portion or all of our deferred tax assets will be realized. At both November 30, 2010 and 2009, we had no net deferred tax assets.
We believe that the accounting estimate for the valuation of deferred tax assets is a critical accounting estimate because judgment is required in assessing the likely future tax consequences of events that have been recognized in our financial statements or tax returns. We base our estimate of deferred tax assets and liabilities on current tax laws and rates and, in certain cases, business plans and other expectations about future outcomes. Changes in existing tax laws or rates could affect actual tax results and future business results, which may affect the amount of deferred tax liabilities or the valuation of deferred tax assets over time. Our accounting for deferred tax consequences represents our best estimate of future events.
Lennar Homebuilding Operations
Revenue Recognition
Revenues from sales of homes are recognized when sales are closed and title passes to the new homeowner, the new homeowner’s initial and continuing investment is adequate to demonstrate a commitment to pay for the home, the new homeowner’s receivable is not subject to future subordination and we do not have a substantial continuing involvement with the new home. Revenues from sales of land are recognized when a significant down payment is received, the earnings process is complete, title passes and collectability of the receivable is reasonably assured. We believe that the accounting policy related to revenue recognition is a critical accounting policy because of the significance of revenue.
Inventories
Inventories are stated at cost unless the inventory within a community is determined to be impaired, in which case the impaired inventory is written down to fair value. Inventory costs include land, land development and home construction costs, real estate taxes, deposits on land purchase contracts and interest related to development and construction. We review our inventory for indicators of impairment by evaluating each community during each reporting period. The inventory within each community is categorized as finished homes and construction in progress or land under development based on the development state of the community. There were 440 and 390 active communities as of November 30, 2010 and 2009, respectively. If the undiscounted cash flows expected to be generated by a community are less than its carrying amount, an impairment charge is recorded to write down the carrying amount of such community to its fair value.
In conducting our review for indicators of impairment on a community level, we evaluate, among other things, the margins on homes that have been delivered, margins on homes under sales contracts in backlog, projected margins on homes with regard to future home sales over the life of the community, projected margins with regard to future land sales, and the estimated fair value of the land itself. We pay particular attention to communities in which inventory is moving at a slower than anticipated absorption pace and communities whose average sales price and/or margins are trending downward and are anticipated to continue to trend downward. From this review, we identify communities whose carrying values exceed their undiscounted cash flows. Although gross margins for all of our homebuilding segments, and Homebuilding Other, except Homebuilding Houston, have improved for the year ended November 30, 2010, revenues of our Homebuilding Central, Homebuilding West and Homebuilding Houston segments decreased 4%, 20% and 17%, respectively, for the year ended November 30, 2010, compared to the year ended November 30, 2009 due to a decrease in absorption pace.
We estimate the fair value of our communities using a discounted cash flow model. The projected cash flows for each community are significantly impacted by estimates related to market supply and demand, product type by community, homesite sizes, sales pace, sales prices, sales incentives, construction costs, sales and marketing expenses, the local economy, competitive conditions, labor costs, costs of materials and other factors for that particular community. Every division evaluates the historical performance of each of its communities as well as the current trends in the market and economy impacting the community and its surrounding areas. These trends are analyzed for each of the estimates listed above. For example, since the start of the downturn in the housing market, we have found ways to reduce our construction costs in many communities, and this reduction in construction costs in addition to changes in product type in many communities has impacted future estimated cash flows.
Each of the homebuilding markets in which we operate is unique, as homebuilding has historically been a local business driven by local market conditions and demographics. Each of our homebuilding markets has specific supply and demand relationships reflective of local economic conditions. Our projected cash flows are impacted by many assumptions. Some of the most critical assumptions in our cash flow models are our projected absorption pace for home sales, sales prices and costs to build and deliver our homes on a community by community basis.
In order to arrive at the assumed absorption pace for home sales included in our cash flow models, we analyze our historical absorption pace in the community as well as other communities in the geographical area. In addition, we analyze internal and external market studies and trends, which generally include, but are not limited to, statistics on population demographics, unemployment rates and availability of competing product in the geographic area where the community is located. When analyzing our historical absorption pace for home sales and corresponding internal and external market studies, we place greater emphasis on more current metrics and trends such as the absorption pace realized in our most recent quarters as well as forecasted population demographics, unemployment rates and availability of competing product. Generally, if we notice a variation from historical results over a span of two fiscal quarters, we consider such variation to be the establishment of a trend and adjust our historical information accordingly in order to develop assumptions on the projected absorption pace in the cash flow model for a community.
In order to determine the assumed sales prices included in our cash flow models, we analyze the historical sales prices realized on homes we delivered in the community and other communities in the geographical area as well as the sales prices included in our current backlog for such communities. In addition, we analyze internal and external market studies and trends, which generally include, but are not limited to, statistics on sales prices in neighboring communities and sales prices on similar products in non-neighboring communities in the geographic area where the community is located. When analyzing our historical sales prices and corresponding market studies, we also place greater emphasis on more current metrics and trends such as future forecasted sales prices in neighboring communities as well as future forecasted sales prices for similar product in non-neighboring communities. Generally, if we notice a variation from historical results over a span of two fiscal quarters, we consider such variation to be the establishment of a trend and adjust our historical information accordingly in order to develop assumptions on the projected sales prices in the cash flow model for a community.
In order to arrive at our assumed costs to build and deliver our homes, we generally assume a cost structure reflecting contracts currently in place with our vendors adjusted for any anticipated cost reduction initiatives or increases in cost structure. Costs assumed in our cash flow models for our communities are generally based on the rates we are currently obligated to pay under existing contracts with our vendors adjusted for any anticipated cost reduction initiatives or increases in cost structure.
Due to the fact that the estimates and assumptions included in our cash flow models are based upon historical results and projected trends, they do not anticipate unexpected changes in market conditions or strategies that may lead to us incurring additional impairment charges in the future.
Using all the available trend information, we calculate our best estimate of projected cash flows for each community. While many of the estimates are calculated based on historical and projected trends, all estimates are subjective and change from market to market and community to community as market and economic conditions change. The determination of fair value also requires discounting the estimated cash flows at a rate we believe a market participant would determine to be commensurate with the inherent risks associated with the assets and related estimated cash flow streams. The discount rate used in determining each asset’s fair value depends on the community’s projected life and development stage. We generally use a discount rate of approximately 20%, subject to the perceived risks associated with the community’s cash flow streams relative to its inventory.
We estimate the fair value of inventory evaluated for impairment based on market conditions and assumptions made by management at the time the inventory is evaluated, which may differ materially from actual results if market conditions or our assumptions change. For example, further market deterioration or changes in our assumptions may lead to us incurring additional impairment charges on previously impaired inventory, as well as on inventory not currently impaired, but for which indicators of impairment may arise if further market deterioration occurs.
We also have access to land inventory through option contracts, which generally enables us to defer acquiring portions of properties owned by third parties and unconsolidated entities until we have determined whether to exercise our option. A majority of our option contracts require a non-refundable cash deposit or
irrevocable letter of credit based on a percentage of the purchase price of the land. Our option contracts are recorded at cost. In determining whether to walk-away from an option contract, we evaluate the option primarily based upon the expected cash flows from the property that is the subject of the option. If we intend to walk-away from an option contract, we record a charge to earnings in the period such decision is made for the deposit amount and related pre-acquisition costs associated with the option contract.
We believe that the accounting related to inventory valuation and impairment is a critical accounting policy because: (1) assumptions inherent in the valuation of our inventory are highly subjective and susceptible to change and (2) the impact of recognizing impairments on our inventory has been and could continue to be material to our consolidated financial statements. Our evaluation of inventory impairment, as discussed above, includes many assumptions. The critical assumptions include the timing of the home sales within a community, management’s projections of selling prices and costs and the discount rate applied to estimate the fair value of the homesites within a community on the balance sheet date. Our assumptions on the timing of home sales are critical because the homebuilding industry has historically been cyclical and sensitive to changes in economic conditions such as interest rates, credit availability, unemployment levels and consumer sentiment. Changes in these economic conditions could materially affect the projected sales price, costs to develop the homesites and/or absorption rate in a community. Our assumptions on discount rates are critical because the selection of a discount rate affects the estimated fair value of the homesites within a community. A higher discount rate reduces the estimated fair value of the homesites within the community, while a lower discount rate increases the estimated fair value of the homesites within a community. Because of changes in economic and market conditions and assumptions and estimates required of management in valuing inventory during changing market conditions, actual results could differ materially from management’s assumptions and may require material inventory impairment charges to be recorded in the future.
During the years ended November 30, 2010, 2009 and 2008, we recorded the following inventory impairments:
| Years Ended November 30, | ||||||||||||
| 2010 | 2009 | 2008 | ||||||||||
| (In thousands) | ||||||||||||
Valuation adjustments to finished homes, CIP and land on which we intend to build homes (1) | $ | 44,717 | 180,239 | 195,518 | ||||||||
Valuation adjustments to land we intend to sell or have sold to third parties | 3,436 | 95,314 | 47,791 | |||||||||
Write-offs of option deposits and pre-acquisition costs | 3,105 | 84,372 | 97,172 | |||||||||
Total inventory impairments | $ | 51,258 | 359,925 | 340,481 | ||||||||
The valuation adjustments were estimated based on market conditions and assumptions made by management at the time the valuation adjustments were recorded, which may differ materially from actual results if market conditions or our assumptions change. See Note 2 of the notes to our consolidated financial statements included in Item 8 of this document for details related to valuation adjustments and write-offs by reportable segment and Homebuilding Other.
Warranty Costs
Although we subcontract virtually all aspects of construction to others and our contracts call for the subcontractors to repair or replace any deficient items related to their trades, we are primarily responsible to homebuyers to correct any deficiencies. Additionally, in some instances, we may be held responsible for the actions of or losses incurred by subcontractors. Warranty reserves are established at an amount estimated to be adequate to cover potential costs for materials and labor with regard to warranty-type claims expected to be incurred subsequent to the delivery of a home. Reserves are determined based upon historical data and trends with respect to similar product types and geographical areas. We believe the accounting estimate related to the reserve for warranty costs is a critical accounting estimate because the estimate requires a large degree of judgment.
At November 30, 2010, the reserve for warranty costs was $109.2 million, which included $23.3 million related to defective drywall manufactured in China that was purchased and installed by various of our subcontractors. While we believe that the reserve for warranty costs is adequate, there can be no assurances that
historical data and trends will accurately predict our actual warranty costs. Additionally, there can be no assurances that future economic or financial developments might not lead to a significant change in the reserve.
Lennar Homebuilding Investments in Unconsolidated Entities
We strategically invest in unconsolidated entities that acquire and develop land (1) for our homebuilding operations or for sale to third parties or (2) for construction of homes for sale to third-party homebuyers. Our partners generally are unrelated homebuilders, land owners/developers and financial or other strategic partners.
Most of the unconsolidated entities through which we acquire and develop land are accounted for by the equity method of accounting because we are not the primary beneficiary, and we have a significant, but less than controlling, interest in the entities. We record our investments in these entities in our consolidated balance sheets as “Lennar Homebuilding Investments in Unconsolidated Entities” and our pro-rata share of the entities’ earnings or losses in our consolidated statements of operations as “Lennar Homebuilding Equity in Earnings (Loss) from Unconsolidated Entities,” as described in Note 4 of the notes to our consolidated financial statements. Advances to these entities are included in the investment balance.
Management looks at specific criteria and uses its judgment when determining if we are the primary beneficiary of, or have a controlling interest in, an unconsolidated entity. Factors considered in determining whether we have significant influence or we have control include risk and reward sharing, experience and financial condition of the other partners, voting rights, involvement in day-to-day capital and operating decisions and continuing involvement. The accounting policy relating to the use of the equity method of accounting is a critical accounting policy due to the judgment required in determining whether we are the primary beneficiary or have control or significant influence.
As of November 30, 2010, we believe that the equity method of accounting is appropriate for our investments in Lennar Homebuilding unconsolidated entities where we are not the primary beneficiary and we do not have a controlling interest, but rather share control with our partners. At November 30, 2010, the Lennar Homebuilding unconsolidated entities in which we had investments had total assets of $3.8 billion and total liabilities of $1.6 billion.
We evaluate our investments in Lennar Homebuilding unconsolidated entities for indicators of impairment during each reporting period. A series of operating losses of an investee or other factors may indicate that a decrease in the value of our investment in the Lennar Homebuilding unconsolidated entity has occurred which is other-than-temporary. The amount of impairment recognized is the excess of the investment’s carrying amount over its estimated fair value.
The evaluation of our investment in Lennar Homebuilding unconsolidated entities includes certain critical assumptions: (1) projected future distributions from the unconsolidated entities, (2) discount rates applied to the future distributions and (3) various other factors.
Our assumptions on the projected future distributions from the Lennar Homebuilding unconsolidated entities are dependent on market conditions. Specifically, distributions are dependent on cash to be generated from the sale of inventory by the Lennar Homebuilding unconsolidated entities. Such inventory is also reviewed for potential impairment by the Lennar Homebuilding unconsolidated entities. The review for inventory impairment performed by our Lennar Homebuilding unconsolidated entities is materially consistent with our process, as discussed above, for evaluating our own inventory as of the end of a reporting period. The Lennar Homebuilding unconsolidated entities generally also use a discount rate of approximately 20% in their reviews for impairment, subject to the perceived risks associated with the community’s cash flow streams relative to its inventory. If a valuation adjustment is recorded by an unconsolidated entity related to its assets, our proportionate share of it is reflected in our Lennar Homebuilding equity in loss from unconsolidated entities with a corresponding decrease to our Lennar Homebuilding investment in unconsolidated entities. In certain instances, we may be required to record additional losses relating to our Lennar Homebuilding investment in unconsolidated entities; such losses are included in Lennar Homebuilding other income (expense), net. We believe our assumptions on the projected future distributions from the Lennar Homebuilding unconsolidated entities are critical because the operating results of the Lennar Homebuilding unconsolidated entities from which the projected distributions are derived are dependent on the status of the homebuilding industry, which has historically been cyclical and sensitive to changes in economic conditions such as interest rates, credit availability, unemployment levels and consumer sentiment. Changes in these economic conditions could materially affect the projected operational results of the Lennar Homebuilding unconsolidated entities from which the distributions are derived.
In addition, we believe our assumptions on discount rates are critical accounting policies because the selection of the discount rates affects the estimated fair value of our Lennar Homebuilding investments in unconsolidated entities. A higher discount rate reduces the estimated fair value of our Lennar Homebuilding investments in unconsolidated entities, while a lower discount rate increases the estimated fair value of our Lennar Homebuilding investments in unconsolidated entities. Because of changes in economic conditions, actual results could differ materially from management’s assumptions and may require material valuation adjustments to our Lennar Homebuilding investments in unconsolidated entities to be recorded in the future.
Additionally, we consider various qualitative factors to determine if a decrease in the value of our investment is other-than-temporary. These factors include age of the venture, intent and ability for us to recover our investment in the entity, financial condition and long-term prospects of the entity, short-term liquidity needs of the unconsolidated entity, trends in the general economic environment of the land, entitlement status of the land held by the unconsolidated entity, overall projected returns on investments, defaults under contracts with third parties (including bank debt), recoverability of the investment through future cash flows and relationships with the other partners and banks. If we believe that the decline in the fair value of the investment is temporary, then no impairment is recorded.
During the years ended November 30, 2010, 2009 and 2008, we recorded the following valuation adjustments related to our Lennar Homebuilding investments in unconsolidated entities:
| Years Ended November 30, | ||||||||||||
| 2010 | 2009 | 2008 | ||||||||||
| (In thousands) | ||||||||||||
Our share of valuation adjustments related to assets of Lennar Homebuilding unconsolidated entities | $ | 10,461 | 101,893 | 32,245 | ||||||||
Valuation adjustments to our Lennar Homebuilding investments in unconsolidated entities | 1,735 | 88,972 | 172,790 | |||||||||
Total valuation adjustments to our Lennar Homebuilding investments in unconsolidated entities | $ | 12,196 | 190,865 | 205,035 | ||||||||
These valuation adjustments were calculated based on market conditions and assumptions made by management at the time the valuation adjustments were recorded, which may differ materially from actual results if market conditions or our assumptions change. See Note 2 of the notes to our consolidated financial statements included in Item 8 of this document for details related to valuation adjustments and write-offs by reportable segment and homebuilding other.
Consolidation of Variable Interest Entities
GAAP requires the consolidation of VIEs in which an enterprise has a controlling financial interest. A controlling financial interest will have both of the following characteristics: (a) the power to direct the activities of a VIE that most significantly impact the VIE’s economic performance and (b) the obligation to absorb losses of the VIE that could potentially be significant to the VIE or the right to receive benefits from the VIE that could potentially be significant to the VIE.
Our variable interest in VIEs may be in the form of (1) equity ownership, (2) contracts to purchase assets, (3) management services and development agreements between us and a VIE, (4) loans provided by us to a VIE or other partner and/or (5) guarantees provided by members to banks and other third parties. We examine specific criteria and use our judgment when determining if we are the primary beneficiary of a VIE. Factors considered in determining whether we are the primary beneficiary include risk and reward sharing, experience and financial condition of other partner(s), voting rights, involvement in day-to-day capital and operating decisions, representation on a VIE’s executive committee, existence of unilateral kick-out rights or voting rights, level of economic disproportionality between us and the other partner(s) and contracts to purchase assets from VIEs. The accounting policy relating to variable interest entities is a critical accounting policy because the determination whether an entity is a VIE and, if so, whether we are primary beneficiary may require us to exercise significant judgment.
Generally, all major decision making in our joint ventures is shared between all partners. In particular, business plans and budgets are generally required to be unanimously approved by all partners. Usually, management and other fees earned by us are nominal and believed to be at market and there is no significant economic disproportionality between us and other partners. Generally, we purchase less than a majority of the JV’s assets and the purchase prices under our option contracts are believed to be at market.
Generally, our Lennar Homebuilding unconsolidated entities become VIEs and consolidate when the other partner(s) lack the intent and financial wherewithal to remain in the entity. As a result, we continue to fund operations and debt paydowns through partner loans or substituted capital contributions.
Financial Services Operations
Revenue Recognition
Premiums from title insurance policies are recognized as revenue on the effective date of the policies. Escrow fees and loan origination revenues are recognized at the time the related real estate transactions are completed, usually upon the close of escrow. Expected gains and losses from the sale of loans and their related servicing rights are included in the measurement of all written loan commitments that are accounted for at fair value through earnings at the time of commitment. Interest income on loans held-for-sale and loans held-for-investment is recognized as earned over the terms of the mortgage loans based on the contractual interest rates. We believe that the accounting policy related to revenue recognition is a critical accounting policy because of the significance of revenue.
Loan Origination Liabilities
Substantially all of the loans we originate are sold within a short period in the secondary mortgage market on a servicing released, non-recourse basis. After the loans are sold, we retain potential liability for possible claims by purchasers that we breached certain limited industry-standard representations and warranties in the loan sale agreement. There has been an increased industry-wide effort by purchasers to defray their losses in an unfavorable economic environment by purporting to have found inaccuracies related to sellers’ representations and warranties in particular loan sale agreements. Our mortgage operations has established liabilities for anticipated losses associated with mortgage loans previously originated and sold to investors. We establish liabilities for such anticipated losses based upon, among other things, an analysis of repurchase requests received, an estimate of potential repurchase claims not yet received, our actual past repurchases, and losses through the disposition of affected loans. While we believe that we have adequately reserved for losses known and projected repurchase requests, given the volatility in the mortgage industry and the uncertainty regarding the ultimate resolution of these claims, if either actual repurchases or the losses incurred resolving those repurchases exceed our expectations, additional recourse expense may be incurred. This allowance requires management’s judgment and estimate. For these reasons, we believe that the accounting estimate related to the loan origination losses is a critical accounting estimate.
Goodwill
At both November 30, 2010 and 2009, our goodwill was $34.0 million, which is part of our Lennar Financial Services segment. Goodwill represents the excess of the purchase price paid over the fair value of the net assets acquired in business combinations. Evaluating goodwill for impairment involves the determination of the fair value of our reporting units in which we have recorded goodwill. A reporting unit is a component of an operating segment for which discrete financial information is available and reviewed by management on a regular basis. Inherent in the determination of fair value of our reporting units are certain estimates and judgments, including the interpretation of current economic indicators and market valuations as well as our strategic plans with regard to our operations. To the extent additional information arises or our strategies change, it is possible that our conclusion regarding goodwill impairment could change, which could have a material effect on our financial position and results of operations. For these reasons, we believe that the accounting estimate related to goodwill impairment is a critical accounting estimate.
We review goodwill annually (or whenever indicators of impairment exist) for impairment. Due to operating losses in the title operations of our Lennar Financial Services segment through the nine months ended August 31, 2010 and other factors, we evaluated the carrying value of our Lennar Financial Services segment’s goodwill in both our third and fourth quarters of 2010. The evaluations concluded that an impairment was not required for our Lennar Financial Services segment’s goodwill during 2010.
During the year ended November 30, 2009, we did not record goodwill impairment charges. During the year ended November 30, 2008, we impaired $27.2 million of our Lennar Financial Services segment’s goodwill. As of November 30, 2010 and 2009, there were no material identifiable intangible assets, other than goodwill.
For our review of the Lennar Financial Services segment’s goodwill during the years ended November 30, 2010 and 2009, we determined the fair value of our Lennar Financial Services segment based entirely on the
income approach due to a lack of guideline companies with adequate comparisons to our Lennar Financial Services segment on a stand alone basis.
The income approach establishes fair value by methods which discount or capitalize earnings and/or cash flow by a discount or capitalization rate that reflects market rate of return expectations, market conditions and the risk of the relative investment. We used a discounted cash flow method when applying the income approach. This analysis includes operating income, interest expense, taxes and incremental working capital, as well as other factors. The projections used in the analysis are for a five-year period and represent what we consider to be normalized earnings.
In determining the fair value of our Lennar Financial Services segment under the income approach, our expected cash flows are affected by various assumptions. The most significant assumptions affecting our expected cash flows are the discount rate, projected revenue growth rate and operating profit margin. The impact of a change in any of our significant underlying assumptions +/- 1% would not result in a materially different fair value.
Rialto Investments
Loans Acquired with Deteriorated Credit Quality
All of the acquired loans for which (1) there was evidence of credit quality deterioration since origination and (2) for which it was deemed probable that we would be unable to collect all contractually required principal and interest payments were accounted under ASC Topic 310-30,Loans and Debt Securities Acquired with Deteriorated Credit Quality, (“ASC 310-30”). For loans accounted for under ASC 310-30, management determined upon acquisition the loan’s value based on extensive due diligence on each of the loans, the underlying properties and the borrowers. We determined fair value by discounting the cash flows expected to be collected adjusted for factors that a market participant would consider when determining fair value. Factors considered in the valuation were projected cash flows for the loans, type of loan and related collateral, classification status and current discount rates. Since the estimates are based on projections, all estimates are subjective and can change due to unexpected changes in economic conditions and loan performance. For these reasons, we believe that the accounting related to loans with deteriorated credit quality is a critical accounting policy.
Revenue Recognition—Accretable Yield
Under ASC 310-30, loans were pooled together according to common risk characteristics. The excess of the cash flows expected to be collected from the loans receivable at acquisition over the initial investment for those loans receivable is referred to as the accretable yield and is recognized in interest income over the expected life of the pools primarily using the effective yield method. The difference between contractually required payments at acquisition and the cash flows expected to be collected is referred to as the nonaccretable difference. Changes in the expected cash flows of loans receivable from the date of acquisition will either impact the accretable yield or result in a charge to the provision for loan losses in the period in which the changes become probable. Prepayments are treated as a reduction of cash flows expected to be collected and a reduction of contractually required payments such that the nonaccretable difference is not affected. Subsequent significant decreases to the expected cash flows will generally result in a charge to the provision for loan losses, resulting in an increase to the allowance for loan losses, and a reclassification from accretable yield to nonaccretable difference. Subsequent probable and significant increases in cash flows will result in a recovery of any previously recorded allowance for loan losses, to the extent applicable, and a reclassification from nonaccretable difference to accretable yield. Amounts related to the ASC 310-30 loans are estimates and may change as we obtain additional information related to the respective loans and the inherent uncertainty associated with estimating the amount and timing of the expected cash flows associated with distressed residential and commercial real estate loans. The timing and amount of expected cash flows and related accretable yield can also be impacted by disposal of loans, loans payoffs or expected foreclosures, which result in removal of the loans from the pools. Since the cash flows are based on projections, they are subjective and can change due to unexpected changes in economic conditions and loan performance. We believe that the accretable yield is a critical accounting policy because of the significant judgment required.
Nonaccrual Loans—Revenue Recognition & Impairment
Management classifies certain loans as nonaccrual and discontinues accruing interest income when future collectability of the recorded loan balance is doubtful. When a loan is classified as nonaccrual, unpaid accrued interest income recognized is reversed and any subsequent cash receipt is accounted for using either the cost recovery or cash basis method. Loans are generally returned to accrual status when payments are made that bring the loan account current under the terms of the agreement or when the loan becomes well secured and is in
the process of collection. A loan is considered impaired when, based on current information and events, the carrying value of the receivable is in excess of its fair value. Impairment is measured on a loan-by-loan basis by either the present value of expected future cash flows discounted at the loan’s effective interest rate, the loans obtainable market price, or the fair value of the collateral. If we determine that the value of the impaired loan is less than the recorded investment in the loan, we recognize impairment through an allowance estimate or a charge-off to the allowance.
Real Estate Owned
Real estate owned represents real estate which our Rialto segment has taken control of in partial or full satisfaction of loans receivable. At the time of acquisition, REO is recorded at fair value less estimated costs to sell, which becomes the property’s new basis. The amount by which the recorded investment in the loan is greater or less than the REO’s fair value (net of estimated cost to sell), is recorded as a gain or loss on foreclosure within Rialto Investments other income, net, in our consolidated statement of operations. Subsequently, management periodically performs valuations such that the real estate is carried at the lower of its new cost basis or fair value, net of estimated costs to sell. Any subsequent valuation adjustments, operating expenses or income, and gains and losses on disposition of such properties are also recognized in Rialto Investments other income, net. We believe that the accounting for REO is a critical accounting policy because of the significant judgment required.
Item 7A. Quantitative and Qualitative Disclosures About Market Risk.
We are exposed to market risks related to fluctuations in interest rates on our investments, debt obligations, loans held-for-sale and loans held-for-investment. We utilize forward commitments and option contracts to mitigate the risks associated with our mortgage loan portfolio. The table below provides information at November 30, 2010 about our significant financial instruments that are sensitive to changes in interest rates. For loans held-for-sale, loans held-for-investment, net and investments held-to-maturity, senior notes and other debts payable and notes and other debts payable, the table presents principal cash flows and related weighted average effective interest rates by expected maturity dates and estimated fair values at November 30, 2010. Weighted average variable interest rates are based on the variable interest rates at November 30, 2010. Rialto Investments loans receivable are not included in the table below because income is recorded through accretable yield due to the loans acquired having deteriorated credit quality, thus we believe they are not sensitive to changes in interest rates. See Management’s Discussion and Analysis of Financial Condition and Results of Operations in Item 7 and Notes 1 and 14 of the notes to consolidated financial statements in Item 8 for a further discussion of these items and our strategy of mitigating our interest rate risk.
Information Regarding Interest Rate Sensitivity
Principal (Notional) Amount by
Expected Maturity and Average Interest Rate
November 30, 2010
| Years Ending November 30, | Thereafter | Total | Fair Value at November 30, 2010 | |||||||||||||||||||||||||||||
| 2011 | 2012 | 2013 | 2014 | 2015 | ||||||||||||||||||||||||||||
| (Dollars in millions) | ||||||||||||||||||||||||||||||||
ASSETS | ||||||||||||||||||||||||||||||||
Rialto Investments: | ||||||||||||||||||||||||||||||||
Investments held-to-maturity: | ||||||||||||||||||||||||||||||||
Fixed rate | $ | — | — | — | — | — | 19.5 | 19.5 | 19.5 | |||||||||||||||||||||||
Average interest rate | — | — | — | — | — | 4.0 | % | 4.0 | % | — | ||||||||||||||||||||||
Lennar Financial Services: | ||||||||||||||||||||||||||||||||
Loans held-for-sale: | ||||||||||||||||||||||||||||||||
Fixed rate | $ | — | — | — | — | — | 236.1 | 236.1 | 236.1 | |||||||||||||||||||||||
Average interest rate | — | — | — | — | — | 4.3 | % | 4.3 | % | — | ||||||||||||||||||||||
Variable rate | $ | — | — | — | — | — | 9.3 | 9.3 | 9.3 | |||||||||||||||||||||||
Average interest rate | — | — | — | — | — | 3.1 | % | 3.1 | % | — | ||||||||||||||||||||||
Loans held-for-investment, net and investments held-to-maturity: | ||||||||||||||||||||||||||||||||
Fixed rate | $ | 2.8 | 1.4 | 0.5 | 0.6 | 0.6 | 13.1 | 19.0 | 20.3 | |||||||||||||||||||||||
Average interest rate | 1.9 | % | 3.0 | % | 7.1 | % | 7.1 | % | 7.2 | % | 6.6 | % | 5.7 | % | — | |||||||||||||||||
Variable rate | $ | 0.1 | 0.1 | 0.2 | 0.2 | 0.2 | 5.1 | 5.9 | 5.9 | |||||||||||||||||||||||
Average interest rate | 3.6 | % | 3.6 | % | 3.7 | % | 3.7 | % | 3.7 | % | 4.0 | % | 4.0 | % | — | |||||||||||||||||
LIABILITIES | ||||||||||||||||||||||||||||||||
Lennar Homebuilding: | ||||||||||||||||||||||||||||||||
Senior notes and other debts payable: | ||||||||||||||||||||||||||||||||
Fixed rate | $ | 131.5 | 6.4 | 267.3 | 270.1 | 504.6 | 1,544.5 | 2,724.4 | 2,749.3 | |||||||||||||||||||||||
Average interest rate | 5.8 | % | 4.4 | % | 5.9 | % | 5.7 | % | 5.6 | % | 6.3 | % | 6.1 | % | — | |||||||||||||||||
Variable rate | $ | 75.5 | 231.9 | 85.9 | 9.5 | — | 1.0 | 403.8 | 403.8 | |||||||||||||||||||||||
Average interest rate | 2.9 | % | 3.3 | % | 4.8 | % | 5.5 | % | — | 3.5 | % | 3.6 | % | — | ||||||||||||||||||
Rialto Investments: | ||||||||||||||||||||||||||||||||
Notes payable: | ||||||||||||||||||||||||||||||||
Fixed rate (1) | $ | — | 156.9 | 314.0 | 156.0 | — | — | 626.9 | 600.1 | |||||||||||||||||||||||
Average interest rate | — | 0.0 | % | 0.0 | % | 0.0 | % | — | — | — | — | |||||||||||||||||||||
Variable rate | $ | — | 13.0 | 20.0 | 33.0 | 33.0 | 26.4 | 125.4 | 119.6 | |||||||||||||||||||||||
Average interest rate | — | 4.5 | % | 4.5 | % | 4.5 | % | 4.5 | % | 4.5 | % | 4.5 | % | — | ||||||||||||||||||
Lennar Financial Services: | ||||||||||||||||||||||||||||||||
Notes and other debts payable: | ||||||||||||||||||||||||||||||||
Fixed rate | $ | 0.1 | — | — | — | — | — | 0.1 | 0.1 | |||||||||||||||||||||||
Average interest rate | 8.0 | % | — | — | — | — | — | 8.0 | % | — | ||||||||||||||||||||||
Variable rate | $ | 271.6 | — | — | — | — | — | 271.6 | 271.6 | |||||||||||||||||||||||
Average interest rate | 3.8 | % | — | — | — | — | — | 3.8 | % | — | ||||||||||||||||||||||
Management’s Annual Report on Internal Control Over Financial Reporting
Our management is responsible for establishing and maintaining adequate internal control over financial reporting, as such term is defined in Exchange Act Rule 13a-15(f). Under the supervision and with the participation of our management, including our CEO and CFO, we conducted an evaluation of the effectiveness of our internal control over financial reporting based on the framework inInternal Control—Integrated Frameworkissued by the Committee of Sponsoring Organizations of the Treadway Commission. Based on our evaluation under the framework inInternal Control—Integrated Framework,our management concluded that our internal control over financial reporting was effective as of November 30, 2010. The effectiveness of our internal control over financial reporting as of November 30, 2010 has been audited by Deloitte & Touche LLP, an independent registered public accounting firm, as stated in their attestation report which is included herein.
REPORT OF INDEPENDENT REGISTERED PUBLIC ACCOUNTING FIRM
To the Board of Directors and Stockholders of Lennar Corporation
We have audited the internal control over financial reporting of Lennar Corporation and subsidiaries (the “Company”) as of November 30, 2010, based on the criteria established inInternal Control—Integrated Framework issued by the Committee of Sponsoring Organizations of the Treadway Commission. The Company’s management is responsible for maintaining effective internal control over financial reporting and for its assessment of the effectiveness of internal control over financial reporting, included in the accompanying Management’s Annual Report on Internal Control Over Financial Reporting. Our responsibility is to express an opinion on the Company’s internal control over financial reporting based on our audit.
We conducted our audit in accordance with the standards of the Public Company Accounting Oversight Board (United States). Those standards require that we plan and perform the audit to obtain reasonable assurance about whether effective internal control over financial reporting was maintained in all material respects. Our audit included obtaining an understanding of internal control over financial reporting, assessing the risk that a material weakness exists, testing and evaluating the design and operating effectiveness of internal control based on the assessed risk, and performing such other procedures as we considered necessary in the circumstances. We believe that our audit provides a reasonable basis for our opinion.
A company’s internal control over financial reporting is a process designed by, or under the supervision of, the company’s principal executive and principal financial officers, or persons performing similar functions, and effected by the company’s board of directors, management, and other personnel to provide reasonable assurance regarding the reliability of financial reporting and the preparation of financial statements for external purposes in accordance with generally accepted accounting principles. A company’s internal control over financial reporting includes those policies and procedures that (1) pertain to the maintenance of records that, in reasonable detail, accurately and fairly reflect the transactions and dispositions of the assets of the company; (2) provide reasonable assurance that transactions are recorded as necessary to permit preparation of financial statements in accordance with generally accepted accounting principles, and that receipts and expenditures of the company are being made only in accordance with authorizations of management and directors of the company; and (3) provide reasonable assurance regarding prevention or timely detection of unauthorized acquisition, use, or disposition of the company’s assets that could have a material effect on the financial statements.
Because of the inherent limitations of internal control over financial reporting, including the possibility of collusion or improper management override of controls, material misstatements due to error or fraud may not be prevented or detected on a timely basis. Also, projections of any evaluation of the effectiveness of the internal control over financial reporting to future periods are subject to the risk that the controls may become inadequate because of changes in conditions, or that the degree of compliance with the policies or procedures may deteriorate.
In our opinion, the Company maintained, in all material respects, effective internal control over financial reporting as of November 30, 2010, based on the criteria established inInternal Control—Integrated Framework issued by the Committee of Sponsoring Organizations of the Treadway Commission.
We have also audited, in accordance with the standards of the Public Company Accounting Oversight Board (United States), the consolidated financial statements as of and for the year ended November 30, 2010 of the Company and our report dated January 31, 2011 expressed an unqualified opinion on those financial statements and included an explanatory paragraph related to retrospective adjustments for the adoption of certain accounting standards related to the presentation of noncontrolling interests and the disclosure guidance applicable to variable interest entities and the adoption of other provisions of the amended consolidation guidance applicable to variable interest entities which resulted in the deconsolidation of certain option contracts.
/s/ DELOITTE & TOUCHE LLP
Certified Public Accountants
Miami, Florida
January 31, 2011
Item 8. Financial Statements and Supplementary Data.
REPORT OF INDEPENDENT REGISTERED PUBLIC ACCOUNTING FIRM
To the Board of Directors and Stockholders of Lennar Corporation
We have audited the accompanying consolidated balance sheets of Lennar Corporation and subsidiaries (the “Company”) as of November 30, 2010 and 2009, and the related consolidated statements of operations, equity, and cash flows for each of the three years in the period ended November 30, 2010. These financial statements are the responsibility of the Company’s management. Our responsibility is to express an opinion on these financial statements based on our audits.
We conducted our audits in accordance with the standards of the Public Company Accounting Oversight Board (United States). Those standards require that we plan and perform the audit to obtain reasonable assurance about whether the financial statements are free of material misstatement. An audit includes examining, on a test basis, evidence supporting the amounts and disclosures in the financial statements. An audit also includes assessing the accounting principles used and significant estimates made by management, as well as evaluating the overall financial statement presentation. We believe that our audits provide a reasonable basis for our opinion.
In our opinion, such consolidated financial statements present fairly, in all material respects, the financial position of Lennar Corporation and subsidiaries as of November 30, 2010 and 2009 and the results of their operations and their cash flows for each of the three years in the period ended November 30, 2010, in conformity with accounting principles generally accepted in the United States of America.
As discussed in Note 1 to the consolidated financial statements, the accompanying 2009 and 2008 consolidated financial statements have been retrospectively adjusted for the adoption, on December 1, 2009, of certain accounting standards related to the presentation of noncontrolling interests and the disclosure guidance applicable to variable interest entities. The Company also adopted other provisions of the amended consolidation guidance applicable to variable interest entities which resulted in the deconsolidation of certain option contracts on December 1, 2009.
We have also audited, in accordance with the standards of the Public Company Accounting Oversight Board (United States), the Company’s internal control over financial reporting as of November 30, 2010, based on the criteria established inInternal Control—Integrated Framework issued by the Committee of Sponsoring Organizations of the Treadway Commission and our report dated January 31, 2011 expressed an unqualified opinion on the Company’s internal control over financial reporting.
/s/ DELOITTE & TOUCHE LLP
Certified Public Accountants
Miami, Florida
January 31, 2011
LENNAR CORPORATION AND SUBSIDIARIES
CONSOLIDATED BALANCE SHEETS
November 30, 2010 and 2009
| 2010 (1) | 2009 (1) | |||||||
| (In thousands, except shares and per share amounts) | ||||||||
| ASSETS | ||||||||
Lennar Homebuilding: | ||||||||
Cash and cash equivalents | $ | 1,207,247 | 1,330,603 | |||||
Restricted cash | 8,195 | 9,225 | ||||||
Income tax receivables | 3,783 | 334,428 | ||||||
Receivables, net | 78,419 | 122,053 | ||||||
Inventories: | ||||||||
Finished homes and construction in progress | 1,491,292 | 1,503,346 | ||||||
Land and land under development | 2,223,300 | 1,990,430 | ||||||
Consolidated inventory not owned | 455,016 | 594,213 | ||||||
Total inventories | 4,169,608 | 4,087,989 | ||||||
Investments in unconsolidated entities | 626,185 | 599,266 | ||||||
Other assets | 307,810 | 263,803 | ||||||
| 6,401,247 | 6,747,367 | |||||||
Rialto Investments: | ||||||||
Cash and cash equivalents | 76,412 | — | ||||||
Defeasance cash to retire notes payable | 101,309 | — | ||||||
Loans receivable | 1,219,314 | — | ||||||
Real estate owned | 258,104 | — | ||||||
Investments in unconsolidated entities | 84,526 | 9,874 | ||||||
Other assets | 37,949 | — | ||||||
| 1,777,614 | 9,874 | |||||||
Lennar Financial Services | 608,990 | 557,550 | ||||||
Total assets | $ | 8,787,851 | 7,314,791 | |||||
See accompanying notes to consolidated financial statements.
LENNAR CORPORATION AND SUBSIDIARIES
CONSOLIDATED BALANCE SHEETS
November 30, 2010 and 2009
| 2010 (2) | 2009 (2) | |||||||
| (In thousands, except shares and per share amounts) | ||||||||
| LIABILITIES AND EQUITY | ||||||||
Lennar Homebuilding: | ||||||||
Accounts payable | $ | 168,006 | 169,596 | |||||
Liabilities related to consolidated inventory not owned | 384,233 | 518,359 | ||||||
Senior notes and other debts payable | 3,128,154 | 2,761,352 | ||||||
Other liabilities | 694,142 | 862,584 | ||||||
| 4,374,535 | 4,311,891 | |||||||
Rialto Investments: | ||||||||
Notes payable and other liabilities | 770,714 | — | ||||||
Lennar Financial Services | 448,219 | 414,886 | ||||||
Total liabilities | 5,593,468 | 4,726,777 | ||||||
Stockholders’ equity: | ||||||||
Preferred stock | — | — | ||||||
Class A common stock of $0.10 par value per share | 16,701 | 16,515 | ||||||
Class B common stock of $0.10 par value per share | 3,297 | 3,296 | ||||||
Additional paid-in capital | 2,310,339 | 2,208,934 | ||||||
Retained earnings | 894,108 | 828,424 | ||||||
Treasury stock, at cost; 2010—11,664,744 Class A common shares and 1,679,620 Class B common shares; 2009—11,542,970 Class A common shares and 1,679,620 Class B common shares | (615,496 | ) | (613,690 | ) | ||||
Total stockholders’ equity | 2,608,949 | 2,443,479 | ||||||
Noncontrolling interests | 585,434 | 144,535 | ||||||
Total equity | 3,194,383 | 2,588,014 | ||||||
Total liabilities and equity | $ | 8,787,851 | 7,314,791 | |||||
See accompanying notes to consolidated financial statements.
LENNAR CORPORATION AND SUBSIDIARIES
CONSOLIDATED STATEMENTS OF OPERATIONS
Years Ended November 30, 2010, 2009 and 2008
| 2010 | 2009 | 2008 | ||||||||||
| (Dollars in thousands, except per share amounts) | ||||||||||||
Revenues: | ||||||||||||
Lennar Homebuilding | $ | 2,705,639 | 2,834,285 | 4,263,038 | ||||||||
Lennar Financial Services | 275,786 | 285,102 | 312,379 | |||||||||
Rialto Investments | 92,597 | — | — | |||||||||
Total revenues | 3,074,022 | 3,119,387 | 4,575,417 | |||||||||
Costs and expenses: | ||||||||||||
Lennar Homebuilding (1) | 2,543,323 | 3,210,386 | 4,541,881 | |||||||||
Lennar Financial Services (2) | 244,502 | 249,120 | 343,369 | |||||||||
Rialto Investments | 67,904 | 2,528 | — | |||||||||
Corporate general and administrative | 93,926 | 117,565 | 129,752 | |||||||||
Total costs and expenses | 2,949,655 | 3,579,599 | 5,015,002 | |||||||||
Lennar Homebuilding equity in loss from unconsolidated entities (3) | (10,966 | ) | (130,917 | ) | (59,156 | ) | ||||||
Lennar Homebuilding other income (expense), net (4) | 19,135 | (98,425 | ) | (172,387 | ) | |||||||
Other interest expense | (70,425 | ) | (70,850 | ) | (27,594 | ) | ||||||
Gain on recapitalization of Lennar Homebuilding unconsolidated entity | — | — | 133,097 | |||||||||
Rialto Investments equity in earnings from unconsolidated entities | 15,363 | — | — | |||||||||
Rialto Investments other income, net | 17,251 | — | — | |||||||||
Earnings (loss) before income taxes | 94,725 | (760,404 | ) | (565,625 | ) | |||||||
Benefit (provision) for income taxes (5) | 25,734 | 314,345 | (547,557 | ) | ||||||||
Net earnings (loss) (including net earnings (loss) attributable to noncontrolling interests) | 120,459 | (446,059 | ) | (1,113,182 | ) | |||||||
Less: Net earnings (loss) attributable to noncontrolling interests (6) | 25,198 | (28,912 | ) | (4,097 | ) | |||||||
Net earnings (loss) attributable to Lennar | $ | 95,261 | (417,147 | ) | (1,109,085 | ) | ||||||
Basic earnings (loss) per share | $ | 0.51 | (2.45 | ) | (7.01 | ) | ||||||
Diluted earnings (loss) per share | $ | 0.51 | (2.45 | ) | (7.01 | ) | ||||||
See accompanying notes to consolidated financial statements.
LENNAR CORPORATION AND SUBSIDIARIES
CONSOLIDATED STATEMENTS OF EQUITY
Years Ended November 30, 2010, 2009 and 2008
| 2010 | 2009 | 2008 | ||||||||||
| (Dollars in thousands) | ||||||||||||
Class A common stock: | ||||||||||||
Beginning balance | $ | 16,515 | 14,050 | 13,931 | ||||||||
Issuances of Class A common shares | — | 2,096 | — | |||||||||
Employee stock and director plans | 186 | 369 | 119 | |||||||||
Balance at November 30, | 16,701 | 16,515 | 14,050 | |||||||||
Class B common stock: | ||||||||||||
Beginning balance | 3,296 | 3,296 | 3,296 | |||||||||
Employee stock plans | 1 | — | — | |||||||||
Balance at November 30, | 3,297 | 3,296 | 3,296 | |||||||||
Additional paid-in capital: | ||||||||||||
Beginning balance | 2,208,934 | 1,944,626 | 1,920,386 | |||||||||
Issuances of Class A common shares | — | 218,875 | — | |||||||||
Employee stock and director plans | 8,150 | 25,332 | 12,940 | |||||||||
Tax provision from employee stock plans and vesting of restricted stock | — | — | (6,139 | ) | ||||||||
Amortization of restricted stock and performance-based stock options | 22,090 | 20,101 | 17,439 | |||||||||
Equity component of 2.75% convertible senior notes due 2020 | 71,165 | — | — | |||||||||
Balance at November 30, | 2,310,339 | 2,208,934 | 1,944,626 | |||||||||
Retained earnings: | ||||||||||||
Beginning balance | 828,424 | 1,273,159 | 2,496,933 | |||||||||
Net earnings (loss) attributable to Lennar | 95,261 | (417,147 | ) | (1,109,085 | ) | |||||||
Cash dividends—Class A common stock | (24,570 | ) | (22,448 | ) | (67,220 | ) | ||||||
Cash dividends—Class B common stock | (5,007 | ) | (5,140 | ) | (16,267 | ) | ||||||
Cumulative effect adjustments | — | — | (31,202 | ) | ||||||||
Balance at November 30, | 894,108 | 828,424 | 1,273,159 | |||||||||
Deferred compensation plan: | ||||||||||||
Beginning balance | — | — | (332 | ) | ||||||||
Deferred compensation activity | — | — | 332 | |||||||||
Balance at November 30, | $ | — | — | — | ||||||||
See accompanying notes to consolidated financial statements.
LENNAR CORPORATION AND SUBSIDIARIES
CONSOLIDATED STATEMENTS OF EQUITY—(Continued)
Years Ended November 30, 2010, 2009 and 2008
| 2010 | 2009 | 2008 | ||||||||||
| (Dollars in thousands) | ||||||||||||
Deferred compensation liability: | ||||||||||||
Beginning balance | $ | — | $ | — | 332 | |||||||
Deferred compensation activity | — | — | (332 | ) | ||||||||
Balance at November 30, | — | — | — | |||||||||
Treasury stock, at cost: | ||||||||||||
Beginning balance | (613,690 | ) | (612,124 | ) | (610,366 | ) | ||||||
Employee stock plans | (1,806 | ) | (1,566 | ) | (1,758 | ) | ||||||
Balance at November 30, | (615,496 | ) | (613,690 | ) | (612,124 | ) | ||||||
Accumulated other comprehensive loss: | ||||||||||||
Beginning balance | — | — | (2,061 | ) | ||||||||
Unrealized gain on Company’s portion of unconsolidated entity’s interest rate swap liability, net of tax | — | — | 2,061 | |||||||||
Balance at November 30, | — | — | — | |||||||||
Total stockholders’ equity | 2,608,949 | 2,443,479 | 2,623,007 | |||||||||
Noncontrolling interests: | ||||||||||||
Beginning balance | 144,535 | 165,746 | 28,528 | |||||||||
Net earnings (loss) attributable to noncontrolling interests | 25,198 | (28,912 | ) | (4,097 | ) | |||||||
Receipts related to noncontrolling interests | 14,088 | 5,620 | 154,275 | |||||||||
Payments related to noncontrolling interests | (4,848 | ) | (7,744 | ) | (3,240 | ) | ||||||
Rialto Investments non-cash consolidations | 397,588 | — | — | |||||||||
Non-cash activity related to noncontrolling interests | 8,873 | 9,825 | (9,720 | ) | ||||||||
Balance at November 30, | 585,434 | 144,535 | 165,746 | |||||||||
Total equity | 3,194,383 | 2,588,014 | 2,788,753 | |||||||||
Comprehensive earnings (loss) attributable to Lennar | $ | 95,261 | (417,147 | ) | (1,107,024 | ) | ||||||
Comprehensive earnings (loss) attributable to noncontrolling interests | $ | 25,198 | (28,912 | ) | (4,097 | ) | ||||||
See accompanying notes to consolidated financial statements.
LENNAR CORPORATION AND SUBSIDIARIES
CONSOLIDATED STATEMENTS OF CASH FLOWS
Years Ended November 30, 2010, 2009 and 2008
| 2010 | 2009 | 2008 | ||||||||||
| (Dollars in thousands) | ||||||||||||
Cash flows from operating activities: | ||||||||||||
Net earnings (loss) (including net earnings (loss) attributable to noncontrolling interests) | $ | 120,459 | (446,059 | ) | (1,113,182 | ) | ||||||
Adjustments to reconcile net earning (loss) (including net earnings (loss) attributable to noncontrolling interests ) to net cash provided by operating activities: | ||||||||||||
Depreciation and amortization | 13,520 | 19,905 | 32,399 | |||||||||
Amortization of discount/premium on debt, net | 6,560 | 1,736 | 2,662 | |||||||||
Gain on recapitalization of Lennar Homebuilding unconsolidated entity | — | — | (133,097 | ) | ||||||||
Lennar Homebuilding equity in loss from unconsolidated entities, including $10.5 million, $101.9 million and $32.2 million, respectively, of the Company’s share of valuation adjustments related to assets of Lennar Homebuilding unconsolidated entities in 2010, 2009 and 2008 | 10,966 | 130,917 | 59,156 | |||||||||
Distribution of earnings from Lennar Homebuilding unconsolidated entities | 7,280 | 2,498 | 21,069 | |||||||||
Rialto Investments equity in earnings from unconsolidated entities | (15,363 | ) | — | — | ||||||||
Distributions of earnings from Rialto Investments unconsolidated entities | 3,261 | — | — | |||||||||
Share-based compensation expense | 28,075 | 30,392 | 29,871 | |||||||||
Tax provision from share-based awards | — | — | (6,139 | ) | ||||||||
Deferred income tax provision | — | — | 772,508 | |||||||||
Gain on retirement of Lennar Homebuilding other debt | (19,384 | ) | — | — | ||||||||
Loss (gain) on retirement of Lennar Homebuilding senior notes | 11,714 | (1,183 | ) | — | ||||||||
Gains on Rialto Investments real estate owned | (20,982 | ) | — | — | ||||||||
Valuation adjustments, write-offs of option deposits and pre-acquisition costs, write-offs of notes and other receivables and goodwill impairments | 54,511 | 472,137 | 565,465 | |||||||||
Changes in assets and liabilities: | ||||||||||||
Decrease (increase) in restricted cash | 5,137 | (4,066 | ) | 4,624 | ||||||||
Decrease (increase) in receivables | 340,444 | (117,874 | ) | 828,646 | ||||||||
(Increase) decrease in inventories, excluding valuation adjustments and write-offs of option deposits and pre-acquisition costs | (115,247 | ) | 428,964 | 292,264 | ||||||||
Decrease (increase) in other assets | 28,269 | (5,125 | ) | 7,166 | ||||||||
(Increase) decrease in Lennar Financial Services loans held-for-sale | (64,130 | ) | 4,497 | 83,622 | ||||||||
Decrease in accounts payable and other liabilities | (120,862 | ) | (95,896 | ) | (346,200 | ) | ||||||
Net cash provided by operating activities | 274,228 | 420,843 | 1,100,834 | |||||||||
Cash flows from investing activities: | ||||||||||||
Net (additions) disposals of operating properties and equipment | (5,062 | ) | 329 | 1,390 | ||||||||
Investments in and contributions to Lennar Homebuilding unconsolidated entities | (209,274 | ) | (316,120 | ) | (403,709 | ) | ||||||
Distributions of capital from Lennar Homebuilding unconsolidated entities | 29,401 | 24,119 | 87,802 | |||||||||
Investments in and contributions to Rialto Investments unconsolidated entities | (64,310 | ) | (9,874 | ) | — | |||||||
Investments in and contributions to Rialto Investments consolidated entities (net of $93.7 million cash and cash equivalents consolidated) | (171,399 | ) | — | — | ||||||||
Acquisitions of Rialto Investments portfolios of distressed loans and real estate assets | (184,699 | ) | — | — | ||||||||
Increase in Rialto Investments defeasance cash to retire notes payable | (101,309 | ) | — | — | ||||||||
Receipts of principal payments on loans receivable | 33,923 | — | — | |||||||||
Proceeds from sales of real estate owned | 16,853 | — | — | |||||||||
Decrease in Lennar Financial Services loans held-for-investment, net | 2,276 | 9,655 | 5,006 | |||||||||
Investments in commercial mortgage-backed securities | (19,447 | ) | — | — | ||||||||
Purchases of investment securities | (6,043 | ) | (1,747 | ) | (176,514 | ) | ||||||
Proceeds from sales and maturities of investment securities | 5,719 | 18,518 | 220,322 | |||||||||
Net cash used in investing activities | (673,371 | ) | (275,120 | ) | (265,703 | ) | ||||||
See accompanying notes to consolidated financial statements.
LENNAR CORPORATION AND SUBSIDIARIES
CONSOLIDATED STATEMENTS OF CASH FLOWS—(Continued)
Years Ended November 30, 2010, 2009 and 2008
| 2010 | 2009 | 2008 | ||||||||||
| (Dollars in thousands) | ||||||||||||
Cash flows from financing activities: | ||||||||||||
Net borrowings (repayments) of Lennar Financial Services debt | 54,121 | (8,226 | ) | (315,654 | ) | |||||||
Proceeds from senior notes | 247,323 | 392,392 | — | |||||||||
Proceeds from convertible senior notes | 722,500 | — | — | |||||||||
Debt issuance costs of senior notes and convertible senior notes | (18,415 | ) | (5,500 | ) | — | |||||||
Redemption of senior notes | (251,943 | ) | (281,477 | ) | (322 | ) | ||||||
Partial redemption of senior notes | (222,711 | ) | (53,916 | ) | — | |||||||
Proceeds from other borrowings | 5,676 | 19,912 | 3,548 | |||||||||
Principal payments on other borrowings | (141,505 | ) | (111,395 | ) | (132,055 | ) | ||||||
Exercise of land options contracts from an unconsolidated land investment venture | (39,301 | ) | (33,656 | ) | (48,434 | ) | ||||||
Receipts related to noncontrolling interests | 14,088 | 5,620 | 154,275 | |||||||||
Payments related to noncontrolling interests | (4,848 | ) | (7,744 | ) | (3,240 | ) | ||||||
Common stock: | ||||||||||||
Issuances | 2,238 | 221,437 | 224 | |||||||||
Repurchases | (1,806 | ) | (1,566 | ) | (1,758 | ) | ||||||
Dividends | (29,577 | ) | (27,588 | ) | (83,487 | ) | ||||||
Net cash provided by (used in) financing activities | 335,840 | 108,293 | (426,903 | ) | ||||||||
Net (decrease) increase in cash and cash equivalents | $ | (63,303 | ) | 254,016 | 408,228 | |||||||
Cash and cash equivalents at beginning of year | 1,457,438 | 1,203,422 | 795,194 | |||||||||
Cash and cash equivalents at end of year | $ | 1,394,135 | 1,457,438 | 1,203,422 | ||||||||
Summary of cash and cash equivalents: | ||||||||||||
Lennar Homebuilding | $ | 1,207,247 | 1,330,603 | 1,091,468 | ||||||||
Rialto Investments | 76,412 | — | — | |||||||||
Lennar Financial Services | 110,476 | 126,835 | 111,954 | |||||||||
| $ | 1,394,135 | 1,457,438 | 1,203,422 | |||||||||
Supplemental disclosures of cash flow information: | ||||||||||||
Cash paid for interest, net of amounts capitalized | $ | 77,277 | 55,101 | 37,949 | ||||||||
Cash received for income taxes, net | $ | 341,801 | 241,805 | 877,039 | ||||||||
Supplemental disclosures of non-cash investing and financing activities: | ||||||||||||
Non-cash contributions to Lennar Homebuilding unconsolidated entities | $ | 4,899 | 8,150 | 27,434 | ||||||||
Non-cash distributions from Lennar Homebuilding unconsolidated entities | $ | 59,283 | 125,307 | 56,913 | ||||||||
Purchases of inventories financed by sellers | $ | 22,758 | 22,106 | 2,384 | ||||||||
Purchase of portfolios of distressed loans and real estate assets financed by sellers | $ | 125,395 | — | — | ||||||||
Rialto Investments real estate owned acquired in satisfaction of loans receivable | $ | 185,960 | — | — | ||||||||
Consolidation/deconsolidation of unconsolidated/consolidated entities, net: | ||||||||||||
Receivables | $ | 2,077 | 14,466 | 34,346 | ||||||||
Loans receivable | $ | 1,177,636 | — | — | ||||||||
Inventories | $ | 83,973 | 360,640 | 647,466 | ||||||||
Investments in Lennar Homebuilding unconsolidated entities | $ | (50,953 | ) | (127,449 | ) | (183,647 | ) | |||||
Investments in Rialto Investments consolidated entities | $ | (171,399 | ) | — | — | |||||||
Other assets | $ | 68,013 | 68,727 | 620 | ||||||||
Debts payable | $ | (688,360 | ) | (223,942 | ) | (371,811 | ) | |||||
Other liabilities | $ | (14,526 | ) | (79,599 | ) | (88,774 | ) | |||||
Noncontrolling interests | $ | (406,461 | ) | (12,843 | ) | (38,200 | ) | |||||
See accompanying notes to consolidated financial statements
LENNAR CORPORATION AND SUBSIDIARIES
NOTES TO CONSOLIDATED FINANCIAL STATEMENTS
1. Summary of Significant Accounting Policies
Basis of Consolidation
The accompanying consolidated financial statements include the accounts of Lennar Corporation and all subsidiaries, partnerships and other entities in which Lennar Corporation has a controlling interest and VIEs (see Note 15) in which Lennar Corporation is deemed the primary beneficiary (the “Company”). The Company’s investments in both unconsolidated entities in which a significant, but less than controlling, interest is held and in VIEs in which the Company is not deemed to be the primary beneficiary are accounted for by the equity method. All intercompany transactions and balances have been eliminated in consolidation.
On December 1, 2009, the Company adopted certain provisions of ASC 810. As required by these provisions, the presentation of noncontrolling interests in consolidated subsidiaries, previously referred to as minority interests, has been changed on the consolidated balance sheets to be reflected as a component of total equity and on the consolidated statements of operations to separately disclose the amount of net earnings (loss) attributable to Lennar and to the noncontrolling interests. The Company has also presented the changes in equity attributable to both Lennar Corporation and the noncontrolling interests of its subsidiaries in its consolidated statements of equity.
In addition, on December 1, 2009, the Company also adopted other provisions of ASC 810 that amended the consolidation guidance applicable to VIEs and the definition of a VIE, and require enhanced disclosures to provide more information about an enterprise’s involvement in a VIE. ASC 810 also requires ongoing assessments of whether an enterprise is the primary beneficiary of a VIE. The adoption of these provisions resulted in certain additional disclosures and in the deconsolidation of certain option contracts totaling $75.5 million, previously included in the Company’s consolidated inventory not owned in its consolidated balance sheets (see Note 15).
Use of Estimates
The preparation of financial statements in conformity with accounting principles generally accepted in the United States of America (“GAAP”) requires management to make estimates and assumptions that affect the amounts reported in the consolidated financial statements and accompanying notes. Actual results could differ from those estimates.
Revenue Recognition
Revenues from sales of homes are recognized when the sales are closed and title passes to the new homeowner, the new homeowner’s initial and continuing investment is adequate to demonstrate a commitment to pay for the home, the new homeowner’s receivable is not subject to future subordination and the Company does not have a substantial continuing involvement with the new home. Revenues from sales of land are recognized when a significant down payment is received, the earnings process is complete, title passes and collectability of the receivable is reasonably assured. See Lennar Financial Services and Rialto Investments within this Note for disclosure of revenue recognition policies related to those segments.
Advertising Costs
The Company expenses advertising costs as incurred. Advertising costs were $40.2 million, $42.2 million and $65.7 million, respectively, for the years ended November 30, 2010, 2009 and 2008.
Share-Based Payments
The Company has share-based awards outstanding under three different plans which provide for the granting of stock options and stock appreciation rights and awards of restricted common stock (“nonvested shares”) to key officers, associates and directors. The exercise prices of stock options and stock appreciation rights may not be less than the market value of the common stock on the date of the grant. Exercises are permitted in installments determined when options are granted. Each stock option and stock appreciation right will expire on a date determined at the time of the grant, but not more than ten years after the date of the grant. The Company accounts for stock option awards granted under the plans based on the estimated grant date fair value.
LENNAR CORPORATION AND SUBSIDIARIES
NOTES TO CONSOLIDATED FINANCIAL STATEMENTS—(Continued)
Cash and Cash Equivalents
The Company considers all highly liquid investments purchased with original maturities of three months or less to be cash equivalents. Due to the short maturity period of cash equivalents, the carrying amounts of these instruments approximate their fair values. Cash and cash equivalents as of November 30, 2010 and 2009 included $19.2 million and $5.8 million, respectively, of cash held in escrow for approximately three days.
Restricted Cash
Restricted cash consists of customer deposits on home sales held in restricted accounts until title transfers to the homebuyer, as required by the state and local governments in which the homes were sold.
Income Tax Receivables
Income tax receivables consist of tax refunds that the Company expects to receive within one year. As of November 30, 2010 and 2009, there were $3.8 million and $334.4 million, respectively, of income tax receivables.
Inventories
Inventories are stated at cost unless the inventory within a community is determined to be impaired, in which case the impaired inventory is written down to fair value. Inventory costs include land, land development and home construction costs, real estate taxes, deposits on land purchase contracts and interest related to development and construction. Construction overhead and selling expenses are expensed as incurred. Homes held-for-sale are classified as inventories until delivered. Land, land development, amenities and other costs are accumulated by specific area and allocated to homes within the respective areas. The Company reviews its inventory for indicators of impairment by evaluating each community during each reporting period. The inventory within each community is categorized as finished homes and construction in progress or land under development based on the development state of the community. There were 440 and 390 active communities as of November 30, 2010 and 2009, respectively.If the undiscounted cash flows expected to be generated by a community are less than its carrying amount, an impairment charge is recorded to write down the carrying amount of such community to its estimated fair value.
In conducting its review for indicators of impairment on a community level, the Company evaluates, among other things, the margins on homes that have been delivered, margins on homes under sales contracts in backlog, projected margins with regard to future home sales over the life of the community, projected margins with regard to future land sales and the estimated fair value of the land itself. The Company pays particular attention to communities in which inventory is moving at a slower than anticipated absorption pace and communities whose average sales price and/or margins are trending downward and are anticipated to continue to trend downward. From this review, the Company identifies communities whose carrying values exceed their undiscounted cash flows.
The Company estimates the fair value of its communities using a discounted cash flow model. The projected cash flows for each community are significantly impacted by estimates related to market supply and demand, product type by community, homesite sizes, sales pace, sales prices, sales incentives, construction costs, sales and marketing expenses, the local economy, competitive conditions, labor costs, costs of materials and other factors for that particular community. Every division evaluates the historical performance of each of its communities as well as current trends in the market and economy impacting the community and its surrounding areas. These trends are analyzed for each of the estimates listed above. For example, since the start of the downturn in the housing market, the Company has found ways to reduce its construction costs in many communities, and this reduction in construction costs in addition to change in product type in many communities has impacted future estimated cash flows.
Each of the homebuilding markets in which the Company operates is unique, as homebuilding has historically been a local business driven by local market conditions and demographics. Each of the Company’s homebuilding markets has specific supply and demand relationships reflective of local economic conditions. The
LENNAR CORPORATION AND SUBSIDIARIES
NOTES TO CONSOLIDATED FINANCIAL STATEMENTS—(Continued)
Company’s projected cash flows are impacted by many assumptions. Some of the most critical assumptions in the Company’s cash flow model are projected absorption pace for home sales, sales prices and costs to build and deliver homes on a community by community basis.
In order to arrive at the assumed absorption pace for home sales included in the Company’s cash flow model, the Company analyzes its historical absorption pace in the community as well as other communities in the geographical area. In addition, the Company analyzes internal and external market studies and trends, which generally include, but are not limited to, statistics on population demographics, unemployment rates and availability of competing product in the geographic area where the community is located. When analyzing the Company’s historical absorption pace for home sales and corresponding internal and external market studies, the Company places greater emphasis on more current metrics and trends such as the absorption pace realized in its most recent quarters as well as forecasted population demographics, unemployment rates and availability of competing product. Generally, if the Company notices a variation from historical results over a span of two fiscal quarters, the Company considers such variation to be the establishment of a trend and adjusts its historical information accordingly in order to develop assumptions on the projected absorption pace in the cash flow model for a community.
In order to determine the assumed sales prices included in its cash flow models, the Company analyzes the historical sales prices realized on homes it delivered in the community and other communities in the geographical area as well as the sales prices included in its current backlog for such communities. In addition, the Company analyzes internal and external market studies and trends, which generally include, but are not limited to, statistics on sales prices in neighboring communities and sales prices on similar products in non-neighboring communities in the geographic area where the community is located. When analyzing its historical sales prices and corresponding market studies, the Company also places greater emphasis on more current metrics and trends such as future forecasted sales prices in neighboring communities as well as future forecasted sales prices for similar products in non-neighboring communities. Generally, if the Company notices a variation from historical results over a span of two fiscal quarters, the Company considers such variation to be the establishment of a trend and adjusts its historical information accordingly in order to develop assumptions on the projected sales prices in the cash flow model for a community.
In order to arrive at the Company’s assumed costs to build and deliver homes, the Company generally assumes a cost structure reflecting contracts currently in place with its vendors adjusted for any anticipated cost reduction initiatives or increases in cost structure. Costs assumed in the cash flow model for the Company’s communities are generally based on the rates the Company is currently obligated to pay under existing contracts with its vendors adjusted for any anticipated cost reduction initiatives or increases in cost structure.
Since the estimates and assumptions included in the Company’s cash flow models are based upon historical results and projected trends, they do not anticipate unexpected changes in market conditions or strategies that may lead the Company to incur additional impairment charges in the future.
Using all available trend information, the Company calculates its best estimate of projected cash flows for each community. While many of the estimates are calculated based on historical and projected trends, all estimates are subjective and change from market to market and community to community as market and economic conditions change. The determination of fair vale also requires discounting the estimated cash flows at a rate the Company believes a market participant would determine to be commensurate with the inherent risks associated with the assets and related estimated cash flow streams. The discount rate used in determining each asset’s fair value depends on the community’s projected life and development stage. The Company generally uses a discount rate of approximately 20%, subject to the perceived risks associated with the community’s cash flow streams relative to its inventory.
The Company estimates the fair value of inventory evaluated for impairment based on market conditions and assumptions made by management at the time the inventory is evaluated, which may differ materially from actual results if market conditions or assumptions change. For example, further market deterioration or changes in assumptions may lead to the Company incurring additional impairment charges on previously impaired inventory, as well as on inventory not currently impaired but for which indicators of impairment may arise if further market deterioration occurs.
LENNAR CORPORATION AND SUBSIDIARIES
NOTES TO CONSOLIDATED FINANCIAL STATEMENTS—(Continued)
The Company also has access to land inventory through option contracts, which generally enables the Company to defer acquiring portions of properties owned by third parties and unconsolidated entities until it has determined whether to exercise its option. A majority of the Company’s option contracts require a non-refundable cash deposit or irrevocable letter of credit based on a percentage of the purchase price of the land. The Company’s option contracts are recorded at cost. In determining whether to walk-away from an option contract, the Company evaluates the option primarily based upon its expected cash flows from the property under option. If the Company intends to walk away from an option contract, it records a charge to earnings in the period such decision is made for the deposit amount and related pre-acquisition costs associated with the option contract.
See Note 2 for details of inventory valuation adjustments and write-offs of option deposits and pre-acquisition costs by reportable segment and Homebuilding Other.
Investments in Unconsolidated Entities
The Company evaluates its investments in unconsolidated entities for indicators of impairment during each reporting period. A series of operating losses of an investee or other factors may indicate that a decrease in value of the Company’s investment in the unconsolidated entity has occurred which is other-than-temporary. The amount of impairment recognized is the excess of the investment’s carrying amount over its estimated fair value.
The evaluation of the Company’s investment in unconsolidated entities includes certain critical assumptions made by management: (1) projected future distributions from the unconsolidated entities, (2) discount rates applied to the future distributions and (3) various other factors.
The Company’s assumptions on the projected future distributions from the unconsolidated entities are dependent on market conditions. Specifically, distributions are dependent on cash to be generated from the sale of inventory by the unconsolidated entities. Such inventory is also reviewed for potential impairment by the unconsolidated entities. The unconsolidated entities generally use a discount rate of approximately 20% in their reviews for impairment, subject to the perceived risks associated with the community’s cash flow streams relative to its inventory. If a valuation adjustment is recorded by an unconsolidated entity related to its assets, the Company’s proportionate share is reflected in the Company’s homebuilding equity in earnings (loss) from unconsolidated entities with a corresponding decrease to its investment in unconsolidated entities. In certain instances, the Company may be required to record additional losses relating to its investment in unconsolidated entities, if the Company’s investment in the unconsolidated entity, or a portion thereof, is deemed to be other than temporarily impaired. These losses are included in Lennar Homebuilding other income (expense), net.
Additionally, the Company considers various qualitative factors to determine if a decrease in the value of the investment is other-than-temporary. These factors include age of the venture, intent and ability for the Company to recover its investment in the entity, financial condition and long-term prospects of the entity, short-term liquidity needs of the unconsolidated entity, trends in the general economic environment of the land, entitlement status of the land held by the unconsolidated entity, overall projected returns on investment, defaults under contracts with third parties (including bank debt), recoverability of the investment through future cash flows and relationships with the other partners and banks. If the Company believes that the decline in the fair value of the investment is temporary, then no impairment is recorded.
See Note 2 for details of valuation adjustments related to the Company’s unconsolidated entities by reportable segment and Homebuilding Other.
The Company tracks its share of cumulative earnings and distributions of its joint ventures (“JVs”). For purposes of classifying distributions received from JVs in the Company’s consolidated statements of cash flows, cumulative distributions are treated as returnson capital to the extent of cumulative earnings and included in the Company’s consolidated statements of cash flows as operating activities. Cumulative distributions in excess of the Company’s share of cumulative earnings are treated as returnsof capital and included in the Company’s consolidated statements of cash flows as investing activities.
LENNAR CORPORATION AND SUBSIDIARIES
NOTES TO CONSOLIDATED FINANCIAL STATEMENTS—(Continued)
Consolidation of Variable Interest Entities
GAAP requires the consolidation of VIEs in which an enterprise has a controlling financial interest. A controlling financial interest will have both of the following characteristics: (a) the power to direct the activities of a VIE that most significantly impact the VIE’s economic performance and (b) the obligation to absorb losses of the VIE that could potentially be significant to the VIE or the right to receive benefits from the VIE that could potentially be significant to the VIE.
The Company’s variable interest in VIEs may be in the form of (1) equity ownership, (2) contracts to purchase assets, (3) management services and development agreements between the Company and a VIE, (4) loans provided by the Company to a VIE or other partner and/or (5) guarantees provided by members to banks and other third parties. The Company examines specific criteria and uses its judgment when determining if it is the primary beneficiary of a VIE. Factors considered in determining whether the Company is the primary beneficiary include risk and reward sharing, experience and financial condition of other partner(s), voting rights, involvement in day-to-day capital and operating decisions, representation on a VIE’s executive committee, existence of unilateral kick-out rights or voting rights, level of economic disproportionality between the Company and the other partner(s) and contracts to purchase assets from VIEs. The determination whether an entity is a VIE and, if so, whether the Company is primary beneficiary may require it to exercise significant judgment.
Generally, all major decision making in the Company’s joint ventures is shared between all partners. In particular, business plans and budgets are generally required to be unanimously approved by all partners. Usually, management and other fees earned by the Company are nominal and believed to be at market and there is no significant economic disproportionality between the Company and other partners. Generally, the Company purchases less than a majority of the JV’s assets and the purchase prices under its option contracts are believed to be at market.
Generally, Lennar Homebuilding unconsolidated entities become VIEs and consolidate when the other partner(s) lack the intent and financial wherewithal to remain in the entity. As a result, the Company continues to fund operations and debt paydowns through partner loans or substituted capital contributions.
Operating Properties and Equipment
Operating properties and equipment are recorded at cost and are included in other assets in the consolidated balance sheets. The assets are depreciated over their estimated useful lives using the straight-line method. At the time operating properties and equipment are disposed of, the asset and related accumulated depreciation are removed from the accounts and any resulting gain or loss is credited or charged to earnings. The estimated useful life for operating properties is thirty years, for furniture, fixtures and equipment is two to ten years and for leasehold improvements is five years or the life of the lease, whichever is shorter. Operating properties are reviewed for possible impairment if there are indicators that their carrying amounts are not recoverable. No impairments were recorded during the periods presented.
Investment Securities
Investment securities are classified as available-for-sale unless they are classified as trading or held-to-maturity. Securities classified as trading are carried at fair value and unrealized holding gains and losses are recorded in earnings. Available-for-sale securities are recorded at fair value. Any unrealized holding gains or losses on available-for-sale securities are reported as accumulated other comprehensive gain or loss, which is a separate component of stockholders’ equity, net of tax, until realized. Securities classified as held-to-maturity are carried at amortized cost because they are purchased with the intent and ability to hold to maturity.
At November 30, 2010 and 2009, investment securities classified as held-to-maturity totaled $3.2 million and $2.5 million, respectively, and are included in the assets of the Lennar Financial Services segment. The Lennar Financial Services held-to-maturity securities consist mainly of certificates of deposit and U.S. treasury securities. In addition, at November 30, 2010, the Rialto Investments (“Rialto”) segment had investment
LENNAR CORPORATION AND SUBSIDIARIES
NOTES TO CONSOLIDATED FINANCIAL STATEMENTS—(Continued)
securities classified as held-to-maturity totaling $19.5 million. The Rialto segment held-to-maturity securities consist of commercial mortgage-backed securities. At November 30, 2010 and 2009, the Company had no investment securities classified as trading or available-for-sale.
Derivative Financial Instruments
The Lennar Financial Services segment, in the normal course of business, uses derivative financial instruments to reduce its exposure to fluctuations in mortgage-related interest rates. The segment uses mortgage-backed securities (“MBS”) forward commitments, option contracts and investor commitments to protect the value of fixed rate-locked loan commitments and loans held-for-sale from fluctuations in mortgage-related interest rates. These derivative financial instruments are carried at fair value with the changes in fair value included in Lennar Financial Services revenues.
Goodwill
Goodwill represents the excess of the purchase price over the fair value of the net assets acquired in business combinations. Evaluating goodwill for impairment involves the determination of the fair value of the Company’s reporting units in which the Company has recorded goodwill. A reporting unit is a component of an operating segment for which discrete financial information is available and reviewed by the Company’s management on a regular basis. Inherent in the determination of fair value of the Company’s reporting units are certain estimates and judgments, including the interpretation of current economic indicators and market valuations as well as the Company’s strategic plans with regard to its operations. To the extent additional information arises or the Company’s strategies change, it is possible that the Company’s conclusion regarding goodwill impairment could change, which could have an effect on the Company’s financial position and results of operations.
The Company reviews goodwill annually (or whenever indicators of impairment exist) for impairment. Due to operating losses in the title operations of the Lennar Financial Services segment through the nine months ended August 31, 2010 and other factors, the Company evaluated the carrying value of the Lennar Financial Services segment’s goodwill in both its third and fourth quarters of 2010. The evaluations concluded that an impairment was not required for the Lennar Financial Services segment’s goodwill during 2010. As of both November 30, 2010 and 2009, there were no material identifiable intangible assets, other than goodwill.
During fiscal 2008, the Company impaired $27.2 million of the Lennar Financial Services segment’s goodwill. At November 30, 2010 and 2009, accumulated goodwill impairments totaled $217.4 million, which includes $27.2 million of Lennar Financial Services segment goodwill impairment during fiscal 2008 and $190.2 million of previous Lennar Homebuilding goodwill impairment. At both November 30, 2010 and 2009, goodwill was $34.0 million, all of which relates to the Lennar Financial Services segment and is included in the assets of that segment.
Interest and Real Estate Taxes
Interest and real estate taxes attributable to land and homes are capitalized as inventories while they are being actively developed. Interest related to homebuilding and land, including interest costs relieved from inventories, is included in cost of homes sold and cost of land sold. Interest expense related to the Lennar Financial Services operations is included in its costs and expenses.
During the years ended November 30, 2010, 2009 and 2008, interest incurred by the Company’s homebuilding operations related to homebuilding debt was $181.5 million, $172.1 million and $148.3 million, respectively; interest capitalized into inventories was $111.1 million, $101.3 million and $120.7 million, respectively.
LENNAR CORPORATION AND SUBSIDIARIES
NOTES TO CONSOLIDATED FINANCIAL STATEMENTS—(Continued)
Interest expense was included in cost of homes sold, cost of land sold and other interest expense as follows:
| Years Ended November 30, | ||||||||||||
| 2010 | 2009 | 2008 | ||||||||||
| (In thousands) | ||||||||||||
Interest expense in cost of homes sold | $ | 71,473 | 67,414 | 99,319 | ||||||||
Interest expense in cost of land sold | 2,048 | 9,185 | 3,444 | |||||||||
Other interest expense | 70,425 | 70,850 | 27,594 | |||||||||
Total interest expense | $ | 143,946 | 147,449 | 130,357 | ||||||||
Income Taxes
The Company records income taxes under the asset and liability method, whereby deferred tax assets and liabilities are recognized based on the future tax consequences attributable to temporary differences between the financial statement carrying amounts of existing assets and liabilities and their respective tax bases and attributable to operating loss and tax credit carryforwards. Deferred tax assets and liabilities are measured using enacted tax rates expected to apply in the years in which the temporary differences are expected to be recovered or paid. The effect on deferred tax assets and liabilities of a change in tax rates is recognized in earnings in the period when the changes are enacted.
A reduction of the carrying amounts of deferred tax assets by a valuation allowance is required if, based on the available evidence, it is more likely than not that such assets will not be realized. Accordingly, the need to establish valuation allowances for deferred tax assets is assessed each reporting period by the Company based on the more-likely-than-not realization threshold criterion. In the assessment for a valuation allowance, appropriate consideration is given to all positive and negative evidence related to the realization of the deferred tax assets. This assessment considers, among other matters, the nature, frequency and severity of current and cumulative losses, forecasts of future profitability, the duration of statutory carryforward periods, the Company’s experience with loss carryforwards not expiring unused and tax planning alternatives.
Based upon an evaluation of all available evidence, the Company recorded a valuation allowance against its deferred tax assets of $730.8 million during the year ended November 30, 2008, and increased it by $269.6 million during the year ended November 30, 2009. In addition, for the year ended November 30, 2009, the Company recorded a reversal of its deferred tax asset valuation allowance of $351.8 million, primarily due to a change in tax legislation, which allowed the Company to carry back its fiscal year 2009 tax loss to recover previously paid income taxes. During the year ended November 30, 2010, the Company recorded a reversal of the deferred tax asset valuation allowance of $37.9 million primarily due to the recording of a deferred tax liability from the issuance of 2.75% convertible senior notes due 2020 and the net earnings generated during the year. The reversal of the deferred tax asset valuation allowance related to the issuance of the 2.75% Convertible Senior Notes was recorded as an adjustment to additional paid-in capital. At November 30, 2010 and 2009, the Company’s deferred tax asset valuation allowance was $609.5 million and $647.4 million, respectively. In future periods, the allowance could be reduced based on sufficient evidence indicating that it is more likely than not that a portion or all of our deferred tax assets will be realized. At both November 30, 2010 and 2009, the Company had no net deferred tax assets. Interest related to unrecognized tax benefits is recognized in the financial statements as a component of benefit (provision) for income taxes.
LENNAR CORPORATION AND SUBSIDIARIES
NOTES TO CONSOLIDATED FINANCIAL STATEMENTS—(Continued)
Product Warranty
Warranty and similar reserves for homes are established at an amount estimated to be adequate to cover potential costs for materials and labor with regard to warranty-type claims expected to be incurred subsequent to the delivery of a home. Reserves are determined based on historical data and trends with respect to similar product types and geographical areas. The Company regularly monitors the warranty reserve and makes adjustments to its pre-existing warranties in order to reflect changes in trends and historical data as information becomes available. Warranty reserves are included in Lennar Homebuilding other liabilities in the consolidated balance sheets. The activity in the Company’s warranty reserve was as follows:
| November 30, | ||||||||
| 2010 | 2009 | |||||||
| (In thousands) | ||||||||
Warranty reserve, beginning of year | $ | 157,896 | 129,449 | |||||
Warranties issued during the period | 25,134 | 28,710 | ||||||
Adjustments to pre-existing warranties from changes in estimates | 7,091 | 69,324 | ||||||
Payments | (80,942 | ) | (69,587 | ) | ||||
Warranty reserve, end of year | $ | 109,179 | 157,896 | |||||
As of November 30, 2010, the Company has identified approximately 920 homes delivered in Florida primarily during its 2006 and 2007 fiscal years that are confirmed to have defective Chinese drywall and resulting damage. This represents a small percentage of homes the Company delivered nationally (1.1%) during those fiscal years. Defective Chinese drywall appears to be an industry-wide issue as other homebuilders have publicly disclosed that they are experiencing similar issues with defective Chinese drywall.
Based on its efforts to date, the Company has not identified defective Chinese drywall in homes delivered by the Company outside of Florida. The Company is continuing its investigation of homes delivered during the relevant time period in order to determine whether there are additional homes, not yet inspected, with defective Chinese drywall and resulting damage. If the outcome of the Company’s inspections identifies more homes than the Company has estimated to have defective Chinese drywall, it might require an increase in the Company’s warranty reserve in the future. The Company has replaced defective Chinese drywall when it has been found in homes the Company has built.
Through November 30, 2010, the Company has accrued $82.2 million of warranty reserves related to homes confirmed as having defective Chinese drywall, as well as an estimate for homes not yet inspected that may contain Chinese drywall. As of November 30, 2010, the warranty reserve, net of payments was $23.3 million. During the year ended November 30, 2010, the Company received payments of $61.2 million under its insurance coverage and through third party recoveries relative to the costs it has incurred and expects to incur remedying the homes confirmed and estimated to have defective Chinese drywall and resulting damage. The Company continues to seek additional reimbursement from its subcontractors, insurers and others for costs the Company has incurred or expects to incur to investigate and repair defective Chinese drywall and resulting damage.
Self-Insurance
Certain insurable risks such as general liability, medical and workers’ compensation are self-insured by the Company up to certain limits. Undiscounted accruals for claims under the Company’s self-insurance program are based on claims filed and estimates for claims incurred but not yet reported.
Earnings (Loss) per Share
Basic earnings (loss) per share is computed by dividing net earnings (loss) attributable to common stockholders by the weighted average number of common shares outstanding for the period. Diluted earnings per share reflects the potential dilution that could occur if securities or other contracts to issue common stock were exercised or converted into common stock or resulted in the issuance of common stock that then shared in earnings of the Company.
Effective December 1, 2009, the Company adopted certain provisions under ASC Topic 260,Earnings per Share. Under these provisions, all outstanding nonvested shares that contain non-forfeitable rights to dividends or dividend equivalents that participate in undistributed earnings with common stock are considered participating securities and, therefore, are included in computing earnings per share pursuant to the two-class method. The
LENNAR CORPORATION AND SUBSIDIARIES
NOTES TO CONSOLIDATED FINANCIAL STATEMENTS—(Continued)
two-class method is an earnings allocation formula that determines earnings per share for each class of common stock and participating securities according to dividends or dividend equivalents and participation rights in undistributed earnings. The Company’s restricted common stock (“nonvested shares”) are considered participating securities. For the years ended November 30, 2009 and 2008, the nonvested shares were excluded from the calculation of the denominator for diluted loss per share because including them would be anti-dilutive due to the Company’s net loss during those periods. The adoption of these provisions did not have a material impact to the Company’s basic and diluted loss per share.
Lennar Financial Services
Premiums from title insurance policies are recognized as revenue on the effective date of the policies. Escrow fees and loan origination revenues are recognized at the time the related real estate transactions are completed, usually upon the close of escrow. Expected gains and losses from the sale of loans and their related servicing rights are included in the measurement of all written loan commitments that are accounted for at fair value through earnings at the time of commitment. Interest income on loans held-for-sale and loans held-for-investment is recognized as earned over the terms of the mortgage loans based on the contractual interest rates.
Loans held-for-sale by the Lennar Financial Services segment are carried at fair value and changes in fair value are reflected in earnings. Premiums and discounts recorded on these loans are presented as an adjustment to the carrying amount of the loans and are not amortized. Management believes carrying loans held-for-sale at fair value improves financial reporting by mitigating volatility in reported earnings caused by measuring the fair value of the loans and the derivative instruments used to economically hedge them without having to apply complex hedge accounting provisions.
In addition, the Lennar Financial Services segment recognizes the fair value of its rights to service a mortgage loan as revenue upon entering into an interest rate lock loan commitment with a borrower in accordance with ASC Topic 815-10-S99,SEC Materials,(“ASC 815-10-S99”). The fair value of these servicing rights is included in the Company’s loans held-for-sale as of November 30, 2010 and 2009. Fair value of the servicing rights is determined based on values in the Company’s servicing sales contracts. At November 30, 2010 and 2009, loans held-for-sale, all of which were accounted for at fair value, had an aggregate fair value of $245.4 million and $182.7 million, respectively and an aggregate outstanding principal balance of $240.8 million and $175.5 million, respectively, at November 30, 2010 and 2009.
Substantially all of the loans the Lennar Financial Services segment originates are sold within a short period in the secondary mortgage market on a servicing released, non-recourse basis. After the loans are sold, the Company retains potential liability for possible claims by purchasers that it breached certain limited industry-standard representations and warranties in the loan sale agreement. The Company’s mortgage operations has established liabilities for anticipated losses associated with mortgage loans previously originated and sold to investors. The Company establishes liabilities for such anticipated losses based upon, among other things, an analysis of repurchase requests received, an estimate of potential repurchase claims not yet received, its actual past repurchases, and losses through the disposition of affected loans. While the Company believes that it has adequately reserved for known losses and projected repurchase requests, given the volatility in the mortgage industry and the uncertainty regarding the ultimate resolution of these claims, if either actual repurchases or the losses incurred resolving those repurchases exceed the Company’s expectations, additional recourse expense may be incurred. Loan origination liabilities are included in Lennar Financial Services’ liabilities in the consolidated balance sheets. The activity in the Company’s loan origination liabilities for the years ended November 30, 2010 and 2009 was as follows:
| November 30, | ||||||||
| 2010 | 2009 | |||||||
| (In thousands) | ||||||||
Loan origination liabilities, beginning of year | $ | 9,518 | $ | 5,271 | ||||
Provision for losses issued during the period | 416 | 303 | ||||||
Adjustments to pre-existing provision for losses from changes in estimates | 2,901 | 14,109 | ||||||
Payments/settlements | (2,963 | ) | (10,165 | ) | ||||
Loan origination liabilities, end of year | $ | 9,872 | $ | 9,518 | ||||
LENNAR CORPORATION AND SUBSIDIARIES
NOTES TO CONSOLIDATED FINANCIAL STATEMENTS—(Continued)
Adjustments to pre-existing provision for losses from changes in estimates for the year ended November 30, 2010 and 2009 include an adjustment for additional repurchase requests that were received beyond the estimated provision that was recorded due to an increase in potential issues identified by certain investors.
Loans for which the Company has the positive intent and ability to hold to maturity consist of mortgage loans carried at lower of cost, net of unamortized discounts or fair value on a nonrecurring basis. Discounts are amortized over the estimated lives of the loans using the interest method.
The Company also provides an allowance for loan losses. The provision recorded and the adequacy of the related allowance is determined by the Company’s management’s continuing evaluation of the loan portfolio in light of past loan loss experience, credit worthiness and nature of underlying collateral, present economic conditions and other factors considered relevant by the Company’s management. Anticipated changes in economic factors, which may influence the level of the allowance, are considered in the evaluation by the Company’s management when the likelihood of the changes can be reasonably determined. While the Company’s management uses the best information available to make such evaluations, future adjustments to the allowance may be necessary as a result of future economic and other conditions that may be beyond management’s control.
Rialto Investments
Loans Receivable—Revenue Recognition
All of the acquired loans for which (1) there was evidence of credit quality deterioration since origination and (2) for which it was deemed probable that the Company would be unable to collect all contractually required principal and interest payments were accounted under ASC Topic 310-30,Loans and Debt Securities Acquired with Deteriorated Credit Quality, (“ASC 310-30”). For loans accounted for under ASC 310-30, management determined upon acquisition the loan’s value based on extensive due diligence on each of the loans, the underlying properties and the borrowers. The Company determined fair value by discounting the cash flows expected to be collected adjusted for factors that a market participant would consider when determining fair value. Factors considered in the valuation were projected cash flows for the loans, type of loan and related collateral, classification status and current discount rates. Since the estimates are based on projections, all estimates are subjective and can change due to unexpected changes in economic conditions and loan performance.
Under ASC 310-30, loans were pooled together according to common risk characteristics. A pool is then accounted for as a single asset with a single component interest rate and as aggregate expectation of cash flows. The excess of the cash flows expected to be collected from the loans receivable at acquisition over the initial investment for those loans receivable is referred to as the accretable yield and is recognized in interest income over the expected life of the pools primarily using the effective yield method. The difference between contractually required payments at acquisition and the cash flows expected to be collected is referred to as the nonaccretable difference. Changes in the expected cash flows of loans receivable from the date of acquisition will either impact the accretable yield or result in a charge to the provision for loan losses in the period in which the changes become probable. Prepayments are treated as a reduction of cash flows expected to be collected and a reduction of contractually required payments such that the nonaccretable difference is not affected. Subsequent significant decreases to the expected cash flows will generally result in a charge to the provision for loan losses, resulting in an increase to the allowance for loan losses, and a reclassification from accretable yield to nonaccretable difference. Subsequent probable and significant increases in cash flows will result in a recovery of any previously recorded allowance for loan losses, to the extent applicable, and a reclassification from nonaccretable difference to accretable yield. Amounts related to the ASC 310-30 loans are estimates and may change as the Company obtains additional information related to the respective loans and the inherent uncertainty associated with estimating the amount and timing of the expected cash flows associated with distressed residential and commercial real estate loans. The timing and amount of expected cash flows and related accretable yield can also be impacted by disposal of loans, loans payoffs or expected foreclosures, which result in removal of the loans from the pools.
Nonaccrual Loans—Revenue Recognition & Impairment
Management classifies certain loans as nonaccrual and discontinues accruing interest income when future collectability of the recorded loan balance is doubtful. When a loan is classified as nonaccrual, unpaid
LENNAR CORPORATION AND SUBSIDIARIES
NOTES TO CONSOLIDATED FINANCIAL STATEMENTS—(Continued)
accrued interest income recognized is reversed and any subsequent cash receipt is accounted for using either the cost recovery or cash basis method. Loans are generally returned to accrual status when payments are made that bring the loan account current under the terms of the agreement or when the loan becomes well secured and is in the process of collection. A loan is considered impaired when, based on current information and events; the carrying value of the receivable is in excess of its fair value. Impairment is measured on a loan-by-loan basis by either the present value of expected future cash flows discounted at the loan’s effective interest rate, the loans obtainable market price, or the fair value of the collateral. If the Company determines that the value of the impaired loan is less than the recorded investment in the loan, the Company recognizes impairment through an allowance estimate or a charge-off to the allowance.
Real Estate Owned
Real estate owned (“REO”) represents real estate that the Rialto segment has taken control of in partial or full satisfaction of loans receivable. At the time of acquisition, REO is recorded at fair value less estimated costs to sell, which becomes the property’s new basis. The amount by which the recorded investment in the loan is greater or less than the REO’s fair value (net of estimated cost to sell), is recorded as a gain or loss on foreclosure within Rialto Investments other income, net, in the Company’s consolidated statement of operations. Subsequently, management periodically performs valuations such that REO is carried at the lower of its new cost basis or fair value, net of estimated costs to sell. Any subsequent valuation adjustments, operating expenses or income, and gains and losses on disposition of such properties are also recognized in Rialto Investments other income, net.
New Accounting Pronouncements
In January 2010, the FASB issued Accounting Standards Update (“ASU”) 2010-06,Improving Disclosures about Fair Value Measurements, (“ASU 2010-06”), which requires additional disclosures about transfers between Levels 1 and 2 of the fair value hierarchy and disclosures about purchases, sales, issuances and settlements in the rollforward of activity in Level 3 fair value measurements. The Company adopted ASU 2010-06 for its second quarter ending May 31, 2010, except for the Level 3 activity disclosures which will be effective for the Company’s fiscal year beginning December 1, 2011. ASU 2010-06 has not and is not expected to have a material effect on the Company’s consolidated financial statements.
In April 2010, the FASB issued ASU 2010-18,Effect of a Loan Modification When the Loan Is Part of a Pool That Is Accounted for as a Single Asset, (“ASU 2010-18”). Under ASU 2010-18, modification of loans accounted for within a pool under ASC 310-30 does not result in removal of such loans from the pool even if the modification would otherwise be considered a troubled debt restructuring. An entity must continue to consider whether the pool of assets in which the modified loan is included is impaired if expected cash flows for the pool change. ASU 2010-18 does not affect the accounting for loans acquired with deteriorated credit quality that are not accounted for within a pool. Loans accounted for individually that were acquired with deteriorated credit quality continue to be subject to the accounting provisions for troubled debt restructuring by creditors. The amended guidance is to be applied prospectively, with early application permitted. ASU 2010-18 is effective for modifications of loans accounted for within a pool that occur on or after September 1, 2010. The adoption of this ASU did not have a material effect on the Company’s consolidated financial statements.
In July 2010, the FASB issued ASU 2010-20,Disclosures About the Credit Quality of Financing Receivables and the Allowance for Credit Losses, (“ASU 2010-20”). ASU 2010-20 enhances current disclosure requirements to assist users of financial statements in assessing an entity’s credit risk exposure and evaluating the adequacy of an entity’s allowance for credit losses. ASU 2010-20 requires entities to disclose the nature of credit risk inherent in their finance receivables, the procedure for analyzing and assessing credit risk, and the changes in both the receivables and the allowance for credit losses by portfolio segment and class. ASU 2010-20 is effective for the Company’s fiscal year beginning December 1, 2010. The Company is evaluating the effect the ASU will have in the disclosures in the Company’s consolidated financial statements.
Reclassifications
Certain prior year amounts in the consolidated financial statements have been reclassified to conform with the 2010 presentation. These reclassifications had no impact on the Company’s results of operations. As a result of the Company’s new reportable segment, Rialto Investments, the Company reclassified certain prior year amounts in the consolidated financial statements to conform with the 2010 presentation.
LENNAR CORPORATION AND SUBSIDIARIES
NOTES TO CONSOLIDATED FINANCIAL STATEMENTS—(Continued)
2. Operating and Reporting Segments
The Company’s operating segments are aggregated into reportable segments, based primarily upon similar economic characteristics, geography and product type. The Company’s reportable segments consist of:
(1) Homebuilding East
(2) Homebuilding Central
(3) Homebuilding West
(4) Homebuilding Houston
(5) Financial Services
(6) Rialto Investments
Information about homebuilding activities in which the Company’s homebuilding activities are not economically similar to other states in the same geographic area is grouped under “Homebuilding Other,” which is not considered a reportable segment.
The Rialto segment is a new reportable segment that met the reportable segment criteria set forth in GAAP beginning in the first quarter of 2010. All prior year segment information has been restated to conform with the 2010 presentation. The change had no effect on the Company’s consolidated financial statements, except for certain reclassifications (see Note 1). Rialto focuses on commercial and residential real estate opportunities arising from dislocations in the United States real estate markets and the eventual restructure and recapitalization of those markets.
Evaluation of segment performance is based primarily on operating earnings (loss) before income taxes. Operations of the Company’s homebuilding segments primarily include the construction and sale of single-family attached and detached homes, as well as the purchase, development and sale of residential land directly and through the Company’s unconsolidated entities. Operating earnings (loss) for the homebuilding segments consist of revenues generated from the sales of homes and land, equity in earnings (loss) from unconsolidated entities and other income (expense), net, less the cost of homes sold and land sold, selling, general and administrative expenses and other interest expense of the segment. The Company’s reportable homebuilding segments and all other homebuilding operations not required to be reported separately, have operations located in:
East:Florida, Maryland, New Jersey and Virginia
Central:Arizona, Colorado and Texas (1)
West:California and Nevada
Houston: Houston, Texas
Other: Georgia,Illinois, Minnesota, North Carolina and South Carolina
LENNAR CORPORATION AND SUBSIDIARIES
NOTES TO CONSOLIDATED FINANCIAL STATEMENTS—(Continued)
Operations of the Lennar Financial Services segment include primarily mortgage financing, title insurance and closing services for both buyers of the Company’s homes and others. Substantially all of the loans the Lennar Financial Services segment originates are sold within a short period in the secondary mortgage market on a servicing released, non-recourse basis. After the loans are sold, the Company retains potential liability for possible claims by purchasers that it breached certain limited industry-standard representations and warranties in the loan sale agreements. Lennar Financial Services’ operating earnings consist of revenues generated primarily from mortgage financing, title insurance and closing services, less the cost of such services and certain selling, general and administrative expenses incurred by the segment. The Lennar Financial Services segment operates generally in the same states as the Company’s homebuilding operations, as well as in other states.
Operations of the Rialto segment include sourcing, underwriting, pricing, managing and ultimately monetizing real estate assets, as well as providing similar services to others in markets across the country. Rialto operating earnings (loss) consists of revenues generated primarily from accretable interest income associated with the portfolios of real estate loans acquired in partnership with the FDIC and other portfolios of real estate loans and assets acquired, fees for sub-advisory services, other income, net, consisting primarily of gains on sale of REO and gains upon foreclosure of REO, and equity in earnings from unconsolidated entities, less the costs incurred by the segment for managing the portfolios, providing advisory services, underwriting expenses related to both the completed and abandoned transactions, and other general administrative expenses.
Each reportable segment follows the same accounting policies described in Note 1—“Summary of Significant Accounting Policies” to the consolidated financial statements. Operational results of each segment are not necessarily indicative of the results that would have occurred had the segment been an independent, stand-alone entity during the periods presented.
LENNAR CORPORATION AND SUBSIDIARIES
NOTES TO CONSOLIDATED FINANCIAL STATEMENTS—(Continued)
Financial information relating to the Company’s operations was as follows:
| November 30, | ||||||||||||
| 2010 | 2009 | 2008 | ||||||||||
| (In thousands) | ||||||||||||
Assets: | ||||||||||||
Homebuilding East | $ | 1,524,095 | 1,469,671 | 1,588,299 | ||||||||
Homebuilding Central | 716,595 | 703,669 | 774,412 | |||||||||
Homebuilding West | 2,051,888 | 1,986,558 | 2,022,787 | |||||||||
Homebuilding Houston | 226,749 | 214,706 | 267,628 | |||||||||
Homebuilding Other | 737,486 | 756,068 | 849,726 | |||||||||
Rialto Investments (1) | 1,777,614 | 9,874 | — | |||||||||
Financial Services | 608,990 | 557,550 | 607,978 | |||||||||
Corporate and unallocated | 1,144,434 | 1,616,695 | 1,314,068 | |||||||||
Total assets | $ | 8,787,851 | 7,314,791 | 7,424,898 | ||||||||
Lennar Homebuilding investments in unconsolidated entities: | ||||||||||||
Homebuilding East | $ | 47,731 | 54,242 | 94,897 | ||||||||
Homebuilding Central | 52,156 | 96,036 | 178,618 | |||||||||
Homebuilding West | 517,429 | 423,850 | 451,719 | |||||||||
Homebuilding Houston | 3,095 | 20,527 | 21,820 | |||||||||
Homebuilding Other | 5,774 | 4,611 | 19,698 | |||||||||
Total Lennar Homebuilding investments in unconsolidated entities | $ | 626,185 | 599,266 | 766,752 | ||||||||
Rialto Investments’ investments in unconsolidated entities | $ | 84,526 | 9,874 | — | ||||||||
Financial Services goodwill | $ | 34,046 | 34,046 | 34,046 | ||||||||
| Years Ended November 30, | ||||||||||||
| 2010 | 2009 | 2008 | ||||||||||
| (In thousands) | ||||||||||||
Revenues: | ||||||||||||
Homebuilding East | $ | 939,450 | 872,258 | 1,275,758 | ||||||||
Homebuilding Central | 357,732 | 367,183 | 533,110 | |||||||||
Homebuilding West | 683,490 | 826,237 | 1,440,163 | |||||||||
Homebuilding Houston | 365,938 | 434,818 | 550,853 | |||||||||
Homebuilding Other | 359,029 | 333,789 | 463,154 | |||||||||
Financial Services | 275,786 | 285,102 | 312,379 | |||||||||
Rialto Investments | 92,597 | — | — | |||||||||
Total revenues (2) | $ | 3,074,022 | 3,119,387 | 4,575,417 | ||||||||
Operating earnings (loss): | ||||||||||||
Homebuilding East | $ | 112,992 | (206,253 | ) | (157,034 | ) | ||||||
Homebuilding Central | (25,912 | ) | (70,640 | ) | (95,087 | ) | ||||||
Homebuilding West (3) | (5,861 | ) | (331,070 | ) | (143,696 | ) | ||||||
Homebuilding Houston | 26,030 | 16,442 | 38,806 | |||||||||
Homebuilding Other | (7,189 | ) | (84,772 | ) | (47,872 | ) | ||||||
Financial Services (4) | 31,284 | 35,982 | (30,990 | ) | ||||||||
Rialto Investments | 57,307 | (2,528 | ) | — | ||||||||
Total operating earnings (loss) | 188,651 | (642,839 | ) | (435,873 | ) | |||||||
Corporate and unallocated | (93,926 | ) | (117,565 | ) | (129,752 | ) | ||||||
Earnings (loss) before income taxes | $ | 94,725 | (760,404 | ) | (565,625 | ) | ||||||
LENNAR CORPORATION AND SUBSIDIARIES
NOTES TO CONSOLIDATED FINANCIAL STATEMENTS—(Continued)
Valuation adjustments and write-offs relating to the Company’s operations were as follows:
| Years Ended November 30, | ||||||||||||
| 2010 | 2009 | 2008 | ||||||||||
| (In thousands) | ||||||||||||
Valuation adjustments to finished homes, CIP and land on which the Company intends to build homes: | ||||||||||||
East | $ | 10,410 | 73,670 | 76,791 | ||||||||
Central | 9,205 | 13,603 | 28,142 | |||||||||
West | 7,139 | 64,095 | 75,614 | |||||||||
Houston | 219 | 1,116 | 2,262 | |||||||||
Other | 17,744 | 27,755 | 12,709 | |||||||||
Total | 44,717 | 180,239 | 195,518 | |||||||||
Valuation adjustments to land the Company intends to sell or has sold to third parties: | ||||||||||||
East | 120 | 37,048 | 23,251 | |||||||||
Central | 2,056 | 1,309 | 12,369 | |||||||||
West | 1,166 | 38,679 | 11,094 | |||||||||
Houston | 32 | 674 | 137 | |||||||||
Other (1) | 62 | 17,604 | 940 | |||||||||
Total | 3,436 | 95,314 | 47,791 | |||||||||
Write-offs of option deposits and pre-acquisition costs: | ||||||||||||
East | 2,705 | 64,131 | 18,989 | |||||||||
Central | — | 82 | 6,024 | |||||||||
West | 400 | 13,902 | 62,447 | |||||||||
Houston | — | 2,471 | 745 | |||||||||
Other | — | 3,786 | 8,967 | |||||||||
Total | 3,105 | 84,372 | 97,172 | |||||||||
Company’s share of valuation adjustments related to assets of unconsolidated entities: | ||||||||||||
East | 229 | 504 | 7,241 | |||||||||
Central | 4,734 | 6,184 | 1,732 | |||||||||
West (2) | 5,498 | 94,665 | 22,675 | |||||||||
Houston | — | — | — | |||||||||
Other | — | 540 | 597 | |||||||||
Total | 10,461 | 101,893 | 32,245 | |||||||||
Valuation adjustments to investments in unconsolidated entities: | ||||||||||||
East | 760 | 4,981 | 54,340 | |||||||||
Central | — | 13,179 | 11,197 | |||||||||
West | 975 | 65,607 | 90,193 | |||||||||
Houston | — | 1,317 | — | |||||||||
Other | — | 3,888 | 17,060 | |||||||||
Total | 1,735 | 88,972 | 172,790 | |||||||||
Write-offs of notes and other receivables: | ||||||||||||
East | — | 2,148 | 10,200 | |||||||||
Central | — | 105 | — | |||||||||
West | — | 7,387 | 10,222 | |||||||||
Houston | — | — | — | |||||||||
Other | 1,518 | 19 | 4,596 | |||||||||
Total | 1,518 | 9,659 | 25,018 | |||||||||
Lennar Financial Services goodwill impairment | — | — | 27,176 | |||||||||
Total valuation adjustments and write-offs of option deposits and pre-acquisition costs, notes and other receivables and goodwill | $ | 64,972 | 560,449 | 597,710 | ||||||||
LENNAR CORPORATION AND SUBSIDIARIES
NOTES TO CONSOLIDATED FINANCIAL STATEMENTS—(Continued)
The Company recorded significantly lower valuation adjustments during the year ended November 30, 2010. However, as expected, after the expiration of the Federal homebuyer tax credit at the end of April 2010, demand trends in many communities in which the Company is selling homes decreased despite the affordability from lower home prices and historically low interest rates. If these trends continue and there is further deterioration in the housing market, it may cause additional pricing pressures and slower absorption. This may potentially lead to additional valuation adjustments in the future. In addition, market conditions may cause the Company to re-evaluate its strategy regarding certain assets that could result in further valuation adjustments and/or additional write-offs of option deposits and pre-acquisition costs due to abandonment of those options contracts.
| Years Ended November 30, | ||||||||||||
| 2010 | 2009 | 2008 | ||||||||||
| (In thousands) | ||||||||||||
Lennar Homebuilding interest expense: | ||||||||||||
Homebuilding East | $ | 50,050 | 48,713 | 43,376 | ||||||||
Homebuilding Central | 19,476 | 19,488 | 17,307 | |||||||||
Homebuilding West | 43,562 | 46,809 | 46,522 | |||||||||
Homebuilding Houston | 10,152 | 11,902 | 7,768 | |||||||||
Homebuilding Other | 20,706 | 20,537 | 15,384 | |||||||||
Total Lennar Homebuilding interest expense | $ | 143,946 | 147,449 | 130,357 | ||||||||
Lennar Financial Services interest income, net | $ | 1,710 | 2,839 | 12,391 | ||||||||
Depreciation and amortization: | ||||||||||||
Homebuilding East | $ | 4,658 | 3,676 | 4,395 | ||||||||
Homebuilding Central | 2,550 | 2,073 | 2,428 | |||||||||
Homebuilding West | 5,853 | 7,643 | 14,644 | |||||||||
Homebuilding Houston | 951 | 974 | 1,104 | |||||||||
Homebuilding Other | 1,397 | 1,718 | 1,678 | |||||||||
Lennar Financial Services | 3,507 | 4,269 | 6,095 | |||||||||
Rialto Investments | 134 | — | — | |||||||||
Corporate and unallocated | 16,560 | 19,653 | 19,492 | |||||||||
Total depreciation and amortization | $ | 35,610 | 40,006 | 49,836 | ||||||||
Net additions (disposals) to operating properties and equipment: | ||||||||||||
Homebuilding East | $ | (909 | ) | 230 | 40 | |||||||
Homebuilding Central | 83 | 150 | 33 | |||||||||
Homebuilding West | 4,006 | 291 | 85 | |||||||||
Homebuilding Houston | 35 | — | 20 | |||||||||
Homebuilding Other | (931 | ) | (2,009 | ) | (398 | ) | ||||||
Lennar Financial Services | 1,774 | 1,711 | 1,657 | |||||||||
Rialto Investments | 428 | — | — | |||||||||
Corporate and unallocated | 576 | (702 | ) | (2,827 | ) | |||||||
Total net additions (disposals) to operating properties and equipment | $ | 5,062 | (329 | ) | (1,390 | ) | ||||||
Lennar Homebuilding equity in earnings (loss) from unconsolidated entities: | ||||||||||||
Homebuilding East | $ | (871 | ) | (5,660 | ) | (31,422 | ) | |||||
Homebuilding Central | (4,727 | ) | (8,143 | ) | (1,310 | ) | ||||||
Homebuilding West | (6,113 | ) | (114,373 | ) | (25,113 | ) | ||||||
Homebuilding Houston | 766 | (1,801 | ) | (920 | ) | |||||||
Homebuilding Other | (21 | ) | (940 | ) | (391 | ) | ||||||
Total Lennar Homebuilding equity in loss from unconsolidated entities | $ | (10,966 | ) | (130,917 | ) | (59,156 | ) | |||||
Rialto Investments equity in earnings from unconsolidated entities | $ | 15,363 | — | — | ||||||||
LENNAR CORPORATION AND SUBSIDIARIES
NOTES TO CONSOLIDATED FINANCIAL STATEMENTS—(Continued)
3. Lennar Homebuilding Receivables
| November 30, | ||||||||
| 2010 | 2009 | |||||||
| (In thousands) | ||||||||
Accounts receivable | $ | 41,324 | 88,813 | |||||
Mortgages and notes receivable | 40,167 | 44,111 | ||||||
| 81,491 | 132,924 | |||||||
Allowance for doubtful accounts | (3,072 | ) | (10,871 | ) | ||||
| $ | 78,419 | 122,053 | ||||||
At November 30, 2010, Lennar Homebuilding accounts receivable relates primarily to rebates and other receivables. At November 30, 2009, it also included receivables related to Chinese drywall, which were collected during 2010. The Company performs ongoing credit evaluations of its customers and generally does not require collateral for accounts receivable. Mortgages and notes receivable arising from the sale of land are generally collateralized by the property sold to the buyer. Allowances are maintained for potential credit losses based on historical experience, present economic conditions and other factors considered relevant by the Company.
4. Lennar Homebuilding Investments in Unconsolidated Entities
Summarized condensed financial information on a combined 100% basis related to Lennar Homebuilding’s unconsolidated entities that are accounted for by the equity method was as follows:
| Years Ended November 30, | ||||||||||||
Statements of Operations | 2010 | 2009 | 2008 | |||||||||
| (In thousands) | ||||||||||||
Revenues | $ | 236,752 | 339,993 | 862,728 | ||||||||
Costs and expenses | 378,997 | 1,212,866 | 1,394,601 | |||||||||
Net loss of unconsolidated entities (1) | $ | (142,245 | ) | (872,873 | ) | (531,873 | ) | |||||
The Company’s share of net loss—recognized (2) | $ | (10,966 | ) | (130,917 | ) | (59,156 | ) | |||||
LENNAR CORPORATION AND SUBSIDIARIES
NOTES TO CONSOLIDATED FINANCIAL STATEMENTS—(Continued)
Balance Sheets | November 30, | |||||||
| 2010 | 2009 | |||||||
| (Dollars in thousands) | ||||||||
Assets: | ||||||||
Cash and cash equivalents | $ | 82,573 | 171,946 | |||||
Inventories | 3,371,435 | 3,628,491 | ||||||
Other assets | 307,244 | 403,383 | ||||||
| $ | 3,761,252 | 4,203,820 | ||||||
Liabilities and equity: | ||||||||
Accounts payable and other liabilities | $ | 327,824 | 366,141 | |||||
Debt | 1,284,818 | 1,588,390 | ||||||
Equity | 2,148,610 | 2,249,289 | ||||||
| $ | 3,761,252 | 4,203,820 | ||||||
The Company’s partners generally are unrelated homebuilders, land owners/developers and financial or other strategic partners. The unconsolidated entities follow accounting principles that are in all material respects the same as those used by the Company. The Company shares in the profits and losses of these unconsolidated entities generally in accordance with its ownership interests. In many instances, the Company is appointed as the day-to-day manager under the direction of a management committee that has shared powers amongst the partners of the unconsolidated entities and receives management fees and/or reimbursement of expenses for performing this function. During the years ended November 30, 2010, 2009 and 2008, the Company received management fees and reimbursement of expenses from the unconsolidated entities totaling $21.0 million, $15.3 million and $33.3 million, respectively.
The Company and/or its partners sometimes obtain options or enter into other arrangements under which the Company can purchase portions of the land held by the unconsolidated entities. Option prices are generally negotiated prices that approximate fair value when the Company receives the options. During the years ended November 30, 2010, 2009 and 2008, $86.3 million, $117.8 million and $416.2 million, respectively, of the unconsolidated entities’ revenues were from land sales to the Company. The Company does not include in its Lennar Homebuilding equity in earnings (loss) from unconsolidated entities its pro rata share of unconsolidated entities’ earnings resulting from land sales to its homebuilding divisions. Instead, the Company accounts for those earnings as a reduction of the cost of purchasing the land from the unconsolidated entities. This in effect defers recognition of the Company’s share of the unconsolidated entities’ earnings related to these sales until the Company delivers a home and title passes to a third-party homebuyer.
In 2007, the Company sold a portfolio of land to a strategic land investment venture with Morgan Stanley Real Estate Fund II, L.P., an affiliate of Morgan Stanley & Co., Inc., in which the Company has a 20% ownership interest and 50% voting rights. Due to the Company’s continuing involvement, the transaction did not qualify as a sale by the Company under GAAP; thus, the inventory has remained on the Company’s consolidated balance sheet in consolidated inventory not owned. As of November 30, 2010 and 2009, the portfolio of land (including land development costs) of $424.5 million and $477.9 million, respectively, is reflected as inventory in the summarized condensed financial information related to Lennar Homebuilding’s unconsolidated entities.
The Lennar Homebuilding unconsolidated entities in which the Company has investments usually finance their activities with a combination of partner equity and debt financing. In some instances, the Company and its partners have guaranteed debt of certain unconsolidated entities.
LENNAR CORPORATION AND SUBSIDIARIES
NOTES TO CONSOLIDATED FINANCIAL STATEMENTS—(Continued)
The summary of the Company’s net recourse exposure related to the Lennar Homebuilding unconsolidated entities in which the Company has investments was as follows:
| November 30, | ||||||||
| 2010 | 2009 | |||||||
| (In thousands) | ||||||||
Several recourse debt—repayment | $ | 33,399 | 42,691 | |||||
Several recourse debt—maintenance | 29,454 | 75,238 | ||||||
Joint and several recourse debt—repayment | 48,406 | 85,799 | ||||||
Joint and several recourse debt—maintenance | 61,591 | 81,592 | ||||||
Land seller debt and other debt recourse exposure | — | 2,420 | ||||||
The Company’s maximum recourse exposure | 172,850 | 287,740 | ||||||
Less: joint and several reimbursement agreements with the Company’s partners | (58,878 | ) | (93,185 | ) | ||||
The Company’s net recourse exposure | $ | 113,972 | 194,555 | |||||
During the year ended November 30, 2010, the Company reduced its maximum recourse exposure related to indebtedness of Lennar Homebuilding unconsolidated entities by $114.9 million, of which $82.5 million was paid by the Company primarily through capital contributions to unconsolidated entities and $32.4 million related to a reduction in the number of joint ventures in which the Company has investments, the reduction of joint and several recourse debt and the joint ventures selling inventory.
As of November 30, 2010 and 2009, the Company had $10.2 million and $14.1 million, respectively, of obligation guarantees recorded as a liability on its consolidated balance sheets. During the year ended November 30, 2010, the liability was reduced by $11.0 million as a result of the debt extinguishment related to one of the Company’s unconsolidated entities and by $2.1 million due to cash paid related to an obligation guarantee previously recorded. This was partially offset by an accrual of $9.2 million established by the Company to cover claims arising under obligation guarantees. The obligation guarantees are estimated based on current facts and circumstances and any unexpected changes may lead the Company to incur additional liabilities under its obligation guarantees in the future.
Indebtedness of a Lennar Homebuilding unconsolidated entity is secured by its own assets. Some Lennar Homebuilding unconsolidated entities own multiple properties and other assets. There is no cross collateralization of debt to different unconsolidated entities. The Company also does not use its investment in one unconsolidated entity as collateral for the debt in another unconsolidated entity or commingle funds among Lennar Homebuilding’s unconsolidated entities.
In connection with loans to a Lennar Homebuilding unconsolidated entity, the Company and its partners often guarantee to a lender either jointly and severally or on a several basis, any, or all of the following: (I) the completion of the development, in whole or in part, (ii) indemnification of the lender from environmental issues, (iii) indemnification of the lender from “bad boy acts” of the unconsolidated entity (or full recourse liability in the event of unauthorized transfer or bankruptcy) and (iv) that the loan to value and/or loan to cost will not exceed a certain percentage (maintenance or remargining guarantee) or that a percentage of the outstanding loan will be repaid (repayment guarantee).
In connection with loans to a Lennar Homebuilding unconsolidated entity where there is a joint and several guarantee, the Company generally has a reimbursement agreement with its partner. The reimbursement agreement provides that neither party is responsible for more than its proportionate share of the guarantee. However, if the Lennar Homebuilding’s joint venture partner does not have adequate financial resources to meet its obligations under the reimbursement agreement, the Company may be liable for more than its proportionate share, up to its maximum recourse exposure, which is the full amount covered by the joint and several guarantee.
If the joint ventures are unable to reduce their debt, where there is recourse to the Company, through the sale of inventory or other means, then the Company and its partners may be required to contribute capital to the joint ventures.
LENNAR CORPORATION AND SUBSIDIARIES
NOTES TO CONSOLIDATED FINANCIAL STATEMENTS—(Continued)
The recourse debt exposure in the previous table represents the Company’s maximum recourse exposure to loss from guarantees and does not take into account the underlying value of the collateral or the other assets of the borrowers that are available to repay the debt or to reimburse the Company for any payments on its guarantees. The Lennar Homebuilding unconsolidated entities that have recourse debt have significant amount of assets and equity. The summarized balance sheets of the Lennar Homebuilding unconsolidated entities with recourse debt were as follows:
| November 30, | ||||||||
| 2010 | 2009 | |||||||
| (In thousands) | ||||||||
Assets | $ | 990,028 | 1,324,993 | |||||
Liabilities | 487,606 | 777,836 | ||||||
Equity | 502,422 | 547,157 | ||||||
In addition, in most instances in which the Company has guaranteed debt of a Lennar Homebuilding unconsolidated entity, the Company’s partners have also guaranteed that debt and are required to contribute their share of the guarantee payments. Some of the Company’s guarantees are repayment guarantees and some are maintenance guarantees. In a repayment guarantee, the Company and its venture partners guarantee repayment of a portion or all of the debt in the event of default before the lender would have to exercise its rights against the collateral. In the event of default, if the Company’s venture partner does not have adequate financial resources to meet its obligations under the reimbursement agreement, the Company may be liable for more than its proportionate share, up to its maximum recourse exposure, which is the full amount covered by the joint and several guarantee. The maintenance guarantees only apply if the value or the collateral (generally land and improvements) is less than a specified percentage of the loan balance. If the Company is required to make a payment under a maintenance guarantee to bring the value of the collateral above the specified percentage of the loan balance, the payment would constitute a capital contribution or loan to the Lennar Homebuilding unconsolidated entity and increase the Company’s investment in the unconsolidated entity and its share of any funds the unconsolidated entity distributes.
In connection with many of the loans to Lennar Homebuilding unconsolidated entities, the Company and its joint venture partners (or entities related to them) have been required to give guarantees of completion to the lenders. Those completion guarantees may require that the guarantors complete the construction of the improvements for which the financing was obtained. If the construction is to be done in phases, the guarantee generally is limited to completing only the phases as to which construction has already commenced and for which loan proceeds were used.
During the year ended November 30, 2010, there were: (1) payments of $10.0 million under the Company’s maintenance guarantees, (2) at the election of the Company, a loan paydown of $50.3 million, representing both the Company’s and its partner’s share, in return for a 4-year loan extension and the rights to obtain preferred returns and priority distributions at one of the Company’s unconsolidated entities, and (3) a $19.3 million payment to extinguish debt at a discount and buyout the partner of one of the Company’s unconsolidated entities resulting in a net pre-tax gain of $7.7 million. In addition, during the year ended November 30, 2010, there were other loan paydowns of $28.1 million, a portion of which related to amounts paid under the Company’s repayment guarantees. During the year ended November 30, 2009, there were payments of $31.6 million under the Company’s maintenance guarantees and there were other loan repayments of $72.4 million, a portion of which related to amounts paid under the Company’s repayment guarantees. During the year ended November 30, 2010, there were no payments under completion guarantees. During the year ended November 30, 2009, there was a payment of $5.6 million under a completion guarantee related to one joint venture. Payments made to, or on behalf of, the Company’s unconsolidated entities, including payment made under guarantees, are recorded primarily as capital contributions to the Company’s Lennar Homebuilding unconsolidated entities.
As of November 30, 2010, the fair values of the maintenance guarantees, repayment guarantees and completion guarantees were not material. The Company believes that as of November 30, 2010, in the event it becomes legally obligated to perform under a guarantee of the obligation of a Lennar Homebuilding unconsolidated entity due to a triggering event under a guarantee, most of the time the collateral should be sufficient to repay at least a significant portion of the obligation or the Company and its partners would contribute additional capital into the venture. In certain instances, the Company has placed performance letters of credit and surety bonds with municipalities for its joint ventures (see Note 6).
LENNAR CORPORATION AND SUBSIDIARIES
NOTES TO CONSOLIDATED FINANCIAL STATEMENTS—(Continued)
The total debt of the Lennar Homebuilding unconsolidated entities in which the Company has investments was as follows:
| November 30, | ||||||||
| 2010 | 2009 | |||||||
| (Dollars in thousands) | ||||||||
The Company’s net recourse exposure | $ | 113,972 | 194,555 | |||||
Reimbursement agreements from partners | 58,878 | 93,185 | ||||||
The Company’s maximum recourse exposure | 172,850 | 287,740 | ||||||
Non-recourse bank debt and other debt (partner’s share of several recourse) | 79,921 | 140,078 | ||||||
Non-recourse land seller debt or other debt | 58,604 | 47,478 | ||||||
Non-recourse debt with completion guarantees | 600,297 | 608,397 | ||||||
Non-recourse debt without completion guarantees | 373,146 | 504,697 | ||||||
Non-recourse debt to the Company | 1,111,968 | 1,300,650 | ||||||
Total debt | $ | 1,284,818 | 1,588,390 | |||||
The Company’s maximum recourse exposure as a % of total JV debt | 13 | % | 18 | % | ||||
Subsequent to November 30, 2010, one of Lennar Homebuilding’s unconsolidated entities extended the maturity of its $573.5 million debt without recourse to Lennar until 2018. In exchange for the extension, all the partners agreed to provide a limited several repayment guarantee on the outstanding debt, which will result in a $36.3 million increase to the Company’s maximum recourse exposure related to Lennar Homebuilding unconsolidated entities.
LandSource/Newhall Transactions
In February 2007, the Company’s LandSource Communities Development LLC (“LandSource”) joint venture admitted MW Housing Partners as a new strategic partner. As a result, the Company received a distribution from LandSource of $707.6 million and its ownership in LandSource was reduced to 16%. In June 2008, LandSource and a number of its subsidiaries commenced proceedings under Chapter 11 of the Bankruptcy Code in the United States Bankruptcy Court for the District of Delaware. In November 2008, the Company’s land purchase options with LandSource were terminated, thus, in 2008, the Company recognized a deferred profit of $101.3 million (net of $31.8 million of write-offs of option deposits and pre-acquisition costs and other write-offs) related to the 2007 recapitalization of LandSource.
In July 2009, the United States Bankruptcy Court of the District of Delaware confirmed the plan of reorganization for LandSource. As a result of the bankruptcy proceedings, LandSource was reorganized into a new company called Newhall Land Development, LLC, (“Newhall”). The reorganized company emerged from Chapter 11 free of its previous bank debt. As part of the reorganization plan, in 2009 the Company invested $140 million in exchange for approximately a 15% equity interest in the reorganized Newhall, ownership in several communities that were formerly owned by LandSource, the settlement and release of any claims that might have been asserted against the Company and certain other claims LandSource had against third parties.
5. Operating Properties and Equipment
| November 30, | ||||||||
| 2010 | 2009 | |||||||
| (In thousands) | ||||||||
Operating properties (1) | $ | 196,214 | 145,015 | |||||
Leasehold improvements | 29,107 | 27,916 | ||||||
Furniture, fixtures and equipment | 27,604 | 32,055 | ||||||
| 252,925 | 204,986 | |||||||
Accumulated depreciation and amortization | (57,860 | ) | (52,954 | ) | ||||
| $ | 195,065 | 152,032 | ||||||
LENNAR CORPORATION AND SUBSIDIARIES
NOTES TO CONSOLIDATED FINANCIAL STATEMENTS—(Continued)
Operating properties and equipment are included in other assets in the consolidated balance sheets.
6. Lennar Homebuilding Senior Notes and Other Debts Payable
| November 30, | ||||||||
| 2010 | 2009 | |||||||
| (Dollars in thousands) | ||||||||
5.95% senior notes due 2011 | $ | 113,189 | 244,727 | |||||
5.95% senior notes due 2013 | 266,319 | 347,471 | ||||||
5.50% senior notes due 2014 | 248,657 | 248,365 | ||||||
5.60% senior notes due 2015 | 501,216 | 501,424 | ||||||
6.50% senior notes due 2016 | 249,788 | 249,760 | ||||||
12.25% senior notes due 2017 | 393,031 | 392,392 | ||||||
6.95% senior notes due 2018 | 247,323 | — | ||||||
2.00% convertible senior notes due 2020 | 276,500 | — | ||||||
2.75% convertible senior notes due 2020 | 375,875 | — | ||||||
5.125% senior notes due 2010 | — | 249,955 | ||||||
Mortgage notes on land and other debt | 456,256 | 527,258 | ||||||
| $ | 3,128,154 | 2,761,352 | ||||||
In February 2010, the Company terminated its $1.1 billion senior unsecured revolving credit facility (the “Credit Facility”). The Company had no outstanding borrowings under the Credit Facility as it was only being used to issue letters of credit. The Company entered into cash-collateralized letter of credit agreements with two banks with a capacity totaling $225 million. In November 2010, the Company terminated its cash-collateralized letter of credit agreements and simultaneously entered into a $150 million Letter of Credit and Reimbursement Agreement (“LC Agreement”) with certain financial institutions. The LC Agreement may be increased to $200 million, although there are currently no commitments for the additional $50 million. The Company believes it was in compliance with its debt covenants at November 30, 2010.
The Company’s performance letters of credit outstanding were $78.9 million and $97.7 million, respectively, at November 30, 2010 and 2009. The Company’s financial letters of credit outstanding were $195.0 million and $205.4 million, respectively, at November 30, 2010 and 2009. Performance letters of credit are generally posted with regulatory bodies to guarantee the Company’s performance of certain development and construction activities, and financial letters of credit are generally posted in lieu of cash deposits on option contracts, for insurance risks, credit enhancements and as other collateral. Additionally, at November 30, 2010, the Company had outstanding performance and surety bonds related to site improvements at various projects (including certain projects in the Company’s joint ventures) of $684.7 million. Although significant development and construction activities have been completed related to these site improvements, these bonds are generally not released until all development and construction activities are completed. As of November 30, 2010, there were approximately $314.7 million, or 46%, of costs to complete related to these site improvements. The Company does not presently anticipate any draws upon these bonds, but if any such draws occur, the Company does not believe they would have a material effect on its financial position, results of operations or cash flows.
In November 2010, the Company issued $446.0 million of 2.75% convertible senior notes due 2020 (the “2.75% Convertible Senior Notes”) at a price of 100% in a private placement. Proceeds from the offering, after payment of expenses, were $436.4 million. The net proceeds are being used for general corporate purposes, including repayments or repurchases of existing senior notes or other indebtedness. The 2.75% Convertible Senior Notes are convertible into cash, shares of Class A common stock or a combination of both, at the Company’s election. However, it is the Company’s intent to settle the face value of the 2.75% Convertible Senior
LENNAR CORPORATION AND SUBSIDIARIES
NOTES TO CONSOLIDATED FINANCIAL STATEMENTS—(Continued)
Notes in cash. Holders may convert the 2.75% Convertible Senior Notes at the initial conversion rate of 45.1794 shares of common stock per $1,000 principal amount or 20,150,012 Class A common shares if all the 2.75% Convertible Senior Notes are converted, which is equivalent to an initial conversion price of approximately $22.13 per share of Class A common stock, subject to anti-dilution adjustments. The shares are not included in the calculation of diluted earnings per share primarily because it is the Company’s intent to settle the face value of the 2.75% Convertible Senior Notes in cash and the Company’s stock price does not exceed the conversion price.
Holders of the 2.75% Convertible Senior Notes will have the right to convert them, if during any fiscal quarter commencing after the fiscal quarter ended November 30, 2010 (and only during such fiscal quarter), if the last reported sale price of the Company’s Class A common stock for at least 20 trading days (whether or not consecutive) during a period of 30 consecutive trading days ending on the last trading day of the immediately preceding fiscal quarter is greater than or equal to 130% of the conversion price on each applicable trading day. Holders of the 2.75% Convertible Senior Notes will have the right to require the Company to repurchase them for cash equal to 100% of their principal amount, plus accrued but unpaid interest, on December 15, 2015. The Company will have the right to redeem the 2.75% Convertible Senior Notes at any time on or after December 20, 2015 for 100% of their principal amount, plus accrued but unpaid interest. Interest on the 2.75% Convertible Senior Notes is due semi-annually beginning June 15, 2011. Beginning with the period commencing December 20, 2015, under certain circumstances based on the average trading price of the 2.75% Convertible Senior Notes, the Company may be required to pay contingent interest. The 2.75% Convertible Senior Notes are unsecured and unsubordinated, but are currently guaranteed by substantially all of the Company’s wholly-owned subsidiaries.
Certain provisions under ASC Topic 470,Debt, require the issuer of certain convertible debt instruments that may be settled in cash on conversion to separately account for the liability and equity components of the instrument in a manner that reflects the issuer’s non-convertible debt borrowing rate. The Company has applied these provisions related to its 2.75% Convertible Senior Notes. The Company estimated the fair value of the 2.75% Convertible Senior Notes using similar debt instruments at issuance that did not have a conversion feature and allocated the residual fair value to an equity component that represents the estimated fair value of the conversion feature at issuance. The debt discount of the 2.75% Convertible Senior Notes is being amortized over five years and the annual effective interest is 7.1% after giving effect to the amortization of the discount and deferred financing costs. At November 30, 2010, the principal amount of the 2.75% Convertible Senior Notes was $446.0 million, the unamortized discount included in stockholders’ equity was $70.1 million and the net carrying amount of the 2.75% Convertible Senior Notes was $375.9 million. The carrying amount of the equity component of the 2.75% Convertible Senior Notes was $71.2 million at November 30, 2010. During the year ended November 30, 2010, the amount of interest recognized relating to both the contractual interest and amortization of the discount was $1.7 million.
In May 2010, the Company repurchased $289.4 million aggregate principal amount of its senior notes due 2010, 2011 and 2013 through a tender offer, resulting in a pre-tax loss of $10.8 million. Through the tender offer, the Company repurchased $76.4 million principal amount of its 5.125% senior notes due October 2010, $130.8 million principal amount of its 5.95% senior notes due 2011 and $82.3 million principal amount of its 5.95% senior notes due 2013.
In May 2010, the Company issued $250 million of 6.95% senior notes due 2018 (the “6.95% Senior Notes”) at a price of 98.929% in a private placement. Proceeds from the offering, after payment of initial purchaser’s discount and expenses, were $243.9 million. The Company used the net proceeds of the sale of the 6.95% Senior Notes to fund purchases pursuant to its tender offer for its 5.125% senior notes due October 2010, its 5.95% senior notes due 2011 and its 5.95% senior notes due 2013. Interest on the 6.95% Senior Notes is due semi-annually beginning December 1, 2010. The 6.95% Senior Notes are unsecured and unsubordinated, but are currently guaranteed by substantially all of the Company’s wholly owned subsidiaries. Subsequently, most of the privately placed 6.95% Senior Notes were exchanged for substantially identical 6.95% senior notes that had been registered under the Securities Act of 1933. At November 30, 2010, the carrying amount of the 6.95% Senior Notes was $247.3 million.
In May 2010, the Company also issued $276.5 million of 2.00% convertible senior notes due 2020 (the “2.00% Convertible Senior Notes”) at a price of 100% in a private placement. Proceeds from the offering, after payment of expenses, were $271.2 million. The net proceeds were or will be used for general corporate purposes,
LENNAR CORPORATION AND SUBSIDIARIES
NOTES TO CONSOLIDATED FINANCIAL STATEMENTS—(Continued)
including repayments or repurchases of existing senior notes or other indebtedness. The 2.00% Convertible Senior Notes are convertible into shares of Class A common stock at the initial conversion rate of 36.1827 shares of common stock per $1,000 principal amount of the 2.00% Convertible Senior Notes or 10,004,517 Class A common shares if all the 2.00% Convertible Senior Notes are converted, which is equivalent to an initial conversion price of approximately $27.64 per share of Class A common stock, subject to anti-dilution adjustments. The shares are included in the calculation of diluted earnings per share. Holders of the 2.00% Convertible Senior Notes will have the right to require the Company to repurchase them for cash equal to 100% of their principal amount, plus accrued but unpaid interest, on each of December 1, 2013 and December 1, 2015. The Company will have the right to redeem the 2.00% Convertible Senior Notes at any time on or after December 1, 2013 for 100% of their principal amount, plus accrued but unpaid interest. Interest on the 2.00% Convertible Senior Notes is due semi-annually beginning December 1, 2010. Beginning with the six-month interest period commencing December 1, 2013, under certain circumstances based on the average trading price of the 2.00% Convertible Senior Notes, the Company may be required to pay contingent interest. The 2.00% Convertible Senior Notes are unsecured and unsubordinated, but are currently guaranteed by substantially all of the Company’s wholly-owned subsidiaries. At November 30, 2010, the carrying amount of the 2.00% Convertible Senior Notes was $276.5 million.
In April 2009, the Company sold $400 million of 12.25% senior notes due 2017 (the “12.25% Senior Notes”) at a price of 98.098% in a private placement and were subsequently exchanged for identical 12.25% Senior Notes that had been registered under the Securities Act of 1933. Proceeds from the offering, after payment of initial purchaser’s discount and expenses, were $386.7 million. The Company added the proceeds to its working capital to be used for general corporate purposes, which included the repayment or repurchase of its near-term maturities or of debt of its joint ventures that it has guaranteed. Interest on the 12.25% Senior Notes is due semi-annually. The 12.25% Senior Notes are unsecured and unsubordinated, but are currently guaranteed by substantially all of the Company’s wholly-owned subsidiaries. At November 30, 2010 and 2009, the carrying amount of the 12.25% Senior Notes was $393.0 million and $392.4 million, respectively.
In March 2009, the Company retired its $281 million of 7 5/8% senior notes due March 2009 for 100% of the outstanding principal amount, plus accrued and unpaid interest as of the maturity date.
In April 2006, the Company sold $250 million of 5.95% senior notes due 2011 and $250 million of 6.50% senior notes due 2016 (collectively, the “2006 Senior Notes”) at prices of 99.766% and 99.873%, respectively, in a private placement and were subsequently exchanged for identical 2006 Senior Notes that had been registered under the Securities Act of 1933. Proceeds from the offering of the 2006 Senior Notes, after initial purchaser’s discount and expenses, were $248.7 million and $248.9 million, respectively. The Company added the proceeds to its working capital to be used for general corporate purposes. Interest on the 2006 Senior Notes is due semi-annually. The 2006 Senior Notes are unsecured and unsubordinated, but are currently guaranteed by substantially all of the Company’s wholly-owned subsidiaries. During the years ended November 30, 2010 and 2009, the Company redeemed $131.8 million (including amount redeemed through the tender offer) and $5.0 million, respectively, of the 5.95% senior notes due 2011. At November 30, 2010 and 2009, the carrying amount of the 2006 Senior Notes was $363.0 million and $494.5 million, respectively.
In September 2005, the Company sold $300 million of 5.125% senior notes due October 2010 (the “5.125% Senior Notes”) at a price of 99.905%. During the years ended November 30, 2010 and 2009, the Company redeemed $150.8 million (including amount redeemed through the tender offer) and $50.0 million, respectively, of the 5.125% Senior Notes. In October 2010, the Company retired the remaining $99.2 million of its 5.125% Senior Notes for 100% of the outstanding principal amount plus accrued and unpaid interest as of the maturity date.
In April 2005, the Company sold $300 million of 5.60% Senior Notes due 2015 (the “5.60% Senior Notes”) at a price of 99.771%. Proceeds from the offering, after initial purchaser’s discount and expenses, were $297.5 million. In July 2005, the Company sold $200 million of 5.60% Senior Notes due 2015 at a price of 101.407%. The 5.60% Senior Notes were the same issue as the 5.60% Senior Notes the Company sold in April 2005. Proceeds from the offering, after initial purchaser’s discount and expenses, were $203.9 million. The Company added the proceeds of both offerings to its working capital to be used for general corporate purposes. Interest on the 5.60% Senior Notes is due semi-annually. The 5.60% Senior Notes are unsecured and unsubordinated.
LENNAR CORPORATION AND SUBSIDIARIES
NOTES TO CONSOLIDATED FINANCIAL STATEMENTS—(Continued)
Currently, substantially all of the Company’s wholly-owned subsidiaries are guaranteeing the 5.60% Senior Notes. The 5.60% Senior Notes were subsequently exchanged for identical 5.60% Senior Notes that had been registered under the Securities Act of 1933. At November 30, 2010 and 2009, the carrying amount of the 5.60% Senior Notes sold in April and July 2005 was $501.2 million and $501.4 million, respectively.
In August 2004, the Company sold $250 million of 5.50% senior notes due 2014 (the “5.50% Senior Notes”) at a price of 98.842% in a private placement. Proceeds from the offering, after initial purchaser’s discount and expenses, were $245.5 million. The Company used the proceeds to repay borrowings under its Credit Facility. Interest on the 5.50% Senior Notes is due semi-annually. The 5.50% Senior Notes are unsecured and unsubordinated. Currently, substantially all of the Company’s wholly-owned subsidiaries are guaranteeing the 5.50% Senior Notes. At November 30, 2010 and 2009, the carrying value of the 5.50% Senior Notes was $248.7 million and $248.4 million, respectively.
In February 2003, the Company issued $350 million of 5.95% senior notes due 2013 (the “5.95% Senior Notes”) at a price of 98.287%. Currently, substantially all of the Company’s wholly-owned subsidiaries are guaranteeing the 5.95% Senior Notes. During the year ended November 30, 2010, the Company redeemed $82.3 million (including amount redeemed through the tender offer) of the 5.95% Senior Notes due 2013. At November 30, 2010 and 2009, the carrying amount of the 5.95% Senior Notes was $266.3 million and $347.5 million, respectively.
At November 30, 2010, the Company had mortgage notes on land and other debt due at various dates through 2013 bearing interest at rates up to 10.0% with an average interest rate of 3.7%. At November 30, 2010 and 2009, the carrying amount of the mortgage notes on land and other debt was $456.3 million and $527.3 million, respectively. During the year ended November 30, 2010, the Company retired $160.9 million of mortgage notes on land and other debt, resulting in a pre-tax gain of $19.4 million recorded in Lennar Homebuilding other income (expense), net.
The minimum aggregate principal maturities of senior notes and other debts payable during the five years subsequent to November 30, 2010 and thereafter are as follows:
| Debt Maturities | ||||
| (In thousands) | ||||
2011 | $ | 206,985 | ||
2012 | 238,346 | |||
2013 | 353,184 | |||
2014 | 279,589 | |||
2015 | 504,599 | |||
Thereafter | 1,545,451 | |||
LENNAR CORPORATION AND SUBSIDIARIES
NOTES TO CONSOLIDATED FINANCIAL STATEMENTS—(Continued)
7. Lennar Financial Services Segment
The assets and liabilities related to the Lennar Financial Services segment were as follows:
| November 30, | ||||||||
| 2010 | 2009 | |||||||
| (In thousands) | ||||||||
Assets: | ||||||||
Cash and cash equivalents | $ | 110,476 | 126,835 | |||||
Restricted cash | 21,210 | 25,646 | ||||||
Receivables, net (1) | 136,672 | 123,967 | ||||||
Loans held-for-sale (2) | 245,404 | 182,706 | ||||||
Loans held-for-investment, net | 21,768 | 25,131 | ||||||
Investments held-to-maturity | 3,165 | 2,512 | ||||||
Goodwill | 34,046 | 34,046 | ||||||
Other (3) | 36,249 | 36,707 | ||||||
| $ | 608,990 | 557,550 | ||||||
Liabilities: | ||||||||
Notes and other debts payable | $ | 271,678 | 217,557 | |||||
Other (4) | 176,541 | 197,329 | ||||||
| $ | 448,219 | 414,886 | ||||||
At November 30, 2010, the Lennar Financial Services segment has a warehouse repurchase facility with a maximum aggregate commitment of $150 million and an additional uncommitted amount of $50 million that matures in April 2011, and another warehouse repurchase facility with a maximum aggregate commitment of $175 million that matures in July 2011. The maximum aggregate commitment under these facilities totaled $325 million.
The Lennar Financial Services segment uses these facilities to finance its lending activities until the mortgage loans are sold to investors and expects the facilities to be renewed or replaced with other facilities when they mature. Borrowings under the facilities were $271.6 million and $217.5 million, respectively, at November 30, 2010 and 2009, and were collateralized by mortgage loans and receivables on loans sold to investors but not yet paid for with outstanding principal balances of $286.0 million and $266.9 million, respectively, at November 30, 2010 and 2009. The combined effective interest rate on the facilities at November 30, 2010 was 3.9%. If the facilities are not renewed, the borrowings under the lines of credit will be paid off by selling the mortgage loans held-for-sale to investors and by collecting on receivables on loans sold but not yet paid. Without the facilities, the Lennar Financial Services segment would have to use cash from operations and other funding sources to finance its lending activities.
LENNAR CORPORATION AND SUBSIDIARIES
NOTES TO CONSOLIDATED FINANCIAL STATEMENTS—(Continued)
8. Rialto Investment Segment
The assets and liabilities related to the Rialto segment were as follows:
| November 30, | ||||||||
| 2010 | 2009 | |||||||
| (In thousands) | ||||||||
Assets: | ||||||||
Cash and cash equivalents | $ | 76,412 | — | |||||
Defeasance cash to retire notes payable | 101,309 | — | ||||||
Loans receivable | 1,219,314 | — | ||||||
Real estate owned | 258,104 | — | ||||||
Investments in unconsolidated entities | 84,526 | 9,874 | ||||||
Investments held-to-maturity | 19,537 | — | ||||||
Other | 18,412 | — | ||||||
| $ | 1,777,614 | 9,874 | ||||||
Liabilities: | ||||||||
Notes payable | $ | 752,302 | — | |||||
Other | 18,412 | — | ||||||
| $ | 770,714 | — | ||||||
Rialto’s operating earnings (loss) for the years ended November 30, 2010 and 2009 was as follows:
| Years Ended November 30, | ||||||||
| 2010 | 2009 | |||||||
| (In thousands) | ||||||||
Revenues | $ | 92,597 | — | |||||
Costs and expenses | 67,904 | 2,528 | ||||||
Rialto Investments equity in earnings from unconsolidated entities | 15,363 | — | ||||||
Rialto Investments other income, net | 17,251 | — | ||||||
Operating earnings (loss) (1) | $ | 57,307 | (2,528 | ) | ||||
Loans Receivable
In February 2010, the Rialto segment acquired indirectly 40% managing member equity interests in two limited liability companies (“LLCs”), in partnership with the FDIC, for approximately $243 million (net of transaction costs and a $22 million working capital reserve). The LLCs hold performing and non-performing loans formerly owned by 22 failed financial institutions. The two portfolios originally consisted of more than 5,500 distressed residential and commercial real estate loans with an aggregate unpaid principal balance of approximately $3 billion and an initial fair value of approximately $1.2 billion. The FDIC retained a 60% equity interest in the LLCs and provided $626.9 million of notes with 0% interest, which are non-recourse to the Company. In accordance with GAAP, interest has not been imputed because the notes are with, and guaranteed by, a governmental agency. The notes are secured by the loans held by the LLCs. Additionally, if the LLCs exceed expectations and meet certain internal rate of return and distribution thresholds, the Company’s equity interest in the LLCs could be reduced from 40% down to 30%, with a corresponding increase to the FDIC’s equity interest from 60% up to 70%. As of November 30, 2010, the notes payable balance was $626.9 million; however, during the year ended November 30, 2010, $101.3 million of cash collections on loans in excess of expenses were deposited in a defeasance account, established for the repayment of the notes payable, under the agreement with the FDIC. The funds in the defeasance account will be used to retire the notes payable upon their maturity.
LENNAR CORPORATION AND SUBSIDIARIES
NOTES TO CONSOLIDATED FINANCIAL STATEMENTS—(Continued)
The LLCs met the accounting definition of VIEs and since the Company was determined to be the primary beneficiary, the Company consolidated the LLCs. The Company was determined to be the primary beneficiary because it has the power to direct the activities of the LLCs that most significantly impact the LLCs’ performance through its management and servicer contracts. At November 30, 2010, these consolidated LLCs had total combined assets and liabilities of $1.4 billion and $0.6 billion, respectively.
In September 2010, the Rialto segment completed the acquisitions of over $700 million of distressed real estate assets, in separate transactions, from three financial institutions. The combined portfolio includes approximately 400 loans with a total aggregate unpaid principal balance of over $500 million and over 300 real estate owned (“REO”) properties with an original appraised value of approximately $200 million. The Company paid $310 million for the distressed real estate assets of which, $125 million was financed through a 5-year senior unsecured note provided by one of the selling institutions.
At acquisition, the Rialto segment estimated the cash flows it expected to collect on these loans. In accordance with GAAP, the difference between the contractually required payments and the cash flows expected to be collected at acquisition is referred to as the nonaccretable difference. This difference is neither accreted into income nor recorded on the Company’s consolidated balance sheets. The excess of cash flows expected to be collected over the estimated fair value is referred to as the accretable yield and is recognized in interest income over the remaining life of the pool of loans, using the effective yield method. The following tables display the contractually required principal and interest, cash flows expected to be collected and fair value at acquisition related to the loan portfolios the Rialto segment acquired. The tables also display the nonaccretable difference and the accretable yield at acquisition.
| February 9, 2010 | ||||
| (In thousands) | ||||
FDIC Portfolios | ||||
Loans receivable contractually required payments at acquisition | $ | 3,668,498 | ||
Nonaccretable difference | 2,088,203 | |||
Cash flows expected to be collected | 1,580,295 | |||
Accretable difference | 402,659 | |||
Loans receivable carrying amount | $ | 1,177,636 | ||
| September 30, 2010 | ||||
| (In thousands) | ||||
Bank Portfolios | ||||
Loans receivable contractually required payments at acquisition | $ | 523,688 | ||
Nonaccretable difference | 202,762 | |||
Cash flows expected to be collected | 320,926 | |||
Accretable difference | 84,114 | |||
Loans receivable carrying amount | $ | 236,812 | ||
The following table displays the outstanding balance and the carrying value of the loans receivable as of:
| November 30, 2010 | ||||
| (In thousands) | ||||
Outstanding balance | $ | 4,056,625 | ||
Carrying value | $ | 1,219,314 | ||
Subsequent to acquisition, the Rialto segment is required to evaluate periodically its estimate of cash flows expected to be collected. These evaluations require the continued use of key assumptions and estimates, similar to the initial estimate of fair value. Subsequent changes in the estimated cash flows expected to be collected may result in changes in the accretable yield and nonaccretable difference or reclassifications from nonaccretable yield to accretable. Increases in the cash flows expected to be collected will generally result in an increase in
LENNAR CORPORATION AND SUBSIDIARIES
NOTES TO CONSOLIDATED FINANCIAL STATEMENTS—(Continued)
interest income over the remaining life of the pool of loans. Decreases in expected cash flows due to further credit deterioration will generally result in an impairment charge recognized in the Rialto segment provision for loan and losses, resulting in an increase to the allowance for loan losses.
In accordance with ASC 310-30, the Rialto segment’s reassessment of forecasted cash flows did not warrant the recording of a valuation allowance on these loans during the year ended November 30, 2010. At November 30, 2010, there were loans receivable with a carrying value of approximately $253 million for which interest income was not being recognized as they were classified as nonaccrual. No allowance for loan losses was recorded at November 30, 2010 against these loans as the fair value of the underlying collateral was at least equal to the loans’ carrying value.
Disposal of loans which may include sales of loans, receipts of payments in full by the borrower, or foreclosure, result in removal of the loan from accretable yield portfolios.
The activity in the accretable yield for the FDIC portfolios for the year ended November 30, 2010 was as follows:
| Accretable Yield | ||||
| (In thousands) | ||||
Balance at November 30, 2009 | $ | — | ||
Additions | 402,659 | |||
Accretions | (85,754 | ) | ||
Balance at November 30, 2010 | $ | 316,905 | ||
The activity in the accretable yield for the bank portfolios for the year ended November 30, 2010 was as follows:
| Accretable Yield (1) | ||||
| (In thousands) | ||||
Balance at November 30, 2009 | $ | — | ||
Additions | 84,114 | |||
Accretions | (4,708 | ) | ||
Balance at November 30, 2010 | $ | 79,406 | ||
LENNAR CORPORATION AND SUBSIDIARIES
NOTES TO CONSOLIDATED FINANCIAL STATEMENTS—(Continued)
Real Estate Owned
Based on the nature of Rialto’s operations, real estate properties acquired through, or in lieu of loan foreclosure, are commonly classified as held-for-sale. The Rialto segment classifies properties as held-for-sale when certain criteria set forth in ASC Topic 360 are met. When a real estate asset is classified as held-for-sale, the property is carried at the lower of its cost basis or fair value less estimated costs to sell. The Rialto segment had no valuation allowances on real estate held-for-sale as of November 30, 2010. Valuation allowances on real estate held-for-sale are based on updated appraisals of the underlying properties or management’s best estimate of fair value. The following table presents the changes in real estate held-for-sale for the year ended November 30, 2010:
| ||||
| ||||
| ||||
| ||||
| ||||
For the year ended November 30, 2010, the Company recorded approximately $2.9 million and $18.1 million, respectively, of gains from real estate sales and gains from acquisitions of real estate through foreclosure. The gains associated with real estate operations are recorded in Rialto Investments other income, net.
Investments
In November 2010, the Rialto segment invested in approximately $43 million of non-investment grade commercial mortgage-backed securities (“CMBS”) for $19.4 million, representing a 55% discount to par value. These securities bear interest at a coupon rate of 4% and have a stated and assumed final distribution date of November 2020 and a stated maturity date of October 2057. The Rialto segment has classified these securities as held-to-maturity based on its intent and ability to hold the securities until maturity.
In a CMBS transaction, monthly interest received from all of the pooled loans is paid to the investors, starting with those investors holding the highest rated bonds and progressing in an order of seniority based on the class of security. Based on the aforementioned, the principal and interest repayments of a particular class are dependent upon collections on the underlying mortgages, which are affected by prepayments, extensions and defaults.
In accordance with ASC Topic 320-10,Investments in Debt and Equity Securities, the Rialto segment reviews changes in estimated cash flows periodically, to determine if other-than-temporary impairment has occurred on its investment securities. Based on the Rialto segment’s assessment, no impairment charges were recorded during 2010. Additionally, the carrying value of the investment securities was $19.5 million and approximates their fair value due to the close proximity of the transaction date and the ending balance sheet date.
In addition to the acquisition and management of the FDIC and bank portfolios, an affiliate in the Rialto segment is a sub-advisor to the AllianceBernstein L.P. (“AB”) fund formed under the Federal government’s Public-Private Investment Program (“PPIP”) to purchase real estate related securities from banks and other financial institutions. The sub-advisor receives management fees for sub-advisory services. The Company committed to invest $75 million of the total equity commitments of approximately $1.2 billion made by private investors in this fund, and the U.S. Treasury has committed to a matching amount of approximately $1.2 billion of equity in the fund, as well as agreed to extend up to approximately $2.3 billion of debt financing. During the year ended November 30, 2010, the Company invested $63.8 million in the AB PPIP fund. As of November 30, 2010, the carrying value of the Company’s investment in the AB PPIP fund was $77.3 million.
In November 2010, the Rialto segment completed its first closing of a real estate investment fund (the “Fund”) with initial equity commitments of approximately $300 million (including $75 million committed by the Company). The Fund’s objective during its three-year investment period is to invest in distressed real estate assets and other related investments that fit within the Fund’s investment parameters.
LENNAR CORPORATION AND SUBSIDIARIES
NOTES TO CONSOLIDATED FINANCIAL STATEMENTS—(Continued)
Additionally, another subsidiary in the Rialto segment also has a $7.3 million, or approximately 5%, investment in a service and infrastructure provider to the residential home loan market (the “Service Provider”), which provides services to the consolidated LLCs.
Summarized condensed financial information on a combined 100% basis related to Rialto’s investments in unconsolidated entities that are accounted for by the equity method as of November 30, 2010 was as follows:
| November 30, | ||||||||
Balance Sheets | 2010 | 2009 (1) | ||||||
| (In thousands) | ||||||||
Assets: | ||||||||
Cash and cash equivalents | $ | 42,793 | 2,229 | |||||
Investments | 4,341,226 | — | ||||||
Other assets | 181,600 | 179,985 | ||||||
| $ | 4,565,619 | 182,214 | ||||||
Liabilities and equity: | ||||||||
Accounts payable and other liabilities | $ | 110,921 | 58,209 | |||||
Partner loans | 137,820 | 135,570 | ||||||
Debt due to the U.S. Treasury | 1,955,000 | — | ||||||
Equity | 2,361,878 | (11,565 | ) | |||||
| $ | 4,565,619 | 182,214 | ||||||
| Years Ended November 30, | ||||||||
Statements of Operations | 2010 | 2009 (1) | ||||||
| (In thousands) | ||||||||
Revenues | $ | 357,330 | 58,464 | |||||
Costs and expenses | 209,103 | 89,570 | ||||||
Other gains | 311,468 | — | ||||||
Net earnings (loss) of unconsolidated entities | $ | 459,695 | (31,106 | ) | ||||
Rialto Investments’ share of net earnings recognized | $ | 15,363 | — | |||||
9. Income Taxes
The benefit (provision) for income taxes consisted of the following:
| Years Ended November 30, | ||||||||||||
| 2010 | 2009 | 2008 | ||||||||||
| (In thousands) | ||||||||||||
Current: | ||||||||||||
Federal | $ | 13,286 | 327,131 | 249,157 | ||||||||
State | 12,448 | (12,786 | ) | (24,206 | ) | |||||||
| 25,734 | 314,345 | 224,951 | ||||||||||
Deferred: | ||||||||||||
Federal | — | — | (646,261 | ) | ||||||||
State | — | — | (126,247 | ) | ||||||||
| — | — | (772,508 | ) | |||||||||
| $ | 25,734 | 314,345 | (547,557 | ) | ||||||||
LENNAR CORPORATION AND SUBSIDIARIES
NOTES TO CONSOLIDATED FINANCIAL STATEMENTS—(Continued)
Deferred income taxes reflect the net tax effects of temporary differences between the carrying amounts of the assets and liabilities for financial reporting purposes and the amounts used for income tax purposes. The tax effects of significant temporary differences that give rise to the net deferred tax asset are as follows:
| November 30, | ||||||||
| 2010 | 2009 | |||||||
| (In thousands) | ||||||||
Deferred tax assets: | ||||||||
Inventory valuation adjustments | $ | 131,508 | 175,166 | |||||
Reserves and accruals | 109,357 | 114,002 | ||||||
Net operating loss carryforward | 401,529 | 330,160 | ||||||
Capitalized expenses | 42,388 | 41,598 | ||||||
Investments in unconsolidated entities | 5,819 | 29,685 | ||||||
Other | 32,519 | 38,765 | ||||||
Total deferred tax assets | 723,120 | 729,376 | ||||||
Valuation allowance | (609,463 | ) | (647,385 | ) | ||||
Total deferred tax assets after valuation allowance | 113,657 | 81,991 | ||||||
Deferred tax liabilities: | ||||||||
Capitalized expenses | 45,425 | 35,531 | ||||||
Convertible debt basis difference | 26,331 | — | ||||||
Rialto investments | 12,815 | — | ||||||
Prepaid expenses | 6,214 | 15,977 | ||||||
Other | 22,872 | 30,483 | ||||||
Total deferred tax liabilities | 113,657 | 81,991 | ||||||
Net deferred tax assets | $ | — | $ | — | ||||
As a result of the valuation allowance against the Company’s net deferred tax assets, at November 30, 2010 and 2009, the Lennar Homebuilding operations, the Lennar Financial Services segment and Rialto segment did not have net deferred tax assets.
A reduction of the carrying amounts of deferred tax assets by a valuation allowance is required if, based on the available evidence, it is more likely than not that such assets will not be realized. Accordingly, the need to establish valuation allowances for deferred tax assets is assessed periodically based on the more-likely-than-not realization threshold criterion. In the assessment for a valuation allowance, appropriate consideration is given to all positive and negative evidence related to the realization of the deferred tax assets. This assessment considers, among other matters, the nature, frequency and severity of current and cumulative losses, forecasts of future profitability, the duration of statutory carryforward periods, the Company’s experience with loss carryforwards not expiring unused and tax planning alternatives.
Based upon an evaluation of all available evidence, the Company recorded a valuation allowance against its deferred tax assets of $730.8 million during the year ended November 30, 2008, and increased it by $269.6 million during the year ended November 30, 2009. In addition, for the year ended November 30, 2009, the Company recorded a reversal of its deferred tax asset valuation allowance of $351.8 million, primarily due to a change in tax legislation, which allowed the Company to carry back its fiscal year 2009 tax loss to recover previously paid income taxes. During the year ended November 30, 2010, the Company recorded a reversal of its deferred tax asset valuation allowance of $37.9 million primarily due to the recording of a deferred tax liability from the issuance of 2.75% Convertible Senior Notes and the net earnings generated during the year. The reversal of the deferred tax asset valuation allowance related to the issuance of the 2.75% Convertible Senior Notes was recorded as an adjustment to additional paid-in capital. At November 30, 2010 and 2009, the Company’s deferred tax asset valuation allowance was $609.5 million and $647.4 million, respectively. In future periods, the allowance could be reduced based on sufficient evidence indicating that it is more likely than not that a portion or all of our deferred tax assets will be realized.
At November 30, 2010, the Company had tax effected federal and state net operating loss carryforwards totaling $401.5 million. Federal net operating loss carryforwards may be carried forward up to 20 years to offset future taxable income and begin to expire in 2025. State net operating losses may be carried forward from 5 to 20 years, depending on the tax jurisdiction, with losses expiring between 2012, and 2031.
LENNAR CORPORATION AND SUBSIDIARIES
NOTES TO CONSOLIDATED FINANCIAL STATEMENTS—(Continued)
A reconciliation of the statutory rate and the effective tax rate follows:
| Percentage of Pretax Income (Loss) | ||||||||||||
| 2010 | 2009 | 2008 | ||||||||||
Statutory rate | 35.00 | % | 35.00 | % | 35.00 | % | ||||||
State income taxes, net of federal income tax benefit | 2.43 | 2.32 | 3.09 | |||||||||
Internal Revenue Code Section 199 impact | — | — | (0.29 | ) | ||||||||
Other | 0.18 | (0.33 | ) | (1.25 | ) | |||||||
Nondeductible compensation | 4.79 | (0.30 | ) | (0.35 | ) | |||||||
Tax reserves and interest expense | (50.91 | ) | (4.97 | ) | (3.56 | ) | ||||||
Deferred tax asset valuation reversal (allowance) | (28.50 | ) | 11.25 | (130.15 | ) | |||||||
Effective rate | (37.01 | )% | 42.97 | % | (97.51 | )% | ||||||
The following table summarizes the changes in gross unrecognized tax benefits for the years ended November 30, 2010, 2009 and 2008:
| Years Ended November 30, | ||||||||||||
| 2010 | 2009 | 2008 | ||||||||||
| (In thousands) | ||||||||||||
Gross unrecognized tax benefits, beginning of year | $ | 77,211 | 100,168 | 88,560 | ||||||||
Decreases due to settlements with taxing authorities | (31,167 | ) | (57,022 | ) | (2,605 | ) | ||||||
Increases of prior year items | — | 36,061 | 14,213 | |||||||||
Decreases due to statute expirations | — | (1,996 | ) | — | ||||||||
Gross unrecognized tax benefits, end of year | $ | 46,044 | 77,211 | 100,168 | ||||||||
If the Company were to recognize the $46.0 million of gross unrecognized tax benefits, $25.0 million would affect the Company’s effective tax rate. The Company expects the total amount of unrecognized tax benefits to decrease by $26.5 million within twelve months as a result of settlements with various taxing authorities and the expiration of certain statutes of limitations.
At November 30, 2010 and 2009, the Company had $28.2 million and $33.6 million, respectively, accrued for interest and penalties, of which $2.7 million and $3.9 million, respectively, were recorded during the years ended November 30, 2010 and 2009. During the year ended November 30, 2010, the accrual for interest was reduced by $8.1 million as a result of settlements with various taxing authorities.
The IRS is currently examining the Company’s federal income tax returns for fiscal years 2005 through 2009, and certain state taxing authorities are examining various fiscal years. The final outcome of these examinations is not yet determinable. The statute of limitations for the Company’s major tax jurisdictions remains open for examination for fiscal year 2003 and subsequent years.
10. Earnings (Loss) Per Share
Basic earnings (loss) per share is computed by dividing net earnings (loss) attributable to common stockholders by the weighted average number of common shares outstanding for the period. Diluted earnings per share reflects the potential dilution that could occur if securities or other contracts to issue common stock were exercised or converted into common stock or resulted in the issuance of common stock that then shared in the earnings of the Company.
Effective December 1, 2009, the Company adopted certain provisions under ASC 260. Under these provisions, all outstanding nonvested shares that contain non-forfeitable rights to dividends or dividend equivalents that participate in undistributed earnings with common stock are considered participating securities and, therefore, are included in computing earnings per share pursuant to the two-class method. The two-class method is an earnings allocation formula that determines earnings per share for each class of common stock and participating securities according to dividends or dividend equivalents and participation rights in undistributed earnings. The Company’s restricted common stock (“nonvested shares”) are considered participating securities.
LENNAR CORPORATION AND SUBSIDIARIES
NOTES TO CONSOLIDATED FINANCIAL STATEMENTS—(Continued)
For the years ended November 30, 2009 and 2008, the nonvested shares were excluded from the calculation of the denominator for diluted loss per share because including them would be anti-dilutive due to the Company’s net loss during those periods. The adoption of these provisions did not have a material impact to the Company’s basic and diluted loss per share.
Basic and diluted earnings (loss) per share were calculated as follows:
| Years Ended November 30, | ||||||||||||
| 2010 | 2009 | 2008 | ||||||||||
| (In thousands, except per share amounts) | ||||||||||||
Numerator: | ||||||||||||
Net earnings (loss) attributable to Lennar | $ | 95,261 | (417,147 | ) | (1,109,085 | ) | ||||||
Less: distributed earnings allocated to nonvested shares | 310 | 197 | 1,124 | |||||||||
Less: undistributed earnings allocated to nonvested shares | 735 | — | — | |||||||||
Numerator for basic earnings (loss) per share | 94,216 | (417,344 | ) | (1,110,209 | ) | |||||||
Plus: interest on 2.00% Convertible Senior Notes, net of tax | 1,994 | — | — | |||||||||
Plus: undistributed earnings allocated to convertible shares | 735 | — | — | |||||||||
Less: undistributed earnings reallocated to convertible shares | 734 | — | — | |||||||||
Numerator for diluted earnings (loss) per share | $ | 96,211 | (417,344 | ) | (1,110,209 | ) | ||||||
Denominator: | ||||||||||||
Denominator for basic earnings (loss) per share – weighted average common shares outstanding | 182,960 | 170,537 | 158,395 | |||||||||
Effect of dilutive securities: | ||||||||||||
Shared based payments | 161 | — | — | |||||||||
2.00% Convertible Senior Notes | 5,736 | — | — | |||||||||
Denominator for diluted earnings (loss) per share – weighted average common shares outstanding | 188,857 | 170,537 | 158,395 | |||||||||
Basic earnings (loss) per share | $ | 0.51 | (2.45 | ) | (7.01 | ) | ||||||
Diluted earnings (loss) per share | $ | 0.51 | (2.45 | ) | (7.01 | ) | ||||||
Options to purchase 4.0 million shares, 7.5 million shares and 7.4 million shares, respectively, in total of Class A and Class B common stock were outstanding and anti-dilutive for the years ended November 30, 2010, 2009 and 2008.
11. Comprehensive Income (Loss)
Comprehensive income (loss) attributable to Lennar represents changes in stockholders’ equity from non-owner sources. The components of comprehensive income (loss) attributable to Lennar were as follows:
| Years Ended November 30, | ||||||||||||
| 2010 | 2009 | 2008 | ||||||||||
| (In thousands) | ||||||||||||
Net earnings (loss) attributable to Lennar | $ | 95,261 | (417,147 | ) | (1,109,085 | ) | ||||||
Unrealized gain on Company’s portion of unconsolidated entity’s interest rate swap liability, net of tax (37%) | — | — | 2,061 | |||||||||
Comprehensive income (loss) attributable to Lennar | $ | 95,261 | (417,147 | ) | (1,107,024 | ) | ||||||
There was no accumulated other comprehensive income (loss) at November 30, 2010 and 2009.
12. Capital Stock
Preferred Stock
The Company is authorized to issue 500,000 shares of preferred stock with a par value of $10 per share and 100 million shares of participating preferred stock with a par value of $0.10 per share. No shares of preferred stock or participating preferred stock have been issued as of November 30, 2010.
LENNAR CORPORATION AND SUBSIDIARIES
NOTES TO CONSOLIDATED FINANCIAL STATEMENTS—(Continued)
Common Stock
During both the years ended November 30, 2010 and 2009, the Company’s Class A and Class B common stockholders received a per share annual dividend of $0.16. In October 2008, the Company’s Board of Directors voted to decrease the annual dividend rate with regard to the Company’s Class A and Class B common stock to $0.16 per share per year (payable quarterly) from $0.64 per share per year (payable quarterly). During the year ended November 30, 2008, Class A and Class B common stockholders received per share annual dividends of $0.52.
The only significant difference between the Class A common stock and Class B common stock is that Class A common stock entitles holders to one vote per share and the Class B common stock entitles holders to ten votes per share.
As of November 30, 2010, Stuart A. Miller, the Company’s President, Chief Executive Officer and a Director, directly owned, or controlled through family-owned entities, shares of Class A and Class B common stock, which represented approximately 46% voting power of the Company’s stock.
The Company has a stock repurchase program which permits the purchase of up to 20 million shares of its outstanding common stock. During the years ended November 30, 2010, 2009 and 2008, there were no share repurchases of common stock under the stock repurchase program. As of November 30, 2010, 6.2 million shares of common stock can be repurchased in the future under the program.
During the years ended November 30, 2010 and November 30, 2009, treasury stock increased by 0.1 million Class A common shares and 0.3 million Class A common shares, respectively, due to activity related to the Company’s equity compensation plan and forfeitures of restricted stock.
In April 2009, the Company entered into distribution agreements with J.P Morgan Securities, Inc., Citigroup Global Markets Inc., Merril Lynch, Pierce, Fenner & Smith Incorporated and Deutsche Bank Securities Inc., relating to an offering of its Class A common stock into the market from time to time for an aggregate of up to $275 million. As of November 30, 2009, the Company had sold a total of 21.0 million shares of its Class A common stock under the equity offering for gross proceeds of $225.5 million, or an average of $10.76 per share. After compensation to the distributors of $4.5 million, the Company received net proceeds of $221.0 million. The Company used the proceeds from the offering for general corporate purposes. There was no activity related to these distribution agreements during 2010.
Restrictions on Payment of Dividends
There are no restrictions on the payment of dividends on common stock by the Company. There are no agreements which restrict the payment of dividends by subsidiaries of the Company other than to maintain the financial ratios and net worth requirements under the Lennar Financial Services segment’s warehouse lines of credit, which restrict the payment of dividends from the Company’s mortgage subsidiaries following the occurrence and during the continuance of an event of default thereunder and limit dividends to 50% of net income in the absence of an event of default.
401(k) Plan
Under the Company’s 401(k) Plan (the “Plan”), contributions made by associates can be invested in a variety of mutual funds or proprietary funds provided by the Plan trustee. The Company may also make contributions for the benefit of associates. The Company records as compensation expense its contribution to the Plan. This amount was $4.5 million in 2010, $5.2 million in 2009 and $7.6 million in 2008.
13. Share-Based Payments
The Company has share-based awards outstanding under three different plans which provide for the granting of stock options and stock appreciation rights and awards of restricted common stock (“nonvested shares”) to key officers, associates and directors. These awards are primarily issued in the form of new shares. The exercise prices of stock options and stock appreciation rights may not be less than the market value of the
LENNAR CORPORATION AND SUBSIDIARIES
NOTES TO CONSOLIDATED FINANCIAL STATEMENTS—(Continued)
common stock on the date of the grant. Exercises are permitted in installments determined when options are granted. Each stock option and stock appreciation right will expire on a date determined at the time of the grant, but not more than ten years after the date of the grant.
Cash flows resulting from tax benefits related to tax deductions in excess of the compensation expense recognized for those options (excess tax benefits) are classified as financing cash flows. For the year ended November 30, 2010, there was an immaterial amount of excess tax benefits from share-based awards. For the years ended November 30, 2009 and 2008, the Company did not have any excess tax benefits from shared-based awards.
Compensation expense related to the Company’s share-based awards was as follows:
| Years Ended November 30, | ||||||||||||
| 2010 | 2009 | 2008 | ||||||||||
| (In thousands) | ||||||||||||
Stock options | $ | 5,985 | 10,291 | 12,432 | ||||||||
Nonvested shares | 22,090 | 20,101 | 17,439 | |||||||||
Total compensation expense for share-based awards | $ | 28,075 | 30,392 | 29,871 | ||||||||
Cash received from stock options exercised during the years ended November 30, 2010, 2009 and 2008 was $2.0 million, $0.3 million, and $0.2 million, respectively. The tax deductions related to stock options exercised during the year ended November 30, 2010 were $0.2 million. There were no material tax deductions related to stock options exercised during the years ended November 30, 2009 and 2008.
The fair value of each of the Company’s stock option awards is estimated on the date of grant using a Black-Scholes option-pricing model that uses the assumptions noted in the table below. The fair value of the Company’s stock option awards, which are subject to graded vesting, is expensed on a straight-line basis over the vesting life of the stock options. Expected volatility is based on historical volatility of the Company’s stock over the most recent period equal to the expected life of the award. The risk-free rate for periods within the contractual life of the stock option award is based on the yield curve of a zero-coupon U.S. Treasury bond on the date the stock option award is granted with a maturity equal to the expected term of the stock option award granted. The Company uses historical data to estimate stock option exercises and forfeitures within its valuation model. The expected life of stock option awards granted is derived from historical exercise experience under the Company’s share-based payment plans and represents the period of time that stock option awards granted are expected to be outstanding.
The fair value of these options was determined at the date of the grant using the Black-Scholes option-pricing model. The significant weighted average assumptions for the years ended November 30, 2010, 2009 and 2008 were as follows:
| 2010 | 2009 | 2008 | ||||
Dividend yield | 0.9% - 1.1% | 1.7% - 1.8% | 3.2% - 4.7% | |||
Volatility rate | 80% - 112% | 73% - 121% | 43% - 60% | |||
Risk-free interest rate | 0.2% - 0.6% | 0.7% - 2.8% | 1.9% - 3.5% | |||
Expected option life (years) | 1.5 | 2.0 - 5.0 | 2.0 - 5.0 |
LENNAR CORPORATION AND SUBSIDIARIES
NOTES TO CONSOLIDATED FINANCIAL STATEMENTS—(Continued)
A summary of the Company’s stock option activity for the year ended November��30, 2010 was as follows:
| Stock Options | Weighted Average Exercise Price | Weighted Average Remaining Contractual Life | Aggregate Intrinsic Value (In thousands) | |||||||||||||
Outstanding at November 30, 2009 | 6,395,105 | $ | 29.37 | |||||||||||||
Grants | 20,000 | $ | 17.83 | |||||||||||||
Forfeited or expired | (974,139 | ) | $ | 52.15 | ||||||||||||
Exercises | (174,756 | ) | $ | 11.26 | ||||||||||||
Outstanding at November 30, 2010 | 5,266,210 | $ | 25.72 | 2.0 years | $ | 6,272 | ||||||||||
Vested and expected to vest in the future at November 30, 2010 | 4,095,639 | $ | 23.87 | 2.0 years | $ | 5,170 | ||||||||||
Exercisable at November 30, 2010 | 3,298,410 | $ | 31.35 | 1.6 years | $ | 3,236 | ||||||||||
Available for grant at November 30, 2010 | 1,733,876 | |||||||||||||||
The weighted average fair value of options granted during the years ended November 30, 2010, 2009 and 2008 was $8.66, $4.74 and $3.85, respectively. The total intrinsic value of options exercised during the year ended November 30, 2010 was $0.6 million. The total intrinsic value of options exercised during the years ended November 30, 2009 and 2008 was not material.
The fair value of nonvested shares is determined based on the trading price of the Company’s common stock on the grant date. The weighted average fair value of nonvested shares granted during the years ended November 30, 2010, 2009 and 2008 was $15.21, $12.63 and $15.11, respectively. A summary of the Company’s nonvested shares activity for the year ended November 30, 2010 was as follows:
| Shares | Weighted Average Grant Date Fair Value | |||||||
Nonvested restricted shares at November 30, 2009 | 2,349,485 | $ | 13.27 | |||||
Grants | 1,688,058 | $ | 15.21 | |||||
Vested | (1,317,896 | ) | $ | 14.64 | ||||
Forfeited | (10,750 | ) | $ | 19.38 | ||||
Nonvested restricted shares at November 30, 2010 | 2,708,897 | $ | 13.79 | |||||
At November 30, 2010, there was $40.9 million of unrecognized compensation expense related to unvested share-based awards granted under the Company’s share-based payment plans, of which $6.3 million relates to stock options and $34.6 million relates to nonvested shares. The unrecognized expense related to nonvested shares is expected to be recognized over a weighted-average period of 3.2 years. During the years ended November 30, 2010, 2009 and 2008, 1.3 million nonvested shares, 1.2 million nonvested shares and 0.4 million nonvested shares, respectively, vested. For the years ended November 30, 2010 and 2009, there was no tax provision related to nonvested share activity because the Company has recorded a full valuation allowance against its deferred tax assets. The tax provision related to nonvested share activity during the year ended November 30, 2008 was $6.1 million.
LENNAR CORPORATION AND SUBSIDIARIES
NOTES TO CONSOLIDATED FINANCIAL STATEMENTS—(Continued)
14. Financial Instruments
The following table presents the carrying amounts and estimated fair values of financial instruments held by the Company at November 30, 2010 and 2009, using available market information and what the Company believes to be appropriate valuation methodologies. Considerable judgment is required in interpreting market data to develop the estimates of fair value. The use of different market assumptions and/or estimation methodologies might have a material effect on the estimated fair value amounts. The table excludes cash and cash equivalents, restricted cash, defeasance cash to retire notes payable, receivables, net, income tax receivables and accounts payable, which had fair values approximating their carrying amounts due to the short maturities and liquidity of these instruments.
| November 30, | ||||||||||||||||
| 2010 | 2009 | |||||||||||||||
| Carrying Amount | Fair Value | Carrying Amount | Fair Value | |||||||||||||
| (In thousands) | ||||||||||||||||
ASSETS | ||||||||||||||||
Rialto Investments: | ||||||||||||||||
Loans receivable | $ | 1,219,314 | 1,411,731 | — | — | |||||||||||
Investments—held-to-maturity | $ | 19,537 | 19,537 | — | — | |||||||||||
Lennar Financial Services: | ||||||||||||||||
Loans held-for-investment, net | $ | 21,768 | 23,083 | 25,131 | 26,818 | |||||||||||
Investments—held-to-maturity | $ | 3,165 | 3,177 | 2,512 | 2,529 | |||||||||||
LIABILITIES | ||||||||||||||||
Lennar Homebuilding: | ||||||||||||||||
Senior notes and other debts payable | $ | 3,128,154 | 3,153,106 | 2,761,352 | 2,754,737 | |||||||||||
Rialto Investments: | ||||||||||||||||
Notes payable | $ | 752,302 | 719,703 | — | — | |||||||||||
Lennar Financial Services: | ||||||||||||||||
Notes and other debts payable | $ | 271,678 | 271,678 | 217,557 | 217,557 | |||||||||||
The following methods and assumptions are used by the Company in estimating fair values:
Lennar Homebuilding—For senior notes and other debts payable, the fair value of fixed-rate borrowings is based on quoted market prices. The Company’s variable-rate borrowings are tied to market indices and approximate fair value due to the short maturities associated with the majority of the instruments.
Rialto Investments—The fair value for loans receivable is based on discounted cash flows as of November 30, 2010 or the fair value of the collateral. The fair value for investments held-to-maturity approximated the carrying value because the investments were acquired right before November 30, 2010. For notes payable, the fair value of zero percent notes provided by the FDIC was calculated based on a 5-year treasury yield as of November 30, 2010 and the fair value of other notes payable was calculated based on discounted cash flows using the Company’s weighted average borrowing rate.
Lennar Financial Services—The fair values above are based on quoted market prices, if available. The fair values for instruments that do not have quoted market prices are estimated by the Company on the basis of discounted cash flows or other financial information.
Fair Value Measurements
GAAP provides a framework for measuring fair value, expands disclosures about fair value measurements and establishes a fair value hierarchy which prioritizes the inputs used in measuring fair value summarized as follows:
| ||
| ||
| ||
LENNAR CORPORATION AND SUBSIDIARIES
NOTES TO CONSOLIDATED FINANCIAL STATEMENTS—(Continued)
The Company’s financial instruments measured at fair value at November 30, 2010 on a recurring basis are all within the Lennar Financial Services segment and are summarized below:
Financial Instruments | Fair Value Hierarchy | Fair Value at November 30, 2010 | ||||||
| (Dollars in thousands) | ||||||||
Loans held-for-sale (1) | Level 2 | $ | 245,404 | |||||
Mortgage loan commitments | Level 2 | $ | 1,449 | |||||
Forward contracts | Level 2 | $ | 2,905 | |||||
The estimated fair values of the Company’s financial instruments have been determined by using available market information and what the Company believes to be appropriate valuation methodologies. Considerable judgment is required in interpreting market data to develop the estimates of fair value. The use of different market assumptions and/or estimation methodologies might have a material effect on the estimated fair value amounts. The following methods and assumptions are used by the Company in estimating fair values:
Loans held-for-sale—Fair value is based on independent quoted market prices, where available, or the prices for other mortgage whole loans with similar characteristics. Management believes carrying loans held-for-sale at fair value improves financial reporting by mitigating volatility in reported earnings caused by measuring the fair value of the loans and the derivatives instruments used to economically hedge them without having to apply complex hedge accounting provisions. In addition, the Company recognizes the fair value of its rights to service a mortgage loan as revenue upon entering into an interest rate lock loan commitment with a borrower, in accordance with ASC Topic 815-10-S99. The fair value of these servicing rights is included in the Lennar Financial Services’ loans held-for-sale as of November 30, 2010 and 2009. Fair value of the servicing rights is determined based on value in the servicing sales contracts.
Mortgage loan commitments—Fair value of commitments to originate loans is based upon the difference between the current value of similar loans and the price at which the Lennar Financial Services segment has committed to originate the loans. The fair value of commitments to sell loan contracts is the estimated amount that the Lennar Financial Services segment would receive or pay to terminate the commitments at the reporting date based on market prices for similar financial instruments.
Forward contracts—Fair value is based on quoted market prices for similar financial instruments.
Gains and losses of financial instruments measured at fair value from initial measurement and subsequent changes in fair value are recognized in the Lennar Financial Services segment’s earnings (loss). The changes in fair values that are included in earnings (loss) are shown, by financial instrument and financial statement line item, below:
| Years Ended November 30, | ||||||||
| 2010 | 2009 | |||||||
| (In thousands) | ||||||||
Changes in fair value included in Lennar Financial Services revenues: | ||||||||
Loans held-for-sale | $ | (2,607 | ) | 2,264 | ||||
Mortgage loan commitments | $ | (3,251 | ) | 318 | ||||
Forward contracts | $ | 6,463 | 2,903 | |||||
Interest income on loans held-for-sale measured at fair value is calculated based on the interest rate of the loan and recorded in interest income in the Lennar Financial Services’ statement of operations.
The Lennar Financial Services segment uses mandatory mortgage-backed securities (“MBS”) forward commitments, option contracts and investor commitments to hedge its mortgage-related interest rate exposure. These instruments involve, to varying degrees, elements of credit and interest rate risk. Credit risk associated with MBS forward commitments, option contracts and loan sales transactions is managed by limiting the Company’s counterparties to investment banks, federally regulated bank affiliates and other investors meeting
LENNAR CORPORATION AND SUBSIDIARIES
NOTES TO CONSOLIDATED FINANCIAL STATEMENTS—(Continued)
the Company’s credit standards. The segment’s risk, in the event of default by the purchaser, is the difference between the contract price and fair value of the MBS forward commitments and option contracts. At November 30, 2010, the segment had open commitments amounting to $270.8 million to sell MBS with varying settlement dates through February 2011.
The Company’s assets measured at fair value on a nonrecurring basis are those assets for which the Company has recorded valuation adjustments and write-offs during the year ended November 30, 2010 and Rialto Investments real estate owned assets acquired through foreclosure. The assets measured at fair value on a nonrecurring basis are summarized below:
Non-financial Assets | Fair Value Hierarchy | Fair Value | Total Gains (Losses) (1) | |||||||||
| (Dollars in thousands) | ||||||||||||
Lennar Homebuilding: | ||||||||||||
Finished homes and construction in progress (2) | Level 3 | $ | 88,049 | (41,057 | ) | |||||||
Land and land under development (3) | Level 3 | $ | 10,807 | (5,369 | ) | |||||||
Investments in unconsolidated entities (4) | Level 3 | $ | (1,383 | ) | (1,735 | ) | ||||||
Rialto Investments: | ||||||||||||
Real estate owned (5) | Level 3 | $ | 204,049 | 18,089 | ||||||||
See Note 1 for a detailed description of the Company’s process for identifying and recording valuation adjustments related to Lennar Homebuilding inventory and Lennar Homebuilding investments in unconsolidated entities.
15. Consolidation of Variable Interest Entities
GAAP requires the consolidation of VIEs in which an enterprise has a controlling financial interest. A controlling financial interest will have both of the following characteristics: (a) the power to direct the activities of a VIE that most significantly impact the VIEs’ economic performance and (b) the obligation to absorb losses of the VIE that could potentially be significant to the VIE or the right to receive benefits from the VIE that could potentially be significant to the VIE.
The Company’s variable interest in VIEs may be in the form of (1) equity ownership, (2) contracts to purchase assets, (3) management and development agreements between the Company and a VIE, (4) loans provided by the Company to a VIE or other partner and/or (5) guarantees provided by members to banks and
LENNAR CORPORATION AND SUBSIDIARIES
NOTES TO CONSOLIDATED FINANCIAL STATEMENTS—(Continued)
other third parties. The Company examines specific criteria and uses its judgment when determining if the Company is the primary beneficiary of a VIE. Factors considered in determining whether the Company is the primary beneficiary include risk and reward sharing, experience and financial condition of other partner(s), voting rights, involvement in day-to-day capital and operating decisions, representation on a VIE’s executive committee, existence of unilateral kick-out rights or voting rights, level of economic disproportionality between the Company and the other partner(s) and contracts to purchase assets from VIEs.
Generally, all major decision making in the Company’s joint ventures is shared between all partners. In particular, business plans and budgets are generally required to be unanimously approved by all partners. Usually, management and other fees earned by the Company are nominal and believed to be at market and there is no significant economic disproportionality between the Company and other partners. Generally, the Company purchases less than a majority of the joint venture’s assets and the purchase prices under the Company’s option contracts are believed to be at market.
Generally, Lennar Homebuilding unconsolidated entities become VIEs and consolidate when the other partner(s) lack the intent and financial wherewithal to remain in the entity. As a result, the Company continues to fund operations and debt paydowns through partner loans or substituted capital contributions.
The Company evaluated all joint venture agreements as of November 30, 2010. Based on the Company’s evaluation, it consolidated entities within its Lennar Homebuilding segment that at November 30, 2010 had total combined assets and liabilities of $49.9 million and $9.4 million, respectively. In addition, the Company consolidated the LLCs in partnership with the FDIC in the Company’s Rialto segment that at November 30, 2010 had total combined assets and liabilities of $1.4 billion and $0.6 billion, respectively. The Company was determined to be the primary beneficiary because it has the power to direct the activities of the LLCs that most significantly impact the LLCs’ economic performance through its management and servicer contracts. During the year ended November 30, 2010, there were no VIEs that deconsolidated other than the $75.5 million of option contracts that deconsolidated as a result of the adoption of ASC 810.
At November 30, 2010 and November 30, 2009, the Company’s recorded investments in Lennar Homebuilding unconsolidated entities were $626.2 million and $599.3 million, respectively, and the Rialto Investments segment’s investments in unconsolidated entities as of November 30, 2010 and November 30, 2009 were $84.5 million and $9.9 million, respectively.
Consolidated VIEs
As of November 30, 2010, the carrying amount of the VIEs’ assets and non-recourse liabilities that consolidated were $2,300.2 million and $963.3 million, respectively. Those assets are owned by, and those liabilities are obligations of, the VIEs, not the Company.
A VIE’s assets can only be used to settle obligations of that VIE. The VIEs are not guarantors of Company’s senior notes and other debts payable. In addition, the assets held by a VIE usually are collateral for that VIE’s debt. The Company and other partners do not generally have an obligation to make capital contributions to a VIE unless the Company and/or the other partner(s) have entered into debt guarantees with a VIE’s banks. Other than debt guarantee agreements with a VIE’s banks, there are no liquidity arrangements or agreements to fund capital or purchase assets that could require the Company to provide financial support to a VIE. While the Company has option contracts to purchase land from certain of its VIEs, the Company is not required to purchase the assets and could walk away from the contracts.
LENNAR CORPORATION AND SUBSIDIARIES
NOTES TO CONSOLIDATED FINANCIAL STATEMENTS—(Continued)
Unconsolidated VIEs
At November 30, 2010 and November 30, 2009, the Company’s recorded investments in VIEs that are unconsolidated and its estimated maximum exposure to loss were as follows:
November 30, 2010 | Investments in Unconsolidated VIEs | Lennar’s Maximum Exposure to Loss | ||||||
| (In thousands) | ||||||||
Lennar Homebuilding (1) | $ | 144,809 | 174,967 | |||||
Rialto Investments (2) | �� | 104,063 | 117,631 | |||||
Total | $ | 248,872 | 292,598 | |||||
November 30, 2009 | Investments in Unconsolidated VIEs | Lennar’s Maximum Exposure to Loss | ||||||
| (In thousands) | ||||||||
Lennar Homebuilding (1) | $ | 84,352 | 84,352 | |||||
Rialto Investments (2) | 9,874 | 9,874 | ||||||
Total | $ | 94,226 | 94,226 | |||||
While these entities are VIEs, the Company has determined that the power to direct the activities of the VIEs that most significantly impact the VIEs’ economic performance is generally shared. While the Company generally manages the day-to-day operations of the VIEs, the VIEs have an executive committee made up of representatives from each partner. The members of the executive committee have equal vote and major decisions require unanimous consent and approval from all members. The Company does not have the unilateral ability to exercise participating voting rights without partner consent. Furthermore, the Company’s economic interest is not significantly disproportionate to the point where it would indicate that the Company has the power to direct these activities.
The Company and other partners do not generally have an obligation to make capital contributions to the VIEs, except for the Company’s $11.2 million remaining commitment to the AB PPIP fund and $30.0 million of recourse debt of one of the Lennar Homebuilding unconsolidated VIEs. There are no liquidity arrangements or agreements to fund capital or purchase assets that could require the Company to provide financial support to the VIEs. While the Company has option contracts to purchase land from certain of its unconsolidated VIEs, the Company is not required to purchase the assets and could walk away from the contracts.
Option Contracts
The Company has access to land through option contracts, which generally enables it to control portions of properties owned by third parties (including land funds) and unconsolidated entities until the Company has determined whether to exercise the option.
LENNAR CORPORATION AND SUBSIDIARIES
NOTES TO CONSOLIDATED FINANCIAL STATEMENTS—(Continued)
A majority of the Company’s option contracts require a non-refundable cash deposit or irrevocable letter of credit based on a percentage of the purchase price of the land. The Company’s option contracts sometimes include price adjustment provisions, which adjust the purchase price of the land to its approximate fair value at the time of acquisition, or are based on the fair value of the land at the time of takedown.
The Company’s investments in option contracts are recorded at cost unless those investments are determined to be impaired, in which case the Company’s investments are written down to fair value. The Company reviews option contracts for indicators of impairment during each reporting period.The most significant indicator of impairment is a decline in the fair value of the optioned property such that the purchase and development of the optioned property would no longer meet the Company’s targeted return on investment with appropriate consideration given to the length of time available to exercise the option. Such declines could be caused by a variety of factors including increased competition, decreases in demand or changes in local regulations that adversely impact the cost of development. Changes in any of these factors would cause the Company to re-evaluate the likelihood of exercising its land options.
Some option contracts contain a predetermined take-down schedule for the optioned land parcels. However, in almost all instances, the Company is not required to purchase land in accordance with those take-down schedules. In substantially all instances, the Company has the right and ability to not exercise its option and forfeit its deposit without further penalty, other than termination of the option and loss of any unapplied portion of its deposit and pre-acquisition costs. Therefore, in substantially all instances, the Company does not consider the take-down price to be a firm contractual obligation.
When the Company does not intend to exercise an option, it writes off any unapplied deposit and pre-acquisition costs associated with the option contract. For the years ended November 30, 2010, 2009 and 2008, the Company wrote-off $3.1 million, $84.4 million and $97.2 million, respectively, of option deposits and pre-acquisition costs related to land under option that it does not intend to purchase.
The Company evaluates all option contracts for land to determine whether they are VIEs and, if so, whether the Company is the primary beneficiary of certain of these option contracts. Although the Company does not have legal title to the optioned land, if the Company is deemed to be the primary beneficiary, it is required to consolidate the land under option at the purchase price of the optioned land. During the year ended November 30, 2010, the effect of consolidation of these option contracts was a net increase of $19.8 million to consolidated inventory not owned with a corresponding increase to liabilities related to consolidated inventory not owned in the accompanying consolidated balance sheet as of November 30, 2010. To reflect the purchase price of the inventory consolidated, the Company reclassified the related option deposits from land under development to consolidated inventory not owned in the accompanying consolidated balance sheet as of November 30, 2010. The liabilities related to consolidated inventory not owned primarily represent the difference between the option exercise prices for the optioned land and the Company’s cash deposits. However, consolidated inventory not owned decreased due to (1) the Company exercising its options to acquire land under certain contracts previously consolidated and (2) the deconsolidation of certain option contracts totaling $75.5 million related to the adoption of certain new provisions under ASC 810, resulting in a net decrease in consolidated inventory not owned of $139.2 million for the year ended November 30, 2010.
The Company’s exposure to loss related to its option contracts with third parties and unconsolidated entities consisted of its non-refundable option deposits and pre-acquisition costs totaling $157.4 million and $127.4 million, respectively, at November 30, 2010 and 2009. Additionally, the Company had posted $48.9 million and $58.2 million, respectively, of letters of credit in lieu of cash deposits under certain option contracts as of November 30, 2010 and 2009.
LENNAR CORPORATION AND SUBSIDIARIES
NOTES TO CONSOLIDATED FINANCIAL STATEMENTS—(Continued)
16. Commitments and Contingent Liabilities
The Company is party to various claims, legal actions and complaints arising in the ordinary course of business. In the opinion of management, the disposition of these matters will not have a material adverse effect on the Company’s consolidated financial statements.
The Company is subject to the usual obligations associated with entering into contracts (including option contracts) for the purchase, development and sale of real estate, which it does in the routine conduct of its business. Option contracts generally enable the Company to control portions of properties owned by third parties (including land funds) and unconsolidated entities until the Company determines whether to exercise the option. The use of option contracts allows the Company to reduce the financial risks associated with long-term land holdings. At November 30, 2010, the Company had $157.4 million of non-refundable option deposits and pre-acquisition costs related to certain of these homesites, which were included in inventories in the consolidated balance sheet.
The Company has entered into agreements to lease certain office facilities and equipment under operating leases. Future minimum payments under the non-cancelable leases in effect at November 30, 2010 are as follows:
| Lease Payments | ||||
| (In thousands) | ||||
2011 | $ | 35,031 | ||
2012 | 24,133 | |||
2013 | 16,597 | |||
2014 | 13,392 | |||
2015 | 10,620 | |||
Thereafter | 15,481 | |||
Rental expense for the years ended November 30, 2010, 2009 and 2008 was $40.9 million, $67.9 million and $108.9 million, respectively.
Rental expense includes the following termination costs related to the abandonment of leases as a result of the Company’s efforts to consolidate its operations and reduce costs in the following financial statement line items:
| Years Ended November 30, | ||||||||||||
| 2010 | 2009 | 2008 | ||||||||||
| (In thousands) | ||||||||||||
Selling general and administrative expenses | $ | — | 6,170 | 18,830 | ||||||||
Corporate, general and administrative expenses | — | 1,786 | 2,401 | |||||||||
Lennar Financial Services costs and expenses | — | 850 | 6,498 | |||||||||
Total termination costs related to abandonment of leases | $ | — | 8,806 | 27,729 | ||||||||
The Company is committed, under various letters of credit, to perform certain development and construction activities and provide certain guarantees in the normal course of business. Outstanding letters of credit under these arrangements totaled $273.9 million at November 30, 2010. The Company also had outstanding performance and surety bonds related to site improvements at various projects (including certain projects in the Company’s joint ventures) of $684.7 million. Although significant development and construction activities have been completed related to these site improvements, these bonds are generally not released until all development and construction activities are completed. As of November 30, 2010, there were approximately $314.7 million, or 46%, of costs to complete related to these site improvements. The Company does not presently anticipate any draws upon these bonds that would have a material effect on its consolidated financial statements.
LENNAR CORPORATION AND SUBSIDIARIES
NOTES TO CONSOLIDATED FINANCIAL STATEMENTS—(Continued)
17. Supplemental Financial Information
The indentures governing the principal amounts of the Company’s 5.95% senior notes due 2011, 5.95% senior notes due 2013, 5.50% senior notes due 2014, 5.60% senior notes due 2015, 6.50% senior notes due 2016, 12.25% senior notes due 2017, 6.95% senior notes due 2018, 2.00% convertible senior notes due 2020 and 2.75% convertible senior notes due 2020 require that, if any of the Company’s subsidiaries directly or indirectly guarantee at least $75 million principal amount of debt of Lennar Corporation, those subsidiaries must also guarantee Lennar Corporation’s obligations with regard to its senior notes. Until February 2010, the Company had a Credit Facility that required substantially all of the Company’s subsidiaries guarantee Lennar Corporation’s obligations under the Credit Facility, and therefore, those subsidiaries also guaranteed the Company’s obligations with regard to its senior notes. The Company terminated the Credit Facility and therefore at November 30, 2010, there were no guarantors of Lennar Corporation’s obligations with regard to its senior notes. The entities referred to as “guarantors” in the following tables are subsidiaries that would have been guarantors if the Credit Facility were still in effect. Supplemental information for the guarantors is presented as follows:
Consolidating Balance Sheet
November 30, 2010
| Lennar Corporation | Guarantor Subsidiaries | Non-Guarantor Subsidiaries | Eliminations | Total | ||||||||||||||||
| (In thousands) | ||||||||||||||||||||
| ASSETS | ||||||||||||||||||||
Lennar Homebuilding: | ||||||||||||||||||||
Cash and cash equivalents, restricted cash, receivables, net and income tax receivables | $ | 1,079,107 | 177,674 | 40,863 | — | 1,297,644 | ||||||||||||||
Inventories | — | 3,547,152 | 622,456 | — | 4,169,608 | |||||||||||||||
Investments in unconsolidated entities | — | 587,385 | 38,800 | — | 626,185 | |||||||||||||||
Other assets | 48,776 | 99,486 | 159,548 | — | 307,810 | |||||||||||||||
Investments in subsidiaries | 3,333,769 | 811,317 | — | (4,145,086 | ) | — | ||||||||||||||
| 4,461,652 | 5,223,014 | 861,667 | (4,145,086 | ) | 6,401,247 | |||||||||||||||
Rialto Investments | 91,270 | 335,148 | 1,351,196 | — | 1,777,614 | |||||||||||||||
Lennar Financial Services | — | 149,413 | 459,577 | — | 608,990 | |||||||||||||||
Total assets | $ | 4,552,922 | 5,707,575 | 2,672,440 | (4,145,086 | ) | 8,787,851 | |||||||||||||
| LIABILITIES AND EQUITY | ||||||||||||||||||||
Lennar Homebuilding: | ||||||||||||||||||||
Accounts payable and other liabilities | $ | 298,985 | 479,617 | 83,546 | — | 862,148 | ||||||||||||||
Liabilities related to consolidated inventory not owned | — | 384,233 | — | — | 384,233 | |||||||||||||||
Senior notes and other debts payable | 2,671,898 | 201,248 | 255,008 | — | 3,128,154 | |||||||||||||||
Intercompany | (1,037,694 | ) | 1,128,731 | (91,037 | ) | — | — | |||||||||||||
| 1,933,189 | 2,193,829 | 247,517 | — | 4,374,535 | ||||||||||||||||
Rialto Investments | 10,784 | 128,136 | 631,794 | — | 770,714 | |||||||||||||||
Lennar Financial Services | — | 51,841 | 396,378 | — | 448,219 | |||||||||||||||
Total liabilities | 1,943,973 | 2,373,806 | 1,275,689 | — | 5,593,468 | |||||||||||||||
Stockholders’ equity | 2,608,949 | 3,333,769 | 811,317 | (4,145,086 | ) | 2,608,949 | ||||||||||||||
Noncontrolling interests | — | — | 585,434 | — | 585,434 | |||||||||||||||
Total equity | 2,608,949 | 3,333,769 | 1,396,751 | (4,145,086 | ) | 3,194,383 | ||||||||||||||
Total liabilities and equity | $ | 4,552,922 | 5,707,575 | 2,672,440 | (4,145,086 | ) | 8,787,851 | |||||||||||||
LENNAR CORPORATION AND SUBSIDIARIES
NOTES TO CONSOLIDATED FINANCIAL STATEMENTS—(Continued)
Consolidating Balance Sheet
November 30, 2009
| Lennar Corporation | Guarantor Subsidiaries | Non-Guarantor Subsidiaries | Eliminations | Total | ||||||||||||||||
| (In thousands) | ||||||||||||||||||||
| ASSETS | ||||||||||||||||||||
Lennar Homebuilding: | ||||||||||||||||||||
Cash and cash equivalents, restricted cash, receivables, net and income tax receivables | $ | 1,564,529 | 198,524 | 33,256 | — | 1,796,309 | ||||||||||||||
Inventories | — | 3,493,784 | 594,205 | — | 4,087,989 | |||||||||||||||
Investments in unconsolidated entities | — | 563,984 | 35,282 | — | 599,266 | |||||||||||||||
Other assets | 44,232 | 63,040 | 156,531 | — | 263,803 | |||||||||||||||
Investments in subsidiaries | 3,389,625 | 522,148 | — | (3,911,773 | ) | — | ||||||||||||||
| 4,998,386 | 4,841,480 | 819,274 | (3,911,773 | ) | 6,747,367 | |||||||||||||||
Rialto Investments | 9,874 | — | — | — | 9,874 | |||||||||||||||
Lennar Financial Services | — | 153,545 | 404,005 | — | 557,550 | |||||||||||||||
Total assets | $ | 5,008,260 | 4,995,025 | 1,223,279 | (3,911,773 | ) | 7,314,791 | |||||||||||||
| LIABILITIES AND EQUITY | ||||||||||||||||||||
Lennar Homebuilding: | ||||||||||||||||||||
Accounts payable and other liabilities | $ | 246,501 | 702,091 | 83,588 | — | 1,032,180 | ||||||||||||||
Liabilities related to consolidated inventory not owned | — | 518,359 | — | — | 518,359 | |||||||||||||||
Senior notes and other debts payable | 2,234,093 | 223,545 | 303,714 | — | 2,761,352 | |||||||||||||||
Intercompany | 84,187 | 102,454 | (186,641 | ) | — | — | ||||||||||||||
| 2,564,781 | 1,546,449 | 200,661 | — | 4,311,891 | ||||||||||||||||
Rialto Investments | — | — | — | — | — | |||||||||||||||
Lennar Financial Services | — | 58,951 | 355,935 | — | 414,886 | |||||||||||||||
Total liabilities | 2,564,781 | 1,605,400 | 556,596 | — | 4,726,777 | |||||||||||||||
Stockholders’ equity | 2,443,479 | 3,389,625 | 522,148 | (3,911,773 | ) | 2,443,479 | ||||||||||||||
Noncontrolling interests | — | — | 144,535 | — | 144,535 | |||||||||||||||
Total equity | 2,443,479 | 3,389,625 | 666,683 | (3,911,773 | ) | 2,588,014 | ||||||||||||||
Total liabilities and equity | $ | 5,008,260 | 4,995,025 | 1,223,279 | (3,911,773 | ) | 7,314,791 | |||||||||||||
LENNAR CORPORATION AND SUBSIDIARIES
NOTES TO CONSOLIDATED FINANCIAL STATEMENTS—(Continued)
Consolidating Statement of Operations
Year Ended November 30, 2010
| Lennar Corporation | Guarantor Subsidiaries | Non-Guarantor Subsidiaries | Eliminations | Total | ||||||||||||||||
| (In thousands) | ||||||||||||||||||||
Revenues: | ||||||||||||||||||||
Lennar Homebuilding | $ | — | 2,657,189 | 48,450 | — | 2,705,639 | ||||||||||||||
Lennar Financial Services | — | 154,607 | 180,283 | (59,104 | ) | 275,786 | ||||||||||||||
Rialto Investments | 1,901 | 4,942 | 85,754 | — | 92,597 | |||||||||||||||
Total revenues | 1,901 | 2,816,738 | 314,487 | (59,104 | ) | 3,074,022 | ||||||||||||||
Costs and expenses: | ||||||||||||||||||||
Lennar Homebuilding | — | 2,467,117 | 75,247 | 959 | 2,543,323 | |||||||||||||||
Lennar Financial Services | — | 151,812 | 148,325 | (55,635 | ) | 244,502 | ||||||||||||||
Rialto Investments | 24,717 | 1,839 | 41,348 | — | 67,904 | |||||||||||||||
Corporate general and administrative | 88,795 | — | — | 5,131 | 93,926 | |||||||||||||||
Total costs and expenses | 113,512 | 2,620,768 | 264,920 | (49,545 | ) | 2,949,655 | ||||||||||||||
Lennar Homebuilding equity in loss from unconsolidated entities | — | (10,724 | ) | (242 | ) | — | (10,966 | ) | ||||||||||||
Lennar Homebuilding other income, net | 38,194 | 19,096 | — | (38,155 | ) | 19,135 | ||||||||||||||
Other interest expense | (47,714 | ) | (70,425 | ) | — | 47,714 | (70,425 | ) | ||||||||||||
Rialto Investments equity in earnings from unconsolidated entities | 15,363 | — | — | — | 15,363 | |||||||||||||||
Rialto Investments other income (expense), net | — | (22 | ) | 17,273 | — | 17,251 | ||||||||||||||
Earnings (loss) before income taxes | (105,768 | ) | 133,895 | 66,598 | — | 94,725 | ||||||||||||||
Benefit (provision) for income taxes | 67,368 | (34,838 | ) | (6,796 | ) | — | 25,734 | |||||||||||||
Equity in earnings from subsidiaries | 133,661 | 34,604 | — | (168,265 | ) | — | ||||||||||||||
Net earnings (including net earnings attributable to noncontrolling interests) | 95,261 | 133,661 | 59,802 | (168,265 | ) | 120,459 | ||||||||||||||
Less: Net earnings attributable to noncontrolling interests | — | — | 25,198 | — | 25,198 | |||||||||||||||
Net earnings attributable to Lennar | $ | 95,261 | 133,661 | 34,604 | (168,265 | ) | 95,261 | |||||||||||||
LENNAR CORPORATION AND SUBSIDIARIES
NOTES TO CONSOLIDATED FINANCIAL STATEMENTS—(Continued)
Consolidating Statement of Operations
Year Ended November 30, 2009
| Lennar Corporation | Guarantor Subsidiaries | Non-Guarantor Subsidiaries | Eliminations | Total | ||||||||||||||||
| (In thousands) | ||||||||||||||||||||
Revenues: | ||||||||||||||||||||
Lennar Homebuilding | $ | — | 2,792,314 | 41,971 | — | 2,834,285 | ||||||||||||||
Lennar Financial Services | — | 162,768 | 179,941 | (57,607 | ) | 285,102 | ||||||||||||||
Rialto Investments | — | — | — | — | — | |||||||||||||||
Total revenues | — | 2,955,082 | 221,912 | (57,607 | ) | 3,119,387 | ||||||||||||||
Costs and expenses: | ||||||||||||||||||||
Lennar Homebuilding | — | 3,132,257 | 96,921 | (18,792 | ) | 3,210,386 | ||||||||||||||
Lennar Financial Services | — | 150,704 | 129,729 | (31,313 | ) | 249,120 | ||||||||||||||
Rialto Investments | 2,528 | — | — | — | 2,528 | |||||||||||||||
Corporate general and administrative | 111,032 | — | — | 6,533 | 117,565 | |||||||||||||||
Total costs and expenses | 113,560 | 3,282,961 | 226,650 | (43,572 | ) | 3,579,599 | ||||||||||||||
Lennar Homebuilding equity in loss from unconsolidated entities | — | (130,674 | ) | (243 | ) | — | (130,917 | ) | ||||||||||||
Lennar Homebuilding other income (expense), net | 33,732 | (98,478 | ) | — | (33,679 | ) | (98,425 | ) | ||||||||||||
Other interest expense | (47,714 | ) | (70,850 | ) | — | 47,714 | (70,850 | ) | ||||||||||||
Loss before income taxes | (127,542 | ) | (627,881 | ) | (4,981 | ) | — | (760,404 | ) | |||||||||||
Benefit (provision) for income taxes | 52,138 | 269,800 | (7,593 | ) | — | 314,345 | ||||||||||||||
Equity in earnings (loss) from subsidiaries | (341,743 | ) | 16,338 | — | 325,405 | — | ||||||||||||||
Net loss (including net loss attributable to noncontrolling interests) | (417,147 | ) | (341,743 | ) | (12,574 | ) | 325,405 | (446,059 | ) | |||||||||||
Less: Net loss attributable to noncontrolling interests | — | — | (28,912 | ) | — | (28,912 | ) | |||||||||||||
Net earnings (loss) attributable to Lennar | $ | (417,147 | ) | (341,743 | ) | 16,338 | 325,405 | (417,147 | ) | |||||||||||
LENNAR CORPORATION AND SUBSIDIARIES
NOTES TO CONSOLIDATED FINANCIAL STATEMENTS—(Continued)
Consolidating Statement of Operations
Year Ended November 30, 2008
| Lennar Corporation | Guarantor Subsidiaries | Non-Guarantor Subsidiaries | Eliminations | Total | ||||||||||||||||
| (In thousands) | ||||||||||||||||||||
Revenues: | ||||||||||||||||||||
Lennar Homebuilding | $ | — | 4,262,154 | 288 | 596 | 4,263,038 | ||||||||||||||
Lennar Financial Services | — | 6,426 | 379,624 | (73,671 | ) | 312,379 | ||||||||||||||
Rialto Investments | — | — | — | — | — | |||||||||||||||
Total revenues | — | 4,268,580 | 379,912 | (73,075 | ) | 4,575,417 | ||||||||||||||
Costs and expenses: | ||||||||||||||||||||
Lennar Homebuilding | — | 4,549,804 | 2,458 | (10,381 | ) | 4,541,881 | ||||||||||||||
Lennar Financial Services | — | 3,359 | 391,854 | (51,844 | ) | 343,369 | ||||||||||||||
Rialto Investments | — | — | — | — | — | |||||||||||||||
Corporate general and administrative | 129,752 | — | — | — | 129,752 | |||||||||||||||
Total costs and expenses | 129,752 | 4,553,163 | 394,312 | (62,225 | ) | 5,015,002 | ||||||||||||||
Lennar Homebuilding equity in loss from unconsolidated entities | — | (59,156 | ) | — | — | (59,156 | ) | |||||||||||||
Lennar Homebuilding other income (expense), net | 35,341 | (172,387 | ) | — | (35,341 | ) | (172,387 | ) | ||||||||||||
Other interest expense | (46,191 | ) | (27,594 | ) | — | 46,191 | (27,594 | ) | ||||||||||||
Gain on recapitalization of unconsolidated entity | — | 133,097 | — | — | 133,097 | |||||||||||||||
Loss before income taxes | (140,602 | ) | (410,623 | ) | (14,400 | ) | — | (565,625 | ) | |||||||||||
(Provision) benefit for income taxes | (150,494 | ) | (400,398 | ) | 3,335 | — | (547,557 | ) | ||||||||||||
Equity in loss from subsidiaries | (817,989 | ) | (6,968 | ) | — | 824,957 | — | |||||||||||||
Net loss (including net loss attributable to noncontrolling interests) | (1,109,085 | ) | (817,989 | ) | (11,065 | ) | 824,957 | (1,113,182 | ) | |||||||||||
Less: Net loss attributable to noncontrolling interests | — | — | (4,097 | ) | — | (4,097 | ) | |||||||||||||
Net loss attributable to Lennar | $ | (1,109,085 | ) | (817,989 | ) | (6,968 | ) | 824,957 | (1,109,085 | ) | ||||||||||
LENNAR CORPORATION AND SUBSIDIARIES
NOTES TO CONSOLIDATED FINANCIAL STATEMENTS—(Continued)
Consolidating Statement of Cash Flows
Year Ended November 30, 2010
| Lennar Corporation | Guarantor Subsidiaries | Non-Guarantor Subsidiaries | Eliminations | Total | ||||||||||||||||
| (Dollars in thousands) | ||||||||||||||||||||
Cash flows from operating activities: | ||||||||||||||||||||
Net earnings (including net earnings attributable to noncontrolling interests) | $ | 95,261 | 133,661 | 59,802 | (168,265 | ) | 120,459 | |||||||||||||
Adjustments to reconcile net earnings (including net earnings attributable to noncontrolling interests) to net cash provided by (used in) operating activities | 424,475 | (338,204 | ) | (100,767 | ) | 168,265 | 153,769 | |||||||||||||
Net cash provided by (used in) operating activities | 519,736 | (204,543 | ) | (40,965 | ) | — | 274,228 | |||||||||||||
Cash flows from investing activities: | ||||||||||||||||||||
Investments in and contributions to Lennar Homebuilding unconsolidated entities, net | — | (176,493 | ) | (3,380 | ) | — | (179,873 | ) | ||||||||||||
Investments in and contributions to Rialto Investments consolidated and unconsolidated entities, net | (329,369 | ) | — | 93,660 | — | (235,709 | ) | |||||||||||||
Acquisitions of Rialto Investments portfolios of distressed real estate assets | — | (184,699 | ) | — | — | (184,699 | ) | |||||||||||||
Increase in Rialto Investments defeasance cash to retire notes payable | — | — | (101,309 | ) | — | (101,309 | ) | |||||||||||||
Other | (1,003 | ) | (16,861 | ) | 46,083 | — | 28,219 | |||||||||||||
Net cash provided by (used in) investing activities | (330,372 | ) | (378,053 | ) | 35,054 | — | (673,371 | ) | ||||||||||||
Cash flows from financing activities: | ||||||||||||||||||||
Net repayments (borrowings) of Lennar Financial Services debt | — | (26 | ) | 54,147 | — | 54,121 | ||||||||||||||
Net proceeds from convertible and senior notes | 951,408 | — | — | — | 951,408 | |||||||||||||||
Redemption and partial redemption of senior notes | (474,654 | ) | — | — | — | (474,654 | ) | |||||||||||||
Net repayments on other borrowings | — | (80,076 | ) | (55,753 | ) | — | (135,829 | ) | ||||||||||||
Exercise of land option contracts from an unconsolidated land investment venture | — | (39,301 | ) | — | — | (39,301 | ) | |||||||||||||
Net receipts related to noncontrolling interests | — | — | 9,240 | — | 9,240 | |||||||||||||||
Common stock: | ||||||||||||||||||||
Issuances | 2,238 | — | — | — | 2,238 | |||||||||||||||
Repurchases | (1,806 | ) | — | — | — | (1,806 | ) | |||||||||||||
Dividends | (29,577 | ) | — | — | — | (29,577 | ) | |||||||||||||
Intercompany | (788,601 | ) | 726,901 | 61,700 | — | — | ||||||||||||||
Net cash provided by (used in) financing activities | (340,992 | ) | 607,498 | 69,334 | — | 335,840 | ||||||||||||||
Net increase (decrease) in cash and cash equivalents | (151,628 | ) | 24,902 | 63,423 | — | (63,303 | ) | |||||||||||||
Cash and cash equivalents at beginning of year | 1,223,169 | 154,313 | 79,956 | — | 1,457,438 | |||||||||||||||
Cash and cash equivalents at end of year | $ | 1,071,541 | 179,215 | 143,379 | — | 1,394,135 | ||||||||||||||
LENNAR CORPORATION AND SUBSIDIARIES
NOTES TO CONSOLIDATED FINANCIAL STATEMENTS—(Continued)
Consolidating Statement of Cash Flows
Year Ended November 30, 2009
| Lennar Corporation | Guarantor Subsidiaries | Non-Guarantor Subsidiaries | Eliminations | Total | ||||||||||||||||
| (Dollars in thousands) | ||||||||||||||||||||
Cash flows from operating activities: | ||||||||||||||||||||
Net loss (including net loss attributable to noncontrolling interests) | $ | (417,147 | ) | (341,743 | ) | (12,574 | ) | 325,405 | (446,059 | ) | ||||||||||
Adjustments to reconcile net loss (including net loss attributable to noncontrolling interests) to net cash provided by (used in) operating activities | (203,812 | ) | 1,449,961 | (53,842 | ) | (325,405 | ) | 866,902 | ||||||||||||
Net cash provided by (used in) operating activities | (620,959 | ) | 1,108,218 | (66,416 | ) | — | 420,843 | |||||||||||||
Cash flows from investing activities: | ||||||||||||||||||||
Investments in and contributions to Lennar Homebuilding unconsolidated entities, net | — | (234,169 | ) | (57,832 | ) | — | (292,001 | ) | ||||||||||||
Investments in and contributions to Rialto Investments unconsolidated entities | (9,874 | ) | — | — | — | (9,874 | ) | |||||||||||||
Other | 726 | 20,048 | 5,981 | — | 26,755 | |||||||||||||||
Net cash used in investing activities | (9,148 | ) | (214,121 | ) | (51,851 | ) | — | (275,120 | ) | |||||||||||
Cash flows from financing activities: | ||||||||||||||||||||
Net repayments of Lennar Financial Services debt | — | (84 | ) | (8,142 | ) | — | (8,226 | ) | ||||||||||||
Net proceeds from senior notes | 386,892 | — | — | — | 386,892 | |||||||||||||||
Redemption and partial redemption of senior notes | (335,393 | ) | — | — | — | (335,393 | ) | |||||||||||||
Net repayments on other borrowings | — | (16,715 | ) | (74,768 | ) | — | (91,483 | ) | ||||||||||||
Exercise of land option contracts from an unconsolidated land investment venture | — | (33,656 | ) | — | — | (33,656 | ) | |||||||||||||
Net payments related to noncontrolling interests | — | — | (2,124 | ) | — | (2,124 | ) | |||||||||||||
Common stock: | ||||||||||||||||||||
Issuances | 221,437 | — | — | — | 221,437 | |||||||||||||||
Repurchases | (1,566 | ) | — | — | — | (1,566 | ) | |||||||||||||
Dividends | (27,588 | ) | — | — | — | (27,588 | ) | |||||||||||||
Intercompany | 601,900 | (814,766 | ) | 212,866 | — | — | ||||||||||||||
Net cash provided by (used in) financing activities | 845,682 | (865,221 | ) | 127,832 | — | 108,293 | ||||||||||||||
Net increase in cash and cash equivalents | 215,575 | 28,876 | 9,565 | — | 254,016 | |||||||||||||||
Cash and cash equivalents at beginning of year | 1,007,594 | 125,437 | 70,391 | — | 1,203,422 | |||||||||||||||
Cash and cash equivalents at end of year | $ | 1,223,169 | 154,313 | 79,956 | — | 1,457,438 | ||||||||||||||
LENNAR CORPORATION AND SUBSIDIARIES
NOTES TO CONSOLIDATED FINANCIAL STATEMENTS—(Continued)
Consolidating Statement of Cash Flows
Year Ended November 30, 2008
| Lennar Corporation | Guarantor Subsidiaries | Non-Guarantor Subsidiaries | Eliminations | Total | ||||||||||||||||
| (Dollars in thousands) | ||||||||||||||||||||
Cash flows from operating activities: | ||||||||||||||||||||
Net loss (including net loss attributable to noncontrolling interests) | $ | (1,109,085 | ) | (817,989 | ) | (11,065 | ) | 824,957 | (1,113,182 | ) | ||||||||||
Adjustments to reconcile net loss (including net loss attributable to noncontrolling interests) to net cash provided by operating activities | 1,291,030 | 1,459,469 | 288,474 | (824,957 | ) | 2,214,016 | ||||||||||||||
Net cash provided by operating activities | 181,945 | 641,480 | 277,409 | — | 1,100,834 | |||||||||||||||
Cash flows from investing activities: | ||||||||||||||||||||
Investments in and contributions to Lennar Homebuilding unconsolidated entities, net | — | (315,907 | ) | — | — | (315,907 | ) | |||||||||||||
Other | (423 | ) | 1,857 | 48,770 | — | 50,204 | ||||||||||||||
Net cash provided by (used in) investing activities | (423 | ) | (314,050 | ) | 48,770 | — | (265,703 | ) | ||||||||||||
Cash flows from financing activities: | ||||||||||||||||||||
Net repayments of Lennar Financial Services debt | — | — | (315,654 | ) | — | (315,654 | ) | |||||||||||||
Partial redemption of senior notes | (322 | ) | — | — | — | (322 | ) | |||||||||||||
Net repayments on other borrowings | — | (61,981 | ) | (66,526 | ) | — | (128,507 | ) | ||||||||||||
Exercise of land option contracts from an unconsolidated land investment venture | — | (48,434 | ) | — | — | (48,434 | ) | |||||||||||||
Net receipts related to noncontrolling interests | — | — | 151,035 | — | 151,035 | |||||||||||||||
Common stock: | ||||||||||||||||||||
Issuances | 224 | — | — | — | 224 | |||||||||||||||
Repurchases | (1,758 | ) | — | — | — | (1,758 | ) | |||||||||||||
Dividends | (83,487 | ) | — | — | — | (83,487 | ) | |||||||||||||
Intercompany | 414,031 | (292,787 | ) | (121,244 | ) | — | — | |||||||||||||
Net cash provided by (used in) financing activities | 328,688 | (403,202 | ) | (352,389 | ) | — | (426,903 | ) | ||||||||||||
Net increase (decrease) in cash and cash equivalents | 510,210 | (75,772 | ) | (26,210 | ) | — | 408,228 | |||||||||||||
Cash and cash equivalents at beginning of year | 497,384 | 139,733 | 158,077 | — | 795,194 | |||||||||||||||
Cash and cash equivalents at end of year | $ | 1,007,594 | 63,961 | 131,867 | — | 1,203,422 | ||||||||||||||
LENNAR CORPORATION AND SUBSIDIARIES
NOTES TO CONSOLIDATED FINANCIAL STATEMENTS—(Continued)
18. Quarterly Data (unaudited)
| First | Second | Third | Fourth | |||||||||||||
| (In thousands, except per share amounts) | ||||||||||||||||
2010 | ||||||||||||||||
Revenues | $ | 574,442 | 814,481 | 824,975 | 860,124 | |||||||||||
Gross profit from sales of homes | $ | 98,376 | 143,411 | 147,419 | 128,715 | |||||||||||
Earnings (loss) before income taxes | $ | (19,045 | ) | 35,554 | 39,435 | 38,781 | ||||||||||
Net earnings (loss) attributable to Lennar | $ | (6,523 | ) | 39,719 | 30,035 | 32,030 | ||||||||||
Earnings (loss) per share: | ||||||||||||||||
Basic | $ | (0.04 | ) | 0.21 | 0.16 | 0.17 | ||||||||||
Diluted | $ | (0.04 | ) | 0.21 | 0.16 | 0.17 | ||||||||||
2009 | ||||||||||||||||
Revenues | $ | 593,063 | 891,853 | 720,730 | 913,741 | |||||||||||
Gross profit from sales of homes | $ | 34,182 | 76,092 | 49,496 | 92,230 | |||||||||||
Loss before income taxes | $ | (155,815 | ) | (130,158 | ) | (171,644 | ) | (302,787 | ) | |||||||
Net earnings (loss) attributable to Lennar (1) | $ | (155,929 | ) | (125,185 | ) | (171,605 | ) | 35,572 | ||||||||
Earnings (loss) per share: | ||||||||||||||||
Basic | $ | (0.98 | ) | (0.76 | ) | (0.97 | ) | 0.19 | ||||||||
Diluted | $ | (0.98 | ) | (0.76 | ) | (0.97 | ) | 0.19 | ||||||||
Quarterly and year-to-date computations of per share amounts are made independently. Therefore, the sum of per share amounts for the quarters may not agree with per share amounts for the year.
Item 9. Changes in and Disagreements With Accountants on Accounting and Financial Disclosure.
Not applicable.
Item 9A. Controls and Procedures.
Evaluation of Disclosure Controls and Procedures
Our Chief Executive Officer and Chief Financial Officer participated in an evaluation by our management of the effectiveness of our disclosure controls and procedures as of the end of our fiscal quarter that ended on November 30, 2010. Based on their participation in that evaluation, our CEO and CFO concluded that our disclosure controls and procedures were effective as of November 30, 2010 to ensure that information required to be disclosed in our reports filed or submitted under the Securities Exchange Act of 1934 is recorded, processed, summarized and reported within the time periods specified in the Securities and Exchange Commission’s rules and forms, and to ensure that information required to be disclosed in our reports filed or furnished under the Securities Exchange Act of 1934, as amended, is accumulated and communicated to our management, including our CEO and CFO, as appropriate to allow timely decisions regarding required disclosures.
Our CEO and CFO also participated in an evaluation by our management of any changes in our internal control over financial reporting that occurred during the quarter ended November 30, 2010. That evaluation did not identify any changes that have materially affected, or are reasonably likely to materially affect, our internal control over financial reporting except for new internal controls over financial reporting that were designed and implemented related to the Company’s Rialto Investments segment during the quarter ended November 30, 2010
Management’s Annual Report on Internal Control Over Financial Reporting and the Report of Independent Registered Public Accounting Firm obtained from Deloitte & Touche LLP relating to the effectiveness of Lennar Corporation’s internal control over financial reporting are included elsewhere in this document.
Item 9B. Other Information.
Not applicable.
PART III
Item 10. Directors, Executive Officers and Corporate Governance.
The information required by this item for executive officers is set forth under the heading “Executive Officers of Lennar Corporation” in Part I. The other information called for by this item is incorporated by reference to our definitive proxy statement, which will be filed with the Securities and Exchange Commission on January 29, 2012 (the “Original Filing Date”), is being filed solely to include Exhibit 21, the list of the Company's subsidiaries, which was referenced but not later than March 30, 2011 (120 days afterincluded in the endForm 10-K.
Item 11. Executive Compensation.
The information required by this item is incorporated by referencethe Original Filing Date, does not reflect events that may have occurred subsequent to our definitive proxy statement, which will be filed with the SecuritiesOriginal Filing Date and, Exchange Commission not later than March 30, 2011 (120 days after the end of our fiscal year).
Item 12. Security Ownership of Certain Beneficial Owners and Management and Related Stockholder Matters.
The information required by this item is incorporated by reference to our definitive proxy statement, which will be filed with the Securities and Exchange Commission not later than March 30, 2011 (120 days after the end of our fiscal year), except for the information required by Item 201(d)addition of Regulation S-K, which is provided below.
The following table summarizes our equity compensation plans as of November 30, 2010:
Plan category | Number of shares to be issued upon exercise of outstanding options, warrants and rights (a)(1) | Weighted- average exercise price of outstanding options, warrants and rights (b) | Number of shares remaining available for future issuance under equity compensation plans (excluding shares reflected in column (a)) (c)(2) | |||||||||
Equity compensation plans approved by stockholders | 5,266,210 | $ | 25.72 | 1,733,876 | ||||||||
Equity compensation plans not approved by stockholders | — | — | — | |||||||||
Total | 5,266,210 | $ | 25.72 | 1,733,876 | ||||||||
Item 13. Certain Relationships and Related Transactions, and Director Independence.
The information required by this item is incorporated by reference to our definitive proxy statement, which will be filed withExhibit 21, does not modify or update in any way disclosures made in the Securities and Exchange Commission not later than March 30, 2011 (120 days after the end of our fiscal year).
Item 14. Principal Accounting Fees and Services.
The information required by this item is incorporated by reference to our definitive proxy statement, which will be filed with the Securities and Exchange Commission not later than March 30, 2011 (120 days after the end of our fiscal year).
PART IV
Item 15. Exhibits and Financial Statement Schedules.
| ||||
Information required by other schedules has either been incorporated in the consolidated financial statements and accompanying notes or is not applicable to us.
| 21 | List of | |
| subsidiaries. | ||
| | ||
| 31.1 | Rule 13a-14a/15d-14(a) Certification of Stuart A. Miller. | |
| 31.2 | Rule 13a-14a/15d-14(a) Certification of Bruce E. Gross. | |
| ||
| LENNAR CORPORATION | ||
/ | ||
| Stuart A. Miller | ||
| Chief Executive Officer and Director | ||
Pursuant to the requirements of the Securities Exchange Act of 1934, this Report has been signed below by the following persons on behalf of the registrant and in the capacities and on the dates indicated:
| ||||
|
| |||
| Date: |
| ||
| ||||
|
| |||
|
| |||
| ||||
|
| |||
|
| |||
| ||||
|
| |||
| ||||
|
| |||
| ||||
|
| |||
| ||||
|
| |||
| ||||
|
| |||
| ||||
|
| |||
| ||||
|
| |||
| ||||
|
| |||
| ||||