UNITED STATES
SECURITIES AND EXCHANGE COMMISSION
Washington, DC 20549
FORM 10-K
FOR ANNUAL AND TRANSITION REPORTS
PURSUANT TO SECTIONS 13 OR 15(d) OF THE
SECURITIES EXCHANGE ACT OF 1934
(Mark One)
| x | ANNUAL REPORT PURSUANT TO SECTION 13 OR 15(d) OF THE SECURITIES EXCHANGE ACT OF 1934 |
For the fiscal year ended December 31, 20102012
OR
| ¨ | TRANSITION REPORT PURSUANT TO SECTION 13 OR 15(d) OF THE SECURITIES EXCHANGE ACT OF 1934 |
For the transition period from to
Commission File Number 0-24429
COGNIZANT TECHNOLOGY SOLUTIONS CORPORATION
(Exact Name of Registrant as Specified in Its Charter)
| Delaware | 13-3728359 | |
(State or Other Jurisdiction of Incorporation or Organization) | (I.R.S. Employer Identification No.) | |
Glenpointe Centre West, 500 Frank W. Burr Blvd., Teaneck, New Jersey | 07666 | |
| (Address of Principal Offices) | (Zip Code) | |
Registrant’s telephone number, including area code: (201) 801-0233
Securities registered pursuant to Section 12(b) of the Act:
Title of each class | Name of each exchange on which registered | |
| Class A Common Stock, $0.01 par value per share | The NASDAQ Stock Market LLC |
Securities registered pursuant to Section 12(g) of the Act:
Preferred Share Purchase Rights
(Title of Class)
Indicate by check mark if the registrant is a well-known seasoned issuer, as defined in Rule 405 of the Securities Act. x Yes ¨ No
Indicate by check mark if the registrant is not required to file reports pursuant to Section 13 or Section 15(d) of the Act. ¨ Yes x No
Indicate by check mark whether the registrant (1) has filed all reports required to be filed by Section 13 or 15(d) of the Securities Exchange Act of 1934 during the preceding 12 months (or for such shorter period that the registrant was required to file such reports), and (2) has been subject to such filing requirements for the past 90 days. x Yes ¨ No
Indicate by check mark whether the registrant has submitted electronically and posted on its corporate Website, if any, every Interactive Data File required to be submitted and posted pursuant to Rule 405 of Regulation S-T (§232.405 of this chapter) during the preceding 12 months (or for such shorter period that the registrant was required to submit and post such files). x Yes ¨ No
Indicate by check mark if disclosure of delinquent filers pursuant to Item 405 of Regulation S-K (§229.405 of this chapter) is not contained herein, and will not be contained, to the best of registrant’s knowledge, in definitive proxy or information statements incorporated by reference in Part III of this Form 10-K or any amendment to this Form 10-K. ¨x
Indicate by check mark whether the registrant is a large accelerated filer, an accelerated filer, a non-accelerated filer, or a smaller reporting company. See definitions of “large accelerated filer,” “accelerated filer” and “smaller reporting company” in Rule 12b-2 of the Exchange Act. (Check one):
Large accelerated filer | x | Accelerated filer | ¨ | |||
| Non-accelerated filer | ||||||
| Smaller reporting company | ¨ | ||||
Indicate by check mark whether the registrant is a shell company (as defined in Rule 12b-2 of the Act). ¨ Yes x No
The aggregate market value of the registrant’s voting shares of common stock held by non-affiliates of the registrant on June 30, 2010,29, 2012, based on $50.06$60.00 per share, the last reported sale price on the NASDAQ Global Select Market of the NASDAQ Stock Market LLC on that date, was $14,996,419,635.$17,868,732,060
The number of shares of Class A common stock, $0.01 par value, of the registrant outstanding as of February 17, 201119, 2013 was 304,214,788301,781,902 shares.
DOCUMENTS INCORPORATED BY REFERENCE
The following documents are incorporated by reference into the Annual Report on Form 10-K: Portions of the registrant’s definitive Proxy Statement for its 20112013 Annual Meeting of Stockholders are incorporated by reference into Part III of this Report.
i
| Item 1. | Business |
Overview
We are a leading provider of custom information technology (IT), consulting and business process outsourcing services.services, dedicated to helping the world’s leading companies build stronger businesses. Our customers are primarily Global 2000 companies.clients engage us to help them build more efficient operations, provide solutions to critical business and technology problems, and to help them drive technology-based innovation and growth. Our core competencies include Technologyinclude: Business, Process, Operations and IT Consulting, Complex SystemsApplication Development and Systems Integration, Enterprise Software Package Implementation and Maintenance, Data Warehousing, Business Intelligence and Analytics,Information Management, or EIM, Application Testing, Application Maintenance, IT Infrastructure Management,Services, or IT IS, and Business and Knowledge Process Outsourcing, or BPO and KPO. We tailor our services to specific industries and utilize an integrated global sourcingdelivery model. This seamless global sourcing model combines technical and account managementclient service teams locatedbased on-site at the customer location andclient locations with delivery teams located at dedicated near-shore and offshore development andglobal delivery centers that are located primarily in India, China, the United States, Canada, Argentina, Brazil, Hungary, France and the Philippines.
Industry Background
ManyIn today’s complex business environment, many companies today face intense competitive pressure and rapidly changing market dynamics, driven by such factors as changes in the economy, government regulations, globalization, virtualization and other technology innovations. At the same time, companies must evaluate the effect of emerging technologies such as social networks, mobile devices, advanced analytics and cloud computing, or SMAC, on their business operations. These technologies represent a new IT stack that will profoundly change the way companies relate to their customers, engage with employees, and bring innovative products and services to market. In response to these challenges, many companies are focused on improving efficiencies, enhancing effectiveness and driving innovation through technology to favorably impact both the bottom-line and the top-line. Companies need to build agility into both the cost and revenue sides of their models. In orderthis context, they increasingly view the global sourcing model as a key to achieve these goals,their efforts to operate more cost-effectively and productively. Separately, to confront secular industry shifts, changing demographics and new technologies, companies are focusing on a number of services, such as:
Businesslooking to innovate and Information Technology, or IT, alignment;
IT applicationbuild new and infrastructure optimization;
Business and Knowledge Process effectiveness and efficiency;
Advanced custom systems development;
Data Warehousing, Business Intelligence, or BI and Analytics;
Enterprise Resource Planning, or ERP;
Customer Relationship Management, or CRM;
Supply Chain Management;
Enterprise 2.0different capabilities with emerging technologies to ensure their business models stay relevant.
Companies increasingly seek to meet the dual mandate of more efficient and technology solutions;
Service-Oriented Architectures, Web 2.0effective operations, including cost reduction, along with technology-based innovation and Cloud Computing; and
Engineering and Manufacturing solutions.
These solutions facilitate faster, more responsive and lower-cost business operations. However, their development, integration and on-going maintenance presenttransformation in a comprehensive, integrated manner. Achieving these objectives presents major challenges and require a large number of highly-skilledrequires companies to have highly skilled professionals trained in many diverse and new technologies and specialized industries. In addition, companies also require additional technical resources to maintain, enhance and re-engineer their core legacy IT systems and to address application maintenance projects. Increasingly, companies are relying on custom IT solutionsservice providers, such aslike us, to provide these services.
Additionally, in order to respond effectively to a changing and challenging business environment, IT departments of many companies have focused increasingly on improving returns on IT investments, lowering costs and accelerating the delivery of new systems and solutions. To accomplish these objectives, many IT departments have shifted all or a portion of their IT development, integration and maintenance requirements to outside service providers operating with global sourcing models.delivery models, to help them meet these ever-changing objectives.
Global demand for high quality, lower cost ITtechnology services from outside providers has created a significant opportunity for IT service providers that can successfully leverage the benefits of and address the challenges in using a global talent pool. The effective use of personnel from across the globe can offer a variety of benefits, including lower costs, faster delivery of new IT solutions and innovations in verticalindustry-specific solutions, processes and technologies. Certain countries, particularly India, the Philippines, Singapore and China, have large talent pools of highly qualified technical professionals who can provide high quality IT and business and knowledge process outsourcing services at a lower cost. India is a leader in IT services and is regarded as having one of the largest and highest quality pools of talent in the world. Historically, IT service providers have used offshore labor pools primarily to supplement the internal staffing needs of customers. However, evolving customer demands have led to the increasing acceptance and use of offshore resources for higher value-added services. These services include application design, development, testing integration and maintenance, as well assystems integration, technology consulting and infrastructure management. India’s services and software exports continue to see significant growth. NASSCOM (India’s National Association of Software and Service Companies) reports indicate that India’s IT software and services and business process outsourcing sectors are expected to exceed $76 billion at the end of NASSCOM’s fiscal year 2011. This is a growth rate of approximately 19% over the prior fiscal year. According to the latest NASSCOM “Perspective 2020: Transform Business, Transform India” report, global changes and new megatrends within economic, demographic, business, social and environmental areas are set to expand the outsourcing industry by creating new dynamics and opportunities; and are expected to result in export revenues of approximately $175 billion by 2020.
Using a globally distributed workforce to provide value-added services presents a number of challenges to IT services and BPO/KPO providers. The offshore implementation of value-added IT services requires that IT service providers continually and effectively attract, train and retain highly-skilled software development professionals with advanced technical and industry skills necessary to keep pace with continuing changes in information technology, evolving industry standards and changing customer preferences. These skills are necessary to design, develop and deploy high-quality technology solutions in a cost-effective and timely manner. In addition, IT service providers must have the methodologies, processes and communications capabilities to enable offshore workforces to be successfully integrated with on-site personnel. Service providers must also have strong research and development capabilities, technology competency centers and relationship management skills in order to compete effectively.
The Cognizant Approach
Our solutions are built on a global network of delivery centers, deep domain expertise and a robust portfolio of services.
Global Delivery Model. Our geographic reach extends across the globe, with more than 50 delivery centers in 14 countries. We have a four-tiered global architecture for service delivery and operations, consisting of employees co-located at clients’ sites, local or in-country delivery centers, regional delivery centers and global delivery centers. We are continuously expanding global delivery capacity in our centers in India, China and the Philippines. We have added more regional delivery in Europe (for example, in Hungary) and in-country delivery centers in the United States and Europe (for example, in Minot, North Dakota, Des Moines, Iowa and Grenoble, France) and have increased our presence throughout the world. We also use our proprietary Cognizant 2.0 knowledge-sharing and project-management platform to unite all of our operations around the globe, access capabilities across the company, and streamline workflow. Our extensive facilities, technology and communications infrastructure facilitate the seamless integration of our global workforces.
Domain Expertise.Our business is organized and managed primarily around our four vertically-orientedindustry-oriented business segments:
Financial Services;
Healthcare;
Manufacturing, Retail and Logistics; and
Other, which includes Communications, Information, Media and Entertainment, and High Technology.
This verticalindustry focus has been central to our revenue growth and high customerclient satisfaction. As the IT services industry continues to mature, clients are looking for service providers who understand their businesses, industry initiatives, culturecustomers, markets and havecultures, and can create solutions tailored to meet their individual business needs. We have continued toTo strengthen our industry practices, we hire experts out of industry, establishprofessionals who are deeply experienced in the industries we serve, thus establishing a broad base of business analysts and consultants,consultants. We continually invest in industry training for our staff and build out industry-specific services and solutions. This approach is central to our high-levelshigh levels of on-time delivery and customerclient satisfaction, as we understand the full context of our clients’ challenges and have deep experience in addressing them.
Portfolio of Services.We offer a broad range of services designed to help clients address business challenges and enhance their ability to pursue growth opportunities. Our key service areas, IT Consulting and Technology Services and Outsourcing Services, are delivered to our clients across our four business segments in a standardized, high-quality manner through a Global Delivery Model. Theseour global delivery model. We continually invest in the expansion of our service portfolio to anticipate and meet clients’ evolving needs. In recent years, in addition to our traditional offerings, we have begun to provide services that enable clients to harness emerging SMAC technologies. Our current service areas include:
| • |
|
Business, Process, Operations and Knowledge Process Consulting;
IT Strategy Consulting;
Program Management Consulting;
Technology Consulting;Consulting
Application Design, Development Integration and Re-engineering, such as:Systems Integration
Complex Custom Systems Development;
Data Warehousing / Business Intelligence, or BI;
Customer Relationship Management, or CRM, System implementation; and
Enterprise Resource Planning, or ERP, System implementation; and
SoftwareApplication Testing Services.
| • | Outsourcing Services |
Application Maintenance such as:
Custom Application Maintenance; and
CRM and ERP Maintenance;
IT Infrastructure Outsourcing; andServices
Business and Knowledge Process Outsourcing or BPO and KPO.
Business Segments
We are organized around our four vertically–orientedindustry-oriented business segments, and we report the operations of our business as follows:
Financial Services | Healthcare | Manufacturing/Retail/Logistics | Other | |||
Banking Insurance | Healthcare Life Sciences | Manufacturing and Logistics Retail, Travel and Hospitality Consumer Goods | Communications Information, Media and Entertainment High Technology |
Financial Services
In 2010, ourOur Financial Services business segment serves leading financial institutions throughout the world. Our clients include banks, investment firms and insurance companies. In 2012, this segment represented approximately 42.4%41.3% of our total revenues. Revenues from our Financial Services business segment were $1,944.5$3,035.4 million, $1,406.6$2,518.4 million, and $1,284.0$1,944.5 million for the years ended December 31, 2010, 2009,2012, 2011, and 2008,2010, respectively. This business segment provides services to our customers operating in the following industries:
| • | Banking. We focus on serving traditional retail and commercial banks, |
The demand for our services in the banking sector is being driven by several significant changes in the industry. In response to the global economic crisis, central banks and government bodies have adopted policies designed to maintain low interest rates, raise capital requirements, impose new regulations, and institute risk-mitigation measures, such as restricting proprietary trading. Such actions have the effect of curtailing some revenue sources and increasing compliance costs for most financial institutions. In addition, financial institutions must consider adopting new technologies, such as SMAC, which will impact the way they interface with customers and employees, and how they manage their operations. We help our customers adapt to these changes by providing technology-based industry-specific solutions. In addition to Application Development and Maintenance, the services increasingly in demand in this sector include EIM, Testing, Customer Relationship Management, or CRM, Enterprise Resource Planning, or ERP, BPO, IT IS, and Business and Technology Consulting.
| • | Insurance. We |
Among the factors driving the need for our services in the insurance industry is a desire to improve the sales and marketing process, both by deepening direct retail customer relationships and strengthening interactions with networks of independent and captive insurance agents, often through the use of social and mobile technologies. Insurers also seek to enhance their profitability by differentiating their products and services, resulting in a need for specialized underwriting models and systems. Additionally, many insurers seek to improve business effectiveness by reducing expense ratios and exiting non-core lines of business and operations. Our services which are most in demand in this sector include: Application Development and Integration, Consulting, BPO/KPO, IT IS, EIM, and SMAC services.
Healthcare
Our Healthcare segment serves many leading healthcare and life sciences companies. In 2010,2012, our Healthcare business segment represented approximately 25.6%26.3% of our total revenues. Revenues from our Healthcare business segment were $1,177.1$1,934.9 million, $860.4$1,622.2 million, and $688.2$1,177.1 million for the years ended December 31, 2010, 2009,2012, 2011, and 2008,2010, respectively. This business segment provides services to our customersclients operating in the following industries:
| • |
|
Our Healthcare Practice focuses on providing a broad range of services and solutions to the industry to address regulatory requirements and emerging industry trends such as: Regulatory Compliance, Integrated Health Management (including establishing health information exchanges), EIM, Claims Investigative Services (aimed at preventing fraud and abuse and strengthening administrative processes), and Operational Improvement (in areas such as claims processing, enrollment, membership and billing). We also partner with our clients to enable their systems and processes to deal with the retail orientation of health care, such as the support of individual mandates and the adoption of mobile and analytics solutions to improve access to health information and decision making by end consumers.
| • | Life Sciences.We partner with |
Among the industry forces generating demand for our services are: financial pressures caused by payer and government pricing pressures, patent expiry and competition from generics; the drive to expand into new geographic markets; the need for more targeted or personalized therapies leading to R&D innovation; continued diversification of product portfolios and the related high cost of product development; and a dynamic regulatory environment with greater emphasis on product safety, ethics and compliance, transparency of pricing and promotional activity.
Our Life Sciences solutions help transform many of the business processes in the life sciences value chain (Research, Clinical Development, Manufacturing and Supply Chain, Sales and Marketing) as well as regulatory and administrative functions and general IT. Among our services most often in demand are Consulting, EIM, Customer Solutions, BPO/KPO, IT IS, Application Maintenance, Application Development and Systems Integration, Testing and SMAC services.
Manufacturing / Retail / Manufacturing/Retail/Logistics
Our Manufacturing, Retail and Logistics segment provides business consulting and technology services for global leaders in a range of sub-sectors, including industrial, automotive, process logistics and retailing. In 2010, our Manufacturing, Logistics and Retail business2012, this segment represented approximately 18.5%20.4% of our total revenues. Revenues from our Manufacturing/Retail/Logistics business segment were $849.6$1,498.7 million, $564.9$1,197.5 million, and $443.2$849.6 million for the years ended December 31, 2010, 2009,2012, 2011, and 2008,2010, respectively. This business segment services customers in the following industry groups:
| • | Manufacturing and Logistics. Clients in this sector include manufacturers of automobiles and industrial products, and processors of natural resources, chemicals and raw materials. In logistics, our clients include rail, truck, marine and other transportation and distribution companies. We also serve many leading energy utilities, as well as oil and gas producers. Our clients seek our help in implementing |
business-relevant changes that will make them more productive, competitive and cost-effective. To that end, we help organizations improve operational efficiencies, enhance responsiveness, and collaborate with trading partners to better serve their markets and end customers. We leverage a comprehensive understanding of the business and technology drivers of the industry. Some of our Manufacturing and Logistics solutions for Industrial and Automotive clients include: Warranty Management, Dealer System Integration, Supply Chain Management, Sales and Operations Planning, and Mobility. For transportation and logistics clients, our service areas include Warehouse and Yard Management, |
Industry trends that influence the demand for our services in this sector include the increasing globalization of sourcing and the desire of clients to further penetrate emerging markets, leading to longer and more complex supply chains. In the power generation sector, industry trends include the continued drive toward energy conservation, including “smart meter” installations, the need for better grid reliability and security, regulatory changes and the need to relieve cost pressures through better asset performance and web-based customer care systems. Clients also wish to optimize their supply chains to better manage inventory, support growing eCommerce operations and improve customer-supplier collaboration. They seek to apply intelligent systems to manufacturing and logistics operations, enable mobile platforms to support field sales and use data analytics to make better informed decisions. These trends are driving demand for offerings such as Enterprise Application Services, or EAS, EIM, Consulting and SMAC technologies.
| • | Retail, Travel and Hospitality.We serve a wide spectrum of retailers and distributors, including supermarkets, specialty premium retailers, department stores and large mass-merchandise |
Upgrade supply chainServices in high demand in the retail sector include Consulting, eCommerce, EAS, Systems Integration, Testing, BPO/KPO and EIM. We also serve the entire travel and hospitality industry including airlines, hotels and restaurants, as well as online and retail travel, global distribution systems ranging from order management to category and space management, warehouse management, logistics management, pricingintermediaries and promotions, and merchandising management;
Implement new point of salereal estate companies, providing solutions that embrace new international standards and provide new flexibility for supporting new merchandising initiatives;
Implement point solutions developed by our Retail Center of Excellence. The Center of Excellence has built solution accelerators and defined implementation methodologies for multi-channel integration, and for Point of Sale systems migration;
Accelerate the implementation of enterprise and customer relationship management;
Improve business intelligence effectiveness;
We leverage our experience in a number of key functional areas such as loyalty programs, technical operations,CRM, EIM and inventory distribution, channel management, brand portal development, outlet service desk and store accounting;BPO/KPO.
Our technical and functional consultants provide in-depth knowledge of industry applications and standards; and
We also provide BPO and niche processes in restaurants, hotels and airlines.
| • | Consumer Goods.We work with many of the world’s premier consumer goods manufacturers, creating innovative solutions and strategies that |
The demand for our services in this sector is being propelled by such factors as the need of consumer goods companies to accelerate product innovation to remain competitive and deliver top-line growth, the continuing drive to optimize global sourcing and supply chain management, the impact of SMAC technologies on consumer interaction, marketing and sales processes, the use of data analytics to increase the effectiveness of product development and marketing, as well as ongoing pressures to curtail IT costs. In response to these needs, we provide solutions including Application Development and Systems Integration, Consulting, CRM, EIM, Testing, BPO, IT IS and SMAC services.
Other
The Other business segment includes the Communications, Information, Media and Entertainment, and High Technology operating segments. In 2010,2012, our Other business segment represented approximately 13.5%12.0% of our total revenues. Revenues from our Other business segment were $621.2$877.5 million, $446.7$783.1 million, and $400.8$621.2 million for the years ended December 31, 2010, 2009,2012, 2011, and 2008,2010, respectively. The Other business segment is an aggregation of operating segments each of which, individually, arerepresents less than 10.0% of consolidated revenues and segment operating profit. The Other business segment includes Communications, Information, Media and Entertainment Services and High Technology operating segments. A descriptionDescriptions of the key operating segments included in the Other isbusiness segment are as follows:
| • |
|
| • | Information, Media and Entertainment.We |
We provide services in critical areas such as the Digital Content Supply chain management solutions, from pre-press to material procurement, circulation, logistics,Chain and vendor management;Media Asset Management. Some of our other services include: Business Solutions (such as Advertising Management, Online Media, and e-Business); Digital Distribution, Workflow Automation; Intellectual Property Management, Anti-Piracy Initiatives; and Operational Systems (Advertising Sales, Studio Management, Billing and Payments, Content Management and Delivery).
Business solutions covering advertising management, online media, and e-business;
Workflow automation covering the product development process for broadcasters;
Spot ad buying systems covering agency of record, traffic management, post-buy analysis, and financial management;
Digital Asset Management, or DAM and Digital Rights Management, or DRM; and
Operational systems including ad sales, studio management, outsourcing billing and payments, along with content management and delivery.
| • | High Technology. We serve some of the world’s leading |
Our SolutionSolutions and Services
We believe that we have developed an effective integrated global delivery business model and this business model is expected to be a critical element of our continued growth. To support this business model, at December 31, 2010, we employed approximately 104,000 professionals and support staff globally. We also have established facilities and technology and communication infrastructures to support our business model.
Across each of our business segments, we provide a broad and expanding range of consulting, information technology and outsourcing services, including:
Consulting and Technology Services
| • | IT Strategy and Business Consulting. Our global consulting |
CBC is built on a foundation of deep thought leadership and actionable strategies. CBC works with clients to improve business performance and operational productivity in order to exceed business goals. We also provide assistance with Strategy Consulting, Business and Operations Consulting, IT Strategy & Change Management, and Program Management Consulting.
Key factors driving the demand for CBC’s services are the following:
The need to run the business better while increasing operational flexibility and reducing time to market; Optimizing big data and predictive analytics to gain competitive insight; Large business transformations, impacting business and IT operating models; Increased demands to collaborate and compete in the market for customers, capabilities and talent; Desire to remove roadblocks in the Business/IT relationship – to increase the return on technology investments, both directly and through positioning IT as a source of digital business innovation; Readiness to embrace virtualization capabilities, including greater infrastructure outsourcing and cloud solutions, with a focus on identifying and managing risk and cost; and Ongoing regulatory shifts, which require enhanced risk management and compliance frameworks, as well as greater organizational resilience. In this environment, the services currently provided by CBC include: IT strategy consulting to define new IT target operating models, new delivery models and to optimize IT to business alignment, sourcing strategies and IT costs; Program management consulting, including post-acquisition integration, business and IT integration, business transformation, and large scale business transformation; Operations improvement consulting for business process management, operations strategy, global sourcing and supply chain management, and change management; Strategy consulting with respect to re-imagining new business and operating models, market growth, mergers and acquisitions, product innovation and sustainability initiatives; and Business consulting related to finance, risk advisory, human resources, marketing and analytics functions. CBC also is expanding new services and capabilities in areas such as BPO, Supply Chain Management, Enterprise Analytics, EAS, and consulting related to the management of core assets and intellectual property, or IP. |
| • | Application |
Demand for our Application Development and Systems Integration services is being driven by the growing need of customers to access outside capabilities to respond to the impact of changes in markets, regulation, competition and SMAC technologies on their businesses.
As part of our Application Development services, we define customer requirements, write specifications and design, develop, test and integrate software across multiple platforms including Internet technologies. We modify and test applications to enable systems to function in new operating
environments. In addition, these services include ERP and CRM implementation services. We follow one of two alternative approaches to application development and systems integration:
full life-cycle application development, in which we assume start-to-finish responsibility for analysis, design, implementation, testing and integration of systems; or
cooperative development, in which our employees work with a customer’s in-house IT personnel to jointly analyze, design, implement, test and integrate new systems.
In both of these approaches, our on-site team members work closely and collaboratively with our clients. Detailed design, implementation and testing are generally performed at dedicated near-shore and offshore development and delivery centers located primarily in India, China, the United States, Canada, Argentina, Hungary and the Philippines.centers. In addition, we maintain an on-site presence at each customer location in order to address evolving customerclient needs and resulting changes to the project.
A key part of our application development and systems integration offering is a suite of services to help organizations build and integrate business applications with the rest of their operations. InUsing this suite of services, we leverage our skills in business application development and enterprise application integration to build sophisticated business applications and to integrate these new applications and websites with client server and legacy systems. We build and deploy robust, scalable and extensible architectures for use in a wide range of industries. We maintain competency centers specializing in
various areas such as: Microsoft solutions; IBM, SAP, Oracle and JAVAJava applications; and Cloud computingComputing and Mobile solutions. These competency centers enable us to provide application development and integration services to a broad spectrum of customers.clients.
Our re-engineering service offerings assist customers migrating from systems based on legacy computing environments to newer standards-based distribution architectures, often in response to the more stringent demands of business. Our re-engineering tools automate many of the processes required to implement advanced technology platforms. We believe that this automation substantially reduces the time and cost to perform re-engineering services, savings that benefit both our customers and us.services. These tools also enable us to perform source code analysis and to re-design target databases and convert certain programming languages. If necessary, our programmers also help customersclients re-design and convert user interfaces.
| • |
|
Strategic, advisory and management consulting services across Information Management, Business Intelligence & Analytics;
Enterprise Data Management, including the creation of data warehouses, data marts, operational stores, enterprise master data management platforms, enterprise metadata platforms as well as enterprise data governance;
Descriptive Analytics/ Business Intelligence that involves the strategy, design, build and management of information assets that drive day to day decision making;
Strategic Corporate Performance Management, enabling clients to create executive dashboards or scorecards to better manage operations;
Packaged Analytics designed to provide solutions to specific business problems leveraging technologies such as Mobile and Cloud; and
Big Data to assist clients in managing and deriving actionable insights from the explosion in the volume, variety, velocity and complexity of data.
| • | Application Testing. Our |
| • | Social, Mobile, Analytics and Cloud-based Services.We are aiding clients in adapting social, mobile, analytics and cloud-based (SMAC) technologies to their businesses. Such new technologies are becoming fundamental components of the enterprise IT architecture. These technologies are profoundly changing the way companies relate to their customers, interact with employees, and bring products and services to market. As such, the SMAC stack holds the promise of innovation and the potential for innovation-driven top line growth and efficiencies that improve the bottom line. We help clients analyze social media sentiment and build those insights into their customer relationship management process. In other cases, we are enabling clients to manage and analyze vast accumulations of data and to use that data to drive management decisions. We also offer end-to-end services to enable cloud-based processes, from consulting and implementation to ongoing support activities. |
Outsourcing Services
| • | Application Maintenance. Our Application Maintenance |
We provideBy supporting some or all of a client’s applications, our services to help ensure that a customer’suser’s core operational systems are free of defects and responsive to the customer’s changing needs. As part of this process, we are often able to introduce product and process enhancements and improve service levels to customers requesting modifications and on-going support. We also provide Application Value Management Solutions that can help balance cost, complexity and capacity and can help clients reduce cost of ownership, improve service levels and create new operational efficiencies.
Our global delivery business model enables us to provide a range of rapid response and cost-effective support services to our customers.clients. Our on-site team members often provide help-desk services at the customer’sclient’s facility. These team members typically are available in the event of an emergency service
request and are able to quickly resolve customer problems from remote locations. In the case of more complex maintenance services, including modifications, enhancements and documentation, which typically have longer turnaround times, we take full advantage of our offshore resources to develop solutions more cost-effectively than would be possible relying on higher cost local professionals. The services provided by our offshore team members are delivered to customers using satellite and fiber-optic communications.
As part of our Application Maintenance services, we assist customersclients in renovating their core systems to meet the requirements imposed by new regulations, new standards or other external events. These services include, or have previously included, Year 2000 compliance, Eurocurrency compliance, decimalization within the securities industry and compliance with the Health Insurance Portability and Accountability Act for the healthcare industry.
We seek to anticipate the operational environment of our customers’clients’ IT systems as we design and develop such systems. We also offer diagnostic services to customersclients to assist them in identifying shortcomings in their IT systems and optimizing the performance of their systems.
| • | IT Infrastructure Services. We provide end-to-end IT Infrastructure Management Outsourcing services and |
able to provide significant scale, quality and cost savings to our clients in IT |
| • | Business and Knowledge Process |
Business Strategies
Our objectives are to maximize stockholder value and enhance our position as a leading provider of information technology, consulting and business process outsourcing services. We implement the following core strategies to achieve these objectives:
In additionGrowth through Reinvestment. Historically, we have invested our profit above the 19% to 20% non-GAAP operating margin level, excluding stock-based compensation expense, back into our business. We believe this to be a significant contributing factor to our industry-specific expertisestrong revenue growth. This investment is primarily focused in the areas of: strengthening and focus,expanding our strengths, whichportfolio of services; continuing to expand our geographic presence for both sales and delivery; hiring client partners and relationship personnel with specific industry experience or domain expertise; training our technical staff in a broader range of service offerings; recognizing and rewarding exceptional performance by our employees; and maintaining a level of resources, trained in a broad range of service offerings, to be well positioned to respond to our client requests, as described below.
| • | Expand Service Offerings and Solutions: We have several teams dedicated to creating technology-based innovative solutions and developing new, high value services. The teams collaborate with |
customers to develop these services. For example, we are currently developing new offerings in Business and IT Consulting and industry-oriented IT solutions atop innovative technologies. We invest in internal research and development and promote knowledge building and sharing across the organization to advance the development of new services and solutions. Furthermore, we continue to enhance our capabilities and service offerings in the areas of CRM, ERP, EIM, Software Testing, Infrastructure Management, industry-oriented BPO services and SMAC technologies. |
We believe differentiate us from other IT service providers, includethat the following:
Established and Scalable Proprietary Processes: We have a comprehensive process framework that addresses the entire software engineering life cycle and support activities which are scalable for projects of different sizes and complexities. This proprietary framework, which we refer to as “Process Space” (part of Cognizant 2.0), is supported by in-house project management, metrics management and workflow tools and is available to allcontinued expansion of our programmers globally. Process Space has evolved since its original release in 1996 in breadth, depthservice offerings will provide new sources of revenue, reduce our reliance on any one technology initiative and maturity, based on the implementation feedback from projectshelp foster long-term relationships with our customers by allowing us to better serve their needs. Additionally, as part of our vision to continue our growth and findings of internal quality audits and external assessments. Process capabilities are monitored at the sub-process level and performance targets are monitored at the process level, which are aligned with the overall business objectives. Statistical process controls are used extensively to continuously monitor, predict and improve performance. Our Quality Assurance group facilitates process implementation from the project inception and audits the projects periodically to ensure that the implementation is effectiveanticipate our clients’ and the risks are being managed.
Our process framework complies with the requirements of ISO 9001, TL 9000 for Telecom projects, and ISO 20000 for Infrastructure projects. Our delivery processes, support processes and their implementation are formally certified by Det Norske Veritas, or DNV,markets’ rapidly changing demands in the above mentioned standards. KPMG appraises our enterprise-wide operationsnear-term, mid-term and long-term, we are investing in emerging opportunities which seek to be at CMMI Maturity Level 5, which is the highest possible maturity level rating, of the Capability Maturity Model Integration v1.2, or CMMI, of the Software Engineering Institute at Carnegie Mellon University. Our BPO service offering is assessed at eSCM Maturity Level 4 which is the highest possible rating for the first attempt of the e-Sourcing Capability Model of IT Services Qualification Center at Carnegie Mellon University. Finally, all of our principal development centers have been certified by the STQC Directorate Ministry of Communicationstransform client and Information Technology, Government of India (the accreditation authority for companies in India) under the internationally recognized ISO 27001 (previously BS 7799-2) Information Security Standards, a comprehensive set of controls comprising best practices in information securityuser platforms to internet, cloud and business continuity planning. We have implemented the above process framework enterprise-wide to ensure that we consistently deliver high quality of products and services to our clients from all global operations. mobile-based experiences.
| • | Expand Domestic and International Geographic Presence: We have established sales and marketing offices in various metropolitan areas in the United States and internationally. As we expand our customer base, we plan to open additional sales and marketing offices in North America, Europe, Latin America, Asia, and the Middle East. This expansion is expected to facilitate sales and services to existing and new customers. |
| • | Research and Development and Competency Centers: We have project experience and expertise across multiple architectures and technologies, and have made significant investments in our competency centers and in research and development to keep abreast of the latest technology developments. Most of our technical staff is trained in multiple technologies and architectures. As a result, we are able to react to clients’ needs quickly and efficiently redeploy our technical staff to different technologies. Also, to develop and maintain this flexibility, we have made a substantial investment in our competency centers so that the experience gained from particular projects and research and development efforts is leveraged across our entire organization. Through our investment in research and development activities and the continuing education of our technical personnel, we enlarge our knowledge base and develop the necessary skills to keep pace with emerging technologies. We believe that our ability to work in new technologies allows us to foster long-term relationships by having the capacity to continually address the needs of both existing and new clients. |
| • | Enhance Processes, Methodologies and Productivity Toolsets: We have a comprehensive process framework that addresses the entire software engineering life cycle and support activities, which are scalable for projects of different sizes and complexities. This proprietary framework, which we refer to as “Process Space” (part of Cognizant 2.0), is supported by in-house project management, metrics management and workflow tools and is available to all our programmers globally. Process Space has evolved since its original release in 1996 in breadth, depth and maturity, based on the implementation feedback from projects and findings of internal quality audits and external assessments. Process capabilities are monitored at the sub-process level and performance targets are monitored at the process level. Performance targets are aligned with the overall business objectives. Statistical process controls are used extensively to continuously monitor, predict and improve performance. Our Delivery Assurance Group facilitates process implementation from project inception and audits the projects periodically to ensure that the implementation is effective and the risks are being managed. With the globalization of business, we are committed to improving and enhancing our proprietary Process Space software engineering process and other methodologies and toolsets. In light of the rapid evolution of technology, we believe that continued investment in research and development is critical to our continued success. We are constantly designing and developing additional productivity software tools to automate testing processes and improve project estimation and risk assessment techniques. |
We have invested considerably in automation to improve process institutionalization across the organization. For example, we have createdbuilt and rolled outdeployed “Cognizant 2.0”2.0,” an intelligent delivery ecosystem which orchestrates processes, methodologies and best practices driving effective usage of
knowledge, as well aswhile providing a collaborative framework for our world-wide associates. Cognizant 2.0 offers a unique blend of collaboration, process management and just-in-time management.
client service personnel. Our process framework has been extensively adapted to cater to different types of projects managed by the organization includingacross different service lines, such as Application Development, Managed Services, Application Maintenance, Testing, Mass Change, Data Migration, Re-engineering, Business Process Outsourcing,BPO and IT infrastructure and Package Development projects.IS.
Highly-Skilled Workforce.Global Delivery Model. Our managers and senior technical personnel provide in-depth project management expertise to customers. To maintain this level of expertise, we have placed significant emphasis on recruiting and training our workforce of highly-skilled professionals. We have approximately 12,200 project
managersa four-tiered global architecture for service delivery and senior technical personnel around the world, manyoperations, consisting of whom have significant work experience in North America, Europe and Asia. We also maintain programs and personnel to hire and train the best available technical professionals in both legacy systems and emerging technologies. We provide extensive combined classroom and on-the-job training to newly hired programmers, as well as additional annual training programs designed to enhance the business practices, tools, technology and consulting skills of our professional staff. We were assessed by KPMGemployees co-located at Level 5 (the highest possible rating) of the People Capability Maturity Model,clients’ sites, local or P-CMM, of the Software Engineering Institute at Carnegie Mellon University. This widely recognized means of implementing current best practices in fields such as human resources, knowledge management and organizational development help improve our processes for managing and developing our workforce and addressing critical people issues.
Research and Development and Competency Centers. We have project experience and expertise across multiple architectures and technologies, and have made significant investments in our competencyin-country delivery centers, regional delivery centers and in research and development to keep abreast of the latest technology developments. Most of our programmers are trained in multiple technologies and architectures. As a result, we are able to react to customers’ needs quickly and efficiently redeploy programmers to different technologies. Also, to develop and maintain this flexibility, we have made a substantial investment in our competency centers so that the experience gained from particular projects and research and development efforts is leveraged across our entire organization. In addition, through our investment in research and development activities and the continuing education of our technical personnel, we enlarge our knowledge base and develop the necessary skills to keep pace with emerging technologies. We believe that our ability to work in new technologies allows us to foster long-term relationships by having the capacity to continually address the needs of both existing and new customers.
Well-Developed Infrastructure.global delivery centers. Our extensive facilities, technology and communications infrastructure facilitate the seamless integration of our global workforces. This is accomplished by permitting team members in different locations to access common project information and to work directly on customerclient projects. This infrastructure allows for:
for rapid completion of projects;
projects, highest level of quality;
off-peakquality, efficient use of customers’clients’ technological resources;resources and
real-time access to project information by the on-site account manager or the customer.
International time differences enable our offshore teams to access a customer’s computing facilities located in North America, Europe, the Asia Pacific region and other countries in which we provide services during off-peak hours. This ability to perform services during off-peak hours enables us to complete projects more rapidly and does not require our customers to invest in duplicative hardware and software.client. In addition, for large projects with short time frames, our offshore facilities allow for parallel processing of various development phases to accelerate delivery time. In addition, we can deliver services more rapidly than some competitors without an offshore labor pool because our lower labor costs enable us to cost-effectively assign more professionals to a project.
Business Strategies
Our objectives are to maximize stockholder value and enhance our position as a leading provider of custom information technology, consulting and business process outsourcing services. We implement the following core strategies to achieve these objectives:
| • | Two-in-a-Box: Our proprietary client engagement model, called Two-in-a-Box™, or TIB, represents our commitment to providing superior service to help our clients reduce IT operational costs, embrace best practices and undergo sustainable business transformation. Centered on the needs of the client’s organization, TIB is designed specifically to help the client quickly reduce IT budgets, revamp IT operations and re-deploy freed-up assets to more strategic initiatives that generate business value. The TIB model begins with a relationship management team, led by the Client Partner, or CP, with deep industry expertise, working onsite to absorb the client’s culture, operational processes, challenges and business goals and to assist with strategic planning. Another critical TIB team member is the dedicated global delivery manager, or DM. The relationship between the CP and DM is essential to ensure that our IT services are delivered with precision and that they are tailored to each client’s unique needs. |
| • | Highly-Skilled Workforce: Our managers and senior technical personnel provide in-depth project management expertise to clients. To maintain this level of expertise, we place significant emphasis on recruiting and training our workforce of highly-skilled professionals. We have approximately 19,600 project managers and senior service delivery staff around the world, many of whom have significant work experience in North America, Europe and Asia. We also maintain programs and personnel to hire and train the best available technical professionals in both legacy systems and emerging technologies. We provide extensive combined classroom and on-the-job training to newly-hired technical staff, as well as additional annual training programs designed to enhance the business practices, tools, technology and consulting skills of our professional staff. |
| • | Continue to be an Employer of Choice in the Industry: As a rapidly growing professional services firm, a key attribute of our continued success is the ability to continually hire, assimilate, motivate and retain the best talent possible in the industry. We have developed strong relationships with key universities around the world, particularly in India, to provide a continual pipeline of talented staff from Tier One schools. In addition, we have established an active lateral recruiting program in North America, Europe and India and an on-campus recruiting program in North America. We continue to expand our presence and brand in our key supply markets, further enhancing our ability to hire experienced professionals from competing IT services firms and industry to support our client needs and growth. We invest heavily in training programs, motivational programs and career development to ensure personal professional growth for each of our employees. |
Further Develop Long-Term Customer Relationships.Client Relationships. We have strong long-term strategic relationships with our customersclients and business partners. We seek to establish long-term relationships that present recurring revenue opportunities, frequently trying to establish relationships with our customers’clients’ chief information officers, or other IT and business decision makers, by offering a wide array of cost-effective high quality services. Approximately 97%98% of our
revenues for the year ended December 31, 20102012 were derived from customersclients who had been using our services at the end of 2009.2011. We also seek to leverage our experience with a customer’sclient’s IT systems into new business opportunities. Knowledge of a customer’sclient’s processes and IT systems gained during the performance of application maintenance services, for example, may provide us with a competitive advantage in securing additional maintenance, development and other projects from that customer.
Expand Service Offerings and Solutions.We have several teams dedicated to developing new, high value services. These teams collaborate with customers to develop these services. For example, we are currently developing new offerings in Business and IT Consulting and vertically-oriented IT solutions atop innovative technologies such as: Service Oriented Architectures (SOA) and Web 2.0. We invest in internal research and development and promote knowledge building and sharing across the organization to promote the development of new services and solutions. Furthermore, we continue to enhance our capabilities and service offerings in the areas of:
Customer Relationship Management, or CRM;
Enterprise Resource Planning, or ERP;
Data Warehousing / Business Intelligence, or BI;
Software Testing;
Infrastructure Management; and
Vertically-Oriented Business and Knowledge Process Outsourcing, or BPO and KPO.
We believe that the continued expansion of our service offerings will reduce our reliance on any one technology initiative and may help foster long-term relationships with our customers by allowing us to better serve their needs. Among service offerings, Infrastructure Management and Vertically-Oriented Business and Knowledge Process Outsourcing have been among the key drivers of growth.
Enhance Processes, Methodologies and Productivity Toolsets.With the globalization of business,we are committed to improving and enhancing our proprietary Process Space software engineering process and other methodologies and toolsets. In light of the rapid evolution of technology, we believe that continued investment in research and development is critical to our continued success. We are constantly designing and developing additional productivity software tools to automate testing processes and improve project estimation and risk assessment techniques. For example, we have created and rolled out “Cognizant 2.0” which uses groupware technology based on Web 2.0 technologies, enabling Cognizant associates to share project experiences and best practice methodologies across the organization with the objective of improving productivity.
Expand Domestic and International Geographic Presence. As we expand our customer base, we plan to open additional sales and marketing offices in North America, Europe, Latin America and Asia. This expansion is expected to facilitate sales and service to existing and new customers. We have established sales and marketing offices in various metropolitan areas both in the United States and internationally.
Continue to be an Employer of Choice in the Industry.As a rapidly growing professional services firm, a key attribute of our continued success is the ability to continually hire, assimilate, motivate and retain the best talent possible in the industry. We have developed strong relationships with key universities around the world, particularly in India, to provide a continual funnel of talented staff from Tier One schools. In addition, we continue to expand our presence and brand in our key supply markets, further enhancing our ability to hire experienced professionals from competing IT services firms and industry to support our client needs and growth. We invest heavily in training programs (centered around Cognizant Academy), motivational programs and career development to ensure personal professional growth for each of our associates.client.
Pursue Selective Strategic Acquisitions, Joint Ventures and Strategic Alliances. We believe that opportunities continue to exist in the fragmented market in which we operate to expand our business through selective
strategic acquisitions, joint ventures and strategic alliances. We believe that acquisition and joint venture candidates may enable us to expand our geographic presence, service offering and our capabilities more rapidly, especially in geographic markets and key industries.rapidly. For example, in 2010,late 2012, we completed three acquisitions, to strengthen our business process outsourcing expertise within our logistican acquisition of Medicall Inc., an offshore provider of outsourced clinical services our business transformationfocused on the healthcare sector. The services require clinical licensure and program management capabilities andexpertise. As part of the transaction, we acquired over 600 U.S.-licensed nurses located primarily in the Philippines. This acquisition allows us to expand our testing servicesBPO expertise within Europe. In addition, through our working relationships with independent software vendors we obtain projects using the detailed knowledge we gain in connection with a joint development process.healthcare industry. Finally, we expect to continue to form strategic alliances with select IT service firms that offer complementary services to best meet the requirements of our customers.clients.
Sales and Marketing
We market and sell our services directly through our professional staff, senior management and direct sales personnel operating out of our Teaneck, New Jersey headquarters and our business development offices which are strategically located in various metropolitan areas around the world. The sales and marketing group works with our technicalclient delivery team as the sales process moves closer to the customer’s selection of a services provider. The duration of the sales process varies depending on the type of service, ranging from approximately two months to over one year. The account manager or sales executive works with the technical team to:
define the scope, deliverables, assumptions and execution strategies for a proposed project;
develop project estimates;
prepare pricing and margin analyses; and
finalize sales proposals.
Management reviews and approves proposals, which are then presented to the prospective customer. Our sales and account management personnel remain actively involved in the project through the execution phase. We focus our marketing efforts on businesses with intensive information processing needs. We maintain a prospect/customer database that is continuously updated and used throughout the sales cycle from prospect qualification to close. As a result of this marketing system, we pre-qualify sales opportunities, and direct sales representatives are able to minimize the time spent on prospect qualification. In addition, substantial emphasis is placed on customer retention and expansion of services provided to existing customers. In this regard, our account managers play an important marketing role by leveraging their ongoing relationship with the customer to identify opportunities to expand and diversify the type of services provided to that customer.
Customers
The number of customers served by us has increased significantly in recent years. As of December 31, 2010,2012, we were providing services to approximately 712 customers,821 clients, as compared to approximately 589 customers785 clients as of December 31, 2009,2011, and approximately 565 customers712 clients as of December 31, 2008.2010. As of December 31, 2012, we increased the number of strategic clients to 214. We define a strategic client as one offering the potential to generate at least $5 million to $50 million or more in annual revenues at maturity. Accordingly, we provide a significant volume of services to many customers in each of our business segments. Therefore, a loss of a significant customer or a few significant customers in a particular segment could materially reduce revenues for such segment. However, no individual customer exceeded 10.0% of our consolidated revenues for the years ended December 31, 2010, 20092012, 2011, and 2008.2010. In addition, the services we provide to our larger customers are often critical to the operations of such customers and a termination of our services generally would require an extended transition period with gradualgradually declining revenues. For the years ended December 31, 2012, 2011, and 2010, 200979.4%, 78.5%, and 2008, 78.0%, 79.1% and 79.1% of our revenue, respectively, was from North American customers.
For the year ended December 31, 2010,2012, we derived our revenues from the following business segments: 42.4%41.3% from Financial Services, 25.6%26.3% from Healthcare, 18.5%20.4% from Manufacturing/Retail/Manufacturing/Logistics and 13.5%12.0% from Other.
We generally provide our services either on a time-and-material, basisfixed price, or on a fixed priceper-transaction basis. The volume of work performed for specific customers is likely to vary from year to year, and a significant customer in one year may not use our services in a subsequent year.
Presented in the table below is additional information about our customers.
| Year Ended December 31, | Year Ended December 31, | |||||||||||||||||||||||
| 2010 | 2009 | 2008 | 2012 | 2011 | 2010 | |||||||||||||||||||
Revenues from top five customers as a percentage of total revenues | 17.9 | % | 17.4 | % | 19.4 | % | 14.0 | % | 16.3 | % | 17.9 | % | ||||||||||||
Revenues from top ten customers as a percentage of total revenues | 30.3 | % | 29.4 | % | 30.0 | % | 25.0 | % | 27.7 | % | 30.3 | % | ||||||||||||
Revenues under fixed-bid contracts as a percentage of total revenues | 31.5 | % | 30.3 | % | 26.7 | % | 33.1 | % | 31.7 | % | 31.5 | % | ||||||||||||
Competition
The intensely competitive IT services and outsourcing market includes a large number of participants and is subject to rapid change. This market includes participants from a variety of market segments, including:
systems integration firms;
contract programming companies;
application software companies;
traditional large consulting firms;
the professional services groups of computer equipment companies; and
facilities management and outsourcing companies.
Our direct competitors include, among others, Accenture, Capgemini, Computer Sciences Corporation, Genpact, HCL Technologies, HP Enterprise (formerly Electronic Data Systems), IBM Global Services, Infosys Technologies, Perot Systems (acquired by Dell Inc.), Tata Consultancy Services and Wipro. In addition, we compete with numerous smaller local companies in the various geographic markets in which we operate.
ManySome of our competitors have significantly greater financial, technical and marketing resources andand/or greater name recognition. The principal competitive factors affecting the markets for our services include:
performance and reliability;
quality of technical support, training and services;
responsiveness to customer needs;
reputation and experience;
financial stability and strong corporate governance; and
competitive pricing of services.
We rely on the following to compete effectively:
a well-developed recruiting, training and retention model;
a successful service delivery model;
a broad referral base;
continual investment in process improvement and knowledge capture;
investment in infrastructure and research and development;
financial stability and strong corporate governance;
continued focus on responsiveness to customer needs, quality of services, competitive prices; and
project management capabilities and technical expertise.
Intellectual Property
OurWe provide value to our clients based, in part, on our proprietary innovations, methodologies, reusable knowledge capital and other intellectual property. We recognize the importance of intellectual property rights are importantand its ability to differentiate us from our business.competitors. We presently hold no patents or registered copyrights. Instead, we rely on a combination of intellectual property laws, trade secrets,as well as confidentiality procedures and contractual provisions, to protect our intellectual property.property and our brand. We require our employees, independent contractors, vendorshave registered, and customers to enter into written confidentiality agreements uponapplied for the commencementregistration of, their relationships with us. These agreements generally provide that any confidential or proprietary information disclosed or otherwise made available by us be kept confidential. In addition, when we disclose any confidential or proprietary information to third parties, we routinely require those third parties to agree in writing to keep that information confidential.
A portion of our business involves the development for customers of highly complex information technology software applicationsU.S. and other technology deliverables. This intellectual property includes written specificationsinternational trademarks, service marks, domain names, and documentation in connection with specific customer engagements. Our customers usually own the intellectual property rights in the software and other deliverables we develop for them.
On July 1,1998, Nielsen Media Research, Inc., the successor in interest to Cognizant Corporation, assigned all of its right, title and interest in and to the marks COGNIZANT and C & Design to Cognizant Technology Solutions Corporation. On February 6, 2003, Cognizant Technology Solutions Corporation assigned certain of its assets, including all of its intangible assets, to Cognizant Technology Solutions U.S. Corporation.copyrights. As of December 31, 2010, Cognizant Technology Solutions U.S. Corporation2012, we have also applied for or its predecessors is the record owner of: (a) two registrations for COGNIZANT, one registration for C & Design, one registration for MANAGED TEST CENTER, one registration for TWO-IN-A-BOX, one registration for MDM EXPRESS, one registration for MDM-IN-A-BOX, and one registration for STRATEGIC VISION CONSULTING, one registration for SV (Stylized), and two registrations for TRANSFORMING WHILE PERFORMING, as well as six pending applications for GOVERNANCE-IN-A-BOX, GOVERNANCE-IN-A-BOX and Design, INTEGRATED REPORTING IN THE CLOUD, PLANFORCE, THREE-IN-A-BOX and ONE REPORT AS A SERVICE in the United States; (b) two registrations for COGNIZANT, one registration for C & Design, one application for COGNIZANT, two applications for C & Design, one application for TWO-IN-A-BOX and one application for THREE-IN-A-BOX in India; (c) a registration for COGNIZANT in Spain; (d) one registration for each COGNIZANT and C & Design, one registration for MDM EXPRESS and one registration for MDM-IN-A-BOX, one registration for GOVERNANCE-IN-A-BOX, one registration for THREE-IN-A-BOX and one registration for TWO-IN-A-BOX and applications for INTEGRATED REPORTING IN THE CLOUD, ONE REPORT AS A SERVICE and THE FUTURE OR WORK in the European Union; and (e) six registrations and one application for COGNIZANT and two registrations and two applications for C & Design in Malaysia. In addition, as of December 31, 2010, Cognizant Technology Solutions U.S. Corporation, or its predecessors, is the record owner ofobtained a total of 258299 trademark registrations in 60 countries. In addition, we have filed 9 U.S. and international patent applications covering certain of our proprietary technology. Although the company believes the ownership of such patents, copyrights, trademarks and service marks is an important factor in its business and that its success does depend in part on the ownership thereof, the company relies primarily on the innovative skills, technical competence and marketing abilities of its personnel.
Employees
We finished the 2010 year 2012 with headcount of approximately 104,000.156,700 employees. We employed approximately 83,000124,100 persons in the Asia Pacific region, approximately 17,30027,300 persons in various locations throughout North America and SouthLatin America and over 3,700approximately 5,300 persons in various locations throughout Europe, principally in the United Kingdom. We are not party to any significant collective bargaining agreements. We consider our relations with our employees to be good.
Our future success depends to a significant extent on our ability to attract, train and retain highly-skilled IT development and other professionals. In particular, we need to attract, train and retain project managers, programmers and other senior technical personnel. We believe there is a shortage of, and significant competition for, IT development professionals in the United States, Europe and in India with the advanced technological skills necessary to perform the services we offer. We have an active recruitment program in India, and have developed a recruiting system and database that facilitates the rapid identification of skilled candidates. During the course of the year, we conduct extensive recruiting efforts at premier colleges and technical schools in India. We evaluate candidates based on academic performance, the results of a written aptitude test measuring problem-solving skills and a technical interview. In addition, we have an active lateral recruiting program in North America, Europe and India. A substantial majority of the personnel on most on-site teams and virtually all the personnel staffed on offshore teams is comprised of Indian nationals.
Our senior project managers are hired from leading consulting firms in the United States, Europe and India. Our senior management and most of our project managers have experience working in the United States and Europe. This enhances our ability to attract and retain other professionals with experience in the United States and Europe. We have also adopted a career and education management program to define our employees’ objectives and career plans. We have implemented an intensive orientation and training program to introduce new employees to the Process Space software engineering process, our other technologies and our services.
Our Executive Officers
The following table identifies our current executive officers:
Name | Age | Capacities in Which Served | In Current Position Since | Age | Capacities in Which Served | In Current | ||||||||||
Lakshmi Narayanan(1) | 57 | Vice Chairman of the Board of Directors | 2007 | 59 | Vice Chairman of the Board of Directors | 2007 | ||||||||||
Francisco D’Souza(2) | 42 | President and Chief Executive Officer | 2007 | 44 | Chief Executive Officer | 2007 | ||||||||||
Gordon Coburn(3) | 47 | Chief Financial and Operating Officer, and Treasurer | 2007 | 49 | President | 2012 | ||||||||||
Ramakrishnan Chandrasekaran(4) | 53 | President and Managing Director, Global Delivery | 2006 | |||||||||||||
Rajeev Mehta(5) | 44 | Chief Operating Officer, Global Client Services | 2006 | |||||||||||||
Steven Schwartz(6) | 43 | Senior Vice President, General Counsel and Secretary | 2007 | |||||||||||||
Karen McLoughlin(4) | 48 | Chief Financial Officer | 2012 | |||||||||||||
Ramakrishnan Chandrasekaran(5) | 55 | Group Chief Executive – Technology and Operations | 2012 | |||||||||||||
Rajeev Mehta(6) | 46 | Group Chief Executive – Industry and Markets | 2012 | |||||||||||||
Malcolm Frank(7) | 46 | Executive Vice President, Strategy and Marketing | 2012 | |||||||||||||
Steven Schwartz(8) | 45 | Senior Vice President, General Counsel and Secretary | 2007 | |||||||||||||
| (1) | Lakshmi Narayanan was appointed Vice Chairman of the Board of Directors, effective January 1, 2007. Mr. Narayanan served as our Chief Executive Officer from December 2003 through December 2006 and as our President from March 1998 through December 2006. Mr. Narayanan joined our Indian subsidiary as Chief Technology Officer in 1994 and was elected President of such subsidiary on January 1, 1996. Prior to joining us, from 1975 to 1994, Mr. Narayanan was the regional head of Tata Consultancy Services, a large consulting and software services company located in India. Mr. Narayanan serves on the board of directors and as the Chairman of the Governance Committee of TVS Capital Funds Limited. Mr. Narayanan holds a Bachelor of Science degree, a Master of Science degree and a Management degree from the Indian Institute of Science. |
| (2) | Francisco D’Souza was appointed President and Chief Executive Officer and became a member of the Board of Directors, effective January 1, 2007. Effective February 6, 2012, Mr. D’Souza ceased serving as our President, at which time Mr. Coburn was appointed to such position. Mr. D’Souza served as our Chief Operating Officer from December 2003 through December 2006. Prior to that, from November 1999 to December 2003, he served as our Senior Vice President, North American Operations and Business Development. From March 1998 to November 1999, he served as our Vice President, North American Operations and Business Development and as our Director-North American Operations and Business Development from June 1997 to March 1998. From January 1996 to June 1997, Mr. D’Souza was engaged as our consultant. From February 1995 to December 1995, Mr. D’Souza was employed as Product Manager at Pilot Software. Between 1992 and 1995, Mr. D’Souza held various marketing, business development and technology management positions as a Management Associate at The Dun & Bradstreet Corporation. While working at The Dun & Bradstreet Corporation, Mr. D’Souza was part of the team that established the software development and maintenance business conducted by us. Mr. D’Souza is a member of the Board of Directors of the General Electric Company. Mr. D’Souza also serves on the Board of Trustees of Carnegie Mellon University, the |
Board of Trustees of The New York Hall of Science and the Board of Directors of the U.S.-India Business Council. Mr. D’Souza holds a Bachelor of Business Administration degree from the University of Macau (formerly known as the University of East |
| (3) | Gordon Coburn was appointed |
| (4) | Karen McLoughlin was appointed Chief Financial Officer of the company, effective February 6, 2012. She previously served as the company’s Senior Vice President of Finance and Enterprise Transformation, a role she held since January 2010. In such role, Ms. McLoughlin was responsible for the company’s worldwide financial planning and analysis, enterprise risk management and enterprise transformation functions, including the facilitation and execution of various internal reengineering and transformation initiatives designed to enable the company’s strategic vision. From August 2008 to January 2010, Ms. McLoughlin served as the company’s Senior Vice President of Finance, responsible for overseeing the Company’s global financial planning and analysis team and enterprise risk management, and from October 2003 until August 2008, Ms. McLoughlin served as the company’s Vice President of Global Financial Planning and Analysis. Prior to joining Cognizant in October 2003, Ms. McLoughlin held various positions at Spherion Corporation (“Spherion”) from August 1997 to October 2003 and at Ryder System Inc. (“Ryder”) from July 1994 to August 1997. At both Spherion and Ryder, Ms. McLoughlin held financial management positions and was involved in strategic planning, the integration of several mergers and acquisitions, financial systems implementations and corporate reorganizations. Prior to joining Ryder, she spent six years in the South Florida Practice of Price Waterhouse (now PricewaterhouseCoopers). Ms. McLoughlin has a Bachelor of Arts degree in Economics from Wellesley College and a Master of Business Administration degree from Columbia University. |
| (5) | Ramakrishnan Chandrasekaran was appointed Group Chief Executive – Technology and Operations, effective February 6, 2012. In this role, Mr. Chandrasekaran is responsible for leading our solutions and delivery teams world-wide. From August 2006 to February 2012, he served as our President and Managing Director, Global Delivery, |
| President and Managing Director from January 2004 through July 2006. Prior to that, from November 1999 to January 2004, he served as our Senior Vice President responsible for |
| Rajeev Mehta was appointed Group Chief Executive – Industries and Markets, effective February 6, 2012. In this role, Mr. Mehta is responsible for leading our industry vertical and geographic market operations on a global basis. From August 2006 to February 2012, he served as our Chief Operating Officer, Global Client Services, |
| Malcolm Frank was appointed Executive Vice President, Strategy and Marketing, effective February 6, 2012. In this role, Mr. Frank is responsible for shaping our corporate strategy and global. Mr. Frank served as our Senior Vice President of Strategy and Marketing from August 2005 to February 2012. In both these roles, Mr. Frank’s responsibilities have included, and continue to include, directing all aspects of our corporate marketing function, including strategy and branding, industry and media relations, corporate communications and corporate marketing. From August 2005 until June 2009, Mr. Frank was also responsible for leading our field marketing function. Prior to joining Cognizant in August 2005, Mr. Frank was co-founder, President and Chief Executive Officer of CXO Systems, Inc., an independent software vendor providing dashboard solutions for senior managers, from March 2002 to July 2005. From June 1999 to September 2002, Mr. Frank was the founder, President, Chief Executive Officer and Chairman of Nervewire Inc. (“Nervewire”), a management consulting and systems integration firm. Prior to founding Nervewire, Mr. Frank was a co-founder, executive officer, and Senior Vice President at Cambridge Technology Partners, where he ran Worldwide Marketing, Business Development, and several business units, from January 1990 to June 1999. Mr. Frank graduated from Yale University with a degree in Economics. |
| (8) | Steven Schwartz was named Senior Vice President, General Counsel and Secretary in July 2007, having global responsibility for managing Cognizant’s legal function. Mr. Schwartz, who joined Cognizant in 2001, most recently served as Vice President and General Counsel, a position he held from March 2003 to July 2007. From April 2002 to March 2003, he served as our Vice President and Chief Corporate Counsel. From October 2001 to December 2002, he served as our Chief Corporate Counsel. Mr. Schwartz also serves as our Chief Legal Officer. Mr. Schwartz serves on the board of directors of Information Technology Industry |
None of our executive officers are related to any other executive officer or to any of our Directors. Our executive officers are elected annually by the Board of Directors and serve until their successors are duly elected and qualified.
Corporate History
We began our IT development and maintenance services business in early 1994, as an in-house technology development center for The Dun & Bradstreet Corporation and its operating units. In 1996, we, along with
certain other entities, were spun-off from The Dun & Bradstreet Corporation to form a new company, Cognizant Corporation. On June 24, 1998, we completed an initial public offering of our Class A common stock. On June 30, 1998, a majority interest in us, and certain other entities were spun-off from Cognizant Corporation to form IMS Health. Subsequently, Cognizant Corporation was renamed Nielsen Media Research, Incorporated.
On January 30, 2003, we filed a tender offer in which IMS Health stockholders could exchange IMS Health shares held by them for our Class B common stock held by IMS Health. On February 13, 2003, IMS Health distributed all of our Class B common stock that IMS Health owned in an exchange offer to its stockholders. On February 21, 2003, pursuant to the terms of our Restated Certificate of Incorporation, all of the shares of Class B common stock automatically converted into shares of Class A common stock. Since February 21, 2003, there have been no outstanding shares of Class B common stock. Effective May 26, 2004, pursuant to our Certificate of Incorporation, there are no authorized shares of Class B common stock.
Available Information
We make available the following public filings with the Securities and Exchange Commission, or the SEC, free of charge through our website atwww.cognizant.com as soon as reasonably practicable after we electronically file such material with, or furnish such material to, the SEC:
our Annual Reports on Form 10-K and any amendments thereto;
our Quarterly Reports on Form 10-Q and any amendments thereto; and
our Current Reports on Form 8-K and any amendments thereto.
In addition, we make available our code of business conduct and ethics entitled “Cognizant’s Core Values and Standards of Business Conduct” free of charge through our website. We intend to disclose any amendments to, or waivers from, our code of business conduct and ethics that are required to be publicly disclosed pursuant to rules of the SEC and the NASDAQ Global Select Market by filing such amendment or waiver with the SEC and posting it on our website.
No information on our Internet website is incorporated by reference into this Form 10-K or any other public filing made by us with the SEC.
| Item 1A. | Risk Factors |
Factors That May Affect Future Results
In addition to the risks and uncertainties detaileddescribed elsewhere in this Annual Report on Form 10-K, if any of the following risks occur, our business, financial condition, results of operations or prospects could be materially adversely affected. In such case, the trading price of our common stock could decline.
Our global operations are subject to complex risks, some of which might be beyond our control.
We have offices and operations in various countries around the world and provide services to clients globally. In 2010,2012, approximately 78.0%79.4% of our revenues were attributable to the North American region, 18.6%16.3% were attributable to the European region, and 3.4%4.3% were attributable to the rest of the world, primarily the Asia Pacific region. If we are unable to manage the risks of our global operations, including regulatory, economic, political and other uncertainties in India, fluctuations in foreign exchange and inflation rates, international hostilities, terrorism, natural disasters, and multiple legal and regulatory systems, our results of operations could be adversely affected.
A substantial portion of our assets and operations are located in India and we are subject to regulatory, economic, political and other uncertainties in India.
We intend to continue to develop and expand our offshore facilities in India where a majority of our technical professionals are located. While wage costs are lower in India than in the United States and other
developed countries for comparably skilled professionals, wages in India have historically increased at a faster rate than in the United States.States and other countries in which we operate. If this trend continues in the future, it would result in increased costs for our skilled professionals and thereby potentially reduce our operating margins. Also, there is no assurance that, in future periods, competition for skilled professionals will not drive salaries higher in India, thereby resulting in increased costs for our technical professionals and reduced operating margins.
India has also recently experienced civil unrest and terrorism and has been involved in conflicts with neighboring countries. In recent years, there have been military confrontations between India and Pakistan that have occurred in the region of Kashmir and along the India-Pakistan border. The potential for hostilities between the two countries has been high in light of tensions related to recent terrorist incidents in India and the unsettled nature of the regional geopolitical environment, including events in and related to Afghanistan and Iraq. If India becomes engaged in armed hostilities, particularly if these hostilities are protracted or involve the threat of or use of weapons of mass destruction, it is likely that our operations would be materially adversely affected. In addition, companies may decline to contract with us for services in light of international terrorist incidents or armed hostilities, even where India is not involved, because of more generalized concerns about relying on a service provider utilizing international resources that may be viewed as less stable than those provided domestically.
In the past, the Indian economy has experienced many of the problems that commonly confront the economies of developing countries, including high inflation, erratic gross domestic product growth and shortages of foreign exchange. The Indian government has exercised, and continues to exercise, significant influence over many aspects of the Indian economy and Indian government actions concerning the economy could have a material adverse effect on private sector entities like us. In the past, the Indian government has provided significant tax incentives and relaxed certain regulatory restrictions in order to encourage foreign investment in specified sectors of the economy, including the software development services industry. Programs that have benefited us include, among others, tax holidays, liberalized import and export duties and preferential rules on foreign investment and repatriation. Notwithstanding these benefits, as noted above, India’s central and state governments remain significantly involved in the Indian economy as regulators. In recent years, the Indian government has introduced non-income related taxes, including the fringe benefit tax (which was repealed as of April 1, 2009) and new service taxes, and income-related taxes,
including the Minimum Alternative Tax.Tax, or MAT. In addition, a change in government leadership in India or a change in policies of the existing government in India that results in the elimination of any of the benefits realized by us from our Indian operations or the imposition of new taxes applicable to such operations could have a material adverse effect on our business, results of operations and financial condition.
In addition, the emergence of a widespread health emergency or pandemic, which may be more difficult to prevent or contain in a country like India as compared to more developed countries, could create economic or financial disruption that could negatively affect our revenue and operations or impair our ability to manage our business in certain parts of the world.
Our international sales and operations are subject to many uncertainties.
Revenues from customers outside North America represented approximately 22.0%20.6% of our revenues for the year ended December 31, 2010.2012. We anticipate that revenues from customers outside North America will continue to account for a material portion of our revenues in the foreseeable future and may increase as we expand our international presence, particularly in Europe, the Asia Pacific region and the Latin America region. In addition, the majority of our employees, along with our development and delivery centers, are located in India. As a result, we may be subject to risks inherently associated with international operations, including risks associated with foreign currency exchange rate fluctuations, which may cause volatility in our reported income, and risks associated with the application and imposition of protective legislation and regulations relating to import or export or otherwise resulting from foreign policy or the variability of foreign economic conditions. From time to time, we may engage in hedging transactions to mitigate our risks relating to exchange rate fluctuations. The use
of hedging contracts is intended to mitigate or reduce transactional level volatility in the results of our foreign operations, but does not completely eliminate volatility and risk. In addition, use of hedging contracts includes the risk of non-performance by the counterparty. Additional risks associated with international operations include difficulties in enforcing intellectual property and/or contractual rights, the burdens of complying with a wide variety of foreign laws, potentially adverse tax consequences, tariffs, quotas and other barriers and potential difficulties in collecting accounts receivable. In addition, we may face competition in other countries from companies that may have more experience with operations in such countries or with international operations. Additionally, such companies may have long-standing or well-established relationships with local officials and/or desired clients, which may put us at a competitive disadvantage. We may also face difficulties integrating new facilities in different countries into our existing operations, as well as integrating employees that we hire in different countries into our existing corporate culture. Our international expansion plans may not be successful and we may not be able to compete effectively in other countries. There can be no assurance that these and other factors will not impede the success of our international expansion plans, limit our ability to compete effectively in other countries or otherwise have a material adverse effect on our business, results of operations and financial condition.
Our operating results may be adversely affected by fluctuations in the Indian rupee and other foreign currency exchange rates and restrictions on the deployment of cash across our global operations.
Although we report our operating results in U.S. dollars, a portion of our revenues and expenses are denominated in currencies other than the U.S. dollar. Fluctuations in foreign currency exchange rates can have a number of adverse effects on us. Because our consolidated financial statements are presented in U.S. dollars, we must translate revenues, expenses and income, as well as assets and liabilities, into U.S. dollars at exchange rates in effect during or at the end of each reporting period. Therefore, changes in the value of the U.S. dollar against other currencies will affect our revenues, income from operations, other income (expense), net and the value of balance sheet items originally denominated in other currencies. There is no guarantee that our financial results will not be adversely affected by currency exchange rate fluctuations or that any efforts by us to engage in currency hedging activities will be effective. In addition, in some countries we could be subject to strict restrictions on the movement of cash and the exchange of foreign currencies, which could limit our ability to use this cashthese funds across our global operations. Finally, as we continue to leverage our global delivery model, more of
our expenses are incurred in currencies other than those in which we bill for the related services. An increase in the value of certain currencies, such as the Indian rupee, against the U.S. dollar could increase costs for delivery of services at offshore sites by increasing labor and other costs that are denominated in local currency.
Our operating results may be adversely affected by our use of derivative financial instruments.
We have entered into a series of foreign exchange forward contracts that are designated as cash flow hedges of certain salaryrupee denominated payments in India. These contracts are intended to partially offset the impact of the movement of the exchange rates on future operating costs. In addition, we also entered into foreign exchange forward contracts in order to mitigate foreign currency risk on Indian rupee denominated net monetary assets. The hedging strategies that we have implemented, or may in the future implement, to mitigate foreign currency exchange rate risks may not reduce or completely offset our exposure to foreign exchange rate fluctuations and may expose our business to unexpected market, operational and counterparty credit risks. Accordingly, we may incur losses from our use of derivative financial instruments that could have a material adverse effect on our business, results of operations and financial condition.
Our global operations expose us to numerous and sometimes conflicting legal and regulatory requirements, and violations of these regulations could harm our business.
Because we provide services to clients throughout the world, we are subject to numerous, and sometimes conflicting, legal rules on matters as diverse as import/export controls, content requirements, trade restrictions, tariffs, taxation, sanctions, government affairs, internal and disclosure control obligations, data privacy and labor
relations. Violations of these laws or regulations in the conduct of our business could result in fines, criminal sanctions against us or our officers, prohibitions on doing business, damage to our reputation and other unintended consequences such as liability for monetary damages, fines and/or criminal prosecution, unfavorable publicity, restrictions on our ability to process information and allegations by our clients that we have not performed our contractual obligations. Due to the varying degrees of development of the legal systems of the countries in which we operate, local laws might be insufficient to protect our rights. Our failure to comply with applicable legal and regulatory requirements could have a material adverse effect on our business, results of operations and financial condition.
Among other anti-corruption laws and regulations, including the U.K. Bribery Act, we are subject to the United States Foreign Corrupt Practices Act, or FCPA, which prohibits improper payments or offers of improper payments to foreign officials to obtain business or any other benefit. The FCPA also requires covered companies to make and keep books and records that accurately and fairly reflect the transactions of the company and to devise and maintain an adequate system of internal accounting controls. In many parts of the world, including countries in which we operate, practices in the local business community might not conform to international business standards and could violate these anti-corruption laws or regulations, including the U.S. Foreign Corrupt Practices Act.regulations. Although we have policies and procedures in place that are designed to promote legal and regulatory compliance, our employees, subcontractors and agents could take actions that violate these policies or procedures or applicable anti-corruption laws or regulations. Furthermore, the U.S. government may seek to hold us liable for successor liability FCPA violations committed by companies in which we invest or that we acquire. Violations of these laws or regulations could subject us to criminal or civil enforcement actions, including fines and suspension or disqualification from government contracting or contracting with private entities in certain highly regulated industries, any of which could have a material adverse effect on our business.
International hostilities, terrorist activities, other violence or war, natural disasters, pandemics and infrastructure disruptions, could delay or reduce the number of new service orders we receive and impair our ability to service our customers, thereby adversely affecting our business, financial condition and results of operations.
Hostilities involving the United States and acts of terrorism, violence or war, such as the attacks of September 11, 2001 in the United States, the attacks of July 7, 2005 in the United Kingdom, the attacks of
November 26, 2008 and July 13, 2011 in Mumbai, India, and the continuing conflict in Iraqthe Middle East and Afghanistan, natural disasters, global health risks or pandemics or the threat or perceived potential for these events could materially adversely affect our operations and our ability to provide services to our customers. Such events may cause customers to delay their decisions on spending for information technology, consulting, and business and knowledge process outsourcing services and give rise to sudden significant changes in regional and global economic conditions and cycles. These events also pose significant risks to our people and to physical facilities and operations around the world, whether the facilities are ours or those of our clients, which could affect our financial results. By disrupting communications and travel, giving rise to travel restrictions, and increasing the difficulty of obtaining and retaining highly-skilled and qualified personnel, these events could make it difficult or impossible for us to deliver services to some or all of our clients. As noted above, the majority of our technical professionals are located in India, and the vast majority of our technical professionals in the United States and Europe are Indian nationals who are able to work in the United States and Europe only because they hold current visas and work permits. Travel restrictions could cause us to incur additional unexpected labor costs and expenses or could restrain our ability to retain the skilled professionals we need for our operations. In addition, any extended disruptions of electricity, other public utilities or network services at our facilities, as well as system failures at, or security breaches in, our facilities or systems, could also adversely affect our ability to serve our clients.
Although we continue to believe that we have a strong competitive position in the United States, we continue to increase our efforts to geographically diversify our clients and revenue. Despite our efforts to diversify, hostilities involving the United States, the United Kingdom, India and other countries in which we provide services to our clients, and other acts of terrorism, violence or war, natural disasters, global health risks or pandemics may reduce the demand for our services and negatively affect our revenues and profitability. While we plan and prepare to defend against each of these occurrences, we might be unable to protect our people, facilities and systems against all such occurrences. If these disruptions prevent us from effectively serving our clients, our operating results could be adversely affected.
Anti-outsourcing legislation, if adopted, and negative perceptions associated with offshore outsourcing could adversely affect our business, financial condition and results of operations and impair our ability to service our customers.
The issue of companies outsourcing services to organizations operating in other countries is a topic of political discussion in many countries, including the United States, which is our largest market. For example, measures aimed at limiting or restricting outsourcing by United States companies are periodically considered in the U.S. Congress and in numerous state legislatures to address concerns over the perceived association between offshore outsourcing and the loss of jobs domestically. On August 13, 2010, President Barack Obama signed Public Law 111-230,legislation which contained provisions to imposeimposed additional fees of $2,000 for certain H-1B petitions and $2,250 for certain L-1A and L-1B petitions beginning in August 2010 through September 20, 2014. These fees were later extended through September 20, 2015 in Public Law 111-347. In 2010, Senators Richard Durbin (D-Illinois) and Charles Grassley (R-Iowa) introduced a bill that would, if enacted, further and severely restrict the use of certain temporary business visas.2015. Given the ongoing debate over this issue,outsourcing, the introduction and consideration of other restrictive legislation or regulations is possible. If enacted, such measures may: broaden existing restrictions on outsourcing by federal and state government agencies and on government contracts with firms that outsource services directly or indirectly, or impact private industry with measures such asthat include, but are not limited to, tax disincentives, and/fees or penalties, or intellectual property transfer restrictions, and/or restrictmandatory government audit requirements, and new standards that have the effect of restricting the use of certain business and/or work visas. In the event that any of these measures become law, our business, results of operations and financial condition could be adversely affected and our ability to provide services to our customers could be impaired.
In addition, from time to time, there has been publicity about negative experiences associated with offshore outsourcing, such as domestic job loss, and theft and misappropriation of sensitive client data, particularly involving service providers in India. Current or prospective clients may elect to perform certain services themselves or may be discouraged from transferring services from onshore to offshoreutilizing global service delivery providers due to negative perceptions that may be associated with using an offshore provider.global service delivery models or firms. Any slowdown or reversal of existing
industry trends toward offshore outsourcingglobal service delivery would seriously harm our ability to compete effectively with competitors that provide the majority of their services from within the country in which our clients operate.
LegislationExisting and future legislative and administrative/regulatory policies enacted in certain European jurisdictions and any future legislation/regulation in Europe, countries within the Asia Pacific region or any other country in which we have clients restricting the performance of business process services from an offshore location in jurisdictions in Europe, the Asia Pacific, or any other region in which we have clients could also have a material adverse effect on our business, results of operations and financial condition. For example, legislation enacted in the United Kingdom, based on the 1977 EC Acquired Rights Directive, has been adopted in some form by many European Union, or EU, countries, and provides that if a company outsources all or part of its business to a service provider or changes its current service provider, the affected employees of the company or of the previous service provider are entitled to become employees of the new service provider, generally on the same terms and conditions as their original employment. In addition, dismissals of employees who were employed by the company or the previous service provider immediately prior to that transfer are automatically considered unfair dismissals that entitle such employees to compensation. As a result, in order to avoid unfair dismissal claims, we may have to offer, and become liable for, voluntary redundancy payments to the employees of our clients who outsource business to us in the United Kingdom and other EU countries whothat have adopted similar laws. These types of policies may materially affect our ability to obtain new business from companies in the United Kingdom and EU and to provide outsourced services to companies in the United Kingdom and EU in a cost-effective manner.
Our growth may be hindered by immigration restrictions.
Our future success willcontinues to depend on our ability to attract and retain employees with technical and project management skills, including those from developing countries, especially India. The vast majority of our professionals in the United States and in Europe are Indian nationals. The ability of Indianforeign nationals to work in the United States and Europe depends on their ability and our ability to obtain the necessary visas and work permits.
The H-1B visa classification enables United States employers to hire certain qualified foreign workers in positions that require an education at least equal to a four-year bachelor degree in the United States in specialty occupations such as IT systems engineering and computer systems analysis. The H-1B visa usually permits an individual to work and live in the United States for a period of up to six years. Under certain limited circumstances, H-1B visa extensions after the six-year period may be available. There is a limit on the number of new H-1B petitions that the United States Citizenship and Immigration Services, or CIS, one of the successor agencies to the Immigration and Naturalization Service, may approve in any federal fiscal year, and in years in which this limit is reached, we may be unable to obtain H-1B visas necessary to bring foreign employees to the United States. Currently, the limit is 65,000 for holders of United States or United States-equivalent bachelor degrees (the general cap), and an additional 20,000 for holders of advanced degrees from United States post-secondary educational institutions. We began filingCIS announced on June 11, 2012 that the agency had reached its general cap of 65,000 H-1B petitions with CIS againstvisas, and on June 7, 2012 that the fiscal year 2011 caps beginning April 1, 2010 for work in H-1B status beginning on October 1, 2011. On January 21, 2011 CISagency had reached its advanced degree cap of 20,000 H-1B visas for the fiscal year 2011, and on January 27, 2011, CIS reached its general cap for fiscal year 2011.(FY) 2013. We plan towill begin filing H-1B petitions with CIS against the fiscal year 2012(FY) 2014 caps beginning April 1, 20112013 for work in H-1B status beginning on October 1, 2011.2013. As part of our advanced planning process, we believe that we have a sufficient number of employees visa-readywho are work permit-ready to meet our anticipated business growth in the current year. In addition, there are strict labor regulations associated with the H-1B visa classification. Larger users of the H-1B visa program, like us, face additional/higher legal and regulatory standards, and are often subject to investigations by the Wage and Hour Division of the United States Department of Labor. A findingLabor (DOL) and unannounced random site inspections by CIS’s parent agency, the United States Department of LaborHomeland Security (DHS). A finding by DOL, DHS, and/ or another governmental agency of willful or substantial failure to comply with existing regulations on the H-1B classification may result in back-pay liability, substantial fines, and/or a ban on future use of the H-1B program andand/ or other immigration benefits.
We also regularly transfer employees from Indiaforeign professionals to the United States to work, including work on projects at client sites, using the L-1 visa classification. The L-1 visa allows companiesCompanies abroad are allowed to transfer certain managers and
executives through the L-1A visa, and employees with specialized company knowledge through the L-1B visa to related United States companies, such as a parent, subsidiary, affiliate, joint venture, or branch office. We have an approved “Blanket L Program,”L” petition, under which the corporate relationships of our transferring and receiving entities have been pre-approved by CIS, thus enabling individual L-1 visa applications to be presented directly to a visa-issuing United States consular post abroad rather than undergoing a pre-approval process through CIS in the United States. In recent years, both the United States consular posts in India that review initial L-1 applications and CIS, which adjudicates individual petitions for initial grants and extensions of L-1 visa status, have become increasingly restrictive with respect to this category.category, particularly the L-1B “specialized knowledge” standard. As a result, the rate of refusals of initial individual L-1 petitions and extensions for Indian nationals has increased. In addition, even where L-1 visas are ultimately granted and issued, security measures undertaken by United States consular posts around the world have delayed or prevented visa issuances. Our inability to bring qualified technical personnel into the United States to staff on-site customer locations would have a material adverse effect on our business, results of operations and financial condition.
Pursuant to the L-1 Visa Reform Act, which became effective in June 2005, there arewe must meet a number of restrictions and requirements that must be met in order for us to obtain L-1 visas for our personnel. Under one provision of the L-1 Visa Reform Act,For example, all L-1 applicants, including those brought to the United States under a Blanket L Program, must have worked abroad with the related company for one full year in the prior three years. In addition, L-1B “specialized knowledge” visa holders (intracompany transferees with specialized company knowledge) may not be primarily stationed at the work site of another employer if the L-1B visa holder will be principally controlled and supervised by an employer other than the petitioning employer. Finally, L-1B status may not be granted where placement of the L-1B visa holder at a third party site is part of an arrangement to provide labor for the third party, rather than placement at the site in connection with the provision of a product or service involving specialized knowledge specific to the petitioning employer.
We do not place L-1B workers at third party sites where they are under the primary supervision of a different employer, nor do we place L-1B workers at third party sites in an arrangement to provide labor for the third party without providing a service involving our workers’ specialized knowledge. Since implementation of the L-1
Visa Reform Act, we consistently have established this fact to CIS’s satisfaction. However, if CIS and/or the United States Department of State, through its visa-issuing consular posts abroad, decide to interpret these provisions in a very restrictive fashion, this could impair our ability to effectively staff our projects in the United States with resourcespersonnel from our entities abroad. In addition, CIS has not yet issued regulationsNew guidance governing these and related statutory provisions. Ifprovisions from CIS is anticipated, and if such regulations areguidance is restrictive in nature, our ability to staff our projects in the United States with resourcespersonnel from our entities abroad will be impaired.
We also process immigrant visas for lawful permanent residence (Green Cards) in the United States for employees to fill positions for which there are an insufficient number of able, willing, and qualified United States workers available to fill the positions. Compliance with existing United States immigration and labor laws, or changes in those laws, and/ or increase in governmental scrutiny, making it more difficult to hire foreign nationals or limiting our ability to successfully obtain permanent residence for our foreign employees in the United States, could require us to incur additional unexpected labor and/ or other costs and expenses, and/ or could restrain our ability to retain the skilled professionals we need for our operations in the United States. Any of these restrictions or limitations on our hiring practices could have a material adverse effect on our business, results of operations and financial condition.
In addition to immigration restrictions in the United States, there are certain restrictions on transferring employees to work in the United Kingdom, where we have experienced significant growth. The United Kingdom currently requires that all employees who are not nationals of European Union countries (plus nationals of Bulgaria and Romania), or EEA nationals, obtain work permission before obtaining a visa/entry clearance to travel to the United Kingdom. European nations such as Hungary, Poland, Lithuania, Slovakia, and the Czech Republic do not have a work permit requirement but employees need to register to work within 30 days of arrival. On November 27, 2008, theThe United Kingdom introducedhas a points-based system under which certain certificates of sponsorship are issued by licensed employer sponsors, provided the employees they seek to employ in the United Kingdom can
accumulate a certain number of points based on certain attributes. Where the employee has not worked for a Cognizant group company outside the United Kingdom for at least 6 months, we will need tomust carry out a resident labor market test to confirm that the intended role cannot be filled by an EEA national. We are currently an A-rated sponsor and were allocated certificates of sponsorship which we believe are sufficient to meet our current and expected demand for transfers to the United Kingdom. On November 23, 2010, the United Kingdom announced new restrictions to control annual net migration, but allowed for temporary intra-company transfers of employees from outside the European Economic Area for up to five years as long as the employees meet certain compensation requirements.
Immigration and work permit laws and regulations in the United States, the United Kingdom, the EU, Switzerland and other countries are subject to legislative and administrative changes as well as changes in the application of standards and enforcement. Immigration and work permit laws and regulations can be significantly affected by political forces and levels of economic activity. Our international expansion strategy and our business, results of operations, and financial condition may be materially adversely affected if changes in immigration and work permit laws and regulations or the administration or enforcement of such laws or regulations impair our ability to staff projects with professionals who are not citizens of the country where the work is to be performed.
Our revenues are highly dependent on clients primarily located in the United States and Europe, as well as on clients concentrated in certain industries, including the financial services industry. Continuing or worsening economic conditions or factors that negatively affect the economic health of the United States, Europe or these industries may adversely affect our business.
Approximately 78.0%79.4% of our revenues during the year ended December 31, 20102012 were derived from customers located in North America. In the same period, approximately 18.6%16.3% of our revenues were derived from customers located in Europe. If the United States or European economy continues to weaken or slow and conditions in the financial markets continue to deteriorate, pricing for our services may be depressed and our customers may reduce or postpone their technology spending significantly, which may in turn lower the demand
for our services and negatively affect our revenues and profitability. Additionally, any prolonged recession in the United States and Europe could have an adverse impact on our revenues because a large portion of our revenues are primarily derived from the United States and Europe. In addition, during the year ended December 31, 2010,2012, we earned approximately 42.4%41.3% of our revenues from the financial services industry, which includes insurance. A deteriorationDeterioration in the financial services industry andor significant consolidation in that industry, or a decrease in growth or consolidation in other industry segments on which we focus, may reduce the demand for our services and negatively affect our revenues and profitability. In addition, if we are unable to successfully anticipate changing economic and political conditions affecting the industries and markets in which we operate, we may be unable to effectively plan for or respond to those changes, and our business could be negatively affected.
We face intense competition from other service providers.
We operate in intensely competitive industries that experience rapid technological developments, changes in industry standards, and changes in customer requirements. The intensely competitive information technology, consulting and business process outsourcing professional services markets include a large number of participants and are subject to rapid change. These markets include participants from a variety of market segments, including:
systems integration firms;
contract programming companies;
application software companies;
internet solutions providers;
large or traditional consulting companies;
professional services groups of computer equipment companies; and
infrastructure management and outsourcing companies.
These markets also include numerous smaller local competitors in the various geographic markets in which we operate which may be able to provide services and solutions at lower costs or on terms more attractive to clients than we can. Our direct competitors include, among others, Accenture, Capgemini, Computer Sciences Corporation, Genpact, HCL Technologies, HP Enterprise (formerly Electronic Data Systems), IBM Global Services, Infosys Technologies, Perot Systems (acquired by Dell Inc.), Tata Consultancy Services and Wipro. Many of our competitors have significantly greater financial, technical and marketing resources and greater name recognition and, therefore, may be better able to compete for new work and skilled professionals. There is a risk that increased competition could put downward pressure on the prices we can charge for our services and on our operating margins. Similarly, if our competitors develop and implement methodologies that yield greater efficiency and productivity, they may be able to offer services similar to ours at lower prices without adversely affecting their profit margins. Even if our offerings address industry and client needs, our competitors may be more successful at selling their services. If we are unable to provide our clients with superior services and solutions at competitive prices or successfully market those services to current and prospective clients, our results of operations may suffer. Further, a client may choose to use its own internal resources rather than engage an outside firm to perform the types of services we provide. We cannot be certain that we will be able to sustain our current levels of profitability or growth in the face of competitive pressures, including competition for skilled technology professionals and pricing pressure from competitors employing an on-site/offshore business model.
In addition, we may face competition from companies that increase in size or scope as the result of strategic mergers or acquisitions. These transactions may include consolidation activity among hardware manufacturers, software companies and vendors, and service providers. The result of any such vertical integration may be greater integration of products and services that were once offered separately by independent vendors. Our access to such products and services may be reduced as a result of such an industry trend, which could adversely affect our competitive position. These types of events could have a variety of negative effects on our competitive position and our financial results, such as reducing our revenue, increasing our costs, lowering our gross margin percentage, and requiring us to recognize impairments on our assets.
We may not be able to sustain our current level of profitability.
For the year ended December 31, 2010,2012, we reported an operating margin of 18.8%18.5%. Our operating margin may decline if we experience declines in demand and pricing for our services, an increase in our operating costs, including imposition of new non-income related taxes, or due to adverse fluctuations in foreign currency exchange rates. In addition, historically, wages in India have increased at a faster rate than in the United States. Additionally, the number and type of equity-based compensation awards and the assumptions used in valuing equity-based compensation awards may change resulting in increased stock-based compensation expense and lower margins. Although we have historically been able to partially offset wage increases and foreign currency fluctuations through further leveraging the scale of our operating structure, obtaining price increases, and issuing a lower number of stock-based compensation awards in proportion to our overall headcount, we cannot be sure that we will be able to continue to do so in the future.
Our profitability could suffer if we are not able to control our costs.costs or improve our efficiency.
Our ability to control our costs and improve our efficiency affects our profitability. If we are unable to control our costs or improve our efficiency, our profitability could be negatively affected.
Our business will suffer if we fail to develop new services and enhance our existing services in order to keep pace with the rapidly evolving technological environment.
The information technology, consulting and business process outsourcing professional services markets are characterized by rapid technological change, evolving industry standards, changing customer preferences and
new product and service introductions. Our future success will depend on our ability to develop solutions that keep pace with changes in the markets in which we provide services. We cannot be sure that we will be successful in developing new services addressing evolving technologies in a timely or cost-effective manner or, if these services are developed, that we will be successful in the marketplace. In addition, we cannot be sure that products, services or technologies developed by others will not render our services non-competitive or obsolete. Our failure to address the demands of the rapidly evolving technological environment could have a material adverse effect on our business, results of operations and financial condition.
Our ability to remain competitive will also depend on our ability to design and implement, in a timely and cost-effective manner, solutions for customers that both leverage their legacy systems and appropriately utilize newer technologies such as cloud-based services, Web 2.0 models, software-as-a-service, and service oriented architectures.software-as-a-service. Our failure to design and implement solutions in a timely and cost-effective manner could have a material adverse effect on our business, results of operations and financial condition.
We may face difficulties in providing end-to-end business solutions or delivering complex and large projects for our clients that could cause clients to discontinue their work with us, which in turn could harm our business.
We have been expanding the nature and scope of our engagements and have added new service offerings, such as IT consulting, business and knowledge process outsourcing, systems integration and outsourcing of entire portions of IT infrastructure. The success of these service offerings is dependent, in part, upon continued demand for such services by our existing, new and prospective clients and our ability to meet this demand in a cost-competitive and effective manner. In addition, our ability to effectively offer a wider breadth of end-to-end business solutions depends on our ability to attract existing or new clients to these service offerings. To obtain engagements for such end-to-end solutions, we also are more likely to compete with large, well-established international consulting firms, resulting in increased competition and marketing costs. Accordingly, we cannot be certain that our new service offerings will effectively meet client needs or that we will be able to attract existing and new clients to these service offerings.
The increased breadth of our service offerings may result in larger and more complex projects with our clients. This will require us to establish closer relationships with our clients and a thorough understanding of their
operations. Our ability to establish such relationships will depend on a number of factors, including the proficiency of our professionals and our management personnel. Our failure to understand our client requirements or our failure to deliver services that meet the requirements specified by our clients could result in termination of client contracts, and we could be liable to our clients for significant penalties or damages.
Larger projects may involve multiple engagements or stages, and there is a risk that a client may choose not to retain us for additional stages or may cancel or delay additional planned engagements. These terminations, cancellations or delays may result from factors that have little or nothing to do with the quality of our services, such as the business or financial condition of our clients or the economy generally. Such cancellations or delays make it difficult to plan for project resource requirements and inaccuracies in such resource planning and allocation may have a negative impact on our profitability.
If our clients are not satisfied with our services, our business could be adversely affected.
Our business model depends in large part on our ability to attract additional work from our base of existing clients. Our business model also depends on relationships our account teamsteams’ ability to develop relationships with our clients so that we canenable us to understand our clients’ needs and deliver solutions and services that are tailored to those needs. If a client is not satisfied with the quality of work performed by us, or with the type of services or solutions delivered, then we could incur additional costs to address the situation, the profitability of that work might be impaired, and the client’s dissatisfaction with our services could damage our ability to obtain additional work from that client. In particular, clients that are not satisfied might seek to terminate existing contracts prior to their
scheduled expiration date and could direct future business to our competitors. In addition, negative publicity related to our client services or relationships, regardless of its accuracy, may further damage our business by affecting our ability to compete for new contracts with current and prospective clients.
We rely on a few customers for a large portion of our revenues.
Our top five and top ten customers generated approximately 17.9%14.0% and 25.0%, respectively, of our revenues for the year ended December 31, 2010.2012. The volume of work performed for specific customers is likely to vary from year to year, and a major customer in one year may not use our services in a subsequent year. The loss of one of our large customers could have a material adverse effect on our business, results of operations and financial condition.
We generally do not have long-term contracts with our customers and our results of operations could be adversely affected if our clients terminate their contracts with us on short notice.
Consistent with industry practice, we generally do not enter into long-term contracts with our customers. A majority of our contracts can be terminated by our clients with short notice and without significant early termination cost. Terminations may result from factors that are beyond our control and unrelated to our work product or the progress of the project, including the business or financial conditions of the client, changes in ownership or management at our clients, changes in client strategies or the economy or markets generally. When contracts are terminated, we lose the anticipated revenues and might not be able to eliminate our associated costs in a timely manner. Consequently, our profit margins in subsequent periods could be lower than expected. If we are unable to replace the lost revenue with other work on terms we find acceptable or effectively eliminate costs, we may not be able to maintain our level of profitability.
Our results of operations may be affected by the rate of growth in the use of technology in business and the type and level of technology spending by our clients.
Our business depends, in part, upon continued growth in the use of technology in business by our clients and prospective clients as well as their customers and suppliers. In challenging economic environments, our clients may reduce or defer their spending on new technologies in order to focus on other priorities. At the same time, many companies have already invested substantial resources in their current means of conducting commerce and
exchanging information, and they may be reluctant or slow to adopt new approaches that could disrupt existing personnel, processes and infrastructures. If the growth of technology usage in business, or our clients’ spending on technology in business, declines, or if we cannot convince our clients or potential clients to embrace new technological solutions, our results of operations could be adversely affected.
If we are unable to collect our receivables from, or bill our unbilled services to, our clients, our results of operations and cash flows could be adversely affected.
Our business depends on our ability to successfully obtain payment from our clients of the amounts they owe us for work performed. We evaluate the financial condition of our clients and usually bill and collect on relatively short cycles. We maintain allowances against receivables and unbilled services. Actual losses on client balances could differ from those that we currently anticipate and, as a result, we might need to adjust our allowances. There is no guarantee that we will accurately assess the creditworthiness of our clients. Macroeconomic conditions, such as the continued credit crisis and related turmoil in the global financial system, could also result in financial difficulties, including limited access to the credit markets, insolvency or bankruptcy, for our clients, and, as a result, could cause clients to delay payments to us, request modifications to their payment arrangements that could increase our receivables balance, or default on their payment obligations to us. Timely collection of client balances also depends on our ability to complete our contractual commitments and bill and collect our contracted revenues. If we are unable to meet our contractual requirements, we might experience delays in collection of and/or be unable to collect our client balances, and if this occurs, our results of
operations and cash flows could be adversely affected. In addition, if we experience an increase in the time to bill and collect for our services, our cash flows could be adversely affected.
We are investing substantial cash in new facilities and physical infrastructure, and our profitability could be reduced if our business does not grow proportionately.
We have made and continue to make significant contractual commitments related to capital expenditures on construction or expansion of our development and delivery centers. We may encounter cost overruns or project delays in connection with new facilities. These expansions will likely increase our fixed costs and if we are unable to grow our business and revenues proportionately, our profitability may be reduced.
Competition for highly-skilled technical personnel is intense and the success of our business depends on our ability to attract and retain highly-skilled professionals.
Our future success will depend to a significant extent on our ability to attract, train and retain highly-skilled professionals so as to keep our supply of skills and resources in balance with client demand. In particular, we must attract, train and retain appropriate numbers of talented people, including project managers, IT engineers and other senior technical personnel, with diverse skills in order to serve client needs and grow our business. We are particularly dependent on retaining our senior executives and other experienced managers with the skill sets required by our business, and if we are unable to do so, our ability to develop new business and effectively lead our current projects could be jeopardized. Similarly, the profitability of our business model depends on our ability to effectively utilize personnel with the right mix of skills and experience to support our projects. The processes and costs associated with recruiting, training and retaining employees place significant demands on our resources.
We believe there is a shortage of, and significant competition for, professionals with the advanced technological skills necessary to perform the services we offer. We have subcontracted to a limited extent in the past, and may do so in the future, with other service providers in order to meet our obligations to our customers. Our ability to maintain and renew existing engagements and obtain new business will depend, in large part, on our ability to attract, train and retain technical personnel with the skills that keep pace with continuing changes in information technology, evolving industry standards and changing customer preferences. Further, we must train and manage our growing work force, requiring an increase in the level of responsibility for both existing and new
management personnel. We cannot guarantee that the management skills and systems currently in place will be adequate or that we will be able to train and assimilate new employees successfully. Our profits and ability to compete for and manage client engagements could be adversely affected if we cannot manage employee hiring and attrition to achieve a stable and efficient workforce structure.
Our ability to operate and compete effectively could be impaired if we lose key personnel or if we cannot attract additional qualified personnel.
Our future performance depends to a significant degree upon the continued service of the key members of our management team, as well as marketing, sales and technical personnel, and our ability to attract and retain new management and other personnel. We do not maintain key man life insurance on any of our executive officers or significant employees. Competition for personnel is intense, and there can be no assurance that we will be able to retain our key employees or that we will be successful in attracting and retaining new personnel in the future. The loss of any one or more of our key personnel or the failure to attract and retain key personnel could have a material adverse effect on our business, results of operations and financial condition.
Restrictions in non-competition agreements with our executive officers may not be enforceable.
WeCurrently we have entered into non-competition agreements with the majority of our executive officers. We cannot be certain, however, that the restrictions in these agreements prohibiting such executive officers from
engaging in competitive activities are enforceable. Further, substantially all of our professional non-executive staff are not covered by agreements that would prohibit them from working for our competitors. If any of our key professional personnel leaves our employment and joins one of our competitors, our business could be adversely affected.
Our earnings may be adversely affected if we change our intent not to repatriate foreign earnings in India or if such earnings become subject to U.S. tax on a current basis.
Effective January 1, 2002, and in accordance with authoritative literature, we no longer accrue incremental U.S. taxes on allour Indian earnings recognized in 2002 and subsequent periodsafter 2001 as these earnings (as well as other foreign earnings for all periods) are considered to be indefinitely reinvested outside of the United States. While we have no plans to do so, events may occur in the future that could effectively force us to change our intent not to repatriate our foreignsuch earnings. If we change our intent and repatriate such earnings, we will have to accrue the applicable amount of taxes associated with such earnings and pay taxes at a substantially higher rate than our effective income tax rate in 2010.2012. These increased taxes could have a material adverse effect on our business, results of operations and financial condition.
Our operating resultsearnings may be negatively impacted uponby the loss of certain tax benefits provided by India to companies in our industry as well as fromby proposed tax legislation in India.
Our Indian subsidiaries, are export-oriented companies which, under the Indian Income Tax Act of 1961, are entitledcollectively referred to claim tax holidays for a period of ten consecutive years for each Software Technology Park, or STP, with respect to export profits for each STP. Substantially all of the earnings of our Indian subsidiaries are attributable to export profits. The majority of our STPs inas Cognizant India, are currently entitled to a 100% exemption from Indian income tax. Under current Indian tax law, export profits after March 31, 2011 from our existing STPs will be fully taxable at the Indian statutory rate (which is currently 33.22%) in effect at such time. If the tax holidays relating to our Indian STPsprimarily export-oriented and are not extended or new tax incentives are not introduced that would effectively extend theeligible for certain income tax holiday benefits beyond March 31, 2011,granted by the Indian government for export activities conducted within Special Economic Zones, or SEZs, for periods of up to 15 years. Changes in Indian tax laws that would reduce or deny SEZ tax benefits could have a material adverse effect on our effectivebusiness, results of operations and financial condition. In addition, all Indian profits, including those generated within SEZs, are subject to the MAT, at the current rate of approximately 20.0%. Any MAT paid is creditable against future corporate income tax, rate will increase significantly beginningsubject to limitations. Currently, we anticipate utilizing our existing MAT balances against future corporate income tax. Our ability to fully do so may be influenced by possible changes to the Indian tax laws as well as the future financial results of Cognizant India. Our inability to fully utilize our deferred income tax assets related to the MAT could have a material adverse effect on our business, results of operations and financial condition.
Our earnings and financial condition may be negatively impacted by certain tax related matters.
We are subject to income taxes in calendar year 2011.both the United States and numerous foreign jurisdictions. The provision for income taxes and cash tax liability in the future could be adversely affected by numerous factors including, but not limited to, income before taxes being lower than anticipated in countries with lower statutory tax rates and higher than anticipated in countries with higher statutory tax rates, changes in the valuation of deferred tax assets and liabilities, and changes in tax laws, regulations, accounting principles or interpretations thereof, which could adversely impact our results of operations and financial condition in future periods. In addition, our income tax returns are subject to examination in the jurisdictions in which we operate. We regularly assess the likelihood of adverse outcomes resulting from these examinations to determine the adequacy of our provision for income taxes. An unfavorable outcome of one or more of these examinations may have an adverse effect on our business, results of operations and financial condition.
If our pricing structures are based on inaccurate expectations and assumptions regarding the cost and complexity of performing our work, then our contracts could be unprofitable.
We negotiate pricing terms with our clients utilizing a range of pricing structures and conditions. We predominantly contract to provide services either on a time-and-materials basis or on a fixed-price basis. Our pricing is highly dependent on our internal forecasts and predictions about our projects and the marketplace, which might be based on limited data and could turn out to be inaccurate. If we do not accurately estimate the costs and timing for completing projects, our contracts could prove unprofitable for us or yield lower profit margins than anticipated. We face a number of risks when pricing our contracts, as many of our projects entail
the coordination of operations and workforces in multiple locations and utilizing workforces with different skill sets and competencies across geographically diverse service locations. Our pricing, cost and profit margin estimates for the work that we perform frequently include anticipated long-term cost savings from transformational and other initiatives that we expect to achieve and sustain over the life of the contract. There is a risk that we will underprice our projects, fail to accurately estimate the costs of performing the work or fail to accurately assess the risks associated with potential contracts. In particular, any increased or unexpected costs, delays or failures to achieve anticipated cost savings, or unexpected risks we encounter in connection with the performance of this work, including those caused by factors outside our control, could make these contracts less profitable or unprofitable, which could have an adverse effect on our profit margin.
In addition, a significant portion of our projects are on a fixed-price basis, subjecting us to the foregoing risks to an even greater extent. Fixed-price contracts accounted for approximately 31.5%33.1% of our revenues for the year ended December 31, 2010.2012. We expect that an increasing number of our future projects will be contracted on a fixed-price basis. In addition to the other risks described in the paragraph above, we bear the risk of cost over-runs and operating cost inflation in connection with projects covered by fixed-price contracts. Our failure to estimate accurately the resources and time required for a fixed-price project, or our failure to complete our contractual obligations within the time frame committed, could have a material adverse effect on our business, results of operations and financial condition.
Our profitability could suffer if we are not able to maintain favorable pricing rates.
Our profit margin, and therefore our profitability, is dependent on the rates we are able to recover for our services. If we are not able to maintain favorable pricing for our services, our profit margin and our profitability could suffer. The rates we are able to recover for our services are affected by a number of factors, including:
our clients’ perceptions of our ability to add value through our services;
competition;
introduction of new services or products by us or our competitors;
our competitors’ pricing policies;
our ability to accurately estimate, attain and sustain contract revenues, margins and cash flows over increasingly longer contract periods;
bid practices of clients and their use of third-party advisors;
the use by our competitors and our clients of offshore resources to provide lower-cost service delivery capabilities;
our ability to charge premium prices when justified by market demand or the type of service; and
general economic and political conditions.
Our profitability could suffer if we are not able to maintain favorable utilization rates.
The cost of providing our services, including the utilization rate of our professionals, affects our profitability. If we are not able to maintain an appropriate utilization rate for our professionals, our profit margin and our profitability may suffer. Our utilization rates are affected by a number of factors, including:
our ability to efficiently transition employees from completed projects to new assignments andassignments;
our ability to hire and assimilate new employees;
our ability to accurately forecast demand for our services and thereby maintain an appropriate headcount in each of our geographies and workforces;
our ability to effectively manage attrition; and
our need to devote time and resources to training, professional development and other non-chargeable activities.
If we do not continue to improve our operational, financial and other internal controls and systems to manage our rapid growth and size or if we are unable to enter, operate and compete effectively in new geographic markets, our business may suffer and the value of our shareholders’stockholders’ investment in our Company may be harmed.
Our anticipated growth will continue to place significant demands on our management and other resources. Our growth will require us to continue to develop and improve our operational, financial and other internal controls both in the United States, Europe, India and elsewhere. In particular, our continued growth will increase the challenges involved in:
recruiting, training and retaining technical, finance, marketing and management personnel with the knowledge, skills and experience that our business model requires;
maintaining high levels of client satisfaction;
developing and improving our internal administrative infrastructure, particularly our financial, operational, communications and other internal systems;
preserving our culture, values and entrepreneurial environment; and
effectively managing our personnel and operations and effectively communicating to our personnel worldwide our core values, strategies and goals.
In addition, the increasing size and scope of our operations increase the possibility that an employeea member of our personnel will engage in unlawful or fraudulent activity, breach our contractual obligations, or otherwise expose us to unacceptable business risks, despite our efforts to train our people and maintain internal controls to prevent such instances. If we do not continue to develop and implement the right processes and tools to manage our enterprise, our ability to compete successfully and achieve our business objectives could be impaired.
As part of our growth strategy, we plan to continue expanding our operations in Europe, Asia, the Middle East, and Latin America. We may not be able to compete effectively in these markets and the cost of entering these markets may be substantially greater than we expect. If we fail to compete effectively in the new markets we enter, or if the cost of entering those markets is substantially greater than we expect, our business, results of operations and financial condition could be adversely affected. In addition, if we cannot compete effectively, we may be required to reconsider our strategy to invest in our international expansion plans and change our intent on the repatriation of our earnings.
Our operating results may experience significant quarterly fluctuations.
We, historically,Historically, we have experienced significant quarterly fluctuations in our revenues and results of operations and expect these fluctuations to continue. Among the factors causing these variations have been:
the nature, number, timing, scope and contractual terms of the projects in which we are engaged;
delays incurred in the performance of those projects;
the accuracy of estimates of resources and time required to complete ongoing projects; and
general economic conditions.
In addition, our future revenues, operating margins and profitability may fluctuate as a result of:
changes in pricing in response to customer demand and competitive pressures;
changes to the financial condition of our clients;
the mix of on-site and offshore staffing;
the ratio of fixed-price contracts versus time-and-materials contracts;
employee wage levels and utilization rates;
changes in foreign exchange rates, including the Indian rupee versus the U.S. dollar;
the timing of collection of accounts receivable;
enactment of new taxes;
changes in domestic and international income tax rates and regulations; and
changes to levels and types of stock-based compensation awards and assumptions used to determine the fair value of such awards.
A high percentage of our operating expenses, particularly personnel and rent, are relatively fixed in advance of any particular period. As a result, unanticipated variations in the number and timing of our projects or in employee wage levels and utilization rates may cause significant variations in our operating results in any particular period, and could result in losses. Any significant shortfall of revenues in relation to our expectations, any material reduction in utilization rates for our professional staff or variance in the on-site/offshore staffing mix, an unanticipated termination of a major project, a customer’s decision not to pursue a new project or proceed to succeeding stages of a current project or the completion of several major customer projects during a quarter could require us to pay underutilized employees and could therefore have a material adverse effect on our business, results of operations and financial condition.
As a result of these factors, it is possible that in some future periods, our revenues and operating results may be significantly below the expectations of public market analysts and investors. In such an event, the price of our common stock would likely be materially and adversely affected.
We could be held liable for damages or our reputation could be damaged by disclosure of confidential information or personal data, security breaches or system failures.
We are dependent on information technology networks and systems to process, transmit and securely store electronic information and to communicate among our locations around the world and with our clients. Security breaches of this infrastructure could lead to shutdowns or disruptions of our systems and potential unauthorized disclosure of confidential information.information or data, including personal data. In addition, many of our engagements involve projects that are critical to the operations of our customers’ businesses and provide benefits that are difficult to quantify. The theft and/or unauthorized use or publication of our, or our clients’, confidential information or other proprietary business information as a result of such an incident could adversely affect our competitive position and reduce marketplace acceptance of our services. Any failure in a customer’sthe networks or computer systemsystems used by us or our customers could result in a claim for substantial damages against us and significant reputational harm, regardless of our responsibility for
the failure. Although we attempt to limit by contract our liability for damages arising from negligent acts, errors, mistakes or omissions in rendering our services, we cannot assure you that any such damages are subject to a contractual limitation or that any such contractual limitations on liability will be enforceable in all instances or will otherwise protect us from liability for damages.
In addition, we often have access to or are required to manage, utilize, collect and store sensitive or confidential client or employee data, including nonpublic personal data. As a result, we are subject to numerous U.S. and foreign jurisdiction laws and regulations designed to protect this information, such as the European Union Directive on Data Protection and various U.S. federal and state laws governing the protection of health or other individually identifiable information. If any person, including any of our employees, negligently disregards or intentionally breaches our established controls or procedures with which we are responsible for complying with respect to
such data or otherwise mismanages or misappropriates that data, or if unauthorized access to or disclosure of data in our possession or control occurs, we could be subject to significant liability to our clients or our clients’ customers for breaching contractual confidentiality and security provisions or privacy laws, as well as liability and penalties in connection with any violation of applicable privacy laws and/or criminal prosecution. Unauthorized disclosure of sensitive or confidential client or employee data, whether through breach of computer systems, systems failure, employee negligence, fraud or misappropriation, or otherwise, could damage our reputation and cause us to lose clients. Similarly, unauthorized access to or through our information systems and networks or those we develop or manage for our clients, whether by our employees or third parties, could result in negative publicity, legal liability and damage to our reputation.
Although we have general liability insurance coverage, including coverage for errors or omissions, there can be no assurance that coverage will continue to be available on reasonable terms or will be sufficient in amount to cover one or more large claims, or that the insurer will not disclaim coverage as to any future claim. The successful assertion of one or more large claims against us that exceed available insurance coverage or changes in our insurance policies, including premium increases or the imposition of large deductible or co-insurance requirements, could have a material adverse effect on our business, results of operations and financial condition.
Our business could be negatively affected if we incur legal liability, including with respect to our indemnificationcontractual obligations, in connection with providing our solutions and services.
If we fail to meet our contractual obligations or otherwise breach obligations to our clients, we could be subject to legal liability. We may enter into non-standard agreements because we perceive an important economic opportunity by doing so or because our personnel did not adequately adhere to our guidelines. In addition, the contracting practices of our competitors may cause contract terms and conditions that are unfavorable to us to become standard in the marketplace. If we cannot or do not perform our obligations, we could face legal liability and our contracts might not always protect us adequately through limitations on the scope and/or amount of our potential liability. If we cannot, or do not, meet our contractual obligations to provide solutions and services, and if our exposure is not adequately limited through the enforceable terms of our agreements, we might face significant legal liability and our business could be adversely affected.
In the normal course of business and in conjunction with certain client engagements, we have entered into contractual arrangements through which we may be obligated to indemnify clients or other parties with whom we conduct business with respect to certain matters. These arrangements can include provisions whereby we agree to hold the indemnified party and certain of their affiliated entities harmless with respect to third-party claims related to such matters as our breach of certain representations or covenants, or out of our intellectual property infringement, our gross negligence or willful misconduct or certain other claims made against certain parties. Payments by us under any of these arrangements are generally conditioned on the client making a claim and providing us with full control over the defense and settlement of such claim. It is not possible to determine the maximum potential amount under these indemnification agreements due to the unique facts and circumstances involved in each particular agreement. Historically, we have not made payments under these indemnification agreements so they have not had any impact on our operating results, financial position, or cash flows. However, if events arise requiring us to make payment for indemnification claims under our indemnification obligations in contracts we have entered, such payments could have a material impact on our operating results, financial position, and cash flows.
We could incur liability or our reputation could be damaged if our provision of services and solutions to our clients contributes to our clients’ internal control deficiencies.
Our clients may perform audits or require us to perform audits and provide audit reports with respect to the controls and procedures that we use in the performance of services for such clients, especially when we process data belonging to them. Our ability to acquire new clients and retain existing clients may be adversely affected and our reputation could be harmed if we receive a qualified opinion, or if we cannot obtain an unqualified
opinion, with respect to our controls and procedures in connection with any such audit in a timely manner. Additionally, we could incur liability if our controls and procedures, or the controls and procedures we manage for a client, were to result in internal controls failures or impair our client’s ability to comply with its own internal control requirements.
If we are unableWe may not be able to enforce or protect our intellectual property rights, which may harm our business may be adversely affected.ability to compete and harm our business.
Our future success will depend, in part, on our ability to protect our proprietary methodologies and other valuable intellectual property. We presently hold no issued patents or registered copyrights, however, we have filed patent applications and we intend to file additional patent applications. There is no guarantee that any patents will be granted in the United States or in any other country we may seek protection or that they will serve as a barrier from competition from other organizations. Additionally, the protection afforded by international patent laws as well as the enforcement actions differ from country to country. There is no guarantee that we will be able to maintain adequate protection or enforcement of our intellectual property rights.
We also rely upon a combination of copyright and trade secret laws, non-disclosure and otherrelated contractual arrangements, and variousother security measures to protect our intellectual property rights. Existing laws of some countries in which we provide services or solutions, such as China, might offer only limited protection of our intellectual property rights. India is a member of the Berne Convention, and has agreed to recognize protections on copyrights conferred under the laws of foreign countries, including the laws of the United States. We believe that laws, rules, regulations and treaties in effect in the United States, India and other countries in which we operate are adequate to protect us from misappropriation or unauthorized use of our copyrights and other intellectual property. However, there can be no assurance that these laws will not change and, in particular, that the laws of India or the United States will not change in ways that may prevent or restrict the transfer of software components, libraries and toolsets from India toand other technology or data we use in the United States or fromperformance of our services among the United States to India.countries in which we operate and provide services. There can be no assurance that the steps we have taken to protect our intellectual property rights will be adequate to deter misappropriation of any of our intellectual property, or that we will be able to detect unauthorized use and take appropriate steps to enforce our rights. Enforcing our rights might also require considerable time, money and oversight.
Unauthorized use of our intellectual property may result in development of technology, products or services that compete with our products and services and unauthorized parties may infringe upon or misappropriate our products, services or proprietary information. If we are unable to protect our intellectual property, our business may be adversely affected.affected and our ability to compete may be impaired.
Depending on the circumstances, we might need to grant a specific client greater rights in intellectual property developed or used in connection with a contract than we generallynormally do. In certain situations, we might forego all rights to the use of intellectual property we create and intend to reuse across multiple client engagements, which would limit our ability to reuse that intellectual property for other clients. Any limitation on our ability to provide a service or solution could cause us to lose revenue-generating opportunities and require us to incur additional expenses to develop new or modified solutions for future projects.
Our ability to enforce our software license agreements, service agreements, and other intellectual property rights is subject to general litigation risks, as well as uncertainty as to the enforceability of our intellectual property rights in various countries. To the extent that we seek to enforce our rights, we could be subject to claims that an intellectual property right is invalid, otherwise not enforceable, or is licensed to the party against whom we are pursuing a claim. In addition, our assertion of intellectual property rights may result in the other party seeking to assert alleged intellectual property rights or assert other claims against us, which could harm our business. If we are not successful in defending such claims in litigation, we may not be able to sell or license a particular service or solution due to an injunction, or we may have to pay damages that could, in turn, harm our results of operations. In addition, governments may adopt regulations, or courts may render decisions, requiring compulsory licensing of intellectual property to others, or governments may require that products meet specified
standards that serve to favor local companies. Our inability to enforce our intellectual property rights under these circumstances may harm our competitive position and our business.
Our services or solutions could infringe upon the intellectual property rights of others orand we might lose our abilitymay be subject to utilize theclaims of infringement of third-party intellectual property of others.rights.
We cannot be sure that our services and solutions, or the solutions of others that we offer to our clients, do not infringe on the intellectual property rights of others, and we could have infringement claims assertedothers. Third parties may assert against us or against our clients. Thesecustomers claims alleging infringement of patent, copyright, trademark, or other intellectual property rights to technologies or services that are important to our business. Infringement claims could harm our reputation, cost us money and prevent us from offering some services or solutions. In a number of our contracts, we have agreedgenerally agree to indemnify our clients for anycertain expenses or liabilities resulting from claimed infringementspotential infringement of the intellectual property rights of third parties. In some instances, the amount of our liability under these indemnities could be greater thansubstantial. Any claims that our products, services or processes infringe the revenuesintellectual property rights of others, regardless of the merit or resolution of such claims, may result in significant costs in defending and resolving such claims, and may divert the efforts and attention of our management and technical personnel from our business. In addition, as a result of such intellectual property infringement claims, we receivecould be required or otherwise decide that it is appropriate to:
pay third-party infringement claims;
discontinue using, licensing, or selling particular products subject to infringement claims;
discontinue using the technology or processes subject to infringement claims;
develop other technology not subject to infringement claims, which could be costly or may not be possible; and/or
license technology from the client. Any claims or litigationthird party claiming infringement, which license may not be available on commercially reasonable terms.
The occurrence of any of the foregoing could result in this area, whether we ultimately win or lose, could be time-consuming and costly, injure our reputationunexpected expenses or require us to enter into royaltyrecognize an impairment of our assets, which would reduce the value of our assets and increase expenses. In addition, if we alter or licensing arrangements. If the latter, we might notdiscontinue our offering of affected items or services, our revenue could be able to enter into these royalty or licensing arrangements on acceptable terms.affected. If a claim of infringement were
successful against us or our clients, an injunction might be ordered against our client or our own services or operations, causing further damages.
We expect that the risk of infringement claims against us will increase if our competitors are able to obtain patents and other intellectual property rights for software products and methods, technological solutions, and processes. We may be subject to intellectual property infringement claims from certain individuals and companies who have acquired patent portfolios for the primary purpose of asserting such claims against other companies. The risk of infringement claims against us may also increase as we continue to develop and license our intellectual property to our clients and other third parties. Any infringement claim or litigation against us could have a material adverse effect on our business, results of operations and financial condition.
We might lose our ability to utilize the intellectual property of others, which could harm our business.
We could lose our ability, or be unable to secure the right, to utilize the intellectual property of others. Third-party suppliers of software, hardware or other intellectual property assets could be unwilling to permit us to use their intellectual property and this could impede or disrupt use of their products or services by us and our clients. If our ability to provide services and solutions to our clients is impaired as a result of any such denial, our operating results could be adversely affected.
We may not be unableable to successfully acquire target companies or integrate acquired companies or technologies successfullyinto our company, and we may bebecome subject to certain liabilities assumed or incurred in connection with our acquisitions that could harm our operating results.
We expect to continue our program of pursuing strategic acquisitions and joint ventures designed to enhance our capabilities, enable us to expand our geographic presence, especially in the European market, enter new technology areas and/or expand our capacity. We cannot be sure that we will successfully identify suitable acquisition candidates, consummate any acquisition or joint venture, integrate any acquired business or joint venture into our operations or achieve desired financial and operating results. Further, acquisitions and joint ventures involve a number of special risks, including diversion of management’s attention and failure to retain key personnel. We might need to dedicate additional management and other resources to complete the transactions. Our organizational structure could make it difficult for us to efficiently integrate acquired businesses or technologies into our ongoing operations and assimilate employees of those businesses into our culture and operations. Accordingly, we might fail to realize the expected benefits or strategic objectives of any acquisition we undertake. If we are unable to complete the number and kind of acquisitions for which we plan, or if we are inefficient or unsuccessful at integrating any acquired businesses into our operations, we may not be able to achieve our planned rates of growth or improve our market share, profitability or competitive position in specific markets or services. Also, we may finance any future acquisitions with cash, debt financing, the issuance of equity securities We expect to continue pursuing strategic acquisition and joint venture opportunities designed to enhance our capabilities, expand our capacity and geographic presence and/or a combination of the foregoing.enter new technology areas. We cannot assure youpredict or guarantee that we will successfully identify suitable acquisition candidates or consummate any acquisition or joint venture. We may need to divert and/or dedicate management and other resources to complete the transactions. Once we have consummated an acquisition transaction or entered into a joint venture transaction, we may not be able to arrange adequate financing on acceptable terms. In addition, acquisitions financed withintegrate the issuanceacquired business or joint venture (and personnel) into our operations, recognize anticipated efficiencies and/or benefits, realize our strategic objectives or achieve the desired financial and operating results, in each case, both generally and as a result of our equity securities could be dilutive.unique organizational structure. Acquisitions and joint ventures involve a number of special risks, including diversion of management’s attention, failure to retain key personnel and the potential assumption or incurrence of liabilities and/or obligations.
Although we conduct due diligence in connection with each of our acquisitions, there may be liabilities that we fail to discover, or that we inadequately assess in our due diligence efforts.efforts or that are not properly disclosed to us. In particular, to the extent that any acquired businesses orbusiness (or any properties thereof) (i) failed to comply with or otherwise violated applicable laws or regulations, or(ii) failed to fulfill their contractual obligations to customers or (iii) incurred material liabilities or obligations to customers that are not identified during the diligence process, we, as the successor owner, may be financially responsible for these violations, failures and failuresliabilities and may suffer financial and/or reputational harm or otherwise be adversely affected. While we generally require the selling party to indemnify us for any and all damages associated with such liabilities, if for any reason the seller does not perform their indemnification obligation, we may be held responsible for such liabilities and have no recourse for resulting damages. In addition, as part of an acquisition, we may assume responsibilities and obligations of the acquired business pursuant to the terms and conditions of services agreements entered by the acquired entity that are not consistent with the terms and conditions that we typically accept and require. Although we attempt to structure acquisitions in such a manner as to minimize our exposure to, among other things, the liability that could arise from such contractual commitments,factors and conditions contemplated by the foregoing two sentences (including through indemnification protection), we cannot assure youpredict or guarantee that any of our efforts to minimize the liability will be effective in all instances or will otherwise protect us from liability for damages under such agreements.liability. The discovery of any material liabilities associated with our acquisitions for which we are unable to receiverecover indemnification amounts could harm our operating results.
System failure or disruptions in communications could disrupt our business and result in lost customers and curtailed operations which would reduce our revenue and profitability.
To deliver our services to our customers, we must maintain a high speed network of satellite, fiber optic and land lines and active voice and data communications twenty-four hours a day between our main operating offices in Chennai, our other development and delivery centers and the offices of our customers worldwide. Although
we maintain redundancy facilities and satellite communications links, any systems failure or a significant lapse in our ability to transmit voice and data through satellite and telephone communications could result in lost customers and curtailed operations which would reduce our revenue and profitability.
Consolidation in the industries that we serve could adversely affect our business.
Companies in the industries that we serve may seek to achieve economies of scale and other synergies by combining with or acquiring other companies. If two or more of our current clients merge or consolidate and combine their operations, it may decrease the amount of work that we perform for these clients. If one of our current clients merges or consolidates with a company that relies on another provider for its consulting, systems integration and technology, or outsourcing services, we may lose work from that client or lose the opportunity to gain additional work. The increased market power of larger companies could also increase pricing and competitive pressures on us. Any of these possible results of industry consolidation could adversely affect our business.
Our ability to attract and retain business may depend on our reputation in the marketplace.
Our services are marketed to clients and prospective clients based on a number of factors. Since many of our specific client engagements involve unique services and solutions, our corporate reputation is a significant factor in our clients’ evaluation of whether to engage our services. We believe the Cognizant brand name and our reputation are important corporate assets that help distinguish our services from those of our competitors and also contribute to our efforts to recruit and retain talented employees. However, our corporate reputation is potentially susceptible to damage by actions or statements made by current or former clients, competitors, vendors, adversaries in legal proceedings, government regulators, former and current employees and personnel as well as members of the investment community and the media. There is a risk that negative information about our company, even if based on false rumor or misunderstanding, could adversely affect our business. In particular, damage to our reputation could be difficult and time-consuming to repair, could make potential or existing clients reluctant to select us for new engagements, resulting in a loss of business, and could adversely affect our recruitment and retention efforts. Damage to our reputation could also reduce the value and effectiveness of the Cognizant brand name and could reduce investor confidence in us, adversely affecting our share price.
Provisions in our charter, by-laws and stockholders’ rights plan and provisions under Delaware law may discourage unsolicited takeover proposals.
Provisions in our charter and by-laws, each as amended, our stockholders’ rights plan and Delaware General Corporate Law, or DGCL, may have the effect of deterring unsolicited takeover proposals or delaying or preventing changes in our control or management, including transactions in which stockholders might otherwise receive a premium for their shares over then-current market prices. In addition, these documents and provisions may limit the ability of stockholders to approve transactions that they may deem to be in their best interests. Our board of directors has the authority, without further action by the stockholders, to fix the rights and preferences, and issue shares of preferred stock. Our charter provides for a classified board of directors, which will prevent a change of control of our board of directors at a single meeting of stockholders. The prohibition of our stockholders’ ability to act by written consent and the restrictions imposed on our stockholders’ ability to call a special meeting will delaymay have the effect of delaying stockholder actions until annual meetings or until a special meeting is called by our chairman or chief executive officer or our board of directors. The supermajority-voting requirement for specified amendments to our charter and by-laws allows a minority of our stockholders to block those amendments. The DGCL also contains provisions preventing stockholders from engaging in business combinations with us, subject to certain exceptions. These provisions could also discourage bids for our common stock at a premium as well as create a depressive effect on the market price of the shares of our common stock.
New and changing corporate governance and public disclosure requirements add uncertainty to our compliance policies and increasesincrease our costs of compliance.
Changing laws, regulations and standards relating to accounting, corporate governance and public disclosure, including the Sarbanes-Oxley Act of 2002, other SEC regulations, and the NASDAQ Global Select Market rules, are creating uncertainty for companies like ours. These laws, regulations and standards may lack specificity and are subject to varying interpretations. Their application in practice may evolve over time, as new
guidance is provided by regulatory and governing bodies. This could result in continuing uncertainty regarding compliance matters and higher costs of compliance as a result of ongoing revisions to such corporate governance standards.
In particular, our efforts to comply with Section 404 of the Sarbanes-Oxley Act of 2002 and the related regulations regarding our required assessment of our internal controls over financial reporting and our external auditors’ audit of that assessment requires the commitment of significant financial and managerial resources. We consistently assess the adequacy of our internal controls over financial reporting, remediate any control deficiencies that may be identified, and validate through testing that our controls are functioning as documented. While we do not anticipate any material weaknesses, the inability of management and our independent auditor to
provide us with an unqualified report as to the adequacy and effectiveness, respectively, of our internal controls over financial reporting for future year ends could result in adverse consequences to us, including, but not limited to, a loss of investor confidence in the reliability of our financial statements, which could cause the market price of our stock to decline.
We are committed to maintaining high standards of corporate governance and public disclosure, and our efforts to comply with evolving laws, regulations and standards in this regard have resulted in, and are likely to continue to result in, increased general and administrative expenses and a diversion of management time and attention from revenue-generating activities to compliance activities. In addition, the laws, regulations and standards regarding corporate governance may make it more difficult for us to obtain director and officer liability insurance. Further, our board members, chief executive officer and chief financial officer could face an increased risk of personal liability in connection with their performance of duties. As a result, we may face difficulties attracting and retaining qualified board members and executive officers, which could harm our business. If we fail to comply with new or changed laws, regulations or standards of corporate governance, our business and reputation may be harmed.
Our share price could be adversely affected if we are unable to maintain effective internal controls.
The accuracy of our financial reporting is dependent on the effectiveness of our internal controls. We are required to provide a report from management to our shareholdersstockholders on our internal control over financial reporting that includes an assessment of the effectiveness of these controls. Internal control over financial reporting has inherent limitations, including human error, the possibility that controls could be circumvented or become inadequate because of changed conditions, and fraud. Because of these inherent limitations, internal control over financial reporting might not prevent or detect all misstatements or fraud. If we cannot maintain and execute adequate internal control over financial reporting or implement required new or improved controls to ensure the reliability of the financial reporting and preparation of our financial statements for external use, we could suffer harm to our reputation, fail to meet our public reporting requirements on a timely basis, or be unable to properly report on our business and the results of our operations, and the market price of our securities could be materially adversely affected.
We are exposed to credit risk and fluctuations in the market values of our investment portfolio.
Recent turmoil in the financial markets has adversely affected economic activity in the United States, Europe and other regions of the world in which we do business. We believe that based on our current cash, cash equivalents and investment balances and expected operating cash flows, the current lack of liquidity in the credit markets will not have a material impact on our liquidity, cash flow or financial flexibility. Continued deterioration of the credit and capital markets could result in volatility of our investment earnings and impairments to our investment portfolio, which could negatively impact our financial condition and reported income. The continued decline in economic activity could adversely affect the ability of counterparties to certain financial instruments such as marketable securities and derivatives to meet their obligations to us.
Our stock price continues to be volatile.
Our stock has at times experienced substantial price volatility as a result of variations between our actual and anticipated financial results, announcements by us and our competitors, projections or speculation about our business or that of our competitors by the media or investment analysts or uncertainty about current global
economic conditions. The stock market, as a whole, also has experienced extreme price and volume fluctuations that have affected the market price of many technology companies in ways that may have been unrelated to these companies’ operating performance. Furthermore, we believe our stock price should reflect future growth and profitability expectations and, if we fail to meet these expectations, our stock price may significantly decline.
| Item 1B. | Unresolved Staff |
None.
To support our planned growth, we are continually expanding our development and delivery center capacity through the construction of new facilities, supplemented by additional leasing of non-owned facilities. Below is a summary of development and delivery facilities in India, China, and the Philippines and Singapore and our executive office in Teaneck, New Jersey as of December 31, 2010.2012.
Location | Number of Locations | Square Footage Leased | Square Footage Owned | Total Square Footage | Number of Locations | Square Footage Leased | Square Footage Owned | Total Square Footage | ||||||||||||||||||||||||
Development and Delivery Facilities: | ||||||||||||||||||||||||||||||||
India: | ||||||||||||||||||||||||||||||||
Chennai | 11 | 1,634,274 | 2,956,220 | 4,590,494 | 12 | 2,450,185 | 5,041,307 | 7,491,492 | ||||||||||||||||||||||||
Pune | 6 | 1,116,635 | 343,703 | 1,460,338 | 5 | 1,547,930 | 343,703 | 1,891,633 | ||||||||||||||||||||||||
Bangalore | 4 | 880,463 | 225,000 | 1,105,463 | 5 | 2,055,577 | 225,000 | 2,280,577 | ||||||||||||||||||||||||
Kolkata | 5 | 413,703 | 827,727 | 1,241,430 | 6 | 944,410 | 827,727 | 1,772,137 | ||||||||||||||||||||||||
Hyderabad | 6 | 1,230,115 | — | 1,230,115 | 7 | 2,256,374 | — | 2,256,374 | ||||||||||||||||||||||||
Coimbatore | 3 | 173,641 | 725,611 | 899,252 | 3 | 173,641 | 725,611 | 899,252 | ||||||||||||||||||||||||
Cochin | 2 | 251,139 | — | 251,139 | ||||||||||||||||||||||||||||
Mumbai | 2 | 172,745 | — | 172,745 | 3 | 330,665 | — | 330,665 | ||||||||||||||||||||||||
Gurgaon | 3 | 77,726 | — | 77,726 | 4 | 188,080 | — | 188,080 | ||||||||||||||||||||||||
Cochin | 1 | 110,700 | — | 110,700 | ||||||||||||||||||||||||||||
Mangalore | 1 | 42,760 | — | 42,760 | ||||||||||||||||||||||||||||
Shanghai, China | 3 | 100,500 | — | 100,500 | 3 | 100,500 | — | 100,500 | ||||||||||||||||||||||||
Manila, the Philippines | 2 | 49,625 | — | 49,625 | 4 | 146,497 | — | 146,497 | ||||||||||||||||||||||||
Singapore City | 2 | 33,786 | 33,786 | |||||||||||||||||||||||||||||
|
|
|
| |||||||||||||||||||||||||||||
Total | 46 | 5,960,127 | 5,078,261 | 11,038,388 | 57 | 10,521,544 | 7,163,348 | 17,684,892 | ||||||||||||||||||||||||
|
|
|
| |||||||||||||||||||||||||||||
Executive Office: | ||||||||||||||||||||||||||||||||
Teaneck | 1 | 86,033 | — | 86,033 | 1 | 96,107 | — | 96,107 | ||||||||||||||||||||||||
|
|
|
| |||||||||||||||||||||||||||||
We operate out of our Teaneck, New Jersey headquarters and our regional and international offices. We have business development offices located in metropolitan areas including in North and SouthLatin America: Atlanta (GA), Boston (MA), Bridgewater (NJ), Buenos Aires, Chicago (IL), Dallas (TX), Knoxville (TN), Los Angeles (CA), Minneapolis (MN), Phoenix (AZ), San Francisco (CA), Seattle (WA)Sao Paulo, Tampa (FL), and Toronto; in Europe: Amsterdam, Basel, Brussels, Copenhagen, Dublin, Frankfurt, Geneva, Helsinki, London, Lyon, Madrid, Oslo, Paris, Prague, Stockholm, and Zurich; in the Middle East: Dubai;Dubai, and Riyadh; and in the Asia Pacific region: Auckland, Bangkok, Brisbane, Chennai, Cyberjaya, Hong Kong, Kuala Lumpur, Manila, Melbourne, Osaka, Shanghai, Sydney, Singapore, Tokyo, and Tokyo.Wellington.
In addition to the locations included in the above table, we operate development and delivery facilities in North and SouthLatin America: Bentonville (AR), Boston (MA), Bridgewater (NJ), Buenos Aires, Chicago (IL), Detroit (MI), Des Moines (IA), Guadalajara, Minot (ND), Phoenix (AZ), Sao Paulo, Tampa (FL) and Toronto; in Europe: Amsterdam, Budapest, Grenoble, Eindhoven, Heidelberg and London; and in India and the Asia Pacific area: Bangalore, Chennai, Cochin, Coimbatore, Gurgaon, Hyderabad, Kolkata, Manila, Mumbai, Pune, and Shanghai.London. We also have several training facilities strategically located near or within our main offices and development and delivery centers.
We believe that our current facilities are adequate to support our existing operations. We also believe that we will be able to obtain suitable additional facilities on commercially reasonable terms on an “as needed”needed basis.” The above properties are used to provide services across all four of our business segments.
We are involved in various claims and legal actions arising in the ordinary course of business. In the opinion of our management, the outcome of such claims and legal actions, if decided adversely, is not expected to have a material adverse effect on our quarterly or annual operating results, cash flows or consolidated financial position.
Item 4.Mine Safety Disclosures
Not applicable.
| Item 5. | Market for Registrant’s Common Equity, Related Stockholder Matters and Issuer Purchases of Equity |
Our Class A common stock trades on the NASDAQ Global Select Market (NASDAQ) under the symbol “CTSH”.
The following table shows the per share range of high and low sale prices for shares of our Class A common stock, as listed for quotation on the NASDAQ, and the quarterly cash dividends paid per share for the quarterly periods indicated.
Quarter Ended | High | Low | Cash Dividend Per Share | |||||||||
March 31, 2009 | $ | 22.18 | $ | 17.26 | $ | 0.00 | ||||||
June 30, 2009 | $ | 27.90 | $ | 20.35 | $ | 0.00 | ||||||
September 30, 2009 | $ | 39.40 | $ | 25.01 | $ | 0.00 | ||||||
December 31, 2009 | $ | 46.61 | $ | 36.69 | $ | 0.00 | ||||||
March 31, 2010 | $ | 52.68 | $ | 42.08 | $ | 0.00 | ||||||
June 30, 2010 | $ | 54.81 | $ | 45.85 | $ | 0.00 | ||||||
September 30, 2010 | $ | 65.75 | $ | 48.98 | $ | 0.00 | ||||||
December 31, 2010 | $ | 74.79 | $ | 61.26 | $ | 0.00 | ||||||
Quarter Ended | High | Low | ||||||
March 31, 2011 | $ | 81.85 | $ | 70.53 | ||||
June 30, 2011 | $ | 83.48 | $ | 64.40 | ||||
September 30, 2011 | $ | 77.71 | $ | 53.54 | ||||
December 31, 2011 | $ | 77.44 | $ | 59.95 | ||||
March 31, 2012 | $ | 78.00 | $ | 64.92 | ||||
June 30, 2012 | $ | 77.85 | $ | 55.25 | ||||
September 30, 2012 | $ | 71.45 | $ | 53.92 | ||||
December 31, 2012 | $ | 74.87 | $ | 64.20 | ||||
As of December 31, 2010,2012, the approximate number of holders of record of our Class A common stock was 209171 and the approximate number of beneficial holders of our Class A common stock was 55,000.38,800.
Dividends
We have never declared or paid cash dividends on our Class A common stock. We currently intend to retain any future earnings to finance the growth of our business and, therefore, do not currently anticipate paying any cash dividends in the foreseeable future.
Equity Compensation Plan Information
The following table provides information as of December 31, 2010 with respect to the shares of our Class A common stock that may be issued under our existing equity compensation plans. We previously had four equity compensation plans, each of which was approved by our stockholders: (1) Amended and Restated 1999 Incentive Compensation Plan, which we refer to as the 1999 Incentive Plan; (2) Amended and Restated Non-Employee Directors’ Stock Option Plan, which we refer to as the Director Plan; (3) the Amended and Restated Key Employees’ Stock Option Plan; and (4) Amended and Restated 2004 Employee Stock Purchase Plan, which we refer to as the 2004 Employee Stock Purchase Plan. The 1999 Incentive Plan, the Director Plan and the Key Employees’ Stock Option Plan were succeeded by the Cognizant Technology Solutions Corporation 2009 Incentive Compensation Plan, which we refer to as the 2009 Incentive Plan, which was approved by our stockholders. Awards granted under the previous plans are still valid, however no additional awards may be granted from these previous plans. For additional information on our equity compensation plans, please see Note 12 to our consolidated financial statements.
Plan Category | Number of Securities to be Issued Upon Vesting of Awards or Exercise of Outstanding Stock Options | Weighted Average Exercise Price of Awards or Outstanding Stock Options | Number of Securities Available for Future Issuance Under Equity Compensation Plans | |||||||||
Equity compensation plans that have been approved by security holders—stock options(1) | 12,867,658 | (2) | $ | 21.23 | 24,109,992 | (3) | ||||||
Equity compensation plans that have been approved by security holders—performance stock units(4) | 1,104,987 | N/A | — | |||||||||
Equity compensation plans that have been approved by security holders—restricted stock units(5) | 1,394,027 | N/A | — | |||||||||
Equity compensation plans not approved by security holders | — | — | ||||||||||
Total | 15,366,672 | 24,109,992 | ||||||||||
Issuer Purchases of Equity Securities
InFrom December 2010 through December 2012, our Board of Directors authorized up to $150.0 million$1.0 billion in funds for repurchases of Cognizant’s outstanding shares of Class A common stock. The $150.0 million authorization excludedstock, excluding fees and expenses and expires in December 2011.expenses. The program authorizes management to repurchase shares in the open market or in private transactions from time to time, depending on market conditions.conditions and expires on December 31, 2013.
During the three months ended December 31, 2012, we repurchased approximately $25.9 million of our Class A common stock under our stock repurchase program. Stock repurchases were funded from working capital.
Month | Total Number of Shares Purchased | Average Price Paid per Share | Total Number of Shares Purchased as Part of Publicly Announced Plans or Programs | Approximate Dollar Value of Shares that May Yet Be Purchased under the Plans or Programs (in thousands) | ||||||||||||
October 2010 | — | $ | — | — | $ | — | ||||||||||
November 2010 | — | $ | — | — | $ | — | ||||||||||
December 2010 | 600,000 | $ | 69.76 | 600,000 | $ | 108,144 | ||||||||||
Total | 600,000 | $ | 69.76 | 600,000 | ||||||||||||
Month | Total Number of Shares Purchased | Average Price Paid per Share | Total Number of Shares Purchased as Part of Publicly Announced Plans or Programs | Approximate Dollar Value of Shares that May Yet Be Purchased under the Plans or Programs (in thousands) | ||||||||||||
October 1, 2012 – October 31, 2012 | — | $ | — | — | $ | 159,584 | ||||||||||
November 1, 2012 – November 30, 2012 | 398,120 | $ | 65.17 | 398,120 | $ | 133,639 | ||||||||||
December 1, 2012 – December 31, 2012 | — | $ | — | — | $ | 133,639 | ||||||||||
|
|
|
| |||||||||||||
Total | 398,120 | $ | 65.17 | 398,120 | $ | 133,639 | ||||||||||
|
|
|
| |||||||||||||
Performance Graph
The following graph compares the cumulative total stockholder return on our Class A common stock with the cumulative total return on the NASDAQ-100 Index, S&P 500 Index and a Peer Group Index (capitalization weighted) for the period beginning January 1, 2006December 31, 2007 and ending on the last day of our last completed fiscal year. The stock performance shown on the graph below is not indicative of future price performance.
COMPARISON OF CUMULATIVE TOTAL RETURN(1)(2)
Among Cognizant, the NASDAQ-100 Index, the S&P 500 Index
And a Peer Group Index(3)(Capitalization Weighted)
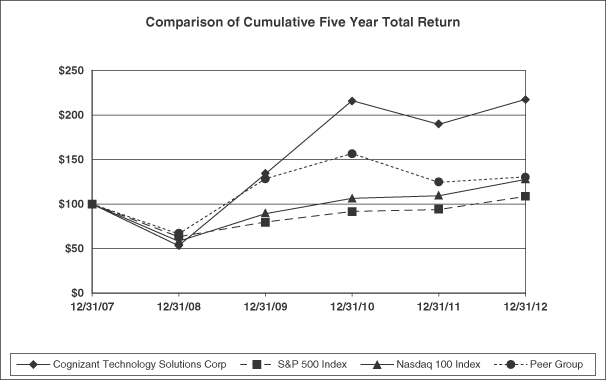
Company / Index | Base Period 12/31/05 | 12/31/06 | 12/31/07 | 12/31/08 | 12/31/09 | 12/31/10 | Base Period 12/31/07 | 12/31/08 | 12/31/09 | 12/31/10 | 12/31/11 | 12/31/12 | ||||||||||||||||||||||||||||||||||||
COGNIZANT TECHNOLOGY SOLUTIONS CORP | 100 | 153.49 | 135.03 | 71.85 | 180.35 | 291.59 | 100 | 53.21 | 133.56 | 215.94 | 189.48 | 217.69 | ||||||||||||||||||||||||||||||||||||
S&P 500 INDEX | 100 | 115.79 | 122.16 | 76.96 | 97.33 | 111.99 | 100 | 63.00 | 79.67 | 91.68 | 93.61 | 108.59 | ||||||||||||||||||||||||||||||||||||
NASDAQ-100 | 100 | 106.79 | 126.73 | 73.65 | 113.08 | 134.81 | 100 | 58.11 | 89.23 | 106.38 | 109.25 | 127.63 | ||||||||||||||||||||||||||||||||||||
PEER GROUP | 100 | 130.09 | 121.62 | 77.17 | 143.40 | 173.00 | 100 | 66.47 | 128.45 | 156.80 | 124.24 | 130.61 | ||||||||||||||||||||||||||||||||||||
| (1) | Graph assumes $100 invested on |
| (2) | Cumulative total return assumes reinvestment of dividends. |
| (3) | We have constructed a Peer Group Index of other information technology consulting firms consisting of Accenture Ltd., Computer Sciences Corporation, Computer Task Group, Inc., Exlservice Holdings Inc, Genpact Ltd Inc., iGate Corp., Infosys Technologies Ltd., Sapient Corp., |
| Item 6. | Selected Financial Data |
The following table sets forth our selected consolidated historical financial data as of the dates and for the periods indicated. Our selected consolidated financial data set forth below as of December 31, 20102012 and 20092011 and for each of the three years in the period ended December 31, 2010 has2012 have been derived from the audited financial statements included elsewhere herein. Our selected consolidated financial data set forth below as of December 31, 2008, 20072010, 2009 and 20062008 and for each of the years ended December 31, 20072009 and 20062008 are derived from our audited consolidated financial statements not included elsewhere herein. Our selected consolidated financial information for 2010, 20092012, 2011 and 20082010 should be read in conjunction with the Consolidated Financial Statements and the Notes and “Item 7. Management’s Discussion and Analysis of Financial Condition and Results of Operations” which are included elsewhere in this Annual Report on Form 10-K.
| Year Ended December 31, | Year Ended December 31, | |||||||||||||||||||||||||||||||||||||||
| 2010 | 2009 | 2008 | 2007 | 2006 | 2012 | 2011 | 2010 | 2009 | 2008 | |||||||||||||||||||||||||||||||
| (in thousands, except per share data) | (in thousands, except per share data) | |||||||||||||||||||||||||||||||||||||||
Consolidated Statement of Operations Data: | ||||||||||||||||||||||||||||||||||||||||
Consolidated Operations Data: | ||||||||||||||||||||||||||||||||||||||||
Revenues | $ | 4,592,389 | $ | 3,278,663 | $ | 2,816,304 | $ | 2,135,577 | $ | 1,424,267 | $ | 7,346,472 | $ | 6,121,156 | $ | 4,592,389 | $ | 3,278,663 | $ | 2,816,304 | ||||||||||||||||||||
Cost of revenues (exclusive of depreciation and amortization expense shown separately below) | 2,654,569 | 1,849,443 | 1,572,816 | 1,206,035 | 787,923 | 4,278,241 | 3,538,622 | 2,654,569 | 1,849,443 | 1,572,816 | ||||||||||||||||||||||||||||||
Selling, general and administrative expenses | 972,093 | 721,359 | 652,021 | 494,102 | 343,238 | 1,557,646 | 1,328,665 | 972,093 | 721,359 | 652,021 | ||||||||||||||||||||||||||||||
Depreciation and amortization expense | 103,875 | 89,371 | 74,797 | 53,918 | 34,163 | 149,089 | 117,401 | 103,875 | 89,371 | 74,797 | ||||||||||||||||||||||||||||||
|
|
|
|
| ||||||||||||||||||||||||||||||||||||
Income from operations | 861,852 | 618,490 | 516,670 | 381,522 | 258,943 | 1,361,496 | 1,136,468 | 861,852 | 618,490 | 516,670 | ||||||||||||||||||||||||||||||
|
|
|
|
| ||||||||||||||||||||||||||||||||||||
Other income (expense), net: | ||||||||||||||||||||||||||||||||||||||||
Interest income | 25,793 | 15,895 | 22,188 | 29,560 | 17,615 | 44,514 | 39,249 | 25,793 | 15,895 | 22,188 | ||||||||||||||||||||||||||||||
Other, net | (9,065 | ) | 2,566 | (23,648 | ) | 3,274 | 1,253 | (18,414 | ) | (6,568 | ) | (9,065 | ) | 2,566 | (23,648 | ) | ||||||||||||||||||||||||
|
|
|
|
| ||||||||||||||||||||||||||||||||||||
Total other income (expense), net | 16,728 | 18,461 | (1,460 | ) | 32,834 | 18,868 | 26,100 | 32,681 | 16,728 | 18,461 | (1,460 | ) | ||||||||||||||||||||||||||||
|
|
|
|
| ||||||||||||||||||||||||||||||||||||
Income before provision for income taxes | 878,580 | 636,951 | 515,210 | 414,356 | 277,811 | 1,387,596 | 1,169,149 | 878,580 | 636,951 | 515,210 | ||||||||||||||||||||||||||||||
Provision for income taxes | 145,040 | 101,988 | 84,365 | 64,223 | 45,016 | 336,333 | 285,531 | 145,040 | 101,988 | 84,365 | ||||||||||||||||||||||||||||||
|
|
|
|
| ||||||||||||||||||||||||||||||||||||
Net income | $ | 733,540 | $ | 534,963 | $ | 430,845 | $ | 350,133 | $ | 232,795 | $ | 1,051,263 | $ | 883,618 | $ | 733,540 | $ | 534,963 | $ | 430,845 | ||||||||||||||||||||
|
|
|
|
| ||||||||||||||||||||||||||||||||||||
Basic earnings per share | $ | 2.44 | $ | 1.82 | $ | 1.49 | $ | 1.22 | $ | 0.83 | $ | 3.49 | $ | 2.91 | $ | 2.44 | $ | 1.82 | $ | 1.49 | ||||||||||||||||||||
|
|
|
|
| ||||||||||||||||||||||||||||||||||||
Diluted earnings per share | $ | 2.37 | $ | 1.78 | $ | 1.44 | $ | 1.15 | $ | 0.77 | $ | 3.44 | $ | 2.85 | $ | 2.37 | $ | 1.78 | $ | 1.44 | ||||||||||||||||||||
|
|
|
|
| ||||||||||||||||||||||||||||||||||||
Cash dividends declared per common share | $ | — | $ | — | $ | — | $ | — | $ | — | $ | — | $ | — | $ | — | $ | — | $ | — | ||||||||||||||||||||
|
|
|
|
| ||||||||||||||||||||||||||||||||||||
Weighted average number of common shares outstanding—Basic | 300,781 | 293,304 | 290,121 | 288,155 | 281,715 | |||||||||||||||||||||||||||||||||||
Weighted average number of common shares outstanding-Basic | 301,291 | 303,277 | 300,781 | 293,304 | 290,121 | |||||||||||||||||||||||||||||||||||
|
|
|
|
| ||||||||||||||||||||||||||||||||||||
Weighted average number of common shares outstanding—Diluted | 309,137 | 301,115 | 298,940 | 303,593 | 301,124 | |||||||||||||||||||||||||||||||||||
Weighted average number of common shares outstanding-Diluted | 305,861 | 310,351 | 309,137 | 301,115 | 298,940 | |||||||||||||||||||||||||||||||||||
|
|
|
|
| ||||||||||||||||||||||||||||||||||||
Cash and cash equivalents and short-term investments | $ | 2,226,388 | $ | 1,399,332 | $ | 762,579 | $ | 670,425 | $ | 648,159 | ||||||||||||||||||||||||||||||
Consolidated Financial Position Data: | ||||||||||||||||||||||||||||||||||||||||
Cash, cash equivalents and short term investments | $ | 2,863,758 | $ | 2,432,264 | $ | 2,226,388 | $ | 1,399,332 | $ | 762,579 | ||||||||||||||||||||||||||||||
Long-term investments | — | 151,131 | 161,693 | — | — | — | — | — | 151,131 | 161,693 | ||||||||||||||||||||||||||||||
Long-term obligations: | ||||||||||||||||||||||||||||||||||||||||
Deferred income tax liabilities, net | 4,946 | — | 7,294 | 15,145 | — | 2,777 | 3,339 | 4,946 | — | 7,294 | ||||||||||||||||||||||||||||||
Other noncurrent liabilities | 62,971 | 38,455 | 14,111 | 14,267 | 2,979 | 287,081 | 342,003 | 62,971 | 38,455 | 14,111 | ||||||||||||||||||||||||||||||
Working capital | 2,587,508 | 1,660,960 | 1,080,542 | 901,495 | 790,888 | 3,436,964 | 2,875,801 | 2,587,508 | 1,660,960 | 1,080,542 | ||||||||||||||||||||||||||||||
Total assets | 4,583,074 | 3,338,240 | 2,374,560 | 1,838,306 | 1,325,981 | 6,521,571 | 5,507,933 | 4,583,074 | 3,338,240 | 2,374,560 | ||||||||||||||||||||||||||||||
Stockholders’ equity | 3,584,431 | 2,653,177 | 1,965,578 | 1,468,210 | 1,073,499 | 4,854,383 | 3,952,886 | 3,584,431 | 2,653,177 | 1,965,578 | ||||||||||||||||||||||||||||||
| Item 7. | Management’s Discussion and Analysis of Financial Condition and Results of Operations |
Executive Summary
In 2010,2012, our revenues increased to $4,592.4$7,346.5 million compared to $3,278.7$6,121.2 million in 2009.2011. Net income increased to $733.5$1,051.3 million or $2.37$3.44 per diluted share, including stock-based compensation expense, net of tax, equal to $0.14$0.26 per diluted share during 2010.2012. This is compared to net income of $535.0$883.6 million, or $1.78$2.85 per diluted share, including stock-based compensation expense, and applicable stock-based Indian fringe benefit tax expense, net of tax, of $0.12equal to $0.22 per diluted share during 2009.2011. The key drivers of our revenue growth in 20102012 were as follows:
strongStrong performance across all of our business segments, withparticularly our Manufacturing/Retail/Logistics, Financial Services and Healthcare business segments, which reported revenue growth ranging from 36.8% for Healthcare to 50.4% for Manufacturing, Retailof 25.2%, 20.5%, and Logisitics as19.3%, respectively, compared to 2009;2011;
continued penetration of the European market, particularlyContinued strength in the UKNorth America market where we experienced revenue growth of 58.2% asrevenues grew 21.5% or $1,033.3 million compared to 2009;2011;
increasedIncreased customer spending on post-acquisition integration engagements and discretionary development projects;
expansionExpansion of our service offerings, including IT IS and BPO services, which enabled us to cross-sell new services to our customers and meet the rapidly growing demand for complex large-scale outsourcing solutions;
increasedIncreased penetration at existing customers, including strategic customers;clients; and
continuedContinued expansion of the market for global delivery of IT services and business process outsourcing.
We saw a continued increase in demand from our customers for a broad range of IT solutions, including application maintenance, complex systems development engagements, testing, enterprise resource planning, or ERP, infrastructure management, business process outsourcing, or BPO, and business intelligence. We finished the year with approximately 712821 active clients compared to approximately 589785 as of December 31, 20092011 and increased the number of strategic clients by 2223 during the year bringing the total number of our strategic clients to 166.214. We define a strategic client as one offering the potential to generate at least $5 million to $50 million or more in annual revenues at maturity. Our top five and top ten customers accounted for 17.9%14.0% and 30.3%25.0%, respectively, of our total revenues in 20102012 as compared to 17.4%16.3% and 29.4%27.7%, respectively, for the year ended December 31, 2009.2011. As we continue to add new customers and increase our penetration at existing customers, we expect the percentage of revenues from our top five and top ten customers to decline over time.
Our revenue from European customers increased by 41.0% to approximately $855.6 million in 2010 compared to approximately $606.8 million in 2009. Revenue from Europe, excluding the UK, increased by approximately $43.0 million from approximately $253.3 million in 2009 to approximately $296.3 million in 2010 and revenue from the UK increased by approximately $205.8 million from approximately $353.5 million in 2009 to approximately $559.3 million in 2010. We believe that Europe will continue to be an area of significant investment for us as we see this region as well as the Middle East and the Asia Pacific regions, particularly Japan, India, Australia and Singapore, as growth opportunities for the long term.
Our revenue growth is also attributed to increasing market acceptance of, and strong demand for, offshore IT software and services and business process outsourcing. NASSCOM (India’s National Association of Software and Service Companies) reports indicate that export revenues from India’s IT software and services and business process outsourcing sectors are expected to exceed $76 billionmeet the lower-end of its growth guidance and at the end of NASSCOM’sleast achieve a double digit growth for NASSCOM’S fiscal year 2011. This is an expected growth rate of approximately 19% over the prior fiscal year.2013. According to the latest NASSCOMNASSCOM’s “Perspective 2020: Transform Business, Transform India” report, global changes and new megatrends within economic, demographic, business, social and environmental areas are set to expand the outsourcing industry by creating new dynamics and opportunities and are expected to result in export revenues of $175 billion by 2020.
Our revenue from European customers increased by 8.9% to approximately $1,195.5 million in 2012 compared to approximately $1,097.5 million in 2011. Revenue from Europe, excluding the UK, increased by approximately $31.9 million from approximately $398.6 million in 2011 to approximately $430.6 million in 2012 and revenue from the UK increased by approximately $66.1 million from approximately $698.9 million in 2011 to approximately $764.9 million in 2012. We believe that Europe, the Middle East and the Asia Pacific regions, particularly Japan, India, Australia and Singapore, will continue to be areas of significant investment for us as we see these regions as growth opportunities for the long term.
In 2010,2012, our operating margin decreased slightly to 18.8%18.5% compared to 18.9%18.6% in 2009.2011. Excluding stock-based compensation expense of approximately $57.0$107.4 million, operating margin in 20102012 was 20.0%. This was in line with
within our historic targeted operating margin range, excluding stock-based compensation costs, and applicable stock-based Indian fringe benefit tax expense, of 19% to 20% of total revenues. OperatingThe slight decrease in operating margin was affectedprimarily due to continued investments to grow our business partially offset by the appreciationfavorable impact of the depreciation of the Indian rupee versus the U.S. dollar, an increase in compensation costs, including incentive-based compensation costs,net of the impact of our cash flow hedge losses, and investments to groweconomies of scale driven by increased revenues that resulted from our business, partially offset by expanded sales and marketing activities in the current and prior years that allowed us to leverage our cost structure over a larger organization. Historically, we have invested our profitability above the 19% to 20% operating margin level, which excludes stock-based compensation, and any related stock-based Indian fringe benefit tax expense, back into our business, which we believe is a significant contributing factor to our strong revenue growth. This investment is primarily focused in the areas of:of hiring client partners and relationship personnel with specific industry experience or domain expertise;expertise, training our technical staff in a broader range of service offerings;offerings, strengthening our business analytic capabilities;analytics capabilities, strengthening and expanding our portfolio of services; continuing to expand our geographic presence for both sales and delivery; anddelivery as well as recognizing and rewarding exceptional performance by our employees. In addition, this investment includes maintaining a level of resources, trained in a broad range of service offerings, to be well positioned to respond to our customer requests to take on additional projects. For the year ending December 31, 2011,2013, we expect to continue to invest amounts in excess of our targeted operating margin levels back into the business.
We finished the year with total headcount of approximately 104,000,156,700 employees, which is an increase of approximately 25,60019,000 over the prior year. The increase in the number of our technical personnel and the related infrastructure costs to meet the demand for our services is the primary driver of the increase in our operating expenses in 2010.2012. Annualized turnover, including both voluntary and involuntary, was approximately 18.5%10.7% for 2010.2012. The majority of our turnover occurs in India. As a result, annualized attrition rates on-site at clients are below our global attrition rate. In addition, attrition is weighted towards the more junior members of our staff. We have experienced increases in compensation and benefit costs, including incentive-based compensation costs, in India which may continue in the future; however, historically, this has not had a material impact on our results of operations as we have been able to absorb such cost increases through price increases or cost management strategies such as managing discretionary costs, the mix of our professional staff andas well as utilization levels, and achieving other operating efficiencies.
Our current India real estate development program includes planned construction of an additional 8.010.5 million square feet of new space. The expanded program includes the expenditure of approximately $500.0 millionspace between 2011 and the end of 20142015. This program includes the expenditure of over $700.0 million during this period on land acquisition, facilities construction and furnishings to build new company-owned state-of-the-art IT development and delivery centers in regions primarily designated as Special Economic Zones, or SEZs, located in India. During 2011,2013, we expect to spend approximately $285$400 million globally for capital expenditures.expenditures, including the Indian real estate development program.
At December 31, 2010,2012, we had cash, and cash equivalents and short-term investments of $2,226.4$2,863.8 million and working capital of $2,587.5$3,437.0 million. Accordingly, we do not anticipate any near-term liquidity issues. During 2010 and 2009,2012, we repurchased $41.9approximately $486.0 million and $12.4 million, respectively, of our Class A common stock under variousour existing stock repurchase programs.program. Stock repurchases under these programs were funded from working capital.
While several measures have indicated that the economy may be improving, the global economic environment remains fragile. During 2011,2013, barring any unforeseen events, we expect the following factors to affect our business and our operating results:
Stabilization of global economic conditions and the financial services sector;
Normalization of customer IT budgets, which may result in spending by customers on discretionary projects, specifically application development projects;
Continued focus by customers on directing IT spending towards cost containment projects, such as application maintenance, infrastructure management and BPO;
Demand from our customers to help them achieve their dual mandate of simultaneously achieving cost savings while investing in innovation;
Secular changes driven by evolving technologies and regulatory changes;
ForeignVolatility in foreign currency volatility;rates; and
IncreaseContinued uncertainty in our effective income tax rate as a result of the expiration of tax holiday benefits related to our STP facilitiesworld economy, particularly in India.Europe.
In response to this fragile macroeconomic environment, we plan to:
Continue to invest in our talent base and new service offerings;
Partner with our existing customers to provide innovative solutions resulting in our garneringgarner an increased portion of our customers’ overall IT spend;spend by providing innovative solutions;
Continue our focus on growing our business in Europe, the Middle East and the Asia Pacific region, where we believe there are opportunities to gain market share;
Continue to increase our strategic customer base across all of our business segments;
Opportunistically look for acquisitions that canmay improve our overall service delivery capabilities;capabilities, expand our geographic presence and/or enable us to enter new areas of technology;
Continue to focus on operating focus and discipline in order to appropriately manage our cost structure; and
Continue to locate most of our new development center facilities in SEZs to take advantage of SEZ tax incentives.incentivized areas.
Critical Accounting Estimates and Risks
Management’s discussion and analysis of our financial condition and results of operations is based on our accompanying consolidated financial statements that have been prepared in accordance with accounting principles generally accepted in the United States of America. The preparation of these financial statements requires management to make estimates and assumptions that affect the amounts reported for assets and liabilities, including the recoverability of tangible and intangible assets, disclosure of contingent assets and liabilities as of the date of the financial statements, and the reported amounts of revenues and expenses during the reported period. On an on-going basis, we evaluate our estimates. The most significant estimates relate to the recognition of revenue and profits based on the percentage of completion method of accounting for certain fixed-bid contracts, the allowance for doubtful accounts, income taxes, valuation of short and long-term investments, goodwill and other long-lived assets, assumptions used in valuing stock-based compensation awards and derivative financial investments, contingencies and litigation. We base our estimates on historical experience and on various other assumptions that are believed to be reasonable under the circumstances, the results of which form the basis for making judgments about the carrying values of assets and liabilities that are not readily apparent from other sources. The actual amounts may differ from the estimates used in the preparation of the accompanying consolidated financial statements. Our significant accounting policies are described in Note 1 to the accompanying consolidated financial statements.
We believe the following critical accounting policies require a higher level of management judgments and estimates than others in preparing the consolidated financial statements:
Revenue Recognition. Revenues related to our highly complex information technology application development contracts, which are predominantly fixed-price contracts, are recognized as the services are performed using the percentage of completion method of accounting. Under this method, total contract revenue during the term of an agreement is recognized on the basis of the percentage that each contract’s total labor cost to date bears to the total expected labor cost (cost to cost method). This method is followed where reasonably dependable estimates of revenues and costs can be made. Management reviews total expected labor costs on an ongoing basis. Revisions to our estimates may result in increases or decreases to revenues and income and are reflected in the consolidated financial statements in the periods in which they are first identified. If our estimates indicate that a contract loss will be incurred, a loss provision is recorded in the period in which the loss first becomes probable and reasonably estimable. Contract losses are determined to be the amount by which the
estimated costs of the contract exceed the estimated total revenues that will be generated by the contract and are included in cost of revenues in our consolidated statement of operations. Contract losses for the periods presented were immaterial.
Stock-Based Compensation. Utilizing the fair value recognition provisions prescribed by the authoritative guidance, stock-based compensation cost is measured at the grant date based on the value of the award and is recognized as expense over the vesting period. Determining the fair value of stock-based awards at the grant date requires judgment, including estimating the expected term over which the stock awards will be outstanding before they are exercised, the expected volatility of our stock and the number of stock-based awards that are expected to be forfeited. In addition, for performance stock units, we are required to estimate the most probable outcome of the performance conditions in order to determine the amount of stock compensation costs to be recorded over the vesting period. If actual results differ significantly from our estimates, stock-based compensation expense and our results of operations could be materially impacted.
Income Taxes.Determining the consolidated provision for income tax expense, deferred income tax assets and liabilities and related valuation allowance, if any, involves judgment. As a global company, we are required to calculate and provide for income taxes in each of the jurisdictions where we operate. Changes in the geographic mix or estimated level of annual pre-tax income can also affect the overall effective income tax rate.
Our provision for income taxes also includes the impact of provisions established for uncertain income tax positions, as well as the related net interest. Tax exposures can involve complex issues and may require an extended period to resolve. Although we believe we have adequately reserved for our uncertain tax positions, no assurance can be given that the final tax outcome of these matters will not be different. We adjust these reserves in light of changing facts and circumstances, such as the closing of a tax audit or the refinement of an estimate. To the extent that the final tax outcome of these matters differs from the amounts recorded, such differences will impact the provision for income taxes in the period in which such determination is made.
On an on-going basis, we evaluate whether a valuation allowance is needed to reduce our deferred income tax assets to the amount that is more likely than not to be realized. While we have considered future taxable income and on-going prudent and feasible tax planning strategies in assessing the need for the valuation allowance, in the event we determine that we will be able to realize deferred income tax assets in the future in excess of the net recorded amount, an adjustment to the deferred income tax asset would increase income in the period such determination was made. Likewise, should we determine that we will not be able to realize all or part of the net deferred income tax asset in the future, an adjustment to the deferred income tax asset would reduce income in the period such determination was made.
Our Indian subsidiaries, which are referred to collectively herein as Cognizant India, are export-oriented companies which, under the Indian Income Tax Act of 1961, are entitled to claim tax holidays for a period of ten consecutive years for each Software Technology Park, or STP, with respect to export profits for each STP. Substantially all of the earnings of Cognizant India are attributable to export profits. The majority of our STPs in India are currently entitled to a 100% exemption from Indian income tax. In addition, we have constructed our newer development facilities in SEZs, which are entitled to certain income tax incentives for periods up to 15 years. We expect to continue to locate most of our new development centers in these areas.
The tax holidays for STPs are currently scheduled to expire on March 31, 2011. Thereafter, export profits from our existing STPs will be fully taxable at the Indian statutory rate (33.22% as of December 31, 2010) in effect at such time. If the tax holidays relating to our Indian STPs are not extended or new tax incentives are not introduced that would effectively extend the income tax holiday benefits beyond March 2011, our effective income tax rate will increase significantly beginning in calendar year 2011.
Derivative Financial Instruments.Derivative financial instruments are accounted for in accordance with the authoritative guidance which requires that each derivative instrument be recorded on the balance sheet as either an asset or liability measured at its fair value as of the reporting date. Our derivative financial instruments consist of foreign exchange forward contracts. We estimate the fair value of each foreign exchange forward contract by using a present value of expected cash flows model. This model utilizes various assumptions, including, but not limited to timing and amounts of cash flows, discount rates, and credit risk factors. The use of different assumptions could have a positive or negative effect on our results of operations and financial condition.
Investments. Our investment portfolio is primarily comprised of U.S. dollar denominated corporate bonds, municipal bonds, debt issuances by the U.S. government, U.S. government agencies, foreign governments and supranational entities, asset-backed securities, and bank time deposits. The asset-backed securities include securities backed by auto loans, credit card receivables, and other receivables and are rated AAA/Aaa. The years of issuance of our asset-backed securities fall in the 2001 to 2010 range. Historically, our investments have also included municipal debt securities with interest rates that reset through a Dutch auction process.
We utilize various inputs to determine the fair value of our investment portfolio. To the extent they exist, unadjusted quoted market prices for identical assets in active markets (Level 1) or quoted prices on similar assets (Level 2) are utilized to determine the fair value of each investment in the portfolio. In the absence of quoted prices or liquid markets, valuation techniques would be used to determine fair value of any investments that require inputs that are both significant to the fair value measurement and unobservable (Level 3). Valuation techniques are based on various assumptions, including, but not limited to timing and amounts of cash flows, discount rates, rate of return, and adjustments for nonperformance and liquidity. A significant degree of judgment is involved in valuing investments using Level 3 inputs. The use of different assumptions could have a positive or negative effect on our results of operations and financial condition. See Note 10 for additional information related to our security valuation methodologies.
We periodically evaluate if unrealized losses, as determined based on the security valuation methodologies discussed above, on individual securities classified as available for sale in the investment portfolio are considered to be other-than-temporary. The analysis of other-than-temporary impairment requires the use of various assumptions, including, but not limited to, the length of time an investment’s book value is greater than fair value, the severity of the investment’s decline, any credit deterioration of the investment, whether management intends to sell the security and whether it is more likely than not that we will be required to sell the security prior to recovery of its amortized cost basis. Once a decline in fair value is determined to be other-than-temporary, an impairment charge is generally recorded to earnings and a new cost basis in the investment is established.
Allowance for Doubtful Accounts. We maintain an allowance for doubtful accounts for estimated losses resulting from the inability of our customers to make required payments. The allowance for doubtful accounts is determined by evaluating the relative credit-worthiness of each customer, historical collections experience and other information, including the aging of the receivables. If the financial condition of our customers were to deteriorate, resulting in an impairment of their ability to make payments, additional allowances may be required.
Goodwill.We evaluate goodwill for impairment at least annually, or as circumstances warrant. When determining the fair value of our reporting units, we utilize various assumptions, including projections of future cash flows. Any adverse changes in key assumptions about our businesses and their prospects or an adverse change in market conditions may cause a change in the estimation of fair value and could result in an impairment charge. Based upon our most recent evaluation of goodwill, there are no significant risks of impairment. As of December 31, 2010, our goodwill balance was $224.0 million.
Long-Lived Assets. We review long-lived assets and certain identifiable intangibles for impairment whenever events or changes in circumstances indicate that the carrying amount of an asset may not be recoverable. In general, we will recognize an impairment loss when the sum of undiscounted expected future
cash flows is less than the carrying amount of such asset. The measurement for such an impairment loss is then based on the fair value of the asset. If such assets were determined to be impaired, it could have a material adverse effect on our business, results of operations and financial condition.
Risks.The majority of our development and delivery centers, including a majority of our employees, are located in India. As a result, we may be subject to certain risks associated with international operations, including risks associated with foreign currency exchange rate fluctuations and risks associated with the application and imposition of protective legislation and regulations relating to import and export or otherwise resulting from foreign policy or the variability of foreign economic or political conditions. Additional risks associated with international operations include difficulties in enforcing intellectual property rights, limitations on immigration programs, the burdens of complying with a wide variety of foreign laws, potential geo-political and other risks associated with terrorist activities and local and cross border conflicts, and potentially adverse tax consequences, tariffs, quotas and other barriers. We are also subject to risks associated with our overall compliance with Section 404 of the Sarbanes-Oxley Act of 2002. The inability of our management to ensure the adequacy and effectiveness of our internal control over financial reporting for future year ends could result in adverse consequences to us, including, but not limited to, a loss of investor confidence in the reliability of our financial statements, which could cause the market price of our stock to decline. See Part I, Item 1A. “Risk Factors.”
Results of Operations
The following table sets forth, for the periods indicated, certain financial data expressed for the three years ended December 31, 2010:2012:
(Dollars in thousands)
| 2010 | % of Revenues | 2009 | % of Revenues | 2008 | % of Revenues | Increase (Decrease) | 2012 | % of Revenues | 2011 | % of Revenues | 2010 | % of Revenues | Increase (Decrease) | |||||||||||||||||||||||||||||||||||||||||||||||||||
| 2010 | 2009 | 2012 | 2011 | |||||||||||||||||||||||||||||||||||||||||||||||||||||||||||||
Revenues | $ | 4,592,389 | 100.0 | % | $ | 3,278,663 | 100.0 | % | $ | 2,816,304 | 100.0 | % | $ | 1,313,726 | $ | 462,359 | $ | 7,346,472 | 100.0 | $ | 6,121,156 | 100.0 | $ | 4,592,389 | 100.0 | $ | 1,225,316 | $ | 1,528,767 | |||||||||||||||||||||||||||||||||||
Cost of revenues(1) | 2,654,569 | 57.8 | 1,849,443 | 56.4 | 1,572,816 | 55.8 | 805,126 | 276,627 | 4,278,241 | 58.2 | 3,538,622 | 57.8 | 2,654,569 | 57.8 | 739,619 | 884,053 | ||||||||||||||||||||||||||||||||||||||||||||||||
Selling, general and administrative(2) | 972,093 | 21.2 | 721,359 | 22.0 | 652,021 | 23.2 | 250,734 | 69,338 | 1,557,646 | 21.2 | 1,328,665 | 21.7 | 972,093 | 21.2 | 228,981 | 356,572 | ||||||||||||||||||||||||||||||||||||||||||||||||
Depreciation and amortization | 103,875 | 2.3 | 89,371 | 2.7 | 74,797 | 2.7 | 14,504 | 14,574 | 149,089 | 2.0 | 117,401 | 1.9 | 103,875 | 2.3 | 31,688 | 13,526 | ||||||||||||||||||||||||||||||||||||||||||||||||
|
|
|
|
| ||||||||||||||||||||||||||||||||||||||||||||||||||||||||||||
Income from operations | 861,852 | 18.8 | 618,490 | 18.9 | 516,670 | 18.3 | 243,362 | 101,820 | 1,361,496 | 18.5 | 1,136,468 | 18.6 | 861,852 | 18.8 | 225,028 | 274,616 | ||||||||||||||||||||||||||||||||||||||||||||||||
Other income (expense), net | 16,728 | 18,461 | (1,460 | ) | (1,733 | ) | 19,921 | 26,100 | 32,681 | 16,728 | (6,581 | ) | 15,953 | |||||||||||||||||||||||||||||||||||||||||||||||||||
Provision for income taxes | 145,040 | 101,988 | 84,365 | 43,052 | 17,623 | 336,333 | 285,531 | 145,040 | 50,802 | 140,491 | ||||||||||||||||||||||||||||||||||||||||||||||||||||||
|
|
|
|
| ||||||||||||||||||||||||||||||||||||||||||||||||||||||||||||
Net income | $ | 733,540 | 16.0 | % | $ | 534,963 | 16.3 | % | $ | 430,845 | 15.3 | % | $ | 198,577 | $ | 104,118 | $ | 1,051,263 | 14.3 | $ | 883,618 | 14.4 | $ | 733,540 | 16.0 | $ | 167,645 | $ | 150,078 | |||||||||||||||||||||||||||||||||||
|
|
|
|
| ||||||||||||||||||||||||||||||||||||||||||||||||||||||||||||
| (1) | Includes stock-based compensation expense of |
| (2) | Includes stock-based compensation expense of |
The following table includes non-GAAP income from operations, excluding stock-based compensation, and stock-based Indian fringe benefit tax expense, a measure defined by the Securities and Exchange Commission as a non-GAAP financial measure. This non-GAAP financial measure is not based on any comprehensive set of accounting rules or principles and should not be considered a substitute for, or superior to, financial measures calculated in accordance with GAAP, and may be different from non-GAAP measures used by other companies. In addition, this non-GAAP measure theshould be read in conjunction with our financial statements prepared in accordance with GAAP andGAAP. The reconciliations of ourCognizant’s GAAP financial statementsmeasures to suchthe corresponding non-GAAP measuremeasures should be carefully evaluated.
We seek to manage the company to a targeted operating margin, excluding stock-based compensation expense and stock-based Indian fringe benefit tax expense, of 19% to 20% of revenues. Accordingly, we believe that non-GAAP income from operations, excluding stock-based compensation expense, and applicable stock-based Indian fringe benefit tax, which was repealed during the third quarter of 2009, retroactive to April 1, 2009, is a meaningful measure for investors to evaluate our financial performance. We believe providing investors with an operating view consistent with how we manage the company provides enhanced transparency into the operating results of the company. For our internal management reporting and budgeting purposes we use financial statements that do not include stock-based compensation expense and applicable stock-based Indian fringe benefit tax expense for financial and operational decision making to evaluate period-to-period comparisons and for making comparisons of our operating results to that of our competitors. Moreover, because of varying available valuation methodologies and the variety of award types that companies can use to account for stock-based compensation expense, we believe that providing a non-GAAP financial measure that excludes stock-based compensation expense and applicable stock-based Indian fringe benefit tax expense allows investors to make additional comparisons between our operating results and those of
other companies. Accordingly, we believe that the presentation of non-GAAP income from operations when read in conjunction with our reported GAAP income from operations can provide useful supplemental information to our management and to investors regarding financial and business trends relating to our financial condition and results of operations.
A limitation of using non-GAAP income from operations versus income from operations reported in accordance with GAAP is that non-GAAP income from operations excludes costs, namely, stock-based compensation thatexpense, which is recurring and applicable stock-based Indian fringe benefit tax.recurring. Stock-based compensation expense will continue to be for the foreseeable future a significant recurring expense in our business. In addition, other companies may calculate non-GAAP financial measures differently than us, thereby limiting the usefulness of this non-GAAP financial measure as a comparative tool. We compensate for these limitations by providing specific information regarding the GAAP amounts excluded from non-GAAP income from operations and evaluatingto allow investors to evaluate such non-GAAP financial measures with financial measures calculated in accordance with GAAP.
A reconciliation of income from operations as reported and non-GAAP income from operations, excluding stock-based compensation expense, and stock-based Indian fringe benefit tax expense, is as follows for the years ended December 31:
(Dollars in thousands)
| 2010 | % of Revenues | 2009 | % of Revenues | 2008 | % of Revenues | |||||||||||||||||||
Income from operations, as reported | $ | 861,852 | 18.8 | % | $ | 618,490 | 18.9 | % | $ | 516,670 | 18.3 | % | ||||||||||||
Add: stock-based compensation expense | 56,984 | 1.2 | 44,816 | 1.4 | 43,900 | 1.6 | ||||||||||||||||||
Add: stock-based Indian fringe benefit tax expense | — | — | 945 | — | 8,149 | 0.3 | ||||||||||||||||||
Non-GAAP income from operations, excluding stock-based compensation expense and stock-based Indian fringe benefit tax expense | $ | 918,836 | 20.0 | % | $ | 664,251 | 20.3 | % | $ | 568,719 | 20.2 | % | ||||||||||||
The fringe benefit tax regulation in India obligated us to pay, upon exercise or distribution of shares under a stock-based compensation award, a non-income related tax on the appreciation of the award from date of grant to date of vest. There was no cash cost to us as we recovered the cost of the Indian fringe benefit tax from the employee’s proceeds from the award. Under U.S. GAAP, the stock-based Indian fringe benefit tax expense is required to be recorded as an operating expense and the related recovery of such tax from our employee is required to be recorded to stockholders’ equity as proceeds from a stock-based compensation award. During the third quarter of 2009, the Indian government repealed the fringe benefit tax retroactive to April 1, 2009.
| 2012 | % of Revenues | 2011 | % of Revenues | 2010 | % of Revenues | |||||||||||||||||||
Income from operations, as reported | $ | 1,361,496 | 18.5 | $ | 1,136,468 | 18.6 | $ | 861,852 | 18.8 | |||||||||||||||
Add: stock-based compensation expense | 107,355 | 1.5 | 90,232 | 1.4 | 56,984 | 1.2 | ||||||||||||||||||
|
|
|
|
|
| |||||||||||||||||||
Non-GAAP income from operations, excluding stock-based compensation expense | $ | 1,468,851 | 20.0 | $ | 1,226,700 | 20.0 | $ | 918,836 | 20.0 | |||||||||||||||
|
|
|
|
|
| |||||||||||||||||||
Year Ended December 31, 20102012 Compared to Year Ended December 31, 20092011
Revenue. Revenue increased by 40.1%,20% or approximately $1,313.7$1,225.3 million, from approximately $3,278.7$6,121.2 million during 20092011 to approximately $4,592.4$7,346.5 million in 2010.2012. This increase was primarily attributed to greater acceptance of theour global delivery model among an increasing number of industries, continued interest in using theour global delivery model as a means to reduce overall IT and operations costs, increased customer spending on post-acquisition integration engagements and discretionary development projects, and greatercontinued penetration in the European market.all our geographic markets. Revenue from customers existing as of December 31, 20092011 increased by approximately $1,193.3$1,088.8 million and revenue from new customers added during 20102012 was approximately $120.4$136.5 million or approximately 9.2%11.1% of the year over year revenue increase and 2.6%1.9% of total revenues for the year ended December 31, 2010.2012. In addition, revenue from our North American, European and EuropeanRest of World customers increased in 20102012 by $988.5$1,033.3 million, $98.0 million and $248.8$94.0 million, respectively, as compared to 2009.2011. We had approximately 712821 active clients as
clients as of December 31, 20102012 as compared to approximately 589785 active clients as of December 31, 2009.2011. In addition, we experienced strong demand across all of our business segments for an increasingly broad range of services. Our Financial Services, Healthcare, and HealthcareManufacturing/Retail/Logistics business segments accounted for approximately $537.8$517.0 million, $312.7 million and $316.7$301.2 million, respectively, of the $1,313.7$1,225.3 million increase in revenue. Additionally, our IT consulting and technology services and IT outsourcing revenues increased by approximately 52.1%20.4% and 30.4%19.6%, respectively, compared to 20092011 and represented approximately 48.3%51.1% and 51.7%,48.9% respectively, of total revenues in 2010.2012. No customer accounted for sales in excess of 10% of revenues during 2010 and 2009.2012 or 2011.
Cost of Revenues (Exclusive of Depreciation and Amortization Expense). Our cost of revenues consists primarily of salaries, incentive-based compensation, stock-based compensation expense, payroll taxes, employee benefits, immigration and project-related travel for technical personnel, subcontracting and sales commissions related to revenues. Our cost of revenues increased by approximately 43.5%20.9% or $805.2$739.6 million from $1,849.4 million during 2009 to $2,654.6$3,538.6 million in 2010.2011 to $4,278.2 million in 2012. The increase was due primarily to an increase in compensation and benefits costs of approximately $671.2$660.3 million, resulting primarily from the increase in the number of our technical personnel, and incentive-based compensation, as well aspartially offset by the appreciationfavorable impact of the depreciation of the Indian rupee versus the U.S. dollar.dollar, net of the impact of our cash flow hedge losses.
Selling, General and Administrative Expenses. Selling, general and administrative expenses consist primarily of salaries, incentive-based compensation, stock-based compensation expense, payroll taxes, employee benefits, travel, promotion, communications, management, finance, administrative and occupancy costs. Selling, general and administrative expenses, including depreciation and amortization, increased by approximately 32.7%18.0% or $265.2$260.7 million, from $810.7$1,446.1 million during 2009,2011, to $1,075.9$1,706.7 million during 2010,2012, and decreased as a percentage of revenue from 24.7%23.6% in 20092011 to 23.4%23.2% in 2010.2012. The decrease as a percentage of revenue was due primarily to the favorable impact of the depreciation of the Indian rupee versus the U.S. dollar, net of the impact of our cash flow hedge losses, and economies of scale driven by increased revenues that resulted from our expanded sales and marketing activities in the current and prior years that allowed us to leverage our cost structure over a larger organization, partially offset by an increase in compensationinvestments to grow our business and benefit costs, including incentive-based compensation andexpenses related to the impactexpansion of the appreciation of the Indian rupee versus the U.S. dollar.our infrastructure to support our revenue growth.
Income from Operations. Income from operations increased approximately 39.3%19.8%, or $243.4$225.0 million, from approximately $618.5$1,136.5 million during 20092011 to approximately $861.9$1,361.5 million during 2010,2012, representing operating margins of 18.8%18.5% of revenues in 20102012 and 18.9%18.6% of revenues in 2009.2011. The slight decrease in operating margin was impacted by an increase in compensation and benefit costs, including incentive-based compensation costs, andprimarily due to continued investments to grow our business partially offset by the favorable impact of the depreciation of the Indian rupee versus the U.S. dollar, net of the impact of our cash flow hedge losses, and economies of scale driven by increased revenues that resulted from our expanded sales and marketing activities in the current and prior years that allowed us to leverage our cost structure over a larger organization. Excluding the impact of applicable designated cash flow hedges, the appreciationdepreciation of the Indian rupee against the U.S. dollar negativelypositively impacted our operating margin by approximately 157355 basis points or 1.573.55 percentage points. Each additional 1.0% change in the exchange rate between the Indian rupee and the U.S. dollar will have the effect of moving our operating margin by approximately 2724 basis points or 0.270.24 percentage points. Excluding stock-based compensation expense of $57.0$107.4 million and $44.8$90.2 million for 20102012 and 2009 and stock-based Indian fringe benefit tax expense of $0.9 million in 2009,2011, respectively, operating margins for each of the two years ended December 31, 2010 and 2009 were 20.0% and 20.3%, respectively..
We entered into foreign exchange forward contracts to hedge certain salaryIndian rupee denominated payments in India. These hedges are intended to mitigate the volatility of the changes in the exchange rate between the U.S. dollar and the Indian rupee. During 2010,2012, the settlement of certain cash flow hedges favorablynegatively impacted our operating margin by approximately 91131 basis points or 0.911.31 percentage points.
Other Income (Expense), Net. Total other income (expense), net consists primarily of foreign currency exchange gains and (losses) and interest income. The following table sets forth, for the periods indicated, Total other income (expense), net:
(Dollars in thousands)
| 2010 | 2009 | Increase/ (Decrease) | 2012 | 2011 | Increase/ (Decrease) | |||||||||||||||||||
Foreign currency exchange gains | $ | 11,220 | $ | 22,493 | $ | (11,273 | ) | |||||||||||||||||
(Losses) on foreign exchange forward contracts not designated as hedging instruments | (21,088 | ) | (20,821 | ) | (267 | ) | ||||||||||||||||||
Foreign currency exchange (losses) | $ | (11,745 | ) | $ | (32,400 | ) | $ | 20,655 | ||||||||||||||||
(Losses) gains on foreign exchange forward contracts not designated as hedging instruments | (8,270 | ) | 23,621 | (31,891 | ) | |||||||||||||||||||
|
|
| ||||||||||||||||||||||
Net foreign currency exchange (losses) gains | (9,868 | ) | 1,672 | (11,540 | ) | |||||||||||||||||||
Net foreign currency exchange (losses) | (20,015 | ) | (8,779 | ) | (11,236 | ) | ||||||||||||||||||
Interest income | 25,793 | 15,895 | 9,898 | 44,514 | 39,249 | 5,265 | ||||||||||||||||||
Other, net | 803 | 894 | (91 | ) | 1,601 | 2,211 | (610 | ) | ||||||||||||||||
|
|
| ||||||||||||||||||||||
Total other income (expense), net | $ | 16,728 | $ | 18,461 | $ | (1,733 | ) | $ | 26,100 | $ | 32,681 | $ | (6,581 | ) | ||||||||||
|
|
| ||||||||||||||||||||||
The foreign currency exchange gainslosses of approximately $11.2$11.7 million were primarily attributed to intercompany transactions between our European subsidiaries and Cognizant India for services performed by Cognizant India on behalf of our European customers and the remeasurement of the Indian rupee net monetary assets on Cognizant India’s books to the U.S. dollar functional currency. The $21.1$8.3 million of losses on foreign exchange forward contracts not designated as hedging instruments relate to the realized and unrealized losses on foreign exchange forward contracts entered into primarily to offset foreign currency exposure to Indian rupee denominated net monetary assets. At December 31, 2012, the notional value of our undesignated hedges was $208.6 million. The $5.3 million increase in interest income was primarily attributed to higher invested balances.
Provision for Income Taxes. The provision for income taxes increased from approximately $285.5 million in 2011 to approximately $336.3 million in 2012. The effective income tax rate decreased slightly from 24.4% in 2011 to 24.2% in 2012. The decrease in our effective income tax rate was primarily attributed to favorable discrete items in 2012 partially offset by the scheduled reduction in 2012 of certain income tax holiday benefits in India.
Net Income. Net income increased from approximately $883.6 million in 2011 to approximately $1,051.3 million in 2012, representing 14.4% and 14.3% of revenues, respectively.
Year Ended December 31, 2011 Compared to Year Ended December 31, 2010
Revenue. Revenue increased by 33.3%, or approximately $1,528.8 million, from approximately $4,592.4 million during 2010 to approximately $6,121.2 million in 2011. This increase was primarily attributed to greater acceptance of our global delivery model among an increasing number of industries, continued interest in using our global delivery model as a means to reduce overall IT costs and increased customer spending on discretionary projects. Revenue from customers existing as of December 31, 2010 increased by approximately $1,371.3 million and revenue from new customers added during 2011 was approximately $157.5 million or approximately 10.3% of the year over year revenue increase and 2.6% of total revenues for the year ended December 31, 2011. In addition, revenue from our North American and European customers increased in 2011 by $1,220.2 million and $241.9 million, respectively, as compared to 2010. We had approximately 785 active clients as of December 31, 2011 as compared to approximately 712 active clients as of December 31, 2010. In addition, we experienced strong demand across all of our business segments for an increasingly broad range of services. Our Financial Services and Healthcare business segments accounted for approximately $574.0 million and $445.0 million, respectively, of the $1,528.8 million increase in revenue. Additionally, our consulting and technology services and outsourcing revenues increased by approximately 40.7% and 26.4%, respectively, compared to 2010 and represented approximately 50.9% and 49.1%, respectively, of total revenues in 2011. No customer accounted for sales in excess of 10% of revenues during 2011 or 2010.
Cost of Revenues (Exclusive of Depreciation and Amortization Expense). Our cost of revenues consists primarily of salaries, incentive-based compensation, stock-based compensation expense, payroll taxes, employees benefits, immigration and project-related travel for technical personnel, subcontracting and sales commissions related to revenues. Our cost of revenues increased by approximately 33.3% or $884.0 million from $2,654.6 million during 2010 to $3,538.6 million in 2011. The increase was due primarily to an increase in compensation and benefits costs of approximately $821.8 million, resulting from the increase in the number of our technical personnel necessary to support our revenue growth.
Selling, General and Administrative Expenses. Selling, general and administrative expenses consist primarily of salaries, incentive-based compensation, stock-based compensation expense, payroll taxes, employee benefits, travel, promotion, communications, management, finance, administrative and occupancy costs. Selling, general and administrative expenses, including depreciation and amortization, increased by approximately 34.4% or $370.1 million, from $1,076.0 million during 2010, to $1,446.1 million during 2011, and increased as a percentage of revenue from 23.4% in 2010 to 23.6% in 2011. The increase as a percentage of revenue was due primarily to increases in compensation and benefit costs and investments to grow our business, including expanded sales and marketing activities.
Income from Operations. Income from operations increased approximately 31.9%, or $274.6 million, from approximately $861.9 million during 2010 to approximately $1,136.5 million during 2011, representing operating margins of 18.6% of revenues in 2011 and 18.8% of revenues in 2010. The decrease in operating margin was attributed to an increase in compensation and benefit costs and investments to grow our business, including expanded sales and marketing activities. Excluding the impact of applicable designated cash flow hedges, the depreciation of the Indian rupee against the U.S. dollar positively impacted our operating margin by approximately 54 basis points or 0.54 percentage points. Each additional 1.0% change in the exchange rate between the Indian rupee and the U.S. dollar will have the effect of moving our operating margin by approximately 27 basis points or 0.27 percentage points. Excluding stock-based compensation expense of $90.2 million and $57.0 million for 2011 and 2010, respectively, operating margins for the years ended December 31, 2011 and 2010 were 20.0% and 20.0%, respectively.
We entered into foreign exchange forward contracts to hedge certain Indian rupee denominated payments in India. These hedges are intended to mitigate the volatility of the changes in the exchange rate between the U.S. dollar and the Indian rupee. During 2011, settlement of certain cash flow hedges favorably impacted our operating margin by approximately 31 basis points or 0.31 percentage points.
Other Income (Expense), Net. Total other income (expense), net consists primarily of foreign currency exchange gains and (losses) and interest income. The following table sets forth, for the periods indicated, Total other income (expense), net:
(Dollars in thousands)
| 2011 | 2010 | Increase / (Decrease) | ||||||||||
Foreign currency exchange (losses) gains | $ | (32,400 | ) | $ | 11,220 | $ | (43,620 | ) | ||||
Gains (losses) on foreign exchange forward contracts not designated as hedging instruments | 23,621 | (21,088 | ) | 44,709 | ||||||||
|
|
|
|
|
| |||||||
Net foreign currency exchange (losses) | (8,779 | ) | (9,868 | ) | 1,089 | |||||||
Interest income | 39,249 | 25,793 | 13,456 | |||||||||
Other, net | 2,211 | 803 | 1,408 | |||||||||
|
|
|
|
|
| |||||||
Total other income (expense), net | $ | 32,681 | $ | 16,728 | $ | 15,953 | ||||||
|
|
|
|
|
| |||||||
The foreign currency exchange losses of approximately $32.4 million were primarily attributed to the remeasurement of the Indian rupee net monetary assets on Cognizant India’s books to the U.S. dollar functional
currency. The $23.6 million of gains on foreign exchange forward contracts were primarily related to the change in fair value of foreign exchange forward contracts entered into to offset foreign currency exposure to Indian rupee denominated net monetary assets and the realized losses related to the settlement of certain foreign exchange forward contracts in 2010.2011. At December 31, 2010,2011, the notional value of theseour undesignated hedges was $234.0$234.2 million. The $9.9$13.5 million increase in interest income was primarily attributed to higher invested balances.
Provision for Income Taxes. The provision for income taxes increased from approximately $102.0 million in 2009 to approximately $145.0 million in 2010.2010 to approximately $285.5 million in 2011. The effective income tax rate increased from 16.0% in 2009 to 16.5% in 2010.2010 to 24.4% in 2011. The increase in our effective income tax rate was primarily attributed to discretethe expiration of India’s STP tax itemsholiday program in 2010, a higher U.S. state effective income tax rate in 2010, as well as an increase in our taxable income in India resulting from an increase in non-export profits that are taxable at the India statutory rate.2011.
Net Income. Net income increased from approximately $535.0 million in 2009 to approximately $733.5 million in 2010 to approximately $883.6 million in 2011, representing 16.3%16.0% and 16.0%14.4% of revenues, respectively. The decrease in net income as a percentage of revenues in 20102011 is primarily attributed to an increase in net foreign currency exchange losses and a higher effective income tax rate.
Year Ended December 31, 2009 Compared to Year Ended December 31, 2008
Revenue. Revenue increased by 16.4%, or approximately $462.4 million, from approximately $2,816.3 million during 2008 to approximately $3,278.7 millionrate in 2009. This increase was primarily attributed to greater acceptance of the global delivery model among an increasing number of industries, continued interest in using the global delivery model as a means to reduce overall IT costs and greater penetration in the European market. Revenue from customers existing as of December 31, 2008 increased by approximately $375.9 million and revenue from new customers added during 2009 was approximately $86.5 million or approximately 18.7% of the year over year revenue increase and 2.6% of total revenues for the year ended December 31, 2009. In addition, revenue from our North American and European customers increased in 2009 by $365.9 million and $65.7 million, respectively, as compared to 2008. We had approximately 589 active clients as of December 31, 2009 as compared to approximately 565 active clients as of December 31, 2008. In addition, we experienced strong demand across all of our business segments for an increasingly broad range of services. Our Financial Services and Healthcare business segments accounted for approximately $122.6 million and $172.2 million, respectively, of the $462.4 million increase in revenue. Additionally, our IT consulting and technology services and IT outsourcing revenues increased by approximately 10.2% and 21.9%, respectively, compared to 2008 and represented approximately 44.4% and 55.6%, respectively, of total revenues in 2009.
Cost of Revenues (Exclusive of Depreciation and Amortization Expense). Our cost of revenues consists primarily of salaries, incentive-based compensation, stock-based compensation expense and related stock-based Indian fringe benefit tax expense, payroll taxes, benefits, immigration and project-related travel for technical personnel, subcontracting and sales commissions related to revenues. Our cost of revenues increased by approximately 17.6% or $276.6 million from $1,572.8 million during 2008 to $1,849.4 million in 2009. The increase was due primarily to higher compensation and benefits costs of approximately $267.1 million, inclusive of the depreciation of the Indian rupee, resulting from the increase in the number of our technical personnel, and incentive-based compensation, offset by continued improvements in operating efficiencies.
Selling, General and Administrative Expenses. Selling, general and administrative expenses consist primarily of salaries, incentive-based compensation, stock-based compensation expense and related stock-based Indian fringe benefit tax expense, employee benefits, travel, promotion, communications, management, finance, administrative and occupancy costs. Selling, general and administrative expenses, including depreciation and amortization, increased by approximately 11.5% or $83.9 million, from $726.8 million during 2008, to $810.7 million during 2009, and decreased as a percentage of revenue from 25.8% in 2008 to 24.7% in 2009. The decrease as a percentage of revenue was due primarily to the favorable impact of the depreciation of the Indian rupee versus the U.S. dollar, economies of scale driven by increased revenues that resulted from our expanded sales and marketing activities in the current and prior years that allowed us to leverage our cost structure over a larger organization, reductions in discretionary spending, partially offset by an increase in compensation and benefit costs, including incentive-based compensation, depreciation and amortization expense and expenses related to the expansion of our infrastructure to support our revenue growth.
Income from Operations. Income from operations increased approximately 19.7%, or $101.8 million, from approximately $516.7 million during 2008 to approximately $618.5 million during 2009, representing operating margins of approximately 18.9% of revenues in 2009 and 18.3% of revenues in 2008. The operating margin increase was primarily due to the favorable impact of the depreciation of the Indian rupee versus the U.S. dollar and achieving operating efficiencies as a result of revenue growth outpacing our headcount growth, partially offset by an increase in compensation and benefit costs, including incentive-based compensation costs, and investments to grow our business. Excluding the impact of applicable designated cash flow hedges, the depreciation of the Indian rupee against the U.S. dollar favorably impacted our operating margin by approximately 255 basis points or 2.55 percentage points. Each additional 1.0% change in the exchange rate between the Indian rupee and the U.S. dollar would have had the effect of moving our operating margin by approximately 24 basis points or 0.24 percentage points. Excluding stock-based compensation expense and stock-based Indian fringe benefit tax expense of $45.8 million in 2009 and $52.0 million in 2008, operating margins for the years ended December 31, 2009 and 2008 were 20.3% and 20.2%, respectively.
We entered into foreign exchange forward contracts to hedge certain salary payments in India. These hedges are intended to mitigate the volatility of the changes in the exchange rate between the U.S. dollar and the Indian rupee. During 2009, these cash flow hedges favorably impacted our operating margin by approximately 27 basis points or 0.27 percentage points.
Other Income (Expense), Net. Total other income (expense), net consists primarily of foreign currency exchange gains and (losses) and interest income. The following table sets forth, for the periods indicated, Total other income (expense), net:
(Dollars in thousands)
| 2009 | 2008 | Increase/ (Decrease) | ||||||||||
Foreign currency exchange gains | $ | 22,493 | $ | (22,818 | ) | $ | 45,311 | |||||
(Losses) on foreign exchange forward contracts not designated as hedging instruments | (20,821 | ) | — | (20,821 | ) | |||||||
Net foreign currency exchange (losses) gains | 1,672 | (22,818 | ) | 24,490 | ||||||||
Interest income | 15,895 | 22,188 | (6,293 | ) | ||||||||
Other, net | 894 | (830 | ) | 1,724 | ||||||||
Total other income (expense), net | $ | 18,461 | $ | (1,460 | ) | $ | 19,921 | |||||
In 2009, foreign currency exchange gains were approximately $22.5 million, which were primarily attributed to U.S. dollar denominated intercompany payables from our European subsidiaries to Cognizant India for services performed by Cognizant India on behalf of our European customers and the remeasurement of the Indian rupee net monetary assets on Cognizant India’s books to the U.S. dollar functional currency. The $20.8 million of losses on foreign exchange forward contracts were related to the change in fair value of foreign exchange forward contracts entered into to offset foreign currency exposure to Indian rupee denominated net monetary assets. At December 31, 2009, the notional value of these undesignated hedges was $400.0 million. The $6.3 million decrease in interest income was due to lower average short-term interest rates during 2009 compared to 2008. The increase in other, net of $1.7 million primarily related to gains on redemptions of certain auction-rate securities offset by the net change in fair value of our auction-rate securities and the related UBS Right.
Provision for Income Taxes. The provision for income taxes increased from approximately $84.4 million in 2008 to approximately $102.0 million in 2009. The effective income tax rate decreased from 16.4% in 2008 to 16.0% in 2009. The decrease in our effective income tax rate was primarily attributed to the tax impact of foreign exchange forward contracts, as well as a shift in the geographic mix of our income which resulted in a greater percentage of our revenues falling under income tax holidays.
Net Income. Net income increased from approximately $430.8 million in 2008 to approximately $535.0 million in 2009, representing 15.3% and 16.3% of revenues, respectively. The increase in net income as a percentage of revenues in 2009 was primarily attributed to a higher operating margin and foreign currency exchange gains partially offset by lower interest income.2011.
Results by Business Segment
Our reportable segments are: Financial Services, which includes customers providing banking / banking/transaction processing, capital markets and insurance services; Healthcare, which includes healthcare providers and payers as well as life sciences customers; Manufacturing/Retail/Logistics, which includes manufacturers, retailers, travel and other hospitality customers, as well as customers providing logistics services; and Other, which is an aggregation of industry operating segments each of which, individually, arerepresents less than 10.0% of consolidated revenues and segment operating profit. The Other segment includes entertainment,information, media and informationentertainment services, communications, and high technology operating segments. Our sales managers, account executives, account managers and project teams are aligned in accordance with the specific industries they serve.
Our chief operating decision maker evaluates Cognizant’s performance and allocates resources based on segment revenues and operating profit. Segment operating profit is defined as income from operations before
unallocated costs. Generally, operating expenses for each operating segment have similar characteristics and are subject to the same factors, pressures and challenges. However, the economic environment and its effects on industries served by our operating groups may affect revenue and operating expenses to differing degrees. Expenses included in segment operating profit consist principally of direct selling and delivery costs as well as a per seat charge for use of the development and delivery centers. Certain expenses, such asselling, general and administrative andexpenses, excess or shortfall of incentive compensation for delivery personnel as compared to target, stock-based compensation expense, a portion of depreciation and amortization are not specifically allocated to specific segments as management does not believe it is practical to allocate such costs to individual segments because they are not directly attributable to any specific segment. Further, stock-based compensation expense and the related stock-based Indian fringe benefit taximpact of the settlements of our cash flow hedges are not allocated to individual segments in internal management reports used by the chief operating decision maker. Accordingly, thesesuch expenses are separately disclosed as “unallocated” and are adjusted only against the total incomeexcluded from operations.segment operating profit.
As of December 31, 2010,2012, we had approximately 712821 active customers.clients. Accordingly, we provide a significant volume of services to many customers in each of our business segments. Therefore, a loss of a significant customer or a few significant customers in a particular segment could materially reduce revenues for such segment. However, no individual customer exceeded 10.0% of our consolidated revenues for the years ended December 31, 2010, 2009 and 2008.2012, 2011, or 2010. In addition, the services we provide to our larger customers are often critical to the operations of such customers and we believe that a termination of our services would require an extended transition period with gradual declining revenues.
Revenues from external customers and segment operating profit, before unallocated expenses, for the Financial Services, Healthcare, Manufacturing/Retail/Logistics, and Other segments for the years ended December 31, 2010, 20092012, 2011, and 20082010 are as follows:
(Dollars in thousands)
| 2010 | 2009 | |||||||||||||||||||||||||||
| 2010 | 2009 | 2008 | Increase | % | Increase | % | ||||||||||||||||||||||
| (Dollars in thousands) | ||||||||||||||||||||||||||||
Revenues: | ||||||||||||||||||||||||||||
Financial Services | $ | 1,944,450 | $ | 1,406,629 | $ | 1,284,013 | $ | 537,821 | 38.2 | % | $ | 122,616 | 9.5 | % | ||||||||||||||
Healthcare | 1,177,113 | 860,427 | 688,224 | 316,686 | 36.8 | 172,203 | 25.0 | |||||||||||||||||||||
Manufacturing/Retail/ Logistics | 849,643 | 564,917 | 443,236 | 284,726 | 50.4 | 121,681 | 27.5 | |||||||||||||||||||||
Other | 621,183 | 446,690 | 400,831 | 174,493 | 39.1 | 45,859 | 11.4 | |||||||||||||||||||||
Total revenues | $ | 4,592,389 | $ | 3,278,663 | $ | 2,816,304 | $ | 1,313,726 | 40.1 | % | $ | 462,359 | 16.4 | % | ||||||||||||||
Segment Operating Profit: | ||||||||||||||||||||||||||||
Financial Services | $ | 668,595 | $ | 503,689 | $ | 439,055 | $ | 164,906 | 32.7 | % | $ | 64,634 | 14.7 | % | ||||||||||||||
Healthcare | 436,879 | 331,007 | 270,790 | 105,872 | 32.0 | 60,217 | 22.2 | |||||||||||||||||||||
Manufacturing/Retail/ Logistics | 283,676 | 184,636 | 136,609 | 99,040 | 53.6 | 48,027 | 35.2 | |||||||||||||||||||||
Other | 208,306 | 147,246 | 132,209 | 61,060 | 41.5 | 15,037 | 11.4 | |||||||||||||||||||||
Total segment operating profit | $ | 1,597,456 | $ | 1,166,578 | $ | 978,663 | $ | 430,878 | 36.9 | % | $ | 187,915 | 19.2 | % | ||||||||||||||
| 2012 | 2011 | |||||||||||||||||||||||||||
| 2012 | 2011 | 2010 | Increase | % | Increase | % | ||||||||||||||||||||||
Revenues: | ||||||||||||||||||||||||||||
Financial Services | $ | 3,035,447 | $ | 2,518,422 | $ | 1,944,450 | $ | 517,025 | 20.5 | $ | 573,972 | 29.5 | ||||||||||||||||
Healthcare | 1,934,898 | 1,622,157 | 1,177,113 | 312,741 | 19.3 | 445,044 | 37.8 | |||||||||||||||||||||
Manufacturing/Retail/Logistics | 1,498,668 | 1,197,472 | 849,643 | 301,196 | 25.2 | 347,829 | 40.9 | |||||||||||||||||||||
Other | 877,459 | 783,105 | 621,183 | 94,354 | 12.0 | 161,922 | 26.1 | |||||||||||||||||||||
|
|
|
|
|
|
|
|
|
| |||||||||||||||||||
Total revenue | $ | 7,346,472 | $ | 6,121,156 | $ | 4,592,389 | $ | 1,225,316 | 20.0 | $ | 1,528,767 | 33.3 | ||||||||||||||||
|
|
|
|
|
|
|
|
|
| |||||||||||||||||||
Segment Operating Profit: | ||||||||||||||||||||||||||||
Financial Services | $ | 998,339 | $ | 872,267 | $ | 668,595 | $ | 126,072 | 14.5 | $ | 203,672 | 30.5 | ||||||||||||||||
Healthcare | 724,454 | 625,052 | 436,879 | 99,402 | 15.9 | 188,173 | 43.1 | |||||||||||||||||||||
Manufacturing/Retail/Logistics | 527,970 | 440,416 | 283,676 | 87,554 | 19.9 | 156,740 | 55.3 | |||||||||||||||||||||
Other | 288,052 | 254,145 | 208,306 | 33,907 | 13.3 | 45,839 | 22.0 | |||||||||||||||||||||
|
|
|
|
|
|
|
|
|
| |||||||||||||||||||
Total segment operating profit | $ | 2,538,815 | $ | 2,191,880 | $ | 1,597,456 | $ | 346,935 | 15.8 | $ | 594,424 | 37.2 | ||||||||||||||||
|
|
|
|
|
|
|
|
|
| |||||||||||||||||||
Year Ended December 31, 20102012 Compared to Year Ended December 31, 20092011
Financial Services Segment
Revenue. Revenue increased by 38.2%,20.5% or approximately $537.8$517.0 million, from approximately $1,406.6$2,518.4 million during 20092011 to approximately $1,944.5$3,035.4 million in 2010.2012. The increase in revenue was primarily driven by continued expansion of existing customer relationships as well as revenue contributed by new customers. The increase in revenue from customers existing as of December 31, 20092011 and customers added during 2012 was approximately $481.5 million and approximately $35.5 million, respectively. Within the segment, revenue from our insurance and banking customers increased approximately $266.8 million and $250.2 million, respectively, over the prior year. Overall, the year-over-year increase can also be attributed to leveraging sales and marketing investments in this business segment as well as greater acceptance of our global services delivery model and increased customer spending on discretionary projects.
Segment Operating Profit. Segment operating profit increased by 14.5% or approximately $126.1 million, from approximately $872.3 million during 2011 to approximately $998.3 million during 2012. The increase in segment operating profit was attributable primarily to increased revenues and the favorable impact of the depreciation of the Indian rupee versus the U.S. dollar, partially offset by an increase in compensation and benefit costs resulting primarily from additional headcount to support our revenue growth and continued investment in sales and marketing.
Healthcare Segment
Revenue.Revenue increased by 19.3% or approximately $312.7 million, from approximately $1,622.2 million during 2011 to approximately $1,934.9 million in 2012. The increase in revenue was primarily driven by continued expansion of existing customer relationships as well as revenue contributed by new customers. The increase in revenue from customers existing as of December 31, 2011 and customers added
during 20102012 was approximately $508.1$292.9 million and approximately $29.7$19.8 million, respectively. Within the segment, growth was stronger among our healthcare customers, where revenue during 2012 increased by approximately $222.4 million. Revenue during 2012 increased by approximately $90.3 million for our life sciences customers. The increases can also be attributed to leveraging sales and marketing investments in this business segment as well as greater acceptance of our global services delivery model and increased customer spending on discretionary projects. IT spending by our life sciences customers may be adversely impacted by the patent cliff affecting our customers and continued consolidation in the industry.
Segment Operating Profit. Segment operating profit increased 15.9% or approximately $99.4 million, from approximately $625.1 million during 2011 to approximately $724.5 million during 2012. The increase in segment operating profit was attributable primarily to increased revenues and the favorable impact of the depreciation of the Indian rupee versus the U.S. dollar, partially offset by an increase in compensation and benefit costs resulting primarily from additional headcount to support our revenue growth and continued investment in sales and marketing.
Manufacturing/Retail/Logistics Segment
Revenue. Revenue increased by 25.2% or approximately $301.2 million, from approximately $1,197.5 million during 2011 to approximately $1,498.7 million in 2012. The increase in revenue was primarily driven by continued expansion of existing customer relationships as well as revenue contributed by new customers. The increase in revenue from customers existing as of December 31, 2011 and customers added during 2012 was approximately $243.4 million and approximately $57.8 million, respectively. Within the segment, growth was stronger among our retail and hospitality customers, where revenue during 2012 increased by approximately $219.0 million. In 2012, revenue among our manufacturing and logistics customers increased by approximately $82.2 million. The increase can also be attributed to leveraging sales and marketing investments in this business segment as well as greater acceptance of our global services delivery model and increased customer spending on discretionary projects.
Segment Operating Profit. Segment operating profit increased 19.9% or approximately $87.6 million, from approximately $440.4 million during 2011 to approximately $528.0 million during 2012. The increase in segment operating profit was attributable primarily to increased revenues and the favorable impact of the depreciation of the Indian rupee versus the U.S. dollar, partially offset by an increase in compensation and benefit costs resulting primarily from additional headcount to support our revenue growth and continued investment in sales and marketing.
Other Segment
Revenue. Revenue increased by 12.0% or approximately $94.4 million, from approximately $783.1 million in 2011 to approximately $877.5 million in 2012. The increase in revenue was primarily driven by continued expansion of existing customer relationships as well as revenue contributed by new customers. The increase in revenue from customers existing as of December 31, 2011 and customers added during 2012 was approximately $71.0 million and approximately $23.4 million, respectively. The increase in revenue can also be attributed to leveraging sales and marketing investments in this business segment as well as greater acceptance of our global services delivery model and increased customer spending on discretionary projects. Within the Other segment, growth was below the company average across all operating segments within Other, which includes information, media and entertainment services, communications and high technology.
Segment Operating Profit. Segment operating profit increased 13.3% or approximately $33.9 million, from approximately $254.1 million in 2011 to approximately $288.1million in 2012. The increase in segment operating profit was attributable primarily to increased revenues, achieving operating efficiencies, including continued leverage of prior sales and marketing investments, and the favorable impact of the depreciation of the Indian rupee versus the U.S. dollar, partially offset by an increase in compensation and benefits costs resulting primarily from additional headcount to support our revenue growth.
Year Ended December 31, 2011 Compared to Year Ended December 31, 2010
Financial Services Segment
Revenue. Revenue increased by 29.5%, or approximately $573.9 million, from approximately $1,944.5 million during 2010 to approximately $2,518.4 million in 2011. The increase in revenue was primarily driven by continued expansion of existing customer relationships as well as revenue contributed by new customers. The increase in revenue from customers existing as of December 31, 2010 and customers added during 2011 was approximately $531.3 million and approximately $42.6 million, respectively. Within the segment, revenue from our banking and insurance customers increased approximately $410.3$395.7 million and $127.5$178.2 million, respectively, over the prior year. Overall, the full year 20102011 increase in the segment can also be attributed to leveraging sales and marketing investments in this business segment as well as greater acceptance of our global services delivery model and increased customer spending on post-acquisition integration engagements and discretionary development projects.
Segment Operating Profit. Segment operating profit increased by 32.7%30.5%, or approximately $164.9$203.7 million, from approximately $503.7 million during 2009 to approximately $668.6 million during 2010.2010 to approximately $872.3 million during 2011. The increase in segment operating profit was attributable primarily to increased revenues partially offset by additional headcount to support our revenue growth, continued investment in sales and marketing, an increase in compensation and benefit costs, including incentive-based compensation, andduring the impact of the appreciation of the Indian rupee versus the U.S. dollar.year.
Healthcare Segment
Revenue.Revenue increased by 36.8%37.8%, or approximately $316.7$445.0 million, from approximately $860.4$1,177.1 million during 20092010 to approximately $1,177.1$1,622.2 million in 2010.2011. The increase in revenue was primarily driven by continued expansion of existing customer relationships as well as revenue contributed by new customers. The increase in revenue from customers existing as of December 31, 20092010 and customers added during 20102011 was approximately $293.9$394.7 million and approximately $22.8$50.3 million, respectively. Within the segment, growth was strong among both our healthcare and life sciences and healthcare customers, where revenue during 20102011 increased by approximately $205.4$279.8 million and $111.3$165.2 million, respectively. The increase can also be attributed to leveraging sales and marketing investments in this business segment as well as greater acceptance of our global services delivery model and increase inincreased customer spending on discretionary development projects.
Segment Operating Profit. Segment operating profit increased 32.0%43.1%, or approximately $105.9$188.2 million, from approximately $331.0 million during 2009 to approximately $436.9 million during 2010.2010 to approximately $625.1 million during 2011. The increase in segment operating profit was attributable primarily to increased revenues, achieving operating efficiencies, including continued leverage of prior sales and marketing investments, and the impact of the depreciation of the Indian rupee versus the U.S. dollar, partially offset by additional headcount to support our revenue growth, continued investment in sales and marketing, an increase in compensation and benefit costs including incentive-based compensation, and the impact of the appreciation of the Indian rupee versus the U.S. dollar.resulting from additional headcount to support our revenue growth.
Manufacturing/Retail/Logistics Segment
Revenue. Revenue increased by 50.4%40.9%, or approximately $284.7$347.8 million, from approximately $564.9$849.6 million during 20092010 to approximately $849.6$1,197.5 million in 2010.2011. The increase in revenue was primarily driven by continued expansion of existing customer relationships as well as revenue contributed by new customers. The increase in revenue from customers existing as of December 31, 20092010 and customers added during 20102011 was approximately $241.7$307.2 million and approximately $43.0$40.6 million, respectively. Within the segment, growth was strong among both our retail and hospitality and manufacturing and logistics customers, where revenue during 20102011 increased by approximately $159.6$221.7 million and $125.1$126.1 million, respectively. The increase can also be attributed to leveraging sales and marketing investments in this business segment as well as greater acceptance of our global services delivery model and increase inincreased customer spending on discretionary development projects.
Segment Operating Profit. Segment operating profit increased 53.6%55.3%, or approximately $99.1$156.7 million, from approximately $184.6 million during 2009 to approximately $283.7 million during 2010.2010 to approximately $440.4 million during 2011. The increase in segment operating profit was attributable primarily to increased revenues during the year, and achieving operating
efficiencies, including continued leverage of prior sales and marketing investments, and the impact of the depreciation of the Indian rupee versus the U.S. dollar, partially offset by additional headcount to support our revenue growth, an increase in compensation and benefit costs including incentive-based compensation, and the impact of the appreciation of the Indian rupee versus the U.S. dollar.resulting from additional headcount to support our revenue growth.
Other Segment
Revenue. Revenue increased by 39.1%26.1%, or approximately $174.5$161.9 million, from approximately $446.7 million in 2009 to approximately $621.2 million in 2010.2010 to approximately $783.1 million in 2011. The increase in revenue was primarily driven by continued expansion of existing customer relationships as well as revenue contributed by new customers. The increase in revenue from customers existing as of December 31, 20092010 and customers added during 20102011 was approximately $149.6$137.9 million and approximately $24.9$24.0 million, respectively. Within the Other segment, growth was particularly strong among both our entertainment, media and information services customers and our telecommunication customers, where revenue during 20102011 increased approximately $74.1 million and $56.6 million, respectively.$75.7 million. The increase can also be attributed to leveraging sales and marketing investments in this business segment as well as greater acceptance of our global services delivery model and increase inincreased customer spending on discretionary development projects.
Segment Operating Profit. Segment operating profit increased 41.5%22.0%, or approximately $61.1$45.8 million, from approximately $147.2$208.3 million in 20092010 to approximately $208.3$254.1 million in 2010.2011. The increase in segment operating profit was attributable primarily to increased revenues during the year and achieving operating efficiencies, including continual leverage of prior sales and marketing investments, partially offset by additional headcount to support our revenue growth, an increase in compensation and benefit costs, including incentive-based compensation, and the impact of the appreciation of the Indian rupee versus the U.S. dollar.
Year Ended December 31, 2009 Compared to Year Ended December 31, 2008
Financial Services Segment
Revenue. Revenue increased by 9.5%, or approximately $122.6 million, from approximately $1,284.0 million during 2008 to approximately $1,406.6 million in 2009. The increase in revenue was primarily driven by continued expansion of existing customer relationships as well as revenue contributed by new customers. The increase in revenue from customers existing as of December 31, 2008 and customers added during 2009 was approximately $108.7 million and approximately $13.9 million, respectively. Within the segment, revenue from our insurance customers increased approximately $76.3 million over the prior year. Overall, the full year 2009 increase in the segment can also be attributed to leveraging sales and marketing investments in this business segment as well as greater acceptance of our global services delivery model. However, revenue from our financial services segment grew slower than the rest of the company primarily due to the crisis in the financial services sector during 2009.
Segment Operating Profit. Segment operating profit increased by 14.7%, or approximately $64.6 million, from approximately $439.1 million during 2008 to approximately $503.7 million during 2009. The increase in segment operating profit was attributable primarily to increased revenues, the impact of the depreciation of the Indian rupee versus the U.S. dollar and achieving operating efficiencies, including continued leverage of prior sales and marketing investments.
Healthcare Segment
Revenue. Revenue increased by 25.0%, or approximately $172.2 million, from approximately $688.2 million during 2008 to approximately $860.4 million in 2009. The increase in revenue was primarily driven by continued expansion of existing customer relationships as well as revenue contributed by new customers. The increase in revenue from customers existing as of December 31, 2008 and customers added during 2009 was approximately $157.9 million and approximately $14.3 million, respectively. Within the segment, growth was particularly strong among both our life sciences and healthcare customers, where revenue during 2009 increased by approximately $93.1 million $79.1 million, respectively. The increase can also be attributed to leveraging sales and marketing investments in this business segment as well as greater acceptance of our global services delivery model.
Segment Operating Profit. Segment operating profit increased 22.2%, or approximately $60.2 million, from approximately $270.8 million during 2008 to approximately $331.0 million during 2009. The increase in segment operating profit was attributable primarily to increased revenues, achieving operating efficiencies and the impact of the depreciation of the Indian rupee versus the U.S. dollar, partially offset by an increase in compensation and benefit costs resulting from additional headcount to support our revenue growth, continued investment in sales and marketing and wage inflation, primarily in India.
Manufacturing/Retail/Logistics Segment
Revenue. Revenue increased by 27.5%, or approximately $121.7 million, from approximately $443.2 million during 2008 to approximately $564.9 million in 2009. Thean increase in revenue was primarily driven by continued expansion of existing customer relationships as well as revenue contributed by new customers. The increase in revenue from customers existing as of December 31, 2008compensation and customers added during 2009 was approximately $92.5 million and approximately $29.2 million, respectively. Within the segment, growth was particularly strong among our retail and hospitality customers, where revenue during 2009 increased by approximately $92.3 million. The increase can also be attributed to leveraging sales and marketing investments in this business segment as well as greater acceptance of our global services delivery model.
Segment Operating Profit. Segment operating profit increased 35.2%, or approximately $48.0 million, from approximately $136.6 million during 2008 to approximately $184.6 million during 2009. The increase in segment operating profit was attributable primarily to increased revenues, the impact of the depreciation of the Indian rupee versus the U.S. dollar and achieving operating efficiencies, including continued leverage of prior sales and marketing investments.
Other Segment
Revenue. Revenue increased by 11.4%, or approximately $45.9 million, from approximately $400.8 million in 2008 to approximately $446.7 million in 2009. The increase in revenue was primarily driven by continued expansion of existing customer relationships as well as revenue contributed by new customers. The increase in revenue from customers existing as of December 31, 2008 and customers added during 2009 was approximately $16.8 million and approximately $29.1 million, respectively. Within the Other segment, growth was particularly strong among our entertainment media and information services customers, where revenue during 2009 increased approximately $41.2 million over the prior year. The increase can also be attributed to leveraging sales and marketing investments in this business segment as well as greater acceptance of our global services delivery model.
Segment Operating Profit. Segment operating profit increased 11.4%, or approximately $15.0 million, from approximately $132.2 million in 2008 to approximately $147.2million in 2009. The increase in segment operating profit was attributable primarily to increased revenues during the year.benefit costs.
Liquidity and Capital Resources
At December 31, 2010,2012, we had cash, and cash equivalents and short-term investments of $2,226.4$2,863.8 million. We have used, and plan to use, such cash for expansion of existing operations, including our offshore development and delivery centers;centers, continued development of new service lines; possible acquisitions of related businesses;businesses, formation of joint ventures;ventures, stock repurchases;repurchases and general corporate purposes, including working capital. As of December 31, 2010,2012, we had no third party debt and had working capital of approximately $2,587.5 million as compared to working capital of approximately $1,661.0 million as of December 31, 2009.$3,437.0 million. Accordingly, we do not anticipate any near-term liquidity issues.
Net cash provided by operating activities was approximately $1,172.6 million for the year ended December 31, 2012, $875.2 million for the year ended December 31, 2011 and $764.7 million for the year ended December 31, 2010, $672.3 million for the year ended December 31, 2009 and $429.7 million for the year ended
December 31, 2008.2010. The increase in 20102012 was primarily attributed to the increase in net income and more efficient deployment of working capital during 2012 as compared to the prior year2011. The increase in 2011 as compared to 2010 is primarily attributed to the increase in our net income in 2010 and higher incentive based compensation accruals, which are paid subsequent to year end. This increase was offset by increases in certain accounts, including tradeincome. Trade accounts receivable which, increased from approximately $517.5to $1,345.7 million at December 31, 20082012 as compared to approximately $626.3$1,179.0 million at December 31, 20092011 and to approximately $901.3 million at December 31, 2010. Unbilled accounts receivable increased fromto approximately $62.2$183.1 million at December 31, 20082012 as compared to approximately $83.0$139.6 at December 31, 20092011 and to approximately $113.0 million at December 31, 2010. The increase in trade accounts receivable and unbilled receivables during 20102012 was due primarily to increased revenues. We monitor turnover, aging and the collection of accounts receivable through the use of management reports that are prepared on a customer basis and evaluated by our finance staff. At December 31, 2010,2012, our days sales outstanding, including unbilled receivables, was approximately 7172 days as compared to 7273 days as of December 31, 20092011 and 71 days as of December 31, 2008.2010.
Our investing activities used net cash of approximately $570.1 million for the year ended December 31, 2012, $850.3 million for the year ended December 31, 2011 and $446.9 million for the year ended December 31, 2010, $394.8 million2010. The decrease in net cash used in investing activities during 2012 is related to a decrease in net purchases of investments, lower payments for acquisitions, partially offset higher spending for capital expenditures during the year ended December 31, 2009 and $55.0 million for the year ended December 31, 2008.year. The increase in net cash used in investing activities during 2011 as compared to 2010 primarily related to an increase in net purchases of investments, an increase in spending for capital expenditures during the year partially offset by decreasedand higher payments for acquisitions and a decrease in net purchases of investments.acquisitions.
Our financing activities used net cash of approximately $343.0 million for the year ended December 31, 2012 and $255.5 million for the year ended December 31, 2011 and provided net cash of approximately $120.0 million for the year ended December 31, 2010, $76.9 million for the year ended December 31, 2009 and $44.0 million for the year ended December 31, 2008.2010. The increase in 2010net cash used in financing activities in both years is primarily related to additional proceeds and excess tax benefits from issuances under our stock-based compensation plans partially offset by additionalhigher levels of repurchases of our common stock under our stock repurchase program.
As of December 31, 2010,2012, $2,054.5 million of our cash, cash equivalents and short-term investments totaled $685.4 million. Inwas held by our foreign subsidiaries. We utilize a variety of strategies in an effort to ensure that our worldwide cash is available in the second quarterlocations in which it is needed. Most of 2010,the amounts held outside of the United States could be repatriated to the United States but, under current law, would be subject to income taxes in the United States, less applicable foreign tax credits. However, other than amounts representing pre-2002 undistributed Indian earnings for which we have already accrued U.S. taxes, we intend to permanently reinvest these funds outside the U.S. and our auction-rate municipal debt securities were redeemedcurrent plans do not demonstrate a need to repatriate these amounts to fund our U.S. operations. If such earnings are repatriated in the future, or are no longer deemed to be indefinitely reinvested, we will accrue the applicable amount of taxes associated with such earnings at that time. Due to the various methods by which such earnings could be repatriated in the issuers or purchased by UBS reducing our outstanding balancefuture, it is not currently practicable to zero.determine the amount of applicable taxes that would result from such repatriation.
Our ability to expand and grow our business in accordance with current plans, to make acquisitions and form joint ventures and to meet our long-term capital requirements beyond a twelve month period will depend on many factors, including the rate, if any, at which our cash flow increases, our ability and willingness to accomplish acquisitions and joint ventures with capital stock, our continued intent not to repatriate foreign earnings, and the availability of public and private debt and equity financing. We cannot be certain that additional financing, if required, will be available on terms favorable to us, if at all. We expect our operating cash flow and cash and cash equivalents to be sufficient to meet our operating requirements for the next twelve months.
Commitments and Contingencies
As of December 31, 2010,2012, we had outstanding fixed capital commitments of approximately $56.6$163.5 million related to our India development center expansion program, which included expenditures for land acquisition, facilities construction and furnishings to build new state-of-the-art development and delivery centers primarily in regions primarily designated as SEZs located in India. As of December 31, 2010,2012, we had the following obligations and commitments to make future payments under contractual obligations and commercial commitments:
| Payments due by period | ||||||||||||||||||||
| Total | Less than 1 year | 1-3 years | 3-5 years | More than 5 years | ||||||||||||||||
| (in thousands) | ||||||||||||||||||||
Operating leases | $ | 327,759 | $ | 83,364 | $ | 136,123 | $ | 70,564 | $ | 37,708 | ||||||||||
Fixed capital commitments(1) | 56,587 | 56,587 | — | — | — | |||||||||||||||
Other purchase commitments(2) | 46,427 | 23,213 | 23,214 | — | — | |||||||||||||||
Total | $ | 430,773 | $ | 163,164 | $ | 159,337 | $ | 70,564 | $ | 37,708 | ||||||||||
Operating leases Fixed capital commitments(1) Other purchase commitments(2) Total Payments due by period Total Less than
1 year 1-3 years 3-5 years More than
5 years (in thousands) $ 724,314 $ 124,644 $ 227,199 $ 143,970 $ 228,501 163,484 163,484 — — — 39,508 18,276 21,232 — — $ 927,306 $ 306,404 $ 248,431 $ 143,970 $ 228,501
| (1) | Relates to our India development and delivery center expansion program. |
| (2) | Other purchase commitments include, among other things, communications and information technology |
As of December 31, 2010,2012, we had $23.0$92.7 million of unrecognized tax benefits. This represents the tax benefits associated with certain tax positions on our domestic and international tax returns that have not been
recognized on our financial statements due to uncertainty regarding their resolution. The resolution or settlement of these income tax positions with the relevant taxing authorities is at various stages and therefore we are unable to make a reliable estimate of the eventual cash flows by period that may be required to settle these matters.
We are involved in various claims and legal actions arising in the ordinary course of business. In the opinion of management, the outcome of such claims and legal actions, if decided adversely, is not expected to have a material adverse effect on our quarterly or annual operating results, cash flows, or consolidated financial position. Additionally, many of our engagements involve projects that are critical to the operations of our customers’ business and provide benefits that are difficult to quantify. Any failure in a customer’s systems or our failure to meet our contractual obligations to our clients, including any breach involving a customer’s confidential information or sensitive data, or our obligations under applicable laws or regulations could result in a claim for substantial damages against us, regardless of our responsibility for such failure. Although we attempt to contractually limit our liability for damages arising from negligent acts, errors, mistakes, or omissions in rendering our services, there can be no assurance that the limitations of liability set forth in our contracts will be enforceable in all instances or will otherwise protect us from liability for damages. Although we have general liability insurance coverage, including coverage for errors or omissions, there can be no assurance that such coverage will continue to be available on reasonable terms or will be available in sufficient amounts to cover one or more large claims, or that the insurer will not disclaim coverage as to any future claim. The successful assertion of one or more large claims against us that exceed available insurance coverage or changes in our insurance policies, including premium increases or the imposition of large deductible or co-insurance requirements, could have a material adverse effect on our quarterly and annual operating results, financial position and cash flows.
Foreign Currency Risk
Overall, we believe that we have limited revenue risk resulting from movement in foreign currency exchange rates as approximately 78.0%79.4% of our revenues for the year ended December 31, 20102012 were generated from customers located in North America. However, a portion of our costs in India, representing approximately 33.2%30.5% of our global operating costs for the year ended December 31, 2010,2012, are denominated in the Indian rupee and are subject to foreign exchange rate fluctuations. These foreign currency exchange rate fluctuations have an impact on our results of operations. In addition, a portion of our balance sheet is exposed to foreign currency exchange rate fluctuations, which may result in non-operating foreign currency exchange gains or losses upon remeasurement. In 2010 and 2009,2012, we reported foreign currency exchange gains,losses, exclusive of hedging gains or losses, of approximately $11.2$11.7 million, and $22.5 million, respectively, which were primarily attributed to the remeasurement of intercompany balances between our European subsidiaries and Cognizant India for services performed by Cognizant India on behalf of our European customers and Indian rupee net monetary assets on Cognizant India’s books to the U.S. dollar functional currency. On an ongoing basis, we manage a portion of this risk by limiting our net monetary asset exposure to certain currencies in our foreign subsidiaries, primarily the Indian rupee in our Indian subsidiaries.rupee.
We entered into a series of foreign exchange forward contracts that are designated as cash flow hedges of certain salaryIndian rupee denominated payments in India. Cognizant India converts U.S. dollar receipts from intercompany billings to Indian rupees to fund local expenses, including salaries.expenses. These U.S. dollar / Indian rupee hedges to buy Indian rupees and sell U.S. dollars are intended to partially offset the impact of movement of exchange rates on future operating costs. During 2010We recorded losses of $96.1 million in 2012 and 2009, we reported incomegains of $41.6$18.8 million and $8.9 million, respectively,in 2011, on
contracts that settled during each year. As of December 31, 2010,2012, we have outstanding contracts with a total notional value of $3,353.0 million at a weighted average forward rate of 54.13 rupees to the U.S. dollar. These contracts are scheduled to mature as follows: outstanding contracts with a notional value of $1,253.0 million and a weighted average forward rate of 51.0 rupees to the U.S. dollar scheduled to mature in 2013; outstanding contracts with a notional value of $1,200 million and a weighted average forward rate of 54.1 rupees to the U.S. dollar scheduled to mature in 2014; outstanding contracts with a notional value of $780.0 million and a weighted average forward rate of 48.0157.5 rupees to the U.S. dollar scheduled to mature in 2011,2015; and outstanding contracts with a notional value of $780.0$120.0 million and a weighted average forward rate of 48.1065.2 rupees to the U.S. dollar scheduled to mature in 2012, and outstanding contracts with a notional value2016.
Our foreign subsidiaries are exposed to foreign exchange rate risk for transactions denominated in currencies other than the functional currency of $600.0 million and a weighted average forward rate of 50.07 rupees to the U.S. dollar scheduled to mature in 2013.
respective subsidiary. We also use foreign currencyexchange forward contracts to hedge balance sheet exposure to our Indian rupeecertain monetary assets and liabilities denominated net monetary assets.in currencies other than the functional currency of the subsidiary. These contracts are not designated as hedges and are intended to offset the foreign currency exchange rate gains or losses upon the remeasurement of the underlying Indian rupee denominatedthese net monetary assets. During 2009, weWe entered into a series of foreign exchange forward contracts scheduled to mature in 2010,2013 which are primarily used to buy U.S. dollars and sellhedge our Indian rupees during 2010. During 2010, we entered into additional foreign exchange forward contracts scheduled to mature in 2011.rupee denominated net monetary assets. At December 31, 2010 and 2009,2012, the notional value of the outstanding contracts was $234.0$208.6 million and $400 million, respectively, and the related fair values werevalue was a net liability of $7.3 million and $20.8 million, respectively.$5.2 million. During 2010 and 2009,2012, inclusive of losses of $21.1$8.3 million and $20.8 million, respectively, on these undesignated balance sheet hedges, we reported net foreign currency exchange (losses) and gainslosses of approximately ($9.9) million and $1.7 million, respectively.$20.0 million.
ThereOff-Balance Sheet Arrangements
Other than our foreign exchange forward contracts, there were no off-balance sheet transactions, arrangements or other relationships with unconsolidated entities or other persons in 2012, 2011 and 2010 2009 and 2008 that would have, affected ouror are reasonably likely to have, a current or future effect on the company’s financial condition, revenues or expenses, results of operations, liquidity, capital expenditures or the availability of or requirements for capital resources.
Effects of Inflation
Our most significant costs are the salaries and related benefits for our programming staff and other professionals. Competition in India, the United States and Europe for professionals with advanced technical skills necessary to perform our services offered has caused wages to increase at a rate greater than the general rate of inflation. As with other service providers in our industry, we must adequately anticipate wage increases, particularly on our fixed-price contracts. Historically, we have experienced increases in compensation and benefit costs, including incentive-based compensation, in India; however, this has not had a material impact on our results of operations as we have been able to absorb such cost increases through price increases or cost management strategies such as managing discretionary costs, mix of professional staff and utilization levels and achieving other operating efficiencies. There can be no assurance that we will be able to offset such cost increases in the future.
Critical Accounting Estimates and Risks
Management’s discussion and analysis of our financial condition and results of operations is based on our accompanying consolidated financial statements that have been prepared in accordance with accounting principles generally accepted in the United States of America. The preparation of these financial statements requires management to make estimates and assumptions that affect the amounts reported for assets and liabilities, including the recoverability of tangible and intangible assets, disclosure of contingent assets and liabilities as of the date of the financial statements, and the reported amounts of revenues and expenses during the reported period. On an on-going basis, we evaluate our estimates. The most significant estimates relate to the recognition of revenue and profits based on the percentage of completion method of accounting for certain fixed-bid contracts, the allowance for doubtful accounts, income taxes, valuation of goodwill and other long-lived assets, valuation of investments and derivative financial instruments, assumptions used in valuing stock-based compensation arrangements, contingencies and litigation. We base our estimates on historical experience and on various other assumptions that are believed to be reasonable under the circumstances, the results of which form the basis for making judgments about the carrying values of assets and liabilities that are not readily apparent from other sources. The actual amounts may differ from the estimates used in the preparation of the accompanying consolidated financial statements. Our significant accounting policies are described in Note 1 to the accompanying consolidated financial statements.
We believe the following critical accounting policies require a higher level of management judgments and estimates than others in preparing the consolidated financial statements:
Revenue Recognition. Revenues related to our highly complex information technology application development contracts, which are predominantly fixed-price contracts, are recognized as the services are performed using the percentage of completion method of accounting. Under this method, total contract revenue during the term of an agreement is recognized on the basis of the percentage that each contract’s total labor cost to date bears to the total expected labor cost (cost to cost method). This method is followed where reasonably dependable estimates of revenues and costs can be made. Management reviews total expected labor costs on an ongoing basis. Revisions to our estimates may result in increases or decreases to revenues and income and are reflected in the consolidated financial statements in the periods in which they are first identified. If our estimates indicate that a contract loss will be incurred, a loss provision is recorded in the period in which the loss first becomes probable and reasonably estimable. Contract losses are determined to be the amount by which the estimated costs of the contract exceed the estimated total revenues that will be generated by the contract and are included in cost of revenues in our consolidated statement of operations. Contract losses for the periods presented were immaterial.
Stock-Based Compensation. Utilizing the fair value recognition provisions prescribed by the authoritative guidance, stock-based compensation cost is measured at the grant date based on the value of the award and is recognized as expense over the vesting period. Determining the fair value of stock-based awards at the grant date requires judgment, including estimating the expected term over which the stock awards will be outstanding before they are exercised, the expected volatility of our stock and the number of stock-based awards that are expected to be forfeited. In addition, for performance stock units, we are required to estimate the most probable outcome of the performance conditions in order to determine the amount of stock compensation costs to be recorded over the vesting period. If actual results differ significantly from our estimates, stock-based compensation expense and our results of operations could be materially impacted.
Income Taxes.Determining the consolidated provision for income tax expense, deferred income tax assets (and related valuation allowance, if any) and liabilities requires significant judgment. We are required to calculate and provide for income taxes in each of the jurisdictions where we operate. Changes in the geographic mix of income before taxes or estimated level of annual pre-tax income can affect our overall effective income tax rate. The consolidated provision for income taxes may also change period to period based on non-recurring events, such as the settlement of income tax audits and changes in tax laws, regulations, or accounting principles.
Our provision for income taxes also includes the impact of provisions established for uncertain income tax positions, as well as the related net interest, which can involve complex issues and may require an extended period to resolve. Although we believe we have adequately reserved for our uncertain tax positions, no assurance can be given that the final tax outcome of these matters will not differ from our recorded amounts. We adjust these reserves in light of changing facts and circumstances, such as the closing of a tax audit. To the extent that the final tax outcome of these matters differs from the amounts recorded, such differences will impact the provision for income taxes in the period in which such determination is made.
Significant judgment is also required in determining any valuation allowance recorded against deferred income tax assets. In assessing the need for a valuation allowance, we consider all available evidence for each jurisdiction including past operating results, estimates of future taxable income and the feasibility of tax planning strategies. In the event we change our determination as to the amount of deferred income tax assets that can be realized, we will adjust the valuation allowance with a corresponding impact recorded to income tax expense in the period in which such determination was made.
Our Indian subsidiaries, collectively referred to as Cognizant India, are primarily export-oriented companies and are eligible for certain income tax holiday benefits granted by the Indian government for export activities conducted within Special Economic Zones, or SEZs, for periods of up to 15 years. We have constructed and
expect to continue to locate most of our newer development facilities in SEZs. All Indian profits, including those generated within SEZs, are subject to the Minimum Alternative Tax, or MAT, at the current rate of approximately 20.0%. Any MAT paid is creditable against future corporate income tax within a 10-year expiration period, subject to certain limitations. Currently, we anticipate utilizing our existing MAT balances against our future corporate income tax obligations in India. However, our ability to do so could be impacted by possible changes to the Indian tax laws as well as the future financial results of Cognizant India.
Derivative Financial Instruments.Derivative financial instruments are accounted for in accordance with the authoritative guidance which requires that each derivative instrument be recorded on the balance sheet as either an asset or liability measured at its fair value as of the reporting date. Our derivative financial instruments consist of foreign exchange forward contracts. We estimate the fair value of each foreign exchange forward contract by using a present value of expected cash flows model. This model utilizes various assumptions, including, but not limited to timing and amounts of cash flows, discount rates, and credit risk factors. The use of different assumptions could have a positive or negative effect on our results of operations and financial condition.
Investments. Our investment portfolio is comprised primarily of time deposits, mutual funds invested in fixed income securities and U.S. dollar denominated corporate bonds, municipal bonds, certificates of deposit, commercial paper, debt issuances by the U.S. government, U.S. government agencies, foreign governments and supranational entities and asset-backed securities. The asset-backed securities include securities backed by auto loans, credit card receivables, mortgage loans and other receivables and are rated AAA/Aaa. The years of issuance of our asset-backed securities fall in the 2003 to 2012 range.
We utilize various inputs to determine the fair value of our investment portfolio. To the extent they exist, unadjusted quoted market prices for identical assets in active markets (Level 1) or quoted prices on similar assets (Level 2) are utilized to determine the fair value of each investment in our portfolio. In the absence of quoted prices or liquid markets, valuation techniques would be used to determine fair value of any investments that require inputs that are both significant to the fair value measurement and unobservable (Level 3). Valuation techniques are based on various assumptions, including, but not limited to timing and amounts of cash flows, discount rates, rate of return, and adjustments for nonperformance and liquidity. A significant degree of judgment is involved in valuing investments using Level 3 inputs. The use of different assumptions could have a positive or negative effect on our results of operations and financial condition. See Note 10 to our consolidated financial statements for additional information related to our security valuation methodologies.
We periodically evaluate if unrealized losses, as determined based on the security valuation methodologies discussed above, on individual securities classified as available-for-sale in the investment portfolio are considered to be other-than-temporary. The analysis of other-than-temporary impairment requires the use of various assumptions, including, but not limited to, the length of time an investment’s book value is greater than fair value, the severity of the investment’s decline, any credit deterioration of the investment, whether management intends to sell the security and whether it is more likely than not that we will be required to sell the security prior to recovery of its amortized cost basis. Once a decline in fair value is determined to be other-than-temporary, an impairment charge is generally recorded to income and a new cost basis in the investment is established.
Allowance for Doubtful Accounts. We maintain an allowance for doubtful accounts for estimated losses resulting from the inability of our customers to make required payments. The allowance for doubtful accounts is determined by evaluating the relative credit-worthiness of each customer, historical collections experience and other information, including the aging of the receivables. If the financial condition of our customers were to deteriorate, resulting in an impairment of their ability to make payments, additional allowances may be required.
Goodwill.We evaluate goodwill for impairment at least annually, or as circumstances warrant. When determining the fair value of our reporting units, we utilize various assumptions, including projections of future cash flows. Any adverse changes in key assumptions about our businesses and their prospects or an adverse
change in market conditions may cause a change in the estimation of fair value and could result in an impairment charge. Based upon our most recent evaluation of goodwill, there are no significant risks of impairment for any of our reporting units. As of December 31, 2012, our goodwill balance was $309.2 million.
Long-Lived Assets and Intangibles. We review long-lived assets and certain identifiable intangibles for impairment whenever events or changes in circumstances indicate that the carrying amount of an asset may not be recoverable. In general, we will recognize an impairment loss when the sum of undiscounted expected future cash flows is less than the carrying amount of such asset. The measurement for such an impairment loss is then based on the fair value of the asset. If such assets were determined to be impaired, it could have a material adverse effect on our business, results of operations and financial condition.
Risks. The majority of our development and delivery centers, including a majority of our employees, are located in India. As a result, we may be subject to certain risks associated with international operations, including risks associated with foreign currency exchange rate fluctuations and risks associated with the application and imposition of protective legislation and regulations relating to import and export or otherwise resulting from foreign policy or the variability of foreign economic or political conditions. Additional risks associated with international operations include difficulties in enforcing intellectual property rights, limitations on immigration programs, the burdens of complying with a wide variety of foreign laws, potential geo-political and other risks associated with terrorist activities and local and cross border conflicts, and potentially adverse tax consequences, tariffs, quotas and other barriers. We are also subject to risks associated with our overall compliance with Section 404 of the Sarbanes-Oxley Act of 2002. The inability of our management to ensure the adequacy and effectiveness of our internal control over financial reporting for future year ends could result in adverse consequences to us, including, but not limited to, a loss of investor confidence in the reliability of our financial statements, which could cause the market price of our stock to decline. See Part I, Item 1A. “Risk Factors.”
Recent Accounting Pronouncements
In October 2009,February 2013, the Financial Accounting Standards Board, or FASB, issued a new accounting standard which provides guidance for arrangements with multiple deliverables. Specifically,related to accumulated other comprehensive income, requiring the new standard requires an entity to allocate consideration at the inceptionpresentation of an arrangement to allsignificant amounts reclassified out of its deliverables based on their relative selling prices. In the absence of the vendor-specific objective evidence or third-party evidence of the selling prices, consideration must be allocatedaccumulated other comprehensive income to the deliverables basedrespective line items in the statement of operations. For those amounts required by U.S. GAAP to be reclassified to earnings in their entirety in the same reporting period, this presentation is required either on management’s best estimatethe statement of the selling prices. In addition, the new standard eliminates the use of the residual method of allocation. In October 2009, the FASB also issuedoperations or in a new accounting standard which changes revenue recognition for tangible products containing software and hardware elements. Specifically, tangible products containing software and hardwaresingle footnote. For items that function together to deliver the tangible products’ essential functionality are scoped out of the existing software revenue recognition guidance and will be accounted for under the multiple-element arrangements revenue recognition guidance discussed above. Both standards arenot required to be reclassified in their entirety to earnings, the presentation requirement can be met by cross-referencing disclosures elsewhere in the footnotes. The pronouncement is effective by no later than the first quarter of 2011on a prospective basis effective for interim and early adoption is permitted. We adopted both of these standards effective January 1, 2010. Our adoption of these standards did not have a material effect on our financial condition or consolidated results of operations.
In January 2010, the FASB issued new guidance requiring supplemental fair value disclosures and providing several clarifications regarding existing disclosure requirements. Specifically, the new guidance requires an
entity to disclose separately the amounts of significant transfers in and out of Level 1 and Level 2 fair value measurements and to describe the reasons for the transfers. In addition, the new standard requires a gross presentation of the Level 3 rollforward, stating separately information about purchases, sales, issuances, and settlements.annual reporting periods that start after December 15, 2012. The new guidance also provides clarification regarding the appropriate level of disaggregation of assets and liabilities for the purpose of fair value disclosures as well as the requirement to provide disclosures about the valuation techniques and inputs used to measure fair value for both recurring and nonrecurring Level 2 and Level 3 measurements. We adopted the new guidance effective January 1, 2010 and have presented the required information in Note 10 in our consolidated financial statements included herein.
In December 2010, the FASB issued a new accounting standard requiring that Step 2 of the goodwill impairment test be performed for reporting units whose carrying value is zero or negative. This guidance will be effective January 1, 2011. Our adoption of this standard affects financial statement presentation only and will not have a materialno effect on our financial condition or consolidated results of operations.
In December 2010,2011, the FASB issued guidance requiring enhanced disclosures related to the nature of an entity’s rights to offset and any related arrangements associated with its financial instruments and derivative instruments. The new guidance clarifying somerequires the disclosure of the disclosure requirementsgross amounts subject to rights of set-off, amounts offset in accordance with the accounting standards followed and the related to business combinations that are material onnet exposure. In January 2013, the FASB issued an individual or aggregate basis. Specifically,additional update clarifying the guidance states that, if comparative financial statements are presented, the entity should disclose revenue and earningsscope of the combined entity as though the business combination(s) that occurred during the current year occurred as of the beginning of the comparable prior annual reporting period only. Additionally, thethis guidance. The new standard expands the supplemental pro forma disclosure required by the authoritative guidance to include a description of the nature and amount of material, nonrecurring pro forma adjustments directly attributable to the business combination in the reported pro forma revenue and earnings. This guidance will be effective for periods beginning on or after January 1, 2011. Our2013. The adoption of this standard affects financial statement disclosures only and will not have a materialno effect on our financial condition or consolidated results of operations. However, it may result in additional disclosures in the event that we enter into a business combination that is material either on an individual or aggregate basis.
Forward Looking Statements
The statements contained in this Annual Report on Form 10-K that are not historical facts are forward-looking statements (within the meaning of Section 21E of the Securities Exchange Act of 1934, as amended) that involve risks and uncertainties. Such forward-looking statements may be identified by, among other things, the use of forward-looking terminology such as “believes,” “expects,” “may,” “could,” “would,” “plan,” “intend,” “estimate,
“estimate,” “predict,” “potential,” “continue,” “should” or “anticipates” or the negative thereof or other variations thereon or comparable terminology, or by discussions of strategy that involve risks and uncertainties. From time to time, we or our representatives have made or may make forward-looking statements, orally or in writing.
Such forward-looking statements may be included in various filings made by us with the Securities and Exchange Commission, or press releases or oral statements made by or with the approval of one of our authorized executive officers. These forward-looking statements, such as statements regarding anticipated future revenues or operating margins, contract percentage completions, earnings, capital expenditures, liquidity, plans, objectives, and other statements regarding matters that are not historical facts, involve predictions.are based on our current expectations, estimates and projections, management’s beliefs, and certain assumptions made by management, many of which, by their nature, are inherently uncertain and beyond our control. Our actual results, performance or achievements could differ materially from the results expressed in, or implied by, these forward-looking statements. There are a number of important factors that could cause our results to differ materially from those indicated by such forward-looking statements, including, but not limited to, continuing worsening economic conditions in the United States and Europe; the loss of customers; the rate of growth in the use of technology in business and the type and level of technology spending by our clients; the risk of reputational harm to us; increased competition from other service providers; the risk that we may not be able to keep pace with the rapidly evolving technological environment; competition for hiring highly-skilled professionals or the loss of key personnel; the risk that we may not be able to control our costs or maintain favorable pricing and utilization rates; the risk that we might not be able to maintain effective internal controls; the risk that we may not be able to enforce non-competition agreements with our executives; the risk of liability resulting from security breaches; our inability to successfully acquire or integrate target companies; changes in domestic and international regulations and legislation, including immigration and anti-outsourcing legislation; the effect of fluctuations in the Indian rupee and other currency exchange rates; the effect of our use of derivative instruments; the risk of war, terrorist activities, pandemics and natural disasters; the possibility that me may choose to repatriate foreign earnings or that those earnings may become subject to tax on a U.S. basis; the possibility that we may lose certain tax benefits provided to companies in our industry by India; the risk that we may not be able to enforce or protect our intellectual property rights, or that we may infringe upon the intellectual property rights of others; the possibility that we could lose our ability to utilize the intellectual property rights of others; and the factors set forth in Part I, in the section entitled “Item 1A. Risk Factors” in this report. You are advised to consult any further disclosures we make on related subjects in the reports we file with the Securities and Exchange Commission, including this report in the sections titled “Part I, Item 1. Business,” “Part I, Item 1A. Risk Factors” and “Part II, Item 7. Management’s Discussion and Analysis of Financial Condition and Results of Operations.” We undertake no obligation to update or revise any forward-looking statements, whether as a result of new information, future events or otherwise, except as may be required under applicable securities laws. There are a number of important factors that could cause our results to differ materially from those indicated by such forward-looking statements. These factors include those set forth in Part I, in the section entitled Item 1A. “Risk Factors”.
| Item 7A. | Quantitative and Qualitative Disclosures About Market Risk |
We are exposed to foreign currency exchange rate risk in the ordinary course of doing business as we transact or hold a portion of our funds in foreign currencies, particularly the Indian rupee. Accordingly, we periodically evaluate the need for hedging strategies, including the use of derivative financial instruments, to mitigate the effect of foreign currency exchange rate fluctuations and expect to continue to use such instruments in the future to reduce foreign currency exposure to appreciation or depreciation in the value of certain foreign currencies. All hedging transactions are authorized and executed pursuant to regularly reviewed policies and procedures.
We have entered into a series of foreign exchange forward contracts that are designated as cash flow hedges of certain salaryIndian rupee denominated payments in India. Cognizant India converts U.S. dollar receipts from intercompany billings to Indian rupees to fund local expenses, including salaries.expenses. These U.S. dollar / Indian rupee hedges are intended to partially offset the impact of movement of exchange rates on future operating costs. As of December 31, 2010 and December 31, 2009, the notional value of these contracts was $2,160.0 million and $810.0 million, respectively.$3,353.0 million. The outstanding contracts as of
December 31, 20102012 are scheduled to mature each month during 2011, 2012,2013, 2014, 2015 and 2013.2016. At December 31, 2010 and December 31, 2009,2012, the net unrealized gainloss on our outstanding foreign exchange forward contracts was $32.3 million and $19.0 million, respectively.$296.6 million. Based upon a sensitivity analysis of our foreign exchange forward contracts at December 31, 2010,2012, which estimates the fair value of the contracts based upon market exchange rate fluctuations, a 10.0% change in the foreign currency exchange rate against the U.S. dollar with all other variables held constant would have resulted in a change in the fair value of approximately $205.3$285.5 million.
Our foreign subsidiaries are exposed to foreign exchange rate risk for transactions denominated in currencies other than the functional currency of the respective subsidiary. We also use foreign exchange forward contracts to hedge balance sheet exposure to our Indian rupeecertain monetary assets and liabilities denominated net monetary assets.in currencies other than the functional currency of the subsidiary. These contracts are not designated as hedges and are intended to offset the foreign currency exchange rate gains or losses upon the remeasurement of the underlying Indian rupee denominatedthese net monetary assets. We entered into a series of foreign exchange forward contracts scheduled to mature in 2011,2013 which are primarily used to buy U.S. dollars and sellhedge our Indian rupees.rupee denominated net monetary assets. At December 31, 2010,2012, the notional value of the outstanding contracts was $234.0$208.6 million and the related fair value was a liability of $7.3$5.2 million. Based upon a sensitivity analysis of our foreign exchange forward contracts at December 31, 2010,2012, which estimates the fair value of the contracts based upon market exchange rate fluctuations, a 10.0% change in the foreign currency exchange rate against the U.S. dollar with all other variables held constant would have resulted in a change in the fair value of approximately $23.8$17.7 million.
There were no off-balance sheet transactions, arrangements or other relationships with unconsolidated entities or other persons in 2010, 2009 and 2008 that would have affected our liquidity or the availability of or requirements for capital resources.
We do not believe we are exposed to material direct risks associated with changes in interest rates other than with our cash, and cash equivalents and short-term investments. As of December 31, 2010,2012, we had approximately $2,226.4$2,863.8 million of cash, and cash equivalents and short-term investments most of which are impacted almost immediately by changes in short-term interest rates.
We typically invest in highly ratedhighly-rated securities and our policy generally limits the amount of credit exposure to any one issuer. Our investment policy requires investments to be investment grade rated A or better with the objective of minimizing the potential risk of principal loss. We may sell our investments prior to their stated maturities for strategic purposes, in anticipation of credit deterioration, or for duration management. As of December 31, 2010,2012, our short-term investments totaled $685.4$1,293.7 million. Our investment portfolio is primarily comprised of time deposits, mutual funds invested in fixed income securities and U.S. dollar denominated corporate bonds, municipal bonds, debt issuances by the U.S. government and U.S. government agencies, debt issuances by foreign governments and supranational entities and asset-backed securities, and bank time deposits.
| Item 8. | Financial Statements and Supplementary Data |
The financial statements required to be filed pursuant to this Item 8 are appended to this Annual Report on Form 10-K. A list of the financial statements filed herewith is found in Part IV, “Item 15. Exhibits, Financial Statements and Financial Statement Schedule”.
| Item 9. | Changes in and Disagreements with Accountants on Accounting and Financial Disclosure |
Not applicable.
| Item 9A. | Controls and |
Evaluation of Disclosure Controls and Procedures
Our management under the supervision and with the participation of our chief executive officer and our chief financial officer, evaluated the design and operating effectiveness of our disclosure controls and procedures (as defined in Rules 13a-15(e) and 15d-15(e) under the Securities Exchange Act of 1934, as amended, or the Exchange Act) as of December 31, 2010.2012. Based on this evaluation, our chief executive officer and our chief financial officer concluded that, as of December 31, 2010,2012, our disclosure controls and procedures were effective to ensure that
information required to be disclosed by us in our reports that we file or submit under the Exchange Act is (i) recorded, processed, summarized and reported within the time periods specified in the SEC’s rules and forms and (ii) accumulated and communicated to our management, including our chief executive officer and our chief financial officer, as appropriate to allow timely decisions regarding required disclosure.
Changes in Internal Control over Financial Reporting
No changes in our internal control over financial reporting (as defined in Rules 13a-15(f) and 15d-15(f) under the Exchange Act) occurred during the fiscal quarter ended December 31, 20102012 that have materially affected, or are reasonably likely to materially affect, our internal control over financial reporting.
Management’s Responsibility for Financial Statements
Our management is responsible for the integrity and objectivity of all information presented in this annual report. The consolidated financial statements were prepared in conformity with accounting principles generally accepted in the United States of America and include amounts based on management’s best estimates and judgments. Management believes the consolidated financial statements fairly reflect the form and substance of transactions and that the financial statements fairly represent the Company’scompany’s financial position and results of operations.
The Audit Committee of the Board of Directors, which is composed solely of independent directors, meets regularly with the Company’scompany’s independent registered public accounting firm and representatives of management to review accounting, financial reporting, internal control and audit matters, as well as the nature and extent of the audit effort. The Audit Committee is responsible for the engagement of the independent registered public accounting firm. The independent registered public accounting firm has free access to the Audit Committee.
Management’s Report on Internal Control Over Financial Reporting
Our management is responsible for establishing and maintaining adequate internal control over financial reporting. Internal control over financial reporting is defined in Rule 13a-15(f) orand 15d-15(f) of the Exchange Act and is a process designed by, or under the supervision of, our chief executive and chief financial officers and effected by our Board of Directors, management and other personnel, to provide reasonable assurance regarding the reliability of financial reporting and the preparation of financial statements for external purposes in accordance with generally accepted accounting principles and includes those policies and procedures that:
Pertain to the maintenance of records that, in reasonable detail, accurately and fairly reflect the transactions and dispositions of our assets;
Provide reasonable assurance that transactions are recorded as necessary to permit preparation of financial statements in accordance with generally accepted accounting principles, and that receipts and expenditures of the Companycompany are being made only in accordance with authorizations of our management and directors; and
Provide reasonable assurance regarding prevention or timely detection of unauthorized acquisition, use or disposition of the Company’scompany’s assets that could have a material effect on the financial statements.
Our management assessed the effectiveness of the company’s internal control over financial reporting as of December 31, 2010.2012. In making this assessment, the Company’scompany’s management used the criteria set forth by the Committee of Sponsoring Organizations of the Treadway Commission (COSO) inInternal Control-Integrated Framework.
Based on its evaluation, our management has concluded that, as of December 31, 2010,2012, our internal control over financial reporting was effective. The effectiveness ofPricewaterhouseCoopers LLP, the independent registered public accounting firm that audited the financial statements included in this annual report, has issued an attestation report on our internal control over financial reporting, as of December 31, 2010 has been audited by PricewaterhouseCoopers LLP, an independent registered public accounting firm, as stated in their report which is included on page F-2.
Inherent Limitations of Internal Controls
Because of its inherent limitations, internal control over financial reporting may not prevent or detect all misstatements. Projections of any evaluation of effectiveness to future periods are subject to the risk that controls may become inadequate because of changes in conditions, or that the degree of compliance with the policies or procedures may deteriorate.
| Item 9B. | Other |
None.We have entered into amended and restated employment agreements with each of Messrs. Francisco D’Souza, our Chief Executive Officer, Gordon J. Coburn, our President, Ramakrishnan Chandrasekaran, our Group Chief Executive – Technology and Operations, Rajeev Mehta, our Group Chief Executive – Industry and Markets, and Steven Schwartz, our Senior Vice President and General Counsel, which supersede and replace these executives’ existing severance and noncompetition agreements. In addition, we have entered into an employment agreement with Ms. Karen McLoughlin, our Chief Financial Officer, who had not previously been a party to a severance and noncompetition or similar agreement. Each of these employment agreements is substantially similar, as described below. The agreements govern the terms and conditions of the executives’ employment, including their duties and responsibilities, compensation and benefits, and applicable severance terms.
Each employment agreement became effective February 25, 2013, and will continue in effect until terminated by the executive or by us. Each employment agreement provides for an annual base salary, which is subject to review and modification by our Compensation Committee. Each executive is also eligible to earn incentive compensation pursuant to applicable bonus plan(s), and is also eligible to receive the customary fringe benefits that are generally available to our employees.
Pursuant to the employment agreements, upon any termination of employment, the executive is entitled to receive any accrued but unpaid amounts or benefits as of the termination date. Each employment agreement also provides for certain severance payments and benefits upon specified terminations of employment. Upon a termination of employment without “cause,” other than due to the executive’s death or disability, or for “good reason,” in any case, prior to a “change in control” (each such term as defined in the applicable employment agreement), then subject to the execution of a release, the executive is entitled to receive: (i) continued payment of base salary for twenty-two months following termination; (ii) group medical insurance continuation coverage for up to twelve months following termination; (iii) accelerated vesting of any then-outstanding and unvested equity awards that are (A) subject to continued service vesting requirements only or (B) subject to performance-based vesting requirements with respect to which all performance objectives have been satisfied and the applicable performance period has expired so that only continued service vesting requirements remain as of the termination date, and in either case, that would have otherwise vested during the twelve-month period following termination (had the executive remained employed through such twelve-month period).
If such a termination occurs upon or within twelve months after a “change in control”, then subject to the execution of a release, the executive is entitled to receive (in lieu of the severance benefits described above): (a) an amount equal to one times the executive’s annual base salary, payable in installments over a twelve-month period following termination; (b) an amount equal to the executive’s target bonus for the year of termination (assuming 100% achievement of all applicable targets and objectives), payable in a lump sum within thirty-five days following termination; (c) group medical insurance continuation coverage for up to twelve months following termination; (d) accelerated vesting of any then-outstanding and unvested equity awards that are (X) subject to continued service vesting requirements only or (Y) subject to performance-based vesting requirements with respect to which all performance objectives have been satisfied and the applicable performance period has expired so that only continued service vesting requirements remain as of the termination date, and in either case, that would have otherwise vested during the twelve-month period following termination (had the executive remained employed through such twelve-month period); and (e) accelerated vesting of a prorated portion of any then-outstanding and unvested equity awards that are subject to performance-based
vesting requirements with respect to which the applicable performance period has not expired as of the termination date, based on the company’s determination of the level of achievement of the applicable performance objectives for the portion of the performance period that occurs prior to the consummation of the change in control.
The employment agreements each include an Internal Revenue Code Section 280G “cutback” provision, which provides that any payment or benefit paid or provided to the executives pursuant to the agreements that would otherwise constitute a “parachute payment” and be subject to an excise tax under Internal Revenue Code Section 4999 will be reduced to the extent necessary so that no portion of such payments or benefits will be subject to the excise tax. Additionally, each executive will be subject to any clawback or recoupment policies, pursuant to which we will be permitted to recoup all or part of certain severance amounts, cash bonuses or incentive compensation (including equity incentive compensation) paid or awarded to the executive in the event that we are required to restate our financial statements.
The employment agreements each contain confidentiality restrictions effective during and after employment and non-competition and non-solicitation covenants effective during employment and for one year following the termination of employment. In addition, the employment agreements contain intellectual property covenants which require the executives to disclose any inventions created by them during employment and for a period of six months following the termination of employment, and provides that the executives will assign certain inventions created during such period to us in accordance with applicable intellectual property laws.
The foregoing description of the employment agreements does not purport to be complete and is qualified by reference to the full text of the form of employment agreement, which is attached hereto as Exhibit 10.4 and incorporated by reference herein.
| Item 10. | Directors, Executive Officers and Corporate Governance |
The information relating to our directors and nominees for election as directors under the heading “Election of Directors” in our definitive proxy statement for the 20112013 Annual Meeting of Stockholders is incorporated herein by reference to such proxy statement. The information relating to our executive officers in response to this item is contained in part under the caption “Our Executive Officers” in Part I of this Annual Report on Form 10-K and the remainder is incorporated herein by reference to our definitive proxy statement for the 20112013 Annual Meeting of Stockholders under the headings “Section 16(a) Beneficial Ownership Reporting Compliance,” “Corporate Governance-Code of Ethics” and “Committees of the Board-Audit Committee.”
We have adopted a written code of business conduct and ethics, entitled “Cognizant’s Core Values and Standards of Business Conduct,” that applies to all of our employees, including our principal executive officer, principal financial officer, principal accounting officer and controller, or persons performing similar functions. We make available our code of business conduct and ethics free of charge through our website which is located atwww.cognizant.com. We intend to disclose any amendments to, or waivers from, our code of business conduct and ethics that are required to be publicly disclosed pursuant to rules of the SEC and the NASDAQ Global Select Market by filing such amendment or waiver with the SEC and by posting it on our website.
| Item 11. | Executive Compensation |
The discussion under the heading “Executive Compensation,” “Compensation Committee Report,” “Executive Compensation Tables” and “Compensation Committee Interlocks and Insider Participation” in our definitive proxy statement for the 20112013 Annual Meeting of Stockholders is incorporated herein by reference to such proxy statement.
| Item 12. | Security Ownership of Certain Beneficial Owners and Management and Related Stockholder Matters |
The discussion under the heading “Security Ownership of Certain Beneficial Owners and Management” and “Executive Compensation Tables-Equity Compensation Plan Information” in our definitive proxy statement for the 20112013 Annual Meeting of Stockholders is incorporated herein by reference to such proxy statement.
| Item 13. | Certain Relationships and Related Transactions, and Director Independence |
The discussion under the heading “Certain Relationships and Related Transactions and Director Independence” in our definitive proxy statement for the 20112013 Annual Meeting of Stockholders is incorporated herein by reference to such proxy statement.
| Item 14. | Principal Accountant Fees and Services |
The discussion under the heading “Independent Registered Public Accounting Firm Fees and Other Matters” in our definitive proxy statement for the 20112013 Annual Meeting of Stockholders is incorporated herein by reference to such proxy statement.
| Item 15. | Exhibits, Financial Statement Schedules |
| (a) | (1) | Consolidated Financial Statements. | ||
Reference is made to the Index to Consolidated Financial Statements on Page F-1. | ||||
(2) | Consolidated Financial Statement Schedule. | |||
Reference is made to the Index to Financial Statement Schedule on Page F-1. | ||||
(3) | Exhibits. | |||
Reference is made to the Index to Exhibits on Page | ||||
Schedules other than as listed above are omitted as not required or inapplicable or because the required information is provided in the consolidated financial statements, including the notes thereto.
Pursuant to the requirements of Section 13 or 15(d) of the Securities Exchange Act of 1934, the Registrant has duly caused this report to be signed on its behalf by the undersigned, thereunto duly authorized this 23rd26th day of February, 2011.2013.
| COGNIZANT TECHNOLOGY SOLUTIONS CORPORATION | ||
| By: | /S/ FRANCISCO | |
Francisco D’Souza, | ||
| Chief Executive Officer | ||
| (Principal Executive Officer) | ||
Pursuant to the requirements of the Securities Exchange Act of 1934, this report has been signed below by the following persons on behalf of the Registrant and in the capacities and on the dates indicated.
Signature | Title | Date | ||
/ Francisco D’Souza |
(Principal Executive Officer) | February | ||
/s/ K
| Chief Financial (Principal Financial and Accounting Officer) | February | ||
/ John E. Klein | Chairman of the Board and Director | February | ||
/ Lakshmi Narayanan | Vice Chairman of the Board and Director | February | ||
/ Thomas M. Wendel | Director | February | ||
/ Robert W. Howe | Director | February | ||
/ Robert E. Weissman | Director | February | ||
/ John N. Fox, Jr. | Director | February | ||
/ Maureen Breakiron-Evans | Director | February | ||
/s/ MICHAEL PATSALOS-FOX Michael Patsalos-Fox | Director | February 26, 2013 | ||
/s/ LEO S. MACKAY, JR. Leo S. Mackay, Jr. | Director | February 26, 2013 | ||
|
| |
| Incorporated by Reference | ||||||||||||||||||||||
Number | Exhibit Description | Form | File No. | Exhibit | Date | Filed Herewith | ||||||||||||||||
| 3.1 | Restated Certificate of Incorporation | 8-K | 000-24429 | 3.1 | 2/13/03 | |||||||||||||||||
| 3.2 | Amended and Restated By-laws of the Company, as amended on April 18, 2008 | 8-K | 000-24429 | 3.1 | 4/23/08 | |||||||||||||||||
| 3.3 | Amendment to Restated Certificate of Incorporation, dated May 26, 2004 | 10-Q | 000-24429 | 3.1 | 8/6/04 | |||||||||||||||||
| 3.4 | Amendment to Restated Certificate of Incorporation, dated June 13, 2006 | 8-K | 000-24429 | 3.1 | 6/13/06 | |||||||||||||||||
| 3.5 | Amendment to Restated Certificate of Incorporation, dated June 2, 2011 | 8-K | 000-24429 | 3.1 | 6/2/11 | |||||||||||||||||
| 3.6 | Amendment to Amended and Restated By-laws of the Company, as amended, dated June 2, 2011 | 8-K | 000-24429 | 3.2 | 6/2/11 | |||||||||||||||||
| 4.1 | Rights Agreement, dated March 5, 2003, between the Company and American Stock Transfer & Trust Company, as Rights Agent, which includes the Certificate of Designations for the Series A Junior Participating Preferred Stock as Exhibit A, the Form of Right Certificate as Exhibit B and the Summary of Rights to Purchase Preferred Shares as Exhibit C | 8-K | 000-24429 | 4.1 | 3/6/03 | |||||||||||||||||
| 4.2 | Specimen Certificate for shares of Class A common stock | S-4/A | 333-101216 | 4.2 | 1/30/03 | |||||||||||||||||
| 10.1† | Form of Indemnification Agreement for Directors and Officers | S-1 | 333-49783 | 10.1 | 4/9/98 | |||||||||||||||||
| 10.2† | Amended and Restated Cognizant Technology Solutions Key Employees’ Stock Option Plan | S-1 | 333-49783 | 10.2 | 4/9/98 | |||||||||||||||||
| 10.3† | Amended and Restated Cognizant Technology Solutions Non-Employee Directors’ Stock Option Plan | S-1 | 333-49783 | 10.3 | 4/9/98 | |||||||||||||||||
| 10.4† | Form of Amended and Restated Executive Employment and Non-Disclosure, Non-Competition, and Invention Assignment Agreement, between the Company and each of its Executive Officers. | * | ||||||||||||||||||||
| 10.5† | Amended and Restated 1999 Incentive Compensation Plan (as Amended and Restated Through April 26, 2007) | 8-K | 000-24429 | 10.1 | 6/8/07 | |||||||||||||||||
| 10.6† | 2004 Employee Stock Purchase Plan (as amended and restated effective as of April 1, 2010) | 8-K | 000-24429 | 10.1 | 6/1/10 | |||||||||||||||||
| 10.7† | Form of Stock Option Certificate | 10-Q | 000-24429 | 10.1 | 11/8/04 | |||||||||||||||||
Number Exhibit Description Incorporated by Reference Form File No. Exhibit Date Filed
Herewith 10.8† The Cognizant Technology Solutions Executive Pension Plan 10-Q 000-24429 10.2 8/8/05 10.9 Distribution Agreement between IMS Health Incorporated and the Company, dated
January 7, 2003 S-4/A 333-101216 10.13 1/30/03 10.10† Amended and Restated 1999 Incentive Competition Plan Amendment No. 1, which became effective on March 2, 2007 10-Q 000-24429 10.1 5/10/07 10.11† Amended and Restated Key Employees’ Stock Option Plan Amendment No. 1, which became effective on March 2, 2007 10-Q 000-24429 10.2 5/10/07 10.12† Amended and Restated Non-Employee Directors’ Stock Option Plan Amendment No. 1, which became effective on March 2, 2007 10-Q 000-24429 10.3 5/10/07 10.13† Form of Performance Unit Award for grants to certain executive officers 8-K 000-24429 10.1 12/7/07 10.14† Form of Stock Unit Award Agreement pursuant to the Cognizant Technology Solutions Corporation Amended and Restated 1999 Incentive Compensation Plan 8-K 000-24429 10.1 9/5/08 10.15† The Cognizant Technology Solutions Executive Pension Plan, as amended and restated 8-K 000-24429 10.2 12/5/08 10.16† Cognizant Technology Solutions Corporation 2009 Incentive Compensation Plan 8-K 000-24429 10.1 6/11/09 10.17† Form of Cognizant Technology Solutions Corporation Stock Option Agreement 8-K 000-24429 10.1 7/6/09 10.18† Form of Cognizant Technology Solutions Corporation Notice of Grant of Stock Option 8-K 000-24429 10.2 7/6/09 10.19† Form of Cognizant Technology Solutions Corporation Restricted Stock Unit Award Agreement Time-Based Vesting 8-K 000-24429 10.3 7/6/09 10.20† Form of Cognizant Technology Solutions Corporation Notice of Award of Restricted Stock Units Time-Based Vesting 8-K 000-24429 10.4 7/6/09 10.21† Form of Cognizant Technology Solutions Corporation Restricted Stock Unit Award Agreement Performance-Based Vesting 8-K 000-24429 10.5 7/6/09 10.22† Form of Cognizant Technology Solutions Corporation Notice of Award of Restricted Stock Units Performance-Based Vesting 8-K 000-24429 10.6 7/6/09
| Incorporated by Reference | ||||||||||||||||||||||
| Exhibit Description | |||||||||||||||||||||
| Form | File No. | Exhibit | Date | Filed Herewith | ||||||||||||||||||
|
| |||||||||||||||||||||
| Form of Cognizant Technology Solutions Corporation Notice of Award of Restricted Stock Units Non-Employee Director Deferred | 8-K | 000-24429 | 10.8 | 7/6/09 | ||||||||||||||||||
| 21.1 | List of subsidiaries of the | * | ||||||||||||||||||||
| 23.1 | Consent of PricewaterhouseCoopers | * | ||||||||||||||||||||
| 31.1 | Certification Pursuant to Rule 13a-14(a) and 15d-14(a) of the Exchange Act, as Adopted Pursuant to Section 302 of the Sarbanes-Oxley Act of 2002 (Chief Executive Officer) | * | ||||||||||||||||||||
| 31.2 | Certification Pursuant to Rule 13a-14(a) and 15d-14(a) of the Exchange Act, as Adopted Pursuant to Section 302 of the Sarbanes-Oxley Act of 2002 (Chief Financial Officer) | * | ||||||||||||||||||||
| 32.1 | Certification Pursuant to 18 U.S.C. Section 1350 (Chief Executive Officer) | * | ||||||||||||||||||||
| 32.2 | Certification Pursuant to 18 U.S.C. Section 1350 (Chief Financial Officer) | * | ||||||||||||||||||||
| 101.INS | XBRL Instance Document | * | ||||||||||||||||||||
| 101.SCH | XBRL Taxonomy Extension Schema Document | * | ||||||||||||||||||||
| 101.CAL | XBRL Taxonomy Extension Calculation Linkbase Document | * | ||||||||||||||||||||
| 101.DEF | XBRL Taxonomy Extension Definition Linkbase Document | * | ||||||||||||||||||||
| 101.LAB | XBRL Taxonomy Extension Label Linkbase Document | * | ||||||||||||||||||||
| 101.PRE | XBRL Taxonomy Extension Presentation Linkbase Document | * | ||||||||||||||||||||
| A management contract or compensatory plan or arrangement required to be filed as an exhibit pursuant to Item 15(a)(3) of Form 10-K. |
COGNIZANT TECHNOLOGY SOLUTIONS CORPORATION
INDEX TO CONSOLIDATED FINANCIAL STATEMENTS
AND FINANCIAL STATEMENT SCHEDULE
| Page | ||||
Consolidated Financial Statements: | ||||
| F-2 | ||||
Consolidated Statements of Financial Position as of December 31, | F-3 | |||
| F-4 | ||||
Consolidated Statements of Comprehensive Income for the years ended December 31, 2012, 2011 and 2010 | F-5 | |||
Financial Statement Schedule: | ||||
Report of Independent Registered Public Accounting Firm
To theBoardthe Board of Directors and Stockholders of Cognizant Technology Solutions Corporation:
In our opinion, the consolidated financial statements listed in the accompanying indexappearingindex appearing under Item 15(a)(1) present fairly, in all material respects, the financial position of Cognizant Technology Solutions Corporation (the “Company”) and its subsidiaries at December 31, 20102012 and December 31, 2009,2011, and the results of their operations and their cash flows for each of the three years in the period ended December 31, 20102012 in conformity with accounting principles generally accepted in the United States of America. In addition, in our opinion, the financial statement schedule listed in the accompanying index appearing under Item 15(a)(2) presents fairly, in all material respects, the information set forth therein when read in conjunction with the related consolidated financial statements. Also in our opinion, the Company maintained, in all material respects, effective internal control over financial reporting as of December 31, 2010,2012, based on criteria established inInternal Control—Integrated Framework issued by the Committee of Sponsoring Organizations of the Treadway Commission (COSO). The Company’s management is responsible for these financial statements and financial statement schedule, for maintaining effective internal control over financial reporting and for its assessment of the effectiveness of internal control over financial reporting, included in Management’s Report on Internal Control Over Financial Reporting appearing under Item 9A. Our responsibility is to express opinions on these financial statements, on the financial statement schedule, and on the Company’s internal control over financial reporting based on our integrated audits. We conducted our audits in accordance with the standards of the Public Company Accounting Oversight Board (United States). Those standards require that we plan and perform the audits to obtain reasonable assurance about whether the financial statements are free of material misstatement and whether effective internal control over financial reporting was maintained in all material respects. Our audits of the financial statements included examining, on a test basis, evidence supporting the amounts and disclosures in the financial statements, assessing the accounting principles used and significant estimates made by management, and evaluating the overall financial statement presentation. Our audit of internal control over financial reporting included obtaining an understanding of internal control over financial reporting, assessing the risk that a material weakness exists, and testing and evaluating the design and operating effectiveness of internal control based on the assessed risk. Our audits also included performing such other procedures as we considered necessary in the circumstances. We believe that our audits provide a reasonable basis for our opinions.
A company’s internal control over financial reporting is a process designed to provide reasonable assurance regarding the reliability of financial reporting and the preparation of financial statements for external purposes in accordance with generally accepted accounting principles. A company’s internal control over financial reporting includes those policies and procedures that (i) pertain to the maintenance of records that, in reasonable detail, accurately and fairly reflect the transactions and dispositions of the assets of the company; (ii) provide reasonable assurance that transactions are recorded as necessary to permit preparation of financial statements in accordance with generally accepted accounting principles, and that receipts and expenditures of the company are being made only in accordance with authorizations of management and directors of the company; and (iii) provide reasonable assurance regarding prevention or timely detection of unauthorized acquisition, use, or disposition of the company’s assets that could have a material effect on the financial statements.
Because of its inherent limitations, internal control over financial reporting may not prevent or detect misstatements. Also, projections of any evaluation of effectiveness to future periods are subject to the risk that controls may become inadequate because of changes in conditions, or that the degree of compliance with the policies or procedures may deteriorate.
PRICEWATERHOUSECOOPERSPricewaterhouseCoopers LLP
New York, New York
February 23, 201126, 2013
COGNIZANT TECHNOLOGY SOLUTIONS CORPORATION
CONSOLIDATED STATEMENTS OF FINANCIAL POSITION
(in thousands, except par values)
| At December 31, | At December 31, | |||||||||||||||
| 2010 | 2009 | 2012 | 2011 | |||||||||||||
| Assets | ||||||||||||||||
Current assets: | ||||||||||||||||
Cash and cash equivalents | $ | 1,540,969 | $ | 1,100,930 | $ | 1,570,077 | $ | 1,310,906 | ||||||||
Short-term investments | 685,419 | 298,402 | 1,293,681 | 1,121,358 | ||||||||||||
Trade accounts receivable, net of allowances of $20,991 and $16,465, respectively | 901,308 | 626,288 | ||||||||||||||
Trade accounts receivable, net of allowances of $25,816 and $24,658, respectively | 1,345,661 | 1,179,043 | ||||||||||||||
Unbilled accounts receivable | 112,960 | 82,952 | 183,085 | 139,627 | ||||||||||||
Deferred income tax assets, net | 96,164 | 73,791 | 201,894 | 109,042 | ||||||||||||
Other current assets | 181,414 | 125,205 | 219,896 | 225,530 | ||||||||||||
|
| |||||||||||||||
Total current assets | 3,518,234 | 2,307,568 | 4,814,294 | 4,085,506 | ||||||||||||
Property and equipment, net of accumulated depreciation of $352,472 and $274,570, respectively | 570,448 | 481,516 | ||||||||||||||
Long-term investments | — | 151,131 | ||||||||||||||
Property and equipment, net of accumulated depreciation of $573,792 and $455,506, respectively | 971,486 | 758,034 | ||||||||||||||
Goodwill | 223,963 | 192,372 | 309,185 | 288,772 | ||||||||||||
Intangible assets, net | 85,136 | 75,757 | 87,475 | 97,616 | ||||||||||||
Deferred income tax assets, net | 109,808 | 80,618 | 178,824 | 164,192 | ||||||||||||
Other noncurrent assets | 75,485 | 49,278 | 160,307 | 113,813 | ||||||||||||
|
| |||||||||||||||
Total assets | $ | 4,583,074 | $ | 3,338,240 | $ | 6,521,571 | $ | 5,507,933 | ||||||||
|
| |||||||||||||||
| Liabilities and Stockholders’ Equity | ||||||||||||||||
Current liabilities: | ||||||||||||||||
Accounts payable | $ | 75,373 | $ | 54,640 | $ | 108,707 | $ | 72,205 | ||||||||
Deferred revenue | 84,590 | 51,605 | 149,696 | 105,713 | ||||||||||||
Accrued expenses and other current liabilities | 770,763 | 540,363 | 1,118,927 | 1,031,787 | ||||||||||||
|
| |||||||||||||||
Total current liabilities | 930,726 | 646,608 | 1,377,330 | 1,209,705 | ||||||||||||
Deferred income tax liabilities, net | 4,946 | — | 2,777 | 3,339 | ||||||||||||
Other noncurrent liabilities | 62,971 | 38,455 | 287,081 | 342,003 | ||||||||||||
|
| |||||||||||||||
Total liabilities | 998,643 | 685,063 | 1,667,188 | 1,555,047 | ||||||||||||
|
| |||||||||||||||
Commitments and contingencies (See Note 13) | ||||||||||||||||
Stockholders’ equity: | ||||||||||||||||
Stockholders’ Equity: | ||||||||||||||||
Preferred stock, $.10 par value, 15,000 shares authorized, none issued | — | — | — | — | ||||||||||||
Class A common stock, $.01 par value, 500,000 shares authorized, 303,941 and 297,231 shares issued and outstanding at December 31, 2010 and 2009, respectively | 3,039 | 2,972 | ||||||||||||||
Class A common stock, $.01 par value, 1,000,000 shares authorized, 301,680 and 303,106 shares issued and outstanding at December 31, 2012 and December 31, 2011, respectively | 3,017 | 3,031 | ||||||||||||||
Additional paid-in capital | 846,886 | 664,560 | 457,260 | 692,723 | ||||||||||||
Retained earnings | 2,698,908 | 1,965,368 | 4,633,789 | 3,582,526 | ||||||||||||
Accumulated other comprehensive income (loss) | 35,598 | 20,277 | (239,683 | ) | (325,394 | ) | ||||||||||
|
| |||||||||||||||
Total stockholders’ equity | 3,584,431 | 2,653,177 | 4,854,383 | 3,952,886 | ||||||||||||
|
| |||||||||||||||
Total liabilities and stockholders’ equity | $ | 4,583,074 | $ | 3,338,240 | $ | 6,521,571 | $ | 5,507,933 | ||||||||
|
| |||||||||||||||
The accompanying notes are an integral part of the consolidated financial statements.
COGNIZANT TECHNOLOGY SOLUTIONS CORPORATION
CONSOLIDATED STATEMENTS OF OPERATIONS
(in thousands, except per share data)
| Year Ended December 31, | Year Ended December 31, | |||||||||||||||||||||||
| 2010 | 2009 | 2008 | 2012 | 2011 | 2010 | |||||||||||||||||||
Revenues | $ | 4,592,389 | $ | 3,278,663 | $ | 2,816,304 | $ | 7,346,472 | $ | 6,121,156 | $ | 4,592,389 | ||||||||||||
Operating expenses: | ||||||||||||||||||||||||
Cost of revenues (exclusive of depreciation and amortization expense shown separately below) | 2,654,569 | 1,849,443 | 1,572,816 | 4,278,241 | 3,538,622 | 2,654,569 | ||||||||||||||||||
Selling, general and administrative expenses | 972,093 | 721,359 | 652,021 | 1,557,646 | 1,328,665 | 972,093 | ||||||||||||||||||
Depreciation and amortization expense | 103,875 | 89,371 | 74,797 | 149,089 | 117,401 | 103,875 | ||||||||||||||||||
|
|
| ||||||||||||||||||||||
Income from operations | 861,852 | 618,490 | 516,670 | 1,361,496 | 1,136,468 | 861,852 | ||||||||||||||||||
|
|
| ||||||||||||||||||||||
Other income (expense), net: | ||||||||||||||||||||||||
Interest income | 25,793 | 15,895 | 22,188 | 44,514 | 39,249 | 25,793 | ||||||||||||||||||
Other, net | (9,065 | ) | 2,566 | (23,648 | ) | (18,414 | ) | (6,568 | ) | (9,065 | ) | |||||||||||||
|
|
| ||||||||||||||||||||||
Total other income (expense), net | 16,728 | 18,461 | (1,460 | ) | 26,100 | 32,681 | 16,728 | |||||||||||||||||
|
|
| ||||||||||||||||||||||
Income before provision for income taxes | 878,580 | 636,951 | 515,210 | 1,387,596 | 1,169,149 | 878,580 | ||||||||||||||||||
Provision for income taxes | 145,040 | 101,988 | 84,365 | 336,333 | 285,531 | 145,040 | ||||||||||||||||||
|
|
| ||||||||||||||||||||||
Net income | $ | 733,540 | $ | 534,963 | $ | 430,845 | $ | 1,051,263 | $ | 883,618 | $ | 733,540 | ||||||||||||
|
|
| ||||||||||||||||||||||
Basic earnings per share | $ | 2.44 | $ | 1.82 | $ | 1.49 | $ | 3.49 | $ | 2.91 | $ | 2.44 | ||||||||||||
|
|
| ||||||||||||||||||||||
Diluted earnings per share | $ | 2.37 | $ | 1.78 | $ | 1.44 | $ | 3.44 | $ | 2.85 | $ | 2.37 | ||||||||||||
|
|
| ||||||||||||||||||||||
Weighted average number of common shares outstanding—Basic | 300,781 | 293,304 | 290,121 | 301,291 | 303,277 | 300,781 | ||||||||||||||||||
Dilutive effect of shares issuable under stock-based compensation plans | 8,356 | 7,811 | 8,819 | 4,570 | 7,074 | 8,356 | ||||||||||||||||||
|
|
| ||||||||||||||||||||||
Weighted average number of common shares outstanding—Diluted | 309,137 | 301,115 | 298,940 | 305,861 | 310,351 | 309,137 | ||||||||||||||||||
|
|
| ||||||||||||||||||||||
The accompanying notes are an integral part of the financial statements.
COGNIZANT TECHNOLOGY SOLUTIONS CORPORATION
CONSOLIDATED STATEMENTS OF STOCKHOLDERS’ EQUITY
(in thousands)
Class A Common Stock | Additional Paid-in Capital | Retained Earnings | Accumulated Other Comprehensive Income(Loss) | Total | ||||||||||||||||||||
| Shares | Amount | |||||||||||||||||||||||
Balance, December 31, 2007 | 288,012 | $ | 2,880 | $ | 450,567 | $ | 999,560 | $ | 15,203 | $ | 1,468,210 | |||||||||||||
Net income | — | — | — | 430,845 | — | 430,845 | ||||||||||||||||||
Foreign currency translation adjustments | — | — | — | — | (25,258 | ) | (25,258 | ) | ||||||||||||||||
Change in unrealized gain on cash flow hedges, net of taxes of $22 | — | — | — | — | 576 | 576 | ||||||||||||||||||
Comprehensive income | $ | 406,163 | ||||||||||||||||||||||
Common stock issued, stock-based compensation plans | 4,575 | 46 | 54,830 | — | — | 54,876 | ||||||||||||||||||
Tax benefit, stock-based compensation plans | — | — | 18,058 | — | — | 18,058 | ||||||||||||||||||
Stock-based compensation expense | — | — | 43,900 | — | — | 43,900 | ||||||||||||||||||
Repurchases of common stock | (979 | ) | (10 | ) | (27,825 | ) | — | — | (27,835 | ) | ||||||||||||||
Acquisition (See Note 2) | 62 | 1 | 2,205 | — | — | 2,206 | ||||||||||||||||||
Balance, December 31, 2008 | 291,670 | 2,917 | 541,735 | 1,430,405 | (9,479 | ) | 1,965,578 | |||||||||||||||||
Net income | — | — | — | 534,963 | — | 534,963 | ||||||||||||||||||
Foreign currency translation adjustments | — | — | — | — | 11,922 | 11,922 | ||||||||||||||||||
Change in unrealized gain on cash flow hedges, net of taxes of $550 | — | — | — | — | 17,834 | 17,834 | ||||||||||||||||||
Comprehensive income | $ | 564,719 | ||||||||||||||||||||||
Common stock issued, stock-based compensation plans | 6,326 | 63 | 61,588 | — | — | 61,651 | ||||||||||||||||||
Tax benefit, stock-based compensation plans | — | — | 32,672 | — | — | 32,672 | ||||||||||||||||||
Stock-based compensation expense | — | — | 44,816 | — | — | 44,816 | ||||||||||||||||||
Repurchases of common stock | (765 | ) | (8 | ) | (16,251 | ) | — | — | (16,259 | ) | ||||||||||||||
Balance, December 31, 2009 | 297,231 | 2,972 | 664,560 | 1,965,368 | 20,277 | 2,653,177 | ||||||||||||||||||
Net income | — | — | — | 733,540 | — | 733,540 | ||||||||||||||||||
Foreign currency translation adjustments | — | — | — | — | 2,411 | 2,411 | ||||||||||||||||||
Change in unrealized gain on cash flow hedges, net of taxes of $1,044 | — | — | — | — | 12,313 | 12,313 | ||||||||||||||||||
Change in unrealized gain on available-for-sale securities, net of taxes of $408 | — | — | — | — | 597 | 597 | ||||||||||||||||||
Comprehensive income | $ | 748,861 | ||||||||||||||||||||||
Common stock issued, stock-based compensation plans | 7,529 | 75 | 107,009 | — | — | 107,084 | ||||||||||||||||||
Tax benefit, stock-based compensation plans | — | — | 73,839 | — | — | 73,839 | ||||||||||||||||||
Stock-based compensation expense | — | — | 56,984 | — | — | 56,984 | ||||||||||||||||||
Repurchases of common stock | (892 | ) | (9 | ) | (58,991 | ) | — | — | (59,000 | ) | ||||||||||||||
Acquisition (See Note 2) | 73 | 1 | 3,485 | — | — | 3,486 | ||||||||||||||||||
Balance, December 31, 2010 | 303,941 | $ | 3,039 | $ | 846,886 | $ | 2,698,908 | $ | 35,598 | $ | 3,584,431 | |||||||||||||
The accompanying notes are an integral part of the consolidated financial statements.
COGNIZANT TECHNOLOGY SOLUTIONS CORPORATION
CONSOLIDATED STATEMENTS OF CASH FLOWSCOMPREHENSIVE INCOME
(in thousands)
| Year Ended December 31, | ||||||||||||
| 2010 | 2009 | 2008 | ||||||||||
Cash flows from operating activities: | ||||||||||||
Net income | $ | 733,540 | $ | 534,963 | $ | 430,845 | ||||||
Adjustments to reconcile net income to net cash provided by operating activities: | ||||||||||||
Depreciation and amortization | 110,172 | 89,371 | 74,797 | |||||||||
Provision for doubtful accounts | 5,950 | 3,347 | 8,473 | |||||||||
Deferred income taxes | (51,909 | ) | (26,589 | ) | (5,028 | ) | ||||||
Stock-based compensation expense | 56,984 | 44,816 | 43,900 | |||||||||
Excess tax benefit on stock-based compensation plans | (71,919 | ) | (31,556 | ) | (16,993 | ) | ||||||
Other | (7,598 | ) | (6,101 | ) | 2,587 | |||||||
Changes in assets and liabilities: | ||||||||||||
Trade accounts receivable | (278,418 | ) | (98,451 | ) | (168,395 | ) | ||||||
Other current assets | (75,347 | ) | (42,778 | ) | (31,151 | ) | ||||||
Other assets | (24,296 | ) | (9,255 | ) | (9,976 | ) | ||||||
Accounts payable | 18,597 | 6,675 | 19,283 | |||||||||
Other current and noncurrent liabilities | 348,898 | 207,883 | 81,363 | |||||||||
Net cash provided by operating activities | 764,654 | 672,325 | 429,705 | |||||||||
Cash flows used in investing activities: | ||||||||||||
Purchases of property and equipment | (185,512 | ) | (76,639 | ) | (169,410 | ) | ||||||
Purchases of investments | (934,185 | ) | (348,209 | ) | (135,200 | ) | ||||||
Proceeds from maturity or sale of investments | 706,670 | 98,697 | 270,560 | |||||||||
Acquisitions, net of cash acquired | (33,863 | ) | (68,613 | ) | (20,956 | ) | ||||||
Net cash used in investing activities | (446,890 | ) | (394,764 | ) | (55,006 | ) | ||||||
Cash flows from financing activities: | ||||||||||||
Issuance of common stock under stock-based compensation plans | 107,084 | 61,651 | 54,876 | |||||||||
Excess tax benefit on stock-based compensation plans | 71,919 | 31,556 | 16,993 | |||||||||
Repurchases of common stock | (59,000 | ) | (16,259 | ) | (27,835 | ) | ||||||
Net cash provided by financing activities | 120,003 | 76,948 | 44,034 | |||||||||
Effect of currency translation on cash and cash equivalents | 2,272 | 11,355 | (23,512 | ) | ||||||||
Increase in cash and cash equivalents | 440,039 | 365,864 | 395,221 | |||||||||
Cash and cash equivalents, at beginning of year | 1,100,930 | 735,066 | 339,845 | |||||||||
Cash and cash equivalents, at end of year | $ | 1,540,969 | $ | 1,100,930 | $ | 735,066 | ||||||
Supplemental information: | ||||||||||||
Cash paid for income taxes during the year | $ | 127,129 | $ | 120,544 | $ | 82,802 | ||||||
| Year Ended December 31, | ||||||||||||
| 2012 | 2011 | 2010 | ||||||||||
Net income | $ | 1,051,263 | $ | 883,618 | $ | 733,540 | ||||||
|
|
|
|
|
| |||||||
Other comprehensive income (loss), net of tax: | ||||||||||||
Foreign currency translation adjustments | 15,133 | (7,839 | ) | 2,411 | ||||||||
Change in unrealized (loss) gain on cash flow hedges, net of taxes of $18,816, ($64,217) and $1,044 for the years ended December 31, 2012, 2011 and 2010, respectively | 70,229 | (353,762 | ) | 12,313 | ||||||||
Change in unrealized gain on available-for-sale securities, net of taxes of $105, $372, $408 for the years ended December 31, 2012, 2011 and 2010, respectively | 349 | 609 | 597 | |||||||||
|
|
|
|
|
| |||||||
Other comprehensive income (loss) | 85,711 | (360,992 | ) | 15,321 | ||||||||
|
|
|
|
|
| |||||||
Comprehensive income | $ | 1,136,974 | $ | 522,626 | $ | 748,861 | ||||||
|
|
|
|
|
| |||||||
The accompanying notes are an integral part of the consolidated financial statements.
COGNIZANT TECHNOLOGY SOLUTIONS CORPORATION
CONSOLIDATED STATEMENTS OF STOCKHOLDERS’ EQUITY
(in thousands)
| Class A Common Stock | Additional Paid-in Capital | Retained Earnings | Accumulated Other Comprehensive Income (Loss) | |||||||||||||||||||||
| Shares | Amount | Total | ||||||||||||||||||||||
Balance, December 31, 2009 | 297,231 | $ | 2,972 | $ | 664,560 | $ | 1,965,368 | $ | 20,277 | $ | 2,653,177 | |||||||||||||
Net income | — | — | — | 733,540 | — | 733,540 | ||||||||||||||||||
Other comprehensive income | — | — | — | — | 15,321 | 15,321 | ||||||||||||||||||
|
| |||||||||||||||||||||||
Comprehensive income | $ | 748,861 | ||||||||||||||||||||||
|
| |||||||||||||||||||||||
Common stock issued, stock-based compensation plans | 7,529 | 75 | 107,009 | — | — | 107,084 | ||||||||||||||||||
Tax benefit, stock-based compensation plans | — | — | 73,839 | — | — | 73,839 | ||||||||||||||||||
Stock-based compensation expense | — | — | 56,984 | — | — | 56,984 | ||||||||||||||||||
Repurchases of common stock | (892 | ) | (9 | ) | (58,991 | ) | — | — | (59,000 | ) | ||||||||||||||
Business combination (see Note 2) | 73 | 1 | 3,485 | — | — | 3,486 | ||||||||||||||||||
|
|
|
|
|
|
|
|
|
|
|
| |||||||||||||
Balance, December 31, 2010 | 303,941 | 3,039 | 846,886 | 2,698,908 | 35,598 | 3,584,431 | ||||||||||||||||||
Net income | — | — | — | 883,618 | — | 883,618 | ||||||||||||||||||
Other comprehensive (loss) | — | — | — | — | (360,992 | ) | (360,992 | ) | ||||||||||||||||
|
| |||||||||||||||||||||||
Comprehensive income | $ | 522,626 | ||||||||||||||||||||||
|
| |||||||||||||||||||||||
Common stock issued, stock-based compensation plans | 4,513 | 45 | 79,506 | — | — | 79,551 | ||||||||||||||||||
Tax benefit, stock-based compensation plans | — | — | 39,778 | — | — | 39,778 | ||||||||||||||||||
Stock-based compensation expense | — | — | 90,232 | — | — | 90,232 | ||||||||||||||||||
Repurchases of common stock | (5,511 | ) | (55 | ) | (374,092 | ) | — | — | (374,147 | ) | ||||||||||||||
Business combination (see Note 2) | 163 | 2 | 10,413 | — | — | 10,415 | ||||||||||||||||||
|
|
|
|
|
|
|
|
|
|
|
| |||||||||||||
Balance, December 31, 2011 | 303,106 | 3,031 | 692,723 | 3,582,526 | (325,394 | ) | 3,952,886 | |||||||||||||||||
Net income | — | — | — | 1,051,263 | — | 1,051,263 | ||||||||||||||||||
Other comprehensive income | — | — | — | — | 85,711 | 85,711 | ||||||||||||||||||
|
| |||||||||||||||||||||||
Comprehensive income | $ | 1,136,974 | ||||||||||||||||||||||
|
| |||||||||||||||||||||||
Common stock issued, stock-based compensation plans | 7,176 | 72 | 129,413 | — | — | 129,485 | ||||||||||||||||||
Tax benefit, stock based compensation plans | — | — | 48,528 | — | — | 48,528 | ||||||||||||||||||
Stock-based compensation expense | — | — | 107,355 | — | — | 107,355 | ||||||||||||||||||
Repurchases of common stock | (8,602 | ) | (86 | ) | (520,759 | ) | — | — | (520,845 | ) | ||||||||||||||
|
|
|
|
|
|
|
|
|
|
|
| |||||||||||||
Balance, December 31, 2012 | 301,680 | $ | 3,017 | $ | 457,260 | $ | 4,633,789 | $ | (239,683 | ) | $ | 4,854,383 | ||||||||||||
|
|
|
|
|
|
|
|
|
|
|
| |||||||||||||
The accompanying notes are an integral part of the consolidated financial statements.
COGNIZANT TECHNOLOGY SOLUTIONS CORPORATION
CONSOLIDATED STATEMENTS OF CASH FLOWS
(in thousands)
| Year Ended December 31, | ||||||||||||
| 2012 | 2011 | 2010 | ||||||||||
Cash flows from operating activities: | ||||||||||||
Net income | $ | 1,051,263 | $ | 883,618 | $ | 733,540 | ||||||
Adjustments to reconcile net income to net cash provided by operating activities: | ||||||||||||
Depreciation and amortization | 156,588 | 124,175 | 110,172 | |||||||||
Provision for doubtful accounts | 5,076 | 4,582 | 5,950 | |||||||||
Deferred income taxes | (117,908 | ) | (8,599 | ) | (51,909 | ) | ||||||
Stock-based compensation expense | 107,355 | 90,232 | 56,984 | |||||||||
Excess tax benefits on stock-based compensation plans | (48,373 | ) | (39,141 | ) | (71,919 | ) | ||||||
Other | 2,499 | 46,036 | (7,598 | ) | ||||||||
Changes in assets and liabilities: | ||||||||||||
Trade accounts receivable | (158,603 | ) | (284,167 | ) | (278,418 | ) | ||||||
Other current assets | (29,833 | ) | (99,224 | ) | (75,347 | ) | ||||||
Other noncurrent assets | (36,692 | ) | (28,805 | ) | (24,296 | ) | ||||||
Accounts payable | 32,773 | (8,593 | ) | 18,597 | ||||||||
Other current and noncurrent liabilities | 208,438 | 195,038 | 348,898 | |||||||||
|
|
|
|
|
| |||||||
Net cash provided by operating activities | 1,172,583 | 875,152 | 764,654 | |||||||||
|
|
|
|
|
| |||||||
Cash flows from investing activities: | ||||||||||||
Purchases of property and equipment | (334,465 | ) | (288,221 | ) | (185,512 | ) | ||||||
Purchases of investments | (1,428,508 | ) | (1,338,664 | ) | (934,185 | ) | ||||||
Proceeds from maturity or sale of investments | 1,252,821 | 859,404 | 706,670 | |||||||||
Business combinations, net of cash acquired | (59,894 | ) | (82,800 | ) | (33,863 | ) | ||||||
|
|
|
|
|
| |||||||
Net cash (used in) investing activities | (570,046 | ) | (850,281 | ) | (446,890 | ) | ||||||
|
|
|
|
|
| |||||||
Cash flows from financing activities: | ||||||||||||
Issuance of common stock under stock-based compensation plans | 129,484 | 79,551 | 107,084 | |||||||||
Excess tax benefits on stock-based compensation plans | 48,373 | 39,141 | 71,919 | |||||||||
Repurchases of common stock | (520,845 | ) | (374,147 | ) | (59,000 | ) | ||||||
|
|
|
|
|
| |||||||
Net cash (used in) provided by financing activities | (342,988 | ) | (255,455 | ) | 120,003 | |||||||
|
|
|
|
|
| |||||||
Effect of exchange rate changes on cash and cash equivalents | (378 | ) | 521 | 2,272 | ||||||||
|
|
|
|
|
| |||||||
Increase (decrease) in cash and cash equivalents | 259,171 | (230,063 | ) | 440,039 | ||||||||
Cash and cash equivalents, beginning of year | 1,310,906 | 1,540,969 | 1,100,930 | |||||||||
|
|
|
|
|
| |||||||
Cash and cash equivalents, end of period | $ | 1,570,077 | $ | 1,310,906 | $ | 1,540,969 | ||||||
|
|
|
|
|
| |||||||
Supplemental information: | ||||||||||||
Cash paid for income taxes during the year | $ | 402,098 | $ | 248,229 | $ | 127,129 | ||||||
|
|
|
|
|
| |||||||
The accompanying notes are an integral part of the consolidated financial statements.
Notes to Consolidated Financial Statements
(Dollars in thousands, except share data)
1. Summary of Significant Accounting Policies
The terms “Cognizant,” “we,” “our,” “us” and the “Company” refer to Cognizant Technology Solutions Corporation and its subsidiaries unless the context indicates otherwise.
Description of Business. Cognizant isWe are a leading provider of custom information technology or IT,(IT), consulting and business process outsourcing services.services, dedicated to helping the world’s leading companies build stronger businesses. Our customers are primarily Global 2000 companies.clients engage us to help them build more efficient operations, provide solutions to critical business and technology problems, and to help them drive technology-based innovation and growth. Our core competencies include Technology Strategyinclude: Business, Process, Operations and IT Consulting, ComplexApplication Development and Systems Development,Integration, Enterprise Software Package Implementation and Maintenance, Data Warehousing and Business Intelligence,Information Management, or EIM, Application Testing, Application Maintenance, IT Infrastructure ManagementServices, or IT IS and Business and Knowledge Process Outsourcing.Outsourcing, or BPO and KPO. We tailor our services to specific industries and utilize an integrated global delivery model. This seamless global delivery model combines technical and account management teams located on-site at the customer location and at dedicated near-shore and offshore development and delivery centers located primarily in India, China, the United States, Canada, Argentina, Hungary and the Philippines.
Basis of Presentation and Principles of Consolidation. The consolidated financial statements are presented in accordance with generally accepted accounting principles in the United States of America, or USU.S. GAAP, and reflect the consolidated financial position, results of operations, comprehensive income and cash flows of our consolidated subsidiaries for all periods presented. All intercompany balances and transactions have been eliminated in consolidation.
Cash and Cash Equivalents and Investments.Cash and cash equivalents consist of all cash balances, including money market funds and liquid instruments. Liquid instruments are classified as cash equivalents when their maturities at the date of purchase are three months or less and as short-term investments when their maturities at the date of purchase are greater than three months.
We determine the appropriate classification of our investments in marketable securities at the date of purchase and reevaluate such designation at each balance sheet date. We have classified and accounted for our marketable securities as available-for-sale. After consideration of our risk versus reward objectives, as well as our liquidity requirements, we may sell these securities prior to their stated maturities. As we view these marketable securities as available to support current operations, we classify such securities with maturities at the date of purchase beyond twelve months as short-term investments because such investments represent an investment in cash that is available for current operations. Non-marketable investments are classified as short-term investments when their maturities are between three and twelve months and as long-term investments when their maturities are greater than twelve months.
Available-for-sale securities are reported at fair value with changes in unrealized gains and losses recorded as a separate component of accumulated other comprehensive income (loss) until realized. We determine the cost of the securities sold based on the specific identification method. Trading securities are reported at fair value with any unrealized gains or losses related to the changes in fair value recorded in income or loss. Time deposits with financial institutions are valued at cost, which approximates fair value.
Interest and amortization of premiums and discounts for debt securities are included in interest income. We also evaluate our available-for-sale investments periodically for possible other-than-temporary impairment by reviewing factors such as the length of time and extent to which fair value has been below cost basis, the financial condition of the issuer, whether we intend to sell the security and whether it is more likely than not that we will be required to sell the security prior to recovery of its amortized cost basis. Once a decline in fair value is determined to be other-than-temporary, an impairment charge is generally recorded to earningsincome and a new cost basis in the investment is established.
Allowance for Doubtful Accounts. We maintain an allowance for doubtful accounts for estimated losses resulting from the inability of our customers to make required payments. The allowance for doubtful accounts is determined by evaluating the relative credit-worthiness of each customer, historical collections experience and other information, including the aging of the receivables. We evaluate the collectibilitycollectability of our accounts receivable on an on-going basis and write-off accounts when they are deemed to be uncollectible.
Unbilled Accounts Receivable.Unbilled accounts receivable represent revenues on contracts to be billed, in subsequent periods, as per the terms of the related contracts.
Short-term Financial Assets and Liabilities.Cash and cash equivalents, trade receivables, accounts payable and other accrued liabilities are short-term in nature and, accordingly, their carrying values approximate fair value.
Property and Equipment. Property and equipment are stated at cost, net of accumulated depreciation. Depreciation is calculated on the straight-line basis over the estimated useful lives of the assets. Leasehold improvements are amortized on a straight-line basis over the shorter of the term of the lease or the estimated useful life of the improvement. Maintenance and repairs are expensed as incurred, while renewals and betterments are capitalized. Deposits paid towards acquisition of long-lived assets and the cost of assets not put in use before the balance sheet date are disclosed under the caption “capital work-in-progress” in Note 4.
Internal Use Software. Costs for software developed or obtained for internal use are capitalized, including the salaries and benefits of employees that are directly involved in the installation and development of such software. The capitalized costs are amortized on a straight-line basis over the lesser of three years or the software’s useful life. Costs associated with preliminary project stage activities, training, maintenance and all other post-implementation stage activities are expensed as incurred.
Goodwill. We allocate the cost of an acquired entity to the assets acquired and liabilities assumed based on their estimated fair values including goodwill and identifiable intangible assets. We do not amortize goodwill, but instead test goodwill at the reporting unit level for impairment at least annually or as circumstances warrant. If an impairment is indicated, a write-down to fair value (normally measured by discounting estimated future cash flows) is recorded. We do not have any indefinite-lived intangible assets.
Long-Lived Assets including Finite-lived Intangible Assetsand Intangibles. We review long-lived assets and certain identifiable intangibles for impairment whenever events or changes in circumstances indicate that the carrying amount of an asset may not be recoverable. We recognize an impairment loss when the sum of undiscounted expected future cash flows is less than the carrying amount of such assets. The impairment loss would equal the amount by which the carrying amount of the asset exceeds the fair value of the asset. Other intangibles consist primarily of customer relationships and developed technology, which are being amortized on a straight-line basis over their estimated useful lives.
Stock Repurchase Program. In December 2010,Our existing stock repurchase program approved by our Board of Directors authorized up to $150,000, excluding feesin December 2010 and expenses,subsequently amended during 2011 and 2012 allows for repurchasesthe repurchase of Cognizant’s$1,000,000 of our outstanding shares of Class A common stock. This stock repurchase program, as amended, expires on December 31, 2013. We completed stock repurchases of 600,00013,675,683 shares for $41,864, inclusive of fees and expenses, under this program. Under a stock repurchase program which expired in December 2009, we were authorized to repurchase up to $50,000, excluding fees and expenses, of our Class A common stock. We completed stock repurchases of 650,000 shares for $12,439,$866,566, inclusive of fees and expenses, under this program. Additional stock repurchases were made in connection with our stock-based compensation plans, whereby Company shares were tendered by employees for payment of exercise price or applicable statutory tax withholdings. During 20102012, 2011, and 2009,2010 such repurchases totaled 292,576532,592, 504,164 and 114,642292,576 shares, respectively, at an aggregate cost of $17,136$34,925, $35,365 and $3,820,$17,136, respectively. At the time of repurchase, shares are returned to the status of authorized and unissued shares. We account for the repurchases as constructively retired and record such repurchases as a reduction of Class A common stock and additional paid-in capital.
Revenue Recognition. Our contracts are entered into on either a time-and-materials or fixed-price basis. Revenues related to time-and-material contracts are recognized as the service is performed. Revenues related to fixed-price contracts that provide for highly complex information technology application development services are recognized as the service is performed using the percentage of completion method of accounting, under which the total value of revenue is recognized on the basis of the percentage that each contract’s total labor cost to date bears to the total expected labor costs (cost to cost method). Revenues related to fixed-price contracts that provide solely for application maintenance services are recognized on a straight-line basis unless revenues are earned and obligations are fulfilled in a different pattern. Revenues related
to fixed-price contracts that do not provide for highly complex information technology development services are recognized as services are performed on a proportional performance basis based upon the level of effort. Expenses are recorded as incurred overduring the contract period.
Revenues related to business process outsourcing, or BPO, contracts entered into on a time-and-material basis are recognized as the services are performed. Revenues from fixed-price BPO contracts are recognized on a straight-line basis, unless revenues are earned and obligations are fulfilled in a different pattern. Revenues from transaction-priced contracts are recognized as transactions are processed. Amounts billable for transition or set-up activities in BPO contracts are deferred and recognized as revenue evenly over the period services are provided. Costs related to delivering BPO services are expensed as incurred with the exception of certain transition costs related to the set-up of processes, personnel and systems, which are deferred during the transition period and expensed evenly over the period of service. The deferred costs are specific internal costs or external costs directly related to transition or set-up activities necessary to enable the BPO services. Generally, deferred amounts are protected in the event of early termination of the contract and are monitored regularly for impairment. Impairment losses are recorded when projected undiscounted operating cash flows of the related contract are not sufficient to recover the carrying amount of the deferred assets. Deferred transition revenues and costs as of December 31, 20102012 and 20092011 were immaterial.
Contingent or incentive revenues are recognized when the contingency is satisfied and we conclude the amounts are earned. Volume discounts are recorded as a reduction of revenue over the contract period as services are provided.
For contracts with multiple deliverables, we evaluate at the inception of each new contract all deliverables in an arrangement to determine whether they represent separate units of accounting. For arrangements with multiple units of accounting, primarily fixed-price contracts that provide both application maintenance and application development services and certain application maintenance contracts, arrangement consideration is allocated among the units of accounting, where separable, based on their relative selling price. Relative selling price is determined usingbased on vendor-specific objective evidence.evidence, if it exists. Otherwise, third-party evidence of selling price is used, when it is available, and in circumstances when neither vendor-specific objective evidence nor third-party evidence of selling price is available, management’s best estimate of selling price is used. Revenue is recognized for each unit of accounting based on our revenue recognition policy described above.
Fixed-price contracts are cancelable subject to a specified notice period. All services provided by us through the date of cancellation are due and payable under the contract terms. We issue invoices related to fixed-price contracts based upon achievement of milestones during a project or other contractual terms. Differences between the timing of billings, based upon contract milestones or other contractual terms, and the recognition of revenue are recognized as either unbilled receivables or deferred revenue. Estimates of certain fixed-price contracts are subject to adjustment as a project progresses to reflect changes in expected completion costs or efforts. The cumulative impact of any revision in estimates is reflected in the financial reporting period in which the change in estimate becomes known and any anticipated losses on contracts are recognized immediately. Warranty provisions generally exist under such contracts for a period of up to ninety days past contract completion and costs related to such provisions are accrued at the time the related revenues are recorded.
For all services, revenue is earned when and if evidence of an arrangement is obtained and the other criteria to support revenue recognition are met, including the price that is fixed or determinable, services that have been rendered and collectability that is reasonably assured. Revenues related to services performed without a signed
agreement or work order are not recognized until there is evidence of an arrangement, such as when agreements or work orders are signed or payment is received; however, the cost related to the performance of such work is recognized in the period the services are rendered.
We account for reimbursement of out-of-pocket expenses as revenues. Subcontractor costs are included in cost of services as they are incurred.
Stock-Based Compensation.Stock-based compensation expense for awards of equity instruments to employees and non-employee directors is determined based on the grant-date fair value of those awards. We recognize these compensation costs net of an estimated forfeiture rate over the requisite service period of the award. Forfeitures are estimated on the date of grant and revised if actual or expected forfeiture activity differs materially from original estimates.
Foreign Currency. The assets and liabilities of our foreign subsidiaries whose functional currency is not the U.S. dollar are translated into U.S. dollars from local currencies at current exchange rates and revenues and expenses are translated from local currencies at average monthly exchange rates. The resulting translation adjustments are recorded in accumulated other comprehensive income (loss) on the accompanying consolidated statements of financial position. The U.S. dollar is the functional currency for certain foreign subsidiaries who conduct business predominantly in U.S. dollars. For these foreign subsidiaries, non-monetary assets and liabilities are remeasured at historical exchange rates, while monetary assets and liabilities are remeasured at current exchange rates. Foreign currency exchange gains or losses from remeasurement are included in income. Net foreign currency exchange gains (losses) included in our results of operations, inclusive of our undesignated foreign currency hedges, were ($9,868)20,015), $1,672,($8,779), and ($22,818)9,868), for the years ended December 31, 2010, 20092012, 2011 and 2008,2010, respectively.
Derivative Financial Instruments.Derivative financial instruments are accounted for in accordance with the authoritative guidance which requires that each derivative instrument be recorded on the balance sheet as either an asset or liability measured at its fair value as of the reporting date. Our derivative financial instruments consist of foreign exchange forward contracts. For derivative financial instruments to qualify for hedge accounting, the following criteria must be met: (1) the hedging instrument must be designated as a hedge; (2) the hedged exposure must be specifically identifiable and expose us to risk; and (3) it is expected that a change in fair value of the derivative financial instrument and an opposite change in the fair value of the hedged exposure will have a high degree of correlation. The authoritative guidance also requires that changes in our derivatives’ fair values be recognized in income unless specific hedge accounting and documentation criteria are met (i.e., the instruments are accounted for as hedges). For items to which hedge accounting is applied, we record the effective portion of our derivative financial instruments that are designated as cash flow hedges in accumulated other comprehensive income (loss) in the accompanying consolidated statements of financial position. Any ineffectiveness or excluded portion of a designated cash flow hedge is recognized in income.
Use of Estimates. The preparation of financial statements requires management to make estimates and assumptions that affect the reported amounts of assets and liabilities, including the recoverability of tangible and intangible assets, disclosure of contingent assets and liabilities as of the date of the financial statements, and the reported amounts of revenues and expenses during the period. On an on-going basis, management reevaluates these estimates. The most significant estimates relate to the recognition of revenue and profits based on the percentage of completion method of accounting for certain fixed-bid contracts, the allowance for doubtful accounts, income taxes, and related deferred income tax assets and liabilities, valuation of investments, goodwill and other long-lived assets, assumptions used in determining the fair valuevaluation of stock-based compensation awardsinvestments and derivative financial instruments, assumptions used in valuing stock-based compensation arrangements, contingencies and litigation. Management bases its estimates on historical experience and on various other assumptions that are believed to be reasonable under the circumstances. The actual amounts may vary from the estimates used in the preparation of the accompanying consolidated financial statements.
Risks and Uncertainties. Principally, allThe majority of our development and delivery centers including a majority of ourand employees are located in India. As a result, we may be subject to certain risks associated with international operations, including risks associated with foreign currency exchange rate fluctuations and risks associated with the application and imposition of protective legislation and regulations relating to import and export or otherwise resulting from foreign policy or the variability of foreign economic or political conditions. Additional risks associated with international operations include difficulties in enforcing intellectual property rights, the burdens of complying with a wide variety of foreign laws, potential geo-political and other risks associated with terrorist activities and local or cross border conflicts and potentially adverse tax consequences, tariffs, quotas and other barriers.
Concentration of Credit Risk. Financial instruments that potentially subject us to significant concentrations of credit risk consist primarily of cash and cash equivalents, time deposits, investments in securities, derivative financial instruments and trade accounts receivable. We maintain our cash and cash equivalents and investments with high credit quality financial institutions, invest in investment-grade debt securities and limit the amount of credit exposure to any one commercial issuer. Trade accounts receivable isare dispersed across many customers operating in different industries; therefore, concentration of credit risk is limited.
Income Taxes.We provide for income taxes utilizing the asset and liability method of accounting for income taxes.accounting. Under this method, deferred income taxes are recorded to reflect the tax consequences in future years of differences between the tax basis of assets and liabilities and their financial reporting amounts at each balance sheet date, based on enacted tax laws and statutory tax rates applicable to the periods in which the differences are expected to affect taxable income. If it is determined that it is more likely than not that future tax benefits associated with a deferred income tax asset will not be realized, a valuation allowance is provided. The effect on deferred income tax assets and liabilities of a change in the tax rates is recognized in income in the period that includes the enactment date. Tax benefits earned on exercise of employee stock options in excess of compensation charged to income are credited to additional paid-in capital. Our provision for income taxes also includes the impact of provisions established for uncertain income tax positions, as well as the related interest.
Earnings Per Share, or EPS. Basic EPS excludes dilution and is computed by dividing earnings available to common stockholders by the weighted-average number of common shares outstanding for the period. Diluted EPS includes all potential dilutive common stock in the weighted average shares outstanding. For purposes of computing diluted earnings per share for the years ended December 31, 2012, 2011 and 2010, 2009respectively, 4,570,000, 7,074,000, and 2008, respectively, 8,356,000 7,811,000, and 8,819,000 shares were assumed to have been outstanding related to common share equivalents. We exclude options with exercise prices that are greater than the average market price from the calculation of diluted EPS because their effect would be anti-dilutive. We excluded 19,500 shares in 2012, 12,500 shares in 2011, and zero shares in 2010 3,839,000 shares in 2009 and 5,397,000 shares in 2008 from our diluted EPS calculation. Also, in accordance with the authoritative guidance, we excluded from the calculation of diluted EPS options to purchase an additional 79,300 shares in 2012, 38,600 shares in 2011, and 16,500 shares in 2010, 228,000 shares in 2009, and 248,000 shares in 2008, whose combined exercise price, unamortized fair value and excess tax benefits were greater in each of those periods than the average market price of our common stock because their effect would be anti-dilutive. We include performance stock unit awards in the dilutive potential common shares when they become contingently issuable per the authoritative guidance and exclude the awards when they are not contingently issuable.
Accounting Changes and New Accounting Standards.
In October 2009,June 2011, the Financial Accounting Standards Board, or FASB, issued new guidance, which requires that comprehensive income be presented either in a new accounting standard which provides guidance for arrangements with multiple deliverables. Specifically,single continuous statement of comprehensive income or in two separate consecutive statements, thus eliminating the new standard requires an
entity to allocate consideration atoption of presenting the inceptioncomponents of an arrangement to all of its deliverables based on their relative selling prices. In the absenceother comprehensive income as part of the vendor-specific objective evidence or third-party evidencestatement of the selling prices, consideration must be allocated to the deliverables based on management’s best estimate of the selling prices. In addition, the new standard eliminates the use of the residual method of allocation. In October 2009, the FASB also issued a new accounting standard which changes revenue recognition for tangible products containing software and hardware elements. Specifically, tangible products containing software and hardware that function together to deliver the tangible products’ essential functionality are scoped out of the existing software revenue recognition guidance and will be accounted for under the multiple-element arrangements revenue recognition guidance discussed above. Both standards are required to be effective by no later than the first quarter of 2011 and early adoption is permitted. We adopted both of these standardsin stockholders’ equity. This became effective January 1, 2010. Our2012. We adopted this standard on January 1, 2012 and elected to present comprehensive income in two consecutive statements. The adoption of these standards did not have a materialthis standard affects financial statement presentation only and had no effect on our financial condition or consolidated results of operations.
In January 2010,February 2013, the FASB issued additional guidance related to accumulated other comprehensive income, requiring the presentation of significant amounts reclassified out of accumulated other comprehensive income to the respective line items in the statement of operations. For those amounts required by U.S. GAAP to be reclassified to earnings in their entirety in the same reporting period, this presentation is required either on the statement of operations or in a single footnote. For items that are not required to be reclassified in their entirety to earnings, the presentation requirement can be met by cross-referencing disclosures elsewhere in the footnotes. The pronouncement is effective on a prospective basis effective for interim and annual reporting periods that start after December 15, 2012. The adoption of this standard affects financial statement presentation only and will have no effect on our financial condition or consolidated results of operations.
In September 2011, the FASB issued new guidance requiring supplemental fair value disclosures and providing several clarifications regarding existing disclosure requirements. Specifically, the new guidance requiresrelated to goodwill impairment testing. This standard allows, but does not require, an entity to disclose separatelyfirst assess qualitative factors to determine whether the amountsexistence of significant transfers in and out of Level 1 and Level 2events or circumstances leads to a determination that it is more likely than not that the fair value measurements andof a reporting unit is less than its carrying amount. If, after assessing the totality of events or circumstances, an entity determines it is not more likely than not that the fair value of a reporting unit is less than its carrying amount, then performing the two-step impairment test is unnecessary. However, if an entity concludes otherwise, then it is required to describeperform the reasons for the transfers. In addition, the new standard requires a gross presentationfirst step of the Level 3 rollforward, stating separately information about purchases, sales, issuances, and settlements. The new guidance also provides clarification regardingtwo-step impairment test by calculating the appropriate level of disaggregation of assets and liabilities for the purpose of fair value disclosures as well asof the requirement to provide disclosures aboutreporting unit and comparing the valuation techniques and inputs used to measure fair value for both recurring and nonrecurring Level 2 and Level 3 measurements. We adoptedwith the new guidance effective January 1, 2010 and have presentedcarrying amount of the reporting unit. If the carrying amount of a reporting unit exceeds its fair value, then the entity is required information in Note 10.
In December 2010,to perform the FASB issued a new accounting standard requiring that Step 2second step of the goodwill impairment test be performedto measure the amount of the impairment loss, if any. The new standard gives an entity the option to bypass the qualitative assessment for any reporting units whose carrying valueunit in any period and proceed directly to performing the first step of the two-step goodwill impairment test. An entity may resume performing the qualitative assessment in any subsequent period. This standard is zero or negative. This guidance will be effective for periods beginning on January 1, 2011. Our2012 and the adoption of this standard will not have a materialhad no effect on our financial condition or consolidated results of operations.
In December 2010,2011, the FASB issued guidance requiring enhanced disclosures related to the nature of an entity’s rights to offset and any related arrangements associated with its financial instruments and derivative instruments. The new guidance clarifying somerequires the disclosure of the disclosure requirementsgross amounts subject to rights of set-off, amounts offset in accordance with the accounting standards followed and the related to business combinations that are material onnet exposure. In January 2013, the FASB issued an individual or aggregate basis. Specifically,additional update clarifying the guidance states that, if comparative financial statements are presented, the entity should disclose revenue and earningsscope of the combined entity as though the business combination(s) that occurred during the current year occurred as of the beginning of the comparable prior annual reporting period only. Additionally, thethis guidance. The new standard expands the supplemental pro forma disclosure required by the authoritative guidance to include a description of the nature and amount of material, nonrecurring pro forma adjustments directly attributable to the business combination in the reported pro forma revenue and earnings. This guidance will be effective for periods beginning on or after January 1, 2011. Our2013. The adoption of this standard affects financial statement disclosures only and will not have a materialno effect on our financial condition or consolidated results of operations. However, it may result in additional disclosures in the event that
Note 2 — Business Combinations
During 2012, we entercompleted three business combinations for total cash consideration of approximately $28,100 (net of cash acquired). In August of 2012, we entered into a transaction pursuant to which we signed a multi-year service agreement, assumed an assembled workforce, and acquired land, building and other assets. Under the current authoritative business combination that is material either on an individual or aggregate basis.guidelines, this transaction qualified as a business combination. This transaction expands our business process outsourcing capabilities within the insurance industry. Additionally, in 2012, we completed two business combinations to strengthen our business and knowledge process outsourcing and research capabilities within the media and healthcare industries. As part of these transactions, we acquired customer relationship assets, assembled workforces, and other assets. In addition, during 2012, we settled contingent payment provisions of approximately $31,400 related to business combinations completed in prior years.
2. AcquisitionsDuring 2011, we completed two business combinations for total consideration, including stock, of approximately $91,000 (net of cash acquired). These transactions strengthen our business process outsourcing and analytics solution offerings and enhance our retail SAP capabilities.
During 2010, we completed three business combinations for total consideration, including stock, of approximately $46,000 (net of cash acquired). These transactions expand our business process outsourcing expertise within our logistic services, strengthen our business transformation and program management capabilities and expand our testing services within Europe. As of December 31, 2010, we accrued additional consideration of approximately $6,500 that was contingent on the achievement of certain financial and operating targets during the earn-out period by a company acquired in 2008.
During 2009, we completed four business combinations for an aggregate consideration of approximately $97,300 (net of cash acquired). In December 2009, we acquired the stock of UBS India Service Centre Private Limited (“UBS ISC”) for cash consideration of approximately $62,800, net of acquired cash. As part of this
transaction, we acquired multi-year service agreements, an assembled workforce, land, equipment and other assets. The acquisition expands our business and knowledge process outsourcing capabilities in the financial services industry. In the third quarter of 2009, we entered into a transaction with Invensys pursuant to which we acquired a multi-year service agreement, an assembled workforce and certain other assets. Under the current authoritative business combination guidelines, this transaction qualified as business combination. This transaction, with no initial cash consideration, expands our business process outsourcing expertise within engineering services. The remaining two acquisitions were completed to strengthen our retail and infrastructure management capabilities.
During 2008, we completed two acquisitions. The acquisitions strengthen our IT consulting practice in the media and entertainment industry and service delivery capabilities in India. The initial consideration paid in cash and stock was approximately $24,000 (net of cash acquired and including direct transaction costs). The stock consideration consisted of 62,340 shares of Class A common stock valued at $2,206.
We made an allocation of the purchase price to the tangible and intangible assets and liabilities acquired, including tax deductible goodwill and non-tax deductible goodwill as described in the table below:
| 2010 | 2009 | 2008 | 2012 | 2011 | 2010 | |||||||||||||||||||
Number of business combinations completed | 3 | 4 | 2 | |||||||||||||||||||||
Total initial consideration, net of cash acquired(1) | $ | 46,000 | $ | 97,300 | $ | 24,000 | $ | 28,100 | $ | 91,000 | $ | 46,000 | ||||||||||||
Purchase price allocated to: | ||||||||||||||||||||||||
Tax deductible goodwill | $ | — | $ | 2,200 | $ | 7,400 | — | 21,367 | — | |||||||||||||||
Non-deductible goodwill | $ | 22,600 | $ | 36,600 | $ | 1,500 | 19,096 | 44,713 | 22,600 | |||||||||||||||
Intangible assets | $ | 25,700 | $ | 37,300 | $ | 7,260 | 10,000 | 19,400 | 25,700 | |||||||||||||||
Weighted average life of intangible assets | 8.6 years | 6.3 years | 10 years | 8.6 years | 8.2 years | 8.6 years | ||||||||||||||||||
| (1) | Includes stock consideration in |
The acquisitions in 2010, 20092012, 2011, and 20082010 were included in our consolidated financial statements as of the date which they were acquired and were not material to our operations, financial position or cash flows. For additional details of our goodwill and intangible assets see Note 5.
Note 3 — Investments
Investments were as follows as of December 31:
| 2010 | 2009 | 2012 | 2011 | |||||||||||||
Available-for-sale securities: | ||||||||||||||||
Available-for-sale investment securities: | ||||||||||||||||
U.S. Treasury and agency debt securities | $ | 340,384 | $ | 160 | $ | 551,236 | $ | 464,938 | ||||||||
Municipal debt securities | 41,655 | — | ||||||||||||||
Corporate and other debt securities | 122,909 | 2 | 290,936 | 202,705 | ||||||||||||
Asset-backed securities | 33,154 | — | 97,112 | 100,894 | ||||||||||||
Municipal debt securities | 47,292 | 43,889 | ||||||||||||||
Mutual funds | 21,150 | — | ||||||||||||||
Foreign government debt securities | 7,926 | — | 3,620 | 10,500 | ||||||||||||
|
| |||||||||||||||
Total available-for-sale securities | 546,028 | 162 | ||||||||||||||
Trading securities—auction-rate securities | — | 129,103 | ||||||||||||||
UBS Right | — | 22,028 | ||||||||||||||
Total available-for-sale investment securities | 1,011,346 | 822,926 | ||||||||||||||
Time deposits | 139,391 | 298,240 | 282,335 | 298,432 | ||||||||||||
|
| |||||||||||||||
Total investments | $ | 685,419 | $ | 449,533 | $ | 1,293,681 | $ | 1,121,358 | ||||||||
|
| |||||||||||||||
Our available-for-sale investment securities consist of U.S. dollar denominated investments primarily ofin U.S. Treasury notes, U.S. government agency debt securities, municipal debt securities, non-U.S. government debt securities, U.S. and international
corporate bonds, certificates of deposit, commercial paper, debt securities issuesissued by supranational institutions, mutual funds invested in fixed income securities and asset-backed securities, including those backed by auto loans, credit card receivables, mortgage loans and other receivables. Our investment guidelines are to purchase securities with a credit rating of A and abovewhich are investment grade at the time of acquisition. We monitor the credit ratings of the securities in our portfolio on an ongoing basis. The carrying value of the time deposits approximated fair value as of December 31, 20102012 and 2009.2011.
At December 31, 2009, our investment in auction-rate securities was recorded at fair value and consisted of AAA/A3-rated municipal bonds with an auction reset feature whose underlying assets were generally student loans, which were substantially backed by the Federal Family Education Loan Program, or FFELP. Auctions for these securities began to fail during the first quarter of 2008. The auction failures did not affect the value of the collateral underlying the auction-rate securities, and we earned and received interest on our auction-rate securities at a pre-determined formula with spreads tied to particular interest rate indices. As of December 31, 2009, the majority of our auction-rate securities were classified as long-term investments. The classification of the auction-rate securities as long-term investments was due to continuing auction failures, the securities’ stated maturity of greater than one year and our ability and intent to hold such securities beyond one year.
In November 2008, we accepted an offer from UBS AG, or UBS, to sell to UBS, at par value, our auction-rate securities at any time during an exercise period from June 30, 2010 to July 2, 2012, which we refer to as the UBS Right. In accepting the UBS Right, we granted UBS the authority to purchase these auction-rate securities or sell them on our behalf at par value anytime after the execution of the UBS Right through July 2, 2012. The offer was non-transferable. In 2008, we elected to measure the UBS Right under the fair value option as permitted under the authoritative guidance and recorded pre-tax income of $28,158, and a corresponding long- term investment. At the same time, we transferred our investment in auction-rate securities from available-for-sale securities to trading securities. As a result of this transfer, we recognized a pre-tax loss in our consolidated statement of operations of $29,127 reflecting the reversal of the unrealized loss previously recorded in accumulated other comprehensive income (loss). In 2008, these transactions were recorded in the caption Other, net in our consolidated statement of operations. During 2010, the remaining balance of our auction-rate securities was redeemed by the issuers or purchased by UBS at par value thereby reducing the outstanding balance to zero.
Additional information regarding our auction-rate securities is as follows:
| December 31, 2010 | December 31, 2009 | |||||||
Par value | $ | — | $ | 151,275 | ||||
| Year Ended December 31, 2010 | Year Ended December 31, 2009 | |||||||
Redemptions by issuer or purchases by UBS at par value | $ | 151,275 | $ | 17,250 | ||||
Available-for-Sale Investment Securities
The amortized cost, gross unrealized gains and losses and fair value of available-for-sale investment securities were as follows at December 31:
| 2010 | 2012 | |||||||||||||||||||||||||||||||
| Amortized Cost | Gross Unrealized Gains | Gross Unrealized Losses | Fair Value | Amortized Cost | Unrealized Gains | Unrealized Losses | Fair Value | |||||||||||||||||||||||||
U.S. Treasury and agency debt securities | $ | 339,982 | $ | 994 | $ | (592 | ) | $ | 340,384 | $ | 550,317 | $ | 972 | $ | (53 | ) | $ | 551,236 | ||||||||||||||
Municipal debt securities | 41,802 | 2 | (149 | ) | 41,655 | |||||||||||||||||||||||||||
Corporate and other debt securities | 122,137 | 835 | (63 | ) | 122,909 | 289,146 | 1,812 | (22 | ) | 290,936 | ||||||||||||||||||||||
Asset-backed securities | 33,258 | 33 | (137 | ) | 33,154 | 97,004 | 237 | (129 | ) | 97,112 | ||||||||||||||||||||||
Municipal debt securities | 47,266 | 93 | (67 | ) | 47,292 | |||||||||||||||||||||||||||
Mutual funds | 21,583 | — | (433 | ) | 21,150 | |||||||||||||||||||||||||||
Foreign government debt securities | 7,844 | 83 | (1 | ) | 7,926 | 3,590 | 30 | — | 3,620 | |||||||||||||||||||||||
|
|
|
| |||||||||||||||||||||||||||||
Total available-for-sale investment securities | $ | 545,023 | $ | 1,947 | $ | (942 | ) | $ | 546,028 | $ | 1,008,906 | $ | 3,144 | $ | (704 | ) | $ | 1,011,346 | ||||||||||||||
|
|
|
| |||||||||||||||||||||||||||||
| 2009 | 2011 | |||||||||||||||||||||||||||||||
| Amortized Cost | Gross Unrealized Gains | Gross Unrealized Losses | Fair Value | Amortized Cost | Unrealized Gains | Unrealized Losses | Fair Value | |||||||||||||||||||||||||
U.S. Treasury and agency debt securities | $ | 160 | $ | — | $ | — | $ | 160 | $ | 463,318 | $ | 1,742 | $ | (122 | ) | $ | 464,938 | |||||||||||||||
Corporate and other debt securities | 2 | — | — | 2 | 202,284 | 902 | (481 | ) | 202,705 | |||||||||||||||||||||||
Asset-backed securities | 101,068 | 100 | (274 | ) | 100,894 | |||||||||||||||||||||||||||
Municipal debt securities | 43,873 | 101 | (85 | ) | 43,889 | |||||||||||||||||||||||||||
Foreign government debt securities | 10,397 | 105 | (2 | ) | 10,500 | |||||||||||||||||||||||||||
|
|
|
| |||||||||||||||||||||||||||||
Total available-for-sale investment securities | $ | 162 | $ | — | $ | — | $ | 162 | $ | 820,940 | $ | 2,950 | $ | (964 | ) | $ | 822,926 | |||||||||||||||
|
|
|
| |||||||||||||||||||||||||||||
The fair value and related unrealized losses of available-for-sale investment securities in a continuous unrealized loss position for less than 12 months were as follows at December 31, 2010:
| Less than 12 Months | ||||||||
| Fair Value | Unrealized Losses | |||||||
U.S. Treasury and agency debt securities | $ | 200,772 | $ | (592 | ) | |||
Municipal debt securities | 25,598 | (149 | ) | |||||
Corporate and other debt securities | 16,518 | (63 | ) | |||||
Asset-backed securities | 17,791 | (137 | ) | |||||
Foreign government debt securities | 1,203 | (1 | ) | |||||
Total | $ | 261,882 | $ | (942 | ) | |||
As of December 31, 2010, we did not have any investments in available-for-sale securities that had been in an unrealized loss positionand for 12 months or longer. longer were as follows as of December 31:
| 2012 | ||||||||||||||||||||||||
| Less than 12 Months | 12 Months or More | Total | ||||||||||||||||||||||
| Fair Value | Unrealized Losses | Fair Value | Unrealized Losses | Fair Value | Unrealized Losses | |||||||||||||||||||
U.S. Treasury and agency debt securities | $ | 120,118 | $ | (53 | ) | $ | — | $ | — | $ | 120,118 | $ | (53 | ) | ||||||||||
Corporate and other debt securities | 25,662 | (21 | ) | 699 | (1 | ) | 26,361 | (22 | ) | |||||||||||||||
Asset-backed securities | 27,180 | (93 | ) | 1,499 | (36 | ) | 28,679 | (129 | ) | |||||||||||||||
Municipal debt securities | 7,908 | (32 | ) | 696 | (35 | ) | 8,604 | (67 | ) | |||||||||||||||
Mutual funds | 21,150 | (433 | ) | — | — | 21,150 | (433 | ) | ||||||||||||||||
|
|
|
|
|
|
|
|
|
|
|
| |||||||||||||
Total | $ | 202,018 | $ | (632 | ) | $ | 2,894 | $ | (72 | ) | $ | 204,912 | $ | (704 | ) | |||||||||
|
|
|
|
|
|
|
|
|
|
|
| |||||||||||||
| 2011 | ||||||||||||||||||||||||
| Less than 12 Months | 12 Months or More | Total | ||||||||||||||||||||||
| Fair Value | Unrealized Losses | Fair Value | Unrealized Losses | Fair Value | Unrealized Losses | |||||||||||||||||||
U.S. Treasury and agency debt securities | $ | 122,124 | $ | (122 | ) | $ | — | $ | — | $ | 122,124 | $ | (122 | ) | ||||||||||
Corporate and other debt securities | 75,076 | (481 | ) | — | — | 75,076 | (481 | ) | ||||||||||||||||
Asset-backed securities | 58,503 | (241 | ) | 2,292 | (33 | ) | 60,795 | (274 | ) | |||||||||||||||
Municipal debt securities | 5,149 | (17 | ) | 1,732 | (68 | ) | 6,881 | (85 | ) | |||||||||||||||
Foreign government debt securities | 1,507 | (2 | ) | — | — | 1,507 | (2 | ) | ||||||||||||||||
|
|
|
|
|
|
|
|
|
|
|
| |||||||||||||
Total | $ | 262,359 | $ | (863 | ) | $ | 4,024 | $ | (101 | ) | $ | 266,383 | $ | (964 | ) | |||||||||
|
|
|
|
|
|
|
|
|
|
|
| |||||||||||||
The unrealized losses for the above securities as of December 31, 2012 and 2011 are primarily attributable to changes in interest rates. As of December 31, 2010,2012, we do not consider any of the investments to be other-than-temporarily impaired. As of December 31, 2009, we did not have any available-for-sale securities in an unrealized loss position.
The gross unrealized gains and losses in the above tables were recorded, net of tax, in accumulated other comprehensive income (loss).
The contractual maturities of our fixed income available-for-sale investment securities as of December 31, 20102012 are set forth in the following table:
| Amortized Cost | Fair Value | |||||||
Due within one year | $ | 24,292 | $ | 24,327 | ||||
Due after one year through five years | 470,098 | 471,224 | ||||||
Due after five years through ten years | 2,071 | 2,051 | ||||||
Due after ten years | 15,304 | 15,272 | ||||||
Asset-backed securities | 33,258 | 33,154 | ||||||
Total available-for-sale investment securities | $ | 545,023 | $ | 546,028 | ||||
| Amortized Cost | Fair Value | |||||||
Due within one year | $ | 147,037 | $ | 147,304 | ||||
Due after one year up to two years | 379,383 | 380,735 | ||||||
Due after two years up to three years | 362,297 | 363,434 | ||||||
Due after three years up to four years | 1,602 | 1,611 | ||||||
Asset-backed securities | 97,004 | 97,112 | ||||||
|
|
|
| |||||
Fixed income available-for-sale investment securities | $ | 987,323 | $ | 990,196 | ||||
|
|
|
| |||||
Asset-backed securities were excluded from the maturity categories because the actual maturities may differ from the contractual maturities since the underlying receivables may be prepaid without penalties. Further, actual maturities of debt securities may differ from those presented above since certain obligations provide the issuer the right to call or prepay the obligation prior to scheduled maturity without penalty.
Proceeds from sales of available-for-sale investment securities and the gross gains and losses that have been included in earnings as a result of those sales were as follows for the years ended December 31:
| 2010 | ||||
Proceeds from sales of available-for-sale investment securities | $ | 195,693 | ||
Gross gains | $ | 778 | ||
Gross losses | (124 | ) | ||
Net gains on sales of available-for-sale investment securities | $ | 654 | ||
During 2009 and 2008, proceeds from sales of available-for-sale investment securities and the gross gains and losses that have been included in earnings as a result of those sales were immaterial.
| 2012 | 2011 | 2010 | ||||||||||
Proceeds from sales of available-for-sale investment securities | $ | 697,406 | $ | 652,992 | $ | 195,693 | ||||||
|
|
|
|
|
| |||||||
Gross gains | $ | 2,410 | $ | 3,102 | $ | 778 | ||||||
Gross losses | (402 | ) | (785 | ) | (124 | ) | ||||||
|
|
|
|
|
| |||||||
Net gains on sales of available-for-sale investment securities | $ | 2,008 | $ | 2,317 | $ | 654 | ||||||
|
|
|
|
|
| |||||||
4. Property and Equipment, net
Property and equipment were as follows as of December 31:
| Estimated Useful Life (Years) | 2010 | 2009 | Estimated Useful Life (Years) | 2012 | 2011 | |||||||||||||||
Buildings | 30 | $ | 289,260 | $ | 230,418 | 30 | $ | 423,340 | $ | 321,280 | ||||||||||
Computer equipment and purchased software | 3 | 227,189 | 195,646 | |||||||||||||||||
Computer equipment and software | 3 | 352,147 | 291,883 | |||||||||||||||||
Furniture and equipment | 5 – 9 | 152,289 | 131,368 | 5 – 9 | 240,988 | 186,983 | ||||||||||||||
Land | 16,042 | 16,042 | 20,396 | 16,042 | ||||||||||||||||
Leasehold land | 33,653 | 16,930 | 60,306 | 39,186 | ||||||||||||||||
Capital work-in-progress | 95,496 | 70,639 | 256,272 | 211,140 | ||||||||||||||||
Leasehold improvements | Shorter of the lease term or the life of leased asset | 108,991 | 95,043 | Shorter of the lease term or the life of the leased asset | 191,829 | 147,026 | ||||||||||||||
|
| |||||||||||||||||||
Sub-total | 922,920 | 756,086 | 1,545,278 | 1,213,540 | ||||||||||||||||
Accumulated depreciation and amortization | (352,472 | ) | (274,570 | ) | (573,792 | ) | (455,506 | ) | ||||||||||||
|
| |||||||||||||||||||
Property and equipment, net | $ | 570,448 | $ | 481,516 | $ | 971,486 | $ | 758,034 | ||||||||||||
|
| |||||||||||||||||||
Depreciation and amortization expense related to property and equipment was $93,190, $79,126$137,561, $107,257, and $66,681$93,190 for the years ended December 31, 2010, 20092012, 2011, and 2008,2010, respectively.
In India, leasehold land is leased by us from the government of India with lease terms ranging up to 99 years. Lease payments are made at the inception of the lease agreement and amortized over the lease term. Amortization expense of leasehold land is immaterial for the periods presented and is included in depreciation and amortization expense in our accompanying consolidated statements of operations.
5. Goodwill and Intangible Assets, net
Changes in goodwill were as follows for the years ended December 31:
| 2010 | 2009 | 2012 | 2011 | |||||||||||||
Balance, beginning of year | $ | 192,372 | $ | 154,035 | $ | 288,772 | $ | 223,963 | ||||||||
Acquisitions and adjustments | 29,120 | 38,067 | ||||||||||||||
Business combinations | 19,096 | 66,080 | ||||||||||||||
Cumulative translation adjustments | 2,471 | 270 | 1,317 | (1,271 | ) | |||||||||||
|
| |||||||||||||||
Balance, end of year | $ | 223,963 | $ | 192,372 | $ | 309,185 | $ | 288,772 | ||||||||
|
| |||||||||||||||
In 20102012 and 2009,2011, the increase in goodwill was primarily related to business combinations completed during the 2010 and 2009 acquisitions, respectively.period. No impairment losses were recognized during the three years ended December 31, 2010.2012.
Goodwill has been allocated to our reportable segments as follows as of December 31:
| 2010 | 2009 | 2012 | 2011 | |||||||||||||
Financial Services | $ | 82,365 | $ | 72,577 | $ | 137,677 | $ | 126,550 | ||||||||
Healthcare | 71,302 | 65,097 | 78,977 | 70,977 | ||||||||||||
Manufacturing/Retail/Logistics | 26,946 | 21,048 | 48,304 | 48,057 | ||||||||||||
Other | 43,350 | 33,650 | 44,227 | 43,188 | ||||||||||||
|
| |||||||||||||||
Total goodwill | $ | 223,963 | $ | 192,372 | $ | 309,185 | $ | 288,772 | ||||||||
|
| |||||||||||||||
Components of intangible assets were as follows as of December 31:
| 2010 | 2012 | |||||||||||||||||||||||
| Gross Carrying Amount | Accumulated Amortization | Net Carrying Amount | Gross Carrying Amount | Accumulated Amortization | Net Carrying Amount | |||||||||||||||||||
Customer relationships | $ | 117,299 | $ | (36,683 | ) | $ | 80,616 | $ | 142,653 | $ | (67,058 | ) | $ | 75,595 | ||||||||||
Developed technology | 3,129 | (601 | ) | 2,528 | 4,222 | (2,204 | ) | 2,018 | ||||||||||||||||
Other | 2,679 | (687 | ) | 1,992 | 13,921 | (4,059 | ) | 9,862 | ||||||||||||||||
|
|
| ||||||||||||||||||||||
Total intangible assets | $ | 123,107 | $ | (37,971 | ) | $ | 85,136 | $ | 160,796 | $ | (73,321 | ) | $ | 87,475 | ||||||||||
|
|
| ||||||||||||||||||||||
| 2011 | ||||||||||||||||||||||||
| Gross Carrying Amount | Accumulated Amortization | Net Carrying Amount | ||||||||||||||||||||||
Customer relationships | $ | 134,285 | $ | (50,698 | ) | $ | 83,587 | |||||||||||||||||
Developed technology | 4,158 | (1,275 | ) | 2,883 | ||||||||||||||||||||
Other | 13,216 | (2,070 | ) | 11,146 | ||||||||||||||||||||
|
|
| ||||||||||||||||||||||
Total intangible assets | $ | 151,659 | $ | (54,043 | ) | $ | 97,616 | |||||||||||||||||
|
|
| ||||||||||||||||||||||
| 2009 | ||||||||||||
| Gross Carrying Amount | Accumulated Amortization | Net Carrying Amount | ||||||||||
Customer relationships | $ | 94,489 | $ | (22,835 | ) | $ | 71,654 | |||||
Developed technology | 7,206 | (4,121 | ) | 3,085 | ||||||||
Other | 3,797 | (2,779 | ) | 1,018 | ||||||||
Total intangible assets | $ | 105,492 | $ | (29,735 | ) | $ | 75,757 | |||||
All of the intangible assets have finite lives and as such are subject to amortization. The weighted average life of intangible assets was 8.7 years for customer relationships, 6.7 years for developed technology, and 3.9 years for other intangibles. Amortization of intangible assets totaled $19,027 for 2012, $16,918 for 2011, and $16,982 for 2010, $10,245 for 20092010. During 2012, 2011 and $8,116 for 2008. During 2010, amortization expense of $7,499, $6,774 and $6,297, respectively, relating to customer relationship intangible assets was recorded as a reduction of revenues. These intangible assets are attributed to direct revenue contracts with sellers of acquired businesses.
Estimated amortization expense related to our existing intangible assets for the next five years are as follows:
Year | Amount | |||
2011 | $ | 15,494 | ||
2012 | $ | 15,114 | ||
2013 | $ | 13,641 | ||
2014 | $ | 13,169 | ||
2015 | $ | 8,543 | ||
Year 2013 2014 2015 2016 2017 Amount $ 18,220 17,513 12,467 11,874 10,275
6. Accrued Expenses and Other Current Liabilities
Accrued expenses and other current liabilities were as follows as of December 31:
| 2010 | 2009 | 2012 | 2011 | |||||||||||||
Compensation and benefits | $ | 533,067 | $ | 356,127 | $ | 661,816 | $ | 632,649 | ||||||||
Income taxes | 14,999 | 10,300 | 29,570 | 27,676 | ||||||||||||
Professional fees | 34,121 | 26,508 | 35,366 | 32,861 | ||||||||||||
Travel and entertainment | 16,531 | 15,871 | 26,417 | 18,215 | ||||||||||||
Customer volume incentives | 85,180 | 44,537 | 142,945 | 104,989 | ||||||||||||
Derivative financial instruments | 7,504 | 20,968 | 130,923 | 126,731 | ||||||||||||
Deferred income taxes | 1,134 | — | 454 | 73 | ||||||||||||
Other | 78,227 | 66,052 | 91,436 | 88,593 | ||||||||||||
|
| |||||||||||||||
Total accrued expenses and other current liabilities | $ | 770,763 | $ | 540,363 | $ | 1,118,927 | $ | 1,031,787 | ||||||||
|
| |||||||||||||||
7. Accumulated Other Comprehensive Income (Loss)
The components of accumulated other comprehensive income (loss) were as follows as of December 31:
| 2010 | 2009 | 2012 | 2011 | |||||||||||||
Foreign currency translation adjustments | $ | 4,278 | $ | 1,867 | $ | 11,572 | $ | (3,561 | ) | |||||||
Unrealized gain on cash flow hedges, net of taxes | 30,723 | 18,410 | ||||||||||||||
Unrealized (loss) on cash flow hedges, net of taxes | (252,810 | ) | (323,039 | ) | ||||||||||||
Unrealized gain on available-for-sale securities, net of taxes | 597 | — | 1,555 | 1,206 | ||||||||||||
|
| |||||||||||||||
Total accumulated other comprehensive income (loss) | $ | 35,598 | $ | 20,277 | $ | (239,683 | ) | $ | (325,394 | ) | ||||||
|
| |||||||||||||||
8. Employee Benefits
InWe contribute to defined contribution plans in the United States we maintainand Europe, including a 401(k) savings plan and supplemental retirement plan which are defined contribution plans. Employer matchingplans in the United States. Total expenses for company contributions forto these plans were $7,491, $5,562$24,789, $19,453, and $5,420$13,447 for the years ended December 31, 2012, 2011, and 2010, 2009 and 2008, respectively. Certain of our employees participate in defined contribution plans in Europe, primarily the United Kingdom, sponsored by us. The costs related to these plans were not material to our results of operations or financial position for the years presented.
We maintain employee benefit plans that cover substantially all India-based employees. The employees’ provident fund, pension and family pension plans are statutory defined contribution retirement benefit plans.
Under the plans, employees contribute up to 12% of their base compensation, which is matched by an equal contribution by the Company. For these plans, we recognized a contribution expense of $35,049, $20,729$54,125, $49,200, and $17,925$35,049 for the years ended December 31, 2010, 20092012, 2011, and 2008,2010, respectively.
We also maintain a gratuity plan in India that is a statutory post-employment benefit plan providing defined lump sum benefits. We make annual contributions to an employees’ gratuity fund established with a government-owned insurance corporation to fund a portion of the estimated obligation. Accordingly, our liability for the gratuity plan reflects the undiscounted benefit obligation payable as of the balance sheet date which was based upon the employees’ salary and years of service. As of December 31, 20102012 and 2009,2011, the amount accrued under the gratuity plan was $25,350$56,737 and $21,064,$39,916, which is net of fund assets of $36,132$50,427 and $20,741,$40,744, respectively. Expense recognized by us was $16,949, $8,918$28,496, $29,703, and $12,371$16,949 for the years ended December 31, 2012, 2011, and 2010, 2009 and 2008, respectively.
9. Income Taxes
Income before provision for income taxes shown below is based on the geographic location to which such income is attributed for years ended December 31:
| 2010 | 2009 | 2008 | 2012 | 2011 | 2010 | |||||||||||||||||||
United States | $ | 220,234 | $ | 151,711 | $ | 135,797 | $ | 381,940 | $ | 344,143 | $ | 220,234 | ||||||||||||
Foreign | 658,346 | 485,240 | 379,413 | 1,005,656 | 825,006 | 658,346 | ||||||||||||||||||
|
|
| ||||||||||||||||||||||
Total | $ | 878,580 | $ | 636,951 | $ | 515,210 | ||||||||||||||||||
Income before provision for income taxes | $ | 1,387,596 | $ | 1,169,149 | $ | 878,580 | ||||||||||||||||||
|
|
| ||||||||||||||||||||||
The provision for income taxes consists of the following components for the years ended December 31:
| 2010 | 2009 | 2008 | 2012 | 2011 | 2010 | |||||||||||||||||||
Current: | ||||||||||||||||||||||||
Federal and state | $ | 110,713 | $ | 101,170 | $ | 63,977 | $ | 265,826 | $ | 120,441 | $ | 110,713 | ||||||||||||
Foreign | 86,236 | 59,539 | 73,080 | 188,415 | 173,689 | 86,236 | ||||||||||||||||||
|
|
| ||||||||||||||||||||||
Total current | 196,949 | 160,709 | 137,057 | 454,241 | 294,130 | 196,949 | ||||||||||||||||||
|
|
| ||||||||||||||||||||||
Deferred: | ||||||||||||||||||||||||
Federal and state | (12,597 | ) | (35,315 | ) | (7,677 | ) | (99,649 | ) | 26,549 | (12,597 | ) | |||||||||||||
Foreign | (39,312 | ) | (23,406 | ) | (45,015 | ) | (18,259 | ) | (35,148 | ) | (39,312 | ) | ||||||||||||
|
|
| ||||||||||||||||||||||
Total deferred | (51,909 | ) | (58,721 | ) | (52,692 | ) | (117,908 | ) | (8,599 | ) | (51,909 | ) | ||||||||||||
|
|
| ||||||||||||||||||||||
Total provision for income taxes | $ | 145,040 | $ | 101,988 | $ | 84,365 | $ | 336,333 | $ | 285,531 | $ | 145,040 | ||||||||||||
|
|
| ||||||||||||||||||||||
The reconciliation between our effective income tax rate and the U.S. federal statutory rate is as follows:
| 2010 | % | 2009 | % | 2008 | % | 2012 | % | 2011 | % | 2010 | % | |||||||||||||||||||||||||||||||||||||
Tax expense, at U.S. federal statutory rate | $ | 307,503 | 35.0 | $ | 222,933 | 35.0 | $ | 180,323 | 35.0 | $ | 485,659 | 35.0 | $ | 409,202 | 35.0 | $ | 307,503 | 35.0 | ||||||||||||||||||||||||||||||
State and local income taxes, net of federal benefit | 13,699 | 1.6 | 8,648 | 1.4 | 7,740 | 1.5 | 24,032 | 1.7 | 20,373 | 1.7 | 13,699 | 1.6 | ||||||||||||||||||||||||||||||||||||
Non-taxable income for Indian tax purposes | (151,789 | ) | (10.9 | ) | (125,708 | ) | (10.8 | ) | (166,800 | ) | (19.0 | ) | ||||||||||||||||||||||||||||||||||||
Rate differential on foreign earnings | (184,533 | ) | (21.0 | ) | (137,138 | ) | (21.5 | ) | (107,246 | ) | (20.8 | ) | (22,126 | ) | (1.6 | ) | (26,030 | ) | (2.2 | ) | (17,733 | ) | (2.0 | ) | ||||||||||||||||||||||||
Other | 8,371 | 0.9 | 7,545 | 1.1 | 3,548 | 0.7 | 557 | 0.0 | 7,694 | 0.7 | 8,371 | 0.9 | ||||||||||||||||||||||||||||||||||||
|
|
| ||||||||||||||||||||||||||||||||||||||||||||||
Total provision for income taxes | $ | 145,040 | 16.5 | $ | 101,988 | 16.0 | $ | 84,365 | 16.4 | $ | 336,333 | 24.2 | $ | 285,531 | 24.4 | $ | 145,040 | 16.5 | ||||||||||||||||||||||||||||||
|
|
| ||||||||||||||||||||||||||||||||||||||||||||||
Deferred
The significant components of deferred income tax assets and liabilities recorded on the consolidated statements of financial position were comprised of the followingas follows as of December 31:
| 2010 | 2009 | |||||||
Deferred income tax assets: | ||||||||
Net operating losses | $ | 9,663 | $ | 9,304 | ||||
Revenue recognition | 37,526 | 32,836 | ||||||
Compensation and benefits | 38,480 | 32,526 | ||||||
Stock-based compensation | 24,780 | 23,478 | ||||||
Minimum alternative tax and other credits | 100,468 | 81,201 | ||||||
Depreciation and amortization | 4,304 | 260 | ||||||
Other | 26,293 | 13,085 | ||||||
| 241,514 | 192,690 | |||||||
Less valuation allowance | (10,684 | ) | (10,230 | ) | ||||
Deferred income tax assets, net | 230,830 | 182,460 | ||||||
Deferred income tax liabilities: | ||||||||
Undistributed Indian income | 6,096 | 6,134 | ||||||
Intangible assets | 24,842 | 21,917 | ||||||
Deferred income tax liabilities | 30,938 | 28,051 | ||||||
Net deferred income tax assets | $ | 199,892 | $ | 154,409 | ||||
Deferred income tax assets: Net operating losses Revenue recognition Compensation and benefits Stock-based compensation Minimum alternative tax (MAT) and other credits Other Less valuation allowance Deferred income tax assets, net Deferred income tax liabilities: Undistributed Indian earnings Depreciation and amortization Intangible assets Deferred income tax liabilities Net deferred income tax assets 2012 2011 $ 10,911 $ 9,742 31,628 33,083 99,110 60,358 26,993 30,366 178,244 120,843 62,416 55,882 409,302 310,274 (6,288 ) (10,365 ) 403,014 299,909 5,601 5,689 832 — 19,094 24,398 25,527 30,087 $ 377,487 $ 269,822
At December 31, 2010,2012, we had foreign net operating loss carryforwards of approximately $37,500.$34,200. We have recorded a full valuation allowance on most of thecertain foreign net operating loss carryforwards. During 2007, the Indian government passed tax legislation that, among other items, subjects Indian taxpayers to a Minimum Alternative Tax, or MAT. As of December 31, 20102012 and 2009,2011, deferred income taxestax assets related to the MAT were approximately $98,600$163,000 and $78,800,$112,200, respectively. The calculation of the Minimum Alternate Tax, or MAT, calculation includes all profits realized by our Indian profits earnedsubsidiaries and any MAT paid is creditable against future corporate income tax within our Software Technology Parks, or STPs and the resulting tax may be credited against Indian income taxes due in future years,a 10-year expiration period, subject to certain limitations. Our existing MAT assets expire between March 2018 and March 2023 and we expect to fully utilize them within the applicable 10-year expiration periods.
Our Indian subsidiaries, collectively referred to as Cognizant India, are primarily export-oriented companies, which, underand are eligible for certain income tax holiday benefits granted by the Indian Income Tax Actgovernment of 1961 are entitled to claim tax holidaysIndia for a period of ten consecutive years for each STP with respect to export profits for each STP. Substantially all of the earnings of Cognizant India are attributable to export profits. The majority of our STPs in India are currently entitled to a 100% exemption from Indian income tax. The tax holidays for STPs currently expire on March 31, 2011. In addition, we have constructed new development centers in areas designated asactivities conducted within Special Economic Zones, or SEZs. Development centers operating in SEZs, are entitled to certain income tax incentives for periodsperiod of up to 15 years. Our Indian operations outside of SEZs are subject to corporate income tax at a rate of 32.4%. In addition, all Indian profits, including those generated within SEZs, are subject to the MAT, at the current rate of 20.0%. On March 31, 2011, income tax holidays related to export activities conducted within Software Technology Parks, or STPs, expired. For the years ended December 31, 2010, 20092012, 2011, and 2008,2010, the effect of the income tax holidays for our STPs and SEZs was to reduce the overall income tax provision and increase net income by approximately $166,800, $127,800$151,789, $125,708, and $102,500,$166,800, respectively, and increase diluted EPS by $0.54, $0.42$0.50, $0.41, and $0.34,$0.54, respectively.
Prior to January 1, 2002, it was our intent to repatriate all accumulated earnings from India to the United States. Accordingly, we provided deferred income taxes on such pre-2002 undistributed earnings. During the first quarter of 2002, we made a strategic decision to pursue an international strategy that includes expanded infrastructure investments in India and geographic expansion in Europe and Asia. As a component of this strategy, weWe do not intend to use 2002 and subsequent Indian earnings and otherrepatriate our foreign earnings for all periods (except with respect to expand operations outside of the United States instead of repatriating these earnings to the United States. Accordingly, effective January 1, 2002, we no longer accrue incremental U.S. taxes on all Indian earnings generated prior to 2002) as thesesuch earnings are considereddeemed to be indefinitely reinvested outside of the United States. With respect to all other foreign earnings, it was our intent to indefinitely reinvest all such earnings outside of the United States. As of December 31, 2010,2012, the amount of unrepatriated Indian earnings and total foreign earnings (including unrepatriated Indian earnings) upon which no incremental U.S. taxes have been recorded is approximately $1,984,400$3,406,000 and $2,165,000,$3,753,900, respectively. If such earnings are repatriated in the future, or are no longer deemed to be indefinitely reinvested, we will accrue the applicable amount of taxes associated with such earnings.earnings at that time. Due to the various methods by which such earnings could be repatriated in the future, it is not currently practicable to determine the amount of applicable taxes that would result from such repatriation.
Due to the geographical scope of our operations, we are subject to tax examinations in various jurisdictions. Accordingly, we may record incremental tax expense, based upon the more-likely-than-not outcomes ofstandard, for any uncertain tax positions. In addition, when applicable, we adjust the previously recorded income tax expense to reflect examination results when the position is effectively settled. Our ongoing assessments of the more-likely-than-not outcomes of the examinations and related tax positions require judgment and can increase or decrease our effective income tax rate, as well as impact our operating results. The specific timing of when the resolution of each tax position will be reached is uncertain.
Changes in unrecognized income tax benefits were as follows for the years ended December 31:
| 2010 | 2009 | 2012 | 2011 | |||||||||||||
Balance, beginning of year | $ | 10,553 | $ | 6,409 | $ | 56,526 | $ | 22,950 | ||||||||
Additions based on tax positions related to the current year | 2,677 | 908 | 37,270 | 16,897 | ||||||||||||
Additions for tax positions of prior years | 10,135 | 4,162 | 7,847 | 7,559 | ||||||||||||
Additions for tax positions of acquired subsidiaries | — | — | 88 | 16,056 | ||||||||||||
Reductions for tax positions of acquired subsidiaries | — | — | ||||||||||||||
Reductions for tax positions due to lapse of statutes of limitations | (597 | ) | (1,034 | ) | (8,816 | ) | (4,190 | ) | ||||||||
Settlements | — | — | — | (1,591 | ) | |||||||||||
Foreign currency exchange movement | 182 | 108 | (194 | ) | (1,155 | ) | ||||||||||
|
| |||||||||||||||
Balance, end of year | $ | 22,950 | $ | 10,553 | $ | 92,721 | $ | 56,526 | ||||||||
|
| |||||||||||||||
At December 31, 2010,2012, the entire balance of unrecognized income tax benefits would affect theour effective income tax rate, if recognized. It is reasonably possible thatWhile the Company believes uncertain tax positions may be settled within the next twelve months, certain U.S. state and foreign examinations will be resolved or reachit is difficult to estimate the statuteincome tax impact of limitations, which could result in a decrease in unrecognized tax benefits of $3,352.these potential resolutions at this time. We recognize accrued interest and penalties associated with uncertain tax positions as part of our provision for income taxes. The total amount of accrued interest and penalties at December 31, 20102012 and 20092011 was approximately $6,766$8,209 and $3,800,$10,884, respectively, and relates to U.S. and foreign tax matters. The amount of interest and penalties expensed in 2010, 20092012, 2011, and 20082010 were immaterial.
We file a U.S. federal consolidated income tax return. The U.S. federal statute of limitations remains open for the year 2007years 2009 and onward. The statute of limitations for state audits varies by state. Years still under examination by foreign tax authorities are years 2001 and forward.
10.Note 10 — Fair Value Measurements
We measure our cash equivalents, investments and foreign exchange forward contracts at fair value. The authoritative guidance defines fair value as the exit price, or the amount that would be received to sell an asset or paid to transfer a liability in an orderly transaction between market participants as of the measurement date. The authoritative guidance also establishes a fair value hierarchy that is intended to increase consistency and comparability in fair value measurements and related disclosures. The fair value hierarchy is based on inputs to valuation techniques that are used to measure fair value that are either observable or unobservable. Observable inputs reflect assumptions market participants would use in pricing an asset or liability based on market data obtained from independent sources while unobservable inputs reflect a reporting entity’s pricing based upon their own market assumptions.
The fair value hierarchy consists of the following three levels:
Level 1—Inputs are quoted prices in active markets for identical assets or liabilities.
Level 2—Inputs are quoted prices for similar assets or liabilities in an active market, quoted prices for identical or similar assets or liabilities in markets that are not active, inputs other than quoted prices that are observable and market-corroborated inputs which are derived principally from or corroborated by observable market data.
Level 3—Inputs are derived from valuation techniques in which one or more significant inputs or value drivers are unobservable.
The following table summarizes our financial assets and (liabilities) measured at fair value on a recurring basis as of December 31, 2012:
| Level 1 | Level 2 | Level 3 | Total | |||||||||||||
Cash equivalents: | ||||||||||||||||
Money market funds | $ | 411,512 | $ | — | $ | — | $ | 411,512 | ||||||||
Time deposits | — | 300,770 | — | 300,770 | ||||||||||||
Commercial paper | — | 7,918 | — | 7,918 | ||||||||||||
|
|
|
|
|
|
|
| |||||||||
Total cash equivalents | 411,512 | 308,688 | — | 720,200 | ||||||||||||
|
|
|
|
|
|
|
| |||||||||
Investments: | ||||||||||||||||
Time deposits | — | 282,335 | — | 282,335 | ||||||||||||
|
|
|
|
|
|
|
| |||||||||
Available-for-sale investment securities: | ||||||||||||||||
U.S. Treasury and agency debt securities | 392,067 | 159,169 | — | 551,236 | ||||||||||||
Corporate and other debt securities | — | 290,936 | — | 290,936 | ||||||||||||
Asset-backed securities | — | 97,112 | — | 97,112 | �� | |||||||||||
Municipal debt securities | — | 47,292 | — | 47,292 | ||||||||||||
Mutual funds | 21,150 | 21,150 | ||||||||||||||
Foreign government debt securities | — | 3,620 | — | 3,620 | ||||||||||||
|
|
|
|
|
|
|
| |||||||||
Total available-for-sale investment securities | 392,067 | 619,279 | — | 1,011,346 | ||||||||||||
|
|
|
|
|
|
|
| |||||||||
Total investments | 392,067 | 901,614 | — | 1,293,681 | ||||||||||||
|
|
|
|
|
|
|
| |||||||||
Derivative financial instruments – foreign exchange forward contracts: | ||||||||||||||||
Other current assets | — | 1,344 | — | 1,344 | ||||||||||||
Accrued expenses and other current liabilities | — | (130,923 | ) | — | (130,923 | ) | ||||||||||
Other noncurrent assets | — | 3,436 | — | 3,436 | ||||||||||||
Other noncurrent liabilities | — | (175,628 | ) | — | (175,628 | ) | ||||||||||
|
|
|
|
|
|
|
| |||||||||
Total | $ | 803,579 | $ | 908,531 | $ | — | $ | 1,712,110 | ||||||||
|
|
|
|
|
|
|
| |||||||||
The following table summarizes our financial assets and (liabilities) measured at fair value on a recurring basis as of December 31, 2010:2011:
| Level 1 | Level 2 | Level 3 | Total | |||||||||||||
Cash equivalents: | ||||||||||||||||
Money market funds | $ | 421,424 | $ | — | $ | — | $ | 421,424 | ||||||||
Time deposits | — | 67,703 | — | 67,703 | ||||||||||||
Total cash equivalents | 421,424 | 67,703 | — | 489,127 | ||||||||||||
Investments: | ||||||||||||||||
Time deposits | — | 139,391 | — | 139,391 | ||||||||||||
Available-for-sale securities—current: | ||||||||||||||||
U.S. Treasury and agency debt securities | 268,114 | 72,270 | — | 340,384 | ||||||||||||
Municipal debt securities | — | 41,655 | — | 41,655 | ||||||||||||
Corporate and other debt securities | — | 122,909 | — | 122,909 | ||||||||||||
Asset-backed debt securities | — | 33,154 | — | 33,154 | ||||||||||||
Foreign government debt securities | — | 7,926 | — | 7,926 | ||||||||||||
Total available-for-sale securities—current | 268,114 | 277,914 | — | 546,028 | ||||||||||||
Total investments | 268,114 | 417,305 | — | 685,419 | ||||||||||||
Derivative financial instruments—foreign exchange forward contracts: | ||||||||||||||||
Other current assets | — | 30,983 | — | 30,983 | ||||||||||||
Accrued expenses and other current liabilities | — | (7,504 | ) | — | (7,504 | ) | ||||||||||
Other noncurrent assets | — | 8,144 | — | 8,144 | ||||||||||||
Other noncurrent liabilities | — | (6,601 | ) | — | (6,601 | ) | ||||||||||
Total | $ | 689,538 | $ | 510,030 | $ | — | $ | 1,199,568 | ||||||||
The following table summarizes our financial assets and (liabilities) measured at fair value on a recurring basis as of December 31, 2009:
| Level 1 | Level 2 | Level 3 | Total | |||||||||||||
Cash equivalents: | ||||||||||||||||
Money market funds | $ | 778,311 | $ | — | $ | — | $ | 778,311 | ||||||||
Total cash equivalents | 778,311 | — | — | 778,311 | ||||||||||||
Investments: | ||||||||||||||||
Time deposits | — | 298,240 | — | 298,240 | ||||||||||||
Available-for-sale securities—current | — | 162 | — | 162 | ||||||||||||
Trading securities—noncurrent | — | — | 129,103 | 129,103 | ||||||||||||
UBS Right—noncurrent | — | — | 22,028 | 22,028 | ||||||||||||
Total investments | — | 298,402 | 151,131 | 449,533 | ||||||||||||
Derivative financial instruments—foreign exchange forward contracts: | ||||||||||||||||
Other current assets | — | 20,358 | — | 20,358 | ||||||||||||
Accrued expenses and other current liabilities | — | (20,968 | ) | — | (20,968 | ) | ||||||||||
Other noncurrent assets | — | 688 | — | 688 | ||||||||||||
Other noncurrent liabilities | — | (1,917 | ) | — | (1,917 | ) | ||||||||||
Total | $ | 778,311 | $ | 296,563 | $ | 151,131 | $ | 1,226,005 | ||||||||
Cash equivalents: Money market funds Time deposits Commercial paper Total cash equivalents Investments: Time deposits Available-for-sale investment securities: U.S. Treasury and agency debt securities Corporate and other debt securities Asset-backed securities Municipal debt securities Foreign government debt securities Total available-for-sale investment securities Total investments Derivative financial instruments – foreign exchange forward contracts: Other current assets Accrued expenses and other current liabilities Other noncurrent liabilities Total Level 1 Level 2 Level 3 Total $ 128,004 $ — $ — $ 128,004 — 13,283 — 13,283 — 11,626 — 11,626 128,004 24,909 — 152,913 — 298,432 — 298,432 326,659 138,279 — 464,938 — 202,705 — 202,705 — 100,894 — 100,894 — 43,889 — 43,889 — 10,500 — 10,500 326,659 496,267 — 822,926 326,659 794,699 — 1,121,358 — 30,935 — 30,935 — (126,731 ) — (126,731 ) — (259,104 ) — (259,104 ) $ 454,663 $ 464,708 $ — $ 919,371
We measure the fair value of money market funds and U.S. Treasury securities based on quoted prices in active markets for identical assets. The fair value of commercial paper, certificates of deposit, U.S. government agency securities, municipal debt securities, U.S. and international corporate bonds and foreign government debt securities is measured based on relevant trade data, dealer quotes, or model driven valuations using significant inputs derived from or corroborated by observable market data, such as yield curves and credit spreads. We measure the fair value of our asset-backed securities using model driven valuations based on significant inputs derived from or corroborated by observable market data such as dealer quotes, available trade information, spread data, current market assumptions on prepayment speeds and defaults and historical data on deal collateral performance. The value of the mutual funds invested in fixed income securities is based on the net asset value, or NAV of the fund, with appropriate consideration to the liquidity and any restrictions on disposition of the investment in the fund.
We estimate the fair value of each foreign exchange forward contract by using a present value of expected cash flows model. This model calculates the difference between the current market forward price and the contracted forward price for each foreign exchange contract and applies the difference in the rates to each outstanding contract. The market forward rates includedinclude a discount and credit risk factor. The amounts wereare aggregated by type of contract and maturity.
We estimated the fair value of the auction-rate securities using a discounted cash flow model analysis which considered the following key inputs: the underlying structure of each security, the timing of expected future principal and interest payments, and discount rates, inclusive of an illiquidity risk premium, that are believed to reflect current market conditions and the relevant risk associated with each security. We estimated the value of the UBS Right using a fair value model analysis, which considered the following key inputs: discount rate, timing and amount of cash flow, and UBS counterparty risk.
During the years ended December 31, 20102012 and 2009,2011, there were no transfers betweenamong Level 1, Level 2, or Level 3 financial assets and liabilities. As of December 31, 2009, Level 3 assets consisted of our investment in auction-rate securities and the related UBS Right. See
Note 3 for additional information. During 2010, our auction-rate securities were redeemed by the issuers or purchased by UBS at par value thereby reducing the outstanding balance to zero. The following table provides a summary of changes in fair value of our Level 3 financial assets for the years ended December 31:
| 2010 | 2009 | |||||||
Balance, at the beginning of the period | $ | 151,131 | $ | 167,556 | ||||
Redemptions or purchases by UBS | (151,275 | ) | (17,250 | ) | ||||
Gain related to auction-rate securities included in Other, net | 22,172 | 6,955 | ||||||
Loss related to UBS Right included in Other, net | (22,028 | ) | (6,130 | ) | ||||
Balance, at the end of the period | $ | — | $ | 151,131 | ||||
11.11 — Derivative Financial Instruments
In the normal course of business, we use foreign exchange forward contracts to manage foreign currency exchange rate risk. The estimated fair value of the foreign exchange forward contracts considers the following items: discount rate, timing and amount of cash flow and counterparty credit risk. Derivatives may give rise to credit risks from the possible non-performance by counterparties. Credit risk is generally limited to the fair value of those contracts that are favorable to us. We have limited our credit risk by entering into derivative transactions only with highly-rated global financial institutions, limiting the amount of credit exposure with any one financial institution and conducting ongoing evaluation of the creditworthiness of the financial institutions with which we do business.
The following table provides information on the location and fair values of derivative financial instruments included in our consolidated statements of financial position as of December 31, 2010:31:
Designation of Derivatives | Location on Statement of Financial Position | Assets | Liabilities | |||||||
Cash Flow Hedges—Designated as hedging instruments | ||||||||||
Foreign exchange forward contracts | Other current assets | $ | 30,983 | $ | — | |||||
| Other assets | 8,144 | — | ||||||||
| Accrued expenses and other current liabilities | — | 187 | ||||||||
| Noncurrent liabilities | — | 6,601 | ||||||||
Total | 39,127 | 6,788 | ||||||||
Other Derivatives—Not designated as hedging instruments | ||||||||||
Foreign exchange forward contracts | Accrued expenses and other current liabilities | — | 7,317 | |||||||
Total | — | 7,317 | ||||||||
Total | $ | 39,127 | $ | 14,105 | ||||||
The following table provides information on the location and fair values of derivative financial instruments included in our consolidated statements of financial position as of December 31, 2009:
Designation of Derivatives | Location on Statement of Financial Position | Assets | Liabilities | |||||||
Cash Flow Hedges—Designated as hedging instruments | ||||||||||
Foreign exchange forward contracts | Other current assets | $ | 20,211 | $ | — | |||||
| Other assets | 688 | — | ||||||||
| Noncurrent liabilities | — | 1,917 | ||||||||
Total | 20,899 | 1,917 | ||||||||
Other Derivatives—Not designated as hedging instruments | ||||||||||
Foreign exchange forward contracts | Other current assets | 147 | — | |||||||
Accrued expenses and other current liabilities | — | 20,968 | ||||||||
Total | 147 | 20,968 | ||||||||
Total | $ | 21,046 | $ | 22,885 | ||||||
Designation of Derivatives Cash Flow Hedges – Designated as hedging instruments Foreign exchange forward contracts Other Derivatives – Not designated as hedging instruments Foreign exchange forward contracts Total 2012 2011 Location on Statement of Financial
Position Assets Liabilities Assets Liabilities Other current assets $ 1,230 $ — $ — $ — Other noncurrent assets 3,436 — — — Accrued expenses and
other current
liabilities — 125,633 — 126,536 Other noncurrent
liabilities — 175,628 — 259,104 Total 4,666 301,261 — 385,640 Other current assets 114 — 30,935 — Accrued expenses and
other current
liabilities — 5,290 — 195 Total 114 5,290 30,935 195 $ 4,780 $ 306,551 $ 30,935 $ 385,835
Cash Flow Hedges
We have entered into a series of foreign exchange forward contracts that are designated as cash flow hedges of certain salaryIndian rupee denominated payments in India. These contracts are intended to partially offset the impact of movement of exchange rates on future operating costs and are scheduled to mature each month during 2011, 20122013, 2014, 2015 and 2013.2016. Under these contracts, we purchase Indian rupees and sell U.S. dollars. The changes in fair value of these contracts are initially reported in the caption “accumulated other comprehensive income (loss)” onin our accompanying consolidated statements of financial position and are subsequently reclassified to earnings in the same period the hedge contract matures. As of December 31, 2012, we estimate that $106,000 of the net losses related to derivatives designated as cash flow hedges recorded in accumulated other comprehensive income (loss) is expected to be reclassified into earnings within the next 12 months.
The notional value of our outstanding contracts by year of maturity and the net unrealized (loss) gain included in accumulated other comprehensive income (loss) for such contracts were as follows as of December 31:
| 2010 | 2009 | 2012 | 2011 | |||||||||||||
2010 | $ | — | $ | 450,000 | ||||||||||||
2011 | 780,000 | 360,000 | ||||||||||||||
2012 | 780,000 | — | $ | — | $ | 1,193,500 | ||||||||||
2013 | 600,000 | — | 1,253,000 | 1,080,000 | ||||||||||||
2014 | 1,200,000 | 810,000 | ||||||||||||||
2015 | 780,000 | 420,000 | ||||||||||||||
2016 | 120,000 | — | ||||||||||||||
|
| |||||||||||||||
Total notional value of contracts outstanding | $ | 2,160,000 | $ | 810,000 | $ | 3,353,000 | $ | 3,503,500 | ||||||||
|
| |||||||||||||||
Net unrealized gain included in accumulated other comprehensive income (loss), net of taxes | $ | 30,723 | $ | 18,410 | ||||||||||||
Net unrealized (loss) included in accumulated other comprehensive | $ | (252,810 | ) | $ | (323,039 | ) | ||||||||||
|
| |||||||||||||||
Upon settlement or maturity of the cash flow hedge contracts, we record the related gain or loss, based on our designation at the commencement of the contract, to salaryIndian rupee denominated expense reported within cost of revenues and selling, general and administrative expenses. Hedge ineffectiveness was immaterial for all periods presented.
The following table provides information on the location and amounts of pre-tax gains (losses) on our cash flow hedges for the yearyears ended December 31, 2010:31:
| Increase (decrease) in Derivative Gains (Losses) Recognized in Accumulated Other Comprehensive Income (Loss) (effective portion) | Location of Net Derivative Gains | Net Gain (Loss) Reclassified from Accumulated Other Comprehensive Income (Loss) into Income (effective portion) | ||||||||
Cash Flow Hedges— Designated as hedging instruments | ||||||||||
Foreign exchange forward contracts | $ | 54,919 | Cost of revenues | $ | 34,974 | |||||
Selling, general and administrative expenses | 6,588 | |||||||||
Total | $ | 54,919 | $ | 41,562 | ||||||
Cash Flow Hedges – Designated as hedging instruments Foreign exchange forward contracts Increase (decrease) in
Derivative Gains
(Losses) Recognized
in Accumulated Other
Comprehensive Income (Loss)
(effective portion) Location of Net Derivative Gains
(Losses) Reclassified
from Accumulated Other
Comprehensive Income (Loss)
into Income
(effective portion) Net Gain (Loss) Reclassified
from Accumulated Other
Comprehensive Income (Loss)
into Income
(effective portion) 2012 2011 2012 2011 $ (7,065 ) $ (399,205 ) Cost of revenues $ (79,335 ) $ 15,294 Selling, general
and administrative
expenses (16,775 ) 3,480 Total $ (96,110 ) $ 18,774
The following table provides informationactivity related to the change in net unrealized (losses) gains on the location and amounts of pre-tax gains (losses) on our cash flowsflow hedges for the year ended December 31, 2009:in accumulated other comprehensive income (loss) was as follows:
| Increase (decrease) in Derivative Gains (Losses) Recognized in Accumulated Other Comprehensive Income (Loss) (effective portion) | Location of Net Derivative Gains | Net Gain (Loss) Reclassified from Accumulated Other Comprehensive Income (Loss) to Income (effective portion) | ||||||||
Cash Flow Hedges— Designated as hedging instruments | ||||||||||
Forward foreign exchange contracts | $ | 27,330 | Cost of revenues | $ | 7,141 | |||||
Selling, general and administrative expenses | 1,805 | |||||||||
Total | $ | 27,330 | $ | 8,946 | ||||||
| 2012 | 2011 | |||||||
Net unrealized (losses) gains on cash flow hedges, net of taxes, beginning of period | $ | (323,039 | ) | $ | 30,723 | |||
Change in fair value, net of tax | (10,613 | ) | (339,553 | ) | ||||
Reclassification into earnings, net of tax | 80,842 | (14,209 | ) | |||||
|
|
|
| |||||
Net unrealized (losses) gains on cash flow hedges, net of taxes, end of period | $ | (252,810 | ) | $ | (323,039 | ) | ||
|
|
|
| |||||
Other Derivatives
We also use foreign exchange forward contracts, which have not been designated as hedges, to hedge our balance sheet exposure to Indian rupeecertain monetary assets and liabilities denominated net monetary assets. During 2009 and 2010, wein currencies other than the functional currency of our foreign subsidiaries. We entered into a series of foreign exchange forward contracts scheduled to mature in 2013 which are primarily to purchase U.S. dollars and sell Indian rupees. Realized gains or losses and changes in the estimated fair value of these derivative financial instruments are recorded in Other, net in our consolidated statements of operations.
Additional information related to our outstanding contracts is as follows:follows as of December 31:
| December 31, 2010 | December 31, 2009 | |||||||
Notional value of contracts outstanding | $ | 234,021 | $ | 400,000 | ||||
| 2012 | 2011 | |||||||
Notional value of contracts outstanding | $ | 208,571 | $ | 234,239 | ||||
|
|
|
| |||||
The following table provides information on the location and amounts of realized and unrealized pre-tax gains (losses) on our other derivative financial instruments for years ended December 31, 20102012 and 2009. There were no realized gains (losses) on our other derivative instruments for the year ended December 31, 2009.2011.
| Location of Net Gains / (Losses) on Derivative Instruments | Amount of Net Gains (Losses) on Derivative Instruments | Location of Net Gains /(Losses) | Amount of Net Gains (Losses) on Derivative Instruments | |||||||||||||||||
| 2010 | 2009 | 2012 | 2011 | |||||||||||||||||
Other Derivatives—Not designated as hedging instruments | ||||||||||||||||||||
Other Derivatives – Not designated as hedging instruments | ||||||||||||||||||||
Foreign exchange forward contracts | Other, net | $ | (21,088 | ) | $ | (20,821 | ) | Other, net | $ | (8,270 | ) | $ | 23,621 | |||||||
|
| |||||||||||||||||||
The related cash flow impacts of all of our derivative activities are reflected as cash flows from operating activities.
12. Stock-Based Compensation Plans
On June 5, 2009, our stockholders approved the adoption of the Cognizant Technology Solutions Corporation 2009 Incentive Compensation Plan (the “2009 Incentive Plan”), under which 24,000,000 shares of our Class A common stock were reserved for issuance. The 2009 Incentive Plan is the successor plan to our Amended and Restated 1999 Incentive Compensation Plan which terminated on April 13, 2009 in accordance
with its terms (the “1999 Incentive Plan”), our Amended and Restated Non-Employee Directors’ Stock Option Plan (the “Director Plan”) and our Amended and Restated Key Employees’ Stock Option Plan (the “Key Employee Plan”) which terminated in July 2009 (collectively, the “Predecessor Plans”). The 2009 Incentive Plan will not affect any options or stock issuances outstanding under the Predecessor Plans. No further awards will be made under the Predecessor Plans. As of December 31, 2010,2012, we have 20,482,12713,982,728 shares available for grant under the 2009 Incentive Plan.
Stock options granted to employees under our plans have a life ranging from seven to ten years, vest proportionally over four years, unless specified otherwise, and have an exercise price equal to the fair market value of the common stock on the date of grant. Grants to non-employee directors vest proportionally over two years. Stock-based compensation expense relating to stock options is recognized on a straight-line basis over the requisite service period.
Restricted stock units vest proportionately in quarterly or annual installments over three years. Stock-based compensation expense relating to restricted stock units is recognized on a straight-line basis over the requisite service period.
We granted performance stock units that cliff vest after three years, principally to executive officers, and performance stock units that vest over periods ranging from one to three years to employees, including the executive officers. The vesting of performance stock units is contingent on both meeting revenue performance
targets and continued service. Stock-based compensation costs for performance stock units that cliff vest are
recognized on a straight-line basis and awards that vest proportionally are recognized on a graded-vesting basis over the vesting period based on the most probable outcome of the performance conditions. If the minimum performance targets are not met, no compensation cost is recognized and any recognized compensation cost is reversed.
The Company’s 2004 Employee Stock Purchase Plan (the “Purchase Plan”), as amended in 2010, provides for the issuance of up to 9,000,000 shares of Class A common stock to eligible employees. The Purchase Plan provides for eligible employees to purchase whole shares of Class A common stock at a price of 90% of the lesser of: (a) the fair market value of a share of Class A common stock on the first date of the purchase period or (b) the fair market value of a share of Class A common stock on the last date of the purchase period. Stock-based compensation expense for the Purchase Plan is recognized over the vesting period of three months on a straight-line basis. As of December 31, 2010,2012, we had 3,627,8651,960,418 shares available for future grants and issuances under the Purchase Plan.
The allocation of total stock-based compensation expense between cost of revenues and selling, general and administrative expenses as well as the related income tax benefit were as follows for the three years ended December 31:
| 2010 | 2009 | 2008 | 2012 | 2011 | 2010 | |||||||||||||||||||
Cost of revenues | $ | 13,147 | $ | 14,889 | $ | 18,715 | $ | 16,773 | $ | 15,257 | $ | 13,147 | ||||||||||||
Selling, general and administrative expenses | 43,837 | 29,927 | 25,185 | 90,582 | 74,975 | 43,837 | ||||||||||||||||||
|
|
| ||||||||||||||||||||||
Total stock-based compensation expense | $ | 56,984 | $ | 44,816 | $ | 43,900 | $ | 107,355 | $ | 90,232 | $ | 56,984 | ||||||||||||
|
|
| ||||||||||||||||||||||
Income tax benefit | $ | 13,453 | $ | 9,881 | $ | 8,788 | $ | 26,206 | $ | 21,510 | $ | 13,453 | ||||||||||||
|
|
| ||||||||||||||||||||||
Effective April 1, 2007, the Indian government enacted a fringe benefit tax, or FBT, on the intrinsic value of stock options and awards as of the vesting date that is payable by us at the time of exercise or distribution for employees subject to FBT. We elected to recover this cost from the employee and withhold the FBT from the employee’s stock option or award proceeds at the time of exercise or distribution before remitting the tax to the Indian government. Because we were the primary obligor of this tax obligation, we recorded the FBT as an
operating expense and the recovery from the employee is recorded in additional paid-in capital as proceeds from stock issuance. During the third quarter of 2009, the Indian government repealed the FBT retroactive to April 1, 2009. Stock-based FBT expense was as follows for the years ended December, 31:
| 2010 | 2009 | 2008 | ||||||||||
Stock-based FBT expense | $ | — | $ | 945 | $ | 8,149 | ||||||
In determining the fair value of stock options issued to employees who were subject to the FBT, we estimated the future stock issuance proceeds, including FBT, at time of grant. The Monte Carlo simulation model was used to estimate the future price of our stock on the respective vesting dates of stock option grants. Accordingly, effective April 1, 2007, we began to segregate our employees into two groups for determining the fair value of stock options at date of grant: employees subject to the FBT and employees not subject to the FBT. Effective in 2007, the fair value of each stock option granted to employees subject to the FBT was estimated at the date of grant using the Monte Carlo simulation model and the fair value of each stock option granted to employees not subject to the FBT was estimated at date of grant using the Black-Scholes option-pricing model. Effective April 1, 2009, we estimated the fair value of each stock option granted using the Black-Scholes option-pricing model. For the years ended December 31, 2010, 20092012, 2011 and 2008,2010, expected volatility was calculated using implied market volatilities. In addition, the expected term, which represents the period of time, measured from the grant date, that vested options are expected to be outstanding, was derived by incorporating exercise and post-vest termination assumptions, based on historical data, in a Monte Carlo simulation model. The risk-free rate is derived from the U.S. Treasury yield curve in effect at the time of grant. We have not paid any dividends. Forfeiture assumptions used in amortizing stock-based compensation expense are based on an analysis of historical data.
The fair values of option grants, including the Purchase Plan, were estimated at the date of grant during the years ended December 31, 2010, 20092012, 2011, and 20082010 based upon the following assumptions and were as follows:
| 2010 | 2009 | 2008 | 2012 | 2011 | 2010 | |||||||||||||||||||
Dividend yield | 0 | % | 0 | % | 0 | % | 0 | % | 0 | % | 0 | % | ||||||||||||
Weighted average volatility factor: | ||||||||||||||||||||||||
Stock options | 39.98 | % | 45.98 | % | 58.38 | % | 36.71 | % | 31.87 | % | 39.98 | % | ||||||||||||
Purchase Plan | 33.35 | % | 56.63 | % | 46.89 | % | 32.31 | % | 34.66 | % | 33.35 | % | ||||||||||||
Weighted average expected life (in years): | ||||||||||||||||||||||||
Stock options | 3.53 | 4.18 | 5.95 | 3.69 | 3.54 | 3.53 | ||||||||||||||||||
Purchase Plan | 0.25 | 0.25 | 0.25 | 0.25 | 0.25 | 0.25 | ||||||||||||||||||
Weighted average risk-free interest rate: | ||||||||||||||||||||||||
Stock options | 1.55 | % | 2.48 | % | 2.97 | % | 0.43 | % | 1.06 | % | 1.55 | % | ||||||||||||
Purchase Plan | 0.13 | % | 0.14 | % | 1.88 | % | 0.06 | % | 0.05 | % | 0.13 | % | ||||||||||||
Weighted average grant date fair value: | ||||||||||||||||||||||||
Stock options | $ | 15.35 | $ | 10.49 | $ | 12.87 | $ | 16.77 | $ | 18.85 | $ | 15.35 | ||||||||||||
Purchase Plan | $ | 8.75 | $ | 5.04 | $ | 5.65 | $ | 11.13 | $ | 12.21 | $ | 8.75 | ||||||||||||
During the year ended December 31, 2010,2012, we issued 597,636934,892 shares of Class A common stock under the Purchase Plan with a total vested fair value of approximately $5,230.$10,409.
A summary of the activity for stock options granted under our stock-based compensation plans as of December 31, 20102012 and changes during the year then ended is presented below:
| Number of Options | Weighted Average Exercise Price (in dollars) | Weighted Average Remaining Life (in years) | Aggregate Intrinsic Value (in thousands) | Number of Options | Weighted Average Exercise Price (in dollars) | Weighted Average Remaining Life (in years) | Aggregate Interinsic Value (in thousands) | |||||||||||||||||||||||||
Outstanding at January 1, 2010 | 19,080,201 | $ | 18.56 | |||||||||||||||||||||||||||||
Outstanding at January 1, 2012 | 10,498,661 | $ | 23.06 | |||||||||||||||||||||||||||||
Granted | 70,000 | 49.14 | 90,000 | 59.65 | ||||||||||||||||||||||||||||
Exercised | (6,122,686 | ) | 12.88 | (4,773,216 | ) | 15.88 | ||||||||||||||||||||||||||
Cancelled | (133,986 | ) | 35.48 | (7,500 | ) | 31.06 | ||||||||||||||||||||||||||
Expired | (25,871 | ) | 29.06 | (6,599 | ) | 32.04 | ||||||||||||||||||||||||||
| ||||||||||||||||||||||||||||||||
Outstanding at December 31, 2010 | 12,867,658 | $ | 21.23 | 4.42 | $ | 669,948 | ||||||||||||||||||||||||||
Outstanding at December 31, 2012 | 5,801,346 | $ | 29.52 | 3.73 | $ | 257,461 | ||||||||||||||||||||||||||
|
|
|
| |||||||||||||||||||||||||||||
Vested and expected to vest at December 31, 2010 | 12,712,996 | $ | 21.10 | 4.39 | $ | 663,482 | ||||||||||||||||||||||||||
Vested and expected to vest at December 31, 2012 | 5,787,914 | $ | 29.44 | 3.73 | $ | 257,305 | ||||||||||||||||||||||||||
|
|
|
| |||||||||||||||||||||||||||||
Exercisable at December 31, 2010 | 11,300,983 | $ | 19.67 | 4.06 | $ | 605,967 | ||||||||||||||||||||||||||
Exercisable at December 31, 2012 | 5,674,846 | $ | 28.76 | 3.68 | $ | 256,101 | ||||||||||||||||||||||||||
|
|
|
| |||||||||||||||||||||||||||||
As of December 31, 2010, $11,8442012, $1,244 of total remaining unrecognized stock-based compensation cost related to stock options is expected to be recognized over the weighted-average remaining requisite service period of 1.031.15 years. The total intrinsic value of options exercised was $270,349, $142,676$256,623, $136,182, and $87,910$270,349 for the years ended December 31, 2010, 20092012, 2011, and 2008,2010, respectively.
The fair value of performance stock units and restricted stock units is determined based on the number of stock units granted and the quoted price of our stock at date of grant. For employees previously subject to the FBT, the grant date fair value is reduced by the amount of the FBT expected to be recovered by us from the employee. Under the Monte Carlo simulation model, the value of the FBT is equal to the FBT tax rate multiplied by the quoted price of our stock at date of grant. Effective April 1, 2009, the Indian government repealed the FBT, and accordingly the fair value of performance stock units and restricted stock units is determined based upon the number of stock units granted and the quoted price of our stock at the date of grant.
A summary of the activity for performance stock units granted under our stock-based compensation plans as of December 31, 20102012 and changes during the year then ended is presented below:below. The presentation reflects the number of performance stock units at the maximum performance milestones.
| Number of Units | Weighted Avg Grant Date Fair Value (in dollars) | Number of Units | Weighted Average Grant Date Fair Value (in dollars) | |||||||||||||
Unvested at January 1, 2010 | 921,407 | $ | 28.14 | |||||||||||||
Unvested at January 1, 2012 | 1,828,928 | $ | 64.56 | |||||||||||||
Granted | 425,875 | 64.55 | 1,113,745 | 67.10 | ||||||||||||
Vested | (173,847 | ) | 15.87 | (446,253 | ) | 60.23 | ||||||||||
Forfeited | (14,567 | ) | 21.73 | (24,759 | ) | 69.02 | ||||||||||
Reduction in units due to performance condition | (53,881 | ) | 28.93 | |||||||||||||
Reduction due to the achievement of lower than maximum performance milestones | (700,367 | ) | 65.42 | |||||||||||||
| ||||||||||||||||
Unvested at December 31, 2010 | 1,104,987 | $ | 44.15 | |||||||||||||
Unvested at December 31, 2012 | 1,771,294 | $ | 66.84 | |||||||||||||
| ||||||||||||||||
As of December 31, 2010, $17,1452012, $71,225 of total remaining unrecognized stock-based compensation cost related to performance stock units is expected to be recognized over the weighted-average remaining requisite service period of 1.872.20 years.
A summary of the activity for restricted stock units granted under our stock-based compensation plans as of December 31, 20102012 and changes during the year then ended is presented below:
| Number of Units | Weighted Avg Grant Date Fair Value (in dollars) | Number of Units | Weighted Average Grant Date Fair Value (in dollars) | |||||||||||||
Unvested at January 1, 2010 | 1,556,796 | $ | 29.49 | |||||||||||||
Unvested at January 1, 2012 | 2,160,591 | $ | 66.08 | |||||||||||||
Granted | 508,728 | 63.31 | 745,275 | 67.75 | ||||||||||||
Vested | (634,702 | ) | 27.97 | (1,024,014 | ) | 61.21 | ||||||||||
Forfeited | (36,795 | ) | 37.60 | (97,117 | ) | 67.37 | ||||||||||
| ||||||||||||||||
Unvested at December 31, 2010 | 1,394,027 | $ | 41.78 | |||||||||||||
Unvested at December 31, 2012 | 1,784,735 | $ | 69.39 | |||||||||||||
| ||||||||||||||||
As of December 31, 2010, $48,3302012, $101,935 of total remaining unrecognized stock-based compensation cost related to restricted stock units is expected to be recognized over the weighted-average remaining requisite service period of 1.892.03 years.
13.Note 13 — Commitments and Contingencies
We lease office space and equipment under operating leases, which expire at various dates through the year 2023.2024. Certain leases contain renewal provisions and generally require us to pay utilities, insurance, taxes, and other operating expenses. Future minimum rental payments under non-cancelable operating leases as of December 31, 20102012 are as follows:
2011 | $ | 83,364 | ||||||
2012 | 76,309 | |||||||
2013 | 59,814 | $ | 124,644 | |||||
2014 | 41,153 | 121,172 | ||||||
2015 | 29,411 | 106,027 | ||||||
2016 | 81,806 | |||||||
2017 | 62,164 | |||||||
Thereafter | 37,708 | 228,501 | ||||||
| ||||||||
Total minimum lease payments | $ | 327,759 | $ | 724,314 | ||||
| ||||||||
Rental expense totaled $94,863, $75,170$147,576, $122,035, and $85,281 for$94,863 years ended December 31, 2010, 20092012, 2011, and 2008,2010, respectively.
Our current India real estate development program includes planned construction of approximately 8.010.5 million square feet of new space. The expandedspace between 2011 and the end of 2015. This program includes the expenditure of approximately $500,000over $700,000 during this period on land acquisition, facilities construction and furnishings to build new company-owned state-of-the-art IT development and delivery centers in regions primarily designated as SEZs located in India. As of December 31, 2010,2012, we had outstanding fixed capital commitments of $56,587approximately $163,484 related to our India development center expansion program.
We are involved in various claims and legal actions arising in the ordinary course of business. In the opinion of management, the outcome of such claims and legal actions, if decided adversely, is not expected to have a material adverse effect on our business, financial condition, and results of operations.operations and cash flows. Additionally, many of our engagements involve projects that are critical to the operations of our customers’ business and provide benefits that are difficult to quantify. Any failure in a customer’s systems or our failure to meet our contractual obligations to our clients, including any breach involving a customer’s confidential information or sensitive data, or our obligations under applicable laws or regulations could result in a claim for substantial damages against us, regardless of our responsibility for such failure. Although we attempt to contractually limit our liability for damages arising from negligent acts, errors, mistakes, or omissions in rendering our services,
there can be no
assurance that the limitations of liability set forth in our contracts will be enforceable in all instances or will otherwise protect us from liability for damages. Although we have general liability insurance coverage, including coverage for errors or omissions, there can be no assurance that such coverage will continue to be available on reasonable terms or will be available in sufficient amounts to cover one or more large claims, or that the insurer will not disclaim coverage as to any future claim. The successful assertion of one or more large claims against us that exceed available insurance coverage or changes in our insurance policies, including premium increases or the imposition of large deductible or co-insurance requirements, could have a material adverse effect on our business, results of operations, financial condition and financial condition.cash flows.
In the normal course of business and in conjunction with certain client engagements, we have entered into contractual arrangements through which we may be obligated to indemnify clients or other parties with whom we conduct business with respect to certain matters. These arrangements can include provisions whereby we agree to hold the indemnified party and certain of their affiliated entities harmless with respect to third-party claims related to such matters as our breach of certain representations or covenants, or out of our intellectual property infringement, our gross negligence or willful misconduct or certain other claims made against certain parties. Payments by us under any of these arrangements are generally conditioned on the client making a claim and providing us with full control over the defense and settlement of such claim. It is not possible to determine the maximum potential amount under these indemnification agreements due to the unique facts and circumstances involved in each particular agreement. Historically, we have not made payments under these indemnification agreements so they have not had any impact on our operating results, financial position, or cash flows. However, if events arise requiring us to make payment for indemnification claims under our indemnification obligations in contracts we have entered, such payments could have material impact on our operatingbusiness, results of operations, financial position,condition and cash flows.
14.Note 14 — Segment Information
Our reportable segments are: Financial Services, which includes customers providing banking/transaction processing, capital markets and insurance services; Healthcare, which includes healthcare providers and payers as well as life sciences customers; Manufacturing/Retail/Logistics, which includes manufacturers, retailers, travel and other hospitality customers, as well as customers providing logistics services; and Other, which is an aggregation of industry segments each of which, individually, arerepresents less than 10% of consolidated revenues and segment operating profit. The Other reportable segment includes entertainment,our information, media and informationentertainment services, communications and high technology operating segments. Our sales managers, account executives, account managers and project teams are aligned in accordance with the specific industries they serve.
Our chief operating decision maker evaluates the Company’s performance and allocates resources based on segment revenues and operating profit. Segment operating profit is defined as income from operations before unallocated costs. Generally, operating expenses for each operating segment have similar characteristics and are subject to the same factors, pressures and challenges. However, the economic environment and its effects on industries served by our operating segments may affect revenue and operating expenses to differing degrees. Expenses included in segment operating profit consist principally of direct selling and delivery costs as well as a per seat charge for use of the development and delivery centers. Certain expenses, such asselling, general and administrative andexpenses, excess or shortfall of incentive compensation for delivery personnel as compared to target, stock-based compensation expense, a portion of depreciation and amortization are not specifically allocated to specific segments as management does not believe it is practical to allocate such costs to individual segments because they are not directly attributable to any specific segment. Further, stock-based compensation expense and the related stock-based Indian fringe benefit taximpact of the settlements of our cash flow hedges are not allocated to individual segments in internal management reports used by the chief operating decision maker. Accordingly, thesesuch expenses are excluded from segment operating profit and are separately disclosed as “unallocated” and adjusted only against our total income from operations. Additionally, management has determined that it is not practical to allocate identifiable assets, by segment, since such assets are used interchangeably among the segments.
Revenues from external customers and segment operating profit, before unallocated expenses, for the Financial Services, Healthcare, Manufacturing/Retail/Logistics, and Otherour reportable segments were as follows for the years ended December 31:
| 2010 | 2009 | 2008 | ||||||||||
Revenues: | ||||||||||||
Financial Services | $ | 1,944,450 | $ | 1,406,629 | $ | 1,284,013 | ||||||
Healthcare | 1,177,113 | 860,427 | 688,224 | |||||||||
Manufacturing/Retail/Logistics | 849,643 | 564,917 | 443,236 | |||||||||
Other | 621,183 | 446,690 | 400,831 | |||||||||
Total revenue | $ | 4,592,389 | $ | 3,278,663 | $ | 2,816,304 | ||||||
| 2010 | 2009 | 2008 | ||||||||||
Segment Operating Profit: | ||||||||||||
Financial Services | $ | 668,595 | $ | 503,689 | $ | 439,055 | ||||||
Healthcare | 436,879 | 331,007 | 270,790 | |||||||||
Manufacturing/Retail/Logistics | 283,676 | 184,636 | 136,609 | |||||||||
Other | 208,306 | 147,246 | 132,209 | |||||||||
Total segment operating profit | 1,597,456 | 1,166,578 | 978,663 | |||||||||
Less—unallocated costs(1) | 735,604 | 548,088 | 461,993 | |||||||||
Income from operations | $ | 861,852 | $ | 618,490 | $ | 516,670 | ||||||
| 2012 | 2011 | 2010 | ||||||||||
Revenues: | ||||||||||||
Financial Services | $ | 3,035,447 | $ | 2,518,422 | $ | 1,944,450 | ||||||
Healthcare | 1,934,898 | 1,622,157 | 1,177,113 | |||||||||
Manufacturing/Retail/Logistics | 1,498,668 | 1,197,472 | 849,643 | |||||||||
Other | 877,459 | 783,105 | 621,183 | |||||||||
|
|
|
|
|
| |||||||
Total revenue | $ | 7,346,472 | $ | 6,121,156 | $ | 4,592,389 | ||||||
|
|
|
|
|
| |||||||
| 2012 | 2011 | 2010 | ||||||||||
Segment Operating Profit: | ||||||||||||
Financial Services | $ | 998,339 | $ | 872,267 | $ | 668,595 | ||||||
Healthcare | 724,454 | 625,052 | 436,879 | |||||||||
Manufacturing/Retail/Logistics | 527,970 | 440,416 | 283,676 | |||||||||
Other | 288,052 | 254,145 | 208,306 | |||||||||
|
|
|
|
|
| |||||||
Total segment operating profit | 2,538,815 | 2,191,880 | 1,597,456 | |||||||||
Less: unallocated costs(1) | 1,177,319 | 1,055,412 | 735,604 | |||||||||
|
|
|
|
|
| |||||||
Income from operations | $ | 1,361,496 | $ | 1,136,468 | $ | 861,852 | ||||||
|
|
|
|
|
| |||||||
| (1) | Includes |
Geographic Area Information
Revenue and long-lived assets, by geographic area, are as follows:
| North America(2) | Europe(3) | Other(5)(6) | Total | |||||||||||||||||||||||||||||
2012 | ||||||||||||||||||||||||||||||||
Revenues(1) | $ | 5,836,258 | $ | 1,195,490 | $ | 314,724 | $ | 7,346,472 | ||||||||||||||||||||||||
Long-lived assets(4) | 52,149 | 8,696 | 910,641 | 971,486 | ||||||||||||||||||||||||||||
2011 | ||||||||||||||||||||||||||||||||
Revenues(1) | $ | 4,802,958 | $ | 1,097,475 | $ | 220,723 | $ | 6,121,156 | ||||||||||||||||||||||||
Long-lived assets(4) | 27,387 | 5,232 | 725,415 | 758,034 | ||||||||||||||||||||||||||||
| North America(2) | Europe(3) | Other(5)(6) | Total | |||||||||||||||||||||||||||||
2010 | ||||||||||||||||||||||||||||||||
Revenues(1) | $ | 3,582,719 | $ | 855,575 | $ | 154,095 | $ | 4,592,389 | $ | 3,582,719 | $ | 855,575 | $ | 154,095 | $ | 4,592,389 | ||||||||||||||||
Long-lived assets(4) | $ | 12,198 | $ | 3,687 | $ | 554,563 | $ | 570,448 | 12,198 | 3,687 | 554,563 | 570,448 | ||||||||||||||||||||
2009 | ||||||||||||||||||||||||||||||||
Revenues(1) | $ | 2,594,210 | $ | 606,804 | $ | 77,649 | $ | 3,278,663 | ||||||||||||||||||||||||
Long-lived assets(4) | $ | 9,042 | $ | 3,145 | $ | 469,329 | $ | 481,516 | ||||||||||||||||||||||||
2008 | ||||||||||||||||||||||||||||||||
Revenues(1) | $ | 2,228,355 | $ | 541,142 | $ | 46,807 | $ | 2,816,304 | ||||||||||||||||||||||||
Long-lived assets(4) | $ | 7,494 | $ | 2,470 | $ | 445,290 | $ | 455,254 | ||||||||||||||||||||||||
| (1) | Revenues are attributed to regions based upon customer location. |
| (2) | Substantially all relates to operations in the United States. |
| (3) | Includes revenue from operations in the United Kingdom of $764,936, $698,853, and $559,297 |
| (4) | Long-lived assets include property and equipment net of accumulated depreciation and amortization. |
| (5) | Includes our operations in Asia Pacific, Middle East and |
| (6) | Substantially all of these long-lived assets relate to operations in India. |
15. Quarterly Financial Data (Unaudited)
Summarized quarterly results for the two years ended December 31, 20102012 are as follows:
| Three Months Ended | Full Year | Three Months Ended | ||||||||||||||||||||||||||||||||||||||
2010 | March 31 | June 30 | September 30 | December 31 | ||||||||||||||||||||||||||||||||||||
2012 | March 31 | June 30 | September 30 | December 31 | Full Year | |||||||||||||||||||||||||||||||||||
Revenues | $ | 959,720 | $ | 1,105,154 | $ | 1,216,913 | $ | 1,310,602 | $ | 4,592,389 | $ | 1,711,349 | $ | 1,795,220 | $ | 1,891,688 | $ | 1,948,215 | $ | 7,346,472 | ||||||||||||||||||||
Cost of revenues (exclusive of depreciation and amortization expense shown separately below) | 555,904 | 641,019 | 699,623 | 758,023 | 2,654,569 | 984,520 | 1,030,889 | 1,111,898 | 1,150,934 | 4,278,241 | ||||||||||||||||||||||||||||||
Selling, general and administrative expenses | 194,993 | 234,547 | 262,632 | 279,921 | 972,093 | 374,178 | 396,771 | 384,951 | 401,746 | 1,557,646 | ||||||||||||||||||||||||||||||
Depreciation and amortization expense | 25,806 | 23,673 | 26,359 | 28,037 | 103,875 | 34,752 | 35,602 | 39,453 | 39,282 | 149,089 | ||||||||||||||||||||||||||||||
Income from operations | 183,017 | 205,915 | 228,299 | 244,621 | 861,852 | 317,899 | 331,958 | 355,386 | 356,253 | 1,361,496 | ||||||||||||||||||||||||||||||
Net income | $ | 151,500 | $ | 172,175 | $ | 203,699 | $ | 206,166 | $ | 733,540 | 243,651 | 251,932 | 276,901 | 278,779 | 1,051,263 | |||||||||||||||||||||||||
Basic EPS | $ | 0.51 | $ | 0.57 | $ | 0.68 | $ | 0.68 | $ | 2.44 | (1) | $ | 0.80 | $ | 0.83 | $ | 0.93 | $ | 0.93 | $ | 3.49 | |||||||||||||||||||
Diluted EPS | $ | 0.49 | $ | 0.56 | $ | 0.66 | $ | 0.66 | $ | 2.37 | (1) | $ | 0.79 | $ | 0.82 | $ | 0.91 | $ | 0.92 | $ | 3.44 | |||||||||||||||||||
| Three Months Ended | Full Year | |||||||||||||||||||
2009 | March 31 | June 30 | September 30 | December 31 | ||||||||||||||||
Revenues | $ | 745,862 | $ | 776,592 | $ | 853,488 | $ | 902,721 | $ | 3,278,663 | ||||||||||
Cost of revenues (exclusive of depreciation and amortization expense shown separately below) | 419,708 | 433,340 | 475,599 | 520,796 | 1,849,443 | |||||||||||||||
Selling, general and administrative expenses | 166,872 | 170,003 | 193,806 | 190,678 | 721,359 | |||||||||||||||
Depreciation and amortization expense | 21,152 | 21,579 | 22,301 | 24,339 | 89,371 | |||||||||||||||
Income from operations | 138,130 | 151,670 | 161,782 | 166,908 | 618,490 | |||||||||||||||
Net income | $ | 113,132 | $ | 141,255 | $ | 136,572 | $ | 144,004 | $ | 534,963 | ||||||||||
Basic EPS | $ | 0.39 | $ | 0.48 | $ | 0.47 | $ | 0.49 | $ | 1.82 | (1) | |||||||||
Diluted EPS | $ | 0.38 | $ | 0.47 | $ | 0.45 | $ | 0.47 | $ | 1.78 | (1) | |||||||||
| Three Months Ended |
| |||||||||||||||||||
2011 | March 31 | June 30 | September 30 | December 31 | Full Year | |||||||||||||||
Revenues | $ | 1,371,253 | $ | 1,485,242 | $ | 1,600,954 | $ | 1,663,707 | $ | 6,121,156 | ||||||||||
Cost of revenues (exclusive of depreciation and amortization expense shown separately below) | 782,176 | 860,871 | 924,886 | 970,689 | 3,538,622 | |||||||||||||||
Selling, general and administrative expenses | 296,330 | 326,718 | 353,161 | 352,456 | 1,328,665 | |||||||||||||||
Depreciation and amortization expense | 27,382 | 27,695 | 29,905 | 32,419 | 117,401 | |||||||||||||||
Income from operations | 265,365 | 269,958 | 293,002 | 308,143 | 1,136,468 | |||||||||||||||
Net income | 208,327 | 208,045 | 227,119 | 240,127 | 883,618 | |||||||||||||||
Basic EPS | $ | 0.69 | $ | 0.68 | $ | 0.75 | $ | 0.79 | $ | 2.91 | ||||||||||
Diluted EPS | $ | 0.67 | $ | 0.67 | $ | 0.73 | $ | 0.78 | $ | 2.85 | ||||||||||
Cognizant Technology Solutions Corporation
Valuation and Qualifying Accounts
For the Years Ended December 31, 2010, 20092012, 2011, and 20082010
(Dollars in Thousands)
Description | Balance at Beginning of Period | Charged to Costs and Expenses | Charged to Other Accounts | Deductions/ Other | Balance at End of Period | Balance at Beginning of Period | Charged to Costs and Expenses | Charged to Other Accounts | Deductions /Other | Balance at End of Period | ||||||||||||||||||||||||||||||
Accounts receivable allowance for doubtful accounts: | ||||||||||||||||||||||||||||||||||||||||
2012 | $ | 24,658 | $ | 5,051 | $ | — | $ | 3,893 | $ | 25,816 | ||||||||||||||||||||||||||||||
2011 | $ | 20,991 | $ | 4,516 | $ | — | $ | 849 | $ | 24,658 | ||||||||||||||||||||||||||||||
2010 | $ | 16,465 | $ | 5,950 | $ | — | $ | 1,424 | $ | 20,991 | $ | 16,465 | $ | 5,950 | $ | — | $ | 1,424 | $ | 20,991 | ||||||||||||||||||||
2009 | 13,441 | 3,347 | — | 323 | 16,465 | |||||||||||||||||||||||||||||||||||
2008 | 6,339 | 8,473 | — | 1,371 | 13,441 | |||||||||||||||||||||||||||||||||||
Warranty accrual: | ||||||||||||||||||||||||||||||||||||||||
2012 | $ | 12,291 | $ | 17,063 | $ | — | $ | 14,514 | $ | 14,840 | ||||||||||||||||||||||||||||||
2011 | $ | 9,094 | $ | 14,078 | $ | — | $ | 10,881 | $ | 12,291 | ||||||||||||||||||||||||||||||
2010 | $ | 6,575 | $ | 10,384 | $ | — | $ | 7,865 | $ | 9,094 | $ | 6,575 | $ | 10,384 | $ | — | $ | 7,865 | $ | 9,094 | ||||||||||||||||||||
2009 | 5,669 | 7,588 | — | 6,682 | 6,575 | |||||||||||||||||||||||||||||||||||
2008 | 4,234 | 6,470 | — | 5,035 | 5,669 | |||||||||||||||||||||||||||||||||||
Valuation allowance—deferred income tax assets: | ||||||||||||||||||||||||||||||||||||||||
2012 | $ | 10,365 | $ | 1,399 | $ | — | $ | 5,476 | $ | 6,288 | ||||||||||||||||||||||||||||||
2011 | $ | 10,684 | $ | 470 | $ | — | $ | 789 | $ | 10,365 | ||||||||||||||||||||||||||||||
2010 | $ | 10,230 | $ | 1,362 | $ | — | $ | 908 | $ | 10,684 | $ | 10,230 | $ | 1,362 | $ | — | $ | 908 | $ | 10,684 | ||||||||||||||||||||
2009 | 7,883 | 2,362 | — | 15 | 10,230 | |||||||||||||||||||||||||||||||||||
2008 | 5,887 | 3,606 | (1,225 | ) | 385 | 7,883 | ||||||||||||||||||||||||||||||||||
F-34F-33