| x | ANNUAL REPORT PURSUANT TO SECTION 13 OR |
OR
| ¨ | TRANSITION REPORT PURSUANT TO SECTION 13 OR |
| Oklahoma | 73-0767549 | |
|
| |
| (Address of principal executive offices) | (Zip Code) | |
(405) 234-9000
| Title of | Name of | |
| Common Stock, $0.01 par value | New York Stock Exchange | |
| Large accelerated filer | Accelerated filer | ¨ | ||||
| Non-accelerated filer | ¨
| Smaller reporting company | ¨ | |||
As of February 18, 2011, the registrant had 170,405,395
were outstanding on February 17, 2014.
| ||||||
| Item 1. | ||||||
| Item 1A. | ||||||
| Item 1B. | ||||||
| Item 2. | ||||||
| Item 3. | ||||||
| Item 4. | ||||||
| ||||||
| ||||||
| ||||||
| ||||||
| ||||||
Item 5. | ||||||
Item 6. | ||||||
Item 7. | ||||||
Item 7A. | ||||||
Item 8. | ||||||
Item 9. | ||||||
| Item 9A. | ||||||
| Item 9B. | ||||||
| ||||||
| ||||||
Item 10. | ||||||
Item 11. | ||||||
Item 12. | ||||||
Item 13. | ||||||
Item 14. | ||||||
Item 15. | ||||||
our business strategy; our future operations; our crude oil and natural gas our technology; the amount, nature and timing of capital expenditures; estimated revenues, expenses and results of operations; drilling and completing of wells; marketing of crude oil and natural gas; transportation of crude oil, natural gas liquids, and natural gas to markets; costs of exploiting and developing our properties and conducting other operations; our financial position; general economic conditions; credit markets;Basin”basin” A large natural depression on the earth’s surface in which sediments generally brought by water accumulate.unit.unit, which represents the amount of energy needed to heat one pound of water by one degree Fahrenheit and can be used to describe the energy content of fuels.Completion”completion” The process of treating a drilled well followed by the installation of permanent equipment for the production of crude oil and/or natural gas, or in the case of a dry hole, the reporting of abandonment to the appropriate agency.gas.Conventionalconventional play” An area that is believed to be capable of producing crude oil and natural gas occurring in discrete accumulations in structural and stratigraphic traps.Developedde-risked” Refers to acreage and locations in which the Company believes the geological risks and uncertainties related to recovery of crude oil and natural gas have been reduced as a result of drilling operations to date. However, only a portion of such acreage and locations have been assigned proved undeveloped reserves and ultimate recovery of hydrocarbons from such acreage and locations remains subject to all risks of recovery applicable to other acreage. that are allocated or assignable to productive wells or wells capable of production.Developmentdevelopment well” A well drilled within the proved area of a crude oil or natural gas reservoir to the depth of a stratigraphic horizon known to be productive.Drydry gas” Refers to natural gas that remains in a gaseous state in the reservoir and does not produce large quantities of liquid hydrocarbons when brought to the surface. Also may refer to gas that has been processed or treated to remove all natural gas liquids.TM™” A Continental Resources, Inc. trademark which describes a well site layout approved by the North Dakota Industrial Commission which allows for drilling fourmultiple wells from a single pad resulting in less environmental impact and lower drilling and completion costs.“Enhanced recovery” The recovery of crude oil and natural gas through the injection of liquids or gases into the reservoir, supplementing its natural energy. Enhanced recovery methods are oftensometimes applied when production slows due to depletion of the natural pressure.Exploratoryexploratory well” A well drilled to find a new field or to find a new reservoir in a field previously found to be productive of crude oil or natural gas in another reservoir.Field”field” An area consisting of a single reservoir or multiple reservoirs all grouped on, or related to, the same individual geological structural feature or stratigraphic condition. The field name refers to the surface area, although it may refer to both the surface and the underground productive formations.Formation”formation” A layer of rock which has distinct characteristics that differs from nearby rock.Heldheld by production” or“HBP” Refers to a mineralan oil and gas lease in which an entity is allowed to operate a property ascontinued into effect into its secondary term for so long as a producing oil and/or gas well is located on any portion of the property produces a minimum paying quantity of crude oilleased premises or natural gas.lands pooled therewith.Horizontalhorizontal drilling” A drilling technique used in certain formations where a well is drilled vertically to a certain depth and then drilled at a right anglehorizontally within a specified interval.Injectionhydraulic fracturing” A process involving the high pressure injection of water, sand and additives into rock formations to stimulate crude oil and natural gas production.i��One million cubic feet of natural gas.Net acres” The percentage of total acres an owner has out ofpad drilling" or "pad development" Describes a particular number of acres,well site layout which allows for drilling multiple wells from a single pad resulting in less environmental impact and lower drilling and completion costs. Also may be referred to as ECO-Pad drilling or a specified tract. An owner who has a 50% interest in 100 acres owns 50 net acres.development.Play”play”A term applied to a portion of the exploration and production cycle following the identification by geologists and geophysicists of areas with potential crude oil and natural gas reserves.Productiveproductive well” A well that is found to be capable of producing hydrocarbons in sufficient quantities such that proceeds from the sale of the production exceed production expenses and taxes.Prospect”prospect” A potential geological feature or formation which geologists and geophysicists believe may contain hydrocarbons. A prospect can be in various stages of evaluation, ranging from a prospect that has been fully evaluated and is ready to drill to a prospect that will require substantial additional seismic data processing and interpretation.Provedproved reserves” The quantities of crude oil and natural gas, which, by analysis of geoscience and engineering data, can be estimated with reasonable certainty to be economically producible from a given date forward, from known reservoirs and under existing economic conditions, operating methods, and government regulations prior to the time at which contracts providing the right to operate expire, unless evidence indicates that renewal is reasonably certain.Provedproved developed reserves” Reserves that can be expected to be recovered through existing wells with existing equipment and operating methods.Provedproved undeveloped reserves (“reserves” or “PUD”)” Proved reserves that are expected to be recovered from new wells on undrilled acreage or from existing wells where a relatively major expenditure is required for recompletion.“Reservoir” A porous and permeable underground formation containing a natural accumulation of producible crude oil and/or natural gas that is confined by impermeable rock or water barriers and is separate from other reservoirs.Royaltyresource play” Refers to an expansive contiguous geographical area with prospective crude oil and/or natural gas reserves that has the potential to be developed uniformly with repeatable commercial success due to advancements in horizontal drilling and multi-stage fracturing technologies. that are produced from a crude oil or natural gas property. A royalty interest owner does not bear any of the exploration, development, or operating expenses associated with drilling and producing a crude oil or natural gas property.Spacing”SCOOP” Refers to the South Central Oklahoma Oil Province, a term we use to describe an emerging area of crude oil and liquids-rich natural gas properties located in the Anadarko basin of south central Oklahoma.Standardizedstandardized measure” Discounted future net cash flows estimated by applying the 12-month unweighted arithmetic average of the first-day-of-the-month commodity prices for the period of January to December (for year-end 2010 and 2009) or year-end prices (for 2008 and prior) to the estimated future production of year-end proved reserves. Future cash inflows are reduced by estimated future production and development costs based on period-end costs to determine pre-tax cash inflows. Future income taxes, if applicable, are computed by applying the statutory tax rate to the excess of pre-tax cash inflows over ourthe tax basis in the crude oil and natural gas properties. Future net cash inflows after income taxes are discounted using a 10% annual discount rate.Step-outstep-out well” or“Stepstep outs”A well drilled beyond the proved boundaries of a field to investigate a possible extension of the field.iiUnconventionalunconventional play” An area that is believed to be capable of producing crude oil and natural gas occurring in accumulations that are regionally extensive, but require recently developed technologies to achieve profitability.may lack readily apparent traps, seals and discrete hydrocarbon-water boundaries that typically define conventional reservoirs. These areas tend to have low permeability and may be closely associated with source rock, as is the case with oil and gas shale, tight oil and gas sands and coalbed methane.methane, and generally require horizontal drilling, fracture stimulation treatments or other special recovery processes in order to achieve economic production.Undevelopedundeveloped acreage” Lease acreage on which wells have not been drilled or completed to a point that would permit the production of commercial quantities of crude oil andand/or natural gas.Unit”unit” The joining of all or substantially all interests in a reservoir or field, rather than a single tract, to provide for development and operation without regard to separate property interests. Also, the area covered by a unitization agreement.Waterflood”waterflood” The injection of water into a crude oil reservoir to “push” additional crude oil out of the reservoir rock and into the wellbores of producing wells. Typically an enhanced recovery process.Wellbore”wellbore” The hole drilled by the bit that is equipped for crude oil or natural gas production on a completed well. Also called a well or borehole.Workingworking interest” The right granted to the lessee of a property to explore for and to produce and own crude oil, natural gas, or other minerals. The working interest owners bear the exploration, development, and operating costs on either a cash, penalty, or carried basis.Regarding Forward-Looking StatementsCertain statements and information in this report may constitute “forward-looking statements” withinfor the meaningPurpose of the “Safe Harbor” Provisions of the Private Securities Litigation Reform Act of 1995.1995“project”“project,” “budget,” “plan,” “continue,” “potential,” “guidance,” “strategy” and similar expressions are intended to identify forward-looking statements, although not all forward-looking statements contain such identifying words. Forward-looking statements are based on the Company’s current expectations and assumptions about future events and currently available information as to the outcome and timing of future events. Although the Company believes the expectations reflected in the forward-looking statements are reasonable and based on reasonable assumptions, no assurance can be given that such expectations will be correct or achieved or that the assumptions are accurate. When considering forward-looking statements, you should keep in mind the risk factors and other cautionary statements described under the headingPart I, Item 1A. Risk Factors included in this report.report, quarterly reports, registration statements filed from time to time with the SEC, and other announcements we make from time to time.about our:about:reserves;technology;financial strategy;prices;gas;gas and flaring activities;competition and government regulations;acquisitions;acquisitions and dispositions;
iii
our liquidity and access to capital;
the impact of governmental policies, laws and regulations, as well as regulatory and legal proceedings involving us and of scheduled or potential regulatory or legal changes;
uncertainty regarding our future operating results; and
plans, objectives, expectations and intentions contained in this report that are not historical.
crude oil and natural gas revenues. Crude oil represents approximately 68% of our estimated proved reserves as of December 31, 2013. In October 2012, we announced a five-year growth plan to triple our production and proved reserves from year-end 2012 to year-end 2017. 2012. North Region: Bakken field North Dakota Bakken Montana Bakken Red River units Cedar Hills Other Red River units Other South Region: Oklahoma Woodford Anadarko Woodford Arkoma Woodford Other East Region Total North Region: Bakken field North Dakota Bakken Montana Bakken Red River units Niobrara Colorado/Wyoming Other South Region: Oklahoma Woodford Anadarko Woodford Arkoma Woodford Southern Oklahoma Other East Region Total business strategy: Proved developed producing Proved developed non-producing Proved undeveloped Total proved reserves Standardized Measure North Region: Bakken field North Dakota Bakken Montana Bakken Red River units Cedar Hills Other Red River units Other South Region: Oklahoma Woodford Anadarko Woodford Arkoma Woodford Other East Region Total 2013. MBoe Proved reserves at beginning of year Revisions of previous estimates Extensions, discoveries and other additions Production Sales of minerals in place Purchases of minerals in place Proved reserves at end of year Summary of Crude Oil and Natural Gas Properties and Projects for a discussion of our 2013 drilling plays at competitive terms. Refer to Exhibit 99 included with this Annual Report on Form 10-K for further discussion of the qualifications of Ryder Scott personnel. reserves. North Region: Bakken field North Dakota Bakken Montana Bakken Red River units Niobrara Colorado/Wyoming Other South Region: Oklahoma Woodford Anadarko Woodford Arkoma Woodford Southern Oklahoma Other East Region Total 2013: North Region: Bakken field North Dakota Bakken Montana Bakken Red River units Niobrara Colorado/Wyoming Other South Region: Oklahoma Woodford Anadarko Woodford Arkoma Woodford Southern Oklahoma Other East Region Total dates or the leases are renewed. Exploratory wells: Crude oil Natural gas Dry holes Total exploratory wells Development wells: Crude oil Natural gas Dry holes Total development wells Total wells ongoing. drilled in exit 2014 at 19 rigs. Our drilling will focus on additional infill development of Elm Coulee and continued expansion of the Elm Coulee field onto our undeveloped acreage north of the field. As of December 31, 2013, we had 4 rigs operating in the Montana Bakken and plan to exit 2014 with the same number of rigs. 2014 and beyond. Net production volumes: Crude oil (MBbls)(1) North Dakota Bakken Arkoma Woodford Total Company Natural gas (MMcf) North Dakota Bakken Arkoma Woodford Total Company Crude oil equivalents (MBoe) Total Company Average sales prices:(2) Crude oil ($/Bbl) North Dakota Bakken Arkoma Woodford Total Company Natural gas ($/Mcf) North Dakota Bakken Arkoma Woodford Total Company Crude oil equivalents ($/Boe) Total Company Costs and expenses:(2) Production expenses ($/Boe) North Dakota Bakken Arkoma Woodford Total Company Production taxes and other expenses ($/Boe) General and administrative expenses ($/Boe)(3) DD&A expense ($/Boe) North Region: Bakken field North Dakota Bakken Montana Bakken Red River units Cedar Hills Other Red River units Other South Region: Oklahoma Woodford Anadarko Woodford Arkoma Woodford Other East Region Total 2013: North Region: Bakken field North Dakota Bakken Montana Bakken Red River units Other South Region: Oklahoma Woodford Anadarko Woodford Arkoma Woodford Other East Region Total 2013: continue. crude oil and natural gas liquids FERC or interested persons may challenge existing or changed rates or services. Intrastate crude oil and NGL pipeline transportation rates for resale in interstate commerce, has issued blanket authorizations for all gas resellers subject to FERC regulation, except interstate pipelines, to resell natural gas at market prices. However, either the U.S. Congress or the FERC (with respect to the resale of gas in interstate commerce) could re-impose price controls in the future. The U.S. Department of Energy (“U.S. DOE”) regulates the terms and conditions for the exportation and importation of natural gas (including liquefied natural gas or “LNG”). U.S. law provides for very limited regulation of exports to and imports from any country that has entered into a Free Trade Agreement (“FTA”) with the United States that provides for national treatment of trade in natural gas; however, the U.S. DOE’s regulation of imports and exports from and to countries without such FTAs is more comprehensive. The FERC also regulates the construction and operation of import and export facilities, including LNG terminals. Regulation of imports and exports and related facilities may materially affect natural gas markets and sales prices. production regulations affecting our industry operations to determine if any disclosure or reporting obligations arise under the conflict mineral rules. require the acquisition of various permits before drilling commences; restrict the types, quantities and concentration of various substances that can be released into the environment in connection with crude oil and natural gas drilling, production and transportation activities; limit or prohibit drilling activities on certain lands lying within wilderness, wetlands and other protected areas including areas containing endangered species of plants and animals; and require remedial measures to mitigate pollution from former and ongoing operations, such as requirements to close pits and plug abandoned wells. program to reduce U.S. emissions of greenhouse gases, including carbon dioxide and methane. Under In addition, while the prospect for such cap-and-trade legislation by the U.S. Congress remains uncertain, several states have adopted, or are in the process of adopting, similar cap-and-trade programs. (405) 234-9000. worldwide and regional economic conditions impacting the global supply and demand for crude oil and natural gas; the actions of the Organization of Petroleum Exporting the price and quantity of imports of foreign crude oil and natural gas; political conditions in or affecting other crude oil-producing and natural gas-producing the level of national and global crude oil and natural gas exploration and production; the level of national and global crude oil and natural gas inventories; localized supply and demand changes in supply, demand, and refinery capacity for various grades of crude oil and natural gas; technological advances affecting energy consumption; and the price and availability of alternative sources. economically produce. our financial condition and results of operations. reserves and production. the amount of our proved reserves; the volume of crude oil and natural gas we are able to produce and sell from existing wells; the prices at which our ability to acquire, locate and produce new reserves; and the ability and willingness of our banks to operations and our ability to achieve our growth plan. spillage or mishandling of crude oil, natural gas, brine, well fluids, hydraulic fracturing fluids, toxic gas or other pollutants by third party service providers or us; Reserve estimates depend on many assumptions that may turn out to be inaccurate. Any material inaccuracies in these reserve estimates or underlying assumptions will materially affect the quantities and present value of our reserves. The Company's current estimates of reserves could change, potentially in material amounts, in the future. the actual cost and timing of development and production expenditures; the amount and timing of actual production; changes in governmental regulations or taxation. $1.3 billion. environmental hazards, such as uncontrollable flows of crude oil, natural gas, brine, well fluids, hydraulic fracturing fluids, toxic gas or other abnormally pressured formations; mechanical difficulties, such as stuck oilfield drilling and service tools and casing collapse; fires, explosions and ruptures of pipelines; loss of product or property damage occurring as a result of transfer to a rail car or train derailments; spillage or mishandling of crude oil, natural injury or loss of life; damage to pollution and other environmental damage; regulatory investigations and penalties; suspension of our operations; and repair and remediation costs. parties, and on the availability of rail transportation We presently transport a significant portion of operated crude oil production from our North region to market centers by rail, with approximately 70% of such production being shipped by rail in December 2013. See the subsequent risk factor titled See emissions, which could have a material adverse effect on our business, financial condition and results of operations. growth plan. fines and other liabilities. Those companies may be able to pay more for productive crude oil and natural gas properties and exploratory prospects and to evaluate, bid for and purchase a greater number of properties and prospects than our financial or personnel resources permit. In addition, companies may be able to offer better compensation packages to attract and retain qualified personnel than we are able to offer. The cost to attract and retain qualified personnel has increased in recent years due to competition and may increase substantially in the future. We may not be able to compete successfully in the future in acquiring prospective reserves, developing reserves, marketing hydrocarbons, attracting and retaining quality personnel and raising additional capital, which could have a material adverse effect on our financial condition and results of operations. our investments, loans and advances and the paying of dividends and other restricted payments; our incurrence of additional indebtedness; the granting of liens, other than liens created pursuant to the mergers, consolidations and sales of all or a substantial part of our business or properties; the hedging, forward sale or swap of our production of crude oil or natural gas or other commodities; the sale of assets. incur, assume or guarantee additional indebtedness or issue redeemable stock; pay dividends on stock, repurchase stock or redeem subordinated debt; make certain investments; enter into certain transactions with affiliates; create certain liens on our assets; sell or otherwise dispose of certain assets, including capital stock of subsidiaries; restrict dividends, loans or other asset transfers from our restricted subsidiaries; enter into new lines of business; and consolidate with or merge with or into, or sell all or substantially all of our properties to another person. indebtedness, which would adversely affect our financial condition and results of operations. production is less than the volume covered by the derivative instruments; the there is an increase in the differential between the underlying price in the derivative instrument and actual prices received. Our decision on the quantity and price at which we choose to hedge our future production is based in part on our view of current and future market conditions and our desire to stabilize cash flows necessary for the development of our crude oil and natural gas reserves. As part of our risk management program, we have hedged a significant portion of our forecasted production. We utilize a combination of derivative contracts based on West Texas Intermediate crude oil pricing, Inter-Continental Exchange pricing for Brent crude oil, and Henry Hub pricing for natural gas. We believe our derivative contracts provide relevant protection from price fluctuations in the U.S. markets where we deliver and sell our production. The pricing for Brent crude oil is believed to be a better reflection of the sales prices realized in certain U.S. market centers. However, in the event Brent prices increase significantly, the prices realized in those U.S. market centers may no longer be reflective of Brent prices. In such a circumstance, we may incur significant cash losses upon settling our crude oil derivative instruments. Such losses may be incurred without seeing a corresponding increase in revenues from higher realized prices on our physical sales of crude oil. recoverable reserves; future crude oil and natural gas prices and their future development costs, operating costs and property taxes; and potential environmental and other liabilities. flows due to the preliminary status of the matter, the complexity and number of legal and factual issues presented by the matter and uncertainties with respect to, among other things, the nature of the claims and defenses, the potential size of the class, the scope and types of the properties and agreements involved, the production years involved, and the ultimate potential outcome of the matter. The class has not been certified. Plaintiffs have indicated that if the class is certified they may seek damages in excess of $165 million which may increase with the passage of time, a majority of which would be comprised of interest. The Company disputes plaintiffs’ claims, disputes that the case meets the requirements for a class action and is vigorously defending the case. that these forward-looking statements are subject to all of the risks and uncertainties, most of which are difficult to predict and many of which are beyond our control, incident to the exploration for, and the development, production, and sale of, crude oil and natural gas. These risks include, but are not limited to, commodity price volatility, inflation, lack of availability of drilling, completion and production equipment and services and transportation infrastructure, environmental risks, drilling andiv historical consolidated financial statements and the notes to those historical consolidated financial statements included elsewhere in this report. Unless the context otherwise requires, references in this report to “Continental Resources,” “we,” “ us,“us,” “our,” “ours” or “the Company” refer to Continental Resources, Inc. and its subsidiary.Beginning in 2009, we changed our reporting regions from Rockies, Mid-Continent and Gulf Coast to North, South and East. The North region consists of properties north of Kansas and west of the Mississippi river and includes North Dakota Bakken, Montana Bakken, the Red River units and the Niobrara play in Colorado and Wyoming. The South region includes Kansas and all properties south of Kansas and west of the Mississippi river including the Arkoma Woodford and Anadarko Woodford plays in Oklahoma. The East region contains properties east of the Mississippi river including the Illinois Basin and Michigan.Item 1. Business operationsproperties in the North, South and East regions of the United States. The North region consists of properties north of Kansas and west of the Mississippi River and includes North Dakota Bakken, Montana Bakken, and the Red River units. The South region includes Kansas and all properties south of Kansas and west of the Mississippi River including various plays in the South Central Oklahoma Oil Province (“SCOOP”), Northwest Cana and Arkoma areas of Oklahoma. The East region is comprised of undeveloped leasehold acreage east of the Mississippi River.1993,1989, our activities and growth remained focused primarily in Oklahoma. In 1993,1989, we expanded our activity into the North region. Our operations are now geographically concentrated in the North region, with that region comprising approximately 77% of our crude oil and natural gas production and approximately 86% of our crude oil and natural gas revenues for the year ended December 31, 2013. Approximately 70%76% of our estimated proved reserves as of December 31, 20102013 are located in the North region.completed an initial public offeringhave focused our operations on the exploration and development of crude oil since the 1980s. For the year ended December 31, 2013, crude oil accounted for approximately 71% of our common stock in 2007,total production and approximately 87% of our common stock trades on the New York Stock Exchange under the ticker symbol “CLR”.stimulationstimulation) and enhanced recovery technologies allowsallow us to economically develop and produce crude oil and natural gas reserves from unconventional formations. As a result of these efforts, we have grown substantially through the drill bit, adding 287.01,046 MMBoe of proved crude oil and natural gas reserves through extensions and discoveries from January 1, 20062009 through December 31, 20102013 compared to 3.085 MMBoe added through proved reserve acquisitions during that same period.2010,2013, our estimated proved reserves were 364.71,084.1 MMBoe, with estimated proved developed reserves of 140.4406.8 MMBoe, or 38% of our total estimated proved reserves. Crude oil comprised 62% of our total estimated proved reserves as of December 31, 2010. For the year ended December 31, 2010,2013, we generated crude oil and natural gas revenues of $948.5 million$3.6 billion and operating cash flows of $653.2 million.$2.6 billion. For the year andended December 31, 2013, daily production averaged 135,919 Boe per day, a 39% increase over average production of 97,583 Boe per day for the year ended December 31, 2012. Average daily production for the quarter ended December 31, 2010, daily production averaged 43,3182013 increased 35% to 144,254 Boe per day and 48,034from 106,831 Boe per day respectively. This represents growth of 16% and 27% as compared tofor the year and quarter ended December 31, 2009, when daily production averaged 37,324 Boe per day and 37,747 Boe per day, respectively.following table below summarizes our total estimated proved reserves, PV-10 and net producing wells as of December 31, 2010,2013, average daily production for the three monthsquarter ended December 31, 20102013 and the reserve-to-production index in our principal regions. The PV-10 values shown below are not intended to represent the fair market value of our crude oil and natural gas properties. There are numerous uncertainties inherent in estimating quantities of crude oil and natural gas reserves. See “Critical Accounting Policies and Estimates” in Item 7. Management’s Discussion and Analysis of Financial Condition and Results of Operations of this report for further discussion of uncertainties inherent to the reserve estimates.20102013 are based primarily on a reserve report prepared by our independent reserve engineers, Ryder Scott Company, L.P (“Ryder Scott”). In preparing its report, Ryder Scott evaluated properties representing approximately 94%99% of our PV-10, 97%99% of our proved crude oil reserves, and 94% of our proved natural gas reserves as of December 31, 2010.2013. Our internal technical staff evaluated the remaining properties. Our estimated proved reserves and related future net revenues, PV-10 and Standardized Measure at December 31, 20102013 were determined using the 12-month unweighted arithmetic average of the first-day-of-the-month commodity prices for the period of January 20102013 through December 2010,2013, without giving effect to derivative transactions, and were held constant throughout the lifelives of the properties. These prices were $79.43$4.38$3.67 per MMBtu for natural gas ($71.9291.50 per Bbl for crude oil and $5.07$5.36 per Mcf for natural gas net ofadjusted for location and quality differentials). At December 31, 2010 Average daily
production for
fourth quarter
2010
(Boe per day) Percent
of
total Annualized
reserve/
production
index(2) Proved
reserves
(MBoe) Percent
of
total PV-10(1)
(in thousands) Net
producing
wells 158,042 43.3 % $ 1,982,573 183 17,834 37.1 % 24.3 40,032 11.0 % 632,576 125 4,686 9.8 % 23.4 38,645 10.6 % 981,143 129 10,862 22.6 % 9.7 15,449 4.2 % 297,737 106 3,034 6.3 % 14.0 3,466 1.0 % 54,798 220 1,207 2.5 % 7.9 34,099 9.4 % 204,930 13 1,705 3.6 % 54.8 62,347 17.1 % 271,749 53 4,403 9.2 % 38.8 8,495 2.3 % 101,543 293 2,989 6.2 % 7.8 4,137 1.1 % 105,165 544 1,314 2.7 % 8.6 364,712 100.0 % $ 4,632,214 1,666 48,034 100.0 % 20.8 December 31, 2013 Average daily
production for
fourth quarter
2013
(Boe per day) Annualized
reserve/production
index (2) Proved
reserves
(MBoe) Percent
of total PV-10 (1)
(In millions) Net
producing
wells Percent
of total North Region: Bakken field North Dakota Bakken 688,741 63.5 % $ 13,093 779 80,374 55.7 % 23.5 Montana Bakken 52,401 4.8 % 1,437 233 12,961 9.0 % 11.1 Red River units Cedar Hills 54,191 5.0 % 1,522 130 10,498 7.3 % 14.1 Other Red River units 22,419 2.1 % 427 131 3,900 2.7 % 15.7 Other 1,884 0.2 % 32 16 812 0.6 % 6.4 South Region: SCOOP 214,667 19.8 % 3,286 74 23,754 16.5 % 24.8 Northwest Cana 29,827 2.8 % 198 73 6,696 4.6 % 12.2 Arkoma Woodford 11,103 1.0 % 69 59 2,769 1.9 % 11.0 Other 8,892 0.8 % 111 277 2,490 1.7 % 9.8 Total 1,084,125 100.0 % $ 20,175 1,772 144,254 100.0 % 20.6 (1) PV-10 is a non-GAAP financial measure and generally differs from Standardized Measure, the most directly comparable GAAP financial measure, because it does not include the effects of income taxes on future net revenues. The Standardized Measure at December 31, 2010 is $3.8 billion, a $0.8 billion difference from PV-10 becauserevenues of the tax effect.approximately $3.9 billion. Neither PV-10 nor Standardized Measure represents an estimate of the fair market value of our crude oil and natural gas properties. We and others in the crude oil and natural gas industry use PV-10 as a measure to compare the relative size and value of proved reserves held by companies without regard to the specific income tax characteristics of such entities.(2) The Annualized Reserve/Production Index is the number of years that estimated proved reserves would last assuming current production continued at the same rate. This index is calculated by dividing annualized fourth quarter 20102013 production into the estimated proved reserve quantityvolumes at December 31, 2010.2013.20102013 and the budgeted amounts we plan to spend on exploratory and development drilling, capital workovers, and facilities in 2011: 2011 Plan Developed acres Undeveloped acres Gross wells
planned
for drilling Capital
expenditures
(in millions) (1) Gross Net Gross Net 264,299 119,405 1,021,366 504,244 514 $ 819 86,808 66,971 224,704 165,316 16 75 149,994 132,247 — — 15 58 — — 103,148 71,712 5 20 69,068 52,698 308,470 171,117 — 2 55,320 34,326 350,255 233,216 99 230 100,430 22,749 47,297 20,864 14 9 — — 36,440 11,039 — — 99,597 47,250 80,146 52,193 3 9 44,720 42,687 172,322 140,734 21 5 870,236 518,333 2,344,148 1,370,435 687 $ 1,227 2014 Plan Developed acres Undeveloped acres Gross wells
planned for
drilling Capital
expenditures (1)
(in millions) Gross Net Gross Net North Region: Bakken field North Dakota Bakken 900,678 530,682 504,898 378,370 802 $ 2,233 Montana Bakken 159,943 135,426 214,358 165,343 68 413 Red River units 156,703 137,294 — — 16 50 Niobrara - Colorado/Wyoming 12,087 8,529 126,662 69,526 — — Other 22,194 7,220 235,931 179,265 6 40 South Region: SCOOP 74,019 48,990 603,665 354,864 159 876 Northwest Cana 120,668 73,777 110,120 71,314 — 13 Arkoma Woodford 110,973 26,359 4,568 434 — — Other 100,710 46,008 197,434 167,506 9 65 East Region — — 152,762 144,363 — — Total 1,657,975 1,014,285 2,150,398 1,530,985 1,060 $ 3,690 (1) CapitalThe capital expenditures budgeted for 20112014 as reflected above include amounts for drilling, capital workovers and facilities and exclude budgeted amounts for land of $108$300 million, seismic of $15$30 million, and $6$30 million for vehicles, computers and other equipment. We expect our cash flows from operations and the availability under our revolving credit facility will be sufficient to meet our capital expenditure needs. The actual amount and timing of our capitalPotential acquisition expenditures may differ materially from our estimates as a result of, among other things, available cash flows, actual drilling results, the availability of drilling rigs and other services and equipment, and regulatory, technological and competitive developments. Further, a decline in crude oil and natural gas prices could cause us to curtail our actual capital expenditures. Conversely, an increase in commodity prices could result in increased capital expenditures.are not budgeted.1980’s1980s we began to believe that the valuation potential for crude oil exceeded that of natural gas. Accordingly, we began to shift our reserve and production profiles towardstoward crude oil. As of December 31, 2010,2013, crude oil comprises 62%comprised 68% of our total proved reserves and 75%71% of our 20102013 annual production. Although we do pursue liquids-rich natural gas opportunities, such as the Anadarko Woodford shale play in Oklahoma, that have the potential to improve the overall economics of our development projects, we continue to believe that crude oil valuations will be superior to natural gas valuations on a relative Btu basis.Low-Cost Drilling. Substantially allA substantial portion of our annual capital expenditures are invested in drilling projects and acreage acquisitions. From January 1, 20062009 through December 31, 2010,2013, proved crude oil and natural gas reserve additions through extensions and discoveries were 287.01,046 MMBoe compared to 3.085 MMBoe of proved reserve acquisitions. periodically, our technical staff has internally generated substantially alla substantial portion of the opportunities for the investment of our capital. As an early entrant in new or emerging plays, we expect to acquire undeveloped acreage at a lower cost than later entrants into a developing play.stimulationstimulation) and enhanced recovery technologies allows us to commerciallyeconomically develop unconventional crude oil and natural gas resource reservoirs, such as the Red River B dolomite,Dolomite, Bakken, shale and Oklahoma Woodford formations. The Oklahoma Woodford is a widespread unconventional shale formations.reservoir that produces in various basins across the state of Oklahoma, with our properties being primarily concentrated in the SCOOP, Northwest Cana and Arkoma areas of the play. Production rates in the Red River units also have been increasedsustained through the use of enhanced recovery technologies.technologies including water and high pressure air injection. Our production from the Red River units, the Bakken field, and the Oklahoma Woodford shale comprised approximately 13,96148,324 MBoe, or 88%97%, of our total crude oil and natural gas production duringfor the year ended December 31, 2010.2013.1,006,391970,325 net undeveloped acres held in the Bakken play in North Dakota and Montana and North Dakota Bakken shale, Colorado and Wyoming Niobrara shale andthe Oklahoma Woodford, shale fields, we held 364,044560,660 net undeveloped acres in other crude oil and natural gas plays as of December 31, 2010.2013. Our technical staff is focused on identifying and testing new that we believe will help us successfully execute our strategies:own 1,370,435held 1,530,985 net undeveloped acres and 518,3331,014,285 net developed acres as of December 31, 2010.2013. Approximately 83%68% of the net undeveloped acres are located within unconventional resource plays including, but not limited to,in the Bakken shale in North(North Dakota and Montana, theMontana), Woodford shale in Oklahoma(Oklahoma) and the Niobrara shale in Colorado(Colorado and Wyoming.Wyoming). The remaining balance of the net undeveloped acreage is located in conventional plays including 3D-defined locations for the Trenton-Black River of Michigan, Red River of Montana and North Dakota, Lodgepole of North Dakota,(North Dakota), Morrow-Springer of western Oklahoma(Western Oklahoma) and Frio in south Texas.(South Texas) plays.ExperienceMethods. We have substantial experience with horizontal drilling and enhanced recovery methods. In 1992, we drilled our initialfirst horizontal well, and we have drilled over 1,0002,100 horizontal wells since that time. We continue to be a leader in the development of new drilling and completion technologies. Our trademarked ECO-Pad drilling concept, which allows for drilling multiple wells from a single pad, is becoming a standard drilling approach in the industry because it improves land use and increases operating efficiencies. We have drilled as many as 14 wells on a pad site and have the opportunity to increase this number in the future based on surface availability, technology and well spacing. We are also a leader in extending lateral drilling lengths, in some instances up to three miles. In 2012, we completed the first multiple-unit spaced well drilled in Oklahoma, which had a horizontal section that was twice the length of previous laterals in the area. Longer laterals are believed to have substantial experience with enhanced recovery methodsa positive impact on well productivity and currently serveeconomics. Additionally, we are a leader in the exploration and evaluation of the lower layers or “benches” of the Three Forks formation in the Bakken field (referred to as the operator"Lower Three Forks"), initially targeting the first bench of 48 waterflood units. Additionally,the Three Forks in mid-2008 followed by the successful completion of our first well in the second bench in October 2011. In 2012, we operate 7 high pressure air injection (“HPAI”) floods.successfully completed the first well ever drilled in the third bench of the Three Forks. In 2013, we completed our first of four pilot density projects in the Bakken and Three Forks formations, which included our first wells drilled in the fourth bench. The density project demonstrated the productive potential of multiple stacked zones and is helping us determine the optimum drilling and spacing pattern for future development of these reservoirs.2010,2013, we operated properties comprising 88%87% of our total proved reserves and 86% of our PV-10. By controlling operations, we are able to more effectively manage the cost and timing of exploration and development of our properties, including the drilling and fracture stimulation methods used.79 senior officers have an average of 30 years of crude oil and natural gas industry experience. Additionally,technical staff, which includes 40 petroleum engineers, 22 geoscientistscorporate credit rating was upgraded to investment grade by Moody’s Investor Services, Inc. and 19 landmen, has an average of 16 years experienceStandard & Poor’s Ratings Services. We have experienced significant growth with our success in the industry.Strong Financial Position. Asdevelopment of February 18, 2011, we had outstanding borrowings under our revolvingthe Bakken field and most recently the SCOOP play. Our growth has been matched with a disciplined capital sourcing approach which has enabled a strong credit profile. We have a credit facility with lender commitments totaling $1.5 billion which may be increased up to $2.5 billion to provide additional liquidity if needed to maintain our growth strategy, take advantage of approximately $95.0 millionbusiness opportunities, and fund our capital program. We had $1.2 billion of available borrowing capacity under our credit facility at December 31, 2013 after considering outstanding borrowings and letters of $652.6 million.credit. We believe that our planned exploration and development activities will be funded substantially from our operating cash flows and borrowings under our revolving credit facility.facility borrowings. Our 20112014 capital expenditures budget has been established based on our current expectation of available cash flows from operations and availability under our revolving credit facility. Should expected available cash flows from operations materially varydiffer from expectations, we believe our credit facility has sufficient availability to fund any deficit or that we can reduce our capital expenditures to be in line with cash flows from operations.In December 2008, the SEC adopted new rules related to modernizing reserve calculation and disclosure requirements for crude oil and natural gas companies that became effective prospectively for annual reporting periods ending on or after December 31, 2009. The new rules, which we initially adopted for the year ended December 31, 2009, expanded the definition of crude oil and natural gas producing activities to include the extraction of saleable hydrocarbons from oil sands, shale, coal beds or other nonrenewable natural resources that are intended to be upgraded into synthetic oil or natural gas, and activities undertaken with a view to such extraction. The use of new technologies is now permitted in the determination of proved reserves if those technologies have been demonstrated empirically to lead to reliable conclusions about reserve volumes. The revised rules allow producers to report additional undrilled locations beyond one offset on each side of a producing well when there is reasonable certainty of economic producibility. Other definitions and terms were revised, including the definition of proved reserves, which was revised to indicate that entities must use the unweighted average of the first-day-of-the-month commodity prices over the preceding 12-month period, rather than the year-end price, when estimating whether reserve quantities are economical to produce. Likewise, the 12-month average price is now used to calculate reserves used in computing depreciation, depletion and amortization. Another significant provision of the new rules is a general requirement that, subject to limited exceptions, proved undeveloped reserves may only be booked if they relate to wells scheduled to be drilled within five years of the date of booking.The initial application in 2009 of new rules related to modernizing the reserve calculation and disclosure requirements resulted in an upward adjustment to our total proved reserves as of December 31, 2009 primarily as a result of the amendments to the definition of crude oil and natural gas reserves and higher crude oil prices. SeeNotes to Consolidated Financial Statements—Note 15. Supplemental Crude Oil and Natural Gas Information (Unaudited).regulations. Theregulations prior to the time at which contracts providing the right to operate expire, unless evidence indicates renewal is reasonably certain. In connection with the estimation of proved reserves, the term “reasonable certainty” implies a high degree of confidence that the quantities of crude oil and/or natural gas actually recovered will equal or exceed the estimate. To achieve reasonable certainty, our internal reserve engineers and Ryder Scott, our independent reserve engineers, employed technologies that have been demonstrated to yield results with consistency and repeatability. The technologies and economic data used in the estimation of our proved reserves include, but are not limited to, well logs, geologic maps including isopach and structure maps, analogy and statistical analysis, and available downhole and production data, seismic data and well test data.the PV-10 by reserve category as of December 31, 2010 by reserve category.2013. The total Standardized Measure of discounted cash flows as of December 31, 20102013 is also presented. Ryder Scott evaluated properties representing approximately 94%99% of our PV-10, 97%99% of our proved crude oil reserves, and 94% of our proved natural gas reserves as of December 31, 2010,2013, and our internal technical staff evaluated the remaining properties. A copy of Ryder Scott’s summary report is included as an exhibit to this Annual Report on Form 10-K. Our estimated proved reserves and related future net revenues and PV-10 at December 31, 2010 were determined using the 12-month unweighted arithmetic average of the first-day-of-the-month commodity prices for the period of January 2010 through December 2010, without giving effect to derivative transactions, and were held constant throughout the life of the properties. These prices were $79.43 per Bbl for crude oil and $4.38 per MMBtu for natural gas ($71.92 per Bbl for crude oil and $5.07 per Mcf for natural gas net of location and quality differentials). December 31, 2010 Crude Oil
(MBbls) Natural Gas
(MMcf) Total
(MBoe) PV-10(1)
(in thousands) 99,565 233,501 138,482 $ 3,097,810 1,707 1,198 1,907 25,876 123,512 604,869 224,323 1,508,528 224,784 839,568 364,712 $ 4,632,214 $ 3,785,322 Crude Oil
(MBbls) Natural Gas
(MMcf) Total
(MBoe) PV-10 (1)
(in millions)Proved developed producing 277,845 761,729 404,800 $ 10,461.0 Proved developed non-producing 785 7,240 1,992 49.6 Proved undeveloped 459,158 1,309,051 677,333 9,664.8 Total proved reserves 737,788 2,078,020 1,084,125 $ 20,175.4 Standardized Measure (1) $ 16,295.8 (1) PV-10 is a non-GAAP financial measure and generally differs from Standardized Measure, the most directly comparable GAAP financial measure, because it does not include the effects of income taxes on future net revenues. The Standardized Measure at December 31, 2010 is $3.8 billion, a $0.8 billion difference from PV-10 becauserevenues of the tax effect.approximately $3.9 billion. Neither PV-10 nor Standardized Measure represents an estimate of the fair market value of our crude oil and natural gas properties. We and others in the crude oil and natural gas industry use PV-10 as a measure to compare the relative size and value of proved reserves held by companies without regard to the specific income tax characteristics of such entities.2010. Proved Developed Proved Undeveloped Crude
Oil
(MBbls) Natural
Gas
(MMcf) Total
(MBoe) Crude
Oil
(MBbls) Natural
Gas
(MMcf) Total
(MBoe) 33,233 46,801 41,033 96,227 124,693 117,009 15,405 16,651 18,180 18,337 21,088 21,852 31,752 20,398 35,152 3,493 — 3,493 12,840 437 12,913 2,536 — 2,536 2,226 6,418 3,296 20 900 170 548 24,302 4,598 2,438 162,379 29,501 102 75,304 12,653 393 295,809 49,694 1,377 42,709 8,495 — — — 3,789 1,679 4,069 68 — 68 101,272 234,699 140,389 123,512 604,869 224,323 Proved Developed Proved Undeveloped Crude Oil
(MBbls) Natural Gas
(MMcf) Total
(MBoe) Crude Oil
(MBbls) Natural Gas
(MMcf) Total
(MBoe)North Region: Bakken field North Dakota Bakken 159,372 260,318 202,759 401,841 504,846 485,982 Montana Bakken 31,727 32,169 37,088 12,771 15,252 15,313 Red River units Cedar Hills 51,263 7,039 52,436 1,755 — 1,755 Other Red River units 17,472 13,400 19,705 2,714 — 2,714 Other 619 7,590 1,884 — — — South Region: SCOOP 14,607 238,629 54,379 39,096 727,150 160,288 Northwest Cana 1,433 102,676 18,546 981 61,803 11,281 Arkoma Woodford 18 66,509 11,103 — — — Other 2,119 40,639 8,892 — — — Total 278,630 768,969 406,792 459,158 1,309,051 677,333 We have historically added reserves through our exploration program and development activities. SeeItem 1. Business—Crude Oil and Natural Gas Operations. Reserves at December 31, 2010 and 2009 were computed using the 12-month unweighted average of the first-day-of-the-month commodity prices as required by the new SEC rules. Reserves at December 31, 2008 were computed using year-end commodity prices pursuant to previous SEC rules. ChangesThe following table provides information regarding changes in total proved reserves were as follows for the periods indicated:presented. Year Ended December 31, 2010 2009 2008 257,293 159,262 134,615 27,629 1,195 (13,224 ) 95,233 110,454 47,647 (15,811 ) (13,623 ) (12,006 ) — — — 368 5 2,230 364,712 257,293 159,262 Year Ended December 31, MBoe 2013 2012 2011 Proved reserves at beginning of year 784,677 508,438 364,712 Revisions of previous estimates (96,054 ) 4,149 2,237 Extensions, discoveries and other additions 444,654 233,652 161,981 Production (49,610 ) (35,716 ) (22,581 ) Sales of minerals in place — (7,838 ) — Purchases of minerals in place 458 81,992 2,089 Proved reserves at end of year 1,084,125 784,677 508,438 Revisions. Revisions of previous estimates. Revisions represent changes in previous reservesreserve estimates, upward or downward, resulting from new information normally obtained from development drilling and production history or resulting from a change in economic factors, such as commodity prices, operating costs, or development costs. Revisions for the year ending December 31, 2008 were primarily due to lower commodity prices at the end of 2008 compared to 2007. Revisions for the year ended December 31, 2010 were due2013 primarily represent the removal of proved undeveloped ("PUD") reserves resulting from a decision in 2013 to better than anticipated production performanceallocate a greater focus of our 5-year growth plan to our drilling programs in higher rates-of-return crude oil and higher average commodity prices throughout 2010 as comparedliquids-rich natural gas areas of the Bakken and SCOOP while continuing to 2009.build on the early success in our development of the Lower Three Forks reservoirs in the Bakken. Another contributing factor is our increased focus on multi-well pad drilling in the Bakken, which resulted in the removal of PUDs in certain areas in favor of PUDs more likely to be developed with pad drilling where operating efficiencies may be realized to maximize rates of return. These factors contributed to the removal of 81 MMBoe of PUD reserves in 2013.the year ended December 31, 2009 include increases in proved undeveloped locations as a resulteach of the changethree years reflected in the SEC’s rules in 2009 to allow producers to report additional undrilled locations beyond one offset on each side of a producing well where there is reasonable certainty of economic producibility. Extensions, discoveries and other additions for the year ended December 31, 2010table above were primarily due to increases in proved reserves associated with our successful drilling activity and strong production growth in the Bakken fieldfield. Proved reserve additions in North Dakota.the Bakken totaled 276 MMBoe for the year ended December 31, 2013. Additionally, 2013 extensions and discoveries were significantly impacted by successful drilling results in the emerging SCOOP play, resulting in 158 MMBoe of proved reserve additions during the year. Significant progress continued to be made in 2013 in developing and expanding our Bakken and SCOOP assets, both laterally and vertically, through strategic exploration, development, planning and technology. See the subsequent section titled that a significant portion of future reserve additions will come from our major development projects includingin the Bakken and SCOOP.Woodford plays.Wyoming, and our East region in an effort to redeploy capital to our strategic areas that we believe will deliver higher future growth potential. See Part II, Item 8. Notes to Consolidated Financial Statements—Note 13. Property Acquisitions and Dispositions for further discussion of our 2012 dispositions. We may also purchasecontinue to seek opportunities to sell non-strategic properties if and when we have the ability to dispose of such assets at competitive terms.acquisitions. Crude Oil
(MBbls) Natural Gas
(MMcf) Total
(MBoe)Proved undeveloped reserves at December 31, 2012 334,293 795,585 466,891 Revisions of previous estimates (52,440 ) (251,475 ) (94,354 ) Extensions and discoveries 240,653 981,118 404,173 Purchases of minerals in place 23 26 28 Conversion to proved developed reserves (63,371 ) (216,203 ) (99,405 ) Proved undeveloped reserves at December 31, 2013 459,158 1,309,051 677,333 reserve engineers,reserves evaluation consulting firm, estimated, in accordance with generally accepted petroleum engineering and evaluation principles and definitions and guidelines established by the SEC, 94%99% of our PV-10, 97%99% of our proved crude oil reserves, and 94% of our proved natural gas reserves as of December 31, 20102013 included in this Annual Report on Form 10-K. The Ryder Scott technical personspersonnel responsible for preparing the reserve estimates presented herein meet the requirements regarding qualifications, independence, objectivity and confidentiality set forth in the Standards Pertaining to the Estimating and Auditing of Oil and Gas Reserves Information promulgated by the Society of Petroleum Engineers.meetsis in contact regularly with representatives of Ryder Scott to review properties and discuss methods and assumptions used in Ryder Scott’s preparation of the year-end reserves estimates. While we have no formal committee specifically designated to review reserves reporting and the reserves estimation process, aA copy of the Ryder Scott reserve report is reviewed by our Audit Committee with representatives of Ryder Scott and by our internal technical staff before disseminationthe information is filed with the SEC on Form 10-K. Additionally, certain members of the information. Additionally, our senior management reviewsreview and approvesapprove the Ryder Scott reserve report and on a quarterly basis review any internally estimated significant changes to our proved reserves on a quarterly basis.Resource DevelopmentCorporate Engineering is the technical person primarily responsible for overseeing the preparation of our reserve estimates. He has a Bachelor of Science degree in Petroleum Engineering, an MBA in Finance and 2529 years of industry experience with positions of increasing responsibility in operations, acquisitions, engineering and evaluations. He has worked in the area of reserves and reservoir engineering most of his career and is a member of the Society of Petroleum Engineers. The Vice President—Resource DevelopmentCorporate Engineering reports directly to our President and Chief Operating Officer.Senior Vice President—Operations. The reserve estimates are reviewed and approved by the President and Chief Operating Officer and certain other members of senior management.Proved Undeveloped Reserves. Our proved undeveloped (“PUD”) reserves at December 31, 2010 were 224,323 MBoe, consisting of 123,512 MBbls of crude oil and 604,869 MMcf of natural gas. In 2010, we developed approximately 11% of our proved undeveloped reserves booked as of December 31, 2009 through the drilling of 130 gross (60.4 net) development wells at an aggregate capital cost of approximately $310 million. Also in 2010, we removed the reserves associated with 61 gross (23.9 net) PUD locations because, in the opinion of management, such locations were no longer expected to be developed within the 5 year timeline required by SEC rules. This resulted in the removal of 40.1 Bcf of proved undeveloped natural gas reserves (6.7 MMBoe) in 2010. Estimated future development costs relating to the development of proved undeveloped reserves are projected to be approximately $865 million in 2011, $1,055 million in 2012, and $811 million in 2013.Since our entry into the Bakken field we have acquired a substantial leasehold position. Our drilling programs to date have focused on proving our undeveloped leasehold acreage through strategic exploratory drilling, thereby increasing the amount of leasehold acreage in the secondary term of the lease with no further drilling obligations, i.e. categorized as held by production (HBP) and resulting in a reduced amount of leasehold acreage in the primary term of the lease with drilling obligations. While we will continue to drill strategic exploratory wells and build on our current leasehold position, we will simultaneously focus on drilling programs over the next 5 years which harvest our PUD locations. Our current 5 year plan anticipates that full development of our PUD inventory will comprise over one-third of our projected level of drilling activity and generate additional PUD locations as our current inventory is harvested.acreageacres by region as of December 31, 2010: Developed acres Undeveloped acres Total Gross Net Gross Net Gross Net 264,299 119,405 1,021,366 504,244 1,285,665 623,649 86,808 66,971 224,704 165,316 311,512 232,287 149,994 132,247 — — 149,994 132,247 — — 103,148 �� 71,712 103,148 71,712 69,068 52,698 308,470 171,117 377,538 223,815 55,320 34,326 350,255 233,216 405,575 267,542 100,430 22,749 47,297 20,864 147,727 43,613 — — 36,440 11,039 36,440 11,039 99,597 47,250 80,146 52,193 179,743 99,443 44,720 42,687 172,322 140,734 217,042 183,421 870,236 518,333 2,344,148 1,370,435 3,214,384 1,888,768 Developed acres Undeveloped acres Total Gross Net Gross Net Gross Net North Region: Bakken field North Dakota Bakken 900,678 530,682 504,898 378,370 1,405,576 909,052 Montana Bakken 159,943 135,426 214,358 165,343 374,301 300,769 Red River units 156,703 137,294 — — 156,703 137,294 Niobrara - Colorado/Wyoming 12,087 8,529 126,662 69,526 138,749 78,055 Other 22,194 7,220 235,931 179,265 258,125 186,485 South Region: SCOOP 74,019 48,990 603,665 354,864 677,684 403,854 Northwest Cana 120,668 73,777 110,120 71,314 230,788 145,091 Arkoma Woodford 110,973 26,359 4,568 434 115,541 26,793 Other 100,710 46,008 197,434 167,506 298,144 213,514 East Region — — 152,762 144,363 152,762 144,363 Total 1,657,975 1,014,285 2,150,398 1,530,985 3,808,373 2,545,270 20102013 that willare expected to expire over the next three years by region unless production is established within the spacing units covering the acreage prior to the expiration dates: 2011 2012 2013 Gross Net Gross Net Gross Net 229,040 85,969 216,013 105,602 328,682 160,385 16,003 14,925 23,210 17,563 82,058 54,158 — — — — — — 696 696 1,079 1,079 43,381 31,102 72,584 44,088 38,699 21,359 48,448 38,702 135,836 88,520 60,851 37,223 137,014 95,088 17,174 7,123 12,323 7,141 7,557 5,500 18,685 3,206 6,140 3,015 10,788 4,434 57,589 44,766 3,609 1,842 5,953 3,859 41,042 32,286 60,769 54,453 38,678 30,618 588,649 321,579 422,693 249,277 702,559 423,846 2014 2015 2016 Gross Net Gross Net Gross Net North Region: Bakken field North Dakota Bakken 126,232 84,679 143,555 118,609 107,462 107,257 Montana Bakken 63,762 51,399 65,541 46,973 38,375 36,632 Red River units 2,716 1,377 7,967 5,423 12,054 12,042 Niobrara - Colorado/Wyoming 13,574 8,800 83,531 45,692 23,538 10,816 Other 3,063 1,873 10,991 4,101 1,440 588 South Region: SCOOP 122,067 71,061 105,279 58,198 151,040 81,042 Northwest Cana 34,804 21,997 27,686 15,668 33,024 26,521 Arkoma Woodford 1,040 120 — — — — Other 1,202 733 85,919 64,276 15,932 16,767 East Region 9,657 7,486 14,187 9,760 5,128 4,695 Total 378,117 249,525 544,656 368,700 387,993 296,360 2010,2013, we drilled exploratory and development wells as set forth in the table below: 2010 2009 2008 Gross Net Gross Net Gross Net 42 11.8 14 6.5 41 18.2 25 10.9 34 9.0 73 19.5 4 2.2 16 9.0 12 8.9 71 24.9 64 24.5 126 46.6 231 91.5 106 39.1 153 89.3 44 5.2 45 4.1 72 13.4 3 1.0 2 0.1 8 3.2 278 97.7 153 43.3 233 105.9 349 122.6 217 67.8 359 152.5 2013 2012 2011 Gross Net Gross Net Gross Net Exploratory wells: Crude oil 75 51.5 76 37.0 50 23.4 Natural gas 40 23.7 78 43.8 109 45.9 Dry holes 3 2.1 1 1.0 2 1.3 Total exploratory wells 118 77.3 155 81.8 161 70.6 Development wells: �� Crude oil 734 250.9 561 211.3 380 126.1 Natural gas 26 5.4 5 2.4 17 1.6 Dry holes — — 3 1.1 5 0.6 Total development wells 760 256.3 569 214.8 402 128.3 Total wells 878 333.6 724 296.6 563 198.9 2010,2013, there were 151404 gross (47.9(160.8 net) wells in the process of drilling, completing or waiting on completion.18, 2011,17, 2014, we operated 3843 rigs on our properties. Our rig activity during 20112014 will depend on potential drilling efficiency gains and crude oil and natural gas prices and, accordingly, our rig count may increase or decrease from current levels. There can be no assurance, however, that additional rigs will be available to us at an attractive cost. SeePart I, Item 1A. Risk Factors—The unavailability or high cost of additional drilling rigs, equipment, supplies, personnel and oilfield services could adversely affect our ability to execute our exploration and development plans within our budget and on a timely basis.2011. We2014. Although we cannot provide any assurance, we believe our cash flows from operations, remaining cash balance, and borrowing availability under our revolving credit facility, including our ability to increase our borrowing capacity thereunder, will be sufficient to satisfy our 20112014 capital budget. We may choose to access the capital markets for additional financing to take advantage of business opportunities that may arise if such financing can be arranged at favorable terms. The actual amount and timing of our capital expenditures may differ materially from our estimates as a result of, among other things, available cash flows, unbudgeted acquisitions, actual drilling results, the availability of drilling rigs and other services and equipment, the availability of transportation capacity, and regulatory, technological and competitive developments. Further, a decline in crude oil and natural gascommodity prices could cause us to curtail our actual capital expenditures. Conversely, an increase in commodity prices could result in increased capital expenditures.thatare believed to be capable of producing crude oil and natural gas occurring in discrete accumulations in structural and stratigraphic traps. “Unconventional plays” are areas that are believed to be capable of producing crude oil and natural gas occurring in accumulations that are regionally extensive, but generally require recently developed technologieshorizontal drilling, fracture stimulation treatments or other special recovery processes to achieve profitability.economic production. Unconventional plays tend to have low permeability and may be closely associated with source rock as is the case with oil and gas shale, tight oil and gas sands and coalbed methane. Our operations in unconventional plays include operations in the Bakken and Woodford shalesplays and the Red River units. Our operations within conventional plays include operations in the Trenton-Black River of Michigan, Lodgepole of North Dakota, Morrow-Springer of western Oklahoma and Frio in south Texas. In general, unconventional plays require the application of more advanced technology and higher drilling and completion costs to produce relative to conventional plays. These technologies can include large hydraulic fracturefracturing treatments, horizontal wellbores, multilateral wellbores, or some other technique or combination of techniques to expose more of the reservoir to the wellbore.85%82% of our PV-10 as of December 31, 2010. During the three months ended December 31, 2010, our average daily production from such properties was 33,214 net Bbls of crude oil2013 and 26,456 net Mcf of natural gas. Our principal producing properties in this region are in the Bakken field and the Red River units.Bakken FieldThe Bakken field of North Dakota and Montana has become one of the premier crude oil resource plays in the United States. It has been described by the United States Geological Survey (“USGS”) as the largest continuous crude oil accumulation it has ever assessed. Estimates of recoverable reserves for the Bakken field have grown from 4.3 billion barrels of crude oil, as published in a report issued by the USGS in April 2008, to potentially 11 billion barrels of crude oil in North Dakota alone, as reported by the North Dakota Industrial Commission (“NDIC”) in January 2011. The increase in reserves is a result of improved drilling and completion technologies and the additional reserves found in the Three Forks formation, which is now recognized as part of the Bakken petroleum system. Drilling activity and production rates in the Bakken field continued to increase in 2010, reaching record levels in North Dakota, according to a report issued by the NDIC in January 2011. As of February 18, 2011, there were 174 rigs drilling in the Bakken field, up 96% from the 89 rigs that were drilling as of January 25, 2010. We continue to be a leader in the development and expansion of the Bakken field. We control one of the largest leasehold positions with approximately 1,597,177 gross (855,936 net) acres as of December 31, 2010. We are also the most active driller in the Bakken field, with 23 operated rigs drilling as of February 18, 2011. During 2010 we completed 233 gross (76.5 net) wells in the Bakken field. Our properties within the Bakken field represented 56% of our PV-10 as of December 31, 2010 and 47%75% of our average daily Boe production for the three months ended December 31, 2010.20102013, there were 183 rigs actively drilling in the Bakken field.6482,636 gross (260.5(1,025 net) wells in the Bakken field. Ourprovenproved undeveloped drilling locations in the Bakken field as of December 31, 20102013 totaled 8421,964 gross (393.7(1,119 net) wells.2010 proved to be an exceptional year for usas we sawduring 2013, completing a total of 749 gross (267 net) wells. We have reduced our production, reservesdrilling and acreage position growcompletion costs on operated North Dakota Bakken wells from approximately $9.2 million in 2012 to record levels while substantial portionsapproximately $8.0 million in 2013. The largest contributors to these cost reductions are multi-well pad development which reduced the overall footprint of our undeveloped acreage were de-risked dueoperations, advancements in stimulation and drilling technology, rig moving and location construction. We exited the year with over 70% of our rig activity on multi-well pads.record breakingBakken field. We also had success expanding the field extents onto our undeveloped leasehold through our step-out drilling activity in North Dakota. Our Bakken field production averaged 25,589 net Boe per dayprogram and we completed the first of four pilot density projects initiated during the monthyear. These pilot density projects are designed to help us determine the optimum drilling and spacing pattern for future development of December 2010, up 78%the Bakken and Three Forks reservoirs. We also initiated a pilot secondary recovery project to evaluate the potential for increasing the ultimate recovery of crude oil from our average daily Bakken field production in December 2009. Total proved Bakken field reserves at December 31, 2010 were 198 MMBoe, up 47% over our proved Bakken field reserves as of December 31, 2009. Our net acreage position in the Bakken field increased 33% during 2010, from 645,347 net acres asthrough secondary injection methods. Progress of December 31 2009 to 855,936 net acres as of December 31, 2010. Approximately 22% of our net acreagethese pilot projects is developed and 78% of our net acreage is undeveloped as of December 31, 2010.$845 million$2.5 billion drilling 530870 gross (131.7(287 net) wells in the Bakken field during 2011. Approximately 91% will2014, of which approximately 84% is expected to be invested in North Dakota and the remaining 9% will be invested16% in Montana. We plan to keepexit 2014 with 23 rigs drilling in the Bakken field throughout the year, with 2119 rigs located in North Dakota and 24 rigs in Montana.Bakken.Bakken20102013 came primarily from our activities in North Dakota. Production increased to an average rate of 20,860 net80,374 Boe per day during the month ofthree months ended December 2010,31, 2013, up 129% from36% over the average daily rate in December 2009.2012 fourth quarter. Proved reserves grew 50% year over yearincreased 33% year-over-year to 158689 MMBoe as of December 31, 2010.2013. Our estimated ultimate recoverable reserves per well (1,280-acre spacing) also increased during the year from 430 MBoe gross to 518 MBoe gross based on historical well performance. As of December 31, 2010, our North Dakota Bakken properties represented 43%65% of our PV-10 at December 31, 2013and 37%56% of our average daily Boe production for the three months ended December 31, 2010. We2013. In 2013, we completed 222678 gross (71(211 net) wells, during 2010, bringing our total number of wells the North Dakota Bakken to 4752,267 gross (150.2(788 net) wells as of December 31, 2010.2013. As of December 31, 2010,2013, we had 1,285,6651,405,576 gross (623,649(909,052 net) acres in the North Dakota Bakken field, of which 19%58% of the net acreage is developed and 81% of the net acreageremaining 42% is undeveloped. Our inventory of proven netproved undeveloped locations stood at 7471,904 gross (329.5(1,074 net) wells as of December 31, 2010.One of the more significant outcomes of the 20102013.the North Dakota focused on (1) developing our derisked areas, (2) expanding the field vertically and horizontally through step-out exploration drilling and (3) pilot density drilling to determine optimum well spacing and pattern for full field development. We successfully achieved our 2013 objectives in each of these areas and expect to continue making progress with these initiatives in 2014.expansionfirst 1,280-acre unit that was fully developed on 320-acre spacing in the Bakken field and included four Middle Bakken wells, three TF1 wells, four TF2 wells and three TF3 wells. These 14 wells produced at a maximum combined initial 24 hour production rate of 14,850 barrels of oil equivalent per day. The Hawkinson density pilot employed several state of the play west ofart technologies including the Nesson Anticline. Technological breakthroughs demonstrated that widespread commercial production can be achieved in this area by increasing fracture stimulation treatments where necessary. Based on this information, we expanded our leasing effort and acquired an additional 141,800 net acreslargest downhole microseismic monitoring survey ever conducted in the North Dakota Bakken during 2010, increasing our net acreage position by 29% over our North Dakota Bakken net acreage position asworld. All of December 31, 2009.Another significant achievement during 2010this was done to help us determine the successful implementation of our ECO-PadTM technology. ECO-Pad technology allows 4 wells (2 Bakkenbest inter-well spacing and 2 Three Forks) to be drilled from a single drilling pad, which reduces drilling costs, completion costs and environmental impact by centralizing operations on a single pad. Drilling costs are saved by utilizing a walking rig, which moves between wells on hydraulic feet that eliminate the need to breakdown the rig each time it moves from one well to another well. Completion costs are saved by conducting fracture stimulation treatments on multiple wells in one continuous operation. Centralizing operations and production facilities reduces the size of the pad needed by as much as 75%. Our first ECO-Pad operation, the Arthur-Hegler, was completed in August 2010, flowing at a combined maximum 24-hour rate of 4,350 Boe per day. As of December 31, 2010, we had completed 4 ECO-Pad locations and had 4 ECO-Pad rigs drilling. We believe our ECO-Pad technology is a key to maximizing thepattern for future development of the Bakken field, and we plan to increase the use of this technology as the field matures.During 2010 we increased the number of fracture stimulation stages per well from approximately 18 stages to as many as 30 stages. Although there are always overriding geologic factors that influence production, the increase in recoverable reserves we announced in 2010 can be attributed primarily to the increased number of fracture stimulation stages used per well.field. We are studying these resultscurrently monitoring production from the Hawkinson unit andoptimize future fracture stimulationsassess performance. We also completed drilling operations on three additional pilot density projects in 2013 - the field.During 2011,Tangsrud, Rollefstad, and Wahpeton projects - which we expect to begin producing during the first half of 2014. The Tangsrud and Rollefstad projects, like the Hawkinson project, are developing the Middle Bakken and first three benches of the Three Forks on 320-acre spacing while the Wahpeton project is developing the same zones on 160-acre spacing.$771 million$2.1 billion drilling 514802 gross (120.6(240 net) wells in the North Dakota Bakken field. TheBakken. Approximately 13% of the capital expenditures will be spent on exploratory drilling which will include additional step-out drilling and three new pilot density projects. These new pilot density projects will further test the development of the Middle Bakken and first three benches of the Three Forks on 160-acre spacing. The remainder of the capital is expected to be spent drilling development wells alongin the field including our Nesson Anticline acreagefull field development program in the Antelope prospect in McKenzie and step-out wells westWilliams Counties of the Nesson Anticline to continue expanding the proven extents of the Bakken and Three Forks reservoirs underlying our acreage. The majority of ourNorth Dakota. This development drilling will be on 1,280-acre spacing but will include some 640-acre infield locations and dual zone development. In time, we expect that the North Dakota Bakken field will be developed on 320-acre spacing like the Elm Coulee field in Montana.done using ECO-Pad technology. As of February 18, 2011,December 31, 2013, we had 2116 operated rigs drilling in the North Dakota Bakken and plan to maintain 21 operated rigs drilling in the play throughout 2011.. production isproperties are located primarily inwithin the Elm Coulee field in Richland County, Montana. The Elm Coulee field is listed byProduction from our Montana Bakken properties reached an all time high during the Energy Information Administration asthree months ended December 31, 2013, averaging 12,961 Boe per day over that period, up 52% from the 17th largest onshore field inaverage daily rate for the lower 48 statesthree months ended December 31, 2012. This reflects the success of the United States ranked by proved liquid reserves in 2009. Sinceour ongoing drilling program to optimize and expand our first well in August 2003,Montana Bakken properties. During 2013, we have completed a total of 17171 gross (108.6(56 net) wells in the fieldMontana bringing our total number of wells drilled in Montana Bakken to 369 gross (237 net) wells as of December 31, 2010. Year over year, production in 2010 was down 18%, reflecting our limited drilling activity in the field during 2010. The majority of our drilling was conducted during the second half of 2010, and production during the month of December 2010 was down only 10% from the average daily production in December 2009.2013. As of December 31, 20102013 our Montana Bakken properties represented 14%7% of our PV-10 and 10%9% of our average daily Boe production for the three months ended December 31, 2010. During the year we added 98,344 gross (68,788 net) acres in the Montana Bakken play.2013. As of December 31, 2010,2013, we owned 311,512had 374,301 gross (232,287(300,769 net) acres in Montana Bakken, of which 29%45% of the net acreage is developed and the remaining 71% of the net acreage55% is undeveloped.During the year ended December 31, 2010, using the latest drilling and completion technologies, we completed 11 gross (5.5 net) wells to further develop the field and test the potential to expand the limits of the Elm Coulee field. The Rognas 2-22H well, which is strategically located along the northern edge of the Elm Coulee field, was completed flowing at a 24-hour maximum rate of 1,014 Boe per day. The Rognas 2-22H was completed using current drilling and cased hole, multi-stage fracture stimulation technology and has significantly outperformed offsetting wells that were completed using older open hole completion technology. These results are encouraging and indicate that we may be able to extend the limits of the Elm Coulee field using these technologies. We will continue testing this concept in 2011.We plan to invest approximately $74 million drilling 16 gross (11.1 net) wells in the Montana Bakken during 2011. Our drilling will focus in the Elm Coulee field area but will also include some strategic step-out wells to further test our undeveloped acreage immediately north of the Elm Coulee field. As of February 18, 2011 we had 2 rigs drilling in the Montana Bakken and we plan to maintain 2 rigs in the play throughout 2011. As of December 31, 2010,2013, we had 9560 gross (64.2(45 net) provenproved undeveloped locations identified in the Montana Bakken field.Ourrepresent 28%are comprised of our PV-10 as of December 31, 2010 and 34% of our average daily North region Boe production for December 2010. The 8nine units comprising the Red River units are located along the Cedar Creek Anticline in North Dakota, South Dakota and Montana andthat produce crude oil and natural gas from the Red River “B” formation, a thin continuous, dolomite formation at depths of 8,000 to 9,500 feet. Our principal producing properties in the Red River units include the Cedar Hills units in North Dakota and Montana, the Medicine Pole Hills units in North Dakota, and the Buffalo Red River units in South Dakota. Our properties in the Red River units comprise a portion of the Cedar Hills field, which was listed by the U.S. Energy Information Administration in 20082010 as the 7th9th largest onshore field in the lower 48 states of the United States ranked by 2009 proved liquid proved reserves.In thewe plan to complete pattern drilling on the waterflood project in the Cedar Hills units and resume development activity in the Medicine Pole Hills and Buffalo units in 2011. We have allocated $58 million of our capital expenditure budget to the Red River units, which will support 2 operated rigs and a significant investment in facilities and infrastructure.Cedar Hills Units. Cedar Hills North unit (“CHNU”) is located in Bowman and Slope Counties, North Dakota. We drilled the initial horizontal well in CHNU, the Ponderosa 1-15, in April 1995. As of December 31, 2010, we had drilled 235 horizontal wells within this 49,700-acre unit, with 116 producing wellbores and the remainder serving as injection wellbores. We own a 98% working interest and operate the CHNU.Cedar Hills West unit (“CHWU”), in Fallon County, Montana, is contiguous to the northern portion of CHNU. As of December 31, 2010, this 7,800-acre unit contained 11 horizontal producing wells and 5 horizontal injection wells. We own and operate a 100% working interest in the CHWU.In January 2003, we commenced enhanced recovery in the two Cedar Hills units, with HPAI used throughout most of the area and water injected generally along the boundary of CHNU. Under HPAI, compressed air injected into a reservoir oxidizes residual crude oil and produces flue gases (primarily carbon dioxide and nitrogen) that mobilize and sweep the crude oil into producing wellbores. During February 2008, the transition started to have full scale water injection and this transition was completed in June of 2010 when we stopped our air injection at Cedar Hills after injecting nearly 80 Bcf of air into the reservoir. We have seen continued success from our increased density drilling program which supported the idea that we could more economically inject water than air in these units. In response to our enhanced recovery and increased drilling efforts, our net daily production increased from 2,185 Boe per day in November 2003 to 10,789 Boe per day in December 2010. During 2011, we plan to drill 12 new horizontal wells in the Cedar Hills units continuing with our increased density for both the producing wells and injection wells, and improving and upgrading production and injection facilities. In 2011, we plan to invest approximately $35 million drilling and improving facilities in the Cedar Hills units.Medicine Pole Hills Units. The Medicine Pole Hills units (“MPHU”) are approximately five miles east of the southern portion of the CHNU. We acquired the Medicine Pole Hills unit in 1995. At that time, the 9,600-acre unit consisted of 18 vertical producing wellbores and 4 injection wellbores under HPAI producing 525 net Bbls of crude oil per day. We have since drilled 51 horizontal wellbores extending production to the west with the formation of the 15,000-acre Medicine Pole Hills West unit and to the south, with the 11,500-acre Medicine Pole Hills South unit. All three units are under HPAI and we operate and own an average 77% working interest in the three units. Production from the units averaged 1,241 net Bbls of crude oil and 1,721 net Mcf of natural gas per day during December 2010. In May 2010 we began the installation of two 15 MMcf per day electric air compressors to supplement and ultimately replace our more costly natural gas-fired compressors which currently inject 24 MMcf of air per day. During the second quarter of 2011, we plan to finalize the installation. In 2011, we plan to invest approximately $7 million for capital workover and facilities in MPHU.Buffalo Red River Units. Three contiguous Buffalo Red River units (Buffalo, West Buffalo, and South Buffalo) are located in Harding County, South Dakota, approximately 21 miles south of MPHU. When we purchased the units in 1995, there were 73 vertical producing wellbores and 38 injection wellbores under HPAI producing approximately 1,906 net Bbls of crude oil per day. We operate and own an average working interest of 95% in the 32,900 acres comprising the three units. From 2005 through 2010, we re-entered 48 existing vertical wells and drilled horizontal laterals to increase production and sweep efficiency from the three units. Production for the month of December 2010 was 1,421 net Bbls of crude oil per day. In 2011, we plan to invest approximately $4 million for capital workovers and facilities which will include installing two 14 MMcf per day electric air compressors to supplement and ultimately replace the less efficient and higher maintenance compressors which currently inject 10 MMcf of air per day. This installation started in May 2010 and will be completed during the first quarter of 2011.NiobraraThe Upper Cretaceous Niobrara formation has emerged as another potential crude oil resource play in various basins throughout the northern Rocky Mountain region. As with most resource plays, the Niobrara has a history of producing through conventional technology with some of the earliest production dating back to the early 1900s. Individual fields have produced up to 12 MMBoe and individual wells have produced up to 2.1 MMBoe. Natural fracturing has played a key role in producing the Niobrara historically due to the low porosity and low permeability of the formation. Because of this, conventional production has been very localized and limited in area extent. We believe the Niobrara can be produced on a more widespread basis using today’s horizontal multi-stage fracture stimulation technology where the Niobrara is thermally mature. Based on studies conducted by our geotechnical teams, we have acquired 103,148 gross (71,712 net) acres in prospective portions of the DJ Basin of Colorado and Wyoming.DJ Basin. The DJ Basin Niobrara play emerged as a crude oil resource play in 2010 and attracted a flurry of leasing activity based on drilling results announced early in 2010. Drilling activity increased during the year, and at December 31, 2010 there were 12 rigs drilling horizontal Niobrara wells in the DJ Basin, with 279 outstanding permits to drill additional horizontal Niobrara wells in the basin. Although drilling activity ramped up during the year, the play is in its early stages, and completion results and production histories are limited. A total of 15 Niobrara completions have been published as of December 31, 2010. Initial production rates for these Niobrara producers ranged from 87 Bbls of crude oil per day to 1,558 Bbls of crude oil per day.As of December 31, 2010, we owned 103,148 gross (71,712 net) acres in the DJ Basin. Approximately 33% of the net acreage is located in Weld and Morgan Counties, Colorado and 67% in Laramie, Goshen and Platte counties in Wyoming. Here, the Niobrara is found at an average depth of approximately 6,000 feet, and the targeted B-bench chalk ranges from 50 to 100 feet thick. We spud our first horizontal well in Weld County, Colorado, the Newton 1-4H, in early February 2011. The Newton 1-4H is the first 1,280-acre spaced well drilled in the Niobrara play, with a targeted lateral length of 9,200 feet. To date, all wells in the play have been drilled on 640-acre spacing with laterals of 4,500 feet or less. By increasing the lateral length, we expect to get more reserves per well at a lower cost.In 2011, we plan to invest approximately $20 million drilling 5 gross (3.3 net) wells in the DJ Basin Niobrara play. We also plan to acquire 80 square miles of 3D seismic data during the first quarter of 2011 to guide future drilling in the play.Big Horn Basin and OtherOur wells within the Big Horn Basin in northern Wyoming and otheradjacent areas within the North region represented 1%10% of our PV-10 as of December 31, 20102013 and 3%10% of our average daily Boe production for the three months ended December 31, 2010.2013. Our principal propertyaverage daily production from these legacy properties decreased 2% in the Big Horn Basin,fourth quarter of Worland field, produces primarily from2012 fourth quarter. The relatively shallow decline in these mature properties is due to optimization efforts and some limited drilling activity. Proved reserves were 77 MMBoe as of December 31, 2013. We are continuing to extend the Phosphoria formation. We also have several other ongoing projectsperformance life of our properties in the Rockies, including conventional 3D-defined locations at the Red River units primarily by improving our water and Lodgepole structuresair injection efficiency and taking other measures to optimize production. Additional enhanced recovery via carbon dioxide injection is currently being studied. As of December 31, 2013, we had 156,703 gross (137,294 net) acres in the Red River units and adjacent areas, all of which is developed acreage.Montana,19% in 2011. We expect to further reduce this amount as we continue to build out infrastructure and horizontal Fryburg opportunitiestransition to a greater use of ECO-Pad development in North Dakota.12%18% of our PV-10 as of December 31, 20102013 and 19%25% of our average daily Boe production for the three months ended December 31, 2010. During2013. For the three months ended December 31, 2010,2013, our average daily production from such properties was 790 net Bbls of crude oil and 49,843 net Mcf of natural gas,35,709 Boe per day, up 27%58% from the same period 2009.in 2012. Our principal producing properties in this region are located in the Anadarko and Arkoma basins of Oklahoma, as well as various basins of Texas and Louisiana.Oklahoma Woodford ShaleThe Oklahoma Woodford is a widespread unconventional shale reservoir that produces crude oil, natural gas and natural gas condensateemerging SCOOP play in various basins across the state ofsouth-central Oklahoma.principal producingSCOOP properties in the Oklahoma Woodford are located in the Arkomasouthern Oklahoma primarily in Garvin, Grady, Stephens, Carter, McClain and Anadarko basins. Combined, these propertiesLove Counties. SCOOP represented 10%16% of our PV-10 as of December 31, 20102013 and 13% of our net average daily Boe production for the three months ended December 31, 2010. Production from the Oklahoma Woodford for 2010 totaled 1,928 MBoe (11,568 MMcfe), up 17% over 2009. Production increased throughout the year, and the average daily production for our Oklahoma Woodford properties for the month of December 2010 was 6,144 Boe per day, up 41% over our daily average production for the month of December 2009. As of December 31, 2010, we held 589,742 gross (322,194 net) acres in the play. As of December 2010, 18% of the net acreage is developed and the remaining 82% of the net acreage is undeveloped.During 2010 we completed 67 gross (15.1 net) Oklahoma Woodford wells. During 2011, we plan to invest approximately $230 million drilling 113 gross (31.1 net) wells in the Oklahoma Woodford. As of February 18, 2011 we had 11 rigs drilling in the Oklahoma Woodford and expect to maintain 8 to 10 rigs in the play throughout 2011.Arkoma Woodford Shale.The Arkoma Woodford represented 6% of our PV-10 as of December 31, 2010 and 9% of our average daily Boe production for the three months ended December 31, 2010. Year-over-year, Arkoma Woodford2013. For the year ended December 31, 2013, SCOOP production was down 5%grew 318% over 2012 due to ourscaled back increased drilling programactivity in 2010. During the month ofplay. For the three months ended December 2010, however, our Arkoma Woodford31, 4,253 net23,754 Boe per day, up 19%233% over our average daily production in December 2009, reflecting results of wells we completed in the second half of 2010. As of December 31, 2010 we have completed a total of 387 gross (57.5 net) wells in the Arkoma Woodford play.During 2010, we completed a total of 50 gross (6.5 net) wells, as compared to 71 gross (8.5 net) wells in 2009. These completions included a combination of 640-acre exploratory and 80-acre infield development type wells. We also licensed 10 squares miles of 3D seismic data during 2010 to provide guidance for our exploration and development drilling in the East McAlester area. In total, we now own approximately 150 square miles of proprietary and non-proprietary 3D seismic data in the Arkoma basin to complement our drilling effort. As of December 31, 2010, we owned approximately 147,727 gross (43,613 net) acres in the Arkoma Woodford play, of which 52% of our net acreage is developed and the remaining 48% of our net acreage is undeveloped. A total of 339 gross (94.1 net) proven undeveloped locations have been identified on this acreage as of December 31, 2010.In 2011, we plan to invest approximately $9 million to drill 14 gross (2.3 net) wells in the Arkoma Woodford play. As of February 18, 2011, we had 1 operated rig drilling in the Arkoma Woodford play.Anadarko Woodford Shale. The Anadarko Woodford represented 4% of our PV-10 as of December 31, 2010 and 4% of our average daily Boe production for the three months ended December 31, 2010. Our Anadarko Woodford production grew 333% year-over-year due to our increased drilling activity in 2010. During the month2012. As of December 2010, our Anadarko Woodford production averaged 1,891 net Boe per day, up 136% over our average daily production in December 2009.31, We control one of the largest acreage positions in the Anadarko Woodford play, with 405,5752013, we held 677,684 gross (267,542(403,854 net) acres under lease in SCOOP, of which 12% of the net acreage was developed and the remaining 88% of the net acreage was undeveloped. Our inventory of proved undeveloped drilling locations in SCOOP as of December 31, 2010. This acreage is located2013 totaled 309 gross (153 net) wells.Canadian, Blaine, Dewey, Caddo, GradySCOOP during 2013 and McClain counties in Oklahoma, extending 51 miles northwest and 75 miles southeast from the Cana field area, where the initial discovery was made in late 2007. Approximately 68% of our acreage is located in our NW Cana project and 32% is located in our SE Cana project.Competition for acreage and equipment in the Anadarko Woodford grew rapidly during 2010 in response to continued success in the Cana field and our drilling success in our NW Cana and SE Cana projects. The industry rig count tripled during the year, from 15 rigs in January 2010 to 48 rigs as of February 18, 2011. Results from the 2010 drilling activity demonstrated that production from the Woodford Shale is widespread and repeatable, and suggests that the Anadarko Woodford may prove to contain greater recoverable reserves than the Arkoma Woodford.During 2010,December 31, 16145 gross (8.2 net) wells as compared to 4 gross (2.6(79 net) wells in 2009.SCOOP. Our 20102013 drilling program included exploration, step-out and development wells focused on de-risking the play and holding our acreage by production. The year 2013 was strategically designed to delineatea particularly impactful year for SCOOP as our drilling results and results from others in the extent of the productive Anadarko Woodfordindustry established both a crude oil and condensate rich, natural gas producing fairway that combined is approximately 20 miles wide and 120 miles long. Based on our acreage. Under this successful program, we completed key wells in both our NW Cana2013 drilling results, SCOOP is proving to be another significant asset for the Company with considerable potential for production and SE Cana projects, demonstrating that the productive Anadarko Woodford fairway extends at least 90 miles from known production at our Brown 1-2H well in Dewey County (NW Cana) to our Dana 1-29H well in Grady County (SE Cana). In NW Cana, the Doris 1-25H well (98% WI) was completed flowing at an initial 24-hour test rate of 4.5 MMcf of natural gas per day and 72 Bbls of crude oil per day. The Doris 1-25H well was located 4 miles south of our initial discovery well, the Brown 1-2H (100% WI) that was completed in September 2009. The Brown 1-2H well was completed flowing at 4.2 MMcf of natural gas per day and 102 Bbls of crude oil per day and produced a total of 1,208 MMcf of natural gas and 15,895 Bbls of crude oil as of December 31, 2010. In our SE Cana project we completed the Dana 1-29H well (79% WI) flowing at 2.5 MMcf per day of liquids-rich natural gas and 88 Bbls of crude oil per day during its initial 24-hour test period. The Dana 1-29H well was a key completion for us in SE Cana, as it confirmed our geologic model that higher production rates can be achieved from the upper siliceous member of the Woodford shale in SE Cana. In January 2011, we confirmed the success of the Dana 1-29H well by completing the Sprowls 1-14H well located 17 miles north of the Dana 1-29H well. The Sprowls 1-14H well (100% WI) was completed flowing at 2.8 MMcf of natural gas per day and 96 Bbls of crude oil per day during its initial 24-hour test period. Based on these positive results, we increased our operated rig count in the Anadarko Woodford from 1 operated rig in January 2010 to 10 operated rigs as of February 18, 2011.Anreserve growth.the Anadarko WoodfordSCOOP is the potential to encounter additional pay from a variety of conventional and potential unconventional reservoirs overlying and underlying the Woodford. With the Anadarko basin being one of the more prolific crude oil and natural gas producing basinsWoodford formation. There are over 60 different conventional reservoirs known to produce in the United States, there are up to 12 conventional reservoirs overlying the Anadarko Woodford shale. All of theseSCOOP area. These conventional reservoirs have the potential to produce locally under our Anadarko WoodfordSCOOP acreage. A good example is our Rother 1-4H well (100% WI), which encountered a productive reservoir in an overlying Springer sand while drilling to the Woodford shale. After completing the Rother 1-4H well as a Woodford producer, we drilled a second well, the Rother 2-4 (80% WI) to produce the Springer reservoir. The Rother 2-4 well produced 4.9 MMcf of natural gas per day and 91 Bbls of crude oil per day during its initial 24-hour test period. Springer sand reservoirs can be quite prolific, and since being completed in November 2010, the Rother 2-4 well has produced 221 MMcf of natural gas and 3,926 Bbls of crude oil as of December 31, 2010. To date, 37% of our Woodford wells have encountered productive reservoirs in overlying Tonkawa, Red Fork, Morrow, Springer and/or Mississippian reservoirs, while drilling to the Woodford shale.2011,2014, we plan to invest approximately $221$865 million to drill 99159 gross (28.8(72 net) wells in the SCOOP play. Approximately 40% of these wells will be multi-unit wells. Multi-unit wells enable us to further delineatedrill two spacing units from one location, which reduces well costs and developour overall surface footprint. The 2014 drilling program will continue to focus on expanding the Anadarko Woodford shale onknown productive extents of SCOOP and de-risking our acreage. It will also include pilot density projects to determine the optimum well spacing and pattern for full scale development of SCOOP in the future. We also expect to invest approximately $19 million to acquire approximately 230 square miles of additional proprietary 3D seismic data to guide future drilling. As of February 18, 2011,December 31, 2013, we had 1018 operated rigs drilling in the Anadarko Woodford play,SCOOP play.expecttransportation companies at the wellhead with price realizations that correlate with WTI benchmark pricing. We anticipate continuing this approach through early 2015 and to have 2 additional rigs drillingbegin delivery of production from our SCOOP properties via wellhead pipeline gathering and intrastate pipeline systems directly into Cushing as field infrastructure is constructed and developed. play by the end of first quarter 2011. To support our drilling program, we are investing approximately $12 million dollars to acquire approximately 500 square miles of proprietary 3D seismic to guide future drilling on our acreage. As of December 31, 2010, we had a total of 80 gross (41.4 net) proven undeveloped locations identified on our Anadarko Woodford acreage.Conventional Anadarko Basin and Gulf CoastOur conventional producing properties in the Anadarko basinSCOOP as third party midstream gathering and Gulf Coast areas represented 2% ofprocessing companies expanded field gathering and compression facilities, cryogenic processing capacity and NGL pipeline capacity to market centers. Throughout our PV-10 as of December 31, 2010 and 6% ofSouth region leasehold, we are coordinating our average daily Boe production for the three months ended December 31, 2010. The properties primarily include our legacy assetswell completion operations to coincide with well connections to gathering systems in Oklahoma along the Anadarko Basin Shelf, the Jefferson Island Salt Dome in Iberia Parish, Louisiana, and producing properties in Nueces County, Texas. We continueorder to maximize the performance of these properties through workovers, recompletions and drilling as warranted. Year-over-year our conventional Anadarko and Gulf Coast production declined 13% due to normal production declines and our limited drilling activity. During the month of December 2010 however, production averaged 3,269 net Boe per day, up 12% over our average daily production in December 2009 reflecting results of wells we completed in the second half of 2010. We completed 11 gross (4.9 net) wells in the conventional Anadarko and Gulf Coast areas during 2010.East Regionminimize greenhouse gas emissions.Our properties in the East region represent 2% of our PV-10 as of December 31, 2010. During the three months ended December 31, 2010, our average daily production from such properties was 1,292 net Bbls of crude oil and 128 net Mcf of natural gas. Our principal producing properties in this region are located in the Illinois Basin, Michigan Basin, and portions of the Appalachian Basin in the eastern United States.Illinois BasinOur properties within the Illinois Basin represented 33% of our PV-10 in the East region as of December 31, 2010 and 59% of our average daily East region Boe production for the three months ended December 31, 2010. Our production within the Illinois Basin is primarily crude oil from units comprised of shallow sand formations under water injection. We continue to maximize the performance of these properties through workovers, recompletions and drilling as warranted.Michigan Trenton-Black RiverOur Trenton-Black River properties located in Hillsdale Co., Michigan represented 15% of our PV-10 in the East region as of December 31, 2010 and 16% of our average daily East region Boe production for the three months ended December 31, 2010. We owned approximately 76,500 gross (58,800 net) acres in the play as of December 31, 2010. Since drilling our first well on the properties in 2007, we have drilled and completed 20 gross (12.3 net) wells with net success of 55%.Drilling on these properties has been guided by our proprietary 3D seismic interpretation techniques. We currently own 46 square miles of 3D seismic data on the properties and have numerous additional drilling locations. We plan to acquire an additional 10.6 square miles of 3D seismic during 2011 to identify additional drilling opportunities.2010, 20092013, 2012 and 20082011 in total and for each field containing 15 percent or more of our total proved reserves as of December 31, 2010: Year Ended December 31, 2010 2009 2008 4,450 2,257 1,145 9 13 8 11,820 10,022 9,147 3,994 1,729 720 8,726 9,152 5,407 23,943 21,606 17,151 15,811 13,623 12,006 $ 70.09 $ 55.06 $ 83.68 72.88 58.46 80.74 70.69 54.44 88.87 6.38 4.73 10.62 4.22 3.50 7.24 4.49 3.22 6.90 59.70 45.10 77.66 $ 2.94 $ 3.64 $ 14.06 2.39 2.10 7.87 5.87 6.89 8.40 4.82 3.37 4.84 3.09 3.03 2.95 15.33 15.34 12.30 Year ended December 31, 2013 2012 2011 Net production volumes: Crude oil (MBbls) (1) North Dakota Bakken 23,513 15,936 8,480 SCOOP 2,004 478 96 Total Company 34,989 25,070 16,469 Natural gas (MMcf) North Dakota Bakken 26,783 16,454 7,523 SCOOP 29,438 7,060 1,927 Total Company 87,730 63,875 36,671 Crude oil equivalents (MBoe) North Dakota Bakken 27,977 18,679 9,733 SCOOP 6,910 1,654 417 Total Company 49,610 35,716 22,581 Average sales prices: (2) Crude oil ($/Bbl) North Dakota Bakken $ 89.45 $ 84.50 $ 88.43 SCOOP 95.63 89.37 93.02 Total Company 89.93 84.59 88.51 Natural gas ($/Mcf) North Dakota Bakken $ 6.26 $ 5.55 $ 7.18 SCOOP 5.59 4.01 7.56 Total Company 5.25 4.20 5.24 Crude oil equivalents ($/Boe) North Dakota Bakken $ 81.17 $ 76.95 $ 82.56 SCOOP 51.55 34.01 56.30 Total Company 72.71 66.83 73.05 Average costs per Boe: (2) Production expenses ($/Boe) North Dakota Bakken $ 5.50 $ 4.31 $ 4.05 SCOOP 0.99 1.02 1.30 Total Company 5.69 5.49 6.13 Production taxes and other expenses ($/Boe) $ 6.69 $ 6.42 $ 6.42 General and administrative expenses ($/Boe) (3) $ 2.91 $ 3.42 $ 3.23 DD&A expense ($/Boe) $ 19.47 $ 19.44 $ 17.33 (1) Crude oil sales volumes varydiffer from production volumes because, at various times, we have stored crude oil in inventory due to pipeline line fill requirements, low commodity prices, or because of low pricestransportation constraints or we have sold crude oil from inventory. Crude oil sales volumes were 78 MBbls more than production volumes for the year ended December 31, 2010, 824 MBbls less than production volumes for the year ended December 31, 2009 and 97 MBbls more than production volumes for the year ended December 31, 2008.2013,(2) Average sales prices and per unit costs have been calculated using sales volumes and exclude any effect of derivative transactions. (3) General and administrative expense ($/Boe) includes non-cash equity compensation expenseexpenses of $0.74$0.80 per Boe, $0.84$0.82 per Boe, and $0.75$0.73 per Boe for the years ended December 31, 2010, 20092013, 2012 and 2008,2011, respectively, and corporate relocation expenses of $0.04 per Boe, $0.22 per Boe and $0.14 per Boe for the years ended December 31, 2013, 2012, and 2011, respectively.2010: Fourth Quarter 2010 Daily Production Crude Oil Natural Gas Total (Bbls per day) (Mcf per day) (Boe per day) 15,393 14,648 17,834 4,076 3,662 4,686 10,372 2,938 10,862 2,684 2,097 3,034 689 3,111 1,207 183 9,135 1,705 19 26,303 4,403 588 14,404 2,989 1,292 129 1,314 35,296 76,427 48,034 Fourth Quarter 2013 Daily Production Crude Oil
(Bbls per day) Natural Gas
(Mcf per day) Total
(Boe per day)North Region: Bakken field North Dakota Bakken 67,164 79,263 80,374 Montana Bakken 11,422 9,237 12,961 Red River units Cedar Hills 10,101 2,382 10,498 Other Red River units 3,468 2,592 3,900 Other 367 2,672 812 South Region: SCOOP 6,567 103,121 23,754 Northwest Cana 542 36,920 6,696 Arkoma Woodford 4 16,594 2,769 Other 808 10,085 2,490 Total 100,443 262,866 144,254 2010: Crude Oil
Wells Natural Gas
Wells Total Wells Gross Net Gross Net Gross Net 510 182 5 1 515 183 191 124 2 1 193 125 257 233 2 2 259 235 235 218 5 2 240 220 4 4 18 9 22 13 — — 369 53 369 53 216 169 244 124 460 293 654 534 14 10 668 544 2,067 1,464 659 202 2,726 1,666 Crude Oil Wells Natural Gas Wells Total Wells Gross Net Gross Net Gross Net North Region: Bakken field North Dakota Bakken 2,261 778 6 1 2,267 779 Montana Bakken 361 232 2 1 363 233 Red River units Cedar Hills 136 130 — — 136 130 Other Red River units 145 131 — — 145 131 Other 33 15 4 1 37 16 South Region: SCOOP 45 23 96 51 141 74 Northwest Cana 11 6 157 67 168 73 Arkoma Woodford 3 — 397 59 400 59 Other 208 162 232 115 440 277 Total 3,203 1,477 894 295 4,097 1,772 2010,2013, we did not own interests in any wells containing multiple completions.we initiallyupon initiation of fee leasing of undeveloped leasehold which does not have associated proved reserves, contract landmen conduct only a cursory reviewtitle examination of courthouse records. Such title examinations are reviewed and approved by Company landmen. Prior to closing an acquisition from a third party, whether producing crude oil and natural gas leases or non-producing, Company and contract landmen perform title examinations at applicable courthouses and examine the seller's internal land, legal, well, marketing and accounting records including existing title opinions. We may procure an acquisition title opinion depending on the materiality of the title to our properties on which we do not have proved reserves. involved.those properties,any property, we endeavor to conductprocure a thorough title examinationopinion from external legal counsel and perform curative work with respectnecessary to significantsatisfy requirements pertaining to material title defects. To the extent title opinions or other investigations reflect title defects on those properties, we are typically responsible for curing any title defects at our expense. We generally will not commence drilling operations on a property until we have cured any material title defects on such property.obtainedprocured and cured title opinions on substantially all of our producing properties and believe that we have satisfactorydefensible title to our producing properties in accordance with standards generally accepted in the crude oil and natural gas industry. Prior to completing an acquisition of producing crude oil and natural gas leases, we perform title reviews on the most significant leases and, depending on the materiality of the properties, we may obtain a title opinion or review previously obtained title opinions. Our crude oil and natural gas properties are subject to customary royalty and other interests liens to secure borrowings under our revolving credit facility, liens for current taxes and other burdens which we believe do not materially interfere with the use of the properties or affect our carrying value of such properties.We primarily sella pipeline gathering system, althoughsystems, with the remaining balance of our production isbeing transported by truck.truck or rail. Where thedirectly marketed crude oil that is directly marketed is transported by truck, the crude oilit is delivered to the most practical point on a pipeline system for delivery to a sales point “downstream” on another connecting pipeline. Crude oil that is sold at the lease is delivered directly onto the purchasers’purchaser’s truck and the sale is complete at that point.Beginning in the third quarter of 2010 and through the present, as and the continuous increase in Williston Basin production, and our desire to transport our crude oil to U.S. coastal markets which provide favorable pricing, in December 2013 we are shipping a growing portiontransported approximately 70% of our operated crude oil production from our North region crude oil by rail car.rail. We are using both manifest and unit train facilities for these shipments and anticipate that these shipments will continue and likely grow through the duration of 2011.market based on published pricing. Our newestmarket. Some of our contracts allow us the flexibility to sell at the well or, with notice, take our gas “in-kind”, transport, process, and sell in the market area. Midstream natural gas gathering and processing companies are our primary transporters and purchasers.parties.parties, and on the availability of rail transportation.yearyears ended December 31, 2010, 20092013, 2012 and 2008, crude oil2011, sales to Marathon Crude Oil Company accounted for approximately 57%12%, 56%21% and 44%41% of our total crude oil and natural gas revenues, respectively. Sales to United Energy Trading accounted for approximately 11% of our total crude oil and natural gas revenues for both of the years ended December 31, 2013 and 2012. Additionally, sales to Tesoro Refining and Marketing Company accounted for approximately 15% of our total crude oil and natural gas revenues for the year ended December 31, 2013. No other purchasers accounted for more than 10% of our total crude oil and natural gas salesrevenues for 2010, 20092013, 2012 and 2008.2011. We believe that the loss of our largest purchaser would not have a material adverse effect on our operations, as therecrude oil and natural gas are a number of alternative crude oilfungible products with well-established markets and numerous purchasers in our producing regions. substantially greater than ours, which can be particularly important in the areas in which we operate. Those companies may be able to pay more for productive crude oil and natural gas properties and exploratory prospects and to evaluate, bid for and purchase a greater number of properties and prospects than our financial or personnel Also, there is substantial competition for capital available for investment in the crude oil and natural gas industry.other policy implementationsinterpretations affecting the crude oil and natural gasour industry have been pervasive and are continuously reviewed for modification,by legislators and regulators, including the imposition of new or increased requirements on us and other industry participants. Applicable laws and regulations and other requirements affecting our industry and its members often carry substantial penalties for failure to comply. Such laws and regulationsrequirements may have a significant effect on the exploration, development, production and sale of crude oil and natural gas. These laws and regulationsrequirements increase the cost of doing business and, consequently, affect profitability. We believe that we are in substantial compliance with all laws and regulations and policies currently applicable to our operations and that our continued compliance with existing requirements will not have a material adverse impact on us. However, because public policy changes affecting the crude oil and natural gas industry are commonplace and because existing laws and regulations may be amended or reinterpreted, we are unable to predict the future cost or impact of complying with such laws and regulations. We do not expect that any future legislative or regulatory initiatives will affect our operations in a manner materially different than they would affect our similarly situated competitors.Transportationsales and Salestransportation of Crude Oilcondensate and natural gas liquids or condensate in the United States are not currently regulatedsubject to price controls and are made at negotiated prices. Nevertheless, the U.S. Congress could reenactenact price controls in the future. The United States does regulate the exportation of petroleum and petroleum products, and these regulations could restrict the markets for these commodities and thus affect sales prices. With regard to our physical sales of these energy commoditiescrude oil and derivative tradinginstruments relating to these commodities,crude oil, we are required to observecomply with anti-market manipulation laws and related regulations enforced by the Federal Trade Commission (“FTC”) and the Commodity Futures Trading Commission (“CFTC”). See the discussion below of “Other Federal Laws and Regulations Affecting Our Industry.Industry—FTC and CFTC Market Manipulation Rules.” Should we violate the anti-market manipulation laws and regulations, we could be subject to substantial penalties and related third-party damage claims by, among others, sellers, royalty owners and taxing authorities.in common carrier pipelinesand NGLs, as well as other liquid products, is subject to rate and access regulation. The Federal Energy Regulatory Commission (the “FERC”(“FERC”) regulates interstate crude oil and NGL pipeline transportation rates under the Interstate Commerce Act.Act and the Energy Policy Act of 1992 and the rules and regulations promulgated under those laws. In general, interstate crude oil pipeline rates must be just and reasonable and must not be unduly discriminatory or confer any undue preference upon any shipper. Oil and other liquid pipeline rates are often cost-based, although many pipeline charges today are today based on historical rates adjusted for inflation and other factors, and other charges may result from settlement rates agreed to by all shippers or market-based rates, which are permitted in certain circumstances.aremay be subject to regulation by state regulatory commissions. The basis for intrastate crude oil pipeline regulation, and the degree of regulatory oversight and scrutiny given to intrastate crude oil pipeline rates, varies from state to state. Insofar as the interstate and intrastate transportation rates that we pay are generally applicable to all comparable shippers, we believe that the regulation of crude oilintrastate transportation rates will not affect our operations in a way that materially differs from the effect on the operations of our competitors who are similarly situated. crude oil pipelines must provide service on an equitable basis. Under this standard, common carrierssuch pipelines must offer service to all similarly situated shippers requesting service on the same terms and under the same rates. When crude oilsuch pipelines operate at full capacity, access is governed by prorating provisions, which may be set forth in the pipelines’ published tariffs. Accordingly,We believe we believe thatgenerally will have access to crude oil pipeline transportation services generally will be available to us to the same extent as to our similarly situated competitors.Transportationsales and Sales of Natural GasHistorically, the transportation and sale for resale of natural gas in interstate commerce have been regulated by agencies ofFederal government, primarily the FERC and its predecessor agency. In the past, the Federal government has regulated the prices at which natural gas could be sold. While sales by producers of natural gas can currently be made at uncontrolled market prices, U.S. Congress could reenact price controls in the future. Deregulation of wellhead natural gas sales began with the enactment of the Natural Gas Policy Act and culminated in adoption ofenacted the Natural Gas Wellhead Decontrol Act, which removed all remaining price and non-price controls affecting wellhead sales of natural gas. The FERC, which has the authority under the Natural Gas Act (“NGA”) to regulate prices, terms, and conditions for the sale of natural gas effective January 1, 1993.that we produce, as well as the revenues we receive for sales of our natural gas. Since 1985, theThe FERC has endeavored to make natural gas transportation more accessible to natural gas buyers and sellers on an open and non-discriminatory basis. The FERC has stated that open access policies are necessary to improve the competitive structure of the interstate natural gas pipeline industry and to create a regulatory framework that will put natural gas sellers into more direct contractual relations with natural gas buyers by, among other things, unbundling the sale of natural gas from the sale of transportation and storage services. Beginning in 1992, theThe FERC has issued a series of orders to implement its open access policies. As a result, the interstate pipelines’ traditional role as wholesalers of natural gas has been eliminated and replaced by a structure under which pipelines provide transportation and storage serviceservices on an open access basis to others who buy and sell natural gas. Although the FERC’s orders do not directly regulate natural gas producers, they are intended to foster increased competition within all phases of the natural gas industry. We cannot provide any assurance that the less stringentpro-competitive regulatory approach established by the FERC will continue. However, we do not believe that any action taken will affect us in a materially different way that materially differs from the way it affectsthan other natural gas producers.The prices at which we sell natural gas are not currently subject to federal rate regulation and, for the most part, are not subject to state regulation. However, withtradinginstruments relating to natural gas, we are required to observe anti-market manipulation laws and related regulations enforced by the FERC and the CFTC. See the discussion below of “Other Federal Laws and Regulations Affecting Our Industry.Industry—FTC and CFTC Market Manipulation Rules.” Should we violate the anti-market manipulation laws and regulations, we could be subject to substantial penalties and related third partythird-party damage claims by, among others, sellers, royalty owners and taxing authorities. In addition, pursuant to various FERC Order Nos. 704, 720 and 735, some of our operationsorders, we may be required to submit reports to the FERC or post data on the internet regarding certain market transactions.for some of our operations. See the discussion below of “Other Federal Laws and Regulations Affecting Our Industry—FERC Market Transparency and Reporting Rules.”includeincludes various safety, environmental, and in some circumstances, nondiscriminatoryequitable take requirements. Natural gas gathering may receive greater regulatory scrutiny at both the state and federal levels in the future. We cannot predict what effect, if any, such changes mightmay have on our operations, but the natural gas industry could be required to incur additional capital expenditures and increased costs depending on future legislative and regulatory changes.changes, including changes in the interpretation of existing requirements or programs to implement those requirements. We do not believe that we would be affected by any such regulatory changes in a materially different way that materially differs from the way it affectsthan our similarly situated competitors. that we produce, as well as the revenues we receive for sales of our natural gas. The basis for intrastate regulation of natural gas transportation and the degree of regulatory oversight and scrutiny given to intrastate natural gas pipeline rates and services varies from state to state. Insofar as such regulation within a particular state will generally affect all intrastate natural gas shippers within the state on a comparable basis, we believe that the regulation of similarly situated intrastate natural gas transportation in any states in which we operate and ship natural gas on an intrastate basis will not affect our operations in a way that materially differs from the effect on the operations of our similarly situated competitors.Productionlocal,federal, state and federallocal statutes, rules, orders and regulations. Federal, state and local statutes and regulations, which require, among other matters, permits for drilling operations, drilling bonds and reports concerning operations. All of the states in which we own and operate properties have regulations governing conservation, matters, including provisions for the unitization or pooling of crude oil and natural gas properties, the establishment of maximum allowable rates of production from crude oil and natural gas wells, the regulation of well spacing, and the plugging and abandonment of wells. The effect of these regulations is to limit the amount of crude oil and natural gas that we can produce from our wells and to limit the number of wells or the locations at which we can drill, although we can apply for exceptions to such regulations or to have reductions in well spacing. Moreover, each state generally imposes a production, severance or excise tax with respect to the production and sale of crude oil, natural gas and natural gas liquids within its jurisdiction.Federal Lawsfederal laws and Regulations Affecting Our IndustryAct.OnAct. In July 21, 2010, President Obama signed into law the Dodd-Frank Wall Street Reform and Consumer Protection Act (the “Dodd-Frank Act”), which, among other things, establishes federal oversight and regulation of the was enacted into law. This financial reform legislation includes provisions that require many derivative transactions that were then executed over-the-counter derivatives market and the entities, such as us, that participate in that market. Significant regulations are required to be promulgated byexecuted through an exchange and be centrally cleared. The Dodd-Frank Act requires the CFTC, the SEC, and the Commodity Futures Trading Commission within 360 days from the date of enactmentother regulators to establish rules and regulations to implement the new legislation. The CFTC has issued final regulations to implement significant aspects of the legislation, including new rules for the registration of swap dealers and major swap participants (and related definitions of those terms), definitions of the term “swap,” rules to establish the ability to rely on the commercial end-user exception from the central clearing and exchange trading requirements, requirements for reporting and record keeping, rules on customer protection in the context of cleared swaps, and position limits for swaps and other transactions based on the price of certain reference contracts, some of which are referenced in our swap contracts. The position limits regulation has been vacated by a Federal court; however, the CFTC has proposed replacement rules. Key regulations that have not yet been finalized include those establishing margin requirements for uncleared swaps and regulatory capital requirements for swap dealers.hedge and otherwise manage our financial and commercial risks related to fluctuations in commodity prices,prices. Additional effects of the new regulations, including increased regulatory reporting and recordkeeping costs, increased regulatory capital requirements for our counterparties, and market dislocations or disruptions, among other consequences, could have an adverse effect on our ability to hedge risks associated with our business. Many ofkey concepts and processes underSEC had planned to adopt the Dodd-Frank Act arerequirement that registrants disclose certain payments made to the U.S. Federal government and foreign governments in connection with the commercial development of crude oil, natural gas or minerals. The disclosure requirements were challenged by certain business groups and were subsequently vacated by a Federal court in July 2013. The SEC did not definedappeal the ruling and must be delineated by rules and regulationsplans to issue a revised proposal, the timing of which have been and are beingis uncertain. by the applicable regulatory agencies. As a consequence, it is not possible at this time to predict the effects that the Dodd-Frank Act requirement that registrants disclose the use of conflict minerals in their products, and whether any of those minerals originated in certain conflict-ridden regions of Africa and financed or benefited armed groups. Certain business groups challenged the resulting rules and regulations may have ondisclosure requirements; however, the requirements were upheld by a Federal court in a July 2013 ruling. The ruling has been appealed by the plaintiffs involved in the matter. We monitor our hedging activities. On August 8, 2005, President Bush signed into law the Domenici-Barton The Energy Policy Act of 2005 (“EPAct 2005”). The EPAct 2005 included a comprehensive compilation of tax incentives, authorized appropriations for grants and guaranteed loans, and made significant changes to the statutory framework affecting the energy industry. Among other matters, EPAct 2005 amended the Natural Gas Act (the “NGA”)NGA to add an anti-market manipulation provision which makesmaking it unlawful for any entity, including otherwise non-jurisdictional producers such as us, to use any deceptive or manipulative device or contrivance in connection with the purchase or sale of natural gas or the purchase or sale of transportation services subject to regulation by the FERC, in contravention of rules prescribed by the FERC. OnIn January 19, 2006, the FERC issued Order No. 670, which contained rules implementing the anti-market manipulation provision of EPAct 2005. The rules make it unlawful: (1) in connection with the purchase or sale of natural gas subject to the jurisdiction of the FERC, or the purchase or sale of transportation services subject to the jurisdiction of the FERC, for any entity, directly or indirectly, to use or employ any device, scheme or artifice to defraud; (2) to make any untrue statement of material fact or omit to make any such statement necessary to make the statements made not misleading; or (3) to engage in any act or practice that operates as a fraud or deceit upon any person. These anti-market manipulation rules do not apply to activities that relate only to intrastate or other non-jurisdictional sales or gathering, but do apply to activities of natural gas pipelines and storage companies that provide interstate services, as well as otherwise non-jurisdictional entities to the extent the activities are conducted “in connection with” natural gas sales, purchases or transportation subject to FERC jurisdiction, which now includes the annual reporting requirements under FERC Order No. 704, which isas described further below.increased the FERC’s civil penalty authority under the Natural Gas Policy Act of 1978 (“NGPA”) from $5,000 per violation per day to $1,000,000 per violation per day.NGPA. Under EPAct 2005, the FERC also has authority to order disgorgement of profits associated with any violation. The civil penalty provisions are applicable to entities that engage in the sale of natural gas for resale in interstate commerce. The anti-market manipulation rulerules and enhanced civil penalty authority reflect an expansion of the FERC’s NGA enforcement authority. On December 26, 2007, the The FERC issued a final rule, as amended on rehearing (“Order No. 704”) on the annual natural gas transaction reporting requirements. Under Order No. 704,requires wholesale buyers and sellers of more than 2.2 million MMBtuMMBtus of physical natural gas in the previous calendar year, including interstate and intrastate natural gas pipelines, natural gas gatherers, natural gas processors, natural gas marketers, and natural gas producers, are required to report, on May 1 of each year, aggregate volumes of natural gas purchased or sold at wholesale in the prior calendar year to the extent such transactions utilize, contribute to, or may contribute to the formation of price indices. Order No. 704The FERC also requires market participants to indicate whether they report prices to any index publishers and, if so, whether their reporting complies with the FERC’s policy statement on price reporting. Failure to comply with these reporting requirements could subject us to enhanced civil penalty liability provided under EPAct 2005.EISA.EISA, including authority to request that a court impose fines of up to $1,000,000 per day per violation. Under the Commodity Exchange Act, the CFTC is directed to prevent price manipulations for the commodity and futures markets, including the energy futures markets. Pursuant to the Dodd-Frank Act, the CFTC has adopted anti-market manipulation regulations that prohibit, among other things, fraud and price manipulation in the commodity and futures markets. The CFTC also has statutory authority to assess fines of up to the greater of $1,000,000 or triple the monetary gain for violations of its anti-market manipulation regulations. Knowing or willful violations of the Commodity Exchange Act may also lead to a felony conviction.mightmay affect the crude oil and natural gas industry are pending before the U.S. Congress, the FERC and the courts. We cannot predict the ultimate impact of these or the above regulatory changes to our crude oil and natural gas operations. We do not believe that we wouldwill be affected by any such action materially different than similarly situated competitors.Healthhealth and Safety Regulationsafety regulationGeneral. Our operations are subject to stringent and complex federal, state, and local laws and regulations governing environmental protection, health and safety, including the discharge of materials into the environment. These laws and regulations may, among other things:thea rate that would otherwise be possible. The regulatory burden on the crude oil and natural gas industry increases the cost of doing business in the industry and consequently affects profitability. Additionally, the U.S. Congress and federal and state agencies frequently revise environmental, health and safety laws, rules and regulations, and any changes that result in more stringent and costly waste handling, disposal, cleanup and remediation requirements for the crude oil and natural gas industry could have a significant impact on our operating costs.to which our business operationswe are subject to include, among others,others: (i) regulations by the Environmental Protection Agency (“EPA”) and various state agencies regarding approved methods of disposal for certain hazardous and nonhazardous wastes; (ii) the Comprehensive Environmental Response, Compensation, and Liability Act and analogous state laws that may require the removal of previously disposed wastes (including wastes disposed of or released by prior owners or operators), the cleanup of property contamination (including groundwater contamination), and remedial plugging operations to prevent future contamination; (iii) the federal pipelineDepartment of Transportation safety laws and comparable state and local requirements; (iv) the Clean Air Act and comparable state and local requirements, which establish pollution control requirements with respect to air emissions from our operations; (v) the Oil Pollution Act of 1990, which contains numerous requirements relating to the prevention of and response to oil spills into waters of the United States; (vi) the Federal Water Pollution Control Act, or the Clean Water Act, and analogous state laws which impose restrictions and strict controls with respect to the discharge of pollutants, including crude oil and other substances generated by our operations, into waters of the United States or state waters; (vii) the Resource Conservation and Recovery Act, which is the principal federal statute governing the treatment, storage and disposal of solid and hazardous wastes, and comparable state law;statutes; (viii) the Safe Drinking Water Act and analogous state laws which impose requirements relating to our underground injection activities; (ix) the National Environmental Policy Act and comparable state statutes, which requires federalrequire government agencies, including the Department of Interior, to evaluate major agency actions that have the potential to significantly impact the environment; (x) the federal Occupational Safety and Health Act ("OSHA") and comparable state statutes, which require that we organize and/or disclose information about hazardous materials stored, used or produced in our operations, and (xi) state regulations and statutes governing the handling, treatment, storage and disposal of naturally occurring radioactive material.We have incurred in the past, and expect to incur in the future, capital and other expenditures related to environmental compliance. Such expenditures, however, are included within our overall capital and operating budgets and are not separately itemized. Although we believe that our continued compliance with existing requirements will not have a material adverse impact on our financial condition and results of operations, we cannot assure you that the passage of more stringent laws or regulations in the future will not have a negative impact on our financial position or results of operations.thatthe emission of carbon dioxide emissions and other identified greenhouse gases“greenhouse gases” may have on the environment and climateOnSince its December 15, 2009 endangerment finding regarding the EPA published its findings that emissionsemission of carbon dioxide, methane and other greenhouse gases, present an endangerment to human health and the environment because emissions of such gases are, according to the EPA contributing to the warming of the earth’s atmosphere and other climatic changes. These findings by the EPA have allowed the agency to implement regulations that restrict emissionshas begun regulating sources of greenhouse gasesgas emissions under existing provisions of the federal Clean Air Act. In April 2010, the EPA finalizedAmong several regulations that will require a reduction in emissions ofrequiring reporting or permitting for greenhouse gases from motor vehicles beginning in 2011. In May 2010,gas sources, the EPA finalized its “tailoring rule”, which sets forth criteria for determining in May 2010 that identifies which stationary sources of greenhouse gases are required to obtain permits to construct, modify or operate on account of, and to implement the best available control technology for, their greenhouse gases. In September 2009, the EPA finalized a rule that requires reporting of greenhouse gas emissions from specified large sources in the United States for emissions occurring in the prior calendar year. In November 2010, the EPA also finalized its greenhouse gas reporting requirements for certain oil and gas production facilities that emit 25,000 metric tons or more of carbon dioxide equivalent per year. ThisThe rule became effective on December 30, 2010 and requires annual reporting to the EPA of greenhouse gas emissions toby such regulated facilities.March 2012 for emissions during 2011,January 1, 2015. Compliance with such rules could result in significant costs, including increased capital expenditures and annually thereafter. Also, legislation has been proposedoperating costs, and could adversely impact our business.bothrecent years the U.S. House of Representatives and Senate that would establishCongress has considered establishing a cap-and-tradethesepast proposals, the EPA would issue or sell a capped and steadily declining number of tradable emissions allowances to certain major sources of greenhouse gas emissions so that such sources could continue to emit greenhouse gases into the atmosphere. These allowances would be expected to escalate significantly in cost over time. The net effect of such legislation, if adopted, would be to impose increasing costs on the combustion of carbon-based fuels such as crude oil, refined petroleum products, and natural gas.that we sell, emits carbon dioxide and other greenhouse gases. Thus, any one of thecurrent or future federal, state or local climate change initiatives could have a material adverse effect on our business. The climate change laws and regulations could adversely affect demand for the crude oil and natural gas that we produce by stimulating demand for alternative forms of energy that do not rely on the combustion of fossil fuels.fuels, and therefore could have a material adverse effect on our business. Although our compliance with any regulation of greenhouse gasesgas regulations may result in increased compliance and operating costs, we do not expect the compliance costs to comply with thefor currently applicable regulations to be material. ItMoreover, while it is not possible at this time to estimate the compliance costs or operational impacts we could experience to comply withfor any new legislative or regulatory developments. Wedevelopments in this area, we do not anticipate that we would bebeing impacted by the climate change initiatives to any greater degree than other similarsimilarly situated competitors. The U.S. Congress is considering legislation to amend the federal Safe Drinking Water Act to remove the exemption for hydraulic fracturing operations and require reporting and disclosure of chemicals used by the crude oil and natural gas industry in the hydraulic fracturing process, including, for example, the Fracturing Responsibility and Awareness of Chemicals Act of 2009. Hydraulic fracturing involves the injection of water, sand and chemicalsadditives under pressure into rock formations to stimulate crude oil and natural gas production. SponsorsSome activists have attempted to link hydraulic fracturing to various environmental problems, including adverse effects to drinking water supplies and migration of bills pending beforemethane and other hydrocarbons. As a result, several federal agencies are studying the environmental risks with respect to hydraulic fracturing or evaluating whether to restrict its use. From time to time, legislation has been introduced in the U.S. Congress have asserted that chemicalsto amend the federal Safe Drinking Water Act to eliminate an existing exemption for hydraulic fracturing activities from the definition of “underground injection,” thereby requiring the crude oil and natural gas industry to obtain permits for hydraulic fracturing and to require disclosure of the additives used in the fracturing processprocess. If adopted, such legislation could adversely affect drinking water supplies. These bills, if adopted, could increase the possibility of litigation and establish an additional level of regulation and permitting at the federal level that could prohibitlevel.lead to operational delays or increased operating costs and could result in additional regulatory burdens, makingmake it more difficult and more expensive to perform hydraulic fracturingcomplete crude oil and increasingnatural gas wells in low-permeability formations, increase our costs of compliance.compliance and doing business, and delay, prevent or prohibit the development of natural resources from unconventional formations. Compliance, or the consequences of anyour failure to comply, by us, could have a material adverse effect on our financial condition and results of operations. However, atAt this time it is not possible to estimate the potential impact on our business that may arise if such federal or state legislation is enacted into law. In addition, in March 2010 the EPA announced its intention to conduct a comprehensive research study on the potential adverse impacts that hydraulic fracturing may have on water quality and public health. Thus, even if the pending legislation is not adopted by the U.S. Congress, the EPA study, depending on its results, could spur further initiatives to regulate hydraulic fracturing under the Safe Drinking Water Act.2010,2013, we employed 493 people, including 272 employees in drilling and production, 75 in financial and accounting, 49 in land, 26 in exploration, 15 in reservoir engineering, 42 in administrative and 14 in information technology.929 people. Our future success will depend partially on our ability to attract, retain and motivate qualified personnel. We are not a party to any collective bargaining agreements and have not experienced any strikes or work stoppages. We consider our relations with our employees to be satisfactory. We utilize the services of independent contractors to perform various field and other services.web sitewebsite iswww.contres.com.www.clr.com. Through the investor relations section of our website, we make available free of charge our Annual Report on Form 10-K, Quarterly Reports on Form 10-Q, Current Reports on Form 8-K, and allany amendments to those reports as soon as reasonably practicable after the report is filed with or furnished to the Securities and Exchange Commission.SEC. For a current version of various corporate governance documents, including our Code of Ethics, please see our website. We intend to disclose amendments to, or waivers from, our Code of Ethics by posting to our website. Information contained aton our website is not incorporated by reference into this report and you should not consider information contained aton our website as part of this report.Securities and Exchange Commission.SEC. The public may read and copy any materials we file with the SEC at the SEC’s Public Reference Room at 100 F Street N.E., Washington, D.C. 20549. The public may obtain information about the operation of the Public Reference Room by calling the SEC at 1-800-SEC-0330. We file our reports with the SEC electronically. The SEC maintains an internet web sitewebsite that contains reports, proxy and information statements, and other information regarding issuers that file electronically with the SEC. The address of the SEC’s website is http://www.sec.gov.www.sec.gov.30220 N. Independence, Enid,Broadway, Oklahoma 73701,City, Oklahoma 73102, and our telephone number at that address is (580) 233-8955.Item 1A. Risk Factors of the other information contained in this report, before deciding to invest in shares of our common stock. If any of the following risks develop into actual events, our business, financial condition or results of operations could be materially adversely affected, the trading price of your shares could decline and you may lose all or part of your investment.us;us or, as a result of developments occurring in the future, conditions that we currently deem to be immaterial may also materially and adversely affect our business, financial condition, cash flows, and results of operations.Risks Relating to the Crude Oil and Natural Gas Industry and Our BusinessCountries, or OPEC;countries,countries;the current conflicts in the Middle East and conditions in South America and Russia;environmental regulations;fundamentalsfundamentals;availability;processing, storage and refining facilities;fuels.The slowdown in economic activity caused by the recent worldwide economic recession reduced worldwide demand forfuels or other energy and resulted in lower crude oil and natural gas prices. Crude oil prices declined from record high levels in early July 2008 of over $140 per Bbl to below $45 per Bbl in February 2009 before rebounding to prices in excess of $90 per Bbl in 2010. Natural gas prices declined from over $13 per Mcf in mid-2008 to approximately $4 per Mcf in February 2009 and remained at depressed levels throughout 2010.result in a decrease in the borrowing base under our revolving credit facility or otherwise limit our ability to borrow money or raise additional capital; and reduce the amount of crude oil and natural gas that we can produce economically.our having to make significant downward adjustments to our estimated proved reserves. As a result, a substantial or extended decline in crude oil or natural gas prices maywould materially and adversely affect our future business, financial condition, results of operations, liquidity or ability to finance planned capital expenditures.In addition, becausewe are vulnerable to fluctuations in pricing inwith that area. In particular, 78%region comprising approximately 77% of our crude oil and natural gas production duringand approximately 86% of our crude oil and natural gas revenues for the fourth quarteryear ended December 31, 2013. Additionally, as of 2010 was fromDecember 31, 2013 approximately 76% of our estimated proved reserves were located in the North region. As a resultwe are significantlythe success and profitability of our operations may be disproportionately exposed to the impacteffect of regional supply and demand factors, transportation capacity constraints, curtailment of production or interruption of transportationevents. These include, among others, fluctuations in the prices of crude oil and natural gas produced from the wells in the region and other regional supply and demand factors, including gathering, pipeline and rail transportation capacity constraints, available rigs, equipment, oil field services, supplies, labor and infrastructure capacity. In addition, our operations in the North region may be adversely affected by seasonal weather and lease stipulations designed to protect wildlife, which can intensify competition for the items described above during months when drilling is possible and may result in periodic shortages. The concentration of our operations in the North region also increases exposure to unexpected events that may occur in this region such as natural disasters, industrial accidents or labor difficulties. Any one of these areas. Suchevents has the potential to cause producing wells to be shut-in, delay operations and growth plans, decrease cash flows, increase operating and capital costs and prevent development of lease inventory before expiration. Any of the risks described above could have a material adverse effect on our financial condition, results of operations and cash flows.can cause significant fluctuation incould adversely impact our realizedbusiness and financial condition.prices. For example,and put downward pressure on the difference between the average NYMEXprices of crude oil price and natural gas. This would negatively impact our average realized crude oil price was $9.38 per Bbl forrevenues, margins, profitability, operating cash flows, liquidity and financial condition. Such weakness or uncertainty could also cause our North region properties forcommodity hedging arrangements to become economically ineffective if our counterparties are unable to perform their obligations or seek bankruptcy protection. Furthermore, our ability to collect receivables may be adversely impacted.year ended December 31, 2010, whereasfuture, we may not be able to access adequate funding under our credit facility as a result of (i) a decrease in our credit ratings that triggers the difference betweenreinstatement of a borrowing base requirement, subjecting us to the average NYMEX crude oil pricerisk that other events may adversely impact the size of our borrowing base following reinstatement, (ii) a decline in commodity prices, or (iii) an unwillingness or inability on the part of our lending counterparties to meet their funding obligations or increase their commitments as required under the credit facility. Due to these factors, we cannot be certain that funding, if needed, will be available to the extent required and on terms we find acceptable. If we are unable to access funding when needed on acceptable terms, we may not be able to fully implement our average realized crude oil price was $9.02 per Bblbusiness plans, complete new property acquisitions to replace reserves, take advantage of business opportunities, respond to competitive pressures, or refinance debt obligations as they come due. Should any of the above risks occur, they could have a material adverse effect on a Company-wide basis for the year ended December 31, 2010.satisfactoryacceptable terms, which could lead to a decline in our crude oil and natural gas reserves.2010,2013, we had $1.24invested approximately $3.84 billion in our capital program, inclusive of capitalproperty acquisitions. In October 2012, we announced a five-year growth plan to triple our production and exploration expenditures.proved reserves from year-end 2012 to year-end 2017. Our capital expenditures for 20112014 are budgeted to be approximately $1.36$4.05 billion, excluding acquisitions which are not budgeted, with $1.23$3.69 billion allocated for drilling, capital workovers and completion operations.facilities. To date, theseour capital expenditures have been financed with cash generated by operations, borrowings under our revolving credit facility and the issuance of senior notes.debt and equity securities. The actual amount and timing of our future capital expenditures may differ materially from our estimates as a result of, among other things,others, commodity prices, available cash flows, unbudgeted acquisitions, actual drilling results, the availability of drilling rigs and other services and equipment, the availability of transportation capacity, and regulatory, technological and competitive developments. Continued improvementImprovement in commodity prices may result in an increase in our actual capital expenditures. Conversely, a significant decline in commodity prices could result in a decrease in ouractual capital expenditures. We intend to finance our future capital expenditures primarily through cash flows from operations and through borrowings under our revolving credit facility; however, our financing needs may require us to alter or increase our capitalization substantially through the issuance of debt or equity securities or the sale of assets. The issuance of additional debt may require thatrequires a portion of our cash flows from operations be used for the payment of interest and principal on our debt, thereby reducing our ability to use cash flows to fund working capital needs, capital expenditures and acquisitions. The issuance of additional equity securities could have a dilutive effect on the value of our common stock.including:including but not limited to: our crude oil and natural gas are sold;lend. our revenues or the borrowing base under our revolving credit facilityability to borrow decrease as a result of lower crude oil or natural gas prices, operating difficulties, declines in reserves or for any other reason, we may have limited ability to obtain the capital necessary to sustain our operations at current levels. If additional capital is needed, we may not be able to obtain debt or equity financing. If cash generated by revolving credit facility is not sufficient to meet our capital requirements, the failure to obtain additional financing could result in a curtailment of our operations relating to development of our prospects, which in turn could lead to a decline in our crude oil and natural gas reserves and could adversely affect our business, financial condition and results of operations. exploitation, exploration, development and production activities. Our crude oil and natural gas exploration and production activities are subject to numerous risks beyond our control, including the risk that drilling will not result in commercially viable crude oil or natural gas production. Our decisions to purchase, explore, develop or otherwise exploit prospects or properties will depend in part on the evaluation of data obtained through geophysical and geological analyses, production data, and engineering studies, the results of which are often inconclusive or subject to varying interpretations. Our cost of drilling, completing and operating wells is oftenmay be uncertain before drilling commences.our scheduled drilling projects, including:following:environment, including groundwater and shoreline contamination;requirements;requirements including permitting.pressure or irregularities in geological formations;shortages of or delays in obtaining equipment and qualified personnel;equipment failures or accidents;adverse weather conditions, such as blizzards and ice storms;reductions in crude oil and natural gas prices;limited availability of financing at acceptable rates;title problems;limitations in transportation capacity or in the market for crude oil and natural gas; andadverse governmental regulations.complex.complex and inherently imprecise. It requires interpretationsinterpretation of available technical data and many assumptions, including assumptions relating to current and future economic conditions, production rates, drilling and operating expenses, and commodity prices. Any significant inaccuraciesinaccuracy in these interpretations or assumptions could materially affect our estimated quantities and present value of our reserves. SeePart I, Item 1. Business—Crude Oil and Natural Gas Operations, Proved Reserves for information about our estimated crude oil and natural gas reserves, and the PV-10, and Standardized Measure of discounted future net cash flows as of December 31, 2010.2013.ourreserves estimates, we must project production rates and the amount and timing of development expenditures. We must also analyze available geological, geophysical, production and engineering data. The extent, quality andvary.vary with the uncertainty of decline curves and the ability to model heterogeneity of the porosity, permeability and pressure relationships in unconventional resources. The process also requires economic assumptions, based on historical data but projected into the future, about matters such as crude oil and natural gas prices, drilling and operating expenses, capital expenditures, taxes and availability of funds.reserves.reserves, which in turn could have an adverse effect on the value of our assets. In addition, we may adjust estimates of proved reserves, potentially in material amounts, to reflect production history, results of exploration and development, prevailing crude oil and natural gas prices and other factors, many of which are beyond our control. that the present value of future net revenues from our proved reserves is the current market value of our estimated crude oil and natural gas reserves. For the years prior to 2009, we based the estimated discounted future net revenues from our proved reserves on prices and costs in effect at year-end. In accordance with the SEC requirements that went into effect in 2009,rules, we currently base the estimated discounted future net revenues from our proved reserves on the 12-month unweighted arithmetic average of the first-day-of-the-month commodity prices for the preceding twelve months. Actual future prices may be materially higher or lower than the SEC pricing used in the calculations. Actual future net revenues from our crude oil and natural gas properties will be affected by factors such as:actual prices we receive for crude oil and natural gas;usour reserves or the crude oil and natural gas industry in general. materially from those used in our estimate of the present value estimate.of future net revenues. If crude oil prices decline by $10.00 per Bbl, thenbarrel, our PV-10 as of December 31, 20102013 would decrease approximately $849 million.$2.8 billion. If natural gas prices decline by $1.00 per Mcf, then our PV-10 as of December 31, 20102013 would decrease approximately $392 million.commerciallyeconomically develop unconventional crude oil and natural gas resource plays using enhanced recovery technologies. For example, we may inject water and high-pressure air into formations on some of our properties to increase the production of crude oil and natural gas. The additional production and reserves attributable to the use of these enhanced recovery methods are inherently difficult to predict. If our enhanced recovery programs do not allow for the extraction of crude oil and natural gas in the manner or to the extent that we anticipate, our future results of operations and financial condition could be materially adversely affected.take write-downs ofwrite down the carrying values of our crude oil and natural gas properties.wouldcould adversely affect our cash flows and results of operations.exploitationdevelopment and developmentexploitation activities or acquire properties containing proved reserves, our proved reserves will decline as those reserves are produced. Producing crude oil and natural gas reservoirs are generally are characterized by declining production rates that vary depending upon reservoir characteristics and other factors. Our future crude oil and natural gas reserves and production, and therefore our cash flows and results of operations, are highly dependent on our success in efficiently developing and exploiting our current reserves and economically finding or acquiring additional recoverable reserves. We may not be able to develop, exploit, find or acquire sufficient additional reserves to replace our current and future production. If we are unable to replace our current and future production, the value of our reserves will decrease, and our business, financial condition and results of operations wouldcould be materially adversely affected.our budget and on a timely basis. that are not provided for in our capital budget, which could have a material adverse effect on our business, financial condition or results of operations.underinsuredunder insured events could materially and adversely affect our business, financial condition or results of operations. Our crude oil and natural gas exploration and production activities are subject to all of the operating risks associated with drilling for and producing crude oil and natural gas, including the possibility of:pollutionpollutants into the environment, including groundwater and shoreline contamination;disasters.andor destruction of property, natural resources and equipment; that the cost of available insurance is excessive relative to the risks presented. In addition, pollution and environmental risks generally are not fully insurable. The occurrence of an event that is not fully covered by insurance could have a material adverse effect on our business, financial condition and results of operations. that we decide to drill may not yield crude oil or natural gas in economically producible quantities. that we decide to drill that do not yield crude oil or natural gas in economically producible quantities willmay adversely affect our results of operations and financial condition. In this report, we describe some of our current prospects and our plans to exploreThereIt is no waynot possible to predict with certainty in advance of drilling and testing whether any particular prospect will yield crude oil or natural gas in sufficient quantities to recover drilling or completion costs or to be economically producible. The use of seismic data and other technologies and the study of producing fields in the same area will not enable us to know conclusively prior to drilling whether crude oil or natural gas will be present or, if present, whether crude oil or natural gas will be present in economically producible quantities. We cannot assure you that the analogies we draw from available data from other wells, more fully explored prospects or producing fields will be applicable to our drilling prospects.UnlessIf we are not able to renew expired leases before they expire, any proved undeveloped reserves associated with such leases will be removed from our proved reserves. AsThe combined net acreage expiring in the next three years represents 60% of our total net undeveloped acreage at December 31, 2010,2013. At that date, we had leases representing 321,579249,525 net acres expiring in 2011, 249,2772014, 368,700 net acres expiring in 2012,2015, and 423,846296,360 net acres expiring in 2013. As such, our2016. Our actual drilling activities may materially differ from those presently identified, which could adversely affect our business.parties. or lack of, available capacity on these systems and facilities could result in the shut-in of producing wells or the delay, or discontinuance of, development plans for properties. Although we have some contractual control over the transportation of our product, material changes in these business relationships could materially affect our operations. We generally do not purchase firm transportation on third party facilities and therefore, our production transportation can be interrupted by those having firm arrangements. Federal and state regulation of crude oil and natural gas production and transportation, tax and energy policies, changes in supply and demand, pipeline pressures, damage to or destruction of pipelines and rail systems, labor disputes and general economic conditions could adversely affect our ability to produce, gather, transport and transportsell crude oil and natural gas.and/civil disturbances, public protests, terrorist attacks, cyber attacks, adverse weather, regulatory developments, equipment failures or weatheraccidents, including pipeline ruptures or train derailments, could negatively impact our ability to market and deliver our products.products and achieve the most favorable prices for our crude oil and natural gas production. We have no control over when or if access to such pipeline or rail facilities arewould be restored or what prices willwould be charged. A totalsignificant shut-in of production in connection with any of the aforementioned items could materially affect us due to a lack ofour cash flows, and if a substantial portion of the impacted production is hedged at lower than market prices, those financial hedges would have to be paid from borrowings absent sufficient cash flows.areas that are developed and producing.producing areas. Since new or emerging plays have limited or no production history, we are unable to use past drilling results in those areas to help predict our future drilling results. As a result, our cost of drilling, completing and operating wells in these areas may be higher than initially expected, and the value of our undeveloped acreage will decline if drilling results are unsuccessful.local and otherlocal laws and regulations that could adversely affect the cost, manner or feasibility of conducting our operations or expose us to significant liabilities.regulations.regulations, including those governing environmental protection, health and safety, and the discharge of materials into the environment. In order to conduct our operations in compliance with these laws and regulations, we must obtain and maintain numerous permits, approvals and certificates from various federal, state and local governmental authorities. WeEnvironmental regulations may incurrestrict the types, quantities and concentration of materials that can be released into the environment in connection with drilling and production activities, limit or prohibit drilling activities on certain lands lying within wilderness, wetlands and other protected areas, and impose substantial costs in orderliabilities for pollution resulting from our operations.maintain compliancecomply with these existing laws and regulations may trigger a variety of administrative, civil and criminal enforcement measures, including the assessment of monetary penalties, the imposition of remedial requirements, and the issuance of orders enjoining future operations. Strict liability or joint and several liability may be imposed under certain laws, which could cause us to become liable for the conduct of others or for consequences of our own actions. For instance, an accidental release from one of our wells could subject us to substantial liabilities arising from environmental cleanup and restoration costs, claims made by neighboring landowners and other third parties for personal injury and property damage and fines or penalties for related violations of environmental laws or regulations. In addition,Such costs could have a material adverse effect on our business, financial condition and results of operations.Our business is subject to federal, state and local laws and regulations as interpreted and enforced by governmental authorities possessing jurisdiction over various aspects of the exploration for, and the production and transportation of, crude oil and natural gas. Failure to comply with such laws and regulations, as interpreted and enforced, could have a material adverse effect on our business, financial condition and results of operations. SeeItem 1. Business—Regulation of the Crude Oil and Natural Gas Industry for a description of the laws and regulations that affect us.Strict, joint and several liabilities may be imposed under certain environmental laws, which could cause us to become liable for the conduct of others or for consequences of our own actions that were in compliance with all applicable laws at the time those actions were taken. In addition, claims for damages to persons or property, including natural resources, may result from our operations.New laws, regulations or enforcement policies could be more stringent and impose unforeseen liabilities or significantly increase compliance costs. If we are not able to recover the resultingincreased costs through insurance or increased revenues, our business, financial condition and results of operations could be adversely affected.reducedreduce demand for the crude oil, natural gas and NGLs thatnatural gas liquids we produce.On 15, 2009, the EPA published its findings that emissions of carbon dioxide, methane and other “greenhouse gases”greenhouse gases present an endangerment to human health and the environment because emissions of such gases are, according to the EPA, contributing to the warming of the Earth’s atmosphere and other climaticclimate changes. These findings by the EPA have allowedallow the agency to implementproceed with the adoption and implementation of several regulations that would restrict emissions of greenhouse gases under existing provisions of the federal Clean Air Act. In April 2010,Act, such as the EPA finalized regulations that will require a reductionso-called “tailoring rule” adopted in emissions of greenhouse gases from motor vehicles beginning in 2011. In May 2010, the EPA finalized its “tailoring rule”, which sets forth criteria for determining which stationary sources are required to obtain permits to construct, modify or operate on account of,imposes permitting and to implement the best available control technology for, theirrequirements on the largest greenhouse gas emissions pursuant to the Clean Air Act Prevention of Significant Deterioration and Title V operating permit programs. Under the tailoring rule, permitting requirements will be phased in through successive steps that expand the scope of covered sources over time. In September 2009, the EPA finalized a rule that requires reporting of greenhouse gas emissions from specified large sources in the United States for emissions occurring in the prior calendar year.stationary sources. In November 2010, the EPA also finalized its greenhouse gas reporting requirements for certain oil and gas production facilities that emit 25,000 metric tons or more of carbon dioxide equivalent per year. ThisThe rule became effective on December 30, 2010 and requires annual reporting to the EPA of greenhouse gas emissions toby such regulated facilities.by March 2012issued final rules that established new air emission controls for emissions during 2011, and annually thereafter. Some of our facilities may be subject to the reporting rules for thecrude oil and natural gas industry,production and natural gas processing operations. These rules were published in the Federal Register in August 2012. The EPA’s rule package includes New Source Performance Standards to address emissions of sulfur dioxide and VOCs and a separate set of emission standards to address hazardous air pollutants frequently associated with crude oil and natural gas production and processing activities. The final rules require the use of reduced emission completions or “green completions” on all hydraulically-fractured wells completed or refractured after January 1, 2015 in order to achieve a 95% reduction in the emission of VOCs. The rules also establish specific new requirements regarding emissions from compressors, controllers, dehydrators, storage tanks and other production equipment. These rules may also be coveredrequire modifications to our operations, including the installation of new equipment to control emissions from our wells by subsequent phases of the tailoring rule or other rulemakings.Legislation has been proposedJanuary 1, 2015. Compliance with such rules could result in bothsignificant costs, including increased capital expenditures and operating costs, and could adversely impact our business.House of Representatives and Senate that would establish a cap-and-trade programCongress has from time to time considered legislation to reduce U.S. emissions of greenhouse gases, and almost half of the states, including carbon dioxide and methane. Understates in which we operate, have enacted or passed measures to reduce emissions of greenhouse gases, primarily through the planned development of greenhouse gas emission inventories and/or regionalproposals, the EPA would issue or sell a capped and steadily declining number of tradable emissions allowances to certaincap-and-trade programs work by requiring either major sources of emissions or major producers of fuels to acquire and surrender emission allowances, with the number of allowances available for purchase reduced each year until the overall greenhouse gas emissions so that such sources could continue to emit greenhouse gases intoemission reduction goal is achieved. These reductions may cause the atmosphere. Thesecost of allowances would be expected to escalate significantly in cost over time.net effectadoption and implementation of such legislation, if adopted, would be to impose increasing costs on the combustion of carbon-based fuels such as crude oil, refined petroleum products, and natural gas. The Obama Administration has indicated its support of legislation to reduce greenhouse gas emissions through an emission allowance system. Although it is not possible at this time to predict when or if Congress may act on climate change legislation, any future federal laws or implementing regulations that may be adopted to addressrequire reporting of greenhouse gasgases or otherwise limit emissions of greenhouse gases from our equipment and operations could require us to incur increased operating costs.Even if such legislation is not adopted at the national level, more than one-third of the states, either individually or as part of regional initiatives, have begun taking actionscosts to control and/monitor and report on greenhouse gas emissions or reduce emissions of greenhouse gases as have a number of local governments.Although most of the regional and state-level initiatives have to date been focused on large sources of greenhouse gas emissions, such as coal-fired electric power plants, smaller sources of emissions could become subject to greenhouse gas emission limitations, allowance purchase requirements or other restrictions or costs.Any one of these federal, regional, state or local climate change regulatory or legislative initiatives, or related litigation (including pending common law nuisance suits against various companies relating to greenhouse gases), could have a material adverse effect onassociated with our business, financial condition and results of operations. These laws and regulations could also adversely affect demand for the crude oil, natural gas and NGLs we produce, including by increasing their cost. In addition, these laws and regulationsregulatory initiatives could drive down demand for our products by stimulating demand for alternative forms of energy that do not rely on combustion of fossil fuels (suchthat serve as oil, natural gas and NGLs), which is a major source of greenhouse gas emissions. that some scientists have concluded that increasing concentrations of greenhouse gases in the Earth’s atmosphere may produce climate changes that have significant physical effects, such as increased frequency and severity of storms, droughts, and floods and other climatic events. If any such effects were to occur as a result of climate change or otherwise, they could have an adverse effect on our assets and operations.Legislationproposedintroduced in the U.S. Congress to amend the federal Safe Drinking Water Act to requireeliminate an existing exemption for hydraulic fracturing activities from the disclosuredefinition of chemicals used by“underground injection,” thereby requiring the crude oil and natural gas industry in theto obtain permits for hydraulic fracturing, process. Hydraulic fracturing involvesand to require disclosure of the injection of water, sand and chemicals under pressure into rock formations to stimulate oil and natural gas production. We engage third parties to provide hydraulic fracturing or other well stimulation services to us in connection with several wells or proposed wells for which we are the operator. Sponsors of bills currently pending in Congress have asserted that chemicalsadditives used in the fracturing process may be adversely impacting drinking water supplies. The proposedprocess. If ever adopted, such legislation would require the reporting and public disclosure of chemicals used in the fracturing process, which could make it easier for third parties opposing the hydraulic fracturing process to initiate legal proceedings based on allegations that specific chemicals used in the fracturing process are impairing groundwater or causing other damage. These bills, if adopted, could establish an additional level of regulation and permitting at the federal or state level that could prohibitlevel.could lead to operational delaysotherwise regulate their use more closely. In certain areas of the United States, new drilling permits for hydraulic fracturing have been put on hold pending development of additional standards.increased operating costs and could result in additional regulatory burdens thatlocal law or implementing regulation imposing permitting or reporting obligations on, or otherwise limiting, the hydraulic fracturing process, or the discovery of groundwater contamination or other adverse environmental effects directly connected to hydraulic fracturing, could make it more difficult and more expensive to perform hydraulic fracturingcomplete crude oil and natural gas wells in low-permeability formations and increase our costs of compliance and doing business. Certain states and other agencies have adoptedbusiness, as well as delay, prevent or are considering similar disclosure legislation, moratoria or enforcement initiatives relating to hydraulic fracturing. These legislative and regulatory initiatives, toprohibit the extent theydevelopment of natural resources from unconventional formations. In the event regulations are adopted or continue, couldthat prohibit or significantly limit the use of hydraulic fracturing in states in which we operate, it would have a material adverse effect on our ability to economically find and develop our crude oil and natural gas properties locatedreserves in unconventional formations, whichour strategic plays. The inability to achieve a satisfactory economic return could cause us to curtail or discontinue our exploration and development plans. Such a circumstance would adversely affecthave a material adverse effect on our business and would impair our ability to access, develop and book reserves in the future.In March 2010, the United States Environmental Protection Agency announced that it would conduct a wide-ranging study on the effects of hydraulic fracturing on human health and the environment. The agency also announced that one of its enforcement initiatives for 2011 to 2013 would be to focus on environmental compliance by the energy extraction sector, and has already commenced one potential enforcement matter in Texas. This study and enforcement initiative could result in additional regulatory scrutiny that could make it difficult to perform hydraulic fracturing and increaseimplement our costs of compliance and doing business.all applicable FERC, FTC and CFTC administered statutes rules,and regulations and orders,on market behavior, we could be subject to substantial penalties and fines. current violations of anti-market manipulation rules for natural gas, crude oil and petroleum products of up to $1,000,000 per day for each violation. While our systemsThe CFTC, under the Commodity Exchange Act, has similar authority to assess penalties of up to the greater of $1,000,000 or triple the monetary gain for violation of anti-market manipulation rules for certain derivative contracts. Knowing or willful violations of the Commodity Exchange Act may also lead to a felony conviction. In addition, while we have not been regulated by the FERC as a natural gas company under the NGA, the FERC has adopted regulations that may subject certain of our otherwise non-FERC jurisdictional facilitiesus to the FERC annual reporting and daily scheduled flow and capacity posting requirements. Additional rules and legislation pertaining to those and other matters may be considered or adopted by the FERC, the FTC or CFTC from time to time. The FTC has also adopted anti-market manipulation rules that apply to our sales and trading of crude oil and petroleum products. Failure to comply with any of these regulations in the future could subject us to civil penalty liability, as well as the disgorgement of profits and third-party claims.ManyCertain of our competitors may possess and employ financial, technical and personnel resources substantially greater than ours.business.Seasonal weather conditions and lease stipulations adversely affect our ability to conduct drilling activities in some of the areas where we operate.Crude oil and natural gas operations in the North region are adversely affected by seasonal weather conditions and lease stipulations designed to protect various wildlife. In certain areas, including parts of Montana, North Dakota, South Dakota, Colorado and Wyoming, drilling and other crude oil and natural gas activities can only be conducted during the spring and summer months. This limits our ability to operate in those areas and can intensify competition during those months for drilling rigs, oilfield equipment, services, supplies and qualified personnel, which may lead to periodic shortages. These constraints and the resulting shortages or high costs could delay our operations and materially increase our operating and capital costs.a result, weof December 31, 2013, non-operated properties represented 19% of our estimated proved developed reserves, 10% of our estimated proved undeveloped reserves, and 13% of our estimated total proved reserves. We have limited ability to influence or control the operation or future development of such properties, including compliance with environmental, safety and other regulations, or the amount of capital expenditures that we will be required to fund with respect to such properties. Moreover, we are dependent on the other working interest owners of such projects to fund their contractual share of the capital expenditures of such projects. These limitations and our dependence on the operator and other working interest owners for these projects could cause us to incur unexpected future costs and materially and adversely affect our financial condition and results of operations. revolving credit facility and the indentures for our senior notes contain certain covenants and restrictions that may inhibit our ability to make certain investments, incur additional indebtedness and engage in certain other transactions, which could adversely affect our ability to meet our future goals. revolving credit facility and thecertain indentures for our senior notes include certain covenants and restrictions that may, among other things,others, restrict:revolving credit facility and certain permitted liens;The revolving credit facility also requires us to maintain certain financial ratios, such as leverage ratios. revolving credit facility and the senior note indentures may restrict our ability to expand or pursue our business strategies. Our ability to comply with these and other provisions of our revolving credit facility or senior note indentures may be impacted by changes in economic or business conditions, results of operations or events beyond our control. The breach of any of these covenants could result in a default under our revolving credit facility or senior note indentures, in which case, depending on the actions taken by the lenders or trusteetrustees thereunder or their successors or assignees, such lenders or trustees could elect to declare all amounts outstanding thereunder, together with accrued interest, to be due and payable. If we were unable to repay such borrowings or interest under our revolving credit facility, our lenders could proceed against their collateral. If the indebtedness under our revolving credit facility were to beis accelerated, our assets may not be sufficient to repay in full such indebtedness.18, 2011,17, 2014, outstanding borrowings under our revolving credit facility were $95.0$560 million and the impact of a 1% increase in interest rates on this amount of debt would result in increased annual interest expense of approximately $1.0$5.6 million and a $0.6$3.5 million decrease in our annual net income. We require continued access to capital. A significant reduction in cash flows from operations or the availability of credit could materially and adversely affect our ability to achieve our planned growth and operating results.Volatility in the financial markets or in macro-economic factors could adversely impact our business and financial condition. We may not be able to obtain funding in the capital markets on terms we find acceptable, or obtain funding under our current revolving credit facility because of a deterioration of the capital and credit markets and our borrowing base.Volatility in U.S. and global financial and equity markets, including market disruptions, limited liquidity, and interest rate volatility, may increase our cost of financing. Further, economic uncertainty could reduce the demand for crude oil and natural gas and put downward pressure on the prices for crude oil and natural gas, which would negatively impact our revenues and cash flows. Historically, we have used our cash flows from operations, borrowings under our revolving credit facility and capital market transactions to fund our capital expenditures.We have an existing revolving credit facility with lender commitments totaling $750 million. In the future, we may not be able to access adequate funding under our bank credit facilities as a result of (i) a decrease in our borrowing base due to the outcome of a subsequent borrowing base redetermination, which is solely at the discretion of our lenders, or (ii) an unwillingness or inability on the part of our lending counterparties to meet their funding obligations. Declines in commodity prices could result in a determination to lower our borrowing base in the future and, in such case, we could be required to repay any indebtedness in excess of the borrowing base.Due to these factors, we cannot be certain that funding, if needed, will be available to the extent required and on terms we find acceptable. If we are unable to access funding when needed on acceptable terms, we may not be able to fully implement our business plans, complete new property acquisitions to replace our reserves, take advantage of business opportunities, respond to competitive pressures, or refinance our debt obligations as they come due, any of which could have a material adverse effect on our financial condition and results of operations.exposuresexposure to credit risk areis through joint interest receivables ($269.5 million at December 31, 2010) and the sale of our crude oil and natural gas production, ($213.3 million in receivables at December 31, 2010), which we market to energy marketing companies, refineries and affiliates.affiliates ($656.2 million in receivables at December 31, 2013), our joint interest receivables ($350.0 million at December 31, 2013), and counterparty credit risk associated with our derivative instrument receivables ($3.6 million at December 31, 2013). Joint interest receivables arise from billing entities who own a partial interest in the wells we operate. These entities participate in our wells primarily based on their ownership in leases included in units onpurchaserpurchasers of our crude oil and natural gas during the year ended December 31, 20102013 accounted for 57%a combined 38% of our total revenues.crude oil and natural gas revenues for the year. We generally do not require our customerscounterparties to post collateral.provide collateral to support crude oil and natural gas sales receivables owed to us. Additionally, our use of derivative instruments involves the risk that our counterparties will be unable to meet their obligations under the arrangements. The inability or failure of our significant customers to meet their obligations to us or their insolvency or liquidation may adversely affect our financial condition and results of operations.could reduce our earnings. a more predictable cash flowflows and to reduce our exposure to adverse fluctuations in the prices of crude oil and natural gas, we enter into derivative instruments for a portion of our crude oil and/or natural gas production, including collars and fixed price swaps. SeePart II, Item 7. Management’s Discussion and Analysis of Financial Condition and Results of Operations – Operations—Crude Oil and Natural Gas Hedging andPart II, Item 8. Notes to Consolidated Financial Statements – Statements—Note 5. Derivative Instruments for a summary of our crude oil and natural gas commodity derivative positions. We diddo not designate any of our derivative instruments as hedges for accounting purposes and we record all derivative instruments on our balance sheet at fair value. Changes in the fair value of our derivative instruments are recognized in current earnings. Accordingly, our earnings may fluctuate significantly as a result of changes in the fair value of our derivative instruments.somecertain circumstances, including when:counter-partycounterparty to the derivative instrument defaults on its contractual obligations; or72.6%68% of our outstanding common stock, giving him influence and control in corporate transactions and other matters, including a sale of our Company.February 18, 2011,December 31, 2013, Harold G. Hamm, our Chairman and Chief Executive Officer, beneficially owned 123,753,708126,337,891 shares of our outstanding common stock representing approximately 72.6%68% of our outstanding common shares. As a result, Mr. Hamm is our controlling shareholder and will continue to be able to control the election of our directors, determine our corporate and management policies and determine, without the consent of our other shareholders, the outcome of certain corporate transactions or other matters submitted to our shareholders for approval, including potential mergers or acquisitions, asset sales and other significant corporate transactions. As controlling shareholder, Mr. Hamm could cause, delay or prevent a change of control of our Company. The interests of Mr. Hamm may not coincide with the interests of other holders of our common stock. affiliated companies controlled by Mr. Hamm provide oilfield, gathering and processing, marketing and other services to us. We expect these transactions will continueare in the futurebusiness of gathering, processing, and marketing crude oil and natural gas or providing oilfield services in some of the areas where we have operations. We have historically entered, and expect to continue entering, into transactions from time to time with these affiliated companies if, after an independent review by our Audit Committee, it is determined such transactions are in the Company's best interests and are on terms no less favorable to us than could be achieved with an unaffiliated third party. These transactions may result in conflicts of interest between Mr. Hamm’s affiliated companies and us. We can provide no assurance that any such conflicts will be resolved in our favor.Proposed legislation under consideration by Congress could increase our operating costs, reduce our liquidity, delay our operations or otherwise alter the way we conduct our business.Our operations are subject to extensive federal, state and local laws and regulations. Changes to existing laws or regulations or new laws or regulations may unfavorably impact us and could result in increased operating costs and have a material adverse effect on our financial condition and results of operations. For example, Congress is considering legislation that, if adopted in its current proposed form, would subject companies involved in crude oil and natural gas exploration and production activities to substantial additional regulation. If such legislation is adopted, it could result in, among other items, additional regulation of and restrictions on hydraulic fracturing of wells, and additional regulation of private energy commodity derivative and hedging activities. These and other potential laws and regulations could increase our operating costs, reduce our liquidity, delay our operations or otherwise alter the way we conduct our business, which could in turn have a material adverse effect on our financial condition and results of operations.Certain federal income tax deductions currently available with respect to oil and gas exploration and development may be eliminated as a result of future legislation.Among the changes contained in President Obama’s fiscal year 2012 budget proposal, released by the White House on February 14, 2011, is the elimination or deferral of certain key U.S. federal income tax deductions currently available to oil and gas exploration and production companies. Such proposed changes include, but are not limited to, (i) the repeal of the percentage depletion allowance for oil and gas properties; (ii) the elimination of current deductions for intangible drilling and development costs; (iii) the elimination of the deduction for certain U.S. production activities; and (iv) an extension of the amortization period for certain geological and geophysical expenditures. Recently, members of the U.S. Congress have considered similar changes to the existing federal income tax laws that affect oil and gasexploration and production companies, which, if enacted, would negatively affect our financial condition and results of operations. The passage of any legislation as a result of the budget proposal or any other similar change in U.S. federal income tax law could eliminate or defer certain tax deductions within the industry that are currently available with respect to oil and gas exploration and development, and any such change could negatively affect our financial condition and results of operations.Potential regulations under the Dodd-Frank Act regarding derivatives could have an adverse effect on our ability to use derivative instruments to reduce the effect of commodity price risk and other risks associated with our business.We use derivative instruments to manage our commodity price risk. In 2010, Congress adopted the Dodd-Frank Wall Street Reform and Consumer Protection Act (HR 4173), which, among other provisions, establishes federal oversight and regulation of the over-the-counter derivatives market and entities, such as us, that participate in that market. The new legislation was signed into law by President Obama on July 21, 2010 and requires the Commodities Futures Trading Commission (the “CFTC”) and the SEC to promulgate rules and regulations implementing the new legislation within 360 days from the date of enactment. The CFTC has also proposed regulations to set position limits for certain futures and option contracts in the major energy markets, although it is not possible at this time to predict whether or when the CFTC will adopt those rules or include comparable provisions in its rulemaking under the new legislation. The financial reform legislation may also require us to comply with margin requirements and with certain clearing and trade-execution requirements in connection with our derivative activities, although the application of those provisions to us is uncertain at this time. The financial reform legislation may also require the counterparties to our derivative instruments to spin off some of their derivatives activities to a separate entity, which may not be as creditworthy as the current counterparty.The new legislation and any new regulations could significantly increase the cost of derivative contracts (including through requirements to post collateral, which could adversely affect our available liquidity), materially alter the terms of derivative contracts, reduce the availability of derivatives to protect against risks we encounter, reduce our ability to monetize or restructure existing derivative contracts, and increase our exposure to less creditworthy counterparties. If we reduce our use of derivatives as a result of the legislation and regulations, our results of operations may become more volatile and our cash flows may be less predictable. Finally, the legislation was intended, in part, to reduce the volatility of crude oil and natural gas prices, which some legislators attributed to speculative trading in derivatives and commodity instruments related to crude oil and natural gas. Our revenues could therefore be adversely affected if a consequence of the legislation and regulations is to lower commodity prices. Any of these consequences could have a material adverse effect on our financial position and results of operations.appropriate differentials; that we believe to be generally consistent with industry practices. Our review will not reveal all existing or potential problems nor will it permit us to become sufficiently familiar with the properties to fully assess their deficiencies and capabilities.capabilities prior to acquisition. Inspections may not always be performed on every well, and environmental problems are not necessarily observable even when an inspection is undertaken. Even when problems are identified, the seller of the subject properties may be unwilling or unable to provide effective contractual protection against all or part of the problems. We often are not entitled to contractual indemnification for environmental liabilities and acquire properties on an “as is” basis.Item 1B. Unresolved Staff Comments 2010.2013.Item 2. Properties Item 3. Legal Proceedings On4, 2010, a putativean alleged class action was filed against the Company alleging the Company improperly deducted post-production costs from royalties paid to plaintiffs and other royalty interest owners as categorized in the petition from crude oil and natural gas wells located in Oklahoma. The plaintiffs have alleged a number of claims, including breach of contract, fraud, breach of fiduciary duty, unjust enrichment, and other claims and seek recovery of compensatory damages, interest, punitive damages and attorney fees on behalf of the putativealleged class. The Company has responded to the petition, and denied the allegations and raised a number of affirmative defenses. The actionDiscovery is in very preliminary stagesongoing and no discovery has been conducted. As such, theinformation and documents continue to be exchanged. The Company is not currently able to estimate a reasonably possible loss or range of loss or what impact, if any, the action will have on its financial condition, results of operations or cash flows.such asincluding, but not limited to, commercial disputes, claims from royalty and surface owners, property damage claims, personal injury claims and similarother matters. While the outcome of these legal matters cannot be predicted with certainty, the Company does not expect them to have a material adverse effect on its financial condition, results of operations or cash flows.Item 4. (Removed and Reserved)Mine Safety Disclosures
High Low Cash Dividend Period October 1, 2010 to October 31, 2010 November 1, 2010 to November 30, 2010 December 1, 2010 to December 31, 2010 Total Statement of Income (in thousands, except per share data) Crude oil and natural gas sales Losses on derivative instruments, net(1) Total revenues Income from continuing operations Net Income Basic earnings per share: From continuing operations Net income per share Shares used in basic earnings per share Diluted earnings per share: From continuing operations Net income per share Shares used in diluted earnings per share Pro forma C-corporation(2) Pro forma income from continuing operations Pro forma net income Pro forma basic earnings per share Pro forma diluted earnings per share Production Crude oil (MBbl)(3) Natural gas (MMcf) Crude oil equivalents (MBoe) Average sales prices(4) Crude oil ($/Bbl) Natural gas ($/Mcf) Crude oil equivalents ($/Boe) Average costs per Boe($/Boe)(4) Production expenses Production taxes and other expenses Depreciation, depletion, amortization and accretion General and administrative expenses Proved reserves at December 31 Crude oil (MBbl) Natural gas (MMcf) Crude oil equivalents (MBoe) Other financial data(in thousands) Net cash provided by operations Net cash used in investing Net cash provided by (used in) financing EBITDAX(5) Capital expenditures Cash dividends per share Balance sheet data at December 31(in thousands) Total assets Long-term debt, including current maturities Shareholders’ equity We are natural gas properties in our East region. The sold properties represented an immaterial portion of our operations and do not materially affect the comparability of the operating results and cash flows for the periods presented in this report. Our operations are geographically concentrated in the North region, with that region comprising approximately 77% of our crude oil and natural gas production and approximately 86% of our crude oil and natural gas revenues for the year ended December 31, 2013. operating cash flows needs for the next 12 months; however, we may choose to access the capital markets for additional financing to take advantage of business opportunities that may arise if such financing can be arranged at favorable terms. Average daily production: Crude oil (Bbl per day) Natural gas (Mcf per day) Crude oil equivalents (Boe per day) Average sales prices:(1) Crude oil ($/Bbl) Natural gas ($/Mcf) Crude oil equivalents ($/Boe) Production expenses ($/Boe)(1) General and administrative expenses ($/Boe)(1) (2) Net income (in thousands) Diluted net income per share EBITDAX (in thousands)(3) (in thousands, except sales price data) Crude oil and natural gas sales Loss on mark-to-market derivative instruments, net(1) Total revenues Operating costs and expenses(2) Other expenses, net Income before income taxes Provision for income taxes Net income Production volumes: Crude oil (MBbl)(3) Natural gas (MMcf) Crude oil equivalents (MBoe) Sales volumes: Crude oil (MBbl)(3) Natural gas (MMcf) Crude oil equivalents (MBoe) Average sales prices:(4) Crude oil ($/Bbl) Natural gas ($/Mcf) Crude oil equivalents ($/Boe) Crude oil (MBbl) Natural gas (MMcf) Total (MBoe) North South East Total (MBoe) fair value of our derivative instruments and revenues associated with crude oil and natural gas service operations. Crude Reclaimed crude oil sales Average sales price ($/Bbl) Sales volumes (barrels) rate. $/Boe Production expenses Production taxes and other expenses Production expenses, production taxes and other expenses $/Boe Crude oil and natural gas Other equipment Asset retirement obligation accretion Depreciation, depletion, amortization and accretion Boe for the fourth quarter of 2013. Fourth quarter DD&A was impacted by the operational timing of pad drilling and resulting mix of well completions during the year. Crude oil (MBbl) Natural gas (MMcf) Total (MBoe) North South East Total (MBoe) region compared to 2011 due to the completion of new wells during the period. These increases were partially offset by a decrease in production volumes of 837 MMcf, or 6%, from non-core areas in our South region due to a combination of natural declines in production and reduced drilling activity prompted by the pricing environment for natural gas in those areas. Crude revenues. $/Boe Production expenses Production taxes and other expenses Production expenses, production taxes and other expenses Arkoma Woodford and Michigan. $/Boe Crude oil and natural gas Other equipment Asset retirement obligation accretion Depreciation, depletion, amortization and accretion Boe was partially the result of a gradual shift in our production base from our historic base of the Red River units in the Cedar Hills field to newer production bases in the Bakken and Oklahoma Woodford plays. The producing properties in our newer areas typically carry higher DD&A rates due to the higher cost of developing reserves in those areas compared to our older, more mature properties. Niobrara play in Colorado. equity securities. At December 31, credit. operating activities investing activities 2012 capital program. We may choose to access the capital markets for additional financing to take advantage of business opportunities that may arise if such financing can be arranged at favorable terms. 2014 capital program. In millions Exploration and development drilling Land costs Capital facilities, workovers and re-completions Vehicles, computers and other equipment Acquisition of producing properties Seismic Dry holes Total In millions Exploration and development drilling Land costs Capital facilities, workovers and re-completions Seismic Vehicles, computers and other equipment Total In thousands Arising from arrangements on the balance sheet: Revolving credit facility Senior Notes(1) Interest expense(2) Asset retirement obligations(3) Arising from arrangements not on the balance sheet: Operating leases(4) Drilling rig commitments(5) Fracturing and well stimulation commitments(6) Total contractual obligations As part of our risk management program, we economically hedge a portion of our anticipated future crude oil and natural gas production to achieve more predictable cash flows and to reduce our exposure to fluctuations in crude oil and natural gas prices. Reducing our exposure to price volatility helps ensure conditions and our desire to have the cash flows needed to fund the development of our inventory of undeveloped crude oil and natural gas reserves in conjunction with our growth strategy. See Note 5. Derivative Instruments in Notes to Consolidated Financial Statements for further discussion of the accounting applicable to our derivative instruments, a summary of open contracts at December 31, 2013 and the estimated fair value of those contracts as of that date. Additionally, a summary of derivative contracts entered into after December 31, 2013 is provided subsequently under the heading Crude Oil and Natural Gas Hedging. We expect to continue entering into derivative instruments covering a portion of our future crude oil and/or natural gas production in order to further secure cash flows in support of our growth plans; however, we may choose not to hedge future production if the pricing environment for certain time periods is not deemed to be favorable. commodity exchanges, with crude oil derivative settlements based on NYMEX West Texas Intermediate ("WTI") pricing or Inter-Continental Exchange ("ICE") pricing for Brent crude oil and natural gas derivative settlements based on NYMEX Henry Hub pricing. See Period and Type of Contract January 2012—December 2012 Swaps January 2013—December 2013 Collars Oil—ICE Brent Period and Type of Contract January 2011—March 2011 Swaps April 2011—June 2011 Swaps July 2011—September 2011 Swaps October 2011—December 2011 Swaps January 2012—December 2012 Swaps Gas—NYMEX Henry Hub assets. properties, whereby costs incurred to acquire mineral interests in crude oil and natural gas properties, to drill and equip exploratory wells that find proved reserves, to drill and equip development wells, and expenditures for enhanced recovery operations are capitalized. Geological and geophysical costs, seismic costs incurred for exploratory projects, lease rentals and costs associated with unsuccessful exploratory wells or projects are expensed as incurred. Costs of seismic studies that are utilized in development drilling within an area of proved reserves are capitalized as development costs. To the extent a seismic project covers areas of both developmental and exploratory drilling, those seismic costs are proportionately allocated between capitalized development costs and exploration expense. Maintenance, repairs and costs of injection are expensed as incurred, except that the costs of replacements or renewals that expand capacity or improve production are capitalized. reasonableness. complying with such laws and regulations. Net income Interest expense Provision (benefit) for income taxes Depreciation, depletion, amortization and accretion Property impairments Exploration expenses Unrealized losses on derivatives Non-cash equity compensation EBITDAX Realized pricing is primarily driven by the prevailing worldwide price for crude oil and spot market prices applicable to our 2013. . facility. In millions Fixed rate debt: Notes: Principal amount (1) Weighted-average interest rate Variable rate debt: Revolving credit facility: Principal amount Weighted-average interest rate senior notes and note payable. 26, 2014 Subsidiaries Assets Current assets: Cash and cash equivalents Receivables: Crude oil and natural gas sales Affiliated parties Joint interest and other, net Derivative assets Inventories Deferred and prepaid taxes Prepaid expenses and other Total current assets Net property and equipment, based on successful efforts method of accounting Debt issuance costs, net Total assets Liabilities and shareholders’ equity Current liabilities: Accounts payable trade Revenues and royalties payable Payables to affiliated parties Accrued liabilities and other Derivative liabilities Current portion of asset retirement obligations Total current liabilities Long-term debt Other noncurrent liabilities: Deferred income tax liabilities Asset retirement obligations, net of current portion Noncurrent derivative liabilities Other noncurrent liabilities Total other noncurrent liabilities Commitments and contingencies (Note 10) Shareholders’ equity: Preferred stock, $0.01 par value; 25,000,000 shares authorized; no shares issued and outstanding Common stock, $0.01 par value; 500,000,000 shares authorized; 170,408,652 shares issued and outstanding at December 31, 2010; 169,968,471 shares issued and outstanding at December 31, 2009 Additional paid-in-capital Retained earnings Total shareholders’ equity Total liabilities and shareholders’ equity Subsidiaries Revenues: Crude oil and natural gas sales Crude oil and natural gas sales to affiliates Loss on mark-to-market derivative instruments, net Crude oil and natural gas service operations Total revenues Operating costs and expenses: Production expenses Production expenses to affiliates Production taxes and other expenses Exploration expenses Crude oil and natural gas service operations Depreciation, depletion, amortization and accretion Property impairments General and administrative expenses Gain on sale of assets Total operating costs and expenses Income from operations Other income (expense): Interest expense Other Income before income taxes Provision for income taxes Net income Basic net income per share Diluted net income per share Subsidiaries Balance, December 31, 2007 Net income Stock-based compensation Stock options: Exercised Repurchased and canceled Restricted stock: Issued Repurchased and canceled Forfeited Balance, December 31, 2008 Net income Stock-based compensation Excess tax benefit on stock-based compensation Stock options: Exercised Repurchased and canceled Restricted stock: Issued Repurchased and canceled Forfeited Balance, December 31, 2009 Net income Excess tax benefit on stock-based compensation Stock-based compensation Stock options: Exercised Repurchased and canceled Restricted stock: Issued Repurchased and canceled Forfeited Balance, December 31, 2010 Subsidiaries Cash flows from operating activities: Net income Adjustments to reconcile net income to net cash provided by operating activities: Depreciation, depletion, amortization and accretion Property impairments Change in fair value of derivatives Stock-based compensation Provision for deferred income taxes Excess tax benefit from stock-based compensation Dry hole costs Gain on sale of assets Other, net Changes in assets and liabilities: Accounts receivable Inventories Prepaid expenses and other Accounts payable trade Revenues and royalties payable Accrued liabilities and other Other noncurrent liabilities Net cash provided by operating activities Cash flows from investing activities: Exploration and development Purchase of crude oil and natural gas properties Purchase of other property and equipment Proceeds from sale of assets Net cash used in investing activities Cash flows from financing activities: Revolving credit facility borrowings Repayment of revolving credit facility Proceeds from issuance of Senior Notes Other debt Repayment of other debt Debt issuance costs Repurchase of equity grants Excess tax benefit from stock-based compensation Dividends to shareholders Exercise of stock options Net cash provided by financing activities Net change in cash and cash equivalents Cash and cash equivalents at beginning of period Cash and cash equivalents at end of period statements. Subsidiaries 2013. eliminated upon consolidation. Estimated crude oil and natural gas sales Year ended December 31, 2008 Year ended December 31, 2009 Year ended December 31, 2010 Tubular goods and equipment Crude oil In barrels Crude oil line fill requirements Temporarily stored crude oil 2014. Of the suspended costs, Service property and equipment Furniture and fixtures Automobiles Machinery and equipment Office equipment, computer equipment and software Enterprise resource planning software Buildings and improvements retirement obligations Subsidiaries Statements Asset retirement obligations at January 1 Accretion expense Revisions Plus: Additions for new assets Less: Plugging costs and sold assets Total asset retirement obligations at December 31 Less: Current portion of asset retirement obligations at December 31 Non-current portion of asset retirement obligations at December 31 2013: The Company’s impairment assessments are affected by economic factors such as the results of exploration activities, commodity price outlooks, anticipated drilling programs, remaining lease terms, and potential shifts in business strategy employed by management. net.” The fair value of derivative contracts is based upon various factors, including commodity exchange prices, over-the-counter quotations, and, in the case of collars, volatility, the risk-free interest rate, and the time to expiration. See The Company’s policy is to recognize penalties and interest related to unrecognized tax benefits, if any, in income tax expense. Income (numerator): Net income—basic and diluted Weighted average shares (denominator): Weighted average shares—basic Restricted stock Employee stock options Weighted average shares—diluted Net income per share: Basic Diluted standard Supplemental cash flow information: Cash paid for interest Cash paid for income taxes Cash received for income tax refunds Non-cash investing activities: Asset retirement obligations Proved crude oil and natural gas properties Unproved crude oil and natural gas properties Service properties, equipment and other Total property and equipment Accumulated depreciation, depletion and amortization Net property and equipment 2012: Prepaid advances from joint interest owners Accrued compensation Accrued production taxes and ad valorem taxes Accrued interest Other 2012: Period and Type of Contract January 2011 – March 2011 Swaps Collars April 2011 – June 2011 Swaps Collars July 2011 – September 2011 Swaps Collars October 2011 – December 2011 Swaps Collars January 2012 – December 2012 Swaps Collars January 2013 – December 2013 Swaps Collars Period and Type of Contract January 2011 – December 2011 Swaps Realized gain (loss) on derivatives: Crude oil fixed price swaps Crude oil collars Natural gas fixed price swaps Natural gas basis swaps Unrealized gain (loss) on derivatives: Crude oil fixed price swaps Crude oil collars Natural gas fixed price swaps Natural gas basis swaps Gain (loss) on mark-to-market derivative instruments Commodity swaps and collars The Company’s policy is to recognize transfers between the hierarchy levels as of the beginning of the reporting period in which the event or change in circumstances caused the transfer. Description Derivative assets (liabilities): Fixed price swaps Basis swaps Collars Total Description Derivative assets (liabilities): Fixed price swaps Basis swaps Collars Total Balance at January 1 Total realized or unrealized gains (losses): Included in earnings Included in other comprehensive income Purchases, sales, issuances and settlements, net Transfers into Level 3 Transfers out of Level 3 Balance at December 31 Change in unrealized gains (losses) relating to derivatives still held at December 31 nonrecurring basis assets. Proved property impairments Non-producing property impairments Total Long-term debt Revolving credit facility 8 1/4% Senior Notes due 2019(1) 7 3/8% Senior Notes due 2020(2) 7 1/8% Senior Notes due 2021(3) Total prices and, accordingly, are classified as Level 1 in the fair value hierarchy. Revolving credit facility: Prime rate based loans LIBOR based loans Total revolving credit facility 8 1/4% Senior Notes due 2019(1) 7 3/8% Senior Notes due 2020(2) 7 1/8% Senior Notes due 2021(3) Total debt 2013. outstanding senior note obligations. sinking fund requirements. senior notes. The Company’s other subsidiary, 20 Broadway Associates LLC, the value of whose assets and operations are minor, does not guarantee the senior notes. Current tax provision: Federal State Total current tax provision Deferred tax provision: Federal State Total deferred tax provision Total provision for income taxes Federal income tax provision at statutory rate (35%) State income tax provision (benefit), net of Federal benefit Non-deductible stock-based compensation Other, net Provision for income taxes periods presented: Subsidiaries Statements Current: Deferred tax assets(1) Unrealized losses on derivatives Other expenses Total current deferred tax assets Noncurrent: Deferred tax assets Net operating loss carryforwards Unrealized losses on derivatives Alternative minimum tax carryforwards Other Total noncurrent deferred tax assets Deferred tax liabilities Property and equipment Deferred compensation Total noncurrent deferred tax liabilities Net noncurrent deferred tax liabilities Net deferred tax liabilities In these years 2011 2012 2013 2014 2015 Total obligations Fracturing and related to these transactions, which is included in the caption “Payables to affiliated parties” in the consolidated balance sheets. amount of pipeline capacity used, which will be allocated between the affiliated party and unaffiliated party. Future commitments under the joint tariff arrangement, a portion of which will be allocated to the affiliate, total approximately Non-cash equity compensation options or expired. The Outstanding at December 31, 2007 Exercised Outstanding at December 31, 2008 Exercised Outstanding at December 31, 2009 Exercised Outstanding at December 31, 2010 for the periods presented: The intrinsic value of a stock option is the amount by which the value of the underlying stock exceeds the exercise price of the option at its exercise date. The total intrinsic value of options exercised during the years ended December 31, Non-vested restricted shares at December 31, 2007 Granted Vested Forfeited Non-vested restricted shares at December 31, 2008 Granted Vested Forfeited Non-vested restricted shares at December 31, 2009 Granted Vested Forfeited Non-vested restricted shares at December 31, 2010 Property Acquisitions and Dispositions common stock, par value Subsidiaries Crude oil and natural gas sales Production expenses Production taxes and other expenses Exploration expenses Depreciation, depletion, amortization and accretion Property impairments Income taxes Results from crude oil and natural gas producing activities 2011. Property Acquisition Costs: Proved Unproved Total property acquisition costs Exploration Costs Development Costs Total Proved crude oil and natural gas properties Unproved crude oil and natural gas properties Total Less accumulated depreciation, depletion and amortization Net capitalized costs period of determination. Balance at January 1 Additions to capitalized exploratory well costs pending determination of proved reserves Reclassification to proved crude oil and natural gas properties based on the determination of proved reserves Capitalized exploratory well costs charged to expense Balance at December 31 Number of projects Subsidiaries Statements Proved reserves as of December 31, 2007 Revisions of previous estimates Extensions, discoveries and other additions Production Sales of minerals in place Purchases of minerals in place Proved reserves as of December 31, 2008 Revisions of previous estimates Extensions, discoveries and other additions Production Sales of minerals in place Purchases of minerals in place Proved reserves as of December 31, 2009 Revisions of previous estimates Extensions, discoveries and other additions Production Sales of minerals in place Purchases of minerals in place Proved reserves as of December 31, 2010 2010. Downward revisions to natural gas reserves for both of the years ended December 31, 2011 and 2012 were due to the removal of proved undeveloped ("PUD") reserves for certain dry gas properties not expected to be developed given the pricing environment for natural gas. year ended December 31, 2012 primarily reflected the Company’s acquisitions of properties in the Bakken play of North Dakota during the year. See Proved Developed Reserves Proved Undeveloped Reserves 2011: not occur in the periods assumed. Actual prices realized, costs incurred and production quantities may vary significantly from those used. Therefore, the estimated future net cash flow computations should not be considered to represent the Company’s estimate of the expected revenues or the current value of existing proved reserves. Future cash inflows Future production costs Future development and abandonment costs Future income taxes Future net cash flows 10% annual discount for estimated timing of cash flows Standardized measure of discounted future net cash flows 2011. Standardized measure of discounted future net cash flows at the beginning of the year Extensions, discoveries and improved recoveries, less related costs Revisions of previous quantity estimates Changes in estimated future development and abandonment costs Purchases (sales) of minerals in place Net change in prices and production costs Accretion of discount Sales of crude oil and natural gas produced, net of production costs Development costs incurred during the period Change in timing of estimated future production and other Change in income taxes Net change Standardized measure of discounted future net cash flows at the end of the year Subsidiaries 2010 Total revenues(1) Gain (loss) on mark-to-market derivative instruments, net(1) Income (loss) from operations Net income (loss) Net income (loss) per share: Basic Diluted 2009 Total revenues(1) Gain (loss) on mark-to-market derivative instruments, net(1) Income (loss) from operations Net income (loss) Net income (loss) per share: Basic Diluted 67. Signature Title Date /s/ /s/ /s/ /s/ /s/ Item 5. Market for Registrant’s Common Equity, Related ShareholderStockholder Matters and Issuer Purchases of Equity Securitiesand cash dividends declared for each quarter of the previous two years. 2010 2009 Quarter ended Quarter ended March 31 June 30 September 30 December 31 March 31 June 30 September 30 December 31 $ 46.18 $ 52.53 $ 48.65 $ 59.98 $ 26.97 $ 34.41 $ 44.31 $ 47.27 36.27 39.35 38.23 45.00 13.84 20.00 22.33 36.25 — — — — — — — — Our No cash dividends were declared during the previous two years. 2013 2012 Quarter Ended Quarter Ended March 31 June 30 September 30 December 31 March 31 June 30 September 30 December 31 High $ 93.99 $ 89.63 $ 108.19 $ 121.78 $ 97.19 $ 91.82 $ 84.19 $ 80.59 Low $ 74.03 $ 72.35 $ 86.56 $ 100.25 $ 67.94 $ 61.50 $ 61.02 $ 66.07 Cash Dividend — — — — — — — — notesnote indentures restrict the payment of dividends under certain circumstances and we do not anticipate paying any cash dividends on our common stock in the foreseeable future. As of February 18, 2011,17, 2014, the number of record holders of our common stock was 72.126. Management believes, after inquiry, that the number of beneficial owners of our common stock is approximately 20,600.57,200. On February 18, 2011,17, 2014, the last reported sales price of our Common Stock,common stock, as reported on the NYSE,New York Stock Exchange, was $63.84$113.27 per share.2010: Total number
of shares
purchased (1) Average
price paid
per share (2) Total number of
shares purchased as
part of publicly
announced plans
or programs Maximum number
of shares that may
yet be purchased
under the plans
or program (3) 53,734 $ 48.65 — — 24,897 $ 49.92 — — 726 $ 57.91 — — 79,357 $ 49.13 — — Period Total number of
shares purchased Average
price paid
per share Total number of shares
purchased as part of
publicly announced
plans or programs Maximum number of
shares that may yet be
purchased under the
plans or programs (3)October 1, 2013 to October 31, 2013 — — — — November 1, 2013 to November 30, 2013 92,303 (1) $ 116.45 (1) — — December 1, 2013 to December 31, 2013 41,000 (2) $ 102.20 (2) — — Total 133,303 $ 112.07 — — (1) In connection with stock option exercises or restricted stock grants under the Continental Resources, Inc. 2000 Stock Option Plan (“2000 Plan”) and the Continental Resources, Inc.Company's 2005 Long-Term Incentive Plan (“("2005 Plan”Plan") and 2013 Long-Term Incentive Plan ("2013 Plan"), we adopted a policy that enables employees to surrender shares to cover their tax liability. AllEffective May 23, 2013, the 2013 Plan was adopted and replaced the Company's 2005 Plan. Restricted stock awards granted under the 2005 Plan prior to the adoption of the 2013 Plan will remain outstanding in accordance with their terms. The 92,303 shares purchased above represent shares surrendered by employees to cover tax liabilities. We paid the associated taxes to the Internal Revenue Service.(2)The price paid per share was the closing price of our common stock on the date of exercise or the date the restrictions lapsed on such shares, as applicable.shares. We paid the associated taxes to the Internal Revenue Service.(2) Represents shares of our common stock purchased by Harold G. Hamm, our Chairman, Chief Executive Officer, and controlling shareholder in an open-market transaction on December 11, 2013. (3) We are unable to determine at this time the total amount of securities or approximate dollar value of those securities that could potentially be surrendered to us pursuant to our policy that enables employees to surrender shares to cover their tax liability associated with the exercise of options or vesting of restrictions on shares.Number of Shares
to be Issued Upon
Exercise of
Outstanding
OptionsWeighted-Average
Exercise Price of
Outstanding OptionsRemaining Shares
Available for Future
Issuance Under Equity
Compensation Plans (1)Equity Compensation Plans Approved by Shareholders — — 9,813,989 Equity Compensation Plans Not Approved by Shareholders — — — (1) Represents the maximum remaining shares available for issuance under the 2000 Plan and 20052013 Plan.performance graph compares the yearly percentage change in the cumulative total shareholder return on our common stock performance with the cumulative total returnsperformance of the Standard & Poor’s 500 Stock Index (“S&P 500 Index”) and the groupDow Jones US Oil and Gas Index (“Dow Jones US O&G Index”) for the period of companiesDecember 2008 through December 2013. The graph assumes the value of the investment in our peer group as outlined below. common stock and in each index was $100 on December 31, 2008 and that any dividends were reinvested. The stock performance shown on the graph below is not indicative of future price performance. As required by those rules, the performance graph was prepared based upon the following assumptions:$100 was invested in our common stock at its initial public offering price of $15 per share and was invested in the S&P 500 Index and our “peer group” on May 14, 2007, our initial public offering date, at the closing price on such date;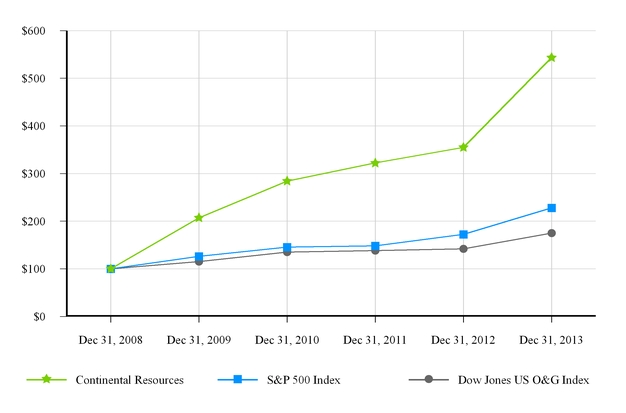
investment in our peer group was weighted based on the stock price of each individual company within the peer group at the beginning of the period; anddividends were reinvested on the relevant payment dates.In years prior to 2010, our peer group was comprised of the following companies:Bill Barrett CorporationDenbury Resources Inc.Encore Acquisition CompanyQuicksilver Resources Inc.Range Resources CorporationSM Energy Company (formerly St. Mary Land and Exploration Company)Southwestern Energy CompanyIn March 2010, Encore Acquisition Company was acquired by Denbury Resources Inc. and ceased being a stand-alone publicly traded entity. As a result, Encore Acquisition Company was removed from our peer group in 2010. Further, in 2010 our peer group was expanded to include the additional companies shown below. These companies have historically been included in our executive compensation survey group and proxy statement filings for 2007, 2008 and 2009 and are now being included herein so that our peer group used in this Annual Report on Form 10-K is consistent with the peer group used in our proxy statement disclosures. The historical peers reflected above and the additional peers below were selected because they are publicly traded crude oil and natural gas exploration and production companies similar in size and operations to us.Cabot Oil & Gas CorporationComstock Resources, Inc.EXCO Resources, Inc.Forest Oil CorporationPetrohawk Energy CorporationPlains Exploration & Production Company
Item 6. Selected Financial Data historical and pro forma consolidated financial data.data for the years ended December 31, 2009 through 2013. The selected historical consolidated financial data presented below is not intended to replace our historical consolidated financial statements. historical consolidated financial data, as it relates to each of the fiscal years ended December 31, 20062009 through 2010,2013, has been derived from our audited historical consolidated financial statements for such periods. You should read the following selected historical consolidated financial data in connection withPart II, Item 7. Management’s Discussion and Analysis of Financial Condition and Results of Operations and our historical consolidated financial statements and related notes included elsewhere in this report. The selected historical consolidated results are not necessarily indicative of results to be expected in future periods. YEAR ENDED DECEMBER 31, 2010 2009 2008 2007 2006 $ 948,524 $ 610,698 $ 939,906 $ 606,514 $ 468,602 (130,762 ) (1,520 ) (7,966 ) (44,869 ) — 839,065 626,211 960,490 582,215 483,652 168,255 71,338 320,950 28,580 253,088 168,255 71,338 320,950 28,580 253,088 $ 1.00 $ 0.42 $ 1.91 $ 0.17 $ 1.60 $ 1.00 $ 0.42 $ 1.91 $ 0.17 $ 1.60 168,985 168,559 168,087 164,059 158,114 $ 0.99 $ 0.42 $ 1.89 $ 0.17 $ 1.59 $ 0.99 $ 0.42 $ 1.89 $ 0.17 $ 1.59 169,779 169,529 169,392 165,422 159,665 $ 184,002 $ 156,833 184,002 156,833 1.12 0.97 1.11 0.96 11,820 10,022 9,147 8,699 7,480 23,943 21,606 17,151 11,534 9,225 15,811 13,623 12,006 10,621 9,018 $ 70.69 $ 54.44 $ 88.87 $ 63.55 $ 55.30 4.49 3.22 6.90 5.87 6.08 59.70 45.10 77.66 58.31 52.09 $ 5.87 $ 6.89 $ 8.40 $ 7.35 $ 6.99 4.82 3.37 4.84 3.13 2.48 15.33 15.34 12.30 9.00 7.27 3.09 3.03 2.95 3.15 3.45 224,784 173,280 106,239 104,145 98,038 839,568 504,080 318,138 182,819 121,865 364,712 257,293 159,262 134,615 118,349 653,167 372,986 719,915 390,648 417,041 (1,039,416 ) (499,822 ) (927,617 ) (483,498 ) �� (324,523 ) 379,943 135,829 204,170 94,568 (91,451 ) 810,877 450,648 757,708 469,885 372,115 1,237,189 433,991 988,593 525,677 326,579 $ — $ — $ — $ 0.33 $ 0.55 $ 3,591,785 $ 2,314,927 $ 2,215,879 $ 1,365,173 $ 858,929 925,991 523,524 376,400 165,000 140,000 1,208,155 1,030,279 948,708 623,132 490,461 Year Ended December 31, 2013 2012 2011 2010 2009 Income Statement data In thousands, except per share data Crude oil and natural gas sales $ 3,606,774 $ 2,379,433 $ 1,647,419 $ 948,524 $ 610,698 Gain (loss) on derivative instruments, net (1) (191,751 ) 154,016 (30,049 ) (130,762 ) (1,520 ) Total revenues 3,455,150 2,572,520 1,649,789 839,065 626,211 Income from continuing operations 764,219 739,385 429,072 168,255 71,338 Net income 764,219 739,385 429,072 168,255 71,338 Basic earnings per share: From continuing operations $ 4.15 $ 4.08 $ 2.42 $ 1.00 $ 0.42 Net income per share $ 4.15 $ 4.08 $ 2.42 $ 1.00 $ 0.42 Shares used in basic earnings per share 184,075 181,340 177,590 168,985 168,559 Diluted earnings per share: From continuing operations $ 4.13 $ 4.07 $ 2.41 $ 0.99 $ 0.42 Net income per share $ 4.13 $ 4.07 $ 2.41 $ 0.99 $ 0.42 Shares used in diluted earnings per share 184,849 181,846 178,230 169,779 169,529 Production Crude oil (MBbl) (2) 34,989 25,070 16,469 11,820 10,022 Natural gas (MMcf) 87,730 63,875 36,671 23,943 21,606 Crude oil equivalents (MBoe) 49,610 35,716 22,581 15,811 13,623 Average sales prices (3) Crude oil ($/Bbl) $ 89.93 $ 84.59 $ 88.51 $ 70.69 $ 54.44 Natural gas ($/Mcf) 5.25 4.20 5.24 4.49 3.22 Crude oil equivalents ($/Boe) 72.71 66.83 73.05 59.70 45.10 Average costs per Boe ($/Boe) (3) Production expenses $ 5.69 $ 5.49 $ 6.13 $ 5.87 $ 6.89 Production taxes and other expenses 6.69 6.42 6.42 4.82 3.37 Depreciation, depletion, amortization and accretion 19.47 19.44 17.33 15.33 15.34 General and administrative expenses (4) 2.91 3.42 3.23 3.09 3.03 Proved reserves at December 31 Crude oil (MBbl) 737,788 561,163 326,133 224,784 173,280 Natural gas (MMcf) 2,078,020 1,341,084 1,093,832 839,568 504,080 Crude oil equivalents (MBoe) 1,084,125 784,677 508,438 364,712 257,293 Other financial data (in thousands) Net cash provided by operating activities $ 2,563,295 $ 1,632,065 $ 1,067,915 $ 653,167 $ 372,986 Net cash used in investing activities (3,711,011 ) (3,903,370 ) (2,004,714 ) (1,039,416 ) (499,822 ) Net cash provided by financing activities 1,140,469 2,253,490 982,427 379,943 135,829 EBITDAX (5) 2,839,510 1,963,123 1,303,959 810,877 450,648 Total capital expenditures 3,841,633 4,358,572 2,224,096 1,237,189 433,991 Balance Sheet data at December 31 (in thousands) Total assets $ 11,941,182 $ 9,140,009 $ 5,646,086 $ 3,591,785 $ 2,314,927 Long-term debt, including current maturities 4,715,832 3,539,721 1,254,301 925,991 523,524 Shareholders’ equity 3,953,118 3,163,699 2,308,126 1,208,155 1,030,279 (1) Derivative instruments are not accounted fordesignated as hedges for accounting purposes and, therefore, realized and unrealized changes in the fair value of the instruments are shown separately from crude oil and natural gas sales. The amounts above include unrealized non-cash mark-to-market lossesgains (losses) on derivative instruments of $166.2($130.2) million, $2.1$199.7 million, $4.1 million, ($166.2) million and $26.7($2.1) million for the years ended December 31, 2013, 2012, 2011, 2010, and 2009, and 2007, respectively. There were no unrealized gains or losses on derivative instruments for the years ended December 31, 2008 and 2006.(2)Prior to our initial public offering on May 14, 2007, we were a subchapter S corporation and income taxes were payable by our shareholders. As a result, there was a minimal provision for income taxes for the periods ended December 31, 2006 and prior. In connection with our initial public offering, weconverted to a subchapter C corporation. Pro forma adjustments are reflected to provide for income taxes as if we had been a subchapter C corporation for all periods presented. A statutory Federal tax rate of 35% and effective state tax rate of 3% (net of Federal income tax effects) were used for the pro forma enacted tax rate for all pro forma periods presented.(3)(2)At various times, we have stored crude oil due to pipeline line fill requirements, low commodity prices, or because of low pricestransportation constraints or we have sold crude oil from inventory. These actions result in differences between our produced and sold crude oil volumes. For the year2013, crude oil sales volumes were 4 MBbls less than crude oil production volumes. For 2012, crude oil sales volumes were 112 MBbls less than crude oil production volumes. For 2011, crude oil sales volumes were 30 MBbls less than crude oil production volumes. For 2010, crude oil sales volumes were 78 MBbls more than crude oil production volumes. For the year 2009, crude oil sales volumes were 82 MBbls less than crude oil production volumes. For the year 2008, crude oil sales volumes were 97 MBbls more than crude oil production volumes. For the years 2007 and 2006, crude oil sales volumes were 221 MBbls and 21 MBbls less than crude oil production volumes, respectively.(4)(3) Average sales prices and average costs per Boe have been computed using sales volumes and exclude any effect of derivative transactions. (4) General and administrative expenses ($/Boe) include non-cash equity compensation expenses of $0.80 per Boe, $0.82 per Boe, $0.73 per Boe, $0.74 per Boe and $0.84 per Boe for the years ended December 31, 2013, 2012, 2011, 2010, and 2009, respectively. Additionally, general and administrative expenses include corporate relocation expenses of $0.04 per Boe, $0.22 per Boe and $0.14 per Boe for the years ended December 31, 2013, 2012 and 2011. No corporate relocation expenses were incurred prior to 2011. (5) unrealized derivativenon-cash gains and losses resulting from the requirements of accounting for derivatives, and non-cash equity compensation expense. EBITDAX is not a measure of net income or operating cash flows as determined by generally accepted accounting principles (“GAAP”). A reconciliationprinciples. Reconciliations of net income and operating cash flows to EBITDAX isare provided inPart II, Item 7. Management’s Discussion and Analysis of Financial Condition and Results of Operations—Non-GAAP Financial Measures.ItemITEM 7. Management’s Discussion and Analysis of Financial Condition and Results of Operations historical consolidated financial statements and notes, as well as the selected historical consolidated financial data included elsewhere in this report. Our operating results for the periods discussed below may not be indicative of future performance. For aadditional discussion of crude oil and natural gas reserve information, please seePart I, Item 1. Business—Crude Oil and Natural Gas Operations. The following discussion and analysis includes forward-looking statements and should be read in conjunction withPart I, Item 1A. Risk Factors in this report, along withCautionary Statement Regarding Forward-Looking Statementsfor the Purpose of the “Safe Harbor” Provisions of the Private Securities Litigation Reform Act of 1995 at the beginning of this report, for information about the risks and uncertainties that could cause our actual results to be materially different than our forward-looking statements.Overviewengaged inan independent crude oil and natural gas exploration exploitation and production activitiescompany with properties in the North, South, and East regions of the United States. The North region consists of properties north of Kansas and west of the Mississippi riverRiver and includes North Dakota Bakken, Montana Bakken, and the Red River units and the Niobrara play in Colorado and Wyoming.units. The South region includes Kansas and all properties south of Kansas and west of the Mississippi riverRiver including the Arkoma Woodford and Anadarko Woodfordvarious plays in the South Central Oklahoma Oil Province (“SCOOP”), Northwest Cana, and Arkoma areas of Oklahoma. The East region contains propertiesis comprised of undeveloped leasehold acreage east of the Mississippi river includingRiver. In December 2012, we sold the Illinois Basinproducing crude oil and Michigan.stimulationstimulation) and enhanced recovery technologies allow usprovide the means to economically develop and produce crude oil and natural gas reserves from unconventional formations. We derive the majority of our operating income and cash flows from the sale of crude oil and natural gas. We expect that growth in our revenues and operating income will primarily depend on productcommodity prices and our ability to increase our reserves and related crude oil and natural gas production. In recent monthsyears, there has been significant volatilitydiscoveries resulting from our exploration and development activities were the primary drivers of our proved reserves growth in 2013, adding 444.7 MMBoe of proved reserves during the year. Our extensions and discoveries were primarily driven by successful drilling results and strong production growth in the Bakken field and the emerging SCOOP play. Our proved reserves in the Bakken field totaled 741.1 MMBoe at December 31, 2013, representing a 32% increase from 563.6 MMBoe at year-end 2012. Proved reserves in the SCOOP play increased 241% from 62.9 MMBoe at December 31, 2012 to 214.7 MMBoe at December 31, 2013. The year 2013 was an impactful year for SCOOP as our drilling results and results from others in the industry have helped establish a crude oil and liquids-rich natural gas prices due to a varietyproductive fairway that has resulted in the booking of factors we cannot control or predict, including political and economic events, weather conditions, and competitionadditional reserves from other energy sources. These factors impact supply and demand for crude oil and natural gas, which affects crude oil and natural gas prices. In addition,this emerging play.prices we realize for our crude oil and natural gas production are affected by location differences in market prices.Crude oilBakken field comprised 62%68% of our 364.7proved reserves at December 31, 2013, with SCOOP comprising 20% and the Red River units in North Dakota, South Dakota and Montana comprising 7%. The Bakken, SCOOP and Red River units comprised 72%, 8% and 10%, respectively, of our proved reserves at year-end 2012. Estimated proved developed producing reserves were 404.8 MMBoe at December 31, 2013, representing 37% of our total estimated proved reserves ascompared with 39% at year-end 2012.2010 and 75%2013 compared to 72% at December 31, 2012. The decreased percentage of crude oil reserves at December 31, 2013 resulted from the significant increase in SCOOP reserves as a percentage of our 15,811 MBoe of production fortotal reserves during the year, then ended. which have a higher concentration of liquids-rich natural gas compared to our other operating areas such as the Bakken.interest, andinterest. At December 31, 2013, we operated wells that accounted for 88%87% of our PV-10total proved reserves and 69%86% of our 2,726 gross wells as of December 31, 2010.PV-10. By controlling operations, we are able to more effectively manage the costs and timing of exploration and development of our properties, including the drilling and fracture stimulationcompletion methods used.Our Additionally, our business strategy has historically focused on reserve and production growth through exploration and development. development activities.2010,2013, we added 253,334 MBoe840.3 MMBoe of proved reserves through extensions and discoveries, compared to 2,603 MBoe84.5 MMBoe added through acquisitions. During this period, our production increased from 12,006 MBoe in 2008 to 15,811 MBoe in 2010. An aspect of our business strategy has been to acquire large undeveloped acreage positions in new or developing resource plays. As of December 31, 2010, we held 2,344,148 gross (1,370,435 net) undeveloped acres, including 669,560 net undeveloped acres in the Bakken field in MontanaNorth Dakota and 265,119 net undeveloped acres in the Oklahoma Woodford shale projects. As an early entrant in new or emerging plays, we expect to acquire undeveloped acreage at a lower cost than those of later entrants into a developing play.2010,2013, our crude oil and natural gas production increased to 15,811totaled 49,610 MBoe (43,318(135,919 Boe per day), anrepresenting a 39% increase from production of 16% from35,716 MBoe (97,583 Boe per day) for the year ended December 31, 2009. 2012. Crude oil represented 71% of our 2013 production compared to 70% for 2012.20102013 production was primarily resulted from an increase indriven by higher production from our properties in the North Dakota Bakken field and Anadarko Woodfordthe SCOOP play due to the continued success of our drilling programs in Oklahoma. those areas.2010 increased by 55% to $948.5the fourth quarter of 2013, a 36% increase over revenues of $670.4 million for the 2012 fourth quarter due to a 32%36% increase in sales volumes, with realized commodity prices along with increased productionbeing consistent between periods. Crude oil represented 85% of our total crude oil and natural gas revenues for the fourth quarter of 2013 compared to 2009. Our realized price per Boe increased $14.60 to $59.70 for 2010 compared to 2009. At various times we have stored crude oil due to pipeline line fill requirements or because of low prices or we have sold oil from inventory. These actions result in differences between our produced and sold crude oil volumes. Crude oil sales volumes were 78 MBbls more than crude oil production88% for the year ended December 31, 2010 and crude oil sales volumes were 82 MBbls less than crude oil production for the same period in 2009. 2012 fourth quarter.20102013 were $653.2 million, an$2.56 billion, a 57% increase of $280.2 million from $373.0 million$1.63 billion provided by our operating activities during the comparable 20092012 period. The increase inFor the fourth quarter of 2013, operating cash flows wastotaled $584.8 million, 21% higher than operating cash flows of $484.2 million for the 2012 fourth quarter. The increased operating cash flows in 2013 were primarily due to increasedhigher crude oil and natural gas revenues as a resultresulting mainly from increased sales volumes, partially offset by an increase in cash losses on matured derivatives and higher production expenses, production taxes, general and administrative expenses, interest expense and other expenses associated with the growth of higher commodity prices and sales volumes. Duringour operations over the past year.2010,2013, we invested $1.24approximately $3.57 billion (includingin our capital program (excluding $268.1 million of unbudgeted acquisitions and including $28.4 million of seismic costs and $89.5 million of capital costs associated with increased accruals for capital expenditures). Capital expenditures for the fourth quarter of $148.02013 totaled $867.5 million, and $5.8excluding $71.2 million of seismic costs) in ourunbudgeted acquisitions. Our 2013 capital program concentrating mainlyfocused primarily on increased exploration and development in the Bakken field the Oklahoma Woodford play, and the Red River units.In October 2010,SCOOP play.Board of Directors approved a 2011Bakken acreage by 6% from 1,139,803 net acres at year-end 2012 to 1,209,821 net acres at year-end 2013 and increased our SCOOP acreage by 85% from 218,167 net acres at year-end 2012 to 403,854 net acres at year-end 2013.of $1.36for 2014 is $4.05 billion, which will focus primarilyexcluding acquisitions. Our 2014 capital program is expected to continue focusing on increasedexploratory and development drilling in the Bakken shalefield and SCOOP play. We expect to continue participating as a buyer of North Dakotaproperties if and when we have the Anadarko Woodford shaleability to increase our position in western Oklahoma.strategic plays at competitive terms.the availability under our revolving credit facility, including our ability to increase our borrowing capacity thereunder, will be sufficient to meet our budgeted capital expenditure needs.How We Evaluate Our Operationsoperationaloperating measures to evaluate our operations and assess our performance. Among these measures are (1) volumesare: (2) crude (3) per (4) EBITDAX. each of the three years ended December 31, 2010. Year ended December 31, 2010 2009 2008 32,385 27,459 24,993 65,598 59,194 46,861 43,318 37,324 32,803 $ 70.69 $ 54.44 $ 88.87 4.49 3.22 6.90 59.70 45.10 77.66 5.87 6.89 8.40 3.09 3.03 2.95 168,255 71,338 320,950 0.99 0.42 1.89 810,877 450,648 757,708 Year ended December 31, 2013 2012 2011 Average daily production: Crude oil (Bbl per day) 95,859 68,497 45,121 Natural gas (Mcf per day) 240,355 174,521 100,469 Crude oil equivalents (Boe per day) 135,919 97,583 61,865 Average sales prices: (1) Crude oil ($/Bbl) $ 89.93 $ 84.59 $ 88.51 Natural gas ($/Mcf) $ 5.25 $ 4.20 $ 5.24 Crude oil equivalents ($/Boe) $ 72.71 $ 66.83 $ 73.05 Production expenses ($/Boe) (1) $ 5.69 $ 5.49 $ 6.13 Production taxes (% of oil and gas revenues) 8.2 % 8.2 % 7.9 % DD&A ($/Boe) (1) $ 19.47 $ 19.44 $ 17.33 General and administrative expenses ($/Boe) (1) $ 2.91 $ 3.42 $ 3.23 Net income (in thousands) $ 764,219 $ 739,385 $ 429,072 Diluted net income per share $ 4.13 $ 4.07 $ 2.41 EBITDAX (in thousands) (2) $ 2,839,510 $ 1,963,123 $ 1,303,959 (1) Average sales prices and per unit expenses have been calculated using sales volumes and exclude any effect of derivative transactions. (2) General and administrative expense ($/Boe) includes non-cash equity compensation expense of $0.74 per Boe, $0.84 per Boe, and $0.75 per Boe for the years ended December 31, 2010, 2009 and 2008, respectively.(3)unrealized derivativenon-cash gains and losses resulting from the requirements of accounting for derivatives, and non-cash equity compensation expense. EBITDAX is not a measure of net income or operating cash flows as determined by U.S. GAAP. A reconciliationReconciliations of net income and operating cash flows to EBITDAX isare provided insubsequently under the heading Non-GAAP Financial Measuresbelow.three years ended December 31, 2010: Year Ended December 31, 2010 2009 2008 $ 948,524 $ 610,698 $ 939,906 (130,762 ) (1,520 ) (7,966 ) 839,065 626,211 960,490 528,744 493,923 431,167 51,854 22,280 10,793 258,467 110,008 518,530 90,212 38,670 197,580 $ 168,255 $ 71,338 $ 320,950 11,820 10,022 9,147 23,943 21,606 17,151 15,811 13,623 12,006 11,898 9,940 9,244 23,943 21,606 17,151 15,889 13,541 12,103 $ 70.69 $ 54.44 $ 88.87 $ 4.49 $ 3.22 $ 6.90 $ 59.70 $ 45.10 $ 77.66 Year Ended December 31, In thousands, except sales price data 2013 2012 2011 Crude oil and natural gas sales $ 3,606,774 $ 2,379,433 $ 1,647,419 Gain (loss) on derivative instruments, net (1) (191,751 ) 154,016 (30,049 ) Crude oil and natural gas service operations 40,127 39,071 32,419 Total revenues 3,455,150 2,572,520 1,649,789 Operating costs and expenses (2) (2,009,383 ) (1,279,713 ) (889,037 ) Other expenses, net (232,718 ) (137,611 ) (73,307 ) Income before income taxes 1,213,049 1,155,196 687,445 Provision for income taxes (448,830 ) (415,811 ) (258,373 ) Net income $ 764,219 $ 739,385 $ 429,072 Production volumes: Crude oil (MBbl) (3) 34,989 25,070 16,469 Natural gas (MMcf) 87,730 63,875 36,671 Crude oil equivalents (MBoe) 49,610 35,716 22,581 Sales volumes: Crude oil (MBbl) (3) 34,985 24,958 16,439 Natural gas (MMcf) 87,730 63,875 36,671 Crude oil equivalents (MBoe) 49,607 35,604 22,551 Average sales prices: (4) Crude oil ($/Bbl) $ 89.93 $ 84.59 $ 88.51 Natural gas ($/Mcf) 5.25 4.20 5.24 Crude oil equivalents ($/Boe) 72.71 66.83 73.05 (1) Amounts include unrealizeda non-cash mark-to-market lossesloss on derivative instruments of $166.2$130.2 million for the year ended December 31, 2013 and non-cash mark-to-market gains on derivative instruments of $199.7 million and $2.1$4.1 million for the years ended December 31, 20102012 and 2009,2011, respectively. There were no unrealized gains or losses on derivative instruments for the year ended December 31, 2008.(2) Netgaingains on salesales of assets of $29.6$0.1 million, $0.7$136.0 million, and $0.9$20.8 million for the years ended December 31, 2010, 20092013, 2012 and 2008,2011, respectively. In June 2010, we sold certain non-strategic leaseholds located in DeSoto Parish, LouisianaSee Notes to a third party with an effective dateConsolidated Financial Statements—Note 13. Property Acquisitions and Dispositions for further discussion of June 18, 2010. Total cash proceeds amounted to $35.4 million. In connection with the sale, we recognized a pre-tax gain of $31.7 million. The sale involved undeveloped acreage with no proved reserves2011 and no production or revenues.2012 dispositions.(3) At various times we have stored crude oil due to pipeline line fill requirements, low commodity prices, or because of low pricestransportation constraints or we have sold crude oil from inventory. These actions result in differences between our produced and sold crude oil volumes. Crude oil sales volumes were 78 MBbls more than crude oil production for the year ended December 31, 2010, 824 MBbls less than crude oil production for the year ended December 31, 2009 and 972013, 112 MBbls moreless than crude oil production for the year ended December 31, 2008.2012 and 30 MBbls less than crude oil production for the year ended December 31, 2011.(4) Average sales prices have been calculated using sales volumes and exclude any effect of derivative transactions. 20102013 compared to the year ended December 31, 20092012 Year Ended December 31, Volume
increase Percent
increase 2010 2009 Volume Percent Volume Percent 11,820 75 % 10,022 74 % 1,798 18 % 23,943 25 % 21,606 26 % 2,337 11 % 15,811 100 % 13,623 100 % 2,188 16 % Year Ended December 31, Volume
increase
(decrease) Percent
increase
(decrease) 2010 2009 MBoe Percent MBoe Percent 12,431 79 % 10,314 76 % 2,117 21 % 2,915 18 % 2,784 20 % 131 5 % 465 3 % 525 4 % (60 ) (11 )% 15,811 100 % 13,623 100 % 2,188 16 % Year Ended December 31, Volume
increase Volume
percent
increase 2013 2012 Volume Percent Volume Percent Crude oil (MBbl) 34,989 71 % 25,070 70 % 9,919 40 % Natural Gas (MMcf) 87,730 29 % 63,875 30 % 23,855 37 % Total (MBoe) 49,610 100 % 35,716 100 % 13,894 39 % Year Ended December 31, Volume
increase
(decrease) Percent
increase
(decrease) 2013 2012 MBoe Percent MBoe Percent North Region 38,023 77 % 27,207 76 % 10,816 40 % South Region 11,587 23 % 8,110 23 % 3,477 43 % East Region (1) — — 399 1 % (399 ) (100 %) Total 49,610 100 % 35,716 100 % 13,894 39 % (1) 18% during9,919 MBbls, or 40%, for the year ended December 31, 20102013 compared to the year ended December 31, 2009.2012. Production increases in the North Dakota Bakken field Red River units, and the Oklahoma WoodfordSCOOP play contributed incremental production volumes in 20102013 of 2,26210,661 MBbls, a 57% increase over production in excess of productionthese areas for the same period in 2009. Favorable drilling results have been the primary contributors to production2012. Production growth in these areas is primarily due to increased drilling and completion activity resulting from our drilling program. These increases were partially offset by a decrease of 418 MBbls associated with non-strategic properties in Wyoming and the East region that were sold in February 2012 and December 2012, respectively. Additionally, production from our properties in the Red River units and Northwest Cana play decreased a total of 308 MBbls, or 5%, over the prior year due to a combination of natural declines in production and reduced drilling activity in those areas.2,33723,855 MMcf, or 11%37%, duringfor the year ended December 31, 20102013 compared to the same period in 2009.2012. Natural gas production in the Bakken field inincreased 11,299 MMcf, or 61%, for the North region was up 2,172 MMcfyear ended December 31, 2013 compared to the same period in 20092012 due to additionalnew wells being completed and gas from existing wells being connected to natural gas being connected and soldprocessing plants in North Dakota.the play. Natural gas production in the Oklahoma Woodford areaSCOOP play increased 1,47122,378 MMcf, or 317%, due to additional wells being completed and producing during the year ended December 31, 2010in 2013 compared to 2009. The increased natural gas production in the Bakken and Oklahoma Woodford plays was2012. These increases were partially offset by decreases in natural gasproduction volumes of 916totaling 9,554 MMcf, or 27%, from our properties in the Cedar Hills fieldNorthwest Cana, Arkoma Woodford, and non-core areas in our South region due to the conversiona combination of producing wells to injection wells and 801 MMcf due to natural declines in non-Woodford areasproduction and reduced drilling activity. Additionally, natural gas production decreased 159 MMcf associated with non-strategic properties in Wyoming and the East region that were sold in February 2012 and December 2012, respectively.South region.RevenuesOiloil and Natural Gas Sales.natural gas sales. Crude oil and natural gas sales for the year ended December 31, 20102013 were $948.5 million,$3.61 billion, a 55%52% increase from sales of $610.7 million for 2009. Our realized price per Boe increased $14.60 to $59.70$2.38 billion for the year ended December 31, 2010 from $45.10 for the year ended December 31, 2009.same period in 2012. Our sales volumes increased 2,34814,003 MBoe, or 17%39%, over the same period in 20092012 primarily due to the continuing success of our drilling programs in the Bakken field and additionalSCOOP play.being connected and soldprices realized in the North region. connection with improved market prices along with an improvement in crude oil differentials.20102013 was $9.02$8.23 compared to $8.29$9.06 for 2009. Factors contributingthe year ended December 31, 2012. The improved differential reflects our continued efforts to the changing differentials included Canadianshift Bakken crude oil importssales to coastal markets in the United States with less dependence on currently available pipeline markets. We continue to employ a portfolio approach (rail and increasespipe) in transporting to multiple U.S. coastal and inland markets and expect this trend to continue in 2014. Rail transportation costs are typically higher than pipeline transportation costs per barrel mile, but market prices realized in U.S. coastal markets continue to be competitive with currently available pipeline markets. We plan to continue pursuing this portfolio approach to balance volumes delivered to pipeline and rail market destinations in an effort to maximize net wellhead value.North region, coupled with downstream transportation capacity constraintsWilliston basin continued to grow and seasonal refinery maintenance and outages resulted in a temporary reduction in demand fluctuations.for Bakken crude oil. As a result, our realized crude oil differential to WTI averaged $13.05 per barrel in the fourth quarter of 2013 compared to $7.80 per barrel for the 2013 third quarter and $3.21 per barrel for the 2012 fourth quarter. The wide differentials realized in the 2013 fourth quarter are expected to continue into the first quarter of 2014. We expect crude oil differentials to ultimately improve from current levels but for volatility to continue.Derivatives. We have entered into a number of derivative contracts, including fixed price swaps and zero-cost collars, to reduce the uncertainty of future cash flows in order to underpin our capital expenditures and drilling program. We are required to recognize all derivative instruments on the balance sheet as either assets or liabilities measured at fair value. We have not designated our derivative instruments as hedges for accounting purposes. As a result, we mark our derivative instruments to fair value and recognize the realized and unrealized changes in fair value in the consolidated statements of income under the caption “Gain (loss) on derivative instruments, net”, which is a component of total revenues.consolidated income statements under the caption “Loss on mark-to-marketfair value of our derivative instruments net.”During the year ended December 31, 2010, we realized gains on natural gas derivativesas a result of $22.3 million and realized gains on crude oil derivatives of $13.2 million. During the year ended December 31, 2010, we reported an unrealized non-cash mark-to-market gain on natural gas derivatives of $19.8 million and an unrealized non-cash mark-to-market loss on crude oil derivatives of $186.0 million. During the year ended December 31, 2009, we realized gains on natural gas derivatives of $0.6 million and reported an unrealized non-cash mark-to-market gain on natural gas derivatives of $1.6 million and an unrealized non-cash mark-to-market loss on crude oil derivatives of $3.7 million.Crude Oil and Natural Gas Service Operations. Our crude oil and natural gas service operations consist primarily of the treatment and sale of lower quality crude oil, or reclaimed crude oil. The table below shows the volumes and prices for the sale of reclaimed crude oil for the periods presented. Year ended
December 31, Variance 2010 2009 $ 69.35 $ 48.57 $ 20.78 227,000 199,000 28,000 During the year ended December 31, 2010, prices for reclaimed crude oil sold from our central treating units were $20.78 per barrel higher than the comparable 2009 period, which contributed to an increase in reclaimed crude oil revenue of $5.8 million to $16.8 million, contributing to an overall increasevolatility in crude oil and natural gas service operations revenueprices.$4.3matured contracts. Non-cash gains and losses below represent the change in fair value of derivative instruments which continue to be held at period end and the reversal of previously recognized non-cash gains or losses on derivative contracts that matured during the period. Year ended December 31, In thousands 2013 2012 Cash received (paid) on derivatives: Crude oil derivatives $ (71,156 ) $ (55,579 ) Natural gas derivatives 9,601 9,858 Cash paid on derivatives, net (61,555 ) (45,721 ) Non-cash gain (loss) on derivatives Crude oil derivatives (126,167 ) 202,478 Natural gas derivatives (4,029 ) (2,741 ) Non-cash gain (loss) on derivatives, net (130,196 ) 199,737 Gain (loss) on derivative instruments, net $ (191,751 ) $ 154,016 2010. During the year ended December 31, 2009, we sold high-pressure air2013 from our Red River units to a third party and recorded revenues of $2.2 million. Beginning January 2010, we no longer sell high-pressure air to a third party. Associated crude oil and natural gas service operations expenses increased $7.3$195.4 million to $18.1 million during the year ended December 31, 2010 compared to the same period in 2009 due mainly to an increase in the costs of purchasing and treating reclaimed crude oil for resale.Operating Costs and ExpensesProduction Expenses, Production Taxes and Other Expenses. Production expense remained consistent at $93.2 million during the years ended December 31, 2010 and 2009. Production expense per Boe decreased to $5.87 for the year ended December 31, 20102012. This increase is primarily the result of an increase in the number of producing wells along with higher costs incurred in 2013 from $6.89severe weather conditions encountered in the North region which created a more challenging operating environment compared to a mild winter season experienced in 2012. Production expense per Boe increased to $5.69 for the year ended December 31, 2013 compared to $5.49 per Boe for the year ended December 31, 2009. In the prior year, we leased compressors from a related party for approximately $400,000 per month under an operating lease and a new agreement was negotiated effective February 1, 2010 through November 2010 resulting in the monthly lease fee being reduced to $50,000, lowering production expense per Boe for the 2010 period. The per unit decrease was also driven by longer natural production periods on certain North Dakota Bakken wells that resulted in lower artificial lifting costs, positive secondary recovery efforts in the Cedar Hills field that have resulted in lower-cost improvements in production, and the conversion of certain high pressure air injection units to less costly waterflood units during 2010, which also contributed to lower-cost improvements in production. We plan to convert some waterflood units to high pressure air injection units on certain fields in 2011, which may result in increased production expenses compared to 2010.2012.$31.0$103.7 million, or 68%45%, duringto $332.1 million for the year ended December 31, 20102013 compared to $228.4 million for the year ended December 31, 20092012 as a result of higher crude oil and natural gas revenues resulting from increased commodity prices and sales volumes along with the expiration of various tax incentives.and higher realized commodity prices. Production taxes and other expenses onin the consolidated statements of income statements include other charges for marketing, gathering, dehydration and compression fees primarily related to natural gas sales in the ArkomaOklahoma Woodford areaand North Dakota Bakken areas of $6.1$33.3 million and $6.8$29.9 million for the years ended December 31, 20102013 and 2009,2012, respectively. The increase in other charges is primarily due to higher natural gas sales volumes in 2013. Production taxes, excluding other expenses,charges, as a percentage of crude oil and natural gas salesrevenues were 7.5%8.2% for the yearboth years ended December 31, 2010 compared to 6.5% for the year ended December 31, 2009. The increase is due to the expiration of various tax incentives coupled with higher taxable revenues in North Dakota, our most active area, which has production tax rates of up to 11.5% of crude oil revenues.2013 and 2012. Production taxes are generally based on the wellhead values of production and vary by state. Additionally, someSome states offer exemptions or reduced production tax rates for wells that produce less than a certain quantity of crude oil or natural gas and to encourage certain activities, such as horizontal drilling and enhanced recovery projects. In Montana and Oklahoma, new horizontal wells qualify for a tax incentive and are taxed at a lower rate during their initial months of production. After the incentive period expires, the tax rate increasesreverts to the statutory rates. Our overall production tax rate is expected to increase as production tax incentives we currently receive for horizontal wells reach the end of their incentive periods. Year Ended
December 31, Percent
increase
(decrease) 2010 2009 $ 5.87 $ 6.89 (15 %) 4.82 3.37 43 % $ 10.69 $ 10.26 4 % Year ended December 31, $/Boe 2013 2012 Production expenses $ 5.69 $ 5.49 Production taxes and other expenses 6.69 6.42 Production expenses, production taxes and other expenses $ 12.38 $ 11.91 Expensesexpenses. Exploration expenses consistsconsist primarily of dry hole costs and exploratory geological and geophysical costs that are expensed as incurred. ExplorationThe following table shows the components of exploration expenses for the periods indicated. Year ended December 31, In thousands 2013 2012 Exploratory geological and geophysical costs $ 25,597 $ 22,740 Dry hole costs 9,350 767 Exploration expenses $ 34,947 $ 23,507 $0.1$2.9 million in the year ended December 31, 2010 to $12.8 million due primarily to an increase in seismic expense of $3.8 million to $5.8 million offset by a decrease in dry hole expense of $3.5 million to $3.0 million. The majority of the dry hole costs, 76%, were in the South region for the year ended December 31, 20102013 due to changes in the timing and 67%amount of the dryacquisitions of exploratory seismic data between periods. Dry hole costs for the 2009 period were in the East region.Depreciation, Depletion, Amortization and Accretion (“DD&A”). Total DD&A increased $36.0$8.6 million or 17%, infor the year ended December 31, 20102013 and primarily reflect costs associated with exploratory wells in the Arkoma Woodford area and a non-Woodford area of our South region.same period in 2009,year ended December 31, 2012 primarily due to ana 39% increase in productionsales volumes. The following table shows the components of our DD&A rateon a unit of sales basis. Year ended December 31, $/Boe 2013 2012 Crude oil and natural gas properties $ 19.17 $ 19.10 Other equipment 0.24 0.25 Asset retirement obligation accretion 0.06 0.09 Depreciation, depletion, amortization and accretion $ 19.47 $ 19.44 Boe. Year Ended
December 31, 2010 2009 $ 14.92 $ 14.94 0.24 0.23 0.17 0.17 $ 15.33 $ 15.34 Impairments.impairments.Property impairments both proved and non-producing, decreasedincreased in the year ended December 31, 20102013 by $18.7$98.2 million to $65.0$220.5 million compared to $83.7$122.3 million duringfor the year ended December 31, 2009.2012.Impairment of non-producing properties increased $16.2 million during the year ended December 31, 2010 to $63.3 million compared to $47.1 million for 2009 reflecting higher amortization of leasehold costs resulting from a larger base of amortizable costs. Non-producingIndividually insignificant non-producing properties are amortized on a composite methodan aggregate basis based on our estimated experience of successful drilling and the average holding period.Impairment provisions Individually significant non-producing properties, if any, are assessed for proved crude oil and natural gasimpairment on a property-by-property basis. Impairments of non-producing properties were approximately $1.7increased $50.8 million for the year ended December 31, 2010approximately $36.6$117.9 million for the year ended December 31, 2009,2012. The increase primarily resulted from a decreaselarger base of $34.9amortizable costs in the current year coupled with higher rates of amortization resulting from changes in management’s estimates of undeveloped properties not expected to be developed before lease expiration. Additionally, undeveloped leasehold costs on certain properties in the Niobrara play were individually assessed for impairment in the 2013 fourth quarter based on indicators of impairment and were written down to fair value, which resulted in impairment charges being recognized of $8.4 million.or 95%.for the year ended December 31, 2013 compared to $4.3 million for the same period in 2012. We evaluate our proved crude oil and natural gas properties for impairment by comparing their cost basis to the estimated future cash flows on a field basis. If the cost basis is in excess of estimated future cash flows, then20102013 primarily reflect fair value adjustments made for certain properties in the Niobrara play in Colorado and Wyoming driven by uneconomic well results. Impairment provisions for proved properties in 2012 reflect uneconomic operating results in the East region and a non-Bakkennon-Woodford single-well field in the North region. Impairments of proved properties in 2009 were primarily related to uneconomic wells in our South region and a non-Bakken field in the North region.General and Administrative Expenses.General and administrative expenses. General and administrative (“G&A”) expenses increased $8.0$22.7 million to $49.1$144.4 million duringfor the year ended December 31, 20102013 from $41.1$121.7 million duringfor the comparable period of 2009. General and administrativein 2012. G&A expenses include non-cash charges for stock-basedequity compensation of $11.7$39.9 million and $11.4$29.1 million for the years ended December 31, 20102013 and 2009,2012, respectively. General and administrative expenses, excludingThe increase in equity compensation in 2013 resulted from a higher value of restricted stock grants being made throughout 2012 and 2013 due to employee growth, which resulted in increased $7.7expense recognition in 2013 compared to the prior year. Year ended December 31, $/Boe 2013 2012 General and administrative expenses $ 2.07 $ 2.38 Non-cash equity compensation 0.80 0.82 Corporate relocation expenses 0.04 0.22 Total general and administrative expenses $ 2.91 $ 3.42 2010 compared to2013 from $140.7 million for the year ended December 31, 2009. The increase was primarily relatedcomparable period in 2012 due to an increase in personnel costs and office related expenses associated with the growth of our Company during the year. On a volumetric basis, general and administrative expenses increased $0.06 to $3.09 per Boeweighted average outstanding long-term debt obligations. Our weighted average outstanding long-term debt balance for the year ended December 31, 2010 compared to $3.03 per Boe for the year ended December 31, 2009.Interest Expense. Interest expense increased $29.9 million, or 129%, for the year ended December 31, 2010 compared to the year ended December 31, 2009 due to an increase in our outstanding debt balance and higher rates of interest on our senior notes in the current year as compared to lower interest rates on our credit facility borrowings in the prior year. On September 23, 2009, we issued $300 million of 8 1/4% Senior Notes due 2019. On April 5, 2010, we issued $200 million of 7 3/8% Senior Notes due 2020. On September 16, 2010, we issued $400 million of 7 1/8% Senior Notes due 2021. We recorded $45.4 million in interest expense on the outstanding senior notes for the year ended December 31, 2010. Including the interest on the senior notes, our2013 was approximately $4.3 billion with a weighted average interest rate for the year ended December 31, 2010 was 6.98% withof 5.2% compared to a weighted average outstanding long-term debt balance of $685.8 million compared toapproximately $2.3 billion and a weighted average interest rate of 3.78%5.6% for the comparable period in 2012. The increase in outstanding debt resulted from the issuances of 5% Senior Notes due 2022 in 2012 and 4 1/2% Senior Notes due 2023 in 2013, the net proceeds of which were used to repay credit facility borrowings, to fund a portion of our capital budgets and for general corporate purposes.long-term debtcredit facility balance of $507.7decreased to $281.9 million for the year ended December 31, 2009.Our weighted average outstanding revolving credit facility balance decreased2013 compared to $121.7$322.1 million for the year ended December 31, 20102012. The weighted average interest rate on our credit facility borrowings was 2.0% for the year ended December 31, 2013 compared to $426.32.3% for the same period in 2012. At December 31, 2013, we had $275 million of outstanding borrowings on our credit facility compared to $595 million outstanding at December 31, 2012.2009. The weighted average interest rate on our revolving credit facility borrowings was lower at 2.73% for the year ended December 31, 2010 compared to 2.90% for the same period2012, resulting in 2009. At December 31, 2010, we had $30.0 million of outstanding borrowings on our revolving credit facility.Income Taxes. Income taxes for the year ended December 31, 2010 were $90.2 million compared to $38.7 million for the year ended December 31, 2009. We provided for income taxes at a combined federal and stateeffective tax raterates of approximately 35%37% and 36% for both 20102013 and 20092012, respectively, after taking into account permanent taxable differences. SeeNotes to Consolidated Financial Statements—Note 8. Income Taxes for more information. In January 2011, new tax legislation was enacted in the State of Illinois that substantially increases the state income tax rates for individuals and corporations in that state. A significant portion of our East region properties are located in the Illinois Basin; thus, our financial condition and results of operations will be negatively impacted by the tax rate changes in Illinois. Although we are still analyzing the effects of the legislation, we estimate that the tax rate change will increase our consolidated full-year 2011 effective tax rate by approximately 0.1% and result in an increase in our 2011 income tax expense. We will record the impact of the changes beginning in our income tax provision for the quarter ending March 31, 2011.20092012 compared to the year ended December 31, 20082011 Year Ended December 31, Volume
increase Percent
increase 2009 2008 Volume Percent Volume Percent 10,022 74 % 9,147 76 % 875 10 % 21,606 26 % 17,151 24 % 4,455 26 % 13,623 100 % 12,006 100 % 1,617 13 % Year Ended December 31, Volume
increase
(decrease) Percent
increase
(decrease) 2009 2008 MBoe Percent MBoe Percent 10,314 76 % 9,246 77 % 1,068 12 % 2,784 20 % 2,225 19 % 559 25 % 525 4 % 535 4 % (10 ) (2 )% 13,623 100 % 12,006 100 % 1,617 13 % Year Ended December 31, 2012 2011 Volume Percent Volume Percent Crude oil (MBbl) 25,070 70 % 16,469 73 % 8,601 52 % Natural Gas (MMcf) 63,875 30 % 36,671 27 % 27,204 74 % Total (MBoe) 35,716 100 % 22,581 100 % 13,135 58 % Year Ended December 31, 2012 2011 MBoe Percent MBoe Percent North Region 27,207 76 % 17,462 77 % 9,745 56 % South Region 8,110 23 % 4,705 21 % 3,405 72 % East Region (1) 399 1 % 414 2 % (15 ) (4 %) Total 35,716 100 % 22,581 100 % 13,135 58 % (1) 10%52% during the year ended December 31, 20092012 compared to the year ended December 31, 2008.2011. Production increases in the Bakken field, areathe Northwest Cana play and SCOOP play contributed incremental production volumes in excess2012 of 8,493 MBbls, an 81% increase over production in these areas for the same period in 2008 of 1,055 MBoe. Favorable results from drilling were the primary contributors to production2011. Production growth in this area. these areas was primarily due to increased drilling and completion activity resulting from our drilling program. Additionally, production in the Red River units increased 177 MBbls, or 4%, in 2012 due to new wells being completed and enhanced recovery techniques being successfully applied.4,45527,204 MMcf, or 26%74%, during the year ended December 31, 20092012 compared to the same period in 2008. The majority of the increase, 3.6 Bcf of natural2011. Natural gas was from the South region due to the results of our exploration effortsproduction in the Oklahoma Woodford play. The North region natural gas production was up 0.8 BcfBakken field increased 9,414 MMcf, or 104%, for the year ended December 31, 20092012 compared to the same period in 2008 mainly2011 due to new wells being completed and gas from existing wells being connected to natural gas processing plants in the play. Natural gas production in the Northwest Cana and SCOOP plays in Oklahoma increased 17,839 MMcf, or 156%, due to additional wells being completed and producing in the year ended December 31, 2012 compared to the same period in 2011. Further, natural gas being connected and soldproduction increased 716 MMcf, or 81%, in non-Bakken areas in the North Dakota Bakken area.RevenuesOiloil and Natural Gas Sales.natural gas sales. Crude oil and natural gas sales for the year ended December 31, 20092012 were $610.7 million,$2.38 billion, a 35% decrease44% increase from sales of $939.9 million$1.65 billion for 2008.the same period in 2011. Our sales volumes increased 1,43813,053 MBoe, or 12%58%, over the same period in 20082011 due to the continuing success of our enhanced oil recovery and drilling programs and additional natural gas being connected and sold in the North region.Dakota Bakken field and Northwest Cana play, along with early success achieved in the emerging SCOOP play in Oklahoma. Our realized price per Boe decreased $32.56$6.22 to $45.10$66.83 for the year ended December 31, 20092012 from $77.66$73.05 for the year ended December 31, 2008. 2011 due to lower commodity prices and higher crude oil differentials realized.20092012 was $8.29$9.06 compared to $9.50 for 2008. Factors contributing to the changing differentials included Canadian crude oil imports and increases in production in the North region, coupled with downstream transportation capacity constraints, refinery downtime in the North region, and seasonal demand fluctuations for gasoline.Derivatives. We are required to recognize all derivative instruments on the balance sheet as either assets or liabilities measured at fair value. We have not designated our derivative instruments as hedges for accounting pruposes. As a result, we mark our derivative instruments to fair value and recognize the realized and unrealized changes in fair value on derivative instruments in the income statements under the caption “Loss on mark-to-market derivative instruments, net.”During the year ended December 31, 2009, we realized gains on gas derivatives of $0.6 million. We reported an unrealized non-cash mark-to-market gain on gas derivatives of $1.6 million and an unrealized non-cash mark-to-market loss on oil derivatives of $3.7 million.Crude Oil and Natural Gas Service Operations. Our crude oil and natural gas service operations consist primarily of the treatment and sale of lower quality crude oil, or reclaimed crude oil, and the sales of high-pressure air. Prices for reclaimed crude oil sold from our central treating unit were lower$6.39 for the year ended December 31, 2009 than2011. Overall increased production and constrained logistical factors had a negative effect on our realized crude oil prices during 2012 and resulted in higher differentials compared to 2011. Factors contributing to the comparable 2008 period. The price decreased $45.30changing differential included a continued increase in crude oil production across the Williston Basin from the Bakken play as well as increased production and imports from Canada.from 2008 to 2009, which decreased reclaimed crude oil income by $10.2 million, contributing tofor the 2012 fourth quarter.decreasepositive net impact on the fair value of our derivatives, which resulted in net positive revenue adjustments of $154.0 million for the year. Revenues will continue to be significantly impacted, either positively or negatively, by changes in the fair value of our derivative instruments as a result of volatility in crude oil and natural gas service operations revenue of $11.5prices. The following table presents the impact on total revenues related to cash settlements on matured derivative instruments and non-cash gains and losses on open derivative instruments for the periods presented. Year ended December 31, In thousands 2012 2011 Cash received (paid) on derivatives: Crude oil derivatives $ (55,579 ) $ (71,411 ) Natural gas derivatives 9,858 37,305 Cash paid on derivatives, net (45,721 ) (34,106 ) Non-cash gain (loss) on derivatives Crude oil derivatives 202,478 18,753 Natural gas derivatives (2,741 ) (14,696 ) Non-cash gain on derivatives, net 199,737 4,057 Gain (loss) on derivative instruments, net $ 154,016 $ (30,049 ) 2009. Associated crude oil and natural gas service operations expenses decreased $7.5 million to $10.7 million during the year ended December 31, 20092012 from $18.2 million during the year ended December 31, 2008 due mainly to a decrease in the costs of purchasing and treating crude oil for resale compared to the same period in 2008. We sold high-pressure air from our Red River units to a third party and recorded revenues of $2.2$138.2 million for the year ended December 31, 2009 compared2011. This increase was primarily the result of an increase in the number of producing wells. Production expense per Boe decreased to revenues of $3.0 million$5.49 for the year ended December 31, 2008.Operating Costs and ExpensesProduction Expenses, Production Taxes and Other Expenses. Production expenses decreased $8.4 million, or 8%, during the year ended December 31, 20092012 compared to $93.2 million from $101.6 million during the year ended December 31, 2008. The decrease in production expenses was mainly attributable to reductions in energy costs, repairs and workovers. During the year ended December 31, 2009, we participated in the completion of 217 gross (67.8 net) wells. Production expenses per Boe decreased to $6.89 for the year ended December 31, 2009 from $8.40$6.13 per Boe for the year ended December 31, 2008.2011. This decrease was due in part to higher costs being incurred in the prior year resulting from the abnormal rainfall and flooding in North Dakota during the 2011 second quarter. The increased 2011 costs, coupled with reduced production from curtailed and shut-in wells in North Dakota during that time, resulted in higher per-unit production expenses in 2011 compared to 2012.decreased $13.0increased $83.6 million, or 22%58%, duringto $228.4 million for the year ended December 31, 20092012 compared to the year ended December 31, 20082011 as a result of lowerhigher crude oil and natural gas revenues resulting primarily from decreasedincreased sales prices partially offset by the expiration of various tax incentives and increases in other charges.volumes. Production taxes and other expenses onin the consolidated statements of income statements include other charges for marketing, gathering, dehydration and compression fees primarily related to natural gas sales in the ArkomaOklahoma Woodford areaand North Dakota Bakken areas of $6.8$29.9 million and $3.4$13.7 million for the years ended December 31, 20092012 and 2008,2011, respectively. The increase in other charges is primarily due to the significant increase in natural gas sales volumes in 2012. Production taxes, excluding other expenses,charges, as a percentage of crude oil and natural gas salesrevenues were 6.5%8.2% for the year ended December 31, 20092012 compared to 6.0%7.9% for the year ended December 31, 2008. Production taxes are based on the wellhead values of production and vary by state. Additionally, some states offer exemptions or reduced2011. The increase was due to higher taxable revenues coming from North Dakota, our most active area, which has production tax rates for wells that produce less than a certain quantityof up to 11.5% of crude oil or natural gas and to encourage certain activities, such as horizontal drilling and enhanced recovery projects. For 2009, in Montana, North Dakota and Oklahoma new horizontal wells qualify for a tax incentive and are taxed at a lower rate during their initial months of production. After the incentive period expires, the tax rate increases to the statutory rates. Our overall rate is expected to increase as production tax incentives we currently receive for horizontal wells reach the end of their incentive period. Year Ended
December 31, Percent
decrease 2009 2008 $ 6.89 $ 8.40 (17 )% 3.37 4.84 (30 )% $ 10.26 $ 13.24 (23 )% Year Ended December 31, $/Boe 2012 2011 Production expenses $ 5.49 $ 6.13 Production taxes and other expenses 6.42 6.42 Production expenses, production taxes and other expenses $ 11.91 $ 12.55 Exploration Expenses. Exploration expenses consist primarily. The following table shows the components of dry hole costs and exploratoryexploration expenses for the periods indicated. Year Ended December 31, In thousands 2012 2011 Exploratory geological and geophysical costs $ 22,740 $ 19,971 Dry hole costs 767 7,949 Exploration expenses $ 23,507 $ 27,920 that are expensed as incurred. Exploration expenses decreased $27.6increased $2.8 million in the year ended December 31, 2009 to $12.6 million due primarily to a decrease in seismic expense of $14.9 million to $2.0 million and a decrease in dry hole expense of $13.5 million to $6.5 million. The majority of the dry hole costs, 67%, were in the East region for the year ended December 31, 2009 and 67%2012 due to an increase in acquisitions of theseismic data in connection with our increased capital budget for 2012. No significant dry holes were drilled during 2012. Dry hole costs for the 2008 periodrecognized in 2011 were primarily concentrated in the North region.Depletion, Amortizationdepletion, amortization and Accretion.accretion. Total DD&A increased $58.7$301.2 million, inor 77%, for the year ended December 31, 20092012 compared to the same period in 2008,year ended December 31, 2011 primarily due to ana 58% increase in production volumes and additional properties with higher cost reserves being added through our drilling program. Additionally, DD&A increased as a result of the decrease in commodity prices used to calculate reserve volumes at December 31, 2008 that affected DD&A for the first six months of 2009. Lower prices have the effect of decreasing the economic life of crude oil and natural gas properties, which lowers future reserve volumes and increases DD&A.sales volumes. The following table shows the components of our DD&A rateon a unit of sales basis. Year Ended December 31, $/Boe 2012 2011 Crude oil and natural gas properties $ 19.10 $ 16.90 Other equipment 0.25 0.29 Asset retirement obligation accretion 0.09 0.14 Depreciation, depletion, amortization and accretion $ 19.44 $ 17.33 Boe. Year Ended
December 31, Percent
increase 2009 2008 $ 14.94 $ 11.91 25 % 0.23 0.22 5 % 0.17 0.17 0 % $ 15.34 $ 12.30 25 % Impairments.impairments. Property impairments both proved and non-producing, increased in the year ended December 31, 20092012 by $54.9$13.8 million to $83.7$122.3 million compared to $28.8 million during the year ended December 31, 2008. Impairment of non-producing properties increased $30.6 million during the year ended December 31, 2009 to $47.1 million compared to $16.5 million for 2008 reflecting higher amortization of lease costs in our existing fields resulting from further defining likely drilling locations, capital constraints, and amortization of new fields. Non-producing properties consist of undeveloped leasehold costs and costs associated with the purchase of certain proved undeveloped reserves. Non-producing properties are amortized on a composite method based on our estimated experience of successful drilling and the average holding period.Impairment provisions for proved crude oil and natural gas properties were approximately $36.6$108.5 million for the year ended December 31, 2009 compared to approximately $12.32011.2008, an2012 to $117.9 million compared to $92.4 million for the year ended December 31, 2011. The increase resulted from a larger base of $24.3amortizable costs in 2012 coupled with changes in management’s estimates of the undeveloped properties not expected to be developed before lease expiration.or 198%. We evaluate our proved crude oil and natural gas properties for impairment by comparing their cost basisthe year ended December 31, 2012 compared to $16.1 million for the estimated future cash flows on a field basis. If the cost basis issame period in excess of estimated future cash flows, then we impair it based on an estimate of fair market value based on discounted cash flows.2011. Impairments of proved properties in 2009 reflect2012 primarily reflected uneconomic drillingoperating results in certain small fields primarilya non-Woodford single-well field in our South region and our Rockies Other area in the North region, which resulted in impairments of $36.6 million in 2009. Impairments ofregion. Impairment provisions for proved properties in 2008 were primarily related to2011 reflected uneconomic operating results for initial wells indrilled on our South region and our Rockies Other areaacreage in the North region.General and Administrative Expenses.General and administrative expenses. G&A expenses increased $5.4$48.9 million to $41.1$121.7 million duringfor the year ended December 31, 20092012 from $35.7$72.8 million duringfor the comparable period of 2008. General and administrativein 2011. G&A expenses include non-cash charges for stock-basedequity compensation of $11.4$29.1 million and $9.1$16.6 million for the years ended December 31, 20092012 and 2008,2011, respectively. GeneralThe increase in equity compensation in 2012 resulted from a higher value of restricted stock grants due to employee growth and administrativenew executive management personnel, which resulted in increased expense recognition in 2012 compared to 2011. G&A expenses excludingother than equity compensation increased $3.7 million for the twelve months ended December 31, 2009 compared to the twelve months ended December 31, 2008. The increase was primarily related to an increase in personnel costs of approximately $2.0 million due to additional employees and higher wages and increased benefits along with an increase in donations of approximately $1.0 million and an increase in professional fees including litigation expense of approximately $1.5 million. On a volumetric basis, general and administrative expenses were $3.03 per Boe for the year ended December 31, 2009 compared to $2.95 per Boe for the year ended December 31, 2008.Interest Expense. Interest expense increased 91%, or $11.0$36.4 million for the year ended December 31, 20092012 compared to the same period in 2011. The increase was due in part to an increase in personnel costs and office-related expenses associated with our rapid growth. In 2012, our Company grew from having 609 total employees in December 2011 to 753 total employees in December 2012, a 24% increase. Additionally, in March 2011 we announced plans to relocate our corporate headquarters from Enid, Oklahoma to Oklahoma City, Oklahoma. Our relocation was completed during 2012. For the year ended December 31, 2008, due2012, we recognized approximately $7.8 million of costs in G&A expenses associated with the relocation compared to $3.2 million in 2011. Cumulative relocation costs recognized through December 31, 2012 totaled approximately $11.0 million. Year Ended December 31, $/Boe 2012 2011 General and administrative expenses $ 2.38 $ 2.36 Non-cash equity compensation 0.82 0.73 Corporate relocation expenses 0.22 0.14 Total general and administrative expenses $ 3.42 $ 3.23 debt partially offset by lower interest rates in 2009. Our average revolving credit facility balance increased$64.0 million to $426.3$140.7 million for the year ended December 31, 20092012 from $76.7 million for the comparable period in 2011 due to an increase in our weighted average outstanding long-term debt obligations. Our weighted average outstanding long-term debt balance for the year ended December 31, 2012 was approximately $2.3 billion with a weighted average interest rate of 5.6% compared to $248.7a weighted average outstanding long-term debt balance of approximately $970.0 million and a weighted average interest rate of 7.2% for the comparable period in 2011. The increase in outstanding debt resulted from borrowings incurred to fund increased amounts of capital expenditures and property acquisitions in 2012 compared to 2011. On March 8, 2012 and August 16, 2012, we issued $800 million and $1.2 billion, respectively, of 5% Senior Notes due 2022 and used the net proceeds from those issuances to repay credit facility borrowings, to fund a portion of our 2012 capital budget and for general corporate purposes.2008, but the weighted average interest rate on our revolving credit facility was 1.64% lower at 2.90% for the year ended December 31, 20092012 compared to 4.54% for the same period in 2008. At December 31, 2009, our outstanding balance under our revolving credit facility was $266.0 million with a weighted average interest rate of 2.66%. On September 23, 2009, we issued $300 million of 8 1/4% Senior Notes due 2019 (the “2019 Notes”). The 2019 Notes, which carry a coupon rate of 8.25%, were sold at a discount (99.16% of par), which equates to an effective yield to maturity of approximately 8.375%. We recorded $7.0 million in interest on the 2019 Notes for the year ended December 31, 2009. Including the effect of the 2019 Notes, our weighted average interest rate for the year ended December 31, 2009 was 3.78% while at December 31, 2009 our weighted average rate was 5.92%.Income Taxes. Income taxes for the year ended December 31, 2009 were $38.7 million compared to $197.6$70.0 million for the year ended December 31, 2008.2011. The weighted average interest rate on our credit facility borrowings was 2.3% for the year ended December 31, 2012 compared to 2.4% for the same period in 2011. At December 31, 2012, we had $595 million of outstanding borrowings on our credit facility compared to $358.0 million outstanding at December 31, 2011. The increase in credit facility borrowings in 2012 was driven by the aforementioned increase in capital expenditures and property acquisitions during the year.provide taxes at a combined federal and staterecorded income tax rateexpense for the year ended December 31, 2012 of $415.8 million compared to $258.4 million for the year ended December 31, 2011, resulting in effective tax rates of approximately 35% for 2009 compared to approximately36% and 38% for 20082012 and 2011, respectively, after taking into account permanent taxable differences. The decrease in the effective tax rate is related to state losses and utilization of state net operating loss carry forwards. SeeNotes to Consolidated Financial Statements—Note 8. Income Taxes for more information.revolving credit facility and the issuance of senior notes. During the year ended December 31, 2010, our average realized crude oil sales price was $16.25 perbarrel higher, or 30%, than the year ended December 31, 2009,debt and we saw our realized natural gas sales prices increase $1.27 per Mcf, or 39%, in 2010 compared to the same period in 2009. The increased prices of crude oil and natural gas in 2010 as well as increased sales volumes resulted in improved cash flows from operations. Further, our liquidity has improved at December 31, 2010 as we have more borrowing availability on our revolving credit facility as a result of refinancing our credit facility borrowings via the issuance of senior notes in 2010.2010,2013, we had approximately $7.9$28.5 million of cash and cash equivalents and approximately $717.6net available liquidity underoutstanding borrowings on our revolving credit facility (afterat December 31, 2013. As of February 17, 2014, we had $560 million of outstanding borrowings and approximately $936 million of borrowing availability on our credit facility after considering outstanding borrowings and letters of credit).Flowsflows from Operating Activities flows provided by operating activities were $653.2 million, $373.0 millionwas $2.6 billion and $719.9 million$1.6 billion for the years ended December 31, 2010, 20092013 and 2008,2012, respectively. The increase in operating cash flows in 2010 compared to 2009 was primarily due to higher crude oil and natural gas revenues as a result ofdriven by higher sales volumes and higher realized commodity prices, which were partially offset by an increase in cash losses on matured derivatives and sales volumesincreases in production expenses, production taxes, general and administrative expenses, interest expense and other expenses associated with the current period. The decreasegrowth of our operations during the year.operating cash flows in 2009 compared to 2008 was primarily due to a decrease in revenues in 2009 as a result of lower commodity prices.Cash Flows from Investing Activities2010, 20092013 and 2008,2012, we had cash flows used in investing activities (excluding proceeds from asset sales)sales and other) of $1,083.4 million, $507.0 million$3.74 billion and $930.8 million,$4.12 billion, respectively, related to our capital program, inclusive of dry hole costs. The increase in our cash flows used in investing activities in 2010 compared to 2009 was due to the acceleration of our drilling program, primarily in the Bakken shale of North Dakotacosts and the Anadarko Woodford shale in Oklahoma, which resulted in increasedproperty acquisitions. Cash acquisition capital expenditures in 2010. The decrease in our cash flows used in investing activities in 2009 compared to 2008 was primarily due to decreases in capital expenditures as a result of lower commodity prices in 2009.Cash Flows from Financing ActivitiesDuringtotaled $268.1 million and $1.1 billion for the years ended December 31, 2010, 20092013 and 2008,2012, respectively. In 2012 we executed certain transactions to acquire properties in North Dakota totaling $939 million, with no transactions of similar size in 2013. Cash capital expenditures excluding acquisitions totaled $3.47 billion and $2.99 billion for the years ended December 31, 2013 and 2012, respectively, the increase of which was driven by an increase in our capital budget for 2013. flows provided by financing activities for the year ended December 31, 2013 totaled $1.1 billion, primarily resulting from the receipt of $379.9$1.48 billion of net proceeds from the issuance of $1.5 billion of 4 1/2% Senior Notes due 2023 in April 2013, partially offset by net repayments of $320.0 million $135.8 million and $204.2 million, respectively. on our credit facility during the year.$379.9 million$2.3 billion for 2010the year ended December 31, 2012 was primarily the result of $787.0 million of net proceeds received uponfrom the March 2012 issuance of $200$800 million of 7 3/8%5% Senior Notes due 2020 (the “2020 Notes”) in April 20102022 and the issuancean additional $1.21 billion of $400 million of 7 1/8% Senior Notes due 2021 (the “2021 Notes”) in September 2010 along with borrowings on our credit facility, partially offset by amounts repaid under our credit facility. Net cash provided by financing activities of $135.8 million for 2009 was primarily the result ofnet proceeds received from the issuance of $300$1.2 billion of additional 2022 Notes at 102.375% of par in August 2012, along with $237.0 million of 8 1/4% Senior Notes due 2019 (the “2019 Notes”) in September 2009 along withnet borrowings made on our credit facility partially offset by amounts repaid underto fund a portion of our credit facility. Net cash provided by financing activities of $204.2 million for 2008 was primarily the result of borrowings under our revolving credit facility, partially offset by amounts repaid under our credit facility.We that funds from operating cash flows, our remaining cash balance, and our revolving credit facility, including our ability to increase our borrowing capacity thereunder, should be sufficient to meet our cash requirements inclusive of, but not limited to, normal operating needs, debt service obligations, planned capital expenditures, and commitments and contingencies for the next 12 months.the existence of derivative contracts we have in place to limit the downside risk of adverse price movements associated with the forecasted sale of future production, we currently anticipate that we will be able to generate or obtain funds sufficient to meet our short-term and long-term cash requirements. We intend to finance our future capital expenditures primarily through cash flows from operations and through borrowings under our revolving credit facility, but we may also include the issuance ofissue debt or equity securities or the sale ofsell assets. Furthermore, theThe issuance of additional debt requires that a portion of our cash flows from operations be used for the payment of interest and principal on our debt, thereby reducing our ability to use cash flows to fund working capital, capital expenditures and acquisitions.Revolving The issuance of additional equity securities could have a dilutive effect on the value of our common stock.FacilityOn June 30, 2010, we entered into an amended and restated revolving credit agreement. The amended and restated credit agreement amended and restated our previous credit agreement to, among other things:Increase the maximum size of the revolvingWe have a credit facility, from $750 million to $2.5 billion;Maintainmaturing on July 1, 2015, that has aggregate lender commitments undertotaling $1.5 billion. In November 2013, following an upgrade by S&P, as permitted by the revolving credit facility of $750 million, which may be increased atterms, we provided the lenders under our option from time to time (provided there exists no default) up to the lesser of $2.5 billion or the borrowing base then in effect;Increase the borrowing base from the previous $1.0 billion to an initial amount of $1.3 billion, subject to semi-annual redetermination;Modify the applicable margin for Eurodollar and reference rate advances. Eurodollar margins range from 1.75% to 2.75% and reference rate margins range from 0.75% to 1.75%, based on the amount of total outstanding borrowings in relation to the borrowing base; andExtend the maturity of the revolving credit facility from April 12, 2011notice of our intention to July 1, 2015.Our amendedelect an Additional Covenant Period. The election of an Additional Covenant Period means that the credit facility is backednot currently subject to a borrowing base. The election was made in order to facilitate the release of collateral consisting of oil and gas properties securing obligations under the credit facility. On December 11, 2013, we delivered notice to the credit facility lenders confirming we had satisfied all conditions for releasing the collateral and the release of such collateral became effective as of December 12, 2013. On December 13, 2013, our credit rating was upgraded by Moody's. As a result of the second upgrade, we are not currently required to: (i) comply with certain reporting requirements; and (ii) maintain a ratio of the present value of oil and gas properties to total funded debt of not less than 1.5 to 1.0, as set forth in the credit facility.14 banks.13 banks and financial institutions. We believe that each member of the current syndicate of banks has the capability to fund its commitment. If one or more lenders cannot fund its commitment, we wouldmay not have the full availability of the $750 million$1.5 billion commitment.The most recent borrowing base redetermination was completed in December 2010, whereby the lenders approved an increase in our borrowing base from $1.3 billion to $1.5 billion. We have elected to maintain the aggregate commitment level at $750 million. In the future, we may not be able to access adequate funding under our credit facility as a result of (i) a decrease in our borrowing base due to the outcome of a subsequent borrowing base redetermination, or (ii) an unwillingness or inability on the part of our lending counterparties to meet their funding obligations. We expect the next borrowing base redetermination to occur in the second quarter of 2011. Declines in commodity prices could result in a determination to lower the borrowing base in the future and, in such case, we could be required to repay any indebtedness in excess of the borrowing base.$30.0$275 million of outstanding borrowings underand $1.2 billion of borrowing availability (after considering outstanding borrowings and letters of credit) on our credit facility at December 31, 2010 and $226.0 million outstanding at December 31, 2009.2013. As of December 31, 2010,February 17, 2014, we had $717.6$560 million of outstanding borrowings and $936 million of borrowing availability underon our credit facility (after considering outstanding borrowings and letters of credit). On September 16, 2010, we issued $400 million of the 2021 Notes and received net proceeds of approximately $393.0 million after deducting initial purchasers’ fees. The net proceeds were used to repay all borrowings then outstanding under our credit facility, which had a balance prior to payoff of $182 million. Subsequent to the September 16, 2010 payoff, no additional borrowings were made under the credit facility until December 2010. The $30.0 million ofincrease in outstanding borrowings atsubsequent to December 31, 2010 were borrowed on December 29, 2010. As2013 resulted from borrowings incurred to fund a portion of February 18, 2011, we have $95.0 million of outstanding borrowings and $652.6 million of borrowing availability under our revolving credit facility.The revolvingOur credit facility contains restrictive covenants that may limit our ability to, among other things, incur additional indebtedness, sell assets, make loans to others, make investments, enter into mergers, change material contracts, incur liens and engage in certain other transactions without the prior consent of the lenders. Our credit agreementfacility also contains requirements that we maintain a current ratio of not less than 1.0 to 1.0 and a ratio of total funded debt to EBITDAX of no greater than 3.754.0 to 1.0. As defined by our credit agreement, the current ratio represents our ratio of current assets to current liabilities, inclusive of available borrowing capacity under the credit agreement and exclusive of current balances associated with derivative contracts and asset retirement obligations. EBITDAX represents earnings before interest expense, income taxes, depreciation, depletion, amortization and accretion, property impairments, exploration expenses, unrealized derivative gains and losses and non-cash equity compensation expense. EBITDAX is not a measure of net income or cash flows as determined by GAAP. A reconciliation of net income to EBITDAX is provided inItem 7. Management’s Discussion and Analysis of Financial Condition and Results of Operations—Non-GAAP Financial Measures. The total funded debt to EBITDAX ratio represents the sum of outstanding borrowings and letters of credit under our revolving credit facility plus our senior note obligations, divided by total EBITDAX for the most recent four quarters. We were in compliance with these covenants at December 31, 20102013 and we expect to maintain compliance for at least the next 12 months. At December 31, 2010,2013, our current ratio, as defined, was approximately 2.11.7 to 1.0 and our total funded debt to EBITDAX ratio was approximately 1.11.7 to 1.0. A violation of these covenants in the future could result in a default under our credit facility and such event could result in an acceleration of other outstanding indebtedness. In the event of such default, the lenders under our credit facility could elect to terminate their commitments thereunder, cease making further loans, and could declare all outstanding amounts, if any, to be due and payable. If outstanding borrowings under our credit facility were to be accelerated, our assets may not be sufficient to repay in full such indebtedness. We do not believe the restrictive covenants will limit, or are reasonably likely to limit our ability to undertake additional debt or equity financing to a material extent.when needed on acceptable terms when needed, we may not be able to fully implement our business plans, complete new property acquisitions to replace our reserves, take advantage of business opportunities, respond to competitive pressures, or refinance our debt obligations as they come due, any of which could have a material adverse effect on our operations and financial results.Issuances of Long-Term DebtOn September 23, 2009, we issued the 2019 Notes and received net proceeds of approximately $289.7 million after deducting the initial purchasers’ discounts and fees. On April 5, 2010, we issued the 2020 Notes and received net proceeds of approximately $194.2 million after deducting the initial purchasers’ discounts and fees. The net proceeds from these offerings were used to repay a portion of the borrowings then outstanding under our revolving credit facility that were incurred to fund capital expenditures. On September 16, 2010, we issued the 2021 Notes and received net proceeds of approximately $393.0 million after deducting initial purchasers’ fees. The net proceeds were used to repay all borrowings then outstanding under the revolving credit facility that were incurred to fund capital expenditures and to increase cash balances to fund a portion of our accelerated capital program.The 2019 Notes, 2020 Notes, and 2021 Notes (together, the “Notes”) will mature on October 1, 2019, October 1, 2020, and April 1, 2021, respectively. Interest on the Notes is payable semi-annually on April 1 and October 1 of each year, with interest on the 2021 Notes commencing on April 1, 2011. We have the option to redeem all or a portion of the 2019 Notes, 2020 Notes, and 2021 Notes at any time on or after October 1, 2014, October 1, 2015, and April 1, 2016, respectively, at the redemption prices specified in the Notes’ respective indentures (together, the “Indentures”) plus accrued and unpaid interest. We may also redeem the Notes, in whole or in part, at the “make-whole” redemption prices specified in the Indentures, plus accrued and unpaid interest, at any time prior to October 1, 2014, October 1, 2015, and April 1, 2016 for the 2019 Notes, 2020 Notes, and 2021 Notes, respectively. In addition, we may redeem up to 35% of the 2019 Notes, 2020 Notes, and 2021 Notes prior to October 1, 2012, October 1, 2013, and April 1, 2014, respectively, under certain circumstances with the net cash proceeds from certain equity offerings. Currently, we have no plans or intentions of exercising an early redemption option on the Notes. The Notes are not subject to any mandatory redemption or sinking fund requirements.The Indentures contain certain restrictions on our ability to incur additional debt, pay dividends on our common stock, make certain investments, create certain liens on assets, engage in certain transactions with affiliates, transfer or sell certain assets, consolidate or merge, or sell substantially all of our assets. These covenants are subject to a number of important exceptions and qualifications. We were in compliance with these covenants as of December 31, 2010 and expect to maintain compliance for at least the next 12 months. We do not believe the restrictive covenants will limit, or are reasonably likely to limit, our ability to undertake additional debt or equity financing to a material extent. Our subsidiary, which currently has no independent assets or operations, fully and unconditionally guarantees the Notes.Registration Statement FilingOn July 16, 2010, we filed a shelf registration statement on Form S-3 pursuant to which we may offer from time to time one or more series of debt and equity securities. We may issue additional long-term debt and equity securities from time to time when market conditions are favorable and when the need arises. The nature, amounts, terms, and timing of such financing arrangements, and the related impact on our financial position, results of operations, and liquidity are currently indeterminable. The issuance of additional equity securities could have a dilutive effect on the value of our common stock.Future Capital RequirementsCapital ExpendituresWe evaluate opportunities to purchase or sell crude oil and natural gas properties and could participate as a buyer or seller of properties at various times. We seek acquisitions that utilize our technical expertise or offer opportunities to expand our existing core areas. Acquisition expenditures are not budgeted.During the year ended December 31, 2010, we participated in the completion of 349 gross (122.6 net) wells and invested a total of $1,237.2 million (including increases in accruals for capital expenditures of $148.0 million and $5.8 million of seismic costs) in our capital program as shown in the following table. Amount $ 803.0 343.1 30.5 44.5 7.3 5.8 3.0 $ 1,237.2 Our 2010 capital expenditures primarily focused on increased development in the Bakken shale of North Dakota and the Anadarko Woodford shale in western Oklahoma.In October 2010, our Board of Directors approved a 2011 capital expenditures budget of $1.36 billion. Our 2011 planned capital expenditures are expected to be allocated as follows: Amount $ 1,135 108 92 15 6 $ 1,356 The 2011 capital expenditures budget of $1.36 billion will continue to focus primarily on increased development in the Bakken shale of North Dakota and the Anadarko Woodford shale in western Oklahoma.Although we cannot provide any assurance, assuming successful implementation of our strategy, including the future development of our proved reserves and realization of our cash flows as anticipated, we believe that our remaining cash balance, cash flows from operations and available borrowing capacity under our revolving credit facility will be sufficient to fund our 2011 capital budget. The actual amount and timing of our capital expenditures may differ materially from our estimates as a result of, among other things, available cash flows, actual drilling results, the availability of drilling rigs and other services and equipment, and regulatory, technological and competitive developments.Contractual ObligationsWe have the following contractual obligations and commitments as of December 31, 2010: Payments due by period Total Less than
1 year (2011) 1 - 3
years
(2012-2013) 3 - 5
years
(2014-2015) More than
5 years $ 30,000 $ — $ — $ 30,000 $ — 900,000 — — — 900,000 658,400 69,200 138,590 137,798 312,812 56,320 2,241 10,714 1,854 41,511 633 204 270 148 11 80,851 74,338 6,513 — — 53,625 19,500 34,125 — — $ 1,779,829 $ 165,483 $ 190,212 $ 169,800 $ 1,254,334 (1)Amounts represent scheduled maturities of our debt obligations at December 31, 2010 and do not reflect the discounts at which the Notes were issued. SeeNotes to Consolidated Financial Statements—Note 7. Long-Term Debtfor a description of our senior notes.(2)Interest expense includes scheduled cash interest payments on the senior notes as well as estimated interest payments on our revolving credit facility borrowings outstanding at December 31, 2010 and assumes that the interest rate on our credit facility borrowings of 4.00% at December 31, 2010 continues for the life of the revolving credit facility.(3)Amounts represent estimated discounted costs for future dismantlement and abandonment of our crude oil and natural gas properties.(4)Operating lease obligations represent operating leases for office space and office equipment. SeeNotes to Consolidated Financial Statements—Note 9. Lease Commitments.(5)We have various drilling rig contracts with various terms extending through June 2012. These contracts were entered into in the normal course of business to ensure rig availability to allow us to execute our business objectives in our key strategic plays. These drilling commitments are not recorded in the accompanying consolidated balance sheets.(6)On August 20, 2010, we entered into an agreement with a third party whereby the third party will provide, on a take-or-pay basis, hydraulic fracturing services and related equipment to service certain of our properties in North Dakota and Montana. The arrangement has a term of three years, beginning in September 2010, with two one-year extensions available to us at our discretion. Pursuant to the take-or-pay arrangement, we will pay a fixed rate per day for a minimum number of days per calendar quarter over the three-year term regardless of whether or not the services are provided. Fixed commitments amount to $4.9 million per quarter, or $19.5 million annually, for total future commitments of $58.5 million over the three-year term. Future commitments remaining as of December 31, 2010 amount to $53.6 million. The commitments under this arrangement are not recorded in the accompanying consolidated balance sheets.In 2010, we signed a throughput and deficiency agreement with a third party crude oil pipeline company committing to ship 10,000 barrels of crude oil per day for five years at a tariff of $1.85 per barrel. The third party system is scheduled to commence operations late in the second quarter of 2011. We will use this system to move some of our North region crude oil to market.Crude Oil and Natural Gas Hedgingthat we have adequate funds are available for our capital program. Our decision on the quantity and price at which we choose to hedge our future production is based in part on our view of current and future market conditions.In millions Amount Exploration and development drilling $ 3,120.9 Land costs 295.4 Capital facilities, workovers and re-completions 66.9 Buildings, vehicles, computers and other equipment 61.9 Seismic (1) 28.4 Capital expenditures, excluding acquisitions $ 3,573.5 Acquisitions of producing properties 16.6 Acquisitions of non-producing properties 251.5 Total acquisitions 268.1 Total capital expenditures $ 3,841.6 (1) Includes $12.9 million of exploratory seismic costs recognized as exploration expense and $15.5 million of developmental seismic costs capitalized in conjunction with development drilling projects. In millions Amount Exploration and development drilling $ 3,540 Land costs 300 Capital facilities, workovers and re-completions 150 Buildings, vehicles, computers and other equipment 30 Seismic 30 Total 2014 capital budget, excluding acquisitions $ 4,050 Payments due by period In thousands Total Less than
1 year (2014) Years 2 and 3
(2015-2016) Years 4 and 5
(2017-2018) More than
5 yearsArising from arrangements on the balance sheet: Credit facility borrowings $ 275,000 $ — $ 275,000 $ — $ — Senior Notes (1) 4,400,000 — — — 4,400,000 Note payable (2) 18,470 2,011 4,222 4,500 7,737 Interest expense (3) 1,956,796 240,701 474,857 471,643 769,595 Asset retirement obligations (4) 55,787 1,434 1,209 176 52,968 Arising from arrangements not on balance sheet: Operating leases and other (5) 7,027 3,811 2,628 406 182 Drilling rig commitments (6) 109,510 83,336 26,174 — — Fracturing and well stimulation services (7) 15,853 15,853 — — — Pipeline transportation commitments (8) 67,290 16,188 28,992 10,010 12,100 Rail transportation commitments (9) 9,821 9,821 — — — Cost sharing commitment (10) 24,538 14,925 9,613 — — Total contractual obligations $ 6,940,092 $ 388,080 $ 822,695 $ 486,735 $ 5,242,582 (1) (2) Represents future principal payments on $22 million borrowed in February 2012 under a 10-year amortizing term loan secured by the Company’s corporate office building in Oklahoma City, Oklahoma. Principal and interest are payable monthly through the loan’s maturity date of February 26, 2022. (3) Interest expense includes scheduled cash interest payments on the senior notes and note payable as well as estimated interest payments on our credit facility borrowings outstanding at December 31, 2013 and assumes the actual weighted average interest rate on our credit facility borrowings of 1.7% at December 31, 2013 continues through the July 1, 2015 maturity date of the facility. (4) (5) Amounts primarily represent leases for office equipment, communication towers and tanks for storage of hydraulic fracturing fluids, in addition to purchase obligations mainly related to software services. (6) Amounts represent commitments under drilling rig contracts with various terms extending through January 2016. These contracts were entered into in the ordinary course of business to ensure rig availability to allow us to execute our business objectives in our strategic plays. (7) We have an agreement with a third party whereby the third party will provide, on a take-or-pay basis, hydraulic fracturing services and related equipment to service certain of our properties in North Dakota and Montana. The agreement, which expires in September 2014, requires us to pay a fixed rate per day for a minimum number of days per calendar quarter over the term regardless of whether the services are provided. (8) (9) (10) We have entered into an arrangement to share certain costs associated with a local utility company's construction and installation of electrical infrastructure that will provide service to parts of North Dakota where we operate. This arrangement extends through January 2016 and requires us to make scheduled periodic payments based on the projected total cost of the project and the progress of construction. these hedging arrangements limits the downside risk of adverse price movements, their use also may limitlimits future revenues from favorableupward price movements. The use of hedging transactions also involves the risk that the counterparties will be unable to meet the financial terms of such transactions. Our derivative contracts are with multiple counterparties to minimize our exposure to any individual counterparty. Currently, allAll of our derivative contracts are with parties that are lenders (or affiliates of lenders) under our revolving credit agreement. Substantially allfacility. For a discussion of the potential risks associated with our hedging transactionsprogram, refer to Part I, Item 1A. Risk Factors—Our derivative activities could result in financial losses or reduce our earnings.the NYMEX.Please seeNotes to Consolidated Financial Statements—Note 5. Derivative ContractsInstruments for further discussion of the accounting applicable to our derivative instruments, a listingsummary of open contracts as of December 31, 20102013 and the estimated fair value of thosethe contracts as of that date.20112014 and February 18, 2011,17, 2014, we entered into additional crude oil and natural gas derivative contracts summarized in the tabletables below. None of these contracts have been designated for hedge accounting.Oil Collars Swaps Floors Ceilings Bbls Weighted
Average Range Weighted
Average Range Weighted
Average 915,000 $ 100.01 3,102,500 $ 90-$95 $ 91.59 $ 97.25-$101.60 $ 99.13 Period and Type of Contract Bbls Weighted
Average PriceJanuary 2015 - December 2015 Swaps - ICE Brent 6,205,000 $ 100.27 Gas MMBtus Swaps
Weighted
Average 2,360,000 $ 4.69 3,640,000 4.69 3,910,000 4.69 4,232,000 4.73 3,660,000 5.07 Period and Type of Contract MMBtus Weighted
Average PriceJanuary 2014 - December 2014 Swaps - Henry Hub 40,495,000 $ 4.26 January 2015 - December 2015 Swaps - Henry Hub 22,700,000 $ 4.27 January 2016 - December 2016 Swaps - Henry Hub 4,550,000 $ 4.27 historical consolidated financial statements and notes to our historical consolidated financial statementsrelated footnotes contain information that is pertinent to our management’s discussion and analysis of financial condition and results of operations. Preparation of financial statements in conformity with accounting principles generally accepted in the United States requires our management to make estimates, judgments and assumptions that affect the reported amounts of assets, liabilities, revenues and expenses, and the disclosure and estimation of contingent assets and liabilities. However, the accounting principles used by us generally do not change our reported cash flows or liquidity. Interpretation of the existing rules must be done and judgments must be made on how the specifics of a given rule apply to us.moremost significant reporting areas impacted by management’s judgments and estimates are crude oil and natural gas reserve estimations, revenue recognition, the choice of accounting method for derivatives and crude oil and natural gas activities and derivatives, impairment of assets, income taxes and income taxes.contingent liabilities. Management’s judgments and estimates in these areas are based on information available from both internal and external sources, including engineers, geologists and historical experience in similar matters. Actual results could differ from the estimates as additional information becomes known. The SEC has defined proved reserves as the estimated quantities of crude oil, natural gas and natural gas liquids which geological and engineering data demonstrate with reasonable certainty to be economically producible in future periods from known reservoirs under existing economic and operating conditions. Even though our external independent reserve engineers and internal technical staff are knowledgeable and follow authoritative guidelines for estimating reserves, they must make a number of subjective assumptions based on professional judgments in developing the reserve estimates. Estimates of reserves and their values, future production rates, and future costs and expenses are inherently uncertain for various reasons, including many factors beyond the Company's control. Reserve estimates are updated at least annuallysemi-annually and considertake into account recent production levels and other technical information about each field.of our fields. Crude oil and natural gas reserve engineering is a subjective process of estimating underground accumulations of crude oil and natural gas that cannot be precisely measured. The accuracy of any reserve estimate is a function of the quality of available data and of engineering and geological interpretation and judgment. Periodic revisions to the estimated reserves and future cash flows may be necessary as a result of a number of factors, including reservoir performance, new drilling, crude oil and natural gas prices, cost changes in costs, technological advances, new geological or geophysical data, or other economic factors. Accordingly, reserve estimates are often differentmay differ significantly from the quantities of crude oil and natural gas that are ultimately recovered. We cannot predict the amounts or timing of future reserve revisions. If suchEstimates of proved reserves are key components of the Company's most significant financial estimates including the computation of depreciation, depletion, amortization and impairment of proved crude oil and natural gas properties. Future revisions are significant, theyof reserves may be material and could significantly alter future DD&Adepreciation, depletion, and amortization expense and may result in impairmentmaterial impairments of assets that may be material.There has been only limited interpretive guidance regarding reporting of reserve estimates under the new SEC rules implemented in 2009 and there may not be further interpretive guidance on the new rules. Accordingly, while the estimates of our proved reserves at December 31, 2010 included in this report have been prepared based on what we and our independent reserve engineers believe to be reasonable interpretations of the 2009 rules, those estimates could differ materially from any estimates we might prepare in the future by applying more specific interpretive guidance should that guidance become available.recordedrecognized in the month the product is delivered to the purchaser and title transfers. We generally receive payment from one to three months after the sale has occurred. Each monthWe use the sales method of accounting for natural gas imbalances in those circumstances where we estimatehave under-produced or over-produced our ownership percentage in a property. Under this method, a receivable or payable is recognized only to the volumes sold andextent an imbalance cannot be recouped from the price at which they were sold to record revenue. Variances between estimated revenue and actual amounts are recordedreserves in the month payment is received and are reflected inunderlying properties. financial statements as crude oil and natural gas sales. These variances have historically not been material.the NYMEX Henry Hub posted prices and those of our physical pricing points. We do not use derivative instruments for trading purposes. Under accounting rules, we may elect to designate those derivatives that qualify for hedge accounting as cash flow hedges against the price that we will receive for our future crude oil and natural gas production. We have elected not to designate any of our price risk management activities as cash flow hedges. As a result, we mark our derivative instruments to fair value and recognize the realized and unrealized changes in fair value in current earnings. As such, we are likely to experience significant non-cash volatility in our reported earnings during periods of commodity price volatility. Derivative assets and liabilities with the same counterparty and subject to contractual terms which provide for net settlement are reported on a net basis on our consolidated balance sheets.primarily industry-standard models that consider various inputs including: (a)including quoted forward prices for commodities, (b) time value, (c) volatility factors, and (d) current market and contractual prices for the underlying instruments, as well as other relevant economic measures. The calculation of the fair value of our collar contracts requires the use of an option-pricing model. The estimated future prices are compared to the prices fixed by the derivative agreements and the resulting estimated future cash inflows or outflows over the lives of the derivatives are discounted to calculate the fair value of the derivative contracts. These pricing and discounting variables are sensitive to market volatility as well as changes in future price forecasts regional price differences and interest rates. We validate our derivative valuations through management review and by comparison to our counterparty marks and management reviews.Successful Efforts Method of AccountingWe use the successful efforts method of accountingcounterparties’ valuations for our crude oil and natural gas properties, including enhanced recovery projects, whereby costs incurred to acquire mineral interests in crude oil and natural gas properties, to drill and equip exploratory wells that find proved reserves, to drill and equip development wells and expenditures for enhanced recovery operations are capitalized. Geological and geophysical costs, seismic costs, lease rentals and costs associated with unsuccessful exploratory wells or projects, including enhanced recovery projects, are expensed as incurred. Maintenance, repairs and costs of injection are expensed as incurred, except that the cost of replacements or renewals that expand capacity or improve production are capitalized.Depreciation, depletion, and amortization of capitalized drilling and development costs of crude oil and natural gas properties, including related support equipment and facilities, are generally computed using the unit-of-production method on a field basis based on total estimated proved developed crude oil and natural gas reserves. Amortization of producing leaseholds is based on the unit-of-production method using total estimated proved reserves. In arriving at rates under the unit-of-production method, the quantities of recoverable crude oil and natural gas reserves are established based on estimates made by our internal geologists and engineers and external independent reserve engineers. Service properties, equipment and other assets are depreciated using the straight-line method over estimated useful lives of 5 to 40 years. Upon sale or retirement of depreciable or depletable property, the cost and related accumulated depreciation, depletion and amortization are eliminated from the accounts and the resulting gain or loss, if any, is recognized. that the carrying value of an asset may be greater than its future net cash flows, including cash flows from risk adjusted proved reserves.thesethose products, estimates of future crude oil and natural gas reserves to be recovered and the timing thereof, the economic and regulatory climates and other factors. The need to test a field for impairment may result from significant declines in sales prices or downward revisions to crude oil and natural gas reserves. Any assets held for sale are reviewed for impairment when we approve the plan to sell. Estimates of anticipated sales prices are highly judgmental and are subject to material revision in future periods. Because of the uncertainty inherent in these factors, we cannot predict when or if future impairment charges will be recorded.the amount of the impairment losslosses are recognized is determined by amortizing the portion of the unproved properties’ costs which management estimates will not be transferred to proved properties over the lifelives of the leaseleases based on experience of successful drilling and the average holding period. The estimated rate of successful drilling is highly judgmental and is subject to material revision in future periods as better information becomes available.2010,2013, we believe that all of our deferred tax assets recorded on our consolidated balance sheets will ultimately be utilized. We consider future taxable income in making such assessments. Numerous judgments and assumptions are inherent in the determination of future taxable income, including factors such as future operating conditions (particularly as related to prevailing crude oil and natural gas prices). If our estimates and judgments change regarding our ability to utilize our deferred tax assets, our tax provision could increase in the period it is determined that it is more likely than not that a deferred tax asset will not be utilized.taxpayingtax-paying companies. Our effective tax rate is affected by changes in the allocation of property, payroll, and revenues between states in which we own property as rates vary from state to state. Due to the size of our gross deferred tax balances, a small change in our estimated future tax rate can have a material effect on current period earnings.For a description of the accounting standards that we adopted in 2010, seeNotes to Consolidated Financial Statements—Note 1. Organization and Summary of Significant Accounting Policies.Various accounting standards and interpretations were issued in 2010 with effective dates subsequent to December 31, 2010. have evaluated the recently issued accounting pronouncements that are effective in 2011 and believe that none of them will have a material effect on our financial position, results of operations or cash flows when adopted.Further, we are closely monitoring the joint standard-setting efforts of the Financial Accounting Standards Board and the International Accounting Standards Board. There are a large number of pending accounting standards that are being targeted for completion in 20112014 and beyond, including, but not limited to, standards relating to revenue recognition, accounting for leases, fair value measurements, and accounting for financial instruments, disclosure of loss contingencies and financial statement presentation.instruments. Because these pending standards have not yet been finalized, at this time we are not able to determine the potential future impact that these standards will have, if any, on our financial position, results of operations or cash flows.regulationsinterpretations affecting the crude oil and natural gasour industry have been pervasive and are under continual reviewcontinuously reviewed by legislators and regulators, including the imposition of new or increased requirements on us and other industry participants. See Part I, Item 1. Business—Regulation of the Crude Oil and Natural Gas Industry for amendment or expansion. The following area discussion of significant laws and regulations that have been enacted or are currently being considered by regulatory bodies that may affect us in the areas in which we operate.Dodd-Frank Wall Street Reform and Consumer Protection Act.On July 21, 2010, President Obama signed into law the Dodd-Frank Act, which, among other things, establishes federal oversight and regulation of the over-the-counter derivatives market and the entities, such as us, that participate We believe we are in that market. The new legislation, to the extent applicable to us or our derivative counterparties, may result in increased costs and cash collateral requirements for the types of derivative instruments we use to hedge and otherwise manage our financial and commercial risks related to fluctuations in commodity prices, and could have an adverse effect on our ability to hedge risks associatedsubstantial compliance with our business. Further, the Dodd-Frank Act requires the SEC to develop a rule that would require certain issuers to disclose the payments they make to the US Federal Government or foreign governments related to the commercial development of crude oil and natural gas. The final rules related to derivatives reform and government payments are expected to be issued in 2011. Many of the key concepts and processes under the Dodd-Frank Act are not yet finalized and must be delineated by rules and regulations which have been and are being adopted by the applicable regulatory agencies. As a consequence, it is not possible at this time to predict the effects that the Dodd-Frank Act or the resulting rules and regulations may have on our hedging activities or our consolidated financial statements.Climate change. Federal, state and localall laws and regulations are increasingly being enacted to address concerns about the effects that carbon dioxide emissions and other identified greenhouse gases may have on the environment and climate worldwide. These effects are widely referred to as “climate change.” On December 15, 2009, the EPA published its findings that emissions of carbon dioxide, methane and other greenhouse gases present an endangerment to human health and the environment because emissions of such gases are, according to the EPA, contributing to the warming of the earth’s atmosphere and other climatic changes. These findings by the EPA have allowed the agency to implement recent regulations that restrict emissions of greenhouse gases, beginning in 2011 in some instances. As a crude oil and natural gas company, the debate on climate change is relevantpolicies currently applicable to our operations because the equipment we use to explore for, develop and produce crude oil and natural gas emits greenhouse gases. Additionally, the combustion of carbon-based fuels, such as the crude oil and natural gas that we sell, emits carbon dioxide and other greenhouse gases. Thus, any one of the federal, state or local climate change initiatives couldour continued compliance with existing requirements will not have a material adverse effectimpact on us. However, because public policy changes affecting our business. The climate changeindustry are commonplace and because laws and regulations could adversely affect demand for the crude oil and natural gas that we produce by stimulating demand for alternative forms of energy that do not rely on the combustion of fossil fuels. Although our compliance with any regulation of greenhouse gases may result in increased compliance and operating costs, we do not expect the costs to comply with the currently applicable regulations to be material. It is not possible at this time to estimate the costsamended or operational impacts we could experience to comply with new legislative or regulatory developments. We do not anticipate that we would be impacted by the climate change initiatives to any greater degree than other similar competitors.Hydraulic fracturing. The U.S. Congress is currently considering legislation to amend the federal Safe Drinking Water Act to remove the exemption for hydraulic fracturing operations and require reporting and disclosure of chemicals used by the crude oil and natural gas industry in the hydraulic fracturing process, including, for example, the Fracturing Responsibility and Awareness of Chemicals Act of 2009. Sponsors of bills pending before the U.S. Congress have asserted that chemicals used in the fracturing process could adversely affect drinking water supplies. These bills, if adopted, could increase the possibility of litigation and establish an additional level of regulation at the federal or state level that could prohibit hydraulic fracturing or could lead to operational delays or increased operating costs and could result in additional regulatory burdens, making it more difficult to perform hydraulic fracturing and increasing our costs of compliance. These legislative and regulatory initiatives, to the extent they are adopted or continue, could prohibit or limit our ability to develop our crude oil and natural gas properties located in unconventional formations, which could adversely affect our ability to access, develop, and book reserves in the future. Compliance, or the consequences of any failure to comply by us, could have a material adverse effect on our financial condition and results of operations. However, at this time it is not possible to estimate the potential impact on our business that may arise if federal or state legislation is enacted into law.Health Care Reform Acts. In March 2010, President Obama signed into law the Patient Protection and Affordable Care Act and the Health Care and Education Reconciliation Act of 2010 (collectively, the “2010 Acts”). The 2010 Acts expand health care coverage to many uninsured individuals and expand coverage to those already insured, among other things. The 2010 Acts will impact employers and businesses differently depending on the size of the organization and the specific impacts on a company’s employees. The 2010 Acts could require, among other things, changes to our current employee benefit plans, our administrative and accounting processes, or our information technology infrastructure, any of which could cause us to incur additional health care and other costs. The provisions of the 2010 Acts are not expected to have a significant impact on our financial statements in the short term. The ultimate longer term extent and potential costs of the changes are currently uncertain at this time and are being evaluated as regulations and interpretations of the 2010 Acts become available.Recently Enacted Tax LegislationOn December 17, 2010, President Obama signed into law the Tax Relief, Unemployment Insurance Reauthorization and Job Creation Act of 2010 (the “Act”), which, among other things, provides income tax relief for businesses by extending tax benefits and credits that either previously expired or were scheduled to expire in 2010. Most notably for the Company, the Act extends and enhances the bonus depreciation provisions of the Internal Revenue Code for two years. Specifically, the Act allows for a 100% first-year depreciation deduction for qualified property that is acquired after September 8, 2010 and placed in service prior to January 1, 2012. Further, with respect to qualified property placed in service during 2012, the Act allows for a 50% first-year depreciation deduction. These changes will have a positive impact on our capital-intensive business by reducing Federal income taxes currently payable. At December 31, 2010, in the period of enactment, we have recorded an income tax benefit associated with the applicable tax law changes outlined in the Act, which resulted in a $23.1 million decrease in Federal taxable income.On January 13, 2011, the Governor of the State of Illinois signed State Senate Bill 2505 (“SB 2505”), which substantially increases the state income tax rates for individuals and corporations in Illinois. A significant portion of our East region properties are located in the Illinois Basin; thus, our financial condition and results of operations will be adversely impacted by the tax rate changes in Illinois. SB 2505 increases the current corporate income tax rate from 4.8% to 7.0% for tax years 2011 to 2014. For tax years 2015 to 2024, the tax rate decreases to 5.25% and then decreases again to 4.8% for tax years beginning on or after January 1, 2025. SB 2505 also imposes a “personal property tax replacement tax” of 2.5% in addition to the base corporate income tax rate, making the combined corporate income tax rate 9.5% for tax years 2011 to 2014, 7.75% for tax years 2015 to 2024, and 7.3% for tax years 2025 and beyond. Further, SB 2505 temporarily suspends the use of net operating loss carryovers for tax years ending after December 31, 2010 and prior to December 31, 2014 and makes changes to the estimated tax payment requirements. SB 2505 was enacted subsequent to December 31, 2010 and, therefore, no resulting incremental income tax expense is reflected in our effective tax rate for 2010 as a result of the tax rate changes. Althoughreinterpreted, we are still analyzingunable to predict the effects of SB 2505, we estimate that the tax rate change will increase our consolidated full-year 2011 effective tax rate by approximately 0.1% and result in an increase in our 2011 income tax expense. We will record thefuture cost or impact of the changes beginning in our income tax provision for the quarter ending March 31, 2011.Historically, general inflationary trends have not had a material effect on our operating results. However, inthe increases in drilling activity, particularly in the North region, and competitive pressures resulting from higher crude oil and natural gas prices and may again in the future.unrealized derivativenon-cash gains and losses resulting from the requirements of accounting for derivatives, and non-cash equity compensation expense. EBITDAX is not a measure of net income or operating cash flows as determined by U.S. GAAP.themus to more effectively evaluate our operating performance and compare the results of our operations from period to period without regard to our financing methods or capital structure. We exclude the items listed above from net income and operating cash flows in arriving at EBITDAX because thosethese amounts can vary substantially from company to company within our industry depending upon accounting methods and book values of assets, capital structures and the method by which the assets were acquired. that EBITDAX is a widely followed measure of operating performance and may also be used by investors to measure our ability to meet future debt service requirements, if any. Our revolving credit facility requires that we maintain a total funded debt to EBITDAX ratio of no greater than 3.754.0 to 1.0 on a rolling four-quarter basis. This ratio represents the sum of outstanding borrowings and letters of credit under our revolving credit facility plus our note payable and senior note obligations, divided by total EBITDAX for the most recent four quarters. We were in compliance with this covenant at December 31, 2010. At that date, our total funded debt to EBITDAX ratio was approximately 1.1 to 1.0. A violation of this covenant in the future could result in a default under our revolving credit facility. In the event of such default, the lenders under our revolving credit facility could elect to terminate their commitments thereunder, cease making further loans, and could declare all outstanding amounts, together with accrued interest, to be due and payable. If the indebtedness under our revolving credit facility were to be accelerated, our assets may not be sufficient to repay in full such indebtedness. Our revolving credit facility defines EBITDAX consistently with the definition of EBITDAX utilized and presented by us. 2013. Year ended December 31, 2010 2009 2008 2007 2006 (in thousands) $ 168,255 $ 71,338 $ 320,950 $ 28,580 $ 253,088 53,147 23,232 12,188 12,939 11,310 90,212 38,670 197,580 268,197 (132 ) 243,601 207,602 148,902 93,632 65,428 64,951 83,694 28,847 17,879 11,751 12,763 12,615 40,160 9,163 19,738 166,257 2,089 — 26,703 — 11,691 11,408 9,081 12,792 10,932 $ 810,877 $ 450,648 $ 757,708 $ 469,885 $ 372,115 Year Ended December 31, In thousands 2013 2012 2011 2010 2009 Net income $ 764,219 $ 739,385 $ 429,072 $ 168,255 $ 71,338 Interest expense 235,275 140,708 76,722 53,147 23,232 Provision for income taxes 448,830 415,811 258,373 90,212 38,670 Depreciation, depletion, amortization and accretion 965,645 692,118 390,899 243,601 207,602 Property impairments 220,508 122,274 108,458 64,951 83,694 Exploration expenses 34,947 23,507 27,920 12,763 12,615 Impact from derivative instruments: Total (gain) loss on derivatives, net 191,751 (154,016 ) 30,049 130,762 1,520 Total cash (paid) received on derivatives, net (61,555 ) (45,721 ) (34,106 ) 35,495 569 Non-cash (gain) loss on derivatives, net 130,196 (199,737 ) (4,057 ) 166,257 2,089 Non-cash equity compensation 39,890 29,057 16,572 11,691 11,408 EBITDAX $ 2,839,510 $ 1,963,123 $ 1,303,959 $ 810,877 $ 450,648 Year Ended December 31, In thousands 2013 2012 2011 2010 2009 Net cash provided by operating activities $ 2,563,295 $ 1,632,065 $ 1,067,915 $ 653,167 $ 372,986 Current income tax provision 6,209 10,517 13,170 12,853 2,551 Interest expense 235,275 140,708 76,722 53,147 23,232 Exploration expenses, excluding dry hole costs 25,597 22,740 19,971 9,739 6,138 Gain on sale of assets, net 88 136,047 20,838 29,588 709 Excess tax benefit from stock-based compensation — 15,618 — 5,230 2,872 Other, net (1,829 ) (7,587 ) (4,606 ) (3,513 ) (3,890 ) Changes in assets and liabilities 10,875 13,015 109,949 50,666 46,050 EBITDAX $ 2,839,510 $ 1,963,123 $ 1,303,959 $ 810,877 $ 450,648 2010,2013, our PV-10 totaled approximately $4.6$20.2 billion. The Standardized Measure of our discounted future net cash flows was approximately $3.8$16.3 billion at December 31, 2010,2013, representing a $0.8$3.9 billion difference from PV-10 becausedue to the effect of the tax effect.deducting estimated future income taxes in arriving at Standardized Measure. We believe that the presentation of PV-10 is relevant and useful to investors because it presents the discounted future net cash flows attributable to proved reserves held by companies without regard to the specific income tax characteristics of such entities and is a useful measure of evaluating the relative monetary significance of our crude oil and natural gas properties. Investors may utilize PV-10 as a basis for comparing the relative size and value of our proved reserves to other companies. PV-10 should not be considered as a substitute for, or more meaningful than, the Standardized Measure as determined in accordance with U.S. GAAP. Neither PV-10 nor Standardized Measure represents an estimate of the fair market value of our crude oil and natural gas properties.Item 7A. Quantitative and Qualitative Disclosures About Market Risk U.S. natural gas production. Pricing for crude oil and natural gas production has been volatile and unpredictable for several years, and we expect this volatility to continue in the future. The prices we receive for production depend on many factors outside of our control, including volatility in the differences between product prices at sales points and the applicable index price.prices. Based on our average daily production for the year ended December 31, 20102013 and excluding any effect of our derivative instruments in place, our annual revenue would increase or decrease by approximately $118.2$350 million for each $10.00 per barrel change in crude oil prices and $23.9$88 million for each $1.00 per Mcf change in natural gas prices. partially reduce price risk caused by these market fluctuations, we mayeconomically hedge a portion of our anticipated crude oil and natural gas production as part of our risk management program. In addition, we may utilize basis contracts to hedge the differential between NYMEXderivative contract index prices and those of our physical pricing points. Reducing our exposure to price volatility helps ensure that we have adequate funds available for our capital program. Our decision on the quantity and price at which we choose to hedge our production is based in part on our view of current and future market conditions. While hedging limits the downside risk of adverse price movements, it also may limitlimits future revenues from favorableupward price movements.2010,2013, we realized gainsrecognized cash losses on natural gas derivatives of $22.3$61.6 million and realized gains on crude oil derivatives of $13.2 million. For the year ended December 31, 2010, we reported an unrealized non-cash mark-to-market gain on natural gas derivatives of $19.8 million and an unrealizeda non-cash mark-to-market loss on crude oil derivatives of $186.0$130.2 million. The fair value of our derivative instruments at December 31, 20102013 was a net liability of $168.3$94.7 million. The mark-to-market net liability relates to derivative instruments with various terms that are scheduled to mature over the period from January 2014 through December 2015. Over this period, actual derivative settlements may differ significantly, either positively or negatively, from the mark-to-market valuation at December 31, 2013. An assumed increase in the forward commodity prices used in the year-end valuation of our derivative instruments of $10.00 per Bblbarrel for crude oil and $1.00 per MMBtu for natural gas would increase our net derivative liability to $488.0approximately $485 million at December 31, 2010.2013. Conversely, an assumed decrease in forward commodity prices of $10.00 per Bblbarrel for crude oil and $1.00 per MMBtu for natural gas would change our derivative valuation to a net asset of $130.0approximately $289 million at December 31, 2010.information atPart II, Item 7. Management’s Discussion and Analysis of Financial Condition and Results of Operations—Crude Oil and Natural Gas Hedging of this report and the discussion and tables inPart II, Item 8. Notes to Consolidated Financial Statements—Note 5. Derivative Instruments appearing later in this report.On July 21, 2010, President Obama signed into law the Dodd-Frank Act, which, among other things, establishes federal oversight and regulation of the over-the-counter derivatives market and the entities that participate in that market. Significant regulations are required to be promulgated by the SEC and the Commodity Futures Trading Commission within 360 days from the date of enactment to implement the new legislation. The new legislation, to the extent applicable to the Company or its derivatives counterparties, may result in increased costs and cash collateral requirements for the types of derivative instruments the Company uses to hedge and otherwise manage its financial and commercial risks related to fluctuations in commodity prices, and could have an adverse effect on the Company’s ability to hedge risks associated with its business. Many of the key concepts and processes under the Dodd-Frank Act are not defined and must be delineated by rules and regulations which have been and are being adopted by the applicable regulatory agencies. As a consequence, it is not possible at this time to predict the effects that the Dodd-Frank Act or the resulting rules and regulations may have on the Company’s hedging activities.213.3656.2 million in receivables at December 31, 2010)2013), our joint interest receivables ($269.5350.0 million at December 31, 2010)2013), and counterparty credit risk associated with our derivative instrument receivables ($21.43.6 million at December 31, 2010)2013).whowhich own a partial interest in the wells we operate. These entities participate in our wells primarily based on their ownership in leases included in units on which we wish to drill. We can do very little to choose who participates in our wells. In order to minimize our exposure to credit risk we oftengenerally request prepayment of drilling costs where it is allowed by contract or state law. For such prepayments, a liability is recorded and subsequently reduced as the associated work is performed. This liability was $47.7$57.2 million as of December 31, 2010,2013, which will be used to offset future capital costs when billed. In this manner, we reduce credit risk. We also have the right to place a lien on our co-owners interest in the well to redirect production proceeds in order to secure payment or, if necessary, foreclose on the interest. Historically, our credit losses on joint interest receivables have been immaterial.Currently, allAll of our derivative contracts are with parties that are lenders (or affiliates of lenders) under our revolving credit agreement. revolving credit facility. We manage our interest rate exposure by monitoring both the effects of market changes in interest rates and the proportion of our debt portfolio that is variable-rate versus fixed-rate debt. We may utilize interest rate derivatives to alter interest rate exposure in an attempt to reduce interest rate expense related to existing debt issues. Interest rate derivatives may be used solely to modify interest rate exposure and not to modify the overall leverage of the debt portfolio. We currently have no interest rate derivatives. We had $95.0$560 million of outstanding borrowings under our revolving credit facility at February 18, 2011.17, 2014. The impact of a 1% increase in interest rates on this amount of debt would result in increased interest expense of approximately $1.0$5.6 million per year and a $0.6$3.5 million decrease in net income per year. Our revolving credit facility matures on July 1, 2015 and the weighted-average interest rate on outstanding borrowings at February 18, 201117, 2014 was 2.36%1.7%. long-term debt maturities and the weighted average interest rates by expected maturity date as of December 31, 2010: 2011 2012 2013 2014 2015 Thereafter Total $ — $ — $ — $ — $ — $ 900.0 $ 900.0 7.56 % 7.56 % $ — $ — $ — $ — $ 30.0 $ — $ 30.0 4.00 % 4.00 % In thousands 2014 2015 2016 2017 2018 Thereafter Total Fixed rate debt: Senior Notes: Principal amount (1) $ — $ — $ — $ — $ — $ 4,400,000 $ 4,400,000 Weighted-average interest rate — — — — — 5.4 % 5.4 % Note payable: Principal amount $ 2,011 $ 2,078 $ 2,144 $ 2,214 $ 2,286 $ 7,737 $ 18,470 Interest rate 3.1 % 3.1 % 3.1 % 3.1 % 3.1 % 3.1 % 3.1 % Variable rate debt: Credit facility: Principal amount $ — $ 275,000 $ — $ — $ — $ — $ 275,000 Weighted-average interest rate — 1.7 % — — — — 1.7 % (1) This amountAmount does not reflect the discountsany discount or premium at which the Notessenior notes were issued.amountamounts we pay on borrowings under our revolving credit facility. All of our other long-term indebtedness is fixed rate and does not expose us to the risk of cash flow loss due to changes in market interest rates. However, changes in interest rates do affect the fair valuevalues of our Notes.Item 8. Financial Statements and Supplementary Data 585960616263SubsidiarySubsidiaries (the Company) as of December 31, 20102013 and 2009,2012, and the related consolidated statements of income, shareholders’ equity and cash flows for each of the three years in the period ended December 31, 2010.2013. These financial statements are the responsibility of the Company’s management. Our responsibility is to express an opinion on these financial statements based on our audits.SubsidiarySubsidiaries as of December 31, 20102013 and 2009,2012, and the results of their operations and their cash flows for each of the three years in the period ended December 31, 20102013 in conformity with accounting principles generally accepted in the United States of America.Continental Resources, Inc. and Subsidiary’sthe Company’s internal control over financial reporting as of December 31, 2010,2013, based on criteria established in the 1992 Internal Control—Integrated Framework issued by the Committee of Sponsoring Organizations of the Treadway Commission (COSO) and our report dated February 25, 201126, 2014 expressed an unqualified opinion.25, 2011Subsidiary December 31, 2010 2009 In thousands, except par
values and share data $ 7,916 $ 14,222 208,211 119,565 20,156 7,823 254,471 55,970 21,365 2,218 38,362 26,711 22,672 4,575 9,173 4,944 582,326 236,028 2,981,991 2,068,055 27,468 10,844 $ 3,591,785 $ 2,314,927 $ 390,892 $ 91,248 133,051 66,789 4,438 9,612 94,829 45,294 76,771 4,307 2,241 2,460 702,222 219,710 925,991 523,524 582,841 489,241 54,079 47,707 112,940 — 5,557 4,466 755,417 541,414 — — 1,704 1,700 439,900 430,283 766,551 598,296 1,208,155 1,030,279 $ 3,591,785 $ 2,314,927 December 31, In thousands, except par values and share data 2013 2012 Assets Current assets: Cash and cash equivalents $ 28,482 $ 35,729 Receivables: Crude oil and natural gas sales 643,498 468,650 Affiliated parties 13,107 12,410 Joint interest and other, net 349,579 356,111 Derivative assets 3,616 18,389 Inventories 54,440 46,743 Deferred and prepaid taxes 44,337 365 Prepaid expenses and other 10,207 8,386 Total current assets 1,147,266 946,783 Net property and equipment, based on successful efforts method of accounting 10,721,272 8,105,269 Net debt issuance costs and other 72,644 55,726 Noncurrent derivative assets — 32,231 Total assets $ 11,941,182 $ 9,140,009 Liabilities and shareholders’ equity Current liabilities: Accounts payable trade $ 885,289 $ 687,310 Revenues and royalties payable 291,772 261,856 Payables to affiliated parties 5,436 6,069 Accrued liabilities and other 198,113 155,681 Derivative liabilities 90,535 12,999 Current portion of long-term debt 2,011 1,950 Total current liabilities 1,473,156 1,125,865 Long-term debt, net of current portion 4,713,821 3,537,771 Other noncurrent liabilities: Deferred income tax liabilities 1,736,812 1,262,576 Asset retirement obligations, net of current portion 54,353 44,944 Noncurrent derivative liabilities 7,829 2,173 Other noncurrent liabilities 2,093 2,981 Total other noncurrent liabilities 1,801,087 1,312,674 Commitments and contingencies (Note 10) Shareholders’ equity: Preferred stock, $0.01 par value; 25,000,000 shares authorized; no shares issued and outstanding — — Common stock, $0.01 par value; 500,000,000 shares authorized; 185,658,659 shares issued and outstanding at December 31, 2013; 185,604,681 shares issued and outstanding at December 31, 2012 1,857 1,856 Additional paid-in capital 1,252,034 1,226,835 Retained earnings 2,699,227 1,935,008 Total shareholders’ equity 3,953,118 3,163,699 Total liabilities and shareholders’ equity $ 11,941,182 $ 9,140,009 Subsidiary Year Ended December 31, 2010 2009 2008 In thousands, except per share data $ 917,503 $ 584,089 $ 875,213 31,021 26,609 64,693 (130,762 ) (1,520 ) (7,966 ) 21,303 17,033 28,550 839,065 626,211 960,490 86,557 76,719 80,935 6,646 16,523 20,700 76,659 45,645 58,610 12,763 12,615 40,160 18,065 10,740 18,188 243,601 207,602 148,902 64,951 83,694 28,847 49,090 41,094 35,719 (29,588 ) (709 ) (894 ) 528,744 493,923 431,167 310,321 132,288 529,323 (53,147 ) (23,232 ) (12,188 ) 1,293 952 1,395 (51,854 ) (22,280 ) (10,793 ) 258,467 110,008 518,530 90,212 38,670 197,580 $ 168,255 $ 71,338 $ 320,950 $ 1.00 $ 0.42 $ 1.91 $ 0.99 $ 0.42 $ 1.89 Year Ended December 31, In thousands, except per share data 2013 2012 2011 Revenues: Crude oil and natural gas sales $ 3,501,666 $ 2,315,840 $ 1,553,629 Crude oil and natural gas sales to affiliates 105,108 63,593 93,790 Gain (loss) on derivative instruments, net (191,751 ) 154,016 (30,049 ) Crude oil and natural gas service operations 40,127 39,071 32,419 Total revenues 3,455,150 2,572,520 1,649,789 Operating costs and expenses: Production expenses 280,789 193,466 135,178 Production and other expenses to affiliates 6,111 6,675 4,632 Production taxes and other expenses 327,427 223,737 143,236 Exploration expenses 34,947 23,507 27,920 Crude oil and natural gas service operations 29,665 32,248 26,735 Depreciation, depletion, amortization and accretion 965,645 692,118 390,899 Property impairments 220,508 122,274 108,458 General and administrative expenses 144,379 121,735 72,817 Gain on sale of assets, net (88 ) (136,047 ) (20,838 ) Total operating costs and expenses 2,009,383 1,279,713 889,037 Income from operations 1,445,767 1,292,807 760,752 Other income (expense): Interest expense (235,275 ) (140,708 ) (76,722 ) Other 2,557 3,097 3,415 (232,718 ) (137,611 ) (73,307 ) Income before income taxes 1,213,049 1,155,196 687,445 Provision for income taxes 448,830 415,811 258,373 Net income $ 764,219 $ 739,385 $ 429,072 Basic net income per share $ 4.15 $ 4.08 $ 2.42 Diluted net income per share $ 4.13 $ 4.07 $ 2.41 Subsidiary Shares
outstanding Common
stock Additional
paid-in
capital Retained
earnings Total
shareholders’
equity In thousands, except share data 168,864,015 $ 1,689 $ 415,435 $ 206,008 $ 623,132 — — — 320,950 320,950 — — 9,927 — 9,927 436,327 4 1,438 — 1,442 (82,922 ) (1 ) (4,017 ) — (4,018 ) 461,120 5 — — 5 (91,568 ) (1 ) (2,729 ) — (2,730 ) (28,843 ) — — — — 169,558,129 $ 1,696 $ 420,054 $ 526,958 $ 948,708 — — — 71,338 71,338 — — 11,408 — 11,408 — — 2,872 2,872 138,010 1 244 — 245 (29,924 ) — (1,223 ) — (1,223 ) 411,217 4 — — 4 (83,457 ) (1 ) (3,072 ) — (3,073 ) (25,504 ) — — — — 169,968,471 $ 1,700 $ 430,283 $ 598,296 $ 1,030,279 — — — 168,255 168,255 — — 5,230 5,230 — — 11,691 — 11,691 207,220 2 255 — 257 (59,877 ) (1 ) (2,661 ) — (2,662 ) 449,114 4 — — 4 (100,561 ) (1 ) (4,898 ) — (4,899 ) (55,715 ) — — — — 170,408,652 $ 1,704 $ 439,900 $ 766,551 $ 1,208,155 In thousands, except share data Balance at December 31, 2010 170,408,652 $ 1,704 $ 439,900 $ 766,551 $ 1,208,155 Net income — — — 429,072 429,072 Public offering of common stock 10,080,000 101 659,131 — 659,232 Stock-based compensation — — 16,567 — 16,567 Stock options: Exercised 18,470 — 13 — 13 Repurchased and canceled (2,495 ) — (150 ) — (150 ) Restricted stock: Issued 491,315 5 — — 5 Repurchased and canceled (82,807 ) (1 ) (4,767 ) — (4,768 ) Forfeited (41,447 ) — — — — Balance at December 31, 2011 180,871,688 $ 1,809 $ 1,110,694 $ 1,195,623 $ 2,308,126 Net income — — — 739,385 739,385 Common stock issued in exchange for assets 3,916,157 39 81,489 — 81,528 Stock-based compensation — — 30,209 — 30,209 Excess tax benefit on stock-based compensation — — 15,618 — 15,618 Stock options: Exercised 86,500 — 60 — 60 Repurchased and canceled (32,984 ) — (2,951 ) — (2,951 ) Restricted stock: Issued 916,028 9 — — 9 Repurchased and canceled (112,521 ) (1 ) (8,284 ) — (8,285 ) Forfeited (40,187 ) — — — — Balance at December 31, 2012 185,604,681 $ 1,856 $ 1,226,835 $ 1,935,008 $ 3,163,699 Net income — — — 764,219 764,219 Stock-based compensation — — 39,888 — 39,888 Restricted stock: Issued 261,259 3 — — 3 Repurchased and canceled (138,525 ) (1 ) (14,689 ) — (14,690 ) Forfeited (68,756 ) (1 ) — — (1 ) Balance at December 31, 2013 185,658,659 $ 1,857 $ 1,252,034 $ 2,699,227 $ 3,953,118 Subsidiary Year Ended December 31, 2010 2009 2008 In thousands $ 168,255 $ 71,338 $ 320,950 242,748 208,885 148,573 64,951 83,694 28,847 166,257 2,089 (26,703 ) 11,691 11,408 9,081 77,359 36,119 184,115 (5,230 ) (2,872 ) — 3,024 6,477 20,002 (29,588 ) (709 ) (894 ) 4,366 2,607 780 (299,480 ) 48,738 (65,989 ) (11,651 ) (4,501 ) (3,834 ) (2,398 ) 21,961 (16,520 ) 146,473 (117,643 ) 101,967 66,262 (11,371 ) 10,811 47,842 13,842 8,545 2,286 2,924 184 653,167 372,986 719,915 (1,031,499 ) (497,496 ) (841,479 ) (7,338 ) (1,217 ) (74,662 ) (44,564 ) (8,257 ) (14,651 ) 43,985 7,148 3,175 (1,039,416 ) (499,822 ) (927,617 ) 341,000 426,100 443,000 (537,000 ) (576,500 ) (231,600 ) 587,210 297,480 — — 3,304 — — (3,304 ) — (9,191 ) (10,028 ) (1,717 ) (7,561 ) (4,299 ) (6,748 ) 5,230 2,872 — (2 ) (41 ) (207 ) 257 245 1,442 379,943 135,829 204,170 (6,306 ) 8,993 (3,532 ) 14,222 5,229 8,761 $ 7,916 $ 14,222 $ 5,229 Year Ended December 31, In thousands 2013 2012 2011 Cash flows from operating activities: Net income $ 764,219 $ 739,385 $ 429,072 Adjustments to reconcile net income to net cash provided by operating activities: Depreciation, depletion, amortization and accretion 965,437 694,698 391,844 Property impairments 220,508 122,274 108,458 Non-cash (gain) loss on derivatives, net 130,196 (199,737 ) (4,057 ) Stock-based compensation 39,890 29,057 16,572 Provision for deferred income taxes 442,621 405,294 245,203 Excess tax benefit from stock-based compensation — (15,618 ) — Dry hole costs 9,350 767 7,949 Gain on sale of assets, net (88 ) (136,047 ) (20,838 ) Other, net 2,037 5,007 3,661 Changes in assets and liabilities: Accounts receivable (166,138 ) (91,791 ) (294,702 ) Inventories (7,697 ) (7,165 ) (3,412 ) Prepaid expenses and other (11,537 ) 14,381 (3,329 ) Accounts payable trade 107,250 (8,487 ) 83,907 Revenues and royalties payable 28,401 40,030 88,976 Accrued liabilities and other 44,260 40,309 20,784 Other noncurrent assets and liabilities (5,414 ) (292 ) (2,173 ) Net cash provided by operating activities 2,563,295 1,632,065 1,067,915 Cash flows from investing activities: Exploration and development (3,660,773 ) (3,493,652 ) (1,925,577 ) Purchase of producing crude oil and natural gas properties (16,604 ) (570,985 ) (65,315 ) Purchase of other property and equipment (62,054 ) (53,468 ) (44,750 ) Proceeds from sale of assets and other 28,420 214,735 30,928 Net cash used in investing activities (3,711,011 ) (3,903,370 ) (2,004,714 ) Cash flows from financing activities: Revolving credit facility borrowings 970,000 2,119,000 493,000 Repayment of revolving credit facility (1,290,000 ) (1,882,000 ) (165,000 ) Proceeds from issuance of Senior Notes 1,479,375 1,999,000 — Proceeds from issuance of common stock — — 659,736 Proceeds from other debt — 22,000 — Repayment of other debt (1,951 ) (1,579 ) — Debt issuance costs (2,265 ) (7,373 ) (36 ) Equity issuance costs — — (368 ) Repurchase of equity grants (14,690 ) (11,236 ) (4,918 ) Excess tax benefit from stock-based compensation — 15,618 — Exercise of stock options — 60 13 Net cash provided by financing activities 1,140,469 2,253,490 982,427 Net change in cash and cash equivalents (7,247 ) (17,815 ) 45,628 Cash and cash equivalents at beginning of period 35,729 53,544 7,916 Cash and cash equivalents at end of period $ 28,482 $ 35,729 $ 53,544 statementsSubsidiaryCompany was originally formed in 1967 to explore for, develop and produceCompany's principal business is crude oil and natural gas properties. Continental’s operations areexploration, development and production with properties in the North, South, and East regions of the United States. The North region consists of properties north of Kansas and west of the Mississippi riverRiver and includes North Dakota Bakken, Montana Bakken, and the Red River units and the Niobrara shale play in Colorado and Wyoming.units. The South region includes Kansas and all properties south of Kansas and west of the Mississippi riverRiver including the Arkoma and Anadarko Woodfordvarious plays in the South Central Oklahoma Oil Province (“SCOOP”), Northwest Cana and Arkoma areas of Oklahoma. The East region contains propertiesis comprised of undeveloped leasehold acreage east of the Mississippi river includingRiver.Illinois BasinNorth region, with that region comprising approximately 77% of the Company’s crude oil and natural gas production and approximately 86% of its crude oil and natural gas revenues for the state of Michigan. Asyear ended December 31, 2013. Additionally, as of December 31, 2010,2013 approximately 70%76% of the Company’s estimated proved reserves were located in the North region. As2010, the Company had interests in 2,726 wells and serves as the operator of 1,888, or 69%, of those wells.Continental has one wholly owned subsidiary, Banner Pipeline Company, L.L.C., which currently has no assets or operations. of consolidated financial statementsContinentalthe Company and its whollysubsidiaries, all of which are 100% owned, subsidiary after all significant inter-companyintercompany accounts and transactions have been eliminated.couldmay differ from those estimates. The most significant of the estimates and assumptions that affect reported results isare the estimateestimates of the Company’s crude oil and natural gas reserves, which isare used to compute depreciation, depletion, amortization and impairment of producingproved crude oil and natural gas properties. In the opinion of management, all adjustments (consisting only of normal recurring adjustments) necessary for a fair presentation in accordance with U.S. GAAP have been included in these consolidated financial statements.Each month the Company estimates the volumes sold and the price at which they were sold to record revenue. The following table shows the amounts of estimated crude oil and natural gas sales recorded as of December 31 for each indicated year. December 31, 2010 2009 2008 In thousands $ 263,075 $ 129,082 $ 86,350 Variances between estimated revenue and actual amounts received are recorded in the month payment is received and are recorded in the financial statements in the caption “Revenues—Crude Oil and Natural Gas Sales”. These variances have historically not been material. The Company uses the sales method of accounting for natural gas imbalances in those circumstances where it has under-produced or over-produced its ownership percentage in a property. Under this method, a receivable or liabilitypayable is recognized only to the extent that an imbalance cannot be recouped from the reserves in the underlying properties. The Company’s aggregate imbalance positions at December 31, 20102013 and 20092012 were not material.2010,2013, the Company had cash deposits in excess of federally insured amounts of approximately $7.4 million.$28.0 million. The Company has not experienced any losses in such accounts and believes it is not exposed to significant credit risk in this area.Continental Resources, Inc. and SubsidiaryNotes to Consolidated Financial Statements—continuedloss history of losses, and the customer or working interest owner’s ability to pay. The Company writes off specific receivables when they become uncollectiblenoncollectable and any payments subsequently received on those receivables are credited to the allowance for doubtful accounts. Write-offs of uncollectiblenoncollectable receivables have historically not been material. The following table presents the allowance for doubtful accounts at December 31, 2010, 2009 and 2008 and changes in the allowance for those years: Balance at
beginning
of period Additions
charged to
expense Deductions Balance at
end of period In thousands $ 193 $ — $ — $ 193 193 — — 193 193 — — 193 customers.purchasers. For the years ended December 31, 2010, 20092013, 2012 and 2008, crude oil2011, sales to one singlethe Company’s largest purchaser accounted for 57%approximately 15%, 56%21% and 44%41% of total revenues,crude oil and natural gas sales, respectively. Additionally, for the years ended December 31, 2013 and 2012 the Company’s second largest purchaser accounted for approximately 12% and 11%, respectively, of its total crude oil and natural gas sales. The Company's third largest purchaser accounted for approximately 11% of total crude oil and natural gas sales for the year ended December 31, 2013. No other purchasers accounted for more than 10% of the Company’s total crude oil and natural gas sales for those three years.2011, 2012 and 2013. The Company does not require collateral and does not believe the loss of any single purchaser would materially impact its operating results, as crude oil and natural gas are fungible products with well-established markets and numerous purchasers in the Company’s operating regions. December 31, 2010 2009 In thousands $ 16,306 $ 12,044 22,056 14,667 $ 38,362 $ 26,711 December 31, In thousands 2013 2012 Tubular goods and equipment $ 11,139 $ 13,590 Crude oil 43,301 33,153 Total $ 54,440 $ 46,743 including line fill, are valued at the lower of cost or market using the first-in, first-out inventory method. Crude oil inventories consist of the following volumes: December 31, 2010 2009 257,000 253,000 148,000 145,000 405,000 398,000 December 31, MBbls 2013 2012 Crude oil line fill requirements 370 391 Temporarily stored crude oil 344 211 Total 714 602 including enhanced recovery projects, whereby costs incurred to acquire mineral interests in crude oil and natural gas properties, to drill and equip exploratory wells that find proved reserves, to drill and equip development wells, and expenditures for enhanced recovery operations are capitalized. Geological and geophysical costs, seismic costs incurred for exploratory projects, lease rentals and costs associated with unsuccessful exploratory wells or projects including enhanced recovery projects, are expensed as incurred. Costs of seismic studies that are utilized in development drilling within an area of proved reserves are capitalized as development costs. To the extent a seismic project covers areas of both developmental and exploratory drilling, those seismic costs are proportionately allocated between capitalized development costs and exploration expense. Maintenance, repairs and costs of injection are expensed as incurred, except that the costcosts of replacements or renewals that expand capacity or improve production are capitalized.As required,records capitalizedcapitalizes exploratory drilling costs on the balance sheet. On a monthly basis, the CompanyContinental Resources, Inc. and SubsidiaryNotes to Consolidated Financial Statements—continuedcapitalizes the costs of drilling exploratory wellssheet pending determination of whether the well has found proved reserves in economically producible quantities. The Company capitalizes costs associated with the acquisition or construction of support equipment and facilities with the drilling and development costs to which they relate. If proved reserves are found by an exploratory well, the associated capitalized costs become part of well equipment and facilities. However, if proved reserves are not found, the capitalized costs associated with the well are expensed, net of any salvage value. Total capitalized exploratory drilling costs pending the determination of proved reserves were $92.8$22.9$92.7 million as of December 31, 20102013 and 2009,2012, respectively. As of December 31, 2010,2013, exploratory drilling costs of $0.1$3.9 million, representing 1 well,3 wells, were suspended one year beyond the completion of drilling and are expected to be fully evaluated in 2011.EstimatedThe estimated useful lives of service property and equipment are as follows:in10 55-610-20 3-10 25 10-40 Retirement Obligationsita legal obligation is incurred and a corresponding increase in the carrying amount of the related long-lived asset. Subsequently, the capitalized asset retirement costs are charged to expense through the depreciation, depletion and amortization of crude oil and natural gas properties and the liability is accreted to the expected future abandonment amountcost ratably over the related asset’s life.SubsidiaryStatements—continued20082011 through December 31, 2010: 2010 2009 2008 In thousands $ 50,167 $ 44,630 $ 42,092 2,665 2,250 2,053 2,564 2,999 (117 ) 2,794 1,237 3,900 (1,870 ) (949 ) (3,298 ) $ 56,320 $ 50,167 $ 44,630 2,241 2,460 4,747 $ 54,079 $ 47,707 $ 39,883 In thousands 2013 2012 2011 Asset retirement obligations at January 1 $ 47,171 $ 62,625 $ 56,320 Accretion expense 2,767 3,105 3,163 Revisions 2,826 (2,871 ) 1,947 Plus: Additions for new assets 6,009 6,679 3,559 Less: Plugging costs and sold assets (1) (2,986 ) (22,367 ) (2,364 ) Total asset retirement obligations at December 31 $ 55,787 $ 47,171 $ 62,625 Less: Current portion of asset retirement obligations at December 31 (2) 1,434 2,227 2,287 Non-current portion of asset retirement obligations at December 31 $ 54,353 $ 44,944 $ 60,338 (1) (2) Balance is included in the caption "Accrued liabilities and other" in the consolidated balance sheets. 20102013 and 2009,2012, net property and equipment on the consolidated balance sheets included $38.5$44.4 million and $33.8$36.6 million, respectively, of net asset retirement costs.Impairmentproperty.field. The estimated future cash flows expected in connection with the propertyfield are compared to the carrying amount of the propertyfield to determine if the carrying amount is recoverable. If the carrying amount of the propertyfield exceeds its estimated undiscounted future cash flows, the carrying amount of the propertyfield is reduced to its estimated fair value. Due to the unavailability of relevant comparable market data, a discounted cash flow method is used to determine the fair value of proved properties. The discounted cash flow method estimates future cash flows based on management’s expectations for the future and includes estimates of future crude oil and natural gas production, commodity prices based on commodity futures price strips, operating and development costs, and a risk-adjusted discount rate. which primarily consist of undeveloped leasehold costs and costs associated with the purchase of certain proved undeveloped reserves,reserves. Individually significant non-producing properties, if any, are assessed for impairment on a property-by-property basis for individually significant balances,and, if any, and on an aggregate basis by prospect for individually insignificant balances. If the assessment indicates an impairment, a loss is recognized by providing a valuation allowance at the level consistent with the level at which impairment was assessed. The impairment assessment is affected by economic factors such as the results of exploration activities, commodity price outlooks, remaining lease terms, and potential shifts in business strategy employed by management. For individually insignificant non-producing properties, the amount of the impairment losslosses are recognized is determined by amortizing the portion of the properties’ costs which management estimates will not be transferred to proved properties over the lifelives of the leaseleases based on experience of successful drilling and the average holding period.revolvingCompany’s credit facility and amendments thereto wereare capitalized and are being amortized over the term of the facility on a straight-line basis, the use of which approximates the effective interest method. Costs incurred inupon the issuance of the 8 1/4% 1/4% Senior Notes due 2019, the 7 3/8% 3/8% Senior Notes due 2020, and the 7 1/8% 1/8% Senior Notes due 2021, the 5% Senior Notes due 2022 and the 4 1/2% Senior Notes due 2023 (collectively, the “Notes”) were capitalized and are being amortized over the terms of the Notes on a straight-line basis, the use of which approximatesusing the effective interest method. The Company had capitalized costs of $27.5$69.5 million and $10.8$55.3 million (net of accumulated amortization of $11.3$28.8 million and $7.8 million)$20.2 million) relating to its long-term debt at December 31, 20102013 and 2009,2012, respectively. DuringThe increase in 2013 resulted from the capitalization of costs incurred in connection with the Company’s April 2013 issuance of 4 1/2% Senior Notes due 2023 as discussed in Note 7. Long-Term Debt. For the years ended December 31, 2010, 20092013, 2012 and 2008,2011, the Company recognized associated amortization expense associated with capitalized debt issuance costs of $3.5$8.6 million $2.2, $5.6 million and $0.6$3.3 million, respectively, which are reflected in “Interest expense” onin the consolidated statements of income.is required to recognize all ofrecognizes its derivative instruments on the balance sheet as either assets or liabilities measured at fair value with such amounts classified as current or long-term based on their anticipated settlement dates. Derivative assets and liabilities with the same counterparty that are subject to contractual terms which provide for net settlement are reported on a net basis in the consolidated balance sheets. The accounting for the changes in fair value of a derivative depends on the intended use of the derivative and resulting designation. The Company has not designated its derivative instruments as hedges for accounting purposes and, as a result, marks its derivative instruments to fair value and recognizes the realized and unrealized changechanges in fair value in the consolidated statements of income under the caption “Gain (loss) on derivative instruments, in the statements of income.valuevalues of cash, trade receivables and trade payables are considered to be representative of their respective fair values due to the short term maturity of those instruments.revolving credit facility and the Notes.Notes are based on quoted market prices. The fair value of the revolvingnote payable is determined using a discounted cash flow approach based on the interest rate and payment terms of the note payable and an assumed discount rate. The fair value of credit facility borrowings approximates its carrying value based on the borrowing rates currently available to the Company for bank loans with similar terms and maturities. The estimatedSee Note 6. Fair Value Measurements for quantification of the fair value of the revolving credit facility was $30.0 million and $226.0 millionCompany’s long-term debt obligations at December 31, 20102013 and 2009, respectively. The fair values of the Notes are based on quoted market prices and totaled $963.8 million at December 31, 2010 and $315.8 million at December 31, 2009.Continental Resources, Inc. and Subsidiary2012.Notes to Consolidated Financial Statements—continued the financial statement carrying amounts and the tax basis of existing assets and liabilities using the enacted statutory tax rates in effect at year-end. The effect on deferred taxes for a change in tax rates is recognized in income in the period that includes the enactment date. A valuation allowance for deferred tax assets is recorded when it is more likely than not that the benefit from the deferred tax asset will not be realized.dilutive stock options, which are calculated using the treasury stock method as if thosethe awards and options were exercised. The following istable presents the calculation of basic and diluted weighted average shares outstanding and net income per share for the years ended December 31, 2010, 20092013, 2012 and 2008: 2010 2009 2008 In thousands, except per share data $ 168,255 $ 71,338 $ 320,950 168,985 168,559 168,087 546 562 686 248 408 619 169,779 169,529 169,392 $ 1.00 $ 0.42 $ 1.91 $ 0.99 $ 0.42 $ 1.89 New2011. All stock options issued by the Company in prior periods had been exercised or had expired as of March 31, 2012. Year ended December 31, In thousands, except per share data 2013 2012 2011 Income (numerator): Net income - basic and diluted $ 764,219 $ 739,385 $ 429,072 Weighted average shares (denominator): Weighted average shares - basic 184,075 181,340 177,590 Non-vested restricted stock 774 490 544 Stock options — 16 96 Weighted average shares - diluted 184,849 181,846 178,230 Net income per share: Basic $ 4.15 $ 4.08 $ 2.42 Diluted $ 4.13 $ 4.07 $ 2.41 standardsJanuary 2010,December 2011, the Financial Accounting Standards Board (the “FASB”(“FASB”) issued Accounting Standards Update (“ASU”) No. 2010-06,Fair Value Measurements and Disclosures2011-11, Balance Sheet (Topic 820)210)–Improving Disclosures about Fair Value Measurements, which requires new disclosuresOffsetting Assets and clarifies existing disclosure requirements related to fair value measurements.Liabilities. The new standard requires additionalan entity to disclose information about offsetting arrangements to enable financial statement users to understand the effect of netting arrangements on an entity’s financial position. The disclosures relatedare required for recognized financial instruments and derivative instruments that are subject to (i) the amountsoffsetting or are subject to master netting arrangements irrespective of significant transfers between Level 1 and Level 2 fair value measurements and the reasons for the transfers, (ii) the reasons for any transfers in or out of Level 3 measurements, and (iii) the presentation of information in the rollforward of recurring Level 3 measurements about purchases, sales, issuances, and settlements on a gross basis.whether they are offset. The new standard was effective for interim and annual reporting periods beginning after December 15, 2009, except for the disclosure requirements relatedbecame effective January 1, 2013 and must be applied retrospectively to the gross presentation of purchases, sales, issuances, and settlements in the Level 3 rollforward. Those disclosures, which are not expected to have a material impactall periods presented on the Company’s consolidated financial statements, are effective for fiscal years beginning after December 15, 2010 and will be incorporated into the Company’s Quarterly Report on Form 10-Q for the period ending March 31, 2011.balance sheet. The Company adopted the applicable provisions of thisthe new standard on January 1, 20102013 and has included the required disclosures inNote 6. Fair Value Measurements.The adoption5. Derivative Instruments. Adoption of this pronouncementthe new standard required additional footnote disclosures for the Company's derivative instruments and did not have a materialan impact on the Company’s consolidatedits financial statements.ReclassificationsCertain prior year amounts have been reclassified on the consolidated financial statements to conform to the 2010 presentation. On the consolidated balance sheet asposition, results of December 31, 2009, the line item “Derivative assets” was included in “Receivables – Joint interest and other, net” and the line item “Derivative liabilities” was included in “Accrued liabilities and other” and have been shown separately in this report to conform to the 2010 presentation. On the consolidated statements ofoperations or cash flows for the years ended December 31, 2009 and 2008, the line item “Gain on sale of assets” was included in “Other, net” and has been shown separately in this report to conform to the 2010 presentation.Continental Resources, Inc. and Subsidiaryflows.Notes to Consolidated Financial Statements—continued Year ended December 31, 2010 2009 2008 In thousands $ 36,845 $ 14,562 $ 10,224 $ 10,879 $ 146 $ 31,560 $ (1,406 ) $ (22,040 ) $ — $ 5,358 $ 4,236 $ 3,783 Year ended December 31, In thousands 2013 2012 2011 Supplemental cash flow information: Cash paid for interest $ 209,815 $ 102,043 $ 70,088 Cash paid for income taxes 29,017 829 16,030 Cash received for income tax refunds (174 ) (13,866 ) (116 ) Non-cash investing activities: Increase in accrued capital expenditures 89,482 49,039 173,591 Acquisition of assets through issuance of common stock (Note 14) — 176,563 — Asset retirement obligation additions and revisions, net 8,835 3,808 5,506 20102013 and 2009: December 31, 2010 2009 In thousands $ 3,431,628 $ 2,592,712 547,077 271,910 80,337 50,493 4,059,042 2,915,115 (1,077,051 ) (847,060 ) $ 2,981,991 $ 2,068,055 December 31, In thousands 2013 2012 Proved crude oil and natural gas properties $ 12,423,878 $ 8,980,505 Unproved crude oil and natural gas properties 1,181,268 1,073,944 Service properties, equipment and other 236,233 170,763 Total property and equipment 13,841,379 10,225,212 Accumulated depreciation, depletion and amortization (3,120,107 ) (2,119,943 ) Net property and equipment $ 10,721,272 $ 8,105,269 20102013 and 2009: December 31, 2010 2009 In thousands $ 47,710 $ 13,475 8,434 6,837 18,649 13,902 18,140 7,736 1,896 3,344 $ 94,829 $ 45,294 December 31, In thousands 2013 2012 Prepaid advances from joint interest owners $ 57,196 $ 30,434 Accrued compensation 41,757 27,797 Accrued production taxes, ad valorem taxes and other non-income taxes 35,900 33,466 Accrued income taxes — 10,455 Accrued interest 61,216 46,973 Current portion of asset retirement obligations 1,434 2,227 Other 610 4,329 Accrued liabilities and other $ 198,113 $ 155,681 is required to recognizerecognizes all derivative instruments on the balance sheet as either assets or liabilities measured at fair value. The Company has not designated its derivative instruments as hedges for accounting purposes and, as a result, marks its derivative instruments to fair value and recognizes the realized and unrealized changechanges in fair value on derivative instruments in the consolidated statements of income under the caption “Loss“Gain (loss) on mark-to-market derivative instruments, net.”may limitlimits future revenues from favorableupward price movements. For a basis swap contract, which guarantees a price differential between the NYMEXContinental Resources, Inc. and SubsidiaryNotes to Consolidated Financial Statements—continuedprices and the Company’s physical pricing points, the Company receives a payment from the counterparty if the settled price differential is greater than the stated terms of the contract and the Company pays the counterparty if the settled price differential is less than the stated terms of the contract. For a collar contract, the counterparty is required to make a payment to the Company if the settlement price for any settlement period is below the floor price, the Company is required to make a payment to the counterparty if the settlement price for any settlement period is above the ceiling price, and neither party is required to make a payment to the other party if the settlement price for any settlement period is between the floor price and the ceiling price.Crude Oil–NYMEX WTI Swaps Weighted Average Price Period and Type of Contract Bbls January 2014 - December 2014 Swaps - WTI 10,851,250 $ 96.50 Collars Crude Oil–ICE Brent Bbls Floors Ceilings Period and Type of Contract Range Range January 2014 - December 2014 Swaps - ICE Brent 17,028,000 $ 103.17 Collars - ICE Brent 2,190,000 $90.00 - $95.00 $ 90.83 $104.70 - $108.85 $ 107.13 January 2015 - December 2015 Swaps - ICE Brent 2,737,500 $ 99.15 Collars - ICE Brent 730,000 $ 95.00 $ 95.00 $ 107.40 $ 107.40 Natural Gas–NYMEX Henry Hub MMBtus Period and Type of Contract January 2014 - December 2014 Swaps - Henry Hub 64,250,000 $ 4.19 January 2015 - March 2015 Swaps - Henry Hub 1,800,000 $ 4.27 Year ended December 31, In thousands 2013 2012 2011 Cash received (paid) on derivatives: Crude oil fixed price swaps $ (54,289 ) $ (40,238 ) $ (14,900 ) Crude oil collars (16,867 ) (15,341 ) (56,511 ) Natural gas fixed price swaps 9,601 9,858 37,305 Cash paid on derivatives, net $ (61,555 ) $ (45,721 ) $ (34,106 ) Non-cash gain (loss) on derivatives: Crude oil fixed price swaps $ (117,580 ) $ 142,567 $ (23,486 ) Crude oil collars (8,587 ) 59,911 42,239 Natural gas fixed price swaps (4,029 ) (2,741 ) (14,696 ) Non-cash gain (loss) on derivatives, net $ (130,196 ) $ 199,737 $ 4,057 Gain (loss) on derivative instruments, net $ (191,751 ) $ 154,016 $ (30,049 ) onin the consolidated balance sheets under the captions “Derivative assets”, “Noncurrent derivative assets”, “Derivative liabilities”, and “Noncurrent derivative liabilities”. Derivative assets and liabilities with the same counterparty andthat are subject to contractual terms which provide for net settlement are reported on a net basis onin the consolidated balance sheets. Substantially allcrude oilamounts offset under netting arrangements with counterparties, and natural gas derivative contracts are settled based upon reported prices on the NYMEX. The estimated fair value of these contracts is based upon various factors, including closing exchange prices on the NYMEX, over-the-counter quotations, and,resulting net amounts presented in the case of collars, volatility andconsolidated balance sheets for the time value of options. periods presented, all at fair value. December 31, 2013 December 31, 2012 In thousands Gross
amounts of
recognized
assets Gross amounts
offset on
balance sheet Net amounts of
assets on
balance sheet Gross
amounts of
recognized
assets Gross amounts
offset on
balance sheet Net amounts of
assets on
balance sheetCommodity derivative assets $ 4,213 $ (597 ) $ 3,616 $ 86,506 $ (35,886 ) $ 50,620 December 31, 2013 December 31, 2012 In thousands Gross
amounts of
recognized
liabilities Gross amounts
offset on
balance sheet Net amounts of
liabilities on
balance sheet Gross
amounts of
recognized
liabilities Gross amounts
offset on
balance sheet Net amounts of
liabilities on
balance sheet Commodity derivative liabilities $ (125,709 ) $ 27,345 $ (98,364 ) $ (16,241 ) $ 1,069 $ (15,172 ) calculation offollowing table reconciles the fair value of collars requiresnet amounts disclosed above to the use of an option-pricing model. Seeindividual financial statement line items in the consolidated balance sheets.In thousands December 31, 2013 December 31, 2012 Derivative assets $ 3,616 $ 18,389 Noncurrent derivative assets — 32,231 Net amounts of assets on balance sheet 3,616 50,620 Derivative liabilities (90,535 ) (12,999 ) Noncurrent derivative liabilities (7,829 ) (2,173 ) Net amounts of liabilities on balance sheet (98,364 ) (15,172 ) Total derivative assets (liabilities), net $ (94,748 ) $ 35,448 .At December 31, 2010, thehad outstanding contracts with respect to future production as set forth in the tables below.Crude Oil Collars Swaps Floors Ceilings Weighted Weighted Weighted Bbls Average Range Average Range Average 284,000 $ 83.86 2,565,000 $ 75-$80 $ 78.95 $ 88.65-$97.25 $ 91.70 273,000 84.67 2,593,500 $ 75-$80 79.39 $ 89.00-$97.25 91.27 460,000 85.64 2,622,000 $ 75-$80 79.39 $ 89.00-$97.25 91.27 644,000 86.25 2,622,000 $ 75-$80 79.39 $ 89.00-$97.25 91.27 7,320,000 86.90 5,332,620 $ 80 80.00 $ 93.25-$97.00 94.71 5,110,000 88.63 4,745,000 $ 80-$85 82.31 $ 92.30-$101.70 97.58 Natural Gas MMBtus Swaps
Weighted
Average 11,862,500 $ 6.36 Continental Resources, Inc. and SubsidiaryNotes to Consolidated Financial Statements—continuedDerivative Fair Value Gain (Loss)The following table presents information about the componentsfollows a three-level valuation hierarchy for disclosure of derivative fair value gain (loss) for the periods presented: Year ended December 31, 2010 2009 2008 In thousands $ 11,386 $ — $ (7,966 ) 1,809 — — 25,246 569 — (2,946 ) — — (85,870 ) (423 ) — (100,143 ) (3,275 ) — 17,161 4,204 — 2,595 (2,595 ) — $ (130,762 ) $ (1,520 ) $ (7,966 ) The table below provides data about the fair value of derivatives that are not accounted for using hedge accounting. December 31, 2010 December 31, 2009 Assets (Liabilities) Net Assets (Liabilities) Net Fair
Value Fair
Value Fair
Value Fair
Value Fair
Value Fair
Value In thousands $ 21,365 $ (189,711 ) $ (168,346 ) $ 2,218 $ (4,307 ) $ (2,089 ) 6. Fair Value MeasurementsIn January 2010, the FASB issued ASU No. 2010-06,Fair Value Measurements and Disclosures (Topic 820)-Improving Disclosures about Fair Value Measurements,which requires new disclosures and clarifies existing disclosure requirements related to fair value measurements. The Company adopted the applicable provisions of this new standard on January 1, 2010valuation hierarchy categorizes assets and has included the required disclosures below, as applicable.The Company is required to calculate fair value based on a hierarchy which prioritizes the inputs to valuation techniques used to measureliabilities measured at fair value into one of three levels.different levels depending on the observability of the inputs employed in the measurement. The fair value hierarchy gives the highest priority tothree levels are defined as follows:market prices in active markets for identical assets or liabilities (Level 1) andin active markets as of the lowest priority toreporting date.(Level 3). Level 2 inputsthat are corroborated by market data. These are inputs other than quoted prices in active markets included withinin Level 1, which are observable for the asset or liability, either directly or indirectly.indirectly observable as of the reporting date.Liabilities Measuredliabilities measured at Fair Valuefair value on a Recurring BasisCertain assets and liabilitiesrecurring basisThe Company’s assessment of the significance of a particular input to the fair value measurement requires judgment, and may affect the valuation of the fair value of assets and liabilities and their placement within the fair value hierarchy levels. In determining the fair valuevalues of fixed price swaps, and basis swaps,a discounted cash flow method is used due to the unavailability of relevant comparable market data for ourthe Company’s exact contracts, a discounted cash flow method is used.contracts. The discounted cash flow method estimates future cash flows based on quoted market prices for futureforward commodity prices observable inputs relating to basis differentials and a risk-adjusted discount rate. The fair valuevalues of fixed price swaps and basis swaps isare calculated mainly using mainly significant observable inputs (Level 2). The calculationCalculation of the fair valuevalues of collar contracts requires the use of an option-pricing model with significant unobservable inputs (Level 3). The valuation model forindustry-standard option derivative contracts is an industry-standardpricing model that considers various inputs including: (a)including quoted forward prices for commodities, (b) time value, (c) volatility factors, and (d) current market and contractual prices for the underlying instruments, as well as other relevant economic measures. These assumptions are observable in the marketplace or can be corroborated by active markets or broker quotes and are therefore designated as Level 2 within the valuation hierarchy. The Company’s calculation of fair value for each positionof its derivative positions is then compared to the counterparty valuation for reasonableness.Continental Resources, Inc. and SubsidiaryNotes to Consolidated Financial Statements—continued20102013 and 2009. There were no transfers between Level 1 and Level 2 of the2012. In thousands Fair value measurements at December 31, 2013 using: Description Level 1 Level 2 Level 3 Total Derivative assets (liabilities): Fixed price swaps $ — $ (84,893 ) $ — $ (84,893 ) Collars — (9,855 ) — (9,855 ) Total $ — $ (94,748 ) $ — $ (94,748 ) In thousands Fair value measurements at December 31, 2012 using: Description Level 1 Level 2 Level 3 Total Derivative assets (liabilities): Fixed price swaps $ — $ 36,716 $ — $ 36,716 Collars — (1,268 ) — (1,268 ) Total $ — $ 35,448 $ — $ 35,448 hierarchy during the years ended December 31, 2010 and 2009. Further, there were no transfers in and/or out of Level 3 of the fair value hierarchy during the years ended December 31, 2010 and 2009.$(000,000) $(000,000) $(000,000) $(000,000) Fair value measurements at December 31, 2010 using: Total Level 1 Level 2 Level 3 In thousands $ — $ (64,928 ) $ — $ (64,928 ) — — — — — — (103,418 ) (103,418 ) $ — $ (64,928 ) $ (103,418 ) $ (168,346 ) Fair��value measurements at December 31, 2009 using: Total Level 1 Level 2 Level 3 In thousands $ — $ 3,781 $ — $ 3,781 — (2,595 ) — (2,595 ) — — (3,275 ) (3,275 ) $ — $ 1,186 $ (3,275 ) $ (2,089 ) The following table sets forth a reconciliation of changes in the fair value of financial assets and liabilities classified as Level 3 in the fair value hierarchy for the indicated periods: 2010 2009 In thousands $ (3,275 ) $ — (100,143 ) (3,275 ) — — — — — — — — $ (103,418 ) $ (3,275 ) $ (99,110 ) $ (3,275 ) Gains and losses included in earnings for the years ended December 31, 2010 and 2009 attributable to the change in unrealized gains and losses relating to derivatives held at December 31, 2010 and 2009 are reported in “Revenues – Loss on mark-to-market derivative instruments, net”.Assets and Liabilities Measured at Fair Value on a Nonrecurring Basis and liabilities are reported at fair value on a nonrecurring basis in the consolidated financial statements. The following methods and assumptions were used to estimate the fair values for those assets and liabilities.Impairments—impairments –Proved crude oil and natural gas properties are reviewed for impairment on a field-by-field basis each quarter, or when events and circumstances indicate a possible decline in the recoverability of the carrying value of such property.field. The estimated future cash flows expected in connection with the propertyfield are compared to the carrying amount of the propertyfield to determine if the carrying amount is recoverable. If the carrying amount of the propertyfield exceeds its estimated undiscounted future cash flows, the carrying amount of the propertyfield is reduced to its estimated fair value. Due to the unavailability of relevant comparable market data, a discounted cash flow method is used to determine the fair value of proved properties. The discounted cash flow method estimates future cash flows based on management’s expectations for the future and includes estimates of future crude oil and natural gas production, commodity prices based on commodity futures price strips, operating and development costs, and a risk-adjusted discount rate. The fair value of proved crude oil and natural gas properties is calculated using significant unobservable inputs (Level 3).Non-producing The following table sets forth quantitative information about the significant unobservable inputs used by the Company to calculate the fair value of proved crude oil and natural gas properties whichusing a discounted cash flow method.Unobservable Input Assumption Future production Future production estimates for each property Forward commodity prices Forward NYMEX swap prices through 2018 (adjusted for differentials), escalating 3% per year thereafter Operating and development costs Estimated costs for the current year, escalating 3% per year thereafter Productive life of field Ranging from 0 to 50 years Discount rate 10% consistreflected fair value adjustments made for certain properties in the Niobrara play in Colorado and Wyoming driven by uneconomic well results. The impaired properties were written down to their estimated fair value totaling approximately $21.2 million.and costs associated with the purchase of proved undeveloped reserves, are assessed for impairment on a property-by-property basis for individually significant balances, if any, and on an aggregate basis by prospect for individually insignificant balances. If the assessment indicates an impairment, a loss is recognized by providing a valuation allowance at the level consistent with the level at which impairment was assessed. TheContinental Resources, Inc. and SubsidiaryNotes to Consolidated Financial Statements—continueda loss is recognized by providing a valuation allowance at the level consistent with the level at which impairment was assessed. The impairment assessment is affected by economic factors such as the results of exploration activities, commodity price outlooks, remaining lease terms, and potential shifts in business strategy employed by management. For individually insignificant non-producing properties the amount of the impairment loss recognized is determined by amortizing the portion of the properties’ costs whichthat management estimatesexpects will not be transferred to proved properties over the lifelives of the leaseleases based on experience of successful drilling and the average holding period. TheAdditionally, undeveloped leasehold costs on certain properties in the Niobrara play were individually assessed for impairment in the 2013 fourth quarter based on indicators of impairment and were written down to fair value of non-producing properties is calculated using significant unobservable inputs (Level 3).As a result$14.9 million, which resulted in $8.4 million of changesimpairment charges being recognized in reserves andaddition to the commodity futures price strips, proved properties were reviewed for impairment at December 31, 2010 and throughout the year then ended. The Company determined that the carrying amounts of certain proved properties were not recoverable from future cash flows and, therefore, were impaired. Impairments of proved properties amounted to $1.7 million for the year ended December 31, 2010. Further, certain non-producing properties were impaired during the year ended December 31, 2010, reflectingrecurring amortization of leasehold costs. described above.pre-tax non-cash impairments of both proved and non-producingunproved properties for the indicated periods. Proved and non-producingunproved property impairments are recorded under the caption “Property impairments” in the consolidated statements of income. Year ended December 31, 2010 2009 2008 In thousands $ 1,681 $ 36,607 $ 12,271 63,270 47,087 16,576 $ 64,951 $ 83,694 $ 28,847 Asset Retirement Obligations—The Year ended December 31, In thousands 2013 2012 2011 Proved property impairments $ 51,805 $ 4,332 $ 16,107 Unproved property impairments 168,703 117,942 92,351 Total $ 220,508 $ 122,274 $ 108,458 of asset retirement obligations (AROs) is estimated based on discounted cash flow projections using numerous estimates, assumptions and judgments regarding such factors as the existence of a legal obligation for an ARO, estimated probabilities, amounts and timing of settlements, the credit-adjusted risk-free rate to be used, and inflation rates. The fair values of ARO additions for the years ended December 31, 2010 and 2009 were $2.8 million and $1.2 million, respectively, which are reflected in the caption “Asset retirement obligations, net of current portion” in the consolidated balance sheets. The fair values of AROs are calculated using significant unobservable inputs (Level 3).Financial Instruments not Recorded at Fair Value December 31, 2010 December 31, 2009 Carrying
Amount Fair Value Carrying
Amount Fair Value In thousands $ 30,000 $ 30,000 $ 226,000 $ 226,000 297,696 331,500 297,524 315,750 198,295 213,000 — — 400,000 419,333 — — $ 925,991 $ 993,833 $ 523,524 $ 541,750 (1)The carrying amount is net of discounts of $2.3 million and $2.5 million at December 31, 2010 and 2009, respectively.(2)The carrying amount is net of discount of $1.7 million at December 31, 2010.(3)These notes were sold at par and are recorded at 100% of face value. December 31, 2013 December 31, 2012 In thousands Carrying Amount Fair Value Carrying Amount Fair Value Debt: Credit facility $ 275,000 $ 275,000 $ 595,000 $ 595,000 Note payable 18,470 16,500 20,421 20,148 8 1/4% Senior Notes due 2019 298,305 327,800 298,085 339,000 7 3/8% Senior Notes due 2020 198,695 223,700 198,552 226,833 7 1/8% Senior Notes due 2021 400,000 450,300 400,000 454,333 5% Senior Notes due 2022 2,025,362 2,063,300 2,027,663 2,165,833 4 1/2% Senior Notes due 2023 1,500,000 1,519,400 — — Total debt $ 4,715,832 $ 4,876,000 $ 3,539,721 $ 3,801,147 the revolving credit facility borrowings approximates its carrying value based on the borrowing rates available to the Company for bank loans with similar terms and maturities. maturities and is classified as Level 2 in the fair value hierarchy. 1/4% 1/4% Senior Notes due 2019 (“2019 Notes”), the 7 3/8% 3/8% Senior Notes due 2020 and(“2020 Notes”), the 7 1/8% 1/8% Senior Notes due 2021 (“2021 Notes”), the 5% Senior Notes due 2022 (“2022 Notes”), and the 4 1/2% Senior Notes due 2023 ("2023 Notes") are based on quoted market prices.Continental Resources, Inc. and SubsidiaryNotes to Consolidated Financial Statements—continuedLong-termLong-Term Debtfollowing: December 31, 2010 2009 In thousands $ 30,000 $ — — 226,000 30,000 226,000 297,696 297,524 198,295 — 400,000 — $ 925,991 $ 523,524 December 31, In thousands 2013 2012 Credit facility $ 275,000 $ 595,000 Note payable 18,470 20,421 8 1/4% Senior Notes due 2019 (1) 298,305 298,085 7 3/8% Senior Notes due 2020 (2) 198,695 198,552 7 1/8% Senior Notes due 2021 (3) 400,000 400,000 5% Senior Notes due 2022 (4) 2,025,362 2,027,663 4 1/2% Senior Notes due 2023 (3) 1,500,000 — Total debt 4,715,832 3,539,721 Less: Current portion of long-term debt (2,011 ) (1,950 ) Long-term debt, net of current portion $ 4,713,821 $ 3,537,771 (1) $2.3$1.7 million and $2.5$1.9 million at December 31, 20102013 and 2009,2012, respectively.(2) discountunamortized discounts of $1.7$1.3 million and $1.4 million at December 31, 2010.2013 and 2012, respectively.(3) Revolving credit(4) The carrying amount includes an unamortized premium of $25.4 million and $27.7 million at December 31, 2013 and 2012, respectively. had $30.0 million and $226.0 million of outstanding borrowings at December 31, 2010 and 2009, respectively, on its revolvinghas a credit facility, duematuring on July 1, 2015. The credit facility has2015, with aggregate lender commitments of $750 million and a borrowing base oftotaling $1.5 billion, subject to semi-annual redetermination. The most recent borrowing base redetermination was completed in December 2010, whereby the lenders approved an increase in the Company’s borrowing base from $1.3 billion to $1.5 billion. The terms of the facility provide that the commitment levelwhich can be increased up to $2.5 billion under the lesserterms of the facility. In November 2013, following an upgrade by Standard & Poor’s Rating Services (“S&P”), as permitted by the credit facility terms, the Company provided the lenders under its credit facility notice of its intention to elect an Additional Covenant Period (as defined in the credit facility). The election of an Additional Covenant Period means that the credit facility is not currently subject to a borrowing base thenbase. The election was made in effect or $2.5 billion.order to facilitate the release of collateral consisting of oil and gas properties securing obligations under the credit facility. On December 11, 2013, the Company delivered notice to the credit facility lenders confirming it had satisfied all conditions for releasing the collateral and the release of such collateral became effective as of December 12, 2013. On December 13, 2013, the Company's credit rating was upgraded by Moody's Investor Services, Inc (“Moody’s”). As a result of the second upgrade, the Company is not currently required to: (i) comply with certain reporting requirements; and (ii) maintain a ratio of the present value of oil and gas properties to total funded debt of not less than 1.5 to 1.0, as set forth in the credit facility. payable quarterly, at a rate per annum equal to the London Interbank Offered Rate (LIBOR) for one, two, three or six months, as elected by the Company, plus a margin ranging from 175 to 275of 150 basis points, depending on the percentage of its borrowing base utilized, or the lead bank’s reference rate (prime) plus a margin ranging from 75 to 17550 basis points. Borrowings are secured by the Company’s interest in at least 85% (by value) of all of its proved reserves and associated crude oil and natural gas properties. The Company’s weighted average interest rate on outstanding credit facility borrowings was 4.00% and 2.66% at December 31, 2010 and 2009, respectively.$717.6 millionapproximately $1.2 billion of unused commitments (after considering outstanding borrowings and letters of credit) under its revolving credit facility at December 31, 20102013 and incurs commitment fees of 0.50%0.25% per annum of the daily average amount of unused borrowing availability. The credit agreement contains certain restrictive covenants including a requirement that the Company maintain a current ratio of not less than 1.0 to 1.0 and a ratio of total funded debt to EBITDAX of no greater than 3.754.0 to 1.0. As defined by the credit agreement,facility, the current ratio represents the ratio of current assets to current liabilities, inclusive of available borrowing capacity under the credit agreementfacility and exclusive of current balances associated with derivative contracts and asset retirement obligations. EBITDAX represents earnings before interest expense, income taxes, depreciation, depletion, amortization and accretion, property impairments, exploration expenses, unrealized derivativenon-cash gains and losses resulting from the requirements of accounting for derivatives, and non-cash equity compensation expense. EBITDAX is not a measure of net income or cash flows as determined by GAAP. A reconciliation of net income to EBITDAX is provided inItem 7. Management’s Discussion and Analysis of Financial Condition and Results of Operations—Non-GAAP Financial Measures. The total funded debt to EBITDAXrevolving credit facility plus the Company’s note payable and senior note obligations, divided by total EBITDAX for the most recent four quarters. The Company was in compliance with allthese covenants at December 31, 2010.Notes8 1/notes% 1/2% Senior Notes due 2019—On September 23, 2009, the Company issued $300 million of 8 1/4% Senior Notes due 2019 (the “2019 Notes”)2023 and received net proceeds of approximately $289.7 million$1.48 billion after deducting the initial purchasers’ discounts andpurchasers' fees. The Company used the net proceeds were used to repay a portion offrom the borrowings then outstanding under the revolving credit facility.7 3/8% Senior Notes due 2020—On April 5, 2010, the Company issued $200 million of 7 3/8% Senior Notes due 2020 (the “2020 Notes”) and received net proceeds of approximately $194.2 million after deducting the initial purchasers’ discounts and fees. The net proceeds were used to repay a portion of the borrowings then outstanding under the revolving credit facility.7 1/8% Senior Notes due 2021—On September 16, 2010, the Company issued $400 million of 7 1/8% Senior Notes due 2021 (the “2021 Notes”) at par and received net proceeds of approximately $393.0 million after deducting the initial purchasers’ fees. The net proceeds were usedoffering to repay all borrowings then outstanding under the revolvingits credit facility, andwhich had a balance prior to increase cash balancespayoff of approximately $1.04 billion, to fund a portion of its 2013 capital budget, and for general corporate purposes.2010 capital program.Continental Resources, Inc. and Subsidiary2019 Notes 2020 Notes 2021 Notes 2022 Notes 2023 Notes Maturity date Oct 1, 2019 Oct 1, 2020 April 1, 2021 Sep 15, 2022 April 15, 2023 Interest payment dates April 1, Oct. 1 April 1, Oct. 1 April 1, Oct. 1 March 15, Sept. 15 April 15, Oct. 15 Call premium redemption period (1) Oct 1, 2014 Oct 1, 2015 April 1, 2016 March 15, 2017 n/a Make-whole redemption period (2) Oct 1, 2014 Oct 1, 2015 April 1, 2016 March 15, 2017 Jan 15, 2023 Equity offering redemption period (3) — — April 1, 2014 March 15, 2015 n/a (1) On or after these dates, the Company has the option to redeem all or a portion of its senior notes at the decreasing redemption prices specified in the respective senior note indentures (together, the “Indentures”) plus any accrued and unpaid interest to the date of redemption. (2) At any time prior to these dates, the Company has the option to redeem all or a portion of its senior notes at the “make-whole” redemption prices specified in the Indentures plus any accrued and unpaid interest to the date of redemption. (3) Consolidated Financial Statements—continuedThe 2019 Notes, 2020 Notes, and 2021 Notes (together, the “Notes”) will mature on October 1, 2019, October 1, 2020, and April 1, 2021, respectively. Interest on the Notes is payable semi-annually on April 1 and October 1 of each year, with interest on the 2021 Notes commencing April 1, 2011. The Company has the option to redeem allany mandatory redemption or a portion of the 2019 Notes, 2020 Notes, and 2021 Notes at any time on or after October 1, 2014, October 1, 2015, and April 1, 2016, respectively, at the redemption prices specified in the Notes’ respective indentures (together, the “Indentures”) plus accrued and unpaid interest. The Company may also redeem the Notes, in whole or in part, at the “make-whole” redemption prices specified in the Indentures plus accrued and unpaid interest at any time prior to October 1, 2014, October 1, 2015, and April 1, 2016 for the 2019 Notes, 2020 Notes, and 2021 Notes, respectively. In addition, the Company may redeem up to 35% of the 2019 Notes, 2020 Notes, and 2021 Notes prior to October 1, 2012, October 1, 2013, and April 1, 2014, respectively, under certain circumstances with the net cash proceeds from certain equity offerings.TheseHowever, as a result of the increase in credit ratings assigned to the Company's senior unsecured debt and release of credit facility collateral in December 2013 as described above, certain of the restrictive covenants are not currently applicable, including those limiting the Company’s ability to incur additional debt, pay dividends, make certain investments, engage in certain affiliate transactions, and sell certain assets, among others. In the event the Company's credit ratings are reduced below BBB- by S&P or Baa3 by Moody's or collateral is reinstated under the credit facility, such covenants would be restored. The indenture governing the 2023 Notes is less restrictive and contains covenants that, among others, limit the Company's ability to create liens securing certain indebtedness and consolidate, merge or transfer certain assets.as ofat December 31, 2010. The Notes are not subject to any mandatory redemption or sinking fund requirements. The2013. Two of the Company’s sole subsidiary,subsidiaries, Banner Pipeline Company, L.L.C. and CLR Asset Holdings, LLC, which hashave insignificant assets with no independent assets orcurrent value and no operations, fully and unconditionally guaranteesguarantee the Notes. Year ended December 31, 2010 2009 2008 In thousands) $ 12,545 $ 2,444 $ 13,465 308 107 — 12,853 2,551 13,465 78,769 35,302 164,928 (1,410 ) 817 19,187 77,359 36,119 184,115 $ 90,212 $ 38,670 $ 197,580 Year ended December 31, In thousands 2013 2012 2011 Current income tax provision: Federal $ 6,193 $ 9,191 $ 12,931 State 16 1,326 239 Total current income tax provision 6,209 10,517 13,170 Deferred income tax provision: Federal 403,002 383,157 212,406 State 39,619 22,137 32,797 Total deferred income tax provision 442,621 405,294 245,203 Total provision for income taxes $ 448,830 $ 415,811 $ 258,373 years ended December 31, 2010, 2009 and 2008. Year ended December 31, 2010 2009 2008 In thousands $ 90,463 $ 38,503 $ 181,486 (681 ) (108 ) 17,146 — — 15 430 275 (1,067 ) $ 90,212 $ 38,670 $ 197,580 Year ended December 31, In thousands 2013 2012 2011 Federal income tax provision at statutory rate (35%) $ 424,567 $ 404,319 $ 240,606 State income tax provision, net of Federal benefit 25,838 15,213 17,684 Other, net (1,575 ) (3,721 ) 83 Provision for income taxes $ 448,830 $ 415,811 $ 258,373 SubsidiaryStatements—continued20102013 and 20092012 are as follows: December 31, 2010 2009 In thousands $ 21,110 $ 794 603 788 21,713 1,582 20,772 11,352 43,030 — 24,095 12,758 4,394 2,421 92,291 26,531 675,132 515,390 — 382 675,132 515,772 582,841 489,241 $ 561,128 $ 487,659 December 31, In thousands 2013 2012 Current: Deferred tax assets (1) Non-cash losses on derivatives $ 33,029 $ — Other 2,288 2,413 Total current deferred tax assets 35,317 2,413 Deferred tax liabilities Other 645 2,048 Total current deferred tax liabilities 645 2,048 Net current deferred tax assets 34,672 365 Noncurrent: Deferred tax assets Net operating loss carryforwards 41,791 40,441 Non-cash losses on derivatives 2,975 — Alternative minimum tax carryforwards 38,689 27,380 Other 20,220 11,576 Total noncurrent deferred tax assets 103,675 79,397 Deferred tax liabilities Property and equipment 1,840,331 1,330,551 Other 156 11,422 Total noncurrent deferred tax liabilities 1,840,487 1,341,973 Net noncurrent deferred tax liabilities 1,736,812 1,262,576 Net deferred tax liabilities (2) $ 1,702,140 $ 1,262,211 (1) accompanying consolidated balance sheets contain receivables of $1.0$9.7 million and $3.0 million for overpaidprepaid income taxes at December 31, 20102013, with no such prepayments at December 31, 2012.(2) 2009, respectively.a decrease of $15.6 million related to the excess tax benefits of stock-based compensation.2010,2013, the Company had Federal net operating loss carryforwards of $20.9 million which will expire beginning in 2027 and state net operating loss carryforwards totaling $466$1.0 billion which will expire beginning in 2017.0 million which The carryforwards have expiration periods that vary according to state jurisdiction. Included in the net operating loss carryforward is an excess tax benefit related to stock-based compensation of $12.9 million ($4.9 million tax effected) for which the deferred tax asset cannot be recorded until the utilization of the NOL reduces current taxes payable. When recorded, the offsetting account will be additional paid-in capital. In addition, theThe Company has an alternative minimum tax credit carryforwardcarryforwards of $24.1$39 million and a that have no expiration date. Any available statutory depletion carryforward, whichcarryforwards will be recognized when realized, of $8.2 million, neither of which expires.realized. The Company files income tax returns in the U.S. Federal jurisdiction and various state jurisdictions. The earliest yearWith few exceptions, the Company is no longer subject to examination in each is 2005. However,U.S. Federal, state and local income tax examinations by tax authorities for years prior to May 15, 2007, the Company was an S corporation and any taxes for periods prior to that would be payable by the then existing shareholders.2010.expensespayments associated with the Company’s operating leases for the years ended December 31, 2010, 20092013, 2012 and 20082011 were $1.7$3.0 million $6.0, $2.2 million and $6.0$1.7 million respectively., respectively, a portion of which was capitalized and/or billed to other interest owners. At December 31, 2010,2013 the minimum future rental commitments under operating leases having initial or remaining non-cancelable lease terms in excess of one year are as follows: Total
amount In thousands $ 204 172 98 92 56 $ 622 Total amount In these years In thousands 2014 $ 1,954 2015 432 2016 346 2017 255 2018 151 Thereafter 182 Total obligations $ 3,320 Commitmentscommitments – As of December 31, 2010,2013, the Company had various drilling rig contracts with various terms extending through June 2012.January 2016. These contracts were entered into in the normalordinary course of business to ensure rig availability to allow the Company to execute its business objectives in its key strategic plays. These drilling commitments are not recorded in the accompanying consolidated balance sheets. Future commitments as of December 31, 20102013 total $80.8approximately $110 million, of which $74.3$83 million is for contracts that expireexpected to be incurred in 20112014, $26 million in 2015, and $6.5less than $1 million is for contracts that expire in 2012.2016.Continental Resources, Inc. and SubsidiaryNotes to Consolidated Financial Statements—continuedWell Stimulation Services Arrangement—On August 20, 2010, thewell stimulation service agreement– The Company entered intohas an agreement with a third party whereby the third party will provide, on a take-or-pay basis, hydraulic fracturing services and related equipment to service certain of the Company’s properties in North Dakota and Montana. The arrangement has a term of three years, beginningagreement, which expires in September 2010, with two one-year extensions available to2014, requires the Company at its discretion. Pursuant to the take-or-pay arrangement, the Company is to pay a fixed rate per day for a minimum number of days per calendar quarter over the three-year term regardless of whether or not the services are provided. The arrangementagreement also stipulates that the Company will bear the cost of certain products and materials used. Fixed commitments amount to $4.9 million per quarter, or $19.5 million annually, for total future commitments of $58.5 million over the three-year term. Future commitments remaining as of December 31, 20102013 amount to $53.6 million.approximately $16 million, which is expected to be incurred through September 2014.under this arrangement are not recorded in the accompanying consolidated balance sheets.which have Delivery Commitments.In 2010,5-year terms extending as far as November 2017, require the Company signed a throughput and deficiency agreement with a third partyto pay varying per-barrel transportation charges regardless of the amount of pipeline capacity used. Future commitments remaining as of December 31, 2013 under the operational crude oil pipeline company committingtransportation arrangements amount to ship 10,000 barrelsapproximately $43 million, of crude oil per day for five years at a tariff of $1.85 per barrel. The third party systemwhich $14 million is scheduledexpected to commence operations latebe incurred in the second quarter of 2011. 2014, $14 million in 2015, $10 million in 2016, and $5 million in 2017.will use thishas also entered into a commitment to guarantee pipeline access capacity on an operational natural gas pipeline system to move somea portion of its North region natural gas production to market. The commitment, which has a 10-year term ending in October 2023, requires the Company to pay per-unit transportation charges regardless of the amount of pipeline capacity used. Future commitments under the arrangement amount to approximately $24 million as of December 31, 2013, which is expected to be incurred ratably over its 10-year term.market.a joint tariff arrangement between an unaffiliated party and an affiliate controlled by the Company's principal shareholder as discussed in Employee retirement plan.Note 11. Related Party Transactions. These commitments represent aggregatemaintainshas entered into firm transportation commitments to guarantee capacity on rail transportation facilities in order to reduce the impact of possible production curtailments that may arise due to limited transportation capacity. The rail commitments have various terms extending through June 2014 and require the Company to pay varying per-barrel transportation charges regardless of the amount of rail capacity used. Future commitments remaining as of December 31, 2013 under the rail transportation arrangements amount to approximately $10 million, which is expected to be incurred through June 2014.defined contribution retirement plan forsignificant portion of its employeescapital expenditures. The Company is not committed under these contracts to deliver fixed and makes discretionary contributionsdeterminable quantities of crude oil or natural gas in the future.planCompany operates. This arrangement extends through January 2016 and requires the Company to make scheduled periodic payments based on a percentagethe projected total cost of each eligible employee’s compensation. During 2010, 2009the project and 2008, contributions to the plan were 5%progress of eligible employees’ compensation, excluding bonuses. Effective January 1, 2011,construction. Future commitments under the Company’s contributions to the plan represent 3%arrangement as of eligible employees’ compensation, including bonuses, in addition to matching 50% of eligible employees’ contributions up to 6%. Expense for the years ended December 31, 2013 total approximately $25 million, of which $15 million is expected to be incurred in 2014, $8 million in 2015, and $2 million in 2016. 2009 and 2008, was $1.4 million, $1.3 million and $1.1 million, respectively.Employee health claims. The Company self-insures employee health claims up to the first $125,000 per employee. The Company self-insures employee workers’ compensation claims up to the first $250,000 per employee. Any amounts paid above these levels are reinsured through third-party providers. The Company accrues for claims that have been incurred but not yet reported based on a review of claims filed versus expected claims based on claims history. At December 31, 2010 and 2009, the accrued liability for health and worker’s compensation claims was $1.6 million and $1.3 million, respectively.Litigation.On November 4, 2010, a putativean alleged class action was filed against the Company alleging the Company improperly deducted post-production costs from royalties paid to plaintiffs and other royalty interest owners as categorized in the petition from crude oil and natural gas wells located in Oklahoma. The plaintiffs have alleged a number of claims, including breach of contract, fraud, breach of fiduciary duty, unjust enrichment, and other claims and seek recovery of compensatory damages, interest, punitive damages and attorney fees on behalf of the putativealleged class. The Company has responded to the petition, and denied the allegations and raised a number of affirmative defenses. The actionDiscovery is in very preliminary stagesongoing and no discovery has been conducted. As such, theinformation and documents continue to be exchanged. The Company is not currently able to estimate a reasonably possible loss or range of loss or what impact, if any, the action will have on its financial condition, results of operations or cash flows.flows due to the preliminary status of the matter, the complexity and number of legal and factual issues presented by the matter and uncertainties with respect to, among other things, the nature of the claims and defenses, the potential size of the class, the scope and types of the properties and agreements involved, the production years involved, and the ultimate potential outcome of the matter. The class has not been certified. Plaintiffs have indicated that if the class is certified they may seek damages in excess of $165 million which may increase with the passage of time, a majority of which would be comprised of interest. The Company disputes plaintiffs’ claims, disputes that the case meets the requirements for a class action and is vigorously defending the case.such asincluding, but not limited to, commercial disputes, claims from royalty and surface owners, property damage claims, personal injury claims and similarother matters. While the outcome of these legal matters cannot be predicted with certainty, the Company does not expect them to have a material adverse effect on its financial condition, results of operations or cash flows. As of December 31, 20102013 and 2009,2012, the Company has recorded a liability inon the consolidated balance sheets under the caption “Other noncurrent liabilities” of $4.6$1.7 million and $4.3$2.4 million, respectively, for various matters, none of which are believed to be individually significant.Risk.risk – Due to the nature of the crude oil and natural gas business, the Company is exposed to possible environmental risks. The Company is not aware of any material environmental issues or claims.During the second quarter of 2010, the Company determined that an entity that had historically been accounted for as a related party no longer qualified for such treatment. Effective April 1, 2010, transactions with this entity are no longer reflected as affiliated transactions in the consolidated financial statements. The balance sheet at December 31, 2009 included $0.1 million from this party in “Receivables—Affiliated parties” and $6.4 million in “Payables to affiliated parties”. “Production expenses to affiliates” includes $1.8 million in expenses from this party for the year ended December 31, 2010, all of which was recognized in the first quarter of the year, and $8.0 million and $12.4 million in expenses from this party for the years ended December 31, 2009 and 2008, respectively.currently marketssells a portion of its natural gas salesproduction to an affiliate. Duringaffiliates. For the years ended December 31, 2010, 2009,2013, 2012, and 2008,2011, these sales were approximately $31.0amounted to $105.1 million, $26.6$61.7 million, and $64.7$53.5 million respectively. In November 2010,, respectively, and are included in the caption “Crude oil and natural gas sales to affiliates” in the consolidated statements of income. At December 31, 2013 and 2012, $12.7 millionentered into a new gas purchase agreement with this affiliate for the sale and subsequent processing and treatment of natural gas to be produced over the life of certain Continental leases located in North Dakota. The agreement was entered intofrom these affiliates, which is included in the normal course of business on terms that were no less favorable than termscaption “Receivables—Affiliated parties” in the consolidated balance sheets. could have achieved from an unaffiliated third party.Beginning in August 2010, the Company also engages in crude oil trades with an affiliate in orderfrom time to time to obtain space on various pipeline systems. These purchases orsystems in the Company's operating areas. For the years ended December 31, 2012, and 2011, crude oil sales are done withto the affiliate each monthtotaled the net amountno purchases being paid to, or receivedmade from the affiliate in 2011. The Company incurred $2.2 million, $2.7 million, and $1.4 million in transportation and gathering expenses in 2013, 2012, and 2011, respectively, associated with these transactions. At both December 31, 2013 and 2012, $0.2 million was due from the following month. The total barrels soldCompany to the affiliate in 2010 amounted to 104,000 barrels for $7.3 million and the total barrels purchased from the affiliate in 2010 were 15,000 barrels for $1.2 million. The Company incurred $531,000 in expenses in 2010 associated with these transactions.Continental Resources, Inc. and SubsidiaryNotestransactions, which is included in the caption “Payables to Consolidated Financial Statements—continuedaffiliated parties” in the consolidated balance sheets. also contracts for field services such as compression and drilling rig services and purchases residue fuel gas and reclaimed crude oil from certain affiliates. The Company capitalized costs of $5.7 million, $5.0 million and $4.1 million in 2013, 2012, and 2011, respectively, associated with drilling rig services provided by an affiliate. Production and other expenses attributable to these affiliates was $6.6affiliate transactions were $1.4 million $16.5, $2.0 million and $20.7$4.6 million for the years ended December 31, 2010, 20092013, 2012, and 2008,2011, respectively. The total amount paid to these affiliates, a portion of which was billed to other interest owners, was approximately $30.8$48.5 million $90.4, $32.7 million and $104.1$30.8 million during for the years ended December 31, 2010, 20092013, 2012, and 2008,2011, respectively. The Company also received $146,000 in the first quarter of 2010 and $428,000 in 2009 from a former affiliate for saltwater disposal fees. Under a contract for natural gas sales to an affiliate, the Company pays forincurred gathering and treatingtreatment fees which amounted to $5.5$4.7 million in 2010, $4.52013, $4.7 million in 20092012 and $1.0$4.6 million in 2008.2011. At December 31, 20102013 and 2009, approximately $20.22012, $5.1 million and $7.8$5.6 million was due from affiliates and approximately $4.4 million and $9.6 million, respectively, was due to these affiliates respectively.approximately $17.7$2.3 million $11.3, $38.3 million, and $16.7$46.8 million and received payments from these affiliates of $20.9$1.3 million $15.9, $38.5 million, and $14.2$67.5 million during the years ended December 31, 2010, 2009,2013, 2012, and 2008,2011, respectively, relating to these affiliates.the operations of the respective properties. The Company also paid to these affiliates $48,000$277,000 in 20102012 and $508,000$4,900 in 20092011 for their share of proceeds from undeveloped leasehold sales.Thesales, with no such payments in 2013. At December 31, 2013 and 2012, leasesleased office space under an operating lease from an entity owned by the Company’s principal shareholder. The Company pays approximately $86,000 each month for the office space. Rents paid associated with this leasethe leases totaled approximately $983,000, $921,000$0.7 million and $804,000$1.0 million for the years ended December 31, 2010, 20092012 and 2008,2011, respectively.termCompany allows certain affiliates to use its corporate aircraft and crews and has used the aircraft and crews of those same affiliates from time to time in order to facilitate efficient transportation of Company personnel. The rates charged between the parties vary by type of aircraft used. For usage during 2013, 2012, and 2011, the Company charged affiliates approximately $55,000, $112,000, and $235,000, respectively, for use of its corporate aircraft, crews and fuel and training costs and received $379,000 from the affiliate in 2013 for certain current and prior year charges. The Company was charged $51,000, $102,000, and $88,000, respectively, by affiliates for use of their aircraft and crews during 2013, 2012, and 2011 and paid $238,000 to the affiliates in 2013 for certain current and prior year charges.lease continues through February 2012.and restricted stock to employees and directors pursuant to the Continental Resources, Inc. 2000 Stock Option Plan (“2000 Plan”) and restricted stock to employees and directors pursuant to the Continental Resources, Inc. 2005 Long-Term Incentive Plan (“2005 Plan”) and 2013 Long-Term Incentive Plan ("2013 Plan") as discussed below. The Company’s associated compensation expense, which is included in the caption “General and administrative expenses” in the consolidated statements of income, is reflected in the table below for the periods presented. Year ended December 31, 2010 2009 2008 In thousands $ 11,691 $ 11,408 $ 9,081 Year ended December 31, In thousands 2013 2012 2011 Non-cash equity compensation $ 39,890 $ 29,057 $ 16,572 Options These grants consisted of either incentive stock options, nonqualified stock options or a combination of both. The granted stock options vest ratably over either a three or five-year period commencing on the first anniversary of the grant date and expire ten years from date of grant. On November 10, 2005, the 2000 Plan was terminated. As of DecemberMarch 31, 2010,2012, all options covering 2,208,693 sharesissued under the 2000 Plan had been exercised and 538,373 had been canceled.Company’sfollowing table summarizes stock option activity under the 2000 Plan from December 31, 2007 to December 31, 2010 is presented below: Outstanding Exercisable Number of
options Weighted
average
exercise
price Number of
options Weighted
average
exercise
price 886,527 $ 2.28 794,853 $ 1.88 (436,327 ) 3.31 450,200 1.28 450,200 1.28 (138,010 ) 1.78 312,190 1.06 312,190 1.06 (207,220 ) 1.24 104,970 0.71 104,970 0.71 Outstanding Exercisable Outstanding at December 31, 2010 104,970 $ 0.71 104,970 $ 0.71 Exercised (18,470 ) $ 0.71 Outstanding at December 31, 2011 86,500 $ 0.71 86,500 $ 0.71 Exercised (86,500 ) $ 0.71 Outstanding at December 31, 2012 — — — — Continental Resources, Inc. and SubsidiaryNotes to Consolidated Financial Statements—continued2010, 20092012 and 20082011 was $8.9$7.6 million $5.3 and $1.1 million and $15.1 million,, respectively. At December 31, 2010, all options were exercisable and hadweighted average life of 1.25 years with an aggregate intrinsic value of $6.1 million.Restricted StockOn October 3, 2005,broad-based incentive plan that allows the Company adoptedto use, if desired, a variety of equity compensation alternatives in structuring compensation arrangements for the Company's officers, directors and select employees. Effective May 23, 2013, the 2013 Plan replaced the Company's 2005 Plan as the instrument used to grant long-term incentive awards and no further awards will be granted under the 2005 Plan. However, restricted stock awards granted under the 2005 Plan and reserved aprior to the adoption of the 2013 Plan will remain outstanding in accordance with their terms. 5,500,000 shares of common stock available for issuance under the 2013 Plan is 9,840,036 shares, which includes (i) 7,500,000 new shares authorized under the 2013 Plan, (ii) 1,840,036 shares that may be issued pursuantremained available for issuance under the 2005 Plan as of March 27, 2013 that have been transferred from the 2005 Plan to the 2013 Plan, and (iii) up to 500,000 shares available for issuance under the 2013 Plan to the extent such shares are forfeited or withheld for payment of income taxes related to existing awards outstanding under the 2005 Plan. The Company began issuing shares of restricted stock to employees and non-employee directors in October 2005. As of December 31, 2010,2013, the Company had 2,998,348a maximum of 9,813,989 shares of restricted stock available to grant to officers, directors officers and keyselect employees under the 20052013 Plan. except for the right of disposal, constitutes issued and outstanding shares of the Company’s common stock for all corporate purposes during the period of restriction includingand, except as otherwise provided under the 2013 Plan or agreement relevant to a given award, includes the right to vote the restricted stock or to receive dividends, subject to forfeiture. Restricted stock grants generally vest over periods ranging from one to three years.the non-vested restricted shares for the period offrom December 31, 20072010 to December 31, 20102013 is presented below: Number of
non-vested
shares Weighted
average
grant-
date
fair value 1,047,706 $ 18.36 461,120 28.93 (369,091 ) 13.93 (28,843 ) 25.05 1,110,892 24.05 411,217 28.94 (369,784 ) 22.00 (25,504 ) 21.98 1,126,821 26.55 449,114 48.71 (412,143 ) 25.50 (55,715 ) 30.52 1,108,077 35.72 Number of
non-vested
shares Weighted
average
grant-date
fair valueNon-vested restricted shares at December 31, 2010 1,108,077 $ 35.72 Granted 491,315 63.59 Vested (359,601 ) 29.95 Forfeited (41,447 ) 41.93 Non-vested restricted shares at December 31, 2011 1,198,344 $ 48.66 Granted 916,028 73.46 Vested (444,723 ) 45.25 Forfeited (40,187 ) 59.05 Non-vested restricted shares at December 31, 2012 1,629,462 $ 63.28 Granted 261,259 97.95 Vested (464,809 ) 47.30 Forfeited (68,756 ) 71.91 Non-vested restricted shares at December 31, 2013 1,357,156 $ 74.99 average of the high and low intradayclosing market pricesprice of the Company’s common stock on the date of grant. Compensation expense for a restricted stock grant is a fixed amount determined at the grant date fair value and is recognized ratably over the vesting period as services are rendered by employees.employees and directors. The expected life of restricted stock is based on the non-vested period that remains subsequent to the date of grant. There are no post-vesting restrictions related to the Company’s restricted stock. The fair value of the restricted stock that vested during 2010, 20092013, 2012 and 20082011 at the vesting date was $19.7$49.4 million $13.3, $33.0 million and $11.1$19.9 million, respectively. As of December 31, 2010,2013, there was $28.2approximately $55 million of unrecognized compensation expense related to non-vested restricted stock. TheThis expense is expected to be recognized ratably over a weighted average period of 1.71.5 years.Asset DispositionJune 2010,December 2012, the Company acquired certain producing and undeveloped properties in the Bakken play of North Dakota from a third party for $663.3 million, of which $477.1 million was allocated to producing properties. In the transaction, the Company acquired interests in approximately 119,000 net acres as well as producing properties with production of approximately 6,500 net barrels of oil equivalent per day.certain non-strategic leaseholds locatedits producing crude oil and natural gas properties and supporting assets in DeSoto Parish, Louisianaits East region to a third party with an effective date of June 18, 2010. Total cash proceeds amounted to $35.4 million.for $126.4 million. In connection with the sale,transaction, the Company recognized a pre-tax gain of $31.7 million.$68.0 million, which included the effect of removing $8.3 million of asset retirement obligations for the disposed properties previously recognized by the Company that were assumed by the buyer. The sale involvedtransaction excluded a portion of the Company’s non-producing leasehold acreage in the East region, which was retained by the Company for future exploration and development opportunities. The transaction also allowed for the Company to retain an overriding royalty interest in certain of the disposed properties as well as rights to drill in potential unproven deeper formations that may exist below the disposed properties. The disposed properties represented an immaterial portion of the Company’s total proved reserves, production, and revenues.usedentered into a Reorganization and Purchase and Sale Agreement (the “Agreement”) with Wheatland Oil Inc. ("Wheatland") and the proceeds fromshareholders of Wheatland. Wheatland is owned 75% by the saleRevocable Inter Vivos Trust of Harold G. Hamm, a trust of which Harold G. Hamm, the Company’s Chief Executive Officer, Chairman of the Board and principal shareholder is the trustee and sole beneficiary, and 25% by the Company’s Vice Chairman of Strategic Growth Initiatives, Jeffrey B. Hume. The Agreement provided for the acquisition by the Company, through the issuance of shares of the Company’s common stock, of all of Wheatland’s right, title and interest in and to fund a portioncertain crude oil and natural gas properties and related assets, in which the Company also owned an interest, in the states of Mississippi, Montana, North Dakota and Oklahoma and the assumption of certain liabilities related thereto.2010 capital expenditures program.SubsidiaryStatements—continued14.Statements2010, 20092013, 2012 and 2008. Year ended December 31, 2010 2009 2008 In thousands $ 948,524 $ 610,698 $ 939,906 (93,203 ) (93,242 ) (101,635 ) (76,659 ) (45,645 ) (58,610 ) (12,763 ) (12,615 ) (40,160 ) (239,748 ) (204,489 ) (146,208 ) (64,951 ) (83,694 ) (28,847 ) (175,256 ) (64,985 ) (214,489 ) $ 285,944 $ 106,028 $ 349,957 Year ended December 31, In thousands 2013 2012 2011 Crude oil and natural gas sales $ 3,606,774 $ 2,379,433 $ 1,647,419 Production expenses (282,197 ) (195,440 ) (138,236 ) Production taxes and other expenses (332,130 ) (228,438 ) (144,810 ) Exploration expenses (34,947 ) (23,507 ) (27,920 ) Depreciation, depletion, amortization and accretion (953,796 ) (683,207 ) (384,301 ) Property impairments (220,508 ) (122,274 ) (108,458 ) Income taxes (659,783 ) (428,095 ) $ (321,447 ) Results from crude oil and natural gas producing activities $ 1,123,413 $ 698,472 $ 522,247 2010, 20092013, 2012 and 20082011 are shownpresented below: Year ended December 31, 2010 2009 2008 In thousands $ 7,338 $ 1,217 $ 74,663 340,064 73,273 199,621 347,402 74,490 274,284 289,175 96,440 235,263 565,551 260,407 471,820 $ 1,202,128 $ 431,337 $ 981,367 Year ended December 31, In thousands 2013 2012 2011 Property Acquisition Costs: Proved $ 16,604 $ 738,415 $ 65,315 Unproved 546,881 745,601 183,247 Total property acquisition costs 563,485 1,484,016 248,562 Exploration Costs 687,767 857,681 734,797 Development Costs 2,549,203 1,975,660 1,178,136 Total $ 3,800,455 $ 4,317,357 $ 2,161,495 $581,000, $368,000$1.8 million, $3.3 million and $687,000$1.7 million and development costs above include asset retirement costs of $4,670,000, $859,000$6.0 million, $1.0 million and $3,252,000$3.7 million for the years ended December 31, 2010, 20092013, 2012 and 2008,2011, respectively.20102013 and 20092012 are as follows: December 31, 2010 2009 In thousands $ 3,431,628 $ 2,592,712 547,077 271,910 3,978,705 2,864,622 (1,059,315 ) (826,593 ) $ 2,919,390 $ 2,038,029 December 31, In thousands 2013 2012 Proved crude oil and natural gas properties $ 12,423,878 $ 8,980,505 Unproved crude oil and natural gas properties 1,181,268 1,073,944 Total 13,605,146 10,054,449 Less accumulated depreciation, depletion and amortization (3,083,180 ) (2,090,845 ) Net capitalized costs $ 10,521,966 $ 7,963,604 determinesattempts to determine whether the well has discovered crude oil and natural gas reserves and, if so, whether those reserves can be classified as proved.proved reserves. Often, the determination of whether proved reserves can be recorded under SEC guidelines cannot be made when drilling is completed. In those situations where management believes that economicallyinon the consolidated statements of income as dry hole costs, a component of “Exploration expenses”. Where sufficient hydrocarbons have been discovered to justify further exploration or appraisal activities, exploratory drilling costs are deferred inunder the caption “Net property and equipment” on the consolidated balance sheets pending the outcome of those activities.Continental Resources, Inc. and SubsidiaryNotes to Consolidated Financial Statements—continuedperiod. Year Ended December 31, 2010 2009 2008 In thousands $ 22,856 $ 46,274 $ 32,936 185,713 50,765 151,301 (112,739 ) (67,706 ) (117,958 ) (3,024 ) (6,477 ) (20,005 ) $ 92,806 $ 22,856 $ 46,274 87 20 56 15. Year ended December 31, In thousands 2013 2012 2011 Balance at January 1 $ 92,699 $ 128,123 $ 92,806 Additions to capitalized exploratory well costs pending determination of proved reserves 548,933 485,530 500,046 Reclassification to proved crude oil and natural gas properties based on the determination of proved reserves (479,507 ) (520,187 ) (456,780 ) Capitalized exploratory well costs charged to expense (9,350 ) (767 ) (7,949 ) Balance at December 31 $ 152,775 $ 92,699 $ 128,123 Number of gross wells 67 46 56 94%99%, 90%99%, and 83%96% of the Company’s discounted future net cash flows (PV-10) as of December 31, 2010, 2009,2013, 2012, and 2008,2011, respectively. Properties comprising 97%99% of proved crude oil reserves and 94% of proved natural gas reserves were evaluated by Ryder Scott as of December 31, 2010.2013. Remaining reserve estimates were prepared by the Company’s internal technical staff. All reserves stated herein are located in the United States. We adopted the provisions of the amendments onModernization of Oil and Gas Reporting for the year ended December 31, 2009. Such amendments increased the disclosures required regarding the Company’s reserves, changed the definition of proved reserves and changed the pricing assumptions.operating conditions.government regulations prior to the time at which contracts providing the right to operate expire, unless evidence indicates renewal is reasonably certain. There are numerous uncertainties inherent in estimating quantities of proved crude oil and natural gas reserves. Crude oil and natural gas reserve engineering is a subjective process of estimating underground accumulations of crude oil and natural gas that cannot be precisely measured, and estimates of engineers other than the Company’s might differ materially from the estimates set forth herein. The accuracy of any reserve estimate is a function of the quality of available data and of engineering and geological interpretation and judgment. Results of drilling, testing and production subsequentPeriodic revisions to the dateestimated reserves and future cash flows may be necessary as a result of the estimate may justify revisiona number of such estimate.factors, including reservoir performance, new drilling, crude oil and natural gas prices, changes in costs, technological advances, new geological or geophysical data, or other economic factors. Accordingly, reserve estimates are often differentmay differ significantly from the quantities of crude oil and natural gas that are ultimately recovered.20102013, 2012 and 20092011 were computed using the 12-month unweighted average of the first-day-of-the-month commodity prices as required by the new SEC rules. Reserves at December 31, 2008 were computed using year-end commodity prices pursuant to previous SEC rules.2010, 20092013, 2012 and 20082011 were not material and have not been included in the reserve estimates.SubsidiaryStatements—continued Crude Oil
(MBbls) Natural Gas
(MMcf) Total
(MBoe)Proved reserves as of December 31, 2010 224,784 839,568 364,712 Revisions of previous estimates 28,607 (158,219 ) 2,237 Extensions, discoveries and other additions 87,465 447,098 161,981 Production (16,469 ) (36,671 ) (22,581 ) Sales of minerals in place — — — Purchases of minerals in place 1,746 2,056 2,089 Proved reserves as of December 31, 2011 326,133 1,093,832 508,438 Revisions of previous estimates 33,272 (174,736 ) 4,149 Extensions, discoveries and other additions 166,844 400,848 233,652 Production (25,070 ) (63,875 ) (35,716 ) Sales of minerals in place (7,165 ) (4,046 ) (7,838 ) Purchases of minerals in place 67,149 89,061 81,992 Proved reserves as of December 31, 2012 561,163 1,341,084 784,677 Revisions of previous estimates (55,783 ) (241,623 ) (96,054 ) Extensions, discoveries and other additions 267,009 1,065,870 444,654 Production (34,989 ) (87,730 ) (49,610 ) Sales of minerals in place — — — Purchases of minerals in place 388 419 458 Proved reserves as of December 31, 2013 737,788 2,078,020 1,084,125 Crude Oil
(MBbls) Natural Gas
(MMcf) 104,145 182,819 (10,527 ) (16,179 ) 19,765 167,288 (9,147 ) (17,151 ) — — 2,003 1,361 106,239 318,138 1,609 (2,485 ) 75,450 210,029 (10,022 ) (21,606 ) — — 4 4 173,280 504,080 14,414 79,285 48,542 280,146 (11,820 ) (23,943 ) — — 368 — 224,784 839,568 Revisions. Revisions represent changes in previous reserve estimates, either upward or downward, resulting from new information normally obtained from development drilling and production history or resulting from a change in economic factors, such as commodity prices, operating costs or development costs. Revisionsyearyears ended December 31, 2008 were primarily due to lower commodity prices at the end of 2008 compared to 2007. Revisions for the year ended December 31, 20102011 and 2012 were due to better than anticipated production performance, andwith 2011 revisions also being positively impacted by higher average commodity prices throughout 20102011 as compared to 2009.that resultresulting from (1) extension of the proved acreage of previously discovered reservoirs through additional drilling in periods subsequent to discovery and (2) discovery of new fields with proved reserves or of new reservoirs of proved reserves in old fields.the year ended December 31, 2009 include increases in proved undeveloped locations as a resulteach of the changethree years reflected in the SEC’s rules in 2009 to allow producers to report additional undrilled locations beyond one offset on each side of a producing well where there is reasonable certainty of economic producibility. Extensions, discoveries and other additions for the year ended December 31, 2010table above were primarily due to increases in proved reserves associated with our successful drilling activity and strong production growth in the Bakken fieldfield. Proved reserve additions in North Dakota.The increase in 2009 reserves described above had an effect on our depreciation, depletionthe Bakken totaled 227 MMBo and amortization, net income and earnings per share for the fourth quarter of 2009 and293 Bcf (276 MMBoe) for the year 2010. Other thanended December 31, 2013. Additionally, 2013 extensions and discoveries were significantly impacted by successful drilling results in the effectemerging SCOOP play, resulting in 36 MMBo and 730 Bcf (158 MMBoe) of proved reserve additions during the changeyear. Significant progress continued to be made in pricing methodology had on2013 in developing and expanding the Company's Bakken and SCOOP assets, both laterally and vertically, through strategic exploration, development, planning and technology.as discussed above,resulting from the disposition of properties during a period. During the year ended December 31, 2012, the Company is unable to estimatedisposed of certain non-strategic properties in Oklahoma, Wyoming, and the effectEast region. See Note 13. Property Acquisitions and Dispositions for further discussion of the remaining changes on 2009 becauseCompany’s 2012 dispositions.comparative reserve report prepared underperiod. Purchases for the previous rules does not exist.2008, 20092013, 2012 and 2010: December 31, Crude
Oil
(MBbls) Natural
Gas
(MMcf) Crude Oil
Equivalents
(MBoe) 2008 80,387 153,536 105,976 2009 85,270 169,782 113,567 2010 101,272 234,699 140,389 2008 25,852 164,602 53,286 2009 88,010 334,298 143,726 2010 123,512 604,869 224,323 December 31, 2013 2012 2011 Proved Developed Reserves Crude oil (MBbl) 278,630 226,870 145,024 Natural Gas (MMcf) 768,969 545,499 361,265 Total (MBoe) 406,792 317,786 205,235 Proved Undeveloped Reserves Crude oil (MBbl) 459,158 334,293 181,109 Natural Gas (MMcf) 1,309,051 795,585 732,567 Total (MBoe) 677,333 466,891 303,203 Total Proved Reserves Crude oil (MBbl) 737,788 561,163 326,133 Natural Gas (MMcf) 2,078,020 1,341,084 1,093,832 Total (MBoe) 1,084,125 784,677 508,438 proved reserves expected to be recovered through existing wells with existing equipment and operating methods. Proved undeveloped reserves are proved reserves that require incremental capital expenditures to recover. Natural gas is converted to barrels of crude oil equivalent using a conversion factor of six thousand cubic feet per barrel of crude oil based on the average equivalent energy content of natural gas compared to crude oil. for the period January to December (for 2009 and 2010) or year-end commodity prices (for 2008), the costs in effect at December 31 of each year and a 10% discount factor. The Company cautions that actual future net cash flows may vary considerably from these estimates. Although the Company’s estimates of total proved reserves, development costs and production rates were based on the best available information, the development and production of the crude oil and natural gas reserves mayContinental Resources, Inc. and SubsidiaryNotes to Consolidated Financial Statements—continued2010, 20092013, 2012 and 2008. December 31, 2010 2009 2008 In thousands $ 20,420,667 $ 10,993,595 $ 5,777,441 (4,931,251 ) (3,190,748 ) (1,993,888 ) (3,517,389 ) (2,045,242 ) (663,497 ) (2,890,644 ) (1,268,119 ) (703,329 ) 9,081,383 4,489,486 2,416,727 (5,296,061 ) (2,647,946 ) (1,139,626 ) $ 3,785,322 $ 1,841,540 $ 1,277,101 December 31, In thousands 2013 2012 2011 Future cash inflows $ 78,646,274 $ 54,362,574 $ 35,042,916 Future production costs (21,333,460 ) (13,103,469 ) (7,495,552 ) Future development and abandonment costs (10,250,789 ) (8,295,130 ) (5,073,043 ) Future income taxes (12,447,127 ) (8,500,766 ) (5,956,615 ) Future net cash flows 34,614,898 24,463,209 16,517,706 10% annual discount for estimated timing of cash flows (18,319,131 ) (13,282,852 ) (9,012,350 ) Standardized measure of discounted future net cash flows $ 16,295,767 $ 11,180,357 $ 7,505,356 (net of(adjusted for location and quality differentials) utilized in the computation of future cash inflows was $71.92, $52.76,$91.50, $86.56, and $39.69$88.71 per barrel at December 31, 2010, 20092013, 2012 and 2008,2011, respectively. The weighted average natural gas price (net of(adjusted for location and quality differentials) utilized in the computation of future cash inflows was $5.07, $3.67,$5.36, $4.31, and $4.90$5.59 per Mcf at December 31, 2010, 20092013, 2012 and 2008,2011, respectively. Future cash flows are reduced by estimated future costs to develop and to produce the proved reserves, as well as certain abandonment costs, based on year-end cost estimates assuming continuation of existing economic conditions. The expected tax benefits to be realized from the utilization of net operating loss carryforwards and known tax credits are used in the computation of future income tax cash flows. December 31, 2010 2009 2008 In thousands $ 1,841,540 $ 1,277,101 $ 2,582,339 926,938 458,352 276,774 490,563 38,360 (169,605 ) (376,848 ) 23,136 (55,793 ) 8,022 78 115,711 1,177,446 417,739 (1,981,977 ) 184,154 127,710 258,234 (778,662 ) (471,811 ) (779,661 ) 356,992 125,048 305,028 397,669 4,082 26,732 (442,492 ) (158,255 ) 699,319 1,943,782 564,439 (1,305,238 ) $ 3,785,322 $ 1,841,540 $ 1,277,101 December 31, In thousands 2013 2012 2011 Standardized measure of discounted future net cash flows at January 1 $ 11,180,357 $ 7,505,356 $ 3,785,322 Extensions, discoveries and improved recoveries, less related costs 6,613,665 3,724,136 2,276,355 Revisions of previous quantity estimates (1,765,300 ) 254,493 133,990 Changes in estimated future development and abandonment costs 1,942,585 (298,148 ) (70,219 ) Purchases (sales) of minerals in place, net 12,012 1,171,047 56,246 Net change in prices and production costs 263,541 (530,515 ) 1,855,532 Accretion of discount 1,118,036 750,536 378,532 Sales of crude oil and natural gas produced, net of production costs (2,992,447 ) (1,955,555 ) (1,364,373 ) Development costs incurred during the period 1,210,223 1,095,156 528,737 Change in timing of estimated future production and other 464,111 (102,519 ) 773,279 Change in income taxes (1,751,016 ) (433,630 ) (848,045 ) Net change 5,115,410 3,675,001 3,720,034 Standardized measure of discounted future net cash flows at December 31 $ 16,295,767 $ 11,180,357 $ 7,505,356 SubsidiaryStatements—continued16.Statements20102013 and 20092012 is summarized below. Quarter ended March 31 June 30 September 30 December 31 In thousands, except per share data $ 248,268 $ 279,968 $ 219,450 $ 91,379 $ 26,344 $ 55,465 $ (24,183 ) $ (188,388 ) $ 124,529 $ 176,323 $ 76,356 $ (66,887 ) $ 72,465 $ 101,741 $ 39,077 $ (45,028 ) $ 0.43 $ 0.60 $ 0.23 $ (0.27 ) $ 0.43 $ 0.60 $ 0.23 $ (0.27 ) $ 96,608 $ 151,761 $ 170,204 $ 207,638 $ — $ 890 $ (2,105 ) $ (305 ) $ (38,432 ) $ 26,181 $ 59,286 $ 85,253 $ (26,613 ) $ 13,508 $ 34,929 $ 49,514 $ (0.16 ) $ 0.08 $ 0.21 $ 0.29 $ (0.16 ) $ 0.08 $ 0.21 $ 0.29 Quarter ended In thousands, except per share data March 31 June 30 September 30 December 31 2013 Total revenues (1) $ 710,229 $ 1,100,752 $ 823,835 $ 820,334 Gain (loss) on derivative instruments, net (1) $ (84,831 ) $ 199,056 $ (203,774 ) $ (102,202 ) Income from operations $ 270,146 $ 573,872 $ 328,043 $ 273,706 Net income $ 140,627 $ 323,270 $ 167,498 $ 132,824 Net income per share: Basic $ 0.76 $ 1.76 $ 0.91 $ 0.72 Diluted $ 0.76 $ 1.75 $ 0.91 $ 0.72 2012 Total revenues (1) $ 395,100 $ 1,004,719 $ 483,729 $ 688,972 Gain (loss) on derivative instruments, net (1) $ (169,057 ) $ 471,728 $ (158,294 ) $ 9,639 Income from operations $ 135,591 $ 686,474 $ 105,522 $ 365,220 Net income $ 69,094 $ 405,684 $ 44,096 $ 220,511 Net income per share: Basic $ 0.38 $ 2.26 $ 0.24 $ 1.20 Diluted $ 0.38 $ 2.25 $ 0.24 $ 1.19 (1) Gains and losses on mark-to-market derivative instruments are reflected in “Total revenues” inon both the consolidated statements of income and this table of unaudited quarterly financial data. Derivative gains and losses have been shown separately to illustrate the fluctuations in revenues that are attributable to the Company’s derivative instruments. Commodity price fluctuations each quarter can result in significant swings in mark-to-market gains and losses, which affects comparability between periods.Item 9. Changes in and Disagreements with Accountants on Accounting and Financial Disclosure Item 9A. Controls and Procedures Act)Act of 1934, as amended (the “Exchange Act”)) was performed under the supervision and with the participation of the Company’s management, including its Chief Executive Officer and Chief Financial Officer. Based on that evaluation, our Chief Executive Officer and Chief Financial Officer concluded that the Company’s disclosure controls and procedures were effective as of December 31, 20102013 to ensure that information required to be disclosed in the reports it files and submits under the Securities Exchange Act of 1934 is recorded, processed, summarized and reported within the time periods specified in the SEC’s rules and forms and that information that is required to be disclosed under the Exchange Act is accumulated and communicated to the Company’s management, including ourits Chief Executive Officer and our Chief Financial Officer, as appropriate to allow timely decisions regarding required disclosure.2010.2013.20102013 has been audited by Grant Thornton LLP, an independent registered public accounting firm, as stated in their report that follows.Subsidiary’sSubsidiaries (the Company) internal control over financial reporting“Company”) as of December 31, 2010,2013, based on criteria established in the 1992 Internal Control—Integrated Framework issued by the Committee of Sponsoring Organizations of the Treadway Commission (COSO). The Company’s management is responsible for maintaining effective internal control over financial reporting and for its assessment of the effectiveness of internal control over financial reporting, included in the accompanyingManagement’s Report on Internal Control Over Financial Reporting. Our responsibility is to express an opinion on the Company’s internal control over financial reporting based on our audit.Continental Resources, Inc. and Subsidiarythe Company maintained, in all material respects, effective internal control over financial reporting as of December 31, 2010,2013, based on criteria established in the 1992 Internal Control—Integrated Framework issued by COSO.balance sheetsfinancial statements of Continental Resources, Inc. and Subsidiarythe Company as of December 31, 2010 and 2009, andfor the related consolidated statements of income, shareholders’ equity and cash flows for each of the three years in the periodyear ended December 31, 20102013, and our report dated February 25, 2011,26, 2014 expressed an unqualified opinion./s/ GRANT THORNTON LLPOklahoma City, OklahomaFebruary 25, 2011Changes in Internal Control over Financial ReportingAs of the end of the period covered by this report, we carried out an evaluation, under the supervision and with the participation of our Chief Executive Officer and Chief Financial Officer, of our internal control overopinion on those financial reporting to determine whether any changes occurred during the fourth quarter of 2010 that have materially affected, or are reasonably likely to materially affect, our internal control over financial reporting. Based on that evaluation, there were no changes in our internal control over financial reporting or in other factors during the fourth quarter of 2010 that have materially affected or are reasonably likely to materially affect our internal control over financial reporting./s/ GRANT THORNTON LLP Oklahoma City, Oklahoma February 26, 2014 Item 9B. Other Information Item 10. Directors, Executive Officers and Corporate Governance 2011May 2014 (the “Annual Meeting”) and is incorporated herein by reference.Item 11. Executive Compensation Item 12. Security Ownership of Certain Beneficial Owners and Management and Related Stockholder Matters Item 13. Certain Relationships and Related Transactions, and Director Independence Item 14. Principal Accounting Fees and Services Item 15. Exhibits, and Financial Statement SchedulesConsolidated Financial Statementsconsolidated financial statements of Continental Resources, Inc. and Subsidiaries and the Report of Independent Registered Public Accounting Firm are included in Part II, Item 8 of this report beginning on page 57.(3)Index to Exhibits3.1 Third Amended and Restated Certificate of Incorporation of Continental Resources, Inc. filed February 24, 2012 as Exhibit 3.1 to the Company’s 2011 Form 10-K (Commission File No. 001-32886) and incorporated herein by reference. 3.2 Third Amended and Restated Bylaws of Continental Resources, Inc. filed as Exhibit 3.1 to the Company’s Current Report on Form 8-K (Commission File No. 001-32886) filed May 22, 2007November 6, 2012 and incorporated herein by reference. 3.24.1 Second AmendedRegistration Rights Agreement dated as of May 18, 2007 by and Restated Bylaws ofamong Continental Resources, Inc., the Revocable Inter Vivos Trust of Harold G. Hamm, the Harold Hamm DST Trust and the Harold Hamm HJ Trust filed February 24, 2012 as Exhibit 3.24.1 to the Company’s Current Report on2011 Form 8-K10-K (Commission File No. 001-32886) filed May 22, 2007 and incorporated herein by reference. 4.1Registration Rights Agreement filed as Exhibit 10.1 to the Company’s Current Report on Form 8-K (Commission File No. 001-32886) filed May 22, 2007 and incorporated herein by reference.4.2 Specimen Common Stock Certificate filed as Exhibit 4.1 to the Company’s Registration Statement on Form S-1 (Commission File No. 333-132257) filed April 14, 2006 and incorporated herein by reference. 4.3 Indenture dated as of September 23, 2009 among Continental Resources, Inc., Banner Pipeline Company, L.L.C. and Wilmington Trust FSB, as trustee, filed as Exhibit 4.1 to the Company’s Current Report on Form 8-K (Commission File No. 001-32886) filed September 24, 2009 and incorporated herein by reference. 4.4 Indenture dated as of April 5, 2010 among Continental Resources, Inc., Banner Pipeline Company, L.L.C. and Wilmington Trust FSB, as trustee, filed as Exhibit 4.1 to the Company’s Current Report on Form 8-K (Commission File No. 001-32886) filed April 7, 2010 and incorporated herein by reference. 4.5 Indenture dated as of September 16, 2010 among Continental Resources, Inc., Banner Pipeline Company, L.L.C. and Wilmington Trust FSB, as trustee, filed as Exhibit 4.1 to the Company’s Current Report on Form 8-K (Commission File No. 001-32886) filed September 17, 2010 and incorporated herein by reference. 4.6 Registration Rights AgreementIndenture dated as of September 16, 2010March 8, 2012 among Continental Resources, Inc., Banner Pipeline Company, L.L.C. and the Initial Purchasers named therein,Wilmington Trust, National Association, as trustee, filed as Exhibit 4.24.1 to the Company’s Current Report on Form 8-K (Commission File No. 001-32886) filed September 17, 2010March 8, 2012 and incorporated herein by reference.10.1 Strategic Customer Relationship Agreement4.7 Indenture dated as of April 5, 2013 among Complete Energy Services, Inc., CES Mid-Continent Hamm, Inc. and Continental Resources, Inc. dated October 14, 2004 (incorporated by reference to Exhibit 10.12 to the Registration Statement on Form S-1 of Complete Production Services, Inc. filed on November 15, 2005, Commission File No. 333-128750).10.2†Continental Resources, Inc. 2000 Stock Option Plan, Banner Pipeline Company, L.L.C., CLR Asset Holdings, LLC and Wilmington Trust, National Association, as trustee, filed as Exhibit 10.64.1 to the Company’s Registration StatementCurrent Report on Form S-18-K (Commission File No. 333-132257)001-32886) filed April 14, 200611, 2013 and incorporated herein by reference.10.3† First Amendment to4.8 Registration Rights Agreement dated as of August 13, 2012 among Continental Resources, Inc. 2000 Stock Option Plan, the Revocable Inter Vivos Trust of Harold G. Hamm, and Jeffrey B. Hume filed as Exhibit 10.74.1 to the Company’s Registration StatementCurrent Report on Form S-18-K (Commission File No. 333-132257)001-32886) filed April 14, 2006August 17, 2012 and incorporated herein by reference.10.4†Form of Incentive Stock Option Agreement filed as Exhibit 10.8 to the Company’s Registration Statement on Form S-1 (Commission File No. 333-132257) filed April 14, 2006 and incorporated herein by reference.10.5†10.1† Amended and Restated Continental Resources, Inc. 2005 Long-Term Incentive Plan effective as of April 3, 2006 filed as Exhibit 10.9 to the Company’s Registration Statement on Form S-1 (Commission File No. 333-132257) filed April 14, 2006 and incorporated herein by reference. 10.6†10.2† Form of Restricted Stock Award Agreement filed as Exhibit 10.10 to the Company’s Registration Statement on Form S-1 (Commission File No. 333-132257) filed April 14, 2006 and incorporated herein by reference. 10.7†10.3† Form of Indemnification Agreement between Continental Resources, Inc. and each of the directors and executive officers thereof filed as Exhibit 10.12 to the Company’s Registration Statement on Form S-1 (Commission File No. 333-132257) filed April 14, 2006 and incorporated herein by reference. 10.8†10.4† Membership Interest Assignment Agreement by and between Continental Resources, Inc., the Harold Hamm Revocable Inter Vivos Trust, the Harold Hamm HJ Trust and the Harold Hamm DST Trust dated March 30, 2006 filed as Exhibit 10.13 to the Company’s Registration Statement on Form S-1 (Commission File No. 333-132257) filed April 14, 2006 and incorporated herein by reference. 10.910.5 Crude oil gatheringtransportation agreement between Banner Pipeline Company, L.L.C., a wholly owned subsidiary of Continental Resources, Inc. and Banner Transportation Company dated July 11, 2007 filed February 24, 2012 as Exhibit 99.110.8 to the Company’s Current Report on2011 Form 8-K10-K (Commission File No. 001-32886) filed July 11, 2007 and incorporated herein by reference.10.10†Summary of Non-Employee Director Compensation filed as Exhibit 10.19 to the Company’s Form 10-K for the year ended December 31, 2008 (Commission File No. 001-32886) filed February 27, 2009 and incorporated herein by reference.10.1110.6 Seventh Amended and Restated Credit Agreement dated June 30, 2010 among Continental Resources, Inc. as borrower, Union Bank, N.A. as administrative agent, as issuing lender and as swing line lender, and the other lenders party thereto, filed as Exhibit 10.1 to the Company’s Current Report on Form 8-K (Commission File No. 001-32886) filed July 7, 2010 and incorporated herein by reference. 10.12 *†10.7 EmploymentAmendment No. 1 dated July 26, 2012 to the Seventh Amended and Restated Credit Agreement betweendated June 30, 2010, among Continental Resources, Inc., as borrower, Banner Pipeline Company, L.L.C., as guarantor, Union Bank, N.A., as administrative agent and issuing lender, and the other lenders party thereto, filed as Exhibit 10.1 to the Company’s Current Report on Form 8-K (Commission File No. 001-32886) filed August 1, 2012 and incorporated herein by reference.10.8† First Amendment to the Continental Resources, Inc. 2005 Long-Term Incentive Plan filed February 28, 2013 as Exhibit 10.2 to the Company’s 2012 Form 10-K (Commission File No. 001-32886) and Eric S. Eissenstat dated October 14, 2010.incorporated herein by reference.10.9 10.10† Continental Resources, Inc. 2013 Long-Term Incentive Plan included as Appendix A to the Company's Definitive Proxy Statement on Schedule 14A (Commission File No. 001-32886) filed April 10, 2013 and incorporated herein by reference. 10.11† Description of cash bonus plan adopted on February 22, 2013 filed as Exhibit 10.1 to the Company's Form 10-Q for the quarter ended March 31, 2013 (Commission File No. 001-32886) filed May 8, 2013 and incorporated herein by reference. 10.12† Form of Employee Restricted Stock Award Agreement under the Continental Resources, Inc. 2013 Long-Term Incentive Plan filed as Exhibit 10.2 to the Company's Current Report on Form 8-K (Commission File No. 001-32886) filed May 24, 2013 and incorporated herein by reference. 10.13† Form of Non-Employee Director Restricted Stock Award Agreement under the Continental Resources, Inc. 2013 Long-Term Incentive Plan filed as Exhibit 10.3 to the Company's Current Report on Form 8-K (Commission File No. 001-32886) filed May 24, 2013 and incorporated herein by reference. 10.14† Summary of Non-Employee Director Compensation Approved as of May 23, 2013 to be effective July 1, 2013 filed as Exhibit 10.6 to the Company's Form 10-Q for the quarter ended June 30, 2013 (Commission File No. 001-32886) filed August 8, 2013 and incorporated herein by reference. 10.15† Continental Resources, Inc. Deferred Compensation Plan filed as Exhibit 10.1 to the Company's Current Report on Form 8-K (Commission File No. 001-32886) filed September 26, 2013 and incorporated herein by reference. 10.16 Amendment No. 4 and Consent dated December 11, 2013 to the Seventh Amended and Restated Credit Agreement dated June 30, 2010, among Continental Resources, Inc., as borrower, Banner Pipeline Company LLC, and CLR Asset Holdings, LLC as guarantors, Union Bank, N.A., as administrative agent and issuing lender, and the other lenders party thereto, filed as Exhibit 10.1 to the Company's Current Report on Form 8-K (Commission File No. 001-32886) filed December 12, 2013 and incorporated herein by reference. 21* Subsidiaries of Continental Resources, Inc. 23.1* Consent of Grant Thornton LLP. 23.2* Consent of Ryder Scott Company, L.P. 31.1* Certification of the Company’s Chief Executive Officer Pursuant to Section 302 of the Sarbanes-Oxley Act of 2002 (15 U.S.C. Section 7241) 31.2* Certification of the Company’s Chief Financial Officer Pursuant to Section 302 of the Sarbanes-Oxley Act of 2002 (15 U.S.C. Section 7241) 32** Certification of the Company’s Chief Executive Officer and Chief Financial Officer Pursuant to Section 906 of the Sarbanes-Oxley Act of 2002 (18 U.S.C. Section 1350) 99* * Report of Ryder Scott Company, L.P., Independent Petroleum Engineers and Geologists 101.INS** XBRL Instance Document 101.SCH** XBRL Taxonomy Extension Schema Document 101.CAL** XBRL Taxonomy Extension Calculation Linkbase Document 101.DEF** XBRL Taxonomy Extension Definition Linkbase Document 101.LAB** XBRL Taxonomy Extension Label Linkbase Document 101.PRE** XBRL Taxonomy Extension Presentation Linkbase Document * Filed herewith ** Furnished herewith † Management contracts or compensatory plans or arrangements filed pursuant to Item 601(b)(10)(iii) of Regulation S-K. CONTINENTAL RESOURCES, INC. By: HAROLDHAROLD G. HAMM HAMMName: Harold G. Hamm Title: Chairman of the Board and Chief Executive Officer Date: February 25, 201126, 2014 /s/ HAROLD G. HAMM February 25, 201126, 2014Harold G. Hamm Chief Executive Officer(principal executive officer) JOHNJOHN D. HART HART February 25, 2011John D. Hart February 26, 2014 John D. Hart /s/ DAVIDDAVID L. BOREN BOREN Director February 25, 201126, 2014David L. Boren ROBERTROBERT J. GRANT Director February 25, 201126, 2014Robert J. Grant LON MCCAIN Director February 25, 201126, 2014Lon McCain JOHNJOHN T. MCNABBMCNABB II Director February 25, 201126, 2014John T. McNabb II MARKMARK E. MONROE Director February 25, 201126, 2014Mark E. Monroe H. R. SANDERS, JR. Director February 25, 201126, 2014H. R. Sanders, Jr.Edward T. Schafer 90