UNITED STATES
SECURITIES AND EXCHANGE COMMISSION
Washington, D.C. 20549
FORM 10-K
ANNUAL REPORT PURSUANT TO SECTION 13 or 15(d) OF
THE SECURITIES EXCHANGE ACT OF 1934
For the fiscal year ended December 31, 20102011
Commission File Number | Exact Name of Registrant as Specified in its Charter, Address of Principal Executive Offices, and Telephone Number (Including Area Code) | I.R.S. Employer Identification Number | ||
| 001-31403 | PEPCO HOLDINGS,INC. (Pepco Holdings or PHI), a Delaware corporation 701 Ninth Street, N.W. Washington, D.C. 20068 Telephone: (202)872-2000 | 52-2297449 | ||
001-01072 | POTOMAC ELECTRIC POWER COMPANY (Pepco), a District of Columbia and Virginia corporation 701 Ninth Street, N.W. Washington, D.C. 20068 Telephone: (202)872-2000 | 53-0127880 | ||
001-01405 | DELMARVA POWER & LIGHT COMPANY (DPL), a Delaware and Virginia corporation
Telephone: (202)872-2000 | 51-0084283 | ||
001-03559 | ATLANTIC CITY ELECTRIC COMPANY (ACE), a New Jersey corporation
Telephone: (202)872-2000 | 21-0398280 | ||
Continued
Securities registered pursuant to Section 12(b) of the Act:
Registrant | Title of Each Class | Name of Each Exchange on Which Registered | ||
Pepco Holdings | Common Stock, $.01 par value | New York Stock Exchange |
Securities registered pursuant to Section 12(g) of the Act:
Registrant | Title of Each Class | |||
Pepco | Common Stock, $.01 par value | |||
DPL | Common Stock, $2.25 par value | |||
ACE | Common Stock, $3.00 par value |
Indicate by check mark if the registrant is a well-known seasoned issuer, as defined in Rule 405 of the Securities Act.
Pepco Holdings | Yes x | No ¨ | Pepco | Yes ¨ | No x | |||||||
DPL | Yes ¨ | No x | ACE | Yes ¨ | No x | |||||||
Indicate by check mark if the registrant is not required to file reports pursuant to Section 13 or Section 15(d) of the Act.
Pepco Holdings | Yes ¨ | No x | Pepco | Yes ¨ | No x | |||||||
DPL | Yes ¨ | No x | ACE | Yes ¨ | No x | |||||||
Indicate by check mark whether each registrant (1) has filed all reports required to be filed by Section 13 or 15(d) of the Securities Exchange Act of 1934 during the preceding 12 months and (2) has been subject to such filing requirements for the past 90 days.
Pepco Holdings | Yes x | No ¨ | Pepco | Yes x | No ¨ | |||||||
DPL | Yes x | No ¨ | ACE | Yes x | No ¨ | |||||||
Indicate by check mark whether the registrant has submitted electronically and posted on its corporate Web site, if any, every Interactive Data File required to be submitted and posted pursuant to Rule 405 of Regulation S-T during the preceding 12 months (or for such shorter period that the registrant was required to submit and post such files).
Pepco Holdings | Yes x | No ¨ | Pepco | Yes | No ¨ | |||||||
DPL | Yes | No ¨ | ACE | Yes | No ¨ | |||||||
Indicate by check mark if disclosure of delinquent filers pursuant to Item 405 of Regulation S-K is not contained herein, and will not be contained, to the best of registrant’s knowledge, in the definitive proxy or information statements incorporated by reference in Part III of this Form 10-K or any amendment to this Form 10-K (applicable to Pepco Holdings only).x
Indicate by check mark whether the registrant is a large accelerated filer, an accelerated filer, a non-accelerated filer, or a smaller reporting company. See the definitions of “large accelerated filer,” “accelerated filer” and “smaller reporting company” in Rule 12b-2 of the Exchange Act.
Large Accelerated Filer | Accelerated Filer | Non- Accelerated Filer | Smaller Reporting Company | |||||
Pepco Holdings | x | ¨ | ¨ | ¨ | ||||
Pepco | ¨ | ¨ | x | ¨ | ||||
DPL | ¨ | ¨ | x | ¨ | ||||
ACE | ¨ | ¨ | x | ¨ | ||||
Indicate by check mark whether the registrant is a shell company (as defined in Rule 12b-2 of the Exchange Act).
Pepco Holdings | Yes ¨ | No x | Pepco | Yes ¨ | No x | |||||||
DPL | Yes ¨ | No x | ACE | Yes ¨ | No x | |||||||
Pepco, DPL, and ACE meet the conditions set forth in General Instruction I(1)(a) and (b) of Form 10-K and are therefore filing this Form 10-K with the reduced disclosure format specified in General Instruction I(2) of Form 10-K.
Registrant | Aggregate Market Value of Voting and June 30, | Number of Shares of Common | ||
Pepco Holdings | $ | ($.01 par value) | ||
Pepco | None | 100 ($.01 par value) | ||
DPL | None | 1,000 ($2.25 par value) | ||
ACE | None | 8,546,017 ($3.00 par value) |
| (a) | Solely for purposes of calculating this aggregate market value, PHI has defined its affiliates to include (i) those persons who were, as of June 30, 2011, its executive officers, directors and beneficial owners of more than 10% of its common stock, and (ii) such other persons who were, as of June 30, 2011, controlled by, or under common control with, the persons described in clause (i) above. |
| (b) | All voting and non-voting common equity is owned by Pepco Holdings. |
| All voting and non-voting common equity is owned by Conectiv, LLC, a wholly owned subsidiary of Pepco Holdings. |
THIS COMBINED FORM 10-K IS SEPARATELY FILED BY PEPCO HOLDINGS, PEPCO, DPL AND ACE. INFORMATION CONTAINED HEREIN RELATING TO ANY INDIVIDUAL REGISTRANT IS FILED BY SUCH REGISTRANT ON ITS OWN BEHALF. EACH REGISTRANT MAKES NO REPRESENTATION AS TO INFORMATION RELATING TO THE OTHER REGISTRANTS.
DOCUMENTS INCORPORATED BY REFERENCE
Portions of the Pepco Holdings, Inc. definitive proxy statement for the 20112012 Annual Meeting of ShareholdersStockholders to be filed with the Securities and Exchange Commission on or about Marchwithin 120 days after December 31, 2011 are incorporated by reference into Part III of this report.
TABLE OF CONTENTS | ||||||||||||||
| Page | ||||||||||||||
| i | ||||||||||||||
| 1 | |||||||||||||
| ||||||||||||||
| ||||||||||||||
| ||||||||||||||
| ||||||||||||||
| ||||||||||||||
| ||||||||||||||
| - | Business | 3 | ||||||||||||
| - | Risk Factors | 23 | ||||||||||||
| - | Unresolved Staff Comments | 37 | ||||||||||||
| - | Properties | 38 | ||||||||||||
| - | Legal Proceedings | 39 | ||||||||||||
| - | Mine Safety Disclosures | 39 | ||||||||||||
| - | Market for Registrant’s Common Equity, Related Stockholder Matters and Issuer Purchases of Equity Securities | |||||||||||||
| - | Selected Financial Data | |||||||||||||
| - | Management’s Discussion and Analysis of Financial Condition and Results of Operations | |||||||||||||
| - | Quantitative and Qualitative Disclosures About Market Risk | |||||||||||||
| - | Financial Statements and Supplementary Data | |||||||||||||
| - | Changes in and Disagreements With Accountants on Accounting and Financial Disclosure | |||||||||||||
| - | Controls and Procedures | |||||||||||||
| - | Other Information | 322 | ||||||||||||
| - | Directors, Executive Officers and Corporate Governance | 323 | ||||||||||||
| ||||||||||||||
| ||||||||||||||
| - | Executive Compensation | ||||||||||||
| - | Security Ownership of Certain Beneficial Owners and Management and Related Stockholder Matters | 323 | ||||||||||||
| - | Certain Relationships and Related Transactions, and Director Independence | 323 | ||||||||||||
| - | Principal Accounting Fees and Services | 324 | ||||||||||||
| - | Exhibits and Financial Statement Schedules | 324 | ||||||||||||
| - | Condensed Financial Information of Parent Company | 326 | ||||||||||||
| - | Valuation and | ||||||||||||
| ||||||||||||||
| 349 | |||||||||||||
| - | |||||||||||||
| ||||||||||||||
| ||||||||||||||
| ||||||||||||||
| Statements Re: Computation of Ratios | |||||||||||||
| - | Subsidiaries of the Registrant | |||||||||||||
| - | Consents of Independent Registered Public Accounting Firm | |||||||||||||
| - | Rule 13a-14a/15d-14(a) Certifications | |||||||||||||
| - | Section 1350 Certifications | |||||||||||||
The following is a glossary of terms, abbreviations and acronyms that are used in the Reporting Companies’ SEC reports. The terms, abbreviations and acronyms used have the meanings set forth below, unless the context requires otherwise.
Term | Definition | |
| ACE | Atlantic City Electric Company | |
| ACE Funding | Atlantic City Electric Transition Funding LLC | |
| ADITC | Accumulated deferred investment tax credits | |
| AFUDC | Allowance for | |
| AOCL | Accumulated other comprehensive loss | |
| AMI | Advanced metering infrastructure | |
| ASC | Accounting Standards Codification | |
| BART | Best Available Retrofit Technology | |
| BGS | Basic Generation Service | |
| BGS-CIEP | BGS-Commercial and Industrial Energy Price | |
| BGS-FP | BGS-Fixed Price | |
| BSA | Bill Stabilization Adjustment | |
| CAIR | Clean Air Interstate Rule issued by EPA | |
| Calpine | Calpine Corporation, the purchaser of Conectiv Energy’s wholesale power generation business | |
| CERCLA | Comprehensive Environmental Response, Compensation, and Liability Act of 1980 | |
| Conectiv | ||
| Conectiv Energy | Conectiv Energy Holding Company and its subsidiaries | |
| DCPSC | District of Columbia Public Service Commission | |
| DDOE | District of Columbia Department of the Environment | |
| Default Electricity Supply | The supply of electricity by PHI’s electric utility subsidiaries at regulated rates to retail customers who do not elect to purchase electricity from a competitive supplier, and which, depending on the jurisdiction, is also known as SOS or BGS | |
| DPL | Delmarva Power & Light Company | |
| DEDA | Delaware Economic Development Authority | |
| DOE | U.S. Department of Energy | |
| DPSC | Delaware Public Service Commission | |
| DRP | Shareholder Dividend Reinvestment Plan | |
| EBITDA | Earnings before interest, taxes, depreciation, and amortization | |
| EDC | Electricity Distribution Company | |
| EDIT | Excess Deferred Income Taxes | |
| EPA | U.S. Environmental Protection Agency | |
| Exchange Act | Securities Exchange Act of 1934, as amended | |
| FASB | Financial Accounting Standards Board |
i
|
| |
| FERC | Federal Energy Regulatory Commission | |
| FHACA | Flood Hazard Area Control Act | |
| FPA | Federal Power Act | |
| GAAP | Accounting principles generally accepted in the United States of America |
i
| Term | Definition | |
| GCR | Gas Cost Rate | |
| GWh | Gigawatt hour | |
| HPS | Hourly Priced Service | |
| IIP | ACE’s Infrastructure Investment Program | |
| IRS | Internal Revenue Service | |
| ISDA | International Swaps and Derivatives Association | |
| Line | Estimates of electricity and gas expected to be lost in the process of its transmission and distribution to customers | |
| LTIP | The Pepco Holdings, Inc. Long-Term Incentive Plan | |
| MAPP | Mid-Atlantic Power Pathway | |
| Market Transition Charge Tax | Revenue ACE receives, and pays to ACE Funding to recover income taxes associated with Transition Bond Charge revenue | |
| Mcf | Thousand Cubic Feet | |
| MDC | MDC Industries, Inc. | |
| Medicare Act | Medicare Prescription Drug Improvement and Modernization Act of 2003 | |
| Medicare Part D | A prescription drug benefit under the Medicare Act | |
| MFVRD | Modified fixed variable rate design | |
| Mirant | Mirant Corporation | |
| MMBtu | One Million British Thermal Units | |
| MPSC | Maryland Public Service Commission | |
| MSCG | Morgan Stanley Capital Group, Inc. | |
| MWh | Megawatt | |
| NAV | Net Asset Value | |
| NYMEX | New York Mercantile Exchange | |
| NJBPU | New Jersey Board of Public Utilities | |
| NJDEP | New Jersey Department of Environmental Protection | |
| NOx | Nitrogen oxide | |
| NPCC | Northeast Power Coordinating Council | |
| NPDES | National Pollutant Discharge Elimination System | |
| NPL | National Priorities List | |
| NUGs | Non-utility generators | |
| OPEB | Other postretirement | |
| PARS | Performance accelerated restricted stock | |
| PCBs | Polychlorinated biphenyls | |
| PCI | Potomac Capital Investment Corporation and its subsidiaries | |
| Pepco | Potomac Electric Power Company | |
ii
|
| |
| Pepco Energy Services | Pepco Energy Services, Inc. and its subsidiaries | |
| Pepco Holdings or PHI | Pepco Holdings, Inc. | |
| PJM | PJM Interconnection, LLC | |
| PJM RTO | PJM regional transmission organization | |
| Power Delivery | ||
| PPA | Power | |
| PRP | Potentially responsible party |
ii
| Term | Definition | |
| PUHCA 2005 | Public Utility Holding Company Act of 2005 | |
| RECs | Renewable energy credits | |
| Regulated T&D Electric Revenue | Revenue from the transmission and the distribution of electricity to PHI’s customers within its service territories at regulated rates | |
| Reporting Company | Each of PHI, Pepco, DPL and ACE | |
| Revenue Decoupling Adjustment | An adjustment equal to the amount by which revenue from distribution sales differs from the revenue that Pepco and DPL are entitled to earn based on the approved distribution charge per customer | |
| RFC | ReliabilityFirst Corporation | |
| RFP | Request for proposals | |
| RI/FS | Remedial investigation and feasibility study | |
| RIM | Reliability investment recovery mechanism | |
| ROE | Return on equity | |
| RPM | Reliability Pricing Model | |
| RPS | Renewable Energy Portfolio Standards | |
| SEC | Securities and Exchange Commission | |
| SO2 | Sulfur dioxide | |
| SOCA | Standard Offer Capacity Agreement | |
| SOS | Standard Offer Service (the supply of electricity by Pepco in the District of Columbia, by Pepco and DPL in Maryland and by DPL in Delaware to retail customers who have not elected to purchase electricity from a competitive supplier) | |
| SPCC | Spill Prevention, Control, and Countermeasure plans, required pursuant to federal regulations requiring plans for facilities using oil-containing equipment in proximity to surface waters | |
| T&D | Transmission and distribution | |
| Transition Bonds | Transition Bonds issued by ACE Funding | |
| VADEQ | Virginia Department of Environmental Quality | |
| VaR | Value at Risk | |
| VRDBs | Variable Rate Demand Bonds | |
| WACC | Weighted average cost of capital |
iii
Some of the statements contained in this Annual Report on Form 10-K with respect to Pepco Holdings, Inc. (PHI or Pepco Holdings), Potomac Electric Power Company (Pepco), Delmarva Power & Light Company (DPL) and Atlantic City Electric Company (ACE), including each of their respective subsidiaries, are forward-looking statements within the meaning of Section 21E of the Securities Exchange Act of 1934, as amended (the Exchange Act), and Section 27A of the Securities Act of 1933, as amended, and are subject to the safe harbor created thereby and by the Private Securities Litigation Reform Act of 1995. These statements include declarations regarding the intents, beliefs, estimates and current expectations of one or more Reporting Companies or their subsidiaries. In some cases, you can identify forward-looking statements by terminology such as “may,” “might,” “will,” “should,” “could,” “expects,” “intends,” “assumes,” “seeks to,” “plans,” “anticipates,” “believes,” “projects,” “estimates,” “predicts,” “potential,” “future,” “goal,” “objective,” or “continue” or the negative of such terms or other variations thereof or comparable terminology, or by discussions of strategy that involve risks and uncertainties. Forward-looking statements involve estimates, assumptions, known and unknown risks, uncertainties and other factors that may cause one or more Reporting Company’s or their subsidiaries’ actual results, levels of activity, performance or achievements to be materially different from any future results, levels of activity, performance or achievements expressed or implied by such forward-looking statements. Therefore, forward-looking statements are not guarantees or assurances of future performance, and actual results could differ materially from those indicated by the forward-looking statements.
The forward-looking statements contained herein are qualified in their entirety by reference to the following important factors, which are difficult to predict, contain uncertainties, are beyond each Reporting Company’s or their subsidiaries’ control and may cause actual results to differ materially from those contained in forward-looking statements:
Changes in governmental policies and regulatory actions affecting the energy industry, including allowed rates of return, industry and rate structure, acquisition and disposal of assets and facilities, operation and construction of transmission and distribution facilities and the recovery of purchased power expenses;
The outcome of pending and future rate cases, including the possible disallowance of costs and expenses;
The expenditures necessary to comply with regulatory requirements, including regulatory orders, and to implement reliability enhancement, emergency response and customer service improvement programs;
Possible fines, penalties or other sanctions assessed by regulatory authorities against PHI’s regulated utilities;
Weather conditions affecting usage and emergency restoration costs;
Population growth rates and changes in demographic patterns;
Changes in customer energy demand due to conservation measures and the use of more energy-efficient products;
General economic conditions, including the impact of an economic downturn or recession on energy usage;
Changes in and compliance with environmental and safety laws and policies;
1
Changes in tax rates or policies;
Changes in rates of inflation;
Changes in accounting standards or practices;
Unanticipated changes in operating expenses and capital expenditures;
Rules and regulations imposed by, and decisions of, federal and/or state regulatory commissions, PJM Interconnection, LLC (PJM), the North American Electric Reliability Corporation (NERC) and other applicable electric reliability organizations;
Legal and administrative proceedings (whether civil or criminal) and settlements that affect a Reporting Company’s or their subsidiaries’ business and profitability;
Pace of entry into new markets;
Interest rate fluctuations and the impact of credit and capital market conditions on the ability to obtain funding on favorable terms; and
Effects of geopolitical events, including the threat of domestic terrorism or cyber attacks.
These forward-looking statements are also qualified by, and should be read together with, the risk factors included in Part I, Item 1A. “Risk Factors” in this Annual Report on Form 10-K, and investors should refer to such risk factors in evaluating the forward-looking statements contained in this Form 10-K.
Any forward-looking statements speak only as to the date of this Form 10-K for each Reporting Company and none of the Reporting Companies undertakes an obligation to update any forward-looking statements to reflect events or circumstances after the date on which such statements are made or to reflect the occurrence of unanticipated events. New factors emerge from time to time, and it is not possible for a Reporting Company to predict all such factors, nor can the impact of any such factor be assessed on such Reporting Company’s or its subsidiaries’ business (viewed independently or together with the business or businesses of some or all of the other Reporting Companies or their subsidiaries) or the extent to which any factor, or combination of factors, may cause results to differ materially from those contained in any forward-looking statement. The foregoing factors should not be construed as exhaustive.
2
| Item 1. | BUSINESS |
Overview
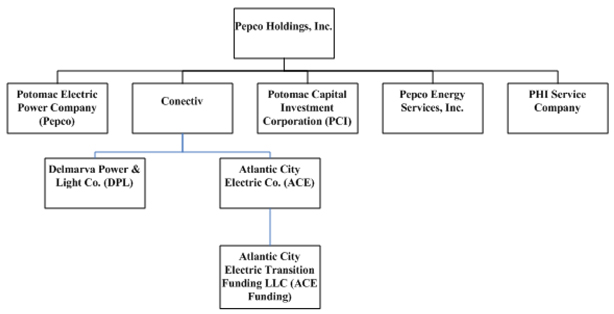
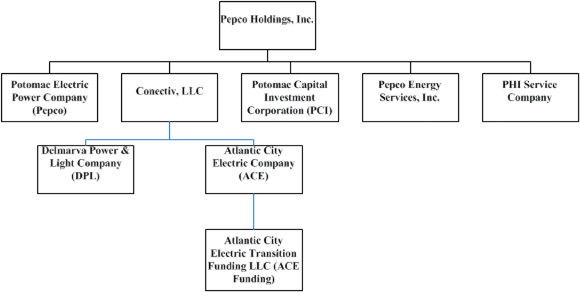
Pepco Holdings, Inc. (PHI or Pepco Holdings), a Delaware corporation incorporated in 2001, is a holding company that, through the following regulated public utility subsidiaries, is engaged primarily in the transmission, distribution and default supply of electricity and, to a lesser extent, the distribution and supply of natural gas (Power Delivery):gas:
Potomac Electric Power Company, (Pepco), which was incorporated in Washington, D.C. in 1896 and became a domestic Virginia corporation in 1949,
Delmarva Power & Light Company, (DPL), which was incorporated in Delaware in 1909 and became a domestic Virginia corporation in 1979, and
Atlantic City Electric Company, (ACE), which was incorporated in New Jersey in 1924.
Through Pepco Energy Services, Inc. and its subsidiaries (collectively, Pepco Energy Services), PHI also provides energy efficiency and renewable energy services primarily to government and institutional customers. Pepco Energy Services is in the process of winding down its competitive electricity and natural gas retail supply business and preparing for the retirement of its two oil firedoil-fired generating facilities.
In addition, through Potomac Capital Investment Corporation (PCI), PHI holds investments in eightseveral cross-border energy leaseslease investments as described below under the heading “Other Business Operations.” PCI is no longer engaged in new investment activity.
The following chart shows, in simplified form, the corporate structure of PHI and its principal subsidiaries:
3
PHI Service Company, a subsidiary service company of PHI, provides a variety of support services, including legal, accounting, treasury, tax, purchasing and information technology services, to PHI and its operating subsidiaries. These services are provided pursuant to a service agreement among PHI, PHI Service Company and the participating operating subsidiaries. The expenses of PHI Service Company are charged to PHI and the participating operating subsidiaries in accordance with cost allocation methods set forth in the service agreement.
Pepco Holdings’ management has identified its operating segments at December 31, 20102011 as (i) Power Delivery, consisting of the operations of Pepco, DPL and ACE, engaged primarily in the transmission, distribution and default supply of electricity and the distribution and supply of natural gas, (ii) Pepco Energy Services and (iii) Other Non-Regulated, consisting primarily of the operations of PCI. For financial information relating to PHI’s segments, see Note (5), “Segment Information,” to the consolidated financial statements of PHI set forth in Part II, Item 8 of this Form 10-K.PHI.
Discontinued Operations
In April 2010, the Board of Directors approved a plan for the disposition of PHI’s competitive wholesale power generation, marketing and supply business, which had been conducted through subsidiaries of Conectiv Energy Holding Company (collectively, Conectiv(Conectiv Energy). On July 1, 2010, PHI completed the sale of Conectiv Energy’s wholesale power generation business to Calpine Corporation (Calpine) for $1.64 billion. The disposition of Conectiv Energy’s remaining assets and businesses not included in the Calpine sale, including its load service supply contracts, energy hedging portfolio and certain tolling agreements, has been substantially completed. The operations of Conectiv Energy, which previously comprised a separate segment for financial reporting purposes, are being accounted for as a discontinued operation. For further information on the former Conectiv Energy segment and the disposition of its assets, operations and obligations, see Note (20), “Discontinued Operations,” to the consolidated financial statements of PHI set forth in Part II, Item 8 of this Form 10-K.PHI.
Investor Information
Each Reporting Company maintains an Internet web site, at the Internet address listed below:
Reporting Company | Internet Address | |
| PHI | http://www.pepcoholdings.com | |
| Pepco | http://www.pepco.com | |
| DPL | http://www.delmarva.com | |
| ACE | http://www.atlanticcityelectric.com |
Each of PHI, Pepco, DPL and ACE files reports with the Securities and Exchange Commission (SEC) under the Securities Exchange ActAct. Copies of 1934, as amended. Thethe Annual Reports on Form 10-K, Quarterly Reports on Form 10-Q, Current Reports on Form 8-K, and all amendments to those reports, of each of the companiesReporting Company are made available free of charge on PHI’s internetInternet Web site as soon as reasonably practicable after such documents are electronically filed with or furnished to the Securities and Exchange Commission (SEC). TheseSEC. Copies of these reports may be found athttp://www.pepcoholdings.com/www.pepcoholdings.com/investors. The information contained on the web sites listed above is not a part of this Form 10-K, and any web site references are not intended to be made through active hyperlinks.
Business Strategy
PHI’s business strategy is to become a top-performing, regulated power delivery company focused on:
investing in transmission and distribution infrastructure to improve reliability of electric service;
building a smarter grid to automate certain functions on the electric system, restore power more efficiently and provide customers detailed energy information to help them control their energy costs;
investing in advanced technologies, new processes and personnel to enhance the customer experience during power restoration, including delivering enhanced customer communications;
pursuing a regulatory strategy that results in earning reasonable rates of return and timely cost recovery of PHI’s investments;
4
growing PHI’s energy services business by providing comprehensive energy management solutions and developing, installing and operating renewable energy solutions; and
demonstrating PHI’s core values of safety, diversity and environmental stewardship through PHI’s business approaches and tangible business practices and outcomes.
To further its business strategy, PHI may examine transactions involving its existing businesses, including entering into joint ventures, disposing of businesses or making acquisitions. PHI also may refine components of its business strategy as it deems necessary or appropriate in response to business factors and conditions, including regulatory requirements.
Description of Business
Power Delivery
PHI’s primary business is Power Delivery. The Power Delivery business in 2011, 2010 and 2009, and 2008, respectively, produced 79%, 73%, and 67%, and 68%respectively, of PHI’s consolidated operating revenues and 81%78%, 78%81%, and 101%78%, respectively, of PHI’s consolidated operating income. None of PHI’s three utilities owns any electric generation facilities.
TheEach utility comprising Power Delivery business consists of the operations of Pepco, DPL and ACE, each of which is a regulated electric utility in the jurisdictions that compriseencompass its electricity distribution service territory.territory and is regulated by FERC for its electricity transmission facilities. DPL also is a regulated natural gas utility serving portions of Delaware. In the aggregate, the Power Delivery business distributes electricity to more than 1.8 million customers in the mid-Atlantic region and delivers natural gas to approximately 123,000124,000 customers in Delaware. None of PHI’s three utilities owns any electric generation facilities.
Distribution and Default Supply of Electricity
Pepco, DPL and ACE each owns and operates a network of wires, substations and other equipment that are classified as transmission facilities, distribution facilities or common facilities (which are used for both transmission and distribution). Transmission facilities carry wholesale electricity into, or across, the utility’s service territory. Distribution facilities carry electricity from the transmission facilities to the end-use customers located in the utility’s service territory.
Each companyutility is responsible for the distribution of electricity in its service territory, for which it is paid tariff rates established by the applicable local public service commissions. Each companyutility also supplies electricity at regulated rates to retail customers in its service territory who do not elect to purchase electricity from a competitive retail supplier. The regulatory term for this default supply service is Standard Offer Service (SOS) in Delaware, the District of Columbia and Maryland, and Basic Generation Service (BGS) in New Jersey. In this Form 10-K, these supply services are referred to generally as Default Electricity Supply.
Transmission of Electricity and Relationship with PJM
The transmission facilities owned by Pepco, DPL and ACE are interconnected with the transmission facilities of contiguous utilities and are part of an interstate power transmission grid over which electricity is transmitted throughout the mid-Atlantic portion of the United States and parts of the Midwest. Pepco, DPL and ACE each is a member of the PJM Regional Transmission Organization (PJM RTO), the regional transmission organization designated by the Federal Energy Regulatory Commission (FERC) to coordinate the movement of wholesale electricity within a region consisting of all or parts of Delaware, Illinois, Indiana, Kentucky, Maryland, Michigan, New Jersey, North Carolina, Ohio, Pennsylvania, Tennessee, Virginia, West Virginia and the District of Columbia.
5
PJM, Interconnection, LLC (PJM), the FERC-approved independent grid operator, manages the transmission grid and the wholesale electricity market in the PJM RTO region. Any entity that wishes to have wholesale electricity delivered at any point within the PJM RTO region must obtain transmission services from PJM. In accordance with FERC-approved rules, Pepco, DPL, ACE and the other transmission-owning utilities in the region make their transmission facilities available to the PJM RTO, and PJM directs and controls the operation of these transmission facilities. For transmission services, transmission owners are paid rates proposed by the transmission owner and approved by FERC. PJM provides billing and settlement services, collects transmission service revenue from transmission service customers and distributes the revenue to the transmission owners. PJM also directs the regional transmission planning process within the PJM RTO region. The PJM Board of Managers reviews and approves each PJM regional transmission expansion plan, including whether to include new construction of transmission facilities proposed by PJM RTO members in the plan and, if so, the target in-service date for those facilities.
Regulation
The operations of PHI’s utility subsidiaries, including the rates they are permitted to charge customers for the distribution and transmission of electricity and, in the case of DPL, the distribution and transportation of natural gas, are subject to regulation by governmental agencies in the jurisdictions in which the subsidiaries provide utility service as follows:
Pepco’s electricity distribution operations are regulated in Maryland by the Maryland Public Service Commission (MPSC) and in the District of Columbia by the District of Columbia Public Service Commission (DCPSC).
DPL’s electricity distribution operations are regulated in Maryland by the MPSC and in Delaware by the Delaware Public Service Commission (DPSC).
DPL’s natural gas distribution and intrastate transportation operations in Delaware are regulated by the DPSC.
ACE’s electricity distribution operations are regulated by the New Jersey Board of Public Utilities (NJBPU).
Each utility subsidiary’s transmission is regulated by FERC.
DPL’s interstate transportation and wholesale sale of natural gas are regulated by FERC.
Seasonality
The operating results of the Power Delivery segment historically have been directly related to the volume of electricity delivered to its customers, producing higher revenues and net income during periods when customers consumed higher amounts of electricity (usually during periods of extreme temperatures) and lower revenues and net income during periods when customers consumed lower amounts of electricity (usually during periods of mild temperatures). This has been due in part to the long standing practice by which the stateapplicable public service commissions set distribution rates based on a fixed charge per kilowatt-hour of electricity used by the customer. Because most of the costs associated with the distribution of electricity do not vary with the volume of electricity delivered, this pricing mechanism also contributed to seasonal variations in net income. As thea result of the implementation of a bill stabilization adjustment mechanism (BSA)BSA for retail customers of Pepco and DPL in Maryland in June 2007 and for customers of Pepco in the District of Columbia in November 2009, distribution revenues have been decoupled from the amount of electricity delivered. Under the BSA, utility customers pay an approved distribution charge for their electric service which does not vary by electricity usage. This change has had the effect of aligning annual distribution revenues more closely with annual distribution costs. In addition, the change has had the effect of eliminating changes in customer electricity usage, whether due to weather conditions or for any other reason, as a factor having an impact on annual distribution revenue and net income in those jurisdictions. The BSA also eliminates what otherwise might be a disincentive for the utility to aggressively develop and promote efficiency programs. Distribution revenues are not decoupled for the distribution of electricity and natural gas by DPL in Delaware or for the distribution of electricity by ACE in New Jersey, and thus are subject to variability due to changes in customer consumption.
In contrast to electricity distribution costs, the cost of the electricity supplied, which is the largest component of a customer’s bill, does vary directly in relation to the volume of electricity used by a customer. Accordingly, whether or not a BSA is in effect for the jurisdiction, the revenues of Pepco, DPL and ACE from the supply of electricity and natural gas vary based on consumption and on this basis are seasonal. Because the revenues received by each of the utility subsidiaries for the default supply of electricity and natural gas closely approximate the supply costs, the impact on net income is immaterial, and therefore is not seasonal.
Regulated Utility Subsidiaries
The following is a more detailed description of the business of each of PHI’s three regulated utility subsidiaries:
6
Pepco
Pepco is engaged in the transmission, distribution and default supply of electricity in the District of Columbia and major portions of Prince George’s County and Montgomery County in Maryland. Pepco’s service territory covers approximately 640 square miles and has a population of approximately 2.2 million. As of December 31, 2010,2011, Pepco distributed electricity to 787,000788,000 customers (of which 256,000257,000 were located in the District of Columbia and 531,000 were located in Maryland), as compared to 778,000787,000 customers as of December 31, 2010 (of which 256,000 were located in the District of Columbia and 531,000 were located in Maryland). As of December 31, 2009, Pepco distributed electricity to 778,000 customers (of which 252,000 were located in the District of Columbia and 526,000 were located in Maryland).
In 2011, Pepco distributed a total of 26,895,000 megawatt hours of electricity, of which 57% was distributed within its Maryland territory and 43% within the District of Columbia. Of this amount, 30% of the total megawatt hours were delivered to residential customers, 50% to commercial customers, and 20% to United States and District of Columbia government customers. In 2010, Pepco distributed a total of 27,665,000 megawatt hours of electricity, of which 57% was distributed within its Maryland territory and 43% within the District of Columbia. Of this amount, 30% of the total megawatt hours were delivereddistributed to residential customers, 49% to commercial customers, and 21% to United States and District of Columbia government customers. In 2009, Pepco distributed a total of 26,549,000 megawatt hours of electricity, of which 57% was distributed within its Maryland territory and 43% within the District of Columbia. Of this amount, 29% of the total megawatt hours were distributed to residential customers, 50% to commercial customers, and 21% to United States and District of Columbia government customers.
Pepco has been providing SOS in Maryland since July 2004. Pursuant to orders issued by the MPSC,Maryland Public Service Commission (MPSC), Pepco is obligated to provide SOS (i) to residential and small commercial customers until further action of the Maryland General Assembly and (ii) to medium-sized commercial customers through MayNovember 2012. Pepco purchases the electricity required to satisfy these SOS obligations from wholesale suppliers under contracts entered into in accordance with competitive bid procedures approved and supervised by the MPSC. Pepco also is obligated to provide Standard Offer Service, known as Hourly Priced Service (HPS), for large Maryland customers. Power to supply HPS customers is acquired in next-day and other short-term PJM RTO markets. Pepco is entitled to recover from its SOS customers the cost of acquiring the SOS supply, plus an administrative charge that is intended to allow Pepco to recover the administrative costs incurred to provide the SOS and a modest margin. Because the margin varies by customer class, the actual average margin over any given time period depends on the number of Maryland SOS customers in each customer class and the electricity used by such customers. Pepco is paid tariff rates for the distribution of electricity over its transmission and distribution facilities to all electricity customers in its Maryland service territory regardless of whether the customer receives SOS or purchases electricity from another supplier.
Pepco has been providing SOS in the District of Columbia since February 2005. Pursuant to orders issued by the DCPSC,District of Columbia Public Service Commission (DCPSC), Pepco is obligated to provide SOS to residential and small, medium-sized and large commercial customers indefinitely. Pepco purchases the electricity required to satisfy its SOS obligations from wholesale suppliers under contracts entered into in accordance with a competitive bid procedure approved and supervised by the DCPSC. Pepco is entitled to recover from its SOS customers the costs of acquiring the SOS supply, plus an administrative charge that is intended to allow Pepco to recover the administrative costs incurred to provide the SOS and a modest margin. Because the margin varies by customer class, the actual average margin over any given time period depends on the number of District of Columbia SOS customers in each customer class and the amount of electricity used by such customers. Pepco is paid tariff rates for the distribution of electricity over its transmission and distribution facilities to all electricity customers in its District of Columbia service territory regardless of whether the customer receives SOS or purchases electricity from another supplier.
7
For the year ended December 31, 2010, 46%2011, 43% of Pepco’s Maryland distribution sales (measured by megawatt hours) were to SOS customers, as compared to 46% and 49% in 2010 and 2009, respectively, and 29%27% of its District of Columbia distribution sales (measured by megawatt hours) were to SOS customers in 2010,2011, as compared to 29% and 31% in 2009.2010 and 2009, respectively.
DPL
DPL is engaged in the transmission, distribution and default supply of electricity in Delaware and portions of Maryland. In northern Delaware, DPL also supplies and delivers natural gas to retail customers and provides transportation-only services to retail customers that purchase natural gas from another supplier.
Distribution and Supply of Electricity
DPL’s electricity distribution service territory consists of the state of Delaware, and Caroline, Cecil, Dorchester, Harford, Kent, Queen Anne’s, Somerset, Talbot, Wicomico and Worcester counties in Maryland. This territory covers approximately 5,000 square miles and has a population of approximately 1.31.4 million. As of December 31, 2010,2011, DPL delivered electricity to 501,000 customers (of which 301,000 were located in Delaware and 200,000 were located in Maryland), as compared to 500,000 customers as of December 31, 2010 (of which 301,000 were located in Delaware and 199,000 were located in Maryland), as compared to 498,000 customers as. As of December 31, 2009, DPL delivered electricity to 498,000 customers (of which 299,000 were located in Delaware and 199,000 were located in Maryland).
In 2010,2011, DPL distributed a total of 12,853,00012,688,000 megawatt hours of electricity to its customers, of which 66% was distributed within its Delaware territory and 34% within Maryland. Of this amount, 41% of the total megawatt hours were distributed to residential customers, 42% to commercial customers and 17% to industrial customers. In 2010, DPL distributed a total of 12,853,000 megawatt hours of electricity, of which 66% was distributed within its Delaware territory and 34% within Maryland. Of this amount, 42% of the total megawatt hours were distributed to residential customers, 41% to commercial customers and 17% to industrial customers. In 2009, DPL distributed a total of 12,494,000 megawatt hours of electricity, of which 67% was distributed within its Delaware territory and 33% within Maryland. Of this amount, 39% of the total megawatt hours were distributed to residential customers, 41% to commercial customers and 20% to industrial customers.
DPL has been providing SOS in Delaware since May 2006. Pursuant to orders issued by the DPSC,Delaware Public Service Commission (DPSC), DPL is obligated to provide SOS to residential, small commercial and industrial customers through May 2014, and to medium, large and general service commercial customers through May 2012. DPL purchases the electricity required to satisfy these SOS obligations from wholesale suppliers under contracts entered into in accordance with competitive bid procedures approved and supervised by the DPSC. DPL also has an obligation to provide SOS, known as HPS, for the largest Delaware customers. Power to supply the HPS customers is acquired in next-day and other short-term PJM RTO markets. DPL’s rates for supplying SOS and HPS reflect the associated capacity, energy (including satisfaction of renewable energy requirements), transmission and ancillary services costs and an amount referred to as a Reasonable Allowance for Retail Margin (RARM).Margin. Components of the RARMReasonable Allowance for Retail Margin include a fixed annual margin of approximately $2.75 million, plus estimated incremental expenses, a cash working capital allowance, and recovery, with a return over five years ending 2011, of the capitalized costs of the billing system used for billing HPS customers. DPL is paid tariff rates for the distribution of electricity over its transmission and distribution facilities to all electricity customers in its Delaware service territory regardless of whether the customer receives SOS or purchases electricity from another supplier.
8
DPL has been providing SOS in Maryland since June 2004. Pursuant to orders issued by the MPSC, DPL is obligated to provide SOS to residential and small commercial customers until further action of the Maryland General Assembly, and to medium-sized commercial customers through May 2014. DPL purchases the electricity required to satisfy these SOS obligations from wholesale suppliers under contracts entered into in accordance with a competitive bid procedure approved and supervised by the MPSC. DPL also is obligated to provide SOS, known as HPS for large Maryland customers. Power to supply the HPS customers is acquired in next-day and other short-term PJM RTO markets. DPL is entitled to recover from its SOS customers the costs of acquiring the SOS supply, plus an administrative charge that is intended to allow DPL to recover the administrative costs incurred to provide the SOS and a modest margin. Because the margin varies by customer class, the actual average margin over any given time period depends on the number of Maryland SOS customers in each customer class and the electricity used by such customers. DPL is paid tariff rates for the distribution of electricity over its transmission and distribution facilities to all electricity customers in its Maryland service territory regardless of whether the customer receives SOS or purchases electricity from another supplier.
For the year ended December 31, 2010, 53%2011, 51% of DPL’s Delaware distribution sales (measured by megawatt hours) were to SOS customers, as compared to 53% and 51% in 2010 and 2009, respectively, and 63%58% of its Maryland distribution sales (measured by megawatt hours) were to SOS customers for the years ended December 31,in 2011, as compared to 63% in 2010 and 2009.
Supply and Distribution of Natural Gas
DPL provides regulated natural gas supply and distribution service to customers in a service territory consisting of a major portion of New Castle County in Delaware. This service territory covers approximately 275 square miles and has a population of approximately 500,000. Large volume commercial, institutional, and industrial natural gas customers may purchase natural gas either from DPL or from other suppliers. DPL uses its natural gas distribution facilities to deliver natural gas to customers that choose to purchase natural gas from another supplier. Intrastate transportation customers pay DPL distribution service rates approved by the DPSC. DPL purchases natural gas supplies for resale to its retail service customers from marketers and producers through a combination of long-term agreements and next-day distribution arrangements. For the year ended December 31, 2010,2011, DPL supplied 65%64% of the natural gas that it delivered, compared to 65% in 2010 and 68% in 2009.
In eachAs of the years ended December 31, 2010 and 2009,2011, DPL delivered natural gas to 124,000 customers as compared to 123,000 customers.customers as of December 31, 2010 and 2009. In 2010,2011, DPL delivered 19,000,000 Mcf (thousand cubic feet) of natural gas to customers in its Delaware service territory, of which 41%40% were sales to residential customers, 23% to commercial customers, 1% to industrial customers and 36% to customers receiving a transportation-only service. In 2010, DPL delivered 19,000,000 Mcf of natural gas, of which 41% were sales to residential customers, 23% were sales to commercial customers, 1% were sales to industrial customers and 35% were sales to customers receiving a transportation-only service. In 2009, DPL delivered 19,000,000 Mcf of natural gas, of which 42% were sales to residential customers, 25% were sales to commercial customers, 1% were sales to industrial customers and 32% were sales to customers receiving a transportation-only service.
ACE
ACE is primarily engaged in the transmission, distribution and default supply of electricity in a service territory consisting of Gloucester, Camden, Burlington, Ocean, Atlantic, Cape May, Cumberland and Salem counties in southern New Jersey. ACE’s service territory covers approximately 2,700 square miles and has a population of approximately 1.1 million. As of December 31, 2010,2011, ACE distributed electricity to 548,000547,000 customers in its service territory, as compared to 548,000 and 547,000 customers as of December 31, 2009.2010 and 2009, respectively.
9
In 2011, ACE distributed a total of 9,683,000 megawatt hours of electricity to its customers, of which 46% of the total was distributed to residential customers, 45% to commercial customers and 9% to industrial customers. In 2010, ACE distributed a total of 10,185,000 megawatt hours of electricity to its customers, of which 46% of the total was distributed to residential customers, 44% to commercial customers, and 10% to industrial customers. In 2009, ACE distributed a total of 9,659,000 megawatt hours of electricity to its customers, of which 45% was distributed to residential customers, 45% to commercial customers, and 10% to industrial customers.
Electric customers in New Jersey who do not choose another supplier receive BGS from their electric distribution company. New Jersey’s electric distribution companies, including ACE, jointly obtain the electricity to meet their BGS obligations from competitive suppliers selected through auctions authorized by the NJBPUNew Jersey Board of Public Utilities (NJBPU) for the supply of New Jersey’s total BGS requirements. Each winning bidder is required to supply its committed portion of the BGS customer load with full requirements service, consisting of power supply and transmission service.
ACE provides two types of BGS:
BGS-Fixed Price (BGS-FP), which is supplied to smaller commercial and residential customers at seasonally-adjusted fixed prices. BGS-FP rates change annually on June 1 and are based on the average BGS price obtained at auction in the current year and the two prior years. As of December 31, 2010,2011, ACE’s BGS-FP peak load was approximately 1,6381,500 megawatts, which represents approximately 98% of ACE’s total BGS load.
BGS-Commercial and Industrial Energy Price (BGS-CIEP), which is supplied to large customers at hourly PJM RTO real-time market prices for a term of 12 months. As of December 31, 2010,2011, ACE’s peak BGS-CIEP load was approximately 2820 megawatts, which represents approximately 2% of ACE’s BGS load.
ACE is paid tariff supply rates established by the NJBPU that compensate it for the cost of obtaining the BGS supply. These rates are set such that ACE does not make any profit or incur any loss on the supply component of the BGS it supplies to customers. ACE is paid tariff rates for the distribution of electricity over its transmission and distribution facilities to all electricity customers in its service territory regardless of whether the customer receives BGS or purchases electricity from another supplier.
For the year ended December 31, 2010, 65%2011, 56% of ACE’s total distribution sales (measured by megawatt hours) were to BGS customers, as compared to 65% and 73% in 2009.2010 and 2009, respectively.
ACE has contracts with three unaffiliated non-utility generators (NUGs) under which ACE is obligated to purchase capacity and the entire generation output of the facilities. One of the contracts expires in 2016 and the other two expire in 2024. In 2010,2011, ACE purchased 2.51.9 million megawatt hours of power from the NUGs. ACE sells this electricity into the wholesale market administered by PJM.
In 2001, ACE established Atlantic City Electric TransitionTransitional Funding LLC (ACE Funding) solely for the purpose of securitizing authorized portions of ACE’s recoverable stranded costs through the issuance and sale of bonds (Transition Bonds). The proceeds of the sale of each series of Transition Bonds were transferred to ACE in exchange for the transfer by ACE to ACE Funding of the right to collect a non-bypassable transition bond charge from ACE customers pursuant to bondable stranded costs rate orders issued by the NJBPU in an amount sufficient to fund the principal and interest payments on the Transition Bonds and related taxes, expenses and fees (Bondable Transition Property). The assets of ACE Funding, including the Bondable Transition Property, and the Transition Bond charges collected from ACE’s customers, are not available to creditors of ACE. The holders of Transition Bonds have recourse only to the assets of ACE Funding.
10
Other Power Delivery Initiatives and Activities
Reliability Enhancement and Emergency Restoration Improvement Plans
DuringIn 2010, PepcoPHI announced Comprehensive Reliability Enhancement Planscomprehensive reliability enhancement plans for Maryland and the District of Columbia. Each six point plan advances work on existing programs and initiates new activities designed to increase the reliability of Pepco distribution services in Maryland and the District of Columbia. TheThese reliability enhancement plans include various initiatives such as enhanced vegetation management, the identification and upgrading of underperformingunder-performing feeder lines, the addition of new facilities to support load, growth,the installation of distribution automation systems on both the overhead and underground network system, the rejuvenation and replacement of underground residential cable replacementcables, improvements to substation supply lines and selective undergrounding of service lines. By focusingportions of existing above ground primary feeder lines, where appropriate to improve reliability and enhance customer satisfaction. During 2011, Pepco continued to execute on these six areas, Pepcoits plans to increase theimprove reliability of the distribution system bywhich it believes have contributed to its progress in reducing both the frequency and the duration of power outages. The incremental cost ofDuring 2011, Pepco invested $120 million in capital expenditures on these reliability enhancement activities. Since initiating the reliability enhancement plans, Pepco trimmed trees along nearly 3,500 miles of power lines, completed 48 expansion projects to meet growth in customer demand for electricity, upgraded more than 340 miles of aging underground lines, and added 125 automated switches that will reroute power more effectively during outages. PHI has extended its reliability enhancement efforts to DPL and ACE.
In 2011 PHI initiated an accelerated emergency restoration improvement program prior to the start of the 2011 summer storm season. As part of this program, Pepco:
more than doubled the number of telephone trunk lines to its Washington, D.C. regional call center;
developed mobile applications to report and track outages;
improved outage information on its Web site to enhance communications with its customers;
implemented regional storm centers for more efficient crew dispatch;
implemented better methodologies for estimating times for restoration of power;
employed technology, including smart meters, to obtain real-time information from the field on power outages and to assist restoration planning efforts by providing data needed to conduct real-time damage assessments;
augmented training of its emergency response personnel; and
installed a backup crisis call center.
These and other emergency restoration improvements overimplemented as a part of this program were tested during Hurricane Irene in August 2011. Although nearly 500,000 customers across all three utilities were without power at the next five years is estimated to be $100 millionpeak of the storm, nearly 98% of outages were restored within a little more than two days.
PHI’s capital expenditures for continuing reliability enhancement efforts are included in the Maryland service territory and $90 million in the Districttable of Columbia service territory. For a discussion of theprojected capital expenditures, associated with these plans, see Item 7, “Management’s Discussion and Analysis of Financial Condition and Results of Operations - Capital—Capital Resources and Liquidity -– Capital Expenditure - Reliability Enhancement Plans” of this Form 10-K.Expenditures.”
Blueprint for the Future
Each of PHI’s three utilities areutility subsidiaries is participating in a PHI initiative referred to as the “Blueprint for the Future,” which is designed to meet the challenges of rising energy costs, respond to concerns about the environment, improvedimprove reliability and address government energy reduction goals. The initiative includes the implementation of various programs to help customers better manage their energy use, reduce the total cost of energy and provide other benefits. These programs also allow each utilityenhance the ability of PHI’s utilities to better manage and operate their electrical and natural gas distribution systems.
11
One of the primary initiatives of Blueprint for the future programs include:
Rebates and other financial incentives to encourage residential customers to replace inefficient appliances and for business customers to use more energy-efficient equipment, such as improved lighting, heating, ventilation and air-conditioning systems.
TheFuture is the installation of smart meters for all electric customers in their service territories, and for natural gas customers in the case of DPL (also known as Advanced Metering infrastructureInfrastructure (AMI)) as has been, or may be approved byfor electric and natural gas customers, which are subject to the approval of applicable state regulators. These smart meters allow the utilities, among other capabilities, to remotely read meters, significantly reduce estimatedthe number of customer bills that are based on usage estimates, improve outage management and detection, and provide customers with more detailed information about their energy consumption.
In addition to the replacement of existing meters, the AMI system involves the construction of a wireless network across the service territories of PHI’s utility subsidiaries and the implementation and integration of new and existing information technology systems to collect and manage data made available by the advanced meters. The installation, at the customer’s option, of smart thermostats or direct load control switches. This equipment reduces residential air conditioner load during times of high wholesale market prices or periods of system constraints. In exchange, customers receive additional financial incentives through bill credits or new dynamic pricing rate structures.
Further automationimplementation of the AMI system involves a combination of technologies provided by multiple vendors. Meter installation is substantially complete for DPL electric distribution system and enhanced communications.
The status of some of the more significant aspects of these initiatives is as follows:
Smart meters (AMI):
Pepco in the District of Columbia: The DCPSC approved the implementation of AMI in December 2009, with cost recovery mechanisms. Full scale implementation of AMI began in October 2010.
Pepco in Maryland: The MPSC approved full-scale implementation of AMI in August 2010, with implementation to begin following approval of a customer education plan.
DPL in Maryland: Final approval of the MPSC is pending approval of an updated cost-benefit study and a customer communications plan.
DPLcustomers in Delaware, for both electric and gas operations: The DPSC approved implementation of AMI in September 2008, including cost recovery mechanisms. Implementation of AMI iswith meter activation expected to be completed in 2011.
ACE: The NJBPUthe first quarter of 2012. Meter installation is notprogressing for Pepco customers in both the District of Columbia and Maryland, with installation expected to approve ACE’s proposal for implementationbe complete in the second and fourth quarters of 2012, respectively. The respective public service commissions have approved the creation of a regulatory asset to defer AMI costs between rate cases, as well as the accrual of a return on the deferred costs. Thus, these costs will be recovered through base rates in the future.
Approval of AMI is still pending for electric customers in DPL’s Maryland service territory, and has been deferred for ACE in New Jersey.
On December 20, 2011, the near term.Delaware Public Service Commission approved DPL’s request to implement dynamic pricing for its Delaware customers. Dynamic pricing will reward SOS customers for lowering their energy use during those times when energy demand and, consequently, the cost of supplying electricity, are higher. Implementation for residential customers will be phased in commencing in 2012 through 2013. Implementation of dynamic pricing for commercial and industrial SOS customers in Delaware will be phased in commencing in 2013 through 2014.
Direct load control programs:
Dynamic pricing has been approved in concept for Pepco customers in Maryland, with phase-in for residential customers beginning in 2012. Pepco has dynamic pricing proposals pending in the District of Columbia: The recovery of costsColumbia jurisdiction with the proposed phase-in for the direct load control program through a surcharge was rejected by the DCPSC on December 20, 2010. As a result, program implementationresidential customers anticipated to begin in 2012. Dynamic pricing has not yet been approved.
Pepco in Maryland: The recovery of costs for the direct load control air-conditioners through a surcharge was approved by MPSC in January 2010. The recovery of costs for smart thermostats through a surcharge is still in progress.
DPL in Maryland: The installation of switches for air conditioners commenced in 2009, and the recovery of costs through a surcharge was approved in January 2010. The installation of smart thermostatsconcept pending AMI deployment authorization for DPL’s Maryland customers and has been temporarily suspended pending resolution of a technical issue.
DPLdeferred for ACE’s customers in Delaware: The installation of smart thermostats and air-conditioning switches is dependent upon commission approval.New Jersey.
ACE: The NJBPU approved the surcharge for residential direct load control program in June 2010.
For a discussion of the capital expenditures associated with Blueprint for the Future, See Item 7,see “Management’s Discussion and Analysis of Financial Condition and Results of Operations — Capital—Capital Resources and Liquidity —– Capital Expenditure —Requirements – Blueprint for the Future” of this Form 10-K.Future.”
MAPP Project
In October 2007, the PJM Board of Managers approved PHI’s proposal to construct a new 230-mile, 500-kilovolt interstate transmission line referred to as the Mid-Atlantic Power Pathway (MAPP), as part of PJM’s regional transmission expansion plan to address the reliability objectives of the PJM RTO system. Since that time, there have been various modifications to the proposal that have redefined the length and route of the MAPP project. PJM has approved the use of advanced direct current technology for segments of the project, including the portion of the line that will traverse under the Chesapeake Bay. The direct current portion of the line will be 640-kilovolts640 kilovolts and the remainder of the line will be 500-kilovolts.500 kilovolts. As currently approved by the PJM Board of Managers, MAPP is approximately 150-miles152 miles in length originating at the Possum Point substation in Virginia and ending at the Indian River substation in Delaware. The cost of the MAPP project for Pepco and DPL is currently estimated to be $1.2 billionbillion.
12
In connection with the MAPP project, FERC has authorized for each of Pepco and DPL a 150 basis point adder to its return on equity, resulting in a FERC-approved rate of return on the planned in serviceMAPP project of 12.8%, along with full recovery of construction work-in-progress and prudently incurred abandoned plant costs.
On August 18, 2011, PJM notified PHI that the scheduled in-service date isfor MAPP has been delayed from June 1, 2015.
PHI understands that PJM currently is2015 to the 2019 to 2021 time period, after taking into account changes in the process of reassessing reliability requirements of the PJM RTO system in the context of the preparation of its 2011 Regional Transmission Expansion Plan, which is scheduled to be completed in June 2011. This reassessment is expected to take into accountdemand response, generation retirements and additions, and a revised load forecast for the PJM region that is significantly lower than the load that was forecastforecasted in prior PJM studies. This reassessment could resultA more recent load forecast continues to support this trend. PJM has retained the MAPP project in a further deferralits 2011 Regional Transmission Expansion Plan. In light of the required operationaldelayed in-service date for MAPP, substantially all of the anticipated capital expenditures associated with MAPP have been delayed until at least 2016 based on current projections.
The exact revised in-service date of all or a portionMAPP will be evaluated as part of PJM’s 2012 Regional Transmission Expansion Plan review process. Until PJM’s evaluation is concluded, PJM has directed PHI to limit further development efforts with respect to the MAPP transmission line.
The construction ofproject and to proceed with only those development efforts reasonably necessary to allow the MAPP requires various permitsproject to be quickly restarted if and approvals, includingwhen deemed necessary. Based on PJM’s direction, PHI intends to continue to complete the approval ofright-of-way acquisition for the MPSC. The MPSC has issued a procedural schedule to consider a request for a Certificate of Public Convenienceproposed route, and Necessity filed by Pepcosome environmental and DPL, which contemplates decision by January 31, 2012.other preparatory activities.
For a discussion of the capital expenditures associated with the MAPP project,Project, see Item 7, “Management’s Discussion and Analysis of Financial Condition and Results of Operations — Capital—Capital Resources and Liquidity —– Capital Expenditure —Requirements – MAPP Project” of this Form 10-K.Project.”
Pepco Energy Services
Pepco Energy Services is engaged in the following businesses:
providing energy efficiency services principally to federal, state and local government customers, and designing, constructing, and operating combined heat and power and central energy plants.
providing high voltage electric construction and maintenance services to customers throughout the United States and low voltage electric construction and maintenance services and streetlight construction and asset management services to utilities, municipalities and other customers in the Washington, D.C. area.
Most of Pepco Energy Services’ contracts with federal, state and local governments, as well as independent agencies such as housing and water authorities, contain provisions authorizing the governmental authority or independent agency to terminate the contract at any time. Those provisions contain explicit mechanisms that, if exercised, would require the other party to pay Pepco Energy Services alsofor work performed through the date of termination and for additional costs incurred as a result of the termination.
From time to time, PHI is required to guarantee the obligations of Pepco Energy Services under certain of its construction contracts. At December 31, 2011, PHI’s guarantees of Pepco Energy Services’ projects totaled $65 million.
Pepco Energy Services has historically been engaged in the business of providing retail energy supply services, consisting of the sale of electricity, including electricity from renewable resources, primarily to commercial, industrial and government customers located primarily in the mid-Atlantic and northeastern regions of the U.S.,United States, as well as Texas and Illinois, and the sale of natural gas to customers located primarily in the mid-Atlantic region. In December 2009, PHI announced that it would wind downwind-down the retail energy supply business. Pepco Energy Services is implementing this wind downwind-down by not entering into any new supply contracts, while continuing to perform under its existing supply contracts through their expiration dates. As of December 31, 2010,2011, Pepco Energy Services’ estimated retail electricity backlog was approximately 9.73.9 million megawatts for distribution through 2014, a decrease of approximately 10.45.8 million megawatts and 16.2 million megawatts when compared to December 31, 2009.2010 and 2009, respectively. For additional information on the Pepco Energy Services wind-down, see Item 7, “Management’s Discussion and Analysis of Financial Condition and Results of Operations – General Overview – Pepco Energy Services.”
Pepco Energy Services’ retail natural gas sales volumes and revenues are seasonally dependent. Colder weather from November through March of each year generally translates into increased sales volumes, which, when coupled with higher natural gas prices during these months, allows Pepco Energy Services to recognize generally higher revenues as compared to other months of the year. Retail electricity sales volumes are also seasonally dependent, with sales in the summer and winter months being generally higher than other months of the year, which, when coupled with higher electricity prices during these periods, allows Pepco Energy Services to recognize generally higher revenues as compared to other periods during the year. However, as Pepco Energy Services is in the process of winding down its retail energy supply business, this Form 10-K.effect of seasonality will likely decrease as such wind-down is completed. The energy services business is not seasonal.
Pepco Energy Services owns and operates two oil-fired generating facilities. The facilities are located in Washington, D.C. and have a combined generating capacity of approximately 790 megawatts. See Item 2, “Properties” of this Form 10-K. Pepco Energy Services sells the output of these facilities into the wholesale market administered by PJM. In February 2007, Pepco Energy Services provided notice to PJM of its intention to deactivate these facilities. Pepco Energy Services currently plans to deactivate both facilities inby the end of May 2012. PJM has informed Pepco
13
Energy Services that these facilities arewill not expected to be needed for reliability after that time, but that its evaluationMay 2012; therefore decommissioning plans are currently underway and on schedule. It is dependent on the completion of transmission and distribution upgrades. Pepco Energy Services’ timing fornot expected that deactivation of thethese facilities in whole or in part, may be delayed based on reliability considerations, economic conditions and the operating condition of the facilities. Deactivation will not have a material impact on PHI’s financial condition, results of operations or cash flows.
Pepco Energy Services also owns three landfill gas-fired electricity facilities that have a total generating capacity rating of ten megawatts, the output of which is sold into the wholesale market administered by PJM andPJM. Pepco Energy Services also owns a solar photovoltaic facility that has a generating capacity rating of two megawatts, the output of which is sold to its host facility.
Pepco Energy Services’ continuing lines of business will not be significantly affected by the wind downwind-down of the retail energy supply business.
PJM Capacity Markets
A source of revenue forHistorically, Pepco Energy Services has beenearned revenue from the sale of capacity associated with its generating facilities. The wholesale market for capacity in the PJM RTO region is administered by PJM, which is responsible for ensuring that within its transmission control area there is sufficient generating capacity available to meet the load requirements plus a reserve margin. In accordance with PJM requirements, retail sellers ofmargin and locates and prices electricity in the PJM market are required to maintain capacity from generating facilities within the control area, or capacity for generating facilities outside the control area that have firm transmission rights into the control area that correspond to their load service obligations. This capacity can be obtained through the ownership of generation facilities, entry into bilateral contracts or the purchase of capacity credits in the auctions administered by PJM. Both generating facilities owned by Pepco Energy Services are located in the transmission control area administered by PJM.
Beginning on June 1, 2007, PJM replaced its former capacity market rules with a forward capacity auction procedure known as the Reliability Pricing Model (RPM), which provides for differentiation in capacity prices between “locational deliverability areas.” Under RPM, PJM holdsholding annual auctions covering capacity to be supplied over consecutive 12-month periods. Pepco Energy Services ishas been exposed to deficiency charges payable to PJM ifwhen their generation units failfailed to meet certain reliability levels. Some deficiency charges may be reduced by purchasing capacity from PJM or third parties.
Since Pepco Energy Services intends to deactivate its two oil-fired generating facilities by May 2012, Pepco Energy Services has not included the facilities’ capacity in any auctions for periods after May 2012.
Competition
In providingPepco Energy Services’ energy management services business is highly competitive. Pepco Energy Services competes with numerous other providers. Competitionenergy services companies primarily with respect to contracts with federal, state and local governments and independent agencies. Many of these energy services companies are subsidiaries of larger construction or utility holding companies (as is the case with Pepco Energy Services). Among the factors as to which the energy services business competes are the amount and duration of the guarantees provided in energy savings performance contracts and the quality and value of service provided to customers. The energy services business is impacted by new entrants into the market, for energy management services is based primarily on overall value to customers.prices, and general economic conditions.
Other Business Operations
Between 1994 and 2002, PCI, a subsidiary of PHI, entered into eight cross-border energy lease investments involving public utility assets (primarily consisting of hydroelectric generation and coal-fired electric generation facilities and natural gas distribution networks) located outside of the United States. Each of these investments is structured as a sale and leaseback transaction commonly referred to as a sale-in, lease-out, or SILO, transaction. During the second quarter of 2011, PHI entered into early termination agreements with two lessees involving all of the leases comprising one of the eight lease investments and a small portion of the leases comprising a second lease investment. The early termination of the leases were negotiated at the request of the lessees and were completed in June 2011. As of December 31, 2010,2011, PHI’s equity investment in its cross-border energy leases was approximately $1.4$1.3 billion. For additional information concerning these cross-border energy lease investments, see Note (8), “Leasing Activities,” and Note (17), “Commitments and Contingencies,” to the consolidated financial statements of PHI.
14
Regulation
The operations of PHI’s utility subsidiaries, including the rates and tariffs they are permitted to charge customers for the distribution and transmission of electricity and, in the case of DPL, the distribution and transportation of natural gas, are subject to regulation by governmental agencies in the jurisdictions in which the subsidiaries provide utility service as follows:
Pepco’s electricity distribution operations are regulated in Maryland by the MPSC and in the District of Columbia by the DCPSC.
DPL’s electricity distribution operations are regulated in Maryland by the MPSC and in Delaware by the DPSC.
DPL’s natural gas distribution and intrastate transportation operations in Delaware are regulated by the DPSC.
ACE’s electricity distribution operations are regulated by the NJBPU.
Each utility subsidiary’s transmission facilities are regulated by FERC.
DPL’s interstate transportation and wholesale sale of natural gas are regulated by FERC.
Each utility subsidiary’s and Pepco Energy Services’ bulk power system is subject to reliability standards established by NERC.
Rates and tariffs are established by these regulatory commissions. PHI’s utility subsidiaries have filed rate cases which are pending in each of its jurisdictions as further described in Note (7), “Regulatory Matters – Regulatory Proceedings – Rate Proceedings,” to the consolidated financial statements of PHI.
The rates and tariffs established by these regulatory commissions are intended to balance the interests of the utilities’ customers and those of its investors by reflecting costs incurred during the period in which the rates are in effect, and giving each utility the opportunity to generate revenues sufficient to recover its costs, including a reasonable rate of return on investor supplied capital during such period. In establishing a utility’s rates, an important factor in the ability of each of Pepco, DPL and ACE to earn its authorized rate of return is the willingness of applicable public service commissions to adequately recognize forward-looking costs in the utility’s rate structure in order to minimize the shortfall in revenues due to the delay in time or “lag” between when costs are incurred and when they are reflected in rates. This delay is commonly known as “regulatory lag.” Each of Pepco, DPL and ACE is currently experiencing significant regulatory lag because their investment in the rate base and operating expenses is outpacing revenue growth.
Higher operating and construction costs, including labor, material, depreciation, taxes and financing costs, as well as costs associated with enhanced distribution system reliability and environmental compliance, are expected at each of PHI’s utility subsidiaries for several years into the future. At the same time, low usage growth and customer growth is expected to limit the growth in revenues. This mismatch between high expense growth and low revenue growth exacerbates regulatory lag for each of PHI’s utility subsidiaries, making it more difficult for each utility to earn equity returns that are allowed by regulators without higher rates or other regulatory relief. See “Risk Factors – The failure of PHI set forthto obtain timely recognition of costs in Part II, Item 8its rates may have a negative effect on PHI’s results of operations and financial condition.”
Pepco, DPL and ACE anticipate that they will continue to face regulatory lag. In their most recent rate cases, Pepco (in the District of Columbia and Maryland) and DPL (in Delaware and Maryland) each has proposed mechanisms that would track reliability and other expenses and permit the utility between rate cases to make adjustments in its rates for prudent investments as made, thereby seeking to reduce the magnitude of regulatory lag. In New Jersey, the NJBPU has approved certain rate recovery mechanisms
15
in connection with ACE’s Infrastructure Investment Program (IIP), which ACE has proposed to extend and expand. There can be no assurance that these proposals or any other attempts by Pepco, DPL and ACE to mitigate regulatory lag will be approved, or that even if approved, the rate recovery mechanisms or any base rate cases will fully ameliorate the effects of regulatory lag. Until such time as these proposed mechanisms are approved, if necessary to address the problem of regulatory lag, the utilities plan to file rate cases at least annually in an effort to align more closely their revenue and related cash flow levels with other operation and maintenance spending and capital investments. In future rate cases, Pepco, DPL and ACE, as applicable, would also continue to seek cost recovery and tracking mechanisms from applicable regulatory commissions to reduce the effects of regulatory lag.
Maryland Reliability Investigation
In August 2010, following major storm events that occurred in July and August 2010, an investigation was initiated in Maryland into the reliability of Pepco’s distribution system and the quality of distribution service Pepco provided to its customers. As a result of that investigation, the MPSC imposed sanctions on Pepco in December 2011, including a fine of $1 million, which Pepco has paid. In accordance with the order, Pepco has filed a detailed work plan for the next five years, which provided a comprehensive description of Pepco’s reliability enhancement plan, its emergency response improvement project, and other communication and service restoration improvements. Pepco is also required to file quarterly updates and a year-end status report with the MPSC providing, among other things, detailed information about its reliability and emergency response improvement objectives, progress and spending (and explanations for any inability to meet such objectives), together with an analysis of trends concerning the measured duration and frequency of customer interruptions. In the required reports, Pepco will be required to demonstrate that its reliability enhancement plan costs were prudently spent and produced a significant improvement in reliability, and if it is unable to do so, the MPSC may deny Pepco reimbursement for future reliability enhancement investments or impose additional fines. In addition to the sanctions, the MPSC stated its intent to review the recovery of reliability costs in Pepco’s pending rate case and to disallow incremental costs it determines to be the result of imprudent management. Pepco believes its reliability costs have been prudently incurred. Furthermore, Pepco expects its reliability enhancement plan to enable Pepco to meet the MPSC’s requirements. For more information about the MPSC’s ruling in this Form 10-K.proceeding, see Note (7), “Regulatory Matters – Regulatory Proceedings,” to the consolidated financial statements of PHI.
District of Columbia and Maryland Reliability and Customer Service Rulemakings
In December 2011, the MPSC approved proposed rules establishing reliability and customer service regulations, compliance with which is anticipated to be mandated as early as the second quarter of 2012. In addition, in July 2011, the DCPSC adopted regulations that establish specific maximum outage frequency and outage duration levels beginning in 2013 and continuing through 2020 and thereafter and are intended to require Pepco to achieve a reliability level in the first quartile of all utilities in the nation by 2020. Pepco and DPL each expect to incur significant operation and maintenance spending and capital investments to comply with these requirements. Pepco believes that the DCPSC’s standards are achievable in the short term, but continues to believe that the standards may not be realistically achievable at an acceptable cost over the longer term. The reliability standards permit Pepco to petition the DCPSC to reevaluate these standards for the period from 2016 to 2020 to address feasibility and cost issues.
Maryland New Generation RFP Issuance Requirement
In September 2009, the MPSC initiated an investigation into whether Maryland’s regulated electric distribution companies (EDCs) should be required to enter into long-term contracts with entities that construct, acquire or lease, and operate, new electric generation facilities in Maryland. In September 2011, the MPSC issued a notice in which it stated that it had not made a final determination at this time whether new generation in Maryland is needed, but directed each of the four Maryland EDCs, including Pepco and DPL, to issue a request for proposal (RFP) for new generation resources by October 7, 2011. On that date, Pepco and DPL issued the RFP and sought additional information from the MPSC on
16
several aspects of the process established in the notice, including whether the MPSC will consider a utility-owned generation option. Hearings were held on January 31, 2012, to obtain further input on whether the EDCs should be ordered to proceed with the RFP. Pepco and DPL have filed a request for rehearing of the notice. The MPSC has stated its intent to select generators and execute long-term contracts between the generators and selected EDCs in April 2012. PHI opposes the requirement to enter into such long-term contracts, which would be viewed as debt by the credit rating agencies and would have an adverse effect on PHI’s, Pepco’s and DPL’s credit metrics.
ACE Standard Offer Capacity Agreements
In April 2011, ACE entered into three Standard Offer Capacity Agreements (SOCAs) by order of the NJBPU, each with a different generation company. The SOCAs were established under a New Jersey law enacted to promote the construction of qualified electric generation facilities in New Jersey. The SOCAs are 15-year, financially settled transactions approved by the NJBPU that allow generators to receive payments from, or make payments to, ACE based on the difference between the fixed price in the SOCAs and the price for capacity that clears PJM. Each of the other EDCs in New Jersey has entered into SOCAs having the same terms with the same generation companies. The annual share of payments or receipts for ACE and the other EDCs is based upon each company’s annual proportion of the total New Jersey load attributable to all EDCs. The NJBPU has approved full recovery from distribution customers of payments made by ACE and the other EDCs, and distribution customers would be entitled to any payments received by ACE and the other EDCs.
ACE and the other EDCs entered the SOCAs under protest based on concerns about the potential cost to distribution customers and the negative credit rating agency implications and have filed lawsuits challenging the constitutionality of the New Jersey law. For more information about the New Jersey law and associated regulatory and legal proceedings, see Note (2), “Significant Accounting Policies – Consolidation of Variable Interest Entities – ACE Standard Offer Capacity Agreements,” to the consolidated financial statements of PHI.
Delaware Renewable Energy Portfolio Standards
DPL is subject to Renewable Energy Portfolio Standards (RPS) in the state of Delaware that require it to obtain renewable energy credits (RECs) for energy delivered to its customers. In July 2011, the Governor of the State of Delaware signed legislation that expands DPL’s RPS obligations beginning in 2012. Before this legislation, DPL was required to obtain RECs for energy delivered only to SOS customers in Delaware; the legislation expands that requirement to energy delivered to all of DPL’s distribution customers in Delaware. DPL’s costs associated with obtaining RECs to fulfill its RPS obligations are recoverable from its distribution customers by law.
The legislation also establishes that the energy output from fuel cells manufactured in Delaware capable of running on renewable fuels is an eligible resource for RECs under the Renewable Portfolio Standards Act. The legislation requires that the DPSC adopt a tariff under which DPL would be an agent that collects payments from its customers and disburses the amounts collected to a qualified fuel cell provider that deploys Delaware-manufactured fuel cells as part of a 30-megawatt generation facility. The legislation also provides for a reduction in DPL’s REC and solar REC requirements based upon the actual energy output of the 30-megawatt generation facility. In October 2011, the DPSC approved the tariff submitted by DPL in response to the legislation. For more information on the tariff, see Note (2), “Significant Accounting Policies – Consolidation of Variable Interest Entities – DPL Renewable Energy Transactions,” to the consolidated financial statements of PHI.
17
NERC Reliability Standards
NERC has established, and FERC has approved, reliability standards with regard to the bulk power system that impose certain operating, planning and cyber security requirements on Pepco, DPL, ACE and Pepco Energy Services. There are eight NERC regional oversight entities, including ReliabilityFirstCorporation (RFC), of which Pepco, DPL, ACE and Pepco Energy Services are members, and Northeast Power Coordinating Council (NPCC), of which Pepco Energy Services is a member. These oversight entities are charged with the day-to-day implementation and enforcement of NERC’s reliability standards, which impose certain operating, planning and cyber security requirements on the bulk power systems of Pepco, DPL, ACE and Pepco Energy Services. RFC and NPCC perform compliance audits on entities registered with NERC based on reliability standards and criteria established by NERC. NERC, RFC and NPCC also conduct compliance investigations in response to a system disturbance, complaint, or possible violation of a reliability standard identified by other means. Each of PHI’s utility subsidiaries and Pepco Energy Services are subject to routine audits and monitoring for compliance with applicable NERC reliability standards, including standards requested by FERC to increase the number of assets designated as “critical assets” (including cyber security assets) subject to NERC’s cyber security standards. NERC is empowered to impose financial penalties, fines and other sanctions for non-compliance with certain rules and regulations.
Employees
At December 31, 2010,2011, PHI had 5,014 employees, including 1,375 employed by Pepco, 905 employed by DPL, 553 employed by ACE and 1,662 employed by PHI Service Company. The remaining employees were employed by Pepco Energy Services. Approximately 2,592 employees (including 1,028 employed by Pepco, 699 employed by DPL, 390 employed by ACE, 331 employed by the PHI Service Company, and 144 employed by Pepco Energy Services)following number of employees:
| In Collective Bargaining Agreements | ||||||||||||||||||||
| Non-union | International Brotherhood of Electrical Workers | International Union of Operating Engineers | Other | Total | ||||||||||||||||
Pepco | 354 | 1,094 | — | — | 1,448 | |||||||||||||||
DPL | 228 | 688 | — | — | 916 | |||||||||||||||
ACE | 174 | 384 | — | — | 558 | |||||||||||||||
Pepco Energy Services | 273 | 199 | 56 | 27 | 555 | |||||||||||||||
PHI Service Company and Other | 1,261 | 366 | — �� | — | 1,627 | |||||||||||||||
|
|
|
|
|
|
|
|
|
| |||||||||||
Total PHI Employees | 2,290 | 2,731 | 56 | 27 | 5,104 | |||||||||||||||
|
|
|
|
|
|
|
|
|
| |||||||||||
PHI’s subsidiaries are covered byparties to five collective bargaining agreements with various locals offour local unions. All five collective bargaining agreements will expire within the International Brotherhood of Electrical Workers.next four years, including one agreement that will expire on June 1, 2012. Collective bargaining agreements are generally renegotiated every three to five years.
Environmental Matters
PHI, through its subsidiaries, is subject to regulation by various federal, regional, state, and local authorities with respect to the environmental effects of its operations, including air and water quality control, solid and hazardous waste disposal, greenhouse gas emissions, and limitations on land use. In addition, federal and state statutes authorize governmental agencies to compel responsible parties to clean up certain abandoned or unremediated hazardous waste sites. PHI’s subsidiaries may incur costs to clean up currently or formerly owned facilities or sites found to be contaminated, as well as other facilities or sites that may have been contaminated due to past disposal practices. PHI’s subsidiaries may also be responsible for ongoing environmental remediation costs associated with facilities or operations that have been sold to third parties as further described in Note (17), “Commitments and Contingencies – Environmental Matters – Conectiv Energy Wholesale Power Generation Sites,” to the consolidated financial statements of PHI.
18
PHI’s subsidiaries’ currently have no projected capital expenditures for the replacement of existing or installation of new environmental control facilities that are necessary for compliance with environmental laws, rules or agency orders.orders are approximately $6 million in 2012 and $3 million in each of 2013, 2014 and 2015. This projection could change depending on the outcome of the matters addressed below or as a result of the imposition of additional environmental requirements or new or different interpretations of existing environmental laws, rules and agency orders.
In view of the sale of the Conectiv Energy wholesale power generation business in 2010, PHI is no longer subject to environmental regulations prospectively applicable to electricity generating facilities, except insofar as such regulations affect the operation of the two generating facilities located in the District of Columbia owned by Pepco Energy Services. Moreover, PHI anticipates that these regulations will cease to apply to PHI electricity generating facilities altogether after May 2012, assuming the two generating facilities are deactivated by Pepco Energy Services as planned.
Air Quality Regulation
The generating facilities owned by Pepco Energy Services are subject to federal, state and local laws and regulations, including the Federal Clean Air Act, (CAA), which limit emissions of air pollutants, require permits for operation of facilities and impose recordkeeping and reporting requirements.
Sulfur Dioxide and Nitrogen Oxide Emissions
The acid rain provisions of the CAAClean Air Act regulate total sulfurSulfur dioxide (SO2) emissions from affected generating units and allocate “allowances” to each affected unit that permit the unit to emit a specified amount of SO2. The generating facilities of Pepco Energy Services that require SO2 allowances use allocated allowances or allowances acquired, as necessary, in the open market to satisfy the applicable regulatory requirements.
In 2005, the U.S. Environmental Protection Agency (EPA) issued the Clean Air Interstate Rule (CAIR), which imposes further reductions of SO2 and limits nitrogen oxide (NOx) emissions from electric generating units in 28 eastern states and the District of Columbia. CAIR uses an allowance system to cap state-wide emissions (and emissions within the District of Columbia) of SO2 (using acid rain allowances) and NOx allowances, as described below, in two stages. NOx reductions were required beginning in 2009 and SO2 reductions were required beginning in 2010. States and the District of Columbia may implement CAIR by adopting EPA’s trading program or through adopting regulations that at a minimum achieve the level of reductions that would otherwise be achieved through implementation of EPA’s trading program. Pepco Energy Services Buzzard Point generating units and its landfill gas generating units produce fewer megawatts than CAIR’s applicability threshold and therefore are not subject to CAIR.
Each state covered by CAIR and the District of Columbia may determine independently which emission sources to control and which control measures to adopt. CAIR includes model rules for multi-state cap and trade programs for power plants that states may choose to adopt to meet the required emissions reductions. In the District of Columbia, the Pepco Energy Services’ Benning Road units are permitted to satisfy the CAIR requirements through the use of allocated allowances or allowances acquired in the open market, through the installation of pollution control devices or through fuel modifications.
The Benning Road units use NOx annual, NOx ozone season and SO2 allowances allocated or acquired, as necessary, in the open market to comply with CAIR.
In July 2010,2011, EPA proposedadopted new regulations to replace CAIR, towhich address transport of air pollution across state boundaries. EPA’s proposed TransportThe Cross-State Air Pollution Rule will impose(CSAPR) imposes stricter limits on SO2 and NOxNOx (annual and ozone season) than CAIR, effective as early as 2012. The proposed Transport Rule will affect Benning generating facility because it has a stationary fossil-fuel fired boiler that was in operation after November 15, 1990 and is used in combination with a generator with nameplate capacity greater than 25 MW producing electricity for sale to the grid.
EPA will propose a Federal Implementation Plan forCAIR; however, the District of Columbia was in the group of jurisdictions excluded from the SO2, NOx, and each state covered by the ruleseasonal NOx under CSAPR. As a result, CSAPR’s Cap and Trade program, which was originally planned to address the lower limits. Alternatively,go into effect on January 1, 2012, is not applicable to Pepco Energy Services.
On December 30, 2011, the District of Columbia DepartmentCircuit Court of Appeals ruled to stay the Environment (DDOE) could develop its own State Implementation Plan (SIP). DDOE’s strategy for addressing the requirements is unknown at this time.
Although implementation of CAIR increases costs forCSAPR, and ordered EPA to continue enforcing CAIR. Consequently, Pepco Energy Services must continue to operate these Benning Road units, PHI currently does not anticipate thatmeet its CAIR orobligations until after the proposed Transport Rule will have a material adverse impact on its resultscourt resolves petitions for review of operations, financial condition or cash flows, even assuming the units are not deactivated by May 2012 as planned. Pepco Energy Services’ Buzzard Point generating units and its landfill gas generating units produce fewer megawatts than the CAIR applicability threshold and therefore would not be affected by the proposed Transport Rule.CSAPR.
19
Federal Regional Haze Rule
The federal Regional Haze Rule was adopted by EPA to address a type of visibility impairment known as regional haze created by the emission of specified pollutants by certain types of large stationary sources. The regulation requires installation of best available retrofit technology (BART) to boilers that (i) emit 250 tons or more per year of a visibility-impairing air pollutant, (ii) were placed in service between 1962 and 1977, and (iii) may reasonably be anticipated to cause or contribute to visibility impairment in any federally protected park or wilderness area. Pepco Energy Services’ Benning Road generating units are subject to this regulation for particulate matter less than ten microns in diameter (PM10) and for SO2 and NOx to the extent not addressed by CAIR. Under Pepco Energy Services is evaluatingServices’ current operating permit issued by the manner of addressing BART, including ceasing operation ofDDOE, the Benning Road generating units consistent with its previously announced planwill not be required to deactivate those units by May 2012.
On January 4, 2011,implement any remedial actions if the facilities are shut down on or before December 17, 2012, which is Pepco Energy Services received from the DDOE the draft of a Title V permit, which reflects Pepco’s agreement to deactivate the Benning Road units by the end of calendar year 2012 and DDOE’s agreement to delay the implementation BART until after the agreed upon retirement date. PHI expects the Title V permit to be finalized before the end of the second quarter 2011.Services’ current plan.
Pepco Energy Services’ Buzzard Pointother generating units, and its landfill gas generating unitsincluding those at Buzzard Point, are not subject to the Regional Haze Rule.
Hazardous Air Pollutant Emissions
In December 2011, EPA finalized a March 2005 rulemaking, EPA removed coal- and oil-fired electric generating units fromrule to reduce the listemission of source categories requiring Maximum Achievable Control Technology for hazardous air pollutants such as mercury and nickel under CAA Section 112. In a decision issued in February 2008, the U.S. Court of Appeals for the District of Columbia Circuit determined that this action by EPA was unlawful. To date, EPA has not proposed new regulations to address hazardous air pollutant emissions from existing electric generating units in response to the court’s decision.
In January 2010, Pepco Energy Services received from EPA an Information Collection Request (ICR) under Section 114 of the Clean Air Act, requesting that it provide information regarding Benning Road units 15 and 16 that will allow EPA to assess the emissions of hazardoustoxic air pollutants from those units.generating facilities. The information requested includes historical data with respect to both units,Mercury and Air Toxics Standards will reduce emissions of heavy metals, including mercury, arsenic, chromium and nickel, as well as dataemissions of acid gases, including hydrochloric and hydrofluoric acid. Because existing generating sources generally have up to four years from the Standards’ effective date to comply with the Mercury and Air Toxics Standards, this rule is not expected to impact the Benning Road or Buzzard Point generating facilities, which are expected to be obtainedretired by stack testing during the operation of Benning Road unit 16. Pepco Energy Services provided timely responses to the ICR. In September 2010, Pepco Energy Services received a variance from EPA such that stack testing at Benning is not required.May 2012.
Green HouseGreenhouse Gas Emissions Reporting
In October 2009, EPA has adopted regulations requiring sources that emit designated greenhouse gases –gases– specifically, carbon dioxide, (CO2), methane, nitrous oxide, hydrofluorocarbons, perfluorocarbons, and other fluorinated gases (e.g., nitrogen trifluoride and hydrofluorinated ethers) – in excess of specified thresholds to file annual reports with EPA disclosing the amount of such emissions. Under these regulations:
| • | Pepco Energy Services |
| • | DPL |
|
ACE, DPL and Pepco will be required to start reporting sulfur hexafluoride emissions from electrical equipment beginning in September 2012, for the previous calendar year.
20
Water Quality Regulation
Clean Water Act
Provisions of the federal Water Pollution Control Act, also known as the Clean Water Act, (CWA), establish the basic legal structure for regulating the discharge of pollutants from point sources to surface waters of the United States. Among other things, the CWAClean Water Act requires that any person wishing to discharge pollutants from a point source (generally a confined, discrete conveyance such as a pipe) obtain a National Pollutant Discharge Elimination System (NPDES) permit issued by EPA or by a state agency under a federally authorized state program. The Benning Road generating facility has a NPDES permit authorizing pollutant discharges, which is subject to periodic renewal.
Pepco and a subsidiary of Pepco Energy Services discharge water from the Benning Road electric generating plant and service center located in the District of Columbia under a NPDES permit issued by EPA in July 2009. The permit imposes compliance monitoring and storm water best management practices (BMPs) to satisfy the District of Columbia’s Total Maximum Daily Load standards for polychlorinated biphenyls (PCBs), oil and grease, metals and other substances. As required by the permit, Pepco has initiated studies to identify the source of the regulated substances to determine appropriate BMPsbest management practices for minimizing the presence of the substances in storm water. The initial study reports are scheduled for completion in March 2012 and will be submitted to EPA as required. The capital expenditures, if any, that may be needed to implement BMPsbest management practices to satisfy these new permit conditions will not be known until thesethe results of the studies are completed.
NPDES General Permit for Pesticide Discharge
PHI operates and maintains approximately 3,600 miles of transmission right of way and approximately 30,000 miles of distribution right of way and uses a combination of mechanical and chemical controls (pesticides/herbicides) to manage vegetation in its rights-of-way through a process known as “Integrated Vegetation Management.” PHI’s application of pesticides and herbicides for vegetation management traditionally has been governedreviewed by the requirements of the Federal Insecticide, Fungicide and Rodenticide Act.
In response to a 2009 decision by the Sixth Circuit Court of Appeals in National Cotton Council,et al, v. EPA, which invalidated a 2006 EPA rulemaking exempting pesticide application from NPDES permit requirements, EPA, in June 2010, proposed a draft NPDES general permit for point source discharges from the application of pesticides to waters of the United States. Under the Court’s order, pesticide discharges are required to be permitted under either an EPA- or state- issued NPDES permit no later than April 9, 2011. State water pollution regulators and agriculture officials asked the EPA to seek a six month stay of the court’s order to provide sufficient time for EPA to finalize its general permit and for states to use the final EPA general permit as a guide for developing state NPDES general permits.
When permitting authorities make such permits available, PHI utility companies will apply for NPDES permits for pesticide application as part of vegetation management activities.EPA.
New Jersey Flood Hazard Area Control Act
In November 2007, the New Jersey Department of Environmental Protection adopted amendments to the agency’s regulations under the Flood Hazard Area Control Act the (FHACA) to minimize damage to life and property from flooding caused by development in flood plains. The amended regulations impose a new regulatory program to mitigate flooding and related environmental impacts from a broad range of construction and development activities, including electric utility transmission and distribution construction, which were previously unregulated under the FHACA. These regulations impose restrictions on construction of new electric transmission and distribution facilities and increase the time and personnel resources required to obtain permits and conduct maintenance activities. In November 2008,While ACE filed an appeal ofcontinues to evaluate the financial impact related to compliance with the amended regulations, based on current information, PHI and ACE do not believe these regulations with the Appellate Divisionwill have a material adverse effect on their respective financial conditions or results of the Superior Court of New Jersey. The grounds for ACE’s appeal include the lack of administrative record justification for the FHACA regulations and conflict between the FHACA regulations and other state and federal regulations and standards for maintenance of electric power transmission and distribution facilities. The matter was argued before the Appellate Division on January 3, 2011, and the decision of the court is pending.operations.
Business Strategy investing in transmission and distribution infrastructure to improve reliability of electric service; building a smarter grid to automate certain functions on the electric system, restore power more efficiently and provide customers detailed energy information to help them control their energy costs; investing in advanced technologies, new processes and personnel to enhance the customer experience during power restoration, including delivering enhanced customer communications; pursuing a regulatory strategy that results in earning reasonable rates of return and timely cost recovery of PHI’s investments;EPA Oil Pollution Prevention RegulationsIn 2002, EPA amendedPHI’s business strategy is to become a top-performing, regulated power delivery company focused on:
4
growing PHI’s energy services business by providing comprehensive energy management solutions and developing, installing and operating renewable energy solutions; and
demonstrating PHI’s core values of safety, diversity and environmental stewardship through PHI’s business approaches and tangible business practices and outcomes.
To further its oil pollution prevention regulationsbusiness strategy, PHI may examine transactions involving its existing businesses, including entering into joint ventures, disposing of businesses or making acquisitions. PHI also may refine components of its business strategy as it deems necessary or appropriate in response to require facilities that, becausebusiness factors and conditions, including regulatory requirements.
Description of their location, could reasonably be expected to discharge oil in quantities that may be harmful to the environment, to amend existing Spill Prevention, Control, and Countermeasure (SPCC) Plans and implement secondary containment as necessary. After giving effect to additional amendments and delays in the effective date, PHI facilities subject to the regulations must comply with these regulatory requirements by November 10, 2011. PHI anticipates that compliance with the SPCC regulations will require physical modification of certain facilities through the construction of containment structures or replacement of oil-filled equipment with non-oil-filled equipment at a total anticipated cost to ACE, DPL and Pepco of approximately $1 million, $2 million and $2 million, respectively. PHI does not expect the compliance costs for Pepco Energy Services to be material.Business
Hazardous Substance RegulationPower Delivery
The Comprehensive Environmental Response, Compensation,PHI’s primary business is Power Delivery. Power Delivery in 2011, 2010 and Liability Act2009, produced 79%, 73%, and 67%, respectively, of 1980 (CERCLA) authorizes EPA,PHI’s consolidated operating revenues and comparable state laws authorize state environmental authorities,78%, 81%, and 78%, respectively, of PHI’s consolidated operating income.
Each utility comprising Power Delivery is regulated in the jurisdictions that encompass its electricity distribution service territory and is regulated by FERC for its electricity transmission facilities. DPL also is a regulated natural gas utility serving portions of Delaware. In the aggregate, Power Delivery distributes electricity to issue ordersmore than 1.8 million customers in the mid-Atlantic region and bring enforcement actionsdelivers natural gas to compel responsible parties to investigateapproximately 124,000 customers in Delaware. None of PHI’s three utilities owns any electric generation facilities.
Distribution and take remedial actions at any site that is determined to present an actual or potential threat to human health or the environment becauseDefault Supply of an actual or threatened release of one or more hazardous substances. Parties that generated or transported hazardous substances to such sites, as well as the owners and operators of such sites, may be deemed liable under CERCLA or comparable state laws. Electricity
Pepco, DPL and ACE each owns and operates a network of wires, substations and other equipment that are classified as transmission facilities, distribution facilities or common facilities (which are used for both transmission and distribution). Transmission facilities carry wholesale electricity into, or across, the utility’s service territory. Distribution facilities carry electricity from the transmission facilities to the end-use customers located in the utility’s service territory.
Each utility is responsible for the distribution of electricity in its service territory, for which it is paid tariff rates established by the applicable local public service commissions. Each utility also supplies electricity at regulated rates to retail customers in its service territory who do not elect to purchase electricity from a competitive retail supplier. The regulatory term for this default supply service is Standard Offer Service (SOS) in Delaware, the District of Columbia and Maryland, and Basic Generation Service (BGS) in New Jersey. In this Form 10-K, these supply services are referred to generally as Default Electricity Supply.
Transmission of Electricity and Relationship with PJM
The transmission facilities owned by Pepco, DPL and ACE are interconnected with the transmission facilities of contiguous utilities and are part of an interstate power transmission grid over which electricity is transmitted throughout the mid-Atlantic portion of the United States and parts of the Midwest. Pepco, DPL and ACE each is a member of the PJM Regional Transmission Organization (PJM RTO), the regional transmission organization designated by the Federal Energy Regulatory Commission (FERC) to coordinate the movement of wholesale electricity within a region consisting of all or parts of Delaware, Illinois, Indiana, Kentucky, Maryland, Michigan, New Jersey, North Carolina, Ohio, Pennsylvania, Tennessee, Virginia, West Virginia and the District of Columbia.
5
PJM, the FERC-approved independent grid operator, manages the transmission grid and the wholesale electricity market in the PJM RTO region. Any entity that wishes to have wholesale electricity delivered at any point within the PJM RTO region must obtain transmission services from PJM. In accordance with FERC-approved rules, Pepco, DPL, ACE and the other transmission-owning utilities in the region make their transmission facilities available to the PJM RTO, and PJM directs and controls the operation of these transmission facilities. For transmission services, transmission owners are paid rates proposed by the transmission owner and approved by FERC. PJM provides billing and settlement services, collects transmission service revenue from transmission service customers and distributes the revenue to the transmission owners. PJM also directs the regional transmission planning process within the PJM RTO region. The PJM Board of Managers reviews and approves each PJM regional transmission expansion plan, including whether to include new construction of transmission facilities proposed by PJM RTO members in the plan and, if so, the target in-service date for those facilities.
Seasonality
The operating results of Power Delivery historically have been directly related to the volume of electricity delivered to its customers, producing higher revenues and net income during periods when customers consumed higher amounts of electricity (usually during periods of extreme temperatures) and lower revenues and net income during periods when customers consumed lower amounts of electricity (usually during periods of mild temperatures). This has been nameddue in part to the long standing practice by EPAwhich the applicable public service commissions set distribution rates based on a fixed charge per kilowatt-hour of electricity used by the customer. Because most of the costs associated with the distribution of electricity do not vary with the volume of electricity delivered, this pricing mechanism also contributed to seasonal variations in net income. As a result of the implementation of a BSA for retail customers of Pepco and DPL in Maryland in June 2007 and for customers of Pepco in the District of Columbia in November 2009, distribution revenues have been decoupled from the amount of electricity delivered. Under the BSA, utility customers pay an approved distribution charge for their electric service which does not vary by electricity usage. This change has had the effect of aligning annual distribution revenues more closely with annual distribution costs. In addition, the change has had the effect of eliminating changes in customer electricity usage, whether due to weather conditions or a state environmental agencyfor any other reason, as a potentially responsible partyfactor having an impact on annual distribution revenue and net income in pending proceedings involving certain contaminated sites. Seethose jurisdictions. The BSA also eliminates what otherwise might be a disincentive for the utility to aggressively develop and promote efficiency programs. Distribution revenues are not decoupled for the distribution of electricity and natural gas by DPL in Delaware or for the distribution of electricity by ACE in New Jersey, and thus are subject to variability due to changes in customer consumption.
In contrast to electricity distribution costs, the cost of the electricity supplied, which is the largest component of a customer’s bill, does vary directly in relation to the volume of electricity used by a customer. Accordingly, whether or not a BSA is in effect for the jurisdiction, the revenues of Pepco, DPL and ACE from the supply of electricity and natural gas vary based on consumption and on this basis are seasonal. Because the revenues received by each of the utility subsidiaries for the default supply of electricity and natural gas closely approximate the supply costs, the impact on net income is immaterial, and therefore is not seasonal.
Regulated Utility Subsidiaries
The following is a more detailed description of the business of each of PHI’s three regulated utility subsidiaries:
6
Pepco
Pepco is engaged in the transmission, distribution and default supply of electricity in the District of Columbia and major portions of Prince George’s County and Montgomery County in Maryland. Pepco’s service territory covers approximately 640 square miles and has a population of approximately 2.2 million. As of December 31, 2011, Pepco distributed electricity to 788,000 customers (of which 257,000 were located in the District of Columbia and 531,000 were located in Maryland), as compared to 787,000 customers as of December 31, 2010 (of which 256,000 were located in the District of Columbia and 531,000 were located in Maryland). As of December 31, 2009, Pepco distributed electricity to 778,000 customers (of which 252,000 were located in the District of Columbia and 526,000 were located in Maryland).
In 2011, Pepco distributed a total of 26,895,000 megawatt hours of electricity, of which 57% was distributed within its Maryland territory and 43% within the District of Columbia. Of this amount, 30% of the total megawatt hours were delivered to residential customers, 50% to commercial customers, and 20% to United States and District of Columbia government customers. In 2010, Pepco distributed a total of 27,665,000 megawatt hours of electricity, of which 57% was distributed within its Maryland territory and 43% within the District of Columbia. Of this amount, 30% of the total megawatt hours were distributed to residential customers, 49% to commercial customers, and 21% to United States and District of Columbia government customers. In 2009, Pepco distributed a total of 26,549,000 megawatt hours of electricity, of which 57% was distributed within its Maryland territory and 43% within the District of Columbia. Of this amount, 29% of the total megawatt hours were distributed to residential customers, 50% to commercial customers, and 21% to United States and District of Columbia government customers.
Pepco has been providing SOS in Maryland since July 2004. Pursuant to orders issued by the Maryland Public Service Commission (MPSC), Pepco is obligated to provide SOS (i) Item to residential and small commercial customers until further action of the Maryland General Assembly and (ii) to medium-sized commercial customers through November 2012. Pepco purchases the electricity required to satisfy these SOS obligations from wholesale suppliers under contracts entered into in accordance with competitive bid procedures approved and supervised by the MPSC. Pepco also is obligated to provide Standard Offer Service, known as Hourly Priced Service (HPS), for large Maryland customers. Power to supply HPS customers is acquired in next-day and other short-term PJM RTO markets. Pepco is entitled to recover from its SOS customers the cost of acquiring the SOS supply, plus an administrative charge that is intended to allow Pepco to recover the administrative costs incurred to provide the SOS and a modest margin. Because the margin varies by customer class, the actual average margin over any given time period depends on the number of Maryland SOS customers in each customer class and the electricity used by such customers. Pepco is paid tariff rates for the distribution of electricity over its transmission and distribution facilities to all electricity customers in its Maryland service territory regardless of whether the customer receives SOS or purchases electricity from another supplier.
Pepco has been providing SOS in the District of Columbia since February 2005. Pursuant to orders issued by the District of Columbia Public Service Commission (DCPSC), Pepco is obligated to provide SOS to residential and small, medium-sized and large commercial customers indefinitely. Pepco purchases the electricity required to satisfy its SOS obligations from wholesale suppliers under contracts entered into in accordance with a competitive bid procedure approved and supervised by the DCPSC. Pepco is entitled to recover from its SOS customers the costs of acquiring the SOS supply, plus an administrative charge that is intended to allow Pepco to recover the administrative costs incurred to provide the SOS and a modest margin. Because the margin varies by customer class, the actual average margin over any given time period depends on the number of District of Columbia SOS customers in each customer class and the amount of electricity used by such customers. Pepco is paid tariff rates for the distribution of electricity over its transmission and distribution facilities to all electricity customers in its District of Columbia service territory regardless of whether the customer receives SOS or purchases electricity from another supplier.
7
For the year ended December 31, 2011, 43% of Pepco’s Maryland distribution sales (measured by megawatt hours) were to SOS customers, as compared to 46% and 49% in 2010 and 2009, respectively, and 27% of its District of Columbia distribution sales (measured by megawatt hours) were to SOS customers in 2011, as compared to 29% and 31% in 2010 and 2009, respectively.
DPL
DPL is engaged in the transmission, distribution and default supply of electricity in Delaware and portions of Maryland. In northern Delaware, DPL also supplies and delivers natural gas to retail customers and provides transportation-only services to retail customers that purchase natural gas from another supplier.
Distribution and Supply of Electricity
DPL’s electricity distribution service territory consists of the state of Delaware, and Caroline, Cecil, Dorchester, Harford, Kent, Queen Anne’s, Somerset, Talbot, Wicomico and Worcester counties in Maryland. This territory covers approximately 5,000 square miles and has a population of approximately 1.4 million. As of December 31, 2011, DPL delivered electricity to 501,000 customers (of which 301,000 were located in Delaware and 200,000 were located in Maryland), as compared to 500,000 customers as of December 31, 2010 (of which 301,000 were located in Delaware and 199,000 were located in Maryland). As of December 31, 2009, DPL delivered electricity to 498,000 customers (of which 299,000 were located in Delaware and 199,000 were located in Maryland).
In 2011, DPL distributed a total of 12,688,000 megawatt hours of electricity to its customers, of which 66% was distributed within its Delaware territory and 34% within Maryland. Of this amount, 41% of the total megawatt hours were distributed to residential customers, 42% to commercial customers and 17% to industrial customers. In 2010, DPL distributed a total of 12,853,000 megawatt hours of electricity, of which 66% was distributed within its Delaware territory and 34% within Maryland. Of this amount, 42% of the total megawatt hours were distributed to residential customers, 41% to commercial customers and 17% to industrial customers. In 2009, DPL distributed a total of 12,494,000 megawatt hours of electricity, of which 67% was distributed within its Delaware territory and 33% within Maryland. Of this amount, 39% of the total megawatt hours were distributed to residential customers, 41% to commercial customers and 20% to industrial customers.
DPL has been providing SOS in Delaware since May 2006. Pursuant to orders issued by the Delaware Public Service Commission (DPSC), DPL is obligated to provide SOS to residential, small commercial and industrial customers through May 2014, and to medium, large and general service commercial customers through May 2012. DPL purchases the electricity required to satisfy these SOS obligations from wholesale suppliers under contracts entered into in accordance with competitive bid procedures approved and supervised by the DPSC. DPL also has an obligation to provide SOS, known as HPS, for the largest Delaware customers. Power to supply the HPS customers is acquired in next-day and other short-term PJM RTO markets. DPL’s rates for supplying SOS and HPS reflect the associated capacity, energy (including satisfaction of renewable energy requirements), transmission and ancillary services costs and an amount referred to as a Reasonable Allowance for Retail Margin. Components of the Reasonable Allowance for Retail Margin include a fixed annual margin of approximately $2.75 million, plus estimated incremental expenses, a cash working capital allowance, and recovery, with a return over five years ending 2011, of the capitalized costs of the billing system used for billing HPS customers. DPL is paid tariff rates for the distribution of electricity over its transmission and distribution facilities to all electricity customers in its Delaware service territory regardless of whether the customer receives SOS or purchases electricity from another supplier.
8
DPL has been providing SOS in Maryland since June 2004. Pursuant to orders issued by the MPSC, DPL is obligated to provide SOS to residential and small commercial customers until further action of the Maryland General Assembly, and to medium-sized commercial customers through May 2014. DPL purchases the electricity required to satisfy these SOS obligations from wholesale suppliers under contracts entered into in accordance with a competitive bid procedure approved and supervised by the MPSC. DPL also is obligated to provide HPS for large Maryland customers. Power to supply the HPS customers is acquired in next-day and other short-term PJM RTO markets. DPL is entitled to recover from its SOS customers the costs of acquiring the SOS supply, plus an administrative charge that is intended to allow DPL to recover the administrative costs incurred to provide the SOS and a modest margin. Because the margin varies by customer class, the actual average margin over any given time period depends on the number of Maryland SOS customers in each customer class and the electricity used by such customers. DPL is paid tariff rates for the distribution of electricity over its transmission and distribution facilities to all electricity customers in its Maryland service territory regardless of whether the customer receives SOS or purchases electricity from another supplier.
For the year ended December 31, 2011, 51% of DPL’s Delaware distribution sales (measured by megawatt hours) were to SOS customers, as compared to 53% and 51% in 2010 and 2009, respectively, and 58% of its Maryland distribution sales (measured by megawatt hours) were to SOS customers in 2011, as compared to 63% in 2010 and 2009.
Supply and Distribution of Natural Gas
DPL provides regulated natural gas supply and distribution service to customers in a service territory consisting of a major portion of New Castle County in Delaware. This service territory covers approximately 275 square miles and has a population of approximately 500,000. Large volume commercial, institutional, and industrial natural gas customers may purchase natural gas either from DPL or from other suppliers. DPL uses its natural gas distribution facilities to deliver natural gas to customers that choose to purchase natural gas from another supplier. Intrastate transportation customers pay DPL distribution service rates approved by the DPSC. DPL purchases natural gas supplies for resale to its retail service customers from marketers and producers through a combination of long-term agreements and next-day distribution arrangements. For the year ended December 31, 2011, DPL supplied 64% of the natural gas that it delivered, compared to 65% in 2010 and 68% in 2009.
As of December 31, 2011, DPL delivered natural gas to 124,000 customers as compared to 123,000 customers as of December 31, 2010 and 2009. In 2011, DPL delivered 19,000,000 Mcf (thousand cubic feet) of natural gas to customers in its Delaware service territory, of which 40% were sales to residential customers, 23% to commercial customers, 1% to industrial customers and 36% to customers receiving a transportation-only service. In 2010, DPL delivered 19,000,000 Mcf of natural gas, of which 41% were sales to residential customers, 23% were sales to commercial customers, 1% were sales to industrial customers and 35% were sales to customers receiving a transportation-only service. In 2009, DPL delivered 19,000,000 Mcf of natural gas, of which 42% were sales to residential customers, 25% were sales to commercial customers, 1% were sales to industrial customers and 32% were sales to customers receiving a transportation-only service.
ACE
ACE is primarily engaged in the transmission, distribution and default supply of electricity in a service territory consisting of Gloucester, Camden, Burlington, Ocean, Atlantic, Cape May, Cumberland and Salem counties in southern New Jersey. ACE’s service territory covers approximately 2,700 square miles and has a population of approximately 1.1 million. As of December 31, 2011, ACE distributed electricity to 547,000 customers in its service territory, as compared to 548,000 and 547,000 customers as of December 31, 2010 and 2009, respectively.
9
In 2011, ACE distributed a total of 9,683,000 megawatt hours of electricity to its customers, of which 46% of the total was distributed to residential customers, 45% to commercial customers and 9% to industrial customers. In 2010, ACE distributed a total of 10,185,000 megawatt hours of electricity to its customers, of which 46% of the total was distributed to residential customers, 44% to commercial customers, and 10% to industrial customers. In 2009, ACE distributed a total of 9,659,000 megawatt hours of electricity to its customers, of which 45% was distributed to residential customers, 45% to commercial customers, and 10% to industrial customers.
Electric customers in New Jersey who do not choose another supplier receive BGS from their electric distribution company. New Jersey’s electric distribution companies, including ACE, jointly obtain the electricity to meet their BGS obligations from competitive suppliers selected through auctions authorized by the New Jersey Board of Public Utilities (NJBPU) for the supply of New Jersey’s total BGS requirements. Each winning bidder is required to supply its committed portion of the BGS customer load with full requirements service, consisting of power supply and transmission service.
ACE provides two types of BGS:
ACE is paid tariff supply rates established by the NJBPU that compensate it for the cost of obtaining the BGS supply. These rates are set such that ACE does not make any profit or incur any loss on the supply component of the BGS it supplies to customers. ACE is paid tariff rates for the distribution of electricity over its transmission and distribution facilities to all electricity customers in its service territory regardless of whether the customer receives BGS or purchases electricity from another supplier.
For the year ended December 31, 2011, 56% of ACE’s total distribution sales (measured by megawatt hours) were to BGS customers, as compared to 65% and 73% in 2010 and 2009, respectively.
ACE has contracts with three unaffiliated non-utility generators (NUGs) under which ACE is obligated to purchase capacity and the entire generation output of the facilities. One of the contracts expires in 2016 and the other two expire in 2024. In 2011, ACE purchased 1.9 million megawatt hours of power from the NUGs. ACE sells this electricity into the wholesale market administered by PJM.
In 2001, ACE established Atlantic City Electric Transitional Funding LLC (ACE Funding) solely for the purpose of securitizing authorized portions of ACE’s recoverable stranded costs through the issuance and sale of bonds (Transition Bonds). The proceeds of the sale of each series of Transition Bonds were transferred to ACE in exchange for the transfer by ACE to ACE Funding of the right to collect a non-bypassable transition bond charge from ACE customers pursuant to bondable stranded costs rate orders issued by the NJBPU in an amount sufficient to fund the principal and interest payments on the Transition Bonds and related taxes, expenses and fees (Bondable Transition Property). The assets of ACE Funding, including the Bondable Transition Property, and the Transition Bond charges collected from ACE’s customers, are not available to creditors of ACE. The holders of Transition Bonds have recourse only to the assets of ACE Funding.
10
Other Power Delivery Initiatives and Activities
Reliability Enhancement and Emergency Restoration Improvement Plans
In 2010, PHI announced comprehensive reliability enhancement plans for Pepco in Maryland and the District of Columbia. These reliability enhancement plans include various initiatives such as enhanced vegetation management, the identification and upgrading of under-performing feeder lines, the addition of new facilities to support load, the installation of distribution automation systems on both the overhead and underground network system, the rejuvenation and replacement of underground residential cables, improvements to substation supply lines and selective undergrounding of portions of existing above ground primary feeder lines, where appropriate to improve reliability and enhance customer satisfaction. During 2011, Pepco continued to execute on its plans to improve reliability which it believes have contributed to its progress in reducing both the frequency and duration of power outages. During 2011, Pepco invested $120 million in capital expenditures on these reliability enhancement activities. Since initiating the reliability enhancement plans, Pepco trimmed trees along nearly 3,500 miles of power lines, completed 48 expansion projects to meet growth in customer demand for electricity, upgraded more than 340 miles of aging underground lines, and added 125 automated switches that will reroute power more effectively during outages. PHI has extended its reliability enhancement efforts to DPL and ACE.
In 2011 PHI initiated an accelerated emergency restoration improvement program prior to the start of the 2011 summer storm season. As part of this program, Pepco:
more than doubled the number of telephone trunk lines to its Washington, D.C. regional call center;
developed mobile applications to report and track outages;
improved outage information on its Web site to enhance communications with its customers;
implemented regional storm centers for more efficient crew dispatch;
implemented better methodologies for estimating times for restoration of power;
employed technology, including smart meters, to obtain real-time information from the field on power outages and to assist restoration planning efforts by providing data needed to conduct real-time damage assessments;
augmented training of its emergency response personnel; and
installed a backup crisis call center.
These and other emergency restoration improvements implemented as a part of this program were tested during Hurricane Irene in August 2011. Although nearly 500,000 customers across all three utilities were without power at the peak of the storm, nearly 98% of outages were restored within a little more than two days.
PHI’s capital expenditures for continuing reliability enhancement efforts are included in the table of projected capital expenditures, see “Management’s Discussion and Analysis of Financial Condition and Results of Operations – Capital—Capital Resources and Liquidity – Capital Requirements – Environmental Remediation Obligations,Expenditures.” and (ii) Note (17), “Commitments and Contingencies – Legal Proceedings – Environmental Litigation,” to
Blueprint for the consolidated financial statements of PHI set forth in Part II, Item 8 of this Form 10-K.
The businesses of PHI, Pepco, DPL and ACE are subject to numerous risks and uncertainties, including the events or conditions identified below. The occurrence of one or more of these events or conditions could have an adverse effect on the business of any one or more of the companies, including, depending on the circumstances, its financial condition, results of operations and cash flows. Unless otherwise noted, each risk factor set forth below applies to each of PHI, Pepco, DPL and ACE.
PHI and its subsidiaries are subject to substantial governmental regulation, and unfavorable regulatory treatment could have a negative effect.Future
The regulated utilities that comprise the Power Delivery businesses are subject to regulation by various federal, state and local regulatory agencies that significantly affects their operations. Each of Pepco, DPL and ACE is regulated by the public service commission for each service territory in which it operates, with respect to, among other things, the rates it can charge retail customers for the distribution and supply of electricity (and, additionally for DPL, the distribution and supply of natural gas). In addition, the rates that the companies can charge for electricity transmission are regulated by FERC, and DPL’s natural gas transportation is regulated by FERC. The companies cannot change these rates without approval by the applicable regulatory authority. While the approved rates are intended to permit the companies to recover their costs of service and earn a reasonable rate of return on invested capital, the profitability of the companies is affected by the rates they are able to charge. In addition, if the costs incurred by any of the companies in operating its facilities exceed the allowed amounts for costs included in the approved rates, the financial results of that company, and correspondingly PHI, will be adversely affected.
PHI’s utility subsidiaries is participating in a PHI initiative referred to as well as Pepco Energy Services, are required“Blueprint for the Future,” which is designed to have numerous permits, approvalsmeet the challenges of rising energy costs, respond to concerns about the environment, improve reliability and certificates from governmental agencies that regulateaddress government energy reduction goals. The initiative includes the implementation of various programs to help customers better manage their businesses. PHI believes that eachenergy use, reduce the total cost of its subsidiaries has,energy and each of Pepco, DPL and ACE believes it has, obtained or sought renewal ofprovide other benefits. These programs also enhance the material permits, approvals and certificates necessary for its existing operations and that its business is conducted in accordance with applicable laws. None of the companies, however, are able to predict the impact that future regulatory activities may have on its business. Changes in or reinterpretations of existing laws or regulations, or the imposition of new laws or regulations, may require any one or moreability of PHI’s subsidiariesutilities to incur additional expenses or significant capital expenditures or to change the way it conducts its operations.
The operating results of the Power Delivery businessbetter manage and the retail energy supply business of Pepco Energy Services fluctuate on a seasonal basis and can be adversely affected by changes in weather.
The Power Delivery business historically has been seasonal and weather has had a material impact on its operating performance. Demand for electricity is generally higher in the summer months associated with cooling and demand for electricityoperate their electrical and natural gas is generally higher in the winter months associated with heating as compared to other timesdistribution systems.
11
One of the year. Accordingly, eachprimary initiatives of PHI, Pepco, DPL and ACE historically has generated less revenue and income when temperatures are warmer than normal inBlueprint for the winter and cooler than normal inFuture is the summer. The recent adoptioninstallation of smart meters (also known as Advanced Metering Infrastructure (AMI)) for retail customers of Pepco and DPL in Maryland and for Pepco retail customers in the District of Columbia of a bill stabilization adjustment mechanism which decouples distribution revenue for a given reporting period from the amount of power delivered during the period, has had the effect of eliminating in those jurisdictions, changes in the use of electricity by such retail customers due to weather conditions or for other reasons as a factor having an impact on reported distribution revenue and income.
The adoption of bill stabilization adjustment or similar mechanisms for DPL electricityelectric and natural gas customers, in Delaware and ACE electricity customers in New Jersey are under consideration by the state public service commissions. In those jurisdictions that have not adopted a bill stabilization adjustment or similar mechanism, operating results continue to be affected by weather conditions.
The retail energy supply business of Pepco Energy Services generally produces higher gross margins when temperatures are colder than normal in winter or warmer than normal in summer, and less gross margin when weather conditions are milder than normal. The Energy Services business of Pepco Energy Services, which includes providing energy savings performance contracting services principally to federal, state and local government customers, and designing, constructing and operating combined heat and power energy plants for customers, is not seasonal.
Facilities may not operate as planned or may require significant maintenance expenditures, which could decrease revenues or increase expenses.
Operation of the Pepco, DPL and ACE transmission and distribution facilities and Pepco Energy Services’ generating facilities (scheduled for deactivation in May 2012) involves many risks, including the breakdown or failure of equipment, accidents, labor disputes and performance below expected levels. Older facilities and equipment, even if maintained in accordance with sound engineering practices, may require significant capital expenditures for additions or upgrades to provide reliable operations or to comply with changing environmental requirements. Natural disasters and weather, including tornadoes, hurricanes and snow and ice storms, also can disrupt transmission and distribution systems. Disruption of the operation of transmission or distribution facilities or the operation of generation facilities below expected output levels, can reduce revenues and result in the incurrence of additional expenses that may not be recoverable from customers or through insurance, including deficiency charges imposed by PJM on generating facilities at a rate of up to two times the capacity payment that the generating facility receives. Furthermore, the transmission and generating facilities of the PHI companies are subject to reliability standards imposed by the North American Electric Reliability Corporation. Failureapproval of applicable state regulators. These smart meters allow the utilities, among other capabilities, to complyremotely read meters, significantly reduce the number of customer bills that are based on usage estimates, improve outage management and detection, and provide customers with the standards may result in substantial monetary penalties.
Energy companies are subject to adverse publicity which makes them vulnerable to negative regulatory and litigation outcomes.
Utility companies, including PHI’s utility subsidiaries, have been the subject of public criticism focused on the reliability ofmore detailed information about their distribution services and the speed with which they are able to respond to outages caused by storm damage. Adverse publicity of this nature may render legislatures, regulatory authorities and other government officials less likely to view energy companies such as PHI and its subsidiaries in a favorable light, and may cause PHI and its subsidiaries to be susceptible to less favorable legislative and regulatory outcomes.
PHI’s Blueprint for the Future program includes the replacement of customers’ existing electric and gas meters with an AMI system.consumption. In addition to the replacement of existing meters, the AMI system involves the construction of a wireless network across the service territories of PHI’s utility subsidiaries and the implementation and integration of new and existing information technology systems to collect and manage the data made available by the advanced meters. The implementation of the AMI system involves a combination of technologies provided by multiple vendors. IfMeter installation is substantially complete for DPL electric customers in Delaware, with meter activation expected to be completed in the first quarter of 2012. Meter installation is progressing for Pepco customers in both the District of Columbia and Maryland, with installation expected to be complete in the second and fourth quarters of 2012, respectively. The respective public service commissions have approved the creation of a regulatory asset to defer AMI system results in lower than projected performance, PHI’s utility subsidiaries could experience higher than anticipated maintenance expenditures.
The transmission facilitiescosts between rate cases, as well as the accrual of the Power Delivery business are interconnected with the facilities of other transmission facility owners whose actions could have a negative impact on Power Delivery’s operations.
The electricity transmission facilities of Pepco, DPL and ACE are interconnected with the transmission facilities of contiguous utilities and are part of an interstate power transmission grid. FERC has designated a number of regional transmission organizations to coordinate the operation of portions of the interstate transmission grid. Pepco, DPL and ACE are members of the PJM RTO. The PJM RTO and the other regional transmission organizations have established sophisticated systems that are designed to ensure the reliability of the operation of transmission facilities and prevent the operations of one utility from having an adverse impactreturn on the operations of the other utilities. However, the systems put in place by the PJM RTO and the other regional transmission organizations may not alwaysdeferred costs. Thus, these costs will be adequate to prevent problems at other utilities from causing service interruptionsrecovered through base rates in the transmission facilitiesfuture.
Approval of Pepco, DPL or ACE. If any of Pepco, DPL orAMI is still pending for electric customers in DPL’s Maryland service territory, and has been deferred for ACE were to suffer such a service interruption, it could have a negative impact on it and on PHI.in New Jersey.
The cost of compliance with environmental laws, including laws relating to emissions of greenhouse gases, is significant and implementation of new and existing environmental laws may increase operating costs.
The operations of PHI’s subsidiaries, including Pepco, DPL and ACE, are subject to extensive federal, state and local environmental laws and regulations relating to air quality, water quality, spill prevention, waste management, natural resource protection, site remediation and health and safety. These laws and regulations may require significant capital and other expenditures to, among other things, meet emissions and effluent standards, conduct site remediation, complete environmental studies and perform environmental monitoring. If a company fails to comply with applicable environmental laws and regulations, even if caused by factors beyond its control, such failure could result inOn December 20, 2011, the assessment of civil or criminal penalties and liabilities and the need to expend significant sums to achieve compliance.
In addition, PHI’s subsidiaries are required to obtain and comply with a variety of environmental permits, licenses, inspections and other approvals. If there is a delay in obtaining any required environmental regulatory approval, or if there is a failure to obtain, maintain or comply with any such approval, operations at affected facilities could be halted or subjected to additional costs.
There is growing concern at the federal and state levels regarding the implications of CO2 and other greenhouse gas emissions on the global climate. The implementation of restrictions on the emission of CO2 and other greenhouse gases or regulatory action by the U.S. Environmental Protection Agency prior to deactivation of Pepco Energy Services’ generating facilities (scheduled for May 2012) could require Pepco Energy Services to incur increased capital expenditures or operating costs to replace existing equipment, install additional pollution control equipment or purchase CO2 allowances and offsets.
Alternatively, Pepco Energy Services could be required to discontinue or curtail the operations of one or more units prior to their planned deactivation date.
Until specific requirements are promulgated, the impact that any new environmental regulations, voluntary compliance guidelines, enforcement initiatives or legislation may have on the results of operations, financial position or liquidity of PHI and its subsidiaries is not determinable.
Failure to retain and attract key skilled professional and technical employees could have an adverse effect on operations.
The ability of each of PHI and its subsidiaries, including Pepco, DPL and ACE,Delaware Public Service Commission approved DPL’s request to implement dynamic pricing for its business strategy is dependent on its ability to recruit, retainDelaware customers. Dynamic pricing will reward SOS customers for lowering their energy use during those times when energy demand and, motivate employees. Competition for skilled employees in some areas is high and the inability to retain and attract these employees could adversely affect the business, operations and financial condition of PHI or the affected company.
The Energy Services business of Pepco Energy Services is highly competitive. (PHI only)
The Energy Services business of Pepco Energy Services is highly competitive. This competition generally has the effect of limiting margins and requiring a continual focus on controlling costs.
Pepco Energy Services relies on generation, transmission, storage, and distribution assets that it does not own or control to deliver electricity and natural gas to its customers and to obtain the fuel required to operate its generating facilities. (PHI only)
Pepco Energy Services is dependent on electric generating and transmission facilities, natural gas pipelines and natural gas storage facilities owned and operated by others to fulfill the remaining contractual obligations of its retail energy supply business. A disruption in the operation of these facilities would have an adverse effect on Pepco Energy Services.
The operation of Pepco Energy Services’ generating facilities depends on natural gas or diesel fuel supplied by others. If the fuel supply to these generating facilities were to be disrupted and storage or other sources of supply were not available, the ability of Pepco Energy Services to operate its plants would be adversely affected.
Changes in technology may adversely affect the Power Delivery business.
Increased conservation and end-user generation made possible through advances in technology could reduce demand for the transmission and distribution facilities of the Power Delivery business and adversely affect PHI and any one or more of its utility subsidiaries.
Pepco Energy Services’ risk management procedures may not be effective in preventing losses. (PHI only)
The retail energy supply and the electricity generation businesses of Pepco Energy Services are conducted in accordance with sophisticated risk management systems that are designed to quantify and control risk. However, actual results sometimes deviate from modeled expectations. Until the completion of the ongoing wind down of retail energy supply business and the deactivation of Pepco Energy Services’ two generating facilities (scheduled for May 2012), the ineffectiveness of Pepco Energy Service’s risk management procedures could have a material adverse effect on PHI’s results of operations.
The retail energy supply business of Pepco Energy Services can give rise to significant collateral requirements. (PHI only)
In conducting its retail energy supply business, Pepco Energy Services typically entered into electricity and natural gas sale contracts under which it committed to supply the electricity or natural gas requirements of its retail customers over a specified period at agreed upon prices. To acquire the required energy, Pepco Energy Services has entered into wholesale purchase contracts for electricity and natural gas. These contracts typically impose collateral requirements on each party designed to protect the other party against the risk of nonperformance between the date the contract was entered into and the date the energy is paid for. The collateral required to be posted can be of varying forms, including cash, letters of credit and guarantees. When energy market prices decrease relative to the supplier contract prices, Pepco Energy Service’s collateral obligations increase. While Pepco Energy Services no longer enters into new energy supply contracts, it has continuing supply obligations based on prior contracts and corresponding wholesale purchase contracts that extend through 2014. Particularly in periods of energy market price volatility, the collateral obligations associated with these wholesale purchase contracts can be substantial, although they can be expected to diminish as the Pepco Energy Services retail energy supply business is wound down. These collateral demands could negatively affect PHI’s liquidity by requiring PHI to draw on its capacity under its credit facilities or other financing sources.
The retail energy supply business of Pepco Energy Services has significant exposure to counterparty risk. (PHI only)
Pepco Energy Services has entered into transactions with numerous counterparties. These include both commercial transactions for the purchase and sale of electricity and natural gas, and derivative and other transactions, to manage the risk of commodity price fluctuations. Under these arrangements, Pepco Energy Services is exposed to the risk that the counterparty may fail to perform its obligation to make or take delivery under the contract, fail to make a required payment or fail to return collateral posted by Pepco Energy Services when no longer required. Under many of these contracts, Pepco Energy Services is entitled to receive collateral or other types of performance assurance from the counterparty, which may be in the form of cash, letters of credit or parent guarantees, to protect against performance and credit risk. Even where collateral is provided, capital market disruptions can prevent the counterparty from meeting its collateral obligations or degrade the value of letters of credit and guarantees as a result of the lowered rating or insolvency of the issuer or guarantor. In the event of a bankruptcy of a counterparty, bankruptcy law, in some circumstances, could require Pepco Energy Services to surrender collateral held or payments received.
Mark-to-market accounting treatment for instruments Pepco Energy Service’s uses to hedgeconsequently, the cost of supply used to satisfy retail customer load obligations could cause earnings volatility. (PHI only)supplying electricity, are higher. Implementation for residential customers will be phased in commencing in 2012 through 2013. Implementation of dynamic pricing for commercial and industrial SOS customers in Delaware will be phased in commencing in 2013 through 2014.
Dynamic pricing has been approved in concept for Pepco Energy Services purchases energy commodity contractscustomers in Maryland, with phase-in for residential customers beginning in 2012. Pepco has dynamic pricing proposals pending in the formDistrict of electricity and natural gas futures, swaps, options and forward contracts to hedge commodity price risk in connectionColumbia jurisdiction with the purchase of natural gas and electricityproposed phase-in for deliveryresidential customers anticipated to customers. Pepco Energy Services accounts for its futures and swap contracts as cash flow hedges of forecasted transactions. Certain commodity contracts that do not qualify as cash flow hedges of forecasted transactions or do not meet the requirements for normal purchase and normal sale accounting are marked to market through current earnings. Any changebegin in the fair value of the transactions used to hedge price risk that receive mark-to-market accounting treatment will be reflected in PHI’s current earnings without any offsetting change in the fair value of its retail load obligations until the settlement date of these contracts in future periods. As a result, PHI’s earnings could be more volatile due to the mark-to-market accounting treatment for its commodity contracts.
Business operations could be adversely affected by terrorism.
The threat of, or actual acts of, terrorism may affect the operations of PHI and its subsidiaries in unpredictable ways and may cause changes in the insurance markets, force an increase in security measures and cause disruptions of fuel supplies and markets. If any of its infrastructure facilities, including its transmission or distribution facilities, were to be a direct target, or an indirect casualty, of an act of terrorism, the operations of PHI, Pepco, DPL or ACE could be adversely affected. Corresponding instability in the financial markets as a result of terrorism also could adversely affect the ability to raise needed capital.
Insurance coverage may not be sufficient to cover all casualty losses that the companies might incur.
PHI and its subsidiaries, including Pepco, DPL and ACE, currently have insurance coverage for their facilities and operations in amounts and with deductibles that they consider appropriate. However, there is no assurance that such insurance coverage will be available in the future on commercially reasonable terms. In addition, some risks, such as weather related casualties, may not be insurable. In the case of loss or damage to property, plant or equipment, there is no assurance that the insurance proceeds received, if any, will be sufficient to cover the entire cost of replacement or repair.
Revenues, profits and cash flows may be adversely affected by economic conditions.
Periods of slowed economic activity generally result in decreased demand for power, particularly by industrial and large commercial customers. As a consequence, recessions or other downturns in the economy may result in decreased revenues, profits and cash flows for the Power Delivery businesses of Pepco, DPL and ACE and the business of Pepco Energy Services.
The Internal Revenue Service (IRS) challenge to cross-border energy sale and lease-back transactions entered into by a PHI subsidiary could result in loss of prior and future tax benefits. (PHI only)
PCI maintains a portfolio of eight cross-border energy lease investments, which as of December 31, 2010, had an equity value of approximately $1.4 billion and from which PHI currently derives approximately $59 million per year in tax benefits in the form of interest and depreciation deductions in excess of rental income. PHI’s cross-border energy lease investments, each of which is with a tax-indifferent party, have been under examination by the IRS as part of the normal PHI federal income tax audits. In the final IRS revenue agent’s report issued in June 2006 and in March 2009 in connection with the audits of PHI’s federal 2001-2002, and 2003-2005 income tax returns, respectively, the IRS disallowed the depreciation and interest deductions in excess of rental income claimed by PHI with respect to its cross-border energy lease investments. In addition, the IRS has sought to recharacterize the leases as loan transactions as to which PHI would be subject to original issue discount income. PHI disagrees with the IRS’ proposed adjustments and filed tax protests.
In November 2010, the IRS approved a settlement with respect to the 2001-2002 tax returns in which PHI agreed to a disallowance of its depreciation and interest deductions in excess of rental income, but reserved the right to file refund claims contesting the allowances. In January 2011, PHI paid $74 million of additional tax, plus penalties of $1 million, in accordance with the terms of the settlement. PHI intends to file a claim for refund for the disallowed deductions, pursue litigation against the IRS if claim is denied. The 2003-2005 case is currently pending with the IRS Appeals Office.
In the event that that IRS were to be successful in disallowing 100% of the tax benefits associated with these leases and recharacterizing these leases as loans, PHI estimates that, as of December 31, 2010, it would be obligated to pay approximately $692 million in additional federal and state taxes and $133 million of interest, of which $74 million2012. Dynamic pricing has been satisfied by the payment madeapproved in January 2011. In
addition, the IRS could require PHI to pay a penalty of up to 20% on the amount of additional taxes due. PHI anticipates that any additional taxes that it would be required to pay as a result of the disallowance of prior deductions or a re-characterization of the leases as loans would be recoverableconcept pending AMI deployment authorization for DPL’s Maryland customers and has been deferred for ACE’s customers in the form of lower taxes over the remaining terms of the affected leases. Moreover, the entire amount of any additional tax would not be due immediately. Rather, the federal and state taxes would be payable when the open audit years are closed and PHI amends subsequent tax returns not then under audit.
To the extent that PHI does not prevail in this matter and suffers a disallowance of the tax benefits and incurs imputed original issue discount income due to the recharacterization of the leases as loans, PHI would be required under Financial Accounting Standards Board guidance on leases (Accounting Standards Codification (ASC) 840 and ASC 850) to recalculate the timing of the tax benefits generated by the cross-border energy lease investments and adjust the equity value of the investments, which would result in a non-cash charge to earnings that could be material.New Jersey.
For furthera discussion of this matter, see Part II, Item 8, Financial Statements and Supplementary Data — PHI — Note (17), “Commitments and Contingencies — Regulatory and Other Matters — PHI’s Cross-Border Energy Lease Investments,” of this Form 10-K.
PHI and its subsidiaries are dependent on access to capital markets and bank financing to satisfy their capital and liquidity requirements. The inability to obtain required financing would have an adverse effect on their respective businesses.
PHI, Pepco, DPL and ACE each have significant capital requirements, including the funding of construction expenditures and the refinancing of maturing debt. The companies rely primarily on cash flow from operations and access to the capital markets to meet these financing needs. The operating activities of the companies also require access to short-term money markets and bank financing as sources of liquidity that are not met by cash flow from operations. Adverse business developments or market disruptions could increase the cost of financing or prevent the companies from accessing one or more financial markets.
The financing costs of each of PHI, Pepco, DPL and ACE are closely linked, directly or indirectly, to its credit rating. The collateral requirements of Pepco Energy Services’ retail energy supply business also are determined in part by the unsecured debt rating of PHI. Negative ratings actions by one or more of the credit rating agencies resulting from a change in PHI’s or the utility’s operating results or prospects would increase funding costs and collateral requirements and could make financing more difficult to obtain.
Under the terms of PHI’s primary credit facilities, the consolidated indebtedness of PHI cannot exceed 65% of its consolidated capitalization. If PHI’s equity were to decline to a level that caused PHI’s debt to exceed this limit, lenders would be entitled to refuse any further extension of credit and to declare all of the outstanding debt under the credit facilities immediately due and payable. To avoid such a default, a renegotiation of this covenant would be required which would likely increase funding costs and could result in additional covenants that would restrict PHI’s operational and financing flexibility. Events that could cause a reduction in PHI’s equity include a further write down of PHI’s cross-border energy lease investments or a significant write down of PHI’s goodwill.
Events that could cause or contribute to a disruption of the financial markets include, but are not limited to:
a recession or an economic slowdown;
the bankruptcy of one or more energy companies or financial institutions;
a significant change in energy prices;
a terrorist attack or threatened attacks; or
a significant electricity transmission disruption.
In accordance with the requirements of the Sarbanes-Oxley Act of 2002 and the SEC rules thereunder, PHI’s management is responsible for establishing and maintaining internal control over financial reporting and is required to assess annually the effectiveness of these controls. The inability to certify the effectiveness of these controls due to the identification of one or more material weaknesses in these controls also could increase financing costs or could adversely affect the ability to access one or more financial markets.
PHI has a significant goodwill balance related to its Power Delivery business. A determination that goodwill is impaired could result in a significant non-cash charge to earnings.
PHI had a goodwill balance at December 31, 2010, of approximately $1.4 billion, primarily attributable to Pepco’s acquisition of Conectiv in 2002. Under accounting principles generally accepted in the United States of America, an impairment charge must be recorded to the extent that the implied fair value of goodwill is less than the carrying value of goodwill, as shown on the consolidated balance sheet. PHI is required to test goodwill for impairment at least annually and whenever events or changes in circumstances indicate that the carrying value may not be recoverable. Factors that may result in an interim impairment test include a decline in PHI’s stock price causing market capitalization to fall further below book value, an adverse change in business conditions or an adverse regulatory action. If PHI were to determine that its goodwill is impaired, PHI would be required to reduce its goodwill balance by the amount of the impairment and record a corresponding non-cash charge to earnings. Depending on the amount of the impairment, an impairment determination could have a material adverse effect on PHI’s financial condition and results of operations, but would not have an impact on cash flow.
The funding of future defined benefit pension plan and post-retirement benefit plan obligations is based on assumptions regarding the valuation of future benefit obligations and the performance of plan assets. If market performance decreases plan assets or changes in assumptions regarding the valuation of benefit obligations increase plan liabilities, PHI, Pepco, DPL or ACE may be required to make significant cash contributions to fund these plans.
PHI holds assets in trust to meet its obligations under PHI’s defined benefit pension plan (the PHI Retirement Plan) and its postretirement benefit plan. The amounts that PHI is required to contribute (including the amounts for which Pepco, DPL and ACE are responsible) to fund the trusts are determined based on assumptions made as to the valuation of future benefit obligations, and the investment performance of the plan assets. Accordingly, the performance of the capital markets will affect the value of plan assets. A decline in the market value of plan assets may increase the plan funding requirements to meet the future benefit obligations. In addition, changes in interest rates affect the valuation of the liabilities of the plans. As interest rates decrease, the liabilities increase, potentially requiring additional funding. Demographic changes, such as a change in the expected timing of retirements or changes in life expectancy assumptions, also may increase the funding requirements of the plans. A need for significant additional funding of the plans could have a material adverse effect on the cash flows of PHI, Pepco, DPL and ACE. Future increases in pension plan and other postretirement benefit plan costs, to the extent they are not recoverable in the base rates of PHI’s utility subsidiaries, could have a material adverse effect on results of operations and financial condition of PHI, Pepco, DPL and ACE.
PHI’s cash flow, ability to pay dividends and ability to satisfy debt obligations depend on the performance of its operating subsidiaries. PHI’s unsecured obligations are effectively subordinated to the liabilities and the outstanding preferred stock of its subsidiaries. (PHI only)
PHI is a holding company that conducts its operations entirely through its subsidiaries, and all of PHI’s consolidated operating assets are held by its subsidiaries. Accordingly, PHI’s cash flow, its ability to satisfy its obligations to creditors and its ability to pay dividends on its common stock are dependent upon the earnings of the subsidiaries and the distribution of such earnings to PHI in the form of dividends. The subsidiaries are separate legal entities and have no obligation to pay any amounts due on any debt or equity securities issued by PHI or to make any funds available for such payment. Because the claims of
the creditors of PHI’s subsidiaries and the preferred stockholders of ACE are superior to PHI’s entitlement to dividends, the unsecured debt and obligations of PHI are effectively subordinated to all existing and future liabilities of its subsidiaries and to the rights of the holders of ACE’s preferred stock to receive dividend payments.
Provisions of the Delaware General Corporation Law may discourage an acquisition of PHI. (PHI only)
As a Delaware corporation, PHI is subject to the business combination law set forth in Section 203 of the Delaware General Corporation Law, which could have the effect of delaying, discouraging or preventing an acquisition of PHI.
Because Pepco, DPL and ACE are direct or indirect wholly owned subsidiaries of PHI, PHI can exercise substantial control over their dividend policies and businesses and operations. (Pepco, DPL and ACE only)
All of the members of each of Pepco’s, DPL’s and ACE’s board of directors, as well as many of their respective executive officers, are officers of PHI. Among other decisions, each of Pepco’s, DPL’s and ACE’s board is responsible for decisions regarding payment of dividends, financing and capital raising activities and acquisition and disposition of assets. Within the limitations of applicable law, and subject to the financial covenants under each company’s respective outstanding debt instruments, each of Pepco’s, DPL’s and ACE’s board of directors will base its decisions concerning the amount and timing of dividends, and other business decisions, on the company’s earnings, cash flow and capital structure and also may take into account the business plans and financial requirements of PHI and its other subsidiaries.
Pepco Holdings
None.
Pepco
None.
DPL
None.
ACE
None.
Generating Facilities
The following table identifies the electric generating facilities owned by PHI’s subsidiaries at December 31, 2010.
|
|
| ||||||
| ||||||||
| ||||||||
| ||||||||
| ||||||||
| ||||||||
| ||||||||
| ||||||||
| ||||||||
| ||||||||
| ||||||||
| ||||||||
The preceding table sets forth the net summer electric generating capacity of each electric generating facility owned. Although the generating capacity may be higher during the winter months, the facilities are used to meet summer peak loads that are generally higher than winter peak loads. Accordingly, the summer generating capacity more accurately reflects the operational capability of the facilities.
Transmission and Distribution Systems
On a combined basis, the electric transmission and distribution systems owned by Pepco, DPL and ACE at December 31, 2010, consisted of approximately 3,500 transmission circuit miles of overhead lines, 400 transmission circuit miles of underground cables, 18,600 distribution circuit miles of overhead lines, and 16,100 distribution circuit miles of underground cables, primarily in their respective service territories. DPL and ACE own and operate distribution system control centers in New Castle, Delaware and Mays Landing, New Jersey, respectively. Pepco also operates a distribution system control center in Maryland. The computer equipment and systems contained in Pepco’s control center are financed through a sale and leaseback transaction.
DPL owns a liquefied natural gas facility located in Wilmington, Delaware,expenditures associated with a storage capacity of approximately 3 million gallons and an emergency sendout capability of 49,000 Mcf per day. DPL owns 8 natural gas city gate stations at various locations in New Castle County, Delaware. These stations have a total primary delivery point contractual entitlement of 262,961 Mcf per day. DPL also owns approximately 104 pipeline miles of natural gas transmission mains, 1,912 pipeline miles of natural gas distribution mains, and 1,309 natural gas pipeline miles of service lines. In addition, DPL has a 10% undivided interest in approximately 7 miles of natural gas transmission mains, which are used by DPL for its natural gas operations and by the 90% owner for distribution of natural gas to its electric generating facilities.
Substantially all of the transmission and distribution property, plant and equipment owned by each of Pepco, DPL and ACE is subject to the liens of the respective mortgages under which the companies issue First Mortgage Bonds. See Note (11), “Debt” to the consolidated financial statements of PHI, set forth in Part II, Item 8 of this Form 10-K.
Pepco Holdings
Other than litigation incidental to PHI and its subsidiaries’ business, PHI is not a party to, and PHI and its subsidiaries’ property is not subject to, any material pending legal proceedings except as described in Note (17), “Commitments and Contingencies—Legal Proceedings,” to the consolidated financial statements of PHI, set forth in Part II, Item 8 of this Form 10-K.
Pepco
Other than litigation incidental to its business, Pepco is not a party to, and its property is not subject to, any material pending legal proceedings except as described in Note (13), “Commitments and Contingencies—Legal Proceedings,” to the financial statements of Pepco, set forth in Part II, Item 8 of this Form 10-K.
DPL
Other than litigation incidental to its business, DPL is not a party to, and its property is not subject to, any material pending legal proceedings except as described in Note (15), “Commitments and Contingencies—Legal Proceedings,” to the financial statements of DPL, set forth in Part II, Item 8 of this Form 10-K.
ACE
Other than litigation incidental to its business, ACE is not a party to, and its property is not subject to, any material pending legal proceedings except as described in Note (14), “Commitments and Contingencies—Legal Proceedings,” to the consolidated financial statements of ACE, set forth in Part II, Item 8 of this Form 10-K.
Part II
The New York Stock Exchange is the principal market on which Pepco Holdings common stock is traded. The following table presents the dividends declared per share on the Pepco Holdings common stock and the high and low sales pricesBlueprint for the common stock based on composite trading as reported by the New York Stock Exchange during each quarter in the last two years.
Period | Dividends Per Share | Price Range | ||||||||||
| High | Low | |||||||||||
2010: | ||||||||||||
First Quarter | $ | .27 | $ | 17.57 | $ | 15.74 | ||||||
Second Quarter | .27 | 17.78 | 15.13 | |||||||||
Third Quarter | .27 | 18.92 | 15.40 | |||||||||
Fourth Quarter | .27 | 19.80 | 18.01 | |||||||||
| $ | 1.08 | |||||||||||
2009: | ||||||||||||
First Quarter | $ | .27 | $ | 18.71 | $ | 10.07 | ||||||
Second Quarter | .27 | 13.67 | 11.45 | |||||||||
Third Quarter | .27 | 15.37 | 12.85 | |||||||||
Fourth Quarter | .27 | 17.51 | 14.24 | |||||||||
| $ | 1.08 | |||||||||||
See Item 7,Future, see “Management’s Discussion and Analysis of Financial Condition and Results of Operations — Capital—Capital Resources and Liquidity —– Capital Requirements — Dividends,– Blueprint for the Future.”
MAPP Project
In October 2007, the PJM Board of this Form 10-KManagers approved PHI’s proposal to construct a new 230-mile, 500-kilovolt interstate transmission line referred to as the Mid-Atlantic Power Pathway (MAPP), as part of PJM’s regional transmission expansion plan to address the reliability objectives of the PJM RTO system. Since that time, there have been various modifications to the proposal that have redefined the length and route of the MAPP project. PJM has approved the use of advanced direct current technology for information regarding restrictionssegments of the project, including the portion of the line that will traverse under the Chesapeake Bay. The direct current portion of the line will be 640 kilovolts and the remainder of the line will be 500 kilovolts. As currently approved by the PJM Board of Managers, MAPP is approximately 152 miles in length originating at the Possum Point substation in Virginia and ending at the Indian River substation in Delaware. The cost of the MAPP project for Pepco and DPL is currently estimated to be $1.2 billion.
12
In connection with the MAPP project, FERC has authorized for each of Pepco and DPL a 150 basis point adder to its return on equity, resulting in a FERC-approved rate of return on the abilityMAPP project of PHI12.8%, along with full recovery of construction work-in-progress and its subsidiaries to pay dividends.
At December 31, 2010, there were 55,893 registered holders of record of Pepco Holdings common stock.
Dividendsprudently incurred abandoned plant costs.
On January 27,August 18, 2011, PJM notified PHI that the PHI Board of Directors declared a dividend on common stock of 27 cents per share payable March 31, 2011,scheduled in-service date for MAPP has been delayed from June 1, 2015 to shareholders of record on March 10, 2011.
PHI Subsidiaries
All of the common equity of Pepco, DPL and ACE is owned directly or indirectly by PHI. Pepco, DPL and ACE each customarily pays dividends on its common stock on a quarterly basis based on its earnings, cash flow and capital structure, and2019 to 2021 time period, after taking into account changes in demand response, generation retirements and additions, and a revised load forecast for the business plans and financial requirements of PHI and its other subsidiaries.
Pepco
All of Pepco’s common stockPJM region that is held by Pepco Holdings. The table below presentslower than the aggregate amount of common stock dividends paid by Pepco to PHI during each quarterload that was forecasted in the last two years. Dividends received by PHI in 2010 were usedprior PJM studies. A more recent load forecast continues to support this trend. PJM has retained the paymentMAPP project in its 2011 Regional Transmission Expansion Plan. In light of its common stock dividend.the delayed in-service date for MAPP, substantially all of the anticipated capital expenditures associated with MAPP have been delayed until at least 2016 based on current projections.
Period | Aggregate Dividends | |||
2010: | ||||
First Quarter | $ | 25,000,000 | ||
Second Quarter | 25,000,000 | |||
Third Quarter | 45,000,000 | |||
Fourth Quarter | 20,000,000 | |||
| $ | 115,000,000 | |||
2009: | ||||
First Quarter | $ | — | ||
Second Quarter | — | |||
Third Quarter | — | |||
Fourth Quarter | — | |||
| $ | — | |||
DPL
AllThe exact revised in-service date of DPL’s common stockMAPP will be evaluated as part of PJM’s 2012 Regional Transmission Expansion Plan review process. Until PJM’s evaluation is held by Conectiv. The table below presents the aggregate amount of common stock dividends paid by DPL to Conectiv during each quarter in the last two years. Dividends received by Conectiv in 2010 and 2009 were passed through toconcluded, PJM has directed PHI to support the payment of its common stock dividend.
Period | Aggregate Dividends | |||
2010: | ||||
First Quarter | $ | — | ||
Second Quarter | 23,000,000 | |||
Third Quarter | — | |||
Fourth Quarter | — | |||
| $ | 23,000,000 | |||
2009: | ||||
First Quarter | $ | 28,500,000 | ||
Second Quarter | — | |||
Third Quarter | — | |||
Fourth Quarter | — | |||
| $ | 28,500,000 | |||
ACE
All of ACE’s common stock is held by Conectiv. The table below presents the aggregate amount of common stock dividends paid by ACE to Conectiv during each quarter in the last two years. Dividends received by Conectiv in 2010 were used to pay down short-term debt owed to PHI. Dividends received by Conectiv in 2009 were passed through to PHI to support the payment of its common stock dividend.
Period | Aggregate Dividends | |||
2010: | ||||
First Quarter | $ | — | ||
Second Quarter | — | |||
Third Quarter | — | |||
Fourth Quarter | 35,000,000 | |||
| $ | 35,000,000 | |||
2009: | ||||
First Quarter | $ | 24,100,000 | ||
Second Quarter | — | |||
Third Quarter | — | |||
Fourth Quarter | 40,000,000 | |||
| $ | 64,100,000 | |||
Recent Sales of Unregistered Equity Securities
Pepco Holdings
None.
Pepco
None.
DPL
None.
ACE
None.
Purchases of Equity Securities by the Issuer and Affiliated Purchasers
Pepco Holdings
None.
Pepco
None.
DPL
None.
ACE
None.
The following table sets forth selected historical consolidated data for PHI as of December 31, 2010, 2009, 2008, 2007, and 2006, derived from PHI’s audited financial statements.
PEPCO HOLDINGS CONSOLIDATED FINANCIAL HIGHLIGHTS
| 2010 | 2009 | 2008 | 2007 | 2006 | ||||||||||||||||
| (in millions, except per share data) | ||||||||||||||||||||
Consolidated Operating Results | ||||||||||||||||||||
Total Operating Revenue | $ | 7,039 | $ | 7,402 | $ | 8,059 | (f) | $ | 7,613 | $ | 6,877 | |||||||||
Total Operating Expenses | 6,415 | (a) | 6,754 | (d) | 7,510 | 6,953 | (h) | 6,281 | (j) | |||||||||||
Operating Income | 624 | 648 | 549 | 660 | 596 | |||||||||||||||
Other Expenses | 474 | (b) | 321 | 276 | 255 | 252 | ||||||||||||||
Preferred Stock Dividend Requirements of Subsidiaries | — | — | — | — | 1 | |||||||||||||||
Income from Continuing Operations Before Income Tax Expense | 150 | 327 | 273 | 405 | 343 | |||||||||||||||
Income Tax Expense Related to Continuing Operations | 11 | (c) | 104 | (e) | 90 | (f)(g) | 141 | (i) | 133 | |||||||||||
Income from Continuing Operations | 139 | 223 | 183 | 264 | 210 | |||||||||||||||
(Loss) Income from Discontinued Operations, net of Income Taxes | (107 | ) | 12 | 117 | 70 | 38 | (k) | |||||||||||||
Net Income | 32 | 235 | 300 | 334 | 248 | |||||||||||||||
Earnings Available for Common Stock | 32 | 235 | 300 | 334 | 248 | |||||||||||||||
Common Stock Information | ||||||||||||||||||||
Basic Earnings Per Share of Common Stock from Continuing Operations | $ | 0.62 | $ | 1.01 | $ | 0.90 | $ | 1.36 | $ | 1.10 | ||||||||||
Basic (Loss) Earnings per Share of Common Stock from Discontinued Operations | (0.48 | ) | .05 | 0.57 | 0.36 | 0.20 | ||||||||||||||
Basic Earnings Per Share of Common Stock | 0.14 | 1.06 | 1.47 | 1.72 | 1.30 | |||||||||||||||
Diluted Earnings Per Share of Common Stock from Continuing Operations | 0.62 | 1.01 | 0.90 | 1.36 | 1.10 | |||||||||||||||
Diluted (Loss) Earnings per Share of Common Stock from Discontinued Operations | (0.48 | ) | .05 | 0.57 | 0.36 | 0.20 | ||||||||||||||
Diluted Earnings Per Share of Common Stock | 0.14 | 1.06 | 1.47 | 1.72 | 1.30 | |||||||||||||||
Cash Dividends Per Share of Common Stock | 1.08 | 1.08 | 1.08 | 1.04 | 1.04 | |||||||||||||||
Year-End Stock Price | 18.25 | 16.85 | 17.76 | 29.33 | 26.01 | |||||||||||||||
Net Book Value per Common Share | 18.79 | 19.15 | 19.14 | 20.04 | 18.82 | |||||||||||||||
Weighted Average Shares Outstanding | 224 | 221 | 204 | 194 | 191 | |||||||||||||||
Other Information | ||||||||||||||||||||
Investment in Property, Plant and Equipment | $ | 12,120 | $ | 11,431 | $ | 10,860 | $ | 10,392 | $ | 10,003 | ||||||||||
Net Investment in Property, Plant and Equipment | 7,673 | 7,241 | 6,874 | 6,552 | 6,317 | |||||||||||||||
Total Assets | 14,480 | 15,779 | 16,133 | 15,111 | 14,244 | |||||||||||||||
Capitalization | ||||||||||||||||||||
Short-term Debt | $ | 534 | $ | 530 | $ | 465 | $ | 289 | $ | 350 | ||||||||||
Long-term Debt | 3,629 | 4,470 | 4,859 | 4,175 | 3,769 | |||||||||||||||
Current Portion of Long-Term Debt and Project Funding | 75 | 536 | 85 | 332 | 858 | |||||||||||||||
Transition Bonds issued by ACE Funding | 332 | 368 | 401 | 434 | 464 | |||||||||||||||
Capital Lease Obligations due within one year | 8 | 7 | 6 | 6 | 6 | |||||||||||||||
Capital Lease Obligations | 86 | 92 | 99 | 105 | 111 | |||||||||||||||
Long-Term Project Funding | 15 | 17 | 19 | 21 | 23 | |||||||||||||||
Non-controlling Interest | 6 | 6 | 6 | 6 | 24 | |||||||||||||||
Common Shareholders’ Equity | 4,230 | 4,256 | 4,190 | 4,018 | 3,612 | |||||||||||||||
Total Capitalization | $ | 8,915 | $ | 10,282 | $ | 10,130 | $ | 9,386 | $ | 9,217 | ||||||||||
INFORMATION FOR THIS ITEM IS NOT REQUIRED FOR PEPCO, DPL, AND ACE AS THEY MEET THE CONDITIONS SET FORTH IN GENERAL INSTRUCTIONS I(1)(a) AND (b) OF FORM 10-K AND THEREFORE ARE FILING THIS FORM WITH THE REDUCED FILING FORMAT.
The information required by this item is contained herein, as follows:
| ||
| ||
| ||
| ||
| ||
PEPCO HOLDINGS
MANAGEMENT’S DISCUSSION AND ANALYSIS OF FINANCIAL CONDITION AND RESULTS OF OPERATIONS
Pepco Holdings, Inc.
General Overview
Pepco Holdings, Inc. (PHI or Pepco Holdings), a Delaware corporation incorporated in 2001, is a holding company that, through its regulated public utility subsidiaries, is engaged primarily in the transmission, distribution and default supply of electricity and the distribution and supply of natural gas (Power Delivery). Through Pepco Energy Services, Inc. and its subsidiaries (collectively, Pepco Energy Services), PHI provides energy efficiency services primarily to government and institutional customers and is in the process of winding down its competitive electricity and natural gas retail supply business. Each of Power Delivery and Pepco Energy Services constitutes a separate segment for financial reporting purposes. A third segment, Other Non-Regulated, owns a portfolio of eight cross-border energy lease investments.
The following table sets forth the percentage contributions to consolidated operating revenue and operating income from continuing operations attributablelimit further development efforts with respect to the Power Delivery, Pepco Energy ServicesMAPP project and Other Non-Regulated segments:to proceed with only those development efforts reasonably necessary to allow the MAPP project to be quickly restarted if and when deemed necessary. Based on PJM’s direction, PHI intends to continue to complete the right-of-way acquisition for the proposed route, and some environmental and other preparatory activities.
| December 31, | ||||||||||||
| 2010 | 2009 | 2008 | ||||||||||
Percentage of Consolidated Operating Revenue | ||||||||||||
Power Delivery | 73 | % | 67 | % | 68 | % | ||||||
Pepco Energy Services | 27 | % | 32 | % | 33 | % | ||||||
Other Non-Regulated | — | 1 | % | (1 | )% | |||||||
Percentage of Consolidated Operating Income | ||||||||||||
Power Delivery | 81 | % | 78 | % | 101 | % | ||||||
Pepco Energy Services | 11 | % | 14 | % | 10 | % | ||||||
Other Non-Regulated | 8 | % | 8 | % | (11 | )% | ||||||
Percentage of Power Delivery Operating Revenue | ||||||||||||
Power Delivery Electric | 95 | % | 95 | % | 94 | % | ||||||
Power Delivery Gas | 5 | % | 5 | % | 6 | % | ||||||
Power Delivery
Power Delivery Electric consists primarilyFor a discussion of the transmission, distributioncapital expenditures associated with the MAPP Project, see “Management’s Discussion and default supplyAnalysis of electricity,Financial Condition and Power Delivery Gas consistsResults of the deliveryOperations —Capital Resources and supply of natural gas. Power Delivery represents a single operating segment for financial reporting purposes.
The Power Delivery business is conducted by PHI’s three utility subsidiaries: Potomac Electric Power Company (Pepco), Delmarva Power & Light Company (DPL) and Atlantic City Electric Company (ACE). Each of these companies is a regulated public utility in the jurisdictions that comprise its service territory. Each company is responsible for the distribution of electricity and, in the case of DPL, natural gas in its service territory, for which it is paid tariff rates established by the applicable local public service commission. Each company also supplies electricity at regulated rates to retail customers in its service territory who do not elect to purchase electricity from a competitive energy supplier. The regulatory term for this supply service is Standard Office Service (SOS) in Delaware, the District of Columbia and Maryland and Basic Generation Service (BGS) in New Jersey. In this Form 10-K, these supply service obligations are referred to generally as Default Electricity Supply.
PEPCO HOLDINGS
Pepco, DPL and ACE are also responsible for the transmission of wholesale electricity into and across their service territories. The rates each company is permitted to charge for the wholesale transmission of electricity are regulated by the Federal Energy Regulatory Commission (FERC). Transmission rates are updated annually based on a FERC-approved formula methodology.
The profitability of the Power Delivery business depends on its ability to recover costs and earn a reasonable return on its capital investments through the rates it is permitted to charge. The Power Delivery operating results historically have been seasonal, generally producing higher revenue and income in the warmest and coldest periods of the year. Operating results also can be affected by economic conditions, energy prices and the impact of energy efficiency measures on customer usage of electricity.
As a result of the implementation of a bill stabilization adjustment mechanism (BSA) for retail customers of Pepco and DPL in Maryland in June 2007 and for customers of Pepco in the District of Columbia in November 2009, Pepco and DPL recognize distribution revenue based on an approved distribution charge per customer. From a revenue recognition standpoint, this has the effect of decoupling distribution revenue recognized in a reporting period from the amount of power delivered during the period. As a consequence, the only factors that will cause distribution revenue in Maryland and the District of Columbia to fluctuate from period to period are changes in the number of customers and changes in the approved distribution charge per customer. For customers to whom the BSA applies, changes in customer usage (such as due to weather conditions, energy prices, energy efficiency programs or other reasons) from period to period have no impact on reported distribution revenue.
As a result of the BSA in Maryland and the District of Columbia, a Revenue Decoupling Adjustment is recorded representing either (i) a positive adjustment equal to the amount by which revenue from Maryland and District and Columbia retail distribution sales falls short of the revenue that Pepco and DPL are entitled to earn based on the approved distribution charge per customer or (ii) a negative adjustment equal to the amount by which revenue from such distribution sales exceeds the revenue that Pepco and DPL are entitled to earn based on the approved distribution charge per customer.Liquidity – Capital Requirements – MAPP Project.”
Pepco Energy Services
The business of the Pepco Energy Services segment has consisted primarily of (i)is engaged in the retail supply of electricity and natural gas and (ii) following businesses:
providing energy savings performance contractingefficiency services principally to federal, state and local government customers, and designing, constructing, and operating combined heat and power and central energy plants forplants.
providing high voltage electric construction and maintenance services to customers (Energy Services).throughout the United States and low voltage electric construction and maintenance services and streetlight construction and asset management services to utilities, municipalities and other customers in the Washington, D.C. area.
Most of Pepco Energy Services’ contracts with federal, state and local governments, as well as independent agencies such as housing and water authorities, contain provisions authorizing the governmental authority or independent agency to terminate the contract at any time. Those provisions contain explicit mechanisms that, if exercised, would require the other party to pay Pepco Energy Services also ownsfor work performed through the date of termination and operates two oil-fired generation facilities.for additional costs incurred as a result of the termination.
From time to time, PHI is required to guarantee the obligations of Pepco Energy Services under certain of its construction contracts. At December 31, 2011, PHI’s guarantees of Pepco Energy Services’ projects totaled $65 million.
Pepco Energy Services has historically been engaged in the business of providing retail energy supply services, consisting of the sale of electricity, including electricity from renewable resources, primarily to commercial, industrial and government customers located primarily in the mid-Atlantic and northeastern regions of the United States, as well as Texas and Illinois, and the sale of natural gas to customers located primarily in the mid-Atlantic region. In December 2009, PHI announced that it will wind downwould wind-down the retail energy supply component of thebusiness. Pepco Energy Services business. The decision was made after considering, among other factors, the return PHI earnsis implementing this wind-down by investing capital in the retail energy supply business as compared to alternative investments.
To effectuate the wind down, Pepco Energy Services will continue to fulfill all of its commercial and regulatory obligations and perform its customer service functions to ensure that it meets the needs of its existing customers, but will not be entering into any new retail energy supply contracts. Operating revenues relatedcontracts, while continuing to the retail energyperform under its existing supply business for the years endedcontracts through their expiration dates. As of December 31, 2010, 2009 and 2008 were $1.6 billion, $2.3 billion and $2.5 billion, respectively, and operating income for the same periods was $59 million, $88 million and $54 million, respectively.
PHI expects the retail energy supply business to remain profitable through December 31, 2012, based on its existing contract backlog and its corresponding portfolio of wholesale hedges, with immaterial losses beyond that date. Substantially all of2011, Pepco Energy Services’ estimated retail customer obligations will be fully performed by June 1, 2014.
PEPCO HOLDINGS
In connection with the operationelectricity backlog was approximately 3.9 million megawatts for distribution through 2014, a decrease of the retail energy supply business, as ofapproximately 5.8 million megawatts and 16.2 million megawatts when compared to December 31, 2010 and 2009, respectively. For additional information on the Pepco Energy Services has collateral pledged to counterparties primarily for the instruments it uses to hedge commodity price risk of approximately $230 million and $280 million, respectively. Of the December 31, 2010 collateral amount, $113 million was in the form of letters of credit and $117 million was posted in cash. Pepco Energy Services estimates that at current market prices, with the wind down of the retail energy supply business, this collateral will be released as follows: an aggregate of 64% by December 31, 2011, an aggregate of 92% by December 31, 2012, and substantially all collateral by June 1, 2014.
As a result of the decision to wind down the retail energy supply business, Pepco Energy Services in the fourth quarter of 2009 recorded (i) a $4 million pre-tax impairment charge reflecting the write off of all goodwill allocated to the business and (ii) a pre-tax charge of less than $1 million related to employee severance.
Pepco Energy Services’ remaining businesses will not be affected by the wind down of the retail energy supply business.
Other Non-Regulated
Through its subsidiary Potomac Capital Investment Corporation, PHI maintains a portfolio of cross-border energy lease investments with a book value at December 31, 2010 of approximately $1.4 billion. This activity constitutes a third operating segment, which is designated as “Other Non-Regulated,” for financial reporting purposes. For a discussion of PHI’s cross-border energy lease investments,wind-down, see Note (17), “Commitments and Contingencies—Regulatory and Other Matters – PHI’s Cross-Border Energy Lease Investments,” to the consolidated financial statements of PHI set forth in Part II, Item 8 of this Form 10-K.
Discontinued Operations
On April 20, 2010, the Board of Directors of PHI approved a plan for the disposition of Conectiv Energy, which is comprised of Conectiv Energy Holding Company and its subsidiaries. On July 1, 2010, PHI completed the sale of Conectiv Energy’s wholesale power generation business to Calpine for $1.64 billion. The disposition of all of Conectiv Energy’s remaining assets and businesses not included in the Calpine sale, including its load service supply contracts, energy hedging portfolio and certain tolling agreements, has been substantially completed. The operations of Conectiv Energy, which previously comprised a separate segment for financial reporting purposes, have been classified as a discontinued operation in PHI’s consolidated financial statements for each of the three years in the period ended December 31, 2010 and the business is no longer being treated as a separate segment for financial reporting purposes. Accordingly, in this Management’s“Management’s Discussion and Analysis of Financial Condition and Results of Operations – General Overview – Pepco Energy Services.”
Pepco Energy Services’ retail natural gas sales volumes and revenues are seasonally dependent. Colder weather from November through March of each year generally translates into increased sales volumes, which, when coupled with higher natural gas prices during these months, allows Pepco Energy Services to recognize generally higher revenues as compared to other months of the year. Retail electricity sales volumes are also seasonally dependent, with sales in the summer and winter months being generally higher than other months of the year, which, when coupled with higher electricity prices during these periods, allows Pepco Energy Services to recognize generally higher revenues as compared to other periods during the year. However, as Pepco Energy Services is in the process of winding down its retail energy supply business, this effect of seasonality will likely decrease as such wind-down is completed. The energy services business is not seasonal.
Pepco Energy Services owns and operates two oil-fired generating facilities. The facilities are located in Washington, D.C. and have a combined generating capacity of approximately 790 megawatts. Pepco Energy Services sells the output of these facilities into the wholesale market administered by PJM. In February 2007, Pepco Energy Services provided notice to PJM of its intention to deactivate these facilities by the end of May 2012. PJM has informed Pepco
13
Energy Services that these facilities will not be needed for reliability after May 2012; therefore decommissioning plans are currently underway and on schedule. It is not expected that deactivation of these facilities will have a material impact on PHI’s financial condition, results of operations or cash flows.
Pepco Energy Services also owns three landfill gas-fired electricity facilities that have a total generating capacity rating of ten megawatts, the output of which is sold into the wholesale market administered by PJM. Pepco Energy Services also owns a solar photovoltaic facility that has a generating capacity rating of two megawatts, the output of which is sold to its host facility.
Pepco Energy Services’ continuing lines of business will not be significantly affected by the wind-down of the retail energy supply business.
PJM Capacity Markets
Historically, Pepco Energy Services has earned revenue from the sale of capacity associated with its generating facilities. PJM is responsible for ensuring that within its transmission control area there is sufficient generating capacity available to meet the load requirements plus a reserve margin and locates and prices electricity capacity by holding annual auctions covering capacity to be supplied over consecutive 12-month periods. Pepco Energy Services has been exposed to deficiency charges payable to PJM when their generation units failed to meet certain reliability levels.
Since Pepco Energy Services intends to deactivate its two oil-fired generating facilities by May 2012, Pepco Energy Services has not included the facilities’ capacity in any auctions for periods after May 2012.
Competition
Pepco Energy Services’ energy services business is highly competitive. Pepco Energy Services competes with other energy services companies primarily with respect to contracts with federal, state and local governments and independent agencies. Many of these energy services companies are subsidiaries of larger construction or utility holding companies (as is the case with Pepco Energy Services). Among the factors as to which the energy services business competes are the amount and duration of the guarantees provided in energy savings performance contracts and the quality and value of service provided to customers. The energy services business is impacted by new entrants into the market, energy prices, and general economic conditions.
Other Business Operations
Between 1994 and 2002, PCI, a subsidiary of PHI, entered into eight cross-border energy lease investments involving public utility assets (primarily consisting of hydroelectric generation and coal-fired electric generation facilities and natural gas distribution networks) located outside of the United States. Each of these investments is structured as a sale and leaseback transaction commonly referred to as a sale-in, lease-out, or SILO, transaction. During the second quarter of 2011, PHI entered into early termination agreements with two lessees involving all referencesof the leases comprising one of the eight lease investments and a small portion of the leases comprising a second lease investment. The early termination of the leases were negotiated at the request of the lessees and were completed in June 2011. As of December 31, 2011, PHI’s equity investment in its cross-border energy leases was approximately $1.3 billion. For additional information concerning these cross-border energy lease investments, see Note (8), “Leasing Activities,” and Note (17), “Commitments and Contingencies,” to continuing operations exclude the consolidated financial statements of PHI.
14
Regulation
The operations of PHI’s utility subsidiaries, including the formerrates and tariffs they are permitted to charge customers for the distribution and transmission of electricity and, in the case of DPL, the distribution and transportation of natural gas, are subject to regulation by governmental agencies in the jurisdictions in which the subsidiaries provide utility service as follows:
Pepco’s electricity distribution operations are regulated in Maryland by the MPSC and in the District of Columbia by the DCPSC.
DPL’s electricity distribution operations are regulated in Maryland by the MPSC and in Delaware by the DPSC.
DPL’s natural gas distribution and intrastate transportation operations in Delaware are regulated by the DPSC.
ACE’s electricity distribution operations are regulated by the NJBPU.
Each utility subsidiary’s transmission facilities are regulated by FERC.
DPL’s interstate transportation and wholesale sale of natural gas are regulated by FERC.
Each utility subsidiary’s and Pepco Energy Services’ bulk power system is subject to reliability standards established by NERC.
Rates and tariffs are established by these regulatory commissions. PHI’s utility subsidiaries have filed rate cases which are pending in each of its jurisdictions as further described in Note (7), “Regulatory Matters – Regulatory Proceedings – Rate Proceedings,” to the consolidated financial statements of PHI.
The rates and tariffs established by these regulatory commissions are intended to balance the interests of the utilities’ customers and those of its investors by reflecting costs incurred during the period in which the rates are in effect, and giving each utility the opportunity to generate revenues sufficient to recover its costs, including a reasonable rate of return on investor supplied capital during such period. In establishing a utility’s rates, an important factor in the ability of each of Pepco, DPL and ACE to earn its authorized rate of return is the willingness of applicable public service commissions to adequately recognize forward-looking costs in the utility’s rate structure in order to minimize the shortfall in revenues due to the delay in time or “lag” between when costs are incurred and when they are reflected in rates. This delay is commonly known as “regulatory lag.” Each of Pepco, DPL and ACE is currently experiencing significant regulatory lag because their investment in the rate base and operating expenses is outpacing revenue growth.
Higher operating and construction costs, including labor, material, depreciation, taxes and financing costs, as well as costs associated with enhanced distribution system reliability and environmental compliance, are expected at each of PHI’s utility subsidiaries for several years into the future. At the same time, low usage growth and customer growth is expected to limit the growth in revenues. This mismatch between high expense growth and low revenue growth exacerbates regulatory lag for each of PHI’s utility subsidiaries, making it more difficult for each utility to earn equity returns that are allowed by regulators without higher rates or other regulatory relief. See “Risk Factors – The failure of PHI to obtain timely recognition of costs in its rates may have a negative effect on PHI’s results of operations and financial condition.”
Pepco, DPL and ACE anticipate that they will continue to face regulatory lag. In their most recent rate cases, Pepco (in the District of Columbia and Maryland) and DPL (in Delaware and Maryland) each has proposed mechanisms that would track reliability and other expenses and permit the utility between rate cases to make adjustments in its rates for prudent investments as made, thereby seeking to reduce the magnitude of regulatory lag. In New Jersey, the NJBPU has approved certain rate recovery mechanisms
15
in connection with ACE’s Infrastructure Investment Program (IIP), which ACE has proposed to extend and expand. There can be no assurance that these proposals or any other attempts by Pepco, DPL and ACE to mitigate regulatory lag will be approved, or that even if approved, the rate recovery mechanisms or any base rate cases will fully ameliorate the effects of regulatory lag. Until such time as these proposed mechanisms are approved, if necessary to address the problem of regulatory lag, the utilities plan to file rate cases at least annually in an effort to align more closely their revenue and related cash flow levels with other operation and maintenance spending and capital investments. In future rate cases, Pepco, DPL and ACE, as applicable, would also continue to seek cost recovery and tracking mechanisms from applicable regulatory commissions to reduce the effects of regulatory lag.
Maryland Reliability Investigation
In August 2010, following major storm events that occurred in July and August 2010, an investigation was initiated in Maryland into the reliability of Pepco’s distribution system and the quality of distribution service Pepco provided to its customers. As a result of that investigation, the MPSC imposed sanctions on Pepco in December 2011, including a fine of $1 million, which Pepco has paid. In accordance with the order, Pepco has filed a detailed work plan for the next five years, which provided a comprehensive description of Pepco’s reliability enhancement plan, its emergency response improvement project, and other communication and service restoration improvements. Pepco is also required to file quarterly updates and a year-end status report with the MPSC providing, among other things, detailed information about its reliability and emergency response improvement objectives, progress and spending (and explanations for any inability to meet such objectives), together with an analysis of trends concerning the measured duration and frequency of customer interruptions. In the required reports, Pepco will be required to demonstrate that its reliability enhancement plan costs were prudently spent and produced a significant improvement in reliability, and if it is unable to do so, the MPSC may deny Pepco reimbursement for future reliability enhancement investments or impose additional fines. In addition to the sanctions, the MPSC stated its intent to review the recovery of reliability costs in Pepco’s pending rate case and to disallow incremental costs it determines to be the result of imprudent management. Pepco believes its reliability costs have been prudently incurred. Furthermore, Pepco expects its reliability enhancement plan to enable Pepco to meet the MPSC’s requirements. For more information about the MPSC’s ruling in this proceeding, see Note (7), “Regulatory Matters – Regulatory Proceedings,” to the consolidated financial statements of PHI.
District of Columbia and Maryland Reliability and Customer Service Rulemakings
In December 2011, the MPSC approved proposed rules establishing reliability and customer service regulations, compliance with which is anticipated to be mandated as early as the second quarter of 2012. In addition, in July 2011, the DCPSC adopted regulations that establish specific maximum outage frequency and outage duration levels beginning in 2013 and continuing through 2020 and thereafter and are intended to require Pepco to achieve a reliability level in the first quartile of all utilities in the nation by 2020. Pepco and DPL each expect to incur significant operation and maintenance spending and capital investments to comply with these requirements. Pepco believes that the DCPSC’s standards are achievable in the short term, but continues to believe that the standards may not be realistically achievable at an acceptable cost over the longer term. The reliability standards permit Pepco to petition the DCPSC to reevaluate these standards for the period from 2016 to 2020 to address feasibility and cost issues.
Maryland New Generation RFP Issuance Requirement
In September 2009, the MPSC initiated an investigation into whether Maryland’s regulated electric distribution companies (EDCs) should be required to enter into long-term contracts with entities that construct, acquire or lease, and operate, new electric generation facilities in Maryland. In September 2011, the MPSC issued a notice in which it stated that it had not made a final determination at this time whether new generation in Maryland is needed, but directed each of the four Maryland EDCs, including Pepco and DPL, to issue a request for proposal (RFP) for new generation resources by October 7, 2011. On that date, Pepco and DPL issued the RFP and sought additional information from the MPSC on
16
several aspects of the process established in the notice, including whether the MPSC will consider a utility-owned generation option. Hearings were held on January 31, 2012, to obtain further input on whether the EDCs should be ordered to proceed with the RFP. Pepco and DPL have filed a request for rehearing of the notice. The MPSC has stated its intent to select generators and execute long-term contracts between the generators and selected EDCs in April 2012. PHI opposes the requirement to enter into such long-term contracts, which would be viewed as debt by the credit rating agencies and would have an adverse effect on PHI’s, Pepco’s and DPL’s credit metrics.
ACE Standard Offer Capacity Agreements
In April 2011, ACE entered into three Standard Offer Capacity Agreements (SOCAs) by order of the NJBPU, each with a different generation company. The SOCAs were established under a New Jersey law enacted to promote the construction of qualified electric generation facilities in New Jersey. The SOCAs are 15-year, financially settled transactions approved by the NJBPU that allow generators to receive payments from, or make payments to, ACE based on the difference between the fixed price in the SOCAs and the price for capacity that clears PJM. Each of the other EDCs in New Jersey has entered into SOCAs having the same terms with the same generation companies. The annual share of payments or receipts for ACE and the other EDCs is based upon each company’s annual proportion of the total New Jersey load attributable to all EDCs. The NJBPU has approved full recovery from distribution customers of payments made by ACE and the other EDCs, and distribution customers would be entitled to any payments received by ACE and the other EDCs.
ACE and the other EDCs entered the SOCAs under protest based on concerns about the potential cost to distribution customers and the negative credit rating agency implications and have filed lawsuits challenging the constitutionality of the New Jersey law. For more information about the New Jersey law and associated regulatory and legal proceedings, see Note (2), “Significant Accounting Policies – Consolidation of Variable Interest Entities – ACE Standard Offer Capacity Agreements,” to the consolidated financial statements of PHI.
Delaware Renewable Energy Portfolio Standards
DPL is subject to Renewable Energy Portfolio Standards (RPS) in the state of Delaware that require it to obtain renewable energy credits (RECs) for energy delivered to its customers. In July 2011, the Governor of the State of Delaware signed legislation that expands DPL’s RPS obligations beginning in 2012. Before this legislation, DPL was required to obtain RECs for energy delivered only to SOS customers in Delaware; the legislation expands that requirement to energy delivered to all of DPL’s distribution customers in Delaware. DPL’s costs associated with obtaining RECs to fulfill its RPS obligations are recoverable from its distribution customers by law.
The legislation also establishes that the energy output from fuel cells manufactured in Delaware capable of running on renewable fuels is an eligible resource for RECs under the Renewable Portfolio Standards Act. The legislation requires that the DPSC adopt a tariff under which DPL would be an agent that collects payments from its customers and disburses the amounts collected to a qualified fuel cell provider that deploys Delaware-manufactured fuel cells as part of a 30-megawatt generation facility. The legislation also provides for a reduction in DPL’s REC and solar REC requirements based upon the actual energy output of the 30-megawatt generation facility. In October 2011, the DPSC approved the tariff submitted by DPL in response to the legislation. For more information on the tariff, see Note (2), “Significant Accounting Policies – Consolidation of Variable Interest Entities – DPL Renewable Energy Transactions,” to the consolidated financial statements of PHI.
17
NERC Reliability Standards
NERC has established, and FERC has approved, reliability standards with regard to the bulk power system that impose certain operating, planning and cyber security requirements on Pepco, DPL, ACE and Pepco Energy Services. There are eight NERC regional oversight entities, including ReliabilityFirstCorporation (RFC), of which Pepco, DPL, ACE and Pepco Energy Services are members, and Northeast Power Coordinating Council (NPCC), of which Pepco Energy Services is a member. These oversight entities are charged with the day-to-day implementation and enforcement of NERC’s reliability standards, which impose certain operating, planning and cyber security requirements on the bulk power systems of Pepco, DPL, ACE and Pepco Energy Services. RFC and NPCC perform compliance audits on entities registered with NERC based on reliability standards and criteria established by NERC. NERC, RFC and NPCC also conduct compliance investigations in response to a system disturbance, complaint, or possible violation of a reliability standard identified by other means. Each of PHI’s utility subsidiaries and Pepco Energy Services are subject to routine audits and monitoring for compliance with applicable NERC reliability standards, including standards requested by FERC to increase the number of assets designated as “critical assets” (including cyber security assets) subject to NERC’s cyber security standards. NERC is empowered to impose financial penalties, fines and other sanctions for non-compliance with certain rules and regulations.
Employees
At December 31, 2011, PHI had the following number of employees:
| In Collective Bargaining Agreements | ||||||||||||||||||||
| Non-union | International Brotherhood of Electrical Workers | International Union of Operating Engineers | Other | Total | ||||||||||||||||
Pepco | 354 | 1,094 | — | — | 1,448 | |||||||||||||||
DPL | 228 | 688 | — | — | 916 | |||||||||||||||
ACE | 174 | 384 | — | — | 558 | |||||||||||||||
Pepco Energy Services | 273 | 199 | 56 | 27 | 555 | |||||||||||||||
PHI Service Company and Other | 1,261 | 366 | — �� | — | 1,627 | |||||||||||||||
|
|
|
|
|
|
|
|
|
| |||||||||||
Total PHI Employees | 2,290 | 2,731 | 56 | 27 | 5,104 | |||||||||||||||
|
|
|
|
|
|
|
|
|
| |||||||||||
PHI’s subsidiaries are parties to five collective bargaining agreements with four local unions. All five collective bargaining agreements will expire within the next four years, including one agreement that will expire on June 1, 2012. Collective bargaining agreements are generally renegotiated every three to five years.
Environmental Matters
PHI, through its subsidiaries, is subject to regulation by various federal, regional, state, and local authorities with respect to the environmental effects of its operations, including air and water quality control, solid and hazardous waste disposal, greenhouse gas emissions, and limitations on land use. In addition, federal and state statutes authorize governmental agencies to compel responsible parties to clean up certain abandoned or unremediated hazardous waste sites. PHI’s subsidiaries may incur costs to clean up currently or formerly owned facilities or sites found to be contaminated, as well as other facilities or sites that may have been contaminated due to past disposal practices. PHI’s subsidiaries may also be responsible for ongoing environmental remediation costs associated with facilities or operations that have been sold to third parties as further described in Note (17), “Commitments and Contingencies – Environmental Matters – Conectiv Energy segment.
PEPCO HOLDINGSWholesale Power Generation Sites,” to the consolidated financial statements of PHI.
18
PHI’s subsidiaries’ currently projected capital expenditures for the replacement of existing or installation of new environmental control facilities that are necessary for compliance with environmental laws, rules or agency orders are approximately $6 million in 2012 and $3 million in each of 2013, 2014 and 2015. This projection could change depending on the outcome of the matters addressed below or as a result of the imposition of additional environmental requirements or new or different interpretations of existing environmental laws, rules and agency orders. In view of the sale of the Conectiv Energy wholesale power generation business in 2010, PHI is no longer subject to environmental regulations prospectively applicable to electricity generating facilities, except insofar as such regulations affect the operation of the two generating facilities located in the District of Columbia owned by Pepco Energy Services. Moreover, PHI anticipates that these regulations will cease to apply to PHI electricity generating facilities altogether after May 2012, assuming the two generating facilities are deactivated by Pepco Energy Services as planned.
Air Quality Regulation
The generating facilities owned by Pepco Energy Services are subject to federal, state and local laws and regulations, including the Federal Clean Air Act, which limit emissions of air pollutants, require permits for operation of facilities and impose recordkeeping and reporting requirements.
Sulfur Dioxide and Nitrogen Oxide Emissions
The acid rain provisions of the Clean Air Act regulate total Sulfur dioxide (SO2) emissions from affected generating units and allocate “allowances” to each affected unit that permit the unit to emit a specified amount of SO2. The generating facilities of Pepco Energy Services that require allowances use allocated allowances or allowances acquired, as necessary, in the open market to satisfy the applicable regulatory requirements.
In 2005, the U.S. Environmental Protection Agency (EPA) issued the Clean Air Interstate Rule (CAIR), which imposes further reductions of SO2 and limits nitrogen oxide (NOx) emissions from electric generating units in 28 eastern states and the District of Columbia. CAIR uses an allowance system to cap state-wide emissions (and emissions within the District of Columbia) of SO2 (using acid rain allowances) and NOx allowances, as described below, in two stages. NOx reductions were required beginning in 2009 and SO2 reductions were required beginning in 2010. States and the District of Columbia may implement CAIR by adopting EPA’s trading program or through adopting regulations that at a minimum achieve the level of reductions that would otherwise be achieved through implementation of EPA’s trading program. Pepco Energy Services Buzzard Point generating units and its landfill gas generating units produce fewer megawatts than CAIR’s applicability threshold and therefore are not subject to CAIR.
Each state covered by CAIR and the District of Columbia may determine independently which emission sources to control and which control measures to adopt. CAIR includes model rules for multi-state cap and trade programs for power plants that states may choose to adopt to meet the required emissions reductions. In the District of Columbia, the Pepco Energy Services’ Benning Road units are permitted to satisfy the CAIR requirements through the use of allocated allowances or allowances acquired in the open market, through the installation of pollution control devices or through fuel modifications. The Benning Road units use NOx annual, NOx ozone season and SO2 allowances allocated or acquired, as necessary, in the open market to comply with CAIR.
In July 2011, EPA adopted new regulations to replace CAIR, which address transport of air pollution across state boundaries. The Cross-State Air Pollution Rule (CSAPR) imposes stricter limits on SO2 and NOx (annual and ozone season) than CAIR; however, the District of Columbia was in the group of jurisdictions excluded from the SO2, NOx, and seasonal NOx under CSAPR. As a result, CSAPR’s Cap and Trade program, which was originally planned to go into effect on January 1, 2012, is not applicable to Pepco Energy Services.
On December 30, 2011, the District of Columbia Circuit Court of Appeals ruled to stay the CSAPR, and ordered EPA to continue enforcing CAIR. Consequently, Pepco Energy Services must continue to meet its CAIR obligations until after the court resolves petitions for review of CSAPR.
19
Federal Regional Haze Rule
The federal Regional Haze Rule was adopted by EPA to address a type of visibility impairment known as regional haze created by the emission of specified pollutants by certain types of large stationary sources. The regulation requires installation of best available retrofit technology (BART) to boilers that (i) emit 250 tons or more per year of a visibility-impairing air pollutant, (ii) were placed in service between 1962 and 1977, and (iii) may reasonably be anticipated to cause or contribute to visibility impairment in any federally protected park or wilderness area. Pepco Energy Services’ Benning Road generating units are subject to this regulation for particulate matter less than ten microns in diameter and for SO2 and NOx to the extent not addressed by CAIR. Under Pepco Energy Services’ current operating permit issued by the DDOE, the Benning Road generating units will not be required to implement any remedial actions if the facilities are shut down on or before December 17, 2012, which is Pepco Energy Services’ current plan.
Pepco Energy Services’ other generating units, including those at Buzzard Point, are not subject to the Regional Haze Rule.
Hazardous Air Pollutant Emissions
In December 2011, EPA finalized a rule to reduce the emission of toxic air pollutants from generating facilities. The Mercury and Air Toxics Standards will reduce emissions of heavy metals, including mercury, arsenic, chromium and nickel, as well as emissions of acid gases, including hydrochloric and hydrofluoric acid. Because existing generating sources generally have up to four years from the Standards’ effective date to comply with the Mercury and Air Toxics Standards, this rule is not expected to impact the Benning Road or Buzzard Point generating facilities, which are expected to be retired by May 2012.
Greenhouse Gas Emissions Reporting
In October 2009, EPA adopted regulations requiring sources that emit designated greenhouse gases– specifically, carbon dioxide, methane, nitrous oxide, hydrofluorocarbons, perfluorocarbons, and other fluorinated gases (e.g., nitrogen trifluoride and hydrofluorinated ethers) – in excess of specified thresholds to file annual reports with EPA disclosing the amount of such emissions. Under these regulations:
| • | Pepco Energy Services reports CO2, methane and nitrous oxide for its Benning Road units. No changes or restrictions on operations will occur as a result of this rule. |
| • | DPL currently reports with respect to its gas distribution operations CO2 emissions that would result assuming the complete combustion or oxidation of the annual volume of natural gas it distributes to its customers. Beginning in September 2012, DPL will be required to report fugitive CO2 and methane emissions for its gas distribution operations for the previous calendar year (hence, the 2012 report will contain data from calendar year 2011). DPL’s liquefied natural gas storage facility does not meet the reporting threshold (25,000 metric tons) for fugitive emissions. |
ACE, DPL and Pepco will be required to start reporting sulfur hexafluoride emissions from electrical equipment beginning in September 2012, for the previous calendar year.
20
Water Quality Regulation
Clean Water Act
Provisions of the federal Water Pollution Control Act, also known as the Clean Water Act, establish the basic legal structure for regulating the discharge of pollutants from point sources to surface waters of the United States. Among other things, the Clean Water Act requires that any person wishing to discharge pollutants from a point source (generally a confined, discrete conveyance such as a pipe) obtain a National Pollutant Discharge Elimination System (NPDES) permit issued by EPA or by a state agency under a federally authorized state program. The Benning Road facility has a NPDES permit authorizing pollutant discharges, which is subject to periodic renewal.
Pepco and a subsidiary of Pepco Energy Services discharge water from the Benning Road electric generating plant and service center located in the District of Columbia under a NPDES permit issued by EPA in July 2009. The permit imposes compliance monitoring and storm water best management practices to satisfy the District of Columbia’s Total Maximum Daily Load standards for polychlorinated biphenyls (PCBs), oil and grease, metals and other substances. As required by the permit, Pepco has initiated studies to identify the source of the regulated substances to determine appropriate best management practices for minimizing the presence of the substances in storm water. The initial study reports are scheduled for completion in March 2012 and will be submitted to EPA as required. The capital expenditures, if any, that may be needed to implement best management practices to satisfy these new permit conditions will not be known until the results of the studies are reviewed by EPA.
New Jersey Flood Hazard Area Control Act
In November 2007, the New Jersey Department of Environmental Protection adopted amendments to the agency’s regulations under the Flood Hazard Area Control Act the (FHACA) to minimize damage to life and property from flooding caused by development in flood plains. The amended regulations impose a new regulatory program to mitigate flooding and related environmental impacts from a broad range of construction and development activities, including electric utility transmission and distribution construction, which were previously unregulated under the FHACA. These regulations impose restrictions on construction of new electric transmission and distribution facilities and increase the time and personnel resources required to obtain permits and conduct maintenance activities. While ACE continues to evaluate the financial impact related to compliance with the amended regulations, based on current information, PHI and ACE do not believe these regulations will have a material adverse effect on their respective financial conditions or results of operations.
Business Strategy PHI’s business strategy is to pursuing a regulatory strategy that results in earning reasonable rates of return and timely cost recovery of PHI’s remainbecome a mid-Atlantic regional energy distribution utilitytop-performing, regulated power delivery company focused on value creation, operational excellence and environmental responsibility. The components of this strategy include:on:Achieving earnings growthinvesting in the Power Delivery business by focusing on transmission and distribution infrastructure investments and constructive regulatory outcomes, while maintaining a high levelto improve reliability of operational excellence.electric service;Pursuing technologiesbuilding a smarter grid to automate certain functions on the electric system, restore power more efficiently and practices that promoteprovide customers detailed energy efficiency,information to help them control their energy conservation and the reduction of greenhouse gas emissions.costs;Supplementinginvesting in advanced technologies, new processes and personnel to enhance the customer experience during power restoration, including delivering enhanced customer communications;utility earnings through Pepco Energy Servicesinvestments;
4
growing PHI’s energy services business by providing comprehensive energy performance servicesmanagement solutions and developing, installing and operating renewable energy solutions; and
demonstrating PHI’s core values of safety, diversity and combined heatenvironmental stewardship through PHI’s business approaches and power alternatives to commercial, industrialtangible business practices and government customers.outcomes.
To further thisits business strategy, PHI may from time to time examine a variety of transactions involving its existing businesses, including the entryentering into joint ventures, disposing of businesses or the disposition of one or more businesses, as well as possiblemaking acquisitions. PHI also may reassess or refine the components of its business strategy as it deems necessary or appropriate in response to business factors and conditions, including regulatory requirements.
Description of Business
Power Delivery
PHI’s primary business is Power Delivery. Power Delivery in 2011, 2010 and 2009, produced 79%, 73%, and 67%, respectively, of PHI’s consolidated operating revenues and 78%, 81%, and 78%, respectively, of PHI’s consolidated operating income.
Each utility comprising Power Delivery is regulated in the jurisdictions that encompass its electricity distribution service territory and is regulated by FERC for its electricity transmission facilities. DPL also is a wideregulated natural gas utility serving portions of Delaware. In the aggregate, Power Delivery distributes electricity to more than 1.8 million customers in the mid-Atlantic region and delivers natural gas to approximately 124,000 customers in Delaware. None of PHI’s three utilities owns any electric generation facilities.
Distribution and Default Supply of Electricity
Pepco, DPL and ACE each owns and operates a network of wires, substations and other equipment that are classified as transmission facilities, distribution facilities or common facilities (which are used for both transmission and distribution). Transmission facilities carry wholesale electricity into, or across, the utility’s service territory. Distribution facilities carry electricity from the transmission facilities to the end-use customers located in the utility’s service territory.
Each utility is responsible for the distribution of electricity in its service territory, for which it is paid tariff rates established by the applicable local public service commissions. Each utility also supplies electricity at regulated rates to retail customers in its service territory who do not elect to purchase electricity from a competitive retail supplier. The regulatory term for this default supply service is Standard Offer Service (SOS) in Delaware, the District of Columbia and Maryland, and Basic Generation Service (BGS) in New Jersey. In this Form 10-K, these supply services are referred to generally as Default Electricity Supply.
Transmission of Electricity and Relationship with PJM
The transmission facilities owned by Pepco, DPL and ACE are interconnected with the transmission facilities of contiguous utilities and are part of an interstate power transmission grid over which electricity is transmitted throughout the mid-Atlantic portion of the United States and parts of the Midwest. Pepco, DPL and ACE each is a member of the PJM Regional Transmission Organization (PJM RTO), the regional transmission organization designated by the Federal Energy Regulatory Commission (FERC) to coordinate the movement of wholesale electricity within a region consisting of all or parts of Delaware, Illinois, Indiana, Kentucky, Maryland, Michigan, New Jersey, North Carolina, Ohio, Pennsylvania, Tennessee, Virginia, West Virginia and the District of Columbia.
5
PJM, the FERC-approved independent grid operator, manages the transmission grid and the wholesale electricity market in the PJM RTO region. Any entity that wishes to have wholesale electricity delivered at any point within the PJM RTO region must obtain transmission services from PJM. In accordance with FERC-approved rules, Pepco, DPL, ACE and the other transmission-owning utilities in the region make their transmission facilities available to the PJM RTO, and PJM directs and controls the operation of these transmission facilities. For transmission services, transmission owners are paid rates proposed by the transmission owner and approved by FERC. PJM provides billing and settlement services, collects transmission service revenue from transmission service customers and distributes the revenue to the transmission owners. PJM also directs the regional transmission planning process within the PJM RTO region. The PJM Board of Managers reviews and approves each PJM regional transmission expansion plan, including whether to include new construction of transmission facilities proposed by PJM RTO members in the plan and, if so, the target in-service date for those facilities.
Seasonality
The operating results of Power Delivery historically have been directly related to the volume of electricity delivered to its customers, producing higher revenues and net income during periods when customers consumed higher amounts of electricity (usually during periods of extreme temperatures) and lower revenues and net income during periods when customers consumed lower amounts of electricity (usually during periods of mild temperatures). This has been due in part to the long standing practice by which the applicable public service commissions set distribution rates based on a fixed charge per kilowatt-hour of electricity used by the customer. Because most of the costs associated with the distribution of electricity do not vary with the volume of electricity delivered, this pricing mechanism also contributed to seasonal variations in net income. As a result of the implementation of a BSA for retail customers of Pepco and DPL in Maryland in June 2007 and for customers of Pepco in the District of Columbia in November 2009, distribution revenues have been decoupled from the amount of electricity delivered. Under the BSA, utility customers pay an approved distribution charge for their electric service which does not vary by electricity usage. This change has had the effect of aligning annual distribution revenues more closely with annual distribution costs. In addition, the change has had the effect of eliminating changes in customer electricity usage, whether due to weather conditions or for any other reason, as a factor having an impact on annual distribution revenue and net income in those jurisdictions. The BSA also eliminates what otherwise might be a disincentive for the utility to aggressively develop and promote efficiency programs. Distribution revenues are not decoupled for the distribution of electricity and natural gas by DPL in Delaware or for the distribution of electricity by ACE in New Jersey, and thus are subject to variability due to changes in customer consumption.
In contrast to electricity distribution costs, the cost of the electricity supplied, which is the largest component of a customer’s bill, does vary directly in relation to the volume of electricity used by a customer. Accordingly, whether or not a BSA is in effect for the jurisdiction, the revenues of Pepco, DPL and ACE from the supply of electricity and natural gas vary based on consumption and on this basis are seasonal. Because the revenues received by each of the utility subsidiaries for the default supply of electricity and natural gas closely approximate the supply costs, the impact on net income is immaterial, and therefore is not seasonal.
Regulated Utility Subsidiaries
The following is a more detailed description of the business of each of PHI’s three regulated utility subsidiaries:
6
Pepco
Pepco is engaged in the transmission, distribution and default supply of electricity in the District of Columbia and major portions of Prince George’s County and Montgomery County in Maryland. Pepco’s service territory covers approximately 640 square miles and has a population of approximately 2.2 million. As of December 31, 2011, Pepco distributed electricity to 788,000 customers (of which 257,000 were located in the District of Columbia and 531,000 were located in Maryland), as compared to 787,000 customers as of December 31, 2010 (of which 256,000 were located in the District of Columbia and 531,000 were located in Maryland). As of December 31, 2009, Pepco distributed electricity to 778,000 customers (of which 252,000 were located in the District of Columbia and 526,000 were located in Maryland).
In 2011, Pepco distributed a total of 26,895,000 megawatt hours of electricity, of which 57% was distributed within its Maryland territory and 43% within the District of Columbia. Of this amount, 30% of the total megawatt hours were delivered to residential customers, 50% to commercial customers, and 20% to United States and District of Columbia government customers. In 2010, Pepco distributed a total of 27,665,000 megawatt hours of electricity, of which 57% was distributed within its Maryland territory and 43% within the District of Columbia. Of this amount, 30% of the total megawatt hours were distributed to residential customers, 49% to commercial customers, and 21% to United States and District of Columbia government customers. In 2009, Pepco distributed a total of 26,549,000 megawatt hours of electricity, of which 57% was distributed within its Maryland territory and 43% within the District of Columbia. Of this amount, 29% of the total megawatt hours were distributed to residential customers, 50% to commercial customers, and 21% to United States and District of Columbia government customers.
Pepco has been providing SOS in Maryland since July 2004. Pursuant to orders issued by the Maryland Public Service Commission (MPSC), Pepco is obligated to provide SOS (i) to residential and small commercial customers until further action of the Maryland General Assembly and (ii) to medium-sized commercial customers through November 2012. Pepco purchases the electricity required to satisfy these SOS obligations from wholesale suppliers under contracts entered into in accordance with competitive bid procedures approved and supervised by the MPSC. Pepco also is obligated to provide Standard Offer Service, known as Hourly Priced Service (HPS), for large Maryland customers. Power to supply HPS customers is acquired in next-day and other short-term PJM RTO markets. Pepco is entitled to recover from its SOS customers the cost of acquiring the SOS supply, plus an administrative charge that is intended to allow Pepco to recover the administrative costs incurred to provide the SOS and a modest margin. Because the margin varies by customer class, the actual average margin over any given time period depends on the number of Maryland SOS customers in each customer class and the electricity used by such customers. Pepco is paid tariff rates for the distribution of electricity over its transmission and distribution facilities to all electricity customers in its Maryland service territory regardless of whether the customer receives SOS or purchases electricity from another supplier.
Pepco has been providing SOS in the District of Columbia since February 2005. Pursuant to orders issued by the District of Columbia Public Service Commission (DCPSC), Pepco is obligated to provide SOS to residential and small, medium-sized and large commercial customers indefinitely. Pepco purchases the electricity required to satisfy its SOS obligations from wholesale suppliers under contracts entered into in accordance with a competitive bid procedure approved and supervised by the DCPSC. Pepco is entitled to recover from its SOS customers the costs of acquiring the SOS supply, plus an administrative charge that is intended to allow Pepco to recover the administrative costs incurred to provide the SOS and a modest margin. Because the margin varies by customer class, the actual average margin over any given time period depends on the number of District of Columbia SOS customers in each customer class and the amount of electricity used by such customers. Pepco is paid tariff rates for the distribution of electricity over its transmission and distribution facilities to all electricity customers in its District of Columbia service territory regardless of whether the customer receives SOS or purchases electricity from another supplier.
7
For the year ended December 31, 2011, 43% of Pepco’s Maryland distribution sales (measured by megawatt hours) were to SOS customers, as compared to 46% and 49% in 2010 and 2009, respectively, and 27% of its District of Columbia distribution sales (measured by megawatt hours) were to SOS customers in 2011, as compared to 29% and 31% in 2010 and 2009, respectively.
DPL
DPL is engaged in the transmission, distribution and default supply of electricity in Delaware and portions of Maryland. In northern Delaware, DPL also supplies and delivers natural gas to retail customers and provides transportation-only services to retail customers that purchase natural gas from another supplier.
Distribution and Supply of Electricity
DPL’s electricity distribution service territory consists of the state of Delaware, and Caroline, Cecil, Dorchester, Harford, Kent, Queen Anne’s, Somerset, Talbot, Wicomico and Worcester counties in Maryland. This territory covers approximately 5,000 square miles and has a population of approximately 1.4 million. As of December 31, 2011, DPL delivered electricity to 501,000 customers (of which 301,000 were located in Delaware and 200,000 were located in Maryland), as compared to 500,000 customers as of December 31, 2010 (of which 301,000 were located in Delaware and 199,000 were located in Maryland). As of December 31, 2009, DPL delivered electricity to 498,000 customers (of which 299,000 were located in Delaware and 199,000 were located in Maryland).
In 2011, DPL distributed a total of 12,688,000 megawatt hours of electricity to its customers, of which 66% was distributed within its Delaware territory and 34% within Maryland. Of this amount, 41% of the total megawatt hours were distributed to residential customers, 42% to commercial customers and 17% to industrial customers. In 2010, DPL distributed a total of 12,853,000 megawatt hours of electricity, of which 66% was distributed within its Delaware territory and 34% within Maryland. Of this amount, 42% of the total megawatt hours were distributed to residential customers, 41% to commercial customers and 17% to industrial customers. In 2009, DPL distributed a total of 12,494,000 megawatt hours of electricity, of which 67% was distributed within its Delaware territory and 33% within Maryland. Of this amount, 39% of the total megawatt hours were distributed to residential customers, 41% to commercial customers and 20% to industrial customers.
DPL has been providing SOS in Delaware since May 2006. Pursuant to orders issued by the Delaware Public Service Commission (DPSC), DPL is obligated to provide SOS to residential, small commercial and industrial customers through May 2014, and to medium, large and general service commercial customers through May 2012. DPL purchases the electricity required to satisfy these SOS obligations from wholesale suppliers under contracts entered into in accordance with competitive bid procedures approved and supervised by the DPSC. DPL also has an obligation to provide SOS, known as HPS, for the largest Delaware customers. Power to supply the HPS customers is acquired in next-day and other short-term PJM RTO markets. DPL’s rates for supplying SOS and HPS reflect the associated capacity, energy (including satisfaction of renewable energy requirements), transmission and ancillary services costs and an amount referred to as a Reasonable Allowance for Retail Margin. Components of the Reasonable Allowance for Retail Margin include a fixed annual margin of approximately $2.75 million, plus estimated incremental expenses, a cash working capital allowance, and recovery, with a return over five years ending 2011, of the capitalized costs of the billing system used for billing HPS customers. DPL is paid tariff rates for the distribution of electricity over its transmission and distribution facilities to all electricity customers in its Delaware service territory regardless of whether the customer receives SOS or purchases electricity from another supplier.
8
DPL has been providing SOS in Maryland since June 2004. Pursuant to orders issued by the MPSC, DPL is obligated to provide SOS to residential and small commercial customers until further action of the Maryland General Assembly, and to medium-sized commercial customers through May 2014. DPL purchases the electricity required to satisfy these SOS obligations from wholesale suppliers under contracts entered into in accordance with a competitive bid procedure approved and supervised by the MPSC. DPL also is obligated to provide HPS for large Maryland customers. Power to supply the HPS customers is acquired in next-day and other short-term PJM RTO markets. DPL is entitled to recover from its SOS customers the costs of acquiring the SOS supply, plus an administrative charge that is intended to allow DPL to recover the administrative costs incurred to provide the SOS and a modest margin. Because the margin varies by customer class, the actual average margin over any given time period depends on the number of Maryland SOS customers in each customer class and the electricity used by such customers. DPL is paid tariff rates for the distribution of electricity over its transmission and distribution facilities to all electricity customers in its Maryland service territory regardless of whether the customer receives SOS or purchases electricity from another supplier.
For the year ended December 31, 2011, 51% of DPL’s Delaware distribution sales (measured by megawatt hours) were to SOS customers, as compared to 53% and 51% in 2010 and 2009, respectively, and 58% of its Maryland distribution sales (measured by megawatt hours) were to SOS customers in 2011, as compared to 63% in 2010 and 2009.
Supply and Distribution of Natural Gas
DPL provides regulated natural gas supply and distribution service to customers in a service territory consisting of a major portion of New Castle County in Delaware. This service territory covers approximately 275 square miles and has a population of approximately 500,000. Large volume commercial, institutional, and industrial natural gas customers may purchase natural gas either from DPL or from other suppliers. DPL uses its natural gas distribution facilities to deliver natural gas to customers that choose to purchase natural gas from another supplier. Intrastate transportation customers pay DPL distribution service rates approved by the DPSC. DPL purchases natural gas supplies for resale to its retail service customers from marketers and producers through a combination of long-term agreements and next-day distribution arrangements. For the year ended December 31, 2011, DPL supplied 64% of the natural gas that it delivered, compared to 65% in 2010 and 68% in 2009.
As of December 31, 2011, DPL delivered natural gas to 124,000 customers as compared to 123,000 customers as of December 31, 2010 and 2009. In 2011, DPL delivered 19,000,000 Mcf (thousand cubic feet) of natural gas to customers in its Delaware service territory, of which 40% were sales to residential customers, 23% to commercial customers, 1% to industrial customers and 36% to customers receiving a transportation-only service. In 2010, DPL delivered 19,000,000 Mcf of natural gas, of which 41% were sales to residential customers, 23% were sales to commercial customers, 1% were sales to industrial customers and 35% were sales to customers receiving a transportation-only service. In 2009, DPL delivered 19,000,000 Mcf of natural gas, of which 42% were sales to residential customers, 25% were sales to commercial customers, 1% were sales to industrial customers and 32% were sales to customers receiving a transportation-only service.
ACE
ACE is primarily engaged in the transmission, distribution and default supply of electricity in a service territory consisting of Gloucester, Camden, Burlington, Ocean, Atlantic, Cape May, Cumberland and Salem counties in southern New Jersey. ACE’s service territory covers approximately 2,700 square miles and has a population of approximately 1.1 million. As of December 31, 2011, ACE distributed electricity to 547,000 customers in its service territory, as compared to 548,000 and 547,000 customers as of December 31, 2010 and 2009, respectively.
9
In 2011, ACE distributed a total of 9,683,000 megawatt hours of electricity to its customers, of which 46% of the total was distributed to residential customers, 45% to commercial customers and 9% to industrial customers. In 2010, ACE distributed a total of 10,185,000 megawatt hours of electricity to its customers, of which 46% of the total was distributed to residential customers, 44% to commercial customers, and 10% to industrial customers. In 2009, ACE distributed a total of 9,659,000 megawatt hours of electricity to its customers, of which 45% was distributed to residential customers, 45% to commercial customers, and 10% to industrial customers.
Electric customers in New Jersey who do not choose another supplier receive BGS from their electric distribution company. New Jersey’s electric distribution companies, including ACE, jointly obtain the electricity to meet their BGS obligations from competitive suppliers selected through auctions authorized by the New Jersey Board of Public Utilities (NJBPU) for the supply of New Jersey’s total BGS requirements. Each winning bidder is required to supply its committed portion of the BGS customer load with full requirements service, consisting of power supply and transmission service.
ACE provides two types of BGS:
ACE is paid tariff supply rates established by the NJBPU that compensate it for the cost of obtaining the BGS supply. These rates are set such that ACE does not make any profit or incur any loss on the supply component of the BGS it supplies to customers. ACE is paid tariff rates for the distribution of electricity over its transmission and distribution facilities to all electricity customers in its service territory regardless of whether the customer receives BGS or purchases electricity from another supplier.
For the year ended December 31, 2011, 56% of ACE’s total distribution sales (measured by megawatt hours) were to BGS customers, as compared to 65% and 73% in 2010 and 2009, respectively.
ACE has contracts with three unaffiliated non-utility generators (NUGs) under which ACE is obligated to purchase capacity and the entire generation output of the facilities. One of the contracts expires in 2016 and the other two expire in 2024. In 2011, ACE purchased 1.9 million megawatt hours of power from the NUGs. ACE sells this electricity into the wholesale market administered by PJM.
In 2001, ACE established Atlantic City Electric Transitional Funding LLC (ACE Funding) solely for the purpose of securitizing authorized portions of ACE’s recoverable stranded costs through the issuance and sale of bonds (Transition Bonds). The proceeds of the sale of each series of Transition Bonds were transferred to ACE in exchange for the transfer by ACE to ACE Funding of the right to collect a non-bypassable transition bond charge from ACE customers pursuant to bondable stranded costs rate orders issued by the NJBPU in an amount sufficient to fund the principal and interest payments on the Transition Bonds and related taxes, expenses and fees (Bondable Transition Property). The assets of ACE Funding, including the Bondable Transition Property, and the Transition Bond charges collected from ACE’s customers, are not available to creditors of ACE. The holders of Transition Bonds have recourse only to the assets of ACE Funding.
10
Other Power Delivery Initiatives and Activities
Reliability Enhancement and Emergency Restoration Improvement Plans
In 2010, PHI announced comprehensive reliability enhancement plans for Pepco in Maryland and the District of Columbia. These reliability enhancement plans include various initiatives such as enhanced vegetation management, the identification and upgrading of under-performing feeder lines, the addition of new facilities to support load, the installation of distribution automation systems on both the overhead and underground network system, the rejuvenation and replacement of underground residential cables, improvements to substation supply lines and selective undergrounding of portions of existing above ground primary feeder lines, where appropriate to improve reliability and enhance customer satisfaction. During 2011, Pepco continued to execute on its plans to improve reliability which it believes have contributed to its progress in reducing both the frequency and duration of power outages. During 2011, Pepco invested $120 million in capital expenditures on these reliability enhancement activities. Since initiating the reliability enhancement plans, Pepco trimmed trees along nearly 3,500 miles of power lines, completed 48 expansion projects to meet growth in customer demand for electricity, upgraded more than 340 miles of aging underground lines, and added 125 automated switches that will reroute power more effectively during outages. PHI has extended its reliability enhancement efforts to DPL and ACE.
In 2011 PHI initiated an accelerated emergency restoration improvement program prior to the start of the 2011 summer storm season. As part of this program, Pepco:
more than doubled the number of telephone trunk lines to its Washington, D.C. regional call center;
developed mobile applications to report and track outages;
improved outage information on its Web site to enhance communications with its customers;
implemented regional storm centers for more efficient crew dispatch;
implemented better methodologies for estimating times for restoration of power;
employed technology, including smart meters, to obtain real-time information from the field on power outages and to assist restoration planning efforts by providing data needed to conduct real-time damage assessments;
augmented training of its emergency response personnel; and
installed a backup crisis call center.
These and other emergency restoration improvements implemented as a part of this program were tested during Hurricane Irene in August 2011. Although nearly 500,000 customers across all three utilities were without power at the peak of the storm, nearly 98% of outages were restored within a little more than two days.
PHI’s capital expenditures for continuing reliability enhancement efforts are included in the table of projected capital expenditures, see “Management’s Discussion and Analysis of Financial Condition and Results of Operations —Capital Resources and Liquidity – Capital Expenditures.”
Blueprint for the Future
Each of PHI’s utility subsidiaries is participating in a PHI initiative referred to as “Blueprint for the Future,” which is designed to meet the challenges of rising energy costs, respond to concerns about the environment, improve reliability and address government energy reduction goals. The initiative includes the implementation of various programs to help customers better manage their energy use, reduce the total cost of energy and provide other benefits. These programs also enhance the ability of PHI’s utilities to better manage and operate their electrical and natural gas distribution systems.
11
One of the primary initiatives of Blueprint for the Future is the installation of smart meters (also known as Advanced Metering Infrastructure (AMI)) for electric and natural gas customers, which are subject to the approval of applicable state regulators. These smart meters allow the utilities, among other capabilities, to remotely read meters, significantly reduce the number of customer bills that are based on usage estimates, improve outage management and detection, and provide customers with more detailed information about their energy consumption. In addition to the replacement of existing meters, the AMI system involves the construction of a wireless network across the service territories of PHI’s utility subsidiaries and the implementation and integration of new and existing information technology systems to collect and manage data made available by the advanced meters. The implementation of the AMI system involves a combination of technologies provided by multiple vendors. Meter installation is substantially complete for DPL electric customers in Delaware, with meter activation expected to be completed in the first quarter of 2012. Meter installation is progressing for Pepco customers in both the District of Columbia and Maryland, with installation expected to be complete in the second and fourth quarters of 2012, respectively. The respective public service commissions have approved the creation of a regulatory asset to defer AMI costs between rate cases, as well as the accrual of a return on the deferred costs. Thus, these costs will be recovered through base rates in the future.
Approval of AMI is still pending for electric customers in DPL’s Maryland service territory, and has been deferred for ACE in New Jersey.
On December 20, 2011, the Delaware Public Service Commission approved DPL’s request to implement dynamic pricing for its Delaware customers. Dynamic pricing will reward SOS customers for lowering their energy use during those times when energy demand and, consequently, the cost of supplying electricity, are higher. Implementation for residential customers will be phased in commencing in 2012 through 2013. Implementation of dynamic pricing for commercial and industrial SOS customers in Delaware will be phased in commencing in 2013 through 2014.
Dynamic pricing has been approved in concept for Pepco customers in Maryland, with phase-in for residential customers beginning in 2012. Pepco has dynamic pricing proposals pending in the District of Columbia jurisdiction with the proposed phase-in for residential customers anticipated to begin in 2012. Dynamic pricing has been approved in concept pending AMI deployment authorization for DPL’s Maryland customers and has been deferred for ACE’s customers in New Jersey.
For a discussion of the capital expenditures associated with Blueprint for the Future, see “Management’s Discussion and Analysis of Financial Condition and Results of Operations —Capital Resources and Liquidity – Capital Requirements – Blueprint for the Future.”
MAPP Project
In October 2007, the PJM Board of Managers approved PHI’s proposal to construct a new 230-mile, 500-kilovolt interstate transmission line referred to as the Mid-Atlantic Power Pathway (MAPP), as part of PJM’s regional transmission expansion plan to address the reliability objectives of the PJM RTO system. Since that time, there have been various modifications to the proposal that have redefined the length and route of the MAPP project. PJM has approved the use of advanced direct current technology for segments of the project, including the portion of the line that will traverse under the Chesapeake Bay. The direct current portion of the line will be 640 kilovolts and the remainder of the line will be 500 kilovolts. As currently approved by the PJM Board of Managers, MAPP is approximately 152 miles in length originating at the Possum Point substation in Virginia and ending at the Indian River substation in Delaware. The cost of the MAPP project for Pepco and DPL is currently estimated to be $1.2 billion.
12
In connection with the MAPP project, FERC has authorized for each of Pepco and DPL a 150 basis point adder to its return on equity, resulting in a FERC-approved rate of return on the MAPP project of 12.8%, along with full recovery of construction work-in-progress and prudently incurred abandoned plant costs.
On August 18, 2011, PJM notified PHI that the scheduled in-service date for MAPP has been delayed from June 1, 2015 to the 2019 to 2021 time period, after taking into account changes in demand response, generation retirements and additions, and a revised load forecast for the PJM region that is lower than the load that was forecasted in prior PJM studies. A more recent load forecast continues to support this trend. PJM has retained the MAPP project in its 2011 Regional Transmission Expansion Plan. In light of the delayed in-service date for MAPP, substantially all of the anticipated capital expenditures associated with MAPP have been delayed until at least 2016 based on current projections.
The exact revised in-service date of MAPP will be evaluated as part of PJM’s 2012 Regional Transmission Expansion Plan review process. Until PJM’s evaluation is concluded, PJM has directed PHI to limit further development efforts with respect to the MAPP project and to proceed with only those development efforts reasonably necessary to allow the MAPP project to be quickly restarted if and when deemed necessary. Based on PJM’s direction, PHI intends to continue to complete the right-of-way acquisition for the proposed route, and some environmental and other preparatory activities.
For a discussion of the capital expenditures associated with the MAPP Project, see “Management’s Discussion and Analysis of Financial Condition and Results of Operations —Capital Resources and Liquidity – Capital Requirements – MAPP Project.”
Pepco Energy Services
Pepco Energy Services is engaged in the following businesses:
providing energy efficiency services principally to federal, state and local government customers, and designing, constructing, and operating combined heat and power and central energy plants.
providing high voltage electric construction and maintenance services to customers throughout the United States and low voltage electric construction and maintenance services and streetlight construction and asset management services to utilities, municipalities and other customers in the Washington, D.C. area.
Most of Pepco Energy Services’ contracts with federal, state and local governments, as well as independent agencies such as housing and water authorities, contain provisions authorizing the governmental authority or independent agency to terminate the contract at any time. Those provisions contain explicit mechanisms that, if exercised, would require the other party to pay Pepco Energy Services for work performed through the date of termination and for additional costs incurred as a result of the termination.
From time to time, PHI is required to guarantee the obligations of Pepco Energy Services under certain of its construction contracts. At December 31, 2011, PHI’s guarantees of Pepco Energy Services’ projects totaled $65 million.
Pepco Energy Services has historically been engaged in the business of providing retail energy supply services, consisting of the sale of electricity, including electricity from renewable resources, primarily to commercial, industrial and government customers located primarily in the mid-Atlantic and northeastern regions of the United States, as well as Texas and Illinois, and the sale of natural gas to customers located primarily in the mid-Atlantic region. In December 2009, PHI announced that it would wind-down the retail energy supply business. Pepco Energy Services is implementing this wind-down by not entering into any new supply contracts, while continuing to perform under its existing supply contracts through their expiration dates. As of December 31, 2011, Pepco Energy Services’ estimated retail electricity backlog was approximately 3.9 million megawatts for distribution through 2014, a decrease of approximately 5.8 million megawatts and 16.2 million megawatts when compared to December 31, 2010 and 2009, respectively. For additional information on the Pepco Energy Services wind-down, see “Management’s Discussion and Analysis of Financial Condition and Results of Operations – General Overview – Pepco Energy Services.”
Pepco Energy Services’ retail natural gas sales volumes and revenues are seasonally dependent. Colder weather from November through March of each year generally translates into increased sales volumes, which, when coupled with higher natural gas prices during these months, allows Pepco Energy Services to recognize generally higher revenues as compared to other months of the year. Retail electricity sales volumes are also seasonally dependent, with sales in the summer and winter months being generally higher than other months of the year, which, when coupled with higher electricity prices during these periods, allows Pepco Energy Services to recognize generally higher revenues as compared to other periods during the year. However, as Pepco Energy Services is in the process of winding down its retail energy supply business, this effect of seasonality will likely decrease as such wind-down is completed. The energy services business is not seasonal.
Pepco Energy Services owns and operates two oil-fired generating facilities. The facilities are located in Washington, D.C. and have a combined generating capacity of approximately 790 megawatts. Pepco Energy Services sells the output of these facilities into the wholesale market administered by PJM. In February 2007, Pepco Energy Services provided notice to PJM of its intention to deactivate these facilities by the end of May 2012. PJM has informed Pepco
13
Energy Services that these facilities will not be needed for reliability after May 2012; therefore decommissioning plans are currently underway and on schedule. It is not expected that deactivation of these facilities will have a material impact on PHI’s financial condition, results of operations or cash flows.
Pepco Energy Services also owns three landfill gas-fired electricity facilities that have a total generating capacity rating of ten megawatts, the output of which is sold into the wholesale market administered by PJM. Pepco Energy Services also owns a solar photovoltaic facility that has a generating capacity rating of two megawatts, the output of which is sold to its host facility.
Pepco Energy Services’ continuing lines of business will not be significantly affected by the wind-down of the retail energy supply business.
PJM Capacity Markets
Historically, Pepco Energy Services has earned revenue from the sale of capacity associated with its generating facilities. PJM is responsible for ensuring that within its transmission control area there is sufficient generating capacity available to meet the load requirements plus a reserve margin and locates and prices electricity capacity by holding annual auctions covering capacity to be supplied over consecutive 12-month periods. Pepco Energy Services has been exposed to deficiency charges payable to PJM when their generation units failed to meet certain reliability levels.
Since Pepco Energy Services intends to deactivate its two oil-fired generating facilities by May 2012, Pepco Energy Services has not included the facilities’ capacity in any auctions for periods after May 2012.
Competition
Pepco Energy Services’ energy services business is highly competitive. Pepco Energy Services competes with other energy services companies primarily with respect to contracts with federal, state and local governments and independent agencies. Many of these energy services companies are subsidiaries of larger construction or utility holding companies (as is the case with Pepco Energy Services). Among the factors as to which the energy services business competes are the amount and duration of the guarantees provided in energy savings performance contracts and the quality and value of service provided to customers. The energy services business is impacted by new entrants into the market, energy prices, and general economic conditions.
Other Business Operations
Between 1994 and 2002, PCI, a subsidiary of PHI, entered into eight cross-border energy lease investments involving public utility assets (primarily consisting of hydroelectric generation and coal-fired electric generation facilities and natural gas distribution networks) located outside of the United States. Each of these investments is structured as a sale and leaseback transaction commonly referred to as a sale-in, lease-out, or SILO, transaction. During the second quarter of 2011, PHI entered into early termination agreements with two lessees involving all of the leases comprising one of the eight lease investments and a small portion of the leases comprising a second lease investment. The early termination of the leases were negotiated at the request of the lessees and were completed in June 2011. As of December 31, 2011, PHI’s equity investment in its cross-border energy leases was approximately $1.3 billion. For additional information concerning these cross-border energy lease investments, see Note (8), “Leasing Activities,” and Note (17), “Commitments and Contingencies,” to the consolidated financial statements of PHI.
14
Regulation
The operations of PHI’s utility subsidiaries, including the rates and tariffs they are permitted to charge customers for the distribution and transmission of electricity and, in the case of DPL, the distribution and transportation of natural gas, are subject to regulation by governmental agencies in the jurisdictions in which the subsidiaries provide utility service as follows:
Pepco’s electricity distribution operations are regulated in Maryland by the MPSC and in the District of Columbia by the DCPSC.
DPL’s electricity distribution operations are regulated in Maryland by the MPSC and in Delaware by the DPSC.
DPL’s natural gas distribution and intrastate transportation operations in Delaware are regulated by the DPSC.
ACE’s electricity distribution operations are regulated by the NJBPU.
Each utility subsidiary’s transmission facilities are regulated by FERC.
DPL’s interstate transportation and wholesale sale of natural gas are regulated by FERC.
Each utility subsidiary’s and Pepco Energy Services’ bulk power system is subject to reliability standards established by NERC.
Rates and tariffs are established by these regulatory commissions. PHI’s utility subsidiaries have filed rate cases which are pending in each of its jurisdictions as further described in Note (7), “Regulatory Matters – Regulatory Proceedings – Rate Proceedings,” to the consolidated financial statements of PHI.
The rates and tariffs established by these regulatory commissions are intended to balance the interests of the utilities’ customers and those of its investors by reflecting costs incurred during the period in which the rates are in effect, and giving each utility the opportunity to generate revenues sufficient to recover its costs, including a reasonable rate of return on investor supplied capital during such period. In establishing a utility’s rates, an important factor in the ability of each of Pepco, DPL and ACE to earn its authorized rate of return is the willingness of applicable public service commissions to adequately recognize forward-looking costs in the utility’s rate structure in order to minimize the shortfall in revenues due to the delay in time or “lag” between when costs are incurred and when they are reflected in rates. This delay is commonly known as “regulatory lag.” Each of Pepco, DPL and ACE is currently experiencing significant regulatory lag because their investment in the rate base and operating expenses is outpacing revenue growth.
Higher operating and construction costs, including labor, material, depreciation, taxes and financing costs, as well as costs associated with enhanced distribution system reliability and environmental compliance, are expected at each of PHI’s utility subsidiaries for several years into the future. At the same time, low usage growth and customer growth is expected to limit the growth in revenues. This mismatch between high expense growth and low revenue growth exacerbates regulatory lag for each of PHI’s utility subsidiaries, making it more difficult for each utility to earn equity returns that are allowed by regulators without higher rates or other regulatory relief. See “Risk Factors – The failure of PHI to obtain timely recognition of costs in its rates may have a negative effect on PHI’s results of operations and financial condition.”
Pepco, DPL and ACE anticipate that they will continue to face regulatory lag. In their most recent rate cases, Pepco (in the District of Columbia and Maryland) and DPL (in Delaware and Maryland) each has proposed mechanisms that would track reliability and other expenses and permit the utility between rate cases to make adjustments in its rates for prudent investments as made, thereby seeking to reduce the magnitude of regulatory lag. In New Jersey, the NJBPU has approved certain rate recovery mechanisms
15
in connection with ACE’s Infrastructure Investment Program (IIP), which ACE has proposed to extend and expand. There can be no assurance that these proposals or any other attempts by Pepco, DPL and ACE to mitigate regulatory lag will be approved, or that even if approved, the rate recovery mechanisms or any base rate cases will fully ameliorate the effects of regulatory lag. Until such time as these proposed mechanisms are approved, if necessary to address the problem of regulatory lag, the utilities plan to file rate cases at least annually in an effort to align more closely their revenue and related cash flow levels with other operation and maintenance spending and capital investments. In future rate cases, Pepco, DPL and ACE, as applicable, would also continue to seek cost recovery and tracking mechanisms from applicable regulatory commissions to reduce the effects of regulatory lag.
Maryland Reliability Investigation
In August 2010, following major storm events that occurred in July and August 2010, an investigation was initiated in Maryland into the reliability of Pepco’s distribution system and the quality of distribution service Pepco provided to its customers. As a result of that investigation, the MPSC imposed sanctions on Pepco in December 2011, including a fine of $1 million, which Pepco has paid. In accordance with the order, Pepco has filed a detailed work plan for the next five years, which provided a comprehensive description of Pepco’s reliability enhancement plan, its emergency response improvement project, and other communication and service restoration improvements. Pepco is also required to file quarterly updates and a year-end status report with the MPSC providing, among other things, detailed information about its reliability and emergency response improvement objectives, progress and spending (and explanations for any inability to meet such objectives), together with an analysis of trends concerning the measured duration and frequency of customer interruptions. In the required reports, Pepco will be required to demonstrate that its reliability enhancement plan costs were prudently spent and produced a significant improvement in reliability, and if it is unable to do so, the MPSC may deny Pepco reimbursement for future reliability enhancement investments or impose additional fines. In addition to the sanctions, the MPSC stated its intent to review the recovery of reliability costs in Pepco’s pending rate case and to disallow incremental costs it determines to be the result of imprudent management. Pepco believes its reliability costs have been prudently incurred. Furthermore, Pepco expects its reliability enhancement plan to enable Pepco to meet the MPSC’s requirements. For more information about the MPSC’s ruling in this proceeding, see Note (7), “Regulatory Matters – Regulatory Proceedings,” to the consolidated financial statements of PHI.
District of Columbia and Maryland Reliability and Customer Service Rulemakings
In December 2011, the MPSC approved proposed rules establishing reliability and customer service regulations, compliance with which is anticipated to be mandated as early as the second quarter of 2012. In addition, in July 2011, the DCPSC adopted regulations that establish specific maximum outage frequency and outage duration levels beginning in 2013 and continuing through 2020 and thereafter and are intended to require Pepco to achieve a reliability level in the first quartile of all utilities in the nation by 2020. Pepco and DPL each expect to incur significant operation and maintenance spending and capital investments to comply with these requirements. Pepco believes that the DCPSC’s standards are achievable in the short term, but continues to believe that the standards may not be realistically achievable at an acceptable cost over the longer term. The reliability standards permit Pepco to petition the DCPSC to reevaluate these standards for the period from 2016 to 2020 to address feasibility and cost issues.
Maryland New Generation RFP Issuance Requirement
In September 2009, the MPSC initiated an investigation into whether Maryland’s regulated electric distribution companies (EDCs) should be required to enter into long-term contracts with entities that construct, acquire or lease, and operate, new electric generation facilities in Maryland. In September 2011, the MPSC issued a notice in which it stated that it had not made a final determination at this time whether new generation in Maryland is needed, but directed each of the four Maryland EDCs, including Pepco and DPL, to issue a request for proposal (RFP) for new generation resources by October 7, 2011. On that date, Pepco and DPL issued the RFP and sought additional information from the MPSC on
16
several aspects of the process established in the notice, including whether the MPSC will consider a utility-owned generation option. Hearings were held on January 31, 2012, to obtain further input on whether the EDCs should be ordered to proceed with the RFP. Pepco and DPL have filed a request for rehearing of the notice. The MPSC has stated its intent to select generators and execute long-term contracts between the generators and selected EDCs in April 2012. PHI opposes the requirement to enter into such long-term contracts, which would be viewed as debt by the credit rating agencies and would have an adverse effect on PHI’s, Pepco’s and DPL’s credit metrics.
ACE Standard Offer Capacity Agreements
In April 2011, ACE entered into three Standard Offer Capacity Agreements (SOCAs) by order of the NJBPU, each with a different generation company. The SOCAs were established under a New Jersey law enacted to promote the construction of qualified electric generation facilities in New Jersey. The SOCAs are 15-year, financially settled transactions approved by the NJBPU that allow generators to receive payments from, or make payments to, ACE based on the difference between the fixed price in the SOCAs and the price for capacity that clears PJM. Each of the other EDCs in New Jersey has entered into SOCAs having the same terms with the same generation companies. The annual share of payments or receipts for ACE and the other EDCs is based upon each company’s annual proportion of the total New Jersey load attributable to all EDCs. The NJBPU has approved full recovery from distribution customers of payments made by ACE and the other EDCs, and distribution customers would be entitled to any payments received by ACE and the other EDCs.
ACE and the other EDCs entered the SOCAs under protest based on concerns about the potential cost to distribution customers and the negative credit rating agency implications and have filed lawsuits challenging the constitutionality of the New Jersey law. For more information about the New Jersey law and associated regulatory and legal proceedings, see Note (2), “Significant Accounting Policies – Consolidation of Variable Interest Entities – ACE Standard Offer Capacity Agreements,” to the consolidated financial statements of PHI.
Delaware Renewable Energy Portfolio Standards
DPL is subject to Renewable Energy Portfolio Standards (RPS) in the state of Delaware that require it to obtain renewable energy credits (RECs) for energy delivered to its customers. In July 2011, the Governor of the State of Delaware signed legislation that expands DPL’s RPS obligations beginning in 2012. Before this legislation, DPL was required to obtain RECs for energy delivered only to SOS customers in Delaware; the legislation expands that requirement to energy delivered to all of DPL’s distribution customers in Delaware. DPL’s costs associated with obtaining RECs to fulfill its RPS obligations are recoverable from its distribution customers by law.
The legislation also establishes that the energy output from fuel cells manufactured in Delaware capable of running on renewable fuels is an eligible resource for RECs under the Renewable Portfolio Standards Act. The legislation requires that the DPSC adopt a tariff under which DPL would be an agent that collects payments from its customers and disburses the amounts collected to a qualified fuel cell provider that deploys Delaware-manufactured fuel cells as part of a 30-megawatt generation facility. The legislation also provides for a reduction in DPL’s REC and solar REC requirements based upon the actual energy output of the 30-megawatt generation facility. In October 2011, the DPSC approved the tariff submitted by DPL in response to the legislation. For more information on the tariff, see Note (2), “Significant Accounting Policies – Consolidation of Variable Interest Entities – DPL Renewable Energy Transactions,” to the consolidated financial statements of PHI.
17
NERC Reliability Standards
NERC has established, and FERC has approved, reliability standards with regard to the bulk power system that impose certain operating, planning and cyber security requirements on Pepco, DPL, ACE and Pepco Energy Services. There are eight NERC regional oversight entities, including ReliabilityFirstCorporation (RFC), of which Pepco, DPL, ACE and Pepco Energy Services are members, and Northeast Power Coordinating Council (NPCC), of which Pepco Energy Services is a member. These oversight entities are charged with the day-to-day implementation and enforcement of NERC’s reliability standards, which impose certain operating, planning and cyber security requirements on the bulk power systems of Pepco, DPL, ACE and Pepco Energy Services. RFC and NPCC perform compliance audits on entities registered with NERC based on reliability standards and criteria established by NERC. NERC, RFC and NPCC also conduct compliance investigations in response to a system disturbance, complaint, or possible violation of a reliability standard identified by other means. Each of PHI’s utility subsidiaries and Pepco Energy Services are subject to routine audits and monitoring for compliance with applicable NERC reliability standards, including standards requested by FERC to increase the number of assets designated as “critical assets” (including cyber security assets) subject to NERC’s cyber security standards. NERC is empowered to impose financial penalties, fines and other sanctions for non-compliance with certain rules and regulations.
Employees
At December 31, 2011, PHI had the following number of employees:
| In Collective Bargaining Agreements | ||||||||||||||||||||
| Non-union | International Brotherhood of Electrical Workers | International Union of Operating Engineers | Other | Total | ||||||||||||||||
Pepco | 354 | 1,094 | — | — | 1,448 | |||||||||||||||
DPL | 228 | 688 | — | — | 916 | |||||||||||||||
ACE | 174 | 384 | — | — | 558 | |||||||||||||||
Pepco Energy Services | 273 | 199 | 56 | 27 | 555 | |||||||||||||||
PHI Service Company and Other | 1,261 | 366 | — �� | — | 1,627 | |||||||||||||||
|
|
|
|
|
|
|
|
|
| |||||||||||
Total PHI Employees | 2,290 | 2,731 | 56 | 27 | 5,104 | |||||||||||||||
|
|
|
|
|
|
|
|
|
| |||||||||||
PHI’s subsidiaries are parties to five collective bargaining agreements with four local unions. All five collective bargaining agreements will expire within the next four years, including one agreement that will expire on June 1, 2012. Collective bargaining agreements are generally renegotiated every three to five years.
Environmental Matters
PHI, through its subsidiaries, is subject to regulation by various federal, regional, state, and local authorities with respect to the environmental effects of its operations, including air and water quality control, solid and hazardous waste disposal, greenhouse gas emissions, and limitations on land use. In addition, federal and state statutes authorize governmental agencies to compel responsible parties to clean up certain abandoned or unremediated hazardous waste sites. PHI’s subsidiaries may incur costs to clean up currently or formerly owned facilities or sites found to be contaminated, as well as other facilities or sites that may have been contaminated due to past disposal practices. PHI’s subsidiaries may also be responsible for ongoing environmental remediation costs associated with facilities or operations that have been sold to third parties as further described in Note (17), “Commitments and Contingencies – Environmental Matters – Conectiv Energy Wholesale Power Generation Sites,” to the consolidated financial statements of PHI.
18
PHI’s subsidiaries’ currently projected capital expenditures for the replacement of existing or installation of new environmental control facilities that are necessary for compliance with environmental laws, rules or agency orders are approximately $6 million in 2012 and $3 million in each of 2013, 2014 and 2015. This projection could change depending on the outcome of the matters addressed below or as a result of the imposition of additional environmental requirements or new or different interpretations of existing environmental laws, rules and agency orders. In view of the sale of the Conectiv Energy wholesale power generation business in 2010, PHI is no longer subject to environmental regulations prospectively applicable to electricity generating facilities, except insofar as such regulations affect the operation of the two generating facilities located in the District of Columbia owned by Pepco Energy Services. Moreover, PHI anticipates that these regulations will cease to apply to PHI electricity generating facilities altogether after May 2012, assuming the two generating facilities are deactivated by Pepco Energy Services as planned.
Air Quality Regulation
The generating facilities owned by Pepco Energy Services are subject to federal, state and local laws and regulations, including the Federal Clean Air Act, which limit emissions of air pollutants, require permits for operation of facilities and impose recordkeeping and reporting requirements.
Sulfur Dioxide and Nitrogen Oxide Emissions
The acid rain provisions of the Clean Air Act regulate total Sulfur dioxide (SO2) emissions from affected generating units and allocate “allowances” to each affected unit that permit the unit to emit a specified amount of SO2. The generating facilities of Pepco Energy Services that require allowances use allocated allowances or allowances acquired, as necessary, in the open market to satisfy the applicable regulatory requirements.
In 2005, the U.S. Environmental Protection Agency (EPA) issued the Clean Air Interstate Rule (CAIR), which imposes further reductions of SO2 and limits nitrogen oxide (NOx) emissions from electric generating units in 28 eastern states and the District of Columbia. CAIR uses an allowance system to cap state-wide emissions (and emissions within the District of Columbia) of SO2 (using acid rain allowances) and NOx allowances, as described below, in two stages. NOx reductions were required beginning in 2009 and SO2 reductions were required beginning in 2010. States and the District of Columbia may implement CAIR by adopting EPA’s trading program or through adopting regulations that at a minimum achieve the level of reductions that would otherwise be achieved through implementation of EPA’s trading program. Pepco Energy Services Buzzard Point generating units and its landfill gas generating units produce fewer megawatts than CAIR’s applicability threshold and therefore are not subject to CAIR.
Each state covered by CAIR and the District of Columbia may determine independently which emission sources to control and which control measures to adopt. CAIR includes model rules for multi-state cap and trade programs for power plants that states may choose to adopt to meet the required emissions reductions. In the District of Columbia, the Pepco Energy Services’ Benning Road units are permitted to satisfy the CAIR requirements through the use of allocated allowances or allowances acquired in the open market, through the installation of pollution control devices or through fuel modifications. The Benning Road units use NOx annual, NOx ozone season and SO2 allowances allocated or acquired, as necessary, in the open market to comply with CAIR.
In July 2011, EPA adopted new regulations to replace CAIR, which address transport of air pollution across state boundaries. The Cross-State Air Pollution Rule (CSAPR) imposes stricter limits on SO2 and NOx (annual and ozone season) than CAIR; however, the District of Columbia was in the group of jurisdictions excluded from the SO2, NOx, and seasonal NOx under CSAPR. As a result, CSAPR’s Cap and Trade program, which was originally planned to go into effect on January 1, 2012, is not applicable to Pepco Energy Services.
On December 30, 2011, the District of Columbia Circuit Court of Appeals ruled to stay the CSAPR, and ordered EPA to continue enforcing CAIR. Consequently, Pepco Energy Services must continue to meet its CAIR obligations until after the court resolves petitions for review of CSAPR.
19
Federal Regional Haze Rule
The federal Regional Haze Rule was adopted by EPA to address a type of visibility impairment known as regional haze created by the emission of specified pollutants by certain types of large stationary sources. The regulation requires installation of best available retrofit technology (BART) to boilers that (i) emit 250 tons or more per year of a visibility-impairing air pollutant, (ii) were placed in service between 1962 and 1977, and (iii) may reasonably be anticipated to cause or contribute to visibility impairment in any federally protected park or wilderness area. Pepco Energy Services’ Benning Road generating units are subject to this regulation for particulate matter less than ten microns in diameter and for SO2 and NOx to the extent not addressed by CAIR. Under Pepco Energy Services’ current operating permit issued by the DDOE, the Benning Road generating units will not be required to implement any remedial actions if the facilities are shut down on or before December 17, 2012, which is Pepco Energy Services’ current plan.
Pepco Energy Services’ other generating units, including those at Buzzard Point, are not subject to the Regional Haze Rule.
Hazardous Air Pollutant Emissions
In December 2011, EPA finalized a rule to reduce the emission of toxic air pollutants from generating facilities. The Mercury and Air Toxics Standards will reduce emissions of heavy metals, including mercury, arsenic, chromium and nickel, as well as emissions of acid gases, including hydrochloric and hydrofluoric acid. Because existing generating sources generally have up to four years from the Standards’ effective date to comply with the Mercury and Air Toxics Standards, this rule is not expected to impact the Benning Road or Buzzard Point generating facilities, which are expected to be retired by May 2012.
Greenhouse Gas Emissions Reporting
In October 2009, EPA adopted regulations requiring sources that emit designated greenhouse gases– specifically, carbon dioxide, methane, nitrous oxide, hydrofluorocarbons, perfluorocarbons, and other fluorinated gases (e.g., nitrogen trifluoride and hydrofluorinated ethers) – in excess of specified thresholds to file annual reports with EPA disclosing the amount of such emissions. Under these regulations:
| • | Pepco Energy Services reports CO2, methane and nitrous oxide for its Benning Road units. No changes or restrictions on operations will occur as a result of this rule. |
| • | DPL currently reports with respect to its gas distribution operations CO2 emissions that would result assuming the complete combustion or oxidation of the annual volume of natural gas it distributes to its customers. Beginning in September 2012, DPL will be required to report fugitive CO2 and methane emissions for its gas distribution operations for the previous calendar year (hence, the 2012 report will contain data from calendar year 2011). DPL’s liquefied natural gas storage facility does not meet the reporting threshold (25,000 metric tons) for fugitive emissions. |
ACE, DPL and Pepco will be required to start reporting sulfur hexafluoride emissions from electrical equipment beginning in September 2012, for the previous calendar year.
20
Water Quality Regulation
Clean Water Act
Provisions of the federal Water Pollution Control Act, also known as the Clean Water Act, establish the basic legal structure for regulating the discharge of pollutants from point sources to surface waters of the United States. Among other things, the Clean Water Act requires that any person wishing to discharge pollutants from a point source (generally a confined, discrete conveyance such as a pipe) obtain a National Pollutant Discharge Elimination System (NPDES) permit issued by EPA or by a state agency under a federally authorized state program. The Benning Road facility has a NPDES permit authorizing pollutant discharges, which is subject to periodic renewal.
Pepco and a subsidiary of Pepco Energy Services discharge water from the Benning Road electric generating plant and service center located in the District of Columbia under a NPDES permit issued by EPA in July 2009. The permit imposes compliance monitoring and storm water best management practices to satisfy the District of Columbia’s Total Maximum Daily Load standards for polychlorinated biphenyls (PCBs), oil and grease, metals and other substances. As required by the permit, Pepco has initiated studies to identify the source of the regulated substances to determine appropriate best management practices for minimizing the presence of the substances in storm water. The initial study reports are scheduled for completion in March 2012 and will be submitted to EPA as required. The capital expenditures, if any, that may be needed to implement best management practices to satisfy these new permit conditions will not be known until the results of the studies are reviewed by EPA.
New Jersey Flood Hazard Area Control Act
In November 2007, the New Jersey Department of Environmental Protection adopted amendments to the agency’s regulations under the Flood Hazard Area Control Act the (FHACA) to minimize damage to life and property from flooding caused by development in flood plains. The amended regulations impose a new regulatory program to mitigate flooding and related environmental impacts from a broad range of construction and development activities, including electric utility transmission and distribution construction, which were previously unregulated under the FHACA. These regulations impose restrictions on construction of new electric transmission and distribution facilities and increase the time and personnel resources required to obtain permits and conduct maintenance activities. While ACE continues to evaluate the financial impact related to compliance with the amended regulations, based on current information, PHI and ACE do not believe these regulations will have a material adverse effect on their respective financial conditions or results of operations.
EPA Oil Pollution Prevention Regulations
Facilities that, because of their location, store or use oil and could reasonably be expected to discharge oil into water bodies or adjacent shorelines in quantities that may be harmful to the environment are subject to EPA’s oil pollution prevention regulations. These regulations require entities to prepare and implement Spill Prevention, Control, and Countermeasure Plans (SPCC) and specify site-specific measures to prevent and respond to an oil discharge. The SPCC regulations generally require the use of containment and/or diversionary structures to prevent the discharge of oil in the event of a leak or release of oil at the facility. As an alternative to the containment/diversionary structure requirement, owners of certain oil-filled operational equipment, such as electric system transformers, may comply with EPA’s regulations by implementing an inspection and monitoring program, developing an oil spill contingency plan, and providing a written commitment of resources to control and remove any discharge of oil. ACE, DPL and Pepco are complying with the SPCC regulations by employing containment/diversionary structures and by means of inspection and monitoring measures, in each case where such measures have been determined to be appropriate. Total costs in 2011 to Pepco, DPL and ACE were approximately $5 million, $1 million and $2 million, respectively, as of December 31, 2011 and each utility expects to incur ongoing costs to comply with the SPCC regulations. In addition to the costs to comply with EPA’s oil pollution prevention regulations, PHI companies project expenditures of approximately $11 million over four years to replace certain oil-filled breakers with gas-filled breakers to eliminate the possibility of an oil release from such equipment. Compliance costs for Pepco Energy Services have not been material, and PHI does not expect that they will become material in the foreseeable future.
21
Hazardous Substance Regulation
The Comprehensive Environmental Response, Compensation, and Liability Act (CERCLA) of 1980 authorizes EPA, and comparable state laws authorize state environmental authorities, to issue orders and bring enforcement actions to compel responsible parties to investigate and take remedial actions at any site that is determined to present an actual or potential threat to human health or the environment because of an actual or threatened release of one or more hazardous substances. Parties that generated or transported hazardous substances to such sites, as well as the owners and operators of such sites, may be deemed liable under CERCLA or comparable state laws. Pepco, DPL and ACE each has been named by EPA or a state environmental agency as a potentially responsible party in pending proceedings involving certain contaminated sites. See (i) Item 7 “Management’s Discussion and Analysis of Financial Condition and Results of Operations – Capital Resources and Liquidity – Capital Requirements – Environmental Remediation Obligations,” and (ii) Note (17), “Commitments and Contingencies – Environmental Matters,” to the consolidated financial statements of PHI.
Executive Officers of PHI
The names of the executive officers of PHI, their ages and the positions they held as of February 23, 2012, are set forth in the following table. The business experience of each executive officer during the past five years is set forth adjacent to his or her name under the heading “Office and Length of Service” in the following table and in the applicable footnote.
Name | Age | Office and | ||||
Joseph M. Rigby | 55 | Chairman of the Board 5/09 - Present, President3/08 - Present, and Chief Executive Officer3/09- Present (1) | ||||
David M. Velazquez | 52 | Executive Vice President 3/09 - Present (2) | ||||
Kirk J. Emge | 62 | Senior Vice President and General Counsel 3/08- Present (3) | ||||
Anthony J. Kamerick | 64 | Senior Vice President and Chief Financial Officer 6/09 - Present (4) | ||||
Beverly L. Perry | 64 | Senior Vice President 10/02- Present | ||||
Ronald K. Clark | 56 | Vice President and Controller 8/05- Present | ||||
Ernest L. Jenkins | 57 | Vice President 5/05 – Present | ||||
Laura L. Monica | 55 | Vice President 8/11 – Present (5) | ||||
Hallie M. Reese | 48 | Vice President, PHI Service Company 5/05 - Present | ||||
John U. Huffman | 52 | President6/06- Present, and Chief Executive Officer, Pepco Energy Services, Inc. 3/09- Present (6) | ||||
22
| (1) | Mr. Rigby was Chief Operating Officer of PHI from September 2007 until February 28, 2009 and Executive Vice President of PHI from September 2007 until March 2008, Senior Vice President of PHI from August 2002 until September 2007 and Chief Financial Officer of PHI from May 2004 until September 2007. Mr. Rigby was President and Chief Executive Officer of ACE, DPL and Pepco from September 1, 2007 to February 28, 2009. Mr. Rigby has been Chairman of Pepco, DPL and ACE since March 1, 2009. |
| (2) | Mr. Velazquez served as President of Conectiv Energy Holding Company, an affiliate of PHI, from June 2006 to February 28, 2009, Chief Executive Officer of Conectiv Energy Holding Company from January 2007 to February 28, 2009 and Chief Operating Officer of Conectiv Energy Holding Company from June 2006 to December 2006. He served as a Vice President of PHI from February 2005 to June 2006 and as Chief Risk Officer of PHI from August 2005 to June 2006. |
| (3) | Mr. Emge was Vice President, Legal Services of PHI from August 2002 until March 2008. Mr. Emge has served as General Counsel of ACE, DPL and Pepco since August 2002 and as Senior Vice President of Pepco and DPL since March 1, 2009. |
| (4) | Mr. Kamerick was Senior Vice President and Chief Regulatory Officer of PHI from March 2009 until June 2009. Mr. Kamerick was Vice President and Treasurer of PHI from August 2002 until February 28, 2009. |
| (5) | From October 2006 to October 2010, Ms. Monica was Senior Vice President, Corporate Communications at American Water Works Company (NYSE: AWK), and from September 1991 to October 2006, Ms. Monica was President of High Point Communications, a strategic communications firm. Ms. Monica rejoined High Point Communications as President from October 2010 to August 2011. |
| (6) | Mr. Huffman has been employed by Pepco Energy Services since June 2003. He was Chief Operating Officer from April 2006 to February 28, 2009, Senior Vice President from February 2005 to March 2006 and Vice President from June 2003 to February 2005. |
Each PHI executive officer is elected annually and serves until his or her respective successor has been elected and qualified or his or her earlier resignation or removal.
INFORMATION FOR THIS ITEM IS NOT REQUIRED FOR PEPCO, DPL, AND ACE AS THEY MEET THE CONDITIONS SET FORTH IN GENERAL INSTRUCTIONS I(1)(a) AND (b) OF FORM 10-K AND THEREFORE ARE FILING THIS FORM WITH THE REDUCED FILING FORMAT.
The businesses of each Reporting Company are subject to numerous risks and uncertainties, including the events or conditions identified below. The occurrence of one or more of these events or conditions could have an adverse effect on the business of any one or more of the Reporting Companies, including, depending on the circumstances, its financial condition, results of operations and cash flow. Unless otherwise noted, each risk factor set forth below applies to each Reporting Company.
23
PHI utility subsidiaries are subject to comprehensive regulation which may significantly affect their operations. PHI’s utility subsidiaries may be subject to fines, penalties and other sanctions for the inability to meet these requirements.
The regulated utilities that comprise Power Delivery are subject to extensive regulation by various federal, state and local regulatory agencies. Each of Pepco, DPL and ACE is regulated by the state agencies for each service territory in which it operates, with respect to, among other things, the manner in which utility service is provided to customers, as well as rates it can charge customers for the distribution and supply of electricity (and, additionally for DPL, the distribution and supply of natural gas). NERC has also established, and FERC has approved, reliability standards with regard to the bulk power system that impose certain operating, planning and cyber security requirements on Pepco, DPL, ACE and Pepco Energy Services. Further, FERC regulates the electricity transmission facilities of Pepco, DPL and ACE.
Approval of these regulators is required in connection with changes in rates and other aspects of the utilities’ operations. These regulatory authorities, and NERC with respect to electric reliability, are empowered to impose financial penalties, fines and other sanctions against the utilities for non-compliance with certain rules and regulations. In this regard, in December 2011, the MPSC sanctioned Pepco related to its reliability in connection with major storm events that occurred in July and August 2010. These sanctions included imposing a fine on Pepco and requiring Pepco to file a work plan detailing, among other things, its reliability improvement objectives and progress in meeting those objectives, while raising the possibility of additional fines or cost disallowances for failing to meet those objectives. The MPSC also stated that it would consider in Pepco’s pending Maryland retail base rate case the potential disallowance of costs which may be determined to have been imprudently incurred.
NERC’s eight regional oversight entities, including RFC, of which Pepco, DPL, ACE and Pepco Energy Services are members, and NPCC, of which Pepco Energy Services is a member, are charged with the day-to-day implementation and enforcement of NERC’s standards. RFC and NPCC perform compliance audits on entities registered with NERC based on reliability standards and criteria established by NERC. NERC, RFC and NPCC also conduct compliance investigations in response to a system disturbance, complaint, or possible violation of a reliability standard identified by other means. Pepco, DPL, ACE and Pepco Energy Services are subject to routine audits and monitoring with respect to compliance with applicable NERC reliability standards, including standards requested by FERC to increase the number of assets (including cyber security assets) subject to NERC cyber security standards that are designated as “critical assets.” From time to time, Pepco, DPL and ACE have entered into settlement agreements with RFC resolving alleged violations and resulting in fines. There can be no assurance that additional settlements resolving issues related to RFC or NPCC requirements will not occur in the future. The imposition of additional sanctions and civil fines by these enforcement entities could have a material adverse effect on a Reporting Company’s results of operations, cash flow and financial condition.
PHI’s utility subsidiaries, as well as Pepco Energy Services, are also required to have numerous permits, approvals and certificates from governmental agencies that regulate their businesses. Although PHI believes that each of its subsidiaries has, and each of Pepco, DPL and ACE believes it has, obtained or sought renewal of the material permits, approvals and certificates necessary for its existing operations and that its business is conducted in accordance with applicable laws, PHI is unable to predict the impact that future regulatory activities may have on its business. Changes in or reinterpretations of existing laws or regulations, or the imposition of new laws or regulations, may require any one or more of PHI’s subsidiaries to incur additional expenses or significant capital expenditures or to change the way it conducts its operations.
PHI’s profitability is largely dependent on its ability to recover costs of providing utility services to its customers and to earn an adequate return on its capital investments. The failure of PHI to obtain timely recognition of costs in its rates may have a negative effect on PHI’s results of operations and financial condition.
The public service commissions which regulate PHI’s utility subsidiaries establish utility rates and tariffs intended to provide the utility the opportunity to obtain revenues sufficient to recover its prudently incurred costs, together with a reasonable return on investor supplied capital. These regulatory authorities also determine how Pepco, ACE and DPL recover from their customers purchased power and natural gas
24
and other operating costs, including transmission and other costs. The utilities cannot change their rates without approval by the applicable regulatory authority. There can be no assurance that the regulatory authorities will consider all costs to have been prudently incurred, nor can there be any assurance that the regulatory process by which rates are determined will always result in rates that achieve full and timely recovery of costs or a just and reasonable rate of return on investments. In addition, if the costs incurred by any of the utilities in operating its business exceed the amounts on which its approved rates are based, the financial results of that utility, and correspondingly PHI, may be adversely affected.
PHI’s utility subsidiaries are also exposed to “regulatory lag,” which refers to a shortfall in revenues due to the delay in time or “lag” between when costs are incurred and when they are reflected in rates. All of PHI’s utilities are currently experiencing significant regulatory lag because their investment in the rate base and their operating expenses are outpacing revenue growth. PHI anticipates that this trend will continue for the foreseeable future. The failure to timely recognize costs in rates could have a material adverse effect on PHI’s and each utility subsidiary’s business, results of operations, cash flow and financial condition.
In their most recent rate cases, Pepco (in the District of Columbia and Maryland), DPL (in Maryland and Delaware) and ACE (in New Jersey) have proposed mechanisms that would track reliability and other expenses and permit each utility to make adjustments in its approved rates to account for prudent investments as made, thereby seeking to reduce the magnitude of regulatory lag. In New Jersey, the NJBPU has previously approved a similar mechanism, and ACE currently has an update and expansion of that previously approved mechanism pending before the NJPBU. There can be no assurance that these proposals or any attempts by Pepco, DPL and ACE to mitigate regulatory lag will be approved, or that even if approved, the rate recovery mechanisms will fully ameliorate the effects of regulatory lag. If necessary to address in whole or in part the problem of regulatory lag, each utility can file base rate cases annually (or even more frequently) to seek to align its revenue and related cash flow levels allowed by the applicable public service commissions with operation and maintenance spending and capital investments. The inability of PHI’s utility subsidiaries to obtain relief from the impact of regulatory lag through base rate cases or otherwise may have an adverse effect on the business, results of operations, cash flow and financial condition of PHI and each utility subsidiary.
The operating results of Power Delivery and the retail energy supply business of Pepco Energy Services fluctuate on a seasonal basis and can be adversely affected by changes in weather.
The Power Delivery business historically has been seasonal and, as a result, weather has had a material impact on its operating performance. Demand for electricity is generally higher in the summer months associated with cooling and demand for electricity and natural gas is generally higher in the winter months associated with heating as compared to other times of the year. Accordingly, each of PHI, Pepco, DPL and ACE historically has generated less revenue and income when temperatures are warmer in the winter and cooler in the summer. In addition, severe weather conditions can produce storms that cause extensive damage to the transmission and distribution systems, as well as related facilities, that can require the utilities to incur additional operation and maintenance expense, as well as capital expenditures. These additional costs can be significant and the rates charged to customers may not always be timely or adequately adjusted to reflect these higher costs.
In the District of Columbia and Maryland, Pepco and DPL are subject to a bill stabilization adjustment mechanism applicable to retail customers, which decouples distribution revenue for a given reporting period from the amount of power delivered during the period. The bill stabilization mechanism has the effect in those jurisdictions of reducing the impact of changes in the use of electricity by retail customers due to weather conditions or for other reasons on reported distribution revenue and income. A comparable revenue decoupling mechanism for DPL electricity and natural gas customers in Delaware is under consideration by the DPSC. In those jurisdictions that have not adopted a bill stabilization adjustment or similar mechanism, operating results continue to be affected by weather conditions.
25
The retail energy supply business of Pepco Energy Services generally produces higher gross margins when temperatures are colder than normal in winter or warmer than normal in summer, and less gross margin when weather conditions are milder than normal. The energy services business of Pepco Energy Services, which includes providing energy savings performance contracting services principally to federal, state and local government customers, and designing, constructing and operating combined heat and power energy plants for customers, is not seasonal.
Facilities may not operate as planned or may require significant capital or operation and maintenance expenditures, which could decrease revenues or increase expenses.
Operation of the Pepco, DPL and ACE transmission and distribution facilities involves many risks, including the breakdown or failure of equipment, accidents, labor disputes, theft of copper wire or pipe, scams, failure of software or hardware, and performance below expected levels. Older facilities and equipment, even if maintained in accordance with sound engineering practices, may require significant capital expenditures for additions or upgrades to provide reliable operations or to comply with changing environmental requirements. Thefts of copper wire or pipe, which seek to capitalize on the current high market price of copper, increase the likelihood of poor system voltage control, electricity and streetlight outages, damage to equipment and property, and injury or death, as well as increasing the likelihood of damage to fuel lines, which can create an unsafe and potentially explosive condition. Natural disasters and weather, including tornadoes, hurricanes and snow and ice storms, also can disrupt transmission and distribution systems. Disruption of the operation of transmission or distribution facilities can reduce revenues and result in the incurrence of additional expenses that may not be recoverable from customers or through insurance.
PHI’s Blueprint for the Future program includes the replacement of customers’ existing electric and gas meters with an AMI system. In addition to the replacement of existing meters, the AMI system involves the construction of a wireless network across the service territories of PHI’s utility subsidiaries and the implementation and integration of new and existing information technology systems to collect and manage data made available by the advanced meters. The implementation of the AMI system involves a combination of technologies provided by multiple vendors. If the AMI system results in lower than projected performance, PHI’s utility subsidiaries could experience higher than anticipated maintenance expenditures.
Energy companies are subject to adverse publicity and reputational risks, which make them vulnerable to negative customer perception and could lead to increased regulatory oversight or other sanctions.
Utility companies, including PHI’s utility subsidiaries, have a large consumer customer base and as a result have been the subject of public criticism focused on the reliability of their distribution services and the speed with which they are able to respond to outages caused by storm damage or other unanticipated events. Adverse publicity of this nature may render legislatures, public service commissions and other regulatory authorities and government officials, less likely to view energy companies such as PHI and its subsidiaries in a favorable light, and may cause PHI and its subsidiaries to be susceptible to less favorable legislative and regulatory outcomes or increased regulatory oversight. Unfavorable regulatory outcomes can include more stringent laws and regulations governing PHI’s operations, such as reliability and customer service quality standards or vegetation management requirements, as well as fines, penalties or other sanctions or requirements. The imposition of any of the foregoing could have a material negative impact on PHI’s and each utility subsidiary’s business, results of operations, cash flow and financial condition.
26
Unfavorable regulatory developments and compliance with new or enhanced regulatory requirements will subject PHI’s utility subsidiaries to higher operating costs.
PHI’s utility subsidiaries are subject to and will continue to be subject to changing regulatory requirements, including those related to reliability and customer service, in the various jurisdictions in which they operate. For example, in December 2011, the MPSC approved proposed rules establishing reliability and customer service regulations, compliance with which is anticipated to be mandated as early as the second quarter of 2012. In addition, in July 2011, the DCPSC adopted regulations that establish specific maximum outage frequency and outage duration levels beginning in 2013 and continuing through 2020 and thereafter and are intended to require Pepco to achieve a reliability level in the first quartile of all utilities in the nation by 2020. Pepco believes that the DCPSC’s standards are achievable in the short term, but continues to believe that the standards may not be realistically achievable at an acceptable cost over the longer term. The reliability standards permit Pepco to petition the DCPSC to reevaluate these standards for the period from 2016 to 2020 to address feasibility and cost issues.
Each of Pepco and DPL expect that it will have to incur significant operating and maintenance and capital expenses to comply with these requirements. Furthermore, each of Pepco and DPL would be subject to civil penalties or other sanctions if it does not meet the required performance or reliability standards. Other jurisdictions in which PHI’s utility subsidiaries have operations have reliability and customer service quality standards, the violation of which could also result in the imposition of penalties, fines and other sanctions. Compliance, and any failure to comply, with current, proposed or future regulatory requirements may have a material adverse effect on PHI and each utility subsidiary’s business, results of operations, cash flow and financial condition.
The transmission facilities of Power Delivery are interconnected with the facilities of other transmission facility owners. Failures of neighboring transmission systems could have a negative impact on Power Delivery’s operations.
The electricity transmission facilities of Pepco, DPL and ACE are interconnected with the transmission facilities of neighboring utilities and are part of the interstate power transmission grid. Pepco, DPL and ACE are members of the PJM RTO, a regional transmission organization that operates the portion of the interstate transmission grid that includes the PHI transmission facilities. Although PJM’s systems and operations are designed to ensure the reliable operation of the transmission grid and prevent the operations of one utility from having an adverse impact on the operations of the other utilities, there can be no assurance that service interruptions originating at other utilities will not cause interruptions in the Pepco, DPL or ACE service territories. Thus, due to the interconnected nature of the grid, an outage in a neighboring utility could trigger a system outage in either Pepco, DPL or ACE. If Pepco, DPL or ACE were to suffer such a service interruption, it could have a negative impact on its and PHI’s business, results of operations, cash flow and financial condition.
Changes in technology and conservation measures may adversely affect Power Delivery.
Increased conservation and end-user generation made possible through advances in technology could reduce demand for the transmission and distribution facilities of Power Delivery and adversely affect PHI and one or more of its utility subsidiaries. Alternative technologies to produce electricity, the development of which has expanded due to climate change and other environmental concerns, could ultimately provide alternative sources of electricity. As these new technologies are developed and
become available, the quantity and pattern of electricity usage by customers could decline, which could have a negative impact on the business, results of operations, cash flow and financial condition of PHI or its utility subsidiaries.
27
The cost of compliance with environmental laws is significant and implementation of new and existing environmental laws may increase operating costs.
The operations of PHI’s subsidiaries are subject to extensive federal, state and local environmental laws and regulations relating to air quality, water quality, spill prevention, waste management, natural resource protection, site remediation and health and safety. These laws and regulations may require significant capital and other expenditures to, among other things, meet emissions and effluent standards, conduct site remediation, complete environmental studies and perform environmental monitoring. If a company fails to comply with applicable environmental laws and regulations, even if caused by factors beyond its control, such failure could result in the assessment of civil or criminal penalties and liabilities and the need to expend significant sums to achieve compliance.
In addition, PHI’s subsidiaries are required to obtain and comply with a variety of environmental permits, licenses, inspections and other approvals. If there is a delay in obtaining any required environmental regulatory approval, or if there is a failure to obtain, maintain or comply with any such approval, operations at affected facilities could be halted or subjected to additional costs.
Failure to retain and attract key skilled and properly motivated professional and technical employees could have an adverse effect on operations.
PHI and its subsidiaries operate in a highly regulated industry that requires the continued operation of sophisticated systems and technology. One of the challenges they face in implementing their business strategy is to attract, motivate and retain a skilled, efficient and cost-effective workforce while recruiting new talent to replace losses in knowledge and skills due to retirements. Over the course of the next three years, PHI estimates that approximately one-third of this skilled workforce will reach retirement age. Competition for skilled employees in some areas is high and the inability to attract and retain these employees, especially as existing skilled workers retire in the near future, could adversely affect the business, operations and financial condition of PHI or the affected company.
PHI’s subsidiaries are subject to collective bargaining agreements that could impact their business and operations.
As of December 31, 2011, 55% of employees of PHI and its subsidiaries, collectively, were represented by various labor unions. PHI’s subsidiaries are parties to five collective bargaining agreements with four local unions that represent these employees. All five collective bargaining agreements will expire within the next four years, including one agreement that expires on June 1, 2012. Collective bargaining agreements are generally renegotiated every three to five years, and the risk exists that there could be a work stoppage after expiration of an agreement until a new collective bargaining agreement has been reached. Labor negotiations typically involve bargaining over wages, benefits and working conditions, including management rights. PHI’s last work stoppage, a two-week strike by DPL’s employees, occurred in 2010. During that strike, DPL used management and contractor employees to maintain essential operations. Though PHI believes that a protracted work stoppage is unlikely, such an event could result in a disruption of the operations of the affected utility, which could, in turn, have a material adverse effect upon the business, results of operations, cash flow and financial condition of PHI and the affected utility.
The energy services business of Pepco Energy Services is highly competitive. (PHI only)
Unlike PHI’s regulated business, Pepco Energy Services’ business is highly competitive and is not assured a rate of return on capital investments through a predetermined rate structure. This competition generally has the effect of limiting margins and requiring a continual focus on controlling costs. The energy services business is impacted by new entrants into the market, energy prices, and general economic conditions. These factors may negatively impact Pepco Energy Services’ ability to market its services to new customers, or renew existing contracts, as well as the prices Pepco Energy Services may charge.
28
Among the factors on which the energy services business competes are the amount and duration of the guarantees provided in energy savings performance contracts. In connection with many of its energy efficiency installation projects, Pepco Energy Services guarantees a minimum level of annual energy cost savings over a period typically ranging up to 15 years. Currently, Pepco Energy Services does not insure against this risk, and accordingly could suffer financial losses if a project does not achieve the guaranteed level of performance.
Under its energy savings performance contracts, Pepco Energy Services is responsible for maintaining, repairing and replacing energy equipment, which obligations may require Pepco Energy Services to incur significant costs many years after an installation of a project is completed. (PHI only)
Pepco Energy Services owns energy equipment and is also responsible for operating and maintaining additional energy equipment that it does not own. In addition, it is generally Pepco Energy Services’ responsibility to repair or replace this energy equipment in the event of a failure. These equipment maintenance, repair and replacement obligations could adversely affect PHI’s results of operations, cash flow and financial condition.
The inability of Pepco Energy Services to perform its obligations in connection with its energy services construction projects may have a material adverse effect on PHI. (PHI only)
Projects undertaken by Pepco Energy Services include design, construction, startup and testing activities related to combined heat and power and other energy facilities, pursuant to guaranteed maximum price or fixed-price contracts. Pepco Energy Services will generally secure commitments from subcontractors and vendors to perform within contract pricing commitments, equipment-performance standards, jobsite safety requirements, and other key parameters. Ultimately, however, Pepco Energy Services will bear responsibility in the event of unexcused failures by these subcontractors and vendors, as well as other third parties, to perform in accordance with the terms of these contracts or otherwise pursuant to the expectations of the parties. If such events occur, Pepco Energy Services could experience reputational harm and claims for money damages and other relief, which could, depending upon the cause and severity of the failure of performance, adversely affect PHI’s business, results of operations, cash flow and financial condition.
Pepco Energy Services relies on generation, transmission, storage and distribution assets that it does not own or control to deliver electricity and natural gas to its customers and to obtain the fuel required to operate its generating facilities. (PHI only)
Pepco Energy Services is dependent on electric generating and transmission facilities, natural gas pipelines and natural gas storage facilities owned and operated by others to fulfill the remaining contractual obligations of its retail energy supply business. A disruption in the operation of these facilities or the inefficient operation of these facilities would have an adverse effect on Pepco Energy Services.
The operation of Pepco Energy Services’ generating facilities depends on fuel supplied by others. If the fuel supply to these generating facilities was to be disrupted and storage or other sources of supply were not available, the ability of Pepco Energy Services to operate its plants would be adversely affected.
If PHI is not successful in mitigating the risks inherent in its business, its operations could be adversely affected.
PHI and its subsidiaries are faced with a number of different types of risk. PHI confronts legislative, regulatory policy, compliance and other risks, including:
risks related to recovery of capital and operating costs;
resource planning and other long-term planning risks, including resource acquisition risks;
financial risks, including credit, interest rate and capital market risks; and
macroeconomic risks, including risks related to economic conditions and changes in demand for electricity and natural gas in the service territories of PHI’s utility subsidiaries, as well as with respect to Pepco Energy Services’ business.
PHI management seeks to mitigate the risks inherent in the implementation of PHI’s business strategy through its established risk mitigation process, which includes adherence to PHI’s business policies and other compliance policies, operation of formal risk management structures and groups, and overall business management. PHI management is responsible for identifying, assessing and managing risks, and developing risk-management strategies, while the Board of Directors and its Audit Committee oversee the assessment, management and mitigation of risk. However, there can be no assurance these risk mitigation efforts will adequately address all such risks.
29
PHI and its subsidiaries are exposed to contractual and credit risks associated with certain of their operations.
PHI and its subsidiaries are subject to a number of contractual and credit risks associated with certain of their operations. For example, Pepco Energy Services has entered into commercial transactions for the purchase and sale of electricity and natural gas, as well as derivative and other transactions to manage the risk of commodity price fluctuations. Under these arrangements, Pepco Energy Services is exposed to the risk that the counterparty may fail to perform its obligation to make or take delivery under the contract, fail to make a required payment or fail to return collateral posted by Pepco Energy Services when the counterparty is required to do so. In addition, PHI’s PCI subsidiary has entered into several cross-border energy lease investments located outside the United States. Under these leases, PCI is exposed to the risk that the counterparty may fail to make lease payments on time or at all.
Many of these contracts provide for PHI or a subsidiary to receive collateral or other types of performance assurance from the counterparty, which may be in the form of cash, letters of credit or parent guarantees, to protect against performance and credit risk. Even where collateral is provided, capital market disruptions can prevent the counterparty from meeting its collateral obligations or degrade the value of letters of credit and guarantees as a result of the lowered rating or insolvency of the issuer or guarantor. In the event of a bankruptcy of a counterparty to any contract to which PHI or any of its subsidiaries is a party, bankruptcy law, in some circumstances, could require the surrender of collateral held or payments received. In the case of PCI, the fact that the counterparties are located outside the United States could make it more difficult for PCI to seek redress or obtain a judgment or compensation against a foreign counterparty for any breach of the lease agreement by that counterparty.
The retail energy supply business of Pepco Energy Services can give rise to significant collateral requirements. (PHI only)
In conducting its retail energy supply business, Pepco Energy Services has entered into electricity or natural gas supply agreements and wholesale purchase contracts for electricity and natural gas that typically impose collateral requirements on each party. The collateral requirements are designed to protect the other party against the risk of nonperformance between the date the contract was entered into and the date of payment for the energy. When energy market prices decrease relative to the supplier contract prices, Pepco Energy Services’ collateral obligations increase. While Pepco Energy Services is no longer entering into new energy supply contracts, it has continuing supply obligations based on existing contracts and corresponding wholesale purchase contracts that extend through 2014. Particularly in periods of energy market price volatility, the collateral obligations associated with these wholesale purchase contracts can be substantial, although they can be expected to diminish as the retail energy supply business is wound down. These collateral demands could negatively affect PHI’s liquidity by requiring PHI to draw on its capacity under its primary credit facility or other financing sources.
30
Business operations could be adversely affected by terrorism and cyber attacks.
The threat of, or actual acts of, terrorism may affect the operations of PHI and its subsidiaries in unpredictable ways and may cause changes in the insurance markets, force an increase in security measures and cause electrical disruptions or disruptions of fuel supplies and markets, including natural gas. Utility industry operations require the continued deployment and utilization of sophisticated information technology systems and network infrastructure. While PHI has implemented protective measures designed to mitigate its vulnerability to physical and cyber threats and attacks, such protective measures, and technology systems generally, are vulnerable to disability or failure due to cyber attack, acts of war or terrorism, and other causes. As a result, there can be no assurance that such protective measures will be completely effective in protecting PHI’s infrastructure or assets from a physical or cyber attack or the effects thereof. If any of Pepco’s, DPL’s or ACE’s infrastructure facilities, including their transmission or distribution facilities, were to be a direct target, or an indirect casualty, of an act of terrorism, the operations of PHI, Pepco, DPL or ACE could be adversely affected. Furthermore, any threats or actions that negatively impact the physical security of PHI’s and its subsidiaries’ facilities, or the integrity or security of their computer networks and systems (and any programs or data stored thereon or therein), could adversely affect PHI’s and its subsidiaries’ ability to manage these facilities, networks, systems, programs and data efficiently or effectively, which in turn could have a material adverse effect on PHI’s or its subsidiaries’ results of operations and financial condition. Corresponding instability in the financial markets as a result of threats or acts of terrorism or threatened or actual cyber attacks also could adversely affect the ability of PHI or its subsidiaries to raise needed capital.
Mark-to-market accounting treatment for instruments Pepco Energy Services uses to hedge the cost of supply used to satisfy retail customer load obligations could cause earnings volatility. (PHI only)
Pepco Energy Services purchases energy commodity contracts in the form of electricity and natural gas futures, swaps, options and forward contracts to hedge commodity price risk in connection with the purchase of natural gas and electricity for delivery to customers. Certain commodity contracts that do not qualify as cash flow hedges of forecasted transactions or do not meet the requirements for normal purchase and normal sale accounting are marked to market through current earnings. Any change in the fair value of the transactions used to hedge price risk that receive mark-to-market accounting treatment will be reflected in PHI’s current earnings without any offsetting change in the fair value of its retail load obligations until the settlement date of these contracts in future periods. As a result, PHI’s earnings could be more volatile due to the mark-to-market accounting treatment associated with these commodity contracts. As of December 31, 2011, the commodity contracts that Pepco Energy Services currently accounts for on an accrual basis (because they are designated as normal purchases or normal sales) are, on a fair value basis, in a significant net loss position. If PHI could no longer sustain the normal purchase and normal sale designation for these contracts, it would be required to recognize these net losses in earnings, which could result in greater earnings volatility.
New accounting standards or changes to existing accounting standards could materially impact how a Reporting Company reports its results of operations, cash flow and financial condition.
Each Reporting Company’s financial statements are prepared in accordance with accounting principles generally accepted in the United States of America (GAAP). The SEC, the Financial Accounting Standards Board (FASB) or other authoritative bodies or governmental entities may issue new pronouncements or new interpretations of existing accounting standards that may require the Reporting Companies to change their accounting policies. These changes are beyond the control of the Reporting Companies, can be difficult to predict and could materially impact how they report their results of operations, cash flow and financial condition. Each Reporting Company could be required to apply a new or revised standard retroactively, which could adversely affect its results of operations, cash flow and financial condition.
31
Each Reporting Company’s financial statements, including their reported earnings, could be significantly impacted by convergence of GAAP with International Financial Reporting Standards (IFRS).
The FASB is expected to make broad changes to GAAP as part of an overall initiative to converge GAAP with IFRS. These changes could have significant impacts on the financial statements of each Reporting Company. Also, the SEC is considering incorporating IFRS into the financial reporting system for U.S. public companies. A transition to IFRS could significantly impact each Reporting Company’s financial results, since these standards differ from GAAP in many ways. One of the major differences is the lack of special accounting treatment for regulated activities under IFRS, which could result in greater earnings volatility for each Reporting Company.
Undetected errors in internal controls and information reporting could result in the disallowance of cost recovery and noncompliant disclosure.
Each Reporting Company’s internal controls, accounting policies and practices and internal information systems are designed to enable the Reporting Company to capture and process transactions and information in a timely and accurate manner in compliance with GAAP, laws and regulations, taxation requirements and federal securities laws and regulations applicable to it. Such compliance permits each Reporting Company to, among other things, disclose and report financial and other information in connection with the recovery of its costs and with the reporting requirements for each Reporting Company under federal securities, tax and other laws and regulations.
Each Reporting Company has implemented corporate governance, internal control and accounting policies and procedures in connection with the Sarbanes-Oxley Act of 2002 (the Sarbanes-Oxley Act) and relevant SEC rules, as well as other applicable regulations. Such internal controls and policies have been and continue to be closely monitored by each Reporting Company’s management and PHI’s Board of Directors to ensure continued compliance with these laws, rules and regulations. Management is also responsible for establishing and maintaining internal control over financial reporting and is required to assess annually the effectiveness of these controls. While PHI believes these controls, policies, practices and systems are adequate to verify data integrity, unanticipated and unauthorized actions of employees or temporary lapses in internal controls due to shortfalls in oversight or resource constraints could lead to undetected errors that could result in the disallowance of cost recovery and noncompliant disclosure and reporting. The consequences of these events could have a negative impact on the results of operations and financial condition of the affected Reporting Company. The inability of management to certify as to the effectiveness of these controls due to the identification of one or more material weaknesses in these controls could also increase financing costs or could also adversely affect the ability of a Reporting Company to access the capital markets.
Insurance coverage may not be sufficient to cover all casualty or property losses that the companies might incur.
PHI and its subsidiaries, including Pepco, DPL and ACE, currently have insurance coverage for their facilities and operations in amounts and with deductibles that they consider appropriate. However, there is no assurance that such insurance coverage will be available in the future on commercially reasonable terms or at all. In addition, some risks, such as weather related casualties, may not be insurable. In the case of loss or damage to property, plant or equipment, there is no assurance that the insurance proceeds received, if any, will be sufficient to cover the entire cost of replacement or repair.
32
The Internal Revenue Service (IRS) challenge to cross-border energy sale and lease-back transactions entered into by a PHI subsidiary could result in loss of prior and future tax benefits. (PHI only)
PCI maintains a portfolio of seven cross-border energy lease investments, which as of December 31, 2011, had an equity value of approximately $1.3 billion and from which PHI currently derives approximately $51 million per year in tax benefits in the form of interest and depreciation deductions in excess of rental income. PHI’s cross-border energy lease investments, each of which is with a tax-indifferent party, have been under examination by the IRS as part of the normal PHI federal income tax audits. In the final IRS revenue agent’s report in connection with the audits of PHI’s federal income tax returns from 2001 to 2005, the IRS disallowed the depreciation and interest deductions in excess of rental income claimed by PHI with respect to its cross-border energy lease investments. In addition, the IRS has sought to recharacterize the leases as loan transactions as to which PHI would be subject to original issue discount income. PHI disagrees with the IRS’ proposed adjustments and filed tax protests.
Effective November 2010, PHI entered into a settlement agreement with the IRS for the 2001 and 2002 tax years and subsequently filed refund claims in July 2011 for the disallowed tax deductions relating to the leases for these years. In January 2011, as part of this settlement, PHI paid $74 million of additional tax for 2001 and 2002, penalties of $1 million, and $28 million in interest associated with the disallowed deductions. PHI’s claim for refund for the disallowed deductions was denied by the IRS and PHI has filed suit against the IRS in the U.S. Court of Federal Claims to recover payments made. The case with respect to the 2003 to 2005 returns is currently pending with the IRS Office of Appeals.
In the event that the IRS were to be successful in disallowing 100% of the tax benefits associated with these leases and recharacterizing these leases as loans, PHI estimates that, as of December 31, 2011, it would be obligated to pay approximately $643 million in additional federal and state taxes and $121 million of interest, of which $74 million has been satisfied by the payment made in January 2011. In addition, the IRS could require PHI to pay a penalty of up to 20% on the amount of additional taxes due. PHI anticipates that any additional taxes that it would be required to pay as a result of the disallowance of prior deductions or a re-characterization of the leases as loans would be recoverable in the form of lower taxes over the remaining terms of the affected leases. Moreover, the entire amount of any additional tax would not be due immediately. Rather, the federal and state taxes would be payable when the open audit years are closed and PHI amends subsequent tax returns not then under audit.
To the extent that PHI does not prevail in this matter and suffers a disallowance of the tax benefits and incurs imputed original issue discount income due to the recharacterization of the leases as loans, PHI would be required under Financial Accounting Standards Board guidance on leases (Accounting Standards Codification (ASC) 840) to recalculate the timing of the tax benefits generated by the cross-border energy lease investments and adjust the equity value of the investments, which would result in a non-cash charge to earnings that could be material.
For further discussion of this matter, see Note (17), “Commitments and Contingencies – PHI’s Cross-Border Energy Lease Investments,” to the consolidated financial statements of PHI.
PHI and its subsidiaries are dependent on obtaining access to capital markets and bank financing to satisfy their capital and liquidity requirements. The inability to obtain required financing would have an adverse effect on their respective businesses.
PHI, Pepco, DPL and ACE each have significant capital requirements, including the funding of construction expenditures and the refinancing of maturing debt. These companies rely primarily on cash flow from operations and access to the capital markets to meet these financing needs. The operating activities of PHI and its subsidiaries also require access to short-term money markets and bank financing
33
as sources of liquidity that are not met by cash flow from their operations. Adverse business developments or market disruptions could increase the cost of financing or prevent PHI or any of its subsidiaries from accessing one or more financial markets. Events that could cause or contribute to a disruption of the financial markets include, but are not limited to:
a recession or an economic slowdown;
the bankruptcy of one or more energy companies or financial institutions;
a significant change in energy prices;
a terrorist or cyber attack or threatened attacks;
the outbreak of a pandemic or other similar event; or
a significant electricity or natural gas transmission disruption.
Any reductions in or other actions with respect to the credit ratings of PHI or any of its subsidiaries could increase its financing costs and the cost of maintaining certain contractual relationships.
Nationally recognized rating agencies currently rate PHI, Pepco, DPL and ACE, and debt securities issued by Pepco, DPL and ACE. Ratings are not recommendations to buy or sell securities. PHI or its subsidiaries may, in the future, incur new indebtedness with interest rates that may be affected by changes in or other actions associated with these credit ratings. Each of the rating agencies reviews its ratings periodically, and previous ratings may not be maintained in the future. Rating agencies may also place PHI, Pepco, DPL or ACE under review for potential downgrade in certain circumstances or if any of them seek to take certain actions. A downgrade of these debt ratings or other negative action, such as a review for a potential downgrade, could affect the market price of existing indebtedness and the ability to raise additional debt without incurring increases in the cost of capital. In addition, a downgrade of these ratings, or other negative action, could make it more difficult to raise capital to refinance any maturing debt obligations, to support business growth and to maintain or improve the current financial strength of PHI’s business and operations.
The collateral requirements of Pepco Energy Services’ retail energy supply business also are determined in part by the unsecured debt rating of PHI. Negative ratings actions by one or more of the credit rating agencies resulting from a change in PHI’s or the utility’s operating results or prospects would increase funding costs. Any increases in collateral requirements could make such contractual obligations more expensive and make financing more difficult to obtain.
The agreements that govern PHI’s primary credit facility contain a consolidated indebtedness covenant that may limit discretion of each borrower to incur indebtedness or reduce its equity.
Under the terms of PHI’s primary credit facility, of which each Reporting Company is a borrower, the consolidated indebtedness of each borrower cannot exceed 65% of its consolidated capitalization. If a borrower’s equity were to decline or its debt were to increase to a level that caused its debt to exceed this limit, lenders under the credit facility would be entitled to refuse any further extension of credit and to declare all of the outstanding debt under the credit facility immediately due and payable. To avoid such a default, a waiver or renegotiation of this covenant would be required, which would likely increase funding costs and could result in additional covenants that would restrict the affected Reporting Company’s operational and financing flexibility.
Each borrower’s ability to comply with this covenant is subject to various risks and uncertainties, including events beyond the borrower’s control. For example, events that could cause a reduction in PHI’s equity include, without limitation, a further write-down of PHI’s cross-border energy lease investments or a significant write-down of PHI’s goodwill. Even if each borrower is able to comply with this covenant, the restrictions on its ability to operate its business in its sole discretion could harm PHI’s business by, among other things, limiting the borrower’s ability to incur indebtedness or reduce equity in connection with financings or other corporate opportunities that it may believe would be in its best interests or the interests of PHI’s stockholders to complete.
34
PHI’s cash flow, ability to pay dividends and ability to satisfy debt obligations depend on the performance of its regulated and competitive operating subsidiaries, access to capital markets and other sources of liquidity. PHI’s unsecured obligations are effectively subordinated to the liabilities of its subsidiaries. (PHI only)
PHI is a holding company that conducts its operations entirely through its regulated and competitive subsidiaries, and all of PHI’s consolidated operating assets are held by its subsidiaries. Accordingly, PHI’s cash flow, its ability to satisfy its obligations to creditors and its ability to pay dividends on its common stock are dependent upon the earnings of its subsidiaries, each Reporting Company’s access to capital markets and all sources of cash flow and liquidity that may be available to PHI. PHI’s subsidiaries are separate legal entities and have no obligation to pay any amounts due on any debt or equity securities issued by PHI or to make any funds available for such payment. The ability of PHI’s subsidiaries to pay dividends and make other payments to PHI may be restricted by, among other things, applicable corporate, tax and other laws and regulations and agreements made by PHI and its subsidiaries, including under the terms of indebtedness, and PHI’s financial objective of maintaining a common equity ratio at its utility subsidiaries of between 48% and 50%. Because the claims of the creditors of PHI’s subsidiaries are superior to PHI’s entitlement to dividends, the unsecured debt and obligations of PHI are effectively subordinated to all existing and future liabilities of its subsidiaries, including trade creditors. In addition, claims of creditors, including trade creditors, of PHI’s subsidiaries will generally have priority with respect to the assets and earnings of such subsidiaries over the claims of PHI’s creditors.
Further delays in the current in-service date for the MAPP project or the suspension or cancellation of this project could hinder PHI’s future revenue growth. (PHI, Pepco and DPL)
In 2007, PJM directed PHI and its utility subsidiaries to construct MAPP to address future potential violations of national and regional standards for reliable operation of the region’s transmission system. On August 18, 2011, PJM notified PHI that it has delayed the scheduled in-service date for MAPP from June 1, 2015 to the 2019 to 2021 time period, after taking into account changes in the demand response, generation retirements and additions, and a revised load forecast for the PJM region that was lower than forecasted in prior PJM studies. A more recent load forecast continues to support this load forecast trend. PJM is currently evaluating the exact in-service date as part of its 2012 Regional Transmission Expansion Plan review process. In the interim, the delay of the in-service date will defer a substantial portion of the transmission revenue that PHI expects to earn from the MAPP project, which is anticipated to generate higher rates of return on equity than most of PHI’s other existing transmission assets. Depending on the conclusions reached in its 2012 evaluation, PJM may further delay the required in-service date for the MAPP project or suspend or cancel the project altogether. Although PHI intends to substitute alternative transmission projects for MAPP based on the delay in the MAPP in service date, PHI may not be able to achieve an equal or higher rate of return on these alternative projects as has been approved under the MAPP project.
PHI has a significant goodwill balance related to its Power Delivery business. A determination that goodwill is impaired could result in a significant non-cash charge to earnings.
PHI had a goodwill balance at December 31, 2011, of approximately $1.4 billion, primarily attributable to Pepco’s acquisition of Conectiv in 2002. An impairment charge must be recorded under GAAP to the extent that the implied fair value of goodwill is less than the carrying value of goodwill, as shown on the consolidated balance sheet. PHI is required to test goodwill for impairment at least annually and whenever events or changes in circumstances indicate that the carrying value may not be recoverable. Factors that may result in an interim impairment test include a decline in PHI’s stock price causing market capitalization to fall below book value, an adverse change in business conditions or an adverse regulatory action. If PHI were to determine that its goodwill is impaired, PHI would be required to reduce its goodwill balance by the amount of the impairment and record a corresponding non-cash charge to earnings. Depending on the amount of the impairment, an impairment determination could have a material adverse effect on PHI’s financial condition and results of operations, but would not have an impact on cash flow.
35
The funding of future defined benefit pension plan and post-retirement benefit plan obligations is based on assumptions regarding the valuation of future benefit obligations and the performance of plan assets. If market performance decreases plan assets or changes in assumptions regarding the valuation of benefit obligations increase plan liabilities, any of the Reporting Companies may be required to make significant cash contributions to fund these plans.
PHI holds assets in trust to meet its obligations under PHI’s defined benefit pension plan and its postretirement benefit plan. The amounts that PHI is required to contribute (including the amounts for which Pepco, DPL and ACE are responsible) to fund the trusts are determined based on assumptions made as to the valuation of future benefit obligations, and the investment performance of the plan assets. Accordingly, the performance of the capital markets will affect the value of plan assets. A decline in the market value of plan assets may increase the plan funding requirements to meet the future benefit obligations. In addition, changes in interest rates affect the valuation of the liabilities of the plans. As interest rates decrease, the liabilities increase, potentially requiring additional funding. Demographic changes, such as a change in the expected timing of retirements or changes in life expectancy assumptions, also may increase the funding requirements of the plans. A need for significant additional funding of the plans could have a material adverse effect on the cash flows of any of the Reporting Companies. Future increases in pension plan and other postretirement benefit plan costs, to the extent they are not recoverable in the base rates of PHI’s utility subsidiaries, could have a material adverse effect on the results of operations, cash flow and financial condition of any of the Reporting Companies.
Provisions of the Delaware General Corporation Law and in PHI’s constituent documents may discourage an acquisition of PHI. (PHI only)
PHI is governed by the provisions of Section 203 of the Delaware General Corporation Law, which prohibit a public Delaware corporation from engaging in a business combination with an interested stockholder (as defined in Section 203) for a period commencing three years from the date in which the person became an interested stockholder, unless:
the board of directors approved the transaction which resulted in the stockholder becoming an interested stockholder;
upon consummation of the transaction which resulted in the stockholder becoming an interested stockholder, the interested stockholder owned at least 85% of the voting stock of the corporation (excluding shares owned by officers, directors, or certain employee stock purchase plans); or
at or subsequent to the time the transaction is approved by the board of directors, there is an affirmative vote of at least 66 2/3% of the outstanding voting stock not owned by the interested stockholder approving the transaction.
Section 203 could prohibit or delay mergers or other takeover attempts against PHI, and accordingly, may discourage or prevent attempts to acquire PHI through a tender offer, proxy contest or otherwise.
In addition, PHI’s restated certificate of incorporation and amended and restated bylaws contain provisions that may discourage, delay or prevent a third party from acquiring PHI, even if doing so would be beneficial to its stockholders. Under PHI’s restated certificate of incorporation, only its board of directors may call special meetings of stockholders. Further, stockholder actions may only be taken at a duly called annual or special meeting of stockholders and not by written consent. Moreover, directors of PHI may be removed by stockholders only for cause and only by the effective vote of at least a majority of the outstanding shares of capital stock of PHI entitled to vote generally in the election of directors (voting together as a single class) at a meeting of stockholders called for that purpose. In addition, under PHI’s amended and restated bylaws, stockholders must comply with advance notice requirements for
36
nominating candidates for election to PHI’s board of directors or for proposing matters that can be acted upon by stockholders at stockholder meetings, and this provision may be amended or repealed by stockholders only upon the affirmative vote of the holders of two-thirds of the outstanding shares of PHI capital stock entitled to vote generally in the election of directors, voting together as a single class.
Issuances of additional series of PHI preferred stock could adversely affect holders of PHI’s common stock. (PHI only)
PHI’s board of directors is authorized to issue shares of PHI preferred stock in series without any action on the part of PHI stockholders. PHI’s board of directors also has the power, without stockholder approval, to set the terms of any such series of preferred stock, including with respect to dividend rights, redemption rights and sinking fund provisions, conversion rights, voting rights, and other preferential rights, limitations and restrictions. If PHI issues preferred stock in the future that has a preference over PHI’s common stock with respect to the payment of dividends or upon its liquidation, dissolution or winding up, or if preferred stock is issued with voting rights that dilute the voting power of the common stock, the rights of holders of PHI’s common stock or the market price of such common stock could be adversely affected. Furthermore, issuances of preferred stock can be used to discourage, delay or prevent a third party from acquiring PHI where the acquisition might be perceived as being beneficial to stockholders.
Because Pepco, DPL and ACE are direct or indirect wholly owned subsidiaries of PHI, PHI can exercise substantial control over their dividend policies and businesses competitive conditions and regulatory requirements.operations. (Pepco, DPL and ACE only)
All of the members of each of Pepco’s, DPL’s and ACE’s board of directors, as well as many of their respective executive officers, are officers of PHI. Among other decisions, each of Pepco’s, DPL’s and ACE’s board is responsible for decisions regarding payment of dividends, financing and capital raising activities and acquisition and disposition of assets. Within the limitations of applicable law, and subject to the financial covenants under each company’s respective outstanding debt instruments, each of Pepco’s, DPL’s and ACE’s board of directors will base its decisions concerning the amount and timing of dividends, and other business decisions, on its capital structure, which is based in part on earnings and cash flow, and also may take into account the business plans and financial requirements of PHI and its other subsidiaries.
| Item 1B. | UNRESOLVED STAFF COMMENTS |
Pepco Holdings
None.
Pepco
None.
DPL
None.
ACE
None.
37
| Item 2. | PROPERTIES |
Generating Facilities
The following table identifies the electric generating facilities owned by PHI’s subsidiaries at December 31, 2011.
Electric Generating Facilities | Location | Owner | Generating Capacity (kilowatts) | |||||
Oil Fired Units | ||||||||
Benning Road (a) | Washington, DC | Pepco Energy Services | 550,000 | |||||
Combustion Turbines/Combined Cycle Units | ||||||||
Buzzard Point (a) | Washington, DC | Pepco Energy Services | 240,000 | |||||
Landfill Gas-Fired Units | ||||||||
Fauquier Landfill Project | Fauquier County, VA | Pepco Energy Services | 2,000 | |||||
Eastern Landfill Project | Baltimore County, MD | Pepco Energy Services | 3,000 | |||||
Bethlehem Landfill Project | Northampton, PA | Pepco Energy Services | 5,000 | |||||
| 10,000 | ||||||||
Solar Photovoltaic | ||||||||
Atlantic City Convention Center | Atlantic City, NJ | Pepco Energy Services | 2,000 | |||||
Total Electric Generating Capacity | 802,000 | |||||||
(a) PHI intends to deactivate these facilities by the end of May 2012. | ||||||||
The preceding table sets forth the net summer electric generating capacity of each electric generating facility owned. Although the generating capacity may be higher during the winter months, the facilities are used to meet summer peak loads that are generally higher than winter peak loads. Accordingly, the summer generating capacity more accurately reflects the operational capability of the facilities.
Transmission and Distribution Systems
On a combined basis, the electric transmission and distribution systems owned by Pepco, DPL and ACE at December 31, 2011, consisted of approximately 3,900 transmission circuit miles of overhead lines, 460 transmission circuit miles of underground cables, 18,400 distribution circuit miles of overhead lines, and 16,200 distribution circuit miles of underground cables, primarily in their respective service territories. DPL and ACE own and operate distribution system control centers in New Castle, Delaware and Mays Landing, New Jersey, respectively. Pepco also operates a distribution system control center in Bethesda, Maryland. The computer equipment and systems contained in Pepco’s control center are financed through a sale and leaseback transaction.
DPL owns a liquefied natural gas facility located in Wilmington, Delaware, with a storage capacity of approximately 3 million gallons and an emergency sendout capability of 25,000 Mcf per day. DPL owns 10 natural gas city gate stations at various locations in New Castle County, Delaware. These stations have a total primary delivery point contractual entitlement of 204,075 Mcf per day. DPL also owns approximately 104 pipeline miles of natural gas transmission mains, 1,912 pipeline miles of natural gas distribution mains, and 1,309 natural gas pipeline miles of service lines. In addition, DPL has a 10% undivided interest in approximately 7 miles of natural gas transmission mains, which are used by DPL for its natural gas operations and by the 90% owner for distribution of natural gas to its electric generating facilities.
38
Substantially all of the transmission and distribution property, plant and equipment owned by each of Pepco, DPL and ACE is subject to the liens of the respective mortgages under which the companies issue First Mortgage Bonds. See Note (11), “Debt” to the consolidated financial statements of PHI.
| Item 3. | LEGAL PROCEEDINGS |
Pepco Holdings
Other than litigation incidental to PHI and its subsidiaries’ business, PHI is not a party to, and PHI and its subsidiaries’ property is not subject to, any material pending legal proceedings except as described in Note (17), “Commitments and Contingencies,” to the consolidated financial statements of PHI.
Pepco
Other than litigation incidental to its business, Pepco is not a party to, and its property is not subject to, any material pending legal proceedings except as described in Note (13), “Commitments and Contingencies,” to the financial statements of Pepco.
DPL
Other than litigation incidental to its business, DPL is not a party to, and its property is not subject to, any material pending legal proceedings except as described in Note (15), “Commitments and Contingencies,” to the financial statements of DPL.
ACE
Other than litigation incidental to its business, ACE is not a party to, and its property is not subject to, any material pending legal proceedings except as described in Note (14), “Commitments and Contingencies,” to the consolidated financial statements of ACE.
| Item 4. | MINE SAFETY DISCLOSURES |
Not applicable
39
| Item 5. | MARKET FOR REGISTRANT’S COMMON EQUITY, RELATED STOCKHOLDER MATTERS AND ISSUER PURCHASES OF EQUITY SECURITIES |
The New York Stock Exchange is the principal market on which Pepco Holdings common stock is traded. The following table presents the dividends declared per share on the Pepco Holdings common stock and the high and low sales prices for the common stock based on composite trading as reported by the New York Stock Exchange during each quarter in the last two years.
| Dividends | Price Range | |||||||||||
Period | Per Share | High | Low | |||||||||
2011: | ||||||||||||
First Quarter | $ | .27 | $ | 19.14 | $ | 17.83 | ||||||
Second Quarter | .27 | 20.36 | 18.10 | |||||||||
Third Quarter | .27 | 20.04 | 16.57 | |||||||||
Fourth Quarter | .27 | 20.64 | 17.77 | |||||||||
|
| |||||||||||
| $ | 1.08 | |||||||||||
|
| |||||||||||
2010: | ||||||||||||
First Quarter | $ | .27 | $ | 17.57 | $ | 15.74 | ||||||
Second Quarter | .27 | 17.78 | 15.13 | |||||||||
Third Quarter | .27 | 18.92 | 15.40 | |||||||||
Fourth Quarter | .27 | 19.80 | 18.01 | |||||||||
|
| |||||||||||
| $ | 1.08 | |||||||||||
|
| |||||||||||
At February 15, 2012, there were 52,667 registered holders of record of Pepco Holdings common stock.
Dividends
On January 26, 2012, the PHI Board of Directors declared a dividend on common stock of 27 cents per share payable March 30, 2012, to shareholders of record on March 12, 2012.
See “Management’s Discussion and Analysis of Financial Condition and Results of Operations — Capital Resources and Liquidity — Capital Requirements — Dividends,” and Note (14), “Stock-Based Compensation, Dividend Restrictions, and Calculations of Earnings Per Share of Common Stock — Dividend Restrictions,” for information regarding restrictions on the ability of PHI and its subsidiaries to pay dividends.
PHI Subsidiaries
One of PHI’s financial objectives is to maintain an equity ratio of 48%-50% in each of its operating utilities. Each quarter, PHI may contribute equity into its utility subsidiaries or the utility subsidiaries may make a dividend payment to PHI in order to maintain an equity ratio of 48%-50% in each of the utility subsidiaries.
40
Pepco
All of Pepco’s common stock is held by Pepco Holdings. The table below presents the aggregate amount of common stock dividends paid by Pepco to PHI during each quarter in the last two years. Dividends received by PHI in 2011 and 2010 were used to support the payment of its common stock dividend.
Period | Aggregate Dividends | |||
2011: | ||||
First Quarter | $ | — | ||
Second Quarter | — | |||
Third Quarter | — | |||
Fourth Quarter | 25,000,000 | |||
|
| |||
| $ | 25,000,000 | |||
|
| |||
2010: | ||||
First Quarter | $ | 25,000,000 | ||
Second Quarter | 25,000,000 | |||
Third Quarter | 45,000,000 | |||
Fourth Quarter | 20,000,000 | |||
|
| |||
| $ | 115,000,000 | |||
|
| |||
DPL
All of DPL’s common stock is held by Conectiv, LLC (Conectiv). The table below presents the aggregate amount of common stock dividends paid by DPL to Conectiv during each quarter in the last two years. Dividends received by Conectiv in 2011 and 2010 were passed through to PHI to support the payment of its common stock dividend.
Period | Aggregate Dividends | |||
2011: | ||||
First Quarter | $ | — | ||
Second Quarter | — | |||
Third Quarter | 50,000,000 | |||
Fourth Quarter | 10,000,000 | |||
|
| |||
| $ | 60,000,000 | |||
|
| |||
2010: | ||||
First Quarter | $ | — | ||
Second Quarter | 23,000,000 | |||
Third Quarter | — | |||
Fourth Quarter | — | |||
|
| |||
| $ | 23,000,000 | |||
|
| |||
41
ACE
All of ACE’s common stock is held by Conectiv. The table below presents the aggregate amount of common stock dividends paid by ACE to Conectiv during each quarter in the last two years. Dividends received by Conectiv in 2010 were used to pay down short-term debt owed to PHI.
Period | Aggregate Dividends | |||
2011: | ||||
First Quarter | $ | — | ||
Second Quarter | — | |||
Third Quarter | — | |||
Fourth Quarter | — | |||
|
| |||
| $ | — | |||
|
| |||
2010: | ||||
First Quarter | $ | — | ||
Second Quarter | — | |||
Third Quarter | — | |||
Fourth Quarter | 35,000,000 | |||
|
| |||
| $ | 35,000,000 | |||
|
| |||
Recent Sales of Unregistered Equity Securities
Pepco Holdings
None.
Pepco
None.
DPL
None.
ACE
None.
Purchases of Equity Securities by the Issuer and Affiliated Purchasers
Pepco Holdings
None.
Pepco
None.
DPL
None.
ACE
None.
42
| Item 6. | SELECTED FINANCIAL DATA |
The following table sets forth selected historical consolidated data for PHI as of and for the years ended December 31, 2011, 2010, 2009, 2008, and 2007, derived from PHI’s audited financial statements.
PEPCO HOLDINGS CONSOLIDATED FINANCIAL HIGHLIGHTS
| 2011 | 2010 | 2009 | 2008 | 2007 | ||||||||||||||||||||||||||||||||||
| (in millions, except per share data) | ||||||||||||||||||||||||||||||||||||||
Consolidated Operating Results | ||||||||||||||||||||||||||||||||||||||
Total Operating Revenue | $ | 5,920 | $ | 7,039 | $ | 7,402 | $ | 8,059 | (h | ) | $ | 7,613 | ||||||||||||||||||||||||||
Total Operating Expenses | 5,283 | (a) | 6,415 | (c | ) | 6,754 | (f | ) | 7,510 | 6,953 | (j | ) | ||||||||||||||||||||||||||
Operating Income | 637 | 624 | 648 | 549 | 660 | |||||||||||||||||||||||||||||||||
Other Expenses | 228 | 474 | (d | ) | 321 | 276 | 255 | |||||||||||||||||||||||||||||||
Preferred Stock Dividend Requirements of Subsidiaries | — | — | — | — | — | |||||||||||||||||||||||||||||||||
Income from Continuing Operations Before Income Tax Expense | 409 | 150 | 327 | 273 | 405 | |||||||||||||||||||||||||||||||||
Income Tax Expense Related to Continuing Operations | 149 | (b) | 11 | (e | ) | 104 | (g | ) | 90 | (h | )(i) | 141 | (k | ) | ||||||||||||||||||||||||
Net Income from Continuing Operations | 260 | 139 | 223 | 183 | 264 | |||||||||||||||||||||||||||||||||
(Loss) Income from Discontinued Operations, net of Income Taxes | (3 | ) | (107 | ) | 12 | 117 | 70 | |||||||||||||||||||||||||||||||
Net Income | 257 | 32 | 235 | 300 | 334 | |||||||||||||||||||||||||||||||||
Earnings Available for Common Stock | 257 | 32 | 235 | 300 | 334 | |||||||||||||||||||||||||||||||||
Common Stock Information | ||||||||||||||||||||||||||||||||||||||
Basic Earnings Per Share of Common Stock from Continuing Operations | $ | 1.15 | $ | 0.62 | $ | 1.01 | $ | 0.90 | $ | 1.36 | ||||||||||||||||||||||||||||
Basic (Loss) Earnings Per Share of Common Stock from Discontinued Operations | (0.01 | ) | (0.48 | ) | 0.05 | 0.57 | 0.36 | |||||||||||||||||||||||||||||||
Basic Earnings Per Share of Common Stock | 1.14 | 0.14 | 1.06 | 1.47 | 1.72 | |||||||||||||||||||||||||||||||||
Diluted Earnings Per Share of Common Stock from Continuing Operations | 1.15 | 0.62 | 1.01 | 0.90 | 1.36 | |||||||||||||||||||||||||||||||||
Diluted (Loss) Earnings Per Share of Common Stock from Discontinued Operations | (0.01 | ) | (0.48 | ) | 0.05 | 0.57 | 0.36 | |||||||||||||||||||||||||||||||
Diluted Earnings Per Share of Common Stock | 1.14 | 0.14 | 1.06 | 1.47 | 1.72 | |||||||||||||||||||||||||||||||||
Cash Dividends Per Share of Common Stock | 1.08 | 1.08 | 1.08 | 1.08 | 1.04 | |||||||||||||||||||||||||||||||||
Year-End Stock Price | 20.30 | 18.25 | 16.85 | 17.76 | 29.33 | |||||||||||||||||||||||||||||||||
Net Book Value Per Common Share | 19.05 | 18.79 | 19.15 | 19.14 | 20.04 | |||||||||||||||||||||||||||||||||
Weighted Average Shares Outstanding | 226 | 224 | 221 | 204 | 194 | |||||||||||||||||||||||||||||||||
Other Information | ||||||||||||||||||||||||||||||||||||||
Investment in Property, Plant and Equipment | $ | 12,855 | $ | 12,120 | $ | 11,431 | $ | 10,860 | $ | 10,392 | ||||||||||||||||||||||||||||
Net Investment in Property, Plant and Equipment | 8,220 | 7,673 | 7,241 | 6,874 | 6,552 | |||||||||||||||||||||||||||||||||
Total Assets | 14,910 | 14,480 | 15,779 | 16,133 | 15,111 | |||||||||||||||||||||||||||||||||
Capitalization | ||||||||||||||||||||||||||||||||||||||
Short-term Debt | $ | 732 | $ | 534 | $ | 530 | $ | 465 | $ | 289 | ||||||||||||||||||||||||||||
Long-term Debt | 3,794 | 3,629 | 4,470 | 4,859 | 4,175 | |||||||||||||||||||||||||||||||||
Current Portion of Long-Term Debt and Project Funding | 112 | 75 | 536 | 85 | 332 | |||||||||||||||||||||||||||||||||
Transition Bonds issued by ACE Funding | 295 | 332 | 368 | 401 | 434 | |||||||||||||||||||||||||||||||||
Capital Lease Obligations due within one year | 8 | 8 | 7 | 6 | 6 | |||||||||||||||||||||||||||||||||
Capital Lease Obligations | 78 | 86 | 92 | 99 | 105 | |||||||||||||||||||||||||||||||||
Long-Term Project Funding | 13 | 15 | 17 | 19 | 21 | |||||||||||||||||||||||||||||||||
Non-controlling Interest | — | 6 | 6 | 6 | 6 | |||||||||||||||||||||||||||||||||
Common Shareholders’ Equity | 4,336 | 4,230 | 4,256 | 4,190 | 4,018 | |||||||||||||||||||||||||||||||||
|
|
|
|
|
|
|
|
|
| |||||||||||||||||||||||||||||
Total Capitalization | $ | 9,368 | $ | 8,915 | $ | 10,282 | $ | 10,130 | $ | 9,386 | ||||||||||||||||||||||||||||
|
|
|
|
|
|
|
|
|
| |||||||||||||||||||||||||||||
| (a) | Includes $39 million pre-tax ($3 million after-tax) gain from the early termination of certain cross-border energy leases held in trust. |
| (b) | Includes tax benefits of $14 million primarily associated with an interest benefit related to federal tax liabilities and a $22 million reversal of previously recognized tax benefits associated with the early termination of cross-border energy leases held in trust. |
| (c) | Includes $30 million ($18 million after-tax) related to a restructuring charge and an $11 million ($6 million after-tax) charge related to the effects of Pepco divestiture-related claims. |
| (d) | Includes a loss on extinguishment of debt of $189 million ($113 million after-tax). |
| (e) | Includes $12 million of net Federal and state income tax benefits primarily related to adjustments of accrued interest on uncertain and effectively settled tax positions, $14 million of state tax benefits resulting from the restructuring of certain PHI subsidiaries and $17 million of state income tax benefits associated with the loss on extinguishment of debt. |
| (f) | Includes $40 million ($24 million after-tax) gain related to the effects of Pepco divestiture-related claims. |
| (g) | Includes a $13 million state income tax benefit (after Federal tax) related to a change in the state income tax reporting for the disposition of certain assets in prior years and a benefit of $6 million related to additional analysis of current and deferred tax balances completed in 2009. |
| (h) | Includes a pre-tax charge of $124 million ($86 million after-tax) related to the adjustment to the equity value of cross-border energy lease investments, and included in Income Taxes is a $7 million after-tax charge for the additional interest accrued on the related tax obligation. |
| (i) | Includes $18 million of after-tax net interest income on uncertain and effectively settled tax positions (primarily associated with the reversal of previously accrued interest payable resulting from the tentative settlement with the IRS on the mixed service cost issue and a claim made with the IRS related to the tax reporting for fuel over- and under-recoveries) and a benefit of $8 million (including a $3 million correction of prior period errors) related to additional analysis of deferred tax balances completed in 2008. |
| (j) | Includes $33 million ($20 million after-tax) from settlement of Mirant bankruptcy claims. |
| (k) | Includes $20 million ($18 million net of fees) benefit related to Maryland income tax settlement. |
43
INFORMATION FOR THIS ITEM IS NOT REQUIRED FOR PEPCO, DPL, AND ACE AS THEY MEET THE CONDITIONS SET FORTH IN GENERAL INSTRUCTIONS I(1)(a) AND (b) OF FORM 10-K AND THEREFORE ARE FILING THIS FORM WITH THE REDUCED FILING FORMAT.
| Item 7. | MANAGEMENT’S DISCUSSION AND ANALYSIS OF FINANCIAL CONDITION AND RESULTS OF OPERATIONS |
The information required by this item is contained herein, as follows:
Registrants | Page No. | |
Pepco Holdings | 45 | |
Pepco | 95 | |
DPL | 105 | |
ACE | 116 |
44
PEPCO HOLDINGS
MANAGEMENT’S DISCUSSION AND ANALYSIS OF FINANCIAL CONDITION AND RESULTS OF OPERATIONS
Pepco Holdings, Inc.
General Overview
PHI, a Delaware corporation incorporated in 2001, is a holding company that, through its regulated public utility subsidiaries, is engaged primarily in the transmission, distribution and default supply of electricity and the distribution and supply of natural gas (Power Delivery). Through Pepco Energy Services, PHI provides energy efficiency services primarily to government and institutional customers and is in the process of winding down its competitive electricity and natural gas retail supply business. Each of Power Delivery and Pepco Energy Services constitutes a separate segment for financial reporting purposes. A third segment, Other Non-Regulated, owns a portfolio of seven cross-border energy lease investments.
The following table sets forth the percentage contributions to consolidated operating revenue and operating income from continuing operations attributable to the Power Delivery, Pepco Energy Services and Other Non-Regulated segments:
| December��31, | ||||||||||||
| 2011 | 2010 | 2009 | ||||||||||
Percentage of Consolidated Operating Revenue | ||||||||||||
Power Delivery | 79 | % | 73 | % | 67 | % | ||||||
Pepco Energy Services | 21 | % | 27 | % | 32 | % | ||||||
Other Non-Regulated | — | % | — | % | 1 | % | ||||||
Percentage of Consolidated Operating Income | ||||||||||||
Power Delivery | 78 | % | 81 | % | 78 | % | ||||||
Pepco Energy Services | 5 | % | 11 | % | 14 | % | ||||||
Other Non-Regulated | 17 | % | 8 | % | 8 | % | ||||||
Percentage of Power Delivery Operating Revenue | ||||||||||||
Power Delivery Electric | 95 | % | 95 | % | 95 | % | ||||||
Power Delivery Gas | 5 | % | 5 | % | 5 | % | ||||||
Power Delivery
Power Delivery Electric consists primarily of the transmission, distribution and default supply of electricity, and Power Delivery Gas consists of the delivery and supply of natural gas. Power Delivery represents a single operating segment for financial reporting purposes.
Each utility comprising Power Delivery is a regulated public utility in the jurisdictions that encompass its service territory. Each company is responsible for the distribution of electricity and, in the case of DPL, natural gas in its service territory, for which it is paid tariff rates established by the applicable local public service commission in each jurisdiction. Each company also supplies electricity at regulated rates to retail customers in its service territory who do not elect to purchase electricity from a competitive energy supplier. The regulatory term for this supply service is SOS in Delaware, the District of Columbia and Maryland, and BGS in New Jersey. In this report, these supply service obligations are referred to generally as Default Electricity Supply.
Pepco, DPL and ACE are also responsible for the transmission of wholesale electricity into and across their service territories. The rates each company is permitted to charge for the wholesale transmission of electricity are regulated by FERC. Transmission rates are updated annually based on a FERC-approved formula methodology.
45
PEPCO HOLDINGS
The profitability of Power Delivery depends on its ability to recover costs and earn a reasonable return on its capital investments through the rates it is permitted to charge. Operating results also can be affected by economic conditions, energy prices and the impact of energy efficiency measures on customer usage of electricity.
In ACE and DPL’s Delaware service territories, results historically have been seasonal, generally producing higher revenue and income in the warmest and coldest periods of the year. For retail customers of Pepco and DPL in Maryland and for customers of Pepco in the District of Columbia, revenue is not affected by season changes because a BSA was implemented for retail customers that provides for a fixed distribution charge per customer rather than a charge based upon energy usage. The BSA has the effect of decoupling the distribution revenue recognized in a reporting period from the amount of power delivered during the period. As a result, the only factors that will cause distribution revenue in Maryland and the District of Columbia to fluctuate from period to period are changes in the number of customers and changes in the approved distribution charge per customer. A comparable revenue decoupling mechanism for DPL electricity and natural gas customers in Delaware is under consideration by the DPSC. With respect to customers subject to a BSA, changes in usage (such as due to weather conditions, energy prices, energy efficiency programs or other reasons) from period to period have no impact on reported distribution revenue.
In accounting for the BSA in Maryland and the District of Columbia, a Revenue Decoupling Adjustment is recorded representing either (i) a positive adjustment equal to the amount by which revenue from Maryland and District of Columbia retail distribution sales falls short of the revenue that Pepco and DPL are entitled to earn based on the approved distribution charge per customer or (ii) a negative adjustment equal to the amount by which revenue from such distribution sales exceeds the revenue that Pepco and DPL are entitled to earn based on the approved distribution charge per customer.
The following are developments in some of the key initiatives of Power Delivery in 2011:
Reliability Enhancement and Emergency Restoration Improvement Plans
In 2010, PHI announced that Pepco had adopted and begun to implement comprehensive reliability enhancement plans in Maryland and the District of Columbia. These reliability enhancement plans include various initiatives to improve electrical system reliability, such as:
enhanced vegetation management;
the identification and upgrading of under-performing feeder lines;
the addition of new facilities to support load;
the installation of distribution automation systems on both the overhead and underground network system;
the rejuvenation and replacement of underground residential cables;
improvements to substation supply lines; and
selective undergrounding of portions of existing above ground primary feeder lines, where appropriate to improve reliability.
During 2011, Pepco invested $120 million in capital expenditures on these reliability enhancement activities.
In 2011, prior to the start of the summer storm season, PHI initiated a program to improve Pepco’s emergency restoration efforts that included, among other initiatives, an expansion and enhancement of customer service capabilities.
PHI has extended its reliability enhancement efforts to DPL and ACE. PHI’s capital expenditures for continuing reliability enhancement efforts are included in the table of projected capital expenditures in the section titled “Capital Resources and Liquidity — Capital Expenditures.”
46
PEPCO HOLDINGS
Blueprint for the Future
Each of PHI’s three utilities is participating in a PHI initiative referred to as “Blueprint for the Future.” The installation of smart meters (also known as AMI), a key initiative of Blueprint for the Future, is almost complete for DPL electric customers in Delaware, with meter activation expected to be completed in the first quarter of 2012. Meter installation is still underway for Pepco customers in both the District of Columbia and Maryland, with installation of residential meters expected to be complete in the first and fourth quarters of 2012, respectively. The respective public service commissions have approved the creation of regulatory assets to defer AMI costs between rate cases, as well as the accrual of a return on the deferred costs. Thus, these costs will be recovered through base rates in the future. In addition to the replacement of existing meters, the AMI system involves the construction of a wireless network across the service territories of PHI’s utility subsidiaries and the implementation and integration of new and existing information technology systems to collect and manage data made available by the advanced meters. The implementation of the AMI system involves a combination of technologies provided by multiple vendors.
Approval of AMI is still pending for electric customers in DPL’s Maryland jurisdiction, and has been deferred in New Jersey.
In 2011, the DPSC approved DPL’s request to implement dynamic pricing for its Delaware customers. Implementation for customers will be phased in between 2012 and 2014. Dynamic pricing has been approved in concept, with phase-in for residential customers beginning in 2012 for Pepco customers in Maryland. Customers in Pepco’s District of Columbia jurisdiction have proposals pending with proposed phase-in for residential customers anticipated to begin in 2012. Dynamic pricing has been approved in concept pending AMI deployment authorization for DPL’s Maryland customers and has been deferred for ACE’s customers in New Jersey.
Regulatory Lag
An important factor in the ability of each of Pepco, DPL and ACE to earn its authorized rate of return is the willingness of applicable public service commissions to adequately recognize forward-looking costs in the utility’s rate structure in order to address the shortfall in revenues due to the delay in time or “lag” between when costs are incurred and when they are reflected in rates. This delay is commonly known as “regulatory lag.” Each of Pepco, DPL and ACE is currently experiencing significant regulatory lag because their investment in the rate base and their operating expenses are outpacing revenue growth. PHI is continuing to seek cost recovery and tracking mechanisms from applicable public service commissions to reduce the effects of regulatory lag.
Pepco Energy Services
Pepco Energy Services is engaged in the following businesses:
providing energy efficiency services principally to federal, state and local government customers, and designing, constructing and operating combined heat and power and central energy plants.
providing high voltage electric construction and maintenance services to customers throughout the United States and low voltage electric construction and maintenance services and streetlight construction and asset management services to utilities, municipalities and other customers in the Washington, D.C. area.
47
PEPCO HOLDINGS
Pepco Energy Services also has been engaged in the business of providing retail energy supply services, consisting of the sale of electricity, including electricity from renewable resources, primarily to commercial, industrial and government customers located primarily in the mid-Atlantic and northeastern regions of the U.S., as well as Texas and Illinois, and the sale of natural gas to customers located primarily in the mid-Atlantic region. In December 2009, PHI announced that it will wind-down the retail energy supply component of the Pepco Energy Services business. The decision was made after considering, among other factors, the return PHI earns by investing capital in the retail energy supply business as compared to alternative investments.
To effectuate the wind-down, Pepco Energy Services will continue to fulfill all of its commercial and regulatory obligations and perform its customer service functions to ensure that it meets the needs of its existing customers, but will not be entering into any new retail energy supply contracts. Operating revenues related to the retail energy supply business for the years ended December 31, 2011, 2010 and 2009 were $0.9 billion, $1.6 billion and $2.3 billion, respectively, and operating income for the same periods was $11 million, $59 million and $88 million, respectively.
PHI expects the operating results of the retail energy supply business, excluding the effects of unrealized mark-to-market gains or losses on derivatives contracts, to be profitable in 2012, based on its existing retail contracts and its corresponding portfolio of wholesale hedges, with immaterial losses beyond that date. Substantially all of Pepco Energy Services’ retail customer obligations will be fully performed by June 1, 2014.
In connection with the operation of the retail energy supply business, as of December 31, 2011 and 2010, Pepco Energy Services had collateral pledged to counterparties primarily for the instruments it uses to hedge commodity price risk of approximately $113 million and $230 million, respectively. The collateral pledged as of December 31, 2011, included $1 million in the form of letters of credit and $112 million posted in cash. Pepco Energy Services estimates that at current market prices, with the wind-down of the retail energy supply business, an aggregate of 80% of the collateral will no longer need to be pledged by December 31, 2012, and substantially all collateral will no longer need to be pledged by June 1, 2014.
As a result of the decision to wind-down the retail energy supply business, Pepco Energy Services in the fourth quarter of 2009 recorded (i) a $4 million pre-tax impairment charge reflecting the write off of all goodwill allocated to the business and (ii) a pre-tax charge of less than $1 million related to employee severance.
Pepco Energy Services’ remaining businesses will not be affected by the wind-down of the retail energy supply business.
Other Non-Regulated
Through its subsidiary PCI, PHI maintains a portfolio of cross-border energy lease investments with a book value at December 31, 2011 of approximately $1.3 billion. This activity constitutes a third operating segment, which is designated as “Other Non-Regulated,” for financial reporting purposes. For a discussion of PHI’s cross-border energy lease investments, see Note (8), “Leasing Activities – Investment in Finance Leases Held in Trust,” and Note (17), “Commitments and Contingencies—PHI’s Cross-Border Energy Lease Investments,” to the consolidated financial statements of PHI.
Discontinued Operations
On April 20, 2010, the Board of Directors of PHI approved a plan for the disposition of Conectiv Energy. On July 1, 2010, PHI completed the sale of Conectiv Energy’s wholesale power generation business to Calpine for $1.64 billion. The disposition of all of Conectiv Energy’s remaining assets and businesses not
48
PEPCO HOLDINGS
included in the Calpine sale, including its load service supply contracts, energy hedging portfolio and certain tolling agreements, has been substantially completed. The operations of Conectiv Energy, which previously comprised a separate segment for financial reporting purposes, have been classified as a discontinued operation in PHI’s consolidated financial statements for each of the years ended December 31, 2011, 2010 and 2009, and the business is no longer being treated as a separate segment for financial reporting purposes. Accordingly, in this Management’s Discussion and Analysis of Financial Condition and Results of Operations, all references to continuing operations exclude the operations of the former Conectiv Energy segment.
Earnings Overview
Year Ended December 31, 20102011 Compared to the Year Ended December 31, 20092010
PHI’s net income from continuing operations for the year ended December 31, 20102011 was $260 million, or $1.15 per share, compared to $139 million, or $0.62 per share, compared to $223 million, or $1.01 per share, for the year ended December 31, 2009.2010.
Net income from continuing operations for the year ended December 31, 2010, included the charges set forth below in the business segments noted which are presented net of federal and state income taxes (assuming a composite tax rate of approximately 40%) and are in millions of dollars:
Debt extinguishment costs including treasury lock hedge (Corporate and Other) | $ | 113 | ||
Restructuring charge (All segments) | $ | 18 | ||
Effects of Pepco divestiture-related claims (Power Delivery) | $ | 6 |
Excluding these items, net income from continuing operations would have been $276 million, or $1.24 per share, for the year ended December 31, 2010.
Net income from continuing operations for the year ended December 31, 2009, included the credits set forth below in the Power Delivery segment, which are presented net of federal and state income taxes and are in millions of dollars:
Settlement of Pepco divestiture-related Mirant Corporation (Mirant) bankruptcy claims | $ | 24 | ||
Maryland income tax benefit, net of fees | $ | 11 |
Excluding these items, PHI discloses net income from continuing operations would have been $188 million, or $0.85and related per share for the year ended December 31, 2009.data excluding these items because management believes that these items are not representative of PHI’s ongoing business operations. Management uses this information, and believes that such information is useful to investors, in evaluating PHI’s period-over-period performance. The inclusion of this disclosure is intended to complement, and should not be considered as an alternative to, PHI’s reported net income from continuing operations and related per share data in accordance with GAAP.
PHI’s net loss from discontinued operations for the year ended December 31, 20102011 was $3 million, or $0.01 per share, compared to a net loss of $107 million, or $0.48 per share, compared to net income of $12 million, or $0.05 per share, for the year ended December 31, 2009.2010.
PHI’s net income (loss) for the years ended December 31, 20102011 and 2009,2010, by operating segment, is set forth in the table below (in millions of dollars):
| 2010 | 2009 | Change | 2011 | 2010 | Change | |||||||||||||||||||
Power Delivery | $ | 206 | $ | 199 | $ | 7 | $ | 210 | $ | 206 | $ | 4 | ||||||||||||
Pepco Energy Services | 36 | 40 | (4 | ) | 24 | 36 | (12 | ) | ||||||||||||||||
Other Non-Regulated | 25 | 31 | (6 | ) | 35 | 25 | 10 | |||||||||||||||||
Corporate and Other | (128 | ) | (47 | ) | (81 | ) | (9 | ) | (128 | ) | 119 | |||||||||||||
|
|
| ||||||||||||||||||||||
Net Income from Continuing Operations | 139 | 223 | (84 | ) | 260 | 139 | 121 | |||||||||||||||||
Discontinued Operations | (107 | ) | 12 | (119 | ) | (3 | ) | (107 | ) | 104 | ||||||||||||||
|
|
| ||||||||||||||||||||||
Total PHI Net Income | $ | 32 | $ | 235 | $ | (203 | ) | $ | 257 | $ | 32 | $ | 225 | |||||||||||
|
|
| ||||||||||||||||||||||
49
PEPCO HOLDINGS
Discussion of Operating Segment Net Income Variances:
Power Delivery’s $7$4 million increase in earnings iswas primarily due to the following:
$5123 million increase from higher distribution revenue consisting of:primarily due to Regulated T&D Electric and Regulated Gas distribution rate increases.
a $24$18 million increase due to distributionassociated with higher Default Electricity Supply margins, primarily resulting from an approval by the DCPSC of an increase in Pepco’s cost recovery rate increases (Pepcofor providing SOS in the District of Columbia, effective November 2009 and March 2010;adjustments to Pepco and DPL in Maryland effective December 2009; DPL in Delaware effective April 2010;operating and ACE in New Jersey effective June 2010); and
a $27 million increase due to higher distribution sales, primarily due to weather, usage and growth in the number of customers.maintenance expenses for providing SOS.
$2117 million increase from higher transmission revenue primarily dueattributable to higher rates effective June 1, 2010 and June 1, 2011, related to an increaseincreases in transmission plant investment.
$1117 million increase in Other Income (Expense), primarily an increase in the Allowance for Funds Used During Construction and gains on the disposal of assets.
$6 million increase associated with ACE Basic Generation Service primarily attributable to an increase in unbilled revenue due to higher usage and higher rates.
The aggregate of these increases was partially offset by:
$27 million decrease due to higher operating and maintenance costs primarily resulting from February, July and August 2010 storm restoration activity, system maintenance (tree trimming) and estimated environmental remediation costs.
$24 million decrease due to the 2009 favorable earnings impact of the approvals by the District of Columbia Public Service Commission (DCPSC) and the Maryland Public Service Commission (MPSC) of Pepco’s proposals for sharing the proceeds of the Mirant bankruptcy settlement remaining after the transfer of the Panda PPA to a third party.
$17 million decrease due to a restructuring charge recorded in 2010.
$8 million decrease related to income tax adjustments consisting of:
$13 million decrease due to 2009 earnings impactseverance, pension and health and welfare benefits for employee terminations, associated with the reorganization of a Maryland income tax benefit related to a change in tax reporting for the disposition of certain assets in prior years; offset by
$5 million net increase due to the impact of interest related to effectively settled and uncertain tax positionsPHI in 2010.
$6 million decreaseincrease due to a 2010an order by the DCPSC in 2010 associated with the effects of Pepco divestiture-related claims.
Pepco Energy Services’ $4 million decrease in earnings is primarily due to the following:
$1856 million decrease due to lower retail electricity sales volumes due to the ongoing wind down of the retail electricity supply business,higher operating and lower gross margins due to low demand in the retail natural gas business.maintenance expenses primarily from increased system preventative maintenance and reliability activities.
PEPCO HOLDINGS
$610 million decrease in distribution revenues due to repair costs associated with a thermal services’ distribution system pipe leak and higher costs associated with operating a customer’s cogeneration plant; partially offset by increased high voltage construction activity.
The aggregate amountlower usage, including the effect of these decreases was partially offset by:
$11 million increase due to higher electricity generation output that resulted from warmer than normal weather; partially offset by power plant maintenance costs.milder weather.
$8 million increasedecrease due to higher depreciation expense.
Pepco Energy Services’ $12 million decrease in earnings was primarily due to mark-to-market losses of $18 million in 2011 on derivative contracts, lower interest and other expenses, primarily associated with credit and collateral facilities forearnings as a result of the ongoing wind-down of the retail energy supply business and lower capacity revenues from the generating facilities, partially offset by higher operating income from the energy services business.
Other Non-Regulated’s $6$10 million decreaseincrease in earnings iswas primarily due to favorable income tax benefits recordedadjustments and the gain on the early termination of certain cross-border energy leases, partially offset by lower financial investment portfolio activity (as further discussed in 2009.Note (8), “Leasing Activities – Investment in Finance Leases Held in Trust,” and Note (12), “Income Taxes,” to the consolidated financial statements of PHI.
Corporate and Other’s $81$119 million decrease in earnings isloss was primarily due to the unfavorable impact of $113 million of debt extinguishment costs relatedin 2010 and lower interest expense in 2011 as a result of the reduction in outstanding debt due to the purchaseretirement of outstanding debt with the proceeds from the sale of the Conectiv Energy wholesale power generation business;sale proceeds, partially offset by the favorable impact of $22 million of net state income tax benefitsadjustments in 2010 from the release of certain deferred tax valuation allowances related to the April 2010 corporate restructuring and $8 million of lower interest expense.state net operating losses.
The $119$104 million decrease in earningsthe net loss from discontinued operations was primarily due to the recognition of a loss2010 write-down associated with the sale of the wholesale power generation business to Calpine Corporation and unrealized losses on derivative instruments no longer qualifying for cash flow hedge accounting, partially offset by gains recognized onin the 2010 period from sales of load service supply contracts.
50
PEPCO HOLDINGS
Consolidated Results of Operations
The following results of operations discussion compares the year ended December 31, 2011, to the year ended December 31, 2010. All amounts in the tables (except sales and customers) are in millions of dollars.
Continuing Operations
Operating Revenue
A detail of the components of PHI’s consolidated operating revenue is as follows:
| 2011 | 2010 | Change | ||||||||||
Power Delivery | $ | 4,650 | $ | 5,114 | $ | (464 | ) | |||||
Pepco Energy Services | 1,238 | 1,883 | (645 | ) | ||||||||
Other Non-Regulated | 48 | 54 | (6 | ) | ||||||||
Corporate and Other | (16 | ) | (12 | ) | (4 | ) | ||||||
|
|
|
|
|
| |||||||
Total Operating Revenue | $ | 5,920 | $ | 7,039 | $ | (1,119 | ) | |||||
|
|
|
|
|
| |||||||
Power Delivery Business
The following table categorizes Power Delivery’s operating revenue by type of revenue.
| 2011 | 2010 | Change | ||||||||||
Regulated T&D Electric Revenue | $ | 1,891 | $ | 1,858 | $ | 33 | ||||||
Default Electricity Supply Revenue | 2,462 | 2,951 | (489 | ) | ||||||||
Other Electric Revenue | 67 | 68 | (1 | ) | ||||||||
|
|
|
|
|
| |||||||
Total Electric Operating Revenue | 4,420 | 4,877 | (457 | ) | ||||||||
|
|
|
|
|
| |||||||
Regulated Gas Revenue | 183 | 191 | (8 | ) | ||||||||
Other Gas Revenue | 47 | 46 | 1 | |||||||||
|
|
|
|
|
| |||||||
Total Gas Operating Revenue | 230 | 237 | (7 | ) | ||||||||
|
|
|
|
|
| |||||||
Total Power Delivery Operating Revenue | $ | 4,650 | $ | 5,114 | $ | (464 | ) | |||||
|
|
|
|
|
| |||||||
Regulated T&D Electric Revenue includes revenue from the distribution of electricity, including the distribution of Default Electricity Supply, by PHI’s utility subsidiaries to customers within their service territories at regulated rates. Regulated T&D Electric Revenue also includes transmission service revenue that PHI’s utility subsidiaries receive as transmission owners from PJM at rates regulated by FERC.
Default Electricity Supply Revenue is the revenue received from the supply of electricity by PHI’s utility subsidiaries at regulated rates to retail customers who do not elect to purchase electricity from a competitive energy supplier. Depending on the jurisdiction, Default Electricity Supply is also known as SOS or BGS. The costs related to Default Electricity Supply are included in Fuel and Purchased Energy. Default Electricity Supply Revenue also includes revenue from Transition Bond Charges that ACE receives, and pays to ACE Funding, to fund the principal and interest payments on Transition Bonds issued by ACE Funding, and revenue in the form of transmission enhancement credits that PHI utility subsidiaries receive as transmission owners from PJM for approved regional transmission expansion plan costs.
Other Electric Revenue includes work and services performed on behalf of customers, including other utilities, which is generally not subject to price regulation. Work and services includes mutual assistance to other utilities, highway relocation, rentals of pole attachments, late payment fees and collection fees.
51
PEPCO HOLDINGS
Regulated Gas Revenue includes the revenue DPL receives from on-system natural gas delivered sales and the transportation of natural gas for customers within its service territory at regulated rates.
Other Gas Revenue consists of DPL’s off-system natural gas sales and the short-term release of interstate pipeline transportation and storage capacity not needed to serve customers. Off-system sales are made possible when low demand for natural gas by regulated customers creates excess pipeline capacity.
Regulated T&D Electric
| 2011 | 2010 | Change | ||||||||||
Regulated T&D Electric Revenue | ||||||||||||
Residential | $ | 683 | $ | 683 | $ | — | ||||||
Commercial and industrial | 884 | 883 | 1 | |||||||||
Transmission and other | 324 | 292 | 32 | |||||||||
|
|
|
|
|
| |||||||
Total Regulated T&D Electric Revenue | $ | 1,891 | $ | 1,858 | $ | 33 | ||||||
|
|
|
|
|
| |||||||
| 2011 | 2010 | Change | ||||||||||
Regulated T&D Electric Sales (Gigawatt hours(GWh)) | ||||||||||||
Residential | 17,728 | 18,398 | (670 | ) | ||||||||
Commercial and industrial | 31,282 | 32,045 | (763 | ) | ||||||||
Transmission and other | 256 | 260 | (4 | ) | ||||||||
|
|
|
|
|
| |||||||
Total Regulated T&D Electric Sales | 49,266 | 50,703 | (1,437 | ) | ||||||||
|
|
|
|
|
| |||||||
| 2011 | 2010 | Change | ||||||||||
Regulated T&D Electric Customers (in thousands) | ||||||||||||
Residential | 1,636 | 1,635 | 1 | |||||||||
Commercial and industrial | 198 | 198 | — | |||||||||
Transmission and other | 2 | 2 | — | |||||||||
|
|
|
|
|
| |||||||
Total Regulated T&D Electric Customers | 1,836 | 1,835 | 1 | |||||||||
|
|
|
|
|
| |||||||
The Pepco, DPL and ACE service territories are located within a corridor extending from the District of Columbia to southern New Jersey. These service territories are economically diverse and include key industries that contribute to the regional economic base.
Commercial activity in the region includes banking and other professional services, government, insurance, real estate, shopping malls, casinos, stand alone construction and tourism.
Industrial activity in the region includes chemical, glass, pharmaceutical, steel manufacturing, food processing and oil refining.
Regulated T&D Electric Revenue increased by $33 million primarily due to:
An increase of $32 million due to distribution rate increases (Pepco in the District of Columbia effective March 2010 and July 2010, and in Maryland effective July 2010; DPL in Maryland effective July 2011, and in Delaware effective February 2011; and ACE in New Jersey effective June 2010).
An increase of $32 million in transmission revenue primarily attributable to higher rates effective June 1, 2010 and June 1, 2011 related to increases in transmission plant investment.
52
PEPCO HOLDINGS
An increase of $11 million due to higher pass-through revenue (which is substantially offset by a corresponding increase in Other Taxes) primarily the result of rate increases in Montgomery County, Maryland utility taxes that are collected by Pepco on behalf of the county.
An increase of $7 million primarily due to Pepco customer growth in 2011, primarily in the residential class.
An increase of $2 million due to the implementation of the EmPower Maryland (a demand side management program) surcharge in March 2010 (which is substantially offset by a corresponding increase in Depreciation and Amortization).
The aggregate amount of these increases was partially offset by:
A decrease of $30 million due to an ACE New Jersey Societal Benefit Charge rate decrease that became effective in January 2011 (which is offset in Deferred Electric Service Costs).
A decrease of $11 million due to lower sales as a result of cooler weather during the spring and summer months of 2011, and warmer weather during the fall months of 2011, as compared to the corresponding periods in 2010.
A decrease of $10 million due to lower non-weather related average customer usage.
Default Electricity Supply
| 2011 | 2010 | Change | ||||||||||
Default Electricity Supply Revenue | ||||||||||||
Residential | $ | 1,668 | $ | 2,022 | $ | (354 | ) | |||||
Commercial and industrial | 642 | 733 | (91 | ) | ||||||||
Other | 152 | 196 | (44 | ) | ||||||||
|
|
|
|
|
| |||||||
Total Default Electricity Supply Revenue | $ | 2,462 | $ | 2,951 | $ | (489 | ) | |||||
|
|
|
|
|
| |||||||
Other Default Electricity Supply Revenue consists primarily of (i) revenue from the resale by ACE in the PJM RTO market of energy and capacity purchased under contracts with unaffiliated NUGs, and (ii) revenue from transmission enhancement credits.
| 2011 | 2010 | Change | ||||||||||
Default Electricity Supply Sales (GWh) | ||||||||||||
Residential | 15,545 | 17,385 | (1,840 | ) | ||||||||
Commercial and industrial | 6,168 | 7,034 | (866 | ) | ||||||||
Other | 73 | 93 | (20 | ) | ||||||||
|
|
|
|
|
| |||||||
Total Default Electricity Supply Sales | 21,786 | 24,512 | �� | (2,726 | ) | |||||||
|
|
|
|
|
| |||||||
| 2011 | 2010 | Change | ||||||||||
Default Electricity Supply Customers (in thousands) | ||||||||||||
Residential | 1,432 | 1,525 | (93 | ) | ||||||||
Commercial and industrial | 137 | 148 | (11 | ) | ||||||||
Other | — | 1 | (1 | ) | ||||||||
|
|
|
|
|
| |||||||
Total Default Electricity Supply Customers | 1,569 | 1,674 | (105 | ) | ||||||||
|
|
|
|
|
| |||||||
53
PEPCO HOLDINGS
Default Electricity Supply Revenue decreased by $489 million primarily due to:
A decrease of $200 million due to lower sales, primarily as a result of customer migration to competitive suppliers.
A net decrease of $153 million as a result of lower Pepco and DPL Default Electricity Supply rates, partially offset by higher ACE rates.
A decrease of $94 million due to lower sales as a result of cooler weather during the spring and summer months of 2011, and warmer weather during the fall months of 2011, as compared to the corresponding periods in 2010.
A decrease of $40 million in wholesale energy and capacity resale revenues primarily due to the sale of lower volumes of electricity and capacity purchased from NUGs.
A decrease of $3 million due to a decrease in revenue from Transmission Enhancement Credits.
The aggregate amount of these decreases was partially offset by:
An increase of $3 million resulting from an approval by the DCPSC of an increase in Pepco’s cost recovery rate for providing Default Electricity Supply in the District of Columbia to provide for recovery of higher cash working capital costs incurred in prior periods. The higher cash working capital costs were incurred when the billing cycle for providers of Default Electricity Supply was shortened from a monthly to a weekly period, effective in June 2009.
Total Default Electricity Supply Revenue for the 2011 period includes a decrease of $8 million in unbilled revenue attributable to ACE’s BGS ($5 million decrease in net income), primarily due to lower customer usage and lower Default Electricity Supply rates during the unbilled revenue period at the end of 2011 as compared to the corresponding period in 2010. Under the BGS terms approved by the NJBPU, ACE’s BGS unbilled revenue is not included in the deferral calculation until it is billed to customers, and therefore has an impact on the results of operations in the period during which it is accrued.
Regulated Gas
| 2011 | 2010 | Change | ||||||||||
Regulated Gas Revenue | ||||||||||||
Residential | $ | 113 | $ | 118 | $ | (5 | ) | |||||
Commercial and industrial | 61 | 65 | (4 | ) | ||||||||
Transportation and other | 9 | 8 | 1 | |||||||||
|
|
|
|
|
| |||||||
Total Regulated Gas Revenue | $ | 183 | $ | 191 | $ | (8 | ) | |||||
|
|
|
|
|
| |||||||
| 2011 | 2010 | Change | ||||||||||
Regulated Gas Sales (billion cubic feet) | ||||||||||||
Residential | 7 | 8 | (1 | ) | ||||||||
Commercial and industrial | 5 | 5 | — | |||||||||
Transportation and other | 7 | 6 | 1 | |||||||||
|
|
|
|
|
| |||||||
Total Regulated Gas Sales | 19 | 19 | — | |||||||||
|
|
|
|
|
| |||||||
54
PEPCO HOLDINGS
| 2011 | 2010 | Change | ||||||||||
Regulated Gas Customers (in thousands) | ||||||||||||
Residential | 115 | 114 | 1 | |||||||||
Commercial and industrial | 9 | 9 | — | |||||||||
Transportation and other | — | — | — | |||||||||
|
|
|
|
|
| |||||||
Total Regulated Gas Customers | 124 | 123 | 1 | |||||||||
|
|
|
|
|
| |||||||
DPL’s natural gas service territory is located in New Castle County, Delaware. Several key industries contribute to the economic base as well as to growth.
Commercial activity in the region includes banking and other professional services, government, insurance, real estate, shopping malls, stand alone construction and tourism.
Industrial activity in the region includes chemical and pharmaceutical.
Regulated Gas Revenue decreased by $8 million primarily due to:
A decrease of $17 million due to lower non-weather related average customer usage.
The decrease was partially offset by:
An increase of $6 million due to higher sales primarily as a result of colder weather during the winter of 2011 as compared to the winter of 2010.
An increase of $2 million due to a distribution rate increase effective February 2011.
An increase of $2 million due to customer growth in 2011.
Pepco Energy Services
Pepco Energy Services’ operating revenue decreased $645 million primarily due to:
A decrease of $672 million due to lower retail supply sales volume primarily attributable to the ongoing wind-down of the retail energy supply business.
A decrease of $33 million due to lower generation and capacity revenues at the generating facilities.
The aggregate amount of these decreases was partially offset by:
An increase of $61 million due to increased energy services activities.
55
PEPCO HOLDINGS
Operating Expenses
Fuel and Purchased Energy and Other Services Cost of Sales
A detail of PHI’s consolidated Fuel and Purchased Energy and Other Services Cost of Sales is as follows:
| 2011 | 2010 | Change | ||||||||||
Power Delivery | $ | 2,490 | $ | 3,086 | $ | (596 | ) | |||||
Pepco Energy Services | 1,106 | 1,691 | (585 | ) | ||||||||
Corporate and Other | (2 | ) | (6 | ) | 4 | |||||||
|
|
|
|
|
| |||||||
Total | $ | 3,594 | $ | 4,771 | $ | (1,177 | ) | |||||
|
|
|
|
|
| |||||||
Power Delivery Business
Power Delivery’s Fuel and Purchased Energy consists of the cost of electricity and natural gas purchased by its utility subsidiaries to fulfill their respective Default Electricity Supply and Regulated Gas obligations and, as such, is recoverable from customers in accordance with the terms of public service commission orders. It also includes the cost of natural gas purchased for off-system sales. Fuel and Purchased Energy expense decreased by $596 million primarily due to:
A decrease of $300 million due to lower average electricity costs under Default Electricity Supply contracts.
A decrease of $221 million primarily due to customer migration to competitive suppliers.
A decrease of $83 million due to lower electricity sales primarily as a result of cooler weather during the spring and summer months of 2011, and warmer weather during the fall months of 2011, as compared to the corresponding periods in 2010.
A decrease of $16 million in the cost of gas purchases for on-system sales as a result of lower average gas prices, lower volumes purchased and lower withdrawals from storage.
A decrease of $11 million from the settlement of financial hedges entered into as part of DPL’s hedge program for the purchase of regulated natural gas.
The aggregate amount of these decreases was partially offset by:
An increase of $18 million in deferred electricity expense primarily due to lower Default Electricity Supply rates, which resulted in a higher rate of recovery of Default Electricity Supply costs.
An increase of $18 million in deferred natural gas expense as a result of a higher rate of recovery of natural gas supply costs.
Pepco Energy Services
Pepco Energy Services’ Fuel and Purchased Energy and Other Services Cost of Sales decreased $585 million primarily due to:
A decrease of $621 million due to lower volumes of electricity and gas purchased to serve decreased retail supply sales volume as a result of the ongoing wind-down of the retail energy supply business.
A decrease of $10 million due to lower fuel usage associated with the generating facilities.
56
PEPCO HOLDINGS
The aggregate amount of these decreases was partially offset by:
An increase of $46 million due to increased energy services activities.
Other Operation and Maintenance
A detail of PHI’s Other Operation and Maintenance expense is as follows:
| 2011 | 2010 | Change | ||||||||||
Power Delivery | $ | 884 | $ | 809 | $ | 75 | ||||||
Pepco Energy Services | 81 | 95 | (14 | ) | ||||||||
Other Non-Regulated | 6 | 4 | 2 | |||||||||
Corporate and Other | (57 | ) | (24 | ) | (33 | ) | ||||||
|
|
|
|
|
| |||||||
Total | $ | 914 | $ | 884 | $ | 30 | ||||||
|
|
|
|
|
| |||||||
Other Operation and Maintenance expense for Power Delivery increased by $75 million primarily due to:
An increase of $38 million associated with higher tree trimming and preventative maintenance costs.
An increase of $13 million primarily due to higher 2011 DCPSC rate case costs and reliability audit expenses and due to 2010 Pepco adjustments for the deferral of (i) February 2010 severe winter storm costs of $5 million and (ii) distribution rate case costs of $4 million that previously were charged to other operation and maintenance expense. The adjustments were recorded in accordance with a MPSC rate order issued in August 2010 and a DCPSC rate order issued in February 2010, allowing for the recovery of the costs.
An increase of $9 million in employee-related costs, primarily benefit expenses.
An increase of $8 million primarily due to Pepco’s emergency restoration improvement project and reliability improvement costs.
An increase of $8 million in customer support service and system support costs.
An increase of $6 million in communication costs.
An increase of $5 million in corporate cost allocations, primarily due to higher contractor and outside legal counsel fees.
An increase of $5 million related to New Jersey Societal Benefit Program costs that are deferred and recoverable.
An increase of $4 million in emergency restoration costs. The increase is primarily related to significant incremental costs incurred for repair work following Hurricane Irene in August 2011. Costs incurred for repair work were $28 million, of which $22 million was deferred as regulatory assets to reflect the probable recovery of these storm costs in certain jurisdictions, and the remaining $6 million was charged to other operation and maintenance expense. Approximately $4 million of these total incremental storm costs have been estimated for the cost of restoration services provided by outside contractors. Since the invoices for such services had not been received at December 31, 2011, actual invoices may vary from these estimates. PHI’s utility subsidiaries currently plan to seek recovery of the incremental Hurricane Irene costs in each of their various jurisdictions in pending or planned distribution rate case filings.
57
PEPCO HOLDINGS
An increase of $3 million in costs related to customer requested and mutual assistance work (primarily offset in other Electric T&D Revenue).
The aggregate amount of these increases was partially offset by:
A decrease of $17 million resulting from adjustments recorded by PHI in 2011 associated with the accounting for DPL and Pepco Default Electricity Supply. These adjustments were primarily due to the under-recognition of allowed returns on working capital, uncollectible accounts, late fees and administrative costs.
A decrease of $15 million in environmental remediation costs.
Restructuring Charge
As a result of PHI’s organizational review in the second quarter of 2010, PHI’s operating expenses include a pre-tax restructuring charge of $30 million for the year ended December 31, 2010, related to severance and health and welfare benefits to be provided to terminated employees.
Depreciation and Amortization
Depreciation and Amortization expense increased by $33 million to $426 million in 2011 from $393 million in 2010 primarily due to:
An increase of $16 million in amortization of stranded costs as the result of higher revenue due to rate increases effective October 2010 for the ACE Transition Bond Charge and Market Transition Charge Tax (partially offset in Default Electricity Supply Revenue).
An increase of $14 million due to utility plant additions.
An increase of $4 million in amortization of regulatory assets primarily associated with the EmPower Maryland surcharge that became effective in March 2010 (which is substantially offset by a corresponding increase in Regulated T&D Electric Revenue).
An increase of $1 million in amortization of software upgrades to Pepco’s Energy Management System.
The aggregate amount of these increases was partially offset by:
A decrease of $3 million primarily due to the higher 2010 recognition of asset retirement obligations associated with Pepco Energy Services generating facilities scheduled for deactivation in May 2012.
Other Taxes
Other Taxes increased by $17 million to $451 million in 2011 from $434 million in 2010. The increase was primarily due to:
An increase of $16 million primarily due to rate increases in the Montgomery County, Maryland utility taxes that are collected and passed through by Pepco (substantially offset by a corresponding increase in Regulated T&D Electric Revenue).
58
PEPCO HOLDINGS
An increase of $5 million due to an adjustment in the third quarter of 2010 to correct certain errors related to other taxes.
The aggregate amount of these increases was partially offset by:
A decrease of $5 million in the Energy Assistance Trust Fund surcharge primarily due to rate decreases effective October 2010 (substantially offset by a corresponding decrease in Regulated T&D Electric Revenue).
Gain on Early Termination of Finance Leases Held in Trust
PHI’s operating expenses include a $39 million pre-tax gain for the year ended December 31, 2011 associated with the early termination of several lease investments included in its cross-border energy lease portfolio. For a further discussion of this transaction, see Note (8), “Leasing Activities,” to the consolidated financial statements of PHI.
Deferred Electric Service Costs
Deferred Electric Service Costs, which relate only to ACE, represent (i) the over- or under-recovery of electricity costs incurred by ACE to fulfill its Default Electricity Supply obligation and (ii) the over- or under-recovery of New Jersey Societal Benefit Program costs incurred by ACE. The cost of electricity purchased is reported under Fuel and Purchased Energy and the corresponding revenue is reported under Default Electricity Supply Revenue. The cost of New Jersey Societal Benefit Programs is reported under Other Operation and Maintenance and the corresponding revenue is reported under Regulated T&D Electric Revenue.
Deferred Electric Service Costs increased by $45 million, to an expense reduction of $63 million in 2011 as compared to an expense reduction of $108 million in 2010, primarily due to higher Default Electricity Supply Revenue rates and lower electricity supply costs.
Effects of Pepco Divestiture-Related Claims
The DCPSC on May 18, 2010 issued an order addressing all of the outstanding issues relating to Pepco’s obligation to share with its District of Columbia customers the net proceeds realized by Pepco from the sale of its generation-related assets in 2000. This order disallowed certain items that Pepco had included in the costs it deducted in calculating the net proceeds of the sale. The disallowance of these costs, together with interest, increased the aggregate amount Pepco is required to distribute to customers by approximately $11 million. PHI recognized a pre-tax expense of $11 million for the year ended December 31, 2010.
Other Income (Expenses)
Other Expenses (which are net of Other Income) decreased by $246 million primarily due to the loss on extinguishment of debt that was recorded in 2010 and lower interest expense in 2011 resulting from the reduction in outstanding long term debt in 2010 with the proceeds from the Conectiv Energy sale.
59
PEPCO HOLDINGS
Loss on Extinguishment of Debt
In 2010, PHI purchased or redeemed senior notes in the aggregate principal amount of $1,194 million. In connection with these transactions, PHI recorded a pre-tax loss on extinguishment of debt of $189 million in 2010, $174 million of which was attributable to the retirement of the debt and $15 million of which related to the acceleration of losses on treasury rate lock transactions associated with the retired debt. For a further discussion of these transactions, see Note (11), “Debt,” to the consolidated financial statements of PHI.
Income Tax Expense
PHI’s consolidated effective tax rates from continuing operations for the years ended December 31, 2011 and 2010 were 36.4% and 7.3%, respectively. The increase in the effective tax rate was primarily due to the recognition of certain tax benefits in 2010 that did not recur in 2011 and PHI’s early termination of its interest in certain cross-border energy leases in 2011.
In 2010, certain PHI subsidiaries were restructured which subjected PHI to state income taxes in new jurisdictions and resulted in current state tax benefits that were recorded in 2010 and did not recur in 2011. Specifically, on April 1, 2010, as part of an ongoing effort to simplify PHI’s organizational structure, certain of PHI’s subsidiaries were converted from corporations to single member limited liability companies. In addition to increased organizational flexibility and reduced administrative costs, converting these entities to limited liability companies allows PHI to include income or losses in the former corporations in a single state income tax return, thus increasing the utilization of state income tax attributes. As a result of inclusions of income or losses in a single state return as discussed above, PHI recorded an $8 million benefit by reversing a valuation allowance on certain state net operating losses and an additional benefit of $6 million resulting from changes to certain state deferred tax benefits.
In addition, in November 2010, PHI reached final settlement with the IRS with respect to its federal tax returns for the years 1996 to 2002 for all issues except its cross-border energy lease investments. In connection with the settlement, PHI reallocated certain amounts on deposit with the IRS since 2006 among liabilities in the settlement years and subsequent years. In light of the settlement and reallocations, PHI has recalculated the estimated interest due for the tax years 1996 to 2002. The revised estimate resulted in the reversal of $15 million (after-tax) of estimated interest due to the IRS which was recorded as an income tax benefit in the fourth quarter of 2010.
In 2011, a $17 million (after-tax) income tax benefit was recorded in the first quarter when PHI reached a settlement with the IRS related to the calculation of interest due as a result of the November 2010 audit settlement. This benefit was more than offset during the second quarter of 2011, when PHI terminated early its interest in certain cross-border energy leases prior to the end of their stated term. As a result of the early terminations, PHI reversed $22 million of previously recognized federal tax benefits associated with those leases that will not be realized.
Discontinued Operations
For the year ended December 31, 2011, the $3 million loss from discontinued operations, net of income taxes, consists of an after-tax loss from operations of $1 million and after-tax net loss of $2 million from dispositions of assets and businesses.
60
PEPCO HOLDINGS
The following results of operations discussion is for the year ended December 31, 2010, compared to the year ended December 31, 2009. All amounts in the tables (except sales and customers) are in millions of dollars.
Continuing Operations
Operating Revenue
A detail of the components of PHI’s consolidated operating revenue is as follows:
| 2010 | 2009 | Change | ||||||||||
Power Delivery | $ | 5,114 | $ | 4,980 | $ | 134 | ||||||
Pepco Energy Services | 1,883 | 2,383 | (500 | ) | ||||||||
Other Non-Regulated | 54 | 51 | 3 | |||||||||
Corporate and Other | (12 | ) | (12 | ) | — | |||||||
|
|
|
|
|
| |||||||
Total Operating Revenue | $ | 7,039 | $ | 7,402 | $ | (363 | ) | |||||
|
|
|
|
|
| |||||||
Power Delivery Business
The following table categorizes Power Delivery’s operating revenue by type of revenue.
| 2010 | 2009 | Change | ||||||||||
Regulated T&D Electric Revenue | $ | 1,858 | $ | 1,653 | $ | 205 | ||||||
Default Electricity Supply Revenue | 2,951 | 2,990 | (39 | ) | ||||||||
Other Electric Revenue | 68 | 69 | (1 | ) | ||||||||
|
|
|
|
|
| |||||||
Total Electric Operating Revenue | 4,877 | 4,712 | 165 | |||||||||
|
|
|
|
|
| |||||||
Regulated Gas Revenue | 191 | 228 | (37 | ) | ||||||||
Other Gas Revenue | 46 | 40 | 6 | |||||||||
|
|
|
|
|
| |||||||
Total Gas Operating Revenue | 237 | 268 | (31 | ) | ||||||||
|
|
|
|
|
| |||||||
Total Power Delivery Operating Revenue | $ | 5,114 | $ | 4,980 | $ | 134 | ||||||
|
|
|
|
|
| |||||||
Regulated Transmission and Distribution (T&D)T&D Electric Revenue includes revenue from the distribution of electricity, including the distribution of Default Electricity Supply, by PHI’s utility subsidiaries to customers within their service territories at regulated rates. Regulated T&D Electric Revenue also includes transmission service revenue that PHI’s utility subsidiaries receive as transmission owners from the PJM Interconnection, LLC (PJM) at rates regulated by FERC.
Default Electricity Supply Revenue is the revenue received from the supply of electricity by PHI’s utility subsidiaries at regulated rates to retail customers who do not elect to purchase electricity from a competitive energy supplier. Depending on the jurisdiction, Default Electricity Supply is also known as Standard Offer ServiceSOS or Basic Generation Service (BGS).BGS. The costs related to Default Electricity Supply are included in Fuel and Purchased Energy. Default Electricity Supply Revenue also includes revenue from Transition Bond Charges that ACE receives, and pays to Atlantic City Electric TransitionACE Funding, LLC (ACE Funding), to fund the principal and interest payments on Transition Bonds issued by ACE Funding, and revenue in the form of transmission enhancement credits that PHI utility subsidiaries receive as transmission owners from PJM for approved regional transmission expansion plan costs (Transmission Enhancement Credits).
PEPCO HOLDINGS
costs.
Other Electric Revenue includes work and services performed on behalf of customers, including other utilities, which is generally not subject to price regulation. Work and services includes mutual assistance to other utilities, highway relocation, rentals of pole attachments, late payment fees and collection fees.
Regulated Gas Revenue includes the revenue DPL receives from on-system natural gas delivered sales and the transportation of natural gas for customers within its service territory at regulated rates.
61
PEPCO HOLDINGS
Other Gas Revenue consists of DPL’s off-system natural gas sales and the short-term release of interstate pipeline transportation and storage capacity not needed to serve customers. Off-system sales are made possible when low demand for natural gas by regulated customers creates excess pipeline capacity.
Regulated T&D Electric
| 2010 | 2009 | Change | ||||||||||
| Regulated T&D Electric Revenue | ||||||||||||
Residential | $ | 683 | $ | 596 | $ | 87 | ||||||
Commercial and industrial | 883 | 804 | 79 | |||||||||
Other | 292 | 253 | 39 | |||||||||
Total Regulated T&D Electric Revenue | $ | 1,858 | $ | 1,653 | $ | 205 | ||||||
Other Regulated T&D Electric Revenue consists primarily of transmission service revenue.
| 2010 | 2009 | Change | ||||||||||
Regulated T&D Electric Revenue | ||||||||||||
Residential | $ | 683 | $ | 596 | $ | 87 | ||||||
Commercial and industrial | 883 | 804 | 79 | |||||||||
Transmission and other | 292 | 253 | 39 | |||||||||
|
|
|
|
|
| |||||||
Total Regulated T&D Electric Revenue | $ | 1,858 | $ | 1,653 | $ | 205 | ||||||
|
|
|
|
|
| �� | ||||||
| 2010 | 2009 | Change | 2010 | 2009 | Change | |||||||||||||||||||
| Regulated T&D Electric Sales (Gigawatt hours(GWh)) | ||||||||||||||||||||||||
Regulated T&D Electric Sales (GWh) | ||||||||||||||||||||||||
Residential | 18,398 | 16,871 | 1,527 | 18,398 | 16,871 | 1,527 | ||||||||||||||||||
Commercial and industrial | 32,045 | 31,570 | 475 | 32,045 | 31,570 | 475 | ||||||||||||||||||
Other | 260 | 261 | (1 | ) | ||||||||||||||||||||
Transmission and other | 260 | 261 | (1 | ) | ||||||||||||||||||||
|
|
| ||||||||||||||||||||||
Total Regulated T&D Electric Sales | 50,703 | 48,702 | 2,001 | 50,703 | 48,702 | 2,001 | ||||||||||||||||||
|
|
| ||||||||||||||||||||||
| 2010 | 2009 | Change | ||||||||||||||||||||||
| Regulated T&D Electric Customers (in thousands) | ||||||||||||||||||||||||
Residential | 1,635 | 1,623 | 12 | |||||||||||||||||||||
Commercial and industrial | 198 | 198 | — | |||||||||||||||||||||
Other | 2 | 2 | — | |||||||||||||||||||||
Total Regulated T&D Electric Customers | 1,835 | 1,823 | 12 | |||||||||||||||||||||
| 2010 | 2009 | Change | ||||||||||
Regulated T&D Electric Customers (in thousands) | ||||||||||||
Residential | 1,635 | 1,623 | 12 | |||||||||
Commercial and industrial | 198 | 198 | — | |||||||||
Transmission and other | 2 | 2 | — | |||||||||
|
|
|
|
|
| |||||||
Total Regulated T&D Electric Customers | 1,835 | 1,823 | 12 | |||||||||
|
|
|
|
|
| |||||||
The Pepco, DPL and ACE service territories are located within a corridor extending from the District of Columbia to southern New Jersey. These service territories are economically diverse and include key industries that contribute to the regional economic base.
Commercial activity in the region includes banking and other professional services, government, insurance, real estate, shopping malls, casinos, stand alone construction and tourism.
Industrial activity in the region includes chemical, glass, pharmaceutical, steel manufacturing, food processing and oil refining.
PEPCO HOLDINGS
Regulated T&D Electric Revenue increased by $205 million primarily due to:
An increase of $61 million due to higher pass-through revenue (which is substantially offset by a corresponding increase in Other Taxes) primarily the result of rate increases in Montgomery County, Maryland utility taxes that are collected by Pepco on behalf of the county.
An increase of $46 million due to distribution rate increases (Pepco in the District of Columbia effective November 2009 and March 2010; DPL in Maryland effective December 2009; DPL in Delaware effective April 2010; and ACE in New Jersey effective June 2010).
62
PEPCO HOLDINGS
An increase of $37 million in transmission revenue primarily attributable to higher rates effective June 1, 2010 related to an increase in transmission plant investment.
An increase of $26 million due to higher revenue in the District of Columbia, Delaware and New Jersey service territories, primarily as a result of warmer weather during the 2010 spring and summer months of 2010 as compared to 2009. Distribution revenue in Maryland was decoupled from consumption in 2010 and 2009, and therefore, the weather in this jurisdiction does not affect the period-to-period comparison. The BSA was not implemented in the District of Columbia until November 2009, and therefore, the period-to-period comparison is affected by weather.
An increase of $15 million due to the implementation of the EmPower Maryland (demand side management program for Pepco and DPL) surcharge in March 2010 (which is substantially offset by a corresponding increase in Depreciation and Amortization).
An increase of $9 million due to higher non-weather related average customer usage.
An increase of $8 million due to Pepco customer growth of 1% in 2010, primarily in the residential class.
Default Electricity Supply
| 2010 | 2009 | Change | ||||||||||
Default Electricity Supply Revenue | ||||||||||||
Residential | $ | 2,022 | $ | 1,915 | $ | 107 | ||||||
Commercial and industrial | 733 | 915 | (182 | ) | ||||||||
Other | 196 | 160 | 36 | |||||||||
|
|
|
|
|
| |||||||
Total Default Electricity Supply Revenue | $ | 2,951 | $ | 2,990 | $ | (39 | ) | |||||
|
|
|
|
|
| |||||||
Other Default Electricity Supply Revenue consists primarily of (i) revenue from the resale by ACE in the PJM Regional Transmission Organization (RTO)RTO market of energy and capacity purchased under contracts with unaffiliated non-utility generators (NUGs),NUGs, and (ii) revenue from Transmission Enhancement Credits.
| 2010 | 2009 | Change | ||||||||||
Default Electricity Supply Sales (GWh) | ||||||||||||
Residential | 17,385 | 16,274 | 1,111 | |||||||||
Commercial and industrial | 7,034 | 8,470 | (1,436 | ) | ||||||||
Other | 93 | 101 | (8 | ) | ||||||||
|
|
|
|
|
| |||||||
Total Default Electricity Supply Sales | 24,512 | 24,845 | (333 | ) | ||||||||
|
|
|
|
|
| |||||||
PEPCO HOLDINGS
| 2010 | 2009 | Change | ||||||||||
Default Electricity Supply Customers (in thousands) | ||||||||||||
Residential | 1,525 | 1,572 | (47 | ) | ||||||||
Commercial and industrial | 148 | 159 | (11 | ) | ||||||||
Other | 1 | 2 | (1 | ) | ||||||||
|
|
|
|
|
| |||||||
Total Default Electricity Supply Customers | 1,674 | 1,733 | (59 | ) | ||||||||
|
|
|
|
|
| |||||||
Default Electricity Supply Revenue decreased by $39 million primarily due to:
A decrease of $200 million due to lower sales, primarily as a result of commercial customer migration to competitive suppliers.
63
PEPCO HOLDINGS
A decrease of $59 million as a result of lower Default Electricity Supply rates.
The aggregate amount of these decreases was partially offset by:
An increase of $144 million due to higher sales primarily as a result of warmer weather during the 2010 spring and summer months of 2010 as compared to 2009.
An increase of $40 million due to higher non-weather related average customer usage.
An increase of $29 million in wholesale energy and capacity revenues primarily due to higher market prices for the sale of electricity and capacity purchased from NUGs.
An increase of $8 million due to an increase in revenue from Transmission Enhancement Credits.transmission enhancement credits.
Total Default Electricity Supply Revenue for the 2010 period includes an increase of $8 million in unbilled revenue attributable to ACE’s BGS.BGS ($5 million increase in net income), primarily due to lower customer usage and lower Default Electricity Supply rates during the unbilled revenue period at the end of 2010 as compared to the corresponding period in 2009. Under the BGS terms approved by the New Jersey Board of Public Utilities, ACE is entitled to recover from its customers all of its costs of providing BGS. If the costs of providing BGS exceed the BGS revenue, then the excess costs are deferred in Deferred Electric Service Costs.NJBPU, ACE’s BGS unbilled revenue (which is the result of the recognition of revenue when the electricity is delivered, as opposed to when it is billed) is not included in the deferral calculation until it is billed to customers, and therefore has an impact on the results of operations in the period during which it is accrued. While the change in the amount of unbilled revenue from year to year typically is not significant, for the year ended December 31, 2010, BGS unbilled revenue increased by $8 million as compared to the year ended December 31, 2009, which resulted in a $5 million increase in PHI’s net income. The increase was primarily due to higher Default Electricity Supply rates and colder weather during the unbilled revenue period at the end of 2010 as compared to the corresponding period in 2009.
Regulated Gas
| 2010 | 2009 | Change | ||||||||||
| Regulated Gas Revenue | ||||||||||||
Residential | $ | 118 | $ | 139 | $ | (21 | ) | |||||
Commercial and industrial | 65 | 81 | (16 | ) | ||||||||
Transportation and other | 8 | 8 | — | |||||||||
Total Regulated Gas Revenue | $ | 191 | $ | 228 | $ | (37 | ) | |||||
PEPCO HOLDINGS
| 2010 | 2009 | Change | ||||||||||||||||||||||
Regulated Gas Revenue | ||||||||||||||||||||||||
Residential | $ | 118 | $ | 139 | $ | (21 | ) | |||||||||||||||||
Commercial and industrial | 65 | 81 | (16 | ) | ||||||||||||||||||||
Transportation and other | 8 | 8 | — | |||||||||||||||||||||
|
|
| ||||||||||||||||||||||
Total Regulated Gas Revenue | $ | 191 | $ | 228 | $ | (37 | ) | |||||||||||||||||
|
|
| ||||||||||||||||||||||
| 2010 | 2009 | Change | 2010 | 2009 | Change | |||||||||||||||||||
| Regulated Gas Sales (billion cubic feet) | ||||||||||||||||||||||||
Residential | 8 | 8 | — | 8 | 8 | — | ||||||||||||||||||
Commercial and industrial | 5 | 5 | — | 5 | 5 | — | ||||||||||||||||||
Transportation and other | 6 | 6 | — | 6 | 6 | — | ||||||||||||||||||
|
|
| ||||||||||||||||||||||
Total Regulated Gas Sales | 19 | 19 | — | 19 | 19 | — | ||||||||||||||||||
|
|
| ||||||||||||||||||||||
| 2010 | 2009 | Change | 2010 | 2009 | Change | |||||||||||||||||||
| Regulated Gas Customers (in thousands) | ||||||||||||||||||||||||
Residential | 114 | 113 | 1 | 114 | 113 | 1 | ||||||||||||||||||
Commercial and industrial | 9 | 10 | (1 | ) | 9 | 10 | (1 | ) | ||||||||||||||||
Transportation and other | — | — | — | — | — | — | ||||||||||||||||||
|
|
| ||||||||||||||||||||||
Total Regulated Gas Customers | 123 | 123 | — | 123 | 123 | — | ||||||||||||||||||
|
|
| ||||||||||||||||||||||
DPL’s natural gas service territory is located in New Castle County, Delaware. Several key industries contribute to the economic base as well as to growth.
Commercial activity in the region includes banking and other professional services, government, insurance, real estate, shopping malls, stand alone construction and tourism.
64
PEPCO HOLDINGS
Industrial activity in the region includes chemical and pharmaceutical.
Regulated Gas Revenue decreased by $37 million primarily due to:
A decrease of $22 million due to Gas Cost Rate (GCR) decreases effective March 2009 and November 2009.
A decrease of $14 million due to lower sales as a result of milder weather during the 2010 winter months of 2010 as compared to 2009.
Other Gas Revenue
Other Gas Revenue increased by $6 million primarily due to higher revenue from off-system sales resulting from:
An increase of $4 million due to higher demand from electric generators and natural gas marketers.
An increase of $2 million due to higher market prices.
Pepco Energy Services
Pepco Energy Services’ operating revenue decreased $500 million primarily due to:
A decrease of $651 million due to lower retail electricity sales volume due to the ongoing wind downwind-down of the retail energy supply business.
The decrease is partially offset by:
An increase of $100 million due to higher electricity generation output as the result of completed transmission construction projects and warmer than normal weather, and lower Reliability Pricing ModelRPM charges associated with the generating facilities.
PEPCO HOLDINGS
An increase of $38 million due to increased high voltage and energy services construction activities.
An increase of $13 million due to a higher retail natural gas supply load as the result of 2009 customer acquisitions, partially offset by lower retail natural gas prices.
Operating Expenses
Fuel and Purchased Energy and Other Services Cost of Sales
A detail of PHI’s consolidated Fuel and Purchased Energy and Other Services Cost of Sales is as follows:
| 2010 | 2009 | Change | ||||||||||
Power Delivery | $ | 3,086 | $ | 3,243 | $ | (157 | ) | |||||
Pepco Energy Services | 1,691 | 2,179 | (488 | ) | ||||||||
Corporate and Other | (6 | ) | (7 | ) | 1 | |||||||
|
|
|
|
|
| |||||||
Total | $ | 4,771 | $ | 5,415 | $ | (644 | ) | |||||
|
|
|
|
|
| |||||||
65
PEPCO HOLDINGS
Power Delivery Business
Power Delivery’s Fuel and Purchased Energy consists of the cost of electricity and natural gas purchased by its utility subsidiaries to fulfill their respective Default Electricity Supply and Regulated Gas obligations and, as such, is recoverable from customers in accordance with the terms of public service commission orders. It also includes the cost of natural gas purchased for off-system sales. Fuel and Purchased Energy expense decreased by $157 million primarily due to:
A decrease of $197 million primarily due to commercial customer migration to competitive suppliers.
A decrease of $59 million in deferred electricity expense primarily due to lower Default Electricity Supply Revenue rates, which resulted in a lower rate of recovery of Default Electricity Supply costs.
A decrease of $17 million in deferred natural gas expense as a result of a lower rate of recovery of natural gas supply costs.
A decrease of $14 million due to lower average electricity costs under Default Electricity Supply contracts.
A decrease of $12 million from the settlement of financial hedges entered into as part of DPL’s hedge program for the purchase of regulated natural gas.
The aggregate amount of these decreases was partially offset by:
An increase of $143 million due to higher electricity sales primarily as a result of warmer weather during the 2010 spring and summer months of 2010 as compared to 2009.
Pepco Energy Services
Pepco Energy Services’ Fuel and Purchased Energy and Other Services Cost of Sales decreased $488 million primarily due to:
A decrease of $571 million due to lower volumes of electricity purchased to serve decreased retail customer load as a result of the ongoing wind downwind-down of the retail energy supply business.
PEPCO HOLDINGS
The decrease is partially offset by:
An increase of $42 million due to increased high voltage and energy services construction activities.
An increase of $27 million due to higher fuel usage associated with the generating facilities.
An increase of $15 million due to a higher retail natural gas supply load as the result of 2009 customer acquisitions, partially offset by lower wholesale natural gas prices.
Other Operation and Maintenance
A detail of PHI’s Other operationOperation and maintenanceMaintenance expense is as follows:
| 2010 | 2009 | Change | ||||||||||
Power Delivery | $ | 809 | $ | 752 | $ | 57 | ||||||
Pepco Energy Services | 95 | 90 | 5 | |||||||||
Other Non-Regulated | 4 | 2 | 2 | |||||||||
Corporate and Other | (24 | ) | (25 | ) | 1 | |||||||
|
|
|
|
|
| |||||||
Total | $ | 884 | $ | 819 | $ | 65 | ||||||
|
|
|
|
|
| |||||||
66
PEPCO HOLDINGS
Other operationOperation and maintenanceMaintenance expense for Power Delivery increased by $57 million; however, excluding an increase of $11 million primarily related to bad debt and administrative expenses that are deferred and recoverable in Default Electricity Supply Revenue, Other Operation and Maintenance expense increased by $46 million. The $46 million increase was primarily due to:
An increase of $33 million in emergency restoration costs primarily due to severe storms in February, July and August 2010.
An increase of $17 million in estimated environmental remediation costs due to (i) the establishment of a reserve in the amount of $13 million relating to a possible discharge of polychlorinated biphenyls (PCBs) at the Benning Road transmission and distribution facility owned by Pepco, and (ii) a $4 million accrual in 2010 for future costs relating to a 1999 oil release at the Indian River generating facility then owned by DPL, as further discussed under the headings “Benning Road Site” and “Indian River Oil Release,” respectively, in Note (17), “Commitments and Contingencies,” to the consolidated financial statements of PHI set forth in Part II, Item 8 of this Form 10-K.costs.
An increase of $14 million primarily due to higher tree trimming preventative and correctivepreventative maintenance costs.
An increase of $5 million primarily due to system support and customer support service costs.
The aggregate amount of these increases was partially offset by:
A decrease of $17 million in employee-related costs, primarily due to lower pension and other postretirement benefit (OPEB) expenses.
A decrease of $9 million primarily due to Pepco deferral of (i) February 2010 severe winter storm costs, and (ii) distribution rate case costs, which in each case originally had been charged to Other Operation and Maintenance expense. These deferrals were recorded in accordance with a MPSC rate order issued in August 2010 and a DCPSC rate order issued in February 2010, respectively, authorizing the establishment of regulatory assets for the recovery of these costs.
PEPCO HOLDINGS
Other Operation and Maintenance expense for Pepco Energy Services increased $5 million, primarily due to increases of $8 million in power plant operating costs and $3 million due to the repair cost of a distribution system pipe leak; partially offset by a decrease of $5 million in bad debt expense.
Restructuring Charge
With the ongoing wind downAs a result of the retail energy supply business of Pepco Energy Services and the disposition of Conectiv Energy, PHI is repositioning itself as a regulated transmission and distribution company. In connection with this repositioning, PHI commenced a comprehensivePHI’s organizational review in the second quarter of 2010, to identify opportunities to streamline the organization and to achieve certain reductions in corporate overhead costs that are allocated to itsPHI’s operating segments. This review has resulted in the adoption of a restructuring plan. PHI began implementing the plan during the third quarter, identifying 164 employee positions that were eliminated during the fourth quarter of 2010. The plan also focuses on identifying additional cost reduction opportunities through process improvements and operational efficiencies. PHI currently estimates that the implementation of the plan will result in an annual reduction of approximately $28 million in corporate overhead costs.
In connection with the plan, PHI recordedexpenses include a pre-tax restructuring charge of $30 million for the year ended December 31, 2010, related to severance pension, and health and welfare benefits to be provided to terminated employees.
Depreciation and Amortization
Depreciation and Amortization expense increased by $44 million to $393 million in 2010 from $349 million in 2009 primarily due to:
An increase of $12 million in amortization of regulatory assets primarily due to the EmPower Maryland surcharge that became effective in March 2010 (which is substantially offset by a corresponding increase in Regulated T&D Electric Revenue).
An increase of $10 million due to utility plant additions.
67
PEPCO HOLDINGS
An increase of $8 million due to higher amortization by ACE of stranded costs, primarily the result of higher revenue due to increases in sales (partially offset in Default Electricity Supply Revenue).
An increase of $4 million primarily due to the recognition of asset retirement obligations associated with Pepco Energy Services generating facilities scheduled for deactivation in May 2012.
An increase of $2 million in the amortization of Demand Side Managementdemand-side management program deferred expenses.
Other Taxes
Other Taxes increased by $66 million to $434 million in 2010 from $368 million in 2009. The increase was primarily due to increased pass-throughs experienced by Power Delivery (which are substantially offset by a corresponding increase in Regulated T&D Electric Revenue) primarily resulting from utility tax rate increases imposed by Montgomery County, Maryland.
Deferred Electric Service Costs
Deferred Electric Service Costs, which relate only to ACE, represent (i) the overover- or under recoveryunder-recovery of electricity costs incurred by ACE to fulfill its Default Electricity Supply obligation and (ii) the overover- or under recoveryunder-recovery of New Jersey Societal Benefit Program costs incurred by ACE. The cost of electricity
PEPCO HOLDINGS
purchased is reported under Fuel and Purchased Energy and the corresponding revenue is reported under Default Electricity Supply Revenue. The cost of New Jersey Societal Benefit Programs is reported under Other Operation and Maintenance and the corresponding revenue is reported under Regulated T&D Electric Revenue.
Deferred Electric Service Costs increased by $53 million, to an expense reduction of $108 million in 2010 as compared to an expense reduction of $161 million in 2009, primarily due to an increase in deferred electricity expense as a result of lower electricity supply costs and higher Default Electricity Supply Revenue rates.
EffectEffects of Pepco Divestiture-Related Claims
District of Columbia Divestiture Case
The DCPSC on May 18, 2010 issued an order addressing all of the outstanding issues relating to Pepco’s obligation to share with its District of Columbia customers the net proceeds realized by Pepco from the sale of its generation-related assets in 2000. This order disallowed certain items that Pepco had included in the costs it deducted in calculating the net proceeds of the sale. The disallowance of these costs, together with interest, increased the aggregate amount Pepco iswas required to distribute to customers by approximately $11 million. While Pepco has filed an appeal of the DCPSC’s decision with the District of Columbia Court of Appeals, in view of the DCPSC order, PHI recognized a pre-tax expense of $11 million for the year ended December 31, 2010. The appeal is still pending.
Settlement of Mirant Bankruptcy Claims
In March 2009, the DCPSC approved an allocation between Pepco and its District of Columbia customers of the District of Columbia portion of the Mirant bankruptcy settlement proceeds remaining after the transfer of the Panda PPA.power purchase agreement between Pepco and Panda-Brandywine, L.P. As a result, Pepco recorded a pre-tax gain of $14 million in the first quarter of 2009 reflecting the District of Columbia proceeds retained by Pepco. In July 2009, the MPSC approved an allocation between Pepco and its Maryland customers of the Maryland portion of the Mirant bankruptcy settlement proceeds. As a result, Pepco recorded a pre-tax gain of $26 million in the third quarter of 2009 reflecting the Maryland proceeds retained by Pepco.
68
PEPCO HOLDINGS
Other Income (Expenses)
Other Expenses (which are net of Other Income) increased by $153 million primarily due to a $189 million loss on extinguishment of debt that was recorded in 2010 as further discussed below, partially offset by lower interest expense of $34 million.
Loss on Extinguishment of Debt
In 2010, PHI purchased or redeemed senior notes in the aggregate principal amount of $1,194 million. In connection with these transactions, PHI recorded a pre-tax loss on extinguishment of debt of $189 million in 2010, $174 million of which was attributable to the retirement of the debt and $15 million of which related to the acceleration of losses on treasury rate lock transactions associated with debt that was retired. For a further discussion of these transactions, see Note (11), “Debt,” to the consolidated financial statements of PHI, set forth in Part II, Item 8 of this Form 10-K.
PEPCO HOLDINGS
PHI.
Income Tax Expense
PHI’s consolidated effective tax rates from continuing operations for the years ended December 31, 2010 and 2009 were 7.3% and 31.8%, respectively. The reduction in the effective tax rate is primarily due to two factors. The first is the recording of current state tax benefits resulting from the restructuring of certain PHI subsidiaries which subjected PHI to state income taxes in new jurisdictions. On April 1, 2010, as part of an ongoing effort to simplify PHI’s organizational structure, certain of PHI’s subsidiaries were converted from corporations to single member limited liability companies. In addition to increased organizational flexibility and reduced administrative costs, converting these entities to limited liability companies allows PHI to include income or losses in the former corporations in a single state income tax return, thus increasing the utilization of state income tax attributes. As a result of inclusions of income or losses in a single state return as discussed above, PHI recorded an $8 million benefit by reversing a valuation allowance on certain state net operating losses and an additional benefit of $6 million resulting from changes to certain state deferred tax benefits.
The second factor is the reversal of accrued interest on uncertain and effectively settled tax positions resulting from final settlement with the Internal Revenue Service (IRS)IRS of certain open tax years. In November 2010, PHI reached final settlement with the IRS with respect to its federal tax returns for the years 1996 to 2002 for all issues except its cross-border energy lease investments. In connection with the settlement, PHI reallocated certain amounts on deposit with the IRS since 2006 among liabilities in the settlement years and subsequent years. In light of the settlement and reallocations, PHI has recalculated the estimated interest due for the tax years 1996 to 2002. The revised estimate has resulted in the reversal of $15 million of previously accrued estimated interest due to the IRS. This reversal has been recorded as an income tax benefit in 2010, and is subject to adjustmentPHI recorded an additional tax benefit of $17 million (after-tax) in the second quarter of 2011 when the IRS finalizesfinalized its calculation of the amount of interest due.
Discontinued Operations
For the year ended December 31, 2010, the $107 million loss from discontinued operations, net of income taxes, consists of after-tax income from operations of $6 million and after-tax net losses of $113 million from dispositions of assets and businesses.
PEPCO HOLDINGS
The following results of operations discussion is for the year ended December 31, 2009, compared to the year ended December 31, 2008. All amounts in the tables (except sales and customers) are in millions of dollars.
Continuing Operations
Operating Revenue
A detail of the components of PHI’s consolidated operating revenue is as follows:
| 2009 | 2008 | Change | ||||||||||
Power Delivery | $ | 4,980 | $ | 5,488 | $ | (508 | ) | |||||
Pepco Energy Services | 2,383 | 2,648 | (265 | ) | ||||||||
Other Non-Regulated | 51 | (60 | ) | 111 | ||||||||
Corporate and Other | (12 | ) | (17 | ) | 5 | |||||||
Total Operating Revenue | $ | 7,402 | $ | 8,059 | $ | (657 | ) | |||||
Power Delivery Business
The following table categorizes Power Delivery’s operating revenue by type of revenue.
| 2009 | 2008 | Change | ||||||||||
Regulated T&D Electric Revenue | $ | 1,653 | $ | 1,690 | $ | (37 | ) | |||||
Default Electricity Supply Revenue | 2,990 | 3,413 | (423 | ) | ||||||||
Other Electric Revenue | 69 | 67 | 2 | |||||||||
Total Electric Operating Revenue | 4,712 | 5,170 | (458 | ) | ||||||||
Regulated Gas Revenue | 228 | 204 | 24 | |||||||||
Other Gas Revenue | 40 | 114 | (74 | ) | ||||||||
Total Gas Operating Revenue | 268 | 318 | (50 | ) | ||||||||
Total Power Delivery Operating Revenue | $ | 4,980 | $ | 5,488 | $ | (508 | ) | |||||
Regulated Transmission and Distribution (T&D) Electric Revenue includes revenue from the distribution of electricity, including the distribution of Default Electricity Supply, by PHI’s utility subsidiaries to customers within their service territories at regulated rates. Regulated T&D Electric Revenue also includes transmission service revenue that PHI’s utility subsidiaries receive as transmission owners from the PJM Interconnection, LLC (PJM) at rates regulated by FERC.
Default Electricity Supply Revenue is the revenue received from the supply of electricity by PHI’s utility subsidiaries at regulated rates to retail customers who do not elect to purchase electricity from a competitive energy supplier. Depending on the jurisdiction, Default Electricity Supply is also known as Standard Offer Service or Basic Generation Service (BGS). The costs related to Default Electricity Supply are included in Fuel and Purchased Energy. Default Electricity Supply Revenue also includes revenue from Transition Bond Charges that ACE receives, and pays to Atlantic City Electric Transition Funding LLC (ACE Funding), to fund the principal and interest payments on Transition Bonds issued by ACE Funding and revenue in the form of transmission enhancement credits that PHI utility subsidiaries receive as transmission owners from PJM for approved regional transmission expansion plan costs (Transmission Enhancement Credits).
Other Electric Revenue includes work and services performed on behalf of customers, including other utilities, which is generally not subject to price regulation. Work and services includes mutual assistance to other utilities, highway relocation, rentals of pole attachments, late payment fees, and collection fees.
PEPCO HOLDINGS
Regulated Gas Revenue includes the revenue DPL receives from on-system natural gas delivered sales and the transportation of natural gas for customers within its service territory at regulated rates.
Other Gas Revenue consists of DPL’s off-system natural gas sales and the short-term release of interstate pipeline transportation and storage capacity not needed to serve customers. Off-system sales are made possible when low demand for natural gas by regulated customers creates excess pipeline capacity.
Regulated T&D Electric
| 2009 | 2008 | Change | ||||||||||
| Regulated T&D Electric Revenue | ||||||||||||
Residential | $ | 596 | $ | 593 | $ | 3 | ||||||
Commercial and industrial | 804 | 786 | 18 | |||||||||
Other | 253 | 311 | (58 | ) | ||||||||
Total Regulated T&D Electric Revenue | $ | 1,653 | $ | 1,690 | $ | (37 | ) | |||||
Other Regulated T&D Electric Revenue consists primarily of: (i) transmission service revenue and (ii) revenue from the resale by Pepco in the PJM RTO market of energy and capacity purchased under the Panda PPA prior to the transfer of the Panda PPA to an unaffiliated third party in September 2008.
| 2009 | 2008 | Change | ||||||||||
| Regulated T&D Electric Sales (GWh) | ||||||||||||
Residential | 16,871 | 17,186 | (315 | ) | ||||||||
Commercial and industrial | 31,570 | 32,520 | (950 | ) | ||||||||
Other | 261 | 261 | — | |||||||||
| �� | ||||||||||||
Total Regulated T&D Electric Sales | 48,702 | 49,967 | (1,265 | ) | ||||||||
| 2009 | 2008 | Change | ||||||||||
| Regulated T&D Electric Customers (in thousands) | ||||||||||||
Residential | 1,623 | 1,612 | 11 | |||||||||
Commercial and industrial | 198 | 198 | — | |||||||||
Other | 2 | 2 | — | |||||||||
Total Regulated T&D Electric Customers | 1,823 | 1,812 | 11 | |||||||||
Regulated T&D Electric Revenue decreased by $37 million primarily due to:
A decrease of $53 million in Other Regulated T&D Electric Revenue (which is matched by a corresponding decrease in Fuel and Purchased Energy) due to the absence of revenues from the resale of energy and capacity purchased under the Panda PPA after September 2008.
A decrease of $12 million due to lower non-weather related customer usage.
The aggregate amount of these decreases was partially offset by:
An increase of $16 million due to a distribution rate increase (which is substantially offset by a corresponding increase in Deferred Electric Service Costs) as part of a higher New Jersey Societal Benefit Charge that became effective in June 2008.
PEPCO HOLDINGS
An increase of $15 million due to higher pass-through revenue (which is substantially offset by a corresponding increase in Other Taxes) primarily the result of increases in utility taxes that are collected on behalf of taxing jurisdictions.
Default Electricity Supply
| 2009 | 2008 | Change | ||||||||||
| Default Electricity Supply Revenue | ||||||||||||
Residential | $ | 1,915 | $ | 1,882 | $ | 33 | ||||||
Commercial and industrial | 915 | 1,200 | (285 | ) | ||||||||
Other | 160 | 331 | (171 | ) | ||||||||
Total Default Electricity Supply Revenue | $ | 2,990 | $ | 3,413 | $ | (423 | ) | |||||
Other Default Electricity Supply Revenue consists primarily of revenue from the resale by ACE in the PJM RTO market of energy and capacity purchased under contracts with unaffiliated NUGs.
| 2009 | 2008 | Change | ||||||||||
| Default Electricity Supply Sales (GWh) | ||||||||||||
Residential | 16,274 | 16,621 | (347 | ) | ||||||||
Commercial and industrial | 8,470 | 10,204 | (1,734 | ) | ||||||||
Other | 101 | 101 | — | |||||||||
Total Default Electricity Supply Sales | 24,845 | 26,926 | (2,081 | ) | ||||||||
| 2009 | 2008 | Change | ||||||||||
| Default Electricity Supply Customers (in thousands) | ||||||||||||
Residential | 1,572 | 1,572 | — | |||||||||
Commercial and industrial | 159 | 167 | (8 | ) | ||||||||
Other | 2 | 2 | — | |||||||||
Total Default Electricity Supply Customers | 1,733 | 1,741 | (8 | ) | ||||||||
Default Electricity Supply Revenue decreased by $423 million primarily due to:
A decrease of $175 million in wholesale energy revenues due to lower market prices for the sale of electricity purchased from NUGs.
A decrease of $167 million due to lower sales, primarily the result of commercial customer migration to competitive suppliers.
A decrease of $49 million due to lower non-weather related customer usage.
A decrease of $33 million due to lower sales as a result of milder weather primarily during the 2009 summer months as compared to 2008.
PEPCO HOLDINGS
The decrease in total Default Electricity Supply Revenue includes a decrease of $8 million in unbilled revenue attributable to ACE’s BGS. Under the BGS terms approved by the New Jersey Board of Public Utilities (NJBPU), ACE is entitled to recover from its customers all of its costs of providing BGS. If the costs of providing BGS exceed the BGS revenue, then the excess costs are deferred in Deferred Electric Service Costs. ACE’s BGS unbilled revenue is not included in the deferral calculation, and therefore has an impact on the results of operations in the period during which it is accrued. While the change in the amount of unbilled revenue from year to year typically is not significant, for the year ended December 31, 2009, BGS unbilled revenue decreased by $8 million as compared to the year ended December 31, 2008, which resulted in a $5 million decrease in PHI’s net income. The decrease was due to increased customer migration and lower customer usage during the unbilled revenue period at the end of 2009 as compared to the corresponding period in 2008.
Regulated Gas
| 2009 | 2008 | Change | ||||||||||
| Regulated Gas Revenue | ||||||||||||
Residential | $ | 139 | $ | 121 | $ | 18 | ||||||
Commercial and industrial | 81 | 75 | 6 | |||||||||
Transportation and other | 8 | 8 | — | |||||||||
Total Regulated Gas Revenue | $ | 228 | $ | 204 | $ | 24 | ||||||
| 2009 | 2008 | Change | ||||||||||
| Regulated Gas Sales (billion cubic feet) | ||||||||||||
Residential | 8 | 7 | 1 | |||||||||
Commercial and industrial | 5 | 6 | (1 | ) | ||||||||
Transportation and other | 6 | 7 | (1 | ) | ||||||||
Total Regulated Gas Sales | 19 | 20 | (1 | ) | ||||||||
| 2009 | 2008 | Change | ||||||||||
| Regulated Gas Customers (in thousands) | ||||||||||||
Residential | 113 | 113 | — | |||||||||
Commercial and industrial | 10 | 9 | 1 | |||||||||
Transportation and other | — | — | — | |||||||||
Total Regulated Gas Customers | 123 | 122 | 1 | |||||||||
Regulated Gas Revenue increased by $24 million primarily due to:
An increase of $15 million due to the Gas Cost Rate increase effective November 2008, partially offset by rate decreases in March 2009 and November 2009.
An increase of $14 million (which is offset by a corresponding increase in Fuel and Purchased Energy) associated with the recognition of the unbilled portion of Gas Cost Rate revenue in 2009 which was not previously recognized.
The aggregate amount of these increases was partially offset by:
A decrease of $5 million due to lower non-weather related customer usage.
PEPCO HOLDINGS
A decrease of $4 million due to lower sales as result of warmer weather during the fourth quarter of 2009 as compared to the corresponding period in 2008.
Other Gas Revenue
Other Gas Revenue decreased by $74 million primarily due to lower revenue from off-system sales resulting from:
A decrease of $67 million due to lower market prices.
A decrease of $9 million due to lower demand from electric generators and natural gas marketers.
Pepco Energy Services
Pepco Energy Services’ operating revenue decreased $265 million primarily due to:
A decrease of $170 million due to lower volumes of retail electric load served as a result of the expiration of existing retail contracts.
A decrease of $72 million due to lower construction activities as a result of reduced high voltage construction and maintenance projects.
A decrease of $20 million due to lower retail natural gas prices partially offset by higher customer load as a result of customer acquisitions.
A decrease of $3 million due to lower generation output as a result of milder weather and lower overall load levels for the PJM RTO control area.
Other Non-Regulated
Other Non-Regulated revenues increased by $111 million from a $60 million loss in 2008 to a $51 million gain in 2009. This was primarily the result of a non-cash charge of $124 million that was recorded in the quarter ended June 30, 2008 as a result of revised assumptions regarding the estimated timing of tax benefits from cross-border energy lease investments of Potomac Capital Investment Corporation and its subsidiaries (PCI). In accordance with Financial Accounting Standards Board (FASB) guidance on leases (Accounting Standards Codification (ASC) 840), the charge was recorded as a reduction to lease revenue from these transactions, which is included in Other Non-Regulated revenues.
Operating Expenses
Fuel and Purchased Energy and Other Services Cost of Sales
A detail of PHI’s consolidated Fuel and Purchased Energy and Other Services Cost of Sales is as follows:
| 2009 | 2008 | Change | ||||||||||
Power Delivery | $ | 3,243 | $ | 3,578 | $ | (335 | ) | |||||
Pepco Energy Services | 2,179 | 2,489 | (310 | ) | ||||||||
Corporate and Other | (7 | ) | (13 | ) | 6 | |||||||
Total | $ | 5,415 | $ | 6,054 | $ | (639 | ) | |||||
PEPCO HOLDINGS
Power Delivery Business
Power Delivery’s Fuel and Purchased Energy (other than expense associated with Regulated Gas Revenue and Other Gas revenue) consists of the cost of electricity purchased by its utility subsidiaries to fulfill their respective Default Electricity Supply obligations and, as such, is recoverable from customers in accordance with the terms of public service commission orders. Fuel and Purchased Energy expense decreased by $335 million primarily due to:
A decrease of $236 million primarily due to commercial customer migration to competitive suppliers.
A decrease of $73 million in the cost of natural gas purchases for off-systems sales, the result of lower average natural gas prices and volumes purchased.
A decrease of $53 million (which is matched by a corresponding decrease in Other Regulated T&D Electric Revenue) due to the transfer of the Panda PPA.
A decrease of $33 million due to lower electricity sales as a result of milder weather primarily during the 2009 summer months as compared to 2008.
A decrease of $30 million in the cost of natural gas purchases for system sales, the result of lower average natural gas prices and volumes purchased.
A decrease of $23 million due to lower average electricity costs under Default Electricity Supply contracts.
The aggregate amount of these decreases was partially offset by:
An increase of $63 million due to a higher rate of recovery of electricity supply costs resulting in a decrease in the Default Electricity Supply deferral balance.
An increase of $43 million from the settlement of financial hedges entered into as part of DPL’s hedge program for regulated natural gas.
An increase of $12 million due to a higher rate of recovery of natural gas supply costs primarily as a result of recognizing the unbilled portion of Gas Cost Rate revenue in 2009, as discussed under Regulated Gas Revenue.
Pepco Energy Services
Pepco Energy Services’ Fuel and Purchased Energy and Other Services Cost of Sales decreased $310 million primarily due to:
A decrease of $212 million due to lower volumes of electricity purchased to serve decreased retail customer load as the result of the continuing expiration of existing retail contracts.
A decrease of $45 million due to lower wholesale natural gas prices partially offset by higher retail customer load as the result of customer acquisitions.
A decrease of $42 million due to lower construction activities as a result of reduced high voltage construction and maintenance projects.
A decrease of $11 million due to lower generation output due to milder weather and lower overall load levels for the PJM control area.
PEPCO HOLDINGS
Other Operation and Maintenance
A detail of PHI’s other operation and maintenance expense is as follows:
| 2009 | 2008 | Change | ||||||||||
Power Delivery | $ | 752 | $ | 702 | $ | 50 | ||||||
Pepco Energy Services | 90 | 87 | 3 | |||||||||
Other Non-Regulated | 2 | 2 | — | |||||||||
Corporate and Other | (25 | ) | (16 | ) | (9 | ) | ||||||
Total | $ | 819 | $ | 775 | $ | 44 | ||||||
Other Operation and Maintenance expense for Power Delivery increased by $50 million; however, excluding a decrease of $5 million primarily related to administrative expenses that are deferred and recoverable in Default Electricity Supply Revenue, Other Operation and Maintenance expense increased by $55 million. The $55 million increase was primarily due to:
An increase of $39 million in employee-related costs, primarily due to higher pension and other postretirement benefit expenses.
An increase of $13 million primarily due to higher preventative and corrective maintenance, and emergency restoration costs.
An increase of $4 million in regulatory expenses primarily incurred in connection with the District of Columbia distribution rate case.
An increase of $3 million due to higher non-deferrable bad debt expenses.
During 2008, PHI recorded adjustments, on a consolidated basis, to correct errors in Other Operation and Maintenance expenses for prior periods dating back to February 2005 during which (i) customer late payment fees were incorrectly recognized and (ii) stock-based compensation expense related to certain restricted stock awards granted under the Long-Term Incentive Plan was understated. The late payment fees and stock-based compensation adjustments resulted in increases in Other Operation and Maintenance expenses for the year ended December 31, 2008 of $6 million and $9 million, respectively. These adjustments were not considered material either individually or in the aggregate.
Depreciation and Amortization
Depreciation and Amortization expense increased by $11 million to $349 million in 2009 from $338 million in 2008 primarily due to an increase of $14 million due to utility plant additions and $4 million due to the accelerated depreciation of Pepco Energy Services generating facilities that will be decommissioned in 2012, partially offset by a decrease of $7 million due to lower amortization by ACE of stranded costs primarily as the result of lower revenue due to decreases in the Market Transition Charge Tax rate in October 2009 and October 2008 (partially offset in Default Electricity Supply Revenue).
Other Taxes
Other Taxes increased by $13 million to $368 million in 2009 from $355 million in 2008. The increase was primarily due to increased pass-throughs experienced by Power Delivery (which are substantially offset by a corresponding increase in Regulated T&D Electric Revenue) resulting from rate increases in utility taxes imposed by the taxing jurisdictions.
PEPCO HOLDINGS
Deferred Electric Service Costs
Deferred Electric Service Costs, which relate only to ACE, decreased by $152 million, to an expense reduction of $161 million in 2009 as compared to an expense reduction of $9 million in 2008. The decrease was primarily due to:
A decrease of $186 million due to a lower rate of recovery of costs from the resale in the PJM RTO market of energy and capacity purchased under the NUG contracts.
The decrease was partially offset by:
An increase of $15 million due to a higher rate of recovery through customer rates of deferred energy supply costs for Default Electricity Supply (included in Default Electricity Supply Revenue).
An increase of $13 million due to a higher rate of recovery through customer rates of New Jersey Societal Benefit program costs (included in Regulated T&D Electric Revenue).
An increase of $5 million due to a higher rate of recovery through customer rates of deferred transmission costs for Default Electricity Supply (included in Default Electricity Supply Revenue).
Effect of Settlement of Mirant Bankruptcy Claims
In September 2008, Pepco transferred the Panda PPA to an unaffiliated third party. In March 2009, the DCPSC approved an allocation between Pepco and its District of Columbia customers of the District of Columbia portion of the Mirant bankruptcy settlement proceeds remaining after the transfer of the Panda PPA. As a result, Pepco recorded a pre-tax gain of $14 million reflecting the District of Columbia proceeds retained by Pepco. In July 2009, the MPSC approved an allocation between Pepco and its Maryland customers of the Maryland portion of the Mirant bankruptcy settlement proceeds remaining after the transfer of the Panda PPA. As a result, Pepco recorded a pre-tax gain of $26 million reflecting the Maryland proceeds retained by Pepco.
Gain on Sale of Assets
Gain on Sale of Assets decreased by $3 million in 2009 due to a $3 million gain on the sale of the Virginia retail electric distribution and wholesale transmission assets in January 2008.
Other Income (Expenses)
Other Expenses (which are net of Other Income) increased by $45 million to a net expense of $321 million in 2009 from a net expense of $276 million in 2008, primarily due to an increase in interest expense. The increase in interest expense was due to a $33 million increase in interest expense on long-term debt as the result of a higher amount of outstanding debt, and an increase of $13 million in interest expense on short-term debt due primarily to the Pepco Energy Services credit intermediation agreement, as described below under the heading “Capital Resources and Liquidity - Collateral Requirements of Pepco Energy Services.”
Income Tax Expense
PHI’s consolidated effective tax rates from continuing operations for the years ended December 31, 2009 and 2008 were 31.8% and 33.0%, respectively. The decrease in the rate primarily resulted from a refund of $6 million (after-tax) of state income taxes and the establishment of a state tax benefit carryforward of $7 million (after-tax) related to a change in the tax reporting for the disposition of certain assets in prior years, and from the 2008 charge related to the cross-border energy lease investments described in Note (17), “Commitments and Contingencies,” and corresponding state tax benefits related to the charge.
PEPCO HOLDINGS
Discontinued Operations
Income from Discontinued Operations, net of income taxes, decreased by $105 million to $12 million in 2009 from $117 million in 2008. The decrease was primarily due to lower Conectiv Energy earnings as the result of (i) a $79 million decrease resulting from significantly reduced spark (natural gas) spreads, dark (coal) spreads and lower run-time, (ii) a $63 million decrease primarily related to economic fuel hedges that were favorable in 2008 due to rising fuel prices and unfavorable in 2009 due to falling fuel prices; partially offset by (iii) a $39 million increase due to higher capacity margins caused primarily by higher Reliability Pricing Model clearing prices.
Capital Resources and Liquidity
This section discusses Pepco Holdings’PHI’s working capital, cash flow activity, capital requirements and other uses and sources of capital.
69
PEPCO HOLDINGS
Working Capital
At December 31, 2010, Pepco Holdings’2011, PHI’s current assets on a consolidated basis totaled $1.8$1.4 billion and its current liabilities totaled $1.8 billion.$1.9 billion, resulting in a working capital deficit of $422 million. PHI expects the working capital deficit at December 31, 20102011 to be funded during 20112012 in part through cash flow from operations. Additional working capital will be provided by anticipated reductions in collateral requirements due to the ongoing wind downwind-down of the Pepco Energy Services retail energy supply business and the completion of the disposition of the Conectiv Energy business. At December 31, 2009, Pepco Holdings’2010, PHI’s current assets on a consolidated basis totaled $1.9$1.8 billion and its current liabilities totaled $2.3$1.8 billion. The increasedecrease in working capital from December 31, 20092010 to December 31, 2010 is2011 was primarily due to a reductiondecrease in prepayments of income taxes and an increase in short-term debt. Prepayments of income taxes have decreased in 2011 because certain net operating losses that were classified as current assets in 2010 were reclassified as long-term assets in 2011. Short-term debt increased to temporarily support higher spending by the current portion of long-term debt.utilities on infrastructure investments and reliability initiatives until permanent financing is obtained.
At December 31, 2010, Pepco Holdings’2011, PHI’s cash and current cash equivalents totaled $21$109 million, of which $1$87 million is reflected on the balance sheetwas invested in Conectiv Energy assets held for sale,money market funds, and the balance was held as cash and uncollected funds. Current restricted cash equivalents (cash that is available to be used only for designated purposes) totaled $11 million. At December 31, 2009, Pepco Holdings’2010, PHI’s cash and current cash equivalents totaled $46$21 million, of which $2$1 million iswas reflected on the balance sheet in Conectiv Energy assets held for sale, and its current restricted cash equivalents totaled $11 million.
A detail of PHI’s short-term debt balance and its current maturities of long-term debt and project funding balance follows:
| As of December 31, 2010 | ||||||||||||||||||||||||||||
| (millions of dollars) | ||||||||||||||||||||||||||||
Type | PHI Parent | Pepco | DPL | ACE | ACE Funding | Pepco Energy Services | PHI Consolidated | |||||||||||||||||||||
Variable Rate Demand Bonds | $ | — | $ | — | $ | 105 | $ | 23 | $ | — | $ | 18 | $ | 146 | ||||||||||||||
Commercial Paper | 230 | — | — | 158 | — | — | 388 | |||||||||||||||||||||
Total Short-Term Debt | $ | 230 | $ | — | $ | 105 | $ | 181 | $ | — | $ | 18 | $ | 534 | ||||||||||||||
Current Maturities of Long-Term Debt and Project Funding | $ | — | $ | — | $ | 35 | $ | — | $ | 35 | $ | 5 | $ | 75 | ||||||||||||||
PEPCO HOLDINGS
As of December 31, 2011 (millions of dollars) | ||||||||||||||||||||||||||||
Type | PHI Parent | Pepco | DPL | ACE | ACE Funding | Pepco Energy Services | PHI Consolidated | |||||||||||||||||||||
Variable Rate Demand Bonds | $ | — | $ | — | $ | 105 | $ | 23 | $ | — | $ | 18 | $ | 146 | ||||||||||||||
Commercial Paper | 465 | 74 | 47 | — | — | — | 586 | |||||||||||||||||||||
|
|
|
|
|
|
|
|
|
|
|
|
|
| |||||||||||||||
Total Short-Term Debt | $ | 465 | $ | 74 | $ | 152 | $ | 23 | $ | — | $ | 18 | $ | 732 | ||||||||||||||
|
|
|
|
|
|
|
|
|
|
|
|
|
| |||||||||||||||
Current Maturities of Long-Term Debt and Project Funding | $ | — | $ | — | $ | 66 | $ | — | $ | 37 | $ | 9 | $ | 112 | ||||||||||||||
|
|
|
|
|
|
|
|
|
|
|
|
|
| |||||||||||||||
| As of December 31, 2009 | ||||||||||||||||||||||||||||||||||||||||||||||||||||||||
| (millions of dollars) | As of December 31, 2010 (millions of dollars) | |||||||||||||||||||||||||||||||||||||||||||||||||||||||
Type | PHI Parent | Pepco | DPL | ACE | ACE Funding | Pepco Energy Services | PHI Consolidated | PHI Parent | Pepco | DPL | ACE | ACE Funding | Pepco Energy Services | PHI Consolidated | ||||||||||||||||||||||||||||||||||||||||||
Variable Rate Demand Bonds | $ | — | $ | — | $ | 105 | $ | 23 | $ | — | $ | 18 | $ | 146 | $ | — | $ | — | $ | 105 | $ | 23 | $ | — | $ | 18 | $ | 146 | ||||||||||||||||||||||||||||
Commercial Paper | 324 | — | — | 60 | — | — | 384 | 230 | — | — | 158 | — | — | 388 | ||||||||||||||||||||||||||||||||||||||||||
|
|
|
|
|
|
| ||||||||||||||||||||||||||||||||||||||||||||||||||
Total Short-Term Debt | $ | 324 | $ | — | $ | 105 | $ | 83 | $ | — | $ | 18 | $ | 530 | $ | 230 | $ | — | $ | 105 | $ | 181 | $ | — | $ | 18 | $ | 534 | ||||||||||||||||||||||||||||
|
|
|
|
|
|
| ||||||||||||||||||||||||||||||||||||||||||||||||||
Current Maturities of Long-Term Debt and Project Funding | $ | 450 | $ | 16 | $ | 31 | $ | 1 | $ | 34 | $ | 4 | $ | 536 | $ | — | $ | — | $ | 35 | $ | — | $ | 35 | $ | 5 | $ | 75 | ||||||||||||||||||||||||||||
|
|
|
|
|
|
| ||||||||||||||||||||||||||||||||||||||||||||||||||
Credit FacilitiesFacility
PHI, Pepco, DPL and ACE maintain an unsecured syndicated credit facility to provide for their respective short-term liquidity needs. needs, including obtaining letters of credit, borrowing for general corporate purposes and supporting their commercial paper programs. On August 1, 2011, PHI, Pepco, DPL and ACE entered into an amended and restated credit agreement with respect to the facility, which among other changes, extended the expiration date of the facility to August 1, 2016.
70
PEPCO HOLDINGS
The aggregate borrowing limit under this creditthe facility is $1.5 billion, all or any portion of which may be used to obtain loans orand up to issue$500 million of which may be used to obtain letters of credit. PHI’sThe facility also includes a swingline loan sub-facility, pursuant to which each company may make same day borrowings in an aggregate amount not to exceed 10% of the total amount of the facility. Any swingline loan must be repaid by the borrower within fourteen days of receipt. The initial credit limit under the facilitysublimit for PHI is $875 million. The credit limit of$750 million and $250 million for each of Pepco, DPL and ACE. The sublimits may be increased or decreased by the individual borrower during the term of the facility, except that (i) the sum of all of the borrower sublimits following any such increase or decrease must equal the total amount of the facility and (ii) the aggregate amount of credit used at any given time by (a) PHI may not exceed $1.25 billion and (b) each of Pepco, DPL or ACE ismay not exceed the lesser of $500 million and the maximum amount of short-term debt the company is permitted to have outstanding by its regulatory authorities, except thatauthorities. The total number of the aggregate amount of credit used by Pepco, DPL and ACE at any given time collectivelysublimit reallocations may not exceed $625 million. eight per year during the term of the facility.
The interest rate payable by each company on utilized funds is, at the borrowing company’s election, (i) the greater of the prevailing prime rate, and the federal funds effective rate plus 0.5% and one month LIBOR plus 1.0%, or (ii) the prevailing Eurodollar rate, plus a margin that varies according to the credit rating of the borrower. The facility also includes a “swingline loan sub-facility” pursuant to which each company may make same day borrowings in an aggregate amount not to exceed $150 million. Any swingline loan must be repaid by the borrower within seven days of receipt thereof.
The facility commitment expiration date is May 5, 2012, with each company having the right to elect to have 100% of the principal balance of the loans outstanding on the expiration date continued as non-revolving term loans for a period of one year from such expiration date.
The facility is intended to serve primarily as a source of liquidity to support the commercial paper programs of the respective companies. The companies also are permitted to use the facility to borrow funds for general corporate purposes and issue letters of credit. In order for a borrower to use the facility, certain representations and warranties must be true and correct, and the borrower must be in compliance with specified financial covenants, including (i) the requirement that each borrowing company maintain a ratio of total indebtedness to total capitalization of 65% or less, computed in accordance with the terms of the credit agreement, which calculation excludes from the definition of total indebtedness certain trust preferred securities and deferrable interest subordinated debt (not to exceed 15% of total capitalization), (ii) with certain exceptions, a restriction on sales or other dispositions of assets, other than certain sales and dispositions, and (iii) a restriction on the incurrence of liens on the assets of a borrower or any of its significant subsidiaries other than permitted liens. The credit agreement contains certain covenants and other customary agreements and requirements that, if not complied with, could result in an event of default and the acceleration of repayment obligations of one or more of the borrowers thereunder. Each of the borrowers was in compliance with all financial covenants under this facility as of December 31, 2011.
The absence of a material adverse change in the borrower’sPHI’s business, property, and results of operations or financial condition is not a condition to the availability of credit under the facility.credit agreement. The facilitycredit agreement does not include any rating triggers.
On October 15, 2010, a $400PHI, Pepco, DPL and ACE maintain commercial paper programs to address short-term liquidity needs. As of December 31, 2011, the maximum capacity available under these programs was $875 million, unsecured credit facility maintained$500 million, $500 million and $250 million, respectively. In January 2012, the Board of Directors approved an increase in PHI’s maximum to $1.25 billion.
PHI, Pepco and DPL had $465 million, $74 million and $47 million, respectively, of commercial paper outstanding at December 31, 2011. ACE had no commercial paper outstanding at December 31, 2011. The weighted average interest rate for commercial paper issued by PHI, expired. To replace this facility,Pepco, DPL and ACE during 2011 was 0.64%, 0.35%, 0.34% and 0.33%, respectively. The weighted average maturity of all commercial paper issued by PHI, on October 27, 2010, entered intoPepco, DPL and ACE in 2011 was eleven, two, bi-lateral 364 day unsecured credit agreements totaling $200 million. Under each of the credit agreements, PHI has access to revolvingtwo and floating rate loans over the terms of the agreements. Neither agreement provides for the issuance of letters of credit. The interest rate payable on funds borrowed is at PHI’s election, based on either (a) the prevailing Eurodollar rate plus 2.0% or (b) the highest of (i) the prevailing prime rate, (ii) the federal funds effective rate plus 0.5% or (iii) the one-month Eurodollar rate plus 1.0%, plus a margin of 1.0%. In order to obtain loans under either of the agreements, PHI must be in compliance with the same covenants and conditions that it is required to satisfy for utilization of its existing $1.5 billion credit facility. The absence of a material adverse change in PHI’s business, property, and results of operations or financial condition is not a condition to the availability of credit under either agreement. Neither agreement includes any rating triggers.six days, respectively.
71
PEPCO HOLDINGS
The $1.5 billion credit facility and the two bi-lateral credit agreements are referred to herein collectively as PHI’s “primary credit facilities.” As of December 31, 2010, each borrower was in compliance with the covenants of each of the primary credit facilities.
On November 2, 2010, PHI’s $50 million bi-lateral credit agreement with The Bank of Nova Scotia expired. Both the $400 million PHI facility that expired in October 2010 and this agreement were established to provide additional liquidity and collateral support for Pepco Energy Services’ retail energy supply business and for the operations of Conectiv Energy. Based on the progress toward winding down the retail energy supply business and disposing of the Conectiv Energy segment, the level of liquidity and collateral needed to support these businesses has decreased. As a result, PHI has been able to reduce the total amount of its credit facility needs by $250 million.
Cash and Credit FacilitiesFacility Available as of December 31, 20102011
| Consolidated PHI | PHI Parent | Utility Subsidiaries | Consolidated PHI | PHI Parent | Utility Subsidiaries | |||||||||||||||||||
| (millions of dollars) | (millions of dollars) | |||||||||||||||||||||||
Credit Facilities (Total Capacity) | $ | 1,700 | $ | 1,075 | $ | 625 | ||||||||||||||||||
Credit Facility (Total Capacity) | $ | 1,500 | $ | 750 | $ | 750 | ||||||||||||||||||
Less: Letters of Credit issued | 122 | 117 | 5 | 7 | 2 | 5 | ||||||||||||||||||
Commercial Paper outstanding | 388 | 230 | 158 | 586 | 465 | 121 | ||||||||||||||||||
|
|
| ||||||||||||||||||||||
Remaining Credit Facilities Available | 1,190 | 728 | 462 | |||||||||||||||||||||
Remaining Credit Facility Available | 907 | 283 | 624 | |||||||||||||||||||||
Cash Invested in Money Market Funds (a) | — | — | — | 87 | — | 87 | ||||||||||||||||||
|
|
| ||||||||||||||||||||||
Total Cash and Credit Facilities Available | $ | 1,190 | $ | 728 | $ | 462 | ||||||||||||||||||
Total Cash and Credit Facility Available | $ | 994 | $ | 283 | $ | 711 | ||||||||||||||||||
|
|
| ||||||||||||||||||||||
| (a) | Cash and cash equivalents reported on the balance sheet |
Collateral Requirements
At December 31, 2010 and 2009, the amount of cash, plus borrowing capacity under the primary credit facilities available to meet the future liquidity needs of Pepco Energy Services and Conectiv Energy totaled $728 million and $820 million, respectively.
Collateral Requirements of Pepco Energy Services
In conducting its retail energy supply business, Pepco Energy Services, during periods of declining energy prices, has been exposed to the asymmetrical risk of having to post collateral under its wholesale purchase contracts without receiving a corresponding amount of collateral from its retail customers. To partially address these asymmetrical collateral obligations, Pepco Energy Services, in the first quarter of 2009, entered into a credit intermediation arrangement with Morgan Stanley Capital Group, Inc. (MSCG). Under this arrangement, MSCG, in consideration for the payment to MSCG of certain fees, (i) assumed by novation, the electricity purchase obligations of Pepco Energy Services in years 2009 through 2011 under several wholesale purchase contracts, and (ii) agreed to supplysupplied electricity to Pepco Energy Services on the same terms as the novated transactions, but without imposing on Pepco Energy Services any obligation to post collateral based on changes in electricity prices. The upfront fees incurred by Pepco Energy Services in 2009 in the amount of $25 million are beingwas amortized into expense in declining amounts over the life of the arrangement based on the fair value of the underlying contracts at the time of the novation. For the years ended December 31, 2011, 2010 and 2009, approximately $1 million $8 million and $16 million, respectively, of the fees have been amortized and reflected in interest expense. As the retail electric and natural gas supply businesses are wound down, Pepco Energy Services’ collateral requirements will be further reduced.
PEPCO HOLDINGS
In relation to the wind downwind-down of its retail energy supply business, Pepco Energy Services in the ordinary course of business has entered into various contracts to buy and sell electricity, fuels and related products, including derivative instruments, designed to reduce its financial exposure to changes in the value of its assets and obligations due to energy price fluctuations. These contracts also typically have collateral requirements.
Depending on the contract terms, the collateral required to be posted by Pepco Energy Services can be of varying forms, including cash and letters of credit. As of December 31, 2011, Pepco Energy Services posted net cash collateral of $112 million and letters of credit of $1 million. At December 31, 2010, Pepco Energy Services had posted net cash collateral of $117 million and letters of credit of $113 million.
At December 31, 2009,2011 and 2010, the amount of cash, plus borrowing capacity under the primary credit facility available to meet the future liquidity needs of Pepco Energy Services had posted net cash collateral of $123totaled $283 million and letters of credit of $157 million.
Remaining Collateral Requirements of Conectiv Energy
Depending on the contract terms, the collateral required to be posted by Conectiv Energy is of varying forms, including cash and letters of credit. As of December 31, 2010, Conectiv Energy had posted net cash collateral of $104$728 million, and there were no outstanding letters of credit. At December 31, 2009, Conectiv Energy had posted net cash collateral of $240 million and letters of credit of $22 million.
On January 6, 2011, as part of its ongoing divestiture efforts, Conectiv Energy entered into a financial transaction with a third party under which Conectiv Energy transferred its remaining portfolio of derivatives, including financially settled natural gas and electric power transactions for all remaining periods from February 1, 2011 forward. In connection with the closing of the transaction, Conectiv Energy paid the third party $82 million, primarily representing the fair value of the derivative instruments at February 1, 2011 and an administrative fee of approximately $2 million that will be expensed in the first quarter of 2011. No additional material gain or loss will be recognized as a result of this transaction as the derivatives were previously marked to fair value through earnings in 2010. Approximately $68 million of collateral was returned to Conectiv Energy upon the closing of the transaction in January 2011. Approximately $11 million of the remaining $36 million in outstanding collateral will be returned to Conectiv Energy in connection with this transaction upon the novation of several over-the-counter transactions.
All of the remaining posted cash collateral, other than the $11 million referred to above, is held by the PJM and ISO New England Inc. regional transmission organizations and will be returned within the next several months upon completion of a reconciliation process.respectively.
Pension and Other Postretirement Benefit Plans
In 2008, the pension and other postretirement benefit plans maintained by PHI experienced significant declines in the fair value of plan assets, which has resulted in increased pension and other postretirement benefit costs in 2009 and 2010 and increased plan funding requirements.
Based on the results of the 20102011 actuarial valuation, PHI’s net periodic pension and other postretirement benefitOPEB costs were approximately $94 million in 2011 versus $116 million in 2010 versus $149 million in 2009.2010. The current estimate of benefit cost for 20112012 is $107$103 million. The utility subsidiaries are responsible for substantially all of the total PHI net periodic pension and other postretirement benefitOPEB costs. Approximately 30% of net periodic pension and other postretirement benefitOPEB costs are capitalized. PHI estimates that its net periodic pension and other postretirement benefitOPEB expense will be approximately $75$72 million in 2012, as compared to $66 million in 2011 as compared toand $81 million in 2010 and $103 million in 2009.2010.
72
PEPCO HOLDINGS
Pension benefits are provided under PHI’sthe PHI Retirement Plan, a non-contributory, defined benefit pension plan (the PHI Retirement Plan), a non contributory retirement plan that covers substantially all employees of Pepco, DPL and ACE and certain employees of other PHI subsidiaries. PHI’s funding policy with regard to the PHI Retirement Plan is to maintain a funding level that is at least equal to the funding target liability as defined under the Pension Protection Act of 2006. The funding target under
During 2011, Pepco, DPL and ACE made discretionary tax-deductible contributions totaling $110 million to the Pension Protection Act is an amount that is being phasedPHI Retirement Plan, in over time. The funding target was 96%the amounts of the accrued liability for 2010$40 million, $40 million and is 100% of the accrued liability for 2011.
During$30 million, respectively. In 2010, PHI Service Company made discretionary tax-deductible contributions totaling $100 million to the PHI Retirement Plan, which brought plan assets to at least the funding target level for 2010 under the Pension Protection Act. Pepco, ACE and DPL did not make contributions to the pension plan in 2010.
In 2009, PHI made discretionary tax-deductible contributions totaling $300 million to the PHI Retirement Plan, which brought plan assets to at least the funding target level for 2009 under the Pension Protection Act. Of this amount, $240 million was contributed through tax-deductible contributions from Pepco, ACE and DPL in the amounts of $170 million, $60 million and $10 million, respectively. The remaining $60 million contribution was made through tax-deductible contributions from PHI Service Company.Plan.
Under the Pension Protection Act, if a plan incurs a funding shortfall in the preceding plan year, there can be required minimum quarterly contributions in the current and following plan years. PHI satisfied the minimum required contribution rules in 2010, 2009 and 2008 and does not expect to have any required contributions in 2011. Although PHI projects there will be no minimum funding requirement under the Pension Protection Act guidelines in 2011, PHI currently estimates it may make2010 and 2009. On January 31, 2012, Pepco, DPL and ACE made discretionary tax-deductible contributions to the PHI Retirement Plan in 2011the amounts of up to $150$85 million, $85 million and $30 million, respectively, which is expected to bring the PHI Retirement Plan assets to at least the funding target level for 20112012 under the Pension Protection Act. For additional discussion of PHI’s Pension and Other Postretirement Benefits, see Note (10), “Pension and Other Postretirement Benefits,” to the consolidated financial statements of PHI.
Effective July 1, 2011, PHI set forthapproved revisions to certain of PHI’s existing benefit programs, including the PHI Retirement Plan. The changes to the PHI Retirement Plan were effected in Part II, Item 8order to establish a more unified approach to PHI’s retirement programs and to further align the benefits offered under PHI’s retirement programs. The changes to the PHI Retirement Plan were effective on or after July 1, 2011 and affect the retirement benefits payable to approximately 750 of this Form 10-K.PHI’s employees. All full-time employees of PHI and certain subsidiaries are eligible to participate in the PHI Retirement Plan. Retirement benefits for all other employees remain unchanged.
In the third quarter of 2011, PHI also approved a new, non-qualified Supplemental Executive Retirement Plan (SERP) which replaced PHI’s two pre-existing supplemental retirement plans, effective August 1, 2011. As of the effective date of the new SERP, the Conectiv SERP and the PHI Combined SERP were closed to new participants. The establishment of the new SERP is consistent with PHI’s efforts to align retirement benefits for PHI and its subsidiaries with current market practices and to provide similarly situated participants with retirement benefits that are the same or similar in value as compared to the benefits provided under the prior SERPs.
In the fourth quarter of 2011, PHI approved an increase in the medical benefit limits for certain employees in its postretirement health care benefit plan to align the limits with those provided to other employees. The amendment affects approximately 1,400 employees, of which 400 are retirees and 1,000 are active union employees. The effective date of the plan modification was January 1, 2012.
The additional liabilities and expenses for the benefit plan modifications described above did not have a material impact on PHI’s overall consolidated financial condition, results of operations, or cash flows.
73
PEPCO HOLDINGS
Cash Flow Activity
PHI’s cash flows during 2011, 2010 2009, and 20082009 are summarized below:
| Cash (Use) Source | ||||||||||||
| 2010 | 2009 | 2008 | ||||||||||
| (millions of dollars) | ||||||||||||
Operating Activities | $ | 813 | $ | 606 | $ | 413 | ||||||
Investing Activities | 718 | (860 | ) | (714 | ) | |||||||
Financing Activities | (1,556 | ) | (84 | ) | 630 | |||||||
Net (decrease) increase in cash and cash equivalents | $ | (25 | ) | $ | (338 | ) | $ | 329 | ||||
PEPCO HOLDINGS
| Cash Source (Use) | ||||||||||||
| 2011 | 2010 | 2009 | ||||||||||
| (millions of dollars) | ||||||||||||
Operating Activities | $ | 686 | $ | 813 | $ | 606 | ||||||
Investing Activities | (747 | ) | 718 | (860 | ) | |||||||
Financing Activities | 149 | (1,556 | ) | (84 | ) | |||||||
|
|
|
|
|
| |||||||
Net increase (decrease) in cash and cash equivalents | $ | 88 | $ | (25 | ) | $ | (338 | ) | ||||
|
|
|
|
|
| |||||||
Operating Activities
Cash flows from operating activities during 2011, 2010 2009, and 20082009 are summarized below:
| Cash Source (Use) | Cash Source (Use) | |||||||||||||||||||||||
| 2010 | 2009 | 2008 | 2011 | 2010 | 2009 | |||||||||||||||||||
| (millions of dollars) | (millions of dollars) | |||||||||||||||||||||||
Net Income from continuing operations | $ | 139 | $ | 223 | $ | 183 | $ | 260 | $ | 139 | $ | 223 | ||||||||||||
Non-cash adjustments to net income | 349 | 260 | 390 | 351 | 352 | 262 | ||||||||||||||||||
Pension contributions | (100 | ) | (300 | ) | — | (110 | ) | (100 | ) | (300 | ) | |||||||||||||
Changes in cash collateral related to derivative activities | 13 | 24 | (138 | ) | 9 | 13 | 24 | |||||||||||||||||
Changes in other assets and liabilities | 164 | 296 | 22 | 134 | 161 | 294 | ||||||||||||||||||
Changes in Conectiv Energy net assets held for sale | 248 | 103 | (44 | ) | 42 | 248 | 103 | |||||||||||||||||
|
|
| ||||||||||||||||||||||
Net cash from operating activities | $ | 813 | $ | 606 | $ | 413 | $ | 686 | $ | 813 | $ | 606 | ||||||||||||
|
|
| ||||||||||||||||||||||
Net cash from operating activities was $127 million lower for the year ended December 31, 2011, compared to the same period in 2010. The decrease was due primarily to a $206 million reduction in Conectiv Energy net assets held for sale as well as $10 million increase in pension contributions compared to 2010. A significant portion of the decline in Conectiv Energy assets held for sale was associated with the transfer of derivative instruments to a third party as further described in Note (20), “Discontinued Operations,” to the consolidated financial statements of PHI. Partially offsetting this decrease in operating cash flows was a $121 million increase in cash flows from continuing operations.
Net cash from operating activities was $207 million higher for the year ended December 31, 2010, compared to the same period in 2009. Portions of the increase are attributable to a 2010 decrease in pension plan contributions of $200 million compared to 2009 and a decrease in regulatory liabilities during the year ended December 31, 2010 asthat was the result of a lower rate of recovery by ACE of costs associated with energy and capacity purchased under the NUG contracts. Changes in cash from Conectiv Energy assets held for sale reflect a net decrease in Conectiv Energy assets and liabilities included in discontinued operations, including a decrease in collateral requirements as a result of the liquidation of derivative instruments as further described in Note (20), “Discontinued Operations.”instruments.
Net cash from operating activities was $193 million higher for the year ended December 31, 2009, compared to the same period in 2008. A portion of this increase is attributable to the release from restricted cash of $102 million related to the Mirant settlement and the 2009 receipt of a Federal income tax refund from the IRS of $138 million associated with the carryback of a net operating loss for tax reporting purposes that reflected, among other things, significant tax deductions related to accelerated depreciation, the pension plan contributions paid in 2009 (which were deductible for 2008) and the cumulative effect of adopting a new method of tax reporting for certain repairs. PHI also experienced reduced cash requirements related to purchases of inventory (associated with lower natural gas and electric prices). Offsetting these increases were the pension plan contributions of $300 million made during 2009. The change in Conectiv Energy net assets held for sale included a decrease of $99 million in collateral requirements between 2008 and 2009.
Net cash from operating activities in 2008 included a non-cash charge taken on the cross-border energy lease investments, and additional collateral requirements of $138 million primarily related to Pepco Energy Services’ retail energy supply business.74
PEPCO HOLDINGS
Investing Activities
Cash flows used by investing activities during 2011, 2010 2009, and 20082009 are summarized below:
| Cash (Use) Source | Cash (Use) Source | |||||||||||||||||||||||
| 2010 | 2009 | 2008 | 2011 | 2010 | 2009 | |||||||||||||||||||
| (millions of dollars) | (millions of dollars) | |||||||||||||||||||||||
Investment in property, plant and equipment | $ | (802 | ) | $ | (664 | ) | $ | (643 | ) | $ | (941 | ) | $ | (802 | ) | $ | (664 | ) | ||||||
DOE capital reimbursement awards received | 13 | — | — | 52 | 13 | — | ||||||||||||||||||
Proceeds from early termination of finance leases held in trust | 161 | — | — | |||||||||||||||||||||
Proceeds from sale of Conectiv Energy wholesale power generation business | 1,640 | — | — | — | 1,640 | — | ||||||||||||||||||
Proceeds from sale of assets | 3 | 4 | 56 | — | 3 | 4 | ||||||||||||||||||
Changes in restricted cash equivalents | (10 | ) | (2 | ) | — | |||||||||||||||||||
Net other investing activities | 2 | — | 11 | (9 | ) | 4 | — | |||||||||||||||||
Investment in property, plant and equipment associated with Conectiv Energy assets held for sale | (138 | ) | (200 | ) | (138 | ) | — | (138 | ) | (200 | ) | |||||||||||||
|
|
| ||||||||||||||||||||||
Net cash from (used by) investing activities | $ | 718 | $ | (860 | ) | $ | (714 | ) | ||||||||||||||||
Net cash (used by) from investing activities | $ | (747 | ) | $ | 718 | $ | (860 | ) | ||||||||||||||||
|
|
| ||||||||||||||||||||||
Net cash from investing activities decreased $1,465 million for the year ended December 31, 2011 compared to the same period in 2010. The decrease was due primarily to the $1,640 million in proceeds from the sale of the Conectiv Energy wholesale power generation business and $139 million increase in capital expenditures, partially offset by the $161 million of proceeds from the early termination of certain cross-border energy lease investments in 2011.
Net cash from investing activities increased $1,578 million for the year ended December 31, 2010 compared to the same period in 2009. The increase was due primarily to the July 1, 2010$1,640 million proceeds from the sale of the Conectiv Energy wholesale power generation business offset by a $143$138 million increase in Power Delivery capital expenditures primarily attributable to capital costs associated with transmission plant investment and PHI’s Blueprint for the Future initiatives.
Financing Activities
Cash flows from financing activities during 2011, 2010 and 2009 are summarized below.
| Cash (Use) Source | ||||||||||||
| 2011 | 2010 | 2009 | ||||||||||
| (millions of dollars) | ||||||||||||
Dividends paid on common stock | $ | (244 | ) | $ | (241 | ) | $ | (238 | ) | |||
Common stock issued for the Dividend Reinvestment Plan and employee-related compensation | 47 | 47 | 49 | |||||||||
Redemption of preferred stock of subsidiaries | (6 | ) | — | — | ||||||||
Issuances of long-term debt | 235 | 383 | 110 | |||||||||
Reacquisitions of long-term debt | (70 | ) | (1,726 | ) | (83 | ) | ||||||
Issuances of short-term debt, net | 198 | 4 | 65 | |||||||||
Cost of issuances | (10 | ) | (7 | ) | (4 | ) | ||||||
Net other financing activities | (1 | ) | (6 | ) | 10 | |||||||
Net financing activities associated with Conectiv Energy assets held for sale | — | (10 | ) | 7 | ||||||||
|
|
|
|
|
| |||||||
Net cash from (used by) financing activities | $ | 149 | $ | (1,556 | ) | $ | (84 | ) | ||||
|
|
|
|
|
| |||||||
75
PEPCO HOLDINGS
Net cash used by investingrelated to financing activities increased by $146$1,705 million for the year ended December 31, 20092011 compared to the same period in 2008. The increase was due primarily to an $83 million increase in capital expenditures, of which $62 million was attributable to Conectiv Energy assets held for sale and $35 million was attributable to Power Delivery, partially offset by a decrease in Pepco Energy Services capital expenditures. The increase in Conectiv Energy capital expenditures was2010 primarily due to the constructiona $1,656 million decrease in reacquisitions of new generating facilities. The increaselong-term debt in Power Delivery capital expenditures was primarily attributable to capital costs associated with the Mid-Atlantic Power Pathway (MAPP) and Blueprint for the Future projects. The increase2011 as a result of debt extinguishments in cash used by investing activities also reflected a $52 million reduction in cash proceeds from the sale of other assets, primarily due to the receipt by DPL in 2008 of cash proceeds in the amount of $54 million from the sale of its retail electric distribution and wholesale electric transmission assets in Virginia.2010.
PEPCO HOLDINGS
Financing Activities
Cash flows used by financing activities during 2010, 2009 and 2008 are summarized below.
| Cash (Use) Source | ||||||||||||
| 2010 | 2009 | 2008 | ||||||||||
| (millions of dollars) | ||||||||||||
Dividends paid on common and preferred stock | $ | (241 | ) | $ | (238 | ) | $ | (222 | ) | |||
Common stock issued for the Dividend Reinvestment Plan and employee-related compensation | 47 | 49 | 51 | |||||||||
Issuance of common stock | — | — | 265 | |||||||||
Issuances of long-term debt | 383 | 110 | 1,150 | |||||||||
Reacquisition of long-term debt | (1,726 | ) | (83 | ) | (590 | ) | ||||||
Issuances (repayments) of short-term debt, net | 4 | 65 | 26 | |||||||||
Cost of issuances | (7 | ) | (4 | ) | (30 | ) | ||||||
Net other financing activities | (6 | ) | 10 | (21 | ) | |||||||
Net financing activities associated with Conectiv Energy assets held for sale | (10 | ) | 7 | 1 | ||||||||
Net cash (used by) provided by financing activities | $ | (1,556 | ) | $ | (84 | ) | $ | 630 | ||||
Net cash related to financing activities decreased $1,472 million for the year ended December 31, 2010 compared to the same period in 2009 primarily due to the retirement of $1,643 million of long-term debt using the proceeds from the sale of the Conectiv Energy wholesale power generation business.
Net cash from financing activities decreased $714 million for the year ended 2009, compared to the same period in 2008, principally due to the decrease in 2009 of issuances of long-term debt and common stock, partially offset by the decrease in amounts spent to reacquire long-term debt.
Common Stock Dividends
Common stock dividend payments were $244 million in 2011, $241 million in 2010, and $238 million in 2009, and $222 million in 2008.2009. The increase in common stock dividends paid in 2011 and 2010 was the result of additional shares outstanding, primarily shares issued under the Shareholder Dividend Reinvestment Plan (DRP). The increase in common dividends paid in 2009 was the result of additional shares outstanding, primarily due to PHI’s sale of 16.1 million shares of common stock in November 2008.
Changes in Outstanding Common Stock
In November 2008,Under the DRP, PHI sold 16.1issued 1.6 million shares of common stock in a registered offering at a price per share of $16.50, resulting in gross proceeds of $265 million.
Under the DRP, PHI issued2011, 1.8 million shares of common stock in 2010, and 2.2 million shares of common stock in 2009, and 1.3 million shares of common stock in 2008.
PEPCO HOLDINGS
2009.
Changes in Outstanding Long-Term Debt
Cash flows from the issuance and redemptionreacquisition of long-term debt in 2011, 2010 2009 and 20082009 are summarized in the charts below:
| 2010 | 2009 | 2008 | 2011 | 2010 | 2009 | |||||||||||||||||||||
| Issuances | (millions of dollars) | (millions of dollars) | ||||||||||||||||||||||||
PHI | ||||||||||||||||||||||||||
2.70% senior notes due 2015 | $ | 250 | $ | — | $ | — | $ | — | $ | 250 | $ | — | ||||||||||||||
|
|
| ||||||||||||||||||||||||
| 250 | — | — | — | 250 | — | |||||||||||||||||||||
|
|
| ||||||||||||||||||||||||
Pepco | ||||||||||||||||||||||||||
6.20% tax-exempt bonds due 2022 (a) | — | 110 | — | — | — | 110 | ||||||||||||||||||||
6.50% senior notes due 2037 (b) | — | — | 250 | |||||||||||||||||||||||
7.90% first mortgage bonds due 2038 | — | — | 250 | |||||||||||||||||||||||
|
|
| ||||||||||||||||||||||||
| — | 110 | 500 | — | — | 110 | |||||||||||||||||||||
|
|
| ||||||||||||||||||||||||
DPL | ||||||||||||||||||||||||||
0.75% tax-exempt bonds due 2026 (b) | 35 | — | — | |||||||||||||||||||||||
5.40% tax-exempt bonds due 2031 (c) | 78 | — | — | — | 78 | — | ||||||||||||||||||||
1.80% tax-exempt bonds due 2025 (d) | 15 | — | — | — | 15 | — | ||||||||||||||||||||
2.30% tax-exempt bonds due 2028 (d) | 16 | — | — | — | 16 | — | ||||||||||||||||||||
6.40% first mortgage bonds due 2013 | — | — | 250 | |||||||||||||||||||||||
|
|
| ||||||||||||||||||||||||
| 109 | — | 250 | (f) | 35 | 109 | — | ||||||||||||||||||||
|
|
| ||||||||||||||||||||||||
ACE | ||||||||||||||||||||||||||
4.35% First mortgage bonds due 2021 | 200 | — | — | |||||||||||||||||||||||
4.875% tax-exempt bonds due 2029 (e) | 23 | — | — | — | 23 | — | ||||||||||||||||||||
7.75% first mortgage bonds due 2018 | — | — | 250 | |||||||||||||||||||||||
|
|
| ||||||||||||||||||||||||
| 23 | — | 250 | 200 | 23 | — | |||||||||||||||||||||
|
|
| ||||||||||||||||||||||||
Pepco Energy Services | 1 | — | — | — | 1 | — | ||||||||||||||||||||
|
|
| ||||||||||||||||||||||||
| $ | 383 | $ | 110 | $ | 1,000 | $ | 235 | $ | 383 | $ | 110 | |||||||||||||||
|
|
| ||||||||||||||||||||||||
| (a) | Consists of Pollution Control Revenue Refunding Bonds (Pepco 2022 Bonds) issued by the Maryland Economic Development Corporation for the benefit of Pepco that were purchased by Pepco in 2008. In connection with their resale by Pepco, the interest rate on the Pepco 2022 Bonds was changed from an auction rate to a fixed rate. The Pepco 2022 Bonds are secured by an outstanding series of senior notes issued by Pepco, and the senior notes are in turn secured by a series of collateral first mortgage bonds (Collateral First Mortgage Bonds) issued by Pepco. Both the senior notes and the Collateral First Mortgage Bonds have maturity dates, optional and mandatory redemption provisions, interest rates and interest payment dates that are identical to the terms of the Pepco 2022 Bonds. The payment by Pepco of its obligations with respect to the Pepco 2022 Bonds satisfies the corresponding payment obligations on the senior notes and Collateral First Mortgage Bonds. See Note (11), “Debt,” to the consolidated financial statements of |
| (b) |
76
PEPCO HOLDINGS
| (c) | Consists of Gas Facilities Refunding Revenue Bonds issued by |
| (d) | Consists of Pollution Control Refunding Revenue Bonds issued by DEDA for the benefit of DPL that were purchased by DPL in July 2010. See footnote (c) to the |
| (e) | Consists of Pollution Control Revenue Refunding Bonds (ACE Bonds) issued by The Pollution Control Financing Authority of Salem County for the benefit of ACE that were purchased by ACE in 2008. In connection with the resale by ACE, the interest rate on the ACE Bonds was changed from an auction rate to a fixed rate. The ACE Bonds are secured by an outstanding series of senior notes issued by ACE, and the senior notes are in turn secured by a series of Collateral First Mortgage Bonds issued by ACE. Both the senior notes and the Collateral First Mortgage Bonds have maturity dates, optional and mandatory redemption provisions, interest rates and interest payment dates that are identical to the terms of the ACE Bonds. The payment by ACE of its obligations with respect to the ACE Bonds satisfies the corresponding payment obligations on the senior notes and Collateral First Mortgage Bonds. See Note (11), “Debt,” to the consolidated financial statements of |
PEPCO HOLDINGS
| 2010 | 2009 | 2008 | ||||||||||
| Redemptions | (millions of dollars) | |||||||||||
PHI | ||||||||||||
4.00% notes due 2010 | $ | 200 | $ | — | $ | — | ||||||
Floating rate notes due 2010 | 250 | — | — | |||||||||
6.45% senior notes due 2012 | 750 | — | — | |||||||||
5.90% senior notes due 2016 | 10 | — | — | |||||||||
6.125% senior notes due 2017 | 169 | — | — | |||||||||
6.00% senior notes due 2019 | 200 | — | — | |||||||||
7.45% senior notes due 2032 | 65 | — | — | |||||||||
| 1,644 | — | — | ||||||||||
Pepco | ||||||||||||
5.75% tax-exempt bonds due 2010 (a) | 16 | — | — | |||||||||
6.25% medium-term notes due 2009 | — | 50 | — | |||||||||
6.5% first mortgage bonds due 2008 | — | — | 78 | |||||||||
Auction rate, tax-exempt bonds due 2022 (b) | — | — | 110 | |||||||||
5.875% first mortgage bonds due 2008 | — | — | 50 | |||||||||
| 16 | 50 | 238 | ||||||||||
DPL | ||||||||||||
5.5% tax-exempt bonds due 2025 (c) | 15 | — | — | |||||||||
5.65% tax-exempt bonds due 2028 (c) | 16 | — | — | |||||||||
Auction rate, tax-exempt bonds due 2030-2038 (b) | — | — | 58 | |||||||||
Auction rate, tax-exempt bonds due 2030-2031 (b) | — | — | 36 | |||||||||
6.95% first mortgage bonds due 2008 | — | — | 4 | |||||||||
Auction rate, tax-exempt bonds due 2023 (b) | — | — | 18 | |||||||||
| 31 | — | 116 | ||||||||||
ACE | ||||||||||||
7.25% medium-term notes due 2010 | 1 | — | — | |||||||||
6.79% medium-term notes due 2008 | — | — | 15 | |||||||||
Auction rate, tax-exempt bonds due 2029 (b) | — | — | 55 | |||||||||
6.77% medium-term notes due 2008 | — | — | 1 | |||||||||
6.73%-6.75% medium-term notes due 2008 | — | — | 25 | |||||||||
6.71%-6.73% medium-term notes due 2008 | — | — | 9 | |||||||||
Securitization bonds due 2008-2010 | 34 | 32 | 31 | |||||||||
| 35 | 32 | 136 | ||||||||||
PCI | ||||||||||||
8.24% medium-term note due 2008 | — | — | 92 | |||||||||
| — | — | 92 | ||||||||||
Pepco Energy Services | — | 1 | 8 | |||||||||
| $ | 1,726 | $ | 83 | $ | 590 | |||||||
| 2011 | 2010 | 2009 | ||||||||||||
Reacquisitions | (millions of dollars) | |||||||||||||
| PHI | ||||||||||||||
| 4.00% notes due 2010 | $ | — | $ | 200 | $ | — | ||||||||
| Floating rate notes due 2010 | — | 250 | — | |||||||||||
| 6.45% senior notes due 2012 | — | 750 | — | |||||||||||
| 5.90% senior notes due 2016 | — | 10 | — | |||||||||||
| 6.125% senior notes due 2017 | — | 169 | — | |||||||||||
| 6.00% senior notes due 2019 | — | 200 | — | |||||||||||
| 7.45% senior notes due 2032 | — | 65 | — | |||||||||||
|
|
|
|
|
| |||||||||
| — | 1,644 | — | ||||||||||||
|
|
|
|
|
| |||||||||
| Pepco | ||||||||||||||
| 5.75% tax-exempt bonds due 2010 (a) | — | 16 | — | |||||||||||
| 6.25% medium-term notes due 2009 | — | — | 50 | |||||||||||
|
|
|
|
|
| |||||||||
| — | 16 | 50 | ||||||||||||
|
|
|
|
|
| |||||||||
| DPL | ||||||||||||||
| 4.90% tax-exempt bonds due 2026 (b) | 35 | — | — | |||||||||||
| 5.5% tax-exempt bonds due 2025 (c) | — | 15 | — | |||||||||||
| 5.65% tax-exempt bonds due 2028 (c) | — | 16 | — | |||||||||||
|
|
|
|
|
| |||||||||
| 35 | 31 | — | ||||||||||||
|
|
|
|
|
| |||||||||
| ACE | ||||||||||||||
7.25% medium-term notes due 2010 | — | 1 | — | |||||||||||
Securitization bonds due 2009-2011 | 35 | 34 | 32 | |||||||||||
|
|
|
|
|
| |||||||||
| 35 | 35 | 32 | ||||||||||||
|
|
|
|
|
| |||||||||
Pepco Energy Services | — | — | 1 | |||||||||||
|
|
|
|
|
| |||||||||
| $ | 70 | $ | 1,726 | $ | 83 | |||||||||
|
|
|
|
|
| |||||||||
| (a) | Consists of Pollution Control Revenue Refunding Bonds (Pepco 2010 Bonds) issued by Prince George’s County for the benefit of Pepco. The Pepco 2010 Bonds were secured by an outstanding series of Collateral First Mortgage Bonds issued by Pepco. The Collateral First Mortgage Bonds had maturity dates, optional and mandatory redemption provisions, interest rates and interest payment dates that were identical to the terms of the Pepco 2010 Bonds. Accordingly, the redemption of the Pepco 2010 Bonds at maturity automatically effected the redemption of the Collateral First Mortgage Bonds. |
| (b) | Repurchased by DPL in May 2011 pursuant to a mandatory purchase provision in the |
| (c) | Repurchased by DPL in July 2010 pursuant to a mandatory repurchase provision in the indenture for the bonds that was triggered by the expiration of the original interest period for the bonds. The bonds were resold by DPL in December 2010. See footnote (d) to the Issuances table above. |
77
PEPCO HOLDINGS
Purchase and Resale of Tax-Exempt Auction Rate Bonds
In 2008, PHI subsidiaries purchased at par $276On June 1, 2011, DPL resold $35 million in aggregate principal amount of insured tax-exempt auction rate bondsPollution Control Refunding Revenue Bonds (Delmarva Power & Light Company Project) Series 2001C due 2026 (the Series 2001C Bonds). The Series 2001C Bonds were issued by municipal authorities for the benefit of DPL in 2001 and were repurchased by DPL on May 2, 2011, pursuant to a mandatory repurchase provision in the respective PHI subsidiaries.indenture for the Series 2001C Bonds triggered by the expiration of the original interest rate period specified by the Series 2001C Bonds. See footnote (b) to the Redemptions table above. These purchases were made in response to disruption in the market for municipal auction rate securities that made it difficult for the remarketing agent to successfully remarket the bonds at that time. Upon the purchase of the tax-exempt bonds, the obligations of the PHI subsidiaries with respect to these tax-exempt bonds were considered to be extinguished for accounting purposes; however, each of the companies continued to hold the bonds, while monitoring the market and evaluating the options for reselling the bonds to the public at some time in the future.
Pepco purchased Pollution Control Revenue Refunding Bonds issued by the Maryland Economic Development Corporation in the aggregate principal amount of $110 million. In 2009, the bonds were resold by Pepco to the public. See footnote (a) to the IssuancesReacquisitions table above.
DPL purchased Exempt Facilities Refunding Revenue Bonds issued by DEDA inIn connection with the aggregate principal amount of $112 million. In 2009, DPL redeemed $33 million in principal amountissuance of the bonds. Series 2001C Bonds, DPL entered into a continuing disclosure agreement under which it is obligated to furnish certain information to the bondholders. At the time of the resale, the continuing disclosure agreement was amended and restated to designate the Municipal Securities Rulemaking Board as the sole repository for these continuing disclosure documents. The amendment and restatement of the continuing disclosure agreement did not change the operating or financial data that are required to be provided by DPL under such agreement.
On April 5, 2011, ACE issued $200 million of 4.35% first mortgage bonds due April 1, 2021. The net proceeds were used to repay short-term debt and for general corporate purposes.
In 2010, DEDA issued $78 million of 5.40% Gas Facilities Refunding Revenue Bonds due 2031 for the benefit of DPL. The proceeds were used by DPL to redeem $78 million in principal amount of the bondsExempt Facilities Refunding Revenue Bonds issued by DEDA purchased in 2008. See footnote (c) to the Issuances table above.
ACE purchased (i) Pollution Control Revenue Refunding Bonds issued by Cape May County in the aggregate principal amount of $32 million and (ii) Pollution Control Revenue Refunding Bonds issued by Salem County in the aggregate principal amount of $23 million. In 2009, ACE redeemed $32 million in principal amount of the bonds. In March 2010, the remaining $23 million in aggregate principal amount of the bonds wasPollution Control Revenue Refunding Bonds were resold by ACE to the public. See footnote (e) to the Issuances table above.
In 2009, Pepco resold Pollution Control Revenue Refunding Bonds issued by the Maryland Economic Development Corporation in the aggregate principal amount of $110 million. See footnote (a) to the Issuances table above. In 2009, ACE redeemed $32 million in Pollution Control Revenue Refunding Bonds.
Changes in Short-Term Debt
As of December 31, 2010,2011, PHI had a total of $388$586 million of commercial paper outstanding as compared to $388 million and $384 million of commercial paper outstanding at December 31, 2010 and 2009, and no commercial paper outstanding at December 31, 2008.
Due to the capital and credit market disruptions in 2008, the market for commercial paper was severely restricted. As a result, PHI and its subsidiaries were unable to issue commercial paper on a day-to-day basis either in amounts, or with maturities, that were typically required for cash management purposes. Given their restricted access to the commercial paper market and the general uncertainty in the credit markets, PHI and each of its subsidiaries borrowed under the $1.5 billion credit facility to create a cash reserve for future short-term operating needs. As of December 31, 2008, PHI had a loan of $50 million outstanding and Pepco had a loan of $100 million outstanding under this facility. These loans were repaid in 2009.
In 2008, both DPL and Pepco entered into short-term bank loans. In March 2008, DPL obtained a $150 million unsecured bank loan that was repaid in July 2009. In May 2008, Pepco obtained a $25 million bank loan that was repaid in April 2009 and a $25 million bank loan that was repaid in September 2008.respectively.
In 2008 and 2009, the following insured Variable Rate Demand Bonds (VRDBs) issued by The Pollution Control Financing Authority of Salem County for the benefit of ACE (ACE VRDBs) were tendered to The Bank of New York Mellon, as bond trustee, by the holders and purchased by The Bank of New York Mellon pursuant to standby bond purchase agreements for the respective series:
$18.2 million of Pollution Control Revenue Refunding Bonds 1997 Series A due 2014 (ACE 1997A Bonds), and
$4.4 million of Pollution Control Revenue Refunding Bonds 1997 Series B due 2017.2017 (ACE 1997B Bonds).
PEPCO HOLDINGS
In June 2009, the ACE VRDBs were resold to the public. In connection with this remarketing, the financial guaranty insurance policies issued as credit support for the ACE VRDBs were cancelled and replaced with letters of credit issued by The Bank of New York Mellon.credit. In June 2010, the letters of credit expired and were replaced with new irrevocable direct pay letters of credit. The new letter of credit supporting the ACE 1997A Bonds expires in April 2014 and the new letter of credit for the ACE 1997B Bonds expires in June 2014.2013. The expiration, cancellation, or termination of a letter of credit prior to the maturity of the related VRDBs will require ACE to repurchase the corresponding series of ACE VRDBs.
In November 2008, DPL repurchased $9 million of Variable Rate Demand Bonds issued by DPL that were due 2024.
For a further description of the Variable Rate Demand BondsVRDBs issued by or for the benefit of PHI’s utility subsidiaries, see Note (11), “Debt,” to the consolidated financial statements of PHI, set forth in Part II, Item 8 of this Form 10-K.PHI.
Sale of Virginia Retail Electric Distribution and Wholesale Transmission Assets
In January 2008, DPL completed (i) the sale of its retail electric distribution assets on the Eastern Shore of Virginia for a purchase price of approximately $49 million, and (ii) the sale of its wholesale electric transmission assets located on the Eastern Shore of Virginia for a purchase price of approximately $5 million.78
PEPCO HOLDINGS
Capital Requirements
Capital Expenditures
Pepco Holdings’ total capital expenditures for the year ended December 31, 20102011 totaled $941 million, up $139 million versus $802 million of which $359in 2010. Capital expenditures in 2011 were $521 million was incurred byfor Pepco, $250$229 million was incurred byfor DPL, and $156$138 million was incurred byfor ACE, $7$14 million byfor Pepco Energy Services and $30$39 million byfor Corporate and Other. The Power Delivery expenditures were primarily related to capital costs associated with new customer services, distribution reliability and transmission. Corporate and Other capital expenditures primarily consisted of hardware and software expenditures whichthat will be allocated to the Power Delivery Business when the assets are placed in service.
The table below shows the projected capital expenditures for Power Delivery, Pepco Energy Services and Corporate and Other for the five-year period 20112012 through 2015.2016. Pepco Holdings expects to fund these expenditures through internally generated cash and external financing.
| For the Year | For the Year | |||||||||||||||||||||||||||||||||||||||||||||||
| 2011 | 2012 | 2013 | 2014 | 2015 | Total | 2012 | 2013 | 2014 | 2015 | 2016 | Total | |||||||||||||||||||||||||||||||||||||
| (millions of dollars) | (millions of dollars) | |||||||||||||||||||||||||||||||||||||||||||||||
Power Delivery | ||||||||||||||||||||||||||||||||||||||||||||||||
Distribution | $ | 511 | $ | 479 | $ | 483 | $ | 526 | $ | 544 | $ | 2,543 | $ | 601 | $ | 679 | $ | 729 | $ | 689 | $ | 711 | $ | 3,409 | ||||||||||||||||||||||||
Distribution - Blueprint for the Future | 128 | 59 | 8 | 92 | — | 287 | ||||||||||||||||||||||||||||||||||||||||||
Distribution – Blueprint for the Future | 120 | 3 | — | 9 | 92 | 224 | ||||||||||||||||||||||||||||||||||||||||||
Transmission | 245 | 225 | 197 | 137 | 171 | 975 | 305 | 260 | 278 | 255 | 258 | 1,356 | ||||||||||||||||||||||||||||||||||||
Transmission - MAPP | 163 | 362 | 304 | 213 | 105 | 1,147 | ||||||||||||||||||||||||||||||||||||||||||
Transmission – MAPP | 5 | 2 | 2 | 6 | 190 | 205 | ||||||||||||||||||||||||||||||||||||||||||
Gas Delivery | 20 | 20 | 20 | 20 | 20 | 100 | 22 | 23 | 23 | 25 | 27 | 120 | ||||||||||||||||||||||||||||||||||||
Other | 75 | 50 | 44 | 42 | 53 | 264 | 140 | 80 | 50 | 39 | 49 | 358 | ||||||||||||||||||||||||||||||||||||
|
|
|
|
|
| |||||||||||||||||||||||||||||||||||||||||||
Sub-Total | 1,142 | 1,195 | 1,056 | 1,030 | 893 | 5,316 | 1,193 | 1,047 | 1,082 | 1,023 | 1,327 | 5,672 | ||||||||||||||||||||||||||||||||||||
DOE Capital Reimbursement Awards (a) | (70 | ) | (26 | ) | (4 | ) | — | — | (100 | ) | (50 | ) | (3 | ) | — | — | — | (53 | ) | |||||||||||||||||||||||||||||
|
|
|
|
|
| |||||||||||||||||||||||||||||||||||||||||||
Total for Power Delivery Business | 1,072 | 1,169 | 1,052 | 1,030 | 893 | 5,216 | ||||||||||||||||||||||||||||||||||||||||||
Total for Power Delivery | 1,143 | 1,044 | 1,082 | 1,023 | 1,327 | 5,619 | ||||||||||||||||||||||||||||||||||||||||||
|
|
|
|
|
| |||||||||||||||||||||||||||||||||||||||||||
Pepco Energy Services | 16 | 12 | 9 | 2 | 1 | 40 | 14 | 7 | 7 | 7 | 7 | 42 | ||||||||||||||||||||||||||||||||||||
Corporate and Other | 3 | 3 | 3 | 3 | 3 | 15 | 3 | 3 | 3 | 3 | 3 | 15 | ||||||||||||||||||||||||||||||||||||
|
|
|
|
|
| |||||||||||||||||||||||||||||||||||||||||||
Total PHI | $ | 1,091 | $ | 1,184 | $ | 1,064 | $ | 1,035 | $ | 897 | $ | 5,271 | $ | 1,160 | $ | 1,054 | $ | 1,092 | $ | 1,033 | $ | 1,337 | $ | 5,676 | ||||||||||||||||||||||||
|
|
|
|
|
| |||||||||||||||||||||||||||||||||||||||||||
| (a) | Reflects remaining anticipated reimbursements pursuant to awards from the U.S. Department of Energy (DOE) under the American Recovery and Reinvestment Act of 2009. |
79
PEPCO HOLDINGS
Transmission and Distribution
The projected capital expenditures listed in the table for distribution (other than Blueprint for the Future), transmission (other than the MAPP project) and gas delivery are primarily for facility replacements and upgrades to accommodate customer growth and service reliability, including capital expenditures for continuing reliability enhancement efforts. For a more detailed discussion of these efforts, see “General Overview—Reliability Enhancement and Emergency Restoration Improvement Plans.”
Infrastructure Investment Plan
In 2009, the U.S. DepartmentNJBPU approved ACE’s proposed Infrastructure Investment Plan and the revenue requirement associated with recovering the cost of Energy (DOE)the related projects, subject to a prudency review in the next rate case. The approved projects were designed to enhance reliability of ACE’s distribution system and support economic activity and job growth in New Jersey in the near term. ACE was granted cost recovery through an Infrastructure Investment Surcharge, which became effective on June 1, 2009. This approved plan was completed in 2011 and has added incremental capital spending of approximately $28 million since 2009. In 2011, ACE proposed a new Infrastructure Investment Plan that if approved by the NJBPU, would be expected to add an additional $63 million of capital spending for 2012, which is included in Distribution in the table above.
Blueprint for the Future
Each of PHI’s utility subsidiaries have undertaken programs to install smart meters, further automate their electric distribution systems and enhance their communications infrastructure, which is referred to as the Blueprint for the Future. For a discussion of the Blueprint for the Future initiative, see “General Overview—Blueprint for the Future.” The projected capital expenditures over the next five years are shown as Distribution—Blueprint for the Future in the table above.
MAPP Project
PJM has approved the construction of a new 152-mile, interstate transmission line as part of PJM’s regional transmission expansion plan. In August 2011, PJM notified PHI that the scheduled in-service date for MAPP has been delayed from June 1, 2015 to the 2019 to 2021 time period. The projected capital expenditures over the next five years are shown as Transmission—MAPP in the table above.
MAPP/DOE Loan Program
To assist in the funding of the MAPP project, PHI has applied for a $684 million loan guarantee from the DOE for a substantial portion of the MAPP project, primarily the Calvert Cliffs to Indian River segment. The application has been made under a federal loan guarantee program for projects that employ innovative energy efficiency, renewable energy and advanced transmission and distribution technologies. If granted, PHI believes the guarantee could allow PHI to acquire financing at a
80
PEPCO HOLDINGS
lower cost than it would otherwise be able to obtain in the capital markets. Whether PHI’s application will be granted and, if so, the amount of debt guaranteed is subject to the discretion of the DOE and the negotiation of terms that will satisfy the conditions of the guarantee program. On February 28, 2011, the DOE issued a Notice of Intent to prepare an Environmental Impact Statement to assist the DOE in assessing the environmental impact of constructing the portion of the MAPP project to be supported by the loan guarantee. Since February 2011, the DOE has conducted field inspections of the entire route and has held public meetings to obtain input from the communities along the route.
The DOE’s review of the loan guarantee program has delayed the DOE’s review of PHI’s loan guarantee application. There is not an approval deadline under the loan guarantee program, but this program could change or be terminated in the future. PHI continues to coordinate environmental activities with the DOE.
DOE Capital Reimbursement Awards
In 2009, the DOE announced awards under the American Recovery and Reinvestment Act of 2009 of:
$105 million and $44 million in Pepco’s Maryland and District of Columbia service territories, respectively, for the implementation of an advanced metering infrastructure system, direct load control, distribution automation, and communications infrastructure.
$19 million to ACE for the implementation of direct load control, distribution automation, and communications infrastructure in its New Jersey service territory.
In April 2010, PHI and the DOE signed agreements formalizing the $168 million in awards. Of the $168 million, $130 million is expected to offset incurred and projected Blueprint for the Future and other capital expenditures of Pepco and ACE. The remaining $38 million will be used to offset incremental expenses associated with direct load control and other Pepco and ACE programs. In 2011, Pepco received award payments of $53 million and ACE received award payments of $6 million. In 2010, Pepco received award payments of $15 million and ACE received award payments of $2 million.
The Internal Revenue ServiceIRS has announced that, to the extent these grants are expended on capital items, they will not be considered taxable income.
Transmission and Distribution
The projected capital expenditures listed in the table for distribution (other than Blueprint for the Future), transmission (other than the MAPP project) and natural gas are primarily for facility replacements and upgrades to accommodate customer growth and reliability.
During 2010, Pepco announced Comprehensive Reliability Enhancement Plans for Maryland and the District of Columbia.For a more detailed discussion of these plans, see Item 1, “Business - Description of Business - Other Power Delivery Initiatives and Activities - Reliability Enhancement Plans” of this Form 10-K.
Infrastructure Investment Plan
In 2009, the NJBPU approved ACE’s proposed Infrastructure Investment Plan and the revenue requirement associated with recovering the cost of the related projects, subject to a prudency review in the next rate case. The approved projects are designed to enhance reliability of ACE’s distribution system and support economic activity and job growth in New Jersey in the near term. ACE will achieve cost recovery through an Infrastructure Investment Surcharge, which became effective on June 1, 2009. This approved plan added incremental capital spending of approximately $8 million for 2009 and $19 million for 2010, and is expected to add an additional $1 million of capital spending for 2011, which is included in Distribution in the table above.
PEPCO HOLDINGS
Blueprint for the Future
Each of PHI’s utility subsidiaries have undertaken programs to install smart meters, further automate their electric distribution systems and enhance their communications infrastructure, which they refer to as the Blueprint for the Future. For a discussion of the Blueprint for the Future initiative, see Item 1, “Business - Description of Business - Blueprint for the Future” of this Form 10-K. The projected capital expenditures over the next five years are shown as Distribution - Blueprint for the Future in the table above.
MAPP Project
PHI has under development the construction of a new 230-mile, 500-kilovolt interstate transmission line as part of PJM’s regional transmission expansion plan. For a description of the MAPP project, see Item 1, “Business - Description of Business - MAPP Project” of this Form 10-K. The projected capital expenditures over the next five years are shown as Transmission - MAPP in the table above.
MAPP/DOE Loan Program
To assist in the funding of the MAPP project, PHI has applied for a $684 million loan guarantee from the Department of Energy (DOE) for a substantial portion of the MAPP project, primarily the Calvert Cliffs to Indian River segment. The application has been made under a federal loan guarantee program for projects that employ innovative energy efficiency, renewable energy and advanced transmission and distribution technologies. If granted, PHI believes the guarantee could allow PHI to acquire financing at a lower cost than it would otherwise be able to obtain in the capital markets. Whether PHI’s application will be granted and, if so, the amount of debt guaranteed is subject to the discretion of the DOE and the negotiation of terms that will satisfy the conditions of the guarantee program.
Smart Grid Workforce Training Grant
In April 2010, the DOE awarded $4 million in federal stimulus funds to PHI as part of a three year Smart Grid Workforce Training Grant. PHI and its utility subsidiaries will use the grant to train employees in new roles as energy specialists and energy advisors, as well as to provide enhanced or supplementary training for existing roles such as customer service representatives, billing specialists and distribution engineers. PHI began the training activities in the spring of 2010.
Dividends
Pepco Holdings’ annual dividend rate on its common stock is determined by the Board of Directors on a quarterly basis and takes into consideration, among other factors, current and possible future developments that may affect PHI’s income and cash flows. In 2010,2011, PHI’s Board of Directors declared quarterly dividends of 27 cents per share of common stock payable on March 31, 2010,2011, June 30, 2010,2011, September 30, 20102011 and December 31, 2010.2011.
On January 27, 2011,26, 2012, the Board of Directors declared a dividend on common stock of 27 cents per share payable March 31, 2011,30, 2012, to shareholders of record on March 10, 2011.12, 2012.
PHI, on a stand-alone basis, generates no operating income of its own. Accordingly, its ability to pay dividends to its shareholders depends on dividends received from its subsidiaries. In addition to their future financial performance, the ability of each of PHI’s direct and indirect subsidiaries to pay dividends is subject to limits imposed by: (i) state corporate laws, which impose limitations on the funds that can be used to pay dividends and when such dividends can be paid, and, in the case of ACE, the regulatory requirement that it obtain the prior approval of the NJBPU before dividends can be paid if its equity as a percent of its total capitalization, excluding securitization debt, falls below 30%; (ii) the prior rights of holders of existing and future preferred stock, mortgage bonds and other long-term debt issued by the subsidiaries, and any preferred stock that may be issued by the subsidiaries in the future, (iii) any other restrictions imposed in connection with the incurrence of liabilities; and (iii)(iv) certain provisions of ACE’s charter that impose restrictions on payment of common stock dividends for the benefit of preferred stockholders. None of Pepco, and DPL or ACE currently have no shares of preferred stock outstanding. Currently, the capitalization ratio limitation to which ACE is subject and the restriction in the ACE charter do not limit ACE’s ability to pay common stock dividends. PHI had approximately $1,059$1,072 million and $1,268$1,059 million of retained earnings free of restrictions at December 31, 20102011 and 2009,2010, respectively. These amounts represent the total retained earnings balances at those dates.
81
PEPCO HOLDINGS
Contractual Obligations and Commercial Commitments
Summary information about Pepco Holdings’ consolidated contractual obligations and commercial commitments at December 31, 2010,2011, is as follows:
| Contractual Maturity | Contractual Maturity | |||||||||||||||||||||||||||||||||||||||
Obligation | Total | Less than 1 Year | 1-3 Years | 3-5 Years | After 5 Years | Total | Less than 1 Year | 1-3 Years | 3-5 Years | After 5 Years | ||||||||||||||||||||||||||||||
| (millions of dollars) | (millions of dollars) | |||||||||||||||||||||||||||||||||||||||
Variable Rate Demand Bonds | $ | 146 | $ | 146 | $ | — | $ | — | $ | — | $ | 146 | $ | 146 | $ | — | $ | — | $ | — | ||||||||||||||||||||
Commercial paper | 388 | 388 | — | — | — | 586 | 586 | — | — | — | ||||||||||||||||||||||||||||||
Long-term debt (a) | 4,042 | 71 | 626 | 743 | 2,602 | 4,211 | 111 | 892 | 747 | 2,461 | ||||||||||||||||||||||||||||||
Long-term project funding | 19 | 4 | 4 | 3 | 8 | 15 | 2 | 4 | 3 | 6 | ||||||||||||||||||||||||||||||
Interest payments on debt | 3,326 | 238 | 467 | 374 | 2,247 | 3,162 | 244 | 441 | 365 | 2,112 | ||||||||||||||||||||||||||||||
Capital leases | 136 | 15 | 30 | 30 | 61 | 121 | 15 | 30 | 30 | 46 | ||||||||||||||||||||||||||||||
Operating leases | 533 | 34 | 64 | 58 | 377 | 530 | 39 | 71 | 61 | 359 | ||||||||||||||||||||||||||||||
Estimated pension plan contributions | 150 | 150 | — | — | — | |||||||||||||||||||||||||||||||||||
Estimated pension and OPEB plan contributions | 235 | 235 | — | — | — | |||||||||||||||||||||||||||||||||||
Non-derivative fuel and purchase power contracts (b) | 5,613 | 922 | 1,064 | 711 | 2,916 | 4,102 | 553 | 716 | 708 | 2,125 | ||||||||||||||||||||||||||||||
|
|
|
|
| ||||||||||||||||||||||||||||||||||||
Total (c) | $ | 14,353 | $ | 1,968 | $ | 2,255 | $ | 1,919 | $ | 8,211 | $ | 13,108 | $ | 1,931 | $ | 2,154 | $ | 1,914 | $ | 7,109 | ||||||||||||||||||||
|
|
|
|
| ||||||||||||||||||||||||||||||||||||
| (a) | Includes transition bonds issued by |
| (b) | Excludes contracts for the purchase of electricity to satisfy Default Electricity Supply load service obligations which have neither a fixed commitment amount nor a minimum purchase amount. In addition, costs are recoverable from customers. |
| (c) | Excludes |
Third Party Guarantees, Indemnifications and Off-Balance Sheet Arrangements
PHI and certain of its subsidiaries have various financial and performance guarantees and indemnification obligations that they have entered into in the normal course of business to facilitate commercial transactions with third parties.
As of December 31, 2011, PHI and its subsidiaries were parties to a variety of agreements pursuant to which they were guarantors for standby letters of credit, energy procurement obligations, and other commitments and obligations. Such agreements include performance and payment guarantees of PHI aggregating $175 million related to Pepco Energy Services. For aadditional discussion of PHI’s third party guarantees, indemnifications, obligations and off-balance sheet arrangements, see Note (17), “Commitments and Contingencies,” to the consolidated financial statements of PHI, set forth in Part II, Item 8 of this Form 10-K.PHI.
82
PEPCO HOLDINGS
Energy Contract Net Asset Activity
The following table provides detail on changes in the net asset or liability positions of both the Pepco Energy Services segment and the former Conectiv Energy segment with respect to energy commodity contracts for the year ended December 31, 2010.2011. The balances in the table are pre-tax and the derivative assets and liabilities reflect netting by counterparty before the impact of collateral.
PEPCO HOLDINGS
| Energy Commodity Activities (a) | ||||
| (millions of dollars) | ||||
Total Fair Value of Energy Contract Net Liabilities at December 31, 2009 | $ | (328 | ) | |
Current period unrealized losses | (3 | ) | ||
Effective portion of changes in fair value - recorded in Accumulated Other Comprehensive Loss | (100 | ) | ||
Cash flow hedge ineffectiveness - recorded in income | — | |||
Recognition of realized gains (losses) on settlement of contracts | 137 | |||
Derivative activity associated with Conectiv Energy | 76 | |||
Total Fair Value of Energy Contract Net Liabilities at December 31, 2010 | $ | (218 | ) | |
Detail of Fair Value of Energy Contract Net Liabilities at December 31, 2010 (see above) | ||||
Derivative assets (current assets) | $ | 22 | ||
Derivative assets (non-current assets) | — | |||
Derivative assets held for sale | 7 | |||
Total Fair Value of Energy Contract Assets | 29 | |||
Derivative liabilities (current liabilities) | (144 | ) | ||
Derivative liabilities (non-current liabilities) | (13 | ) | ||
Derivative liabilities held for sale | (90 | ) | ||
Total Fair Value of Energy Contract Liabilities | (247 | ) | ||
Total Fair Value of Energy Contract Net Liabilities | $ | (218 | ) | |
| Energy Commodity Activities (a) | ||||
| (millions of dollars) | ||||
Total Fair Value of Energy Contract Net Liabilities at December 31, 2010 | $ | (135 | ) | |
Current period unrealized losses | (30 | ) | ||
Effective portion of changes in fair value—recorded in Accumulated Other Comprehensive Loss | — | |||
Cash flow hedge ineffectiveness—recorded in income | (1 | ) | ||
Reclassification to realized on settlement of contracts | 83 | |||
|
| |||
Total Fair Value of Energy Contract Net Liabilities at December 31, 2011 | $ | (83 | ) | |
|
| |||
Detail of Fair Value of Energy Contract Net Liabilities at December 31, 2011 (see above) | ||||
Derivative liabilities (current liabilities) | $ | (81 | ) | |
Derivative liabilities (non-current liabilities) | (2 | ) | ||
|
| |||
Total Fair Value of Energy Contract Liabilities | (83 | ) | ||
|
| |||
Total Fair Value of Energy Contract Net Liabilities | $ | (83 | ) | |
|
| |||
(a) Includes all effective hedging activities from continuing operations recorded at fair value through Accumulated Other Comprehensive Loss (AOCL) or trading activities from continuing operations recorded at fair value in the consolidated statements of income. |
| |||
The $218$83 million net liability on energy contracts at December 31, 20102011 was primarily attributable to losses on power swaps and natural gas futures and swaps designated as hedges of future energy purchases for delivery to retail customers under FASB guidance on derivatives and hedging (ASC 815). Prices of electricity and natural gas declined during the year, which resulted in unrealized losses on the energy contracts ofheld by Pepco Energy Services and Conectiv Energy.Services. Pepco Energy Services recorded unrealized lossesServices’ net liability decreased to $83 million at December 31, 2011 from $135 million at December 31, 2010 primarily due to settlements of $100 million on energy contracts in AOCL as these energy contracts were effective hedges under the FASB guidance.derivatives. PHI expects that when these energy contracts settle, the related realized gains or lossesfuture revenues from existing customer sales obligations that are accounted for on an accrual basis will be largely offset by theexpected realized loss or gainnet losses on futurePepco Energy Services’ energy purchases or production that will be used to settle the sales obligations with its customers.contracts.
83
PEPCO HOLDINGS
PHI uses its best estimates to determine the fair value of the commodity and derivative contracts that are held and soldentered into by Pepco Energy Services and Conectiv Energy.Services. The fair values in each category presented below reflect forward prices and volatility factors as of December 31, 20102011, and the fair values are subject to change as a result of changes in these prices and factors. As of December 31, 2011, all of these contracts were held by Pepco Energy Services.
| Fair Value of Contracts at December 31, 2010 Maturities | ||||||||||||||||||||
Source of Fair Value | 2011 | 2012 | 2013 | 2014 and Beyond | Total Fair Value | |||||||||||||||
| (millions of dollars) | ||||||||||||||||||||
Energy Commodity Activities, net (a) | ||||||||||||||||||||
Actively Quoted (i.e., exchange-traded) prices | $ | (54 | ) | $ | (19 | ) | $ | (6 | ) | $ | (1 | ) | $ | (80 | ) | |||||
Prices provided by other external sources (b) | (93 | ) | (42 | ) | (6 | ) | — | (141 | ) | |||||||||||
Modeled (c) | — | — | 1 | 2 | 3 | |||||||||||||||
Total | $ | (147 | ) | $ | (61 | ) | $ | (11 | ) | $ | 1 | $ | (218 | ) | ||||||
| Fair Value of Contracts at December 31, 2011 Maturities | ||||||||||||||||||||
Source of Fair Value | 2012 | 2013 | 2014 | 2015 and Beyond | Total Fair Value | |||||||||||||||
| (millions of dollars) | ||||||||||||||||||||
Energy Commodity Activities, net (a) | ||||||||||||||||||||
Actively Quoted (i.e., exchange-traded) prices | $ | (37 | ) | $ | (9 | ) | $ | (2 | ) | $ | — | $ | (48 | ) | ||||||
Prices provided by other external sources (b) | (26 | ) | (7 | ) | — | — | (33 | ) | ||||||||||||
Modeled (c) | (2 | ) | — | — | — | (2 | ) | |||||||||||||
|
|
|
|
|
|
|
|
|
| |||||||||||
Total | $ | (65 | ) | $ | (16 | ) | $ | (2 | ) | $ | — | $ | (83 | ) | ||||||
|
|
|
|
|
|
|
|
|
| |||||||||||
| (a) | Includes all effective hedging activities recorded at fair value through AOCL, and hedge ineffectiveness and trading activities on the statements of income, as required. |
| (b) | Prices provided by other external sources reflect information obtained from over-the-counter brokers, industry services, or multiple-party on-line platforms that are readily observable in the market. |
| (c) | Modeled values include significant inputs, usually representing more than 10% of the valuation, not readily observable in the market. The modeled valuation above represents the fair valuation of certain long-dated power transactions based on limited observable broker prices extrapolated for periods beyond two years into the future. |
Contractual Arrangements with Credit Rating Triggers or Margining Rights
Under certain contractual arrangements entered into by PHI’s subsidiaries, the subsidiary may be required to provide cash collateral or letters of credit as security for its contractual obligations if the credit ratings of PHI or the subsidiary are downgraded. In the event of a downgrade, the amount required to be posted would depend on the amount of the underlying contractual obligation existing at the time of the downgrade. Based on contractual provisions in effect at December 31, 2010,2011, a downgrade in the unsecured debt credit ratings of PHI or each of its rated subsidiaries to below “investment grade” would increase the collateral obligation of PHI and its subsidiaries by up to $359$233 million, $62 millionnone of which is related to the discontinued operations of Conectiv Energy, and $176$124 million of which is the net settlement amount attributable to derivatives, normal purchase and normal sale contracts, collateral, and other contracts under master netting agreements as described in Note (15), “Derivative Instruments and Hedging Activities,” to the consolidated financial statements of PHI, set forth in Part II, Item 8 of this Form 10-K.PHI. The remaining $121$109 million of the collateral obligation that would be incurred in the event PHI were downgraded to below “investment grade” is attributable primarily to energy services contracts and accounts payable to independent system operators and distribution companies on full requirements contracts entered into by Pepco Energy Services. PHI believes that it and its utility subsidiaries currently have sufficient liquidity to fund their operations and meet their financial obligations.
Many of the contractual arrangements entered into by PHI’s subsidiaries in connection with competitive energy and Default Electricity Supply activities include margining rights pursuant to which the PHI subsidiary or a counterparty may request collateral if the market value of the contractual obligations reaches levels in excess of the credit thresholds established in the applicable arrangements. Pursuant to these margining rights, the affected PHI subsidiary may receive, or be required to post, collateral due to energy price movements. As of December 31, 2010,2011, Pepco Energy Services provided net cash collateral in the amount of $117 million and Conectiv Energy provided net cash collateral in the amount of $104$112 million in connection with these activities.
84
PEPCO HOLDINGS
Environmental Remediation Obligations
PHI’s accrued liabilities for environmental remediation obligations as of December 31, 2010 include approximately $292011 totaled $30 million, of which approximately $5$6 million is expected to be incurred in 2011,2012, for potential environmental cleanup and related costs at sites owned or formerly owned by an operating subsidiary where an operating subsidiary is a potentially responsible party or is alleged to be a third-party contributor. For further information concerning the remediation obligations associated with these sites, see Note (17), “Commitments and Contingencies,” to the consolidated financial statements of PHI, set forth in Part II, Item 8 of this Form 10-K.PHI. For information regarding projected expenditures for environmental control facilities, see Item 1 “Business — “Business—Environmental Matters,Matters.” of this Form 10-K. The most significant environmental remediation obligations as of December 31, 2010, were approximately:2011, are for the following items:
$14 million, of which approximately $600,000 is expected to be incurred in 2011, in environmentalEnvironmental investigation and remediation costs payable by Pepco with respect to the Benning Road site.
$5 million, of which approximately $1 million is expected to be incurred in 2011,Amounts payable by DPL in accordance with a 2001 consent agreement reached with the Delaware Department of Natural Resources and Environmental Control, for remediation, site restoration, natural resource damage compensatory projects and other costs associated with environmental contamination that resulted from an oil release at the Indian River power plant, which DPL sold in June 2001.
$4 million, none of which is expected to be incurred in 2011, for potential ISRAPotential compliance remediation costs under New Jersey’s Industrial Site Recovery Act payable by PHI associated with the retained environmental exposure from the sale of the Conectiv Energy wholesale power generation business.
$2 million, of which approximately $1.6 million is expected to be incurred in 2011,Amounts payable by DPL in connection with the Wilmington Coal Gas South site located in Wilmington, Delaware, to remediate residual material from the historical operation of a manufactured gas plant.
Less than $4 million, payable by various PHI subsidiaries to resolve miscellaneous alleged environmental liabilities. Approximately $115,000 is expected to be incurred in 2011.
Sources of Capital
Pepco Holdings’ sources to meet its long-term funding needs, such as capital expenditures, dividends, and new investments, and its short-term funding needs, such as working capital and the temporary funding of long-term funding needs, include internally generated funds, issuances by PHI, Pepco, DPL and ACE under their commercial paper programs, securities issuances, short-term loans, and bank financing under new or existing facilities. PHI’s ability to generate funds from its operations and to access capital and credit markets is subject to risks and uncertainties. Volatile and deteriorating financial market conditions, diminished liquidity and tightening credit may affect access to certain of PHI’s potential funding sources. See Item 1A, “Risk Factors,” of this Form 10-K for additional discussion of important factors that may impact these sources of capital.
Cash Flow from Operations
Cash flow generated by regulated utility subsidiaries in the Power Delivery business is the primary source of PHI’s cash flow from operations. Additional cash flows are generated by the business of Pepco Energy Services and from the occasional sale of non-core assets.
PEPCO HOLDINGS
Short-Term Funding Sources
Pepco Holdings and its regulated utility subsidiaries have traditionally used a number of sources to fulfill short-term funding needs, such as commercial paper, short-term notes and bank lines of credit. Proceeds from short-term borrowings are used primarily to meet working capital needs but may also be used to temporarily fund long-term capital requirements.
85
PEPCO HOLDINGS
As of December 31, 2011, Pepco Holdings, Pepco, DPL and ACE each maintains an ongoing commercial paper program ofpursuant to which each entity has the ability to issue up to $875 million. Pepcomillion, $500 million, $500 million and DPL have ongoing$250 million, respectively, of commercial paper. In January 2012, the PHI Board of Directors approved an increase in the maximum amount of commercial paper programs of upthat PHI is authorized to $500 million each, and ACE upissue under its commercial paper program to $250 million.$1.25 billion. The commercial paper can be issued with maturities of up to 270 days.
Long-Term Funding Sources
The sources of long-term funding for PHI and its subsidiaries are the issuance of debt and equity securities and borrowing under long-term credit agreements. Proceeds from long-term financings are used primarily to fund long-term capital requirements, such as capital expenditures and new investments, and to repay or refinance existing indebtedness.
Regulatory Restrictions on Financing Activities
The issuance of debt securities by PHI’s principal subsidiaries requires the approval of either FERC or one or more state public utility commissions. Neither FERC approval nor state public utility commission approval is required as a condition to the issuance of securities by PHI.
State Financing Authority
Pepco’s long-term financing activities (including the issuance of securities and the incurrence of debt) are subject to authorization by the DCPSC and MPSC. DPL’s long-term financing activities are subject to authorization by the MPSC and the Delaware Public Service Commission.DPSC. ACE’s long-term and short-term (consisting of debt instruments with a maturity of one year or less) financing activities are subject to authorization by the NJBPU. Each utility, through periodic filings with the state public service commission(s) having jurisdiction over its financing activities, typically seeks to maintainhas maintained standing authority sufficient to cover its projected financing needs over a multi-year period.
FERC Financing Authority
Under the Federal Power Act (FPA), FERC has jurisdiction over the issuance of long-term and short-term securities of public utilities, but only if the issuance is not regulated by the state public utility commission in which the public utility is organized and operating. Under these provisions, FERC has jurisdiction over the issuance of short-term debt by Pepco and DPL. Pepco and DPL have obtained FERC authority for the issuance of short-term debt. Because Pepco Energy Services also qualifies as a public utility under the FPA and is not regulated by a state utility commission, FERC also has jurisdiction over the issuance of securities by Pepco Energy Services. Pepco Energy Services has obtained the requisite FERC financing authority in its market-based rate orders.
Money Pool
Pepco Holdings operates a system money pool under a blanket authorization adopted by FERC. The money pool is a cash management mechanism used by Pepco Holdings to manage the short-term investment and borrowing requirements of its subsidiaries that participate in the money pool. Pepco Holdings may invest in but not borrow from the money pool. Eligible subsidiaries with surplus cash may deposit those funds in the money pool. Deposits in the money pool are guaranteed by Pepco Holdings. Eligible subsidiaries with cash requirements may borrow from the money pool. Borrowings from the money pool are unsecured. Depositors in the money pool receive, and borrowers from the money pool pay, an interest rate based primarily on Pepco Holdings’ short-term borrowing rate. Pepco Holdings deposits funds in the money pool to the extent that the pool has insufficient funds to meet the borrowing needs of its participants, which may require Pepco Holdings to borrow funds for deposit from external sources.
86
PEPCO HOLDINGS
Regulatory And Other Matters
Rate Proceedings
Distribution
The rates that each of Pepco, DPL and ACE is permitted to charge for the retail distribution of electricity and natural gas to its various classes of customers are based on the principle that the utility is entitled to generate an amount of revenue sufficient to recover the cost of providing the service, including a reasonable rate of return on its invested capital. These “base rates” are intended to cover all of each utility’s reasonable and prudent expenses of constructing, operating and maintaining its distribution facilities (other than costs covered by specific cost-recovery surcharges).
A change in base rates in a jurisdiction requires the approval of public service commission. In the rate application submitted to the public service commission, the utility specifies an increase in its “revenue requirement,” which is the additional revenue that the utility is seeking authorization to earn. The “revenue requirement” consists of (i) the allowable expenses incurred by the utility, including operation and maintenance expenses, taxes and depreciation, and (ii) the utility’s cost of capital. The compensation of the utility for its cost of capital takes the form of an overall “rate of return” allowed by the public service commission on the utility’s distribution “rate base” to compensate the utility’s investors for their debt and equity investments in the company. The “rate base”rate base is the aggregate value of the investment in property used by the utility in providing electricity and natural gas distribution services and generally consists of plant in service net of accumulated depreciation and accumulated deferred taxes, plus cash working capital, material and operating supplies and, depending on the jurisdiction, construction work in progress. Over time, the rate base is increased by utility property additions and reduced by depreciation and property retirements and write-offs.
In addition to its base rates, some of the costs of providing distribution service are recovered through the operation of surcharges. Examples of costs recovered by PHI’s utility subsidiaries through surcharges, which vary depending on the jurisdiction, include: a surcharge to reimburse the utility for the cost of purchasing electricity from non-utility generation sourcesNUGs (New Jersey); surcharges to reimburse the utility for costs of public interest programs for low income customers (New Jersey, Maryland, Delaware and the District of Columbia); a surcharge to pay the Transitional Bond Charge (New Jersey); and surcharges to reimburse the utility for certain environmental costs (Delaware and Maryland).
Each utility subsidiary regularly reviews its distribution rates in each jurisdiction of its service territory, and from time to time files applications to adjust its rates as necessary in an effort to ensure that its revenues are sufficient to cover its operating expenses and its cost of capital. The timing of future rate filings and the change in the distribution rate requested will depend on a number of factors, including changes in revenues and expenses and the incurrence or the planned incurrence of capital expenditures. In the third quarter of 2011, Pepco currently expects to filefiled an electricityelectric distribution base rate increase application in the District of Columbia and Maryland, and ACE currently expects to filefiled an electricityelectric distribution base rate increase application in New Jersey. In the fourth quarter of 2011, DPL filed an electric distribution base rate increase application in Delaware and Maryland. Also in the fourth quarter of 2011, Pepco filed an electric distribution base rate increase application in Maryland. DPL currently expects to file a natural gas distribution base rate increase application in early 2012.2013.
In general, a request for new distribution rates is made on the basis of “test year” balances for rate base allowable operating expenses and a requested rate of return. The test year amounts used in the filing may be historical or partially projected. The public service commission may, however, select a different test period than that proposed by the company. Although the approved tariff rates are intended to be forward-looking, and therefore provide for the recovery of some future changes in rate base and operating costs, they typically do not reflect all of the changes in costs for the period in which the new rates are in effect.
87
PEPCO HOLDINGS
If revenues do not keep pace with increases in costs, this situation will result in a lag between when the costs are incurred and when the utility can begin to recover those costs through its rates.
The following table shows, for each of the PHI utility subsidiaries, the authorized return on equity as determined in the most recently concluded base rate proceeding and the date as of which the rate as determined in the proceeding was implemented:
Rate Base (In millions) | Authorized Return on Equity | Rate Effective Date | ||||||
Pepco: | ||||||||
District of Columbia (electricity) | 9.625% | March 2010 | ||||||
Maryland (electricity) | ||||||||
DPL: | ||||||||
Delaware (electricity) | April 2010 | |||||||
Maryland (electricity) | July 2011 | |||||||
Delaware (natural gas) | February 2011 | |||||||
ACE: | ||||||||
New Jersey (electricity) | 10.30% | June 2010 | ||||||
(a) Cost of equity at 10% for purposes of calculating allowance for funds used during construction and regulatory asset carrying costs. | ||||||||
Transmission
The rates Pepco, DPL and ACE are permitted to charge for the transmission of electricity are regulated by FERC and are based on each utility’s transmission rate base, transmission operating expenses and an overall rate of return that is approved by FERC. For each utility subsidiary, FERC has approved a formula for the calculation of the company’sutility transmission rate, which is referred to as a “formula rate.” The formula rates include both fixed and variable elements. Certain of the fixed elements, such as the return on equity and depreciation rates, can be changed only in a FERC rate proceeding. The variable elements of the formula, including the utility’s rate base and operating expenses, are updated annually, effective June 1 of each year, with data from the utility’s most recent annual FERC Form 1 filing.
In addition to its formula rate, each utility’s return on equity is supplemented by incentive rates, sometimes referred to as “adders,” and other incentives, which are authorized by FERC to promote capital investment in transmission infrastructure. For example, inIn connection with the MAPP project, FERC has authorized for each of Pepco and DPL a 150 basis point adder to its return on equity, resulting in a FERC-approved rate of return on the MAPP project of 12.8%, along with full recovery of construction work in progress and prudently incurred abandoned plant costs. Additional return on equity adders are in effect for each of Pepco, DPL and ACE relating to specific transmission upgrades and improvements, as well as in consideration for each utility’s continued membership in PJM. As members of PJM, the transmission rates of Pepco, DPL and ACE are set out in PJM’s Open Access Transmission Tariff.
For a discussion of pending state public utility commission and FERC rate proceedings, see Note (17)(7), “Commitments and Contingencies,“Regulatory Matters,” to the consolidated financial statements of PHI set forth in Part II, Item 8, of this Form 10-K.PHI.
88
PEPCO HOLDINGS
Legal Proceedings and Other Regulatory Matters
For a discussion of legal proceedings, and other regulatory matters, see Note (17), “Commitments and Contingencies,” to the consolidated financial statements of PHI, set forth in Part II, Item 8and for a discussion of this Form 10-K.regulatory matters, see Note (7), “Regulatory Matters,” to the consolidated financial statements of PHI.
PEPCO HOLDINGS
Critical Accounting Policies
General
Pepco HoldingsPHI has identified the following accounting policies includingthat result in having to make certain estimates that, as a result of the judgments, uncertainties, uniqueness and complexities of the underlying accounting standards and operations involved, could result in material changes in its financial condition or results of operations under different conditions or using different assumptions. Pepco HoldingsPHI has discussed the development, selection and disclosure of each of these policies with the Audit Committee of the Board of Directors.
Goodwill Impairment Evaluation
Substantially all of PHI’s goodwill was generated by Pepco’s acquisition of Conectiv in 2002 and is allocated entirely to the Power Delivery reporting unit for purposes of assessing impairment under FASB guidance on goodwill and other intangibles (ASC 350). Management has identified Power Delivery as a single reporting unit based on the aggregation ofbecause its components which have similar economic characteristics, similar products and services and operate in a similar regulatory environment.
PHI tests its goodwill impairment at least annually as of November 1 and on an interim basis if an event occurs or circumstances change that would more likely than not reduce the fair value of a reporting unit below its carrying amount. Factors that may result in an interim impairment test include, but are not limited to: a change in identified reporting units; an adverse change in business conditions; a protracted decline in stock price causing market capitalization to fall below book value; an adverse regulatory action; or impairment of long-lived assets in the reporting unit.
The first step of the goodwill impairment test compares the fair value of the reporting unit with its carrying amount, including goodwill. Management uses its best judgment to make reasonable projections of future cash flows for Power Delivery when estimating the reporting unit’s fair value. In addition, PHI selects a discount rate for the associated risk with those estimated cash flows. These judgments are inherently uncertain, and actual results could vary from those used in PHI’s estimates. The impact of such variations could significantly alter the results of a goodwill impairment test, which could materially impact the estimated fair value of Power Delivery and potentially the amount of any impairment recorded in the financial statements.
PHI tests its goodwill impairment at least annually as of November 1 and on an interim basis if an event occurs or circumstances change that would more likely than not reduce the fair value of a reporting unit below its carrying amount. Factors that may result in an interim impairment test include, but are not limited to: a change in identified reporting units; an adverse change in business conditions; a protracted decline in stock price causing market capitalization to fall below book value; an adverse regulatory action; or impairment of long-lived assets in the reporting unit.
PHI’s November 1, 20102011 annual impairment test indicated that its goodwill was not impaired. See Note (6), “Goodwill,” to the consolidated financial statements of PHI, set forth in Part II, Item 8 of this Form 10-K. Although PHI’s market capitalization remained below book value as of December 31, 2010, PHI did not perform an interim goodwill impairment test because its market capitalization relative to book value improved compared to earlier periods in which it performed an interim impairment test and there were no other indicators of potential impairment. PHI performed interim tests of goodwill for impairment as of March 31, 2009 and as of December 31, 2008 as its market capitalization was below its book value at both points in time and its market capitalization relative to book value had significantly declined. PHI concluded that its goodwill was not impaired at these interim dates.PHI.
In order to estimate the fair value of the Power Delivery reporting unit, PHI uses two valuation techniques: an income approach and a market approach. The income approach estimates fair value based on a discounted cash flow analysis using estimated future cash flows and a terminal value that is consistent with Power Delivery’s long-term view of the business. This approach uses a discount rate based on the estimated weighted average cost of capital (WACC) for the reporting unit. PHI determines the estimated WACC by considering market-based information for the cost of equity and cost of debt that is appropriate for the Power Delivery business as of the measurement date. The market approach estimates fair value based on a multiple of earnings before interest, taxes, depreciation, and amortization (EBITDA) that management believes is consistent with EBITDA multiples for comparable utilities. PHI has consistently used this valuation framework to estimate the fair value of Power Delivery.
89
PEPCO HOLDINGS
The estimation of fair value is dependent on a number of factors that are sourced from the Power Delivery reporting unit’s business forecast, including but not limited to interest rates, growth assumptions, returns on rate base, operating and capital expenditure requirements, and other factors, changes in which could materially impact the results of impairment testing. Assumptions and methodologies used in the models were consistent with historical experience. A hypothetical 10 percent decrease in fair value of the Power Delivery reporting unit at November 1, 20102011 would not have resulted in the Power Delivery reporting unit failing the first step of the impairment test, as defined in the guidance, as the estimated fair value of the reporting unit would have been above its carrying value. Sensitive, interrelated and uncertain variables that could decrease the estimated fair value of the Power Delivery reporting unit include utility sector market performance, sustained adverse business conditions, change in forecasted revenues, higher operating and maintenance capital expenditure requirements, a significant increase in the cost of capital, and other factors.
PHI believes that the estimates involved in its goodwill impairment evaluation process represent “Critical Accounting Estimates” because they are subjective and susceptible to change from period to period as management makes assumptions and judgments, and the impact of a change in assumptions and estimates could be material to financial results.
Long-Lived Assets Impairment Evaluation
Pepco HoldingsPHI believes that the estimates involved in its long-lived asset impairment evaluation process represent “Critical Accounting Estimates” because (i) they are highly susceptible to change from period to period because management is required to make assumptions and judgments about when events indicate the carrying value may not be recoverable and how to estimate undiscounted and discounted future cash flows and fair values, which are inherently uncertain, (ii) actual results could vary from those used in Pepco Holdings’PHI’s estimates and the impact of such variations could be material, and (iii) the impact that recognizing an impairment would have on Pepco Holdings’PHI’s assets as well as the net loss related to an impairment charge could be material. The primary assets subject to a long-lived asset impairment evaluation are property, plant, and equipment.
The FASB guidance on the accounting for the impairment or disposal of long-lived assets (ASC 360), requires that certain long-lived assets must be tested for recoverability whenever events or circumstances indicate that the carrying amount may not be recoverable, such as (i) a significant decrease in the market price of a long-lived asset or asset group, (ii) a significant adverse change in the extent or manner in which a long-lived asset or asset group is being used or in its physical condition, (iii) a significant adverse change in legal factors or in the business climate, including an adverse action or assessment by a regulator, (iv) an accumulation of costs significantly in excess of the amount originally expected for the acquisition or construction of a long-lived asset or asset group, (v) a current-period operating or cash flow loss combined with a history of operating or cash flow losses or a projection or forecast that demonstrates continuing losses associated with the use of a long-lived asset or asset group, and (vi) a current expectation that, more likely than not, a long-lived asset or asset group will be sold or otherwise disposed of significantly before the end of its previously estimated useful life.
An impairment loss may only be recognized if the carrying amount of an asset is not recoverable and the carrying amount exceeds its fair value. The asset is deemed not to be recoverable when its carrying amount exceeds the sum of the undiscounted future cash flows expected to result from the use and eventual disposition of the asset. In order to estimate an asset’s future cash flows, Pepco HoldingsPHI considers historical cash flows. Pepco HoldingsPHI uses its best estimates in making these evaluations and considers various factors, including forward price curves for energy, fuel costs, legislative initiatives, and operating costs. If necessary, the process of determining fair value is done consistentperformed consistently with the process described in assessing the fair value of goodwill discussed above.
90
PEPCO HOLDINGS
Accounting for Derivatives
Pepco HoldingsPHI believes that the estimates involved in accounting for its derivative instruments represent “Critical Accounting Estimates” because management exercises judgment in the following areas, any of which could have a material impact on its financial statements: (i) the application of the definition of a derivative to contracts to identify derivatives, (ii) the election of the normal purchases and normal sales exception from derivative accounting, (iii) the application of cash flow hedge accounting, and (iv) the estimation of fair value used in the measurement of derivatives and hedged items, which are highly susceptible to changes in value over time due to market trends or, in certain circumstances, significant uncertainties in modeling techniques used to measure fair value that could result in actual results being materially different from Pepco Holdings’PHI’s estimates. See Note (2), “Significant Accounting Policies — Policies—Accounting for Derivatives,” and Note (15), “Derivative Instruments and Hedging Activities,” to the consolidated financial statements of PHI, set forth in Part II, Item 8 of this Form 10-K for information on PHI’s accounting for derivatives.PHI.
Pepco HoldingsPHI and its subsidiaries use derivative instruments primarily to manage risk associated with commodity prices. The definition of a derivative in the FASB guidance results in management having to exercise judgment, such as whether there is a notional amount or net settlement provision in contracts. Management assesses a number of factors before determining whether it can designate derivatives for the normal purchase or normal sale exception from derivative accounting, including whether it is probable that the contracts will physically settle with delivery of the underlying commodity. The application of cash flow hedge accounting often requires judgment in the prospective and retrospective assessment and measurement of hedge effectiveness as well as whether it is probable that the forecasted transaction will occur. The fair value of derivatives is determined using quoted exchange prices where available. For instruments that are not traded on an exchange, external broker quotes are used to determine fair value. For some custom and complex instruments, internal models use market information when external broker quotes are not available. For certain long-dated instruments, broker or exchange data is extrapolated for future periods where information is limited. Models are also used to estimate volumes for certain transactions. The same valuation methods are used for risk management purposes to determine the value of non-derivative, commodity exposure.
Pension and Other Postretirement Benefit Plans
Pepco HoldingsPHI believes that the estimates involved in reporting the costs of providing pension and other postretirementOPEB benefits represent “CriticalCritical Accounting Estimates”Estimates because (i) they are based on an actuarial calculation that includes a number of assumptions which are subjective in nature, (ii) they are dependent on numerous factors resulting from actual plan experience and assumptions of future experience, and (iii) changes in assumptions could impact Pepco Holdings’PHI’s expected future cash funding requirements for the plans and would have an impact on the projected benefit obligations, which affect the reported amount of annual net periodic pension and other postretirement benefitOPEB cost on the income statement.
Assumptions about the future, including the discount rate applied to benefit obligations, the expected long-term rate of return on plan assets, the anticipated rate of increase in health care costs and participant compensation have a significant impact on employee benefit costs.
The discount rate for determining the pension benefit obligation was 5.65%5.00% and 6.40%5.65% as of December 31, 20102011 and 2009,2010, respectively. The discount rate for determining the postretirement benefit obligation was 5.60%4.90% and 6.30%5.60% as of December 31, 20102011 and 2009,2010, respectively. PHI utilizes an analytical tool developed by its actuaries to select the discount rate. The analytical tool utilizes a high-quality bond portfolio with cash flows that match the benefit payments expected to be made under the plans.
PEPCO HOLDINGS
The expected long-term rate of return on plan assets was 8.00%7.75% and 8.25%8.00% as of December 31, 2011 and 2010, and 2009, respectively. In selecting anPHI uses a building block approach to estimate the expected long-term rate of return on plan assets. Under this approach, the percentage of plan assets PHI considers actual historical returns, economic forecasts and the judgment of its investment consultants on expected long-term performance for the types of investments held by the plan. The estimatedin each asset class returns are weighted byaccording to PHI’s target asset allocation.allocation, at the beginning of the year, is applied to the expected asset return for the related asset class. PHI incorporates long-term assumptions for real returns, inflation expectations, volatility, and correlations among asset classes to determine expected returns for the related asset class. The plan assets consist of equity, fixed income, investments, real estate and private equity and when viewed over a long-term horizon,investments. The plan assets are expected to yield a return on assets of 8.00%7.75% as of December 31, 2010.2011 when viewed over a long-term horizon.
Assumptions about the future, including the expected return on plan assets, discount rate applied to benefit obligations, the anticipated rate of increase in health care costs and participant compensation have a significant impact on employee benefit costs.
91
PEPCO HOLDINGS
The following table reflects the effect on the projected benefit obligation for the pension plan and the accumulated benefit obligation for the OPEB plan, as well as the net periodic cost associated with changing thefor both plans, if there were changes in these critical actuarial assumptions while holding all other actuarial assumptions constant:
(in millions, except percentages) | Change in Assumptions | Impact on Projected Benefit Obligation | Projected Increase in 2010 Net Periodic Cost | |||||||||
Pension Plan | ||||||||||||
Discount rate | (0.25 | )% | $ | 40 | $ | 3 | ||||||
Expected return | (0.25 | )% | — | (a) | 4 | |||||||
Postretirement Benefit Plan | ||||||||||||
Discount rate | (0.25 | )% | $ | 16 | $ | 1 | ||||||
Expected return | (0.25 | )% | — | (a) | 1 | |||||||
Healthcare cost trend | 1.00 | % | 32 | 2 | ||||||||
(in millions, except percentages) | Change in Assumptions | Impact on Benefit Obligation | Projected Increase in 2011 Net Periodic Cost | |||||||||
Pension Plan | ||||||||||||
Discount rate | (0.25 | )% | $ | 61 | $ | 5 | ||||||
Expected return | (0.25 | )% | — | (a) | 5 | |||||||
Postretirement Benefit Plan | ||||||||||||
Discount rate | (0.25 | )% | $ | 20 | $ | 1 | ||||||
Expected return | (0.25 | )% | — | (a) | 1 | |||||||
Health care cost trend rate | 1.00 | % | 32 | 2 | ||||||||
(a) A change in the expected return assumption has no impact on the Projected Benefit Obligation. |
| |||||||||||
The impact of changes in assumptions and the difference between actual and expected or estimated results on pension and postretirement obligations is generally recognized over the working lives of the employees who benefit under the plans rather than immediately recognizedimmediate recognition in the statements of income.
For additional discussion, see Note (10), “Pension and Other Postretirement Benefits,” to the consolidated financial statements of PHI, set forth in Part II, Item 8 of this Form 10-K.PHI.
Accounting for Regulated Activities
FASB guidance on the accounting for regulated activities, Regulated Operations (ASC 980), applies to the Power Delivery businesses of Pepco, DPL, and ACE and can result in the deferral of costs or revenue that would otherwise be recognized by non-regulated entities. PHI defers the recognition of costs and records regulatory assets when it is probable that those costs will be recovered in future rates charged to its customers.customer rates. PHI defers the recognition of revenues and records regulatory liabilities when it is probable that it will refund payments received from customers in the future or that it will incur future costs related to the payments currently received from customers. Pepco HoldingsPHI believes that the judgments involved in accounting for its regulated activities represent “Critical Accounting Estimates” because (i) management must interpret laws and regulatory commission orders to assess the probability of the recovery of costs from customersin customer rates or the return of revenues to customers when determining whether those costs or revenues should be deferred, (ii) decisions made by regulatory commissions or legislative changes at a later date could vary from earlier interpretations made by management and the impact of such variations could be material, and (iii) writing offthe elimination of a regulatory asset because deferred costs are no longer probable of recovery in future customer rates charged to customers could have a material negative impact on Pepco Holdings’PHI’s assets and earnings.
PEPCO HOLDINGS
Management’s most significant judgment is whether to defer costs or revenues when there is not a current regulatory order specific to the item being considered for deferral. In those cases, management considers relevant historical precedents of the regulatory commissions, the results of recent rate orders, and any new information from its more current interactions with the regulatory commissions on that item. Management regularly reviews its regulatory assetsevaluates whether it should defer costs or revenues and liabilities to determinereviews whether adjustments to its previous conclusions regarding its regulatory assets and liabilities are necessary based on the current regulatory and legislative environment as well as recent rate orders.
92
PEPCO HOLDINGS
For additional discussion, see Note (7), “Regulatory Matters,” to the consolidated financial statements of PHI.
Unbilled Revenue
Unbilled revenue represents an estimate of revenue earned from services rendered by Pepco Holdings’PHI’s utility operations that have not yet been billed. Pepco Holdings’PHI’s utility operations calculate unbilled revenue using an output-based methodology. The calculation is based on the supply of electricity or natural gas distributed to customers but not yet billed, and adjusted for estimated line losslosses (estimates of electricity and gas expected to be lost in the process of itsa utility’s transmission and distribution to customers).
Pepco Holdings believes that thePHI estimates involved in its unbilled revenue process represent “Critical Accounting Estimates” because management is required to make assumptions and judgments about input factors to the unbilled revenue calculation. Specifically, the determination of estimated line losslosses is inherently uncertain. Estimated line losslosses is defined as the estimates of electricity and natural gas expected to be lost in the process of its transmission and distribution to customers. A change in estimated line losslosses can change the output available for sale which is a factor in the unbilled revenue calculation. Certain factors can influence the estimated line losslosses such as weather and a change in customer mix. These factors may vary between companies due to geography and density of service territory, and the impact of changes in these factors could be material. Pepco HoldingsPHI seeks to reduce the risk of an inaccurate estimate of unbilled revenue through corroboration of the estimate with historical information and other metrics.
Accounting for Income Taxes
Pepco HoldingsPHI exercises significant judgment about the outcome of income tax matters in its application of the FASB guidance on accounting for income taxes and believes it represents a “Critical Accounting Estimate” because: (i) it records a current tax liability for estimated current tax expense on its federal and state tax returns; (ii) it records deferred tax assets for temporary differences between the financial statement and tax return determination of pre-tax income and the carrying amount of assets and liabilities that are more likely than not going to result in tax deductions in future years; (iii) it determines whether a valuation allowance is needed against deferred tax assets if it is more likely than not that some portion of the future tax deductions will not be realized; (iv) it records deferred tax liabilities for temporary differences between the financial statement and tax return determination of pre-tax income and the carrying amount of assets and liabilities if it is more likely than not that they are expected to result in tax payments in future years; (v) the measurement of deferred tax assets and deferred tax liabilities requires it to estimate future effective tax rates and future taxable income on its federal and state tax returns; (vi) it asserts that foreign earnings will continue to be indefinitely reinvested abroad; (vii) it must consider the effect of newly enacted tax law on its estimated effective tax rate and in measuring deferred tax balances; and (vii)(viii) it asserts that tax positions in its tax returns or expected to be taken in its tax returns are more likely than not to be sustained assuming that the tax positions will be examined by taxing authorities with full knowledge of all relevant information prior to recording the related tax benefit in the financial statements and that the benefit recognized in the financial statements is the largest amount of benefit that is greater than 50% likely of being realized.statements.
Assumptions, judgment and the use of estimates are required in determining if the “more likely than not” standard (that is, the cumulative result for a greater than 50% chance of being realized) has been met when developing the provision for current and deferred income taxes and the associated current and deferred tax assets and liabilities. Pepco Holdings’PHI’s assumptions, judgments and estimates take into account current tax laws and regulations, interpretation of current tax laws and
PEPCO HOLDINGS
regulations, the impact of newly enacted tax laws and regulations, developments in case law, settlements of tax positions, and the possible outcomes of current and future investigations conducted by tax authorities. Pepco HoldingsPHI has established reserves for income taxes to address potential exposures involving tax positions that could be challenged by tax authorities. Although Pepco HoldingsPHI believes that these assumptions, judgments and estimates are reasonable, changes in tax laws and regulations or its interpretation of tax laws and regulations as well as the resolutions of the current and any future investigations or legal proceedings could significantly impact the financial results from applying the accounting for income taxes in the consolidated financial statements. Pepco HoldingsPHI reviews its application of the “more likely than not” standard quarterly.
Pepco Holdings
93
PEPCO HOLDINGS
PHI also evaluates quarterly the probability of realizing deferred tax assets by reviewing a forecast of future taxable income and the availability of tax planning strategies that can be implemented, if necessary, to realize deferred tax assets. Failure to achieve forecasted taxable income or successfully implement tax planning strategies may affect the realization of deferred tax assets and the amount of any associated valuation allowance. The forecast of future taxable income is dependent on a number of factors that can change over time, including growth assumptions, business conditions, returns on rate base, operating and capital expenditures, cost of capital, tax laws and regulations, the legal structure of entities and other factors, which could materially impact the realizability of deferred tax assets and the associated financial results in the consolidated financial statements.
New Accounting Standards and Pronouncements
For information concerning new accounting standards and pronouncements that have recently been adopted by PHI and its subsidiaries or that one or more of the companies will be required to adopt on or before a specified date in the future, see Note (3), “Newly Adopted Accounting Standards,” and Note (4), “Recently Issued Accounting Standards, Not Yet Adopted,” to the consolidated financial statements of PHI, set forth in Part II, Item 8 of this Form 10-K.
PEPCO HOLDINGS
Forward-Looking Statements94
Some of the statements contained in this Annual Report on Form 10-K are forward-looking statements within the meaning of Section 21E of the Securities Exchange Act of 1934, as amended, and are subject to the safe harbor created by the Private Securities Litigation Reform Act of 1995. These statements include declarations regarding Pepco Holdings’ intents, beliefs and current expectations. In some cases, you can identify forward-looking statements by terminology such as “may,” “will,” “should,” “expects,” “plans,” “anticipates,” “believes,” “estimates,” “predicts,” “potential” or “continue” or the negative of such terms or other comparable terminology. Any forward-looking statements are not guarantees of future performance, and actual results could differ materially from those indicated by the forward-looking statements. Forward-looking statements involve estimates, assumptions, known and unknown risks, uncertainties and other factors that may cause PHI’s actual results, levels of activity, performance or achievements to be materially different from any future results, levels of activity, performance or achievements expressed or implied by such forward-looking statements.
The forward-looking statements contained herein are qualified in their entirety by reference to the following important factors, which are difficult to predict, contain uncertainties, are beyond Pepco Holdings’ control and may cause actual results to differ materially from those contained in forward-looking statements:
Changes in governmental policies and regulatory actions affecting the energy industry, including allowed rates of return, industry and rate structure, acquisition and disposal of assets and facilities, operation and construction of transmission and distribution facilities and the recovery of purchased power expenses;
Weather conditions affecting usage and emergency restoration costs;
Population growth rates and changes in demographic patterns;
Changes in customer demand for electricity and natural gas due to conservation measures and the use of more energy-efficient products;
General economic conditions, including the impact of an economic downturn or recession on electricity and natural gas usage;
Changes in and compliance with environmental and safety laws and policies;
Changes in tax rates or policies;
Changes in rates of inflation;
Changes in accounting standards or practices;
Unanticipated changes in operating expenses and capital expenditures;
Rules and regulations imposed by federal and/or state regulatory commissions, PJM, the North American Electric Reliability Corporation and other applicable electric reliability organizations;
Legal and administrative proceedings (whether civil or criminal) and settlements that affect PHI’s business and profitability;
PEPCO HOLDINGS
Pace of entry into new markets;
Interest rate fluctuations and the impact of credit and capital market conditions on the ability to obtain funding on favorable terms; and
Effects of geopolitical events, including the threat of domestic terrorism.
Any forward-looking statements speak only as to the date of this Annual Report on Form 10-K and Pepco Holdings undertakes no obligation to update any forward-looking statements to reflect events or circumstances after the date on which such statements are made or to reflect the occurrence of unanticipated events. New factors emerge from time to time, and it is not possible for Pepco Holdings to predict all of such factors, nor can Pepco Holdings assess the impact of any such factor on Pepco Holding’s business or the extent to which any factor, or combination of factors, may cause results to differ materially from those contained in any forward-looking statement.
The foregoing review of factors should not be construed as exhaustive.
PEPCO
MANAGEMENT’S DISCUSSION AND ANALYSIS OF FINANCIAL CONDITION AND RESULTS OF OPERATIONS
Potomac Electric Power Company
Potomac Electric Power Company (Pepco)Pepco meets the conditions set forth in General Instruction I(1)(a) and (b) to the Form 10-K, and accordingly information otherwise required under this Item has been omitted in accordance with General Instruction I(2)(a) to the Form 10-K.
General Overview
Pepco is engaged in the transmission and distribution of electricity in the District of Columbia and major portions of Montgomery County and Prince George’s County in suburban Maryland. Pepco also provides Default Electricity Supply, which is the supply of electricity at regulated rates to retail customers in its service territories who do not elect to purchase electricity from a competitive energy supplier. Default Electricity Supply is known as Standard Offer Service (SOS)SOS in both the District of Columbia and Maryland. Pepco’s service territory covers approximately 640 square miles and has a population of approximately 2.2 million. As of December 31, 2010,2011, approximately 57% of delivered electricity sales were to Maryland customers and approximately 43% were to the District of Columbia customers.
Effective June 2007,For retail customers of Pepco in Maryland and in the Maryland Public Service Commission (MPSC) approved a bill stabilization adjustment mechanism (BSA) for retail customers. The District of Columbia, Public Service Commission (DCPSC) also approvedearnings are not affected by the warmest and coldest periods of the year because a BSA for retail customers effective in November 2009. For customers to whom the BSA applies, Pepcowas implemented that recognizes distribution revenue based on thean approved distribution charge per customer. From a revenue recognition standpoint, this has the effect of decouplingConsequently, distribution revenue recognized is decoupled in a reporting period from the amount of power delivered during the period. As a consequence,period and the only factors that will cause distribution revenue recognized in Maryland and the District of Columbia to fluctuate from period to period are changes in the number of customers and changes in the approved distribution charge per customer. For customers to whom the BSA applies, changesChanges in customer usage (such as due to weather conditions, energy prices, energy efficiency programs or other reasons) from period to period have no impact on reported distribution revenue.revenue for customers to whom the BSA applies.
As a result ofIn accounting for the BSA in Maryland and the District of Columbia, a Revenue Decoupling Adjustment is recorded representing either (i) a positive adjustment equal to the amount by which revenue from Maryland and District of Columbia retail distribution sales falls short of the revenue that Pepco is entitled to earn based on the approved distribution charge per customer or (ii) a negative adjustment equal to the amount by which revenue from such distribution sales exceeds the revenue that Pepco is entitled to earn based on the approved distribution charge per customer.
Pepco is a wholly owned subsidiary of Pepco Holdings, Inc. (PHI or Pepco Holdings).PHI. Because PHI is a public utility holding company subject to the Public Utility Holding Company Act of 2005 (PUHCA 2005), the relationship between PHI and Pepco and certain activities of Pepco are subject to theFERC’s regulatory oversight of the Federal Energy Regulatory Commission (FERC) under PUHCA 2005.
Reliability Enhancement and Emergency Restoration Improvement Plans
In 2010, Pepco announced that it had adopted and begun to implement comprehensive reliability enhancement plans in Maryland and the District of Columbia. These reliability enhancement plans include various initiatives to improve electrical system reliability, such as:
enhanced vegetation management;
the identification and upgrading of under-performing feeder lines;
the addition of new facilities to support load;
the installation of distribution automation systems on both the overhead and underground network system;
the rejuvenation and replacement of underground residential cables;
improvements to substation supply lines; and
selective undergrounding of portions of existing above ground primary feeder lines, where appropriate to improve reliability.
During 2011, Pepco invested $120 million in capital expenditures on these reliability enhancement activities.
In 2011, prior to the start of the summer storm season, Pepco initiated a program to improve its emergency restoration efforts that included, among other initiatives, an expansion and enhancement of customer service capabilities.
Blueprint for the Future
Pepco is participating in a PHI initiative referred to as “Blueprint for the Future,” which is designed to meet the challenges of rising energy costs, concerns about the environment, improved reliability and government energy reduction goals. For a discussion of the Blueprint for the Future initiative, see PHI’s “Management’s Discussion and Analysis of Financial Condition and Results of Operations – General Overview—Blueprint for the Future.”
95
PEPCO
MAPP Project
PJM has approved PHI’s proposal to construct a new 152-mile, interstate transmission line as part of PJM’s regional transmission expansion plan. In August 2011, PJM notified PHI that the scheduled in-service date for MAPP has been delayed from June 1, 2015 to the 2019 to 2021 time period.
Regulatory Lag
An important factor in Pepco’s ability to earn its authorized rate of return is the willingness of applicable public service commissions to adequately recognize forward-looking costs in Pepco’s rate structure in order to minimize the shortfall in revenues due to the delay in time or “lag” between when costs are incurred and when they are reflected in rates. This delay is commonly known as “regulatory lag.” Pepco is currently experiencing significant regulatory lag because its investment in the rate base and its operating expenses are outpacing revenue growth. In its most recent rate cases, Pepco (in the District of Columbia and Maryland) has proposed mechanisms that would track reliability and other expenses and permit Pepco between rate cases to make adjustments in its rates for prudent investments as made, thereby seeking to reduce the magnitude of regulatory lag. There can be no assurance that these proposals or any other attempts by Pepco to mitigate regulatory lag will be approved, or that even if approved, the rate recovery mechanisms or any base rate cases will fully ameliorate the effects of regulatory lag. Until such time as these proposed mechanisms are approved, if necessary to address the problem of regulatory lag, Pepco plans to file rate cases at least annually in an effort to align more closely its revenue and related cash flow levels with other operation and maintenance spending and capital investments. In future rate cases, Pepco would also continue to seek cost recovery and tracking mechanisms from applicable regulatory commissions to reduce the effects of regulatory lag.
Results Ofof Operations
The following results of operations discussion compares the year ended December 31, 20102011 to the year ended December 31, 2009.2010. All amounts in the tables (except sales and customers) are in millions of dollars.
Operating Revenue
| 2010 | 2009 | Change | 2011 | 2010 | Change | |||||||||||||||||||
Regulated T&D Electric Revenue | $ | 1,068 | $ | 947 | $ | 121 | $ | 1,111 | $ | 1,068 | $ | 43 | ||||||||||||
Default Electricity Supply Revenue | 1,185 | 1,251 | (66 | ) | 933 | 1,185 | (252 | ) | ||||||||||||||||
Other Electric Revenue | 35 | 33 | 2 | 34 | 35 | (1 | ) | |||||||||||||||||
|
|
| ||||||||||||||||||||||
Total Operating Revenue | $ | 2,288 | $ | 2,231 | $ | 57 | $ | 2,078 | $ | 2,288 | $ | (210 | ) | |||||||||||
|
|
| ||||||||||||||||||||||
The table above shows the amount of Operating Revenue earned that is subject to price regulation (Regulated Transmission & Distribution (T&D)T&D Electric Revenue and Default Electricity Supply Revenue) and that which is not subject to price regulation (Other Electric Revenue).
Regulated T&D Electric Revenue includes revenue from the distribution of electricity, including the distribution of Default Electricity Supply, to Pepco’s customers within its service territory at regulated rates. Regulated T&D Electric Revenue also includes transmission service revenue that Pepco receives as a transmission owner from PJM Interconnection, LLC (PJM) at rates regulated by FERC. Transmission rates are updated annually based on a FERC-approved formula methodology.
Default Electricity Supply Revenue is the revenue received from the supply of electricity by Pepco at regulated rates to retail customers who do not elect to purchase electricity from a competitive energy supplier, and which is also known as Standard Offer Service.SOS. The costs related to Default Electricity Supply are included in Purchased Energy. Default Electricity Supply Revenue also includes transmission enhancement credits that Pepco receives as a transmission owner from PJM for approved regional transmission expansion plan costs.
Other Electric Revenue includes work and services performed on behalf of customers, including other utilities, which is generally not subject to price regulation. Work and services includes mutual assistance to other utilities, highway relocation, rentals of pole attachments, late payment fees and collection fees.
96
PEPCO
Regulated T&D Electric
| Regulated T&D Electric Revenue | 2010 | 2009 | Change | |||||||||
Residential | $ | 314 | $ | 271 | $ | 43 | ||||||
Commercial and industrial | 631 | 571 | 60 | |||||||||
Other | 123 | 105 | 18 | |||||||||
Total Regulated T&D Electric Revenue | $ | 1,068 | $ | 947 | $ | 121 | ||||||
Other Regulated T&D Electric Revenue consists primarily of transmission service revenue.
| Regulated T&D Electric Sales (Gigawatt hours (GWh)) | 2010 | 2009 | Change | |||||||||
Residential | 8,350 | 7,669 | 681 | |||||||||
Commercial and industrial | 19,155 | 18,719 | 436 | |||||||||
Other | 160 | 161 | (1 | ) | ||||||||
Total Regulated T&D Electric Sales | 27,665 | 26,549 | 1,116 | |||||||||
PEPCO
| 2011 | 2010 | Change | ||||||||||||||||||||||
Regulated T&D Electric Revenue | ||||||||||||||||||||||||
Residential | $ | 328 | $ | 314 | $ | 14 | ||||||||||||||||||
Commercial and industrial | 647 | 631 | 16 | |||||||||||||||||||||
Transmission and other | 136 | 123 | 13 | |||||||||||||||||||||
|
|
| ||||||||||||||||||||||
Total Regulated T&D Electric Revenue | $ | 1,111 | $ | 1,068 | $ | 43 | ||||||||||||||||||
|
|
| ||||||||||||||||||||||
| 2011 | 2010 | Change | ||||||||||||||||||||||
Regulated T&D Electric Sales (GWh) | ||||||||||||||||||||||||
Residential | 8,052 | 8,350 | (298 | ) | ||||||||||||||||||||
Commercial and industrial | 18,683 | 19,155 | (472 | ) | ||||||||||||||||||||
Transmission and other | 160 | 160 | — | |||||||||||||||||||||
|
|
| ||||||||||||||||||||||
Total Regulated T&D Electric Sales | 26,895 | 27,665 | (770 | ) | ||||||||||||||||||||
|
|
| ||||||||||||||||||||||
| 2011 | 2010 | Change | ||||||||||||||||||||||
| Regulated T&D Electric Customers (in thousands) | 2010 | 2009 | Change | |||||||||||||||||||||
Residential | 713 | 704 | 9 | 714 | 713 | 1 | ||||||||||||||||||
Commercial and industrial | 74 | 74 | — | 74 | 74 | — | ||||||||||||||||||
Other | — | — | — | |||||||||||||||||||||
Transmission and other | — | — | — | |||||||||||||||||||||
|
|
| ||||||||||||||||||||||
Total Regulated T&D Electric Customers | 787 | 778 | 9 | 788 | 787 | 1 | ||||||||||||||||||
|
|
| ||||||||||||||||||||||
Regulated T&D Electric Revenue increased by $121$43 million primarily due to:
An increase of $61$13 million in transmission revenue primarily attributable to higher rates effective June 1, 2010 and June 1, 2011 related to increases in transmission plant investment.
An increase of $12 million due to distribution rate increases in the District of Columbia effective March 2010 and July 2010; and in Maryland effective July 2010.
An increase of $11 million due to higher pass-through revenue (which is substantially offset by a corresponding increase in Other Taxes) primarily the result of rate increases in Montgomery County, Maryland utility taxes that are collected by Pepco on behalf of the county.
An increase of $17$6 million due to customer growth in transmission revenue2011, primarily attributable to higher rates effective June 1, 2010 related to an increase in transmission plant investment.the residential class.
An increase of $14 million due to distribution rate increases in the District of Columbia that became effective in November 2009 and March 2010.
An increase of $6 million due to higher revenue in the District of Columbia service territory as a result of milder than normal weather during the 2009 spring and summer months as compared to the base period used in establishing the 2010 BSA rates. The BSA was not implemented in the District of Columbia until November 2009; therefore, a change in weather was a factor when comparing revenue from period to period.
An increase of $10$2 million due to the implementation of the EmPower Maryland (a demand side management program) surcharge in March 2010 (which is substantially offset by a corresponding increase in Depreciation and Amortization).
An increase of $8 million due to customer growth of 1% in 2010, primarily in the residential class.
Default Electricity Supply
| 2011 | 2010 | Change | ||||||||||||||||||||||
| Default Electricity Supply Revenue | 2010 | 2009 | Change | |||||||||||||||||||||
Residential | $ | 865 | $ | 850 | $ | 15 | $ | 668 | $ | 865 | $ | (197 | ) | |||||||||||
Commercial and industrial | 309 | 390 | (81 | ) | 257 | 309 | (52 | ) | ||||||||||||||||
Other | 11 | 11 | — | 8 | 11 | (3 | ) | |||||||||||||||||
|
|
| ||||||||||||||||||||||
Total Default Electricity Supply Revenue | $ | 1,185 | $ | 1,251 | $ | (66 | ) | $ | 933 | $ | 1,185 | $ | (252 | ) | ||||||||||
|
|
| ||||||||||||||||||||||
| 2011 | 2010 | Change | ||||||||||||||||||||||
| Default Electricity Supply Sales (GWh) | 2010 | 2009 | Change | |||||||||||||||||||||
Residential | 7,576 | 7,173 | 403 | 6,770 | 7,576 | (806 | ) | |||||||||||||||||
Commercial and industrial | 3,113 | 3,739 | (626 | ) | 2,854 | 3,113 | (259 | ) | ||||||||||||||||
Other | 10 | 10 | — | 8 | 10 | (2 | ) | |||||||||||||||||
|
|
| ||||||||||||||||||||||
Total Default Electricity Supply Sales | 10,699 | 10,922 | (223 | ) | 9,632 | 10,699 | (1,067 | ) | ||||||||||||||||
|
|
| ||||||||||||||||||||||
97
PEPCO
| 2011 | 2010 | Change | ||||||||||||||||||||||
| Default Electricity Supply Customers (in thousands) | 2010 | 2009 | Change | |||||||||||||||||||||
Residential | 644 | 660 | (16 | ) | 598 | 644 | (46 | ) | ||||||||||||||||
Commercial and industrial | 47 | 50 | (3 | ) | 45 | 47 | (2 | ) | ||||||||||||||||
Other | — | — | — | |||||||||||||||||||||
Other Commercial and industrial | — | — | — | |||||||||||||||||||||
|
|
| ||||||||||||||||||||||
Total Default Electricity Supply Customers | 691 | 710 | (19 | ) | 643 | 691 | (48 | ) | ||||||||||||||||
|
|
| ||||||||||||||||||||||
Default Electricity Supply Revenue decreased by $66$252 million primarily due to:
A decrease of $82$135 million as a result of lower Default Electricity Supply rates.
A decrease of $74 million due to lower sales, primarily as a result of residential and commercial customer migration to competitive suppliers.
A decrease of $47$48 million due to lower sales as a result of lower Default Electricity Supply rates.cooler weather during the spring and summer months of 2011, and warmer weather during the fall months of 2011, as compared to the corresponding periods in 2010.
The aggregate amount of these decreases was partially offset by:
An increase of $67$5 million due to higher sales primarily asnon-weather related average customer usage.
An increase of $3 million resulting from an approval by the DCPSC of an increase in Pepco’s cost recovery rate for providing Default Electricity Supply in the District of Columbia to provide for recovery of higher cash working capital costs incurred in prior periods. The higher cash working capital costs were incurred when the billing cycle for providers of Default Electricity Supply was shortened from a result of warmer weather during the 2010 spring and summer months as comparedmonthly to a weekly period, effective in June 2009.
The following table shows the percentages of Pepco’s total distribution sales by jurisdiction that are derived from customers receiving Default Electricity Supply from Pepco. Amounts are for the year ended December 31.
| 2010 | 2009 | 2011 | 2010 | |||||||||||||
Sales to District of Columbia customers | 29 | % | 31 | % | 27 | % | 29 | % | ||||||||
Sales to Maryland customers | 46 | % | 49 | % | 43 | % | 46 | % | ||||||||
Operating Expenses
Purchased Energy
Purchased Energy consists of the cost of electricity purchased by Pepco to fulfill its Default Electricity Supply obligation and, as such, is recoverable from customers in accordance with the terms of public service commission orders. Purchased Energy decreased by $71$259 million to $893 million in 2011 from $1,152 million in 2010 from $1,223 million in 2009 primarily due to:
A decrease of $85 million primarily due to commercial customer migration to competitive suppliers.
A decrease of $39 million in deferred electricity expense primarily due to lower Default Electricity Supply Revenue rates, which resulted in a lower rate of recovery of Default Electricity Supply costs.
A decrease of $8$162 million due to lower average electricity costs under Default Electricity Supply contracts.
A decrease of $62 million primarily due to customer migration to competitive suppliers.
A decrease of $45 million due to lower electricity sales primarily as a result of cooler weather during the spring and summer months of 2011, and warmer weather during the fall months of 2011, as compared to the corresponding periods in 2010.
98
PEPCO
The aggregate amount of these decreases was partially offset by:
An increase of $60$11 million in deferred electricity expense primarily due to lower Default Electricity Supply rates, which resulted in a higher sales primarily as a resultrate of warmer weather during the 2010 spring and summer months as compared to 2009.recovery of Default Electricity Supply costs.
PEPCO
Other Operation and Maintenance
Other Operation and Maintenance increased by $26$66 million to $420 million in 2011 from $354 million in 2010 from $328 million in 2009. Excluding an increase of $2 million primarily related to bad debt expenses that are deferred and recoverable in Default Electricity Supply Revenue, Other Operation and Maintenance expense increased by $24 million. The $24 million increase was primarily due to:
An increase of $22$28 million in emergency restoration costs primarily due to severe storms in February, Julyassociated with higher tree trimming and August 2010.preventative maintenance costs.
An increase of $13 million in estimated environmental remediation costs due to the establishment of a reserve relating to a possible discharge of polychlorinated biphenyls (PCBs) at the Benning Road transmission and distribution facility, as further discussed under the heading “Benning Road Site” in Note (13), “Commitments and Contingencies,” to the Pepco financial statements set forth in Part II, Item 8 of this Form 10-K.
An increase of $3 million primarily due to system support and customer support services costs.
An increase of $3 million primarily due to higher tree trimming costs.
An increase of $2 million2011 DCPSC rate case costs and reliability audit expenses and due to higher non-deferrable bad debt expenses.
The aggregate amount of these increases was partially offset by:
A decrease of $11 million primarily due to Pepco deferrals2010 adjustments for the deferral of (i) February 2010 severe winter storm costs of $5 million and (ii) distribution rate case costs which in each case originally had beenof $4 million that previously were charged to Other Operationother operation and Maintenancemaintenance expense. These deferralsThe adjustments were recorded in accordance with a MPSC rate order issued in August 2010 and a DCPSC rate order issued in February 2010, respectively, authorizing the establishment of regulatory assetsallowing for the recovery of thesethe costs.
An increase of $8 million in customer support service and system support costs.
An increase of $7 million primarily due to emergency restoration improvement project and reliability improvement costs.
An increase of $5 million in communication costs.
An increase of $4 million in employee-related costs, primarily benefit expenses.
An increase of $3 million in outside legal counsel fees.
An increase of $3 million in emergency restoration costs. The increase is primarily related to significant incremental costs incurred for repair work following Hurricane Irene in August 2011. Costs incurred for repair work were $12 million, of which $10 million was deferred as a regulatory asset to reflect the probable recovery of these storm costs in certain jurisdictions, and the remaining $2 million was charged to other operation and maintenance expense. Pepco currently plans to seek recovery of the incremental Hurricane Irene costs in each of its jurisdictions in pending or planned distribution rate case filings.
The aggregate amount of these increases was partially offset by:
A decrease of $7$11 million in employee-related costs, primarily due to lower pension and other postretirement benefit expenses.environmental remediation costs.
Restructuring Charge
With the ongoing wind downAs a result of the retail energy supply business of Pepco Energy Services and the disposition of Conectiv Energy, PHI is repositioning itself as a regulated transmission and distribution company. In connection with this repositioning, PHI commenced a comprehensivePHI’s organizational review in the second quarter of 2010, to identify opportunities to streamline the organization and to achieve certain reductions in corporate overhead costs that are allocated to itsPepco’s operating segments. This review has resulted in the adoption of a restructuring plan. PHI began implementing the plan during the third quarter, identifying 164 employee positions that were eliminated during the fourth quarter of 2010. The plan also focuses on identifying additional cost reduction opportunities through process improvements and operational efficiencies. PHI currently estimates that the implementation of the plan will result in an annual reduction of approximately $28 million in corporate overhead costs.
In connection with the plan, Pepco recordedexpenses include a pre-tax restructuring charge of $15 million for the year ended December 31, 2010, related to severance pension, and health and welfare benefits to be provided to terminated employees.
99
PEPCO
Depreciation and Amortization
Depreciation and Amortization expense increased by $17$9 million to $171 million in 2011 from $162 million in 2010 from $145 million in 2009 primarily due to:
An increase of $9$5 million due to utility plant additions.
An increase of $3 million in amortization of regulatory assets primarily due toassociated with the EmPower Maryland surcharge that became effective in March 2010 (which is substantially offset by a corresponding increase in Regulated T&D Electric Revenue).
An increase of $4 million due to utility plant additions.
An increase of $2$1 million in the amortization of Demand Sidesoftware upgrades to Pepco’s Energy Management deferred expenses.System.
Other Taxes
Other Taxes increased by $62$18 million to $382 million in 2011 from $364 million in 2010 from $302 million in 2009.2010. The increase was primarily due to:
An increase of $16 million primarily due to increased pass-throughs resulting from utility tax rate increases imposed byin the Montgomery County, Maryland (whichutility taxes that are substantiallycollected and passed through by Pepco (substantially offset by a corresponding increase in Regulated T&D Electric Revenue).
An increase of $5 million due to an adjustment in the third quarter of 2010 to correct certain errors related to other taxes.
The aggregate amount of these increases was partially offset by:
A decrease of $5 million in the Energy Assistance Trust Fund surcharge primarily due to rate decreases effective October 2010 (substantially offset by a corresponding decrease in Regulated T&D Electric Revenue).
EffectEffects of Divestiture-Related Claims
District of Columbia Divestiture Case
The DCPSC on May 18, 2010 issued an order addressing all of the outstanding issues relating to Pepco’s obligation to share with its District of Columbia customers the net proceeds realized by Pepco from the sale of its generation-related assets in 2000. This order disallowed certain items that Pepco had included in the costs it deducted in calculating the net proceeds of the sale. The disallowance of these costs, together with interest, increased the aggregate amount Pepco is required to distribute to customers by approximately $11 million. While Pepco has filed an appeal of the DCPSC’s decision with the District of Columbia Court of Appeals, in view of the DCPSC order, PHI recognized a pre-tax expense of $11 million for the year ended December 31, 2010. The appeal is still pending.
Settlement of Mirant Bankruptcy Claims
In March 2009, the DCPSC approved an allocation between Pepco and its District of Columbia customers of the District of Columbia portion of the Mirant Corporation (Mirant) bankruptcy settlement proceeds remaining after the transfer of the power purchase agreement between Pepco and Panda-Brandywine, L.P. As a result, Pepco recorded a pre-tax gain of $14 million in the first quarter of 2009 reflecting the District of Columbia proceeds retained by Pepco. In July 2009, the MPSC approved an allocation between Pepco and its Maryland customers of the Maryland portion of the Mirant bankruptcy settlement proceeds. As a result, Pepco recorded a pre-tax gain of $26 million in the third quarter of 2009 reflecting the Maryland proceeds retained by Pepco.
Other Income (Expenses)
Other Expenses (which are net of Other Income) decreased by $6$8 million to a net expense of $77 million in 2011 from a net expense of $85 million in 2010 from a net expense of $91 million in 2009.2010. The decrease was primarily due to:
An increase of $4$8 million in income related to Allowance for Funds Used During ConstructionAFUDC that is applied to capital projects.
An increase of $3 million in other income due to net proceeds from a company owned life insurance policy.
100
PEPCO
The aggregate amount of these increases was partially offset by:
A decrease of $3 million in other income due to gains on the sale of four parcels of land in 2010.
PEPCO
Income Tax Expense
Pepco’s effective tax rates for the years ended December 31, 2011 and 2010 were 26.7% and 2009 were 25.5% and 41.8%, respectively. The decreaseincrease in the effective tax rate primarily resulted primarily from the November 2010 settlement PHI reached with the Internal Revenue Service (IRS) with respectchanges in estimates and interest related to its Federaluncertain and effectively settled tax returns for the years 1996 to 2002. In connection with the settlement, Pepco reallocated certain amounts on deposit with the IRS since 2006 among liabilities in the settlement years and subsequent years. In light of the settlement and reallocations, Pepco has recalculated the estimated interest due for the tax years 1996 to 2002. The revised estimate has resulted in the reversal of $24 million (after-tax) of previously accrued estimated interest due to the IRS. This reversal has been recorded as an income tax benefit in 2010, and is subject to adjustment when the IRS finalizes its calculation of the amount due. This benefit was partiallypositions offset by an $8increase in certain asset removal costs.
Income Tax Adjustments
During 2011, Pepco recorded an adjustment to correct certain income tax errors related to prior periods associated with the interest on uncertain tax positions. The adjustment resulted in an increase in income tax expense of $1 million reversalfor the year ended December 31, 2011.
In 2010, Pepco recorded certain adjustments to correct errors in income tax expense which resulted in an increase to income tax expense of previously recorded tax benefits and $5$4 million of other adjustments.for the year ended December 31, 2010.
Capital Requirements
Sources of Capital
Pepco has a range of capital sources available, in addition to internally generated funds, to meet its long-term and short-term funding needs. The sources of long-term funding include the issuance of mortgage bonds and other debt securities and bank financings, as well as the ability to issue preferred stock. Proceeds from long-term financings are used primarily to fund long-term capital requirements, such as capital expenditures, and to repay or refinance existing indebtedness. Pepco traditionally has used a number of sources to fulfill short-term funding needs, including commercial paper, short-term notes, bank lines of credit and borrowings under the PHI money pool. Proceeds from short-term borrowings are used primarily to meet working capital needs, but may also be used to temporarily fund long-term capital requirements. Pepco’s ability to generate funds from its operations and to access the capital and credit markets is subject to risks and uncertainties. Volatile and deteriorating financial market conditions, diminished liquidity and tightening credit may affect access to certain of Pepco’s potential funding sources. See Item 1A, “Risk Factors,” of this Form 10-K, for additional discussion of important factors that may have an effect on Pepco’s sources of capital.
Debt Securities
Pepco has a Mortgage and Deed of Trust (the Mortgage) under which it issues First Mortgage Bonds. First Mortgage Bonds issued under the Mortgage are secured by a lien on substantially all of Pepco’s property, plant and equipment. The principal amount of First Mortgage Bonds that Pepco may issue under the Mortgage is limited by the principal amount of retired First Mortgage Bonds and 60% of the lesser of the cost or fair value of new property additions that have not been used as the basis for the issuance of additional First Mortgage Bonds. Pepco also has an Indenture under which it issues senior notes secured by First Mortgage Bonds and an Indenture under which it can issue unsecured debt securities, including medium-term notes. To fund the construction of pollution control facilities, Pepco also has from time to time issued tax-exempt bonds through a municipality or public agency, the proceeds of which are loaned to Pepco by the municipality or agency.
101
PEPCO
Information concerning the principal amount and terms of Pepco’s outstanding debt securities, as of December 31, 2010,2011, is set forth in Note (10), “Debt,” to the financial statements of Pepco set forth in Part II, Item 8 of this Form 10-K.Pepco.
Bank Financing
As further discussed in Note (10), “Debt,” to the financial statements of Pepco, set forth in Part II, Item 8 of this Form 10-K, Pepco participates inis a borrower under a $1.5 billion credit facility, along with PHI, Delmarva Power & Light Company (DPL)DPL and Atlantic City Electric Company (ACE). The facility, all or any portion ofACE, which may be used to obtain loans or to issue letters of credit, expires in 2012.2016. Pepco’s credit limit under the facility is the lesser of $500$250 million and the maximum amount of short-term debt Pepco is permitted to have outstanding by its regulatory authorities, except that the aggregate amount of credit usedauthorities. The short-term borrowing limit established by FERC for Pepco DPL and ACE at any given time may not collectively exceed $625is $500 million.
PEPCO
Commercial Paper Program
Pepco maintains an ongoing commercial paper program of up to $500 million under which it can issue commercial paper with maturities of up to 270 days. The commercial paper is backed by Pepco’s borrowing capacity under the PHI $1.5 billion credit facility.
Pepco had $74 million of commercial paper outstanding at December 31, 2011 and zero outstanding at December 31, 2010. The weighted average interest rate for commercial paper issued during 2011 was 0.35%, and the weighted average maturity was two days. Pepco did not issue commercial paper during 2010.
Money Pool
Pepco participates in the money pool operated by PHI under authorization received from FERC. The money pool is a cash management mechanism used by PHI and eligible subsidiaries to manage their short-term investment and borrowing requirements. PHI may invest in, but not borrow from, the money pool. Eligible subsidiaries with surplus cash may deposit those funds in the money pool. Deposits in the money pool are guaranteed by PHI. Eligible subsidiaries with cash requirements may borrow from the money pool. Borrowings from the money pool are unsecured. Depositors in the money pool receive, and borrowers from the money pool pay, an interest rate based primarily on PHI’s short-term borrowing rate. PHI deposits funds in the money pool to the extent that the pool has insufficient funds to meet the borrowing needs of its participants, which PHI may obtain from external sources.
Preferred Stock
Under its Articles of Incorporation, Pepco is authorized to issue and have outstanding up to 6 million shares of preferred stock in one or more series, with each series having such rights, preferences and limitations, including dividend and voting rights and redemption provisions, as the Board of Directors may establish. As of December 31, 2011 and 2010, there were no shares of Pepco preferred stock outstanding.
Regulatory Restrictions on Financing Activities
Pepco’s long-term financing activities (including the issuance of securities and the incurrence of debt) are subject to authorization by the DCPSC and MPSC. Through its periodic filings with the respective utility commissions, Pepco generally seeks to maintainmaintains standing authority sufficient to cover its projected financing needs over a multi-year period. Under the Federal Power Act,FPA, FERC has jurisdiction over the issuance of long-term and short-term securities of public utilities, but only if the issuance is not regulated by the state public utility commission in which the public utility is organized and operating. Under these provisions, Pepco is required to obtainhas obtained FERC authorization for the issuance of short-term debt.debt under these provisions.
102
PEPCO
Capital Expenditures
Pepco’s capital expenditures for the year ended December 31, 2010,2011 totaled $359$521 million. These expenditures were primarily related to capital costs associated with new customer services, distribution reliability and transmission. The expenditures also include an allocation by PHI of hardware and software expenditures that primarily benefit the Power Delivery business and are allocated to Pepco when the assets are placed in service.
The following table shows Pepco’s projected capital expenditures for the five yearfive-year period 20112012 through 2015.2016. Pepco expects to fund these expenditures through internally generated cash, external financing and capital contributions from PHI.
PEPCO
| For the Year | For the Year | |||||||||||||||||||||||||||||||||||||||||||||||
| 2011 | 2012 | 2013 | 2014 | 2015 | Total | 2012 | 2013 | 2014 | 2015 | 2016 | Total | |||||||||||||||||||||||||||||||||||||
| (millions of dollars) | (millions of dollars) | |||||||||||||||||||||||||||||||||||||||||||||||
Pepco | ||||||||||||||||||||||||||||||||||||||||||||||||
Distribution | $ | 291 | $ | 273 | $ | 259 | $ | 288 | $ | 317 | $ | 1,428 | $ | 321 | $ | 367 | $ | 439 | $ | 398 | $ | 406 | $ | 1,931 | ||||||||||||||||||||||||
Distribution – Blueprint for the Future | 103 | 19 | — | — | — | 122 | 76 | 1 | — | — | — | 77 | ||||||||||||||||||||||||||||||||||||
Transmission | 136 | 86 | 74 | 30 | 64 | 390 | 104 | 93 | 68 | 58 | 71 | 394 | ||||||||||||||||||||||||||||||||||||
Transmission – MAPP | 112 | 216 | 166 | 139 | 45 | 678 | 1 | 1 | 1 | 3 | 132 | 138 | ||||||||||||||||||||||||||||||||||||
Other | 28 | 16 | 10 | 13 | 19 | 86 | 56 | 30 | 17 | 13 | 18 | 134 | ||||||||||||||||||||||||||||||||||||
|
|
|
|
|
| |||||||||||||||||||||||||||||||||||||||||||
Sub-Total | 670 | 610 | 509 | 470 | 445 | 2,704 | 558 | 492 | 525 | 472 | 627 | 2,674 | ||||||||||||||||||||||||||||||||||||
DOE Capital Reimbursement Awards (a) | (65 | ) | (22 | ) | (3 | ) | — | — | (90 | ) | (46 | ) | (2 | ) | — | — | — | (48 | ) | |||||||||||||||||||||||||||||
|
|
|
|
|
| |||||||||||||||||||||||||||||||||||||||||||
Total Pepco | $ | 605 | $ | 588 | $ | 506 | $ | 470 | $ | 445 | $ | 2,614 | $ | 512 | $ | 490 | $ | 525 | $ | 472 | $ | 627 | $ | 2,626 | ||||||||||||||||||||||||
|
|
|
|
|
| |||||||||||||||||||||||||||||||||||||||||||
| (a) | Reflects anticipated reimbursements pursuant to awards from the |
Reliability Enhancement Plans
During 2010, Pepco announced Comprehensive Reliability Enhancement Plans for Maryland and the District of Columbia.For a more detailed discussion of these plans, see Item 1, “Business - Description of Business - Other Power Delivery Initiatives and Activities - Reliability Enhancement Plans” of this Form 10-K.103
Stimulus Funds Related to Blueprint for the Future
PEPCO
In 2009, the U.S. Department of Energy (DOE) announced a $168 million award to PHI under the American Recovery and Reinvestment Act of 2009 for the implementation of an advanced metering infrastructure system, direct load control, distribution automation, and communications infrastructure. Pepco was awarded $149 million with $105 million to be used in the Maryland service territory and $44 million to be used in the District of Columbia service territory.
In April 2010, PHI and the DOE signed agreements formalizing Pepco’s $149 million share of the $168 million award. Of the $149 million, $118 million is expected to offset incurred and projected Blueprint for the Future and other capital expenditures of Pepco. The remaining $31 million will be used to offset incremental expenses associated with direct load control and other programs. In 2010, Pepco received award payments of $15 million.
The Internal Revenue Service has announced that, to the extent these grants are expended on capital items, they will not be considered taxable income.
Transmission and Distribution
The projected capital expenditures listed in the table above for distribution (other than Blueprint for the Future) and transmission (other than the Mid-Atlantic Power Pathway (MAPP)MAPP project) are primarily for facility replacements and upgrades to accommodate customer growth and reliability.
PEPCO
service reliability, including capital expenditures for continuing reliability enhancement efforts.
Blueprint for the Future
Pepco has undertaken programs to install smart meters, further automate its electric distribution systems and enhance its communications infrastructure, which it refers to as the Blueprint for the Future. For a discussion of the Blueprint for the Future initiative, see Item 1, “Business - DescriptionPHI’s “Management’s Discussion and Analysis of Business - Financial Condition and Results of Operations – General Overview—Blueprint for the Future” of this Form 10-K.Future.” The projected capital expenditures over the next five years are shown as Distribution — Distribution—Blueprint for the Future in the table above.
MAPP Project
PHIPJM has under development the construction ofapproved PHI’s proposal to construct a new 230-mile, 500-kilovolt152-mile, interstate transmission line as part of PJM’s regional transmission expansion plan. For a description ofIn August 2011, PJM notified PHI that the scheduled in-service date for MAPP project, see Itemhas been delayed from June 1, “Business - Description of Business - MAPP Project” of this Form 10-K.2015 to the 2019 to 2021 time period. The projected capital expenditures over the next five years for MAPP are shown as Transmission — Transmission—MAPP in the table above.
MAPP/DOE Loan Program
To assist in the funding of the MAPP project, PHI has applied for a $684 million loan guarantee from the Department of Energy (DOE)DOE for a substantial portion of the MAPP project, primarily the Calvert Cliffs to Indian River segment. The application has been made under a federal loan guarantee program for projects that employ innovative energy efficiency, renewable energy and advanced transmission and distribution technologies. If granted, PHI believes the guarantee could allow PHI to acquire financing at a lower cost than it would otherwise be able to obtain in the capital markets. Whether PHI’s application will be granted and, if so, the amount of debt guaranteed is subject to the discretion of the DOE and the negotiation of terms that will satisfy the conditions of the guarantee program. On February 28, 2011, the DOE issued a Notice of Intent to prepare an Environmental Impact Statement to assist the DOE in assessing the environmental impact of constructing the portion of the MAPP project to be supported by the loan guarantee. Since February 2011, the DOE has conducted field inspections of the entire route and has held public meetings to obtain input from the communities along the route.
The DOE’s review of the loan guarantee program has delayed the DOE’s review of PHI’s loan guarantee application. There is not an approval deadline under the loan guarantee program, but this program could change or be terminated in the future. PHI continues to coordinate environmental activities with the DOE.
DOE Capital Reimbursement Awards
In 2009, the DOE announced a $168 million award to PHI under the American Recovery and Reinvestment Act of 2009 for the implementation of an AMI system, direct load control, distribution automation and communications infrastructure. Pepco was awarded $149 million with $105 million to be used in the Maryland service territory and $44 million to be used in the District of Columbia service territory.
In April 2010, PHI and the DOE signed agreements formalizing Pepco’s $149 million share of the $168 million award. Of the $149 million, $118 million is expected to offset incurred and projected Blueprint for the Future and other capital expenditures of Pepco. The remaining $31 million will be used to offset incremental expenses associated with direct load control and other programs. In 2011, Pepco received award payments of $53 million. In 2010, Pepco received award payments of $15 million.
The IRS has announced that, to the extent these grants are expended on capital items, they will not be considered taxable income.
Pension and Other Postretirement Benefit Plans
Pepco participates in pension and postretirement benefitOPEB plans sponsored by PHI for its employees. While the plans have not experienced any significant impact in terms of liquidity or counterparty exposure duePepco contributed $40 million and zero to the disruption of the capitalPHI Retirement Plan during 2011 and credit markets, the stock market declines in 2008 caused a decrease in the market value of benefit plan assets at the end of 2008.2010, respectively.
On January 31, 2012, Pepco contributed zero and $170made an $85 million discretionary tax-deductible contribution to the pension plan during 2010 and 2009, respectively.
PEPCO
Forward-Looking Statements104
Some of the statements contained in this Annual Report on Form 10-K are forward-looking statements within the meaning of Section 21E of the Securities Exchange Act of 1934, as amended, and are subject to the safe harbor created by the Private Securities Litigation Reform Act of 1995. These statements include declarations regarding Pepco’s intents, beliefs and current expectations. In some cases, you can identify forward-looking statements by terminology such as “may,” “will,” “should,” “expects,” “plans,” “anticipates,” “believes,” “estimates,” “predicts,” “potential” or “continue” or the negative of such terms or other comparable terminology. Any forward-looking statements are not guarantees of future performance, and actual results could differ materially from those indicated by the forward-looking statements. Forward-looking statements involve estimates, assumptions, known and unknown risks, uncertainties and other factors that may cause Pepco’s actual results, levels of activity, performance or achievements to be materially different from any future results, levels of activity, performance or achievements expressed or implied by such forward-looking statements.
The forward-looking statements contained herein are qualified in their entirety by reference to the following important factors, which are difficult to predict, contain uncertainties, are beyond Pepco’s control and may cause actual results to differ materially from those contained in forward-looking statements:
Changes in governmental policies and regulatory actions affecting the energy industry, including allowed rates of return, industry and rate structure, acquisition and disposal of assets and facilities, operation and construction of transmission and distribution facilities and the recovery of purchased power expenses;
Weather conditions affecting usage and emergency restoration costs;
Population growth rates and changes in demographic patterns;
Changes in customer demand for electricity due to conservation measures and the use of more energy-efficient products;
General economic conditions, including the impact of an economic downturn or recession on electricity usage;
Changes in and compliance with environmental and safety laws and policies;
Changes in tax rates or policies;
Changes in rates of inflation;
Changes in accounting standards or practices;
Unanticipated changes in operating expenses and capital expenditures;
Rules and regulations imposed by federal and/or state regulatory commissions, PJM, the North American Electric Reliability Corporation and other applicable electric reliability organizations;
Legal and administrative proceedings (whether civil or criminal) and settlements that affect Pepco’s business and profitability;
Interest rate fluctuations and the impact of credit and capital market conditions on the ability to obtain funding on favorable terms; and
PEPCO
Effects of geopolitical events, including the threat of domestic terrorism.
Any forward-looking statements speak only as to the date of this Annual Report on Form 10-K and Pepco undertakes no obligation to update any forward-looking statements to reflect events or circumstances after the date on which such statements are made or to reflect the occurrence of unanticipated events. New factors emerge from time to time, and it is not possible for Pepco to predict all of such factors, nor can Pepco assess the impact of any such factor on Pepco’s business or the extent to which any factor, or combination of factors, may cause results to differ materially from those contained in any forward-looking statement.
The foregoing review of factors should not be construed as exhaustive.
DPL
MANAGEMENT’S DISCUSSION AND ANALYSIS OF FINANCIAL CONDITION AND RESULTS OF OPERATIONS
Delmarva Power & Light Company
Delmarva Power & Light Company (DPL)DPL meets the conditions set forth in General Instruction I(1)(a) and (b) to the Form 10-K, and accordingly information otherwise required under this Item has been omitted in accordance with General Instruction I(2)(a) to the Form 10-K.
General Overview
DPL is engaged in the transmission and distribution of electricity in Delaware and portions of Maryland. DPL also provides Default Electricity Supply, which is the supply of electricity at regulated rates to retail customers in its service territories who do not elect to purchase electricity from a competitive energy supplier. Default Electricity Supply is known as Standard Offer Service (SOS)SOS in both Delaware and Maryland. DPL’s electricity distribution service territory covers approximately 5,000 square miles and has a population of approximately 1.31.4 million. As of December 31, 2010,2011, approximately 66% of delivered electricity sales were to Delaware customers and approximately 34% were to Maryland customers. In northern Delaware, DPL also supplies and distributes natural gas to retail customers and provides transportation-only services to retail customers that purchase natural gas from other suppliers. DPL’s natural gas distribution service territory covers approximately 275 square miles and has a population of approximately 500,000.
As a resultIn DPL’s Delaware service territory, results historically have been seasonal, generally producing higher revenue and income in the warmest and coldest periods of the implementation of a bill stabilization adjustment mechanism (BSA) foryear. For retail customers of DPL in Maryland, in June 2007, DPLearnings are not affected by the warmest and coldest periods of the year because a BSA for retail customers was implemented that recognizes Maryland distribution revenue based on an approved distribution charge per customer. From a revenue recognition standpoint, this has the effect of decouplingConsequently, distribution revenue recognized is decoupled in a reporting period withfrom the amount of power delivered during the period. As a consequence,period and the only factors that will cause distribution revenue recognized in Maryland to fluctuate from period to period are changes in the number of customers and changes in the approved distribution charge per customer. ForA comparable revenue decoupling mechanism for DPL electricity and natural gas customers to whomin Delaware is under consideration by the BSA applies, changesDPSC. Changes in customer usage (such as due to weather conditions, energy prices, energy efficiency programs or other reasons) from period to period have no impact on reported distribution revenue.revenue for customers to whom the BSA applies.
As a result ofIn accounting for the BSA in Maryland, a Revenue Decoupling Adjustment is recorded representing either (i) a positive adjustment equal to the amount by which revenue from Maryland retail distribution sales falls short of the revenue that DPL is entitled to earn based on the approved distribution charge per customer or (ii) a negative adjustment equal to the amount by which revenue from such distribution sales exceeds the revenue that DPL is entitled to earn based on the approved distribution charge per customer.
DPL is a wholly owned subsidiary of Conectiv, which is wholly owned by Pepco Holdings, Inc. (PHI or Pepco Holdings).PHI. Because PHI is a public utility holding company subject to the Public Utility Holding Company Act ofPUHCA 2005, (PUHCA 2005), the relationship between PHI and DPL and certain activities of DPL are subject to theFERC’s regulatory oversight of the Federal Energy Regulatory Commission (FERC) under PUHCA 2005.
Blueprint for the Future
DPL is participating in a PHI initiative referred to as “Blueprint for the Future,” which is designed to meet the challenges of rising energy costs, concerns about the environment, improved reliability and government energy reduction goals. For a discussion of the Blueprint for the Future initiative, see PHI’s “Management’s Discussion and Analysis of Financial Condition and Results of Operations – General Overview—Blueprint for the Future.”
105
DPL
MAPP Project
PJM has approved PHI’s proposal to construct a new 152-mile, interstate transmission line as part of PJM’s regional transmission expansion plan. In August 2011, PJM notified PHI that the scheduled in-service date for MAPP has been delayed from June 1, 2015 to the 2019 to 2021 time period. The projected capital expenditures over the next five years for MAPP are shown as Transmission—MAPP in the table above.
Regulatory Lag
An important factor in the ability of DPL to earn its authorized rate of return is the willingness of applicable public service commissions to adequately recognize forward-looking costs in DPL’s rate structure in order to minimize the shortfall in revenues due to the delay in time or “lag” between when costs are incurred and when they are reflected in rates. This delay is commonly known as “regulatory lag.” DPL is currently experiencing significant regulatory lag because its investment in the rate base and its operating expenses are outpacing revenue growth. In its most recent rate cases, DPL (in Delaware and Maryland) has proposed mechanisms that would track reliability and other expenses and permit DPL between rate cases to make adjustments in its rates for prudent investments as made, thereby seeking to reduce the magnitude of regulatory lag. There can be no assurance that these proposals or any other attempts by DPL to mitigate regulatory lag will be approved, or that even if approved, the rate recovery mechanisms or any base rate cases will fully ameliorate the effects of regulatory lag. Until such time as these proposed mechanisms are approved, if necessary to address the problem of regulatory lag, DPL plans to file rate cases at least annually in an effort to align more closely its revenue and related cash flow levels with other operation and maintenance spending and capital investments. In future rate cases, DPL would also continue to seek cost recovery and tracking mechanisms from applicable regulatory commissions to reduce the effects of regulatory lag.
106
DPL
Results Ofof Operations
The following results of operations discussion compares the year ended December 31, 20102011 to the year ended December 31, 2009.2010. All amounts in the tables (except sales and customers) are in millions of dollars.
Electric Operating Revenue
| 2010 | 2009 | Change | 2011 | 2010 | Change | |||||||||||||||||||
Regulated T&D Electric Revenue | $ | 375 | $ | 343 | $ | 32 | $ | 394 | $ | 375 | $ | 19 | ||||||||||||
Default Electricity Supply Revenue | 768 | 769 | (1 | ) | 664 | 768 | (104 | ) | ||||||||||||||||
Other Electric Revenue | 20 | 23 | (3 | ) | 16 | 20 | (4 | ) | ||||||||||||||||
|
|
| ||||||||||||||||||||||
Total Electric Operating Revenue | $ | 1,163 | $ | 1,135 | $ | 28 | $ | 1,074 | $ | 1,163 | $ | (89 | ) | |||||||||||
|
|
| ||||||||||||||||||||||
The table above shows the amount of Electric Operating Revenue earned that is subject to price regulation (Regulated Transmission & Distribution (T&D)T&D Electric Revenue and Default Electricity Supply Revenue) and that which is not subject to price regulation (Other Electric Revenue).
Regulated T&D Electric Revenue includes revenue from the distribution of electricity, including the distribution of Default Electricity Supply, to DPL’s customers within its service territory at regulated rates. Regulated T&D Electric Revenue also includes transmission service revenue that DPL receives as a transmission owner from PJM Interconnection, LLC (PJM) at rates regulated by FERC. Transmission rates are updated annually based on a FERC-approved formula methodology.
Default Electricity Supply Revenue is the revenue received from the supply of electricity by DPL at regulated rates to retail customers who do not elect to purchase electricity from a competitive energy supplier, and which is also known as Standard Offer Service.SOS. The costs related to Default Electricity Supply are included in Purchased Energy. Default Electricity Supply Revenue also includes transmission enhancement credits that DPL receives as a transmission owner from PJM for approved regional transmission expansion plan costs.
Other Electric Revenue includes work and services performed on behalf of customers, including other utilities, which is generally not subject to price regulation. Work and services includes mutual assistance to other utilities, highway relocation, rentals of pole attachments, late payment fees, and collection fees.
Regulated T&D Electric
| Regulated T&D Electric Revenue | 2010 | 2009 | Change | |||||||
Residential | $184 | $ | 164 | $ | 20 | |||||
Commercial and industrial | 110 | 102 | 8 | |||||||
Other | 81 | 77 | 4 | |||||||
Total Regulated T&D Electric Revenue | $375 | $ | 343 | $ | 32 | |||||
Other Regulated T&D Electric Revenue consists primarily of transmission service revenue.
| 2011 | 2010 | Change | ||||||||||
Regulated T&D Electric Revenue | ||||||||||||
Residential | $ | 188 | $ | 184 | $ | 4 | ||||||
Commercial and industrial | 113 | 110 | 3 | |||||||||
Transmission and other | 93 | 81 | 12 | |||||||||
|
|
|
|
|
| |||||||
Total Regulated T&D Electric Revenue | $ | 394 | $ | 375 | $ | 19 | ||||||
|
|
|
|
|
| |||||||
| 2011 | 2010 | Change | ||||||||||
Regulated T&D Electric Sales (GWh) | ||||||||||||
Residential | 5,197 | 5,357 | (160 | ) | ||||||||
Commercial and industrial | 7,442 | 7,445 | (3 | ) | ||||||||
Transmission and other | 49 | 51 | (2 | ) | ||||||||
|
|
|
|
|
| |||||||
Total Regulated T&D Electric Sales | 12,688 | 12,853 | (165 | ) | ||||||||
|
|
|
|
|
| |||||||
| Regulated T&D Electric Sales(Gigawatt hours (GWh)) | 2010 | 2009 | Change | |||||||||
Residential | 5,357 | 4,922 | 435 | |||||||||
Commercial and industrial | 7,445 | 7,521 | (76 | ) | ||||||||
Other | 51 | 51 | — | |||||||||
Total Regulated T&D Electric Sales | 12,853 | 12,494 | 359 | |||||||||
107
DPL
| Regulated T&D Electric Customers (in thousands) | 2010 | 2009 | Change | |||||||||
Residential | 440 | 438 | 2 | |||||||||
Commercial and industrial | 59 | 59 | — | |||||||||
Other | 1 | 1 | — | |||||||||
Total Regulated T&D Electric Customers | 500 | 498 | 2 | |||||||||
| 2011 | 2010 | Change | ||||||||||
Regulated T&D Electric Customers (in thousands) | ||||||||||||
Residential | 441 | 440 | 1 | |||||||||
Commercial and industrial | 59 | 59 | — | |||||||||
Transmission and other | 1 | 1 | — | |||||||||
|
|
|
|
|
| |||||||
Total Regulated T&D Electric Customers | 501 | 500 | 1 | |||||||||
|
|
|
|
|
| |||||||
Regulated T&D Electric Revenue increased by $32$19 million primarily due to:
An increase of $15$12 million in transmission revenue primarily attributable to higher rates effective June 1, 2010 and June 1, 2011 related to increases in transmission plant investment.
An increase of $11 million due to distribution rate increases in Maryland effective December 2009July 2011, and in Delaware effective April 2010.February 2011.
The aggregate amount of these increases was partially offset by:
An increaseA decrease of $7$4 million due to higher revenuelower sales as a result of cooler weather during the 2011 spring and summer months, and warmer weather during the 2010 spring and summer2011 fall months as compared to 2009.
An increase of $5 million due to the implementation of the EmPower Maryland (a demand side management program) surcharge in March 2010 (which is substantially offset by a corresponding increase in Depreciation and Amortization).2010.
Default Electricity Supply
| 2011 | 2010 | Change | ||||||||||||||||||||||
| Default Electricity Supply Revenue | 2010 | 2009 | Change | |||||||||||||||||||||
Residential | $ | 577 | $ | 551 | $ | 26 | $ | 505 | $ | 577 | $ | (72 | ) | |||||||||||
Commercial and industrial | 181 | 209 | (28 | ) | 148 | 181 | (33 | ) | ||||||||||||||||
Other | 10 | 9 | 1 | 11 | 10 | 1 | ||||||||||||||||||
|
|
| ||||||||||||||||||||||
Total Default Electricity Supply Revenue | $ | 768 | $ | 769 | $ | (1 | ) | $ | 664 | $ | 768 | $ | (104 | ) | ||||||||||
|
|
| ||||||||||||||||||||||
| Default Electricity Supply Sales (GWh) | 2010 | 2009 | Change | |||||||||||||||||||||
| 2011 | 2010 | Change | ||||||||||||||||||||||
Default Electricity Supply Sales (GWh) | ||||||||||||||||||||||||
Residential | 5,199 | 4,821 | 378 | 4,856 | 5,199 | (343 | ) | |||||||||||||||||
Commercial and industrial | 1,954 | 2,050 | (96 | ) | 1,845 | 1,954 | (109 | ) | ||||||||||||||||
Other | 37 | 42 | (5 | ) | 29 | 37 | (8 | ) | ||||||||||||||||
|
|
| ||||||||||||||||||||||
Total Default Electricity Supply Sales | 7,190 | 6,913 | 277 | 6,730 | 7,190 | (460 | ) | |||||||||||||||||
|
|
| ||||||||||||||||||||||
| 2011 | 2010 | Change | ||||||||||||||||||||||
| Default Electricity Supply Customers (in thousands) | 2010 | 2009 | Change | |||||||||||||||||||||
Residential | 423 | 431 | (8 | ) | 415 | 423 | (8 | ) | ||||||||||||||||
Commercial and industrial | 45 | 47 | (2 | ) | 42 | 45 | (3 | ) | ||||||||||||||||
Other | 1 | 1 | — | — | 1 | (1 | ) | |||||||||||||||||
|
|
| ||||||||||||||||||||||
Total Default Electricity Supply Customers | 469 | 479 | (10 | ) | 457 | 469 | (12 | ) | ||||||||||||||||
|
|
| ||||||||||||||||||||||
Default Electricity Supply Revenue decreased by $1$104 million primarily due to:
A decrease of $31 million due to lower sales, primarily as a result of Delaware commercial and Maryland residential customer migration to competitive suppliers.
A decrease of $31$58 million as a result of lower Default Electricity Supply rates.
A decrease of $28 million due to lower sales, primarily as a result of customer migration to competitive suppliers.
108
DPL
A decrease of $25 million due to lower sales as a result of cooler weather during the spring and summer months of 2011, and warmer weather during the fall months of 2011, as compared to the corresponding periods in 2010.
The aggregate amount of these decreases was partially offset by:
An increase of $37 million due to higher sales primarily as a result of warmer weather during the 2010 spring and summer months as compared to 2009.
An increase of $22$7 million due to higher non-weather related average customer usage.
The following table shows the percentages of DPL’s total distribution sales by jurisdiction that are derived from customers receiving Default Electricity Supply from DPL. Amounts are for the years ended December 31:
| 2010 | 2009 | 2011 | 2010 | |||||||||||||
Sales to Delaware customers | 53 | % | 51 | % | 51 | % | 53 | % | ||||||||
Sales to Maryland customers | 63 | % | 63 | % | 58 | % | 63 | % | ||||||||
Natural Gas Operating Revenue
| 2010 | 2009 | Change | 2011 | 2010 | Change | |||||||||||||||||||
Regulated Gas Revenue | $ | 191 | $ | 228 | $ | (37 | ) | $ | 183 | $ | 191 | $ | (8 | ) | ||||||||||
Other Gas Revenue | 46 | 40 | 6 | 47 | 46 | 1 | ||||||||||||||||||
|
|
| ||||||||||||||||||||||
Total Natural Gas Operating Revenue | $ | 237 | $ | 268 | $ | (31 | ) | $ | 230 | $ | 237 | $ | (7 | ) | ||||||||||
|
|
| ||||||||||||||||||||||
The table above shows the amounts of Natural Gas Operating Revenue from sources that are subject to price regulation (Regulated Gas Revenue) and those that generally are not subject to price regulation (Other Gas Revenue). Regulated Gas Revenue includes the revenue DPL receives from on-system natural gas delivered sales and the transportation of natural gas for customers within its service territory at regulated rates. Other Gas Revenue includes off-system natural gas sales and the short-term release of interstate pipeline transportation and storage capacity not needed to serve customers. Off-system sales are made possible when low demand for natural gas by regulated customers creates excess pipeline capacity.
Regulated Gas
| 2011 | 2010 | Change | ||||||||||||||||||||||
| Regulated Gas Revenue | 2010 | 2009 | Change | |||||||||||||||||||||
Residential | $ | 118 | $ | 139 | $ | (21 | ) | $ | 113 | $ | 118 | $ | (5 | ) | ||||||||||
Commercial and industrial | 65 | 81 | (16 | ) | 61 | 65 | (4 | ) | ||||||||||||||||
Transportation and other | 8 | 8 | — | 9 | 8 | 1 | ||||||||||||||||||
|
|
| ||||||||||||||||||||||
Total Regulated Gas Revenue | $ | 191 | $ | 228 | $ | (37 | ) | $ | 183 | $ | 191 | $ | (8 | ) | ||||||||||
|
|
| ||||||||||||||||||||||
| 2011 | 2010 | Change | ||||||||||||||||||||||
| Regulated Gas Sales (billion cubic feet) | 2010 | 2009 | Change | |||||||||||||||||||||
Residential | 8 | 8 | — | 7 | 8 | (1 | ) | |||||||||||||||||
Commercial and industrial | 5 | 5 | — | 5 | 5 | — | ||||||||||||||||||
Transportation and other | 6 | 6 | — | 7 | 6 | 1 | ||||||||||||||||||
|
|
| ||||||||||||||||||||||
Total Regulated Gas Sales | 19 | 19 | — | 19 | 19 | — | ||||||||||||||||||
|
|
| ||||||||||||||||||||||
| Regulated Gas Customers (in thousands) | 2010 | 2009 | Change | |||||||||||||||||||||
Residential | 114 | 113 | 1 | |||||||||||||||||||||
Commercial and industrial | 9 | 10 | (1 | ) | ||||||||||||||||||||
Transportation and other | — | — | — | |||||||||||||||||||||
Total Regulated Gas Customers | 123 | 123 | — | |||||||||||||||||||||
| 2011 | 2010 | Change | ||||||||||
Regulated Gas Customers (in thousands) | ||||||||||||
Residential | 115 | 114 | 1 | |||||||||
Commercial and industrial | 9 | 9 | — | |||||||||
Transportation and other | — | — | — | |||||||||
|
|
|
|
|
| |||||||
Total Regulated Gas Customers | 124 | 123 | 1 | |||||||||
|
|
|
|
|
| |||||||
109
DPL
Regulated Gas Revenue decreased by $37$8 million primarily due to:
A decrease of $22 million due to Gas Cost Rate decreases effective March 2009 and November 2009.
A decrease of $14$17 million due to lower sales as a result of milder weather during the 2010 winter months as compared to 2009.non-weather related average customer usage.
Other Gas Revenue
Other Gas Revenue increased by $6 million primarily due to higher revenue from off-system sales resulting from:The decrease was partially offset by:
An increase of $4$6 million due to higher demand from electric generators and natural gas marketers.sales primarily as a result of colder weather during the winter months of 2011 as compared to 2010.
An increase of $2 million due to higher market prices.a distribution rate increase effective February 2011.
An increase of $2 million due to customer growth in 2011.
Operating Expenses
Purchased Energy
Purchased Energy consists of the cost of electricity purchased by DPL to fulfill its Default Electricity Supply obligation and, as such, is recoverable from customers in accordance with the terms of public service commission orders. Purchased Energy decreased by $11$105 million to $635 million in 2011, from $740 million in 2010 from $751 million in 2009 primarily due to:
A decrease of $20 million in deferred electricity expense primarily due to lower Default Electricity Supply Revenue rates, which resulted in a lower rate of recovery of Default Electricity Supply costs.
A decrease of $20$68 million due to lower average electricity costs under Default Electricity Supply contracts.
A decrease of $4$22 million due to lower electricity sales primarily as a result of cooler weather during the spring and summer months of 2011, and warmer weather during the fall months of 2011, as compared to the corresponding periods in 2010.
A decrease of $21 million primarily due to commercial and residential customer migration to competitive suppliers.
The aggregate amount of these decreases was partially offset by:
An increase of $33$8 million in deferred electricity expense primarily due to lower Default Electricity Supply rates, which resulted in a higher sales primarily as a resultrate of warmer weather during the 2010 spring and summer months as compared to 2009.recovery of Default Electricity Supply costs.
Gas Purchased
Gas Purchased consists of the cost of natural gas purchased by DPL to fulfill its obligation to regulated natural gas customers and, as such, is recoverable from customers in accordance with the terms of public service commission orders. It also includes the cost of natural gas purchased for off-system sales. Total Gas Purchased decreased by $29$9 million to $155 million in 2011 from $164 million in 2010 from $193 million in 2009 primarily due to:
A decrease of $17$16 million in deferred naturalthe cost of gas expensepurchases for on-system sales as a result of a lower rate of recovery of naturalaverage gas supply costs.prices, lower volumes purchased and lower withdraws from storage.
A decrease of $12$11 million from the settlement of financial hedges entered into as part of DPL’s hedge program for the purchase of regulated natural gas.
The aggregate amount of these decreases was partially offset by:
An increase of $18 million in deferred gas expense as a result of a higher rate of recovery of natural gas supply costs.
110
DPL
Other Operation and Maintenance
Other Operation and Maintenance increaseddecreased by $17$16 million to $239 million in 2011 from $255 million in 2010 from $238 million in 2009. Excluding an increase of $3 million primarily related to administrative expenses that are deferred and recoverable in Default Electricity Supply Revenue, Other Operation and Maintenance expense increased by $14 million. The $14 million increase was primarily due to:
A decrease of $16 million resulting from adjustments recorded by DPL in 2011 associated with the accounting for DPL Default Electricity Supply. These adjustments were primarily due to the under-recognition of allowed returns on working capital, uncollectible, late fees and administrative costs.
A decrease of $4 million in environmental remediation costs.
A decrease of $2 million due to an adjustment of self-insurance reserves for general and auto liability claims recorded in 2011.
A decrease of $2 million due to an adjustment for February 2010 severe winter storm costs that previously were charged to other operation and maintenance expense. The adjustment was recorded in accordance with a MPSC rate order issued in July 2011, allowing for the recovery of the costs.
The aggregate amount of these decreases was partially offset by:
An increase of $6$5 million in emergency restoration costs. The increase is primarily duerelated to significant incremental costs incurred for repair work following Hurricane Irene in August 2011. Costs incurred for repair work were $8 million, of which $5 million was deferred as a regulatory asset to reflect the probable recovery of these storm costs in certain jurisdictions, and the remaining $3 million was charged to other operation and maintenance expense. DPL currently plans to seek recovery of the incremental Hurricane Irene costs in each of its jurisdictions in planned distribution rate case filings.
An increase of $5 million associated with higher corrective and preventative maintenance and tree trimming costs.
An increase of $4 million in emergency restoration costs primarily due to the February 2010 severe winter storms.
A $4 million accrual in 2010 for estimated future environmental remediation costs related to a 1999 oil release at the Indian River generating facility then owned by DPL, as further discussed under “Indian River Oil Release” in Note (15), “Commitments and Contingencies,” to the financial statements of DPL.
An increase of $2 million primarily due to system support and customer support services costs.
The aggregate amount of these increases was partially offset by:
A decrease of $5 million in employee-related costs, primarily due to lower pension and other postretirement benefit expenses.
Restructuring Charge
With the ongoing wind downAs a result of the retail energy supply business of Pepco Energy Services and the disposition of Conectiv Energy, PHI is repositioning itself as a regulated transmission and distribution company. In connection with this repositioning, PHI commenced a comprehensivePHI’s organizational review in the second quarter of 2010, to identify opportunities to streamline the organization and to achieve certain reductions in corporate overhead costs that are allocated to itsDPLs operating segments. This review has resulted in the adoption of a restructuring plan. PHI began implementing the plan during the third quarter, identifying 164 employee positions that were eliminated during the fourth quarter of 2010. The plan also focuses on identifying additional cost reduction opportunities through process improvements and operational efficiencies. PHI currently estimates that the implementation of the plan will result in an annual reduction of approximately $28 million in corporate overhead costs.
In connection with the plan, DPL recordedexpenses include a pre-tax restructuring charge of $8 million for the year ended December 31, 2010, related to severance pension, and health and welfare benefits to be provided to terminated employees.
Depreciation and Amortization
Depreciation and Amortization expense increased by $7$6 million to $89 million in 2011 from $83 million in 2010 from $76 million in 2009 primarily due to:
An increase of $3$4 million due to utility plant additions.
An increase of $1 million in amortization of regulatory assets primarily due toassociated with the EmPower Maryland surcharge that became effective in March 2010 (which is substantially offset by a corresponding increase in Regulated T&D Electric Revenue).
An increase of $3 million due to utility plant additions.111
DPL
Other Income (Expenses)
Other Expenses (which are net of Other Income) decreased by $5 million to a net expense of $37 million in 2010 from a net expense of $42 million in 2009. The decrease was primarily due to an increase of $3 million in income related to Allowance for Funds Used During Construction that is applied to capital projects.
Income Tax Expense
DPL’s effective tax rates for the years ended December 31, 2011 and 2010 were 37.2% and 2009 were 40.8% and 23.5%, respectively. The increasedecrease in the effective rate is primarily related to PHI’s 2011 settlement with the IRS regarding interest due on its federal tax rate resulted primarily fromliabilities related to the impactNovember 2010 audit settlement for the tax years 1996 to 2002. In connection with this agreement, PHI reallocated certain amounts that have been on deposit with the IRS since 2006 among liabilities in the settlement years and subsequent years. Primarily related to the settlement and reallocations, DPL recorded an additional $4 million (after-tax) interest benefit. This is partially offset by adjustments recorded in the third quarter of a refund of2011 related to DPL’s settlement with the state taxes DPL receivedtaxing authorities resulting in 2009. DPL received a refund of $6$1 million (after-tax) of state income taxesadditional tax expense and established a statethe recalculation of interest on its uncertain tax benefit carryforward of $7 million (after-tax), eachpositions for open tax years based on different assumptions related to a changethe application of its deposit made with the IRS in 2006. This resulted in an additional tax reporting for certain asset dispositions occurring in prior years.expense of $1 million (after-tax).
In addition, the effective tax rate increased in 2010 as a result of the November 2010 settlement PHI reached with the Internal Revenue Service (IRS)IRS with respect to its Federal tax returns for the years 1996 to 2002. In connection with the settlement, PHI reallocated certain amounts on deposit with the IRS since 2006 among liabilities in the settlement years and subsequent years. In light of the settlement and reallocations, DPL has recalculated the estimated interest due for the tax years 1996 to 2002. The revised estimate has resulted in an additional $3 million (after-tax) of estimated interest due to the IRS. This additional interest expense has been recorded in 2010 and is subject to adjustment when the IRS finalizes its calculation of the amount due. This expense was partially offset by the reversal of $2 million of previously recorded tax liabilities.
Capital Requirements
Sources of Capital
DPL has a range of capital sources available, in addition to internally generated funds, to meet its long-term and short-term funding needs. The sources of long-term funding include the issuance of mortgage bonds and other debt securities and bank financings, as well as the ability to issue preferred stock. Proceeds from long-term financings are used primarily to fund long-term capital requirements, such as capital expenditures, and to repay or refinance existing indebtedness. DPL traditionally has used a number of sources to fulfill short-term funding needs, including commercial paper, short-term notes, bank lines of credit, and borrowings under the PHI money pool. Proceeds from short-term borrowings are used primarily to meet working capital needs, but may also be used to temporarily fund long-term capital requirements. DPL’s ability to generate funds from its operations and to access the capital and credit markets is subject to risks and uncertainties. Volatile and deteriorating financial market conditions, diminished liquidity and tightening credit may affect access to certain of DPL’s potential funding sources. See Item 1A, “Risk Factors,” of this Form 10-K, for additional discussion of important factors that may have an effect on DPL’s sources of capital.
Debt Securities
DPL has a Mortgage and Deed of Trust (the Mortgage) under which it issues First Mortgage Bonds. First Mortgage Bonds issued under the Mortgage are secured by a lien on substantially all of DPL’s property, plant and equipment. The principal amount of First Mortgage Bonds that DPL may issue under the Mortgage is limited by the principal amount of retired First Mortgage Bonds and 60% of the lesser of the cost or fair value of new property additions that have not been used as the basis for the issuance of additional First Mortgage Bonds. DPL also has an Indenture under which it issues unsecured senior notes, medium-term notes and Variable Rate Demand Bonds.VRDBs. To fund the construction of pollution control facilities, DPL also has from time to time issued tax-exempt bonds, including tax-exempt Variable Rate Demand Bonds,VRDBs, through a public agency, the proceeds of which are loaned to DPL by the agency.
112
DPL
Information concerning the principal amount and terms of DPL’s outstanding First Mortgage Bonds, senior notes, medium-term notes and Variable Rate Demand Bonds,VRDBs, and tax-exempt bonds issued for the benefit of DPL, as of December 31, 2010,2011, is set forth in Note (11), “Debt,” to the financial statements of DPL set forth in Part II, Item 8 of this Form 10-K.DPL.
Bank Financing
As further discussed in Note (11), “Debt,” to the financial statements of DPL, set forth in Part II, Item 8 of this Form 10-K, DPL participates inis a borrower under a $1.5 billonbillion credit facility, along with PHI, Potomac Electric Power Company (Pepco)Pepco and Atlantic City Electric Company (ACE). The facility, all or any portion ofACE, which may be used to obtain loans or to issue letters of credit, expires in 2012.2016. DPL’s credit limit under the facility is the lesser of $500$250 million and the maximum amount of short-term debt DPL is permitted to have outstanding by its regulatory authorities, except that the aggregate amount of credit usedauthorities. The short-term borrowing limit established by FERC for DPL Pepco and ACE at any given time may not collectively exceed $625is $500 million.
Commercial Paper Program
DPL maintains an ongoing commercial paper program of up to $500 million under which it can issue commercial paper with maturities of up to 270 days. The commercial paper is backed by DPL’s borrowing capacity under the PHI $1.5 billion credit facility.
DPL had $47 million of commercial paper outstanding at December 31, 2011 and zero outstanding at December 31, 2010. The weighted average interest rates for commercial paper issued during 2011 and 2010 were 0.34%. The weighted average maturity of all commercial paper issued by DPL during 2011 and 2010 was two days.
Money Pool
DPL participates in the money pool operated by PHI under authorization received from FERC. The money pool is a cash management mechanism used by PHI and eligible subsidiaries to manage their short-term investment and borrowing requirements. PHI may invest in, but not borrow from, the money pool. Eligible subsidiaries with surplus cash may deposit those funds in the money pool. Deposits in the money pool are guaranteed by PHI. Eligible subsidiaries with cash requirements may borrow from the money pool. Borrowings from the money pool are unsecured. Depositors in the money pool receive, and borrowers from the money pool pay, an interest rate based primarily on PHI’s short-term borrowing rate. PHI deposits funds in the money pool to the extent that the pool has insufficient funds to meet the borrowing needs of its participants, which PHI may obtain from external sources.
Regulatory Restrictions on Financing Activities
DPL’s long-term financing activities (including the issuance of securities and the incurrence of debt) is subject to authorization by the Delaware Public Service CommissionDPSC and the Maryland Public Service Commission.MPSC. Through its periodic filings with the respective utility commissions, DPL generally seeks to maintainmaintains standing authority sufficient to cover its projected financing needs over a multi-year period. Under the Federal Power Act,FPA, FERC has jurisdiction over the issuance of long-term and short-term securities of public utilities, but only if the issuance is not regulated by the state public utility commission in which the public utility is organized and operating. Under these provisions, DPL is required to obtainhas obtained FERC authorization for the issuance of short-term debt.debt under these provisions.
Capital Expenditures
DPL’s capital expenditures for the year ended December 31, 2010,2011, totaled $250$229 million. These expenditures were primarily related to capital costs associated with new customer services, distribution reliability and transmission. The expenditures also include an allocation by PHI of hardware and software expenditures that primarily benefit the Power Delivery business and are allocated to DPL when the assets are placed in service.
113
DPL
The following table shows DPL’s projected capital expenditures for the five-year period 20112012 through 2015.2016. DPL expects to fund these expenditures through internally generated cash, external financing and capital contributions from PHI.
| For the Year | ||||||||||||||||||||||||
| 2011 | 2012 | 2013 | 2014 | 2015 | Total | |||||||||||||||||||
| (millions of dollars) | ||||||||||||||||||||||||
DPL | ||||||||||||||||||||||||
Distribution | $ | 113 | $ | 105 | $ | 116 | $ | 126 | $ | 113 | $ | 573 | ||||||||||||
Distribution - Blueprint for the Future | 21 | 40 | — | — | — | 61 | ||||||||||||||||||
Transmission | 76 | 107 | 88 | 82 | 80 | 433 | ||||||||||||||||||
Transmission - MAPP | 51 | 146 | 138 | 74 | 60 | 469 | ||||||||||||||||||
Gas Delivery | 20 | 20 | 20 | 20 | 20 | 100 | ||||||||||||||||||
Other | 27 | 21 | 18 | 16 | 19 | 101 | ||||||||||||||||||
Total DPL | $ | 308 | $ | 439 | $ | 380 | $ | 318 | $ | 292 | $ | 1,737 | ||||||||||||
DPL has not received any awards from the U. S. Department of Energy under the American Recovery and Reinvestment Act of 2009 in support of its Blueprint for the Future and other initiatives.
| For the Year |
| |||||||||||||||||||||||
| 2012 | 2013 | 2014 | 2015 | 2016 | Total | |||||||||||||||||||
| (millions of dollars) | ||||||||||||||||||||||||
DPL | ||||||||||||||||||||||||
Distribution | $ | 136 | $ | 153 | $ | 144 | $ | 144 | $ | 161 | $ | 738 | ||||||||||||
Distribution – Blueprint for the Future | 44 | 2 | — | — | — | 46 | ||||||||||||||||||
Transmission | 148 | 93 | 128 | 120 | 116 | 605 | ||||||||||||||||||
Transmission – MAPP | 4 | 1 | 1 | 3 | 58 | 67 | ||||||||||||||||||
Gas Delivery | 22 | 23 | 23 | 25 | 27 | 120 | ||||||||||||||||||
Other | 52 | 29 | 20 | 14 | 17 | 132 | ||||||||||||||||||
|
|
|
|
|
|
|
|
|
|
|
| |||||||||||||
Total DPL | $ | 406 | $ | 301 | $ | 316 | $ | 306 | $ | 379 | $ | 1,708 | ||||||||||||
|
|
|
|
|
|
|
|
|
|
|
| |||||||||||||
Transmission and Distribution
The projected capital expenditures listed in the table above for distribution (other than Blueprint for the Future), transmission (other than the Mid-Atlantic Power Pathway (MAPP)MAPP project) and natural gas delivery are primarily for facility replacements and upgrades to accommodate customer growth and reliability.service reliability, including capital expenditures for reliability enhancement efforts.
Blueprint for the Future
DPL has undertaken programs to install smart meters, further automate its electric distribution systems and enhance its communications infrastructure, which it refers to as the Blueprint for the Future. For a discussion of the Blueprint for the Future initiative, see Item 1, “Business - DescriptionPHI’s “Management’s Discussion and Analysis of Business - Financial Condition and Results of Operations – General Overview—Blueprint for the Future” of this Form 10-K.Future.” The projected capital expenditures over the next five years are shown as Distribution – Blueprint for the Future in the table above.
MAPP Project
PHI has under development the construction of a new 230-mile, 500-kilovolt152-mile, interstate transmission line as part of PJM’s regional transmission expansion plan. For a description of the MAPP project, see Item 1, “Business - Description of Business - MAPP Project” of this Form 10-K. The projected capital expenditures over the next five years for MAPP are shown as Transmission -– MAPP in the table above.
MAPP/DOE Loan Program
To assist in the funding of the MAPP project, PHI has applied for a $684 million loan guarantee from the Department of Energy (DOE)DOE for a substantial portion of the MAPP project, primarily the Calvert Cliffs to Indian River segment. The application has been made under a federal loan guarantee program for projects that employ innovative energy efficiency, renewable energy and advanced transmission and distribution technologies. If granted, PHI believes the guarantee could allow PHI to acquire financing at a lower cost than it would otherwise be able to obtain in the capital markets. Whether PHI’s application will be granted and, if so, the amount of debt guaranteed is subject to the discretion of the DOE and the negotiation of terms that will satisfy the conditions of the guarantee program. On February 28, 2011,
114
DPL
the DOE issued a Notice of Intent to prepare an Environmental Impact Statement to assist the DOE in assessing the environmental impact of constructing the portion of the MAPP project to be supported by the loan guarantee. Since February 2011, the DOE has conducted field inspections of the entire route and has held public meetings to obtain input from the communities along the route.
The DOE’s review of the loan guarantee program has delayed the DOE’s review of PHI’s loan guarantee application. There is not an approval deadline under the loan guarantee program, but this program could change or be terminated in the future. PHI continues to coordinate environmental activities with the DOE.
Pension and Other Postretirement Benefit Plans
DPL participates in pension and postretirement benefitOPEB plans sponsored by PHI for its employees. While the plans have not experienced any significant impact in terms of liquidity or counterparty exposure dueDPL contributed $40 million and zero to the disruption of the capitalPHI Retirement Plan during 2011 and credit markets, the stock market declines in 2008 caused a decrease in the market value of benefit plan assets at the end of 2008.2010, respectively.
On January 31, 2012, DPL contributed zero and $10made an $85 million discretionary tax-deductible contribution to the pension plan during 2010 and 2009, respectively.
DPL
Forward-Looking Statements115
Some of the statements contained in this Annual Report on Form 10-K are forward-looking statements within the meaning of Section 21E of the Securities Exchange Act of 1934, as amended, and are subject to the safe harbor created by the Private Securities Litigation Reform Act of 1995. These statements include declarations regarding DPL’s intents, beliefs and current expectations. In some cases, you can identify forward-looking statements by terminology such as “may,” “will,” “should,” “expects,” “plans,” “anticipates,” “believes,” “estimates,” “predicts,” “potential” or “continue” or the negative of such terms or other comparable terminology. Any forward-looking statements are not guarantees of future performance, and actual results could differ materially from those indicated by the forward-looking statements. Forward-looking statements involve estimates, assumptions, known and unknown risks, uncertainties and other factors that may cause DPL’s actual results, levels of activity, performance or achievements to be materially different from any future results, levels of activity, performance or achievements expressed or implied by such forward-looking statements.
The forward-looking statements contained herein are qualified in their entirety by reference to the following important factors, which are difficult to predict, contain uncertainties, are beyond DPL’s control and may cause actual results to differ materially from those contained in forward-looking statements:
Changes in governmental policies and regulatory actions affecting the energy industry, including allowed rates of return, industry and rate structure, acquisition and disposal of assets and facilities, operation and construction of transmission and distribution facilities and the recovery of purchased power expenses;
Weather conditions affecting usage and emergency restoration costs;
Population growth rates and changes in demographic patterns;
Changes in customer demand for electricity and natural gas due to conservation measures and the use of more energy-efficient products;
General economic conditions, including the impact of an economic downturn or recession on electricity and natural gas usage;
Changes in and compliance with environmental and safety laws and policies;
Changes in tax rates or policies;
Changes in rates of inflation;
Changes in accounting standards or practices;
Unanticipated changes in operating expenses and capital expenditures;
Rules and regulations imposed by federal and/or state regulatory commissions, PJM, the North American Electric Reliability Corporation and other applicable electric reliability organizations;
Legal and administrative proceedings (whether civil or criminal) and settlements that affect DPL’s business and profitability;
Interest rate fluctuations and the impact of credit and capital market conditions on the ability to obtain funding on favorable terms; and
Effects of geopolitical events, including the threat of domestic terrorism.
DPL
Any forward-looking statements speak only as to the date of this Annual Report on Form 10-K and DPL undertakes no obligation to update any forward-looking statements to reflect events or circumstances after the date on which such statements are made or to reflect the occurrence of unanticipated events. New factors emerge from time to time, and it is not possible for DPL to predict all of such factors, nor can DPL assess the impact of any such factor on DPL’s business or the extent to which any factor, or combination of factors, may cause results to differ materially from those contained in any forward-looking statement.
The foregoing review of factors should not be construed as exhaustive.
ACE
MANAGEMENT’S DISCUSSION AND ANALYSIS OF FINANCIAL CONDITION AND RESULTS OF OPERATIONS
Atlantic City Electric CompanyPower Delivery
Atlantic City Electric Company (ACE) meets the conditions set forth in General Instruction I(1)(a) and (b) to the Form 10-K, and accordingly information otherwise required under this Item has been omitted in accordance with General Instruction I(2)(a) to the Form 10-K.Distribution
General Overview
ACE is engaged in the transmission and distribution of electricity in southern New Jersey. ACE also provides Default Electricity Supply, which is the supply of electricity at regulated rates to retail customers in its service territory who do not elect to purchase electricity from a competitive energy supplier. Default Electricity Supply is known as Basic Generation Service (BGS) in New Jersey. ACE’s service territory covers approximately 2,700 square miles and has a population of approximately 1.1 million.
ACE is a wholly owned subsidiary of Conectiv, which is wholly owned by Pepco Holdings, Inc. (PHI or Pepco Holdings). Because PHI is a public utility holding company subject to the Public Utility Holding Company Act of 2005 (PUHCA 2005), the relationship between PHI and ACE and certain activities of ACE are subject to the regulatory oversight of the Federal Energy Regulatory Commission (FERC) under PUHCA 2005.
ACE
RESULTS OF OPERATIONS
The following results of operations discussion compares the year ended December 31, 2010 to the year ended December 31, 2009. All amounts in the tables (except sales and customers) are in millions of dollars.
Operating Revenue
| 2010 | 2009 | Change | ||||||||||
Regulated T&D Electric Revenue | $ | 415 | $ | 363 | $ | 52 | ||||||
Default Electricity Supply Revenue | 998 | 970 | 28 | |||||||||
Other Electric Revenue | 17 | 18 | (1 | ) | ||||||||
Total Operating Revenue | $ | 1,430 | $ | 1,351 | $ | 79 | ||||||
The table above shows the amount of Operating Revenue earned that is subject to price regulation (Regulated Transmission & Distribution (T&D) Electric Revenue and Default Electricity Supply Revenue) and that which is not subject to price regulation (Other Electric Revenue).
Regulated T&D Electric Revenue includes revenue from the distribution of electricity, including the distribution of Default Electricity Supply, to ACE’s customers within its service territory at regulated rates. Regulated T&D Electric Revenue also includes transmission service revenue that ACE receives as a transmission owner from PJM Interconnection, LLC (PJM) at rates regulated by FERC. Transmission rates are updated annually based on a FERC-approved formula methodology.
Default Electricity Supply Revenue is the revenue received from the supply of electricity by ACE at regulated rates to retail customers who do not elect to purchase electricity from a competitive supplier, also known as Basic Generation Service (BGS). The costs related to Default Electricity Supply are included in Purchased Energy. Default Electricity Supply Revenue also includes revenue from Transition Bond Charges that ACE receives, and pays to Atlantic City Electric Transition Funding LLC (ACE Funding), to fund the principal and interest payments on Transition Bonds issued by ACE Funding and revenue in the form of transmission enhancement credits that ACE receives as a transmission owner from PJM for approved regional transmission expansion plan costs (Transmission Enhancement Credits).
Other Electric Revenue includes work and services performed on behalf of customers, including other utilities, which is generally not subject to price regulation. Work and services includes mutual assistance to other utilities, highway relocation, rentals of pole attachments, late payment fees, and collection fees.
Regulated T&D Electric
| Regulated T&D Electric Revenue | 2010 | 2009 | Change | |||||||||
Residential | $ | 185 | $ | 161 | $ | 24 | ||||||
Commercial and industrial | 142 | 131 | 11 | |||||||||
Other | 88 | 71 | 17 | |||||||||
Total Regulated T&D Electric Revenue | $ | 415 | $ | 363 | $ | 52 | ||||||
ACE
Other Regulated T&D Electric Revenue consists primarily of transmission service revenue.
| Regulated T&D Electric Sales (Gigawatt hours (GWh)) | 2010 | 2009 | Change | |||||||||
Residential | 4,691 | 4,280 | 411 | |||||||||
Commercial and industrial | 5,445 | 5,330 | 115 | |||||||||
Other | 49 | 49 | — | |||||||||
Total Regulated T&D Electric Sales | 10,185 | 9,659 | 526 | |||||||||
| Regulated T&D Electric Customers (in thousands) | 2010 | 2009 | Change | |||||||||
Residential | 482 | 481 | 1 | |||||||||
Commercial and industrial | 65 | 65 | — | |||||||||
Other | 1 | 1 | — | |||||||||
Total Regulated T&D Electric Customers | 548 | 547 | 1 | |||||||||
Regulated T&D Electric Revenue increased by $52 million primarily due to:
An increase of $17 million in transmission revenue primarily attributable to higher rates effective June 1, 2010 related to an increase in transmission plant investment.
An increase of $17 million due to a distribution rate increase that became effective in June 2010.
An increase of $13 million due to higher revenue primarily as a result of warmer weather during the 2010 spring and summer months as compared to 2009.
An increase of $5 million due to higher non-weather related average customer usage.
Default Electricity Supply
| Default Electricity Supply Revenue | 2010 | 2009 | Change | |||||||||
Residential | $ | 580 | $ | 514 | $ | 66 | ||||||
Commercial and industrial | 243 | 316 | (73 | ) | ||||||||
Other | 175 | 140 | 35 | |||||||||
Total Default Electricity Supply Revenue | $ | 998 | $ | 970 | $ | 28 | ||||||
Other Default Electricity Supply Revenue consists primarily of: (i) revenue from the resale in the PJM Regional Transmission Organization market of energy and capacity purchased under contracts with unaffiliated, non-utility generators (NUGs), and (ii) revenue from Transmission Enhancement Credits.
| Default Electricity Supply Sales (GWh) | 2010 | 2009 | Change | |||||||||
Residential | 4,610 | 4,280 | 330 | |||||||||
Commercial and industrial | 1,967 | 2,681 | (714 | ) | ||||||||
Other | 46 | 49 | (3 | ) | ||||||||
Total Default Electricity Supply Sales | 6,623 | 7,010 | (387 | ) | ||||||||
ACE
| Default Electricity Supply Customers (in thousands) | 2010 | 2009 | Change | |||||||||
Residential | 458 | 481 | (23 | ) | ||||||||
Commercial and industrial | 56 | 62 | (6 | ) | ||||||||
Other | — | 1 | (1 | ) | ||||||||
Total Default Electricity Supply Customers | 514 | 544 | (30 | ) | ||||||||
Default Electricity Supply Revenue increased by $28 million primarily due to:
An increase of $40 million due to higher sales primarily as a result of warmer weather during the 2010 spring and summer months as compared to 2009.
An increase of $29 million in wholesale energy and capacity revenues primarily due to higher market prices– Blueprint for the sale of electricity and capacity purchased from NUGs.Future
Transmission
Transmission – MAPP
Gas Delivery
Other
An increase of $20 million due to higher non-weather related average customer usage.
An increase of $19 million as a result of higher Default Electricity Supply rates.
An increase of $6 million due to an increase in revenue from Transmission Enhancement Credits.
The aggregate amount of these increases was partially offset by:
A decrease of $87 million due to lower sales, primarily as a result of commercial and industrial customer migration to competitive suppliers.
Total Default Electricity Supply Revenue for the 2010 period includes an increase of $8 million in unbilled revenue attributable to ACE’s BGS. Under the BGS terms approved by the New Jersey Board of Public Utilities (NJBPU), ACE is entitled to recover from its customers all of its costs of providing BGS. If the costs of providing BGS exceed the BGS revenue, then the excess costs are deferred in Deferred Electric Service Costs. ACE’s BGS unbilled revenue (which is the result of the recognition of revenue when the electricity is delivered, as opposed to when it is billed) is not included in the deferral calculation, and therefore has an impact on the results of operations in the period during which it is accrued. While the change in the amount of unbilled revenue from year to year typically is not significant, for the year ended December 31, 2010, BGS unbilled revenue increased by $8 million as compared to the year ended December 31, 2009, which resulted in a $5 million increase in ACE’s net income. The increase was primarily due to higher Default Electricity Supply rates and colder weather during the unbilled revenue period at the end of 2010 as compared to the corresponding period in 2009.
For the years ended December 31, 2010 and 2009, the percentages of ACE’s total distribution sales that are derived from customers receiving Default Electricity Supply are 65% and 73%, respectively.
ACE
Operating Expenses
Purchased Energy
Purchased Energy consists of the cost of electricity purchased by ACE to fulfill its Default Electricity Supply obligation and, as such, is recoverable from customers in accordance with the terms of public service commission orders. Purchased Energy decreased by $46 million to $1,030 million in 2010 from $1,076 million in 2009 primarily due to:
A decrease of $109 million due to lower sales, primarily due to commercial and industrial customer migration to competitive suppliers.
The decrease was partially offset by:
An increase of $49 million due to higher sales primarily as a result of warmer weather during the 2010 spring and summer months as compared to 2009.
An increase of $14 million due to higher average electricity costs under Default Electricity Supply contracts.
Other Operation and Maintenance
Other Operation and Maintenance increased by $14 million to $204 million in 2010 from $190 million in 2009. Excluding an increase of $6 million primarily related to bad debt expenses and New Jersey Societal Benefit Program costs that are deferred and recoverable, Other Operation and Maintenance expense increased by $8 million. The $8 million increase was primarily due to:
An increase of $7 million in emergency restoration costs primarily due to the severe winter storms in February 2010.
An increase of $5 million due to higher tree trimming costs.
An increase of $2 million due to an adjustment
Sub-Total
DOE Capital Reimbursement Awards (a)
Total for non-recoverable litigation costs related to ACE’s former interests in certain nuclear generating facilities in accordance with a May 2010 settlement approved by the NJBPU.Power Delivery
The aggregate amount of these increases was partially offset by:
A decrease of $6 million in employee-related costs, primarily due to lower pension and other postretirement benefit expenses.
Restructuring Charge
With the ongoing wind down of the retail energy supply business of Pepco Energy Services
Corporate and the disposition of Conectiv Energy, PHI is repositioning itself as a regulated transmission and distribution company. In connection with this repositioning, PHI commenced a comprehensive organizational review in the second quarter of 2010 to identify opportunities to streamline the organization and to achieve certain reductions in corporate overhead costs that are allocated to its operating segments. This review has resulted in the adoption of a restructuring plan. PHI began implementing the plan during the third quarter, identifying 164 employee positions that were eliminated during the fourth quarter of 2010. The plan also focuses on identifying additional cost reduction opportunities through process improvements and operational efficiencies. PHI currently estimates that the implementation of the plan will result in an annual reduction of approximately $28 million in corporate overhead costs.Other
ACE
In connection with the plan, ACE recorded a pre-tax restructuring charge of $6 million for the year ended December 31, 2010, related to severance, pension, and health and welfare benefits to be provided to terminated employees.
Depreciation and Amortization
Depreciation and Amortization expense increased by $10 million to $112 million in 2010 from $102 million in 2009 primarily due to higher amortization of stranded costs as the result of higher revenues due to increases in sales (partially offset in Default Electricity Supply Revenue).
Deferred Electric Service Costs
Deferred Electric Service Costs represent (i) the over or under recovery of electricity costs incurred by ACE to fulfill its Default Electricity Supply obligation and (ii) the over or under recovery of New Jersey Societal Benefit Program costs incurred by ACE. The cost of electricity purchased is reported under Purchased Energy and the corresponding revenue is reported under Default Electricity Supply Revenue. The cost of New Jersey Societal Benefit Programs is reported under Other Operation and Maintenance and the corresponding revenue is reported under Regulated T&D Electric Revenue.
Deferred Electric Service Costs increased by $53 million, to an expense reduction of $108 million in 2010 as compared to an expense reduction of $161 million in 2009, primarily due to an increase in deferred electricity expense as a result of lower electricity supply costs and higher Default Electricity Supply Revenue rates.
Income Tax Expense
ACE’s consolidated effective tax rates for the years ended December 31, 2010 and 2009 were 44.8% and 29.3%, respectively. The increase in the effective tax rate resulted primarily from two reversals of previously accrued interest on uncertain and effectively settled tax positions. The first reversal was the result of the November 2010 settlement PHI reached with the Internal Revenue Service (IRS) with respect to its federal tax returns for the years 1996 to 2002. In connection with the settlement, PHI reallocated certain amounts on deposit with the IRS since 2006 among liabilities in the settlement years and subsequent years. In light of the settlement and reallocations, ACE has recalculated the estimated interest due for the tax years 1996 to 2002. The revised estimate has resulted in an additional $1 million (after-tax) of estimated interest due to the IRS. This additional interest expense has been recorded in 2010 and is subject to adjustment when the IRS finalizes its calculation of the amount due. The second reversal of $6 million of accrued interest income was recorded in 2010 to eliminate interest on uncertain and effectively settled state income tax positions that had been erroneously accrued in prior periods.
Capital Requirements
Sources of Capital
ACE has a range of capital sources available, in addition to internally generated funds, to meet its long-term and short-term funding needs. The sources of long-term funding include the issuance of mortgage bonds and other debt securities and bank financings, as well as preferred stock. Proceeds from long-term financings are used primarily to fund long-term capital requirements, such as capital expenditures, and to repay or refinance existing indebtedness. ACE traditionally has used a number of sources to fulfill short-term funding needs, including commercial paper, short-term notes, bank lines of credit, and borrowings under the PHI money pool. Proceeds from short-term borrowings are used primarily to meet working capital needs, but may also be used to temporarily fund long-term capital requirements. ACE’s ability to generate funds from its operations and to access the capital and credit markets is subject to risks and uncertainties. Volatile and deteriorating financial market conditions, diminished liquidity and tightening credit may affect access to certain of ACE’s potential funding sources. See Item 1A, “Risk Factors,” of this Form 10-K, for additional discussion of important factors that may have an effect on ACE’s sources of capital.
ACE
Debt Securities
ACE has a Mortgage and Deed of Trust (the Mortgage) under which it issues First Mortgage Bonds. First Mortgage Bonds issued under the Mortgage are secured by a lien on substantially all of ACE’s property, plant and equipment. The principal amount of First Mortgage Bonds that ACE may issue under the Mortgage is limited by the principal amount of retired First Mortgage Bonds and 65% of the lesser of the cost or fair value of new property additions that have not been used as the basis for the issuance of additional First Mortgage Bonds. ACE also has an Indenture under which it issues senior notes secured by First Mortgage Bonds and an Indenture under which it can issue unsecured debt securities, including Variable Rate Demand Bonds. To fund the construction of pollution control facilities, ACE also has from time to time issued tax-exempt bonds, including tax-exempt Variable Rate Demand Bonds, through a municipality, the proceeds of which are loaned to ACE by the municipality.
Information concerning the principal amount and terms of ACE’s outstanding First Mortgage Bonds, senior notes and Variable Rate Demand Bonds, and tax-exempt bonds issued for the benefit of ACE, as of December 31, 2010, is set forth in Note (10), “Debt,” to the consolidated financial statements of ACE set forth in Part II, Item 8 of this Form 10-K.
Bank Financing
As further discussed in Note (10), “Debt,” to the consolidated financial statements of ACE set forth in Part II, Item 8 of this Form 10-K, ACE participates in a $1.5 billion credit facility, along with PHI, Potomac Electric Power Company (Pepco) and Delmarva Power & Light Company (DPL). The facility, all or any portion of which may be used to obtain loans or to issue letters of credit expires in 2012. ACE’s credit limit under the facility is the lesser of $500 million and the maximum amount of debt ACE is permitted to have outstanding by its regulatory authorities, except that the aggregate amount of credit used by ACE, Pepco and DPL at any given time may not collectively exceed $625 million.
Commercial Paper Program
ACE maintains an ongoing commercial paper program of up to $250 million under which it can issue commercial paper with maturities of up to 270 days. The commercial paper is backed by ACE’s borrowing capacity under the PHI $1.5 billion credit facility.
Money Pool
ACE participates in the money pool operated by PHI under authorization received from the NJBPU. The money pool is a cash management mechanism used by PHI and eligible subsidiaries to manage their short-term investment and borrowing requirements. PHI may invest in, but not borrow from, the money pool. Eligible subsidiaries with surplus cash may deposit those funds in the money pool. Deposits in the money pool are guaranteed by PHI. Eligible subsidiaries with cash requirements may borrow from the money pool. Borrowings from the money pool are unsecured. Depositors in the money pool receive, and borrowers from the money pool pay, an interest rate based primarily on PHI’s short-term borrowing rate. PHI deposits funds in the money pool to the extent that the pool has insufficient funds to meet the borrowing needs of its participants, which PHI may obtain from external sources. By regulatory order, the NJBPU has restricted ACE’s participation in the PHI money pool. ACE may not invest in the money pool, but may borrow from it if the rates are lower than the rates at which ACE could borrow funds externally.
ACE
Preferred Stock
Under its Certificate of Incorporation, ACE is authorized to issue and have outstanding up to (i) 799,979 shares of Cumulative Preferred Stock, (ii) 2 million shares of No Par Preferred Stock and (iii) 3 million shares of Preference Stock, each such type of preferred stock having such terms and conditions as are set forth in or authorized by the Certificate of Incorporation. Information concerning the numbers of shares and the terms of ACE’s outstanding shares of Cumulative Preferred Stock as of December 31, 2010, is set forth in Note (12), “Preferred Stock,” to the consolidated financial statements of ACE set forth in Part II, Item 8 of this Form 10-K. As of December 31, 2010, ACE had issued $6 million of Cumulative Preferred Stock that will be redeemed on February 25, 2011. No shares of No Par Preferred Stock or Preference Stock were outstanding at December 31, 2010.
Regulatory Restrictions on Financing Activities
ACE’s long-term and short-term (consisting of debt instruments with a maturity of one year or less) financing activities are subject to authorization by the NJBPU. Through its periodic filings with the NJBPU, ACE generally seeks to maintain standing authority sufficient to cover its projected financing needs over a multi-year period. ACE’s long-term and short-term financing activities do not require FERC approval.
State corporate laws impose limitations on the funds that can be used to pay dividends. In addition, ACE must obtain the approval of the NJBPU before dividends can be paid if its equity as a percent of its total capitalization, excluding securitization debt, falls below 30%.
Capital Expenditures
ACE’s capital expenditures for the year ended December 31, 2010, totaled $156 million. These expenditures were primarily related to capital costs associated with new customer services, distribution reliability and transmission. The expenditures also include an allocation by PHI of hardware and software expenditures that primarily benefit the Power Delivery business and are allocated to ACE when the assets are placed in service.
The following table shows ACE’s updated projected capital expenditures for the five-year period 2011 through 2015. ACE expects to fund these expenditures through internally generated cash, external financing and capital contributions from PHI.
| For the Year | ||||||||||||||||||||||||
| 2011 | 2012 | 2013 | 2014 | 2015 | Total | |||||||||||||||||||
| (millions of dollars) | ||||||||||||||||||||||||
ACE | ||||||||||||||||||||||||
Distribution | $ | 107 | $ | 101 | $ | 108 | $ | 112 | $ | 114 | $ | 542 | ||||||||||||
Distribution - Blueprint for the Future | 4 | — | 8 | 92 | — | 104 | ||||||||||||||||||
Transmission | 33 | 32 | 35 | 25 | 27 | 152 | ||||||||||||||||||
Other | 20 | 13 | 16 | 13 | 15 | 77 | ||||||||||||||||||
Sub-Total | 164 | 146 | 167 | 242 | 156 | 875 | ||||||||||||||||||
DOE Capital Reimbursement Awards (a) | (5 | ) | (4 | ) | (1 | ) | — | — | (10 | ) | ||||||||||||||
Total ACE | $ | 159 | $ | 142 | $ | 166 | $ | 242 | $ | 156 | $ | 865 | ||||||||||||
Total PHI
| (a) | Reflects remaining anticipated reimbursements pursuant to awards from |
ACE
Stimulus Funds Related to Blueprint for the Future
In 2009, the U.S. Department of Energy (DOE) announced a $168 million award to PHI under the American Recovery and Reinvestment Act of 2009 for the implementation of an advanced metering infrastructure system, direct load control, distribution automation, and communications infrastructure, of which $19 million was for ACE’s service territory.
In April 2010, PHI and the DOE signed agreements formalizing ACE’s $19 million share of the $168 million award. Of the $19 million, $12 million is expected to offset incurred and projected Blueprint for the Future and other capital expenditures of ACE. The remaining $7 million will be used to offset incremental expenses associated with direct load control and other programs. In 2010, ACE received award payments of $2 million.
The Internal Revenue Service has announced that, to the extent these grants are expended on capital items, they will not be considered taxable income.
Transmission and Distribution
The projected capital expenditures listed in the table for distribution (other than Blueprint for the Future) and transmission are primarily for facility replacements and upgrades to accommodate customer growth and reliability.
Blueprint for the Future
ACE has undertaken programs to install smart meters, further automate its electric distribution systems and enhance its communications infrastructure, which it refers to as the Blueprint for the Future. For a discussion of the Blueprint for the Future initiative, see Item 1, “Business - Description of Business - Blueprint for the Future” of this Form 10-K. The projected capital expenditures over the next five years are shown as Distribution - Blueprint for the Future in the table above.
Infrastructure Investment Plan
In 2009, the NJBPU approved ACE’s proposed Infrastructure Investment Plan and the revenue requirement associated with recovering the cost of the related projects, subject to a prudency review in the next rate case. The approved projects are designed to enhance reliability of ACE’s distribution system and support economic activity and job growth in New Jersey in the near term. ACE will achieve cost recovery through an Infrastructure Investment Surcharge, which became effective on June 1, 2009. This approved plan added incremental capital spending of approximately $8 million for 2009 and $19 million for 2010, and is expected to add an additional $1 million of capital spending for 2011, which is included in Distribution in the table above.
Pension and Postretirement Benefit Plans
ACE participates in pension and postretirement benefit plans sponsored by PHI for its employees. While the plans have not experienced any significant impact in terms of liquidity or counterparty exposure due to the disruption of the capital and credit markets, the stock market declines in 2008 caused a decrease in the market value of benefit plan assets at the end of 2008. ACE contributed zero and $60 million to the pension plan during 2010 and 2009, respectively.
ACE
Forward-Looking Statements
Some of the statements contained in this Annual Report on Form 10-K are forward-looking statements within the meaning of Section 21E of the Securities Exchange Act of 1934, as amended, and are subject to the safe harbor created by the Private Securities Litigation Reform Act of 1995. These statements include declarations regarding ACE’s intents, beliefs and current expectations. In some cases, you can identify forward-looking statements by terminology such as “may,” “will,” “should,” “expects,” “plans,” “anticipates,” “believes,” “estimates,” “predicts,” “potential” or “continue” or the negative of such terms or other comparable terminology. Any forward-looking statements are not guarantees of future performance, and actual results could differ materially from those indicated by the forward-looking statements. Forward-looking statements involve estimates, assumptions, known and unknown risks, uncertainties and other factors that may cause ACE’s actual results, levels of activity, performance or achievements to be materially different from any future results, levels of activity, performance or achievements expressed or implied by such forward-looking statements.
The forward-looking statements contained herein are qualified in their entirety by reference to the following important factors, which are difficult to predict, contain uncertainties, are beyond ACE’s control and may cause actual results to differ materially from those contained in forward-looking statements:
Changes in governmental policies and regulatory actions affecting the energy industry, including allowed rates of return, industry and rate structure, acquisition and disposal of assets and facilities, operation and construction of transmission and distribution facilities and the recovery of purchased power expenses;
Weather conditions affecting usage and emergency restoration costs;
Population growth rates and changes in demographic patterns;
Changes in customer demand for electricity due to conservation measures and the use of more energy-efficient products;
General economic conditions, including the impact of an economic downturn or recession on electricity usage;
Changes in and compliance with environmental and safety laws and policies;
Changes in tax rates or policies;
Changes in rates of inflation;
Changes in accounting standards or practices;
Unanticipated changes in operating expenses and capital expenditures;
Rules and regulations imposed by federal and/or state regulatory commissions, PJM, the North American Electric Reliability Corporation and other applicable electric reliability organizations;
Legal and administrative proceedings (whether civil or criminal) and settlements that affect ACE’s business and profitability;
Interest rate fluctuations and the impact of credit and capital market conditions on the ability to obtain funding on favorable terms; and
Effects of geopolitical events, including the threat of domestic terrorism.
ACE
Any forward-looking statements speak only as to the date of this Annual Report on Form 10-K and ACE undertakes no obligation to update any forward-looking statements to reflect events or circumstances after the date on which such statements are made or to reflect the occurrence of unanticipated events. New factors emerge from time to time, and it is not possible for ACE to predict all of such factors, nor can ACE assess the impact of any such factor on ACE’s business or the extent to which any factor, or combination of factors, may cause results to differ materially from those contained in any forward-looking statement.
The foregoing review of factors should not be construed as exhaustive.
Risk management policies for PHI and its subsidiaries are determined by PHI’s Corporate Risk Management Committee, the members of which are PHI’s Chief Risk Officer, Chief Operating Officer, Chief Financial Officer, General Counsel, Chief Information Officer and other senior executives. The Corporate Risk Management Committee monitors interest rate fluctuation, commodity price fluctuation, and credit risk exposure, and sets risk management policies that establish limits on unhedged risk and determine risk reporting requirements. For information about PHI’s derivative activities, other than the information disclosed herein, refer to Note (2), “Significant Accounting Policies - Accounting For Derivatives,” Note (15), “Derivative Instruments and Hedging Activities” and Note (20), “Discontinued Operations” to the consolidated financial statements of PHI set forth in Part II, Item 8 of this Form 10-K.
Pepco Holdings, Inc.
Commodity Price Risk
The Pepco Energy Services segment engages in commodity risk management activities to reduce their financial exposure to changes in the value of their assets and obligations due to commodity price fluctuations. Certain of these risk management activities are conducted using instruments classified as derivatives based on Financial Accounting Standards Board (FASB) guidance on derivatives and hedging (Accounting Standards Codification (ASC) 815). Pepco Energy Services also manages commodity risk with contracts that are not classified as derivatives. The primary risk management objective is to manage the spread between wholesale and retail sales commitments and the cost of supply used to service those commitments in order to ensure stable and known cash flows and fix favorable prices and margins. The discontinued operations of Conectiv Energy have engaged in similar commodity risk management activities throughout 2010. Prior to the sale of the wholesale power generation business on July 1, 2010, the risk management objective of the Conectiv Energy segment also included the management of the spread between the cost of fuel used to operate its electric generating facilities and the revenue received from the sale of the power produced by those facilities by selling forward a portion of their projected generating facility output and buying forward a portion of their projected fuel supply requirements. Conectiv Energy sold its remaining derivatives in January 2011, and no longer engages in such activities.
PHI’s risk management policies place oversight at the senior management level through the Corporate Risk Management Committee, which has the responsibility for establishing corporate compliance requirements for energy market participation. PHI collectively refers to these energy market activities, including its commodity risk management activities, as “energy commodity” activities. PHI uses a value-at-risk (VaR) model to assess the market risk of the energy commodity activities of Pepco Energy Services and Conectiv Energy. PHI also uses other measures to limit and monitor risk in its energy commodity activities, including limits on the nominal size of positions and periodic loss limits. VaR represents the potential fair value loss on energy contracts or portfolios due to changes in market prices for a specified time period and confidence level. In January 2009, PHI changed its VaR estimation model from a delta-normal variance / covariance model to a delta-gamma model. The other parameters, a 95 percent, one-tailed confidence level and a one-day holding period, remained the same. Since VaR is an estimate, it is not necessarily indicative of actual results that may occur.
The table below provides the VaR associated with energy contracts of both the Pepco Energy Services segment and the former Conectiv Energy segment for the year ended December 31, 2010 in millions of dollars:
| VaR for Conectiv Energy Commodity Activities (a) | VaR for Pepco Energy Services Commodity Activities (a) | |||||||
95% confidence level, one-day holding period, one-tailed | ||||||||
Period end | $ | — | $ | 3 | ||||
Average for the period | $ | 2 | $ | 1 | ||||
High | $ | 5 | $ | 3 | ||||
Low | $ | — | $ | 1 | ||||
Pepco Energy Services purchases electric and natural gas futures, swaps, options and forward contracts to hedge price risk
79
PEPCO HOLDINGS
Transmission and Distribution
The projected capital expenditures listed in the table for distribution (other than Blueprint for the Future), transmission (other than the MAPP project) and gas delivery are primarily for facility replacements and upgrades to accommodate customer growth and service reliability, including capital expenditures for continuing reliability enhancement efforts. For a more detailed discussion of these efforts, see “General Overview—Reliability Enhancement and Emergency Restoration Improvement Plans.”
Infrastructure Investment Plan
In 2009, the NJBPU approved ACE’s proposed Infrastructure Investment Plan and the revenue requirement associated with recovering the cost of the related projects, subject to a prudency review in the next rate case. The approved projects were designed to enhance reliability of ACE’s distribution system and support economic activity and job growth in New Jersey in the near term. ACE was granted cost recovery through an Infrastructure Investment Surcharge, which became effective on June 1, 2009. This approved plan was completed in 2011 and has added incremental capital spending of approximately $28 million since 2009. In 2011, ACE proposed a new Infrastructure Investment Plan that if approved by the NJBPU, would be expected to add an additional $63 million of capital spending for 2012, which is included in Distribution in the table above.
Blueprint for the Future
Each of PHI’s utility subsidiaries have undertaken programs to install smart meters, further automate their electric distribution systems and enhance their communications infrastructure, which is referred to as the Blueprint for the Future. For a discussion of the Blueprint for the Future initiative, see “General Overview—Blueprint for the Future.” The projected capital expenditures over the next five years are shown as Distribution—Blueprint for the Future in the table above.
MAPP Project
PJM has approved the construction of a new 152-mile, interstate transmission line as part of PJM’s regional transmission expansion plan. In August 2011, PJM notified PHI that the scheduled in-service date for MAPP has been delayed from June 1, 2015 to the 2019 to 2021 time period. The projected capital expenditures over the next five years are shown as Transmission—MAPP in the table above.
MAPP/DOE Loan Program
To assist in the funding of the MAPP project, PHI has applied for a $684 million loan guarantee from the DOE for a substantial portion of the MAPP project, primarily the Calvert Cliffs to Indian River segment. The application has been made under a federal loan guarantee program for projects that employ innovative energy efficiency, renewable energy and advanced transmission and distribution technologies. If granted, PHI believes the guarantee could allow PHI to acquire financing at a
80
PEPCO HOLDINGS
lower cost than it would otherwise be able to obtain in the capital markets. Whether PHI’s application will be granted and, if so, the amount of debt guaranteed is subject to the discretion of the DOE and the negotiation of terms that will satisfy the conditions of the guarantee program. On February 28, 2011, the DOE issued a Notice of Intent to prepare an Environmental Impact Statement to assist the DOE in assessing the environmental impact of constructing the portion of the MAPP project to be supported by the loan guarantee. Since February 2011, the DOE has conducted field inspections of the entire route and has held public meetings to obtain input from the communities along the route.
The DOE’s review of the loan guarantee program has delayed the DOE’s review of PHI’s loan guarantee application. There is not an approval deadline under the loan guarantee program, but this program could change or be terminated in the future. PHI continues to coordinate environmental activities with the DOE.
DOE Capital Reimbursement Awards
In 2009, the DOE announced awards under the American Recovery and Reinvestment Act of 2009 of:
$105 million and $44 million in Pepco’s Maryland and District of Columbia service territories, respectively, for the implementation of an advanced metering infrastructure system, direct load control, distribution automation, and communications infrastructure.
$19 million to ACE for the implementation of direct load control, distribution automation, and communications infrastructure in its New Jersey service territory.
In April 2010, PHI and the DOE signed agreements formalizing the $168 million in awards. Of the $168 million, $130 million is expected to offset incurred and projected Blueprint for the Future and other capital expenditures of Pepco and ACE. The remaining $38 million will be used to offset incremental expenses associated with direct load control and other Pepco and ACE programs. In 2011, Pepco received award payments of $53 million and ACE received award payments of $6 million. In 2010, Pepco received award payments of $15 million and ACE received award payments of $2 million.
The IRS has announced that, to the extent these grants are expended on capital items, they will not be considered taxable income.
Dividends
Pepco Holdings’ annual dividend rate on its common stock is determined by the Board of Directors on a quarterly basis and takes into consideration, among other factors, current and possible future developments that may affect PHI’s income and cash flows. In 2011, PHI’s Board of Directors declared quarterly dividends of 27 cents per share of common stock payable on March 31, 2011, June 30, 2011, September 30, 2011 and December 31, 2011.
On January 26, 2012, the Board of Directors declared a dividend on common stock of 27 cents per share payable March 30, 2012, to shareholders of record on March 12, 2012.
PHI, on a stand-alone basis, generates no operating income of its own. Accordingly, its ability to pay dividends to its shareholders depends on dividends received from its subsidiaries. In addition to their future financial performance, the ability of each of PHI’s direct and indirect subsidiaries to pay dividends is subject to limits imposed by: (i) state corporate laws, which impose limitations on the funds that can be used to pay dividends and when such dividends can be paid, and, in the case of ACE, the regulatory requirement that it obtain the prior approval of the NJBPU before dividends can be paid if its equity as a percent of its total capitalization, excluding securitization debt, falls below 30%; (ii) the prior rights of holders of existing and future mortgage bonds and other long-term debt issued by the subsidiaries, and any preferred stock that may be issued by the subsidiaries in the future, (iii) any other restrictions imposed in connection with the incurrence of liabilities; and (iv) certain provisions of ACE’s charter that impose restrictions on payment of common stock dividends for the benefit of preferred stockholders. None of Pepco, DPL or ACE currently have shares of preferred stock outstanding. Currently, the capitalization ratio limitation to which ACE is subject and the restriction in the ACE charter do not limit ACE’s ability to pay common stock dividends. PHI had approximately $1,072 million and $1,059 million of retained earnings free of restrictions at December 31, 2011 and 2010, respectively. These amounts represent the total retained earnings balances at those dates.
81
PEPCO HOLDINGS
Contractual Obligations and Commercial Commitments
Summary information about Pepco Holdings’ consolidated contractual obligations and commercial commitments at December 31, 2011, is as follows:
| Contractual Maturity | ||||||||||||||||||||
Obligation | Total | Less than 1 Year | 1-3 Years | 3-5 Years | After 5 Years | |||||||||||||||
| (millions of dollars) | ||||||||||||||||||||
Variable Rate Demand Bonds | $ | 146 | $ | 146 | $ | — | $ | — | $ | — | ||||||||||
Commercial paper | 586 | 586 | — | — | — | |||||||||||||||
Long-term debt (a) | 4,211 | 111 | 892 | 747 | 2,461 | |||||||||||||||
Long-term project funding | 15 | 2 | 4 | 3 | 6 | |||||||||||||||
Interest payments on debt | 3,162 | 244 | 441 | 365 | 2,112 | |||||||||||||||
Capital leases | 121 | 15 | 30 | 30 | 46 | |||||||||||||||
Operating leases | 530 | 39 | 71 | 61 | 359 | |||||||||||||||
Estimated pension and OPEB plan contributions | 235 | 235 | — | — | — | |||||||||||||||
Non-derivative fuel and purchase power contracts (b) | 4,102 | 553 | 716 | 708 | 2,125 | |||||||||||||||
|
|
|
|
|
|
|
|
|
| |||||||||||
Total (c) | $ | 13,108 | $ | 1,931 | $ | 2,154 | $ | 1,914 | $ | 7,109 | ||||||||||
|
|
|
|
|
|
|
|
|
| |||||||||||
| (a) | Includes transition bonds issued by ACE Funding. |
| (b) | Excludes contracts for the purchase of |
| (c) | Excludes $180 million of net non-current liabilities related to uncertain tax positions due to uncertainty in the timing of the associated cash payments. |
Third Party Guarantees, Indemnifications and Off-Balance Sheet Arrangements
PHI and certain of its subsidiaries have various financial and performance guarantees and indemnification obligations that they have entered into in the normal course of business to facilitate commercial transactions with third parties.
As of December 31, 2011, PHI and its subsidiaries were parties to a variety of agreements pursuant to which they were guarantors for standby letters of credit, energy procurement obligations, and other commitments and obligations. Such agreements include performance and payment guarantees of PHI aggregating $175 million related to Pepco Energy Services. For additional discussion of PHI’s third party guarantees, indemnifications, obligations and off-balance sheet arrangements, see Note (17), “Commitments and Contingencies,” to the consolidated financial statements of PHI.
82
PEPCO HOLDINGS
Energy Contract Activity
The following table provides detail on changes in the net asset or liability positions of the Pepco Energy Services segment with respect to energy commodity contracts for the year ended December 31, 2011. The balances in the table are pre-tax and the derivative assets and liabilities reflect netting by counterparty before the impact of collateral.
| Energy Commodity Activities (a) | ||||
| (millions of dollars) | ||||
Total Fair Value of Energy Contract Net Liabilities at December 31, 2010 | $ | (135 | ) | |
Current period unrealized losses | (30 | ) | ||
Effective portion of changes in fair value—recorded in Accumulated Other Comprehensive Loss | — | |||
Cash flow hedge ineffectiveness—recorded in income | (1 | ) | ||
Reclassification to realized on settlement of contracts | 83 | |||
|
| |||
Total Fair Value of Energy Contract Net Liabilities at December 31, 2011 | $ | (83 | ) | |
|
| |||
Detail of Fair Value of Energy Contract Net Liabilities at December 31, 2011 (see above) | ||||
Derivative liabilities (current liabilities) | $ | (81 | ) | |
Derivative liabilities (non-current liabilities) | (2 | ) | ||
|
| |||
Total Fair Value of Energy Contract Liabilities | (83 | ) | ||
|
| |||
Total Fair Value of Energy Contract Net Liabilities | $ | (83 | ) | |
|
| |||
(a) Includes all effective hedging activities from continuing operations recorded at fair value through Accumulated Other Comprehensive Loss (AOCL) or trading activities from continuing operations recorded at fair value in the consolidated statements of income. |
| |||
The $83 million net liability on energy contracts at December 31, 2011 was primarily attributable to losses on power swaps and natural gas futures held by Pepco Energy Services. Pepco Energy Services’ net liability decreased to $83 million at December 31, 2011 from $135 million at December 31, 2010 primarily due to settlements of the derivatives. PHI expects that future revenues from existing customer sales obligations that are accounted for on an accrual basis will largely offset expected realized net losses on Pepco Energy Services’ energy contracts.
83
PEPCO HOLDINGS
PHI uses its best estimates to determine the fair value of the commodity derivative contracts that are entered into by Pepco Energy Services. The fair values in each category presented below reflect forward prices and volatility factors as of December 31, 2011, and the fair values are subject to change as a result of changes in these prices and factors. As of December 31, 2011, all of these contracts were held by Pepco Energy Services.
| Fair Value of Contracts at December 31, 2011 Maturities | ||||||||||||||||||||
Source of Fair Value | 2012 | 2013 | 2014 | 2015 and Beyond | Total Fair Value | |||||||||||||||
| (millions of dollars) | ||||||||||||||||||||
Energy Commodity Activities, net (a) | ||||||||||||||||||||
Actively Quoted (i.e., exchange-traded) prices | $ | (37 | ) | $ | (9 | ) | $ | (2 | ) | $ | — | $ | (48 | ) | ||||||
Prices provided by other external sources (b) | (26 | ) | (7 | ) | — | — | (33 | ) | ||||||||||||
Modeled (c) | (2 | ) | — | — | — | (2 | ) | |||||||||||||
|
|
|
|
|
|
|
|
|
| |||||||||||
Total | $ | (65 | ) | $ | (16 | ) | $ | (2 | ) | $ | — | $ | (83 | ) | ||||||
|
|
|
|
|
|
|
|
|
| |||||||||||
| (a) | Includes all effective hedging activities recorded at fair value through AOCL, and
|
| (b) | Prices provided by other external sources reflect information obtained from over-the-counter brokers, industry services, or multiple-party on-line platforms that are readily observable in the market. |
| (c) | Modeled values include significant inputs, usually representing more than 10% of the valuation, not readily observable in the market. The modeled valuation above represents the fair valuation of certain long-dated power transactions based on |
Contractual Arrangements with Credit Rating Triggers or Margining Rights
Under certain contractual arrangements entered into by PHI’s subsidiaries, the subsidiary may be required to provide cash collateral or letters of credit as security for its contractual obligations if the credit ratings of PHI or the subsidiary are downgraded. In the event of a downgrade, the amount required to be posted would depend on the amount of the underlying contractual obligation existing at the time of the downgrade. Based on contractual provisions in effect at December 31, 2011, a downgrade in the unsecured debt credit ratings of PHI or each of its rated subsidiaries to below “investment grade” would increase the collateral obligation of PHI and its subsidiaries by up to $233 million, none of which is related to the discontinued operations of Conectiv Energy, and $124 million of which is the net settlement amount attributable to derivatives, normal purchase and normal sale contracts, collateral, and other contracts under master netting agreements as described in Note (15), “Derivative Instruments and Hedging Activities,” to the consolidated financial statements of PHI. The remaining $109 million of the collateral obligation that would be incurred in the event PHI were downgraded to below “investment grade” is attributable primarily to energy services contracts and accounts payable to independent system operators and distribution companies on full requirements contracts entered into by Pepco Energy Services. PHI believes that it and its subsidiaries currently have sufficient liquidity to fund their operations and meet their financial obligations.
Many of the contractual arrangements entered into by PHI’s subsidiaries in connection with competitive energy and Default Electricity Supply activities include margining rights pursuant to which the PHI subsidiary or a counterparty may request collateral if the market value of the contractual obligations reaches levels in excess of the credit thresholds established in the applicable arrangements. Pursuant to these margining rights, the affected PHI subsidiary may receive, or be required to post, collateral due to energy price movements. As of December 31, 2011, Pepco Energy Services provided net cash collateral in the amount of $112 million in connection with these activities.
84
PEPCO HOLDINGS
Environmental Remediation Obligations
PHI’s accrued liabilities for environmental remediation obligations as of December 31, 2011 totaled $30 million, of which approximately $6 million is expected to be incurred in 2012, for potential environmental cleanup and related costs at sites owned or formerly owned by an operating subsidiary where an operating subsidiary is a potentially responsible party or is alleged to be a third-party contributor. For further information concerning the remediation obligations associated with these sites, see Note (17), “Commitments and Contingencies,” to the consolidated financial statements of PHI. For information regarding projected expenditures for environmental control facilities, see “Business—Environmental Matters.” The most significant environmental remediation obligations as of December 31, 2011, are for the following items:
Environmental investigation and remediation costs payable by Pepco with respect to the Benning Road site.
Amounts payable by DPL in accordance with a 2001 consent agreement reached with the Delaware Department of Natural Resources and Environmental Control, for remediation, site restoration, natural resource damage compensatory projects and other costs associated with environmental contamination that resulted from an oil release at the Indian River power plant, which DPL sold in June 2001.
Potential compliance remediation costs under New Jersey’s Industrial Site Recovery Act payable by PHI associated with the retained environmental exposure from the sale of the Conectiv Energy wholesale power generation business.
Amounts payable by DPL in connection with the Wilmington Coal Gas South site located in Wilmington, Delaware, to remediate residual material from the historical operation of a manufactured gas plant.
Sources of Capital
Pepco Holdings’ sources to meet its long-term funding needs, such as capital expenditures, dividends, and new investments, and its short-term funding needs, such as working capital and the temporary funding of long-term funding needs, include internally generated funds, issuances by PHI, Pepco, DPL and ACE under their commercial paper programs, securities issuances, short-term loans, and bank financing under new or existing facilities. PHI’s ability to generate funds from its operations and to access capital and credit markets is subject to risks and uncertainties. Volatile and deteriorating financial market conditions, diminished liquidity and tightening credit may affect access to certain of PHI’s potential funding sources. See “Risk Factors,” for additional discussion of important factors that may impact these sources of capital.
Cash Flow from Operations
Cash flow generated by regulated utility subsidiaries in Power Delivery is the primary source of PHI’s cash flow from operations. Additional cash flows are generated by the business of Pepco Energy Services and from the occasional sale of non-core assets.
Short-Term Funding Sources
Pepco Holdings and its regulated utility subsidiaries have traditionally used a number of sources to fulfill short-term funding needs, such as commercial paper, short-term notes and bank lines of credit. Proceeds from short-term borrowings are used primarily to meet working capital needs but may also be used to temporarily fund long-term capital requirements.
85
PEPCO HOLDINGS
As of December 31, 2011, Pepco Holdings, Pepco, DPL and ACE each maintains an ongoing commercial paper program pursuant to which each entity has the ability to issue up to $875 million, $500 million, $500 million and $250 million, respectively, of commercial paper. In January 2012, the PHI Board of Directors approved an increase in the maximum amount of commercial paper that PHI is authorized to issue under its commercial paper program to $1.25 billion. The commercial paper can be issued with maturities of up to 270 days.
Long-Term Funding Sources
The sources of long-term funding for PHI and its subsidiaries are the issuance of debt and equity securities and borrowing under long-term credit agreements. Proceeds from long-term financings are used primarily to fund long-term capital requirements, such as capital expenditures and new investments, and to repay or refinance existing indebtedness.
Regulatory Restrictions on Financing Activities
The issuance of debt securities by PHI’s principal subsidiaries requires the approval of either FERC or one or more state public utility commissions. Neither FERC approval nor state public utility commission approval is required as a condition to the issuance of securities by PHI.
State Financing Authority
Pepco’s long-term financing activities (including the issuance of securities and the incurrence of debt) are subject to authorization by the DCPSC and MPSC. DPL’s long-term financing activities are subject to authorization by the MPSC and the DPSC. ACE’s long-term and short-term (consisting of debt instruments with a maturity of one year or less) financing activities are subject to authorization by the NJBPU. Each utility, through periodic filings with the state public service commission(s) having jurisdiction over its financing activities, has maintained standing authority sufficient to cover its projected financing needs over a multi-year period.
FERC Financing Authority
Under the Federal Power Act (FPA), FERC has jurisdiction over the issuance of long-term and short-term securities of public utilities, but only if the issuance is not regulated by the state public utility commission in which the public utility is organized and operating. Under these provisions, FERC has jurisdiction over the issuance of short-term debt by Pepco and DPL. Pepco and DPL have obtained FERC authority for the issuance of short-term debt. Because Pepco Energy Services also qualifies as a public utility under the FPA and is not regulated by a state utility commission, FERC also has jurisdiction over the issuance of securities by Pepco Energy Services. Pepco Energy Services has obtained the requisite FERC financing authority in its market-based rate orders.
Money Pool
Pepco Holdings operates a system money pool under a blanket authorization adopted by FERC. The money pool is a cash management mechanism used by Pepco Holdings to manage the short-term investment and borrowing requirements of its subsidiaries that participate in the money pool. Pepco Holdings may invest in but not borrow from the money pool. Eligible subsidiaries with surplus cash may deposit those funds in the money pool. Deposits in the money pool are guaranteed by Pepco Holdings. Eligible subsidiaries with cash requirements may borrow from the money pool. Borrowings from the money pool are unsecured. Depositors in the money pool receive, and borrowers from the money pool pay, an interest rate based primarily on Pepco Holdings’ short-term borrowing rate. Pepco Holdings deposits funds in the money pool to the extent that the pool has insufficient funds to meet the borrowing needs of its participants, which may require Pepco Holdings to borrow funds for deposit from external sources.
86
PEPCO HOLDINGS
Regulatory And Other Matters
Rate Proceedings
Distribution
The rates that each of Pepco, DPL and ACE is permitted to charge for the retail distribution of electricity and natural gas to its various classes of customers are based on the principle that the utility is entitled to generate an amount of revenue sufficient to recover the cost of providing the service, including a reasonable rate of return on its invested capital. These “base rates” are intended to cover all of each utility’s reasonable and prudent expenses of constructing, operating and maintaining its distribution facilities (other than costs covered by specific cost-recovery surcharges).
A change in base rates in a jurisdiction requires the approval of public service commission. In the rate application submitted to the public service commission, the utility specifies an increase in its “revenue requirement,” which is the additional revenue that the utility is seeking authorization to earn. The “revenue requirement” consists of (i) the allowable expenses incurred by the utility, including operation and maintenance expenses, taxes and depreciation, and (ii) the utility’s cost of capital. The compensation of the utility for its cost of capital takes the form of an overall “rate of return” allowed by the public service commission on the utility’s distribution “rate base” to compensate the utility’s investors for their debt and equity investments in the company. The rate base is the aggregate value of the investment in property used by the utility in providing electricity and natural gas distribution services and generally consists of plant in service net of accumulated depreciation and accumulated deferred taxes, plus cash working capital, material and operating supplies and, depending on the jurisdiction, construction work in progress. Over time, the rate base is increased by utility property additions and reduced by depreciation and property retirements and write-offs.
In addition to its base rates, some of the costs of providing distribution service are recovered through the operation of surcharges. Examples of costs recovered by PHI’s utility subsidiaries through surcharges, which vary depending on the jurisdiction, include: a surcharge to reimburse the utility for the cost of purchasing electricity from NUGs (New Jersey); surcharges to reimburse the utility for costs of public interest programs for low income customers (New Jersey, Maryland, Delaware and the District of Columbia); a surcharge to pay the Transitional Bond Charge (New Jersey); and surcharges to reimburse the utility for certain environmental costs (Delaware and Maryland).
Each utility subsidiary regularly reviews its distribution rates in each jurisdiction of its service territory, and from time to time files applications to adjust its rates as necessary in an effort to ensure that its revenues are sufficient to cover its operating expenses and its cost of capital. The timing of future rate filings and the change in the distribution rate requested will depend on a number of factors, including changes in revenues and expenses and the incurrence or the planned incurrence of capital expenditures. In the third quarter of 2011, Pepco filed an electric distribution base rate increase application in the District of Columbia and ACE filed an electric distribution base rate increase application in New Jersey. In the fourth quarter of 2011, DPL filed an electric distribution base rate increase application in Delaware and Maryland. Also in the fourth quarter of 2011, Pepco filed an electric distribution base rate increase application in Maryland. DPL currently expects to file a natural gas distribution base rate increase application in early 2013.
In general, a request for new distribution rates is made on the basis of “test year” balances for rate base allowable operating expenses and a requested rate of return. The test year amounts used in the filing may be historical or partially projected. The public service commission may, however, select a different test period than that proposed by the company. Although the approved tariff rates are intended to be forward-looking, and therefore provide for the recovery of some future changes in rate base and operating costs, they typically do not reflect all of the changes in costs for the period in which the new rates are in effect.
87
PEPCO HOLDINGS
If revenues do not keep pace with increases in costs, this situation will result in a lag between when the costs are incurred and when the utility can begin to recover those costs through its rates.
The following table shows, for each of the PHI utility subsidiaries, the authorized return on equity as determined in the most recently concluded base rate proceeding and the date as of which the rate as determined in the proceeding was implemented:
Rating | Exposure Before Credit Collateral (b) | Credit Collateral (c) | Net Exposure | Number of Counterparties Greater Than 10% (d) | Net Exposure of Counterparties Greater Than 10% | |||||||||||||||
Investment Grade (a) | $ | 74 | $ | — | $ | 74 | 5 | $ | 53 | |||||||||||
Non-Investment Grade | — | — | — | — | — | |||||||||||||||
No External Ratings | 1 | — | 1 | — | — | |||||||||||||||
Credit reserves | 1 | |||||||||||||||||||
Interest Rate RiskBase (In millions)
Pepco Holdings and its subsidiaries’ variable or floating rate debt is subject to the risk of fluctuating interest rates in the normal course of business. Pepco Holdings manages interest rates through the use of fixed and, to a lesser extent, variable rate debt. The effect of a hypothetical 10% change in interest rates
Equity
Interest Rate Risk
Pepco does not have any debt with variable or floating rates.
Delmarva Power & Light Company
Commodity Price Risk
DPL uses derivative instruments (forward contracts, futures, swaps, and exchange-traded and over-the-counter options) primarily to reduce natural gas commodity price volatility while limiting its customers’ exposure to increases in the market price of natural gas. DPL also manages commodity risk with capacity contracts that do not meet the definition of derivatives. The primary goal of these activities is to reduce the exposure of its regulated retail natural gas customers to natural gas price spikes. All premiums paid and other transaction costs incurred as part of DPL’s natural gas hedging activity, in addition to all gains and losses on the natural gas hedging activity, are fully recoverable through the Gas Cost Rate clause included in DPL’s natural gas tariff rates approved by the Delaware Public Service Commission and are deferred until recovered. At December 31, 2010, after the effects of cash collateral and netting, DPL had a net derivative liability of $23 million, offset by a $31 million regulatory asset. At December 31, 2009, after the effects of cash collateral and netting, DPL had a net derivative liability of $28 million, offset by a $42 million regulatory asset.
Interest Rate Risk
DPL’s debt is subject to the risk of fluctuating interest rates in the normal course of business. DPL manages interest rates through the use of fixed and, to a lesser extent, variable rate debt. The effect of a hypothetical 10% change in interest rates on the annual interest costs for short-term debt and variable rate debt was less than $1 million as of December 31, 2010.
Atlantic City Electric Company
Interest Rate Risk
ACE’s debt is subject to the risk of fluctuating interest rates in the normal course of business. ACE manages interest rates through the use of fixed and, to a lesser extent, variable rate debt. The effect of a hypothetical 10% change in interest rates on the annual interest costs for short-term debt and variable rate debt was less than $1 million as of December 31, 2010.
Date |
Listed below is a table that sets forth,Pepco:
District of Columbia (electricity)
Maryland (electricity)
DPL:
Delaware (electricity)
Maryland (electricity)
Delaware (natural gas)
ACE:
New Jersey (electricity)
(a) Cost of equity at 10% for each registrant,purposes of calculating allowance for funds used during construction and regulatory asset carrying costs.
Transmission
The rates Pepco, DPL and ACE are permitted to charge for the transmission of electricity are regulated by FERC and are based on each utility’s transmission rate base, transmission operating expenses and an overall rate of return that is approved by FERC. For each utility subsidiary, FERC has approved a formula for the calculation of the utility transmission rate, which is referred to as a “formula rate.” The formula rates include both fixed and variable elements. Certain of the fixed elements, such as the return on equity and depreciation rates, can be changed only in a FERC rate proceeding. The variable elements of the formula, including the utility’s rate base and operating expenses, are updated annually, effective June 1 of each year, with data from the utility’s most recent annual FERC Form 1 filing.
In addition to its formula rate, each utility’s return on equity is supplemented by incentive rates, sometimes referred to as “adders,” and other incentives, which are authorized by FERC to promote capital investment in transmission infrastructure. In connection with the MAPP project, FERC has authorized for each of Pepco and DPL a 150 basis point adder to its return on equity, resulting in a FERC-approved rate of return on the MAPP project of 12.8%, along with full recovery of construction work in progress and prudently incurred abandoned plant costs. Additional return on equity adders are in effect for each of Pepco, DPL and ACE relating to specific transmission upgrades and improvements, as well as in consideration for each utility’s continued membership in PJM. As members of PJM, the transmission rates of Pepco, DPL and ACE are set out in PJM’s Open Access Transmission Tariff.
For a discussion of pending state public utility commission and FERC rate proceedings, see Note (7), “Regulatory Matters,” to the consolidated financial statements of PHI.
88
PEPCO HOLDINGS
Legal Proceedings and Regulatory Matters
For a discussion of legal proceedings, see Note (17), “Commitments and Contingencies,” to the consolidated financial statements of PHI, and for a discussion of regulatory matters, see Note (7), “Regulatory Matters,” to the consolidated financial statements of PHI.
Critical Accounting Policies
General
PHI has identified the following accounting policies that result in having to make certain estimates that, as a result of the judgments, uncertainties, uniqueness and complexities of the underlying accounting standards and operations involved, could result in material changes in its financial condition or results of operations under different conditions or using different assumptions. PHI has discussed the development, selection and disclosure of each of these policies with the Audit Committee of the Board of Directors.
Goodwill Impairment Evaluation
Substantially all of PHI’s goodwill was generated by Pepco’s acquisition of Conectiv in 2002 and is allocated entirely to the Power Delivery reporting unit for purposes of assessing impairment under FASB guidance on goodwill and other intangibles (ASC 350). Management has identified Power Delivery as a single reporting unit because its components have similar economic characteristics, similar products and services and operate in a similar regulatory environment.
PHI tests its goodwill impairment at least annually as of November 1 and on an interim basis if an event occurs or circumstances change that would more likely than not reduce the fair value of a reporting unit below its carrying amount. Factors that may result in an interim impairment test include, but are not limited to: a change in identified reporting units; an adverse change in business conditions; a protracted decline in stock price causing market capitalization to fall below book value; an adverse regulatory action; or impairment of long-lived assets in the reporting unit.
The first step of the goodwill impairment test compares the fair value of the reporting unit with its carrying amount, including goodwill. Management uses its best judgment to make reasonable projections of future cash flows for Power Delivery when estimating the reporting unit’s fair value. In addition, PHI selects a discount rate for the associated risk with those estimated cash flows. These judgments are inherently uncertain, and actual results could vary from those used in PHI’s estimates. The impact of such variations could significantly alter the results of a goodwill impairment test, which could materially impact the estimated fair value of Power Delivery and potentially the amount of any impairment recorded in the financial statements.
PHI’s November 1, 2011 annual impairment test indicated that its goodwill was not impaired. See Note (6), “Goodwill,” to the consolidated financial statements of PHI.
In order to estimate the fair value of the Power Delivery reporting unit, PHI uses two valuation techniques: an income approach and a market approach. The income approach estimates fair value based on a discounted cash flow analysis using estimated future cash flows and a terminal value that is consistent with Power Delivery’s long-term view of the business. This approach uses a discount rate based on the estimated weighted average cost of capital (WACC) for the reporting unit. PHI determines the estimated WACC by considering market-based information for the cost of equity and cost of debt that is appropriate for Power Delivery as of the measurement date. The market approach estimates fair value based on a multiple of earnings before interest, taxes, depreciation, and amortization (EBITDA) that management believes is consistent with EBITDA multiples for comparable utilities. PHI has consistently used this valuation framework to estimate the fair value of Power Delivery.
89
PEPCO HOLDINGS
The estimation of fair value is dependent on a number of factors that are sourced from the Power Delivery reporting unit’s business forecast, including but not limited to interest rates, growth assumptions, returns on rate base, operating and capital expenditure requirements, and other factors, changes in which could materially impact the results of impairment testing. Assumptions and methodologies used in the models were consistent with historical experience. A hypothetical 10 percent decrease in fair value of the Power Delivery reporting unit at November 1, 2011 would not have resulted in the Power Delivery reporting unit failing the first step of the impairment test, as defined in the guidance, as the estimated fair value of the reporting unit would have been above its carrying value. Sensitive, interrelated and uncertain variables that could decrease the estimated fair value of the Power Delivery reporting unit include utility sector market performance, sustained adverse business conditions, change in forecasted revenues, higher operating and maintenance capital expenditure requirements, a significant increase in the cost of capital, and other factors.
PHI believes that the estimates involved in its goodwill impairment evaluation process represent “Critical Accounting Estimates” because they are subjective and susceptible to change from period to period as management makes assumptions and judgments, and the impact of a change in assumptions and estimates could be material to financial results.
Long-Lived Assets Impairment Evaluation
PHI believes that the estimates involved in its long-lived asset impairment evaluation process represent “Critical Accounting Estimates” because (i) they are highly susceptible to change from period to period because management is required to make assumptions and judgments about when events indicate the carrying value may not be recoverable and how to estimate undiscounted and discounted future cash flows and fair values, which are inherently uncertain, (ii) actual results could vary from those used in PHI’s estimates and the impact of such variations could be material, and (iii) the impact that recognizing an impairment would have on PHI’s assets as well as the net loss related to an impairment charge could be material. The primary assets subject to a long-lived asset impairment evaluation are property, plant, and equipment.
The FASB guidance on the accounting for the impairment or disposal of long-lived assets (ASC 360), requires that certain long-lived assets must be tested for recoverability whenever events or circumstances indicate that the carrying amount may not be recoverable, such as (i) a significant decrease in the market price of a long-lived asset or asset group, (ii) a significant adverse change in the extent or manner in which a long-lived asset or asset group is being used or in its physical condition, (iii) a significant adverse change in legal factors or in the business climate, including an adverse action or assessment by a regulator, (iv) an accumulation of costs significantly in excess of the amount originally expected for the acquisition or construction of a long-lived asset or asset group, (v) a current-period operating or cash flow loss combined with a history of operating or cash flow losses or a projection or forecast that demonstrates continuing losses associated with the use of a long-lived asset or asset group, and (vi) a current expectation that, more likely than not, a long-lived asset or asset group will be sold or otherwise disposed of significantly before the end of its previously estimated useful life.
An impairment loss may only be recognized if the carrying amount of an asset is not recoverable and the carrying amount exceeds its fair value. The asset is deemed not to be recoverable when its carrying amount exceeds the sum of the undiscounted future cash flows expected to result from the use and eventual disposition of the asset. In order to estimate an asset’s future cash flows, PHI considers historical cash flows. PHI uses its best estimates in making these evaluations and considers various factors, including forward price curves for energy, fuel costs, legislative initiatives, and operating costs. If necessary, the process of determining fair value is performed consistently with the process described in assessing the fair value of goodwill discussed above.
90
PEPCO HOLDINGS
Accounting for Derivatives
PHI believes that the estimates involved in accounting for its derivative instruments represent “Critical Accounting Estimates” because management exercises judgment in the following areas, any of which could have a material impact on its financial statements: (i) the application of the definition of a derivative to contracts to identify derivatives, (ii) the election of the normal purchases and normal sales exception from derivative accounting, (iii) the application of cash flow hedge accounting, and (iv) the estimation of fair value used in the measurement of derivatives and hedged items, which are highly susceptible to changes in value over time due to market trends or, in certain circumstances, significant uncertainties in modeling techniques used to measure fair value that could result in actual results being materially different from PHI’s estimates. See Note (2), “Significant Accounting Policies—Accounting for Derivatives,” and Note (15), “Derivative Instruments and Hedging Activities,” to the consolidated financial statements of PHI.
PHI and its subsidiaries use derivative instruments primarily to manage risk associated with commodity prices. The definition of a derivative in the FASB guidance results in management having to exercise judgment, such as whether there is a notional amount or net settlement provision in contracts. Management assesses a number of factors before determining whether it can designate derivatives for the normal purchase or normal sale exception from derivative accounting, including whether it is probable that the contracts will physically settle with delivery of the underlying commodity. The application of cash flow hedge accounting often requires judgment in the prospective and retrospective assessment and measurement of hedge effectiveness as well as whether it is probable that the forecasted transaction will occur. The fair value of derivatives is determined using quoted exchange prices where available. For instruments that are not traded on an exchange, external broker quotes are used to determine fair value. For some custom and complex instruments, internal models use market information when external broker quotes are not available. For certain long-dated instruments, broker or exchange data is extrapolated for future periods where information is limited. Models are also used to estimate volumes for certain transactions. The same valuation methods are used for risk management purposes to determine the value of non-derivative, commodity exposure.
Pension and Other Postretirement Benefit Plans
PHI believes that the estimates involved in reporting the costs of providing pension and OPEB benefits represent Critical Accounting Estimates because (i) they are based on an actuarial calculation that includes a number of assumptions which are subjective in nature, (ii) they are dependent on numerous factors resulting from actual plan experience and assumptions of future experience, and (iii) changes in assumptions could impact PHI’s expected future cash funding requirements for the plans and would have an impact on the projected benefit obligations, which affect the reported amount of annual net periodic pension and OPEB cost on the income statement.
Assumptions about the future, including the discount rate applied to benefit obligations, the expected long-term rate of return on plan assets, the anticipated rate of increase in health care costs and participant compensation have a significant impact on employee benefit costs.
The discount rate for determining the pension benefit obligation was 5.00% and 5.65% as of December 31, 2011 and 2010, respectively. The discount rate for determining the postretirement benefit obligation was 4.90% and 5.60% as of December 31, 2011 and 2010, respectively. PHI utilizes an analytical tool developed by its actuaries to select the discount rate. The analytical tool utilizes a high-quality bond portfolio with cash flows that match the benefit payments expected to be made under the plans.
The expected long-term rate of return on plan assets was 7.75% and 8.00% as of December 31, 2011 and 2010, respectively. PHI uses a building block approach to estimate the expected rate of return on plan assets. Under this approach, the percentage of plan assets in each asset class according to PHI’s target asset allocation, at the beginning of the year, is applied to the expected asset return for the related asset class. PHI incorporates long-term assumptions for real returns, inflation expectations, volatility, and correlations among asset classes to determine expected returns for the related asset class. The plan assets consist of equity, fixed income, real estate and private equity investments. The plan assets are expected to yield a return on assets of 7.75% as of December 31, 2011 when viewed over a long-term horizon.
91
PEPCO HOLDINGS
The following table reflects the effect on the projected benefit obligation for the pension plan and the accumulated benefit obligation for the OPEB plan, as well as the net periodic cost for both plans, if there were changes in these critical actuarial assumptions while holding all other actuarial assumptions constant:
(in millions, except percentages) | Change in Assumptions | Impact on Benefit Obligation | Projected Increase in 2011 Net Periodic Cost | |||||||||
Pension Plan | ||||||||||||
Discount rate | (0.25 | )% | $ | 61 | $ | 5 | ||||||
Expected return | (0.25 | )% | — | (a) | 5 | |||||||
Postretirement Benefit Plan | ||||||||||||
Discount rate | (0.25 | )% | $ | 20 | $ | 1 | ||||||
Expected return | (0.25 | )% | — | (a) | 1 | |||||||
Health care cost trend rate | 1.00 | % | 32 | 2 | ||||||||
(a) A change in the expected return assumption has no impact on the Projected Benefit Obligation. |
| |||||||||||
The impact of changes in assumptions and the difference between actual and expected or estimated results on pension and postretirement obligations is generally recognized over the working lives of the employees who benefit under the plans rather than immediate recognition in the statements of income.
For additional discussion, see Note (10), “Pension and Other Postretirement Benefits,” to the consolidated financial statements of PHI.
Accounting for Regulated Activities
FASB guidance on the accounting for regulated activities, Regulated Operations (ASC 980), applies to Power Delivery and can result in the deferral of costs or revenue that would otherwise be recognized by non-regulated entities. PHI defers the recognition of costs and records regulatory assets when it is probable that those costs will be recovered in future customer rates. PHI defers the recognition of revenues and records regulatory liabilities when it is probable that it will refund payments received from customers in the future or that it will incur future costs related to the payments currently received from customers. PHI believes that the judgments involved in accounting for its regulated activities represent “Critical Accounting Estimates” because (i) management must interpret laws and regulatory commission orders to assess the probability of the recovery of costs in customer rates or the return of revenues to customers when determining whether those costs or revenues should be deferred, (ii) decisions made by regulatory commissions or legislative changes at a later date could vary from earlier interpretations made by management and the impact of such variations could be material, and (iii) the elimination of a regulatory asset because deferred costs are no longer probable of recovery in future customer rates could have a material negative impact on PHI’s assets and earnings.
Management’s most significant judgment is whether to defer costs or revenues when there is not a current regulatory order specific to the item being considered for deferral. In those cases, management considers relevant historical precedents of the regulatory commissions, the results of recent rate orders, and any new information from its more current interactions with the regulatory commissions on that item. Management regularly evaluates whether it should defer costs or revenues and reviews whether adjustments to its previous conclusions regarding its regulatory assets and liabilities are necessary based on the current regulatory and legislative environment as well as recent rate orders.
92
PEPCO HOLDINGS
For additional discussion, see Note (7), “Regulatory Matters,” to the consolidated financial statements of PHI.
Unbilled Revenue
Unbilled revenue represents an estimate of revenue earned from services rendered by PHI’s utility operations that have not yet been billed. PHI’s utility operations calculate unbilled revenue using an output-based methodology. The calculation is based on the supply of electricity or natural gas distributed to customers but not yet billed, adjusted for estimated line losses (estimates of electricity and gas expected to be lost in the process of a utility’s transmission and distribution to customers).
PHI estimates involved in its unbilled revenue process represent “Critical Accounting Estimates” because management is required to make assumptions and judgments about input factors to the unbilled revenue calculation. Specifically, the determination of estimated line losses is inherently uncertain. Estimated line losses is defined as the estimates of electricity and natural gas expected to be lost in the process of its transmission and distribution to customers. A change in estimated line losses can change the output available for sale which is a factor in the unbilled revenue calculation. Certain factors can influence the estimated line losses such as weather and a change in customer mix. These factors may vary between companies due to geography and density of service territory, and the impact of changes in these factors could be material. PHI seeks to reduce the risk of an inaccurate estimate of unbilled revenue through corroboration of the estimate with historical information and other metrics.
Accounting for Income Taxes
PHI exercises significant judgment about the outcome of income tax matters in its application of the FASB guidance on accounting for income taxes and believes it represents a “Critical Accounting Estimate” because: (i) it records a current tax liability for estimated current tax expense on its federal and state tax returns; (ii) it records deferred tax assets for temporary differences between the financial statement and tax return determination of pre-tax income and the carrying amount of assets and liabilities that are more likely than not going to result in tax deductions in future years; (iii) it determines whether a valuation allowance is needed against deferred tax assets if it is more likely than not that some portion of the future tax deductions will not be realized; (iv) it records deferred tax liabilities for temporary differences between the financial statement and tax return determination of pre-tax income and the carrying amount of assets and liabilities if it is more likely than not that they are expected to result in tax payments in future years; (v) the measurement of deferred tax assets and deferred tax liabilities requires it to estimate future effective tax rates and future taxable income on its federal and state tax returns; (vi) it asserts that foreign earnings will continue to be indefinitely reinvested abroad; (vii) it must consider the effect of newly enacted tax law on its estimated effective tax rate and in measuring deferred tax balances; and (viii) it asserts that tax positions in its tax returns or expected to be taken in its tax returns are more likely than not to be sustained assuming that the tax positions will be examined by taxing authorities with full knowledge of all relevant information prior to recording the related tax benefit in the financial statements.
Assumptions, judgment and the use of estimates are required in determining if the “more likely than not” standard (that is, the cumulative result for a greater than 50% chance of being realized) has been met when developing the provision for current and deferred income taxes and the associated current and deferred tax assets and liabilities. PHI’s assumptions, judgments and estimates take into account current tax laws and regulations, interpretation of current tax laws and regulations, the impact of newly enacted tax laws and regulations, developments in case law, settlements of tax positions, and the possible outcomes of current and future investigations conducted by tax authorities. PHI has established reserves for income taxes to address potential exposures involving tax positions that could be challenged by tax authorities. Although PHI believes that these assumptions, judgments and estimates are reasonable, changes in tax laws and regulations or its interpretation of tax laws and regulations as well as the resolutions of the current and any future investigations or legal proceedings could significantly impact the financial results from applying the accounting for income taxes in the consolidated financial statements. PHI reviews its application of the “more likely than not” standard quarterly.
93
PEPCO HOLDINGS
PHI also evaluates quarterly the probability of realizing deferred tax assets by reviewing a forecast of future taxable income and tax planning strategies that can be implemented, if necessary, to realize deferred tax assets. Failure to achieve forecasted taxable income or successfully implement tax planning strategies may affect the realization of deferred tax assets and the amount of any associated valuation allowance. The forecast of future taxable income is dependent on a number of factors that can change over time, including growth assumptions, business conditions, returns on rate base, operating and capital expenditures, cost of capital, tax laws and regulations, the legal structure of entities and other factors, which could materially impact the realizability of deferred tax assets and the associated financial results in the consolidated financial statements.
New Accounting Standards and Pronouncements
For information concerning new accounting standards and pronouncements that have recently been adopted by PHI and its subsidiaries or that one or more of the companies will be required to adopt on or before a specified date in the future, see Note (3), “Newly Adopted Accounting Standards,” and Note (4), “Recently Issued Accounting Standards, Not Yet Adopted,” to the consolidated financial statements of PHI.
94
PEPCO
MANAGEMENT’S DISCUSSION AND ANALYSIS OF FINANCIAL CONDITION AND RESULTS OF OPERATIONS
Potomac Electric Power Company
Pepco meets the conditions set forth in General Instruction I(1)(a) and (b) to Form 10-K, and accordingly information otherwise required under this Item has been omitted in accordance with General Instruction I(2)(a) to Form 10-K.
General Overview
Pepco is engaged in the transmission and distribution of electricity in the District of Columbia and major portions of Montgomery County and Prince George’s County in suburban Maryland. Pepco also provides Default Electricity Supply, which is the supply of electricity at regulated rates to retail customers in its service territories who do not elect to purchase electricity from a competitive energy supplier. Default Electricity Supply is known as SOS in both the District of Columbia and Maryland. Pepco’s service territory covers approximately 640 square miles and has a population of approximately 2.2 million. As of December 31, 2011, approximately 57% of delivered electricity sales were to Maryland customers and approximately 43% were to the District of Columbia customers.
For retail customers of Pepco in Maryland and in the District of Columbia, earnings are not affected by the warmest and coldest periods of the year because a BSA for retail customers was implemented that recognizes distribution revenue based on an approved distribution charge per customer. Consequently, distribution revenue recognized is decoupled in a reporting period from the amount of power delivered during the period and the only factors that will cause distribution revenue recognized in Maryland and the District of Columbia to fluctuate from period to period are changes in the number of customers and changes in the approved distribution charge per customer. Changes in customer usage (such as due to weather conditions, energy prices, energy efficiency programs or other reasons) from period to period have no impact on reported distribution revenue for customers to whom the BSA applies.
In accounting for the BSA in Maryland and the District of Columbia, a Revenue Decoupling Adjustment is recorded representing either (i) a positive adjustment equal to the amount by which revenue from Maryland and District of Columbia retail distribution sales falls short of the revenue that Pepco is entitled to earn based on the approved distribution charge per customer or (ii) a negative adjustment equal to the amount by which revenue from such distribution sales exceeds the revenue that Pepco is entitled to earn based on the approved distribution charge per customer.
Pepco is a wholly owned subsidiary of PHI. Because PHI is a public utility holding company subject to the Public Utility Holding Company Act of 2005 (PUHCA 2005), the relationship between PHI and Pepco and certain activities of Pepco are subject to FERC’s regulatory oversight under PUHCA 2005.
Reliability Enhancement and Emergency Restoration Improvement Plans
In 2010, Pepco announced that it had adopted and begun to implement comprehensive reliability enhancement plans in Maryland and the District of Columbia. These reliability enhancement plans include various initiatives to improve electrical system reliability, such as:
enhanced vegetation management;
the identification and upgrading of under-performing feeder lines;
the addition of new facilities to support load;
the installation of distribution automation systems on both the overhead and underground network system;
the rejuvenation and replacement of underground residential cables;
improvements to substation supply lines; and
selective undergrounding of portions of existing above ground primary feeder lines, where appropriate to improve reliability.
During 2011, Pepco invested $120 million in capital expenditures on these reliability enhancement activities.
In 2011, prior to the start of the summer storm season, Pepco initiated a program to improve its emergency restoration efforts that included, among other initiatives, an expansion and enhancement of customer service capabilities.
Blueprint for the Future
Pepco is participating in a PHI initiative referred to as “Blueprint for the Future,” which is designed to meet the challenges of rising energy costs, concerns about the environment, improved reliability and government energy reduction goals. For a discussion of the Blueprint for the Future initiative, see PHI’s “Management’s Discussion and Analysis of Financial Condition and Results of Operations – General Overview—Blueprint for the Future.”
95
PEPCO
MAPP Project
PJM has approved PHI’s proposal to construct a new 152-mile, interstate transmission line as part of PJM’s regional transmission expansion plan. In August 2011, PJM notified PHI that the scheduled in-service date for MAPP has been delayed from June 1, 2015 to the 2019 to 2021 time period.
Regulatory Lag
An important factor in Pepco’s ability to earn its authorized rate of return is the willingness of applicable public service commissions to adequately recognize forward-looking costs in Pepco’s rate structure in order to minimize the shortfall in revenues due to the delay in time or “lag” between when costs are incurred and when they are reflected in rates. This delay is commonly known as “regulatory lag.” Pepco is currently experiencing significant regulatory lag because its investment in the rate base and its operating expenses are outpacing revenue growth. In its most recent rate cases, Pepco (in the District of Columbia and Maryland) has proposed mechanisms that would track reliability and other expenses and permit Pepco between rate cases to make adjustments in its rates for prudent investments as made, thereby seeking to reduce the magnitude of regulatory lag. There can be no assurance that these proposals or any other attempts by Pepco to mitigate regulatory lag will be approved, or that even if approved, the rate recovery mechanisms or any base rate cases will fully ameliorate the effects of regulatory lag. Until such time as these proposed mechanisms are approved, if necessary to address the problem of regulatory lag, Pepco plans to file rate cases at least annually in an effort to align more closely its revenue and related cash flow levels with other operation and maintenance spending and capital investments. In future rate cases, Pepco would also continue to seek cost recovery and tracking mechanisms from applicable regulatory commissions to reduce the effects of regulatory lag.
Results of Operations
The following results of operations discussion compares the year ended December 31, 2011 to the year ended December 31, 2010. All amounts in the tables (except sales and customers) are in millions of dollars.
Operating Revenue
| 2011 | 2010 | Change | ||||||||||
Regulated T&D Electric Revenue | $ | 1,111 | $ | 1,068 | $ | 43 | ||||||
Default Electricity Supply Revenue | 933 | 1,185 | (252 | ) | ||||||||
Other Electric Revenue | 34 | 35 | (1 | ) | ||||||||
|
|
|
|
|
| |||||||
Total Operating Revenue | $ | 2,078 | $ | 2,288 | $ | (210 | ) | |||||
|
|
|
|
|
| |||||||
The table above shows the amount of Operating Revenue earned that is subject to price regulation (Regulated T&D Electric Revenue and Default Electricity Supply Revenue) and that which is not subject to price regulation (Other Electric Revenue).
Regulated T&D Electric Revenue includes revenue from the distribution of electricity, including the distribution of Default Electricity Supply, to Pepco’s customers within its service territory at regulated rates. Regulated T&D Electric Revenue also includes transmission service revenue that Pepco receives as a transmission owner from PJM at rates regulated by FERC. Transmission rates are updated annually based on a FERC-approved formula methodology.
Default Electricity Supply Revenue is the revenue received from the supply of electricity by Pepco at regulated rates to retail customers who do not elect to purchase electricity from a competitive energy supplier, and which is also known as SOS. The costs related to Default Electricity Supply are included in Purchased Energy. Default Electricity Supply Revenue also includes transmission enhancement credits that Pepco receives as a transmission owner from PJM for approved regional transmission expansion plan costs.
Other Electric Revenue includes work and services performed on behalf of customers, including other utilities, which is generally not subject to price regulation. Work and services includes mutual assistance to other utilities, highway relocation, rentals of pole attachments, late payment fees and collection fees.
96
PEPCO
Regulated T&D Electric
| 2011 | 2010 | Change | ||||||||||
Regulated T&D Electric Revenue | ||||||||||||
Residential | $ | 328 | $ | 314 | $ | 14 | ||||||
Commercial and industrial | 647 | 631 | 16 | |||||||||
Transmission and other | 136 | 123 | 13 | |||||||||
|
|
|
|
|
| |||||||
Total Regulated T&D Electric Revenue | $ | 1,111 | $ | 1,068 | $ | 43 | ||||||
|
|
|
|
|
| |||||||
| 2011 | 2010 | Change | ||||||||||
Regulated T&D Electric Sales (GWh) | ||||||||||||
Residential | 8,052 | 8,350 | (298 | ) | ||||||||
Commercial and industrial | 18,683 | 19,155 | (472 | ) | ||||||||
Transmission and other | 160 | 160 | — | |||||||||
|
|
|
|
|
| |||||||
Total Regulated T&D Electric Sales | 26,895 | 27,665 | (770 | ) | ||||||||
|
|
|
|
|
| |||||||
| 2011 | 2010 | Change | ||||||||||
Regulated T&D Electric Customers (in thousands) | ||||||||||||
Residential | 714 | 713 | 1 | |||||||||
Commercial and industrial | 74 | 74 | — | |||||||||
Transmission and other | — | — | — | |||||||||
|
|
|
|
|
| |||||||
Total Regulated T&D Electric Customers | 788 | 787 | 1 | |||||||||
|
|
|
|
|
| |||||||
Regulated T&D Electric Revenue increased by $43 million primarily due to:
An increase of $13 million in transmission revenue primarily attributable to higher rates effective June 1, 2010 and June 1, 2011 related to increases in transmission plant investment.
An increase of $12 million due to distribution rate increases in the District of Columbia effective March 2010 and July 2010; and in Maryland effective July 2010.
An increase of $11 million due to higher pass-through revenue (which is substantially offset by a corresponding increase in Other Taxes) primarily the result of rate increases in Montgomery County, Maryland utility taxes that are collected by Pepco on behalf of the county.
An increase of $6 million due to customer growth in 2011, primarily in the residential class.
An increase of $2 million due to the implementation of the EmPower Maryland surcharge in March 2010 (which is substantially offset by a corresponding increase in Depreciation and Amortization).
Default Electricity Supply
| 2011 | 2010 | Change | ||||||||||
Default Electricity Supply Revenue | ||||||||||||
Residential | $ | 668 | $ | 865 | $ | (197 | ) | |||||
Commercial and industrial | 257 | 309 | (52 | ) | ||||||||
Other | 8 | 11 | (3 | ) | ||||||||
|
|
|
|
|
| |||||||
Total Default Electricity Supply Revenue | $ | 933 | $ | 1,185 | $ | (252 | ) | |||||
|
|
|
|
|
| |||||||
| 2011 | 2010 | Change | ||||||||||
Default Electricity Supply Sales (GWh) | ||||||||||||
Residential | 6,770 | 7,576 | (806 | ) | ||||||||
Commercial and industrial | 2,854 | 3,113 | (259 | ) | ||||||||
Other | 8 | 10 | (2 | ) | ||||||||
|
|
|
|
|
| |||||||
Total Default Electricity Supply Sales | 9,632 | 10,699 | (1,067 | ) | ||||||||
|
|
|
|
|
| |||||||
97
PEPCO
| 2011 | 2010 | Change | ||||||||||
Default Electricity Supply Customers (in thousands) | ||||||||||||
Residential | 598 | 644 | (46 | ) | ||||||||
Commercial and industrial | 45 | 47 | (2 | ) | ||||||||
Other Commercial and industrial | — | — | — | |||||||||
|
|
|
|
|
| |||||||
Total Default Electricity Supply Customers | 643 | 691 | (48 | ) | ||||||||
|
|
|
|
|
| |||||||
Default Electricity Supply Revenue decreased by $252 million primarily due to:
A decrease of $135 million as a result of lower Default Electricity Supply rates.
A decrease of $74 million due to lower sales, primarily as a result of residential and commercial customer migration to competitive suppliers.
A decrease of $48 million due to lower sales as a result of cooler weather during the spring and summer months of 2011, and warmer weather during the fall months of 2011, as compared to the corresponding periods in 2010.
The aggregate amount of these decreases was partially offset by:
An increase of $5 million due to higher non-weather related average customer usage.
An increase of $3 million resulting from an approval by the DCPSC of an increase in Pepco’s cost recovery rate for providing Default Electricity Supply in the District of Columbia to provide for recovery of higher cash working capital costs incurred in prior periods. The higher cash working capital costs were incurred when the billing cycle for providers of Default Electricity Supply was shortened from a monthly to a weekly period, effective in June 2009.
The following table shows the percentages of Pepco’s total distribution sales by jurisdiction that are derived from customers receiving Default Electricity Supply from Pepco. Amounts are for the year ended December 31.
| 2011 | 2010 | |||||||
Sales to District of Columbia customers | 27 | % | 29 | % | ||||
Sales to Maryland customers | 43 | % | 46 | % | ||||
Operating Expenses
Purchased Energy
Purchased Energy consists of the cost of electricity purchased by Pepco to fulfill its Default Electricity Supply obligation and, as such, is recoverable from customers in accordance with the terms of public service commission orders. Purchased Energy decreased by $259 million to $893 million in 2011 from $1,152 million in 2010 primarily due to:
A decrease of $162 million due to lower average electricity costs under Default Electricity Supply contracts.
A decrease of $62 million primarily due to customer migration to competitive suppliers.
A decrease of $45 million due to lower electricity sales primarily as a result of cooler weather during the spring and summer months of 2011, and warmer weather during the fall months of 2011, as compared to the corresponding periods in 2010.
98
PEPCO
The aggregate amount of these decreases was partially offset by:
An increase of $11 million in deferred electricity expense primarily due to lower Default Electricity Supply rates, which resulted in a higher rate of recovery of Default Electricity Supply costs.
Other Operation and Maintenance
Other Operation and Maintenance increased by $66 million to $420 million in 2011 from $354 million in 2010 primarily due to:
An increase of $28 million associated with higher tree trimming and preventative maintenance costs.
An increase of $13 million due to higher 2011 DCPSC rate case costs and reliability audit expenses and due to 2010 adjustments for the deferral of (i) February 2010 severe winter storm costs of $5 million and (ii) distribution rate case costs of $4 million that previously were charged to other operation and maintenance expense. The adjustments were recorded in accordance with a MPSC rate order issued in August 2010 and a DCPSC rate order issued in February 2010, allowing for the recovery of the costs.
An increase of $8 million in customer support service and system support costs.
An increase of $7 million primarily due to emergency restoration improvement project and reliability improvement costs.
An increase of $5 million in communication costs.
An increase of $4 million in employee-related costs, primarily benefit expenses.
An increase of $3 million in outside legal counsel fees.
An increase of $3 million in emergency restoration costs. The increase is primarily related to significant incremental costs incurred for repair work following Hurricane Irene in August 2011. Costs incurred for repair work were $12 million, of which $10 million was deferred as a regulatory asset to reflect the probable recovery of these storm costs in certain jurisdictions, and the remaining $2 million was charged to other operation and maintenance expense. Pepco currently plans to seek recovery of the incremental Hurricane Irene costs in each of its jurisdictions in pending or planned distribution rate case filings.
The aggregate amount of these increases was partially offset by:
A decrease of $11 million in environmental remediation costs.
Restructuring Charge
As a result of PHI’s organizational review in the second quarter of 2010, Pepco’s operating expenses include a pre-tax restructuring charge of $15 million for the year ended December 31, 2010, related to severance and health and welfare benefits to be provided to terminated employees.
99
PEPCO
Depreciation and Amortization
Depreciation and Amortization expense increased by $9 million to $171 million in 2011 from $162 million in 2010 primarily due to:
An increase of $5 million due to utility plant additions.
An increase of $3 million in amortization of regulatory assets primarily associated with the EmPower Maryland surcharge that became effective in March 2010 (which is substantially offset by a corresponding increase in Regulated T&D Electric Revenue).
An increase of $1 million in the amortization of software upgrades to Pepco’s Energy Management System.
Other Taxes
Other Taxes increased by $18 million to $382 million in 2011 from $364 million in 2010. The increase was primarily due to:
An increase of $16 million primarily due to rate increases in the Montgomery County, Maryland utility taxes that are collected and passed through by Pepco (substantially offset by a corresponding increase in Regulated T&D Electric Revenue).
An increase of $5 million due to an adjustment in the third quarter of 2010 to correct certain errors related to other taxes.
The aggregate amount of these increases was partially offset by:
A decrease of $5 million in the Energy Assistance Trust Fund surcharge primarily due to rate decreases effective October 2010 (substantially offset by a corresponding decrease in Regulated T&D Electric Revenue).
Effects of Divestiture-Related Claims
The DCPSC on May 18, 2010 issued an order addressing all of the outstanding issues relating to Pepco’s obligation to share with its District of Columbia customers the net proceeds realized by Pepco from the sale of its generation-related assets in 2000. This order disallowed certain items that Pepco had included in the costs it deducted in calculating the net proceeds of the sale. The disallowance of these costs, together with interest, increased the aggregate amount Pepco is required to distribute to customers by approximately $11 million. Pepco recognized a pre-tax expense of $11 million for the year ended December 31, 2010.
Other Income (Expenses)
Other Expenses (which are net of Other Income) decreased by $8 million to a net expense of $77 million in 2011 from a net expense of $85 million in 2010. The decrease was primarily due to:
An increase of $8 million in income related to AFUDC that is applied to capital projects.
An increase of $3 million in other income due to net proceeds from a company owned life insurance policy.
100
PEPCO
The aggregate amount of these increases was partially offset by:
A decrease of $3 million in other income due to gains on the sale of four parcels of land in 2010.
Income Tax Expense
Pepco’s effective tax rates for the years ended December 31, 2011 and 2010 were 26.7% and 25.5%, respectively. The increase in the effective tax rate primarily resulted from changes in estimates and interest related to uncertain and effectively settled tax positions offset by an increase in certain asset removal costs.
Income Tax Adjustments
During 2011, Pepco recorded an adjustment to correct certain income tax errors related to prior periods associated with the interest on uncertain tax positions. The adjustment resulted in an increase in income tax expense of $1 million for the year ended December 31, 2011.
In 2010, Pepco recorded certain adjustments to correct errors in income tax expense which resulted in an increase to income tax expense of $4 million for the year ended December 31, 2010.
Capital Requirements
Sources of Capital
Pepco has a range of capital sources available, in addition to internally generated funds, to meet its long-term and short-term funding needs. The sources of long-term funding include the issuance of mortgage bonds and other debt securities and bank financings, as well as the ability to issue preferred stock. Proceeds from long-term financings are used primarily to fund long-term capital requirements, such as capital expenditures, and to repay or refinance existing indebtedness. Pepco traditionally has used a number of sources to fulfill short-term funding needs, including commercial paper, short-term notes, bank lines of credit and borrowings under the PHI money pool. Proceeds from short-term borrowings are used primarily to meet working capital needs, but may also be used to temporarily fund long-term capital requirements. Pepco’s ability to generate funds from its operations and to access the capital and credit markets is subject to risks and uncertainties. Volatile and deteriorating financial market conditions, diminished liquidity and tightening credit may affect access to certain of Pepco’s potential funding sources. See “Risk Factors,” for additional discussion of important factors that may have an effect on Pepco’s sources of capital.
Debt Securities
Pepco has a Mortgage and Deed of Trust (the Mortgage) under which it issues First Mortgage Bonds. First Mortgage Bonds issued under the Mortgage are secured by a lien on substantially all of Pepco’s property, plant and equipment. The principal amount of First Mortgage Bonds that Pepco may issue under the Mortgage is limited by the principal amount of retired First Mortgage Bonds and 60% of the lesser of the cost or fair value of new property additions that have not been used as the basis for the issuance of additional First Mortgage Bonds. Pepco also has an Indenture under which it issues senior notes secured by First Mortgage Bonds and an Indenture under which it can issue unsecured debt securities, including medium-term notes. To fund the construction of pollution control facilities, Pepco also has from time to time issued tax-exempt bonds through a municipality or public agency, the proceeds of which are loaned to Pepco by the municipality or agency.
101
PEPCO
Information concerning the principal amount and terms of Pepco’s outstanding debt securities, as of December 31, 2011, is set forth in Note (10), “Debt,” to the financial statements of Pepco.
Bank Financing
As further discussed in Note (10), “Debt,” to the financial statements of Pepco, Pepco is a borrower under a $1.5 billion credit facility, along with PHI, DPL and ACE, which expires in 2016. Pepco’s credit limit under the facility is the lesser of $250 million and the maximum amount of short-term debt Pepco is permitted to have outstanding by its regulatory authorities. The short-term borrowing limit established by FERC for Pepco is $500 million.
Commercial Paper Program
Pepco maintains an ongoing commercial paper program of up to $500 million under which it can issue commercial paper with maturities of up to 270 days. The commercial paper is backed by Pepco’s borrowing capacity under the $1.5 billion credit facility.
Pepco had $74 million of commercial paper outstanding at December 31, 2011 and zero outstanding at December 31, 2010. The weighted average interest rate for commercial paper issued during 2011 was 0.35%, and the weighted average maturity was two days. Pepco did not issue commercial paper during 2010.
Money Pool
Pepco participates in the money pool operated by PHI under authorization received from FERC. The money pool is a cash management mechanism used by PHI and eligible subsidiaries to manage their short-term investment and borrowing requirements. PHI may invest in, but not borrow from, the money pool. Eligible subsidiaries with surplus cash may deposit those funds in the money pool. Deposits in the money pool are guaranteed by PHI. Eligible subsidiaries with cash requirements may borrow from the money pool. Borrowings from the money pool are unsecured. Depositors in the money pool receive, and borrowers from the money pool pay, an interest rate based primarily on PHI’s short-term borrowing rate. PHI deposits funds in the money pool to the extent that the pool has insufficient funds to meet the borrowing needs of its participants, which PHI may obtain from external sources.
Preferred Stock
Under its Articles of Incorporation, Pepco is authorized to issue and have outstanding up to 6 million shares of preferred stock in one or more series, with each series having such rights, preferences and limitations, including dividend and voting rights and redemption provisions, as the Board of Directors may establish. As of December 31, 2011 and 2010, there were no shares of Pepco preferred stock outstanding.
Regulatory Restrictions on Financing Activities
Pepco’s long-term financing activities (including the issuance of securities and the incurrence of debt) are subject to authorization by the DCPSC and MPSC. Through its periodic filings with the respective utility commissions, Pepco generally maintains standing authority sufficient to cover its projected financing needs over a multi-year period. Under the FPA, FERC has jurisdiction over the issuance of long-term and short-term securities of public utilities, but only if the issuance is not regulated by the state public utility commission in which the public utility is organized and operating. Pepco has obtained FERC authorization for the issuance of short-term debt under these provisions.
102
PEPCO
Capital Expenditures
Pepco’s capital expenditures for the year ended December 31, 2011 totaled $521 million. These expenditures were primarily related to capital costs associated with new customer services, distribution reliability and transmission. The expenditures also include an allocation by PHI of hardware and software expenditures that primarily benefit Power Delivery and are allocated to Pepco when the assets are placed in service.
The following table shows Pepco’s projected capital expenditures for the five-year period 2012 through 2016. Pepco expects to fund these expenditures through internally generated cash, external financing and capital contributions from PHI.
| For the Year | ||||||||||||||||||||||||
| 2012 | 2013 | 2014 | 2015 | 2016 | Total | |||||||||||||||||||
| (millions of dollars) | ||||||||||||||||||||||||
Pepco | ||||||||||||||||||||||||
Distribution | $ | 321 | $ | 367 | $ | 439 | $ | 398 | $ | 406 | $ | 1,931 | ||||||||||||
Distribution – Blueprint for the Future | 76 | 1 | — | — | — | 77 | ||||||||||||||||||
Transmission | 104 | 93 | 68 | 58 | 71 | 394 | ||||||||||||||||||
Transmission – MAPP | 1 | 1 | 1 | 3 | 132 | 138 | ||||||||||||||||||
Other | 56 | 30 | 17 | 13 | 18 | 134 | ||||||||||||||||||
|
|
|
|
|
|
|
|
|
|
|
| |||||||||||||
Sub-Total | 558 | 492 | 525 | 472 | 627 | 2,674 | ||||||||||||||||||
DOE Capital Reimbursement Awards (a) | (46 | ) | (2 | ) | — | — | — | (48 | ) | |||||||||||||||
|
|
|
|
|
|
|
|
|
|
|
| |||||||||||||
Total Pepco | $ | 512 | $ | 490 | $ | 525 | $ | 472 | $ | 627 | $ | 2,626 | ||||||||||||
|
|
|
|
|
|
|
|
|
|
|
| |||||||||||||
| (a) | Reflects anticipated reimbursements pursuant to awards from the
| |||||||||||||||||||||||||||||||||||||||||||||||||||||||||||||||||||||||||||||||||||||||||||||||||||||
103
PEPCO
Management assessed its internal control over financial reporting as of December 31, 2010 based on the framework inInternal Control – Integrated Framework issued by the Committee of Sponsoring Organizations of the Treadway Commission. Based on its assessment, the management of Pepco Holdings concluded that Pepco Holdings’ internal control over financial reporting was effective as of December 31, 2010.
PricewaterhouseCoopers LLP, the independent registered public accounting firm that audited the financial statements of Pepco Holdings included in this Annual Report on Form 10-K, has also issued its attestation report on the effectiveness of Pepco Holdings’ internal control over financial reporting, which is included herein.
Report of Independent Registered Public Accounting Firm
To the Shareholders and Board of Directors of
Pepco Holdings, Inc.
In our opinion, the consolidated financial statements listed in the accompanying index appearing under Item 15(a)(1) present fairly, in all material respects, the financial position of Pepco Holdings, Inc. and its subsidiaries at December 31, 2010 and December 31, 2009, and the results of their operations and their cash flows for each of the three years in the period ended December 31, 2010 in conformity with accounting principles generally accepted in the United States of America. In addition, in our opinion, the financial statement schedules listed in the accompanying index appearing under Item 15(a)(2) present fairly, in all material respects, the information set forth therein when read in conjunction with the related consolidated financial statements. Also in our opinion, the Company maintained, in all material respects, effective internal control over financial reporting as of December 31, 2010, based on criteria established inInternal Control - Integrated Framework issued by the Committee of Sponsoring Organizations of the Treadway Commission (COSO). The Company’s management is responsible for these financial statements and financial statement schedules, for maintaining effective internal control over financial reporting and for its assessment of the effectiveness of internal control over financial reporting, included in the accompanying Management’s Report on Internal Control over Financial Reporting. Our responsibility is to express opinions on these financial statements, on the financial statement schedules and on the Company’s internal control over financial reporting based on our integrated audits. We conducted our audits in accordance with the standards of the Public Company Accounting Oversight Board (United States). Those standards require that we plan and perform the audits to obtain reasonable assurance about whether the financial statements are free of material misstatement and whether effective internal control over financial reporting was maintained in all material respects. Our audits of the financial statements included examining, on a test basis, evidence supporting the amounts and disclosures in the financial statements, assessing the accounting principles used and significant estimates made by management, and evaluating the overall financial statement presentation. Our audit of internal control over financial reporting included obtaining an understanding of internal control over financial reporting, assessing the risk that a material weakness exists, and testing and evaluating the design and operating effectiveness of internal control based on the assessed risk. Our audits also included performing such other procedures as we considered necessary in the circumstances. We believe that our audits provide a reasonable basis for our opinions.
A company’s internal control over financial reporting is a process designed to provide reasonable assurance regarding the reliability of financial reporting and the preparation of financial statements for external purposes in accordance with generally accepted accounting principles. A company’s internal control over financial reporting includes those policies and procedures that (i) pertain to the maintenance of records that, in reasonable detail, accurately and fairly reflect the transactions and dispositions of the assets of the company; (ii) provide reasonable assurance that transactions are recorded as necessary to permit preparation of financial statements in accordance with generally accepted accounting principles, and that receipts and expenditures of the company are being made only in accordance with authorizations of management and directors of the company; and (iii) provide reasonable assurance regarding prevention or timely detection of unauthorized acquisition, use, or disposition of the company’s assets that could have a material effect on the financial statements.
Because of its inherent limitations, internal control over financial reporting may not prevent or detect misstatements. Also, projections of any evaluation of effectiveness to future periods are subject to the risk that controls may become inadequate because of changes in conditions, or that the degree of compliance with the policies or procedures may deteriorate.
PEPCO HOLDINGS
PEPCO HOLDINGS, INC. AND SUBSIDIARIES
CONSOLIDATED STATEMENTS OF INCOME
For the Year Ended December 31, | 2010 | 2009 | 2008 | |||||||||
| (millions of dollars, except per share data) | ||||||||||||
Operating Revenue | ||||||||||||
Power Delivery | $ | 5,114 | $ | 4,980 | $ | 5,488 | ||||||
Pepco Energy Services | 1,883 | 2,383 | 2,648 | |||||||||
Other | 42 | 39 | (77 | ) | ||||||||
Total Operating Revenue | 7,039 | 7,402 | 8,059 | |||||||||
Operating Expenses | ||||||||||||
Fuel and purchased energy | 4,644 | 5,330 | 5,927 | |||||||||
Other services cost of sales | 127 | 85 | 127 | |||||||||
Other operation and maintenance | 884 | 819 | 775 | |||||||||
Restructuring charge | 30 | — | — | |||||||||
Depreciation and amortization | 393 | 349 | 338 | |||||||||
Other taxes | 434 | 368 | 355 | |||||||||
Deferred electric service costs | (108 | ) | (161 | ) | (9 | ) | ||||||
Impairment losses | — | 4 | — | |||||||||
Effect of Pepco divestiture-related claims | 11 | (40 | ) | — | ||||||||
Gain on sale of assets | — | — | (3 | ) | ||||||||
Total Operating Expenses | 6,415 | 6,754 | 7,510 | |||||||||
Operating Income | 624 | 648 | 549 | |||||||||
Other Income (Expenses) | ||||||||||||
Interest and dividend income | — | 2 | 17 | |||||||||
Interest expense | (306 | ) | (340 | ) | (305 | ) | ||||||
(Loss) gain from equity investments | (1 | ) | 2 | (4 | ) | |||||||
Loss on extinguishment of debt | (189 | ) | — | — | ||||||||
Other income | 22 | 16 | 19 | |||||||||
Other expenses | — | (1 | ) | (3 | ) | |||||||
Total Other Expenses | (474 | ) | (321 | ) | (276 | ) | ||||||
Income from Continuing Operations Before Income Tax Expense | 150 | 327 | 273 | |||||||||
Income Tax Expense Related to Continuing Operations | 11 | 104 | 90 | |||||||||
Net Income from Continuing Operations | 139 | 223 | 183 | |||||||||
(Loss) Income from Discontinued Operations, net of Income Taxes | (107 | ) | 12 | 117 | ||||||||
Net Income | $ | 32 | $ | 235 | $ | 300 | ||||||
Basic and Diluted Share Information | ||||||||||||
Weighted average shares outstanding (millions) | 224 | 221 | 204 | |||||||||
Earnings per share of common stock from Continuing Operations | $ | 0.62 | $ | 1.01 | $ | 0.90 | ||||||
(Loss) earnings per share of common stock from Discontinued Operations | (0.48 | ) | 0.05 | 0.57 | ||||||||
Basic and diluted earnings per share | $ | 0.14 | $ | 1.06 | $ | 1.47 | ||||||
The accompanying Notes are an integral part of these Consolidated Financial Statements.
PEPCO HOLDINGS
PEPCO HOLDINGS, INC. AND SUBSIDIARIES
CONSOLIDATED STATEMENTS OF COMPREHENSIVE INCOME
For the Year Ended December 31, | 2010 | 2009 | 2008 | |||||||||
| (millions of dollars) | ||||||||||||
Net income | $ | 32 | $ | 235 | $ | 300 | ||||||
Other comprehensive income (loss) from continuing operations | ||||||||||||
Gains (loss) from continuing operations on commodity derivatives designated as cash flow hedges: | ||||||||||||
Losses arising during period | (100 | ) | (129 | ) | (210 | ) | ||||||
Amount of losses (gains) reclassified into income | 135 | 166 | (8 | ) | ||||||||
Net gains (losses) on commodity derivatives | 35 | 37 | (218 | ) | ||||||||
Losses on treasury rate locks reclassified into income | 18 | 5 | 5 | |||||||||
Amortization of losses for prior service cost | — | (13 | ) | (3 | ) | |||||||
Other comprehensive income (loss) from continuing operations, before income taxes | 53 | 29 | (216 | ) | ||||||||
Income tax expense (benefit) from continuing operations | 21 | 12 | (87 | ) | ||||||||
Other comprehensive income (loss) from continuing operations, net of income taxes | 32 | 17 | (129 | ) | ||||||||
Other comprehensive income (loss) from discontinued operations, net of income taxes | 103 | 4 | (87 | ) | ||||||||
Comprehensive income | $ | 167 | $ | 256 | $ | 84 | ||||||
The accompanying Notes are an integral part of these Consolidated Financial Statements.
PEPCO HOLDINGS
PEPCO HOLDINGS, INC. AND SUBSIDIARIES
CONSOLIDATED BALANCE SHEETS
ASSETS | December 31, 2010 | December 31, 2009 | ||||||
| (millions of dollars) | ||||||||
CURRENT ASSETS | ||||||||
Cash and cash equivalents | $ | 20 | $ | 44 | ||||
Restricted cash equivalents | 11 | 11 | ||||||
Accounts receivable, less allowance for uncollectible accounts of $51 million and $44 million, respectively | 1,027 | 1,019 | ||||||
Inventories | 126 | 124 | ||||||
Derivative assets | 45 | 22 | ||||||
Prepayments of income taxes | 276 | 167 | ||||||
Deferred income tax assets, net | 90 | 126 | ||||||
Prepaid expenses and other | 51 | 67 | ||||||
Conectiv Energy assets held for sale | 111 | 346 | ||||||
Total Current Assets | 1,757 | 1,926 | ||||||
INVESTMENTS AND OTHER ASSETS | ||||||||
Goodwill | 1,407 | 1,407 | ||||||
Regulatory assets | 1,915 | 1,801 | ||||||
Investment in finance leases held in trust | 1,423 | 1,386 | ||||||
Income taxes receivable | 114 | 141 | ||||||
Restricted cash equivalents | 5 | 4 | ||||||
Assets and accrued interest related to uncertain tax positions | 11 | 12 | ||||||
Derivative assets | — | 16 | ||||||
Other | 169 | 194 | ||||||
Conectiv Energy assets held for sale | 6 | 29 | ||||||
Total Investments and Other Assets | 5,050 | 4,990 | ||||||
PROPERTY, PLANT AND EQUIPMENT | ||||||||
Property, plant and equipment | 12,120 | 11,431 | ||||||
Accumulated depreciation | (4,447 | ) | (4,190 | ) | ||||
Net Property, Plant and Equipment | 7,673 | 7,241 | ||||||
Conectiv Energy assets held for sale | — | 1,622 | ||||||
Total Property, Plant and Equipment | 7,673 | 8,863 | ||||||
TOTAL ASSETS | $ | 14,480 | $ | 15,779 | ||||
The accompanying Notes are an integral part of these Consolidated Financial Statements.
131
PEPCO HOLDINGS
PEPCO HOLDINGS, INC. AND SUBSIDIARIES
CONSOLIDATED BALANCE SHEETS
LIABILITIES AND EQUITY | December 31, 2010 | December 31, 2009 | ||||||
| (millions of dollars, except shares) | ||||||||
CURRENT LIABILITIES | ||||||||
Short-term debt | $ | 534 | $ | 530 | ||||
Current portion of long-term debt and project funding | 75 | 536 | ||||||
Accounts payable and accrued liabilities | 587 | 574 | ||||||
Capital lease obligations due within one year | 8 | 7 | ||||||
Taxes accrued | 96 | 47 | ||||||
Interest accrued | 45 | 68 | ||||||
Liabilities and accrued interest related to uncertain tax positions | 3 | 1 | ||||||
Derivative liabilities | 66 | 67 | ||||||
Other | 321 | 281 | ||||||
Liabilities associated with Conectiv Energy assets held for sale | 62 | 191 | ||||||
Total Current Liabilities | 1,797 | 2,302 | ||||||
DEFERRED CREDITS | ||||||||
Regulatory liabilities | 528 | 613 | ||||||
Deferred income taxes, net | 2,714 | 2,600 | ||||||
Investment tax credits | 26 | 35 | ||||||
Pension benefit obligation | 332 | 290 | ||||||
Other postretirement benefit obligations | 429 | 409 | ||||||
Income taxes payable | 2 | 5 | ||||||
Liabilities and accrued interest related to uncertain tax positions | 148 | 96 | ||||||
Derivative liabilities | 21 | 54 | ||||||
Other | 175 | 147 | ||||||
Liabilities associated with Conectiv Energy assets held for sale | 10 | 19 | ||||||
Total Deferred Credits | 4,385 | 4,268 | ||||||
LONG-TERM LIABILITIES | ||||||||
Long-term debt | 3,629 | 4,470 | ||||||
Transition bonds issued by ACE Funding | 332 | 368 | ||||||
Long-term project funding | 15 | 17 | ||||||
Capital lease obligations | 86 | 92 | ||||||
Total Long-Term Liabilities | 4,062 | 4,947 | ||||||
COMMITMENTS AND CONTINGENCIES (NOTE 17) | ||||||||
EQUITY | ||||||||
Common stock, $.01 par value - authorized 400,000,000 shares, 225,082,252 and 222,269,895 shares outstanding, respectively | 2 | 2 | ||||||
Premium on stock and other capital contributions | 3,275 | 3,227 | ||||||
Accumulated other comprehensive loss | (106 | ) | (241 | ) | ||||
Retained earnings | 1,059 | 1,268 | ||||||
Total Shareholders’ Equity | 4,230 | 4,256 | ||||||
Non-controlling interest | 6 | 6 | ||||||
Total Equity | 4,236 | 4,262 | ||||||
TOTAL LIABILITIES AND EQUITY | $ | 14,480 | $ | 15,779 | ||||
The accompanying Notes are an integral part of these Consolidated Financial Statements.
PEPCO HOLDINGS
PEPCO HOLDINGS, INC. AND SUBSIDIARIES
CONSOLIDATED STATEMENTS OF CASH FLOWS
For the Year Ended December 31, | 2010 | 2009 | 2008 | |||||||||
| (millions of dollars) | ||||||||||||
OPERATING ACTIVITIES | ||||||||||||
Net income | $ | 32 | $ | 235 | $ | 300 | ||||||
Loss (income) from discontinued operations | 107 | (12 | ) | (117 | ) | |||||||
Adjustments to reconcile net income to net cash from operating activities: | ||||||||||||
Depreciation and amortization | 393 | 349 | 338 | |||||||||
Non-cash rents from cross-border energy lease investments | (55 | ) | (54 | ) | (65 | ) | ||||||
Non-cash charge to reduce equity value of PHI’s cross-border energy lease investments | 2 | 3 | 124 | |||||||||
Effects of Pepco divestiture-related claims | 11 | (40 | ) | — | ||||||||
Changes in restricted cash equivalents related to Mirant settlement | — | 102 | 315 | |||||||||
Deferred income taxes | 345 | 249 | 313 | |||||||||
Losses on treasury rate locks reclassified into income | 18 | 5 | 5 | |||||||||
Other | (20 | ) | (3 | ) | (12 | ) | ||||||
Changes in: | ||||||||||||
Accounts receivable | (12 | ) | 136 | (71 | ) | |||||||
Inventories | (2 | ) | 20 | (35 | ) | |||||||
Prepaid expenses | 7 | (17 | ) | 1 | ||||||||
Regulatory assets and liabilities, net | (154 | ) | (221 | ) | (325 | ) | ||||||
Accounts payable and accrued liabilities | 73 | (153 | ) | 29 | ||||||||
Pension contributions | (100 | ) | (300 | ) | — | |||||||
Pension benefit obligation, excluding contributions | 68 | 95 | 19 | |||||||||
Cash collateral related to derivative activities | 13 | 24 | (138 | ) | ||||||||
Taxes accrued | (213 | ) | 76 | (241 | ) | |||||||
Other assets and liabilities | 52 | 9 | 17 | |||||||||
Net Conectiv Energy assets held for sale | 248 | 103 | (44 | ) | ||||||||
Net Cash From Operating Activities | 813 | 606 | 413 | |||||||||
INVESTING ACTIVITIES | ||||||||||||
Investment in property, plant and equipment | (802 | ) | (664 | ) | (643 | ) | ||||||
DOE capital reimbursement awards received | 13 | — | — | |||||||||
Proceeds from sale of Conectiv Energy wholesale power generation business | 1,640 | — | — | |||||||||
Proceeds from sale of assets | 3 | 4 | 56 | |||||||||
Net other investing activities | 2 | — | 11 | |||||||||
Investment in property, plant and equipment associated with Conectiv Energy assets held for sale | (138 | ) | (200 | ) | (138 | ) | ||||||
Net Cash From (Used By) Investing Activities | 718 | (860 | ) | (714 | ) | |||||||
FINANCING ACTIVITIES | ||||||||||||
Dividends paid on common stock | (241 | ) | (238 | ) | (222 | ) | ||||||
Common stock issued for the Dividend Reinvestment Plan and employee-related compensation | 47 | 49 | 51 | |||||||||
Issuance of common stock | — | — | 265 | |||||||||
Issuances of long-term debt | 383 | 110 | 1,150 | |||||||||
Reacquisition of long-term debt | (1,726 | ) | (83 | ) | (590 | ) | ||||||
Issuances (repayments) of short-term debt, net | 4 | 65 | 26 | |||||||||
Cost of issuances | (7 | ) | (4 | ) | (30 | ) | ||||||
Net other financing activities | (6 | ) | 10 | (21 | ) | |||||||
Net financing activities associated with Conectiv Energy assets held for sale | (10 | ) | 7 | 1 | ||||||||
Net Cash (Used By) From Financing Activities | (1,556 | ) | (84 | ) | 630 | |||||||
Net (Decrease) Increase In Cash and Cash Equivalents | (25 | ) | (338 | ) | 329 | |||||||
Cash and Cash Equivalents of Discontinued Operations | (1 | ) | (2 | ) | (9 | ) | ||||||
Cash and Cash Equivalents at Beginning of Year | 46 | 384 | 55 | |||||||||
CASH AND CASH EQUIVALENTS AT END OF YEAR | $ | 20 | $ | 44 | $ | 375 | ||||||
SUPPLEMENTAL DISCLOSURE OF CASH FLOW INFORMATION | ||||||||||||
Cash paid for interest (net of capitalized interest of $9 million, $11 million and $11 million, respectively) | $ | 310 | $ | 353 | $ | 316 | ||||||
Cash (received) paid for income taxes | (13 | ) | (76 | ) | 99 | |||||||
The accompanying Notes are an integral part of these Consolidated Financial Statements.
PEPCO HOLDINGS
PEPCO HOLDINGS, INC. AND SUBSIDIARIES
CONSOLIDATED STATEMENTS OF EQUITY
| Common Stock | Premium | Accumulated Other Comprehensive | Retained | |||||||||||||||||||||
(millions of dollars, except shares) | Shares | Par Value | on Stock | (Loss) Income | Earnings | Total | ||||||||||||||||||
BALANCE, DECEMBER 31, 2007 | 200,512,890 | $ | 2 | $ | 2,869 | $ | (46 | ) | $ | 1,193 | $ | 4,018 | ||||||||||||
Net Income | — | — | — | — | 300 | 300 | ||||||||||||||||||
Other comprehensive loss | — | — | — | (216 | ) | — | (216 | ) | ||||||||||||||||
Dividends on common stock ($1.08 per share) | — | — | — | — | (222 | ) | (222 | ) | ||||||||||||||||
Issuance of common stock: | ||||||||||||||||||||||||
Original issue shares, net | 17,095,081 | — | 277 | — | — | 277 | ||||||||||||||||||
DRP original shares | 1,298,249 | — | 29 | — | — | 29 | ||||||||||||||||||
Net activity related to stock-based awards | — | — | 4 | — | — | 4 | ||||||||||||||||||
BALANCE, DECEMBER 31, 2008 | 218,906,220 | 2 | 3,179 | (262 | ) | 1,271 | 4,190 | |||||||||||||||||
Net Income | — | — | — | — | 235 | 235 | ||||||||||||||||||
Other comprehensive income | — | — | — | 21 | — | 21 | ||||||||||||||||||
Dividends on common stock ($1.08 per share) | — | — | — | — | (238 | ) | (238 | ) | ||||||||||||||||
Issuance of common stock: | ||||||||||||||||||||||||
Original issue shares, net | 1,210,261 | — | 18 | — | — | 18 | ||||||||||||||||||
DRP original shares | 2,153,414 | — | 31 | — | — | 31 | ||||||||||||||||||
Net activity related to stock-based awards | — | — | (1 | ) | — | — | (1 | ) | ||||||||||||||||
BALANCE, DECEMBER 31, 2009 | 222,269,895 | 2 | 3,227 | (241 | ) | 1,268 | 4,256 | |||||||||||||||||
Net Income | — | — | — | — | 32 | 32 | ||||||||||||||||||
Other comprehensive income | — | — | — | 135 | — | 135 | ||||||||||||||||||
Dividends on common stock ($1.08 per share) | — | — | — | — | (241 | ) | (241 | ) | ||||||||||||||||
Issuance of common stock: | ||||||||||||||||||||||||
Original issue shares, net | 1,041,482 | — | 16 | — | — | 16 | ||||||||||||||||||
DRP original shares | 1,770,875 | — | 31 | — | — | 31 | ||||||||||||||||||
Net activity related to stock-based awards | — | — | 1 | — | — | 1 | ||||||||||||||||||
BALANCE, DECEMBER 31, 2010 | 225,082,252 | $ | 2 | $ | 3,275 | $ | (106 | ) | $ | 1,059 | $ | 4,230 | ||||||||||||
The accompanying Notes are an integral part of these Consolidated Financial Statements.
PEPCO HOLDINGS
Transmission and Distribution The projected capital expenditures listed in the table above for distribution (other than Blueprint for the Future) and transmission (other than the MAPP project) are primarily for facility replacements and upgrades to accommodate customer growth and service reliability, including capital expenditures for continuing reliability enhancement efforts. Blueprint for the Future Pepco has undertaken programs to install smart meters, further automate its electric distribution systems and enhance its communications infrastructure, which it refers to as the Blueprint for the Future. For a discussion of the Blueprint for the Future initiative, see PHI’s “Management’s Discussion and Analysis of Financial Condition and Results of Operations – General Overview—Blueprint for the Future.” The projected capital expenditures over the next five years are shown as Distribution—Blueprint for the Future in the table above. MAPP Project PJM has approved PHI’s proposal to construct a new 152-mile, interstate transmission line as part of PJM’s regional transmission expansion plan. In August 2011, PJM notified PHI that the scheduled in-service date for MAPP has been delayed from June 1, 2015 to the 2019 to 2021 time period. The projected capital expenditures over the next five years for MAPP are shown as Transmission—MAPP in the table above. MAPP/DOE Loan Program To assist in the funding of the MAPP project, PHI has applied for a $684 million loan guarantee from the DOE for a substantial portion of the MAPP project, primarily the Calvert Cliffs to Indian River segment. The application has been made under a federal loan guarantee program for projects that employ innovative energy efficiency, renewable energy and advanced transmission and distribution technologies. If granted, PHI believes the guarantee could allow PHI to acquire financing at a lower cost than it would otherwise be able to obtain in the capital markets. Whether PHI’s application will be granted and, if so, the amount of debt guaranteed is subject to the discretion of the DOE and the negotiation of terms that will satisfy the conditions of the guarantee program. On February 28, 2011, the DOE issued a Notice of Intent to prepare an Environmental Impact Statement to assist the DOE in assessing the environmental impact of constructing the portion of the MAPP project to be supported by the loan guarantee. Since February 2011, the DOE has conducted field inspections of the entire route and has held public meetings to obtain input from the communities along the route. The DOE’s review of the loan guarantee program has delayed the DOE’s review of PHI’s loan guarantee application. There is not an approval deadline under the loan guarantee program, but this program could change or be terminated in the future. PHI continues to coordinate environmental activities with the DOE. DOE Capital Reimbursement Awards In 2009, the DOE announced a $168 million award to PHI under the American Recovery and Reinvestment Act of 2009 for the implementation of an AMI system, direct load control, distribution automation and communications infrastructure. Pepco was awarded $149 million with $105 million to be used in the Maryland service territory and $44 million to be used in the District of Columbia service territory. In April 2010, PHI and the DOE signed agreements formalizing Pepco’s $149 million share of the $168 million award. Of the $149 million, $118 million is expected to offset incurred and projected Blueprint for the Future and other capital expenditures of Pepco. The remaining $31 million will be used to offset incremental expenses associated with direct load control and other programs. In 2011, Pepco received award payments of $53 million. In 2010, Pepco received award payments of $15 million. The IRS has announced that, to the extent these grants are expended on capital items, they will not be considered taxable income. Pension and Other Postretirement Benefit Plans Pepco participates in pension and OPEB plans sponsored by PHI for its employees. Pepco contributed $40 million and zero to the PHI Retirement Plan during 2011 and 2010, respectively. On January 31, 2012, Pepco made an $85 million discretionary tax-deductible contribution to the PHI Retirement Plan. 104 DPLNOTES TO CONSOLIDATED FINANCIAL STATEMENTS
MANAGEMENT’S DISCUSSION AND ANALYSIS OF FINANCIAL CONDITION AND RESULTS OF OPERATIONS
Delmarva Power & Light Company
DPL meets the conditions set forth in General Instruction I(1)(a) and (b) to Form 10-K, and accordingly information otherwise required under this Item has been omitted in accordance with General Instruction I(2)(a) to Form 10-K.
General Overview
DPL is engaged in the transmission and distribution of electricity in Delaware and portions of Maryland. DPL also provides Default Electricity Supply, which is the supply of electricity at regulated rates to retail customers in its service territories who do not elect to purchase electricity from a competitive energy supplier. Default Electricity Supply is known as SOS in both Delaware and Maryland. DPL’s electricity distribution service territory covers approximately 5,000 square miles and has a population of approximately 1.4 million. As of December 31, 2011, approximately 66% of delivered electricity sales were to Delaware customers and approximately 34% were to Maryland customers. In northern Delaware, DPL also supplies and distributes natural gas to retail customers and provides transportation-only services to retail customers that purchase natural gas from other suppliers. DPL’s natural gas distribution service territory covers approximately 275 square miles and has a population of approximately 500,000.
In DPL’s Delaware service territory, results historically have been seasonal, generally producing higher revenue and income in the warmest and coldest periods of the year. For retail customers of DPL in Maryland, earnings are not affected by the warmest and coldest periods of the year because a BSA for retail customers was implemented that recognizes distribution revenue based on an approved distribution charge per customer. Consequently, distribution revenue recognized is decoupled in a reporting period from the amount of power delivered during the period and the only factors that will cause distribution revenue recognized in Maryland to fluctuate from period to period are changes in the number of customers and changes in the approved distribution charge per customer. A comparable revenue decoupling mechanism for DPL electricity and natural gas customers in Delaware is under consideration by the DPSC. Changes in customer usage (such as due to weather conditions, energy prices, energy efficiency programs or other reasons) from period to period have no impact on reported distribution revenue for customers to whom the BSA applies.
In accounting for the BSA in Maryland, a Revenue Decoupling Adjustment is recorded representing either (i) a positive adjustment equal to the amount by which revenue from Maryland retail distribution sales falls short of the revenue that DPL is entitled to earn based on the approved distribution charge per customer or (ii) a negative adjustment equal to the amount by which revenue from such distribution sales exceeds the revenue that DPL is entitled to earn based on the approved distribution charge per customer.
DPL is a wholly owned subsidiary of Conectiv, which is wholly owned by PHI. Because PHI is a public utility holding company subject to PUHCA 2005, the relationship between PHI and DPL and certain activities of DPL are subject to FERC’s regulatory oversight under PUHCA 2005.
Blueprint for the Future
DPL is participating in a PHI initiative referred to as “Blueprint for the Future,” which is designed to meet the challenges of rising energy costs, concerns about the environment, improved reliability and government energy reduction goals. For a discussion of the Blueprint for the Future initiative, see PHI’s “Management’s Discussion and Analysis of Financial Condition and Results of Operations – General Overview—Blueprint for the Future.”
105
DPL
MAPP Project
PJM has approved PHI’s proposal to construct a new 152-mile, interstate transmission line as part of PJM’s regional transmission expansion plan. In August 2011, PJM notified PHI that the scheduled in-service date for MAPP has been delayed from June 1, 2015 to the 2019 to 2021 time period. The projected capital expenditures over the next five years for MAPP are shown as Transmission—MAPP in the table above.
Regulatory Lag
An important factor in the ability of DPL to earn its authorized rate of return is the willingness of applicable public service commissions to adequately recognize forward-looking costs in DPL’s rate structure in order to minimize the shortfall in revenues due to the delay in time or “lag” between when costs are incurred and when they are reflected in rates. This delay is commonly known as “regulatory lag.” DPL is currently experiencing significant regulatory lag because its investment in the rate base and its operating expenses are outpacing revenue growth. In its most recent rate cases, DPL (in Delaware and Maryland) has proposed mechanisms that would track reliability and other expenses and permit DPL between rate cases to make adjustments in its rates for prudent investments as made, thereby seeking to reduce the magnitude of regulatory lag. There can be no assurance that these proposals or any other attempts by DPL to mitigate regulatory lag will be approved, or that even if approved, the rate recovery mechanisms or any base rate cases will fully ameliorate the effects of regulatory lag. Until such time as these proposed mechanisms are approved, if necessary to address the problem of regulatory lag, DPL plans to file rate cases at least annually in an effort to align more closely its revenue and related cash flow levels with other operation and maintenance spending and capital investments. In future rate cases, DPL would also continue to seek cost recovery and tracking mechanisms from applicable regulatory commissions to reduce the effects of regulatory lag.
106
DPL
Results of Operations
The following results of operations discussion compares the year ended December 31, 2011 to the year ended December 31, 2010. All amounts in the tables (except sales and customers) are in millions of dollars.
Electric Operating Revenue
| 2011 | 2010 | Change | ||||||||||
Regulated T&D Electric Revenue | $ | 394 | $ | 375 | $ | 19 | ||||||
Default Electricity Supply Revenue | 664 | 768 | (104 | ) | ||||||||
Other Electric Revenue | 16 | 20 | (4 | ) | ||||||||
|
|
|
|
|
| |||||||
Total Electric Operating Revenue | $ | 1,074 | $ | 1,163 | $ | (89 | ) | |||||
|
|
|
|
|
| |||||||
The table above shows the amount of Electric Operating Revenue earned that is subject to price regulation (Regulated T&D Electric Revenue and Default Electricity Supply Revenue) and that which is not subject to price regulation (Other Electric Revenue).
Regulated T&D Electric Revenue includes revenue from the distribution of electricity, including the distribution of Default Electricity Supply, to DPL’s customers within its service territory at regulated rates. Regulated T&D Electric Revenue also includes transmission service revenue that DPL receives as a transmission owner from PJM at rates regulated by FERC. Transmission rates are updated annually based on a FERC-approved formula methodology.
Default Electricity Supply Revenue is the revenue received from the supply of electricity by DPL at regulated rates to retail customers who do not elect to purchase electricity from a competitive energy supplier, and which is also known as SOS. The costs related to Default Electricity Supply are included in Purchased Energy. Default Electricity Supply Revenue also includes transmission enhancement credits that DPL receives as a transmission owner from PJM for approved regional transmission expansion plan costs.
Other Electric Revenue includes work and services performed on behalf of customers, including other utilities, which is generally not subject to price regulation. Work and services includes mutual assistance to other utilities, highway relocation, rentals of pole attachments, late payment fees, and collection fees.
Regulated T&D Electric
| 2011 | 2010 | Change | ||||||||||
Regulated T&D Electric Revenue | ||||||||||||
Residential | $ | 188 | $ | 184 | $ | 4 | ||||||
Commercial and industrial | 113 | 110 | 3 | |||||||||
Transmission and other | 93 | 81 | 12 | |||||||||
|
|
|
|
|
| |||||||
Total Regulated T&D Electric Revenue | $ | 394 | $ | 375 | $ | 19 | ||||||
|
|
|
|
|
| |||||||
| 2011 | 2010 | Change | ||||||||||
Regulated T&D Electric Sales (GWh) | ||||||||||||
Residential | 5,197 | 5,357 | (160 | ) | ||||||||
Commercial and industrial | 7,442 | 7,445 | (3 | ) | ||||||||
Transmission and other | 49 | 51 | (2 | ) | ||||||||
|
|
|
|
|
| |||||||
Total Regulated T&D Electric Sales | 12,688 | 12,853 | (165 | ) | ||||||||
|
|
|
|
|
| |||||||
107
DPL
| 2011 | 2010 | Change | ||||||||||
Regulated T&D Electric Customers (in thousands) | ||||||||||||
Residential | 441 | 440 | 1 | |||||||||
Commercial and industrial | 59 | 59 | — | |||||||||
Transmission and other | 1 | 1 | — | |||||||||
|
|
|
|
|
| |||||||
Total Regulated T&D Electric Customers | 501 | 500 | 1 | |||||||||
|
|
|
|
|
| |||||||
Regulated T&D Electric Revenue increased by $19 million primarily due to:
An increase of $12 million in transmission revenue primarily attributable to higher rates effective June 1, 2010 and June 1, 2011 related to increases in transmission plant investment.
An increase of $11 million due to distribution rate increases in Maryland effective July 2011, and in Delaware effective February 2011.
The aggregate amount of these increases was partially offset by:
A decrease of $4 million due to lower sales as a result of cooler weather during the 2011 spring and summer months, and warmer weather during the 2011 fall months as compared to 2010.
Default Electricity Supply
| 2011 | 2010 | Change | ||||||||||
Default Electricity Supply Revenue | ||||||||||||
Residential | $ | 505 | $ | 577 | $ | (72 | ) | |||||
Commercial and industrial | 148 | 181 | (33 | ) | ||||||||
Other | 11 | 10 | 1 | |||||||||
|
|
|
|
|
| |||||||
Total Default Electricity Supply Revenue | $ | 664 | $ | 768 | $ | (104 | ) | |||||
|
|
|
|
|
| |||||||
| 2011 | 2010 | Change | ||||||||||
Default Electricity Supply Sales (GWh) | ||||||||||||
Residential | 4,856 | 5,199 | (343 | ) | ||||||||
Commercial and industrial | 1,845 | 1,954 | (109 | ) | ||||||||
Other | 29 | 37 | (8 | ) | ||||||||
|
|
|
|
|
| |||||||
Total Default Electricity Supply Sales | 6,730 | 7,190 | (460 | ) | ||||||||
|
|
|
|
|
| |||||||
| 2011 | 2010 | Change | ||||||||||
Default Electricity Supply Customers (in thousands) | ||||||||||||
Residential | 415 | 423 | (8 | ) | ||||||||
Commercial and industrial | 42 | 45 | (3 | ) | ||||||||
Other | — | 1 | (1 | ) | ||||||||
|
|
|
|
|
| |||||||
Total Default Electricity Supply Customers | 457 | 469 | (12 | ) | ||||||||
|
|
|
|
|
| |||||||
Default Supply Revenue decreased by $104 million primarily due to:
A decrease of $58 million as a result of lower Default Electricity Supply rates.
A decrease of $28 million due to lower sales, primarily as a result of customer migration to competitive suppliers.
108
DPL
A decrease of $25 million due to lower sales as a result of cooler weather during the spring and summer months of 2011, and warmer weather during the fall months of 2011, as compared to the corresponding periods in 2010.
The aggregate amount of these decreases was partially offset by:
An increase of $7 million due to higher non-weather related average customer usage.
The following table shows the percentages of DPL’s total distribution sales by jurisdiction that are derived from customers receiving Default Electricity Supply from DPL. Amounts are for the years ended December 31:
| 2011 | 2010 | |||||||
Sales to Delaware customers | 51 | % | 53 | % | ||||
Sales to Maryland customers | 58 | % | 63 | % | ||||
Natural Gas Operating Revenue
| 2011 | 2010 | Change | ||||||||||
Regulated Gas Revenue | $ | 183 | $ | 191 | $ | (8 | ) | |||||
Other Gas Revenue | 47 | 46 | 1 | |||||||||
|
|
|
|
|
| |||||||
Total Natural Gas Operating Revenue | $ | 230 | $ | 237 | $ | (7 | ) | |||||
|
|
|
|
|
| |||||||
The table above shows the amounts of Natural Gas Operating Revenue from sources that are subject to price regulation (Regulated Gas Revenue) and those that generally are not subject to price regulation (Other Gas Revenue). Regulated Gas Revenue includes the revenue DPL receives from on-system natural gas delivered sales and the transportation of natural gas for customers within its service territory at regulated rates. Other Gas Revenue includes off-system natural gas sales and the short-term release of interstate pipeline transportation and storage capacity not needed to serve customers. Off-system sales are made possible when low demand for natural gas by regulated customers creates excess pipeline capacity.
Regulated Gas
| 2011 | 2010 | Change | ||||||||||
Regulated Gas Revenue | ||||||||||||
Residential | $ | 113 | $ | 118 | $ | (5 | ) | |||||
Commercial and industrial | 61 | 65 | (4 | ) | ||||||||
Transportation and other | 9 | 8 | 1 | |||||||||
|
|
|
|
|
| |||||||
Total Regulated Gas Revenue | $ | 183 | $ | 191 | $ | (8 | ) | |||||
|
|
|
|
|
| |||||||
| 2011 | 2010 | Change | ||||||||||
Regulated Gas Sales (billion cubic feet) | ||||||||||||
Residential | 7 | 8 | (1 | ) | ||||||||
Commercial and industrial | 5 | 5 | — | |||||||||
Transportation and other | 7 | 6 | 1 | |||||||||
|
|
|
|
|
| |||||||
Total Regulated Gas Sales | 19 | 19 | — | |||||||||
|
|
|
|
|
| |||||||
| 2011 | 2010 | Change | ||||||||||
Regulated Gas Customers (in thousands) | ||||||||||||
Residential | 115 | 114 | 1 | |||||||||
Commercial and industrial | 9 | 9 | — | |||||||||
Transportation and other | — | — | — | |||||||||
|
|
|
|
|
| |||||||
Total Regulated Gas Customers | 124 | 123 | 1 | |||||||||
|
|
|
|
|
| |||||||
109
DPL
Regulated Gas Revenue decreased by $8 million primarily due to:
A decrease of $17 million due to lower non-weather related average customer usage.
The decrease was partially offset by:
An increase of $6 million due to higher sales primarily as a result of colder weather during the winter months of 2011 as compared to 2010.
An increase of $2 million due to a distribution rate increase effective February 2011.
An increase of $2 million due to customer growth in 2011.
Operating Expenses
Purchased Energy
Purchased Energy consists of the cost of electricity purchased by DPL to fulfill its Default Electricity Supply obligation and, as such, is recoverable from customers in accordance with the terms of public service commission orders. Purchased Energy decreased by $105 million to $635 million in 2011, from $740 million in 2010 primarily due to:
A decrease of $68 million due to lower average electricity costs under Default Electricity Supply contracts.
A decrease of $22 million due to lower electricity sales primarily as a result of cooler weather during the spring and summer months of 2011, and warmer weather during the fall months of 2011, as compared to the corresponding periods in 2010.
A decrease of $21 million primarily due to customer migration to competitive suppliers.
The aggregate amount of these decreases was partially offset by:
An increase of $8 million in deferred electricity expense primarily due to lower Default Electricity Supply rates, which resulted in a higher rate of recovery of Default Electricity Supply costs.
Gas Purchased
Gas Purchased consists of the cost of gas purchased by DPL to fulfill its obligation to regulated gas customers and, as such, is recoverable from customers in accordance with the terms of public service commission orders. It also includes the cost of gas purchased for off-system sales. Total Gas Purchased decreased by $9 million to $155 million in 2011 from $164 million in 2010 primarily due to:
A decrease of $16 million in the cost of gas purchases for on-system sales as a result of lower average gas prices, lower volumes purchased and lower withdraws from storage.
A decrease of $11 million from the settlement of financial hedges entered into as part of DPL’s hedge program for the purchase of regulated natural gas.
The aggregate amount of these decreases was partially offset by:
An increase of $18 million in deferred gas expense as a result of a higher rate of recovery of natural gas supply costs.
110
DPL
Other Operation and Maintenance
Other Operation and Maintenance decreased by $16 million to $239 million in 2011 from $255 million in 2010 primarily due to:
A decrease of $16 million resulting from adjustments recorded by DPL in 2011 associated with the accounting for DPL Default Electricity Supply. These adjustments were primarily due to the under-recognition of allowed returns on working capital, uncollectible, late fees and administrative costs.
A decrease of $4 million in environmental remediation costs.
A decrease of $2 million due to an adjustment of self-insurance reserves for general and auto liability claims recorded in 2011.
A decrease of $2 million due to an adjustment for February 2010 severe winter storm costs that previously were charged to other operation and maintenance expense. The adjustment was recorded in accordance with a MPSC rate order issued in July 2011, allowing for the recovery of the costs.
The aggregate amount of these decreases was partially offset by:
An increase of $5 million in emergency restoration costs. The increase is primarily related to significant incremental costs incurred for repair work following Hurricane Irene in August 2011. Costs incurred for repair work were $8 million, of which $5 million was deferred as a regulatory asset to reflect the probable recovery of these storm costs in certain jurisdictions, and the remaining $3 million was charged to other operation and maintenance expense. DPL currently plans to seek recovery of the incremental Hurricane Irene costs in each of its jurisdictions in planned distribution rate case filings.
An increase of $5 million associated with higher preventative maintenance and tree trimming costs.
Restructuring Charge
As a result of PHI’s organizational review in the second quarter of 2010, DPLs operating expenses include a pre-tax restructuring charge of $8 million for the year ended December 31, 2010, related to severance and health and welfare benefits to be provided to terminated employees.
Depreciation and Amortization
Depreciation and Amortization expense increased by $6 million to $89 million in 2011 from $83 million in 2010 primarily due to:
An increase of $4 million due to utility plant additions.
An increase of $1 million in amortization of regulatory assets primarily associated with the EmPower Maryland surcharge that became effective in March 2010 (which is substantially offset by a corresponding increase in Regulated T&D Electric Revenue).
111
DPL
Income Tax Expense
DPL’s effective tax rates for the years ended December 31, 2011 and 2010 were 37.2% and 40.8%, respectively. The decrease in the effective rate is primarily related to PHI’s 2011 settlement with the IRS regarding interest due on its federal tax liabilities related to the November 2010 audit settlement for the tax years 1996 to 2002. In connection with this agreement, PHI reallocated certain amounts that have been on deposit with the IRS since 2006 among liabilities in the settlement years and subsequent years. Primarily related to the settlement and reallocations, DPL recorded an additional $4 million (after-tax) interest benefit. This is partially offset by adjustments recorded in the third quarter of 2011 related to DPL’s settlement with the state taxing authorities resulting in $1 million (after-tax) of additional tax expense and the recalculation of interest on its uncertain tax positions for open tax years based on different assumptions related to the application of its deposit made with the IRS in 2006. This resulted in an additional tax expense of $1 million (after-tax).
In addition, the effective tax rate increased in 2010 as a result of the November 2010 settlement PHI reached with the IRS with respect to its Federal tax returns for the years 1996 to 2002. In connection with the settlement, PHI reallocated certain amounts on deposit with the IRS since 2006 among liabilities in the settlement years and subsequent years. In light of the settlement and reallocations, DPL recalculated the estimated interest due for the tax years 1996 to 2002. The revised estimate resulted in an additional $3 million (after-tax) of estimated interest due to the IRS. This expense was partially offset by the reversal of $2 million of previously recorded tax liabilities.
Capital Requirements
Sources of Capital
DPL has a range of capital sources available, in addition to internally generated funds, to meet its long-term and short-term funding needs. The sources of long-term funding include the issuance of mortgage bonds and other debt securities and bank financings, as well as the ability to issue preferred stock. Proceeds from long-term financings are used primarily to fund long-term capital requirements, such as capital expenditures, and to repay or refinance existing indebtedness. DPL traditionally has used a number of sources to fulfill short-term funding needs, including commercial paper, short-term notes, bank lines of credit, and borrowings under the PHI money pool. Proceeds from short-term borrowings are used primarily to meet working capital needs, but may also be used to temporarily fund long-term capital requirements. DPL’s ability to generate funds from its operations and to access the capital and credit markets is subject to risks and uncertainties. Volatile and deteriorating financial market conditions, diminished liquidity and tightening credit may affect access to certain of DPL’s potential funding sources. See “Risk Factors,” for additional discussion of important factors that may have an effect on DPL’s sources of capital.
Debt Securities
DPL has a Mortgage and Deed of Trust (the Mortgage) under which it issues First Mortgage Bonds. First Mortgage Bonds issued under the Mortgage are secured by a lien on substantially all of DPL’s property, plant and equipment. The principal amount of First Mortgage Bonds that DPL may issue under the Mortgage is limited by the principal amount of retired First Mortgage Bonds and 60% of the lesser of the cost or fair value of new property additions that have not been used as the basis for the issuance of additional First Mortgage Bonds. DPL also has an Indenture under which it issues unsecured senior notes, medium-term notes and VRDBs. To fund the construction of pollution control facilities, DPL also has from time to time issued tax-exempt bonds, including tax-exempt VRDBs, through a public agency, the proceeds of which are loaned to DPL by the agency.
112
DPL
Information concerning the principal amount and terms of DPL’s outstanding First Mortgage Bonds, senior notes, medium-term notes and VRDBs, and tax-exempt bonds issued for the benefit of DPL, as of December 31, 2011, is set forth in Note (11), “Debt,” to the financial statements of DPL.
Bank Financing
As further discussed in Note (11), “Debt,” to the financial statements of DPL, DPL is a borrower under a $1.5 billion credit facility, along with PHI, Pepco and ACE, which expires in 2016. DPL’s credit limit under the facility is the lesser of $250 million and the maximum amount of short-term debt DPL is permitted to have outstanding by its regulatory authorities. The short-term borrowing limit established by FERC for DPL is $500 million.
Commercial Paper Program
DPL maintains an ongoing commercial paper program of up to $500 million under which it can issue commercial paper with maturities of up to 270 days. The commercial paper is backed by DPL’s borrowing capacity under the $1.5 billion credit facility.
DPL had $47 million of commercial paper outstanding at December 31, 2011 and zero outstanding at December 31, 2010. The weighted average interest rates for commercial paper issued during 2011 and 2010 were 0.34%. The weighted average maturity of all commercial paper issued by DPL during 2011 and 2010 was two days.
Money Pool
DPL participates in the money pool operated by PHI under authorization received from FERC. The money pool is a cash management mechanism used by PHI and eligible subsidiaries to manage their short-term investment and borrowing requirements. PHI may invest in, but not borrow from, the money pool. Eligible subsidiaries with surplus cash may deposit those funds in the money pool. Deposits in the money pool are guaranteed by PHI. Eligible subsidiaries with cash requirements may borrow from the money pool. Borrowings from the money pool are unsecured. Depositors in the money pool receive, and borrowers from the money pool pay, an interest rate based primarily on PHI’s short-term borrowing rate. PHI deposits funds in the money pool to the extent that the pool has insufficient funds to meet the borrowing needs of its participants, which PHI may obtain from external sources.
Regulatory Restrictions on Financing Activities
DPL’s long-term financing activities (including the issuance of securities and the incurrence of debt) is subject to authorization by the DPSC and the MPSC. Through its periodic filings with the respective utility commissions, DPL generally maintains standing authority sufficient to cover its projected financing needs over a multi-year period. Under the FPA, FERC has jurisdiction over the issuance of long-term and short-term securities of public utilities, but only if the issuance is not regulated by the state public utility commission in which the public utility is organized and operating. DPL has obtained FERC authorization for the issuance of short-term debt under these provisions.
Capital Expenditures
DPL’s capital expenditures for the year ended December 31, 2011, totaled $229 million. These expenditures were primarily related to capital costs associated with new customer services, distribution reliability and transmission. The expenditures also include an allocation by PHI of hardware and software expenditures that primarily benefit Power Delivery and are allocated to DPL when the assets are placed in service.
113
DPL
The following table shows DPL’s projected capital expenditures for the five-year period 2012 through 2016. DPL expects to fund these expenditures through internally generated cash, external financing and capital contributions from PHI.
| For the Year |
| |||||||||||||||||||||||
| 2012 | 2013 | 2014 | 2015 | 2016 | Total | |||||||||||||||||||
| (millions of dollars) | ||||||||||||||||||||||||
DPL | ||||||||||||||||||||||||
Distribution | $ | 136 | $ | 153 | $ | 144 | $ | 144 | $ | 161 | $ | 738 | ||||||||||||
Distribution – Blueprint for the Future | 44 | 2 | — | — | — | 46 | ||||||||||||||||||
Transmission | 148 | 93 | 128 | 120 | 116 | 605 | ||||||||||||||||||
Transmission – MAPP | 4 | 1 | 1 | 3 | 58 | 67 | ||||||||||||||||||
Gas Delivery | 22 | 23 | 23 | 25 | 27 | 120 | ||||||||||||||||||
Other | 52 | 29 | 20 | 14 | 17 | 132 | ||||||||||||||||||
|
|
|
|
|
|
|
|
|
|
|
| |||||||||||||
Total DPL | $ | 406 | $ | 301 | $ | 316 | $ | 306 | $ | 379 | $ | 1,708 | ||||||||||||
|
|
|
|
|
|
|
|
|
|
|
| |||||||||||||
Transmission and Distribution
The projected capital expenditures listed in the table above for distribution (other than Blueprint for the Future), transmission (other than the MAPP project) and gas delivery are primarily for facility replacements and upgrades to accommodate customer growth and service reliability, including capital expenditures for reliability enhancement efforts.
Blueprint for the Future
DPL has undertaken programs to install smart meters, further automate its electric distribution systems and enhance its communications infrastructure, which it refers to as the Blueprint for the Future. For a discussion of the Blueprint for the Future initiative, see PHI’s “Management’s Discussion and Analysis of Financial Condition and Results of Operations – General Overview—Blueprint for the Future.” The projected capital expenditures over the next five years are shown as Distribution – Blueprint for the Future in the table above.
MAPP Project
PHI has under development the construction of a new 152-mile, interstate transmission line as part of PJM’s regional transmission expansion plan. The projected capital expenditures over the next five years for MAPP are shown as Transmission – MAPP in the table above.
MAPP/DOE Loan Program
To assist in the funding of the MAPP project, PHI has applied for a $684 million loan guarantee from the DOE for a substantial portion of the MAPP project, primarily the Calvert Cliffs to Indian River segment. The application has been made under a federal loan guarantee program for projects that employ innovative energy efficiency, renewable energy and advanced transmission and distribution technologies. If granted, PHI believes the guarantee could allow PHI to acquire financing at a lower cost than it would otherwise be able to obtain in the capital markets. Whether PHI’s application will be granted and, if so, the amount of debt guaranteed is subject to the discretion of the DOE and the negotiation of terms that will satisfy the conditions of the guarantee program. On February 28, 2011,
114
DPL
the DOE issued a Notice of Intent to prepare an Environmental Impact Statement to assist the DOE in assessing the environmental impact of constructing the portion of the MAPP project to be supported by the loan guarantee. Since February 2011, the DOE has conducted field inspections of the entire route and has held public meetings to obtain input from the communities along the route.
The DOE’s review of the loan guarantee program has delayed the DOE’s review of PHI’s loan guarantee application. There is not an approval deadline under the loan guarantee program, but this program could change or be terminated in the future. PHI continues to coordinate environmental activities with the DOE.
Pension and Other Postretirement Benefit Plans
DPL participates in pension and OPEB plans sponsored by PHI for its employees. DPL contributed $40 million and zero to the PHI Retirement Plan during 2011 and 2010, respectively.
On January 31, 2012, DPL made an $85 million discretionary tax-deductible contribution to the PHI Retirement Plan.
115
ACE
MANAGEMENT’S DISCUSSION AND ANALYSIS OF FINANCIAL CONDITION AND RESULTS OF OPERATIONS
PEPCO HOLDINGS, INC.
(1)ORGANIZATION
Pepco Holdings, Inc. (PHI or Pepco Holdings), a Delaware corporation incorporated in 2001, is a holding company that, through the following regulated public utility subsidiaries, is engaged primarily in the transmission, distribution, and default supply of electricity and, to a lesser extent, the distribution and supply of natural gas (Power Delivery):
Potomac Electric Power Company (Pepco), which was incorporated in Washington, D.C. in 1896 and became a domestic Virginia corporation in 1949,
Delmarva Power & Light Company (DPL), which was incorporated in Delaware in 1909 and became a domestic Virginia corporation in 1979, and
Atlantic City Electric Company (ACE), which was incorporated in New Jersey in 1924.
Each of Pepco, DPL and ACE is also a reporting company under the Securities Exchange Act of 1934, as amended. Together the three companies constitute a single segment for financial reporting purposes.
Through Pepco Energy Services, Inc. and its subsidiaries (collectively, Pepco Energy Services), PHI provides energy savings performance contracting services, primarily to commercial, industrial and government customers. Pepco Energy Services is in the process of winding down its competitive electricity and natural gas retail supply business. Pepco Energy Services constitutes a separate segment for financial reporting purposes.
PHI Service Company, a subsidiary service company of PHI, provides a variety of support services, including legal, accounting, treasury, tax, purchasing and information technology services to PHI and its operating subsidiaries. These services are provided pursuant to a service agreement among PHI, PHI Service Company, and the participating operating subsidiaries. The expenses of the PHI Service Company are charged to PHI and the participating operating subsidiaries in accordance with cost allocation methods set forth in the service agreement.
Power Delivery
Each of Pepco, DPL and ACE is a regulated public utility in the jurisdictions that comprise its service territory. Each company owns and operates a network of wires, substations and other equipment that is classified as transmission facilities, distribution facilities or common facilities (which are used for both transmission and distribution). Transmission facilities are high-voltage systems that carry wholesale electricity into, or across, the utility’s service territory. Distribution
Distribution facilities are low-voltage systems that carry electricity to end-use customers in the utility’s service territory.
Each company is responsible– Blueprint for the distribution of electricity and in the case of DPL natural gas, in its service territory,Future
Transmission
Transmission – MAPP
Gas Delivery
Other
Sub-Total
DOE Capital Reimbursement Awards (a)
Total for which it is paid tariff rates established by the applicable local public service commissions. Each company also supplies electricity at regulated rates to retail customers in its service territory who do not elect to purchase electricity from a competitive energy supplier. The regulatory term for this supply service is Standard Office Service in Delaware, the District of Columbia and Maryland, and Basic Generation Service (BGS) in New Jersey. In these Notes to the consolidated financial statements, these supply service obligations are referred to generally as Default Electricity Supply.Power Delivery
PEPCO HOLDINGS
Pepco Energy Services
The businessCorporate and Other
Total PHI
| (a) | Reflects remaining anticipated reimbursements pursuant to awards from the U.S. Department of Energy (DOE) under the |
79
PEPCO HOLDINGS
Transmission and Distribution
The projected capital expenditures listed in the table for distribution (other than Blueprint for the Future), transmission (other than the MAPP project) and gas delivery are primarily for facility replacements and upgrades to accommodate customer growth and service reliability, including capital expenditures for continuing reliability enhancement efforts. For a more detailed discussion of these efforts, see “General Overview—Reliability Enhancement and Emergency Restoration Improvement Plans.”
Infrastructure Investment Plan
In 2009, the NJBPU approved ACE’s proposed Infrastructure Investment Plan and the revenue requirement associated with recovering the cost of the related projects, subject to a prudency review in the next rate case. The approved projects were designed to enhance reliability of ACE’s distribution system and support economic activity and job growth in New Jersey in the near term. ACE was granted cost recovery through an Infrastructure Investment Surcharge, which became effective on June 1, 2009. This approved plan was completed in 2011 and has added incremental capital spending of approximately $28 million since 2009. In 2011, ACE proposed a new Infrastructure Investment Plan that if approved by the NJBPU, would be expected to add an additional $63 million of capital spending for 2012, which is included in Distribution in the table above.
Blueprint for the Future
Each of PHI’s utility subsidiaries have undertaken programs to install smart meters, further automate their electric distribution systems and enhance their communications infrastructure, which is referred to as the Blueprint for the Future. For a discussion of the Blueprint for the Future initiative, see “General Overview—Blueprint for the Future.” The projected capital expenditures over the next five years are shown as Distribution—Blueprint for the Future in the table above.
MAPP Project
PJM has approved the construction of a new 152-mile, interstate transmission line as part of PJM’s regional transmission expansion plan. In August 2011, PJM notified PHI that the scheduled in-service date for MAPP has been delayed from June 1, 2015 to the 2019 to 2021 time period. The projected capital expenditures over the next five years are shown as Transmission—MAPP in the table above.
MAPP/DOE Loan Program
To assist in the funding of the MAPP project, PHI has applied for a $684 million loan guarantee from the DOE for a substantial portion of the MAPP project, primarily the Calvert Cliffs to Indian River segment. The application has been made under a federal loan guarantee program for projects that employ innovative energy efficiency, renewable energy and advanced transmission and distribution technologies. If granted, PHI believes the guarantee could allow PHI to acquire financing at a
80
PEPCO HOLDINGS
lower cost than it would otherwise be able to obtain in the capital markets. Whether PHI’s application will be granted and, if so, the amount of debt guaranteed is subject to the discretion of the DOE and the negotiation of terms that will satisfy the conditions of the guarantee program. On February 28, 2011, the DOE issued a Notice of Intent to prepare an Environmental Impact Statement to assist the DOE in assessing the environmental impact of constructing the portion of the MAPP project to be supported by the loan guarantee. Since February 2011, the DOE has conducted field inspections of the entire route and has held public meetings to obtain input from the communities along the route.
The DOE’s review of the loan guarantee program has delayed the DOE’s review of PHI’s loan guarantee application. There is not an approval deadline under the loan guarantee program, but this program could change or be terminated in the future. PHI continues to coordinate environmental activities with the DOE.
DOE Capital Reimbursement Awards
In 2009, the DOE announced awards under the American Recovery and Reinvestment Act of 2009 of:
$105 million and $44 million in Pepco’s Maryland and District of Columbia service territories, respectively, for the implementation of an advanced metering infrastructure system, direct load control, distribution automation, and communications infrastructure.
$19 million to ACE for the implementation of direct load control, distribution automation, and communications infrastructure in its New Jersey service territory.
In April 2010, PHI and the DOE signed agreements formalizing the $168 million in awards. Of the $168 million, $130 million is expected to offset incurred and projected Blueprint for the Future and other capital expenditures of Pepco and ACE. The remaining $38 million will be used to offset incremental expenses associated with direct load control and other Pepco and ACE programs. In 2011, Pepco received award payments of $53 million and ACE received award payments of $6 million. In 2010, Pepco received award payments of $15 million and ACE received award payments of $2 million.
The IRS has announced that, to the extent these grants are expended on capital items, they will not be considered taxable income.
Dividends
Pepco Holdings’ annual dividend rate on its common stock is determined by the Board of Directors on a quarterly basis and takes into consideration, among other factors, current and possible future developments that may affect PHI’s income and cash flows. In 2011, PHI’s Board of Directors declared quarterly dividends of 27 cents per share of common stock payable on March 31, 2011, June 30, 2011, September 30, 2011 and December 31, 2011.
On January 26, 2012, the Board of Directors declared a dividend on common stock of 27 cents per share payable March 30, 2012, to shareholders of record on March 12, 2012.
PHI, on a stand-alone basis, generates no operating income of its own. Accordingly, its ability to pay dividends to its shareholders depends on dividends received from its subsidiaries. In addition to their future financial performance, the ability of each of PHI’s direct and indirect subsidiaries to pay dividends is subject to limits imposed by: (i) state corporate laws, which impose limitations on the funds that can be used to pay dividends and when such dividends can be paid, and, in the case of ACE, the regulatory requirement that it obtain the prior approval of the NJBPU before dividends can be paid if its equity as a percent of its total capitalization, excluding securitization debt, falls below 30%; (ii) the prior rights of holders of existing and future mortgage bonds and other long-term debt issued by the subsidiaries, and any preferred stock that may be issued by the subsidiaries in the future, (iii) any other restrictions imposed in connection with the incurrence of liabilities; and (iv) certain provisions of ACE’s charter that impose restrictions on payment of common stock dividends for the benefit of preferred stockholders. None of Pepco, DPL or ACE currently have shares of preferred stock outstanding. Currently, the capitalization ratio limitation to which ACE is subject and the restriction in the ACE charter do not limit ACE’s ability to pay common stock dividends. PHI had approximately $1,072 million and $1,059 million of retained earnings free of restrictions at December 31, 2011 and 2010, respectively. These amounts represent the total retained earnings balances at those dates.
81
PEPCO HOLDINGS
Contractual Obligations and Commercial Commitments
Summary information about Pepco Holdings’ consolidated contractual obligations and commercial commitments at December 31, 2011, is as follows:
| Contractual Maturity | ||||||||||||||||||||
Obligation | Total | Less than 1 Year | 1-3 Years | 3-5 Years | After 5 Years | |||||||||||||||
| (millions of dollars) | ||||||||||||||||||||
Variable Rate Demand Bonds | $ | 146 | $ | 146 | $ | — | $ | — | $ | — | ||||||||||
Commercial paper | 586 | 586 | — | — | — | |||||||||||||||
Long-term debt (a) | 4,211 | 111 | 892 | 747 | 2,461 | |||||||||||||||
Long-term project funding | 15 | 2 | 4 | 3 | 6 | |||||||||||||||
Interest payments on debt | 3,162 | 244 | 441 | 365 | 2,112 | |||||||||||||||
Capital leases | 121 | 15 | 30 | 30 | 46 | |||||||||||||||
Operating leases | 530 | 39 | 71 | 61 | 359 | |||||||||||||||
Estimated pension and OPEB plan contributions | 235 | 235 | — | — | — | |||||||||||||||
Non-derivative fuel and purchase power contracts (b) | 4,102 | 553 | 716 | 708 | 2,125 | |||||||||||||||
|
|
|
|
|
|
|
|
|
| |||||||||||
Total (c) | $ | 13,108 | $ | 1,931 | $ | 2,154 | $ | 1,914 | $ | 7,109 | ||||||||||
|
|
|
|
|
|
|
|
|
| |||||||||||
| (a) | Includes transition bonds issued by ACE Funding. |
| (b) | Excludes contracts for the |
| (c) | Excludes $180 million of
|
Third Party Guarantees, Indemnifications and Off-Balance Sheet Arrangements
PHI and certain of its subsidiaries have various financial and performance guarantees and indemnification obligations that they have entered into in the normal course of business to facilitate commercial transactions with third parties.
As of December 31, 2011, PHI and its subsidiaries were parties to a variety of agreements pursuant to which they were guarantors for standby letters of credit, energy procurement obligations, and other commitments and obligations. Such agreements include performance and payment guarantees of PHI aggregating $175 million related to Pepco Energy Services. For additional discussion of PHI’s third party guarantees, indemnifications, obligations and off-balance sheet arrangements, see Note (17), “Commitments and Contingencies,” to the consolidated financial statements of PHI.
82
PEPCO HOLDINGS
Energy Contract Activity
The following table provides detail on changes in the net asset or liability positions of the Pepco Energy Services segment with respect to energy commodity contracts for the year ended December 31, 2011. The balances in the table are pre-tax and the derivative assets and liabilities reflect netting by counterparty before the impact of collateral.
| Energy Commodity Activities (a) | ||||
| (millions of dollars) | ||||
Total Fair Value of Energy Contract Net Liabilities at December 31, 2010 | $ | (135 | ) | |
Current period unrealized losses | (30 | ) | ||
Effective portion of changes in fair value—recorded in Accumulated Other Comprehensive Loss | — | |||
Cash flow hedge ineffectiveness—recorded in income | (1 | ) | ||
Reclassification to realized on settlement of contracts | 83 | |||
|
| |||
Total Fair Value of Energy Contract Net Liabilities at December 31, 2011 | $ | (83 | ) | |
|
| |||
Detail of Fair Value of Energy Contract Net Liabilities at December 31, 2011 (see above) | ||||
Derivative liabilities (current liabilities) | $ | (81 | ) | |
Derivative liabilities (non-current liabilities) | (2 | ) | ||
|
| |||
Total Fair Value of Energy Contract Liabilities | (83 | ) | ||
|
| |||
Total Fair Value of Energy Contract Net Liabilities | $ | (83 | ) | |
|
| |||
(a) Includes all effective hedging activities from continuing operations recorded at fair value through Accumulated Other Comprehensive Loss (AOCL) or trading activities from continuing operations recorded at fair value in the consolidated statements of income. |
| |||
The $83 million net liability on energy contracts at December 31, 2011 was primarily attributable to losses on power swaps and natural gas futures held by Pepco Energy Services. Pepco Energy Services’ net liability decreased to $83 million at December 31, 2011 from $135 million at December 31, 2010 primarily due to settlements of the derivatives. PHI expects that future revenues from existing customer sales obligations that are accounted for on an accrual basis will largely offset expected realized net losses on Pepco Energy Services’ energy contracts.
83
PEPCO HOLDINGS
PHI uses its best estimates to determine the fair value of the commodity derivative contracts that are entered into by Pepco Energy Services. The fair values in each category presented below reflect forward prices and volatility factors as of December 31, 2011, and the fair values are subject to change as a result of changes in these prices and factors. As of December 31, 2011, all of these contracts were held by Pepco Energy Services.
| Fair Value of Contracts at December 31, 2011 Maturities | ||||||||||||||||||||
Source of Fair Value | 2012 | 2013 | 2014 | 2015 and Beyond | Total Fair Value | |||||||||||||||
| (millions of dollars) | ||||||||||||||||||||
Energy Commodity Activities, net (a) | ||||||||||||||||||||
Actively Quoted (i.e., exchange-traded) prices | $ | (37 | ) | $ | (9 | ) | $ | (2 | ) | $ | — | $ | (48 | ) | ||||||
Prices provided by other external sources (b) | (26 | ) | (7 | ) | — | — | (33 | ) | ||||||||||||
Modeled (c) | (2 | ) | — | — | — | (2 | ) | |||||||||||||
|
|
|
|
|
|
|
|
|
| |||||||||||
Total | $ | (65 | ) | $ | (16 | ) | $ | (2 | ) | $ | — | $ | (83 | ) | ||||||
|
|
|
|
|
|
|
|
|
| |||||||||||
Consolidation of Variable Interest Entities
In accordance with FASB guidance
| (a) | Includes all effective hedging activities recorded at fair value through AOCL, and hedge ineffectiveness and trading activities on the |
| (b) | Prices provided by other external sources reflect information obtained from over-the-counter brokers, industry services, or
|
| (c) | Modeled values include significant inputs, usually representing more than 10% of the |
Contractual Arrangements with Credit Rating Triggers or Margining Rights
Under certain contractual arrangements entered into by PHI’s subsidiaries, the subsidiary may be required to provide cash collateral or letters of credit as security for its contractual obligations if the credit ratings of PHI or the subsidiary are downgraded. In the event of a downgrade, the amount required to be posted would depend on the amount of the underlying contractual obligation existing at the time of the downgrade. Based on contractual provisions in effect at December 31, 2011, a downgrade in the unsecured debt credit ratings of PHI or each of its rated subsidiaries to below “investment grade” would increase the collateral obligation of PHI and its subsidiaries by up to $233 million, none of which is related to the discontinued operations of Conectiv Energy, and $124 million of which is the net settlement amount attributable to derivatives, normal purchase and normal sale contracts, collateral, and other contracts under master netting agreements as described in Note (15), “Derivative Instruments and Hedging Activities,” to the consolidated financial statements of PHI. The remaining $109 million of the collateral obligation that would be incurred in the event PHI were downgraded to below “investment grade” is attributable primarily to energy services contracts and accounts payable to independent system operators and distribution companies on full requirements contracts entered into by Pepco Energy Services. PHI believes that it and its subsidiaries currently have sufficient liquidity to fund their operations and meet their financial obligations.
Many of the contractual arrangements entered into by PHI’s subsidiaries in connection with competitive energy and Default Electricity Supply activities include margining rights pursuant to which the PHI subsidiary or a counterparty may request collateral if the market value of the contractual obligations reaches levels in excess of the credit thresholds established in the applicable arrangements. Pursuant to these margining rights, the affected PHI subsidiary may receive, or be required to post, collateral due to energy price movements. As of December 31, 2011, Pepco Energy Services provided net cash collateral in the amount of $112 million in connection with these activities.
84
PEPCO HOLDINGS
Environmental Remediation Obligations
PHI’s accrued liabilities for environmental remediation obligations as of December 31, 2011 totaled $30 million, of which approximately $6 million is expected to be incurred in 2012, for potential environmental cleanup and related costs at sites owned or formerly owned by an operating subsidiary where an operating subsidiary is a potentially responsible party or is alleged to be a third-party contributor. For further information concerning the remediation obligations associated with these sites, see Note (17), “Commitments and Contingencies,” to the consolidated financial statements of PHI. For information regarding projected expenditures for environmental control facilities, see “Business—Environmental Matters.” The most significant environmental remediation obligations as of December 31, 2011, are for the following items:
Environmental investigation and remediation costs payable by Pepco with respect to the Benning Road site.
Amounts payable by DPL in accordance with a 2001 consent agreement reached with the Delaware Department of Natural Resources and Environmental Control, for remediation, site restoration, natural resource damage compensatory projects and other costs associated with environmental contamination that resulted from an oil release at the Indian River power plant, which DPL sold in June 2001.
Potential compliance remediation costs under New Jersey’s Industrial Site Recovery Act payable by PHI associated with the retained environmental exposure from the sale of the Conectiv Energy wholesale power generation business.
Amounts payable by DPL in connection with the Wilmington Coal Gas South site located in Wilmington, Delaware, to remediate residual material from the historical operation of a manufactured gas plant.
Sources of Capital
Pepco Holdings’ sources to meet its long-term funding needs, such as capital expenditures, dividends, and new investments, and its short-term funding needs, such as working capital and the temporary funding of long-term funding needs, include internally generated funds, issuances by PHI, Pepco, DPL and ACE under their commercial paper programs, securities issuances, short-term loans, and bank financing under new or existing facilities. PHI’s ability to generate funds from its operations and to access capital and credit markets is subject to risks and uncertainties. Volatile and deteriorating financial market conditions, diminished liquidity and tightening credit may affect access to certain of PHI’s potential funding sources. See “Risk Factors,” for additional discussion of important factors that may impact these sources of capital.
Cash Flow from Operations
Cash flow generated by regulated utility subsidiaries in Power Delivery is the primary source of PHI’s cash flow from operations. Additional cash flows are generated by the business of Pepco Energy Services and from the occasional sale of non-core assets.
Short-Term Funding Sources
Pepco Holdings and its regulated utility subsidiaries have traditionally used a number of sources to fulfill short-term funding needs, such as commercial paper, short-term notes and bank lines of credit. Proceeds from short-term borrowings are used primarily to meet working capital needs but may also be used to temporarily fund long-term capital requirements.
85
PEPCO HOLDINGS
As of December 31, 2011, Pepco Holdings, Pepco, DPL and ACE each maintains an ongoing commercial paper program pursuant to which each entity has the ability to issue up to $875 million, $500 million, $500 million and $250 million, respectively, of commercial paper. In January 2012, the PHI Board of Directors approved an increase in the maximum amount of commercial paper that PHI is authorized to issue under its commercial paper program to $1.25 billion. The commercial paper can be issued with maturities of up to 270 days.
Long-Term Funding Sources
The sources of long-term funding for PHI and its subsidiaries are the issuance of debt and equity securities and borrowing under long-term credit agreements. Proceeds from long-term financings are used primarily to fund long-term capital requirements, such as capital expenditures and new investments, and to repay or refinance existing indebtedness.
Regulatory Restrictions on Financing Activities
The issuance of debt securities by PHI’s principal subsidiaries requires the approval of either FERC or one or more state public utility commissions. Neither FERC approval nor state public utility commission approval is required as a condition to the issuance of securities by PHI.
State Financing Authority
Pepco’s long-term financing activities (including the issuance of securities and the incurrence of debt) are subject to authorization by the DCPSC and MPSC. DPL’s long-term financing activities are subject to authorization by the MPSC and the DPSC. ACE’s long-term and short-term (consisting of debt instruments with a maturity of one year or less) financing activities are subject to authorization by the NJBPU. Each utility, through periodic filings with the state public service commission(s) having jurisdiction over its financing activities, has maintained standing authority sufficient to cover its projected financing needs over a multi-year period.
FERC Financing Authority
Under the Federal Power Act (FPA), FERC has jurisdiction over the issuance of long-term and short-term securities of public utilities, but only if the issuance is not regulated by the state public utility commission in which the public utility is organized and operating. Under these provisions, FERC has jurisdiction over the issuance of short-term debt by Pepco and DPL. Pepco and DPL have obtained FERC authority for the issuance of short-term debt. Because Pepco Energy Services also qualifies as a public utility under the FPA and is not regulated by a state utility commission, FERC also has jurisdiction over the issuance of securities by Pepco Energy Services. Pepco Energy Services has obtained the requisite FERC financing authority in its market-based rate orders.
Money Pool
Pepco Holdings operates a system money pool under a blanket authorization adopted by FERC. The money pool is a cash management mechanism used by Pepco Holdings to manage the short-term investment and borrowing requirements of its subsidiaries that participate in the money pool. Pepco Holdings may invest in but not borrow from the money pool. Eligible subsidiaries with surplus cash may deposit those funds in the money pool. Deposits in the money pool are guaranteed by Pepco Holdings. Eligible subsidiaries with cash requirements may borrow from the money pool. Borrowings from the money pool are unsecured. Depositors in the money pool receive, and borrowers from the money pool pay, an interest rate based primarily on Pepco Holdings’ short-term borrowing rate. Pepco Holdings deposits funds in the money pool to the extent that the pool has insufficient funds to meet the borrowing needs of its participants, which may require Pepco Holdings to borrow funds for deposit from external sources.
86
PEPCO HOLDINGS
Regulatory And Other Matters
Rate Proceedings
Distribution
The rates that each of Pepco, DPL and ACE is permitted to charge for the retail distribution of electricity and natural gas to its various classes of customers are based on the principle that the utility is entitled to generate an amount of revenue sufficient to recover the cost of providing the service, including a reasonable rate of return on its invested capital. These “base rates” are intended to cover all of each utility’s reasonable and prudent expenses of constructing, operating and maintaining its distribution facilities (other than costs covered by specific cost-recovery surcharges).
A change in base rates in a jurisdiction requires the approval of public service commission. In the rate application submitted to the public service commission, the utility specifies an increase in its “revenue requirement,” which is the additional revenue that the utility is seeking authorization to earn. The “revenue requirement” consists of (i) the allowable expenses incurred by the utility, including operation and maintenance expenses, taxes and depreciation, and (ii) the utility’s cost of capital. The compensation of the utility for its cost of capital takes the form of an overall “rate of return” allowed by the public service commission on the utility’s distribution “rate base” to compensate the utility’s investors for their debt and equity investments in the company. The rate base is the aggregate value of the investment in property used by the utility in providing electricity and natural gas distribution services and generally consists of plant in service net of accumulated depreciation and accumulated deferred taxes, plus cash working capital, material and operating supplies and, depending on the jurisdiction, construction work in progress. Over time, the rate base is increased by utility property additions and reduced by depreciation and property retirements and write-offs.
In addition to its base rates, some of the costs of providing distribution service are recovered through the operation of surcharges. Examples of costs recovered by PHI’s utility subsidiaries through surcharges, which vary depending on the jurisdiction, include: a surcharge to reimburse the utility for the cost of purchasing electricity from NUGs (New Jersey); surcharges to reimburse the utility for costs of public interest programs for low income customers (New Jersey, Maryland, Delaware and the District of Columbia); a surcharge to pay the Transitional Bond Charge (New Jersey); and surcharges to reimburse the utility for certain environmental costs (Delaware and Maryland).
Each utility subsidiary regularly reviews its distribution rates in each jurisdiction of its service territory, and from time to time files applications to adjust its rates as necessary in an effort to ensure that its revenues are sufficient to cover its operating expenses and its cost of capital. The timing of future rate filings and the change in the distribution rate requested will depend on a number of factors, including changes in revenues and expenses and the incurrence or the planned incurrence of capital expenditures. In the third quarter of 2011, Pepco filed an electric distribution base rate increase application in the District of Columbia and ACE filed an electric distribution base rate increase application in New Jersey. In the fourth quarter of 2011, DPL filed an electric distribution base rate increase application in Delaware and Maryland. Also in the fourth quarter of 2011, Pepco filed an electric distribution base rate increase application in Maryland. DPL currently expects to file a natural gas distribution base rate increase application in early 2013.
In general, a request for new distribution rates is made on the basis of “test year” balances for rate base allowable operating expenses and a requested rate of return. The test year amounts used in the filing may be historical or partially projected. The public service commission may, however, select a different test period than that proposed by the company. Although the approved tariff rates are intended to be forward-looking, and therefore provide for the recovery of some future changes in rate base and operating costs, they typically do not reflect all of the changes in costs for the period in which the new rates are in effect.
87
PEPCO HOLDINGS
If revenues do not keep pace with increases in costs, this situation will result in a lag between when the costs are incurred and when the utility can begin to recover those costs through its rates.
The following table shows, for each of the PHI utility subsidiaries, the authorized return on equity as determined in the most recently concluded base rate proceeding and the date as of which the rate as determined in the proceeding was implemented:
Rate Base (In millions) | Authorized Return on Equity | Rate Effective Date | ||
Pepco: | ||||
District of Columbia (electricity) | 9.625% | March 2010 | ||
Maryland (electricity) | 9.83% | August 2010 | ||
DPL: | ||||
Delaware (electricity) | 10.00% | April 2010 | ||
Maryland (electricity) | Not specified(a) | July 2011 | ||
Delaware (natural gas) | 10.00% | February 2011 | ||
ACE: | ||||
New Jersey (electricity) | 10.30% | June 2010 | ||
(a) Cost of equity at 10% for purposes of calculating allowance for funds used during construction and regulatory asset carrying costs. | ||||
Transmission
The rates Pepco, DPL and ACE are permitted to charge for the transmission of electricity are regulated by FERC and are based on each utility’s transmission rate base, transmission operating expenses and an overall rate of return that is approved by FERC. For each utility subsidiary, FERC has approved a formula for the calculation of the utility transmission rate, which is referred to as a “formula rate.” The formula rates include both fixed and variable elements. Certain of the fixed elements, such as the return on equity and depreciation rates, can be changed only in a FERC rate proceeding. The variable elements of the formula, including the utility’s rate base and operating expenses, are updated annually, effective June 1 of each year, with data from the utility’s most recent annual FERC Form 1 filing.
In addition to its formula rate, each utility’s return on equity is supplemented by incentive rates, sometimes referred to as “adders,” and other incentives, which are authorized by FERC to promote capital investment in transmission infrastructure. In connection with the MAPP project, FERC has authorized for each of Pepco and DPL a 150 basis point adder to its return on equity, resulting in a FERC-approved rate of return on the MAPP project of 12.8%, along with full recovery of construction work in progress and prudently incurred abandoned plant costs. Additional return on equity adders are in effect for each of Pepco, DPL and ACE relating to specific transmission upgrades and improvements, as well as in consideration for each utility’s continued membership in PJM. As members of PJM, the transmission rates of Pepco, DPL and ACE are set out in PJM’s Open Access Transmission Tariff.
For a discussion of pending state public utility commission and FERC rate proceedings, see Note (7), “Regulatory Matters,” to the consolidated financial statements of PHI.
88
PEPCO HOLDINGS
Legal Proceedings and Regulatory Matters
For a discussion of legal proceedings, see Note (17), “Commitments and Contingencies,” to the consolidated financial statements of PHI, and for a discussion of regulatory matters, see Note (7), “Regulatory Matters,” to the consolidated financial statements of PHI.
Critical Accounting Policies
General
PHI has identified the following accounting policies that result in having to make certain estimates that, as a result of the judgments, uncertainties, uniqueness and complexities of the underlying accounting standards and operations involved, could result in material changes in its financial condition or results of operations under different conditions or using different assumptions. PHI has discussed the development, selection and disclosure of each of these policies with the Audit Committee of the Board of Directors.
Goodwill Impairment Evaluation
Substantially all of PHI’s goodwill was generated by Pepco’s acquisition of Conectiv in 2002 and is allocated entirely to the Power Delivery reporting unit for purposes of assessing impairment under FASB guidance on goodwill and other intangibles (ASC 350). Management has identified Power Delivery as a single reporting unit because its components have similar economic characteristics, similar products and services and operate in a similar regulatory environment.
PHI tests its goodwill impairment at least annually as of November 1 and on an interim basis if an event occurs or circumstances change that would more likely than not reduce the fair value of a reporting unit below its carrying amount. Factors that may result in an interim impairment test include, but are not limited to: a change in identified reporting units; an adverse change in business conditions; a protracted decline in stock price causing market capitalization to fall below book value; an adverse regulatory action; or impairment of long-lived assets in the reporting unit.
The first step of the goodwill impairment test compares the fair value of the reporting unit with its carrying amount, including goodwill. Management uses its best judgment to make reasonable projections of future cash flows for Power Delivery when estimating the reporting unit’s fair value. In addition, PHI selects a discount rate for the associated risk with those estimated cash flows. These judgments are inherently uncertain, and actual results could vary from those used in PHI’s estimates. The impact of such variations could significantly alter the results of a goodwill impairment test, which could materially impact the estimated fair value of Power Delivery and potentially the amount of any impairment recorded in the financial statements.
PHI’s November 1, 2011 annual impairment test indicated that its goodwill was not impaired. See Note (6), “Goodwill,” to the consolidated financial statements of PHI.
In order to estimate the fair value of the Power Delivery reporting unit, PHI uses two valuation techniques: an income approach and a market approach. The income approach estimates fair value based on a discounted cash flow analysis using estimated future cash flows and a terminal value that is consistent with Power Delivery’s long-term view of the business. This approach uses a discount rate based on the estimated weighted average cost of capital (WACC) for the reporting unit. PHI determines the estimated WACC by considering market-based information for the cost of equity and cost of debt that is appropriate for Power Delivery as of the measurement date. The market approach estimates fair value based on a multiple of earnings before interest, taxes, depreciation, and amortization (EBITDA) that management believes is consistent with EBITDA multiples for comparable utilities. PHI has consistently used this valuation framework to estimate the fair value of Power Delivery.
89
PEPCO HOLDINGS
The estimation of fair value is dependent on a number of factors that are sourced from the Power Delivery reporting unit’s business forecast, including but not limited to interest rates, growth assumptions, returns on rate base, operating and capital expenditure requirements, and other factors, changes in which could materially impact the results of impairment testing. Assumptions and methodologies used in the models were consistent with historical experience. A hypothetical 10 percent decrease in fair value of the Power Delivery reporting unit at November 1, 2011 would not have resulted in the Power Delivery reporting unit failing the first step of the impairment test, as defined in the guidance, as the estimated fair value of the reporting unit would have been above its carrying value. Sensitive, interrelated and uncertain variables that could decrease the estimated fair value of the Power Delivery reporting unit include utility sector market performance, sustained adverse business conditions, change in forecasted revenues, higher operating and maintenance capital expenditure requirements, a significant increase in the cost of capital, and other factors.
PHI believes that the estimates involved in its goodwill impairment evaluation process represent “Critical Accounting Estimates” because they are subjective and susceptible to change from period to period as management makes assumptions and judgments, and the impact of a change in assumptions and estimates could be material to financial results.
Long-Lived Assets Impairment Evaluation
PHI believes that the estimates involved in its long-lived asset impairment evaluation process represent “Critical Accounting Estimates” because (i) they are highly susceptible to change from period to period because management is required to make assumptions and judgments about when events indicate the carrying value may not be recoverable and how to estimate undiscounted and discounted future cash flows and fair values, which are inherently uncertain, (ii) actual results could vary from those used in PHI’s estimates and the impact of such variations could be material, and (iii) the impact that recognizing an impairment would have on PHI’s assets as well as the net loss related to an impairment charge could be material. The primary assets subject to a long-lived asset impairment evaluation are property, plant, and equipment.
The FASB guidance on the accounting for the impairment or disposal of long-lived assets (ASC 360), requires that certain long-lived assets must be tested for recoverability whenever events or circumstances indicate that the carrying amount may not be recoverable, such as (i) a significant decrease in the market price of a long-lived asset or asset group, (ii) a significant adverse change in the extent or manner in which a long-lived asset or asset group is being used or in its physical condition, (iii) a significant adverse change in legal factors or in the business climate, including an adverse action or assessment by a regulator, (iv) an accumulation of costs significantly in excess of the amount originally expected for the acquisition or construction of a long-lived asset or asset group, (v) a current-period operating or cash flow loss combined with a history of operating or cash flow losses or a projection or forecast that demonstrates continuing losses associated with the use of a long-lived asset or asset group, and (vi) a current expectation that, more likely than not, a long-lived asset or asset group will be sold or otherwise disposed of significantly before the end of its previously estimated useful life.
An impairment loss may only be recognized if the carrying amount of an asset is not recoverable and the carrying amount exceeds its fair value. The asset is deemed not to be recoverable when its carrying amount exceeds the sum of the undiscounted future cash flows expected to result from the use and eventual disposition of the asset. In order to estimate an asset’s future cash flows, PHI considers historical cash flows. PHI uses its best estimates in making these evaluations and considers various factors, including forward price curves for energy, fuel costs, legislative initiatives, and operating costs. If necessary, the process of determining fair value is performed consistently with the process described in assessing the fair value of goodwill discussed above.
90
PEPCO HOLDINGS
Accounting for Derivatives
PHI believes that the estimates involved in accounting for its derivative instruments represent “Critical Accounting Estimates” because management exercises judgment in the following areas, any of which could have a material impact on its financial statements: (i) the application of the definition of a derivative to contracts to identify derivatives, (ii) the election of the normal purchases and normal sales exception from derivative accounting, (iii) the application of cash flow hedge accounting, and (iv) the estimation of fair value used in the measurement of derivatives and hedged items, which are highly susceptible to changes in value over time due to market trends or, in certain circumstances, significant uncertainties in modeling techniques used to measure fair value that could result in actual results being materially different from PHI’s estimates. See Note (2), “Significant Accounting Policies—Accounting for Derivatives,” and Note (15), “Derivative Instruments and Hedging Activities,” to the consolidated financial statements of PHI.
PHI and its subsidiaries use derivative instruments primarily to manage risk associated with commodity prices. The definition of a derivative in the FASB guidance results in management having to exercise judgment, such as whether there is a notional amount or net settlement provision in contracts. Management assesses a number of factors before determining whether it can designate derivatives for the normal purchase or normal sale exception from derivative accounting, including whether it is probable that the contracts will physically settle with delivery of the underlying commodity. The application of cash flow hedge accounting often requires judgment in the prospective and retrospective assessment and measurement of hedge effectiveness as well as whether it is probable that the forecasted transaction will occur. The fair value of derivatives is determined using quoted exchange prices where available. For instruments that are not traded on an exchange, external broker quotes are used to determine fair value. For some custom and complex instruments, internal models use market information when external broker quotes are not available. For certain long-dated instruments, broker or exchange data is extrapolated for future periods where information is limited. Models are also used to estimate volumes for certain transactions. The same valuation methods are used for risk management purposes to determine the value of non-derivative, commodity exposure.
Pension and Other Postretirement Benefit Plans
PHI believes that the estimates involved in reporting the costs of providing pension and OPEB benefits represent Critical Accounting Estimates because (i) they are based on an actuarial calculation that includes a number of assumptions which are subjective in nature, (ii) they are dependent on numerous factors resulting from actual plan experience and assumptions of future experience, and (iii) changes in assumptions could impact PHI’s expected future cash funding requirements for the plans and would have an impact on the projected benefit obligations, which affect the reported amount of annual net periodic pension and OPEB cost on the income statement.
Assumptions about the future, including the discount rate applied to benefit obligations, the expected long-term rate of return on plan assets, the anticipated rate of increase in health care costs and participant compensation have a significant impact on employee benefit costs.
The discount rate for determining the pension benefit obligation was 5.00% and 5.65% as of December 31, 2011 and 2010, respectively. The discount rate for determining the postretirement benefit obligation was 4.90% and 5.60% as of December 31, 2011 and 2010, respectively. PHI utilizes an analytical tool developed by its actuaries to select the discount rate. The analytical tool utilizes a high-quality bond portfolio with cash flows that match the benefit payments expected to be made under the plans.
The expected long-term rate of return on plan assets was 7.75% and 8.00% as of December 31, 2011 and 2010, respectively. PHI uses a building block approach to estimate the expected rate of return on plan assets. Under this approach, the percentage of plan assets in each asset class according to PHI’s target asset allocation, at the beginning of the year, is applied to the expected asset return for the related asset class. PHI incorporates long-term assumptions for real returns, inflation expectations, volatility, and correlations among asset classes to determine expected returns for the related asset class. The plan assets consist of equity, fixed income, real estate and private equity investments. The plan assets are expected to yield a return on assets of 7.75% as of December 31, 2011 when viewed over a long-term horizon.
91
PEPCO HOLDINGS
The following table reflects the effect on the projected benefit obligation for the pension plan and the accumulated benefit obligation for the OPEB plan, as well as the net periodic cost for both plans, if there were changes in these critical actuarial assumptions while holding all other actuarial assumptions constant:
(in millions, except percentages) | Change in Assumptions | Impact on Benefit Obligation | Projected Increase in 2011 Net Periodic Cost | |||||||||
Pension Plan | ||||||||||||
Discount rate | (0.25 | )% | $ | 61 | $ | 5 | ||||||
Expected return | (0.25 | )% | — | (a) | 5 | |||||||
Postretirement Benefit Plan | ||||||||||||
Discount rate | (0.25 | )% | $ | 20 | $ | 1 | ||||||
Expected return | (0.25 | )% | — | (a) | 1 | |||||||
Health care cost trend rate | 1.00 | % | 32 | 2 | ||||||||
(a) A change in the expected return assumption has no impact on the Projected Benefit Obligation. |
| |||||||||||
The impact of changes in assumptions and the difference between actual and expected or estimated results on pension and postretirement obligations is generally recognized over the working lives of the employees who benefit under the plans rather than immediate recognition in the statements of income.
For additional discussion, see Note (10), “Pension and Other Postretirement Benefits,” to the consolidated financial statements of PHI.
Accounting for Regulated Activities
FASB guidance on the accounting for regulated activities, Regulated Operations (ASC 980), applies to Power Delivery and can result in the deferral of costs or revenue that would otherwise be recognized by non-regulated entities. PHI defers the recognition of costs and records regulatory assets when it is probable that those costs will be recovered in future customer rates. PHI defers the recognition of revenues and records regulatory liabilities when it is probable that it will refund payments received from customers in the future or that it will incur future costs related to the payments currently received from customers. PHI believes that the judgments involved in accounting for its regulated activities represent “Critical Accounting Estimates” because (i) management must interpret laws and regulatory commission orders to assess the probability of the recovery of costs in customer rates or the return of revenues to customers when determining whether those costs or revenues should be deferred, (ii) decisions made by regulatory commissions or legislative changes at a later date could vary from earlier interpretations made by management and the impact of such variations could be material, and (iii) the elimination of a regulatory asset because deferred costs are no longer probable of recovery in future customer rates could have a material negative impact on PHI’s assets and earnings.
Management’s most significant judgment is whether to defer costs or revenues when there is not a current regulatory order specific to the item being considered for deferral. In those cases, management considers relevant historical precedents of the regulatory commissions, the results of recent rate orders, and any new information from its more current interactions with the regulatory commissions on that item. Management regularly evaluates whether it should defer costs or revenues and reviews whether adjustments to its previous conclusions regarding its regulatory assets and liabilities are necessary based on the current regulatory and legislative environment as well as recent rate orders.
92
PEPCO HOLDINGS
For additional discussion, see Note (7), “Regulatory Matters,” to the consolidated financial statements of PHI.
Unbilled Revenue
Unbilled revenue represents an estimate of revenue earned from services rendered by PHI’s utility operations that have not yet been billed. PHI’s utility operations calculate unbilled revenue using an output-based methodology. The calculation is based on the supply of electricity or natural gas distributed to customers but not yet billed, adjusted for estimated line losses (estimates of electricity and gas expected to be lost in the process of a utility’s transmission and distribution to customers).
PHI estimates involved in its unbilled revenue process represent “Critical Accounting Estimates” because management is required to make assumptions and judgments about input factors to the unbilled revenue calculation. Specifically, the determination of estimated line losses is inherently uncertain. Estimated line losses is defined as the estimates of electricity and natural gas expected to be lost in the process of its transmission and distribution to customers. A change in estimated line losses can change the output available for sale which is a factor in the unbilled revenue calculation. Certain factors can influence the estimated line losses such as weather and a change in customer mix. These factors may vary between companies due to geography and density of service territory, and the impact of changes in these factors could be material. PHI seeks to reduce the risk of an inaccurate estimate of unbilled revenue through corroboration of the estimate with historical information and other metrics.
Accounting for Income Taxes
PHI exercises significant judgment about the outcome of income tax matters in its application of the FASB guidance on accounting for income taxes and believes it represents a “Critical Accounting Estimate” because: (i) it records a current tax liability for estimated current tax expense on its federal and state tax returns; (ii) it records deferred tax assets for temporary differences between the financial statement and tax return determination of pre-tax income and the carrying amount of assets and liabilities that are more likely than not going to result in tax deductions in future years; (iii) it determines whether a valuation allowance is needed against deferred tax assets if it is more likely than not that some portion of the future tax deductions will not be realized; (iv) it records deferred tax liabilities for temporary differences between the financial statement and tax return determination of pre-tax income and the carrying amount of assets and liabilities if it is more likely than not that they are expected to result in tax payments in future years; (v) the measurement of deferred tax assets and deferred tax liabilities requires it to estimate future effective tax rates and future taxable income on its federal and state tax returns; (vi) it asserts that foreign earnings will continue to be indefinitely reinvested abroad; (vii) it must consider the effect of newly enacted tax law on its estimated effective tax rate and in measuring deferred tax balances; and (viii) it asserts that tax positions in its tax returns or expected to be taken in its tax returns are more likely than not to be sustained assuming that the tax positions will be examined by taxing authorities with full knowledge of all relevant information prior to recording the related tax benefit in the financial statements.
Assumptions, judgment and the use of estimates are required in determining if the “more likely than not” standard (that is, the cumulative result for a greater than 50% chance of being realized) has been met when developing the provision for current and deferred income taxes and the associated current and deferred tax assets and liabilities. PHI’s assumptions, judgments and estimates take into account current tax laws and regulations, interpretation of current tax laws and regulations, the impact of newly enacted tax laws and regulations, developments in case law, settlements of tax positions, and the possible outcomes of current and future investigations conducted by tax authorities. PHI has established reserves for income taxes to address potential exposures involving tax positions that could be challenged by tax authorities. Although PHI believes that these assumptions, judgments and estimates are reasonable, changes in tax laws and regulations or its interpretation of tax laws and regulations as well as the resolutions of the current and any future investigations or legal proceedings could significantly impact the financial results from applying the accounting for income taxes in the consolidated financial statements. PHI reviews its application of the “more likely than not” standard quarterly.
93
PEPCO HOLDINGS
PHI also evaluates quarterly the probability of realizing deferred tax assets by reviewing a forecast of future taxable income and tax planning strategies that can be implemented, if necessary, to realize deferred tax assets. Failure to achieve forecasted taxable income or successfully implement tax planning strategies may affect the realization of deferred tax assets and the amount of any associated valuation allowance. The forecast of future taxable income is dependent on a number of factors that can change over time, including growth assumptions, business conditions, returns on rate base, operating and capital expenditures, cost of capital, tax laws and regulations, the legal structure of entities and other factors, which could materially impact the realizability of deferred tax assets and the associated financial results in the consolidated financial statements.
New Accounting Standards and Pronouncements
For information concerning new accounting standards and pronouncements that have recently been adopted by PHI and its subsidiaries or that one or more of the companies will be required to adopt on or before a specified date in the future, see Note (3), “Newly Adopted Accounting Standards,” and Note (4), “Recently Issued Accounting Standards, Not Yet Adopted,” to the consolidated financial statements of PHI.
94
PEPCO
MANAGEMENT’S DISCUSSION AND ANALYSIS OF FINANCIAL CONDITION AND RESULTS OF OPERATIONS
Potomac Electric Power Company
Pepco meets the conditions set forth in General Instruction I(1)(a) and (b) to Form 10-K, and accordingly information otherwise required under this Item has been omitted in accordance with General Instruction I(2)(a) to Form 10-K.
General Overview
Pepco is engaged in the transmission and distribution of electricity in the District of Columbia and major portions of Montgomery County and Prince George’s County in suburban Maryland. Pepco also provides Default Electricity Supply, which is the supply of electricity at regulated rates to retail customers in its service territories who do not elect to purchase electricity from a competitive energy supplier. Default Electricity Supply is known as SOS in both the District of Columbia and Maryland. Pepco’s service territory covers approximately 640 square miles and has a population of approximately 2.2 million. As of December 31, 2011, approximately 57% of delivered electricity sales were to Maryland customers and approximately 43% were to the District of Columbia customers.
For retail customers of Pepco in Maryland and in the District of Columbia, earnings are not affected by the warmest and coldest periods of the year because a BSA for retail customers was implemented that recognizes distribution revenue based on an approved distribution charge per customer. Consequently, distribution revenue recognized is decoupled in a reporting period from the amount of power delivered during the period and the only factors that will cause distribution revenue recognized in Maryland and the District of Columbia to fluctuate from period to period are changes in the number of customers and changes in the approved distribution charge per customer. Changes in customer usage (such as due to weather conditions, energy prices, energy efficiency programs or other reasons) from period to period have no impact on reported distribution revenue for customers to whom the BSA applies.
In accounting for the BSA in Maryland and the District of Columbia, a Revenue Decoupling Adjustment is recorded representing either (i) a positive adjustment equal to the amount by which revenue from Maryland and District of Columbia retail distribution sales falls short of the revenue that Pepco is entitled to earn based on the approved distribution charge per customer or (ii) a negative adjustment equal to the amount by which revenue from such distribution sales exceeds the revenue that Pepco is entitled to earn based on the approved distribution charge per customer.
Pepco is a wholly owned subsidiary of PHI. Because PHI is a public utility holding company subject to the Public Utility Holding Company Act of 2005 (PUHCA 2005), the relationship between PHI and Pepco and certain activities of Pepco are subject to FERC’s regulatory oversight under PUHCA 2005.
Reliability Enhancement and Emergency Restoration Improvement Plans
In 2010, Pepco announced that it had adopted and begun to implement comprehensive reliability enhancement plans in Maryland and the District of Columbia. These reliability enhancement plans include various initiatives to improve electrical system reliability, such as:
enhanced vegetation management;
the identification and upgrading of under-performing feeder lines;
the addition of new facilities to support load;
the installation of distribution automation systems on both the overhead and underground network system;
the rejuvenation and replacement of underground residential cables;
improvements to substation supply lines; and
selective undergrounding of portions of existing above ground primary feeder lines, where appropriate to improve reliability.
During 2011, Pepco invested $120 million in capital expenditures on these reliability enhancement activities.
In 2011, prior to the start of the summer storm season, Pepco initiated a program to improve its emergency restoration efforts that included, among other initiatives, an expansion and enhancement of customer service capabilities.
Blueprint for the Future
Pepco is participating in a PHI initiative referred to as “Blueprint for the Future,” which is designed to meet the challenges of rising energy costs, concerns about the environment, improved reliability and government energy reduction goals. For a discussion of the Blueprint for the Future initiative, see PHI’s “Management’s Discussion and Analysis of Financial Condition and Results of Operations – General Overview—Blueprint for the Future.”
95
PEPCO
MAPP Project
PJM has approved PHI’s proposal to construct a new 152-mile, interstate transmission line as part of PJM’s regional transmission expansion plan. In August 2011, PJM notified PHI that the scheduled in-service date for MAPP has been delayed from June 1, 2015 to the 2019 to 2021 time period.
Regulatory Lag
An important factor in Pepco’s ability to earn its authorized rate of return is the willingness of applicable public service commissions to adequately recognize forward-looking costs in Pepco’s rate structure in order to minimize the shortfall in revenues due to the delay in time or “lag” between when costs are incurred and when they are reflected in rates. This delay is commonly known as “regulatory lag.” Pepco is currently experiencing significant regulatory lag because its investment in the rate base and its operating expenses are outpacing revenue growth. In its most recent rate cases, Pepco (in the District of Columbia and Maryland) has proposed mechanisms that would track reliability and other expenses and permit Pepco between rate cases to make adjustments in its rates for prudent investments as made, thereby seeking to reduce the magnitude of regulatory lag. There can be no assurance that these proposals or any other attempts by Pepco to mitigate regulatory lag will be approved, or that even if approved, the rate recovery mechanisms or any base rate cases will fully ameliorate the effects of regulatory lag. Until such time as these proposed mechanisms are approved, if necessary to address the problem of regulatory lag, Pepco plans to file rate cases at least annually in an effort to align more closely its revenue and related cash flow levels with other operation and maintenance spending and capital investments. In future rate cases, Pepco would also continue to seek cost recovery and tracking mechanisms from applicable regulatory commissions to reduce the effects of regulatory lag.
Results of Operations
The following results of operations discussion compares the year ended December 31, 2011 to the year ended December 31, 2010. All amounts in the tables (except sales and customers) are in millions of dollars.
Operating Revenue
| 2011 | 2010 | Change | ||||||||||
Regulated T&D Electric Revenue | $ | 1,111 | $ | 1,068 | $ | 43 | ||||||
Default Electricity Supply Revenue | 933 | 1,185 | (252 | ) | ||||||||
Other Electric Revenue | 34 | 35 | (1 | ) | ||||||||
|
|
|
|
|
| |||||||
Total Operating Revenue | $ | 2,078 | $ | 2,288 | $ | (210 | ) | |||||
|
|
|
|
|
| |||||||
The table above shows the amount of Operating Revenue earned that is subject to price regulation (Regulated T&D Electric Revenue and Default Electricity Supply Revenue) and that which is not subject to price regulation (Other Electric Revenue).
Regulated T&D Electric Revenue includes revenue from the distribution of electricity, including the distribution of Default Electricity Supply, to Pepco’s customers within its service territory at regulated rates. Regulated T&D Electric Revenue also includes transmission service revenue that Pepco receives as a transmission owner from PJM at rates regulated by FERC. Transmission rates are updated annually based on a FERC-approved formula methodology.
Default Electricity Supply Revenue is the revenue received from the supply of electricity by Pepco at regulated rates to retail customers who do not elect to purchase electricity from a competitive energy supplier, and which is also known as SOS. The costs related to Default Electricity Supply are included in Purchased Energy. Default Electricity Supply Revenue also includes transmission enhancement credits that Pepco receives as a transmission owner from PJM for approved regional transmission expansion plan costs.
Other Electric Revenue includes work and services performed on behalf of customers, including other utilities, which is generally not subject to price regulation. Work and services includes mutual assistance to other utilities, highway relocation, rentals of pole attachments, late payment fees and collection fees.
96
PEPCO
Regulated T&D Electric
| 2011 | 2010 | Change | ||||||||||
Regulated T&D Electric Revenue | ||||||||||||
Residential | $ | 328 | $ | 314 | $ | 14 | ||||||
Commercial and industrial | 647 | 631 | 16 | |||||||||
Transmission and other | 136 | 123 | 13 | |||||||||
|
|
|
|
|
| |||||||
Total Regulated T&D Electric Revenue | $ | 1,111 | $ | 1,068 | $ | 43 | ||||||
|
|
|
|
|
| |||||||
| 2011 | 2010 | Change | ||||||||||
Regulated T&D Electric Sales (GWh) | ||||||||||||
Residential | 8,052 | 8,350 | (298 | ) | ||||||||
Commercial and industrial | 18,683 | 19,155 | (472 | ) | ||||||||
Transmission and other | 160 | 160 | — | |||||||||
|
|
|
|
|
| |||||||
Total Regulated T&D Electric Sales | 26,895 | 27,665 | (770 | ) | ||||||||
|
|
|
|
|
| |||||||
| 2011 | 2010 | Change | ||||||||||
Regulated T&D Electric Customers (in thousands) | ||||||||||||
Residential | 714 | 713 | 1 | |||||||||
Commercial and industrial | 74 | 74 | — | |||||||||
Transmission and other | — | — | — | |||||||||
|
|
|
|
|
| |||||||
Total Regulated T&D Electric Customers | 788 | 787 | 1 | |||||||||
|
|
|
|
|
| |||||||
Regulated T&D Electric Revenue increased by $43 million primarily due to:
An increase of $13 million in transmission revenue primarily attributable to higher rates effective June 1, 2010 and June 1, 2011 related to increases in transmission plant investment.
An increase of $12 million due to distribution rate increases in the District of Columbia effective March 2010 and July 2010; and in Maryland effective July 2010.
An increase of $11 million due to higher pass-through revenue (which is substantially offset by a corresponding increase in Other Taxes) primarily the result of rate increases in Montgomery County, Maryland utility taxes that are collected by Pepco on behalf of the county.
An increase of $6 million due to customer growth in 2011, primarily in the residential class.
An increase of $2 million due to the implementation of the EmPower Maryland surcharge in March 2010 (which is substantially offset by a corresponding increase in Depreciation and Amortization).
Default Electricity Supply
| 2011 | 2010 | Change | ||||||||||
Default Electricity Supply Revenue | ||||||||||||
Residential | $ | 668 | $ | 865 | $ | (197 | ) | |||||
Commercial and industrial | 257 | 309 | (52 | ) | ||||||||
Other | 8 | 11 | (3 | ) | ||||||||
|
|
|
|
|
| |||||||
Total Default Electricity Supply Revenue | $ | 933 | $ | 1,185 | $ | (252 | ) | |||||
|
|
|
|
|
| |||||||
| 2011 | 2010 | Change | ||||||||||
Default Electricity Supply Sales (GWh) | ||||||||||||
Residential | 6,770 | 7,576 | (806 | ) | ||||||||
Commercial and industrial | 2,854 | 3,113 | (259 | ) | ||||||||
Other | 8 | 10 | (2 | ) | ||||||||
|
|
|
|
|
| |||||||
Total Default Electricity Supply Sales | 9,632 | 10,699 | (1,067 | ) | ||||||||
|
|
|
|
|
| |||||||
97
PEPCO
| 2011 | 2010 | Change | ||||||||||
Default Electricity Supply Customers (in thousands) | ||||||||||||
Residential | 598 | 644 | (46 | ) | ||||||||
Commercial and industrial | 45 | 47 | (2 | ) | ||||||||
Other Commercial and industrial | — | — | — | |||||||||
|
|
|
|
|
| |||||||
Total Default Electricity Supply Customers | 643 | 691 | (48 | ) | ||||||||
|
|
|
|
|
| |||||||
Default Electricity Supply Revenue decreased by $252 million primarily due to:
A decrease of $135 million as a result of lower Default Electricity Supply rates.
A decrease of $74 million due to lower sales, primarily as a result of residential and commercial customer migration to competitive suppliers.
A decrease of $48 million due to lower sales as a result of cooler weather during the spring and summer months of 2011, and warmer weather during the fall months of 2011, as compared to the corresponding periods in 2010.
The aggregate amount of these decreases was partially offset by:
An increase of $5 million due to higher non-weather related average customer usage.
An increase of $3 million resulting from an approval by the DCPSC of an increase in Pepco’s cost recovery rate for providing Default Electricity Supply in the District of Columbia to provide for recovery of higher cash working capital costs incurred in prior periods. The higher cash working capital costs were incurred when the billing cycle for providers of Default Electricity Supply was shortened from a monthly to a weekly period, effective in June 2009.
The following table shows the percentages of Pepco’s total distribution sales by jurisdiction that are derived from customers receiving Default Electricity Supply from Pepco. Amounts are for the year ended December 31.
| 2011 | 2010 | |||||||
Sales to District of Columbia customers | 27 | % | 29 | % | ||||
Sales to Maryland customers | 43 | % | 46 | % | ||||
Operating Expenses
Purchased Energy
Purchased Energy consists of the cost of electricity purchased by Pepco to fulfill its Default Electricity Supply obligation and, as such, is recoverable from customers in accordance with the terms of public service commission orders. Purchased Energy decreased by $259 million to $893 million in 2011 from $1,152 million in 2010 primarily due to:
A decrease of $162 million due to lower average electricity costs under Default Electricity Supply contracts.
A decrease of $62 million primarily due to customer migration to competitive suppliers.
A decrease of $45 million due to lower electricity sales primarily as a result of cooler weather during the spring and summer months of 2011, and warmer weather during the fall months of 2011, as compared to the corresponding periods in 2010.
98
PEPCO
The aggregate amount of these decreases was partially offset by:
An increase of $11 million in deferred electricity expense primarily due to lower Default Electricity Supply rates, which resulted in a higher rate of recovery of Default Electricity Supply costs.
Other Operation and Maintenance
Other Operation and Maintenance increased by $66 million to $420 million in 2011 from $354 million in 2010 primarily due to:
An increase of $28 million associated with higher tree trimming and preventative maintenance costs.
An increase of $13 million due to higher 2011 DCPSC rate case costs and reliability audit expenses and due to 2010 adjustments for the deferral of (i) February 2010 severe winter storm costs of $5 million and (ii) distribution rate case costs of $4 million that previously were charged to other operation and maintenance expense. The adjustments were recorded in accordance with a MPSC rate order issued in August 2010 and a DCPSC rate order issued in February 2010, allowing for the recovery of the costs.
An increase of $8 million in customer support service and system support costs.
An increase of $7 million primarily due to emergency restoration improvement project and reliability improvement costs.
An increase of $5 million in communication costs.
An increase of $4 million in employee-related costs, primarily benefit expenses.
An increase of $3 million in outside legal counsel fees.
An increase of $3 million in emergency restoration costs. The increase is primarily related to significant incremental costs incurred for repair work following Hurricane Irene in August 2011. Costs incurred for repair work were $12 million, of which $10 million was deferred as a regulatory asset to reflect the probable recovery of these storm costs in certain jurisdictions, and the remaining $2 million was charged to other operation and maintenance expense. Pepco currently plans to seek recovery of the incremental Hurricane Irene costs in each of its jurisdictions in pending or planned distribution rate case filings.
The aggregate amount of these increases was partially offset by:
A decrease of $11 million in environmental remediation costs.
Restructuring Charge
As a result of PHI’s organizational review in the second quarter of 2010, Pepco’s operating expenses include a pre-tax restructuring charge of $15 million for the year ended December 31, 2010, related to severance and health and welfare benefits to be provided to terminated employees.
99
PEPCO
Depreciation and Amortization
Depreciation and Amortization expense increased by $9 million to $171 million in 2011 from $162 million in 2010 primarily due to:
An increase of $5 million due to utility plant additions.
An increase of $3 million in amortization of regulatory assets primarily associated with the EmPower Maryland surcharge that became effective in March 2010 (which is substantially offset by a corresponding increase in Regulated T&D Electric Revenue).
An increase of $1 million in the amortization of software upgrades to Pepco’s Energy Management System.
Other Taxes
Other Taxes increased by $18 million to $382 million in 2011 from $364 million in 2010. The increase was primarily due to:
An increase of $16 million primarily due to rate increases in the Montgomery County, Maryland utility taxes that are collected and passed through by Pepco (substantially offset by a corresponding increase in Regulated T&D Electric Revenue).
An increase of $5 million due to an adjustment in the third quarter of 2010 to correct certain errors related to other taxes.
The aggregate amount of these increases was partially offset by:
A decrease of $5 million in the Energy Assistance Trust Fund surcharge primarily due to rate decreases effective October 2010 (substantially offset by a corresponding decrease in Regulated T&D Electric Revenue).
Effects of Divestiture-Related Claims
The DCPSC on May 18, 2010 issued an order addressing all of the outstanding issues relating to Pepco’s obligation to share with its District of Columbia customers the net proceeds realized by Pepco from the sale of its generation-related assets in 2000. This order disallowed certain items that Pepco had included in the costs it deducted in calculating the net proceeds of the sale. The disallowance of these costs, together with interest, increased the aggregate amount Pepco is required to distribute to customers by approximately $11 million. Pepco recognized a pre-tax expense of $11 million for the year ended December 31, 2010.
Other Income (Expenses)
Other Expenses (which are net of Other Income) decreased by $8 million to a net expense of $77 million in 2011 from a net expense of $85 million in 2010. The decrease was primarily due to:
An increase of $8 million in income related to AFUDC that is applied to capital projects.
An increase of $3 million in other income due to net proceeds from a company owned life insurance policy.
100
PEPCO
The aggregate amount of these increases was partially offset by:
A decrease of $3 million in other income due to gains on the sale of four parcels of land in 2010.
Income Tax Expense
Pepco’s effective tax rates for the years ended December 31, 2011 and 2010 were 26.7% and 25.5%, respectively. The increase in the effective tax rate primarily resulted from changes in estimates and interest related to uncertain and effectively settled tax positions offset by an increase in certain asset removal costs.
Income Tax Adjustments
During 2011, Pepco recorded an adjustment to correct certain income tax errors related to prior periods associated with the interest on uncertain tax positions. The adjustment resulted in an increase in income tax expense of $1 million for the year ended December 31, 2011.
In 2010, Pepco recorded certain adjustments to correct errors in income tax expense which resulted in an increase to income tax expense of $4 million for the year ended December 31, 2010.
Capital Requirements
Sources of Capital
Pepco has a range of capital sources available, in addition to internally generated funds, to meet its long-term and short-term funding needs. The sources of long-term funding include the issuance of mortgage bonds and other debt securities and bank financings, as well as the ability to issue preferred stock. Proceeds from long-term financings are used primarily to fund long-term capital requirements, such as capital expenditures, and to repay or refinance existing indebtedness. Pepco traditionally has used a number of sources to fulfill short-term funding needs, including commercial paper, short-term notes, bank lines of credit and borrowings under the PHI money pool. Proceeds from short-term borrowings are used primarily to meet working capital needs, but may also be used to temporarily fund long-term capital requirements. Pepco’s ability to generate funds from its operations and to access the capital and credit markets is subject to risks and uncertainties. Volatile and deteriorating financial market conditions, diminished liquidity and tightening credit may affect access to certain of Pepco’s potential funding sources. See “Risk Factors,” for additional discussion of important factors that may have an effect on Pepco’s sources of capital.
Debt Securities
Pepco has a Mortgage and Deed of Trust (the Mortgage) under which it issues First Mortgage Bonds. First Mortgage Bonds issued under the Mortgage are secured by a lien on substantially all of Pepco’s property, plant and equipment. The principal amount of First Mortgage Bonds that Pepco may issue under the Mortgage is limited by the principal amount of retired First Mortgage Bonds and 60% of the lesser of the cost or fair value of new property additions that have not been used as the basis for the issuance of additional First Mortgage Bonds. Pepco also has an Indenture under which it issues senior notes secured by First Mortgage Bonds and an Indenture under which it can issue unsecured debt securities, including medium-term notes. To fund the construction of pollution control facilities, Pepco also has from time to time issued tax-exempt bonds through a municipality or public agency, the proceeds of which are loaned to Pepco by the municipality or agency.
101
PEPCO
Information concerning the principal amount and terms of Pepco’s outstanding debt securities, as of December 31, 2011, is set forth in Note (10), “Debt,” to the financial statements of Pepco.
Bank Financing
As further discussed in Note (10), “Debt,” to the financial statements of Pepco, Pepco is a borrower under a $1.5 billion credit facility, along with PHI, DPL and ACE, which expires in 2016. Pepco’s credit limit under the facility is the lesser of $250 million and the maximum amount of short-term debt Pepco is permitted to have outstanding by its regulatory authorities. The short-term borrowing limit established by FERC for Pepco is $500 million.
Commercial Paper Program
Pepco maintains an ongoing commercial paper program of up to $500 million under which it can issue commercial paper with maturities of up to 270 days. The commercial paper is backed by Pepco’s borrowing capacity under the $1.5 billion credit facility.
Pepco had $74 million of commercial paper outstanding at December 31, 2011 and zero outstanding at December 31, 2010. The weighted average interest rate for commercial paper issued during 2011 was 0.35%, and the weighted average maturity was two days. Pepco did not issue commercial paper during 2010.
Money Pool
Pepco participates in the money pool operated by PHI under authorization received from FERC. The money pool is a cash management mechanism used by PHI and eligible subsidiaries to manage their short-term investment and borrowing requirements. PHI may invest in, but not borrow from, the money pool. Eligible subsidiaries with surplus cash may deposit those funds in the money pool. Deposits in the money pool are guaranteed by PHI. Eligible subsidiaries with cash requirements may borrow from the money pool. Borrowings from the money pool are unsecured. Depositors in the money pool receive, and borrowers from the money pool pay, an interest rate based primarily on PHI’s short-term borrowing rate. PHI deposits funds in the money pool to the extent that the pool has insufficient funds to meet the borrowing needs of its participants, which PHI may obtain from external sources.
Preferred Stock
Under its Articles of Incorporation, Pepco is authorized to issue and have outstanding up to 6 million shares of preferred stock in one or more series, with each series having such rights, preferences and limitations, including dividend and voting rights and redemption provisions, as the Board of Directors may establish. As of December 31, 2011 and 2010, there were no shares of Pepco preferred stock outstanding.
Regulatory Restrictions on Financing Activities
Pepco’s long-term financing activities (including the issuance of securities and the incurrence of debt) are subject to authorization by the DCPSC and MPSC. Through its periodic filings with the respective utility commissions, Pepco generally maintains standing authority sufficient to cover its projected financing needs over a multi-year period. Under the FPA, FERC has jurisdiction over the issuance of long-term and short-term securities of public utilities, but only if the issuance is not regulated by the state public utility commission in which the public utility is organized and operating. Pepco has obtained FERC authorization for the issuance of short-term debt under these provisions.
102
PEPCO
Capital Expenditures
Pepco’s capital expenditures for the year ended December 31, 2011 totaled $521 million. These expenditures were primarily related to capital costs associated with new customer services, distribution reliability and transmission. The expenditures also include an allocation by PHI of hardware and software expenditures that primarily benefit Power Delivery and are allocated to Pepco when the assets are placed in service.
The following table shows Pepco’s projected capital expenditures for the five-year period 2012 through 2016. Pepco expects to fund these expenditures through internally generated cash, external financing and capital contributions from PHI.
| For the Year | ||||||||||||||||||||||||
| 2012 | 2013 | 2014 | 2015 | 2016 | Total | |||||||||||||||||||
| (millions of dollars) | ||||||||||||||||||||||||
Pepco | ||||||||||||||||||||||||
Distribution | $ | 321 | $ | 367 | $ | 439 | $ | 398 | $ | 406 | $ | 1,931 | ||||||||||||
Distribution – Blueprint for the Future | 76 | 1 | — | — | — | 77 | ||||||||||||||||||
Transmission | 104 | 93 | 68 | 58 | 71 | 394 | ||||||||||||||||||
Transmission – MAPP | 1 | 1 | 1 | 3 | 132 | 138 | ||||||||||||||||||
Other | 56 | 30 | 17 | 13 | 18 | 134 | ||||||||||||||||||
|
|
|
|
|
|
|
|
|
|
|
| |||||||||||||
Sub-Total | 558 | 492 | 525 | 472 | 627 | 2,674 | ||||||||||||||||||
DOE Capital Reimbursement Awards (a) | (46 | ) | (2 | ) | — | — | — | (48 | ) | |||||||||||||||
|
|
|
|
|
|
|
|
|
|
|
| |||||||||||||
Total Pepco | $ | 512 | $ | 490 | $ | 525 | $ | 472 | $ | 627 | $ | 2,626 | ||||||||||||
|
|
|
|
|
|
|
|
|
|
|
| |||||||||||||
| (a) | Reflects anticipated reimbursements pursuant to
|
103
PEPCO
Transmission and Distribution
The projected capital expenditures listed in the table above for distribution (other than Blueprint for the Future) and transmission (other than the MAPP project) are primarily for facility replacements and upgrades to accommodate customer growth and service reliability, including capital expenditures for continuing reliability enhancement efforts.
Blueprint for the Future
Pepco has undertaken programs to install smart meters, further automate its electric distribution systems and enhance its communications infrastructure, which it refers to as the Blueprint for the Future. For a discussion of the Blueprint for the Future initiative, see PHI’s “Management’s Discussion and Analysis of Financial Condition and Results of Operations – General Overview—Blueprint for the Future.” The projected capital expenditures over the next five years are shown as Distribution—Blueprint for the Future in the table above.
MAPP Project
PJM has approved PHI’s proposal to construct a new 152-mile, interstate transmission line as part of PJM’s regional transmission expansion plan. In August 2011, PJM notified PHI that the scheduled in-service date for MAPP has been delayed from June 1, 2015 to the 2019 to 2021 time period. The projected capital expenditures over the next five years for MAPP are shown as Transmission—MAPP in the table above.
MAPP/DOE Loan Program
To assist in the funding of the MAPP project, PHI has applied for a $684 million loan guarantee from the DOE for a substantial portion of the MAPP project, primarily the Calvert Cliffs to Indian River segment. The application has been made under a federal loan guarantee program for projects that employ innovative energy efficiency, renewable energy and advanced transmission and distribution technologies. If granted, PHI believes the guarantee could allow PHI to acquire financing at a lower cost than it would otherwise be able to obtain in the capital markets. Whether PHI’s application will be granted and, if so, the amount of debt guaranteed is subject to the discretion of the DOE and the negotiation of terms that will satisfy the conditions of the guarantee program. On February 28, 2011, the DOE issued a Notice of Intent to prepare an Environmental Impact Statement to assist the DOE in assessing the environmental impact of constructing the portion of the MAPP project to be supported by the loan guarantee. Since February 2011, the DOE has conducted field inspections of the entire route and has held public meetings to obtain input from the communities along the route.
The DOE’s review of the loan guarantee program has delayed the DOE’s review of PHI’s loan guarantee application. There is not an approval deadline under the loan guarantee program, but this program could change or be terminated in the future. PHI continues to coordinate environmental activities with the DOE.
DOE Capital Reimbursement Awards
In 2009, the DOE announced a $168 million award to PHI under the American Recovery and Reinvestment Act of 2009 for the implementation of an AMI system, direct load control, distribution automation and communications infrastructure. Pepco was awarded $149 million with $105 million to be used in the Maryland service territory and $44 million to be used in the District of Columbia service territory.
In April 2010, PHI and the DOE signed agreements formalizing Pepco’s $149 million share of the $168 million award. Of the $149 million, $118 million is expected to offset incurred and projected Blueprint for the Future and other capital expenditures of Pepco. The remaining $31 million will be used to offset incremental expenses associated with direct load control and other programs. In 2011, Pepco received award payments of $53 million. In 2010, Pepco received award payments of $15 million.
The IRS has announced that, to the extent these grants are expended on capital items, they will not be considered taxable income.
Pension and Other Postretirement Benefit Plans
Pepco participates in pension and OPEB plans sponsored by PHI for its employees. Pepco contributed $40 million and zero to the PHI Retirement Plan during 2011 and 2010, respectively.
On January 31, 2012, Pepco made an $85 million discretionary tax-deductible contribution to the PHI Retirement Plan.
104
DPL
MANAGEMENT’S DISCUSSION AND ANALYSIS OF FINANCIAL CONDITION AND RESULTS OF OPERATIONS
Delmarva Power & Light Company
DPL meets the conditions set forth in General Instruction I(1)(a) and (b) to Form 10-K, and accordingly information otherwise required under this Item has been omitted in accordance with General Instruction I(2)(a) to Form 10-K.
General Overview
DPL is engaged in the transmission and distribution of electricity in Delaware and portions of Maryland. DPL also provides Default Electricity Supply, which is the supply of electricity at regulated rates to retail customers in its service territories who do not elect to purchase electricity from a competitive energy supplier. Default Electricity Supply is known as SOS in both Delaware and Maryland. DPL’s electricity distribution service territory covers approximately 5,000 square miles and has a population of approximately 1.4 million. As of December 31, 2011, approximately 66% of delivered electricity sales were to Delaware customers and approximately 34% were to Maryland customers. In northern Delaware, DPL also supplies and distributes natural gas to retail customers and provides transportation-only services to retail customers that purchase natural gas from other suppliers. DPL’s natural gas distribution service territory covers approximately 275 square miles and has a population of approximately 500,000.
In DPL’s Delaware service territory, results historically have been seasonal, generally producing higher revenue and income in the warmest and coldest periods of the year. For retail customers of DPL in Maryland, earnings are not affected by the warmest and coldest periods of the year because a BSA for retail customers was implemented that recognizes distribution revenue based on an approved distribution charge per customer. Consequently, distribution revenue recognized is decoupled in a reporting period from the amount of power delivered during the period and the only factors that will cause distribution revenue recognized in Maryland to fluctuate from period to period are changes in the number of customers and changes in the approved distribution charge per customer. A comparable revenue decoupling mechanism for DPL electricity and natural gas customers in Delaware is under consideration by the DPSC. Changes in customer usage (such as due to weather conditions, energy prices, energy efficiency programs or other reasons) from period to period have no impact on reported distribution revenue for customers to whom the BSA applies.
In accounting for the BSA in Maryland, a Revenue Decoupling Adjustment is recorded representing either (i) a positive adjustment equal to the amount by which revenue from Maryland retail distribution sales falls short of the revenue that DPL is entitled to earn based on the approved distribution charge per customer or (ii) a negative adjustment equal to the amount by which revenue from such distribution sales exceeds the revenue that DPL is entitled to earn based on the approved distribution charge per customer.
DPL is a wholly owned subsidiary of Conectiv, which is wholly owned by PHI. Because PHI is a public utility holding company subject to PUHCA 2005, the relationship between PHI and DPL and certain activities of DPL are subject to FERC’s regulatory oversight under PUHCA 2005.
Blueprint for the Future
DPL is participating in a PHI initiative referred to as “Blueprint for the Future,” which is designed to meet the challenges of rising energy costs, concerns about the environment, improved reliability and government energy reduction goals. For a discussion of the Blueprint for the Future initiative, see PHI’s “Management’s Discussion and Analysis of Financial Condition and Results of Operations – General Overview—Blueprint for the Future.”
105
DPL
MAPP Project
PJM has approved PHI’s proposal to construct a new 152-mile, interstate transmission line as part of PJM’s regional transmission expansion plan. In August 2011, PJM notified PHI that the scheduled in-service date for MAPP has been delayed from June 1, 2015 to the 2019 to 2021 time period. The projected capital expenditures over the next five years for MAPP are shown as Transmission—MAPP in the table above.
Regulatory Lag
An important factor in the ability of DPL to earn its authorized rate of return is the willingness of applicable public service commissions to adequately recognize forward-looking costs in DPL’s rate structure in order to minimize the shortfall in revenues due to the delay in time or “lag” between when costs are incurred and when they are reflected in rates. This delay is commonly known as “regulatory lag.” DPL is currently experiencing significant regulatory lag because its investment in the rate base and its operating expenses are outpacing revenue growth. In its most recent rate cases, DPL (in Delaware and Maryland) has proposed mechanisms that would track reliability and other expenses and permit DPL between rate cases to make adjustments in its rates for prudent investments as made, thereby seeking to reduce the magnitude of regulatory lag. There can be no assurance that these proposals or any other attempts by DPL to mitigate regulatory lag will be approved, or that even if approved, the rate recovery mechanisms or any base rate cases will fully ameliorate the effects of regulatory lag. Until such time as these proposed mechanisms are approved, if necessary to address the problem of regulatory lag, DPL plans to file rate cases at least annually in an effort to align more closely its revenue and related cash flow levels with other operation and maintenance spending and capital investments. In future rate cases, DPL would also continue to seek cost recovery and tracking mechanisms from applicable regulatory commissions to reduce the effects of regulatory lag.
106
DPL
Results of Operations
The following results of operations discussion compares the year ended December 31, 2011 to the year ended December 31, 2010. All amounts in the tables (except sales and customers) are in millions of dollars.
Electric Operating Revenue
| 2011 | 2010 | Change | ||||||||||
Regulated T&D Electric Revenue | $ | 394 | $ | 375 | $ | 19 | ||||||
Default Electricity Supply Revenue | 664 | 768 | (104 | ) | ||||||||
Other Electric Revenue | 16 | 20 | (4 | ) | ||||||||
|
|
|
|
|
| |||||||
Total Electric Operating Revenue | $ | 1,074 | $ | 1,163 | $ | (89 | ) | |||||
|
|
|
|
|
| |||||||
The table above shows the amount of Electric Operating Revenue earned that is subject to price regulation (Regulated T&D Electric Revenue and Default Electricity Supply Revenue) and that which is not subject to price regulation (Other Electric Revenue).
Regulated T&D Electric Revenue includes revenue from the distribution of electricity, including the distribution of Default Electricity Supply, to DPL’s customers within its service territory at regulated rates. Regulated T&D Electric Revenue also includes transmission service revenue that DPL receives as a transmission owner from PJM at rates regulated by FERC. Transmission rates are updated annually based on a FERC-approved formula methodology.
Default Electricity Supply Revenue is the revenue received from the supply of electricity by DPL at regulated rates to retail customers who do not elect to purchase electricity from a competitive energy supplier, and which is also known as SOS. The costs related to Default Electricity Supply are included in Purchased Energy. Default Electricity Supply Revenue also includes transmission enhancement credits that DPL receives as a transmission owner from PJM for approved regional transmission expansion plan costs.
Other Electric Revenue includes work and services performed on behalf of customers, including other utilities, which is generally not subject to price regulation. Work and services includes mutual assistance to other utilities, highway relocation, rentals of pole attachments, late payment fees, and collection fees.
Regulated T&D Electric
| 2011 | 2010 | Change | ||||||||||
Regulated T&D Electric Revenue | ||||||||||||
Residential | $ | 188 | $ | 184 | $ | 4 | ||||||
Commercial and industrial | 113 | 110 | 3 | |||||||||
Transmission and other | 93 | 81 | 12 | |||||||||
|
|
|
|
|
| |||||||
Total Regulated T&D Electric Revenue | $ | 394 | $ | 375 | $ | 19 | ||||||
|
|
|
|
|
| |||||||
| 2011 | 2010 | Change | ||||||||||
Regulated T&D Electric Sales (GWh) | ||||||||||||
Residential | 5,197 | 5,357 | (160 | ) | ||||||||
Commercial and industrial | 7,442 | 7,445 | (3 | ) | ||||||||
Transmission and other | 49 | 51 | (2 | ) | ||||||||
|
|
|
|
|
| |||||||
Total Regulated T&D Electric Sales | 12,688 | 12,853 | (165 | ) | ||||||||
|
|
|
|
|
| |||||||
107
DPL
| 2011 | 2010 | Change | ||||||||||
Regulated T&D Electric Customers (in thousands) | ||||||||||||
Residential | 441 | 440 | 1 | |||||||||
Commercial and industrial | 59 | 59 | — | |||||||||
Transmission and other | 1 | 1 | — | |||||||||
|
|
|
|
|
| |||||||
Total Regulated T&D Electric Customers | 501 | 500 | 1 | |||||||||
|
|
|
|
|
| |||||||
Regulated T&D Electric Revenue increased by $19 million primarily due to:
An increase of $12 million in transmission revenue primarily attributable to higher rates effective June 1, 2010 and June 1, 2011 related to increases in transmission plant investment.
An increase of $11 million due to distribution rate increases in Maryland effective July 2011, and in Delaware effective February 2011.
The aggregate amount of these increases was partially offset by:
A decrease of $4 million due to lower sales as a result of cooler weather during the 2011 spring and summer months, and warmer weather during the 2011 fall months as compared to 2010.
Default Electricity Supply
| 2011 | 2010 | Change | ||||||||||
Default Electricity Supply Revenue | ||||||||||||
Residential | $ | 505 | $ | 577 | $ | (72 | ) | |||||
Commercial and industrial | 148 | 181 | (33 | ) | ||||||||
Other | 11 | 10 | 1 | |||||||||
|
|
|
|
|
| |||||||
Total Default Electricity Supply Revenue | $ | 664 | $ | 768 | $ | (104 | ) | |||||
|
|
|
|
|
| |||||||
| 2011 | 2010 | Change | ||||||||||
Default Electricity Supply Sales (GWh) | ||||||||||||
Residential | 4,856 | 5,199 | (343 | ) | ||||||||
Commercial and industrial | 1,845 | 1,954 | (109 | ) | ||||||||
Other | 29 | 37 | (8 | ) | ||||||||
|
|
|
|
|
| |||||||
Total Default Electricity Supply Sales | 6,730 | 7,190 | (460 | ) | ||||||||
|
|
|
|
|
| |||||||
| 2011 | 2010 | Change | ||||||||||
Default Electricity Supply Customers (in thousands) | ||||||||||||
Residential | 415 | 423 | (8 | ) | ||||||||
Commercial and industrial | 42 | 45 | (3 | ) | ||||||||
Other | — | 1 | (1 | ) | ||||||||
|
|
|
|
|
| |||||||
Total Default Electricity Supply Customers | 457 | 469 | (12 | ) | ||||||||
|
|
|
|
|
| |||||||
Default Supply Revenue decreased by $104 million primarily due to:
A decrease of $58 million as a result of lower Default Electricity Supply rates.
A decrease of $28 million due to lower sales, primarily as a result of customer migration to competitive suppliers.
108
DPL
A decrease of $25 million due to lower sales as a result of cooler weather during the spring and summer months of 2011, and warmer weather during the fall months of 2011, as compared to the corresponding periods in 2010.
The aggregate amount of these decreases was partially offset by:
An increase of $7 million due to higher non-weather related average customer usage.
The following table shows the percentages of DPL’s total distribution sales by jurisdiction that are derived from customers receiving Default Electricity Supply from DPL. Amounts are for the years ended December 31:
| 2011 | 2010 | |||||||
Sales to Delaware customers | 51 | % | 53 | % | ||||
Sales to Maryland customers | 58 | % | 63 | % | ||||
Natural Gas Operating Revenue
| 2011 | 2010 | Change | ||||||||||
Regulated Gas Revenue | $ | 183 | $ | 191 | $ | (8 | ) | |||||
Other Gas Revenue | 47 | 46 | 1 | |||||||||
|
|
|
|
|
| |||||||
Total Natural Gas Operating Revenue | $ | 230 | $ | 237 | $ | (7 | ) | |||||
|
|
|
|
|
| |||||||
The table above shows the amounts of Natural Gas Operating Revenue from sources that are subject to price regulation (Regulated Gas Revenue) and those that generally are not subject to price regulation (Other Gas Revenue). Regulated Gas Revenue includes the revenue DPL receives from on-system natural gas delivered sales and the transportation of natural gas for customers within its service territory at regulated rates. Other Gas Revenue includes off-system natural gas sales and the short-term release of interstate pipeline transportation and storage capacity not needed to serve customers. Off-system sales are made possible when low demand for natural gas by regulated customers creates excess pipeline capacity.
Regulated Gas
| 2011 | 2010 | Change | ||||||||||
Regulated Gas Revenue | ||||||||||||
Residential | $ | 113 | $ | 118 | $ | (5 | ) | |||||
Commercial and industrial | 61 | 65 | (4 | ) | ||||||||
Transportation and other | 9 | 8 | 1 | |||||||||
|
|
|
|
|
| |||||||
Total Regulated Gas Revenue | $ | 183 | $ | 191 | $ | (8 | ) | |||||
|
|
|
|
|
| |||||||
| 2011 | 2010 | Change | ||||||||||
Regulated Gas Sales (billion cubic feet) | ||||||||||||
Residential | 7 | 8 | (1 | ) | ||||||||
Commercial and industrial | 5 | 5 | — | |||||||||
Transportation and other | 7 | 6 | 1 | |||||||||
|
|
|
|
|
| |||||||
Total Regulated Gas Sales | 19 | 19 | — | |||||||||
|
|
|
|
|
| |||||||
| 2011 | 2010 | Change | ||||||||||
Regulated Gas Customers (in thousands) | ||||||||||||
Residential | 115 | 114 | 1 | |||||||||
Commercial and industrial | 9 | 9 | — | |||||||||
Transportation and other | — | — | — | |||||||||
|
|
|
|
|
| |||||||
Total Regulated Gas Customers | 124 | 123 | 1 | |||||||||
|
|
|
|
|
| |||||||
109
DPL
Regulated Gas Revenue decreased by $8 million primarily due to:
A decrease of $17 million due to lower non-weather related average customer usage.
The decrease was partially offset by:
An increase of $6 million due to higher sales primarily as a result of colder weather during the winter months of 2011 as compared to 2010.
An increase of $2 million due to a distribution rate increase effective February 2011.
An increase of $2 million due to customer growth in 2011.
Operating Expenses
Purchased Energy
Purchased Energy consists of the cost of electricity purchased by DPL to fulfill its Default Electricity Supply obligation and, as such, is recoverable from customers in accordance with the terms of public service commission orders. Purchased Energy decreased by $105 million to $635 million in 2011, from $740 million in 2010 primarily due to:
A decrease of $68 million due to lower average electricity costs under Default Electricity Supply contracts.
A decrease of $22 million due to lower electricity sales primarily as a result of cooler weather during the spring and summer months of 2011, and warmer weather during the fall months of 2011, as compared to the corresponding periods in 2010.
A decrease of $21 million primarily due to customer migration to competitive suppliers.
The aggregate amount of these decreases was partially offset by:
An increase of $8 million in deferred electricity expense primarily due to lower Default Electricity Supply rates, which resulted in a higher rate of recovery of Default Electricity Supply costs.
Gas Purchased
Gas Purchased consists of the cost of gas purchased by DPL to fulfill its obligation to regulated gas customers and, as such, is recoverable from customers in accordance with the terms of public service commission orders. It also includes the cost of gas purchased for off-system sales. Total Gas Purchased decreased by $9 million to $155 million in 2011 from $164 million in 2010 primarily due to:
A decrease of $16 million in the cost of gas purchases for on-system sales as a result of lower average gas prices, lower volumes purchased and lower withdraws from storage.
A decrease of $11 million from the settlement of financial hedges entered into as part of DPL’s hedge program for the purchase of regulated natural gas.
The aggregate amount of these decreases was partially offset by:
An increase of $18 million in deferred gas expense as a result of a higher rate of recovery of natural gas supply costs.
110
DPL
Other Operation and Maintenance
Other Operation and Maintenance decreased by $16 million to $239 million in 2011 from $255 million in 2010 primarily due to:
A decrease of $16 million resulting from adjustments recorded by DPL in 2011 associated with the accounting for DPL Default Electricity Supply. These adjustments were primarily due to the under-recognition of allowed returns on working capital, uncollectible, late fees and administrative costs.
A decrease of $4 million in environmental remediation costs.
A decrease of $2 million due to an adjustment of self-insurance reserves for general and auto liability claims recorded in 2011.
A decrease of $2 million due to an adjustment for February 2010 severe winter storm costs that previously were charged to other operation and maintenance expense. The adjustment was recorded in accordance with a MPSC rate order issued in July 2011, allowing for the recovery of the costs.
The aggregate amount of these decreases was partially offset by:
An increase of $5 million in emergency restoration costs. The increase is primarily related to significant incremental costs incurred for repair work following Hurricane Irene in August 2011. Costs incurred for repair work were $8 million, of which $5 million was deferred as a regulatory asset to reflect the probable recovery of these storm costs in certain jurisdictions, and the remaining $3 million was charged to other operation and maintenance expense. DPL currently plans to seek recovery of the incremental Hurricane Irene costs in each of its jurisdictions in planned distribution rate case filings.
An increase of $5 million associated with higher preventative maintenance and tree trimming costs.
Restructuring Charge
As a result of PHI’s organizational review in the second quarter of 2010, DPLs operating expenses include a pre-tax restructuring charge of $8 million for the year ended December 31, 2010, related to severance and health and welfare benefits to be provided to terminated employees.
Depreciation and Amortization
Depreciation and Amortization expense increased by $6 million to $89 million in 2011 from $83 million in 2010 primarily due to:
An increase of $4 million due to utility plant additions.
An increase of $1 million in amortization of regulatory assets primarily associated with the EmPower Maryland surcharge that became effective in March 2010 (which is substantially offset by a corresponding increase in Regulated T&D Electric Revenue).
111
DPL
Income Tax Expense
DPL’s effective tax rates for the years ended December 31, 2011 and 2010 were 37.2% and 40.8%, respectively. The decrease in the effective rate is primarily related to PHI’s 2011 settlement with the IRS regarding interest due on its federal tax liabilities related to the November 2010 audit settlement for the tax years 1996 to 2002. In connection with this agreement, PHI reallocated certain amounts that have been on deposit with the IRS since 2006 among liabilities in the settlement years and subsequent years. Primarily related to the settlement and reallocations, DPL recorded an additional $4 million (after-tax) interest benefit. This is partially offset by adjustments recorded in the third quarter of 2011 related to DPL’s settlement with the state taxing authorities resulting in $1 million (after-tax) of additional tax expense and the recalculation of interest on its uncertain tax positions for open tax years based on different assumptions related to the application of its deposit made with the IRS in 2006. This resulted in an additional tax expense of $1 million (after-tax).
In addition, the effective tax rate increased in 2010 as a result of the November 2010 settlement PHI reached with the IRS with respect to its Federal tax returns for the years 1996 to 2002. In connection with the settlement, PHI reallocated certain amounts on deposit with the IRS since 2006 among liabilities in the settlement years and subsequent years. In light of the settlement and reallocations, DPL recalculated the estimated interest due for the tax years 1996 to 2002. The revised estimate resulted in an additional $3 million (after-tax) of estimated interest due to the IRS. This expense was partially offset by the reversal of $2 million of previously recorded tax liabilities.
Capital Requirements
Sources of Capital
DPL has a range of capital sources available, in addition to internally generated funds, to meet its long-term and short-term funding needs. The sources of long-term funding include the issuance of mortgage bonds and other debt securities and bank financings, as well as the ability to issue preferred stock. Proceeds from long-term financings are used primarily to fund long-term capital requirements, such as capital expenditures, and to repay or refinance existing indebtedness. DPL traditionally has used a number of sources to fulfill short-term funding needs, including commercial paper, short-term notes, bank lines of credit, and borrowings under the PHI money pool. Proceeds from short-term borrowings are used primarily to meet working capital needs, but may also be used to temporarily fund long-term capital requirements. DPL’s ability to generate funds from its operations and to access the capital and credit markets is subject to risks and uncertainties. Volatile and deteriorating financial market conditions, diminished liquidity and tightening credit may affect access to certain of DPL’s potential funding sources. See “Risk Factors,” for additional discussion of important factors that may have an effect on DPL’s sources of capital.
Debt Securities
DPL has a Mortgage and Deed of Trust (the Mortgage) under which it issues First Mortgage Bonds. First Mortgage Bonds issued under the Mortgage are secured by a lien on substantially all of DPL’s property, plant and equipment. The principal amount of First Mortgage Bonds that DPL may issue under the Mortgage is limited by the principal amount of retired First Mortgage Bonds and 60% of the lesser of the cost or fair value of new property additions that have not been used as the basis for the issuance of additional First Mortgage Bonds. DPL also has an Indenture under which it issues unsecured senior notes, medium-term notes and VRDBs. To fund the construction of pollution control facilities, DPL also has from time to time issued tax-exempt bonds, including tax-exempt VRDBs, through a public agency, the proceeds of which are loaned to DPL by the agency.
112
DPL
Information concerning the principal amount and terms of DPL’s outstanding First Mortgage Bonds, senior notes, medium-term notes and VRDBs, and tax-exempt bonds issued for the benefit of DPL, as of December 31, 2011, is set forth in Note (11), “Debt,” to the financial statements of DPL.
Bank Financing
As further discussed in Note (11), “Debt,” to the financial statements of DPL, DPL is a borrower under a $1.5 billion credit facility, along with PHI, Pepco and ACE, which expires in 2016. DPL’s credit limit under the facility is the lesser of $250 million and the maximum amount of short-term debt DPL is permitted to have outstanding by its regulatory authorities. The short-term borrowing limit established by FERC for DPL is $500 million.
Commercial Paper Program
DPL maintains an ongoing commercial paper program of up to $500 million under which it can issue commercial paper with maturities of up to 270 days. The commercial paper is backed by DPL’s borrowing capacity under the $1.5 billion credit facility.
DPL had $47 million of commercial paper outstanding at December 31, 2011 and zero outstanding at December 31, 2010. The weighted average interest rates for commercial paper issued during 2011 and 2010 were 0.34%. The weighted average maturity of all commercial paper issued by DPL during 2011 and 2010 was two days.
Money Pool
DPL participates in the money pool operated by PHI under authorization received from FERC. The money pool is a cash management mechanism used by PHI and eligible subsidiaries to manage their short-term investment and borrowing requirements. PHI may invest in, but not borrow from, the money pool. Eligible subsidiaries with surplus cash may deposit those funds in the money pool. Deposits in the money pool are guaranteed by PHI. Eligible subsidiaries with cash requirements may borrow from the money pool. Borrowings from the money pool are unsecured. Depositors in the money pool receive, and borrowers from the money pool pay, an interest rate based primarily on PHI’s short-term borrowing rate. PHI deposits funds in the money pool to the extent that the pool has insufficient funds to meet the borrowing needs of its participants, which PHI may obtain from external sources.
Regulatory Restrictions on Financing Activities
DPL’s long-term financing activities (including the issuance of securities and the incurrence of debt) is subject to authorization by the DPSC and the MPSC. Through its periodic filings with the respective utility commissions, DPL generally maintains standing authority sufficient to cover its projected financing needs over a multi-year period. Under the FPA, FERC has jurisdiction over the issuance of long-term and short-term securities of public utilities, but only if the issuance is not regulated by the state public utility commission in which the public utility is organized and operating. DPL has obtained FERC authorization for the issuance of short-term debt under these provisions.
Capital Expenditures
DPL’s capital expenditures for the year ended December 31, 2011, totaled $229 million. These expenditures were primarily related to capital costs associated with new customer services, distribution reliability and transmission. The expenditures also include an allocation by PHI of hardware and software expenditures that primarily benefit Power Delivery and are allocated to DPL when the assets are placed in service.
113
DPL
The following table shows DPL’s projected capital expenditures for the five-year period 2012 through 2016. DPL expects to fund these expenditures through internally generated cash, external financing and capital contributions from PHI.
| For the Year |
| |||||||||||||||||||||||
| 2012 | 2013 | 2014 | 2015 | 2016 | Total | |||||||||||||||||||
| (millions of dollars) | ||||||||||||||||||||||||
DPL | ||||||||||||||||||||||||
Distribution | $ | 136 | $ | 153 | $ | 144 | $ | 144 | $ | 161 | $ | 738 | ||||||||||||
Distribution – Blueprint for the Future | 44 | 2 | — | — | — | 46 | ||||||||||||||||||
Transmission | 148 | 93 | 128 | 120 | 116 | 605 | ||||||||||||||||||
Transmission – MAPP | 4 | 1 | 1 | 3 | 58 | 67 | ||||||||||||||||||
Gas Delivery | 22 | 23 | 23 | 25 | 27 | 120 | ||||||||||||||||||
Other | 52 | 29 | 20 | 14 | 17 | 132 | ||||||||||||||||||
|
|
|
|
|
|
|
|
|
|
|
| |||||||||||||
Total DPL | $ | 406 | $ | 301 | $ | 316 | $ | 306 | $ | 379 | $ | 1,708 | ||||||||||||
|
|
|
|
|
|
|
|
|
|
|
| |||||||||||||
Transmission and Distribution
The projected capital expenditures listed in the table above for distribution (other than Blueprint for the Future), transmission (other than the MAPP project) and gas delivery are primarily for facility replacements and upgrades to accommodate customer growth and service reliability, including capital expenditures for reliability enhancement efforts.
Blueprint for the Future
DPL has undertaken programs to install smart meters, further automate its electric distribution systems and enhance its communications infrastructure, which it refers to as the Blueprint for the Future. For a discussion of the Blueprint for the Future initiative, see PHI’s “Management’s Discussion and Analysis of Financial Condition and Results of Operations – General Overview—Blueprint for the Future.” The projected capital expenditures over the next five years are shown as Distribution – Blueprint for the Future in the table above.
MAPP Project
PHI has under development the construction of a new 152-mile, interstate transmission line as part of PJM’s regional transmission expansion plan. The projected capital expenditures over the next five years for MAPP are shown as Transmission – MAPP in the table above.
MAPP/DOE Loan Program
To assist in the funding of the MAPP project, PHI has applied for a $684 million loan guarantee from the DOE for a substantial portion of the MAPP project, primarily the Calvert Cliffs to Indian River segment. The application has been made under a federal loan guarantee program for projects that employ innovative energy efficiency, renewable energy and advanced transmission and distribution technologies. If granted, PHI believes the guarantee could allow PHI to acquire financing at a lower cost than it would otherwise be able to obtain in the capital markets. Whether PHI’s application will be granted and, if so, the amount of debt guaranteed is subject to the discretion of the DOE and the negotiation of terms that will satisfy the conditions of the guarantee program. On February 28, 2011,
114
DPL
the DOE issued a Notice of Intent to prepare an Environmental Impact Statement to assist the DOE in assessing the environmental impact of constructing the portion of the MAPP project to be supported by the loan guarantee. Since February 2011, the DOE has conducted field inspections of the entire route and has held public meetings to obtain input from the communities along the route.
The DOE’s review of the loan guarantee program has delayed the DOE’s review of PHI’s loan guarantee application. There is not an approval deadline under the loan guarantee program, but this program could change or be terminated in the future. PHI continues to coordinate environmental activities with the DOE.
Pension and Other Postretirement Benefit Plans
DPL participates in pension and OPEB plans sponsored by PHI for its employees. DPL contributed $40 million and zero to the PHI Retirement Plan during 2011 and 2010, respectively.
On January 31, 2012, DPL made an $85 million discretionary tax-deductible contribution to the PHI Retirement Plan.
115
ACE
MANAGEMENT’S DISCUSSION AND ANALYSIS OF FINANCIAL CONDITION AND RESULTS OF OPERATIONS
Atlantic City Electric Company
ACE meets the conditions set forth in General Instruction I(1)(a) and (b) to Form 10-K, and accordingly information otherwise required under this Item has been omitted in accordance with General Instruction I(2)(a) to Form 10-K.
General Overview
ACE is engaged in the transmission and distribution of electricity in southern New Jersey. ACE also provides Default Electricity Supply, which is the supply of electricity at regulated rates to retail customers in its service territory who do not elect to purchase electricity from a competitive energy supplier. Default Electricity Supply is known as BGS in New Jersey. ACE’s service territory covers approximately 2,700 square miles and has a population of approximately 1.1 million.
ACE is a wholly owned subsidiary of Conectiv, which is wholly owned by PHI. Because PHI is a public utility holding company subject to PUHCA 2005, the relationship between PHI and ACE and certain activities of ACE are subject to FERC’s regulatory oversight under PUHCA 2005.
Blueprint for the Future
ACE is participating in a PHI initiative referred to as “Blueprint for the Future,” which is designed to meet the challenges of rising energy costs, concerns about the environment, improved reliability and government energy reduction goals. For a discussion of the Blueprint for the Future initiative, see PHI’s “Management’s Discussion and Analysis of Financial Condition and Results of Operations – General Overview—Blueprint for the Future.”
Regulatory Lag
An important factor in ACE’s ability to earn its authorized rate of return is the willingness of the NJBPU to adequately recognize forward-looking costs in ACE’s rate structure in order to minimize the shortfall in revenues due to the delay in time or “lag” between when costs are incurred and when they are reflected in rates. This delay is commonly known as “regulatory lag.” ACE is currently experiencing significant regulatory lag because its investment in the rate base and its operating expenses are outpacing revenue growth. The NJBPU has approved certain rate recovery mechanisms in connection with ACE’s Infrastructure Investment Program (IIP), which ACE has proposed to extend and expand. There can be no assurance that this proposal or any other attempts by ACE to mitigate regulatory lag will be approved, or that even if approved, the rate recovery mechanisms or any base rate cases will fully ameliorate the effects of regulatory lag. Until such time as this proposed mechanism is approved, if necessary to address the problem of regulatory lag, ACE plans to file rate cases at least annually in an effort to align more closely its revenue and related cash flow levels with other operation and maintenance spending and capital investments. In future rate cases, ACE would also continue to seek cost recovery and tracking mechanisms from applicable regulatory commissions to reduce the effects of regulatory lag.
116
ACE
Results of Operations
The following results of operations discussion compares the year ended December 31, 2011 to the year ended December 31, 2010. All amounts in the tables (except sales and customers) are in millions of dollars.
Operating Revenue
| 2011 | 2010 | Change | ||||||||||
Regulated T&D Electric Revenue | $ | 386 | $ | 415 | $ | (29 | ) | |||||
Default Electricity Supply Revenue | 865 | 998 | (133 | ) | ||||||||
Other Electric Revenue | 17 | 17 | — | |||||||||
|
|
|
|
|
| |||||||
Total Operating Revenue | $ | 1,268 | $ | 1,430 | $ | (162 | ) | |||||
|
|
|
|
|
| |||||||
The table above shows the amount of Operating Revenue earned that is subject to price regulation (Regulated T&D Electric Revenue and Default Electricity Supply Revenue) and that which is not subject to price regulation (Other Electric Revenue).
Regulated T&D Electric Revenue includes revenue from the distribution of electricity, including the distribution of Default Electricity Supply, to ACE’s customers within its service territory at regulated rates. Regulated T&D Electric Revenue also includes transmission service revenue that ACE receives as a transmission owner from PJM at rates regulated by FERC. Transmission rates are updated annually based on a FERC-approved formula methodology.
Default Electricity Supply Revenue is the revenue received from the supply of electricity by ACE at regulated rates to retail customers who do not elect to purchase electricity from a competitive supplier, also known as BGS. The costs related to Default Electricity Supply are included in Purchased Energy. Default Electricity Supply Revenue also includes revenue from Transition Bond Charges that ACE receives, and pays to ACE Funding, to fund the principal and interest payments on Transition Bonds issued by ACE Funding, and revenue in the form of transmission enhancement credits.
Other Electric Revenue includes work and services performed on behalf of customers, including other utilities, which is generally not subject to price regulation. Work and services includes mutual assistance to other utilities, highway relocation, rentals of pole attachments, late payment fees, and collection fees.
Regulated T&D Electric
| 2011 | 2010 | Change | ||||||||||
Regulated T&D Electric Revenue | ||||||||||||
Residential | $ | 167 | $ | 185 | $ | (18 | ) | |||||
Commercial and industrial | 124 | 142 | (18 | ) | ||||||||
Transmission and other | 95 | 88 | 7 | |||||||||
|
|
|
|
|
| |||||||
Total Regulated T&D Electric Revenue | $ | 386 | $ | 415 | $ | (29 | ) | |||||
|
|
|
|
|
| |||||||
117
ACE
| 2011 | 2010 | Change | ||||||||||
Regulated T&D Electric Sales (GWh) | ||||||||||||
Residential | 4,479 | 4,691 | (212 | ) | ||||||||
Commercial and industrial | 5,157 | 5,445 | (288 | ) | ||||||||
Transmission and other | 47 | 49 | (2 | ) | ||||||||
|
|
|
|
|
| |||||||
Total Regulated T&D Electric Sales | 9,683 | 10,185 | (502 | ) | ||||||||
|
|
|
|
|
| |||||||
| 2011 | 2010 | Change | ||||||||||
Regulated T&D Electric Customers (in thousands) | ||||||||||||
Residential | 481 | 482 | (1 | ) | ||||||||
Commercial and industrial | 65 | 65 | — | |||||||||
Transmission and other | 1 | 1 | — | |||||||||
|
|
|
|
|
| |||||||
Total Regulated T&D Electric Customers | 547 | 548 | (1 | ) | ||||||||
|
|
|
|
|
| |||||||
Regulated T&D Electric Revenue decreased by $29 million primarily due to:
A decrease of $30 million due to a New Jersey Societal Benefit Charge rate decrease that became effective in January 2011 (which is offset in Deferred Electric Service Costs).
A decrease of $8 million due to lower non-weather related average customer usage.
A decrease of $7 million due to lower sales as a result of cooler weather during the spring and summer months of 2011, and warmer weather during the fall months of 2011, as compared to the corresponding periods in 2010.
The aggregate amount of these decreases was partially offset by:
An increase of $9 million due to a distribution rate increase that became effective in June 2010.
An increase of $7 million in transmission revenue primarily attributable to higher rates effective June 1, 2010 and June 1, 2011 related to increases in transmission plant investment.
Default Electricity Supply
| 2011 | 2010 | Change | ||||||||||
Default Electricity Supply Revenue | ||||||||||||
Residential | $ | 495 | $ | 580 | $ | (85 | ) | |||||
Commercial and industrial | 237 | 243 | (6 | ) | ||||||||
Other | 133 | 175 | (42 | ) | ||||||||
|
|
|
|
|
| |||||||
Total Default Electricity Supply Revenue | $ | 865 | $ | 998 | $ | (133 | ) | |||||
|
|
|
|
|
| |||||||
Other Default Electricity Supply Revenue consists primarily of: (i) revenue from the resale in the PJM RTO market of energy and capacity purchased under contracts with unaffiliated NUGs, and (ii) revenue from transmission enhancement credits.
| 2011 | 2010 | Change | ||||||||||
Default Electricity Supply Sales (GWh) | ||||||||||||
Residential | 3,919 | 4,610 | (691 | ) | ||||||||
Commercial and industrial | 1,469 | 1,967 | (498 | ) | ||||||||
Other | 36 | 46 | (10 | ) | ||||||||
|
|
|
|
|
| |||||||
Total Default Electricity Supply Sales | 5,424 | 6,623 | (1,199 | ) | ||||||||
|
|
|
|
|
| |||||||
118
ACE
| 2011 | 2010 | Change | ||||||||||
Default Electricity Supply Customers (in thousands) | ||||||||||||
Residential | 419 | 458 | (39 | ) | ||||||||
Commercial and industrial | 50 | 56 | (6 | ) | ||||||||
Other | — | — | — | |||||||||
|
|
|
|
|
| |||||||
Total Default Electricity Supply Customers | 469 | 514 | (45 | ) | ||||||||
|
|
|
|
|
| |||||||
Default Electricity Supply Revenue decreased by $133 million primarily due to:
A decrease of $98 million due to lower sales, primarily as a result of residential and commercial customer migration to competitive suppliers.
A decrease of $40 million in wholesale energy and capacity resale revenues primarily due to the sale of lower volumes of electricity and capacity purchased from NUGs.
A decrease of $21 million due to lower sales as a result of cooler weather during the spring and summer months of 2011, and warmer weather during the fall months of 2011, as compared to the corresponding periods in 2010.
A decrease of $11 million due to lower non-weather related average customer usage.
A decrease of $3 million due to a decrease in revenue from transmission enhancement credits.
The aggregate amount of these decreases was partially offset by:
An increase of $39 million as a result of higher Default Electricity Supply rates, primarily due to a Non-utility Generation Charge rate increase that became effective in January 2011.
Total Default Electricity Supply Revenue for the 2011 period includes a decrease of $8 million in unbilled revenue attributable to ACE’s BGS ($5 million decrease in net income), primarily due to lower customer usage and lower Default Electricity Supply rates during the unbilled revenue period at the end of 2011 as compared to the corresponding period in 2010. Under the BGS terms approved by the NJBPU, ACE’s BGS unbilled revenue is not included in the deferral calculation until it is billed to customers, and therefore has an impact on the results of operations in the period during which it is accrued.
For the years ended December 31, 2011 and 2010, the percentages of ACE’s total distribution sales that are derived from customers receiving Default Electricity Supply are 56% and 65%, respectively.
Operating Expenses
Purchased Energy
Purchased Energy consists of the cost of electricity purchased by ACE to fulfill its Default Electricity Supply obligation and, as such, is recoverable from customers in accordance with the terms of public service commission orders. Purchased Energy decreased by $223 million to $807 million in 2011 from $1,030 million in 2010 primarily due to:
A decrease of $138 million primarily due to customer migration to competitive suppliers.
A decrease of $69 million due to lower average electricity costs under Default Electricity Supply contracts.
119
ACE
A decrease of $16 million due to lower electricity sales primarily as a result of cooler weather during the spring and summer months of 2011, and warmer weather during the fall months of 2011, as compared to 2010.
Other Operation and Maintenance
Other Operation and Maintenance increased by $22 million to $226 million in 2011 from $204 million in 2010 primarily due to:
An increase of $5 million associated with higher tree trimming and preventative maintenance costs.
An increase of $5 million related to New Jersey Societal Benefit Program costs that are deferred and recoverable.
An increase of $4 million in employee-related costs, primarily benefit expenses.
An increase of $3 million in corporate cost allocations.
An increase of $2 million in costs related to customer requested and mutual assistance work (primarily offset in other T&D Electric Revenues).
An increase of $2 million in emergency restoration and reliability improvement, communication and customer support service costs.
The aggregate amount of these increases was partially offset by:
A decrease of $4 million in emergency restoration costs due to higher storm activity in 2010, primarily the severe winter storms of February 2010. In 2011, ACE incurred significant incremental restoration costs for repair work following Hurricane Irene in August 2011 of $7 million, but such costs were deferred as a regulatory asset to reflect the probable recovery of these storm costs. Approximately $3 million of these total incremental storm costs have been estimated for the cost of restoration services provided by outside contractors. Since the invoices for such services had not been received at December 31, 2011, actual invoices may vary from these estimates. ACE currently plans to seek recovery of the incremental Hurricane Irene costs as discussed in Note (7), “Regulatory Matters — Regulatory Proceedings — Rate Proceedings.”
Restructuring Charge
As a result of PHI’s organizational review in the second quarter of 2010, ACEs operating expenses include a pre-tax restructuring charge of $6 million for the year ended December 31, 2010, related to severance and health and welfare benefits to be provided to terminated employees.
Depreciation and Amortization
Depreciation and Amortization expense increased by $22 million to $134 million in 2011 from $112 million in 2010 primarily due to:
An increase of $16 million in amortization of stranded costs as the result of higher revenue due to rate increases effective October 2010 for the ACE Transition Bond Charge and Market Transition Charge Tax (partially offset in Default Electricity Supply Revenue).
An increase of $6 million due to utility plant additions.
120
ACE
Deferred Electric Service Costs
Deferred Electric Service Costs represent (i) the over or under recovery of electricity costs incurred by ACE to fulfill its Default Electricity Supply obligation and (ii) the over or under recovery of New Jersey Societal Benefit Program costs incurred by ACE. The cost of electricity purchased is reported under Purchased Energy and the corresponding revenue is reported under Default Electricity Supply Revenue. The cost of New Jersey Societal Benefit Programs is reported under Other Operation and Maintenance and the corresponding revenue is reported under Regulated T&D Electric Revenue.
Deferred Electric Service Costs increased by $45 million, to an expense reduction of $63 million in 2011 as compared to an expense reduction of $108 million in 2010, primarily due to higher Default Electricity Supply Revenue rates and lower electricity supply costs.
Income Tax Expense
ACE’s consolidated effective tax rates for the years ended December 31, 2011 and 2010 were 45.8% and 44.8%, respectively. The increase in the rate is primarily the result of the recalculation of interest on uncertain and effectively settled tax positions. During 2011, PHI reached a settlement with the IRS with respect to interest due on its federal tax liabilities related to the November 2010 audit settlement for years 1996 through 2002. In connection with this agreement, PHI reallocated certain amounts that have been on deposit with the IRS since 2006 among liabilities in the settlement years and subsequent years. Primarily related to the settlement and reallocations, ACE has recorded an additional $1 million (after-tax) of interest due to the IRS. This additional interest expense was recorded in the second quarter of 2011. This is further impacted by the adjustment recorded in the third quarter of 2011 related to the recalculation of interest on its uncertain tax positions for open tax years using different assumptions related to the application of its deposit made with the IRS in 2006. This resulted in an additional tax expense of $3 million (after-tax).
Capital Requirements
Sources of Capital
ACE has a range of capital sources available, in addition to internally generated funds, to meet its long-term and short-term funding needs. The sources of long-term funding include the issuance of mortgage bonds and other debt securities and bank financings, as well as preferred stock. Proceeds from long-term financings are used primarily to fund long-term capital requirements, such as capital expenditures, and to repay or refinance existing indebtedness. ACE traditionally has used a number of sources to fulfill short-term funding needs, including commercial paper, short-term notes, bank lines of credit, and under certain circumstances, borrowings under the PHI money pool. Proceeds from short-term borrowings are used primarily to meet working capital needs, but may also be used to temporarily fund long-term capital requirements. ACE’s ability to generate funds from its operations and to access the capital and credit markets is subject to risks and uncertainties. Volatile and deteriorating financial market conditions, diminished liquidity and tightening credit may affect access to certain of ACE’s potential funding sources. See “Risk Factors,” for additional discussion of important factors that may have an effect on ACE’s sources of capital.
Debt Securities
ACE has a Mortgage and Deed of Trust (the Mortgage) under which it issues First Mortgage Bonds. First Mortgage Bonds issued under the Mortgage are secured by a lien on substantially all of ACE’s property, plant and equipment. The principal amount of First Mortgage Bonds that ACE may issue under the Mortgage is limited by the principal amount of retired First Mortgage Bonds and 65% of the lesser of the cost or fair value of new property additions that have not been used as the basis for the issuance of additional First Mortgage Bonds. ACE also has an Indenture under which it issues senior notes secured by First Mortgage Bonds and an Indenture under which it can issue unsecured debt securities, including VRDBs. To fund the construction of pollution control facilities, ACE also has from time to time issued tax-exempt bonds, including tax-exempt VRDBs, through a municipality, the proceeds of which are loaned to ACE by the municipality.
121
ACE
Information concerning the principal amount and terms of ACE’s outstanding First Mortgage Bonds, senior notes and VRDBs, and tax-exempt bonds issued for the benefit of ACE, as of December 31, 2011, is set forth in Note (10), “Debt,” to the consolidated financial statements of ACE.
Bank Financing
As further discussed in Note (10), “Debt,” to the consolidated financial statements of ACE, ACE is a borrower under a $1.5 billion credit facility, along with PHI, Pepco and DPL, which expires in 2016. ACE’s credit limit under the facility is the lesser of $250 million and the maximum amount of short-term debt ACE is permitted to have outstanding by its regulatory authorities. The short-term borrowing limit established by the NJBPU for ACE is $250 million.
Commercial Paper Program
ACE maintains an ongoing commercial paper program of up to $250 million under which it can issue commercial paper with maturities of up to 270 days. The commercial paper is backed by ACE’s borrowing capacity under the $1.5 billion credit facility.
ACE had no commercial paper outstanding at December 31, 2011 and $158 million of commercial paper outstanding at December 31, 2010. The weighted average interest rates for commercial paper issued during 2011 and 2010 were 0.33% and 0.36%, respectively. The weighted average maturity of all commercial paper issued by ACE during 2011 and 2010 was six days and seven days, respectively.
Money Pool
ACE participates in the money pool operated by PHI under authorization received from the NJBPU. The money pool is a cash management mechanism used by PHI and eligible subsidiaries to manage their short-term investment and borrowing requirements. PHI may invest in, but not borrow from, the money pool. Eligible subsidiaries with surplus cash may deposit those funds in the money pool. Deposits in the money pool are guaranteed by PHI. Eligible subsidiaries with cash requirements may borrow from the money pool. Borrowings from the money pool are unsecured. Depositors in the money pool receive, and borrowers from the money pool pay, an interest rate based primarily on PHI’s short-term borrowing rate. PHI deposits funds in the money pool to the extent that the pool has insufficient funds to meet the borrowing needs of its participants, which PHI may obtain from external sources. By regulatory order, the NJBPU has restricted ACE’s participation in the PHI money pool. ACE may not invest in the money pool, but may borrow from it if the rates are lower than the rates at which ACE could borrow funds externally.
Preferred Stock
Under its Certificate of Incorporation, ACE is authorized to issue and have outstanding up to (i) 799,979 shares of Cumulative Preferred Stock, (ii) 2 million shares of No Par Preferred Stock and (iii) 3 million shares of Preference Stock, each such type of preferred stock having such terms and conditions as are set forth in or authorized by the Certificate of Incorporation. Information concerning the numbers of shares and the terms of ACE’s outstanding shares of Cumulative Preferred Stock as of December 31, 2011 and 2010, is set forth in Note (12), “Preferred Stock,” to the consolidated financial statements of ACE. As of December 31, 2011, ACE had no shares of preferred stock outstanding.
122
ACE
Regulatory Restrictions on Financing Activities
ACE’s long-term and short-term (consisting of debt instruments with a maturity of one year or less) financing activities are subject to authorization by the NJBPU. Through its periodic filings with the NJBPU, ACE generally maintains standing authority sufficient to cover its projected financing needs over a multi-year period. ACE’s long-term and short-term financing activities do not require FERC approval.
State corporate laws impose limitations on the funds that can be used to pay dividends. In addition, ACE must obtain the approval of the NJBPU before dividends can be paid if its equity as a percent of its total capitalization, excluding securitization debt, falls below 30%. As of December 31, 2011, ACE complied with this requirement without the need to seek approval of the NJBPU.
Capital Expenditures
ACE’s capital expenditures for the year ended December 31, 2011, totaled $138 million. These expenditures were primarily related to capital costs associated with new customer services, distribution reliability and transmission. The expenditures also include an allocation by PHI of hardware and software expenditures that primarily benefit Power Delivery and are allocated to ACE when the assets are placed in service.
The following table shows ACE’s updated projected capital expenditures for the five-year period 2012 through 2016. ACE expects to fund these expenditures through internally generated cash, external financing and capital contributions from PHI.
| For the Year | ||||||||||||||||||||||||
| 2012 | 2013 | 2014 | 2015 | 2016 | Total | |||||||||||||||||||
| (millions of dollars) | ||||||||||||||||||||||||
ACE | ||||||||||||||||||||||||
Distribution | $ | 144 | $ | 159 | $ | 146 | $ | 147 | $ | 144 | $ | 740 | ||||||||||||
Distribution—Blueprint for the Future | — | — | — | 9 | 92 | 101 | ||||||||||||||||||
Transmission | 53 | 74 | 82 | 77 | 71 | 357 | ||||||||||||||||||
Other | 32 | 21 | 13 | 12 | 14 | 92 | ||||||||||||||||||
|
|
|
|
|
|
|
|
|
|
|
| |||||||||||||
Sub-Total | 229 | 254 | 241 | 245 | 321 | 1,290 | ||||||||||||||||||
DOE Capital Reimbursement Awards (a) | (4 | ) | (1 | ) | — | — | — | (5 | ) | |||||||||||||||
|
|
|
|
|
|
|
|
|
|
|
| |||||||||||||
Total ACE | $ | 225 | $ | 253 | $ | 241 | $ | 245 | $ | 321 | $ | 1,285 | ||||||||||||
|
|
|
|
|
|
|
|
|
|
|
| |||||||||||||
| (a) | Reflects anticipated reimbursements pursuant to awards from
|
123
ACE
The IRS has announced that, to the extent these grants are expended on capital items, they will not be considered taxable income.
Transmission and Distribution
The projected capital expenditures listed in the table for distribution (other than Blueprint for the Future) and transmission are primarily for facility replacements and upgrades to accommodate customer growth and reliability, including continued capital expenditures for reliability enhancement efforts.
Blueprint for the Future
ACE has undertaken programs to install smart meters (for which approval by the NJBPU has been deferred), further automate its electric distribution systems and enhance its communications infrastructure, which it refers to as the Blueprint for the Future. For a discussion of the Blueprint for the Future initiative, see PHI’s “Management’s Discussion and Analysis of Financial Condition and Results of Operations – General Overview—Blueprint for the Future.” The projected capital expenditures over the next five years are shown as Distribution—Blueprint for the Future in the table above.
Infrastructure Investment Plan
In 2009, the NJBPU approved ACE’s proposed Infrastructure Investment Plan and the revenue requirement associated with recovering the cost of the related projects, subject to a prudency review in the next rate case. The approved projects were designed to enhance reliability of ACE’s distribution system and support economic activity and job growth in New Jersey in the near term. ACE was granted cost recovery through an Infrastructure Investment Surcharge, which became effective on June 1, 2009. This approved plan was completed in 2011 and has added incremental capital spending of approximately $28 million since 2009. In 2011, ACE proposed a new Infrastructure Investment Plan that if approved by the NJBPU, would be expected to add an additional $63 million of capital spending for 2012, which is included in Distribution in the table above.
DOE Capital Reimbursement Awards
In 2009, the DOE announced a $168 million award to PHI under the American Recovery and Reinvestment Act of 2009 for the implementation of an advanced metering infrastructure system, direct load control, distribution automation, and communications infrastructure, of which $19 million was for ACE’s service territory.
In April 2010, PHI and the DOE signed agreements formalizing ACE’s $19 million share of the $168 million award. Of the $19 million, $12 million is expected to offset incurred and projected Blueprint for the Future and other capital expenditures of ACE. The remaining $7 million will be used to offset incremental expenses associated with direct load control and other programs. In 2011, ACE received award payments of $6 million. In 2010, ACE received award payments of $2 million.
Pension and Other Postretirement Benefit Plans
ACE participates in pension and OPEB plans sponsored by PHI for its employees. ACE contributed $30 million and zero to the PHI Retirement Plan during 2011 and 2010, respectively.
On January 31, 2012, ACE made a $30 million discretionary tax-deductible contribution to the PHI Retirement Plan.
124
| Item 7A. | QUANTITATIVE AND QUALITATIVE DISCLOSURES ABOUT MARKET RISK |
Risk management policies for PHI and its subsidiaries are determined by PHI’s Corporate Risk Management Committee (CRMC), the members of which are PHI’s Chief Risk Officer, Chief Operating Officer, Chief Financial Officer, General Counsel, Chief Information Officer and other senior executives. The CRMC monitors interest rate fluctuation, commodity price fluctuation, and credit risk exposure, and sets risk management policies that establish limits on unhedged risk and determine risk reporting requirements. For information about PHI’s derivative activities, other than the information otherwise disclosed herein, refer to Note (2), “Significant Accounting Policies – Accounting For Derivatives,” Note (15), “Derivative Instruments and Hedging Activities” and Note (20), “Discontinued Operations” of the consolidated financial statements of PHI.
Pepco Holdings, Inc.
Commodity Price Risk
The Pepco Energy Services segment engages in commodity risk management activities to reduce its financial exposure to changes in the value of its assets and obligations due to commodity price fluctuations. Certain of these risk management activities are conducted using instruments classified as derivatives based on FASB guidance on derivatives and hedging, ASC 815. Pepco Energy Services also manages commodity risk with contracts that are not classified as derivatives. The primary risk management objective is to manage the spread between retail electricity and natural gas supply commitments and the cost of energy used to service those commitments in order to ensure stable and known cash flows and fix favorable prices and margins.
PHI’s risk management policies place oversight at the senior management level through the CRMC, which has the responsibility for establishing corporate compliance requirements for energy market participation. PHI collectively refers to these energy market activities, including its commodity risk management activities, as “energy commodity” activities. PHI uses a value-at-risk (VaR) model to assess the market risk of the energy commodity activities of Pepco Energy Services. PHI also uses other measures to limit and monitor risk in its energy commodity activities, including limits on the nominal size of positions and periodic loss limits. VaR represents the potential fair value loss on energy contracts or portfolios due to changes in market prices for a specified time period and confidence level. PHI uses a delta-gamma VaR estimation model. The other parameters include a 95 percent, one-tailed confidence level and a one-day holding period. Since VaR is an estimate, it is not necessarily indicative of actual results that may occur.
The table below provides the VaR associated with energy contracts of the Pepco Energy Services segment for the year ended December 31, 2011 in millions of dollars:
| VaR (a) | ||||
95% confidence level, one-day holding period, one-tailed | ||||
Period end | $ | 1 | ||
Average for the period | $ | 1 | ||
High | $ | 3 | ||
Low | $ | 1 | ||
DPL Renewable Energy Transactions
PHI, through its DPL subsidiary, has entered into four wind PPAs in the aggregate amount of 350 megawatts that include the
| (a) | This column represents all energy derivative contracts, normal purchase
|
125
Pepco Energy Services purchases electric and natural gas futures, swaps, options and forward contracts to hedge price risk in connection with the purchase of physical natural gas and electricity for distribution to customers. Pepco Energy Services accounts for its derivatives as either cash flow hedges of forecasted transactions or they are marked to market through current earnings. Forward contracts that meet the requirements for normal purchase and normal sale accounting under FASB guidance on derivatives and hedging are recorded on an accrual basis.
Credit and Nonperformance Risk
Pepco Holdings’ subsidiaries attempt to minimize credit risk exposure to wholesale energy counterparties through, among other things, formal credit policies, regular assessment of counterparty creditworthiness and the establishment of a credit limit for each counterparty, monitoring procedures that include stress testing, the use of standard agreements which allow for the netting of positive and negative exposures associated with a single counterparty and collateral requirements under certain circumstances, and have established reserves for credit losses. As of December 31, 2011, credit exposure to wholesale energy counterparties was weighted 100% with investment grade counterparties. There were no investments with counterparties without external credit-quality ratings and no investments with non-investment grade counterparties.
The following table provides information on the credit exposure on competitive wholesale energy contracts, net of collateral, to wholesale counterparties as of December 31, 2011, in millions of dollars:
Rating | Exposure Before Credit Collateral (b) | Credit Collateral (c) | Net Exposure | Number of Counterparties Greater Than 10% (d) | Net Exposure of Counterparties Greater Than 10% | |||||||||||||||
Investment Grade (a) | $ | 4 | $ | — | $ | 4 | 2 | $ | 4 | |||||||||||
Non-Investment Grade | — | — | — | — | — | |||||||||||||||
No External Ratings | — | — | — | — | — | |||||||||||||||
Credit reserves | — | |||||||||||||||||||
| (a) | Investment Grade—primarily determined using publicly available credit ratings of the
|
| (b) | Exposure before credit collateral—includes the marked to market energy contract net assets for open/unrealized transactions, the net receivable/payable for realized transactions and net open positions for contracts not marked to market. Amounts due from counterparties are offset by liabilities payable to those counterparties to the extent that legally enforceable netting arrangements are in place. Thus, this column presents the net credit exposure to counterparties after reflecting all allowable netting, but before considering collateral held. |
| (c) | Credit collateral—the face amount of cash deposits, letters of credit and performance bonds received from counterparties, not adjusted for probability of default, and, if applicable, property interests (including oil and natural gas reserves). |
| (d) | Using a percentage of the total exposure. |
Interest Rate Risk
Pepco Holdings and its subsidiaries’ variable or floating rate debt is subject to the risk of fluctuating interest rates in the normal course of business. Pepco Holdings manages interest rates through the use of fixed and, to a lesser extent, variable rate debt. The effect of a hypothetical 10% change in interest rates on the annual interest costs for short-term and variable rate debt was less than $1 million as of December 31, 2011.
126
Potomac Electric Power Company
Interest Rate Risk
Pepco’s debt is subject to the risk of fluctuating interest rates in the normal course of business. Pepco manages interest rates through the use of fixed and, to a lesser extent, variable rate debt. The effect of a hypothetical 10% change in interest rates on the annual interest costs for short-term debt and variable rate debt was less than $1 million as of December 31, 2011.
Delmarva Power & Light Company
Commodity Price Risk
DPL uses derivative instruments (forward contracts, futures, swaps, and exchange-traded and over-the-counter options) primarily to reduce natural gas commodity price volatility while limiting its customers’ exposure to increases in the market price of natural gas. DPL also manages commodity risk with capacity contracts that do not meet the definition of derivatives. The primary goal of these activities is to reduce the exposure of its regulated retail natural gas customers to natural gas price spikes. All premiums paid and other transaction costs incurred as part of DPL’s natural gas hedging activity, in addition to all gains and losses on the natural gas hedging activity, are fully recoverable through the GCR clause included in DPL’s natural gas tariff rates approved by the DPSC and are deferred until recovered. At December 31, 2011, after the effects of cash collateral and netting, DPL had a net derivative liability of $15 million, offset by a $17 million regulatory asset. At December 31, 2010, after the effects of cash collateral and netting, DPL had a net derivative liability of $23 million, offset by a $31 million regulatory asset.
Interest Rate Risk
DPL’s debt is subject to the risk of fluctuating interest rates in the normal course of business. DPL manages interest rates through the use of fixed and, to a lesser extent, variable rate debt. The effect of a hypothetical 10% change in interest rates on the annual interest costs for short-term debt and variable rate debt was less than $1 million as of December 31, 2011.
Atlantic City Electric Company
Interest Rate Risk
ACE’s debt is subject to the risk of fluctuating interest rates in the normal course of business. ACE manages interest rates through the use of fixed and, to a lesser extent, variable rate debt. The effect of a hypothetical 10% change in interest rates on the annual interest costs for short-term debt and variable rate debt was less than $1 million as of December 31, 2011.
127
| Item 8. | FINANCIAL STATEMENTS AND SUPPLEMENTARY DATA |
Listed below is a table that sets forth, for each registrant, the page number where the information is contained herein.
| Registrants | ||||||||||||||||
Item | Pepco Holdings | Pepco * | DPL * | ACE | ||||||||||||
Management’s Report on Internal Control Over Financial Reporting | 129 | 217 | 251 | 290 | ||||||||||||
Report of Independent Registered Public Accounting Firm | 130 | 218 | 252 | 291 | ||||||||||||
Consolidated Statements of Income | 131 | 219 | 253 | 292 | ||||||||||||
Consolidated Statements of Comprehensive Income | 132 | N/A | N/A | N/A | ||||||||||||
Consolidated Balance Sheets | 133 | 220 | 254 | 293 | ||||||||||||
Consolidated Statements of Cash Flows | 135 | 222 | 256 | 295 | ||||||||||||
Consolidated Statements of Equity | 136 | 223 | 257 | 296 | ||||||||||||
Notes to Consolidated Financial Statements | 137 | 224 | 258 | 297 | ||||||||||||
| * | Pepco
|
128
PEPCO HOLDINGS
Management’s Report on Internal Control over Financial Reporting
The management of Pepco Holdings is responsible for establishing and maintaining adequate internal control over financial reporting, as such term is defined in Rule 13a-15(f) and Rule 15d-15(f) under the Exchange Act. Because of its inherent limitations, internal control over financial reporting may not prevent or detect misstatements. Also, projections of any evaluation of effectiveness to future periods are subject to the risk that controls may become inadequate because of changes in conditions, or that the degree of compliance with the policies or procedures may deteriorate.
Management of Pepco Holdings assessed Pepco Holding’s internal control over financial reporting as of December 31, 2011 based on the framework inInternal Control – Integrated Framework issued by the Committee of Sponsoring Organizations of the Treadway Commission. Based on its assessment, the management of Pepco Holdings concluded that Pepco Holdings’ internal control over financial reporting was effective as of December 31, 2011.
PricewaterhouseCoopers LLP, the independent registered public accounting firm that audited the consolidated financial statements of Pepco Holdings included in this Annual Report on Form 10-K, has also issued its attestation report on the effectiveness of Pepco Holdings’ internal control over financial reporting, which is included herein.
129
PEPCO HOLDINGS
Report of Independent Registered Public Accounting Firm
To the Shareholders and Board of Directors of
Pepco Holdings, Inc.
In our opinion, the consolidated financial statements listed in the accompanying index appearing under Item 15(a)(1) present fairly, in all material respects, the financial position of Pepco Holdings, Inc. and its subsidiaries at December 31, 2011 and December 31, 2010, and the results of their operations and their cash flows for each of the three years in the period ended December 31, 2011 in conformity with accounting principles generally accepted in the United States of America. In addition, in our opinion, the financial statement schedules listed in the accompanying index appearing under Item 15(a)(2) present fairly, in all material respects, the information set forth therein when read in conjunction with the related consolidated financial statements. Also in our opinion, the Company maintained, in all material respects, effective internal control over financial reporting as of December 31, 2011, based on criteria established inInternal Control—Integrated Framework issued by the Committee of Sponsoring Organizations of the Treadway Commission (COSO). The Company’s management is responsible for these financial statements and financial statement schedules, for maintaining effective internal control over financial reporting and for its assessment of the effectiveness of internal control over financial reporting, included in the accompanying Management’s Report on Internal Control over Financial Reporting. Our responsibility is to express opinions on these financial statements, on the financial statement schedules, and on the Company’s internal control over financial reporting based on our integrated audits. We conducted our audits in accordance with the standards of the Public Company Accounting Oversight Board (United States). Those standards require that we plan and perform the audits to obtain reasonable assurance about whether the financial statements are free of material misstatement and whether effective internal control over financial reporting was maintained in all material respects. Our audits of the financial statements included examining, on a test basis, evidence supporting the amounts and disclosures in the financial statements, assessing the accounting principles used and significant estimates made by management, and evaluating the overall financial statement presentation. Our audit of internal control over financial reporting included obtaining an understanding of internal control over financial reporting, assessing the risk that a material weakness exists, and testing and evaluating the design and operating effectiveness of internal control based on the assessed risk. Our audits also included performing such other procedures as we considered necessary in the circumstances. We believe that our audits provide a reasonable basis for our opinions.
A company’s internal control over financial reporting is a process designed to provide reasonable assurance regarding the reliability of financial reporting and the preparation of financial statements for external purposes in accordance with generally accepted accounting principles. A company’s internal control over financial reporting includes those policies and procedures that (i) pertain to the maintenance of records that, in reasonable detail, accurately and fairly reflect the transactions and dispositions of the assets of the company; (ii) provide reasonable assurance that transactions are recorded as necessary to permit preparation of financial statements in accordance with generally accepted accounting principles, and that receipts and expenditures of the company are being made only in accordance with authorizations of management and directors of the company; and (iii) provide reasonable assurance regarding prevention or timely detection of unauthorized acquisition, use, or disposition of the company’s assets that could have a material effect on the financial statements.
Because of its inherent limitations, internal control over financial reporting may not prevent or detect misstatements. Also, projections of any evaluation of effectiveness to future periods are subject to the risk that controls may become inadequate because of changes in conditions, or that the degree of compliance with the policies or procedures may deteriorate.
/s/ PricewaterhouseCoopers LLP
Washington, D.C.
February 23, 2012
130
PEPCO HOLDINGS
PEPCO HOLDINGS, INC. AND SUBSIDIARIES
CONSOLIDATED STATEMENTS OF INCOME
For the Year Ended December 31, | 2011 | 2010 | 2009 | |||||||||
| (millions of dollars, except per share data) | ||||||||||||
Operating Revenue | ||||||||||||
Power Delivery | $ | 4,650 | $ | 5,114 | $ | 4,980 | ||||||
Pepco Energy Services | 1,238 | 1,883 | 2,383 | |||||||||
Other | 32 | 42 | 39 | |||||||||
|
|
|
|
|
| |||||||
Total Operating Revenue | 5,920 | 7,039 | 7,402 | |||||||||
|
|
|
|
|
| |||||||
Operating Expenses | ||||||||||||
Fuel and purchased energy | 3,422 | 4,631 | 5,330 | |||||||||
Other services cost of sales | 172 | 140 | 85 | |||||||||
Other operation and maintenance | 914 | 884 | 819 | |||||||||
Restructuring charge | — | 30 | — | |||||||||
Depreciation and amortization | 426 | 393 | 349 | |||||||||
Other taxes | 451 | 434 | 368 | |||||||||
Gain on early termination of finance leases held in trust | (39 | ) | — | — | ||||||||
Deferred electric service costs | (63 | ) | (108 | ) | (161 | ) | ||||||
Impairment losses | — | — | 4 | |||||||||
Effects of Pepco divestiture-related claims | — | 11 | (40 | ) | ||||||||
|
|
|
|
|
| |||||||
Total Operating Expenses | 5,283 | 6,415 | 6,754 | |||||||||
|
|
|
|
|
| |||||||
Operating Income | 637 | 624 | 648 | |||||||||
|
|
|
|
|
| |||||||
Other Income (Expenses) | ||||||||||||
Interest and dividend income | 1 | — | 2 | |||||||||
Interest expense | (254 | ) | (306 | ) | (340 | ) | ||||||
(Loss) gain from equity investments | (3 | ) | (1 | ) | 2 | |||||||
Loss on extinguishment of debt | — | (189 | ) | — | ||||||||
Impairment losses | (5 | ) | — | — | ||||||||
Other income | 33 | 22 | 16 | |||||||||
Other expenses | — | — | (1 | ) | ||||||||
|
|
|
|
|
| |||||||
Total Other Expenses | (228 | ) | (474 | ) | (321 | ) | ||||||
|
|
|
|
|
| |||||||
Income from Continuing Operations Before Income Tax Expense | 409 | 150 | 327 | |||||||||
Income Tax Expense Related to Continuing Operations | 149 | 11 | 104 | |||||||||
|
|
|
|
|
| |||||||
Net Income from Continuing Operations | 260 | 139 | 223 | |||||||||
(Loss) Income from Discontinued Operations, net of Income Taxes | (3 | ) | (107 | ) | 12 | |||||||
|
|
|
|
|
| |||||||
Net Income | $ | 257 | $ | 32 | $ | 235 | ||||||
|
|
|
|
|
| |||||||
Basic and Diluted Share Information | ||||||||||||
Weighted average shares outstanding (millions) | 226 | 224 | 221 | |||||||||
|
|
|
|
|
| |||||||
Earnings per share of common stock from Continuing Operations | $ | 1.15 | $ | 0.62 | $ | 1.01 | ||||||
(Loss) earnings per share of common stock from Discontinued Operations | (0.01 | ) | (0.48 | ) | 0.05 | |||||||
|
|
|
|
|
| |||||||
Basic and diluted earnings per share | $ | 1.14 | $ | 0.14 | $ | 1.06 | ||||||
|
|
|
|
|
| |||||||
The accompanying Notes are an integral part of these Consolidated Financial Statements.
131
PEPCO HOLDINGS
PEPCO HOLDINGS, INC. AND SUBSIDIARIES
CONSOLIDATED STATEMENTS OF COMPREHENSIVE INCOME
For the Year Ended December 31, | 2011 | 2010 | 2009 | |||||||||
| (millions of dollars) | ||||||||||||
Net Income | $ | 257 | $ | 32 | $ | 235 | ||||||
|
|
|
|
|
| |||||||
Other Comprehensive Income (Loss) from Continuing Operations | ||||||||||||
Gains (losses) from continuing operations on commodity derivatives designated as cash flow hedges: | ||||||||||||
Losses arising during period | — | (100 | ) | (129 | ) | |||||||
Amount of losses reclassified into income | 81 | 135 | 166 | |||||||||
|
|
|
|
|
| |||||||
Net gains on commodity derivatives | 81 | 35 | 37 | |||||||||
Losses on treasury rate locks reclassified into income | 1 | 18 | 5 | |||||||||
Amortization of losses for prior service cost | (7 | ) | — | (13 | ) | |||||||
Prior service costs arising during period | (4 | ) | — | — | ||||||||
|
|
|
|
|
| |||||||
Other comprehensive income from continuing operations, before income taxes | 71 | 53 | 29 | |||||||||
Income tax expense related to other comprehensive income from continuing operations | 28 | 21 | 12 | |||||||||
|
|
|
|
|
| |||||||
Other comprehensive income from continuing operations, net of income taxes | 43 | 32 | 17 | |||||||||
Other Comprehensive Income from Discontinued Operations, Net of Income Taxes | — | 103 | 4 | |||||||||
|
|
|
|
|
| |||||||
Comprehensive Income | $ | 300 | $ | 167 | $ | 256 | ||||||
|
|
|
|
|
| |||||||
The accompanying Notes are an integral part of these Consolidated Financial Statements.
132
PEPCO HOLDINGS
PEPCO HOLDINGS, INC. AND SUBSIDIARIES
CONSOLIDATED BALANCE SHEETS
| December 31, 2011 | December 31, 2010 | |||||||
| (millions of dollars) | ||||||||
ASSETS | ||||||||
CURRENT ASSETS | ||||||||
Cash and cash equivalents | $ | 109 | $ | 20 | ||||
Restricted cash equivalents | 11 | 11 | ||||||
Accounts receivable, less allowance for uncollectible accounts of $49 million and $51 million, respectively | 929 | 1,027 | ||||||
Inventories | 132 | 126 | ||||||
Derivative assets | 5 | 45 | ||||||
Prepayments of income taxes | 74 | 276 | ||||||
Deferred income tax assets, net | 59 | 90 | ||||||
Prepaid expenses and other | 120 | 51 | ||||||
Conectiv Energy assets held for sale | — | 111 | ||||||
|
|
|
| |||||
Total Current Assets | 1,439 | 1,757 | ||||||
|
|
|
| |||||
INVESTMENTS AND OTHER ASSETS | ||||||||
Goodwill | 1,407 | 1,407 | ||||||
Regulatory assets | 2,196 | 1,915 | ||||||
Investment in finance leases held in trust | 1,349 | 1,423 | ||||||
Income taxes receivable | 84 | 114 | ||||||
Restricted cash equivalents | 15 | 5 | ||||||
Assets and accrued interest related to uncertain tax positions | 37 | 11 | ||||||
Other | 163 | 169 | ||||||
Conectiv Energy assets held for sale | — | 6 | ||||||
|
|
|
| |||||
Total Investments and Other Assets | 5,251 | 5,050 | ||||||
|
|
|
| |||||
PROPERTY, PLANT AND EQUIPMENT | ||||||||
Property, plant and equipment | 12,855 | 12,120 | ||||||
Accumulated depreciation | (4,635 | ) | (4,447 | ) | ||||
|
|
|
| |||||
Net Property, Plant and Equipment | 8,220 | 7,673 | ||||||
|
|
|
| |||||
TOTAL ASSETS | $ | 14,910 | $ | 14,480 | ||||
|
|
|
| |||||
The accompanying Notes are an integral part of these Consolidated Financial Statements.
133
PEPCO HOLDINGS
PEPCO HOLDINGS, INC. AND SUBSIDIARIES
CONSOLIDATED BALANCE SHEETS
| December 31, 2011 | December 31, 2010 | |||||||
| (millions of dollars, except shares) | ||||||||
LIABILITIES AND EQUITY | ||||||||
CURRENT LIABILITIES | ||||||||
Short-term debt | $ | 732 | $ | 534 | ||||
Current portion of long-term debt and project funding | 112 | 75 | ||||||
Accounts payable and accrued liabilities | 549 | 587 | ||||||
Capital lease obligations due within one year | 8 | 8 | ||||||
Taxes accrued | 110 | 96 | ||||||
Interest accrued | 47 | 45 | ||||||
Liabilities and accrued interest related to uncertain tax positions | 3 | 3 | ||||||
Derivative liabilities | 26 | 66 | ||||||
Other | 274 | 321 | ||||||
Liabilities associated with Conectiv Energy assets held for sale | — | 62 | ||||||
|
|
|
| |||||
Total Current Liabilities | 1,861 | 1,797 | ||||||
|
|
|
| |||||
DEFERRED CREDITS | ||||||||
Regulatory liabilities | 526 | 528 | ||||||
Deferred income taxes, net | 2,863 | 2,714 | ||||||
Investment tax credits | 22 | 26 | ||||||
Pension benefit obligation | 424 | 332 | ||||||
Other postretirement benefit obligations | 469 | 429 | ||||||
Income taxes payable | — | 2 | ||||||
Liabilities and accrued interest related to uncertain tax positions | 32 | 148 | ||||||
Derivative liabilities | 6 | 21 | ||||||
Other | 191 | 175 | ||||||
Liabilities associated with Conectiv Energy assets held for sale | — | 10 | ||||||
|
|
|
| |||||
Total Deferred Credits | 4,533 | 4,385 | ||||||
|
|
|
| |||||
LONG-TERM LIABILITIES | ||||||||
Long-term debt | 3,794 | 3,629 | ||||||
Transition bonds issued by ACE Funding | 295 | 332 | ||||||
Long-term project funding | 13 | 15 | ||||||
Capital lease obligations | 78 | 86 | ||||||
|
|
|
| |||||
Total Long-Term Liabilities | 4,180 | 4,062 | ||||||
|
|
|
| |||||
COMMITMENTS AND CONTINGENCIES (NOTE 17) | ||||||||
EQUITY | ||||||||
Common stock, $.01 par value—authorized 400,000,000 shares, 227,500,190 and 225,082,252 shares outstanding, respectively | 2 | 2 | ||||||
Premium on stock and other capital contributions | 3,325 | 3,275 | ||||||
Accumulated other comprehensive loss | (63 | ) | (106 | ) | ||||
Retained earnings | 1,072 | 1,059 | ||||||
|
|
|
| |||||
Total Shareholders’ Equity | 4,336 | 4,230 | ||||||
Non-controlling interest | — | 6 | ||||||
|
|
|
| |||||
Total Equity | 4,336 | 4,236 | ||||||
|
|
|
| |||||
TOTAL LIABILITIES AND EQUITY | $ | 14,910 | $ | 14,480 | ||||
|
|
|
| |||||
The accompanying Notes are an integral part of these Consolidated Financial Statements.
134
PEPCO HOLDINGS
PEPCO HOLDINGS, INC. AND SUBSIDIARIES
CONSOLIDATED STATEMENTS OF CASH FLOWS
For the Year Ended December 31, | 2011 | 2010 | 2009 | |||||||||
| (millions of dollars) | ||||||||||||
OPERATING ACTIVITIES | ||||||||||||
Net income | $ | 257 | $ | 32 | $ | 235 | ||||||
Loss (income) from discontinued operations, net of income taxes | 3 | 107 | (12 | ) | ||||||||
Adjustments to reconcile net income to net cash from operating activities: | ||||||||||||
Depreciation and amortization | 426 | 393 | 349 | |||||||||
Non-cash rents from cross-border energy lease investments | (55 | ) | (55 | ) | (54 | ) | ||||||
Gain on early termination of finance leases held in trust | (39 | ) | — | — | ||||||||
Non-cash charge to reduce equity value of PHI’s cross-border energy lease investments | 7 | 2 | 3 | |||||||||
Effects of Pepco divestiture-related claims | — | 11 | (40 | ) | ||||||||
Changes in restricted cash equivalents related to Mirant settlement | — | — | 102 | |||||||||
Deferred income taxes | 140 | 345 | 249 | |||||||||
Net unrealized losses on Pepco Energy Services commodity derivatives | 30 | 3 | 2 | |||||||||
Losses on treasury rate locks reclassified into income | 1 | 18 | 5 | |||||||||
Other | (19 | ) | (20 | ) | (3 | ) | ||||||
Changes in: | ||||||||||||
Accounts receivable | 135 | (12 | ) | 136 | ||||||||
Inventories | (6 | ) | (2 | ) | 20 | |||||||
Prepaid expenses | (4 | ) | 7 | (17 | ) | |||||||
Regulatory assets and liabilities, net | (148 | ) | (154 | ) | (221 | ) | ||||||
Accounts payable and accrued liabilities | (90 | ) | 73 | (153 | ) | |||||||
Pension contributions | (110 | ) | (100 | ) | (300 | ) | ||||||
Pension benefit obligation, excluding contributions | 53 | 68 | 95 | |||||||||
Cash collateral related to derivative activities | 9 | 13 | 24 | |||||||||
Taxes accrued | 11 | (213 | ) | 76 | ||||||||
Other assets and liabilities | 43 | 49 | 7 | |||||||||
Net Conectiv Energy assets held for sale | 42 | 248 | 103 | |||||||||
|
|
|
|
|
| |||||||
Net Cash From Operating Activities | 686 | 813 | 606 | |||||||||
|
|
|
|
|
| |||||||
INVESTING ACTIVITIES | ||||||||||||
Investment in property, plant and equipment | (941 | ) | (802 | ) | (664 | ) | ||||||
Department of Energy capital reimbursement awards received | 52 | 13 | — | |||||||||
Proceeds from sale of Conectiv Energy wholesale power generation business | — | 1,640 | — | |||||||||
Proceeds from early termination of finance leases held in trust | 161 | — | — | |||||||||
Changes in restricted cash equivalents | (10 | ) | (2 | ) | — | |||||||
Proceeds from sale of assets | — | 3 | 4 | |||||||||
Net other investing activities | (9 | ) | 4 | — | ||||||||
Investment in property, plant and equipment associated with Conectiv Energy assets held for sale | — | (138 | ) | (200 | ) | |||||||
|
|
|
|
|
| |||||||
Net Cash (Used By) From Investing Activities | (747 | ) | 718 | (860 | ) | |||||||
|
|
|
|
|
| |||||||
FINANCING ACTIVITIES | ||||||||||||
Dividends paid on common stock | (244 | ) | (241 | ) | (238 | ) | ||||||
Common stock issued for the Dividend Reinvestment Plan and employee-related compensation | 47 | 47 | 49 | |||||||||
Redemption of preferred stock of subsidiaries | (6 | ) | — | — | ||||||||
Issuances of long-term debt | 235 | 383 | 110 | |||||||||
Reacquisitions of long-term debt | (70 | ) | (1,726 | ) | (83 | ) | ||||||
Issuances of short-term debt, net | 198 | 4 | 65 | |||||||||
Cost of issuances | (10 | ) | (7 | ) | (4 | ) | ||||||
Net other financing activities | (1 | ) | (6 | ) | 10 | |||||||
Net financing activities associated with Conectiv Energy assets held for sale | — | (10 | ) | 7 | ||||||||
|
|
|
|
|
| |||||||
Net Cash From (Used By) Financing Activities | 149 | (1,556 | ) | (84 | ) | |||||||
|
|
|
|
|
| |||||||
Net Increase (Decrease) In Cash and Cash Equivalents | 88 | (25 | ) | (338 | ) | |||||||
Cash and Cash Equivalents of Discontinued Operations | — | (1 | ) | (2 | ) | |||||||
Cash and Cash Equivalents at Beginning of Year | 21 | 46 | 384 | |||||||||
|
|
|
|
|
| |||||||
CASH AND CASH EQUIVALENTS AT END OF YEAR | $ | 109 | $ | 20 | $ | 44 | ||||||
|
|
|
|
|
| |||||||
SUPPLEMENTAL DISCLOSURE OF CASH FLOW INFORMATION | ||||||||||||
Cash paid for interest (net of capitalized interest of $11 million, $9 million and $11 million, respectively) | $ | 240 | $ | 310 | $ | 353 | ||||||
Cash paid (received) for income taxes | 4 | (13 | ) | (76 | ) | |||||||
The accompanying Notes are an integral part of these Consolidated Financial Statements.
135
PEPCO HOLDINGS
PEPCO HOLDINGS, INC. AND SUBSIDIARIES
CONSOLIDATED STATEMENTS OF EQUITY
| Common Stock | Premium | Accumulated Other Comprehensive | Retained | |||||||||||||||||||||
(millions of dollars, except shares) | Stock Shares | Par Value | on Stock | (Loss) Income | Earnings | Total | ||||||||||||||||||
BALANCE, DECEMBER 31, 2008 | 218,906,220 | $ | 2 | $ | 3,179 | $ | (262 | ) | $ | 1,271 | $ | 4,190 | ||||||||||||
Net Income | — | — | — | — | 235 | 235 | ||||||||||||||||||
Other comprehensive income | — | — | — | 21 | — | 21 | ||||||||||||||||||
Dividends on common stock ($1.08 per share) | — | — | — | — | (238 | ) | (238 | ) | ||||||||||||||||
Issuance of common stock: | ||||||||||||||||||||||||
Original issue shares, net | 1,210,261 | — | 18 | — | — | 18 | ||||||||||||||||||
Shareholder DRP original shares | 2,153,414 | — | 31 | — | — | 31 | ||||||||||||||||||
Net activity related to stock-based awards | — | — | (1 | ) | — | — | (1 | ) | ||||||||||||||||
|
|
|
|
|
|
|
|
|
|
|
| |||||||||||||
BALANCE, DECEMBER 31, 2009 | 222,269,895 | 2 | 3,227 | (241 | ) | 1,268 | 4,256 | |||||||||||||||||
Net Income | — | — | — | — | 32 | 32 | ||||||||||||||||||
Other comprehensive income | — | — | — | 135 | — | 135 | ||||||||||||||||||
Dividends on common stock ($1.08 per share) | — | — | — | — | (241 | ) | (241 | ) | ||||||||||||||||
Issuance of common stock: | ||||||||||||||||||||||||
Original issue shares, net | 1,041,482 | — | 16 | — | — | 16 | ||||||||||||||||||
Shareholder DRP original shares | 1,770,875 | — | 31 | — | — | 31 | ||||||||||||||||||
Net activity related to stock-based awards | — | — | 1 | — | — | 1 | ||||||||||||||||||
|
|
|
|
|
|
|
|
|
|
|
| |||||||||||||
BALANCE, DECEMBER 31, 2010 | 225,082,252 | 2 | 3,275 | (106 | ) | 1,059 | 4,230 | |||||||||||||||||
Net Income | — | — | — | — | 257 | 257 | ||||||||||||||||||
Other comprehensive income | — | — | — | 43 | — | 43 | ||||||||||||||||||
Dividends on common stock ($1.08 per share) | — | — | — | — | (244 | ) | (244 | ) | ||||||||||||||||
Issuance of common stock: | ||||||||||||||||||||||||
Original issue shares, net | 854,124 | — | 17 | — | — | 17 | ||||||||||||||||||
Shareholder DRP original shares | 1,563,814 | — | 30 | — | — | 30 | ||||||||||||||||||
Net activity related to stock-based awards | — | — | 3 | — | — | 3 | ||||||||||||||||||
|
|
|
|
|
|
|
|
|
|
|
| |||||||||||||
BALANCE, DECEMBER 31, 2011 | 227,500,190 | $ | 2 | $ | 3,325 | $ | (63 | ) | $ | 1,072 | $ | 4,336 | ||||||||||||
|
|
|
|
|
|
|
|
|
|
|
| |||||||||||||
The accompanying Notes are an integral part of these Consolidated Financial Statements.
136
PEPCO HOLDINGS
NOTES TO CONSOLIDATED FINANCIAL STATEMENTS
PEPCO HOLDINGS, INC.
(1) ORGANIZATION
Pepco Holdings, Inc. (PHI or Pepco Holdings), a Delaware corporation incorporated in 2001, is a holding company that, through the following regulated public utility subsidiaries, is engaged primarily in the transmission, distribution and default supply of electricity and, to a lesser extent, the distribution and supply of natural gas (Power Delivery):
Potomac Electric Power Company (Pepco), which was incorporated in Washington, D.C. in 1896 and became a domestic Virginia corporation in 1949,
Delmarva Power & Light Company (DPL), which was incorporated in Delaware in 1909 and became a domestic Virginia corporation in 1979, and
Atlantic City Electric Company (ACE), which was incorporated in New Jersey in 1924.
Each of PHI, Pepco, DPL and ACE is also a reporting company under the Securities Exchange Act of 1934, as amended. Together Pepco, DPL and ACE constitute the Power Delivery segment for financial reporting purposes.
Through Pepco Energy Services, Inc. and its subsidiaries (collectively, Pepco Energy Services), PHI provides energy savings performance contracting services, primarily to commercial, industrial and government customers. Pepco Energy Services is in the process of winding down its competitive electricity and natural gas retail supply business. Pepco Energy Services constitutes a separate segment for financial reporting purposes.
PHI Service Company, a subsidiary service company of PHI, provides a variety of support services, including legal, accounting, treasury, tax, purchasing and information technology services to PHI and its operating subsidiaries. These services are provided pursuant to a service agreement among PHI, PHI Service Company and the participating operating subsidiaries. The expenses of PHI Service Company are charged to PHI and the participating operating subsidiaries in accordance with cost allocation methods set forth in the service agreement.
Power Delivery
Each of Pepco, DPL and ACE is a regulated public utility in the jurisdictions that comprise its service territory. Each utility owns and operates a network of wires, substations and other equipment that is classified as transmission facilities, distribution facilities or common facilities (which are used for both transmission and distribution). Transmission facilities are high-voltage systems that carry wholesale electricity into, or across, the utility’s service territory. Distribution facilities are low-voltage systems that carry electricity to end-use customers in the utility’s service territory.
Each utility is responsible for the distribution of electricity and in the case of DPL natural gas, in its service territory, for which it is paid tariff rates established by the applicable local public service commissions. Each utility also supplies electricity at regulated rates to retail customers in its service territory who do not elect to purchase electricity from a competitive energy supplier. The regulatory term for this supply service is Standard Office Service in Delaware, the District of Columbia and Maryland, and Basic Generation Service in New Jersey. In these Notes to the consolidated financial statements, these supply service obligations are referred to generally as Default Electricity Supply.
137
PEPCO HOLDINGS
Pepco Energy Services
Pepco Energy Services is engaged in the following businesses:
providing energy efficiency services principally to federal, state and local government customers, and designing, constructing and operating combined heat and power and central energy plants,
providing high voltage electric construction and maintenance services to customers throughout the United States and low voltage electric construction and maintenance services and streetlight construction and asset management services to utilities, municipalities and other customers in the Washington, D.C. metropolitan area, and
retail supply of electricity and natural gas under its remaining contractual obligations.
Pepco Energy Services also owns and operates two oil-fired generation facilities that are scheduled for deactivation in May 2012.
In December 2009, PHI announced the wind-down of the retail energy supply component of the Pepco Energy Services business. Pepco Energy Services is implementing this wind-down by not entering into any new supply contracts while continuing to perform under its existing supply contracts through their respective expiration dates, the last of which is June 1, 2014. The retail energy supply business has historically generated a substantial portion of the operating revenues and net income of the Pepco Energy Services segment. Operating revenues related to the retail energy supply business for the years ended December 31, 2011, 2010 and 2009 were $0.9 billion, $1.6 billion and $2.3 billion, respectively, while operating income for the same periods was $11 million, $59 million and $88 million, respectively.
In connection with the operation of the retail energy supply business, Pepco Energy Services provided letters of credit of $1 million and posted cash collateral of $112 million as of December 31, 2011. These collateral requirements, which are based on existing wholesale energy purchase and sale contracts and current market prices, will decrease as the contracts expire, with the collateral expected to be no longer needed by June 1, 2014. The energy services business will not be affected by the wind-down of the retail energy supply business.
Other Business Operations
Through its subsidiary Potomac Capital Investment Corporation (PCI), PHI maintains a portfolio of cross-border energy lease investments. This activity constitutes a third operating segment for financial reporting purposes, which is designated as “Other Non-Regulated.” For a discussion of PHI’s cross-border energy lease investments, see Note (8), “Leasing Activities,” and Note (17), “Commitments and Contingencies –– PHI’s Cross-Border Energy Lease Investments.”
Discontinued Operations
In April 2010, the Board of Directors approved a plan for the disposition of PHI’s competitive wholesale power generation, marketing and supply business, which had been conducted through subsidiaries of Conectiv Energy Holding Company (collectively Conectiv Energy). On July 1, 2010, PHI completed the sale of Conectiv Energy’s wholesale power generation business to Calpine Corporation (Calpine) for $1.64 billion. The disposition of all of Conectiv Energy’s remaining assets and businesses, consisting of its load service supply contracts, energy hedging portfolio, certain tolling agreements and other assets not included in the Calpine sale, is substantially complete. The operations of Conectiv Energy are being accounted for as a discontinued operation and no longer constitute a separate segment for financial reporting purposes. Substantially all of the information in these Notes to the Consolidated Financial Statements with respect to the operations of the former Conectiv Energy segment has been consolidated in Note (20), “Discontinued Operations.”
138
PEPCO HOLDINGS
(2)SIGNIFICANT ACCOUNTING POLICIES
Consolidation Policy
The accompanying consolidated financial statements include the accounts of Pepco Holdings and its wholly owned subsidiaries. All material intercompany balances and transactions between subsidiaries have been eliminated. Pepco Holdings uses the equity method to report investments, corporate joint ventures, partnerships, and affiliated companies in which it holds an interest and can exercise significant influence over the operations and policies of the entity. Certain transmission and other facilities currently held, are consolidated in proportion to PHI’s percentage interest in the facility.
Consolidation of Variable Interest Entities
PHI assesses its contractual arrangements with variable interest entities to determine whether it is the primary beneficiary and thereby has to consolidate the entities in accordance with Financial Accounting Standards Board (FASB) Accounting Standards Codification (ASC) 810. The guidance addresses conditions under which an entity should be consolidated based upon variable interests rather than voting interests. Subsidiaries of PHI have the following contractual arrangements to which the guidance applies.
ACE Power Purchase Agreements
PHI, through its ACE subsidiary, is a party to three power purchase agreements (PPAs) with unaffiliated, non-utility generators (NUGs) totaling 459 megawatts. One of the agreements ends in 2016 and the other two end in 2024. PHI was unable to obtain sufficient information to determine whether these three entities were variable interest entities or if ACE was the primary beneficiary. As a result, it applied the scope exemption from the consolidation guidance for enterprises that have not been able to obtain such information.
Net purchase activities with the NUGs for the years ended December 31, 2011, 2010 and 2009, were approximately $218 million, $292 million and $282 million, respectively, of which approximately $206 million, $270 million and $262 million, respectively, consisted of power purchases under the PPAs. The power purchase costs are recoverable from ACE’s customers through regulated rates.
DPL Renewable Energy Transactions
DPL is subject to Renewable Energy Portfolio Standards (RPS) in the state of Delaware that require it to obtain renewable energy credits (RECs) for energy delivered to its customers. DPL’s costs associated with obtaining RECs to fulfill its RPS obligations are recoverable from its customers by law. PHI, through its DPL subsidiary, has entered into three land-based wind PPAs in the aggregate amount of 128 megawatts and one solar PPA with a 10 megawatt facility as of December 31, 2011. All of the facilities associated with these PPAs are operational, and DPL is obligated to purchase energy and RECs in amounts generated and delivered by the wind facilities and solar renewable energy credits (SRECs) from the solar facility at rates that are primarily fixed under these agreements. PHI has concluded that consolidation is not required for any of these agreements under the FASB guidance on the consolidation of variable interest entities.
DPL is obligated to purchase energy and RECs from one of the wind facilities through 2024 in amounts not to exceed 50 megawatts, the second of the wind facilities through 2031 in amounts not to exceed 40 megawatts, and the third facility through 2031 in amounts not to exceed 38 megawatts. DPL’s purchases under the three wind PPAs totaled $18 million and $12 million for the years ended December 31, 2011 and 2010, respectively. The term of the agreement with the solar facility is 20 years and DPL is obligated to purchase SRECs in an amount up to 70 percent of the energy output at a fixed price.DPL’s purchases under the agreement were $1 million for the year ended December 31, 2011.
In addition to the three land-based wind PPAs, PHI, through its DPL subsidiary, has also entered into an offshore wind PPA for a 200 megawatt facility that has not yet been constructed. In December 2011, the developer of the offshore wind facility notified DPL that it was terminating the wind PPA for this facility. DPL received a $2 million termination payment from the developer that will be refunded to DPL’s Delaware customers.
On October 18, 2011, the DPSC approved a tariff submitted by DPL in accordance with the requirements of the RPS specific to fuel cell facilities totaling 30 megawatts to be constructed by a qualified fuel cell provider. The tariff and the RPS establish that DPL would be an agent to collect payments in advance from its distribution customers and remit them to the qualified fuel cell provider for each megawatt hour of energy produced by the fuel cell facilities over 20 years. DPL would have no liability to the qualified fuel cell provider other than to remit payments collected from its distribution customers pursuant to the tariff. The RPS provides for a reduction in DPL’s REC requirements based upon the actual energy output of the facilities. PHI has concluded that DPL would account for this arrangement as an agency transaction.
139
PEPCO HOLDINGS
Atlantic City Electric Transition Funding LLC
Atlantic City Electric Transition Funding LLC (ACE Funding) was established in 2001 by ACE solely for the purpose of securitizing authorized portions of ACE’s recoverable stranded costs through the issuance and sale of bonds (Transition Bonds). The proceeds of the sale of each series of Transition Bonds have been transferred to ACE in exchange for the transfer by ACE to ACE Funding of the right to collect non-bypassable transition bond charges (the Transition Bond Charges) from ACE customers pursuant to bondable stranded costs rate orders issued by the New Jersey Board of Public Utilities (NJBPU) in an amount sufficient to fund the principal and interest payments on the Transition Bonds and related taxes, expenses and fees (Bondable Transition Property). ACE collects the Transition Bond Charges from its customers on behalf of ACE Funding and the holders of the Transition Bonds. The assets of ACE Funding, including the Bondable Transition Property, and the Transition Bond Charges collected from ACE’s customers, are not available to creditors of ACE. The holders of the Transition Bonds have recourse only to the assets of ACE Funding. ACE owns 100 percent of the equity of ACE Funding and PHI consolidates ACE Funding in its financial statements as ACE is the primary beneficiary of ACE Funding under the variable interest entity consolidation guidance.
ACE Standard Offer Capacity Agreements
In April 2011, ACE entered into three Standard Offer Capacity Agreements (SOCAs) by order of the NJBPU, each with a different generation company. The SOCAs were established under a New Jersey law enacted to promote the construction of qualified electric generation facilities in New Jersey. The SOCAs are 15-year, financially settled transactions approved by the NJBPU that allow generators to receive payments from, or make payments to, ACE based on the difference between the fixed price in the SOCAs and the price for capacity that clears PJM Interconnection, LLC (PJM). Each of the other electricity distribution companies (EDCs) in New Jersey has entered into SOCAs having the same terms with the same generation companies. The annual share of payments or receipts for ACE and the other EDCs is based upon each company’s annual proportion of the total New Jersey load attributable to all EDCs. The NJBPU has approved full recovery from distribution customers of payments made by ACE and the other EDCs, and distribution customers would be entitled to any payments received by ACE and the other EDCs.
ACE and the other EDCs entered the SOCAs under protest based on concerns about the potential cost to distribution customers. In May 2011, the NJBPU denied a joint motion for reconsideration of its order requiring each of the EDCs to enter into the SOCAs. In June 2011, ACE and the other EDCs filed appeals related to the NJBPU orders with the Appellate Division of the New Jersey Superior Court. In February 2011, ACE joined other plaintiffs in an action filed in the United States District Court for the District of New Jersey challenging the constitutionality of the New Jersey law. ACE and the other plaintiffs filed a motion for summary judgment with the United States District Court for the District of New Jersey in December 2011.
140
PEPCO HOLDINGS
Two of the generation companies sent a notice of dispute under the SOCA to ACE. The notice of dispute alleges that certain actions taken by PJM have an adverse effect on the generation company’s ability to clear the PJM auction as required by the SOCA. In November 2011, one of the generation companies filed a petition with the NJBPU to change its SOCA. ACE does not believe that a dispute exists under the SOCAs.
Currently, PHI believes that FASB guidance on derivative accounting and the accounting for regulated operations would apply to ACE’s obligations under the SOCA once the related capacity has cleared a PJM auction. Once cleared, the gain (loss) associated with the fair value of a derivative would be offset by the recognition of a regulatory liability (asset). The next PJM capacity auction is scheduled for May 2012.
Use of Estimates
The preparation of financial statements in conformity with accounting principles generally accepted in the United States of America (GAAP) requires management to make certain estimates and assumptions that affect the reported amounts of assets, liabilities, revenues and expenses, and related disclosures of contingent assets and liabilities in the Consolidated Financial Statements and accompanying notes. Although Pepco Holdings believes that its estimates and assumptions are reasonable, they are based upon information available to management at the time the estimates are made. Actual results may differ significantly from these estimates.
Significant matters that involve the use of estimates include the assessment of goodwill and long-lived assets for impairment, fair value calculations for certain derivative instruments, the costs of providing pension and other postretirement benefits, evaluation of the probability of recovery of regulatory assets, accrual of storm restoration costs, accrual of self-insurance reserves for general and auto liability claims, accrual of interest related to income taxes, accrual of restructuring charges, recognition of changes in network service transmission rates for prior service year costs, and the recognition of income tax benefits for investments in finance leases held in trust associated with PHI’s portfolio of cross-border energy lease investments. Additionally, PHI is subject to legal, regulatory, and other proceedings and claims that arise in the ordinary course of its business. PHI records an estimated liability for these proceedings and claims, when it is probable that a loss has been incurred and the loss is reasonably estimable.
Storm Costs
During 2011, Pepco, DPL and ACE incurred significant costs associated with Hurricane Irene that affected their respective service territories. Total incremental storm costs associated with Hurricane Irene were $43 million, with $28 million incurred for repair work and $15 million incurred as capital expenditures. Costs incurred for repair work of $22 million were deferred as regulatory assets to reflect the probable recovery of these storm costs in certain jurisdictions, and the remaining $6 million was charged to Other operation and maintenance expense. Approximately $6 million of these total incremental storm costs have been estimated for the cost of restoration services provided by outside contractors. Since the invoices for such services had not been received at December 31, 2011, actual invoices may vary from these estimates. PHI’s utility subsidiaries are seeking recovery of the incremental Hurricane Irene costs in each of their various jurisdictions in pending or planned distribution rate case filings.
Accrual of Interest Associated with 1996 to 2002 Federal Income Tax Returns
In November 2010, PHI reached final settlement with the Internal Revenue Service (IRS) with respect to its federal tax returns for the years 1996 to 2002 for all issues except its cross-border energy lease investments. PHI also reallocated certain amounts on deposit with the IRS since 2006 among liabilities in the settlement years and subsequent years. In connection with these activities, PHI has recalculated the estimated interest due for the tax years 1996 to 2002. These calculations resulted in the reversal of $15 million (after-tax) of previously accrued estimated interest due to the IRS which was recorded as an income tax benefit in the fourth quarter of 2010. PHI recorded a further $17 million (after-tax) income tax benefit in the second quarter of 2011.
141
PEPCO HOLDINGS
Restructuring Charge
In the second quarter of 2010, PHI commenced a comprehensive organizational review to identify opportunities to streamline the organization and to achieve certain reductions in corporate overhead costs allocated to its operating segments. The restructuring plan resulted in the elimination of 164 employee positions and the recording of an associated estimated accrued expense for termination benefits in the amount of $30 million. The calculation of these termination benefits, the majority of which were paid in 2011, was based on estimated severance costs and actuarial calculations of the present value of certain changes in pension and other postretirement benefits for terminated employees. There were no material changes to this accrual in 2011.
Network Service Transmission Rates
In May of each year, each of PHI’s utility subsidiaries provides its updated network service transmission rate to the Federal Energy Regulatory Commission (FERC) effective for the service year beginning June 1 of the current year and ending on May 31 of the following year. The network service transmission rate includes a true-up for costs incurred in the prior service year not yet reflected in rates charged to customers.
Investments in Finance Leases Held in Trust
As further discussed in Note (8), “Leasing Activities,” Note (12), “Income Taxes,” and Note (17), “Commitments and Contingencies — PHI’s Cross-Border Energy Lease Investments,” PHI maintains a portfolio of cross-border energy lease investments. The book equity value of these cross-border energy lease investments and the pattern of recognizing the related cross-border energy lease income are based on the estimated timing and amount of all cash flows related to the cross-border energy lease investments, including income tax-related cash flows. These investments are more commonly referred to as sale-in lease-out, or SILO, transactions. PHI currently derives tax benefits from these investments to the extent that rental income is exceeded by depreciation deductions based on the purchase price of the assets and interest deductions on the non-recourse debt financing (obtained to fund a substantial portion of the purchase price of the assets). The IRS has announced broadly its intention to disallow the tax benefits recognized by all taxpayers on these types of investments. More specifically, the IRS has disallowed interest and depreciation deductions claimed by PHI related to its cross-border energy lease investments on its 2001 through 2005 federal income tax returns, which currently are under audit and the IRS has sought to recharacterize the leases as loan transactions as to which PHI would be subject to original issue discount income.
142
PEPCO HOLDINGS
In the last several years, IRS challenges to certain cross-border energy lease investment transactions have been the subject of litigation. PHI believes that its tax position with regard to its cross-border energy lease investments was appropriate based on applicable statutes, regulations and case law. However, after evaluating the court rulings available at the time, there have been several decisions in favor of the IRS that were factored into PHI’s decision to adjust the values of the cross-border energy lease investments at certain points in time.
Revenue Recognition
Regulated Revenue
Power Delivery recognizes revenue upon distribution of electricity and gas to its customers, including unbilled revenue for services rendered but not yet billed. PHI’s unbilled revenue was $179 million and $218 million as of December 31, 2011 and 2010, respectively, and these amounts are included in Accounts receivable. PHI’s utility subsidiaries calculate unbilled revenue using an output-based methodology. This methodology is based on the supply of electricity or gas intended for distribution to customers. The unbilled revenue process requires management to make assumptions and judgments about input factors such as customer sales mix, temperature and estimated line losses (estimates of electricity and gas expected to be lost in the process of its transmission and distribution to customers). The assumptions and judgments are inherently uncertain and susceptible to change from period to period, and if the actual results differ from the projected results, the impact could be material.
Taxes related to the consumption of electricity and gas by the utility customers, such as fuel, energy, or other similar taxes, are components of the tariff rates charged by PHI’s utility subsidiaries and, as such, are billed to customers and recorded in Operating revenue. Accruals for the remittance of these taxes are recorded in Other taxes. Excise tax related generally to the consumption of gasoline by PHI and its subsidiaries in the normal course of business is charged to operations, maintenance or construction, and is not material.
Pepco Energy Services Revenue
Pepco Energy Services has recognized revenue upon distribution of electricity and gas to the customer, including amounts for electricity and gas delivered, but not yet billed. Sales and purchases of electric power to independent system operators are netted hourly and classified as operating revenue or operating expenses, as appropriate. Unrealized derivative gains and losses are recognized in current earnings as revenue if the derivatives do not qualify for hedge accounting or normal purchases or normal sales treatment under FASB guidance on derivatives and hedging (ASC 815). Revenue for Pepco Energy Services’ energy services business is recognized using the percentage-of-completion method, for its construction activities, which recognizes revenue as work is completed on the contract. Revenues from its operation and maintenance activities and measurement and verification activities in its energy services business are recognized when earned.
Taxes Assessed by a Governmental Authority on Revenue-Producing Transactions
Taxes included in PHI’s gross revenues were $390 million, $373 million and $293 million for the years ended December 31, 2011, 2010 and 2009, respectively.
Accounting for Derivatives
PHI and its subsidiaries use derivative instruments primarily to manage risk associated with commodity prices and interest rates. Risk management policies are determined by PHI’s Corporate Risk Management Committee (CRMC). The CRMC monitors interest rate fluctuation, commodity price fluctuation and credit risk exposure, and sets risk management policies that establish limits on unhedged risk.
143
PEPCO HOLDINGS
PHI accounts for its derivative activities in accordance with FASB guidance on derivatives and hedging. Derivatives are recorded on the consolidated balance sheets as derivative assets or derivative liabilities and measured at fair value unless designated as normal purchases or normal sales.
Changes in the fair value of derivatives held by PES and DPL that are not designated as hedges are presented on the consolidated statements of income as Operating revenue. PHI uses mark-to-market accounting through earnings for derivatives that either do not qualify for hedge accounting or that management does not designate as hedges.
The gain or loss on a derivative that hedges or do not qualify for hedge accounting are presented on the consolidated statements of income as Operating revenue or Fuel and purchased energy expense, respectively. Changes in the fair value of derivatives held by DPL are deferred as regulatory assets or liabilities under the accounting guidance for regulated activities.
The gain or loss on a derivative that qualifies as a cash flow hedge of an exposure to variable cash flows of a forecasted transaction is initially recorded in Accumulated Other Comprehensive Loss (AOCL) (a separate component of equity) to the extent that the hedge is effective and is subsequently reclassified into earnings, in the same category as the item being hedged, when the gain or loss from the forecasted transaction occurs. If it is probable that a forecasted transaction will not occur, the deferred gain or loss in AOCL is immediately reclassified to earnings. Gains or losses related to any ineffective portion of cash flow hedges are also recognized in earnings immediately as Operating revenue or as a Fuel and purchased energy expense.
Changes in the fair value of derivatives designated as fair value hedges, as well as changes in the fair value of the hedged asset, liability or firm commitment, are recorded as Operating revenue in the consolidated statements of income.
PEPCO HOLDINGS
PHI designates certain commodity forwards as normal purchases or normal sales, which are not required to be recorded in the financial statements until they are settled under FASB guidance. This type of contract is used in normal operations, settles physically and follows standard accrual accounting. Unrealized gains and losses on these contracts do not appear on the consolidated balance sheets. Examples of these normal purchase transactions include purchases of fuel to be consumed in generating facilities or for delivery to customers. Normal sales transactions include agreements to deliver natural gas and electric power to customers. Normal purchases and normal sales transactions are presented on a gross basis when they settle, with normal sales recorded as Operating revenue and normal purchases recorded as Fuel and purchased energy expenses.
The fair value of derivatives is determined using quoted exchange prices where available. For instruments that are not traded on an exchange, pricing services and external broker quotes are used to determine fair value. For some custom and complex instruments, internal models are used to interpolate broker-quality price information. For certain long-dated instruments, broker or exchange data are extrapolated for future periods where limited market information is available. Models are also used to estimate volumes for certain transactions. See Note (15), “Derivative Instruments and Hedging Activities,” for more information about the types of derivatives employed by PHI and Note (16), “ Fair Value Disclosures,” for the methodologies used to value them.
The impact of derivatives that are marked to market through current earnings, the ineffective portion of cash flow hedges, and the portion of fair value hedges that flows to current earnings are presented on a net basis in the consolidated statements of income as Operating revenue or as a Fuel and purchased energy expense. When a hedging gain or loss is realized, it is presented on a net basis in the same line item as the underlying item being hedged. Unrealized derivative gains and losses are presented gross on the consolidated balance sheets except where contractual netting agreements are in place with individual counterparties. See Note (15), “Derivative Instruments and Hedging Activities,” for more information about the components of unrealized and realized gains and losses on derivatives.
The fair value of derivatives is determined using quoted exchange prices where available. For instruments that are not traded on an exchange, pricing services and external broker quotes are used to determine fair value. For some custom and complex instruments, internal models are used to interpolate broker-quality price information. For certain long-dated instruments, broker or exchange data are extrapolated for future periods where limited market information is available. Models are also used to estimate volumes for certain transactions. See Note (15), “Derivative Instruments and Hedging Activities,” for more information about the types of derivatives employed by PHI and Note (16), “Fair Value Disclosures,” for the methodologies used to value them.
PHI designates certain commodity forwards as normal purchases or normal sales, which are not required to be recorded in the financial statements until they are settled. These commodity forwards are used in normal operations, settle physically and follow standard accrual accounting. Unrealized gains and losses on these contracts are not recorded in the financial statements. Examples of these commodity forwards include purchases by Pepco Energy Services of natural gas or electricity for delivery to customers. Normal sales transactions include agreements by Pepco Energy Services to deliver natural gas and electric power to customers. Normal purchases and normal sales transactions are separately presented on a gross basis when they settle, with normal sales recorded as Operating revenue and normal purchases recorded as Fuel and purchased energy expenses.
144
PEPCO HOLDINGS
Stock-Based Compensation
Pepco HoldingsPHI recognizes compensation expense for stock-based awards, modifications or cancellations based on the grant-date fair value. Compensation expense is recognized over the requisite service period. In addition, compensation expense recognized includes the cost for all stock-based awards granted prior to, but not yet vested as of January 1, 2006, measured at the grant-date fair value. A deferred tax asset and deferred tax benefit are also recognized concurrently with compensation expense for the tax effect of the deduction of stock options and restricted stock awards, which are deductible only upon exercise and vesting.
Historically, PHI’s compensation awards includehad included both time-based restricted stock awards that vest over a three-year service period and performance-based restricted stock units that arewere earned based on performance over a three-year period. Beginning in 2011, compensation awards have been granted solely in the form of restricted stock units. The compensation expense associated with these awards is calculated based on the estimated fair value of the awards at the grant date and is recognized over the three-year service or performance period.
Pepco HoldingsPHI estimates the fair value of each stock option awardawards on the date of grant using the Black-Scholes-Merton option pricing model. This model uses assumptions related to expected option term, expected volatility, expected dividend yield, and the risk-free interest rate. Pepco HoldingsPHI uses historical data to estimate option exerciseaward exercises and employee terminationterminations within the valuation model; groups of employees that have similar historical exercise behavior are considered separately for valuation purposes.
Pepco Holdings’PHI’s current policy is to issue new shares to satisfy both stock option exercises and asvested awards of restricted stock awards.
PEPCO HOLDINGS
units.
Income Taxes
PHI and the majority of its subsidiaries file a consolidated federal income tax return. Federal income taxes are allocated among PHI and the subsidiaries included in its consolidated group pursuant to a written tax sharing agreement, which was approved by the Securities and Exchange Commission (SEC) in connection with the establishment of PHI as a holding company. Under this tax sharing agreement, PHI’s consolidated federal income tax liability is allocated based upon PHI’s and its subsidiaries’ separate taxable income or loss amounts.
The consolidated financial statements include current and deferred income taxes. Current income taxes represent the amount of tax expected to be reported on PHI’s and its subsidiaries’ federal and state income tax returns. Deferred income tax assets and liabilities represent the tax effects of temporary differences between the financial statement basis and tax basis of existing assets and liabilities, and they are measured using presently enacted tax rates. See Note (12), “Income Taxes,” for a listing of primary deferred tax assets and liabilities. The portions of Pepco’s, DPL’s and ACE’s deferred tax liabilities applicable to their utility operations that have not been recovered from utility customers represent income taxes recoverable in the future and are included in Regulatory assets on the consolidated balance sheets. See Note (7), “Regulatory Matters – Regulatory Assets and Regulatory Liabilities,” for additional information.
PHI recognizes interest on under or over paymentsunderpayments and overpayments of income taxes, interest on uncertain tax positions and tax-related penalties in income tax expense. Deferred income tax expense generally represents the net change during the reporting period in the net deferred tax liability and deferred recoverable income taxes.
Investment tax credits are amortized to income over the useful lives of the related property.
Cash and Cash Equivalents
Cash and cash equivalents include cash on hand, cash invested in money market funds and commercial paper held with original maturities of three months or less.
145
PEPCO HOLDINGS
Restricted Cash Equivalents
The restricted cash equivalents included in Current Assets and the restricted cash equivalents included in Investments and Other Assets consist of (i) cash held as collateral that is restricted from use for general corporate purposes and (ii) cash equivalents that are specifically segregated based on management’s intent to use such cash equivalents for a particular purpose. The classification as current or non-current conforms to the classification of the related liabilities.
Accounts Receivable and Allowance for Uncollectible Accounts
Pepco Holdings’ accounts receivable balances primarily consist of customer accounts receivable, other accounts receivable, and accrued unbilled revenue generated by subsidiaries in the Power Delivery business and at Pepco Energy Services. Accrued unbilled revenue represents revenue earned in the current period but not billed to the customer until a future date (usually within one month after the receivable is recorded).
PHI maintains an allowance for uncollectible accounts and changes in the allowance are recorded as an adjustment to Other operation and maintenance expense in the consolidated statements of income. PHI determines the amount of the allowance based on specific identification of material amounts at risk by customer and maintains a reserve based on its historical collection experience. The adequacy of this allowance is assessed on a quarterly basis by evaluating all known factors, such as the aging of the receivables, historical collection experience, the economic and competitive environment and changes in the creditworthiness of its customers. Although management believes its allowance is adequate, it cannot anticipate with any certainty the changes in the financial condition of its customers. As a result, PHI records adjustments to the allowance for uncollectible accounts in the period in which the new information that requires an adjustment to the reserve becomes known.
PEPCO HOLDINGS
Inventories
Inventory is valued at the lower of cost or market value. Included in inventories are generation, transmission and distribution materials and supplies, natural gas and fuel oil and coal.oil.
PHI utilizes the weighted average cost method of accounting for inventory items, other than fuel oil held for resale.items. Under this method, an average price is determined for the quantity of units acquired at each price level and is applied to the ending quantity to calculate the total ending inventory balance. Materials and supplies inventory are recorded in inventory when purchased and then expensed or capitalized to plant, as appropriate, when installed.
The costs of natural gas, coal and fuel oil for generating facilities, including transportation costs, are included in inventory when purchased and charged to fuel expense when used. For PHI, the first-in-first-out method is not materially different from the weighted average cost method due to the high inventory turnover rate in the oil marketing business.
Goodwill
Goodwill represents the excess of the purchase price of an acquisition over the fair value of the net assets acquired at the acquisition date. Substantially all of Pepco Holdings’ goodwill was generated by Pepco’s acquisition of Conectiv in 2002 and is allocated entirely to Pepco Holdings’ Power Delivery reporting unit for purposes of impairment testing based on the aggregation of its components.components because its utilities have similar characteristics. Pepco Holdings tests its goodwill for impairment annually as of November 1 and whenever an event occurs or circumstances change in the interim that would more likely than not reduce the fair value of a reporting unit below its carrying amount. Factors that may result in an interim impairment test include, but are not limited to: a change in the identified reporting units; an adverse change in business conditions; a decline in PHI’s stock price causing market capitalization to fall further below book value; an adverse regulatory action; or an impairment of long-lived assets in the reporting unit. PHI performed its annual impairment test on November 1, 20102011 and didits goodwill was not record an impairment chargeimpaired as described in Note (6), “Goodwill.”
146
PEPCO HOLDINGS
Regulatory Assets and Regulatory Liabilities
The Power Delivery operations of Pepco are regulated by the District of Columbia Public Service Commission (DCPSC) and the Maryland Public Service Commission (MPSC).
The Power Delivery operations of DPL are regulated by the DPSC and the MPSC. DPL’s interstate transportation and wholesale sale of natural gas are regulated by FERC.
The Power Delivery operations of ACE are regulated by the New Jersey Board of Public Utilities (NJBPU).
NJBPU. The transmission of electricity by Pepco, DPL, and ACE are regulated by FERC.
The FASB guidance on Regulated Operations (ASC 980) applies to the Power Delivery businesses of Pepco, DPL, and ACE.Delivery. It allows regulated entities, in appropriate circumstances, to defer the income statement impact of certain costs that are expected to be recovered in future rates through the establishment of regulatory assets. Management’s assessment of the probability of recovery of regulatory assets requires judgment and interpretation of laws, regulatory commission orders and other factors. If management subsequently determines, based on changes in facts or circumstances, that a regulatory asset is not probable of recovery, then the regulatory asset would be eliminated through a charge to earnings.
PEPCO HOLDINGS
Effective June 2007, the MPSC approved a bill stabilization adjustment mechanism (BSA) for retail customers of Pepco and DPL. Effective November 2009, the DCPSC approved a BSA for Pepco’s retail customers. See Note (17) “Commitments and Contingencies — (7), “Regulatory Matters—Regulatory and Other Matters — Rate Proceedings.” For customers to whom the BSA applies, Pepco and DPL recognize distribution revenue based on an approved distribution charge per customer. From a revenue recognition standpoint, the BSA has the effect of decoupling the distribution revenue recognized in a reporting period from the amount of power delivered during that period. Pursuant to this mechanism, Pepco and DPL recognize either (i) a positive adjustment equal to the amount by which revenue from Maryland and the District of Columbia retail distribution sales falls short of the revenue that Pepco and DPL are entitled to earn based on the approved distribution charge per customer, or (ii) a negative adjustment equal to the amount by which revenue from such distribution sales exceeds the revenue that Pepco and DPL are entitled to earn based on the approved distribution charge per customer (a Revenue Decoupling Adjustment). A net positive Revenue Decoupling Adjustment is recorded as a regulatory asset and a net negative Revenue Decoupling Adjustment is recorded as a regulatory liability.
Leasing Activities
Pepco Holdings’ lease transactions include plant, office space, equipment, software, vehicles and elements of PPAs. In accordance with FASB guidance on leases (ASC 840), these leases are classified as either leveraged leases, operating leases or capital leases.
Leveraged Leases
Income from investments in leveraged lease transactions, in which PHI is an equity participant, is accounted for using the financing method. In accordance with the financing method, investments in leased property are recorded as a receivable from the lessee to be recovered through the collection of future rentals. Income, including investment tax credits, on leveraged equipment leases is recognized over the life of the lease at a constant rate of return on the positive net investment. Each quarter, PHI reviews the carrying value of each lease, which includes a review of the underlying financial assumptions, the timing and collectibility of cash flows, and the credit quality of the lessee. Changes to the underlying assumptions, if any, would be accounted for in accordance with FASB guidance on leases and reflected in the carrying value of the lease effective for the quarter within which they occur.
147
PEPCO HOLDINGS
Operating Leases
An operating lease in which PHI or a subsidiary is the lessee generally results in a level income statement charge over the term of the lease, reflecting the rental payments required by the lease agreement. If rental payments are not made on a straight-line basis, PHI’s policy is to recognize rent expense on a straight-line basis over the lease term unless another systematic and rational allocation basis is more representative of the time pattern in which the leased property is physically employed.
Capital Leases
For ratemaking purposes, capital leases in which PHI or a subsidiary is the lessee are treated as operating leases; therefore, in accordance with FASB guidance on Regulated Operations (ASC 980), the amortization of the leased asset is based on the recovery of rental payments through customer rates. Investments in equipment under capital leases are stated at cost, less accumulated depreciation. Depreciation is recorded on a straight-line basis over the equipment’s estimated useful life.
Arrangements Containing a Lease
PPAs contain a lease if the arrangement conveys the right to control the use and controlof property, plant or equipment. If so, PHI determines the appropriate lease accounting classification.
PEPCO HOLDINGS
Property, Plant and Equipment
Property, plant and equipment are recorded at original cost, including labor, materials, asset retirement costs and other direct and indirect costs including capitalized interest. The carrying value of property, plant and equipment is evaluated for impairment whenever circumstances indicate the carrying value of those assets may not be recoverable. Upon retirement, the cost of regulated property, net of salvage, is charged to accumulated depreciation. For non-regulated property, the cost and accumulated depreciation of the property, plant and equipment retired or otherwise disposed of are removed from the related accounts and included in the determination of any gain or loss on disposition.
The annual provision for depreciation on electric and gas property, plant and equipment is computed on a straight-line basis using composite rates by classes of depreciable property. Accumulated depreciation is charged with the cost of depreciable property retired, less salvage and other recoveries. Property, plant and equipment, other than electric and gas facilities, is generally depreciated on a straight-line basis over the useful lives of the assets. The table below provides system-wide composite annual depreciation rates for the years ended December 31, 2011, 2010 2009, and 2008.2009.
| Transmission and Distribution | Generation | Transmission and Distribution | Generation | |||||||||||||||||||||||||||||||||||||||||||||
| 2010 | 2009 | 2008 | 2010 | 2009 | 2008 | 2011 | 2010 | 2009 | 2011 | 2010 | 2009 | |||||||||||||||||||||||||||||||||||||
Pepco | 2.6 | % | 2.7 | % | 2.7 | % | — | — | — | 2.6 | % | 2.6 | % | 2.7 | % | — | — | — | ||||||||||||||||||||||||||||||
DPL | 2.8 | % | 2.8 | % | 2.8 | % | — | — | — | 2.8 | % | 2.8 | % | 2.8 | % | — | — | — | ||||||||||||||||||||||||||||||
ACE | 2.8 | % | 2.8 | % | 2.8 | % | — | — | — | 3.0 | % | 2.8 | % | 2.8 | % | — | — | — | ||||||||||||||||||||||||||||||
Pepco Energy Services (a) | — | — | — | 16.9 | % | 11.4 | % | 9.5 | % | — | — | — | 10.2 | % | 16.9 | % | 11.4 | % | ||||||||||||||||||||||||||||||
| (a) | Percentages reflect accelerated depreciation of the Benning Road and Buzzard Point generating plants scheduled for retirement in May 2012. |
In 2010, subsidiaries of PHI received awards from the U.S. Department of Energy (DOE) under the American Recovery and Reinvestment Act of 2009. Pepco was awarded $149 million to fund a portion of the costs incurred for the implementation of an advanced metering infrastructure (AMI) system, direct load control, distribution automation and communications infrastructure in its Maryland and District of Columbia service territories. ACE was awarded $19 million to fund a portion of the costs incurred for the implementation of direct load control, distribution automation and communications infrastructure in its New Jersey service territory. PHI has elected to recognize the awards as a reduction in the carrying value of the assets acquired rather than grant income over the service period.
148
PEPCO HOLDINGS
Long-Lived Asset Impairment Evaluation
Pepco Holdings evaluates long-lived assets to be held and used, such as generating property and equipment, and real estate, for impairment whenever events or changes in circumstances indicate that their carrying value may not be recoverable. Examples of such events or changes include a significant decrease in the market price of a long-lived asset or a significant adverse change in the manner in which an asset is being used or its physical condition. A long-lived asset to be held and used is written down to fair value if the expected future undiscounted cash flow from the asset is less than its carrying value.
For long-lived assets held for sale, an impairment loss is recognized to the extent that the asset’s carrying value exceeds its fair value including costs to sell.
PEPCO HOLDINGS
Capitalized Interest and Allowance for Funds Used During Construction
In accordance with FASB guidance on regulated operations (ASC 980), PHI’s utility subsidiaries can capitalize the capital costs of financing the construction of plant and equipment as Allowance for Funds Used During Construction (AFUDC). This results in the debt portion of AFUDC being recorded as a reduction of Interest expense and the equity portion of AFUDC being recorded as an increase to Other income in the accompanying consolidated statements of income.
Pepco Holdings recorded AFUDC for borrowed funds of $11 million, $8 million $7 million, and $5$7 million for the years ended December 31, 2011, 2010 2009 and 2008,2009, respectively.
Pepco Holdings recorded amounts for the equity component of AFUDC of $15 million, $10 million $3 million and $5$3 million for the years ended December 31, 2011, 2010 2009, and 2008,2009, respectively.
Amortization of Debt Issuance and Reacquisition Costs
Pepco Holdings defers and amortizes debt issuance costs and long-term debt premiums and discounts over the lives of the respective debt issues. When PHI utility subsidiaries refinance existing debt or redeem existing debt, any unamortized premiums, discounts and debt issuance costs, as well as debt redemption costs, are classified as regulatory assets and are amortized generally over the life of the original issue.
Asset Removal Costs
In accordance with FASB guidance, asset removal costs are recorded by PHI utility subsidiaries as regulatory liabilities. At December 31, 2011 and 2010, and 2009, $361$388 million and $352$361 million of asset removal costs, respectively, are included in regulatoryRegulatory liabilities in the accompanying consolidated balance sheets.
Pension and Postretirement Benefit Plans
Pepco Holdings sponsors the PHI Retirement Plan, a non-contributory, defined benefit retirementpension plan that covers substantially all employees of Pepco, DPL, ACE and certain employees of other Pepco Holdings subsidiaries (the PHI Retirement Plan).subsidiaries. Pepco Holdings also provides supplemental retirement benefits to certain eligible executives and key employees through a nonqualified retirement plan and provides certain postretirement health care and life insurance benefits for eligible retired employees.
Pepco Holdings accounts for the PHI Retirement Plan, the nonqualified retirement plans, and the retirement healthcare and life insurance benefit plans in accordance with FASB guidance on Retirement Benefits (ASC 715).
149
PEPCO HOLDINGS
See Note (10), “Pension and Other Postretirement Benefits,” for additional information.
Preferred Stock
As of December 31, 20102011 and 2009,2010, PHI had 40 million shares of preferred stock authorized for issuance, with a par value of $.01 per share. No shares of preferred stock were outstanding at December 31, 20102011 and 2009.2010.
Reclassifications and Adjustments
Certain prior period amounts have been reclassified in order to conform to current period presentation. The following adjustments have been recorded and are not considered material individually or in the aggregate:
OperatingDefault Electricity Supply Revenue and Costs Adjustments
During 2009,2011, DPL recorded additionaladjustments associated with the accounting for Default Electricity Supply revenue of $14 million relatedand costs. These adjustments were primarily due to the unbilled portionunder-recognition of the Gas Cost Rate (GCR) revenue, which was not previously recognized. Because the GCR revenue is deferred, an additionalallowed returns on working capital and under-recoveries of administrative costs, and resulted in a pre-tax decrease in Other operation and maintenance expense of $14$11 million wasfor the year ended December 31, 2011.
Pepco Energy Services Derivative Accounting Adjustments
During 2011, PHI recorded an adjustment associated with an increase in the value of certain derivatives from October 1, 2010 to December 31, 2010, which had been erroneously recorded in 2009. Consequently, there was no impact on consolidated net income.
PEPCO HOLDINGS
other comprehensive income at December 31, 2010. This adjustment resulted in an increase in revenue and pre-tax earnings of $2 million for the year ended December 31, 2011.
Operating Expenses
During 2010, Pepco recorded an adjustment to correct certain errors related to other taxes which resulted in a decrease to Other taxes expense of $5 million (pre-tax).
As further described in Note (9), “Property, Plant and Equipment,” in the fourth quarter of 2010, PHI recorded an accrual of $4 million for the obligations associated with the planned deactivation of Pepco Energy Services’ two oil-fired generating facilities. Of this amount, $1 million should have been recorded in each of 2009, 2008 and 2007.
During 2008, PHI identified an error in the accounting for certain of its restricted stock awards granted under the Long-Term Incentive Plan that resulted in an understatement of stock-based compensation expense in 2007 and 2006. Pepco and DPL also recorded adjustments to correct errors in Other operation and maintenance expenses for prior periods dating back to February 2005 for which late payment fees were incorrectly recognized. These errors were corrected in 2008, resulting in an increase in Other operation and maintenance expenses for the year ended December 31, 2008 of $15 million.
Income Tax Expense Related to Continuing Operations
During 2011, PHI recorded adjustments to correct certain income tax errors related to prior periods associated with the interest on uncertain tax positions. The adjustment resulted in an increase in income tax expense of $2 million.
During 2010, PHI recorded an adjustment to correct certain income tax errors related to prior periods. The pre-tax adjustment resulted in a decrease in income tax expense of $5 million for the year ended December 31, 2010.million.
During 2009, PHI recorded certain adjustments to correct errors related to income taxes. These adjustments, which primarily resulted from the completion of additional analysis of the current and deferred income tax balances, resulted in a decrease in income tax expense of $6 million.
150
PEPCO HOLDINGS
(3) NEWLY ADOPTED ACCOUNTING STANDARDS
TransfersFair Value Measurements and ServicingDisclosures (ASC 860)820)
The FASB issued new disclosure requirements that require significant items within the reconciliation of the Level 3 valuation category to be presented in separate categories for purchases, sales, issuances and settlements. The guidance was effective beginning with PHI’s March 31, 2011 consolidated financial statements. PHI has included the new disclosure requirements in Note (16), “Fair Value Disclosures,” to its consolidated financial statements.
Goodwill (ASC 350)
The FASB issued new guidance on performing goodwill impairment tests that removeswas effective beginning January 1, 2011 for PHI. Under the concept of a qualifying special-purpose entity (QSPE) from the guidance on transfers and servicing and the QSPE scope exception in the guidance on consolidation. The new guidance, also changes the requirementscarrying value of the reporting unit must include the liabilities that are part of the capital structure of the reporting unit. PHI already allocates liabilities to the reporting unit when performing its goodwill impairment test, so the new guidance did not change PHI’s goodwill impairment test methodology.
Revenue Recognition (ASC 605)
The FASB issued new guidance to help determine separate units of accounting for derecognizing financial assets and requires additional disclosures aboutmultiple-deliverables within a transferor’s continuing involvement in transferred financial assets. The guidancesingle contract that was effective for transfers of financial assets occurring in fiscal periods beginning on January 1, 20102011 for PHI. ThisThe energy services contracts of Pepco Energy Services are primarily impacted by this guidance because they often have multiple elements, which could include design, installation, operation and maintenance, and measurement and verification services. PHI and its subsidiaries adopted the new guidance, effective January 1, 2011, and it did not have a material impact on Pepco Energy Services’ revenue recognition methods or results of operations, nor did it have a material impact on PHI’s overall financial condition, results of operations or cash flows.
Fair Value Measurement and Disclosures (ASC 820)
The FASB issued new disclosure requirements for recurring and non-recurring fair value measurements. The guidance, effective beginning with PHI’s March 31, 2010 financial statements, requires the disaggregation of balance sheet items measured at fair value into subsets of balance sheet items based on the nature and risks of the items. The standard requires descriptions of pricing inputs and valuation methodologies for instruments with Level 2 or 3 valuation inputs. In addition, the standard requires information about any significant transfers of instruments between Level 1 and 2 valuation categories. These additional disclosures are included in Note (16), “Fair Value Disclosures.”
Consolidation of Variable Interest Entities (ASC 810)
The FASB issued new consolidation guidance regarding variable interest entities effective January 1, 2010 that eliminates the quantitative analysis requirement and adds new qualitative factors to determine whether consolidation is required. The new qualitative factors are applied on a quarterly basis to interests in
PEPCO HOLDINGS
variable interest entities. Under the new guidance, the holder of the interest with the power to direct the most significant activities of the entity and the right to receive benefits or absorb losses significant to the entity would consolidate. The new guidance retains the provision that allows entities created before December 31, 2003 to be scoped out from a consolidation assessment if exhaustive efforts are taken and there is insufficient information to determine whether there is a relationship with a variable interest entity or the primary beneficiary of a variable interest entity. This guidance did not have a material impact on PHI’s overall financial condition, results of operations, or cash flows.
Subsequent Events (ASC 855)
The FASB issued new guidance that eliminates the requirement for PHI to disclose the date through which it has evaluated subsequent events beginning with its March 31, 2010 financial statements.
Receivables (ASC 310)
The FASB issued new disclosure requirements relating to an entity’s credit exposure to financing receivables that became effective beginning with PHI’s December 31, 2010 financial statements. The new guidance requires disclosures about the credit quality of receivables with maturities of greater than one year and related accounting policies. The primary impact to PHI was additional disclosures about the credit quality of its lessees under its cross-border energy lease investments, which disclosures are included in Note (8), “Leasing Activities.”
(4) RECENTLY ISSUED ACCOUNTING STANDARDS, NOT YET ADOPTED
Fair Value MeasurementMeasurements and Disclosures (ASC 820)
TheIn May 2011, the FASB issued new disclosure requirements that require the disaggregation of the Level 3guidance on fair value measurement reconciliations intoand disclosures that will be effective beginning with PHI’s March 31, 2012 consolidated financial statements. The new guidance will change how fair value is measured in specific instances and expand disclosures about fair value measurements. PHI expects that it will have to provide additional disclosures, but does not expect this guidance to have a significant impact on its fair value measurements.
Comprehensive Income (ASC 220)
In June 2011, the FASB issued new guidance that requires entities to report comprehensive income in one of two ways: (i) one single continuous statement that combines the income statement with the statement of other comprehensive income and totals to a comprehensive income amount; or (ii) in two separate categories for significant purchases, sales, issuances,but consecutive statements of income and settlements. Thisother comprehensive income. In December 2011, the FASB indefinitely deferred the requirement that entities separately present items in their income statement that had been reclassified from other comprehensive income. PHI currently applies the second option in its consolidated financial statements, so PHI expects that this guidance will have minimal impact on its consolidated financial statements. The new guidance is effective beginning with PHI’s March 31, 2012 consolidated financial statements.
Goodwill (ASC 350)
In September 2011, the FASB issued new guidance that changes the annual and interim assessments of goodwill for impairment. The new guidance modifies the required annual impairment test by giving entities the option to perform a qualitative assessment of whether it is more likely than not that goodwill is impaired before performing a quantitative assessment. The new guidance also amends the events and
151
PEPCO HOLDINGS
circumstances that entities should assess to determine whether an interim quantitative impairment test is necessary. The new guidance is effective beginning January 1, 2012 for PHI as it did not elect the option to apply the guidance earlier. PHI did not employ the new qualitative assessment as part of its November 1, 2011 annual impairment test. PHI does not expect the new impairment guidance to have a material impact on its consolidated financial statements.
Balance Sheet (ASC 210)
In December 2011, the FASB issued new disclosure requirements for assets and liabilities, such as derivatives, that are subject to contractual netting arrangements. The new disclosures will include information about the gross exposures and net exposure under contractual netting arrangements as well as how the exposures are presented in the financial statements. The new disclosures are effective beginning with PHI’s March 31, 2013 consolidated financial statements. PHI is evaluating the impact of this new guidance on its consolidated financial statement footnote disclosures.
Revenue Recognition (ASC 605)
The FASB has issued new revenue recognition guidance related to the determination of separate units of accounting for multiple-deliverables within a single contract. PHI’s revenues potentially affected by this guidance are primarily those of Pepco Energy Services’ energy services business, which enters into contracts that have multiple deliverables, such as design, installation, operation and maintenance, measurement, and verification. The guidance is effective January 1, 2011 for PHI, and it is not expected to have a material impact on Pepco Energy Services’ revenue recognition methods or results.
Goodwill (ASC 350)
In December 2010, the FASB issued new guidance on performing goodwill impairment tests. The new guidance eliminates the option to exclude liabilities that are part of the capital structure of the reporting unit when calculating the carrying value of the reporting unit. This is effective for PHI beginning January 1, 2011. Under the new guidance, the carrying value of the reporting unit is the net amount of the assets and liabilities allocated to the reporting unit. PHI allocates liabilities to the reporting unit when performing its goodwill impairment test, so the new guidance is not expected to change how PHI currently performs its goodwill impairment test.
PEPCO HOLDINGS
statements.
(5) SEGMENT INFORMATION
Pepco Holdings’ management has identified its operating segments at December 31, 20102011 as Power Delivery, Pepco Energy Services and Other Non-Regulated. In the tables below, the Corporate and Other column is included to reconcile the segment data with consolidated data and includes unallocated Pepco Holdings’ (parent company) capital costs, such as acquisition financing costs. Segment financial information for continuing operations for the years ended December 31, 2011, 2010 2009, and 2008,2009, is as follows:
| Year Ended December 31, 2010 | Year Ended December 31, 2011 | |||||||||||||||||||||||||||||||||||||||
| (millions of dollars) | (millions of dollars) | |||||||||||||||||||||||||||||||||||||||
| Power Delivery | Pepco Energy Services | Other Non- Regulated | Corporate and Other (a) | PHI Consolidated | Power Delivery | Pepco Energy Services | Other Non- Regulated | Corporate and Other (a) | PHI Consolidated | |||||||||||||||||||||||||||||||
Operating Revenue | $ | 5,114 | $ | 1,883 | $ | 54 | $ | (12 | ) | $ | 7,039 | $ | 4,650 | $ | 1,238 | $ | 48 | $ | (16 | ) | $ | 5,920 | ||||||||||||||||||
Operating Expenses | 4,611 | (d) | 1,812 | 6 | (14 | ) | 6,415 | 4,150 | 1,206 | (30 | )(c) | (43 | ) | 5,283 | ||||||||||||||||||||||||||
Operating Income | 503 | 71 | 48 | 2 | 624 | 500 | 32 | 78 | 27 | 637 | ||||||||||||||||||||||||||||||
Interest Income | 2 | 1 | 3 | (6 | ) | — | 1 | 1 | 4 | (5 | ) | 1 | ||||||||||||||||||||||||||||
Interest Expense | 207 | 16 | 12 | 71 | 306 | 208 | 3 | 13 | 30 | 254 | ||||||||||||||||||||||||||||||
Impairment Losses | — | — | — | (5 | ) | (5 | ) | |||||||||||||||||||||||||||||||||
Other Income (Expenses) | 20 | 2 | (2 | ) | 1 | 21 | 29 | 3 | (4 | ) | 2 | 30 | ||||||||||||||||||||||||||||
Loss on Extinguishment of Debt | — | — | — | (189 | )(e) | (189 | ) | |||||||||||||||||||||||||||||||||
Preferred Stock Dividends | — | — | 3 | (3 | ) | — | — | — | 3 | (3 | ) | — | ||||||||||||||||||||||||||||
Income Tax Expense (Benefit) | 112 | (f) | 22 | 9 | (132 | )(g) | 11 | |||||||||||||||||||||||||||||||||
Income Tax Expense (d) | 112 | 9 | 27 | 1 | 149 | |||||||||||||||||||||||||||||||||||
Net Income (Loss) from Continuing Operations | 206 | 36 | 25 | (128 | ) | 139 | 210 | 24 | 35 | (c) | (9 | ) | 260 | |||||||||||||||||||||||||||
Total Assets | 10,621 | 623 | 1,537 | 1,699 | 14,480 | 11,008 | 565 | 1,499 | 1,838 | 14,910 | ||||||||||||||||||||||||||||||
Construction Expenditures | $ | 765 | $ | 7 | $ | — | $ | 30 | $ | 802 | $ | 888 | $ | 14 | $ | — | $ | 39 | $ | 941 | ||||||||||||||||||||
| (a) | Total Assets in this column includes Pepco Holdings’ goodwill balance of $1.4 billion, all of which is allocated to |
| (b) | Includes depreciation and amortization expense of $426 million, consisting of $394 million for Power Delivery, $17 million for Pepco Energy Services, $2 million for Other Non-Regulated, and $13 million for Corporate and Other. |
| (c) | Includes $39 million pre-tax ($3 million after-tax) gain from the early termination of cross-border energy leases held in trust. |
| (d) | Includes tax benefits of $14 million for Power Delivery primarily associated with an interest benefit related to federal tax liabilities and a $22 million reversal of previously recognized tax benefits for Other Non-Regulated associated with the early termination of cross-border energy leases held in trust. |
152
PEPCO HOLDINGS
| Year Ended December 31, 2010 | ||||||||||||||||||||
| (millions of dollars) | ||||||||||||||||||||
| Power Delivery | Pepco Energy Services | Other Non- Regulated | Corporate and Other (a) | PHI Consolidated | ||||||||||||||||
Operating Revenue | $ | 5,114 | $ | 1,883 | $ | 54 | $ | (12 | ) | $ | 7,039 | |||||||||
Operating Expenses (b)(c) | 4,611 | (d) | 1,812 | 6 | (14 | ) | 6,415 | |||||||||||||
Operating Income | 503 | 71 | 48 | 2 | 624 | |||||||||||||||
Interest Income | 2 | 1 | 3 | (6 | ) | — | ||||||||||||||
Interest Expense | 207 | 16 | 12 | 71 | 306 | |||||||||||||||
Other Income (Expenses) | 20 | 2 | (2 | ) | 1 | 21 | ||||||||||||||
Loss on Extinguishment of Debt | — | — | — | (189 | )(e) | (189 | ) | |||||||||||||
Preferred Stock Dividends | — | — | 3 | (3 | ) | — | ||||||||||||||
Income Tax Expense (Benefit) | 112 | (f) | 22 | 9 | (132 | )(g) | 11 | |||||||||||||
Net Income (Loss) from Continuing Operations | 206 | 36 | 25 | (128 | ) | 139 | ||||||||||||||
Total Assets | 10,621 | 623 | 1,537 | 1,582 | 14,363 | |||||||||||||||
Construction Expenditures | $ | 765 | $ | 7 | $ | — | $ | 30 | $ | 802 | ||||||||||
| (a) | Total Assets in this column includes Pepco Holdings’ goodwill balance of $1.4 billion, all of which is allocated to Power Delivery for purposes of assessing impairment. Total assets also include capital expenditures related to certain hardware and software expenditures which primarily benefit Power Delivery. These expenditures are recorded as incurred in the Corporate and Other segment and are allocated to Power Delivery once the assets are placed in service. Corporate and Other includes intercompany amounts of $(12) million for Operating Revenue, $(10) million for Operating Expense, $(36) million for Interest Income, $(36) million for Interest Expense, and $(3) million for Preferred Stock Dividends. |
| (b) | Includes depreciation and amortization expense of $393 million, consisting of $357 million for Power Delivery, $24 million for Pepco Energy Services, $1 million for Other Non-Regulated, and $11 million for Corporate and Other. |
| (c) | Includes restructuring charge of $30 million, consisting of $29 million for Power Delivery and $1 million for Corporate and Other. |
| (d) | Includes $11 million expense related to effects of Pepco divestiture-related claims. |
| (e) | Includes $174 million ($104 million after-tax) related to loss on extinguishment of debt and $15 million ($9 million after-tax) related to the reclassification of treasury rate lock losses from AOCL to income related to cash tender offers for debt made in 2010. |
| (f) | Includes $12 million of net Federal and state income tax benefits primarily related to adjustments of accrued interest on uncertain and effectively settled tax positions. |
| (g) | Includes $14 million of state tax benefits resulting from the restructuring of certain PHI subsidiaries and $17 million of state income tax benefits associated with the loss on extinguishment of debt, partially offset by a charge of $3 million to write off deferred tax assets related to the subsidy pursuant to the prescription drug benefit (Medicare Part D) under the Medicare |
| Year Ended December 31, 2009 | ||||||||||||||||||||
| (millions of dollars) | ||||||||||||||||||||
| Power Delivery | Pepco Energy Services | Other Non- Regulated | Corporate and Other (a) | PHI Consolidated | ||||||||||||||||
Operating Revenue | $ | 4,980 | $ | 2,383 | $ | 51 | $ | (12 | ) | $ | 7,402 | |||||||||
Operating Expenses (b) | 4,475 | (c) | 2,294 | 4 | (19 | ) | 6,754 | |||||||||||||
Operating Income | 505 | 89 | 47 | 7 | 648 | |||||||||||||||
Interest Income | 3 | 1 | 4 | (6 | ) | 2 | ||||||||||||||
Interest Expense | 211 | 30 | 14 | 85 | 340 | |||||||||||||||
Other Income | 11 | 3 | 2 | 1 | 17 | |||||||||||||||
Preferred Stock Dividends | — | — | 3 | (3 | ) | — | ||||||||||||||
Income Tax Expense (Benefit) | 109 | 23 | 5 | (33 | ) | 104 | ||||||||||||||
Net Income (Loss) from Continuing Operations | 199 | (d) | 40 | 31 | (47 | ) | 223 | |||||||||||||
Total Assets | 10,239 | 734 | 1,515 | 1,294 | 13,782 | |||||||||||||||
Construction Expenditures | $ | 622 | $ | 12 | $ | — | $ | 30 | $ | 664 | ||||||||||
PEPCO HOLDINGS
| (a) | Total Assets in this column includes Pepco Holdings’ goodwill balance of $1.4 billion, all of which is allocated to |
| (b) | Includes depreciation and amortization expense of $349 million, consisting of $323 million for Power Delivery, $18 million for Pepco Energy Services, $2 million for Other Non-Regulated, and $6 million for Corporate and Other. |
153
PEPCO HOLDINGS
| (c) | Includes $40 million ($24 million after-tax) gain related to effects of Pepco divestiture-related claims. |
| (d) | Includes $11 million after-tax state income tax benefit, net of fees, related to a change in the tax reporting for the disposition of certain assets in prior years. |
| Year Ended December 31, 2008 | ||||||||||||||||||||
| (millions of dollars) | ||||||||||||||||||||
| Power Delivery | Pepco Energy Services | Other Non- Regulated | Corporate and Other (a) | PHI Consolidated | ||||||||||||||||
Operating Revenue | $ | 5,488 | $ | 2,648 | $ | (60 | )(c) | $ | (17 | ) | $ | 8,059 | ||||||||
Operating Expenses (b) | 4,932 | 2,592 | 4 | (18 | ) | 7,510 | ||||||||||||||
Operating Income (Loss) | 556 | 56 | (64 | ) | 1 | 549 | ||||||||||||||
Interest Income | 14 | 4 | 4 | (5 | ) | 17 | ||||||||||||||
Interest Expense | 195 | 5 | 19 | 86 | 305 | |||||||||||||||
Other Income (Expenses) | 14 | 2 | (5 | ) | 1 | 12 | ||||||||||||||
Preferred Stock Dividends | — | — | 3 | (3 | ) | — | ||||||||||||||
Income Tax Expense (Benefit) | 139 | 18 | (30 | )(c) | (37 | ) | 90 | |||||||||||||
Net Income (Loss) from Continuing Operations | 250 | 39 | (57 | )(c) | (49 | ) | 183 | |||||||||||||
Total Assets | 10,089 | 798 | 1,452 | 1,843 | 14,182 | |||||||||||||||
Construction Expenditures | $ | 587 | $ | 31 | $ | — | $ | 25 | $ | 643 | ||||||||||
PEPCO HOLDINGS
(6)GOODWILL
Substantially all of PHI’s $1.4 billion goodwill balance was generated by Pepco’s acquisition of Conectiv in 2002 and2002. The goodwill is allocated entirely to the Power Delivery reporting unit based on the aggregation of its regulated public utility company components for purposes of assessing impairment under FASB guidance on goodwill and other intangibles (ASC 350). PHI’s annual impairment test as of November 1, 20102011 indicated that goodwill was not impaired. As of December 31, 2010, after review of its significant assumptions in the goodwill impairment analysis, PHI concluded that there were no events requiring it to perform an interim goodwill impairment test. Although PHI’s market capitalization was below book value at December 31, 2010, PHI’s market capitalization has improved compared to earlier periods when it performed interim impairment tests. PHI performed its previous annual goodwill impairment test as of November 1, 2009, and interim impairment tests as of March 31, 2009 and December 31, 2008 when its market capitalization was further below book value than at November 1, 2009. PHI concluded that its goodwill was not impaired at those earlier dates.
In order to estimate the fair value of its Power Delivery reporting unit, PHI uses two valuation techniques: an income approach and a market approach. The income approach estimates fair value based on a discounted cash flow analysis using estimated future cash flows and a terminal value that is consistent with Power Delivery’s long-term view of the business. This approach uses a discount rate based on the estimated weighted average cost of capital (WACC) for the reporting unit. PHI determines the estimated WACC by considering market-based information for the cost of equity and cost of debt that is appropriate for the Power Delivery business as of the measurement date. The market approach estimates fair value based on a multiple of earnings before interest, taxes, depreciation, and amortization (EBITDA) that management believes is consistent with EBITDA multiples for comparable utilities. PHI has consistently used this valuation framework to estimate the fair value of Power Delivery.
The estimation of fair value is dependent on a number of factors that are derived from the Power Delivery reporting unit’s business forecast, including but not limited to interest rates, growth assumptions, returns on rate base, operating and capital expenditure requirements, and other factors, changes in which could materially affect the results of impairment testing. Assumptions used in the models were consistent with historical experience, including assumptions concerning the recovery of operating costs and capital expenditures. Sensitive, interrelated and uncertain variables that could decrease the estimated fair value of the Power Delivery reporting unit include utility sector market performance, sustained adverse business conditions, changes in forecasted revenues, higher operating and maintenance capital expenditure requirements, a significant increase in the cost of capital and other factors.
In addition to estimating the fair value of its Power Delivery reporting unit, PHI estimated the fair value of its other reporting units (Pepco Energy Services and Other Non-Regulated, and Corporate and Other)Non-Regulated) at November 1, 2010.2011. The sum of the fair value of all reporting units was reconciled to PHI’s market capitalization at November 1, 20102011 to corroborate estimates of the fair value of its reporting units. The sum of the estimated fair values of all reporting units exceeded the market capitalization of PHI at November 1, 2010.2011. PHI believes that the excess of the estimated fair value of PHI’s reporting units as compared to PHI’s market capitalization reflects a reasonable control premium that is comparable to control premiums observed in historical acquisitions in the utility industry during various economic environments. Given the lack of a fundamental change in the Power Delivery reporting unit’s business, PHI does not believe that the decline in its stock price since mid-2008 indicated a commensurate decline in the fair value of PHI’s Power Delivery reporting unit. PHI’s Power Delivery reporting unit consists of regulated companies with regulated recovery rates and approved rates of return allowing for generally predictable and steady streams of revenues and cash flows over an extended period of time.
PEPCO HOLDINGS
PHI will continue to closely monitor for indicators of goodwill impairment, including the sustained period of time that PHI’s stock price has been below its book value.
As discussed in Note (1), “Organization,” onin December 7, 2009, PHI announced the wind-down of the Pepco Energy Services retail energy supply business. As a result of this decision, PHI determined that all goodwill allocated to this business was impaired and therefore, PHI recorded a goodwill impairment charge of $4 million in the fourth quarter of 2009 to write-off the goodwill associated with this business.
A roll forward of PHI’s goodwill balance is set forth below in millions of dollars:
154
Balance, December 31, 2008 | $ | 1,411 | ||
Less: Impairment charge associated with wind-down of Pepco Energy Services retail energy business | (4 | ) | ||
Balance, December 31, 2009 | 1,407 | |||
Less: Adjustments | — | |||
Balance, December 31, 2010 | $ | 1,407 | ||
PEPCO HOLDINGS
PHI’s gross amount of goodwill, accumulated impairment losses and carrying amount of goodwill for the years ended December 31, 2011 and 2010 were as follows:
| 2011 | 2010 | |||||||||||||||||||||||
| Gross Amount | Accumulated Impairment Losses | Carrying Amount | Gross Amount | Accumulated Impairment Losses | Carrying Amount | |||||||||||||||||||
| (millions of dollars) | ||||||||||||||||||||||||
Beginning balance as of January 1 | $ | 1,425 | $ | 18 | $ | 1,407 | $ | 1,425 | $ | 18 | $ | 1,407 | ||||||||||||
Impairment losses | — | — | — | — | — | — | ||||||||||||||||||
|
|
|
|
|
|
|
|
|
|
|
| |||||||||||||
Ending balance as of December 31 | $ | 1,425 | $ | 18 | $ | 1,407 | $ | 1,425 | $ | 18 | $ | 1,407 | ||||||||||||
|
|
|
|
|
|
|
|
|
|
|
| |||||||||||||
(7)REGULATORY ASSETS AND REGULATORY LIABILITIESMATTERS
Regulatory Assets and Regulatory Liabilities
The components of Pepco Holdings’ regulatory asset and liability balances at December 31, 20102011 and 20092010 are as follows:
| 2010 | 2009 | 2011 | 2010 | |||||||||||||
| (millions of dollars) | (millions of dollars) | |||||||||||||||
Regulatory Assets | ||||||||||||||||
Pension and OPEB costs (a) | $ | 848 | $ | 752 | $ | 1,037 | $ | 848 | ||||||||
Securitized stranded costs (a) | 559 | 620 | 481 | 559 | ||||||||||||
Deferred income taxes | 139 | 135 | 145 | 139 | ||||||||||||
Deferred energy supply costs (a) | 61 | 24 | 124 | 61 | ||||||||||||
Recoverable meter-related costs (a) | 112 | 44 | ||||||||||||||
Deferred debt extinguishment costs (a) | 61 | 67 | 57 | 61 | ||||||||||||
Recoverable meter-related costs (a) | 44 | 5 | ||||||||||||||
Recoverable workers compensation and long-term disability costs | 34 | 28 | ||||||||||||||
Blueprint for the Future | 30 | 16 | ||||||||||||||
Deferred losses on gas derivatives | 31 | 42 | 17 | 31 | ||||||||||||
Other | 172 | 156 | 159 | 128 | ||||||||||||
|
| |||||||||||||||
Total Regulatory Assets | $ | 1,915 | $ | 1,801 | $ | 2,196 | $ | 1,915 | ||||||||
|
| |||||||||||||||
Regulatory Liabilities | ||||||||||||||||
Asset removal costs | $ | 361 | $ | 352 | $ | 388 | $ | 361 | ||||||||
Deferred income taxes due to customers | 50 | 53 | 48 | 50 | ||||||||||||
Deferred energy supply costs | 33 | 35 | ||||||||||||||
Excess depreciation reserve | 42 | 58 | 26 | 42 | ||||||||||||
Federal and New Jersey tax benefits, related to securitized stranded costs | 22 | 25 | ||||||||||||||
Deferred energy supply costs | 35 | 117 | ||||||||||||||
Other | 18 | 8 | 31 | 40 | ||||||||||||
|
| |||||||||||||||
Total Regulatory Liabilities | $ | 528 | $ | 613 | $ | 526 | $ | 528 | ||||||||
|
| |||||||||||||||
| (a) | A return is generally earned on these deferrals. |
A description for each category of regulatory assets and regulatory liabilities follows:
Pension and OPEB Costs:Represents the unfunded portion ofunrecognized amounts related to net actuarial losses, prior service cost (credit), and transition liability for Pepco Holdings’ defined benefit pension and other postretirement benefit (OPEB) plans that is probable of recoveryare expected to be recovered by Pepco, DPL and ACE in rates. The utilities have
155
PEPCO HOLDINGS
historically included these items as a part of its cost of service in its customer rates. This regulatory asset is adjusted at least annually when the funded status of Pepco Holdings’ defined benefit pension and OPEB plans are re-measured. See Note (10), “Pension and Other Postretirement Benefits,” for more information about the components of the unrecognized pension and OPEB costs.
Securitized Stranded Costs: Includes contract termination payments under a contract between ACE and an unaffiliated non-utility generatorNUG and costs associated with the regulated operations of ACE’s electricity generation business which are no longer recoverable through customer rates. The recovery of these stranded costs has been securitized through the issuance of Transition Bonds by ACE Funding. A customer surcharge is collected by ACE to fund principal and interest payments on the Transition Bonds. The stranded costs are amortized over the life of the Transition Bonds, which mature between 2013 and 2023.
Deferred Income Taxes: Represents a receivable from Power Delivery’s customers for tax benefits applicable to utility operations of Pepco, DPL and ACE previously flowed through before the companies were ordered to account for the tax benefits as deferred income taxes. As the temporary differences between the financial statement basis and tax basis of assets reverse, the deferred recoverable balances are reversed.
Deferred Energy Supply Costs: The regulatory asset represents primarily deferred costs associated with a net under-recovery of Default Electricity Supply costs incurred by Pepco, DPL and ACE that are probable of recovery in rates. The regulatory liability represents primarily deferred costs associated with a net over-recovery of Default Electricity Supply costs incurred that will be refunded by Pepco, DPL and ACE to customers.
PEPCO HOLDINGS
Recoverable Meter-Related Costs:Represents costs associated with the installation of smart meters and the early retirement of existing meters throughout Pepco’s and DPL’s service territories as a result of the AMI project.
Deferred Debt Extinguishment Costs: Represents the costs of debt extinguishment of Pepco, DPL and ACE for which recovery through regulated utility rates is considered probable and, if approved, will be amortized to interest expense during the authorized rate recovery period.
Recoverable Meter-Related Costs:Workers’ Compensation and Long-Term Disability Costs: Represents accrued workers’ compensation and long-term disability costs for Pepco, which are recoverable from customers when actual claims are paid to employees.
Blueprint for the Future:Includes costs associated with Blueprint for the installation of smart metersFuture initiatives which include programs to help customers better manage their energy use and the early retirement of existing meters throughout Pepco’sto allow each utility to better manage their electrical and DPL’s service territory as a result of the Advanced Metering Infrastructure (AMI) project.natural gas distribution systems.
Deferred Losses on Gas Derivatives:Derivatives: Represents losses associated with hedges of natural gas purchases that are recoverable by DPL through the Gas Cost Rate approved by the DPSC.
Other: Represents miscellaneous regulatory assets that generally are being amortized over 1 to 20 years. Also includes the under-recovery of administrative costs associated with Default Electricity Supply in the District of Columbia and Maryland.
Asset Removal Costs: The depreciation rates for Pepco and DPL include a component for removal costs, as approved by the relevant federal and state regulatory commissions. As such, Pepco and DPL have recorded regulatory liabilities for their estimate of the difference between incurred removal costs and the amount of removal costs recovered through depreciation rates.
Deferred Income Taxes Due to Customers:Represents the portions of deferred income tax liabilities applicable to utility operations of Pepco, DPL and ACE that have not been reflected in current customer rates for which future payment to customers is probable. As the temporary differences between the financial statement basis and tax basis of assets reverse, deferred recoverable income taxes are amortized.
156
PEPCO HOLDINGS
Excess Depreciation Reserve: The excess depreciation reserve was recorded as part of an ACE New Jersey rate case settlement. This excess reserve is the result of a change in estimated depreciable lives and a change in depreciation technique from remaining life to whole life that caused an over-recovery for depreciation expense from customers when the remaining life method has been used. The excess is being amortized over an 8.25 year period, which began in June 2005.
Federal and New Jersey Tax Benefits, Related to Securitized Stranded Costs: Securitized stranded costs include a portion attributable to the future tax benefit expected to be realized when the higher tax basis of the generating facilities divested by ACE is deducted for New Jersey state income tax purposes, as well as the future benefit to be realized through the reversal of federal excess deferred taxes. To account for the possibility that these tax benefits may be given to ACE’s customers through lower rates in the future, ACE established a regulatory liability. The regulatory liability related to federal excess deferred taxes will remain until such time as the Internal Revenue Service issues its final regulations with respect to normalization of these federal excess deferred taxes.
Other: Includes miscellaneous regulatory liabilities.
Regulatory Proceedings
District of Columbia Divestiture Case
In June 2000, the DCPSC approved a divestiture settlement under which Pepco is required to share with its District of Columbia customers the net proceeds realized by Pepco from the sale of its generation-related assets in 2000. This approval left unresolved issues of (i) whether Pepco should be required to share with customers the excess deferred income taxes (EDIT) and accumulated deferred investment tax credits (ADITC) associated with the sold assets and, if so, whether such sharing would violate the normalization provisions of the Internal Revenue Code and its implementing regulations and (ii) whether Pepco was entitled to deduct certain costs in determining the amount of proceeds to be shared.
In May 2010, the DCPSC issued an order addressing all of the remaining issues related to the sharing of the proceeds of Pepco’s divestiture of its generating assets. In the order, the DCPSC ruled that Pepco is not required to share EDIT and ADITC with customers. However, the order also disallowed certain items that Pepco had included in the costs deducted from the proceeds of the sale of the generation assets. The disallowance of these costs, together with interest on the disallowed amount, increased the aggregate amount Pepco was required to distribute to customers, pursuant to the sharing formula, by approximately $11 million, which Pepco recognized as an expense in 2010 and refunded the amounts to its customers. In June 2010, Pepco filed an application for reconsideration of the DCPSC’s order. In July 2010, the DCPSC denied Pepco’s application for reconsideration. In September 2010, Pepco filed an appeal of the DCPSC’s decision with the District of Columbia Court of Appeals. On April 12, 2011, the Court of Appeals affirmed the DCPSC order. Pepco determined not to appeal this decision.
Maryland Public Service Commission Reliability Investigation
In August 2010, following major storm events that occurred in July and August 2010, the MPSC initiated a proceeding for the purpose of investigating the reliability of Pepco’s distribution system and the quality of distribution service Pepco provided to its customers. On December 21, 2011, the MPSC issued an order in the proceeding imposing a fine on Pepco of $1 million, which Pepco has paid. In accordance with the order, Pepco filed a detailed work plan for the next five years, which provides a comprehensive description of Pepco’s reliability enhancement plan, its emergency response improvement project, and other communication and service restoration improvements. Pepco is also required to file quarterly updates and a year-end status report with the MPSC providing, among other things, detailed information about its reliability and emergency response improvement objectives; its progress in meeting such objectives, together with an analysis of trends concerning the measured duration and frequency of customer interruptions compared to 2010 baseline data; the amount of spending associated with such objectives; an explanation for any inability to meet such objectives; any proposed changes in funding these improvement projects; any changes to any of these projects; and interim and final results of Pepco’s system inspection program. In addition, Pepco must provide additional detail in these reports about its Estimated Time to Restoration Manager and the Customer Advocate, which personnel have been added by Pepco as part of its emergency response improvement project, and to explore the benefits of damage prediction models.
157
PEPCO HOLDINGS
Finally, Pepco was required to consider, the comments and suggestions of other interested parties in the reliability proceeding regarding improvements that Pepco might make to its reliability enhancement programs. In these reports, Pepco will be required to demonstrate that its reliability enhancement plan costs were prudently spent and produced a significant improvement in reliability, and if it is unable to do so, the MPSC may deny Pepco reimbursement for future reliability enhancement expenditures or impose additional fines.
The MPSC also stated in the order that it intends to review in Pepco’s pending electric distribution base rate case the recovery of reliability costs and to disallow incremental costs it determines to be the result of imprudent management. Pepco believes its reliability costs have been prudently incurred. Furthermore, Pepco believes that its reliability enhancement plan will enable Pepco to meet the MPSC’s requirements.
Rate Proceedings
Over the last several years, PHI’s utility subsidiaries have proposed in each of their respective service territories the adoption of a mechanism to decouple retail distribution revenue from the amount of power delivered to retail customers. To date:
A BSA has been approved and implemented for Pepco and DPL electric service in Maryland and for Pepco electric service in the District of Columbia. The MPSC has issued an order requiring modification of the BSA in Maryland so that revenues lost as a result of major storm outages are not collected through the BSA if electric service is not restored to the pre-major storm levels within 24 hours of the start of a major storm (as discussed below).
A modified fixed variable rate design (MFVRD) has been approved in concept for DPL electric service in Delaware, but the implementation has been deferred by the DPSC pending the development of an implementation plan and a customer education plan. DPL anticipates that the MFVRD will be in place for electric service by early 2013.
A MFVRD has been approved in concept for DPL natural gas service in Delaware, but implementation likewise has been deferred until development of an implementation plan and a customer education plan. DPL anticipates that the MFVRD will be in place for natural gas service by early 2013.
In New Jersey, a BSA proposed by ACE as part of a Phase 2 to the base rate proceeding filed in August 2009 was not included in the final settlement approved by the NJBPU on May 16, 2011. Accordingly, there is no BSA proposal currently pending in New Jersey.
Under the BSA, customer distribution rates are subject to adjustment (through a credit or surcharge mechanism), depending on whether actual distribution revenue per customer exceeds or falls short of the revenue-per-customer amount approved by the applicable public service commission. The MFVRD approved in concept in Delaware provides for a fixed customer charge (i.e., not tied to the customer’s volumetric consumption) to recover the utility’s fixed costs, plus a reasonable rate of return. Although different from the BSA, PHI views the MFVRD as an appropriate distribution revenue decoupling mechanism.
Delaware
Gas Cost Rates
DPL makes an annual Gas Cost Rate (GCR) filing with the DPSC for the purpose of allowing DPL to recover natural gas procurement costs through customer rates. In August 2010, DPL made its 2010 GCR filing, which proposes rates that would allow DPL to recover an amount equal to a two-year amortization of currently under-recovered natural gas costs. In October 2010, the DPSC issued an order allowing DPL to place the new rates into effect on November 1, 2010, subject to refund and pending final DPSC
158
PEPCO HOLDINGS
approval. The effect of the proposed two-year amortization upon rates is an increase of 0.1% in the level of GCR. The parties in the proceeding submitted a proposed settlement to the hearing examiner on June 3, 2011, which includes the first year of DPL’s two-year amortization but provides that DPL will forego the interest ($171,000 for the 2011 to 2012 period covered by the GCR and $171,000 for the 2012 to 2013 period covered by the GCR) associated with that amortization. The proposed settlement was approved by the DPSC on October 18, 2011.
In August 2011, DPL made its 2011 GCR filing. The filing includes the second year of the effect of the proposed two-year amortization as proposed in DPL’s 2010 filing. On September 20, 2011, the DPSC issued an order allowing DPL to place the new rates into effect on November 1, 2011, subject to refund and pending final DPSC approval.
Natural Gas Distribution Base Rates
In July 2010, DPL submitted an application with the DPSC to increase its natural gas distribution base rates. As subsequently amended, the filing sought approval of an annual rate increase of approximately $10.2 million, based on a requested return on equity (ROE) of 11.0%, and requests approval of implementation of the MFVRD. As permitted by Delaware law, DPL placed an annual increase of approximately $2.5 million into effect, on a temporary basis, on August 31, 2010, and the remainder of approximately $7.7 million of the requested increase was placed into effect on February 2, 2011, in each case subject to refund and pending final DPSC approval. On June 21, 2011, the DPSC approved a settlement providing for an annual rate increase of approximately $5.8 million, based on an ROE of 10.0%. The decision deferred the implementation of the MFVRD until an implementation plan and a customer education plan are developed. As of December 31, 2011, the amount collected in excess of the approved rate has been refunded to customers through a bill credit.
Electric Distribution Base Rates
On December 2, 2011, DPL submitted an application with the DPSC to increase its electric distribution base rates. The filing seeks approval of an annual rate increase of approximately $31.8 million, based on a requested ROE of 10.75%, and requests approval of implementation of the MFVRD. DPL has requested that the rates become effective on January 31, 2012. In the effort to reduce the shortfall in revenues due to the delay in time or lag between when costs are incurred and when they are reflected in rates (regulatory lag), the filing includes a request for the DPSC to approve a reliability investment recovery mechanism (RIM) to recover reliability-related capital expenditures incurred between base rate cases. Through the RIM, DPL would collect in a surcharge the amount of its reliability-related capital expenditures based on its budget for the current year. The budgeted amount would be reconciled with actual capital expenditures on an annual basis and any over-recovery or under-recovery would be reflected in the next year’s surcharge. The work undertaken pursuant to the RIM would be subject to a prudency review by the DPSC in the next base rate case or at more frequent intervals as determined by the DPSC. DPL’s operating and maintenance costs and other capital expenditures would remain subject to recovery through the traditional ratemaking process. DPL has also requested DPSC approval of the use of fully forecasted test years in future DPL rate cases. On January 10, 2012, the DPSC entered an order suspending the full increase and allowing a temporary rate increase of $2.5 million to go into effect on January 31, 2012, subject to refund and pending final DPSC approval. As permitted by Delaware law, DPL intends to place the remainder of approximately $29.3 million of the requested increase into effect on July 2, 2012, subject to refund and pending final DPSC approval.
District of Columbia
On July 8, 2011, Pepco filed an application with the DCPSC to increase its electric distribution base rates by approximately $42 million annually, based on an ROE of 10.75%. In the effort to reduce regulatory lag, the filing includes a request for the DCPSC to approve a RIM to recover reliability-related capital
159
PEPCO HOLDINGS
expenditures incurred between base rate cases. Through the RIM, Pepco would collect in a surcharge the amount of its reliability-related capital expenditures based on its budget for the current year. The budgeted amount would be reconciled with actual capital expenditures on an annual basis and any over-recovery or under-recovery would be reflected in the next year’s surcharge. The work undertaken pursuant to the RIM would be subject to a prudency review by the DCPSC in the next base rate case or at more frequent intervals as determined by the DCPSC. Pepco’s operating and maintenance costs and other capital expenditures would remain subject to recovery through the traditional ratemaking process. A decision by the DCPSC is expected in the second quarter of 2012.
Maryland
DPL Electric Distribution Base Rates
On December 9, 2011, DPL submitted an application with the MPSC to increase its electric distribution base rates. The filing seeks approval of an annual rate increase of approximately $25.2 million, based on a requested ROE of 10.75%. In the effort to reduce regulatory lag, the filing includes a request for the MPSC to approve a RIM to recover reliability-related capital expenditures incurred between base rate cases. Through the RIM, DPL would collect in a surcharge the amount of its reliability-related capital expenditures based on its budget for the current year. The budgeted amount would be reconciled with actual capital expenditures on an annual basis and any over-recovery or under-recovery would be reflected in the next year’s surcharge. The work undertaken pursuant to the RIM would be subject to a prudency review by the MPSC in the next base rate case or at more frequent intervals as determined by the MPSC. DPL’s operating and maintenance costs and other capital expenditures would remain subject to recovery through the traditional ratemaking process. DPL has also requested MPSC approval of the use of fully forecasted test years in future DPL rate cases. A decision by the MPSC is expected in July 2012.
Pepco Electric Distribution Base Rates
On December 16, 2011, Pepco submitted an application with the MPSC to increase its electric distribution base rates. The filing seeks approval of an annual rate increase of approximately $68.4 million, based on a requested ROE of 10.75%. In the effort to reduce regulatory lag, the filing includes a request for the MPSC to approve a RIM to recover reliability-related capital expenditures incurred between base rate cases. Through the RIM, Pepco would collect in a surcharge the amount of its reliability-related capital expenditures based on its budget for the current year. The budgeted amount would be reconciled with actual capital expenditures on an annual basis and any over-recovery or under-recovery would be reflected in the next year’s surcharge. The work undertaken pursuant to the RIM would be subject to a prudency review by the MPSC in the next base rate case or at more frequent intervals as determined by the MPSC. Pepco’s operating and maintenance costs and other capital expenditures would remain subject to recovery through the traditional ratemaking process. Pepco also has requested MPSC approval of the use of fully forecasted test years in future Pepco rate cases. A decision by the MPSC is expected in July 2012.
Major Storm Damage Recovery Proceedings
In February 2011, the MPSC initiated proceedings involving Pepco and DPL, as well as unaffiliated utilities in Maryland, for the purpose of reviewing how the BSA operates to recover revenues lost as a result of major storm outages. On January 25, 2012, the MPSC issued an order modifying the BSA to prevent Pepco and DPL from collecting lost utility revenue through the BSA if electric service is not restored to the pre-major storm levels within 24 hours of the start of a major storm (defined by the MPSC as a weather-related event during which more than the lesser of 10% or 100,000 of an electric utility’s customers have a sustained outage for more than 24 hours). The period for which the lost utility revenue may not be collected through the BSA commences 24 hours after the start of the major storm and continues until all major storm-related outages are restored. The MPSC stated that waivers permitting
160
PEPCO HOLDINGS
collection of BSA revenues would be granted in rare and extraordinary circumstances where a utility can show that an outage was not due to inadequate emphasis on reliability and restoration efforts were reasonable under the circumstances. A similar provision excluding revenues lost as a result of major storm outages from the calculation of future BSA adjustments is already included in the BSA for Pepco in the District of Columbia as approved by the DCPSC. The financial impact of service interruptions due to a major storm as a result of this MPSC order would generally depend on the scope and duration of the outages.
New Jersey
Electric Distribution Base Rates
On August 5, 2011, ACE filed a petition with the NJBPU to increase its electric distribution rates by the net amount of approximately $58.9 million, based on a return on equity of 10.75% (the ACE 2011 Base Rate Case). The net increase consists of a rate increase proposal of approximately $70.5 million, less a deduction from base rates of approximately $17 million attributable to excess depreciation expenses, plus approximately a $4.9 million increase in sales-and-use taxes and an upward adjustment of approximately $0.5 million in the Regulatory Asset Recovery Charge. A decision in the electric distribution rate case is expected by the end of 2012.
Infrastructure Investment Program
In July 2009, the NJBPU approved certain rate recovery mechanisms in connection with ACE’s Infrastructure Investment Program (the IIP). In exchange for the increase in infrastructure investment, the NJBPU, through the IIP, allowed recovery of ACE’s infrastructure investment capital expenditures through a special rate outside the normal rate recovery mechanism of a base rate filing. The IIP was designed to stimulate the New Jersey economy and provide incremental employment in ACE’s service territory by increasing the infrastructure expenditures to a level above otherwise normal budgeted levels. In an October 18, 2011 petition (subsequently amended December 16, 2011) with the NJBPU, ACE requested an extension and expansion to the IIP under which ACE proposes to spend approximately $63 million, $94 million and $81 million in calendar years 2012, 2013 and 2014, respectively, on non-revenue reliability-related capital expenditures. As proposed, capital expenditures related to the proposed special rate would be subject to annual reconciliation and approval by the NJBPU. A decision by the NJBPU on ACE’s IIP filing is expected by the end of the third quarter 2012.
Storm Damage Restoration Costs Recovery
In August 2011, ACE filed a petition with the NJBPU seeking authorization for deferred accounting treatment of uninsured incremental storm damage restoration costs not otherwise recovered through base rates. In that petition, ACE sought deferred accounting treatment for recovery of storm costs of approximately $8 million incurred during Hurricane Irene, which impacted ACE’s service territory in the third quarter of 2011.
(8) LEASING ACTIVITIES
Investment in Finance Leases Held in Trust
As of December 31, 20102011 and 2009,2010, Pepco Holdings had cross-border energy lease investments of $1.3 billion and $1.4 billion, respectively, consisting of hydroelectric generation and coal-fired electric generation facilities and natural gas distribution networks located outside of the United States.
AsDuring 2011, PHI modified its tax cash flow assumptions under its cross-border energy lease investments for the periods 2011-2016, to reflect the anticipated timing of potential litigation with the IRS and to reflect the change in tax laws in the District of Columbia as further discussed in Note (2), “Significant Accounting Policies — Changes in Accounting Estimates,” and Note (17), “Commitments and Contingencies - PHI’s Cross-Border Energy Lease Investments,– District of Columbia Tax Legislation.” duringAccordingly, PHI recalculated the equity investment and recorded a $7 million pre-tax ($3 million after-tax) charge.
161
PEPCO HOLDINGS
During 2010 2009 and 2008,2009, PHI reassessed the sustainability of its tax position and revised its assumptions regarding the estimated timing of tax benefits generated from its cross-border energy lease investments. Based on these reassessments, PHI recorded a reduction in its cross-border energy lease investment revenue of $2 million $3 million and $124$3 million in 2010 and 2009, respectively. For additional discussion, see Note (17), “Commitments and 2008, respectively.Contingencies—PHI’s Cross-Border Energy Lease Investments.”
During 2011, PHI entered into early termination agreements with two lessees involving all of the leases comprising one of the eight lease investments and a small portion of the leases comprising a second lease investment. The early terminations of the leases were negotiated at the request of the lessees. PHI received net cash proceeds of $161 million (net of a termination payment of $423 million used to retire the non-recourse debt associated with the terminated leases) and recorded a pre-tax gain of $39 million, representing the excess of the net cash proceeds over the carrying value of the lease investments.
With respect to the terminated leases, PHI had previously made certain business assumptions regarding foreign investment opportunities available at the end of the full lease terms. Because the leases were terminated prior to the end of the stated term, management decided not to pursue these opportunities and $22 million in certain Federal income tax benefits recognized previously were reversed. The after-tax gain on the lease terminations was $3 million, reflecting an income tax provision at the statutory federal rate of $14 million and the income tax benefit reversal. PHI has no intent to terminate early any other leases in the lease portfolio. With respect to certain of these remaining leases, management’s assumption continues to be that the foreign earnings recognized at the end of the lease term will remain invested abroad.
The components of the cross-border energy lease investments, as of December 31, are summarized below:
| 2010 | 2009 | 2011 | 2010 | |||||||||||||
| (millions of dollars) | (millions of dollars) | |||||||||||||||
Scheduled lease payments to PHI, net of non-recourse debt | $ | 2,265 | $ | 2,281 | $ | 2,120 | $ | 2,265 | ||||||||
Less: Unearned and deferred income | (842 | ) | (895 | ) | (771 | ) | (842 | ) | ||||||||
|
| |||||||||||||||
Investment in finance leases held in trust | 1,423 | 1,386 | 1,349 | 1,423 | ||||||||||||
Less: Deferred income tax liabilities | (816 | ) | (748 | ) | (793 | ) | (816 | ) | ||||||||
|
| |||||||||||||||
Net investment in finance leases held in trust | $ | 607 | $ | 638 | $ | 556 | $ | 607 | ||||||||
|
| |||||||||||||||
Income recognized from cross-border energy lease investments, wasexcluding the gain on the terminated leases discussed above, is comprised of the following for the years ended December 31:
| 2010 | 2009 | 2008 | ||||||||||
| (millions of dollars) | ||||||||||||
Pre-tax income from PHI’s cross-border energy lease investments (included in Other Revenue) | $ | 55 | $ | 54 | $ | 75 | ||||||
Non-cash charge to reduce equity value of PHI’s cross-border energy lease investments | (2 | ) | (3 | ) | (124 | ) | ||||||
Pre-tax income (loss) from PHI’s cross-border energy lease investments after adjustment | 53 | 51 | (49 | ) | ||||||||
Income tax expense (benefit) | 14 | 16 | (12 | ) | ||||||||
Net income (loss) from PHI’s cross-border energy lease investments | $ | 39 | $ | 35 | $ | (37 | ) | |||||
| 2011 | 2010 | 2009 | ||||||||||
| (millions of dollars) | ||||||||||||
Pre-tax income from PHI’s cross-border energy lease investments (included in Other Revenue) | $ | 55 | $ | 55 | $ | 54 | ||||||
Non-cash charge to reduce equity value of PHI’s cross-border energy lease investments | (7 | ) | (2 | ) | (3 | ) | ||||||
|
|
|
|
|
| |||||||
Pre-tax income from PHI’s cross-border energy lease investments after adjustment | 48 | 53 | 51 | |||||||||
Income tax expense | 10 | 14 | 16 | |||||||||
|
|
|
|
|
| |||||||
Net income from PHI’s cross-border energy lease investments | $ | 38 | $ | 39 | $ | 35 | ||||||
|
|
|
|
|
| |||||||
162
PEPCO HOLDINGS
Scheduled lease payments from the cross-border energy lease investments are net of non-recourse debt. Minimum lease payments receivable from the cross-border energy lease investments are zero for each of the years 2011year 2012 through 2015 are zero,2016, and $1,423$1,349 million thereafter.
To ensure credit quality, PHI regularly monitors the financial performance and condition of the lessees under its cross-border energy lease investments. Changes in credit quality are also assessed to determine if they should be reflected in the carrying value of the leases. PHI reviews each lessee’s performance versus annual compliance requirements set by the terms and conditions of the leases. This includes a comparison
PEPCO HOLDINGS
of published credit ratings to minimum credit rating requirements in the leases for lessees with public credit ratings. In addition, PHI routinely meets with senior executives of the lessees to discuss thetheir company and asset performance. If the annual compliance requirements or minimum credit ratings are not met, remedies are available under the leases. At December 31, 2010,2011, all lessees were in compliance with the terms and conditions of their lease agreements.
The table below shows PHI’s net investment in these leases by the published credit ratings of the lessees as of December 31:
Lessee Rating (a) | 2010 | 2011 | 2010 | |||||||||
| (millions of dollars) | (millions of dollars) | |||||||||||
Rated Entities | ||||||||||||
AA/Aa and above | $ | 709 | $ | 737 | $ | 709 | ||||||
A | 549 | 612 | 549 | |||||||||
|
| |||||||||||
Total | 1,258 | 1,349 | 1,258 | |||||||||
Non Rated Entities | 165 | — | 165 | |||||||||
|
| |||||||||||
Total | $ | 1,423 | $ | 1,349 | $ | 1,423 | ||||||
|
| |||||||||||
| (a) | Excludes the credit ratings of collateral posted by the lessees in these transactions. |
Lease Commitments
Pepco leases its consolidated control center, which is an integrated energy management center used by Pepco to centrally control the operation of its transmission and distribution systems. This lease is accounted for as a capital lease and was initially recorded at the present value of future lease payments, which totaled $152 million. The lease requires semi-annual payments of approximately $8 million over a 25-year period that began in December 1994, and provides for transfer of ownership of the system to Pepco for $1 at the end of the lease term. Under FASB guidance on regulated operations, the amortization of leased assets is modified so that the total interest expense charged on the obligation and amortization expense of the leased asset is equal to the rental expense allowed for rate-making purposes. The amortization expense is included within Depreciation and amortization in the consolidated statements of income. This lease is treated as an operating lease for rate-making purposes.
163
PEPCO HOLDINGS
Capital lease assets recorded within Property, Plant and Equipment at December 31, 20102011 and 2009,2010, in millions of dollars, are comprised of the following:
At December 31, 2010 | Original Cost | Accumulated Amortization | Net Book Value | |||||||||
Transmission | $ | 76 | $ | 29 | $ | 47 | ||||||
Distribution | 76 | 29 | 47 | |||||||||
General | 3 | 3 | — | |||||||||
Total | $ | 155 | $ | 61 | $ | 94 | ||||||
At December 31, 2009 | ||||||||||||
Transmission | $ | 76 | $ | 27 | $ | 49 | ||||||
Distribution | 76 | 26 | 50 | |||||||||
General | 3 | 3 | — | |||||||||
Total | $ | 155 | $ | 56 | $ | 99 | ||||||
PEPCO HOLDINGS
| Original Cost | Accumulated Amortization | Net Book Value | ||||||||||
At December 31, 2011 | ||||||||||||
Transmission | $ | 76 | $ | 33 | $ | 43 | ||||||
Distribution | 76 | 33 | 43 | |||||||||
General | 3 | 3 | — | |||||||||
|
|
|
|
|
| |||||||
Total | $ | 155 | $ | 69 | $ | 86 | ||||||
|
|
|
|
|
| |||||||
At December 31, 2010 | ||||||||||||
Transmission | $ | 76 | $ | 29 | $ | 47 | ||||||
Distribution | 76 | 29 | 47 | |||||||||
General | 3 | 3 | — | |||||||||
|
|
|
|
|
| |||||||
Total | $ | 155 | $ | 61 | $ | 94 | ||||||
|
|
|
|
|
| |||||||
The approximate annual commitments under all capital leases are $15 million for each year 20112012 through 2015,2016, and $61$46 million thereafter.
Rental expense for operating leases was $45$46 million, $45 million, and $47$45 million for the years ended December 31, 2011, 2010, 2009, and 2008,2009, respectively.
Total future minimum operating lease payments for Pepco Holdings as of December 31, 2010,2011, are $34 million in 2011, $33$39 million in 2012, $31$36 million in 2013, $35 million in 2014, $32 million in 2015, $29 million in 2014, $29 million in 20152016 and $377$359 million thereafter.
(9) PROPERTY, PLANT AND EQUIPMENT
Property, plant and equipment is comprised of the following:
At December 31, 2010 | Original Cost | Accumulated Depreciation | Net Book Value | |||||||||||||||||||||
| (millions of dollars) | Original Cost | Accumulated Depreciation | Net Book Value | |||||||||||||||||||||
| (millions of dollars) | ||||||||||||||||||||||||
At December 31, 2011 | ||||||||||||||||||||||||
Generation | $ | 105 | $ | 72 | $ | 33 | $ | 108 | $ | 82 | $ | 26 | ||||||||||||
Distribution | 7,567 | 2,749 | 4,818 | 7,832 | 2,848 | 4,984 | ||||||||||||||||||
Transmission | 2,307 | 793 | 1,514 | 2,462 | 834 | 1,628 | ||||||||||||||||||
Gas | 413 | 125 | 288 | 429 | 133 | 296 | ||||||||||||||||||
Construction work in progress | 553 | — | 553 | 742 | — | 742 | ||||||||||||||||||
Non-operating and other property | 1,175 | 708 | 467 | 1,282 | 738 | 544 | ||||||||||||||||||
|
|
| ||||||||||||||||||||||
Total | $ | 12,120 | $ | 4,447 | $ | 7,673 | $ | 12,855 | $ | 4,635 | $ | 8,220 | ||||||||||||
|
|
| ||||||||||||||||||||||
At December 31, 2009 | ||||||||||||||||||||||||
At December 31, 2010 | ||||||||||||||||||||||||
Generation | $ | 96 | $ | 56 | $ | 40 | $ | 105 | $ | 72 | $ | 33 | ||||||||||||
Distribution | 7,229 | 2,639 | 4,590 | 7,567 | 2,749 | 4,818 | ||||||||||||||||||
Transmission | 2,193 | 751 | 1,442 | 2,307 | 793 | 1,514 | ||||||||||||||||||
Gas | 398 | 116 | 282 | 413 | 125 | 288 | ||||||||||||||||||
Construction work in progress | 415 | — | 415 | 553 | — | 553 | ||||||||||||||||||
Non-operating and other property | 1,100 | 628 | 472 | 1,175 | 708 | 467 | ||||||||||||||||||
|
|
| ||||||||||||||||||||||
Total | $ | 11,431 | $ | 4,190 | $ | 7,241 | $ | 12,120 | $ | 4,447 | $ | 7,673 | ||||||||||||
|
|
| ||||||||||||||||||||||
164
PEPCO HOLDINGS
The non-operating and other property amounts include balances for general plant, intangible plant, distribution plant and transmission plant held for future use as well as other property held by non-utility subsidiaries. Utility plant is generally subject to a first mortgage lien.
Pepco Holdings’ utility subsidiaries use separate depreciation rates for each electric plant account. The rates vary from jurisdiction to jurisdiction.
Asset Sales
In January 2008, DPL completed (i) the sale of its retail electric distribution assets located on the Eastern Shore of Virginia for approximately $49 million, and (ii) the sale of its wholesale electric transmission assets located on the Eastern Shore of Virginia for approximately $5 million.
Jointly Owned Plant
PHI’s consolidated balance sheets include its proportionate share of assets and liabilities related to jointly owned plant. At December 31, 20102011 and 2009,2010, PHI’s subsidiaries had a $14 million net book value ownership interest of $13 million and $14 million, respectively, in transmission and other facilities in which various parties also have ownership interests. PHI’s share of the operating and maintenance expenses of the jointly-owned plant is included in the corresponding expenses in the consolidated statements of income. PHI is responsible for providing its share of the financing for the above jointly-owned facilities.
PEPCO HOLDINGS
Deactivation of Pepco Energy Services’ Generating Facilities
Pepco Energy Services owns and operates two oil-fired generating facilities. The facilities are located in Washington, D.C. and have a generating capacity of approximately 790 megawatts. Pepco Energy Services sells the output of these facilities into the wholesale market administered by the PJM Interconnection, LLC (PJM).PJM. In February 2007, Pepco Energy Services provided notice to PJM of its intention to deactivate these facilities. Pepco Energy Services currently plans to deactivate both facilities by the end of May 2012. PJM has informed Pepco Energy Services that these facilities arewill not expected to be needed for reliability after that time, but that its evaluation is dependent onMay 2012; therefore, decommissioning plans are currently underway and on-schedule. During the completion of transmissionyears ended December 31, 2011 and distribution upgrades. Pepco Energy Services’ timing for deactivation of the facilities, in whole or in part, may be accelerated or delayed based on the operating condition of the facilities, economic conditions, and reliability considerations.2010, PHI has recorded decommissioning costs of $2 million and $4 million, respectively, related to these generating facilities in 2010.facilities.
(10) PENSION AND OTHER POSTRETIREMENT BENEFITS
Pension Benefits and Other Postretirement Benefits
Pepco Holdings sponsors the PHI Retirement Plan, which covers substantially all employees of Pepco, DPL, ACE and certain employees of other Pepco Holdings’ subsidiaries. Pepco Holdings also provides supplemental retirement benefits to certain eligible executive and key employees through nonqualified retirement plans.
Pepco Holdings provides certain postretirement health care and life insurance benefits for eligible retired employees. Most employees hired on January 1, 2005 or later will not have company subsidized retiree medical coverage; however, they will be able to purchase coverage at full cost through PHI.
Net periodic benefit cost is included in other operation and maintenance expense, net of the portion of the net periodic benefit cost that is capitalized as part of the cost of labor for internal construction projects. After intercompany allocations, the three utility subsidiaries are responsible for substantially all of the total PHI net periodic benefit cost.
Pepco Holdings accounts for the PHI Retirement Plan, nonqualified retirement plans, and its postretirement health care and life insurance benefits for eligible employees in accordance with FASB guidance on retirement benefits. PHI’s financial statement disclosures are also prepared in accordance with FASB guidance on retirement benefits.
165
PEPCO HOLDINGS
All amounts in the following tables are in millions of dollars:
| Pension Benefits | Other Postretirement Benefits | |||||||||||||||||||||||||||||||
At December 31, | Pension Benefits | Other Postretirement Benefits | 2011 | 2010 | 2011 | 2010 | ||||||||||||||||||||||||||
| 2010 | 2009 | 2010 | 2009 | (millions of dollars) | ||||||||||||||||||||||||||||
Change in Benefit Obligation | ||||||||||||||||||||||||||||||||
Benefit obligation at beginning of year | $ | 1,796 | $ | 1,753 | $ | 651 | $ | 653 | ||||||||||||||||||||||||
Projected benefit obligation at beginning of year | $ | 1,970 | $ | 1,796 | $ | 704 | $ | 651 | ||||||||||||||||||||||||
Service cost | 35 | 36 | 5 | 7 | 35 | 35 | 5 | 5 | ||||||||||||||||||||||||
Interest cost | 110 | 111 | 39 | 40 | 107 | 110 | 37 | 39 | ||||||||||||||||||||||||
Amendments | (7 | ) | 1 | — | — | 18 | (7 | ) | 7 | — | ||||||||||||||||||||||
Actuarial loss (gain) | 179 | 72 | 42 | (10 | ) | |||||||||||||||||||||||||||
Actuarial loss | 176 | 179 | 36 | 42 | ||||||||||||||||||||||||||||
Benefits paid (a) | (146 | ) | (177 | ) | (39 | ) | (39 | ) | (182 | ) | (146 | ) | (40 | ) | (39 | ) | ||||||||||||||||
Termination benefits | 3 | — | 6 | — | — | 3 | 1 | 6 | ||||||||||||||||||||||||
|
|
|
| |||||||||||||||||||||||||||||
Benefit obligation at end of year | $ | 1,970 | $ | 1,796 | $ | 704 | $ | 651 | ||||||||||||||||||||||||
Projected benefit obligation at end of year | $ | 2,124 | $ | 1,970 | $ | 750 | $ | 704 | ||||||||||||||||||||||||
|
|
|
| |||||||||||||||||||||||||||||
Change in Plan Assets | ||||||||||||||||||||||||||||||||
Fair value of plan assets at beginning of year | $ | 1,500 | $ | 1,123 | $ | 242 | $ | 192 | $ | 1,632 | $ | 1,500 | $ | 275 | $ | 242 | ||||||||||||||||
Actual return on plan assets | 173 | 248 | 26 | 40 | 127 | 173 | — | 26 | ||||||||||||||||||||||||
Company contributions | 105 | 306 | 46 | 49 | 117 | 105 | 46 | 46 | ||||||||||||||||||||||||
Benefits paid (a) | (146 | ) | (177 | ) | (39 | ) | (39 | ) | (182 | ) | (146 | ) | (40 | ) | (39 | ) | ||||||||||||||||
|
|
|
| |||||||||||||||||||||||||||||
Fair value of plan assets at end of year | $ | 1,632 | $ | 1,500 | $ | 275 | $ | 242 | $ | 1,694 | $ | 1,632 | $ | 281 | $ | 275 | ||||||||||||||||
|
|
|
| |||||||||||||||||||||||||||||
Funded Status at end of year (plan assets less plan obligations) | $ | (338 | ) | $ | (296 | ) | $ | (429 | ) | $ | (409 | ) | $ | (430 | ) | $ | (338 | ) | $ | (469 | ) | $ | (429 | ) | ||||||||
| (a) | Other Postretirement Benefits paid is net of Medicare Part D subsidy receipts of |
At December 31, 2010,2011, PHI Retirement Plan assets were $1.7 billion and the accumulated benefit obligation was approximately $2.0 billion. At December 31, 2010, PHI’s Retirement Plan assets were approximately $1.6 billion and the accumulated benefit obligation (ABO) was approximately $1.9 billion. At December 31, 2009, PHI’s Retirement Plan assets were approximately $1.5 billion and the ABO was approximately $1.6 billion.
The following table provides the amounts recognized in PHI’s consolidated balance sheets as of December 31, in millions of dollars:2011 and 2010:
| Pension Benefits | Other Postretirement Benefits | |||||||||||||||||||||||||||||||
| Pension Benefits | Other Postretirement Benefits | 2011 | 2010 | 2011 | 2010 | |||||||||||||||||||||||||||
| 2010 | 2009 | 2010 | 2009 | (millions of dollars) | ||||||||||||||||||||||||||||
Regulatory asset | $ | 655 | $ | 583 | $ | 193 | $ | 169 | $ | 794 | $ | 655 | $ | 243 | $ | 193 | ||||||||||||||||
Current liabilities | (6 | ) | (6 | ) | — | — | (6 | ) | (6 | ) | — | — | ||||||||||||||||||||
Pension benefit obligation | (332 | ) | (290 | ) | — | — | (424 | ) | (332 | ) | — | — | ||||||||||||||||||||
Other postretirement benefit obligations | — | — | (429 | ) | (409 | ) | — | — | (469 | ) | (429 | ) | ||||||||||||||||||||
Deferred income taxes, net | 12 | 11 | — | — | 15 | 12 | — | — | ||||||||||||||||||||||||
Accumulated other comprehensive loss, net of tax | 17 | 17 | — | — | 24 | 17 | — | — | ||||||||||||||||||||||||
|
|
|
| |||||||||||||||||||||||||||||
Net amount recognized | $ | 346 | $ | 315 | $ | (236 | ) | $ | (240 | ) | $ | 403 | $ | 346 | $ | (226 | ) | $ | (236 | ) | ||||||||||||
|
|
|
| |||||||||||||||||||||||||||||
166
PEPCO HOLDINGS
Amounts included in AOCL (pre-tax) and regulatory assets at December 31, in millions of dollars,2011 and 2010 consist of:
| Pension Benefits | Other Postretirement Benefits | |||||||||||||||||||||||||||||||
| Pension Benefits | Other Postretirement Benefits | 2011 | 2010 | 2011 | 2010 | |||||||||||||||||||||||||||
| 2010 | 2009 | 2010 | 2009 | (millions of dollars) | ||||||||||||||||||||||||||||
Unrecognized net actuarial loss | $ | 692 | $ | 611 | $ | 208 | $ | 188 | $ | 822 | $ | 692 | $ | 247 | $ | 208 | ||||||||||||||||
Unamortized prior service cost (credit) | (8 | ) | — | (17 | ) | (21 | ) | 11 | (8 | ) | (5 | ) | (17 | ) | ||||||||||||||||||
Unamortized transition liability | — | — | 2 | 2 | — | — | 1 | 2 | ||||||||||||||||||||||||
|
|
|
| |||||||||||||||||||||||||||||
Total | $ | 684 | $ | 611 | $ | 193 | $ | 169 | $ | 833 | $ | 684 | $ | 243 | $ | 193 | ||||||||||||||||
|
|
|
| |||||||||||||||||||||||||||||
Accumulated other comprehensive loss ($17 million, net of tax, at December 31, 2010 and 2009) | $ | 29 | $ | 28 | $ | — | $ | — | ||||||||||||||||||||||||
Accumulated other comprehensive loss ($24 million and $17 million, net of tax, at December 31, 2011 and 2010, respectively) | $ | 39 | $ | 29 | $ | — | $ | — | ||||||||||||||||||||||||
Regulatory assets | 655 | 583 | 193 | 169 | 794 | 655 | 243 | 193 | ||||||||||||||||||||||||
|
|
|
| |||||||||||||||||||||||||||||
Total | $ | 684 | $ | 611 | $ | 193 | $ | 169 | $ | 833 | $ | 684 | $ | 243 | $ | 193 | ||||||||||||||||
|
|
|
| |||||||||||||||||||||||||||||
The estimated net actuarial loss and prior service cost for the defined benefit pension plans that will be amortized from AOCL into net periodic benefit cost over the next reporting year are $48$55 million and $1 million, respectively. The estimated net loss and prior service credit for the other postretirement benefitOPEB plan that will be amortized from AOCL into net periodic benefit cost over the next reporting year are $12$18 million and $4$5 million, respectively.
The table below provides the components of net periodic benefit costs recognized for the years ended December 31, in millions of dollars:2011, 2010 and 2009:
| Pension Benefits | Other Postretirement Benefits | |||||||||||||||||||||||||||||||||||||||||||||||
| Pension Benefits | Other Postretirement Benefits | 2011 | 2010 | 2009 | 2011 | 2010 | 2009 | |||||||||||||||||||||||||||||||||||||||||
| 2010 | 2009 | 2008 | 2010 | 2009 | 2008 | (millions of dollars) | ||||||||||||||||||||||||||||||||||||||||||
Service cost | $ | 35 | $ | 36 | $ | 36 | $ | 5 | $ | 7 | $ | 7 | $ | 35 | $ | 35 | $ | 36 | $ | 5 | $ | 5 | $ | 7 | ||||||||||||||||||||||||
Interest cost | 110 | 111 | 108 | 39 | 40 | 40 | 107 | 110 | 111 | 37 | 39 | 40 | ||||||||||||||||||||||||||||||||||||
Expected return on plan assets | (117 | ) | (101 | ) | (130 | ) | (16 | ) | (13 | ) | (16 | ) | (128 | ) | (117 | ) | (101 | ) | (19 | ) | (16 | ) | (13 | ) | ||||||||||||||||||||||||
Amortization of prior service cost | — | — | — | (5 | ) | (4 | ) | (4 | ) | — | — | — | (5 | ) | (5 | ) | (4 | ) | ||||||||||||||||||||||||||||||
Amortization of net actuarial loss | 42 | 56 | 10 | 13 | 16 | 13 | 47 | 42 | 56 | 14 | 13 | 16 | ||||||||||||||||||||||||||||||||||||
Recognition of benefit contract | — | 1 | — | — | — | — | — | — | 1 | — | — | — | ||||||||||||||||||||||||||||||||||||
Plan amendments | 1 | — | — | — | — | — | — | 1 | — | — | — | — | ||||||||||||||||||||||||||||||||||||
Termination benefits | 3 | — | — | 6 | — | — | — | 3 | — | 1 | 6 | — | ||||||||||||||||||||||||||||||||||||
|
|
|
|
|
| |||||||||||||||||||||||||||||||||||||||||||
Net periodic benefit cost | $ | 74 | $ | 103 | $ | 24 | $ | 42 | $ | 46 | $ | 40 | $ | 61 | $ | 74 | $ | 103 | $ | 33 | $ | 42 | $ | 46 | ||||||||||||||||||||||||
|
|
|
|
|
| |||||||||||||||||||||||||||||||||||||||||||
The table below provides the split of the combined pension and other postretirement net periodic benefit costs among subsidiaries for the years ended December 31, in million of dollars:2011, 2010 and 2009:
| 2011 | 2010 | 2009 | ||||||||||||||||||||||
| 2010 | 2009 | 2008 | (millions of dollars) | |||||||||||||||||||||
Pepco | $ | 40 | $ | 38 | $ | 24 | $ | 43 | $ | 40 | $ | 38 | ||||||||||||
DPL | 28 | 25 | 3 | 23 | 28 | 25 | ||||||||||||||||||
ACE | 23 | 20 | 12 | 21 | 23 | 20 | ||||||||||||||||||
Other subsidiaries | 25 | 66 | 25 | 7 | 25 | 66 | ||||||||||||||||||
|
|
| ||||||||||||||||||||||
Total | $ | 116 | $ | 149 | $ | 64 | $ | 94 | $ | 116 | $ | 149 | ||||||||||||
|
|
| ||||||||||||||||||||||
167
PEPCO HOLDINGS
The following weighted average assumptions were used to determine the benefit obligations at December 31:
| Pension Benefits | Other Postretirement Benefits | Pension Benefits | Other Postretirement Benefits | |||||||||||||||||||||||||||||
| 2010 | 2009 | 2010 | 2009 | 2011 | 2010 | 2011 | 2010 | |||||||||||||||||||||||||
Discount rate | 5.65 | % | 6.40 | % | 5.60 | % | 6.30 | % | 5.00 | % | 5.65 | % | 4.90 | % | 5.60 | % | ||||||||||||||||
Rate of compensation increase | 5.00 | % | 5.00 | % | 5.00 | % | 5.00 | % | 5.00 | % | 5.00 | % | 5.00 | % | 5.00 | % | ||||||||||||||||
Health care cost trend rate assumed for current year | — | — | 7.50 | % | 8.00 | % | — | — | 8.00 | % | 7.50 | % | ||||||||||||||||||||
Rate to which the cost trend rate is assumed to decline | — | — | 5.00 | % | 5.00 | % | — | — | 5.00 | % | 5.00 | % | ||||||||||||||||||||
Year that the cost trend rate reaches the ultimate trend rate | — | — | 2015 | 2015 | — | — | 2017 | 2015 | ||||||||||||||||||||||||
Assumed health care cost trend rates may have a significant effect on the amounts reported for the health care plans. A one-percentage-point change in assumed health care cost trend rates would have the following effects, in millions of dollars:
| 1-Percentage- Point Increase | 1-Percentage- Point Decrease | 1-Percentage- Point Increase | 1-Percentage- Point Decrease | |||||||||||||
Increase (decrease) in total service and interest cost | $ | 2 | $ | (2) | $ | 2 | $ | (1 | ) | |||||||
Increase (decrease) in postretirement benefit obligation | $ | 32 | $ | (28) | $ | 32 | $ | (28 | ) | |||||||
The following weighted average assumptions were used to determine the net periodic benefit cost for the years ended December 31:
| Pension Benefits | Other Postretirement Benefits | Pension Benefits | Other Postretirement Benefits | |||||||||||||||||||||||||||||||||||||||||||||
| 2010 | 2009 | 2008 | 2010 | 2009 | 2008 | 2011 | 2010 | 2009 | 2011 | 2010 | 2009 | |||||||||||||||||||||||||||||||||||||
Discount rate | 6.40 | % | 6.50 | % | 6.25 | % | 6.30 | % | 6.50 | % | 6.25 | % | 5.65 | % | 6.40 | % | 6.50 | % | 5.60 | % | 6.30 | % | 6.50 | % | ||||||||||||||||||||||||
Expected long-term return on plan assets | 8.00 | % | 8.25 | % | 8.25 | % | 8.00 | % | 8.25 | % | 8.25 | % | 7.75 | % | 8.00 | % | 8.25 | % | 7.75 | % | 8.00 | % | 8.25 | % | ||||||||||||||||||||||||
Rate of compensation increase | 5.00 | % | 5.00 | % | 5.00 | % | 5.00 | % | 5.00 | % | 5.00 | % | 5.00 | % | 5.00 | % | 5.00 | % | 5.00 | % | 5.00 | % | 5.00 | % | ||||||||||||||||||||||||
PHI utilizes an analytical tool developed by its actuaries to select the discount rate. The analytical tool utilizes a high-quality bond portfolio with cash flows that match the benefit payments expected to be made under the plans.
In selecting anThe expected long-term rate of return on plan assets was 7.75% and 8.00% as of December 31, 2011 and 2010, respectively. PHI uses a building block approach to estimate the expected rate of return on plan assets. Under this approach, the percentage of plan assets PHI considers actual historical returns, economic forecasts and the judgment of its investment consultants on expected long-term performance for the types of investments held by the plan. The estimatedin each asset class returns are weighted byaccording to PHI’s target asset allocation.allocation, at the beginning of the year, is applied to the expected asset return for the related asset class. PHI incorporates long-term assumptions for real returns, inflation expectations, volatility, and correlations among asset classes to determine expected returns for a given asset allocation The plan assets consist of equity, fixed income, real estate and private equity investments, and when viewed over a long-term horizon, are expected to yield a return on assets of 8.00%7.75% at December 31, 2010.2011. PHI periodically reviews its asset mix and rebalances assets back to the target allocation.
In 2008, PHI and its actuaries conducted an experience study, a periodic analysis of plan experience against actuarial assumptions. The study reviewed withdrawal, retirement and salary increase assumptions. As a result of the study, assumed retirement rates were changed and the age-related salary scale assumption was increased from 4.50% to 5.00% over an average employee’s career. No changes were made for the 2010 and 2009 valuations.
168
PEPCO HOLDINGS
In addition, for the 20082011 Other Postretirement Benefit Plan valuation, the medicalhealth care cost trend rate was changed to 8.5%,8.0% from 2011 to 2012, declining 0.5% per year to 5.00% in 2015a rate of 5.0% for 2017 to 2018 and beyond, from the 2007beyond. The 2010 valuation assumption for 2008 of 7%,was 7.0% from 2011 to 2012, declining 1%0.5% per year to 5% in 2010a rate of 5.0% for 2015 to 2016 and beyond. No changes were made for the 2010 and 2009 valuations.
Benefit Plan Modifications
In the third quarter of 2011, PHI’s Board of Directors approved revisions to certain of PHI’s existing benefit programs, including the PHI Retirement Plan. The changes to the PHI Retirement Plan were effected by PHI in order to establish a more unified approach to PHI’s retirement programs and to further align the benefits offered under PHI’s retirement programs. The changes to the PHI Retirement Plan were effective on or after July 1, 2011 and affect the retirement benefits payable to approximately 750 of PHI’s employees. All full time employees of PHI and certain subsidiaries are eligible to participate in the PHI Retirement Plan. Retirement benefits for all other employees remain unchanged.
In the third quarter of 2011, PHI’s Board also approved a new, non-qualified Supplemental Executive Retirement Plan (SERP) which replaced PHI’s two pre-existing supplemental retirement plans, effective August 1, 2011. As of the effective date of the new SERP, the Conectiv SERP and the PHI Combined SERP were closed to new participants. The establishment of the new SERP is consistent with PHI’s efforts to align retirement benefits for PHI and its subsidiaries with current market practices and to provide similarly situated participants with retirement benefits that are the same or similar in value as compared to the benefits provided under the prior SERPs.
In the fourth quarter of 2011, PHI approved an increase in the medical benefit limits for certain employees in its postretirement health care benefit plan to align the limits with those provided to other employees. The amendment affects approximately 1,400 employees, of which 400 are retirees and 1,000 are active union employees. The effective date of the plan modification is January 1, 2012.
The additional liabilities and expenses for the benefit plan modifications described above did not have a material impact on PHI’s overall consolidated financial condition, results of operations, or cash flows.
Plan Assets
Investment Policies and Strategies
The goal of PHI’s investment policy is to preserve capital and maximize investment earnings in excess of inflation within acceptable levels of volatility to meet the actuarial projected liabilities of the benefit plans. To accomplish this goal, PHI actively manages its plan assets with the objective of optimizing long-term returns while maintaining a high standard of portfolio quality and proper diversification.
In developing its allocation policy for the assets in the PHI Retirement Plan and the other postretirement benefit plan, PHI examined projections of asset returns and volatility over a long-term horizon. In connection with this analysis, PHI evaluated the risk and return tradeoffs of alternative asset classes and asset mixes given long-term historical relationships as well as prospective capital market returns. PHI also conducted an asset liabilityasset-liability study to match projected asset growth with projected liability growth to determine whether there is sufficient liquidity for projected benefit payments. PHI developed its asset mix guidelines by incorporating the results of these analyses with an assessment of its risk posture, and taking into account industry practices. PHI periodically evaluates its investment strategy to ensure that plan assets are sufficient to meet the benefit obligations of the plans. As part of the ongoing evaluation, PHI may make changes to its targeted asset allocations and investment strategy.
UnderPHI’s pension investment strategy is designed to meet the following investment objectives:
Generate investment returns that, in combination with funding contributions from PHI, provide adequate funding to meet all current and future benefit obligations of the plan.
Provide investment results that meet or exceed the assumed long-term rate of return, while maintaining the funded status of the plan at acceptable levels.
169
PEPCO HOLDINGS
Improve funded status over time.
Decrease contribution and expense volatility as funded status improves.
To achieve these guidelines,investment objectives, PHI’s investment strategy divides the pension program into two primary portfolios:
Return-Seeking Assets – These assets are intended to provide investment returns in excess of pension liability growth and reduce existing deficits in the funded status of the plan. The category includes a diversified mix of U.S. large and small cap equities, non-U.S. developed and emerging market equities, real estate, and private equity.
Liability-Hedging Assets – These assets are intended to reflect the sensitivity of the plan’s liabilities to changes in discount rates. This category includes a diversified mix of long duration, primarily investment grade credit and U.S. treasury securities.
In the first quarter of 2011, PHI diversifies assets in order to protect against largemodified its pension investment lossespolicy and strategy to reduce the probabilityeffects of excessivefuture volatility while earningof the fair value of its pension assets relative to its pension liabilities. The new asset-liability management strategy was implemented during the second quarter of 2011. Under the new asset-liability management strategy, the plan’s allocation to fixed income investments, primarily high quality, longer-maturity fixed income securities was increased, with a reduction in the allocation to equity investments. As a result of this modification, during the second quarter of 2011, PHI allocated approximately 54% of its pension plan assets to longer-maturity fixed income investments, 38% to public equity investments and 8% to alternative investments (real estate, private equity). At December 31, 2010, the PHI pension trust’s asset allocation included 40% in fixed income investments (intermediate maturity fixed income), 53% in public equity investments and 7% in alternative investments (real estate, private equity). PHI anticipates further increases in the allocation to fixed income investments, with a corresponding reduction in the allocation to equity and alternative investments as the funded status of its plan increases.
The change in overall investment strategy may result in a lower expected long-term rate of return that is commensurate with an acceptable risk level. Assets are diversified by allocatingassumption because of the shift in allocation from equities and alternative investments to various asset classes and investment styles within those asset classes and by retaining investment management firms with complementary investment styles and approaches.fixed income. PHI’s 2011 pension costs are based on a 7.75% expected long-term rate of return assumption.
Based on the assessment of employee demographics, actuarial funding, and PHI’s business and financial circumstances, PHI believes that its risk posture is slightly below average relative to other pension plans. On a periodic basis, PHI reviews its asset mix and rebalances assets back to the target allocation over a reasonable period of time.
170
PEPCO HOLDINGS
The PHI Retirement Plan asset allocations at December 31, 20102011 and 2009,2010, by asset category, were as follows:
| Plan Assets at December 31, | Target Plan Asset Allocation | Minimum Maximum | ||||||||||||||
| 2010 | 2009 | |||||||||||||||
Asset Category | ||||||||||||||||
Equity | 53 | % | 56 | % | 60 | % | 55% - 65% | |||||||||
Fixed Income | 40 | % | 37 | % | 30 | % | 30% - 50% | |||||||||
Other (real estate, private equity) | 7 | % | 7 | % | 10 | % | 0% - 10% | |||||||||
Total | 100 | % | 100 | % | 100 | % | ||||||||||
PEPCO HOLDINGS
| Plan Assets at December 31, | Target Plan Asset Allocation | |||||||||||||||
| 2011 | 2010 | 2011 | 2010 | |||||||||||||
Asset Category | ||||||||||||||||
Equity | 36 | % | 53 | % | 38 | % | 60 | % | ||||||||
Fixed Income | 56 | % | 40 | % | 54 | % | 30 | % | ||||||||
Other (real estate, private equity) | 8 | % | 7 | % | 8 | % | 10 | % | ||||||||
|
|
|
|
|
|
|
| |||||||||
Total | 100 | % | 100 | % | 100 | % | 100 | % | ||||||||
|
|
|
|
|
|
|
| |||||||||
PHI’s other postretirement benefit plan asset allocations at December 31, 20102011 and 2009,2010, by asset category, were as follows:
| Plan Assets at December 31, | Target Plan Asset Allocation | Minimum Maximum | Plan Assets at December 31, | Target Plan Asset Allocation | ||||||||||||||||||||||||||||
| 2010 | 2009 | 2011 | 2010 | 2011 | 2010 | |||||||||||||||||||||||||||
Asset Category | ||||||||||||||||||||||||||||||||
Equity | 61 | % | 60 | % | 60 | % | 55% - 65% | 62 | % | 61 | % | 60 | % | 60 | % | |||||||||||||||||
Fixed Income | 35 | % | 35 | % | 35 | % | 20% - 50% | 36 | % | 35 | % | 35 | % | 35 | % | |||||||||||||||||
Cash | 4 | % | 5 | % | 5 | % | 0% - 10% | 2 | % | 4 | % | 5 | % | 5 | % | |||||||||||||||||
|
|
|
| |||||||||||||||||||||||||||||
Total | 100 | % | 100 | % | 100 | % | 100 | % | 100 | % | 100 | % | 100 | % | ||||||||||||||||||
|
|
|
| |||||||||||||||||||||||||||||
PHI will rebalance the plan asset portfolios when the actual allocations fall outside the ranges outlined in the investment policy or as funded status improves over a reasonable period of time.
Risk Management and General Investment Manager Guidelines
PlanPension and other postretirement benefit plan assets may be invested in separately managed accounts in which there is ownership of individual securities, shares of commingled funds or mutual funds, or limited partnerships. Commingled funds and mutual funds are subject to detailed policy guidelines set forth in the fund’s prospectus or fund declaration, and limited partnerships are subject to the terms of the partnership agreement.
Separate account investment managers are responsible for achieving a level of diversification in their portfolio that is consistent with their investment approach and their role in PHI’s overall investment structure. Separate account investment managers must follow risk management guidelines established by PHI unless authorized in writing by PHI.
For equity managers, the maximum position in a single issuer’s securities should not exceed 5% of the portfolio’s cost or 8% of the portfolio’s market value. The holdings in any one industry should not exceed 25% of the portfolio’s market value, and the holdings in any one economic sector should not exceed 40% of the portfolio’s market value. International equity managers should not invest more than 25% of the portfolio’s market value in emerging markets and no more than 50% in any single country. Market and currency hedges are limited to defensive purposes.
For fixed income managers, the maximum position in a single issuer’s securities should not exceed 5% of the portfolio’s market value, with the exception of US Treasury or US Government agencies and instrumentalities. The investment manager is expected to maintain a weighted average bond portfolio quality rating of at least “A.” The manager may invest up to 20% of the portfolio’s market value in bonds rated below investment grade. A manager may invest in non-dollar securities up to 20% of the portfolio’s market value, and currency hedging is allowed if it is a normal approach to international fixed income management. No more than 30% of the portfolio’s market value can be invested in combined non-dollar and below investment grade securities.
Derivative instruments are permissible in an investment portfolio to the extent they comply with policy guidelines and are consistent with risk and return objectives. Under no circumstances may such instruments be used speculatively or to leverage the portfolio. Separately managed accounts are prohibited from holding securities issued by the following firms:
PHI common stock is not a permittedand its subsidiaries,
PHI’s pension plan asset.trustee, its parent or its affiliates,
PHI’s pension plan consultant, its parent or its affiliates, and
PHI’s pension plan investment manager, its parent or its affiliates
171
PEPCO HOLDINGS
Fair Value of Plan Assets
As defined in the FASB guidance on fair value measurement and disclosures (ASC 820), fair value is the price that would be received to sell an asset or paid to transfer a liability in an orderly transaction between market participants at the measurement date. The FASB’s fair value framework includes a hierarchy that prioritizes the inputs to valuation techniques used to measure fair value. The hierarchy gives the highest priority to unadjusted quoted prices in active markets for identical assets or liabilities (level 1) and the
PEPCO HOLDINGS
lowest priority to unobservable inputs (level 3). If the inputs used to measure the financial instruments fall within different levels of the hierarchy, the categorization is based on the lowest level input that is significant to the fair value measurement of the instrument. Investments are classified within the fair value hierarchy as follows:
Level 1: Investments are valued using quoted prices in active markets for identical investments.instruments.
Level 2: Investments are valued using other significant observable inputs (e.g., quoted prices for similar investments, interest rates, credit risks, etc).
Level 3: Investments are valued using significant unobservable inputs, including internal assumptions.
There were no significant transfers between level 1 and level 2 during the years ended December 31, 2011 and 2010.
The following tables present the fair values of PHI’s Retirement Planpension and other postretirement benefit plan assets by asset category within the fair value hierarchy levels, as of December 31, 20102011 and 2009:2010:
| Fair Value Measurements at December 31, 2010 | Fair Value Measurements at December 31, 2011 | |||||||||||||||||||||||||||||||
| (millions of dollars) | (millions of dollars) | |||||||||||||||||||||||||||||||
| Total | Quoted Prices in Active Markets for Identical Instruments (Level 1) | Significant Other Observable Inputs (Level 2) | Significant Unobservable Inputs (Level 3) | Total | Quoted Prices in Active Markets for Identical Instruments (Level 1) | Significant Other Observable Inputs (Level 2) | Significant Unobservable Inputs (Level 3) | |||||||||||||||||||||||||
Asset Category | ||||||||||||||||||||||||||||||||
Pension Plan Assets: | ||||||||||||||||||||||||||||||||
Equity | ||||||||||||||||||||||||||||||||
Domestic (a) | $ | 573 | $ | 334 | $ | 212 | $ | 27 | $ | 411 | $ | 165 | $ | 221 | $ | 25 | ||||||||||||||||
International (b) | 270 | 265 | 2 | 3 | 196 | 192 | 2 | 2 | ||||||||||||||||||||||||
Fixed Income (c) | 604 | 397 | 204 | 3 | 939 | — | 930 | 9 | ||||||||||||||||||||||||
Other | ||||||||||||||||||||||||||||||||
Private Equity | 62 | — | — | 62 | 64 | — | — | 64 | ||||||||||||||||||||||||
Real Estate | 55 | — | — | 55 | 65 | — | — | 65 | ||||||||||||||||||||||||
Cash Equivalents (d) | 68 | 68 | — | — | 19 | 19 | — | — | ||||||||||||||||||||||||
|
|
|
| |||||||||||||||||||||||||||||
Pension Plan Assets Subtotal | 1,632 | 1,064 | 418 | 150 | 1,694 | 376 | 1,153 | 165 | ||||||||||||||||||||||||
|
|
|
| |||||||||||||||||||||||||||||
Other Postretirement Plan Assets: | ||||||||||||||||||||||||||||||||
Equity (e) | 168 | 145 | 23 | — | 174 | 150 | 24 | — | ||||||||||||||||||||||||
Fixed Income (f) | 96 | 96 | — | — | 101 | 101 | — | — | ||||||||||||||||||||||||
Cash Equivalents | 11 | 11 | — | — | 6 | 6 | — | — | ||||||||||||||||||||||||
|
|
|
| |||||||||||||||||||||||||||||
Postretirement Plan Assets Subtotal | 275 | 252 | 23 | — | 281 | 257 | 24 | — | ||||||||||||||||||||||||
|
|
|
| |||||||||||||||||||||||||||||
Total Pension and Other Postretirement Plan Assets | $ | 1,907 | $ | 1,316 | $ | 441 | $ | 150 | $ | 1,975 | $ | 633 | $ | 1,177 | $ | 165 | ||||||||||||||||
|
|
|
| |||||||||||||||||||||||||||||
| Predominantly includes domestic common stock and commingled funds. |
| Predominantly includes foreign common and preferred stock and warrants. |
| Predominantly includes corporate bonds, government bonds, |
| Predominantly includes cash investment in short term investment funds. |
| (e) | Includes domestic and international commingled funds. |
| (f) | Includes fixed income commingled funds. |
172
PEPCO HOLDINGS
| Fair Value Measurements at December 31, 2009 | ||||||||||||||||
| (millions of dollars) | ||||||||||||||||
| Total | Quoted Prices in Active Markets for Identical Instruments (Level 1) | Significant Other Observable Inputs (Level 2) | Significant Unobservable Inputs (Level 3) | |||||||||||||
Asset Category | ||||||||||||||||
Pension Plan Assets: | ||||||||||||||||
Equity | ||||||||||||||||
Domestic (a) | $ | 627 | $ | 340 | $ | 287 | $ | — | ||||||||
International (b) | 198 | 197 | 1 | — | ||||||||||||
Fixed Income (c) | 553 | 84 | 457 | 12 | ||||||||||||
Other | ||||||||||||||||
Private Equity | 55 | — | — | 55 | ||||||||||||
Real Estate | 40 | — | — | 40 | ||||||||||||
Cash Equivalents (d) | 27 | 27 | — | — | ||||||||||||
Pension Plan Assets Subtotal | 1,500 | 648 | 745 | 107 | ||||||||||||
Other Postretirement Plan Assets: | ||||||||||||||||
Equity (e) | 145 | 125 | 20 | — | ||||||||||||
Fixed Income (f) | 85 | 85 | — | — | ||||||||||||
Cash Equivalents | 12 | 12 | — | — | ||||||||||||
Postretirement Plan Assets Subtotal | 242 | 222 | 20 | — | ||||||||||||
Total Pension and Other Postretirement Plan Assets | $ | 1,742 | $ | 870 | $ | 765 | $ | 107 | ||||||||
| Fair Value Measurements at December 31, 2010 | ||||||||||||||||
| (millions of dollars) | ||||||||||||||||
| Total | Quoted Prices in Active Markets for Identical Instruments (Level 1) | Significant Other Observable Inputs (Level 2) | Significant Unobservable Inputs (Level 3) | |||||||||||||
Asset Category | ||||||||||||||||
Pension Plan Assets: | ||||||||||||||||
Equity | ||||||||||||||||
Domestic (a) | $ | 573 | $ | 334 | $ | 212 | $ | 27 | ||||||||
International (b) | 270 | 265 | 2 | 3 | ||||||||||||
Fixed Income (c) | 604 | 397 | 204 | 3 | ||||||||||||
Other | ||||||||||||||||
Private Equity | 62 | — | — | 62 | ||||||||||||
Real Estate | 55 | — | — | 55 | ||||||||||||
Cash Equivalents (d) | 68 | 68 | — | — | ||||||||||||
|
|
|
|
|
|
|
| |||||||||
Pension Plan Assets Subtotal | 1,632 | 1,064 | 418 | 150 | ||||||||||||
|
|
|
|
|
|
|
| |||||||||
Other Postretirement Plan Assets: | ||||||||||||||||
Equity (e) | 168 | 145 | 23 | — | ||||||||||||
Fixed Income (f) | 96 | 96 | — | — | ||||||||||||
Cash Equivalents | 11 | 11 | — | — | ||||||||||||
|
|
|
|
|
|
|
| |||||||||
Postretirement Plan Assets Subtotal | 275 | 252 | 23 | — | ||||||||||||
|
|
|
|
|
|
|
| |||||||||
Total Pension and Other Postretirement Plan Assets | $ | 1,907 | $ | 1,316 | $ | 441 | $ | 150 | ||||||||
|
|
|
|
|
|
|
| |||||||||
| (a) | Predominantly includes domestic common |
| (b) | Predominantly includes foreign common and preferred |
| (c) | Predominantly includes corporate bonds, government bonds, municipal/provincial bonds, collateralized mortgage obligations, asset backed securities and commingled |
| (d) | Predominantly includes cash investment in short term investment |
| (e) | Includes domestic and international commingled funds. |
| (f) | Includes fixed income commingled funds. |
There were no significant concentrations of risk in pension and other postretirement benefitOPEB plan assets at December 31, 20102011 and 2009.2010.
Valuation Techniques Used to Determine Fair Value
Equity
Equity securities are primarily comprised of securities issued by public companies in domestic and foreign markets plus investments in commingled funds, which are valued on a daily basis. PHI can exchange shares of the publicly traded securities and the fair values are primarily sourced from the closing prices on stock exchanges where there is active trading, therefore they would be classified as level 1 investments. If there is less active trading, then the publicly traded securities would typically be priced using observable data, such as bid ask prices, and these measurements would be classified as level 2 investments. Investments that are not publicly traded and valued using unobservable inputs would be classified as level 3 investments.
As a practical expedient, the fair values of PHI’s interests in commingled funds are based on the Net Asset Value (NAV) of those funds. These funds have ongoing subscription and redemption activities. Commingled funds with publicly quoted NAVprices and active trading are classified as level 1 investments. Investments inFor commingled funds that are not publicly traded butand have ongoing subscription and redemption activity, the fair value of the investment is the net asset value (NAV) per fund share, derived from the underlying assets held in these funds are tradedsecurities’ quoted prices in active markets, and the prices for these assets are readily observable, are classified as level 2 investments. Investments in commingled funds with redemption restrictions and use NAV are classified as level 3 investments.
173
PEPCO HOLDINGS
Fixed Income
Fixed income investments are primarily comprised of fixed income securities and fixed income commingled funds. The prices for direct investments in fixed income securities are generated on a daily basis. Like the equity securities, fair values generated from active trading on exchanges are classified as level 1 investments. Prices generated from less active trading with wider bid ask prices are classified as level 2 investments. If prices are based on uncorroborated and unobservable inputs, then the investments are classified as level 3 investments.
As a practical expedient, the fair values of PHI’s interests in commingled funds are based on the NAV. These funds have ongoing subscription and redemption activities. Commingled funds with publicly quoted NAVprices and active trading are classified as level 1 investments. Investments inFor commingled funds that are not publicly traded butand have ongoing subscription and redemption activity, the fair value of the investment is the NAV per fund share, derived from the underlying assets held in these funds are tradedsecurities’ quoted prices in active markets, and the prices for these assets are readily observable, are classified as level 2 investments. Investments in commingled funds with redemption restrictions and use NAV are classified as level 3 investments.
Other – Private Equity and Real Estate
Investments in private equity and real estate funds are primarily invested in privately held real estate investment properties, trusts, and partnerships as well as equity and debt issued by public or private companies. As a practical expedient, PHI’s interest in the fund or partnership is valuedestimated at the NAV. PHI’s interest in these funds cannot be readily redeemed due to the inherent lack of liquidity and the primarily long-term nature of the underlying assets. Distribution is made through the liquidation of the underlying assets. PHI views these investments as part of a long-term investment strategy. These investments are valued by each investment manager based on the underlying assets. The majority of the underlying assets are valued using significant unobservable inputs and often require significant management judgment or estimation based on the best available information. Market data includes observations of the trading multiples of public companies considered comparable to the private companies being valued. The funds utilize valuation techniques consistent with the market, income, and cost approaches to measure the fair value of certain real estate investments. As a result, PHI classifies the measurement of these investments as level 3 investments.
The investments in private equity and real estate funds require capital commitments, which may be called over a specific number of years. Unfunded capital commitments as of December 31, 2011 and 2010 and 2009 totaled $42$28 million and $26$42 million, respectively.
Reconciliations of the beginning and ending balances of PHI’s fair value measurements using significant unobservable inputs (level 3) for investments in the pension plan for the years ended December 31, 20102011 and 20092010 are shown below:
| Fair Value Measurement Using Significant Unobservable Inputs (Level 3) | ||||||||||||||||||||
| (millions of dollars) | ||||||||||||||||||||
| Equity | Fixed Income | Private Equity | Real Estate | Total Level 3 | ||||||||||||||||
Beginning balance as of January 1, 2010 | $ | — | $ | 12 | $ | 55 | $ | 40 | $ | 107 | ||||||||||
Transfer in (out) of Level 3 | 23 | — | — | — | 23 | |||||||||||||||
Purchases, sales, and other | 3 | (10 | ) | 1 | 16 | 10 | ||||||||||||||
Unrealized gain/loss | 4 | — | 2 | (1 | ) | 5 | ||||||||||||||
Realized gain/loss | — | 1 | 4 | — | 5 | |||||||||||||||
Ending balance as of December 31, 2010 | $ | 30 | $ | 3 | $ | 62 | $ | 55 | $ | 150 | ||||||||||
| Fair Value Measurement Using Significant Unobservable Inputs (Level 3) | ||||||||||||||||||||
| (millions of dollars) | ||||||||||||||||||||
| Equity | Fixed Income | Private Equity | Real Estate | Total Level 3 | ||||||||||||||||
Beginning balance as of January 1, 2011 | $ | 30 | $ | 3 | $ | 62 | $ | 55 | $ | 150 | ||||||||||
Transfer in (out) of Level 3 | — | — | — | — | — | |||||||||||||||
Purchases | 2 | — | 11 | 9 | 22 | |||||||||||||||
Sales | (5 | ) | (1 | ) | — | — | (6 | ) | ||||||||||||
Settlements | — | 7 | (11 | ) | (6 | ) | (10 | ) | ||||||||||||
Unrealized (loss)/gain | (1 | ) | — | (4 | ) | 9 | 4 | |||||||||||||
Realized gain/(loss) | 1 | — | 6 | (2 | ) | 5 | ||||||||||||||
|
|
|
|
|
|
|
|
|
| |||||||||||
Ending balance as of December 31, 2011 | $ | 27 | $ | 9 | $ | 64 | $ | 65 | $ | 165 | ||||||||||
|
|
|
|
|
|
|
|
|
| |||||||||||
174
PEPCO HOLDINGS
| Fair Value Measurement Using Significant Unobservable Inputs (Level 3) | ||||||||||||||||
| (millions of dollars) | ||||||||||||||||
| Fixed Income | Private Equity | Real Estate | Total Level 3 | |||||||||||||
Beginning balance as of January 1, 2009 | $ | 20 | $ | 32 | $ | 69 | $ | 121 | ||||||||
Transfer in (out) of Level 3 | (8 | ) | — | — | (8 | ) | ||||||||||
Purchases, sales, and other | — | 5 | 6 | 11 | ||||||||||||
Unrealized gain/loss | — | 18 | (29 | ) | (11 | ) | ||||||||||
Realized gain/loss | — | — | (6 | ) | (6 | ) | ||||||||||
Ending balance as of December 31, 2009 | $ | 12 | $ | 55 | $ | 40 | $ | 107 | ||||||||
| Fair Value Measurement Using Significant Unobservable Inputs (Level 3) | ||||||||||||||||||||
| (millions of dollars) | ||||||||||||||||||||
| Equity | Fixed Income | Private Equity | Real Estate | Total Level 3 | ||||||||||||||||
Beginning balance as of January 1, 2010 | $ | — | $ | 12 | $ | 55 | $ | 40 | $ | 107 | ||||||||||
Transfer in (out) of Level 3 | 23 | — | — | — | 23 | |||||||||||||||
Purchases | 4 | 3 | 8 | 16 | 31 | |||||||||||||||
Sales | (2 | ) | (3 | ) | — | — | (5 | ) | ||||||||||||
Settlements | 1 | (7 | ) | (3 | ) | (1 | ) | (10 | ) | |||||||||||
Unrealized gain/(loss) | 4 | (3 | ) | (2 | ) | — | (1 | ) | ||||||||||||
Realized gain | — | 1 | 4 | — | 5 | |||||||||||||||
|
|
|
|
|
|
|
|
|
| |||||||||||
Ending balance as of December 31, 2010 | $ | 30 | $ | 3 | $ | 62 | $ | 55 | $ | 150 | ||||||||||
|
|
|
|
|
|
|
|
|
| |||||||||||
Cash Flows
Contributions - Contributions—PHI Retirement Plan
DuringPHI satisfied the minimum required contribution rules under the Pension Protection Act during 2011 and 2010. Pepco, DPL and ACE made discretionary tax-deductible contributions to the PHI Retirement Plan in the amounts of $40 million, $40 million and $30 million, respectively. In 2010, the PHI Service Company made discretionary tax-deductible contributions totaling $100 million to the PHI Retirement Plan.
On January 31, 2012, Pepco, DPL and ACE made discretionary tax-deductible contributions to the PHI Retirement Plan in the amounts of $85 million, $85 million and $30 million, respectively, which brought planis expected to bring the PHI Retirement Plan assets to at least the funding target level for 2010 under the Pension Protection Act. In 2009, PHI made discretionary tax-deductible contributions totaling $300 million to the PHI Retirement Plan, which brought plan assets to at least the funding target level for 2009 under the Pension Protection Act. Of this amount, $240 million was contributed through tax-deductible contributions from Pepco, ACE and DPL in the amounts of $170 million, $60 million and $10 million, respectively. The remaining $60 million contribution was made through tax-deductible contributions from the PHI Service Company.
Although PHI projects there will be no quarterly minimum funding requirements under the Pension Protection Act guidelines in 2011, PHI currently plans to make a discretionary tax-deductible contribution of up to $150 million to bring its plan assets to at least the funding target level for 20112012 under the Pension Protection Act.
Contributions - Contributions—Other Postretirement Benefit Plan
In 20102011 and 2009,2010, Pepco contributed $10 million and $8 million, respectively, DPL contributed $9$7 million and $10 million, respectively, DPL contributed $6 million and $9 million, respectively, and ACE contributed $8$7 million and $6$8 million, respectively, to the other postretirement benefit plan. In 20102011 and 2009,2010, contributions of $8$13 million and $16$8 million, respectively, were made by other PHI subsidiaries. Assuming no changes to the other postretirement benefit plan assumptions, PHI expects to contribute similar amounts in 2011.
Expected Benefit Payments
Estimated future benefit payments to participants in PHI’s pension and other postretirement benefit plans, which reflect expected future service as appropriate, are as follows (millions of dollars):follows:
Years | Pension Benefits | Other Postretirement Benefits | Pension Benefits | Other Postretirement Benefits | Expected Medicare Part D Subsidies | |||||||||||||||
2011 | $ | 138 | $ | 47 | ||||||||||||||||
| (millions of dollars) | ||||||||||||||||||||
2012 | 123 | 48 | $ | 126 | $ | 47 | $ | 2 | ||||||||||||
2013 | 121 | 50 | 125 | 49 | 2 | |||||||||||||||
2014 | 126 | 51 | 129 | 50 | 3 | |||||||||||||||
2015 | 127 | 52 | 133 | 52 | 3 | |||||||||||||||
2016 through 2020 | $ | 657 | $ | 261 | ||||||||||||||||
2016 | 137 | 52 | 3 | |||||||||||||||||
2017 through 2021 | $ | 732 | $ | 261 | $ | 15 | ||||||||||||||
175
PEPCO HOLDINGS
Medicare Prescription Drug Improvement and Modernization Act of 2003
On December 8, 2003, the Medicare Prescription Drug Improvement and Modernization Act of 2003 (the Medicare Act) became effective. The Medicare Act introduced a prescription drug benefit under Medicare (Medicare Part D),D, as well as a federal subsidy to sponsors of retiree health care benefit plans that provide a benefit that is at least actuarially equivalent to Medicare Part D. Pepco Holdings sponsors postretirement health care plans that provide prescription drug benefits that PHI plan actuaries have determined are actuarially equivalent to Medicare Part D. At December 31,In 2011 and 2010, the accumulated postretirement benefit obligation has been reduced by the present value of projected Medicare Part D subsidies of $51 million. In each of 2010 and 2009, Pepco Holdings received $2 million and $3 million, respectively, in federal Medicare prescription drug subsidies.
Pepco Holdings Retirement Savings Plan
Pepco Holdings has a defined contribution retirement savings plan. Participation in the plan is voluntary. All participants are 100% vested and have a nonforfeitable interest in their own contributions and in the Pepco HoldingsHoldings’ company matching contributions, including any earnings or losses thereon. Pepco Holdings’ matching contributions were $11 million, $12$11 million, and $12 million for the years ended December 31, 2011, 2010 2009, and 2008,2009, respectively.
176
PEPCO HOLDINGS
(11) DEBT
Long-Term Debt
The components of long-term debt are shown below.
| At December 31, | At December 31, | |||||||||||||||||||
Interest Rate | Maturity | 2010 | 2009 | Maturity | 2011 | 2010 | ||||||||||||||
| (millions of dollars) | (millions of dollars) | |||||||||||||||||||
First Mortgage Bonds | ||||||||||||||||||||
Pepco: | ||||||||||||||||||||
5.75% (a) | 2010 | $ | — | $ | 16 | |||||||||||||||
4.95% (a)(b) | 2013 | 200 | 200 | 2013 | $ | 200 | $ | 200 | ||||||||||||
4.65% (a)(b) | 2014 | 175 | 175 | 2014 | 175 | 175 | ||||||||||||||
6.20% (a)(b)(c) | 2022 | 110 | 110 | 2022 | 110 | 110 | ||||||||||||||
5.375% (a) | 2024 | 38 | 38 | 2024 | 38 | 38 | ||||||||||||||
5.75% (a)(b) | 2034 | 100 | 100 | 2034 | 100 | 100 | ||||||||||||||
5.40% (a)(b) | 2035 | 175 | 175 | 2035 | 175 | 175 | ||||||||||||||
6.50% (a)(b)(c) | 2037 | 500 | 500 | 2037 | 500 | 500 | ||||||||||||||
7.90% | 2038 | 250 | 250 | 2038 | 250 | 250 | ||||||||||||||
ACE: | ||||||||||||||||||||
7.25% - 7.63% | 2010 - 2014 | 7 | 8 | |||||||||||||||||
7.63% | 2014 | 7 | 7 | |||||||||||||||||
6.63% | 2013 | 69 | 69 | 2013 | 69 | 69 | ||||||||||||||
7.68% | 2015 - 2016 | 17 | 17 | 2015 -2016 | 17 | 17 | ||||||||||||||
7.75% | 2018 | 250 | 250 | 2018 | 250 | 250 | ||||||||||||||
6.80% (a) | 2021 | 39 | 39 | 2021 | 39 | 39 | ||||||||||||||
4.35% | 2021 | 200 | — | |||||||||||||||||
5.60% (a) | 2025 | 4 | 4 | 2025 | 4 | 4 | ||||||||||||||
4.875% (a)(b)(c) | 2029 | 23 | — | 2029 | 23 | 23 | ||||||||||||||
5.80% (a)(b) | 2034 | 120 | 120 | 2034 | 120 | 120 | ||||||||||||||
5.80% (a)(b) | 2036 | 105 | 105 | 2036 | 105 | 105 | ||||||||||||||
DPL: | ||||||||||||||||||||
6.40% | 2013 | 250 | 250 | 2013 | 250 | 250 | ||||||||||||||
5.22% (a) | 2016 | 100 | 100 | 2016 | 100 | 100 | ||||||||||||||
5.20% (a) | 2019 | 31 | 31 | 2019 | 31 | 31 | ||||||||||||||
4.90% (a)(e) | 2026 | 35 | 35 | |||||||||||||||||
0.75%-4.90% (a)(e) | 2026 | 35 | 35 | |||||||||||||||||
|
| |||||||||||||||||||
Total First Mortgage Bonds | 2,598 | 2,592 | 2,798 | 2,598 | ||||||||||||||||
|
| |||||||||||||||||||
Unsecured Tax-Exempt Bonds | ||||||||||||||||||||
DPL: | ||||||||||||||||||||
5.50% (d) | 2025 | — | 15 | |||||||||||||||||
5.65% (f) | 2028 | — | 16 | |||||||||||||||||
1.80% (d) | 2025 | 15 | — | 2025 | 15 | 15 | ||||||||||||||
2.30% (f) | 2028 | 16 | — | 2028 | 16 | 16 | ||||||||||||||
5.40% | 2031 | 78 | — | 2031 | 78 | 78 | ||||||||||||||
|
| |||||||||||||||||||
Total Unsecured Tax-Exempt Bonds | $ | 109 | $ | 31 | $ | 109 | $ | 109 | ||||||||||||
|
| |||||||||||||||||||
| (a) | Represents a series of first mortgage bonds issued by the indicated company (Collateral First Mortgage Bonds) as collateral for an outstanding series of senior notes issued by the company or tax-exempt bonds issued for the benefit of the company. The maturity date, optional and mandatory prepayment provisions, if any, interest rate, and interest payment dates on each series of senior notes or the company’s obligations in respect of the tax-exempt bonds are identical to the terms of the corresponding series of Collateral First Mortgage Bonds. Payments of principal and interest on a series of senior notes or the company’s obligations in respect of the tax-exempt bonds satisfy the corresponding payment obligations on the related series of Collateral First Mortgage Bonds. Because each series of senior notes or the company’s obligations in respect of the tax-exempt bonds and the corresponding series of Collateral First Mortgage Bonds securing that series of senior notes or tax-exempt bonds obligations effectively represents a single financial obligation, the senior notes and the tax-exempt bonds are not separately shown on the table. |
| (b) | Represents a series of Collateral First Mortgage Bonds issued by the indicated company that in accordance with its terms will, at such time as there are no first mortgage bonds of the issuing company outstanding (other than Collateral First Mortgage Bonds securing payment of senior notes), cease to secure the corresponding series of senior notes and will be cancelled. |
| (c) | Represents a series of Collateral First Mortgage Bonds as to which the indicated company has agreed in connection with the issuance of the corresponding series of senior notes that, notwithstanding the terms of the Collateral First Mortgage Bonds described in footnote (b) above, it will not permit the release of the Collateral First Mortgage Bonds as security for the series of senior notes for so long as the senior notes remain outstanding, unless the company delivers to the senior note trustee comparable secured obligations to secure the senior notes. |
| (d) | On July 1, 2010, DPL purchased this series of tax-exempt bonds issued for the benefit of DPL by the Delaware Economic Development Authority (DEDA) pursuant to a mandatory repurchase provision in the indenture for the bonds that was triggered by the expiration of the original interest period for the bonds. While DPL held the bonds, they remained outstanding as a contractual matter, but were considered extinguished for accounting purposes. On December 1, 2010, DPL resold the bonds to the public, at which time the interest rate on the bonds was changed from 5.50% to a fixed rate of 1.80%. The bonds are subject to mandatory purchase by DPL on June 1, 2012. |
| (e) | These bonds bearing an interest rate of 4.90% were repurchased. On June 1, 2011, DPL resold these bonds that were subject to mandatory repurchase on May 1, 2011 at an interest rate of 0.75%. The |
| (f) | On July 1, 2010, DPL purchased this series of tax-exempt bonds issued for the benefit of DPL by DEDA pursuant to a mandatory repurchase provision in the indenture for the bonds that was triggered by the expiration of the original interest period for the bonds. While DPL held the bonds, they remained outstanding as a contractual matter, but were considered extinguished for accounting purposes. On December 1, 2010, DPL resold the bonds to the public, at which time the interest rate on the bonds was changed from 5.65% to a fixed rate of 2.30%. The bonds are subject to mandatory purchase by DPL on June 1, 2012. |
NOTE: Schedule is continued on next page.
177
PEPCO HOLDINGS
| At December 31, | ||||||||||||
Interest Rate | Maturity | 2010 | 2009 | |||||||||
| (millions of dollars) | ||||||||||||
Medium-Term Notes (unsecured) | ||||||||||||
DPL: | ||||||||||||
7.56% - 7.58% | 2017 | $ | 14 | $ | 14 | |||||||
6.81% | 2018 | 4 | 4 | |||||||||
7.61% | 2019 | 12 | 12 | |||||||||
7.72% | 2027 | 10 | 10 | |||||||||
Total Medium-Term Notes (unsecured) | 40 | 40 | ||||||||||
Recourse Debt | ||||||||||||
PCI: | ||||||||||||
6.59% - 6.69% | 2014 | 11 | 11 | |||||||||
Notes (secured) | ||||||||||||
Pepco Energy Services: | ||||||||||||
7.47% - 7.69% | 2017 | 11 | 9 | |||||||||
Notes (unsecured) | ||||||||||||
PHI: | ||||||||||||
Variable | 2010 | — | 250 | |||||||||
4.00% | 2010 | — | 200 | |||||||||
6.45% | 2012 | — | 750 | |||||||||
2.70% | 2015 | 250 | — | |||||||||
5.90% | 2016 | 190 | 200 | |||||||||
6.125% | 2017 | 81 | 250 | |||||||||
6.00% | 2019 | — | 200 | |||||||||
7.45% | 2032 | 185 | 250 | |||||||||
DPL: | ||||||||||||
5.00% | 2014 | 100 | 100 | |||||||||
5.00% | 2015 | 100 | 100 | |||||||||
Total Notes (unsecured) | 906 | 2,300 | ||||||||||
Total Long-Term Debt | 3,675 | 4,983 | ||||||||||
Other long-term debt | 2 | — | ||||||||||
Net unamortized discount | (12 | ) | (14 | ) | ||||||||
Current portion of long-term debt | (36 | ) | (499 | ) | ||||||||
Total Net Long-Term Debt | $ | 3,629 | $ | 4,470 | ||||||||
Transition Bonds Issued by ACE Funding | ||||||||||||
4.21% | 2013 | $ | 9 | $ | 34 | |||||||
4.46% | 2016 | 39 | 49 | |||||||||
4.91% | 2017 | 118 | 118 | |||||||||
5.05% | 2020 | 54 | 54 | |||||||||
5.55% | 2023 | 147 | 147 | |||||||||
Total | 367 | 402 | ||||||||||
Net unamortized discount | — | — | ||||||||||
Current portion of long-term debt | (35 | ) | (34 | ) | ||||||||
Total Net Long-Term Transition Bonds issued by ACE Funding | $ | 332 | $ | 368 | ||||||||
| At December 31, | ||||||||||||
Interest Rate | Maturity | 2011 | 2010 | |||||||||
| (millions of dollars) | ||||||||||||
Medium-Term Notes (unsecured) | ||||||||||||
DPL: | ||||||||||||
7.56% - 7.58% | 2017 | $ | 14 | $ | 14 | |||||||
6.81% | 2018 | 4 | 4 | |||||||||
7.61% | 2019 | 12 | 12 | |||||||||
7.72% | 2027 | 10 | 10 | |||||||||
|
|
|
| |||||||||
Total Medium-Term Notes (unsecured) | 40 | 40 | ||||||||||
|
|
|
| |||||||||
Recourse Debt | ||||||||||||
PCI: | ||||||||||||
6.59% - 6.69% | 2014 | 11 | 11 | |||||||||
|
|
|
| |||||||||
Notes (secured) | ||||||||||||
Pepco Energy Services: | ||||||||||||
7.35% - 7.47% | 2017 | 15 | 11 | |||||||||
|
|
|
| |||||||||
Notes (unsecured) | ||||||||||||
PHI: | ||||||||||||
2.70% | 2015 | 250 | 250 | |||||||||
5.90% | 2016 | 190 | 190 | |||||||||
6.125% | 2017 | 81 | 81 | |||||||||
7.45% | 2032 | 185 | 185 | |||||||||
DPL: | ||||||||||||
5.00% | 2014 | 100 | 100 | |||||||||
5.00% | 2015 | 100 | 100 | |||||||||
|
|
|
| |||||||||
Total Notes (unsecured) | 906 | 906 | ||||||||||
|
|
|
| |||||||||
Total Long-Term Debt | 3,879 | 3,675 | ||||||||||
Other long-term debt | — | 2 | ||||||||||
Net unamortized discount | (12 | ) | (12 | ) | ||||||||
Current portion of long-term debt | (73 | ) | (36 | ) | ||||||||
|
|
|
| |||||||||
Total Net Long-Term Debt | $ | 3,794 | $ | 3,629 | ||||||||
|
|
|
| |||||||||
Transition Bonds Issued by ACE Funding | ||||||||||||
4.21% | 2013 | $ | — | $ | 9 | |||||||
4.46% | 2016 | 29 | 39 | |||||||||
4.91% | 2017 | 102 | 118 | |||||||||
5.05% | 2020 | 54 | 54 | |||||||||
5.55% | 2023 | 147 | 147 | |||||||||
|
|
|
| |||||||||
Total | 332 | 367 | ||||||||||
Net unamortized discount | — | — | ||||||||||
Current portion of long-term debt | (37 | ) | (35 | ) | ||||||||
|
|
|
| |||||||||
Total Net Long-Term Transition Bonds issued by ACE Funding | $ | 295 | $ | 332 | ||||||||
|
|
|
| |||||||||
178
PEPCO HOLDINGS
The outstanding First Mortgage Bonds issued by each of Pepco, DPL and ACE are subject to a lien on substantially all of the issuing company’s property, plant and equipment.
For a description of the Transition Bonds issued by ACE Funding, see the discussion under the heading “Consolidation of Variable Interest Entities — ACE Transition Funding, LLC” in Note (2), “Significant Accounting Policies.Policies—Consolidation of Variable Interest Entities—ACE Transition Funding, LLC.” The aggregate amounts of maturities for long-term debt and Transition Bonds outstanding at December 31, 2010,2011, are $71 million in 2011, $68$110 million in 2012, $558 million in 2013, $334 million in 2014, $409 million in 2015, $338 million in 2016, and $2,602$2,462 million thereafter.
PHI’s long-term debt is subject to certain covenants. As of December 31, 2010,2011, PHI and its subsidiaries were in compliance with all such covenants.
Unsecured Notes
On October 1, 2010, PHI issued $250 million of 2.70% Senior Notes due 2015.
Long-Term Project Funding
As of December 31, 20102011 and 2009,2010, Pepco Energy Services had outstanding total long-term project funding (including current maturities) of $19$15 million and $20$19 million, respectively, related to energy savings contracts performed by Pepco Energy Services. The aggregate amounts of maturities for the project funding debt outstanding at December 31, 2010,2011, are $4 million for 2011, $2 million for each year 2012 through 2014, $1 million for 2015 and $82016, and $7 million thereafter.
Tax-Exempt Bonds
DPL
In 2010, DEDA issued $78 million of 5.40% Gas Facilities Refunding Revenue Bonds due 2031 for the benefit of DPL. DPL used the proceeds to effect the redemption of the outstanding amounts of five series of tax-exempt bonds in an aggregate principal amount of $78 million that were purchased by DPL in 2008.
In 2010,On June 1, 2011, DPL resold (i) $15$35 million of 1.80% Pollution Control Refunding Revenue Bonds (Delmarva Power & Light Company Project) Series 2000C2001C due 2025, and (ii) $16 million of 2.30% Pollution Control Refunding Revenue2026 (the “Series 2001C Bonds”). The Series 2001C Bonds (Delmarva Power & Light Company Project) Series 2000D due 2028. The bonds were originally issued for the benefit of DPL in 20002001 and had been purchasedwere repurchased by DPL in July 2010on May 2, 2011, pursuant to a mandatory repurchase provision in the respective indenturesindenture for the bonds that wasSeries 2001C Bonds triggered by the expiration of the original interest rate period forspecified by the bonds. The bonds are subject to mandatory purchase by DPL on June 1, 2012.Series 2001C Bonds.
ACEFirst Mortgage Bonds
In 2010,On April 5, 2011, ACE resold $23issued $200 million of 4.875% Pollution Control Revenue Refunding Bonds4.35% first mortgage bonds due 2029, issued byApril 1, 2021. The Pollution Control Financing Authority of Salem Countynet proceeds were used to repay short-term debt and for the benefit of ACE. The bonds had been repurchased by ACE in 2008 in response to the disruption in the tax-exempt bond market.
PEPCO HOLDINGS
general corporate purposes.
Short-Term Debt
Pepco HoldingsPHI and its regulated utility subsidiaries have traditionally used a number of sources to fulfill short-term funding needs, such as commercial paper, short-term notes, and bank lines of credit. Proceeds from short-term borrowings are used primarily to meet working capital needs, but may also be used to temporarily fund long-term capital requirements. A detail of the components of Pepco Holdings’PHI’s short-term debt at December 31, 20102011 and 20092010 is as follows:
| 2010 | 2009 | |||||||
| (millions of dollars) | ||||||||
Commercial Paper | $ | 388 | $ | 384 | ||||
Variable Rate Demand Bonds | 146 | 146 | ||||||
Total | $ | 534 | $ | 530 | ||||
| 2011 | 2010 | |||||||
| (millions of dollars) | ||||||||
Commercial paper | $ | 586 | $ | 388 | ||||
Variable rate demand bonds | 146 | 146 | ||||||
|
|
|
| |||||
Total | $ | 732 | $ | 534 | ||||
|
|
|
| |||||
179
PEPCO HOLDINGS
Commercial Paper
Pepco HoldingsPHI maintains an ongoing commercial paper program which had a maximum capacity of up$875 million through December 31, 2011. In January 2012, the Board of Directors approved an increase in the maximum to $875 million.$1.25 billion. Pepco, DPL, and ACE have ongoing commercial paper programs of up to $500 million, $500 million and $250 million, respectively. The commercial paper programs of each of PHI, Pepco, DPL and ACE are backed by thateach company’s borrowing capacity under PHI’s $1.5 billion primary credit facility, which is described below under the heading “Credit Facilities.”Credit Facility.
PHI, Pepco Holdings and ACEDPL had $230$465 million, $74 million and $158$47 million, respectively, of commercial paper outstanding at December 31, 2010. Pepco did not issue any commercial paper during 2010, and DPL2011. ACE had no commercial paper outstanding at December 31, 2010.2011. The weighted average interest rate for commercial paper issued by PHI, Pepco, Holdings, DPL and ACE commercial paper issued during 20102011 was 0.63%0.64%, 0.35%, 0.34% and 0.36%0.33%, respectively. The weighted average maturity of all commercial paper issued by PHI, Pepco, Holdings, DPL and ACE in 20102011 was nine,eleven, two, two and sevensix days, respectively.
Variable Rate Demand Bonds
PHI’s utility subsidiaries DPL and ACE, as well as Pepco Energy Services, each have outstanding obligations in respect of Variable Rate Demand Bonds (VRDB). VRDBs are subject to repayment on the demand of the holders and, for this reason, are accounted for as short-term debt in accordance with GAAP. However, bonds submitted for purchase are remarketed by a remarketing agent on a best efforts basis. PHI expects that theany bonds submitted for purchase will be remarketed successfully due to the credit worthiness of the issuer and, as applicable, the credit support, and because the remarketing resets the interest rate to the then-current market rate. The bonds may be converted to a fixed-rate, fixed-term option to establish a maturity which corresponds to the date of final maturity of the bonds. On this basis, PHI views VRDBs as a source of long-term financing. As of December 31, 2010,2011, $105 million of VRDBs issued by DPL (of which $72 million was secured by Collateral First Mortgage Bonds issued by DPL), $23 million of VRDBs issued by ACE, and $18 million of VRDBs issued by Pepco Energy Services were outstanding.
The Pollution Control Financing Authority of Salem County has issued tax-exempt VRDBs for the benefit of ACE in the aggregate principal of $23 million. In June 2009, ACE completed the remarketing of these VRDBs supported by letters of credit issued by The Bank of New York Mellon. In June 2010, ACE (i) replaced the letter of credit associated with $18.2 million of Pollution Control Revenue Refunding Bonds, 1997 Series A (Atlantic City Electric Company Project) due 2014 with a new irrevocable direct pay letter of credit expiring in April 2014, and (ii) replaced the letter of credit associated with $4.4 million of Pollution Control Revenue Refunding Bonds, 1997 Series B (Atlantic City Electric Company Project) due 2017 with a new irrevocable direct pay letter of credit expiring in June 2014.
PEPCO HOLDINGS
The VRDBs outstanding at December 31, 20102011 mature as follows: 2014 to 2017 ($49 million), 2024 ($33 million) and 2028 to 2031 ($64 million). The weighted average interest rate for VRDBs was 0.44% during 2011 and 0.45% during 2010 and 1.44% during 2009.2010.
Credit FacilitiesFacility
PHI, Pepco, DPL and ACE maintain an unsecured syndicated credit facility to provide for their respective short-term liquidity needs. needs, including obtaining letters of credit, borrowing for general corporate purposes and supporting their commercial paper programs. On August 1, 2011, PHI, Pepco, DPL and ACE entered into an amended and restated credit agreement with respect to the facility, which among other changes, extended the expiration date of the facility to August 1, 2016.
The aggregate borrowing limit under the amended and restated credit facility is $1.5 billion, all or any portion of which may be used to obtain loans orand up to issue$500 million of which may be used to obtain letters of credit. PHI’sThe facility also includes a swingline loan sub-facility, pursuant to which each company may make same day borrowings in an aggregate amount not to exceed 10% of the total amount of the facility. Any swingline loan must be repaid by the borrower within fourteen days of receipt. The initial credit limit under the facilitysublimit for PHI is $875 million. The credit limit of$750 million and $250 million for each of Pepco, DPL and ACE. The sublimits may be increased or decreased by the individual borrower during the term of the facility, except that (i) the sum of all of the borrower sublimits following any such increase or decrease must equal the total amount of the facility and (ii) the aggregate amount of credit used at any given time by (a) PHI may not exceed $1.25 billion and (b) each of Pepco, DPL or ACE ismay not exceed the lesser of $500 million and the maximum amount of short-term debt the company is permitted to have outstanding by its regulatory authorities, except thatauthorities. The total number of the aggregate amount of credit used by Pepco, DPL and ACE at any given time collectivelysublimit reallocations may not exceed $625 million. eight per year during the term of the facility.
180
PEPCO HOLDINGS
The interest rate payable by each company on utilized funds is, at the borrowing company’s election, (i) the greater of the prevailing prime rate, and the federal funds effective rate plus 0.5% and one month LIBOR plus 1.0%, or (ii) the prevailing Eurodollar rate, plus a margin that varies according to the credit rating of the borrower. The facility also includes a “swingline loan sub-facility” pursuant to which each company may make same day borrowings in an aggregate amount not to exceed $150 million. Any swingline loan must be repaid by the borrower within seven days of receipt thereof.
The facility commitment expiration date is May 5, 2012, with each company having the right to elect to have 100% of the principal balance of the loans outstanding on the expiration date continued as non-revolving term loans for a period of one year from such expiration date.
The facility is intended to serve primarily as a source of liquidity to support the commercial paper programs of the respective companies. The companies are also permitted to use the facility to borrow funds for general corporate purposes and issue letters of credit. In order for a borrower to use the facility, certain representations and warranties must be true and correct, and the borrower must be in compliance with specified financial covenants, including (i) the requirement that each borrowing company maintain a ratio of total indebtedness to total capitalization of 65% or less, computed in accordance with the terms of the credit agreement, which calculation excludes from the definition of total indebtedness certain trust preferred securities and deferrable interest subordinated debt (not to exceed 15% of total capitalization), (ii) with certain exceptions, a restriction on sales or other dispositions of assets, other than certain sales and dispositions, and (iii) a restriction on the incurrence of liens on the assets of a borrower or any of its significant subsidiaries other than permitted liens. The credit agreement contains certain covenants and other customary agreements and requirements that, if not complied with, could result in an event of default and the acceleration of repayment obligations of one or more of the borrowers thereunder. Each of the borrowers was in compliance with all financial covenants under this facility as of December 31, 2011.
The absence of a material adverse change in the borrower’sPHI’s business, property, and results of operations or financial condition is not a condition to the availability of credit under the facility.credit agreement. The facilitycredit agreement does not include any rating triggers.
On October 15,At December 31, 2011 and 2010, a $400 million unsecuredthe amount of cash plus unused borrowing capacity under the primary credit facility maintained byavailable to meet the future liquidity needs of PHI expired. To replace this facility, PHI,and its utility subsidiaries on October 27, 2010, entered into two bi-lateral 364 day unsecured credit agreements totaling $200 million. Under each ofa consolidated basis totaled $1 billion and $1.2 billion, respectively. PHI’s utility subsidiaries had combined cash and unused borrowing capacity under the credit agreements, PHI has access to revolving and floating rate loans over the terms of the agreements. Neither agreement provides for the issuance of letters of credit. The interest rate payable on funds borrowed is at PHI’s election, based on either (a) the prevailing Eurodollar rate plus 2.0% or (b) the highest of (i) the prevailing prime rate, (ii) the federal funds effective rate plus 0.5%, or (iii) the one-month Eurodollar rate plus 1.0%, plus a margin of 1.0%. In order to obtain loans under either of the agreements, PHI must be in compliance with the same covenants and conditions that it is required to satisfy for utilization of its existing $1.5 billion credit facility. The absence of a material adverse change in PHI’s business, property and results of operations or financial condition is not a condition to the availability of credit under either agreement. Neither agreement includes any rating triggers.
The $1.5 billion credit facility of $711 million and the two bi-lateral credit agreements are referred to herein collectively as PHI’s “primary credit facilities.” As of$462 million at December 31, 2011 and 2010, each borrower was in compliance with the covenants of each of the primary credit facilities.
PEPCO HOLDINGS
On November 2, 2010, PHI’s $50 million bi-lateral credit agreement with The Bank of Nova Scotia expired. Both the $400 million PHI facility that expired in October 2010 and this agreement were established to provide additional liquidity and collateral support for Pepco Energy Services’ retail energy supply business and for the operations of Conectiv Energy. Based on the progress toward winding down the retail energy supply business and disposing of the Conectiv Energy segment, the level of liquidity and collateral needed to support these businesses has decreased. As a result, PHI has been able to reduce the total amount of its credit facility needs by $250 million.respectively.
Loss on Extinguishment of Debt
During the year ended December 31, 2010, PHI recorded a pre-tax loss on extinguishment of debt of $189 million ($113 million after-tax), which is further discussed below.
In July 2010, PHI purchased, pursuant to a cash tender offer, $640 million in principal amount of its 6.45% Senior Notes due 2012 (6.45% Notes), redeemed the remaining $110 million of outstanding 6.45% Notes, and purchased, pursuant to a cash tender offer, $129 million of its 6.125% Senior Notes due 2017 (6.125% Notes) and $65 million of 7.45% Senior Notes due 2032 (7.45% Notes). In connection with these transactions, PHI recorded a pre-tax loss on extinguishment of debt of $120 million in the third quarter of 2010.
In October 2010, PHI purchased, pursuant to a cash tender offer, an additional $40 million of outstanding 6.125% Notes. In November 2010, PHI redeemed all of its $200 million 6% Notes due 2019 and $10 million of its 5.9% Notes due 2016. PHI recorded a pre-tax loss on extinguishment of debt of approximately $54 million in the fourth quarter of 2010 in connection with this transaction.
In connection with the purchases of the 6.45% Notes and the 7.45% Notes, PHI accelerated the recognition of $15 million of pre-tax hedging losses attributable to the issuance of the 6.45% Notes and 7.45% Notes by reclassifying these hedging losses from AOCL to income. These hedging losses originally arose when PHI entered into several treasury rate lock transactions in June 2002 to hedge changes in interest rates related to the anticipated issuance in August 2002 of several series of senior notes, including the 6.45% Notes and the 7.45% Notes. Upon issuance of the fixed rate debt in August 2002, the rate locks were terminated at a loss that has been deferred in AOCL and is being recognized in income over the life of the debt issued as interest payments on the debt are made. The accelerated recognition of these losses has also been included as a component of pre-tax loss on extinguishment of debt.
181
PEPCO HOLDINGS
Collateral Requirements of Pepco Energy Services
In the ordinary course of its energy supply business which is in the process of winding down, Pepco Energy Services enters into various contracts to buy and sell electricity, fuels and related products, including derivative instruments, designed to reduce its financial exposure to changes in the value of its assets and obligations due to energy price fluctuations. These contracts typically have collateral requirements. Depending on the contract terms, the collateral required to be posted by Pepco Energy Services can be of varying forms, including cash and letters of credit.
In conducting its retail energy supply business, Pepco Energy Services, during periods of declining energy prices, has been exposed to the asymmetrical risk of having to post collateral under its wholesale purchase contracts without receiving a corresponding amount of collateral from its retail customers. To partially address these asymmetrical collateral obligations, Pepco Energy Services, in the first quarter of 2009, entered into a credit intermediation arrangement with Morgan Stanley Capital Group, Inc. (MSCG). Under this arrangement, MSCG, in consideration for the payment to MSCG of certain fees, (i) assumed, by novation, the electricity purchase obligations of Pepco Energy Services in years 2009 through 2011 under several wholesale purchase contracts, and (ii) agreed to supplysupplied electricity to Pepco Energy Services on the same terms as the novated transactions, but without imposing on Pepco Energy Services any obligation to post collateral based on changes in electricity prices. The upfront fees incurred by Pepco Energy Services in 2009 in the amount of $25 million are beingwas amortized into expense in declining amounts over the life of the arrangement based on the fair value of the underlying contracts at the time of the novation. For the years ended December 31, 2011, 2010 and 2009, approximately $1 million, $8 million and $16 million, respectively, of the fees have been amortized and reflected in interestInterest expense.
As the retail electric and natural gas supply businesses are wound down, Pepco Energy Services’ collateral requirements will be further reduced.
PEPCO HOLDINGS
In relation to its retail energy supply business being wound down,of December 31, 2011, Pepco Energy Services in the ordinary coursehad posted net cash collateral of business, had entered into various contracts to buy and sell electricity, fuels and related products, including derivative instruments, designed to reduce its financial exposure to changes in the value of its assets and obligations due to energy price fluctuations. These contracts typically have collateral requirements.
Depending on the contract terms, the collateral required to be posted by Pepco Energy Services can be of varying forms, including cash$112 million and letters of credit. Ascredit of $1 million. At December 31, 2010, Pepco Energy Services had posted net cash collateral of $117 million and letters of credit of $113 million. At December 31, 2009, Pepco Energy Services had posted net cash collateral of $123 million and letters of credit of $157 million.
At December 31, 20102011 and 2009,2010, the amount of cash, plus borrowing capacity under the primary credit facilities available to meet the future liquidity needs of Pepco Energy Services and Conectiv Energy totaled $728$283 million and $820$728 million, respectively.
(12) INCOME TAXES
PHI and the majority of its subsidiaries file a consolidated federal income tax return. Federal income taxes are allocated among PHI and the subsidiaries included in its consolidated group pursuant to a written tax sharing agreement that was approved by the SEC in connection with the establishment of PHI as a holding company. Under this tax sharing agreement, PHI’s consolidated federal income tax liability is allocated based upon PHI’s and its subsidiaries’ separate taxable income or loss.
The provision for consolidated income taxes, reconciliation of consolidated income tax expense, and components of consolidated deferred tax liabilities (assets) are shown below.
182
PEPCO HOLDINGS
Provision for Consolidated Income Taxes – Continuing Operations
| For the Year Ended December 31, | ||||||||||||
| 2010 | 2009 | 2008 | ||||||||||
| (millions of dollars) | ||||||||||||
Current Tax Benefit | ||||||||||||
Federal | $ | (270 | ) | $ | (160 | ) | $ | (78 | ) | |||
State and local | (50 | ) | (32 | ) | (21 | ) | ||||||
Total Current Tax Benefit | (320 | ) | (192 | ) | (99 | ) | ||||||
Deferred Tax Expense (Benefit) | ||||||||||||
Federal | 300 | 261 | 147 | |||||||||
State and local | 34 | 39 | 46 | |||||||||
Investment tax credits | (3 | ) | (4 | ) | (4 | ) | ||||||
Total Deferred Tax Expense | 331 | 296 | 189 | |||||||||
Total Consolidated Income Tax Expense Related to Continuing Operations | $ | 11 | $ | 104 | $ | 90 | ||||||
PEPCO HOLDINGS
| For the Year Ended December 31, | ||||||||||||
| 2011 | 2010 | 2009 | ||||||||||
| (millions of dollars) | ||||||||||||
Current Tax Expense (Benefit) | ||||||||||||
Federal | $ | 9 | $ | (270 | ) | $ | (160 | ) | ||||
State and local | 4 | (50 | ) | (32 | ) | |||||||
|
|
|
|
|
| |||||||
Total Current Tax Expense (Benefit) | 13 | (320 | ) | (192 | ) | |||||||
|
|
|
|
|
| |||||||
Deferred Tax Expense (Benefit) | ||||||||||||
Federal | 121 | 300 | 261 | |||||||||
State and local | 19 | 34 | 39 | |||||||||
Investment tax credit amortization | (4 | ) | (3 | ) | (4 | ) | ||||||
|
|
|
|
|
| |||||||
Total Deferred Tax Expense | 136 | 331 | 296 | |||||||||
|
|
|
|
|
| |||||||
Total Consolidated Income Tax Expense Related to Continuing Operations | $ | 149 | $ | 11 | $ | 104 | ||||||
|
|
|
|
|
| |||||||
Reconciliation of Consolidated Income Tax Expense – Continuing Operations
| For the Year Ended December 31, | For the Year Ended December 31, | |||||||||||||||||||||||||||||||||||||||||||||||
| 2010 | 2009 | 2008 | 2011 | 2010 | 2009 | |||||||||||||||||||||||||||||||||||||||||||
| (millions of dollars) | (millions of dollars) | |||||||||||||||||||||||||||||||||||||||||||||||
Income tax at Federal statutory rate | $ | 52 | 35.0 | % | $ | 114 | 35.0 | % | $ | 96 | 35.0 | % | $ | 143 | 35.0 | % | $ | 52 | 35.0 | % | $ | 114 | 35.0 | % | ||||||||||||||||||||||||
Increases (decreases) resulting from | ||||||||||||||||||||||||||||||||||||||||||||||||
Depreciation | (3 | ) | (2.0 | )% | 6 | 1.8 | % | 5 | 1.8 | % | — | — | (3 | ) | (2.0 | )% | 6 | 1.8 | % | |||||||||||||||||||||||||||||
State income taxes, net of Federal effect | — | — | 19 | 5.7 | % | 22 | 8.0 | % | 22 | 5.4 | % | — | — | 19 | 5.7 | % | ||||||||||||||||||||||||||||||||
State tax benefits related to prior years’ asset dispositions | — | — | (13 | ) | (4.0 | )% | (3 | ) | (1.0 | )% | (4 | ) | (1.0 | )% | — | — | (13 | ) | (4.0 | )% | ||||||||||||||||||||||||||||
Cross-border energy lease investments | (5 | ) | (3.3 | )% | (6 | ) | (1.7 | )% | (1 | ) | (0.2 | )% | 16 | 3.9 | % | (5 | ) | (3.3 | )% | (6 | ) | (1.7 | )% | |||||||||||||||||||||||||
Change in estimates and interest related to uncertain and effectively settled tax positions | (6 | ) | (4.0 | )% | (1 | ) | (0.4 | )% | (10 | ) | (3.6 | )% | (11 | ) | (2.7 | )% | (6 | ) | (4.0 | )% | (1 | ) | (0.4 | )% | ||||||||||||||||||||||||
Tax credits | (4 | ) | (2.7 | )% | (4 | ) | (1.2 | )% | (4 | ) | (1.5 | )% | ||||||||||||||||||||||||||||||||||||
Investment tax credits | (4 | ) | (1.0 | )% | (4 | ) | (2.7 | )% | (4 | ) | (1.2 | )% | ||||||||||||||||||||||||||||||||||||
Deferred tax basis adjustments | (3 | ) | (2.0 | )% | (4 | ) | (1.2 | )% | (6 | ) | (2.2 | )% | 2 | 0.2 | % | (3 | ) | (2.0 | )% | (4 | ) | (1.2 | )% | |||||||||||||||||||||||||
Reversal of valuation allowances | (8 | ) | (5.3 | )% | — | — | — | — | — | — | (8 | ) | (5.3 | )% | — | — | ||||||||||||||||||||||||||||||||
Change in state deferred tax balances as a result of restructuring | (6 | ) | (4.0 | )% | — | — | — | — | — | — | (6 | ) | (4.0 | )% | — | — | ||||||||||||||||||||||||||||||||
Other, net | (6 | ) | (4.4 | )% | (7 | ) | (2.2 | )% | (9 | ) | (3.3 | )% | (15 | ) | (3.4 | )% | (6 | ) | (4.4 | )% | (7 | ) | (2.2 | )% | ||||||||||||||||||||||||
|
|
|
|
|
| |||||||||||||||||||||||||||||||||||||||||||
Consolidated Income Tax Expense Related to Continuing Operations | $ | 11 | 7.3 | % | $ | 104 | 31.8 | % | $ | 90 | 33.0 | % | $ | 149 | 36.4 | % | $ | 11 | 7.3 | % | $ | 104 | 31.8 | % | ||||||||||||||||||||||||
|
|
|
|
|
| |||||||||||||||||||||||||||||||||||||||||||
OnYear ended December 31, 2011
PHI’s effective income tax rate in 2011 was significantly affected by changes in estimates and interest related to uncertain and effectively settled tax positions. In 2011, PHI reached a settlement with the IRS with respect to interest due on its federal tax liabilities related to the November 2010 audit settlement (discussed below) for years 1996 through 2002. In connection with this agreement, PHI reallocated certain amounts that have been on deposit with the IRS since 2006 among liabilities in the settlement years and subsequent years. Primarily related to the settlement and reallocations, PHI recorded an additional tax benefit of $17 million (after-tax) which was recorded in the second quarter of 2011. Further, PHI recalculated interest on its uncertain tax positions for open tax years using different assumptions related to the application of its deposit made with the IRS in 2006, which resulted in additional tax expense of $3 million (after-tax).
183
PEPCO HOLDINGS
As discussed further in Note (8), “Leasing Activities,” during the second quarter of 2011, PHI terminated early its interest in certain cross-border energy leases prior to the end of their stated terms. As a result of the early terminations, PHI reversed $22 million of previously recognized federal tax benefits associated with those leases which will not be realized.
In addition, as discussed further in Note (17), “Commitments and Contingencies – District of Columbia Tax Legislation,” on June 14, 2011, the Council of the District of Columbia approved the Fiscal Year 2012 Budget Support Act of 2011 (the Budget Support Act). The Budget Support Act includes a provision that requires corporate taxpayers in the District of Columbia to calculate taxable income allocable or apportioned to the District by reference to the income and apportionment factors applicable to commonly controlled entities organized within the United States that are engaged in a unitary business. Previously, only the income of companies with direct nexus to the District of Columbia was taxed. As a result of the change, during 2011 PHI recorded additional state income tax expense of $2 million.
Year ended December 31, 2010
In April 1, 2010, as part of an ongoing effort to simplify PHI’s organizational structure, certain of PHI’s subsidiaries were converted from corporations to single member limited liability companies. In addition to increased organizational flexibility and reduced administrative costs, converting these entities to limited liability companies allows PHI to include income or losses in the former corporations in a single state income tax return, thus increasing the utilization of state income tax attributes. As a result of inclusions of income or losses in a single state return as discussed above, PHI recorded an $8 million benefit by reversing valuation allowances on certain state net operating losses and an additional benefit of $6 million resulting from changes to certain state deferred income tax benefits. In addition, conversion to limited liability companies caused PHI’s separate company losses (primarily related to the loss on the extinguishment of debt) to be subjected to state income taxes in new jurisdictions, resulting in minimal consolidated state taxable income in 2010.
In November 2010, PHI reached final settlement with the IRS with respect to its federal tax returns for the years 1996 to 2002 for all issues except its cross-border energy lease investments. In connection with the settlement, PHI reallocated certain amounts on deposit with the IRS since 2006 among liabilities in the settlement years and subsequent years. In light of the settlement and reallocations, PHI has recalculated the estimated interest due for the tax years 1996 to 2002. The revised estimate has resulted in the reversal of $15 million (after-tax) of estimated interest due to the IRS. This reversal has beenwas recorded as an income tax benefit in the fourth quarter of 2010 and is subject to adjustmentPHI recorded an additional tax benefit of $17 million (after-tax) in the second quarter of 2011 when the IRS finalizesfinalized its calculation of the amount due. Offsetting thisthe 2010 benefit was the reversal of $6 million (after-tax) of erroneously accrued state interest receivable recorded in the first quarter of 2010 and $2 million (after-tax) of other adjustments.
Also in the fourth quarter of 2010, PHI corrected the tax accounting for software amortization. Accordingly, a regulatory asset was established and income tax expense was reduced by $4 million.
Year ended December 31, 2009
During 2009, PHI recorded a decrease to income tax expense of $13 million resulting from the receipt of a refund of $6 million (after-tax) of state income taxes and the establishment of a state tax benefit carryforward of $7 million (after-tax), related to a change in tax reporting for certain asset dispositions occurring in prior years.
184
PEPCO HOLDINGS
During 2009, the IRS issued a Revenue Agent’s Report (RAR) for the audit of PHI’s consolidated federal income tax returns for the calendar years 2003 to 2005. The IRS has proposed adjustments to PHI’s tax returns, including adjustments to PHI’s deductions related to cross-border energy lease investments, the capitalization of overhead costs for tax purposes and the deductibility of certain casualty losses. PHI has appealed certain of the proposed adjustments and believes it has adequately reserved for the adjustments proposed in the RAR.Revenue Agents Report. See Note (17), “Commitments and Contingencies – PHI’s Cross-Border Energy Lease Investments,” for additional information.
During 2009, PHI received a refund of taxes paid in prior years of approximately $138 million, a substantial portion of which is associated with PHI’s utility subsidiaries. The refund resulted from the carryback of a 2008 net operating loss for tax reporting purposes that reflected, among other things, significant tax deductions related to accelerated depreciation, the pension plan contributions made in 2009 (which were deductible for 2008) and the cumulative effect of adopting a new method of tax reporting for certain repairs.
During 2008, Pepco Holdings completed an analysisComponents of itsConsolidated Deferred Tax Liabilities (Assets)
| At December 31, | ||||||||
| 2011 | 2010 | |||||||
| (millions of dollars) | ||||||||
Deferred Tax Liabilities (Assets) | ||||||||
Depreciation and other basis differences related to plant and equipment | $ | 1,871 | $ | 1,680 | ||||
Deferred electric service and electric restructuring liabilities | 131 | 154 | ||||||
Cross-border energy lease investments | 793 | 816 | ||||||
Federal and state net operating losses | (220 | ) | (46 | ) | ||||
Valuation allowances on state net operating losses | 21 | 21 | ||||||
Pension and other postretirement benefits | 130 | 70 | ||||||
Deferred taxes on amounts to be collected through future rates | 47 | 43 | ||||||
Other | 32 | (113 | ) | |||||
|
|
|
| |||||
Total Deferred Tax Liabilities, net | 2,805 | 2,625 | ||||||
Deferred tax assets included in Current Assets | 59 | 90 | ||||||
Deferred tax liabilities included in Other Current Liabilities | (1 | ) | (1 | ) | ||||
|
|
|
| |||||
Total Consolidated Deferred Tax Liabilities, net non-current | $ | 2,863 | $ | 2,714 | ||||
|
|
|
| |||||
The net deferred tax liability represents the tax effect, at presently enacted tax rates, of temporary differences between the financial statement basis and tax basis of assets and liabilities. The portion of the net deferred tax liability applicable to PHI’s utility operations, which has not been reflected in current service rates, represents income taxes recoverable through future rates, net, and deferred income tax accounts and,is recorded as a result, recorded an $8 million netregulatory asset on the balance sheet.
The Tax Reform Act of 1986 repealed the investment tax credit for property placed in service after December 31, 1985, except for certain transition property. Investment tax credits previously earned on Pepco’s, DPL’s and ACE’s property continues to be amortized to income tax expense in 2008, which is primarily included in “Other, net” inover the reconciliation provided above. In conjunction with the analysis, Pepco Holdings also identified a $1 million adjustment of its current and deferred income tax accounts that related to pre-acquisition tax contingencies associated with the Conectiv acquisition in 2002, which was recorded as an increase in goodwill. Also identified as partuseful lives of the analysis were new uncertain tax positions under FASB guidance on income taxes (ASC 740) (primarily representing overpayments of income taxes in previously filed tax returns) that resulted in the recording of after-tax net interest income of $4 million, which is included as a reduction of income tax expense.related property.
During 2008, Pepco Holdings recorded after-tax net interest income of $13 million under FASB guidance on income taxes (ASC 740) primarily related to the reversal of previously accrued interest payable resulting from a tentative settlement on the capitalization of certain overhead costs with the IRS, and a claim made with the IRS related to the tax reporting for fuel over- and under-recoveries. This amount was offset by $7 million in after-tax interest expense related to the change in assumptions regarding the estimated timing of the tax benefits on cross-border energy lease investments.
185
PEPCO HOLDINGS
Reconciliation of Beginning and Ending Balances of Unrecognized Tax Benefits
| 2010 | 2009 | 2008 | 2011 | 2010 | 2009 | |||||||||||||||||||
| (millions of dollars) | (millions of dollars) | |||||||||||||||||||||||
Beginning balance as of January 1, | $ | 246 | $ | 255 | $ | 275 | $ | 395 | $ | 246 | $ | 255 | ||||||||||||
Tax positions related to current year: | ||||||||||||||||||||||||
Additions | 150 | (1 | ) | 2 | 2 | 150 | (1 | ) | ||||||||||||||||
Reductions | — | (2 | ) | — | — | — | (2 | ) | ||||||||||||||||
Tax positions related to prior years: | ||||||||||||||||||||||||
Additions | 35 | 77 | 196 | 20 | 35 | 77 | ||||||||||||||||||
Reductions | (36 | ) | (83 | ) | (209 | ) | (57 | ) | (36 | ) | (83 | ) | ||||||||||||
Settlements | — | — | (9 | ) | (3 | ) | — | — | ||||||||||||||||
|
|
| ||||||||||||||||||||||
Ending balance as of December 31, | $ | 395 | $ | 246 | $ | 255 | $ | 357 | $ | 395 | $ | 246 | ||||||||||||
|
|
| ||||||||||||||||||||||
Unrecognized Benefits That, If Recognized, Would Affect the Effective Tax Rate
Unrecognized tax benefits are related to tax positions that have been taken or are expected to be taken in tax returns that are not recognized in the financial statements because management has either measured the tax benefit at an amount less than the benefit claimed or expected to be claimed, or has concluded that it is not more likely than not that the tax position will be ultimately sustained. For the majority of these tax positions, the ultimate deductibility is highly certain, but there is uncertainty about the timing of such deductibility. Unrecognized tax benefits at December 31, 20102011 included $21$29 million that, if recognized, would lower the effective tax rate.
PEPCO HOLDINGS
Interest and Penalties
PHI recognizes interest and penalties relating to its uncertain tax positions as an element of income tax expense. For the years ended December 31, 2011, 2010 2009 and 2008,2009, PHI recognized $23 million of pre-tax interest income ($14 million after-tax), $2 million of pre-tax interest income ($1 million after-tax), and $5 million of pre-tax interest income ($3 million after-tax), and $17 million of pre-tax interest income ($10 million after-tax), respectively, as a component of income tax expense related to continuing operations. As of December 31, 2011, 2010 2009 and 2008,2009, PHI had $4 million, $12 million $13 million and $16$13 million, respectively, of accrued interest payable related to effectively settled and uncertain tax positions.
Possible Changes to Unrecognized Tax Benefits
It is reasonably possible that the amount of the unrecognized tax benefit with respect to some of PHI’s uncertain tax positions will significantly increase or decrease within the next 12 months. The possible settlement of the cross-border energy lease investments issue, the 2003 to 2005 federal audit, the methodology change for deduction of capitalized construction costs, or state audits could impact the balances and related interest accruals significantly. At this time, an estimate of the range of reasonably possible outcomes cannot be determined.
Tax Years Open to Examination
PHI’s Federal income tax liabilities for Pepco legacy companies for all years through 2002, and for Conectiv legacy companies for all years through 2002, have been determined by the IRS, subject to adjustment to the extent of any net operating loss or other loss or credit carrybacks from subsequent years. PHI has not reached final settlement with the IRS with respect to the cross-border energy lease deductions. The open tax years for the significant states where PHI files state income tax returns (District of Columbia, Maryland, Delaware, New Jersey, Pennsylvania and Virginia) are the same as for the Federal returns. As a result of the final determination of these years, PHI has filed amended state returns requesting $18 million in refunds which are subject to review by the various states. If accepted by the states, PHI could reduce its state tax expense by an estimated $3 million.
Components of Consolidated Deferred Tax Liabilities (Assets)
| At December 31, | ||||||||
| 2010 | 2009 | |||||||
| (millions of dollars) | ||||||||
Deferred Tax Liabilities (Assets) | ||||||||
Depreciation and other basis differences related to plant and equipment | $ | 1,680 | $ | 1,813 | ||||
Goodwill and fair value adjustments | (30 | ) | (100 | ) | ||||
Deferred electric service and electric restructuring liabilities | 154 | 173 | ||||||
Finance and operating leases | 816 | 748 | ||||||
Federal and state net operating losses | (46 | ) | (148 | ) | ||||
Valuation allowances on state net operating losses | 21 | 36 | ||||||
Pension and other postretirement benefits | 70 | 133 | ||||||
Deferred taxes on amounts to be collected through future rates | 43 | 42 | ||||||
Other | (83 | ) | (229 | ) | ||||
Total Deferred Tax Liabilities, Net | 2,625 | 2,468 | ||||||
Deferred tax assets included in Current Assets | 90 | 126 | ||||||
Deferred tax liabilities included in Other Current Liabilities | (1 | ) | 6 | |||||
Total Consolidated Deferred Tax Liabilities, Net Non-Current | $ | 2,714 | $ | 2,600 | ||||
186
PEPCO HOLDINGS
The net deferred tax liability represents the tax effect, at presently enacted tax rates, of temporary differences between the financial statement basis and tax basis of assets and liabilities. The portion of the net deferred tax liability applicable to PHI’s operations, which has not been reflected in current service rates, represents income taxes recoverable through future rates, net, and is recorded as a regulatory asset on the balance sheet.
The Tax Reform Act of 1986 repealed the investment tax credit (ITC) for property placed in service after December 31, 1985, except for certain transition property. ITC previously earned on Pepco’s, DPL’s and ACE’s property continues to be amortized to income over the useful lives of the related property.
Resolution of Certain IRS Audit Matters
In 2010, PHI resolved all tax matters that were raised in IRS audits related to the 2001 and 2002 tax years except for the cross-border energy lease issue. Adjustments recorded relating to these resolved tax matters resulted in a $1 million increase to income tax expense exclusive of interest.
Other Taxes
Other taxes for continuing operations are shown below. The annual amounts include $445 million, $427 million $358 million and $347$358 million for the years ended December 31, 2011, 2010 2009 and 2008,2009, respectively, related to the Power Delivery, business, which are recoverable through rates.
| 2010 | 2009 | 2008 | 2011 | 2010 | 2009 | |||||||||||||||||||
| (millions of dollars) | (millions of dollars) | |||||||||||||||||||||||
Gross Receipts/Delivery | $ | 145 | $ | 142 | $ | 146 | $ | 145 | $ | 145 | $ | 142 | ||||||||||||
Property | 70 | 68 | 64 | 71 | 70 | 68 | ||||||||||||||||||
County Fuel and Energy | 154 | 94 | 90 | 170 | 154 | 94 | ||||||||||||||||||
Environmental, Use and Other | 65 | 64 | 55 | 65 | 65 | 64 | ||||||||||||||||||
|
|
| ||||||||||||||||||||||
Total | $ | 434 | $ | 368 | $ | 355 | $ | 451 | $ | 434 | $ | 368 | ||||||||||||
|
|
| ||||||||||||||||||||||
(13) NONCONTROLLINGNON-CONTROLLING INTEREST
The outstanding preferred stock issued by subsidiaries of PHI as of December 31, 20102011 and 20092010 consisted of the following series of serial preferred stock issued by ACE. The shares of each of the series arewere redeemable solely at the option of the issuer. On January 26,During 2011, ACE issued notes of redemption forredeemed all of its outstanding cumulative preferred stock at the redemption prices indicated in the table below. The redemptions will occur on February 25, 2011.
| Redemption Price | Shares Outstanding | December 31, | Redemption Price | Shares Outstanding | December 31, | |||||||||||||||||||||||||||||||||||
| 2010 | 2009 | 2010 | 2009 | 2011 | 2010 | 2011 | 2010 | |||||||||||||||||||||||||||||||||
| (millions of dollars) | (millions of dollars) | |||||||||||||||||||||||||||||||||||||||
4.0% Series of 1944, $100 per share par value | $ | 105.50 | 24,268 | 24,268 | $ | 2 | $ | 2 | $ | 105.50 | — | 24,268 | $ | — | $ | 2 | ||||||||||||||||||||||||
4.35% Series of 1949, $100 per share par value | $ | 101.00 | 2,942 | 2,942 | — | — | $ | 101.00 | — | 2,942 | — | — | ||||||||||||||||||||||||||||
4.35% Series of 1953, $100 per share par value | $ | 101.00 | 1,680 | 1,680 | — | — | $ | 101.00 | — | 1,680 | — | — | ||||||||||||||||||||||||||||
4.10% Series of 1954, $100 per share par value | $ | 101.00 | 20,504 | 20,504 | 2 | 2 | $ | 101.00 | — | 20,504 | — | 2 | ||||||||||||||||||||||||||||
4.75% Series of 1958, $100 per share par value | $ | 101.00 | 8,631 | 8,631 | 1 | 1 | $ | 101.00 | — | 8,631 | — | 1 | ||||||||||||||||||||||||||||
5.0% Series of 1960, $100 per share par value | $ | 100.00 | 4,120 | 4,120 | 1 | 1 | $ | 100.00 | — | 4,120 | — | 1 | ||||||||||||||||||||||||||||
|
|
|
| |||||||||||||||||||||||||||||||||||||
Total Preferred Stock of Subsidiaries | 62,145 | 62,145 | $ | 6 | $ | 6 | — | 62,145 | $ | — | $ | 6 | ||||||||||||||||||||||||||||
|
|
|
| |||||||||||||||||||||||||||||||||||||
187
PEPCO HOLDINGS
(14)STOCK-BASED COMPENSATION, DIVIDEND RESTRICTIONS, AND CALCULATIONS OF EARNINGS PER SHARE OF COMMON STOCK
| (14) | STOCK-BASED COMPENSATION, DIVIDEND RESTRICTIONS, AND CALCULATIONS OF EARNINGS PER SHARE OF COMMON STOCK |
Stock-Based Compensation
PHI maintains a Long-Term Incentive Plan (LTIP), the objective of which is to increase shareholder value by providing a long-term incentive to reward officers and key employees and directors of Pepco Holdings and its subsidiaries and to increase the ownership of Pepco Holdings’ common stock by such individuals. Any officer or key employee of Pepco Holdings or its subsidiaries may be designated by the PHI boardBoard of directorsDirectors as a participant in the LTIP. Under the LTIP, awards to officers and key employees may be in the form of restricted stock, restricted stock units, stock options, performance units, stock appreciation rights, unrestricted stock, and dividend equivalents. At inception, 10 million shares of common stock were authorized for issuance under the LTIP.
Total stock-based compensation expense recorded in the consolidated statements of income for the years ended December 31, 2011, 2010 and 2009 was $6 million, $5 million and 2008$5 million, respectively, all of which was as follows:
| 2010 | 2009 | 2008 | ||||||||||
| (millions of dollars) | ||||||||||||
Stock options | $ | — | $ | — | $ | — | ||||||
Restricted stock awards | 5 | 5 | 16 | |||||||||
Total stock compensation expense | $ | 5 | $ | 5 | $ | 16 | ||||||
During 2008, PHI identified an error in the accounting for certain of itsassociated with restricted stock awards granted under the LTIP that resulted in an understatement of stock-based compensation expense in 2006 and 2007. This error was corrected in 2008, resulting in an increase in stock-based compensation expense for the year ended December 31, 2008 of $9 million.restricted stock unit awards.
No material amount of stock compensation expense was capitalized for the years ended December 31, 2011, 2010 2009 and 2008.2009.
Restricted Stock and Restricted Stock Unit Awards
Description of awards
A number of programs have been established under the LTIP involving the issuance of restricted stock and restricted stock unit awards, including awards of performance-based restricted stock units, time-based restricted stock and restricted stock units, retention restricted stock and the Conectiv performance accelerated restricted stock (Conectiv PARS)(PARS). A summary of each of these programs is as follows:
Under the performance-based restricted stock program, performance criteria are selected and measured over a three-yearthe specified performance period. Depending on the extent to which the performance criteria are satisfied, the participants are eligible to earn shares of common stock overat the end of the performance period, ranging from 0% to 200% of the target award, and dividends accrued thereon.
Time-basedGenerally, time-based restricted stock and restricted stock unit award opportunities have a requisite service period of three years and, with respect to restricted stock awards, participants have the right to receive dividends on the shares during the vesting period. Under restricted stock unit awards, dividends are credited quarterly in the form of additional restricted stock units, which are paid when vested at the end of the three-year service period.
In connection with the acquisition of Conectiv by Pepco in 2002, Conectiv PARS previously issued to Conectiv employees were converted to shares of Pepco Holdings restricted stock. These shares typically vested over periods of 5 to 7 years. In January 2009, all 6,669 of the remaining sharesPARS outstanding fully vested.
In September 2007, retention awards in the form of 9,015 shares of restricted stock were granted to certain PHI executives, with vesting periods of two or three years. In September 2009, 5,409 of these shares vested. In September 2010, all 3,606 of the remaining shares outstanding vested.
188
PEPCO HOLDINGS
Activity for the year
The 20102011 activity for non-vested, time-based restricted stock, restricted stock units and performance-based restricted stock unit awards is summarized below:in the table below. For performance-based restricted stock unit awards, the table reflects awards projected to achieve 100% of targeted performance criteria for the 2010-2012 and 2011-2013 award cycles.
| Number of Shares | Total Number of Shares | Weighted Average Grant Date Fair Value | ||||||||||
Balance at January 1, 2010 | ||||||||||||
Time-based restricted stock | 233,058 | $ | 20.72 | |||||||||
Performance-based restricted stock units | 499,893 | 22.21 | ||||||||||
Other (a) | 3,606 | 27.73 | ||||||||||
Total | 736,557 | |||||||||||
Granted during 2010 | ||||||||||||
Time-based restricted stock | 161,166 | 16.55 | ||||||||||
Performance-based restricted stock units | 322,156 | 20.11 | ||||||||||
Total | 483,322 | |||||||||||
Vested during 2010 | ||||||||||||
Time-based restricted stock | (49,642 | ) | 25.56 | |||||||||
Performance-based restricted stock units | (141,023 | ) | 25.55 | |||||||||
Other (a) | (3,606 | ) | 27.73 | |||||||||
Total | (194,271 | ) | ||||||||||
Forfeited during 2010 | ||||||||||||
Time-based restricted stock | (28,388 | ) | 17.18 | |||||||||
Performance-based restricted stock units | (94,143 | ) | 19.16 | |||||||||
Total | (122,531 | ) | ||||||||||
Balance at December 31, 2010 | ||||||||||||
Time-based restricted stock | 316,194 | 18.15 | ||||||||||
Performance-based restricted stock units | 586,883 | 20.75 | ||||||||||
Other (a) | — | — | ||||||||||
Total | 903,077 | |||||||||||
| Number of Shares | Total Number of Shares | Weighted Average Grant Date Fair Value | ||||||||||
Balance at January 1, 2011 | ||||||||||||
Time-based restricted stock | | 316,194 | | $ | 18.15 | | ||||||
Performance-based restricted stock units | 586,883 | 20.75 | ||||||||||
|
| |||||||||||
Total | 903,077 | |||||||||||
Granted during 2011 | ||||||||||||
Time-based restricted stock units | | 177,895 | | | 18.87 | | ||||||
Performance-based restricted stock units | 354,979 | 19.56 | ||||||||||
|
| |||||||||||
Total | 532,874 | |||||||||||
Vested during 2011 | ||||||||||||
Time-based restricted stock | (63,764 | ) | 23.70 | |||||||||
Time-based restricted stock units | (173 | ) | 18.84 | |||||||||
Performance-based restricted stock units | (144,451 | ) | 25.36 | |||||||||
|
| |||||||||||
Total | (208,388 | ) | ||||||||||
Forfeited during 2011 | ||||||||||||
Time-based restricted stock | | (10,741 | ) | | 17.06 | | ||||||
Time-based restricted stock units | (7,191 | ) | 18.84 | |||||||||
Performance-based restricted stock units | (32,272 | ) | 21.78 | |||||||||
|
| |||||||||||
Total | (50,204 | ) | ||||||||||
Balance at December 31, 2011 | ||||||||||||
Time-based restricted stock | | 241,689 | | | 16.74 | | ||||||
Time-based restricted stock units | 170,531 | 18.87 | ||||||||||
Performance-based restricted stock units | 765,139 | 19.28 | ||||||||||
|
|
|
| |||||||||
Total | 1,177,359 | |||||||||||
|
| |||||||||||
Grants included in the table above reflect 20102011 grants of performance-based restricted stock units and time-based restricted stock.stock units. PHI recognizes compensation expense related to performance-based restricted stock unit awards and time-based restricted stock and restricted stock unit awards based on the fair value of the awards at date of grant. The fair value is based on the market value of PHI common stock at the date the award opportunity is granted. The estimated fair value of the performance-based awards is also a function of PHI’s projected future performance relative to established performance criteria and the resulting payout of shares based on the achieved performance levels. PHI employed a Monte Carlo simulation to forecast PHI’s performance relative to the performance criteria and to estimate the potential payout of shares under the performance-based awards.
189
PEPCO HOLDINGS
The following table provides the weighted average grant date fair value of those awards forgranted during each of the years ended December 31, 2011, 2010 2009 and 2008:2009:
| 2010 | 2009 | 2008 | 2011 | 2010 | 2009 | |||||||||||||||||||
Weighted average grant-date fair value of each performance-based restricted stock unit granted during the year | $ | 20.11 | $ | 17.51 | $ | 25.36 | $ | 19.56 | $ | 20.11 | $ | 17.51 | ||||||||||||
Weighted average grant-date fair value of each award of time-based restricted stock granted during the year | $ | 16.55 | $ | 17.18 | $ | 25.36 | $ | — | $ | 16.55 | $ | 17.18 | ||||||||||||
Weighted average grant-date fair value of each time-based restricted stock unit granted during the year | $ | 18.87 | $ | — | $ | — | ||||||||||||||||||
As of December 31, 2010,2011, there was approximately $7$9 million of unrecognizedfuture compensation cost (net of estimated forfeitures) related to non-vested restricted stock awards and restricted stock unit awards granted under the LTIP.LTIP that PHI expects to recognize the costs over a weighted-average period of approximately two years.
Stock options
Stock options to purchase shares of PHI’s common stock granted under the LTIP must have an exercise price at least equal to the fair market value of the underlying stock on the grant date. Stock options that have been granted under the LTIP generally have become exercisable on a specified vesting date or dates. All stock options have an expiration date of no greater than ten years from the date of grant. No options have been granted under the LTIP since May 1, 2002.
Non-employee directors are entitled, under the terms of the LTIP, to a grant on May 1 of each year of a nonqualified stock option for 1,000 shares of common stock. However, the Board of Directors has determined that these grants will not be made.
Stock option activity for the year ended December 31, 20102011 is summarized below:
| Number of Options | Weighted Average Exercise Price | Weighted Average Remaining Contractual Term (Years) | Aggregate Intrinsic Value | Number of Options | Weighted Average Exercise Price | Weighted Average Remaining Contractual Term (Years) | Aggregate Intrinsic Value | |||||||||||||||||||||||||
Outstanding at January 1, 2010 | 346,504 | $ | 22.09 | 1.51 | ||||||||||||||||||||||||||||
Outstanding at January 1, 2011 | 280,266 | $ | 22.30 | 0.70 | ||||||||||||||||||||||||||||
Options granted | — | — | — | — | — | — | ||||||||||||||||||||||||||
Options exercised | (11,538 | ) | 13.08 | — | (81,918 | ) | 19.03 | — | ||||||||||||||||||||||||
Options forfeited or expired | (54,700 | ) | 22.90 | — | (167,423 | ) | 24.19 | — | ||||||||||||||||||||||||
| ||||||||||||||||||||||||||||||||
Outstanding at December 31, 2010 | 280,266 | 22.30 | 0.70 | — | ||||||||||||||||||||||||||||
Outstanding at December 31, 2011 | 30,925 | 20.75 | 0.03 | $ | — | |||||||||||||||||||||||||||
| ||||||||||||||||||||||||||||||||
Exercisable at December 31, 2010 | 280,266 | 22.30 | (a) | 0.70 | — | |||||||||||||||||||||||||||
Exercisable at December 31, 2011 | 30,925 | 20.75 | (a) | 0.03 | $ | — | ||||||||||||||||||||||||||
| ||||||||||||||||||||||||||||||||
| (a) | The range of exercise prices is $19.03 to |
Total intrinsic value and tax benefits recognized for stock options exercised in 2011, 2010 2009 and 20082009 were immaterial.
190
PEPCO HOLDINGS
Directors’ Deferred Compensation
Under the Pepco Holdings’ Executive and Director Deferred Compensation Plan, Pepco Holdings non-employee directors may elect to defer all or part of their retainer and meeting fees. Deferred retainer or meeting fees, at the election of the director, can be credited with interest at the prime rate or the return on selected investment funds or can be deemed invested in phantom shares of Pepco Holdings common stock on which dividend equivalent accruals are credited when dividends are paid on the common stock.stock (or a combination of these options). All deferrals are settled in cash. The amount deferred by directors for each of the years ended December 31, 2011, 2010 2009 and 20082009 was not material.
PEPCO HOLDINGS
Compensation expense recognized in respect of dividends and the increase in fair value for each of the years ended December 31, 2011, 2010 2009 and 20082009 was not material. The deferred compensation balance under this program was approximately $1 million at December 31, 20102011 and 2009.2010.
Dividend Restrictions
PHI, on a stand-alone basis, generates no operating income of its own. Accordingly, its ability to pay dividends to its shareholders depends on dividends received from its subsidiaries. In addition to their future financial performance, the ability of PHI’s direct and indirect subsidiaries to pay dividends is subject to limits imposed by: (i) state corporate laws, which impose limitations on the funds that can be used to pay dividends and, in the case of ACE, the regulatory requirement that it obtain the prior approval of the NJBPU before dividends can be paid if its equity as a percent of its total capitalization, excluding securitization debt, falls below 30%; (ii) the prior rights of holders of existing and future preferred stock, mortgage bonds and other long-term debt issued by the subsidiaries, and any other restrictions imposed in connection with the incurrence of liabilities; and (iii) certain provisions of ACE’s charter that impose restrictions on payment of common stock dividends for the benefit of preferred stockholders. Pepco, DPL and DPLACE have no shares of preferred stock outstanding.outstanding at December 31, 2011. Currently, the capitalization ratio limitation to which ACE is subject and the restriction in the ACE charter do not limit ACE’s ability to pay common stock dividends. PHI had approximately $1,059$1,072 million and $1,268$1,059 million of retained earnings free of restrictions at December 31, 20102011 and 2009,2010, respectively. These amounts represent the total retained earnings balances at those dates.
For the years ended December 31, Pepco Holdings received dividends from its subsidiaries as follows:
Subsidiary | 2010 | 2009 | 2008 | 2011 | 2010 | 2009 | ||||||||||||||||||
| (millions of dollars) | (millions of dollars) | |||||||||||||||||||||||
Pepco | $ | 115 | $ | — | $ | 89 | $ | 25 | $ | 115 | $ | — | ||||||||||||
DPL | 23 | 28 | 52 | 60 | 23 | 28 | ||||||||||||||||||
ACE | 35 | 64 | 46 | — | 35 | 64 | ||||||||||||||||||
|
|
| ||||||||||||||||||||||
Total | $ | 173 | $ | 92 | $ | 187 | $ | 85 | $ | 173 | $ | 92 | ||||||||||||
|
|
| ||||||||||||||||||||||
191
PEPCO HOLDINGS
Calculations of Earnings per Share of Common Stock
The numerator and denominator for basic and diluted earnings per share of common stock calculations are shown below.
| For the Years Ended December 31, | For the Years Ended December 31 , | |||||||||||||||||||||||
| 2010 | 2009 | 2008 | 2011 | 2010 | 2009 | |||||||||||||||||||
| (millions of dollars, except per share data) | (millions of dollars, except per share data) | |||||||||||||||||||||||
Income (Numerator): | ||||||||||||||||||||||||
Net income from continuing operations | $ | 139 | $ | 223 | $ | 183 | $ | 260 | $ | 139 | $ | 223 | ||||||||||||
Net (loss) income from discontinued operations | (107 | ) | 12 | 117 | (3 | ) | (107 | ) | 12 | |||||||||||||||
|
|
| ||||||||||||||||||||||
Net income | $ | 32 | $ | 235 | $ | 300 | $ | 257 | $ | 32 | $ | 235 | ||||||||||||
|
|
| ||||||||||||||||||||||
Shares (Denominator) (in millions): | ||||||||||||||||||||||||
Weighted average shares outstanding for basic computation: | ||||||||||||||||||||||||
Average shares outstanding | 224 | 221 | 204 | 226 | 224 | 221 | ||||||||||||||||||
Adjustment to shares outstanding | — | — | — | — | — | — | ||||||||||||||||||
|
|
| ||||||||||||||||||||||
Weighted Average Shares Outstanding for Computation of Basic Earnings Per Share of Common Stock | 224 | 221 | 204 | 226 | 224 | 221 | ||||||||||||||||||
Net effect of potentially dilutive shares (a) | — | — | — | — | — | — | ||||||||||||||||||
|
|
| ||||||||||||||||||||||
Weighted Average Shares Outstanding for Computation of Diluted Earnings Per Share of Common Stock | 224 | 221 | 204 | 226 | 224 | 221 | ||||||||||||||||||
|
|
| ||||||||||||||||||||||
Basic and diluted earnings per share of common stock from continuing operations | $ | 0.62 | $ | 1.01 | $ | 0.90 | $ | 1.15 | $ | 0.62 | $ | 1.01 | ||||||||||||
Basic and diluted (loss) earnings per share of common stock from discontinued operations | (0.48 | ) | 0.05 | 0.57 | (0.01 | ) | (0.48 | ) | 0.05 | |||||||||||||||
|
|
| ||||||||||||||||||||||
Basic and diluted earnings per share | $ | 0.14 | $ | 1.06 | $ | 1.47 | $ | 1.14 | $ | 0.14 | $ | 1.06 | ||||||||||||
|
|
| ||||||||||||||||||||||
| (a) | The number of options to purchase shares of common stock that were excluded from the calculation of diluted earnings per share as they are considered to be anti-dilutive were 14,900, 280,266 |
Shareholder Dividend Reinvestment Plan
PHI maintains a Shareholder Dividend Reinvestment Plan (DRP) through which shareholders may reinvest cash dividends. In addition, both existing shareholders and new investors can make purchases of shares of PHI common stock through the investment of not less than $25 each calendar month nor more than $200,000 each calendar year. Shares of common stock purchased through the DRP may be new shares or, at the election of PHI, shares purchased in the open market. Approximately 2 million 2 million and 1 million new shares were issued and sold under the DRP in each of 2011, 2010 2009 and 2008, respectively.2009.
Pepco Holdings Common Stock Reserved and Unissued
The following table presents Pepco Holdings’ common stock reserved and unissued at December 31, 2010:2011:
Name of Plan | Number of Shares | |||
DRP | ||||
Conectiv Incentive Compensation Plan (a) | ||||
Potomac Electric Power Company Long-Term Incentive Plan (a) | 327,059 | |||
Pepco Holdings Long-Term Incentive Plan | ||||
Pepco Holdings Non-Management Directors Compensation Plan | ||||
Pepco Holdings Retirement Savings Plan | ||||
Total | ||||
| (a) | No further awards will be made under this plan. |
192
PEPCO HOLDINGS
(15)DERIVATIVE INSTRUMENTS AND HEDGING ACTIVITIES
Derivatives are used by Pepco Energy Services and the Power Delivery business to hedge commodity price risk, as well as by PHI, from time to time, to hedge interest rate risk.
The retail energy supply business of Pepco Energy Services, employswhich is in the process of being wound down, enters into energy commodity contracts in the form of electricity and natural gas futures, swaps, options and forward contracts to hedge commodity price risk in connection with the purchase of physical natural gas and electricity for deliverydistribution to customers. The primary risk management objective is to manage the spread between retail sales commitments and the cost of supply used to service those commitments to ensure stable cash flows and lock in favorable prices and margins when they become available.
Pepco Energy Services accounts for some of its futures and swap contracts as cash flow hedges of forecasted transactions. CertainServices’ commodity contracts that are not designated for hedge accounting, do not qualify as cash flow hedges of forecasted transactionsfor hedge accounting, or do not meet the requirements for normal purchase and normal sale accounting, are marked-to-marketmarked to market through current earnings. Forward contracts that meet the requirements for normal purchase and normal sale accounting are accounted for usingrecorded on an accrual accounting.basis.
In the Power Delivery, business, DPL uses derivative instruments in the form of forward contracts, futures, swaps and exchange-traded and over-the-counter options primarily to reduce natural gas commodity price volatility and to limit its customers’ exposure to increases in the market price of gas.natural gas, under a hedging program approved by the DPSC. DPL also managesuses these derivatives to manage the commodity price risk associated with its physical natural gas andpurchase contracts. The natural gas purchase contracts qualify as normal purchases, which are not required to be recorded in the financial statements until settled. DPL’s capacity contracts that are not classified as derivatives. All premiums paid and other transaction costs incurred as part of DPL’s natural gas hedging activity, in addition to all gains and losses related to hedging activities, are deferred under FASB guidance on regulated operations (ASC 980) until recovered based on thefrom its customers through a fuel adjustment clause approved by the DPSC.
PHI and its subsidiaries also useuses derivative instruments from time to time to mitigate the effects of fluctuating interest rates on debt incurredissued in connection with the operation of their businesses. In June 2002, PHI entered into several treasury rate lock transactions in anticipation of the issuance of several series of fixed-rate debt commencing in August 2002. Upon issuance of the fixed-rate debtfixed rate-debt in August 2002, the treasury rate locks were terminated at a loss. The loss has been deferred in AOCL and is being recognized in income over the life of the debt issued as interest payments are made. In connection with the July 2010 debt tender offersAs further described in Note (11), “Debt,” $15 million of these pre-tax losses ($9 million after-tax) was reclassified tointo income as a loss on extinguishment of debt during the third quarter of 2010.
The tables below identify the balance sheet location and fair values of derivative instruments as of December 31, 20102011 and 2009:2010:
| As of December 31, 2010 | ||||||||||||||||||||
Balance Sheet Caption | Derivatives Designated as Hedging Instruments | Other Derivative Instruments | Gross Derivative Instruments | Effects of Cash Collateral and Netting | Net Derivative Instruments | |||||||||||||||
| (millions of dollars) | ||||||||||||||||||||
Derivative Assets (current assets) | $ | 40 | $ | 43 | $ | 83 | $ | (38 | ) | $ | 45 | |||||||||
Derivative Assets (non-current assets) | 16 | 3 | 19 | (19 | ) | — | ||||||||||||||
Total Derivative Assets | 56 | 46 | 102 | (57 | ) | 45 | ||||||||||||||
Derivative Liabilities (current liabilities) | (125 | ) | (63 | ) | (188 | ) | 122 | (66 | ) | |||||||||||
Derivative Liabilities (non-current liabilities) | (68 | ) | (10 | ) | (78 | ) | 57 | (21 | ) | |||||||||||
Total Derivative Liabilities | (193 | ) | (73 | ) | (266 | ) | 179 | (87 | ) | |||||||||||
Net Derivative (Liability) Asset | $ | (137 | ) | $ | (27 | ) | $ | (164 | ) | $ | 122 | $ | (42 | ) | ||||||
| As of December 31, 2011 | ||||||||||||||||||||
Balance Sheet Caption | Derivatives Designated as Hedging Instruments(a) | Other Derivative Instruments(b) | Gross Derivative Instruments | Effects of Cash Collateral and Netting | Net Derivative Instruments | |||||||||||||||
| (millions of dollars) | ||||||||||||||||||||
Derivative assets (current assets) | $ | 17 | $ | 6 | $ | 23 | $ | (18 | ) | $ | 5 | |||||||||
Derivative assets (non-current assets) | — | 1 | 1 | (1 | ) | — | ||||||||||||||
|
|
|
|
|
|
|
|
|
| |||||||||||
Total Derivative assets | 17 | 7 | 24 | (19 | ) | 5 | ||||||||||||||
|
|
|
|
|
|
|
|
|
| |||||||||||
Derivative liabilities (current liabilities) | (55 | ) | (48 | ) | (103 | ) | 77 | (26 | ) | |||||||||||
Derivative liabilities (non-current liabilities) | (11 | ) | (10 | ) | (21 | ) | 15 | (6 | ) | |||||||||||
|
|
|
|
|
|
|
|
|
| |||||||||||
Total Derivative liabilities | (66 | ) | (58 | ) | (124 | ) | 92 | (32 | ) | |||||||||||
|
|
|
|
|
|
|
|
|
| |||||||||||
Net Derivative (liability) asset | $ | (49 | ) | $ | (51 | ) | $ | (100 | ) | $ | 73 | $ | (27 | ) | ||||||
|
|
|
|
|
|
|
|
|
| |||||||||||
| (a) | Amounts included in Derivatives Designated as Hedging Instruments primarily consist of derivatives that were designated as cash flow hedges prior to Pepco Energy Services’ election to discontinue cash flow hedge accounting for these derivatives. |
| (b) | Amounts included in Other Derivative Instruments include gains or losses on derivatives that are not accounted for as cash flow hedges subsequent to Pepco Energy Services’ election to discontinue cash flow hedge accounting. |
193
PEPCO HOLDINGS
| As of December 31, 2009 | ||||||||||||||||||||
Balance Sheet Caption | Derivatives Designated as Hedging Instruments | Other Derivative Instruments | Gross Derivative Instruments | Effects of Cash Collateral and Netting | Net Derivative Instruments | |||||||||||||||
| (millions of dollars) | ||||||||||||||||||||
Derivative Assets (current assets) | $ | 100 | $ | 54 | $ | 154 | $ | (132 | ) | $ | 22 | |||||||||
Derivative Assets (non-current assets) | 44 | 21 | 65 | (49 | ) | 16 | ||||||||||||||
Total Derivative Assets | 144 | 75 | 219 | (181 | ) | 38 | ||||||||||||||
Derivative Liabilities (current liabilities) | (234 | ) | (70 | ) | (304 | ) | 237 | (67 | ) | |||||||||||
Derivative Liabilities (non-current liabilities) | (88 | ) | (35 | ) | (123 | ) | 69 | (54 | ) | |||||||||||
Total Derivative Liabilities | (322 | ) | (105 | ) | (427 | ) | 306 | (121 | ) | |||||||||||
Net Derivative (Liability) Asset | $ | (178 | ) | $ | (30 | ) | $ | (208 | ) | $ | 125 | $ | (83 | ) | ||||||
| As of December 31, 2010 | ||||||||||||||||||||
Balance Sheet Caption | Derivatives Designated as Hedging Instruments | Other Derivative Instruments | Gross Derivative Instruments | Effects of Cash Collateral and Netting | Net Derivative Instruments | |||||||||||||||
| (millions of dollars) | ||||||||||||||||||||
Derivative assets (current assets) | $ | 40 | $ | 43 | $ | 83 | $ | (38 | ) | $ | 45 | |||||||||
Derivative assets (non-current assets) | 16 | 3 | 19 | (19 | ) | — | ||||||||||||||
|
|
|
|
|
|
|
|
|
| |||||||||||
Total Derivative assets | 56 | 46 | 102 | (57 | ) | 45 | ||||||||||||||
|
|
|
|
|
|
|
|
|
| |||||||||||
Derivative liabilities (current liabilities) | (125 | ) | (63 | ) | (188 | ) | 122 | (66 | ) | |||||||||||
Derivative liabilities (non-current liabilities) | (68 | ) | (10 | ) | (78 | ) | 57 | (21 | ) | |||||||||||
|
|
|
|
|
|
|
|
|
| |||||||||||
Total Derivative liabilities | (193 | ) | (73 | ) | (266 | ) | 179 | (87 | ) | |||||||||||
|
|
|
|
|
|
|
|
|
| |||||||||||
Net Derivative (liability) asset | $ | (137 | ) | $ | (27 | ) | $ | (164 | ) | $ | 122 | $ | (42 | ) | ||||||
|
|
|
|
|
|
|
|
|
| |||||||||||
Under FASB guidance on the offsetting of balance sheet accounts (ASC 210-20), PHI offsets the fair value amounts recognized for derivative instruments and the fair value amounts recognized for related collateral positions executed with the same counterparty under master netting agreements. The amount of cash collateral that was offset against these derivative positions is as follows:
| December 31, 2010 | December 31, 2009 | |||||||
| (millions of dollars) | ||||||||
Cash collateral pledged to counterparties with the right to reclaim (a) | $ | 122 | $ | 125 | ||||
| December 31, 2011 | December 31, 2010 | |||||||
| (millions of dollars) | ||||||||
Cash collateral pledged to counterparties with the right to reclaim (a) | $ | 73 | $ | 122 | ||||
| (a) | Includes cash deposits on commodity brokerage |
As of December 31, 20102011 and 2009,2010, all PHI cash collateral pledged related to derivative instruments accounted for at fair value was entitled to be offset under master netting agreements.
Derivatives Designated as Hedging Instruments
Cash Flow Hedges
Pepco Energy Services
For energy commodity contracts that are designated and qualify as cash flow hedges, the effective portion of the gain or loss on the derivative is reported as a component of AOCL and is reclassified into income in the same period or periods during which the hedged transactions affect income. Gains and losses on the derivative representing eitherthat are related to hedge ineffectiveness or hedge components excluded from the assessment of effectiveness,forecasted hedged transaction being probable not to occur, are recognized in income. This informationPepco Energy Services has elected to no longer apply cash flow hedge accounting to certain of its electricity derivatives and all of its natural gas derivatives. Amounts included in AOCL for these cash flow hedges as of December 31, 2011 represent net losses on derivatives prior to the election to discontinue cash flow hedge accounting less amounts reclassified into income as the hedged transactions occur or because the hedged transactions were deemed probable not to occur. Gains or losses on these derivatives after the election to discontinue cash flow hedge accounting are recognized in income. The cash flow hedge activity during the years ended December 31, 2011, 2010 2009 and 20082009 is provided in the tables below:
194
PEPCO HOLDINGS
| Years Ended December 31, | ||||||||||||
| 2010 | 2009 | 2008 | ||||||||||
| (millions of dollars) | ||||||||||||
Amount of net pre-tax loss arising during the period included in accumulated other comprehensive loss | $ | (100 | ) | $ | (129 | ) | $ | (210 | ) | |||
Amount of net pre-tax loss (gain) reclassified into income: | ||||||||||||
Effective portion: | ||||||||||||
Fuel and Purchased Energy | 135 | 164 | (8 | ) | ||||||||
Ineffective portion: (a) | ||||||||||||
Revenue | — | 2 | — | |||||||||
Total net pre-tax loss (gain) reclassified into income | 135 | 166 | (8 | ) | ||||||||
Net pre-tax gain (loss) on commodity derivatives included in other comprehensive loss | $ | 35 | $ | 37 | $ | (218 | ) | |||||
| For the Year Ended December 31, | ||||||||||||
| 2011 | 2010 | 2009 | ||||||||||
| (millions of dollars) | ||||||||||||
Amount of net pre-tax loss arising during the period included in accumulated other comprehensive loss | $ | — | $ | (100 | ) | $ | (129 | ) | ||||
|
|
|
|
|
| |||||||
Amount of net pre-tax (gain) loss reclassified into income: | ||||||||||||
Effective portion: | ||||||||||||
Fuel and purchased energy | 80 | 135 | 164 | |||||||||
Ineffective portion: (a) | ||||||||||||
Revenue | 1 | — | 2 | |||||||||
|
|
|
|
|
| |||||||
Total net pre-tax (gain) loss reclassified into income | 81 | 135 | 166 | |||||||||
|
|
|
|
|
| |||||||
Net pre-tax gain (loss) on commodity derivatives included in other comprehensive loss | $ | 81 | $ | 35 | $ | 37 | ||||||
|
|
|
|
|
| |||||||
| (a) | Included in the above table is a loss of |
As of December 31, 20102011 and 2009,2010, Pepco Energy Services had the following types and volumesquantities of outstanding energy commodity contracts employed as cash flow hedges of forecasted purchases and forecasted sales.
| Quantities | Quantities | |||||||||||||||
Commodity | December 31, 2010 | December 31, 2009 | December 31, 2011 | December 31, 2010 | ||||||||||||
Forecasted Purchases Hedges | ||||||||||||||||
Natural gas (One Million British Thermal Units (MMBtu)) | 8,597,106 | 54,477,500 | — | 8,597,106 | ||||||||||||
Electricity (Megawatt hours (MWh)) | 2,677,640 | 9,708,919 | 614,560 | 2,677,640 | ||||||||||||
Electric capacity (MW-Days) | 34,730 | — | — | 34,730 | ||||||||||||
Forecasted Sales Hedges | ||||||||||||||||
Electricity (MWh) | 2,517,200 | 7,322,535 | 614,560 | 2,517,200 | ||||||||||||
Power Delivery
As described above, allAll premiums paid and other transaction costs incurred as part of DPL’s natural gas hedging activity, in addition to all of DPL’s gains and losses related to hedging activities, are deferred under FASB guidance on regulated operations until recovered from customers based on the fuel adjustment clause approved by the DPSC. The following table indicates the amounts deferred as regulatoryamount of the net unrealized derivative losses arising during the period included in Regulatory assets or liabilities and the locationrealized losses recognized in the consolidated statements of income of amounts reclassified to income through the fuel adjustment clause for the years ended December 31, 2011, 2010 and 2009 and 2008:associated with cash flow hedges:
| For the Year Ended December 31, | ||||||||||||
| 2010 | 2009 | 2008 | ||||||||||
| (millions of dollars) | ||||||||||||
Net Gain (Loss) Deferred as a Regulatory Asset or Liability | $ | 5 | $ | 21 | $ | (29 | ) | |||||
Net Loss Reclassified from Regulatory Asset or Liability to Fuel and Purchased Energy Expense | (12 | ) | (39 | ) | (6 | ) | ||||||
| For the Year Ended December 31, | ||||||||||||
| 2011 | 2010 | 2009 | ||||||||||
| (millions of dollars) | ||||||||||||
Net unrealized losses arising during the period included in Regulatory assets | $ | — | $ | (9 | ) | $ | (20 | ) | ||||
Net realized losses recognized in Fuel and purchased energy expense | (5 | ) | (13 | ) | (41 | ) | ||||||
195
PEPCO HOLDINGS
As of December 31, 20102011 and 2009,2010, DPL had the following outstanding commodity forward contracts that were entered into to hedge forecasted transactions:
| Quantities | ||||||||
Commodity | December 31, 2010 | December 31, 2009 | ||||||
Forecasted Purchases Hedges: | ||||||||
Natural Gas (MMBtu) | 1,670,000 | 5,695,000 | ||||||
| Quantities | ||||||||
Commodity | December 31, 2011 | December 31, 2010 | ||||||
Forecasted Purchases Hedges | ||||||||
Natural gas (MMBtu) | — | 1,840,000 | ||||||
Effective October 1, 2011, DPL elected to no longer apply cash flow hedge accounting to its natural gas derivatives. These derivatives will continue to be employed as part of DPL’s natural gas hedging activities under the hedging program approved by the DPSC, and their dedesignation as cash flow hedges has not resulted in a change to the historical financial statement presentation because all of DPL’s gains and losses on these derivatives are recoverable from customers through the fuel adjustment clause approved by the DPSC.
Cash Flow Hedges Included in Accumulated Other Comprehensive Loss
The tables below provide details regarding effective cash flow hedges included in PHI’s consolidated balance sheet as of December 31, 20102011 and 2009.2010. Cash flow hedges are marked to market on the balance sheet with corresponding adjustments to AOCL.AOCL for effective cash flow hedges. As of December 31, 2011, $42 million of the losses in AOCL were associated with derivatives that Pepco Energy Services previously designated as cash flow hedges. Although Pepco Energy Services no longer designates these derivatives as cash flow hedges, gains or losses previously deferred in AOCL prior to the decision to discontinue cash flow hedge accounting will remain in AOCL until the hedged forecasted transaction occurs unless it is deemed probable that the hedged forecasted transaction will not occur. The data in the following tables indicate the cumulative net loss after-tax related to effective cash flow hedges by contract type included in AOCL, the portion of AOCL expected to be reclassified to income during the next 12 months, and the maximum hedge or deferral term:
| As of December 31, 2010 | ||||||||||||||||||||||||
Contracts | Accumulated Other Comprehensive Loss After-tax (a) | Portion Expected to be Reclassified to Income during the Next 12 Months | Maximum Term | As of December 31, 2011 | Maximum Term | |||||||||||||||||||
Contracts | Accumulated Other Comprehensive Loss After-tax | Portion Expected to be Reclassified to Income during the Next 12 Months | ||||||||||||||||||||||
| (millions of dollars) | (millions of dollars) | |||||||||||||||||||||||
Energy Commodity (b) | $ | 78 | $ | 48 | 41 months | |||||||||||||||||||
Interest Rate | 11 | 1 | 260 months | |||||||||||||||||||||
Energy commodity (a) | $ | 29 | $ | 23 | 29 months | |||||||||||||||||||
Interest rate | 10 | 1 | 248 months | |||||||||||||||||||||
|
| |||||||||||||||||||||||
Total | $ | 89 | $ | 49 | $ | 39 | $ | 24 | ||||||||||||||||
|
| |||||||||||||||||||||||
| (a) |
| The unrealized derivative losses recorded in AOCL |
Contracts | As of December 31, 2009 | Maximum Term | As of December 31, 2010 | Maximum Term | ||||||||||||||||||||
| Accumulated Other Comprehensive Loss After-tax (a) | Portion Expected to be Reclassified to Income during the Next 12 Months | Accumulated Other Comprehensive Loss After-tax | Portion Expected to be Reclassified to Income during the Next 12 Months | |||||||||||||||||||||
| (millions of dollars) | (millions of dollars) | |||||||||||||||||||||||
Energy Commodity (b) | $ | 99 | $ | 58 | 53 months | |||||||||||||||||||
Interest Rate | 22 | 3 | 272 months | |||||||||||||||||||||
Energy commodity (a) | $ | 78 | $ | 48 | 41 months | |||||||||||||||||||
Interest rate | 11 | 1 | 260 months | |||||||||||||||||||||
| �� |
|
| ||||||||||||||||||||||
Total | $ | 121 | $ | 61 | $ | 89 | $ | 49 | ||||||||||||||||
|
| |||||||||||||||||||||||
| (a) |
| The unrealized derivative losses recorded in AOCL |
196
PEPCO HOLDINGS
Other Derivative Activity
Pepco Energy Services
Pepco Energy Services holds certain derivatives that doare not qualifyin hedge accounting relationships nor are they designated as hedges. Under FASB guidance on derivatives and hedging, thesenormal purchases or normal sales. These derivatives are recorded at fair value on the balance sheet with changes in fair value recorded through income.
For the years ended December 31, 2011, 2010 2009 and 2008,2009, the amount of the derivative gain (loss) for Pepco Energy Services recognized in income as part of revenue is provided in the table below:
| For the Year Ended December 31, 2010 | For the Year Ended December 31, 2009 | For the Year Ended December 31, 2008 | ||||||||||||||||||||||||||||||||||
| Revenue | Fuel and Purchased Energy Expense | Total | Revenue | Fuel and Purchased Energy Expense | Total | Revenue | Fuel and Purchased Energy Expense | Total | ||||||||||||||||||||||||||||
| (millions of dollars) | ||||||||||||||||||||||||||||||||||||
Realized mark-to-market gains (losses) | $ | 2 | $ | — | $ | 2 | $ | (2 | ) | $ | — | $ | (2 | ) | $ | 1 | $ | — | $ | 1 | ||||||||||||||||
Unrealized mark-to-market (losses) gains | (3 | ) | — | (3 | ) | (2 | ) | — | (2 | ) | (2 | ) | — | (2 | ) | |||||||||||||||||||||
Total net mark-to-market (losses) gains | $ | (1 | ) | $ | — | $ | (1 | ) | $ | (4 | ) | $ | — | $ | (4 | ) | $ | (1 | ) | $ | — | $ | (1 | ) | ||||||||||||
| For the Year Ended December 31, | ||||||||||||
| 2011 | 2010 | 2009 | ||||||||||
| (millions of dollars) | ||||||||||||
Realized gains (losses) | $ | — | $ | 2 | $ | (2 | ) | |||||
Unrealized mark-to-market losses | (30 | ) | (3 | ) | (2 | ) | ||||||
|
|
|
|
|
| |||||||
Total net losses | $ | (30 | ) | $ | (1 | ) | $ | (4 | ) | |||
|
|
|
|
|
| |||||||
As of December 31, 20102011 and 2009,2010, Pepco Energy Services had the following net outstanding commodity forward contract volumesquantities and net position on derivatives that did not qualify for hedge accounting:
| December 31, 2010 | December 31, 2009 | December 31, 2011 | December 31, 2010 | |||||||||||||||||||||||||||||
Commodity | Quantity | Net Position | Quantity | Net Position | Quantity | Net Position | Quantity | Net Position | ||||||||||||||||||||||||
Financial transmission rights (MWh) | 381,215 | Long | 532,556 | Long | 267,480 | Long | 381,215 | Long | ||||||||||||||||||||||||
Electric Capacity (MW-Days) | 2,265 | Short | — | — | ||||||||||||||||||||||||||||
Electric capacity (MW-Days) | 12,920 | Long | 2,265 | Long | ||||||||||||||||||||||||||||
Electricity (MWh) | 1,455,800 | Short | — | — | 788,280 | Long | 1,455,800 | Long | ||||||||||||||||||||||||
Natural gas (MMBtu) | 45,889,486 | Short | — | — | 24,550,257 | Long | 45,889,486 | Long | ||||||||||||||||||||||||
Power Delivery
DPL holds certain derivatives that doare not qualifyin hedge accounting relationships nor are they designated as hedges.normal purchases or normal sales. These derivatives are recorded at fair value on the consolidated balance sheetsheets with the gain or loss for the change in fair value recorded in income. In accordance with FASB guidance on regulated operations, offsetting regulatory assetsliabilities or regulatory liabilitiesassets are recorded on the balance sheetConsolidated Balance Sheets and the recognition of the derivative gain or recovery of the loss is deferred because of the DPSCDPSC-approved fuel adjustment clause. For the yearsyear ended December 31, 2011, 2010 and 2009, the net unrealized derivative losses arising during the period included in Regulatory assets and 2008, the amount of the derivative gain (loss)net realized losses recognized in the consolidated statements of income isare provided in the table below by line item:below:
| For the Year Ended December 31, | ||||||||||||
| 2010 | 2009 | 2008 | ||||||||||
| (millions of dollars) | ||||||||||||
Gain (Loss) Deferred as a Regulatory Asset or Liability | $ | 6 | $ | (8 | ) | $ | (13 | ) | ||||
Loss Reclassified from Regulatory Asset or Liability to Fuel and Purchased Energy Expense | (26 | ) | (11 | ) | (1 | ) | ||||||
| For the Year Ended December 31, | ||||||||||||
| 2011 | 2010 | 2009 | ||||||||||
| (millions of dollars) | ||||||||||||
Net unrealized losses arising during the period included in Regulatory assets | $ | (13 | ) | $ | (20 | ) | $ | (18 | ) | |||
Net realized losses recognized in Fuel and purchased energy expense | (22 | ) | (26 | ) | (11 | ) | ||||||
197
PEPCO HOLDINGS
As of December 31, 20102011 and 2009,2010, DPL had the following net outstanding natural gas commodity forward contracts that did not qualify for hedge accounting:
| December 31, 2010 | December 31, 2009 | December 31, 2011 | December 31, 2010 | |||||||||||||||||||||||||||||
Commodity | Quantity | Net Position | Quantity | Net Position | Quantity | Net Position | Quantity | Net Position | ||||||||||||||||||||||||
Natural Gas (MMBtu) | 7,827,635 | Long | 10,442,546 | Long | ||||||||||||||||||||||||||||
Natural gas (MMBtu) | 6,161,200 | Long | 8,236,500 | Long | ||||||||||||||||||||||||||||
Contingent Credit Risk Features
The primary contracts used by Pepco Energy Services and Power Delivery segments for derivative transactions are entered into under the International Swaps and Derivatives Association Master Agreement (ISDA) or similar agreements that closely mirror the principal credit provisions of the ISDA. The ISDAs include a Credit Support Annex (CSA) that governs the mutual posting and administration of collateral security. The failure of a party to comply with an obligation under the CSA, including an obligation to transfer collateral security when due or the failure to maintain any required credit support, constitutes an event of default under the ISDA for which the other party may declare an early termination and liquidation of all transactions entered into under the ISDA, including foreclosure against any collateral security. In addition, some of the ISDAs have cross default provisions under which a default by a party under another commodity or derivative contract, or the breach by a party of another borrowing obligation in excess of a specified threshold, is a breach under the ISDA.
The collateral requirements underUnder the ISDA or similar agreements, generally work as follows. Thethe parties establish a dollar threshold of unsecured credit for each party in excess of which the party would be required to post collateral to secure its obligations to the other party. The amount of the unsecured credit threshold varies according to the senior, unsecured debt rating of the respective parties or that of a guarantor of the party’s obligations. The fair values of all transactions between the parties are netted under the master netting provisions. Transactions may include derivatives accounted for on-balance sheet as well as those designated as normal purchases and normal sales that are accounted for off-balance sheet. If the aggregate fair value of the transactions in a net loss position exceeds the unsecured credit threshold, then collateral is required to be posted in an amount equal to the amount by which the unsecured credit threshold is exceeded. The obligations of Pepco Energy Services are usually guaranteed by PHI. The obligations of DPL are stand-alone obligations without the guaranty of PHI. If PHI’s or DPL’s credit rating were to fall below “investment grade,” the unsecured credit threshold would typically be set at zero and collateral would be required for the entire net loss position. Exchange-traded contracts are required to be fully collateralized without regard to the credit rating of the holder.
The gross fair value of PHI’s derivative liabilities, excluding the impact of offsetting transactions or collateral under master netting agreements, with credit risk-related contingent features on December 31, 2011 and 2010, was $54 million and 2009 was $156 million, and $303 million, respectively.respectively, before giving effect to the impact of a credit rating downgrade that would increase these amounts or offsetting transactions that are encompassed within master netting agreements that would alter these amounts. As of those dates,December 31, 2011, PHI had posted cash collateral of zero and $6$1 million respectively, in the normal course of business against the gross derivative liability resulting in a net liability of $156 million and $297 million, respectively, before giving effect to offsetting transactions that are encompassed within master netting agreements that would reduce this amount.$53 million. As of December 31, 2010, PHI had not posted any cash collateral against the gross derivative liability. PHI’s net settlement amount in the event of a downgrade of PHIPHI’s and DPLDPL’s senior unsecured debt rating to below “investment grade”investment grade as of December 31, 20102011 and 2009,2010, would have been approximately $176$124 million and $183$182 million, respectively, after taking into consideration the master netting agreements. The offsetting transactions or collateral that would reduce PHI’s obligation to the net settlement amount include derivativesAt December 31, 2011 and 2010, normal purchase and normal sale contracts in a gainloss position as well as letters of credit already posted as collateral.increased PHI’s obligation.
PHI’s primary sources for posting cash collateral or letters of credit are its credit facilities. At December 31, 20102011 and 2009,2010, the aggregate amount of cash plus borrowing capacity under the primary credit facilities available to meet the future liquidity needs of PHI and its subsidiaries totaled $1.2$1 billion and $1.4$1.2 billion, respectively, of which $728$283 million and $820$728 million, respectively, was available to Pepco Energy Services.
198
PEPCO HOLDINGS
(16)FAIR VALUE DISCLOSURES
Financial Instruments Measured at Fair Value of Assets and Liabilities Excluding Issued Debt and Equity Instrumentson a Recurring Basis
PHI has adoptedapplies FASB guidance on fair value measurement and disclosures (ASC 820) whichthat established a framework for measuring fair value and expanded disclosures about fair value measurements. As defined in the guidance, fair value is the price that would be received to sell an asset or paid to transfer a liability in an orderly transaction between market participants at the measurement date (exit price). PHI utilizes market data or assumptions that market participants would use in pricing the asset or liability, including assumptions about risk and the risks inherent in the inputs to the valuation technique. These inputs can be readily observable, market corroborated or generally unobservable. Accordingly, PHI utilizes valuation techniques that maximize the use of observable inputs and minimize the use of unobservable inputs. The guidance establishes a fair value hierarchy that prioritizes the inputs used to measure fair value. The hierarchy gives the highest priority to unadjusted quoted prices in active markets for identical assets or liabilities (level 1) and the lowest priority to unobservable inputs (level 3). PHI classifies its fair value balances in the fair value hierarchy based on the observability of the inputs used in the fair value calculation as follows:
Level 1 – Quoted prices are available in active markets for identical assets or liabilities as of the reporting date. Active markets are those in which transactions for the asset or liability occur in sufficient frequency and volume to provide pricing information on an ongoing basis, such as the New York Mercantile Exchange (NYMEX).
Level 2 – Pricing inputs are other than quoted prices in active markets included in level 1, which are either directly or indirectly observable as of the reporting date. Level 2 includes those financial instruments that are valued using broker quotes in liquid markets and other observable data. Level 2 also includes those financial instruments that are valued using internally developed methodologies that have been corroborated by observable market data through correlation or by other means. Significant assumptions are observable in the marketplace throughout the full term of the instrument and can be derived from observable data or are supported by observable levels at which transactions are executed in the marketplace.
The LevelPHI’s level 2 derivative instruments primarily consist of electricity derivatives at December 31, 2010.2011. Level 2 power swapsswap values are priced atprovided by a pricing service that uses liquid trading hub prices or valued using the liquid hub prices plus a congestion adder that is calculated using historical regression analysis.to estimate the fair value at zonal locations within trading hubs.
Executive deferred compensation plan assets consist of life insurance policies that are categorized as level 2 assets because they are priced based on the assets underlying the policies. The underlying assets of these life insurance policies, which consist of short-term cash equivalents and fixed income securities that are priced using observable market data.data and can be liquidated for the value of the underlying assets as of December 31, 2011. The level 2 liability associated with the life insurance policies represents a deferred compensation obligation, the value of which is tracked via underlying insurance sub-accounts. The sub-accounts are designed to mirror existing mutual funds and money market funds that are observable and actively traded.
Level 3 – Pricing inputs include significant inputs that are generally less observable than those from objective sources. Level 3 includes those financial instruments that are valued using models or other valuation methodologies.
Derivative instruments categorized as level 3 include natural gas options purchased by DPL as part of a natural gas hedging program approved by the DPSC. Some non-standard assumptions are used in their forwardDPSC and natural gas physical basis contracts held by Pepco Energy Services. The valuation to adjust for the pricing; otherwise, most of the options follow NYMEX valuation. A few of the options have no significant NYMEX components and have to be priced usingis based, in part, on internal volatility assumptions.assumptions extracted from historical NYMEX prices over a certain period of time. The physical basis contracts are valued using liquid hub prices plus a congestion adder that is internally derived from historical data and experience.
199
PEPCO HOLDINGS
Executive deferred compensation plan assets and liabilities that are classified as level 3 include certain life insurance policies that are valued using the cash surrender value of the policies, net of loans against those policies, which does not represent a quoted price in an active market.
The following tables set forth, by level within the fair value hierarchy, PHI’s financial assets and liabilities (excluding Conectiv Energy assets and liabilities held for sale) that were accounted for at fair value on a recurring basis as of December 31, 20102011 and 2009.2010. As required by the guidance, financial assets and liabilities are classified in their entirety based on the lowest level of input that is significant to the fair value measurement. PHI’s assessment of the significance of a particular input to the fair value measurement requires the exercise of judgment, and may affect the valuation of fair value assets and liabilities and their placement within the fair value hierarchy levels.
| Fair Value Measurements at December 31, 2010 | ||||||||||||||||
Description | Total | Quoted Prices in Active Markets for Identical Instruments (Level 1) (a) | Significant Other Observable Inputs (Level 2) (a) | Significant Unobservable Inputs (Level 3) | ||||||||||||
| (millions of dollars) | ||||||||||||||||
ASSETS | ||||||||||||||||
Derivative instruments (b) | ||||||||||||||||
Electricity (c) | $ | 22 | $ | — | $ | 22 | $ | — | ||||||||
Cash equivalents | ||||||||||||||||
Treasury Fund | 17 | 17 | — | — | ||||||||||||
Executive deferred compensation plan assets | ||||||||||||||||
Money Market Funds | 9 | 9 | — | — | ||||||||||||
Life Insurance Contracts | 66 | — | 47 | 19 | ||||||||||||
| $ | 114 | $ | 26 | $ | 69 | $ | 19 | |||||||||
LIABILITIES | ||||||||||||||||
Derivative instruments (b) | ||||||||||||||||
Electricity (c) | $ | 88 | $ | — | $ | 88 | $ | — | ||||||||
Natural Gas (d) | 98 | 75 | — | 23 | ||||||||||||
Executive deferred compensation plan liabilities | ||||||||||||||||
Life Insurance Contracts | 30 | — | 30 | — | ||||||||||||
| $ | 216 | $ | 75 | $ | 118 | $ | 23 | |||||||||
| Fair Value Measurements at December 31, 2011 | ||||||||||||||||
Description | Total | Quoted Prices in Active Markets for Identical Instruments (Level 1) (a) | Significant Other Observable Inputs (Level 2) (a) | Significant Unobservable Inputs (Level 3) | ||||||||||||
| (millions of dollars) | ||||||||||||||||
ASSETS | ||||||||||||||||
Derivative instruments (b) | ||||||||||||||||
Electricity (c) | $ | — | $ | — | $ | — | $ | — | ||||||||
Cash equivalents | ||||||||||||||||
Treasury Fund | 114 | 114 | — | — | ||||||||||||
Executive deferred compensation plan assets | ||||||||||||||||
Money Market Funds | 18 | 18 | — | — | ||||||||||||
Life Insurance Contracts | 60 | — | 43 | 17 | ||||||||||||
|
|
|
|
|
|
|
| |||||||||
| $ | 192 | $ | 132 | $ | 43 | $ | 17 | |||||||||
|
|
|
|
|
|
|
| |||||||||
LIABILITIES | ||||||||||||||||
Derivative instruments (b) | ||||||||||||||||
Electricity (c) | $ | 32 | $ | — | $ | 32 | $ | — | ||||||||
Natural Gas (d) | 67 | 50 | — | 17 | ||||||||||||
Capacity | 1 | — | 1 | — | ||||||||||||
Executive deferred compensation plan liabilities | ||||||||||||||||
Life Insurance Contracts | 28 | — | 28 | — | ||||||||||||
|
|
|
|
|
|
|
| |||||||||
| $ | 128 | $ | 50 | $ | 61 | $ | 17 | |||||||||
|
|
|
|
|
|
|
| |||||||||
| (a) | There were no significant transfers of instruments between level 1 and level 2 valuation categories. |
| (b) | The fair value of derivative assets and liabilities reflect netting by counterparty before the impact of collateral. |
| (c) | Represents wholesale electricity futures and swaps that are used mainly as part of Pepco Energy |
| (d) | Level 1 instruments represent wholesale gas futures and swaps that are used mainly as part of Pepco Energy |
200
PEPCO HOLDINGS
| Fair Value Measurements at December 31, 2009 | ||||||||||||||||
Description | Total | Quoted Prices in Active Markets for Identical Instruments (Level 1) | Significant Other Observable Inputs (Level 2) | Significant Unobservable Inputs (Level 3) | ||||||||||||
| (millions of dollars) | ||||||||||||||||
ASSETS | ||||||||||||||||
Derivative instruments (a) | ||||||||||||||||
Electricity (b) | $ | 21 | $ | — | $ | 21 | $ | — | ||||||||
Cash equivalents | ||||||||||||||||
Treasury Fund | 36 | 36 | — | — | ||||||||||||
Other | 1 | 1 | — | — | ||||||||||||
Executive deferred compensation plan assets | ||||||||||||||||
Money Market Funds | 13 | 13 | — | — | ||||||||||||
Life Insurance Contracts | 62 | — | 43 | 19 | ||||||||||||
| $ | 133 | $ | 50 | $ | 64 | $ | 19 | |||||||||
LIABILITIES | ||||||||||||||||
Derivative instruments (a) | ||||||||||||||||
Electricity (b) | $ | 116 | $ | — | $ | 116 | $ | — | ||||||||
Natural Gas (c) | 113 | 84 | — | 29 | ||||||||||||
Executive deferred compensation plan liabilities | ||||||||||||||||
Life Insurance Contracts | 32 | — | 32 | — | ||||||||||||
| $ | 261 | $ | 84 | $ | 148 | $ | 29 | |||||||||
| Fair Value Measurements at December 31, 2010 | ||||||||||||||||
Description | Total | Quoted Prices in Active Markets for Identical Instruments (Level 1)(a) | Significant Other Observable Inputs (Level 2)(a) | Significant Unobservable Inputs (Level 3) | ||||||||||||
| (millions of dollars) | ||||||||||||||||
ASSETS | ||||||||||||||||
Derivative instruments (b) | ||||||||||||||||
Electricity (c) | $ | 22 | $ | — | $ | 22 | $ | — | ||||||||
Cash equivalents | ||||||||||||||||
Treasury Fund | 17 | 17 | — | — | ||||||||||||
Executive deferred compensation plan assets | ||||||||||||||||
Money Market Funds | 9 | 9 | — | — | ||||||||||||
Life Insurance Contracts | 66 |
| — |
| 47 | 19 | ||||||||||
|
|
|
|
|
|
|
| |||||||||
| $ | 114 | $ | 26 | $ | 69 | $ | 19 | |||||||||
|
|
|
|
|
|
|
| |||||||||
LIABILITIES | ||||||||||||||||
Derivative instruments (b) | ||||||||||||||||
Electricity (c) | $ | 88 | $ | — | $ | 88 | $ | — | ||||||||
Natural Gas (d) | 98 | 75 | — | 23 | ||||||||||||
Executive deferred compensation plan liabilities | ||||||||||||||||
Life Insurance Contracts | 30 | — | �� | 30 | — | |||||||||||
|
|
|
|
|
|
|
| |||||||||
| $ | 216 | $ | 75 | $ | 118 | $ | 23 | |||||||||
|
|
|
|
|
|
|
| |||||||||
| (a) | There were no significant transfers of instruments between level 1 and level 2 categories. |
| (b) | The fair value of derivative assets and liabilities reflect netting by counterparty before the impact of collateral. |
| Represents wholesale electricity futures and swaps that are used mainly as part of Pepco Energy |
| Level 1 instruments represent wholesale gas futures and swaps that are used mainly as part of Pepco Energy |
Reconciliations of the beginning and ending balances of PHI’s fair value measurements using significant unobservable inputs (Level 3) for the years ended December 31, 20102011 and 20092010 are shown below:
| Year Ended December 31, 2010 | Year Ended December 31, 2011 | |||||||||||||||
| Natural Gas | Life Insurance Contracts | Natural Gas | Life Insurance Contracts | |||||||||||||
| (millions of dollars) | (millions of dollars) | |||||||||||||||
Beginning balance as of January 1, 2010 | $ | (29 | ) | $ | 19 | |||||||||||
Total gains or (losses) (realized and unrealized): | ||||||||||||||||
Beginning balance as of January 1, 2011 | $ | (23 | ) | $ | 19 | |||||||||||
Total gains (losses) (realized and unrealized): | ||||||||||||||||
Included in income | — | 3 | (4 | ) | 6 | |||||||||||
Included in accumulated other comprehensive loss | — | — | — | — | ||||||||||||
Included in regulatory liabilities | (16 | ) | — | (10 | ) | — | ||||||||||
Purchases and issuances | — | (3 | ) | |||||||||||||
Purchases | — | — | ||||||||||||||
Issuances | — | (3 | ) | |||||||||||||
Settlements | 22 | — | 19 | (5 | ) | |||||||||||
Transfers in (out) of Level 3 | — | — | 1 | — | ||||||||||||
|
| |||||||||||||||
Ending balance as of December 31, 2010 | $ | (23 | ) | $ | 19 | |||||||||||
Ending balance as of December 31, 2011 | $ | (17 | ) | $ | 17 | |||||||||||
|
| |||||||||||||||
201
PEPCO HOLDINGS
| Year Ended December 31, 2009 | ||||||||
| Natural Gas | Life Insurance Contracts | |||||||
| (millions of dollars) | ||||||||
Beginning balance as of January 1, 2009 | $ | (24 | ) | $ | 18 | |||
Total gains or (losses) (realized and unrealized): | ||||||||
Included in income | — | 4 | ||||||
Included in accumulated other comprehensive loss | — | — | ||||||
Included in regulatory liabilities | (18 | ) | — | |||||
Purchases and issuances | — | (3 | ) | |||||
Settlements | 13 | — | ||||||
Transfers in (out) of Level 3 | — | — | ||||||
Ending balance as of December 31, 2009 | $ | (29 | ) | $ | 19 | |||
| Year Ended December 31, 2010 | ||||||||
| Natural Gas | Life Insurance Contracts | |||||||
| (millions of dollars) | ||||||||
Beginning balance as of January 1, 2010 | $ | (29 | ) | $ | 19 | |||
Total gains (losses) (realized and unrealized): | ||||||||
Included in income | — | 3 | ||||||
Included in accumulated other comprehensive loss | — | — | ||||||
Included in regulatory liabilities | (20 | ) | — | |||||
Purchases | — | — | ||||||
Issuances | — | (3 | ) | |||||
Settlements | 26 | — | ||||||
Transfers in (out) of Level 3 | — | — | ||||||
|
|
|
| |||||
Ending balance as of December 31, 2010 | $ | (23 | ) | $ | 19 | |||
|
|
|
| |||||
The breakdown of realized and unrealized gains or (losses) on level 3 instruments included in income as a component of Other income or Other operation and maintenance expense for the periods below were as follows:
| Year Ended December 31, | Year Ended December 31, | |||||||||||||||
| 2010 | 2009 | 2011 | 2010 | |||||||||||||
| (millions of dollars) | (millions of dollars) | |||||||||||||||
Total gains included in income for the period | $ | 3 | $ | 4 | ||||||||||||
Total net gains included in income for the period | $ | 2 | $ | 3 | ||||||||||||
|
| |||||||||||||||
Change in unrealized gains relating to assets still held at reporting date | $ | 3 | $ | 4 | $ | 2 | $ | 3 | ||||||||
|
| |||||||||||||||
Fair Value of Debt and EquityOther Financial Instruments
The estimated fair values of PHI’s issued debt and equity instruments at December 31, 20102011 and 20092010 are shown below:
| December 31, 2010 | December 31, 2009 | December 31, 2011 | December 31, 2010 | |||||||||||||||||||||||||||||
| (millions of dollars) | (millions of dollars) | |||||||||||||||||||||||||||||||
| Carrying Amount | Fair Value | Carrying Amount | Fair Value | Carrying Amount | Fair Value | Carrying Amount | Fair Value | |||||||||||||||||||||||||
Long-Term Debt | $ | 3,665 | $ | 4,045 | $ | 4,969 | $ | 5,350 | $ | 3,867 | $ | 4,577 | $ | 3,665 | $ | 4,045 | ||||||||||||||||
Transition Bonds issued by ACE Funding | 367 | 406 | 402 | 427 | 332 | 380 | 367 | 406 | ||||||||||||||||||||||||
Long-Term Project Funding | 19 | 19 | 20 | 20 | 15 | 15 | 19 | 19 | ||||||||||||||||||||||||
Redeemable Serial Preferred Stock | 6 | 5 | 6 | 4 | — | — | 6 | 5 | ||||||||||||||||||||||||
202
PEPCO HOLDINGS
The fair value of Long-Term Debt issued by PHI and its utility subsidiaries was based on actual trade prices as of December 31, 2010 and 2009. Where trade prices were not available,(where available), bid prices obtained from brokers and validated by PHI, or a discounted cash flow model were used to estimate fair value. model. Prices obtained from brokers include observable market data on the target security or historical correlation and direct observation methodologies of similar debt securities.
The fair valuesvalue of Transition Bonds issued by ACE Funding, including amounts due within one year, were derived based on bidactual trade prices as of December 31, 2011. Bid prices obtained from brokers and validated by PHI were used at December 31, 2010, because actual trade prices were not available.
The fair value of the Redeemable Serial Preferred Stock, was derived based on quoted market prices.
The carrying amounts of all other financial instruments in the accompanying financial statements approximate fair value.
(17) COMMITMENTS AND CONTINGENCIES
Regulatory and Other Matters
Proceeds from Settlement of Mirant Bankruptcy Claims
In 2007, Pepco received proceeds from the settlement of its Mirant Corporation (Mirant) bankruptcy claims relating to the Panda PPA. In September 2008, Pepco transferred the Panda PPA to an unaffiliated third party, along with a payment to the third party of a portion of the settlement proceeds. In March 2009, the DCPSC approved an allocation between Pepco and its District of Columbia customers of the District of Columbia portion of the Mirant bankruptcy settlement proceeds remaining after the transfer of the Panda PPA. As a result, Pepco recorded a pre-tax gain of $14 million in the first quarter of 2009 reflecting the District of Columbia proceeds retained by Pepco. In July 2009, the MPSC approved an allocation between Pepco and its Maryland customers of the Maryland portion of the Mirant bankruptcy settlement proceeds remaining after the transfer of the Panda PPA. As a result, Pepco recorded a pre-tax gain of $26 million in the third quarter of 2009 reflecting the Maryland proceeds retained by Pepco.
District of Columbia Divestiture Case
In June 2000, the DCPSC approved a divestiture settlement under which Pepco is required to share with its District of Columbia customers the net proceeds realized by Pepco from the sale of its generation-related assets in 2000. This approval left unresolved issues of (i) whether Pepco should be required to share with customers the excess deferred income taxes (EDIT) and accumulated deferred investment tax credits (ADITC) associated with the sold assets and, if so, whether such sharing would violate the normalization provisions of the Internal Revenue Code and its implementing regulations and (ii) whether Pepco was entitled to deduct certain costs in determining the amount of proceeds to be shared.
On May 18, 2010, the DCPSC issued an order addressing all of the remaining issues related to the sharing of the proceeds of Pepco’s divestiture of its generating assets. In the order, the DCPSC ruled that Pepco is not required to share EDIT and ADITC with customers. However, the order also disallowed certain items that Pepco had included in the costs deducted from the proceeds of the sale of the generation assets. The disallowance of these costs, together with interest on the disallowed amount, increases the aggregate amount Pepco is required to distribute to customers, pursuant to the sharing formula, by approximately $11 million. On June 17, 2010, Pepco filed an application for reconsideration of the DCPSC’s order, contesting (i) approximately $5 million of the total of $6 million in disallowances and (ii) approximately $4 million of the $5 million in interest to be credited to customers (reflecting a difference in the period of time over which interest was calculated as well as the balance to
PEPCO HOLDINGS
which interest would be applied). On July 16, 2010, the DCPSC denied Pepco’s application for reconsideration. On September 7, 2010, Pepco filed an appeal of the DCPSC’s decision with the District of Columbia Court of Appeals. PHI recognized an expense of $11 million for the year ended December 31, 2010 corresponding to the disallowed items. The appeal is still pending.
Maryland Public Service Commission Reliability Investigation
In August 2010, following the major storm events that occurred in July and August 2010, the MPSC initiated a proceeding for the purpose of investigating the reliability of the Pepco distribution system and the quality of distribution service Pepco is providing its customers. On February 10, 2011, the MPSC issued a notice expanding the scope of issues on which it requested testimony to include suggested remedies for the MPSC to consider imposing if the MPSC finds that Pepco has failed to meet its public service obligations. The possible remedies identified in the notice were the imposition of civil penalties, changes in the manner of Pepco’s operations, modification of Pepco’s service territory and revocation of Pepco’s authority to exercise its public utility franchise. The MPSC has retained an independent consultant to review and make recommendations regarding the reliability of Pepco’s distribution system and the quality of its service. The independent consultant’s report is due March 4, 2011. The MPSC has scheduled hearings on this matter to occur in mid-June 2011. While Pepco intends to cooperate fully with the MPSC in its efforts to ensure that the electric service provided by Pepco to its Maryland customers is reliable, it intends to oppose vigorously any effort of the MPSC to impose any sanctions of the types specified in the February 10, 2011 notice. Although Pepco believes that it has a strong factual and legal basis to oppose such sanctions, it cannot predict the outcome of this proceeding.
Rate Proceedings
Over the last several years, PHI’s utility subsidiaries have proposed the adoption of mechanisms to decouple retail distribution revenue from the amount of power delivered to retail customers. To date:
A BSA has been approved and implemented for both Pepco and DPL electric service in Maryland and for Pepco electric service in the District of Columbia. The MPSC has initiated a proceeding to review how the BSA operates in Maryland to recover revenues lost as a result of major storm outages (as discussed below).
A modified fixed variable rate design (MFVRD) has been approved in concept for DPL electric service in Delaware, but has been deferred by the DPSC as described below.
A MFVRD has been approved in concept for DPL natural gas service in Delaware, but DPL anticipates that it will be deferred by the DPSC consistent with its treatment in the electric base rate case.
A BSA is pending for ACE in New Jersey.
Under the BSA, customer distribution rates are subject to adjustment (through a credit or surcharge mechanism), depending on whether actual distribution revenue per customer exceeds or falls short of the revenue-per-customer amount approved by the applicable public service commission. The BSA increases rates if actual distribution revenues fall below the approved level and decreases rates if actual distribution revenues are above the approved level. The result is that, over time, the utility collects its authorized revenues for distribution service. As a consequence, a BSA “decouples” distribution revenue from unit sales consumption and ties the growth in distribution revenues to the growth in the number of customers. Some advantages of the BSA are that it (i) eliminates revenue fluctuations due to weather and changes in customer usage patterns and, therefore, provides for more predictable distribution revenues that are better aligned with costs, (ii) provides for more reliable fixed-cost recovery, (iii) tends to stabilize customers’ delivery bills, and (iv) removes any disincentives for the regulated utilities to promote energy efficiency
PEPCO HOLDINGS
programs for their customers, because it breaks the link between overall sales volumes and distribution revenues. The MFVRD approved in concept in Delaware provides for a fixed customer charge (i.e., not tied to the customer’s volumetric consumption) to recover the utility’s fixed costs, plus a reasonable rate of return. Although different from the BSA, PHI views the MFVRD as an appropriate distribution revenue decoupling mechanism.
Delaware
DPL makes an annual GCR filing with the DPSC for the purpose of allowing DPL to recover gas procurement costs through customer rates. In August 2010, DPL made its 2010 GCR filing, which proposes rates that would allow DPL to recover an amount equal to a two-year amortization of currently under-recovered gas costs. In October 2010, the DPSC issued an order placing the new rates into effect on November 1, 2010, subject to refund and pending final DPSC approval. The effect of the proposed two-year amortization upon rates is an increase of 0.1% in the level of GCR. If the DPSC does not accept DPL’s proposal, the full adjustment would result in an increase of 6.9% in the GCR.
In September 2009, DPL submitted an application to the DPSC to increase its electric distribution base rates. The filing, as revised in March 2010, sought approval of an annual rate increase of approximately $26.2 million, assuming approval of the implementation of the MFVRD, based on a requested return on equity (ROE) of 10.75%. As permitted by Delaware law, DPL placed an increase of approximately $2.5 million annually into effect, on a temporary basis, in November 2009, and the remainder of approximately $23.7 million of requested increase went into effect on April 19, 2010, in each case subject to refund and pending final DPSC approval. In June 2010, DPL lowered the requested annual rate increase to approximately $24.2 million. On January 18, 2011, the DPSC approved a rate increase of approximately $16.4 million, based on an ROE of 10.00%. In early 2011, DPL will refund to customers the excess of the billed amounts over the DPSC approved increase. Consideration of the MFVRD has been deferred pending the development of an education plan for customers and workshops that are open to parties and the public for the purpose of developing a proposed implementation plan for the MFVRD.
On July 2, 2010, DPL submitted an application with the DPSC to increase its natural gas distribution base rates. As subsequently amended on September 10, 2010 (to replace test year data for the twelve months ended June 2010 with the actual data) and on October 11, 2010 (based on an update to DPL’s natural gas advanced metering infrastructure implementation schedule), the filing seeks approval of an annual rate increase of approximately $10.2 million, assuming the implementation of the MFVRD, based on a requested ROE of 11.00%. As permitted by Delaware law, DPL placed an annual increase of approximately $2.5 million annually into effect, on a temporary basis, on August 31, 2010, and the remainder of approximately $7.7 million of the requested increase went into effect on February 2, 2011, in each case subject to refund and pending final DPSC approval. Previously, in June 2009, DPL filed an application requesting approval for the implementation of the MFVRD for gas distribution rates. DPL anticipates that the DPSC will follow the same implementation approach it is following with respect to DPL’s MFVRD proposal for electric service, discussed above. The DPSC decision is still pending.
Maryland
In December 2009, Pepco filed an electric distribution base rate case in Maryland. The filing sought approval of an annual rate increase of approximately $40 million, based on a requested ROE of 10.75%. During the course of the proceeding, Pepco reduced its request to approximately $28.2 million. On August 6, 2010, the MPSC issued an order approving a rate increase of approximately $7.8 million, based on an ROE of 9.83%. On September 2, 2010, Pepco filed with the MPSC a motion for reconsideration of the following issues, which in the aggregate would increase annual revenue by approximately $8.5 million: (1) denial of inclusion in rate base of certain reliability plant investments, which occurred subsequent to the test period but before the rate effective period; (2) denial of Pepco’s request to increase depreciation rates to reflect a corrected formula relating to the cost of removal expenses; and (3) imposition of imputed cost savings to partially offset the costs of Pepco’s enhanced vegetation management program. Maryland law and regulation do not mandate a response time from the MPSC regarding Pepco’s motion and, therefore, it is not known when the MPSC will issue a ruling on the motion.
PEPCO HOLDINGS
On December 21, 2010, DPL filed an application with the MPSC to increase its electric distribution base rates by $17.8 million annually, based on an ROE of 10.75%. On December 28, 2010, the MPSC, consistent with its typical practice, issued an order suspending the proposed rate increase request for an initial period of 150 days from January 20, 2011 pending investigation by the MPSC.
On February 1, 2011, the MPSC initiated proceedings for Pepco and DPL, as well as unaffiliated utilities such as Baltimore Gas & Electric Company and Southern Maryland Electric Cooperative, for the purpose of reviewing how the BSA operates to recover revenues lost as a result of major storm outages. In its orders initiating the proceedings, the MPSC expressed concern that the utilities’ respective BSAs may be allowing them to recover revenues lost during extended outages, therefore unintentionally eliminating an incentive to restore service quickly. The MPSC will consider whether the BSA, as currently in effect, is appropriate, whether the calculations or determinant factors for calculating the BSA should be modified, and if so, what modifications should be made. A similar adjustment was included in the BSA for Pepco in the District of Columbia when the BSA was approved by the DCPSC.
Retained Environmental Exposures from the Sale of the Conectiv Energy Wholesale Power Generation Business
On July 1, 2010, PHI sold the Conectiv Energy wholesale power generation business to Calpine. Under New Jersey’s Industrial Site Recovery Act (ISRA), the transfer of ownership triggered an obligation on the part of Conectiv Energy to remediate any environmental contamination at each of the nine Conectiv Energy generating facility sites located in New Jersey. Under the Purchase Agreement dated April 20, 2010, between PHI and Calpine (the Purchase Agreement), Calpine has assumed responsibility for performing the ISRA-required remediation and for the payment of all related ISRA compliance costs up to $10 million. PHI is obligated to indemnify Calpine for any ISRA compliance remediation costs in excess of $10 million. According to preliminary estimates, the costs of ISRA-required remediation activities at the nine generating facility sites located in New Jersey are in the range of approximately $7 million to $18 million. PHI has accrued approximately $4 million as of December 31, 2010 for the ISRA-required remediation activities at the nine generating facility sites.
The sale of the Conectiv Energy wholesale power generation business to Calpine did not include a coal ash landfill site located at the Edge Moor generating facility, which PHI intends to close. The preliminary estimate of the costs to PHI to close the coal ash landfill ranges from approximately $2 million to $3 million, plus annual post-closure operations, maintenance and monitoring costs, estimated to range between $120,000 and $193,000 per year for 30 years. As of December 31, 2010, PHI had accrued approximately $4 million for landfill closure and monitoring.
In orders issued in 2007, the New Jersey Department of Environmental Protection (NJDEP) assessed penalties against Conectiv Energy in an aggregate amount of approximately $2 million, based on NJDEP’s contention that Conectiv Energy’s Deepwater generating facility exceeded the maximum allowable hourly heat input limits during certain periods in calendar years 2004, 2005 and 2006. Conectiv Energy has appealed the NJDEP orders imposing these penalties to the New Jersey Office of Administrative Law. PHI is continuing to prosecute this appeal and, under the Purchase Agreement, has agreed to indemnify Calpine for any monetary penalties, fines or assessments arising out of the NJDEP orders.
General Litigation
In 1993, Pepco was served with Amended Complaints filed in the state Circuit Courts of Prince George’s County, Baltimore City and Baltimore County, Maryland in separate ongoing, consolidated proceedings known as “In re: Personal Injury Asbestos Case.” Pepco and other corporate entities were brought into these cases on a theory of premises liability. Under this theory, the plaintiffs argued that Pepco was negligent in not providing a safe work environment for employees or its contractors, who allegedly were
PEPCO HOLDINGS
exposed to asbestos while working on Pepco’s property. Initially, a total of approximately 448 individual plaintiffs added Pepco to their complaints. While the pleadings are not entirely clear, it appears that each plaintiff sought $2 million in compensatory damages and $4 million in punitive damages from each defendant.
Since the initial filings in 1993, additional individual suits have been filed against Pepco, and significant numbers of cases have been dismissed. As a result of two motions to dismiss, numerous hearings and meetings and one motion for summary judgment, Pepco has had approximately 400 of these cases successfully dismissed with prejudice, either voluntarily by the plaintiff or by the court. As of December 31, 2010,2011, there are approximately 180 cases still pending against Pepco in the Maryland State Courts, of Maryland, of which approximately 90 cases were filed after December 19, 2000, and were tendered to Mirant Corporation (Mirant) for defense and indemnification in connection with the sale by Pepco of its generation assets to Mirant in 2000.
While the aggregate amount of monetary damages sought in the remaining suits (excluding those tendered to Mirant) is approximately $360 million, PHI and Pepco believe the amounts claimed by the remaining plaintiffs are greatly exaggerated. The amount of total liability, if any, and any related insurance recovery cannot be determined at this time; however, based on information and relevant circumstances known at this time, neither PHI nor Pepco believes these suits will have a material adverse effect on its financial condition, results of operations or cash flows. However, iftime. If an unfavorable decision were rendered against Pepco, it could have a material adverse effect on Pepco’s and PHI’s financial condition, results of operations and cash flows.
In September 2011, an asbestos complaint was filed in the New Jersey Superior Court, Law Division, against ACE (among other defendants) asserting claims under New Jersey’s Wrongful Death and Survival statutes. The complaint, filed by the estate of a decedent who was the wife of a former employee of ACE, alleges that the decedent’s mesothelioma was caused by exposure to asbestos brought home by her husband on his work clothes. Unlike the other jurisdictions to which PHI subsidiaries are subject, New Jersey courts have recognized a cause of action against a premise owner in a so-called “take home” case if it can be shown that the harm was foreseeable. In this case, the complaint seeks recovery of an unspecified amount of damages for the decedent’s past medical expenses, loss of earnings, and pain and suffering between the time of injury and death, and asserts a punitive damage claim. At this time, ACE cannot estimate an amount or range of reasonably possible loss to which it may be exposed that may be associated with the claims raised in this complaint. Such an estimate of reasonably possible loss must await further internal investigation and discovery procedures.
203
PEPCO HOLDINGS
Environmental LitigationMatters
PHI, through its subsidiaries, is subject to regulation by various federal, regional, state, and local authorities with respect to the environmental effects of its operations, including air and water quality control, solid and hazardous waste disposal, and limitations on land use. In addition, federal and state statutes authorize governmental agencies to compel responsible parties to clean up certain abandoned or unremediated hazardous waste sites. PHI’s subsidiaries may incur costs to clean up currently or formerly owned facilities or sites found to be contaminated, as well as other facilities or sites that may have been contaminated due to past disposal practices. Although penalties assessed for violations of environmental laws and regulations are not recoverable from customers of the operating utilities, environmental clean-up costs incurred by Pepco, DPL and ACE would begenerally are included by each company in its respective cost of service for ratemaking purposes. The total accrued liabilities for the environmental contingencies of PHI and its subsidiaries described below at December 31, 2011 are summarized as follows:
| Legacy Generation | ||||||||||||||||||||
| Transmission and Distribution | Regulated | Non-Regulated | Other | Total | ||||||||||||||||
| (millions of dollars) | ||||||||||||||||||||
Beginning balance as of January 1 | $ | 13 | $ | 9 | $ | 10 | $ | 2 | $ | 34 | ||||||||||
Accruals | 3 | — | — | — | 3 | |||||||||||||||
Payments | (1 | ) | (1 | ) | — | — | (2 | ) | ||||||||||||
|
|
|
|
|
|
|
|
|
| |||||||||||
Ending balance as of December 31 | 15 | 8 | 10 | 2 | 35 | |||||||||||||||
Less amounts in Other Current Liabilities | 2 | 2 | — | 2 | 6 | |||||||||||||||
|
|
|
|
|
|
|
|
|
| |||||||||||
Amounts in Other Deferred Credits | $ | 13 | $ | 6 | $ | 10 | $ | — | $ | 29 | ||||||||||
|
|
|
|
|
|
|
|
|
| |||||||||||
Conectiv Energy Wholesale Power Generation Sites
On July 1, 2010, PHI sold the Conectiv Energy wholesale power generation business to Calpine. Under New Jersey’s Industrial Site Recovery Act (ISRA), the transfer of ownership triggered an obligation on the part of Conectiv Energy to remediate any environmental contamination at each of the nine Conectiv Energy generating facility sites located in New Jersey. Under the terms of the sale, Calpine has assumed responsibility for performing the ISRA-required remediation and for the payment of all related ISRA compliance costs up to $10 million. PHI is obligated to indemnify Calpine for any ISRA compliance remediation costs in excess of $10 million. According to preliminary estimates, the costs of ISRA-required remediation activities at the nine generating facility sites located in New Jersey are in the range of approximately $7 million to $18 million. The amount accrued by PHI for the ISRA-required remediation activities at the nine generating facility sites is included in the table above under the column entitled Legacy Generation – Non-Regulated.
On September 14, 2011, PHI received a request for data from the U.S. Environmental Protection Agency (EPA) regarding operations at the Deepwater generating facility in New Jersey (which was included in the sale to Calpine) between January 1, 2001 and July 1, 2010, to demonstrate compliance with the Clean Air Act’s new source review permitting program. The data request covers the period from February 2004 to July 1, 2010. Under the terms of the Calpine sale, PHI is obligated to indemnify Calpine for any failure of PHI, on or prior to the closing date of the sale, to comply with environmental laws attributable to the construction of new, or modification of existing, sources of air emissions. At this time, PHI does not expect this inquiry to have a material effect on its financial position or results of operations.
The sale of the Conectiv Energy wholesale power generation business to Calpine did not include a coal ash landfill site located at the Edge Moor generating facility, which PHI intends to close. The preliminary estimate of the costs to PHI to close the coal ash landfill ranges from approximately $2 million to $3 million, plus annual post-closure operations, maintenance and monitoring costs, estimated to range between $120,000 and $193,000 per year for 30 years. The amounts accrued by PHI for this matter are included in the table above under the column entitled Legacy Generation – Non-Regulated.
204
PEPCO HOLDINGS
Franklin Slag Pile Site.
In November 2008, ACE received a general notice letter from the U.S. Environmental Protection Agency (EPA)EPA concerning the Franklin Slag Pile site in Philadelphia, Pennsylvania, asserting that ACE is a potentially responsible party (PRP) that may have liability for clean-up costs with respect to the site. If liable, ACE would be responsible for reimbursing EPA for clean-up costs incurred and to be incurred by the agencysite and for the costs of implementing an EPA-mandated remedy. EPA’s claims are based on ACE’s sale of boiler slag from the B.L. England generating facility, then owned by ACE, to MDC Industries, Inc. (MDC) during the period June 1978 to May 1983. EPA claims that the boiler slag ACE sold to MDC contained copper and lead, which are hazardous substances under the Comprehensive Environmental Response, Compensation, and Liability Act of 1980 (CERCLA), and that the sales transactions may have constituted an arrangement for the disposal or treatment of hazardous substances at the site, which could be a basis for liability under CERCLA. The EPA letter also states that, as of the date of the letter, EPA’s expenditures for response measures at the site have exceeded $6 million. EPA estimates the additional cost for future response measures will be approximately $6 million. ACE understandsbelieves that EPA sent similar general notice letters to three other companies and various individuals.
ACE believes that the B.L. England boiler slag sold to MDC was a valuable material with various industrial applications and, therefore, the sale was not an arrangement for the disposal or treatment of any hazardous substances as would be necessary to constitute a basis for liability under CERCLA. ACE intends to contest any claims to the contrary made by EPA. In a May 2009 decision arising under
PEPCO HOLDINGS
CERCLA, which did not involve ACE, the U.S. Supreme Court rejected an EPA argument that the sale of a useful product constituted an arrangement for disposal or treatment of hazardous substances. While this decision supports ACE’s position, at this time ACE cannot predict how EPA will proceed with respect to the Franklin Slag Pile site, or what portion, if any, of the Franklin Slag Pile site response costs EPA would seek to recover from ACE. Costs to resolve this matter are not expected to be material and are expensed as incurred.
Peck Iron and Metal Site.
EPA informed Pepco in a May 2009 letter that Pepco may be a PRP under CERCLA with respect to the cleanup of the Peck Iron and Metal site in Portsmouth, Virginia, and for costs EPA has incurred in cleaning up the site. The EPA letter states that Peck Iron and Metal purchased, processed, stored and shipped metal scrap from military bases, governmental agencies and businesses and that Peck’s metal scrap operations resulted in the improper storage and disposal of hazardous substances. EPA bases its allegation that Pepco arranged for disposal or treatment of hazardous substances sent to the site on information provided by former Peck Iron and Metal personnel, who informed EPA that Pepco was a customer at the site. Pepco has advised EPA by letter that its records show no evidence of any sale of scrap metal by Pepco to the site. Even if EPA has such records and such sales did occur, Pepco believes that any such scrap metal sales aremay be entitled to the recyclable material exemption from CERCLA liability. At this time Pepco cannot predict how EPA will proceed regarding this matter, or what portion, if any, of the Peck Iron and Metal site response costs EPA would seek to recover from Pepco. In a Federal Register notice published on November 4, 2009, EPA placed the Peck Iron and Metal site on the National Priorities List (NPL). The NPL, among other things, serves as a guide to EPA in determining which sites warrant further investigation to assess the nature and extent of the human health and environmental risks associated with a site. In September 2011, EPA initiated a remedial investigation/feasibility study (RI/FS) using federal funds. Pepco cannot at this time estimate an amount or range of reasonably possible loss associated with the RI/FS, any remediation activities to be performed at the site or any other costs that EPA might seek to impose on Pepco.
205
PEPCO HOLDINGS
Ward Transformer Site.
In April 2009, a group of PRPs with respect to the Ward Transformer site in Raleigh, North Carolina, filed a complaint in the U.S. District Court for the Eastern District of North Carolina, alleging cost recovery and/or contribution claims against a number of entities, including ACE, DPL and Pepco with respect to past and future response costs incurred by the PRP group in performing a removal action at the site. With the court’s permission, the plaintiffs filed amended complaints in September 2009. ACE, DPL and Pepco, as part of a group of defendants, filed a motion to dismiss in October 2009. In a March 24, 2010 order, the court denied the defendants’ motion to dismiss. Although it is too earlyThe next step in the processlitigation will be the filing of summary judgment motions regarding liability for certain “test case” defendants other than ACE, DPL and Pepco. The case has been stayed as to characterize the magnitude ofremaining defendants pending rulings upon the potential liabilitytest cases. Although PHI cannot at this site,time estimate an amount or range of reasonably possible losses to which it may be exposed, PHI does not believe that any of its three utility subsidiaries had extensive business transactions, if any, with the Ward Transformer site.site and therefore, costs incurred to resolve this matter are not expected to be material.
Benning Road Site. On
In September 21, 2010, PHI received a letter from EPA stating that EPA and the District of Columbia Department of the Environment (DDOE) have identified the Benning Road location, consisting of a transmission and distribution facility operated by Pepco and a generation facility operated by Pepco Energy Services, as one of six land-based sites potentially contributing to contamination of the Lowerlower Anacostia River. The letter stated that the principal contaminants of concern are polychlorinated biphenyls (PCBs) and polycyclic aromatic hydrocarbons, that EPA is monitoring the efforts of DDOE and that EPA intends to use federal authority to address the Benning Road site if an agreement for a comprehensive study to evaluate (and, if necessary, as a result of the study, to clean upup) the facility)facility is not reached. In a letter dated October 8, 2010, the Office of the Attorney General of the District of Columbia notified PHI of the District’s intent to sue Pepco Energy Services and Pepco under the Resource Conservation and Recovery Act for abatement of conditions related to their historical activities, including the discharge of PCBs at the Benning Road site. The District’s letter also stated that EPA will list the Benning Road site on the NPL if contamination at the facility is not addressed in a timely manner and that if Pepco fails to meet the District’s deadline, the District intends to sue Pepco and Pepco Energy Services in federal court to seek a scientific study to identify the nature of conditions at the Benning Road site, abatement of conditions, compensation for natural resource damages and reimbursement of DDOE’s related costs.January 2011, Pepco and Pepco Energy Services entered into a proposed consent decree with DDOE filed in the federal District Court on February 1, 2011, which will require the PHI entitiesthat requires Pepco and Pepco Energy Services to conduct a remedial investigation and feasibility study (RI/FS)RI/FS for the Benning Road site and an approximately 10-15 acre portion of the adjacent Anacostia River. The RI/FS will form the basis for DDOE’s selection of a remedial
PEPCO HOLDINGS
action for the Benning Road site and for the Anacostia River sediment associated with the site. In February 2011, the District of Columbia filed a complaint against Pepco and Pepco Energy Services in the United States District Court for the District of Columbia for the purpose of obtaining judicial approval of the consent decree. The consent decree will not be final untilcomplaint asserted claims under CERCLA, the DDOE files aResource Conservation and Recovery Act, and District of Columbia law seeking to compel Pepco and Pepco Energy Services to take actions to investigate and clean up contamination allegedly originating from the Benning Road site, and to reimburse the District of Columbia for its response costs. On December 1, 2011, the District Court issued an order granting the motion requesting the Court to enter a revised consent decree. The District Court’s order entering the consent decree after arequires DDOE to solicit and consider public comment period ends on March 7, 2011,the key RI/FS documents prior to final approval, requires DDOE to make final versions of all approved RI/FS documents available to the public, and requires the parties to submit a written status report to the District Court enters it. In lighton May 24, 2013 regarding the implementation of the requirements of the consent decree and any related plans for remediation. In addition, if the RI/FS has not been completed by May 24, 2013, the status report must provide an explanation and a showing of good cause for why the work has not been completed.
Pepco and Pepco Energy Services commenced work on the RI/FS upon entry of the consent decree. On December 21, 2011, they submitted a draft RI/FS Scope of Work and a draft Community Involvement Plan to DDOE for review. DDOE has solicited public comment on these documents, which were due by February 13, 2012, with respect to the draft Scope of Work, and are due by March 7, 2012 with respect to the draft Community Involvement Plan. Depending on the nature and extent of public comments received, Pepco and Pepco Energy Services anticipate that EPA will refrain from listing the Benning Road facility on the NPL. PHI preliminarily estimates that costs for performing the RI/FSthese documents will be approximately $600,000approved and the remediation costsa draft RI/FS work plan will be approximately $13 million. PHI recognized expensesubmitted by the end of $14 million in the fourthfirst quarter of 2010 with respect to this matter and, as2012. The field work will commence after final work plan approval by DDOE.
206
PEPCO HOLDINGS
The amount of December 31, 2010, has $14 millionremediation costs accrued for this matter.matter is included in the table above under the column entitled Transmission and Distribution.
Price’s Pit Site.
ACE owns a transmission and distribution right-of-way that traverses the Price’s Pit superfund site in Egg Harbor Township, New Jersey. EPA placed Price’s Pit on the NPL in 1983 and NJDEPthe New Jersey Department of Environmental Protection (NJDEP) undertook an environmental investigation to identify and implement remedial action at the site. NJDEP’s investigation revealed that landfill waste had been disposed on ACE’s right-of-way and NJDEP determined that ACE was a responsible party at the site as the owner of a facility on which a hazardous substance has been deposited. ACE, currently is engaged inEPA and NJDEP entered into a settlement negotiations with NJDEP and EPAagreement effective on August 11, 2011 to resolve itsACE’s alleged liability atliability. Under the settlement agreement, ACE made a payment of approximately $1 million (the amount accrued by ACE in 2010) to the EPA Hazardous Substance Superfund, and donated a four-acre parcel of land adjacent to the site by donating property to NJDEP and by making a payment in an amount to be determined. Costs incurred by ACE to resolve this matter are not expected to be material.
Appeal of New Jersey Flood Hazard Regulations. In November 2007, NJDEP adopted amendments to the agency’s regulations under the Flood Hazard Area Control Act (FHACA) to minimize damage to life and property from flooding caused by development in flood plains. The amended regulations impose a new regulatory program to mitigate flooding and related environmental impacts from a broad range of construction and development activities, including electric utility transmission and distribution construction, which were previously unregulated under the FHACA. These regulations impose restrictions on construction of new electric transmission and distribution facilities and increase the time and personnel resources required to obtain permits and conduct maintenance activities. In November 2008, ACE filed an appeal of these regulations with the Appellate Division of the Superior Court of New Jersey. The grounds for ACE’s appeal include the lack of administrative record justification for the FHACA regulations and conflict between the FHACA regulations and other state and federal regulations and standards for maintenance of electric power transmission and distribution facilities. The matter was argued before the Appellate Division on January 3, 2011 and the decision of the court is pending.NJDEP.
Indian River Oil Release
In 2001, DPL entered into a consent agreement with the Delaware Department of Natural Resources and Environmental Control for remediation, site restoration, natural resource damage compensatory projects and other costs associated with environmental contamination resulting from an oil release at the Indian River generating facility, which was sold in June 2001. BasedThe amount of remediation costs accrued for this matter is included in the table above under the column entitled Legacy Generation—Regulated.
Potomac River Mineral Oil Release
In January 2011, a coupling failure on updated engineering estimates obtaineda transformer cooler pipe resulted in a release of non-toxic mineral oil at Pepco’s Potomac River substation in Alexandria, Virginia. An overflow of an underground secondary containment reservoir resulted in approximately 4,500 gallons of mineral oil flowing into the Potomac River.
The release falls within the regulatory jurisdiction of multiple federal and state agencies. Beginning in March 2011, DDOE issued a series of compliance directives that require Pepco to prepare an incident report, provide certain records, and prepare and implement plans for sampling surface water and river sediments and assessing ecological risks and natural resources damages. Pepco has submitted an incident report and is providing the requested records. In December 2011, Pepco completed field sampling and anticipates submitting a report to DDOE during the second quarter of 2010, DPL2012.
On March 16, 2011, the Virginia Department of Environmental Quality (VADEQ) requested documentation regarding the release and the preparation of an emergency response report, which Pepco submitted to the agency on April 20, 2011. On March 25, 2011, Pepco received a notice of violation from VADEQ and in December 2011, VADEQ executed a consent agreement that had been executed by Pepco in August, pursuant to which Pepco paid a civil penalty of approximately $40,000.
During March 2011, EPA conducted an inspection of the Potomac River substation to review compliance with federal regulations regarding Spill Prevention, Control, and Countermeasure (SPCC) plans for facilities using oil-containing equipment in proximity to surface waters. As a result, EPA identified several potential violations of the SPCC regulations relating to SPCC plan content, recordkeeping, and secondary containment, which EPA advised may lead to an EPA demand for noncompliance penalties. As a result of the oil release, Pepco submitted a revised SPCC plan to EPA in August 2011 and implemented certain interim operational changes to the secondary containment systems at the facility which involve pumping accumulated storm water to an aboveground holding tank for off-site disposal. In December 2011, Pepco completed the installation of a treatment system designed to allow automatic discharge of accumulated
207
PEPCO HOLDINGS
storm water from the secondary containment system. Pepco is currently seeking DDOE’s approval to commence operation of the new system and, after receiving such approval, will submit a further revised SPCC plan to EPA. In the meantime, Pepco will continue to use the above ground holding tank to manage storm water from the secondary containment system.
The U.S. Coast Guard assessed a $5,000 penalty against Pepco for the release of oil into the waters of the United States, which Pepco has paid.
In addition to the cost to remediate impacts to the river and shoreline, Pepco also may be liable for non-compliance penalties and/or natural resource damages in addition to those it has already paid. It is not possible to accurately estimate an amount or range of reasonably possible loss to which it may be exposed associated with this liability at this time; however, based on current information, PHI and Pepco do not believe this matter will have a material adverse effect on their respective financial conditions, results of operations or cash flows.
The amounts accrued an additional liabilityfor these matters are included in the amounttable above under the column entitled Transmission and Distribution.
Fauquier County Landfill Site
On October 7, 2011, Pepco Energy Services received a notice of violation dated October 5, 2011, from the VADEQ, which advised Pepco Energy Services of information on which VADEQ may rely to institute an administrative or judicial enforcement action in connection with alleged violation of Virginia air pollution control law and regulations at the facility of Pepco Energy Services’ subsidiary Fauquier County Landfill Gas, L.L.C. in Warrenton, Virginia. The notice of violation is based on an on-site VADEQ inspection during which VADEQ observed certain alleged deficiencies relating to the facility’s permit to construct and operate. On February 6, 2012, VADEQ sent Pepco Energy Services a proposed consent order pursuant to which Pepco Energy Services would agree to perform certain remedial actions and agree to pay a civil charge of approximately $4 million in 2010. As of December 31, 2010, DPL’s accrual for expected future costs to fulfill its obligations under$10,000. Pepco Energy Services is presently reviewing the proposed consent agreement was approximately $5 million, of which approximately $1 million is expected to be incurred in 2011.order.
PHI’s Cross-Border Energy Lease Investments
Between 1994 and 2002, PCI a subsidiary of PHI, entered into eight cross-border energy lease investments involving public utility assets (primarily consisting of hydroelectric generation and coal-fired electric generation facilities and natural gas distribution networks) located outside of the United States. Each of these investments is comprised of multiple leases and each investment is structured as a sale and leaseback transaction commonly referred to by the IRS as a sale-in/sale-in, lease-out, or SILO transaction. PHI’s current
As more fully discussed in Note (8), “Leasing Activities,” PHI entered into early termination agreements with two lessees, at their request, with respect to all of the leases comprising one cross-border energy lease investment and a small portion of the leases comprising another cross-border energy lease investment in the second quarter of 2011. PHI received net cash proceeds of $161 million (net of a termination payment of $423 million used to retire the non-recourse debt associated with the terminated leases) and recorded a pre-tax gain of $39 million, representing the excess of the net cash proceeds over the carrying value of the lease investments. In the future, PHI anticipates that it will receive annual tax benefits from these eight cross-border energy lease investments areof approximately $59$51 million. As of December 31, 2010,2011, the book value of PHI’s equity investment in its cross-border energy leaseslease investments was approximately $1.4$1.3 billion. FromAfter taking into consideration the $74 million paid with the 2001-2002 audit (as discussed below), the net federal and state tax benefits received for the remaining leases from January 1, 2001, the earliest year that remains open to audit, to December 31, 2010, PHI2011, has derivedbeen approximately $575 million in federal and state income tax benefits from the depreciation and interest deductions in excess of rental income with respect to these cross-border energy lease investments.$510 million.
208
PEPCO HOLDINGS
InSince 2005, the Treasury Department and IRS issued Notice 2005-13 identifying sale-leaseback transactions with certain attributes entered into with tax-indifferent parties as tax avoidance transactions, and the IRS announced its intention to disallow the associated tax benefits claimed by the investors in these transactions. PHI’s cross-border energy lease investments each of which is with a tax-indifferent party, have been under examination by the IRS as part of the normal PHI federal income tax audits. In the final RARs issued in June 2006 and in March 2009 in connection with the audit of PHI’s 2001-2002 and 2003-2005 income tax returns, respectively, the IRS disallowed the depreciation and interest deductions in excess of rental income claimed by PHI with respect to each of its cross-border energy lease investments. In addition, the IRS has sought to recharacterize each of the leases as a loan transaction as to which PHI would be subject to original issue discount income. PHI disagrees with the IRS’ proposed adjustments and filed tax protests in August 2006 and May 2009 respectively, in connectionfiled protests of these findings with the auditOffice of Appeals of the 2001-2002 and the 2003-2005 income tax returns. Both of these protests were forwarded toIRS. Effective November 2010, PHI entered into a settlement agreement with the IRS Appeals Office. On August 9, 2010, PHI signed an IRS settlement statement with respect tofor the 2001-2002 income2001 and 2002 tax returns agreeing to the IRS’s disallowance of depreciationyears and interest deductions in excess of rental income with respect to the cross-border energy lease investments, but reserving its right to file timelysubsequently filed refund claims in which it would contestJuly 2011 for the disallowances. The Joint Tax Committee approveddisallowed tax deductions relating to the settlement on November 10, 2010.leases for these years. In January 2011, as part of this settlement, PHI paid $74 million of additional tax associated with the disallowed deductions from the cross-border energy lease investment for 2001 and 2002, plus penalties of $1 million, and any$28 million in interest associated with the disallowed deductions oncedeductions. Since the July 2011 claim for refund was not approved by the IRS assesseswithin the amount due.statutory six-month period, in January 2012 PHI currently intends to file a refund claim for the additional taxes and related interest and penalties incurred by reason of the disallowed deductions, which it expects the IRS to deny, and if so, PHI intends to pursue litigationfiled complaints in the U.S. Court of Federal Claims against the IRS to defend its tax position and recoverseeking recovery of the tax payment, interest and penalties. Absent a settlement, any litigation against the IRS may take several years to resolve. The 2003-2005 caseincome tax return review continues to be in process with the IRS Office of Appeals Office.
At December 31, 2010 and 2009, PHI modified its tax cash flow assumptions under its cross-border energy lease investments for the periods 2010-2013 and 2010-2012, respectively, to reflect the anticipated timingat present, will not be a part of potentialany U.S. Court of Federal Claims litigation with the IRS concerning the investments. As a result of the 2009 recalculation, PHI recorded a $2 million after-tax non-cash charge to earnings at December 31 2009, and recorded an additional $3 million in after-tax non-cash earnings during 2010 (as compared to the earnings that it would have recorded absent the 2009 recalculation). As a result of the 2010 recalculation, PHI recorded a $1 million after-tax non-cash charge to earnings at December 31, 2010.discussed above.
In the event that the IRS were to be successful in disallowing 100% of the tax benefits associated with these leases and recharacterizing these leases as loans, PHI estimates that, as of December 31, 2010,2011, it would be obligated to pay approximately $692$643 million in additional federal and state taxes and $133$121 million of interest on the remaining leases. The $643 million in additional federal and state taxes is net of whichthe $74 million has been satisfied by thetax payment made in January 2011. In addition, the IRS could require PHI to pay a penalty of up to 20% on the amount of additional taxes due.
PHI anticipates that any additional taxes that it would be required to pay as a result of the disallowance of prior deductions or a re-characterization of the leases as loans would be recoverable in the form of lower taxes over the remaining terms of the affected leases. Moreover, the entire amount of any additional federal and state tax would not be due immediately. Rather,immediately, but rather, the federal and state taxes would be payable when the open audit years are closed and PHI amends subsequent tax returns not then under audit. To mitigate the taxes due in the event of a total disallowance of tax benefits, PHI could were it to so elect choose to liquidate all or a portion of its seven remaining cross-border energy lease portfolio,investments, which PHI estimates could be accomplished over a period of six months to one year. Based on current market values, PHI estimates that liquidation of the entireremaining portfolio would generate sufficient cash proceeds to cover the estimated $825$764 million in federal and state taxes and interest due as of December 31, 2010 (or an estimated $751 million after giving effect to the $74 million payment made in January 2011),2011, in the event of a total disallowance of tax benefits and a recharacterization of the transactionsleases as loans. If payments of additional taxes and interest preceded the receipt of liquidation proceeds, the payments would be funded by currently available sources of liquidity.
PEPCO HOLDINGS
To the extent that PHI does not to prevail in this matter and suffers a disallowance of the tax benefits and incurs imputed original issue discount income, due to the recharacterization of the leases as loans, PHI would be required under FASB guidance on leases (ASC 840) to recalculate the timing of the tax benefits generated by the cross-border energy lease investments and adjust the equity value of the investments, which would result in a non-cash charge to earnings.
District of Columbia Tax Legislation
In December 2009,On June 14, 2011, the MayorCouncil of the District of Columbia approved legislation adopted by the City CouncilBudget Support Act. The Budget Support Act includes a provision requiring that imposes mandatory combined unitary business reporting beginning with tax year 2011, and revises the District’s related party expense disallowance beginning with tax year 2009. Because the City Council must still enact further legislation providing guidance on how to implement combined unitary business reporting before this provision is effective, PHI believes that the legislative process was not complete as of December 31, 2010, and, therefore, the effect of the legislation for combined unitary business tax reporting has not been accounted for as of December 31, 2010. However, because the City Council is not required to enact any further legislation in order for the provisions for the disallowance of related party transactions to become effective, PHI accrued approximately $500,000 of additional income tax expense during the first quarter of 2010.
The legislation does not define the term “unitary business” and does not specify how combined tax reporting would differ from PHI’s current consolidated tax reportingcorporate taxpayers in the District of Columbia. However, based upon PHI’s interpretation of combined unitary business tax reporting in other taxing jurisdictions, the legislation would likely result in a change in PHI’s overall stateColumbia calculate taxable income tax rate and, therefore, would likely require an adjustment to PHI’s net deferred income tax liabilities. Further,allocable or apportioned to the extent that the change in rate increases net deferred income tax liabilities, PHI must determine if these increased tax liabilities are probable of recovery in future rates. No timetable has been established by the City Council to enact the required further legislation and, therefore, it is uncertain as to when combined unitary reporting will be effective for PHI’s District of Columbia by reference to the income and apportionment factors applicable to commonly controlled entities organized within the United States that are engaged in a unitary business. This new reporting method was enacted on September 14, 2011 and is effective for tax returns.
Management continues to analyzeyears beginning on or after December 31, 2010. In the impact that the unitary businessaggregate, this new tax reporting aspect of this legislation, if completed, may have on the financial position,method negatively affected pre-tax earnings by $7 million ($5 million after-tax), which is reflected in PHI’s consolidated results of operations, as
209
PEPCO HOLDINGS
further discussed in Note (8), “Leasing Activities,” and cash flowsNote (12), “Income Taxes.” The District of Columbia Office of Tax and Revenue issued proposed regulations on January 20, 2012, to implement this reporting method. PHI will continue to analyze these regulations and its subsidiaries.will record the impact, if any, of such regulations on PHI’s results of operations in the period in which the proposed regulations are adopted as final regulations.
Third Party Guarantees, Indemnifications, and Off-Balance Sheet Arrangements
Pepco HoldingsPHI and certain of its subsidiaries have various financial and performance guarantees and indemnification obligations that they have entered into in the normal course of business to facilitate commercial transactions with third parties as discussed below.
As of December 31, 2010, Pepco Holdings2011, PHI and its subsidiaries were parties to a variety of agreements pursuant to which they were guarantors for standby letters of credit, performance residual value,energy procurement obligations, and other commitments and obligations. The commitments and obligations, in millions of dollars, were as follows:
| Guarantor | Guarantor | |||||||||||||||||||||||||||||||||||||||
| PHI | Pepco | DPL | ACE | Total | PHI | Pepco | DPL | ACE | Total | |||||||||||||||||||||||||||||||
Energy marketing obligations of Conectiv Energy (a) | $ | 139 | $ | — | $ | — | $ | — | $ | 139 | ||||||||||||||||||||||||||||||
Energy procurement obligations of Pepco Energy Services (a) | 243 | — | — | — | 243 | $ | 175 | $ | — | $ | — | $ | — | $ | 175 | |||||||||||||||||||||||||
Guarantees associated with disposal of Conectiv Energy assets (b) | 25 | — | — | — | 25 | 23 | — | — | — | 23 | ||||||||||||||||||||||||||||||
Guaranteed lease residual values (c) | 1 | 2 | 5 | 3 | 11 | 1 | 3 | 5 | 3 | 12 | ||||||||||||||||||||||||||||||
|
|
|
|
| ||||||||||||||||||||||||||||||||||||
Total | $ | 408 | $ | 2 | $ | 5 | $ | 3 | $ | 418 | $ | 199 | $ | 3 | $ | 5 | $ | 3 | $ | 210 | ||||||||||||||||||||
|
|
|
|
| ||||||||||||||||||||||||||||||||||||
| (a) |
PEPCO HOLDINGS
| (b) | Represents |
| (c) | Subsidiaries of |
Pepco Energy Services has entered into various energy savings guaranty contracts associated with the installation of energy savings equipment for federal, state and local government customers. As part of those contracts, Pepco Energy Services typically guarantees that the equipment will generate a specified amount of energy savings on an annual basis based on contractually established performance measures. The longest remaining term of the guarantees currently in effect is 15 years. On an annual basis, Pepco Energy Services undertakes a measurement and verification process to determine the amount of energy savings for the year and whether there is any shortfall in the annual energy savings compared to the guaranteed amount. Pepco Energy Services recognizes a liability for the value of the estimated energy savings shortfall when it is probable that the guaranteed energy savings will not be achieved. The liability for energy savings guaranty contracts has not changed significantly during the year ended December 31, 2010 and currently is less than $1 million. Pepco Energy Services did not make any significant payouts under the guarantees, and there was no significant change in guarantees issued or expired for the year ended December 31, 2010.
Pepco HoldingsPHI and certain of its subsidiaries have entered into various indemnification agreements related to purchase and sale agreements and other types of contractual agreements with vendors and other third parties. These indemnification agreements typically cover environmental, tax, litigation and other matters, as well as breaches of representations, warranties and covenants set forth in these agreements. Typically, claims may be made by third parties under these indemnification agreements over various periods of time depending on the nature of the claim. The maximum potential exposure under these indemnification agreements can range from a specified dollar amount to an unlimited amount depending on the nature of the claim and the particular transaction. The total maximum potential amount of future payments under these indemnification agreements is not estimable due to several factors, including uncertainty as to whether or when claims may be made under these indemnities.
Energy Savings Performance Contracts
Pepco Energy Services has a diverse portfolio of energy savings performance contracts that are associated with the installation of energy savings equipment for federal, state and local government customers. As part of those contracts, Pepco Energy Services typically guarantees that the equipment or systems installed by Pepco Energy Services will generate a specified amount of energy savings on an annual basis over a multi-year period. As of December 31, 2011, Pepco Energy Services’ energy savings guarantees on both completed projects and projects under construction totaled $435 million over the life of the performance contracts with the longest remaining term being 15 years. On an annual basis, Pepco Energy Services
210
PEPCO HOLDINGS
undertakes a measurement and verification process to determine the amount of energy savings for the year and whether there is any shortfall in the annual energy savings compared to the guaranteed amount. Pepco Energy Services recognizes a liability for the value of the estimated energy savings shortfall when it is probable that the guaranteed energy savings will not be achieved and the amount is reasonably estimable. As of December 31, 2011, Pepco Energy Services did not have an accrued liability for energy savings performance contracts. There was no significant change in the type of contracts issued for the year ended December 31, 2011. Based on its historical experience, Pepco Energy Services believes the probability of incurring a material loss under its energy savings performance contracts is remote.
Dividends
On January 27, 2011,26, 2012, Pepco Holdings’ Board of Directors declared a dividend on common stock of 27 cents per share payable March 31, 2011,30, 2012, to shareholders of record on March 10, 2011.12, 2012.
Contractual Obligations
As of December 31, 2010,2011, Pepco Holdings’ contractual obligations under non-derivative fuel and purchase power contracts were $922 million in 2011, $1,064$553 million in 2012, to 2013, $711$716 million in 2013 to 2014, to 2015, and $2,916$708 million in 2015 to 2016, and $2,125 million in 2017 and thereafter.
PEPCO HOLDINGS
(18)ACCUMULATED OTHER COMPREHENSIVE LOSS
A detail of the components of Pepco Holdings’ AOCL relating to continuing operations is as follows. For additional information, see the consolidated statements of comprehensive income.
| Commodity Derivatives | Treasury Lock | Other | Accumulated Other Comprehensive Loss | Commodity Derivatives | Treasury Lock | Other | Accumulated Other Comprehensive Loss | |||||||||||||||||||||||||
| (millions of dollars) | ||||||||||||||||||||||||||||||||
Balance, December 31, 2007 | $ | 11 | $ | (29 | ) | $ | (8 | ) | $ | (26 | ) | |||||||||||||||||||||
Current year change | (131 | ) | 4 | (2 | ) | (129 | ) | |||||||||||||||||||||||||
| (millions of dollars) | ||||||||||||||||||||||||||||||||
Balance, December 31, 2008 | (120 | ) | (25 | ) | (10 | ) | (155 | ) | $ | (120 | ) | $ | (25 | ) | $ | (10 | ) | $ | (155 | ) | ||||||||||||
Current year change | 21 | 3 | (7 | ) | 17 | 21 | 3 | (7 | ) | 17 | ||||||||||||||||||||||
|
|
|
| |||||||||||||||||||||||||||||
Balance, December 31, 2009 | (99 | ) | (22 | ) | (17 | ) | (138 | ) | (99 | ) | (22 | ) | (17 | ) | (138 | ) | ||||||||||||||||
Current year change | 21 | 11 | — | 32 | 21 | 11 | — | 32 | ||||||||||||||||||||||||
|
|
|
| |||||||||||||||||||||||||||||
Balance, December 31, 2010 | $ | (78 | ) | $ | (11 | ) | $ | (17 | ) | $ | (106 | ) | (78 | ) | (11 | ) | (17 | ) | (106 | ) | ||||||||||||
Current year change | 49 | 1 | (7 | ) | 43 | |||||||||||||||||||||||||||
|
|
|
| |||||||||||||||||||||||||||||
Balance, December 31, 2011 | $ | (29 | ) | $ | (10 | ) | $ | (24 | ) | $ | (63 | ) | ||||||||||||||||||||
|
|
|
| |||||||||||||||||||||||||||||
A detail of the income tax expense (benefit) allocated to the components of Pepco Holdings’ AOCL relating to continuing operations for each year is as follows.
As of: | Commodity Derivatives | Treasury Lock | Other | Accumulated Other Comprehensive Loss | ||||||||||||||||||||||||||||||
For the Year Ended: | Commodity Derivatives | Treasury Lock | Other | Accumulated Other Comprehensive Loss | ||||||||||||||||||||||||||||||
| (millions of dollars) | (millions of dollars) | |||||||||||||||||||||||||||||||||
December 31, 2008 | $ | (87 | ) | $ | 1 | $ | (1 | )(a) | $ | (87 | ) | |||||||||||||||||||||||
December 31, 2009 | $ | 15 | $ | 2 | $ | (5 | )(a) | $ | 12 | $ | 15 | $ | 2 | $ | (5 | ) | $ | 12 | ||||||||||||||||
December 31, 2010 | $ | 14 | $ | 7 | $ | — | (a) | $ | 21 | $ | 14 | $ | 7 | $ | — | $ | 21 | |||||||||||||||||
December 31, 2011 | $ | 32 | $ | — | $ | (4 | ) | $ | 28 | |||||||||||||||||||||||||
211
PEPCO HOLDINGS
(19) QUARTERLY FINANCIAL INFORMATION (UNAUDITED)
The quarterly data presented below reflect all adjustments necessary in the opinion of management for a fair presentation of the interim results. Quarterly data normally vary seasonally because of temperature variations, differences between summer and winter rates, and the scheduled downtime and maintenance of electric generating units. The totals of the four quarterly basic and diluted earnings per common share amounts may not equal the basic and diluted earnings per common share for the year due to changes in the number of common shares outstanding during the year.
| 2010 | 2011 | |||||||||||||||||||||||||||||||||||||||
| First Quarter | Second Quarter | Third Quarter | Fourth Quarter | Total | First Quarter | Second Quarter | Third Quarter | Fourth Quarter | Total | |||||||||||||||||||||||||||||||
| (millions, except per share amounts) | (millions, except per share amounts) | |||||||||||||||||||||||||||||||||||||||
Total Operating Revenue | $ | 1,819 | $ | 1,636 | $ | 2,067 | $ | 1,517 | $ | 7,039 | $ | 1,634 | $ | 1,409 | $ | 1,643 | $ | 1,234 | $ | 5,920 | ||||||||||||||||||||
Total Operating Expenses (a) (b) | 1,688 | 1,443 | 1,855 | 1,429 | 6,415 | |||||||||||||||||||||||||||||||||||
Total Operating Expenses | 1,485 | 1,207 | (a) | 1,448 | 1,143 | 5,283 | ||||||||||||||||||||||||||||||||||
Operating Income | 131 | 193 | 212 | 88 | 624 | 149 | 202 | 195 | 91 | 637 | ||||||||||||||||||||||||||||||
Other Expenses | (78 | ) | (84 | ) | (197 | ) | (115 | ) | (474 | ) | (53 | ) | (53 | ) | (60 | ) | (62 | ) | (228 | ) | ||||||||||||||||||||
Income (Loss) From Continuing Operations Before Income Tax Expense | 53 | 109 | 15 | (27 | ) | 150 | ||||||||||||||||||||||||||||||||||
Income Tax Expense (Benefit) Related to Continuing Operations | 25 | (d) | 33 | (e) | (6 | )(f) | (41 | )(f) | 11 | |||||||||||||||||||||||||||||||
Income From Continuing Operations Before Income Tax Expense | 96 | 149 | 135 | 29 | 409 | |||||||||||||||||||||||||||||||||||
Income Tax Expense Related to Continuing Operations (b) | 34 | 54 | 55 | 6 | 149 | |||||||||||||||||||||||||||||||||||
Net Income From Continuing Operations | 28 | 76 | 21 | 14 | 139 | 62 | 95 | (a) | 80 | 23 | 260 | |||||||||||||||||||||||||||||
Income (Loss) From Discontinued Operations, net of taxes | 8 | (130 | ) | (4 | ) | 19 | (107 | ) | 2 | (1 | ) | — | (4 | ) | (3 | ) | ||||||||||||||||||||||||
Net Income (Loss) | $ | 36 | $ | (54 | ) | $ | 17 | $ | 33 | $ | 32 | |||||||||||||||||||||||||||||
Net Income | $ | 64 | $ | 94 | $ | 80 | $ | 19 | $ | 257 | ||||||||||||||||||||||||||||||
Basic and Diluted Earnings Per Share of Common Stock | ||||||||||||||||||||||||||||||||||||||||
Earnings Per Share of Common Stock from Continuing Operations | 0.13 | 0.34 | 0.09 | 0.06 | 0.62 | 0.27 | 0.42 | 0.35 | 0.10 | 1.15 | ||||||||||||||||||||||||||||||
Earnings (Loss) Per Share of Common Stock from Discontinued Operations | 0.03 | (0.58 | ) | (0.01 | ) | 0.08 | (0.48 | ) | 0.01 | — | — | (0.02 | ) | (0.01 | ) | |||||||||||||||||||||||||
Basic and Diluted Earnings (Loss) Per Share of Common Stock | 0.16 | (0.24 | ) | 0.08 | 0.14 | 0.14 | ||||||||||||||||||||||||||||||||||
Basic and Diluted Earnings Per Share of Common Stock | 0.28 | 0.42 | 0.35 | 0.08 | 1.14 | |||||||||||||||||||||||||||||||||||
Cash Dividends Per Common Share | 0.27 | 0.27 | 0.27 | 0.27 | 1.08 | 0.27 | 0.27 | 0.27 | 0.27 | 1.08 | ||||||||||||||||||||||||||||||
| (a) | Includes $39 million pre-tax ($3 million after-tax) gain from the early termination of cross-border energy leases held in trust. |
| (b) | Includes tax benefits of $14 million in the second quarter primarily associated with an interest benefit related to federal tax liabilities and a $22 million reversal of previously recognized tax benefits in the second quarter associated with the early termination of cross-border energy leases held in trust. |
| 2010 | ||||||||||||||||||||
| First Quarter | Second Quarter | Third Quarter | Fourth Quarter | Total | ||||||||||||||||
| (millions, except per share amounts) | ||||||||||||||||||||
Total Operating Revenue | $ | 1,819 | $ | 1,636 | $ | 2,067 | $ | 1,517 | $ | 7,039 | ||||||||||
Total Operating Expenses (a) (b) | 1,688 | 1,443 | 1,855 | 1,429 | 6,415 | |||||||||||||||
Operating Income | 131 | 193 | 212 | 88 | 624 | |||||||||||||||
Other Expenses (c) | (78 | ) | (84 | ) | (197 | ) | (115 | ) | (474 | ) | ||||||||||
Income (Loss) From Continuing Operations Before Income Tax Expense | 53 | 109 | 15 | (27 | ) | 150 | ||||||||||||||
Income Tax Expense (Benefit) Related to Continuing Operations | 25 | (d) | 33 | (e) | (6 | )(f) | (41 | )(f) | 11 | |||||||||||
Net Income From Continuing Operations | 28 | 76 | 21 | 14 | 139 | |||||||||||||||
Income (Loss) From Discontinued Operations, net of taxes | 8 | (130 | ) | (4 | ) | 19 | (107 | ) | ||||||||||||
Net Income (Loss) | $ | 36 | $ | (54 | ) | $ | 17 | $ | 33 | $ | 32 | |||||||||
Basic and Diluted Earnings Per Share of Common Stock | ||||||||||||||||||||
Earnings Per Share of Common Stock from Continuing Operations | 0.13 | 0.34 | 0.09 | 0.06 | 0.62 | |||||||||||||||
Earnings (Loss) Per Share of Common Stock from Discontinued Operations | 0.03 | (0.58 | ) | (0.01 | ) | 0.08 | (0.48 | ) | ||||||||||||
Basic and Diluted Earnings (Loss) Per Share of Common Stock | 0.16 | (0.24 | ) | 0.08 | 0.14 | 0.14 | ||||||||||||||
Cash Dividends Per Common Share | 0.27 | 0.27 | 0.27 | 0.27 | 1.08 | |||||||||||||||
| (a) | Includes restructuring charges of $14 million and $16 million in the third and fourth quarters, respectively. |
| (b) | Includes expenses of $2 million and $9 million in the second and third quarters, respectively, related to the effects of Pepco divestiture-related claims. |
| (c) | Includes debt extinguishment costs of $135 million and $54 million in the third and fourth quarters, respectively. |
| (d) | Includes an $8 million reversal of accrued interest income on uncertain and effectively settled state tax positions and a $4 million reversal of deferred tax assets related to the Medicare Part D subsidy, partially offset by state income tax benefits of $8 million resulting from the planned restructuring of certain PHI subsidiaries. |
| (e) | Includes state income tax benefits of $8 million resulting from the restructuring of certain PHI subsidiaries. |
| (f) | Includes state income tax benefits of $13 million and $4 million in the third and fourth quarters, respectively, associated with the loss on extinguishment of debt and a $18 million Federal tax benefit in the fourth quarter related primarily to reversals of previously accrued interest on uncertain and effectively settled tax positions due to the final settlement with the IRS of the 1996-2002 tax years. |
| 2009 | ||||||||||||||||||||
| First Quarter | Second Quarter | Third Quarter | Fourth Quarter | Total | ||||||||||||||||
| (millions, except per share amounts) | ||||||||||||||||||||
Total Operating Revenue | $ | 2,037 | $ | 1,666 | $ | 2,050 | $ | 1,649 | $ | 7,402 | ||||||||||
Total Operating Expenses (e) | 1,896 | 1,522 | 1,815 | 1,521 | 6,754 | |||||||||||||||
Operating Income | 141 | 144 | 235 | 128 | 648 | |||||||||||||||
Other Expenses | (78 | ) | (81 | ) | (80 | ) | (82 | ) | (321 | ) | ||||||||||
Income From Continuing Operations Before Income Tax Expense | 63 | 63 | 155 | 46 | 327 | |||||||||||||||
Income Tax Expense Related to Continuing Operations | 22 | 24 | 51 | 7 | (g) | 104 | ||||||||||||||
Net Income From Continuing Operations | 41 | 39 | 104 | (f) | 39 | 223 | ||||||||||||||
Income (Loss) From Discontinued Operations, net of taxes | 4 | (14 | ) | 20 | 2 | 12 | ||||||||||||||
Net Income | $ | 45 | $ | 25 | $ | 124 | $ | 41 | $ | 235 | ||||||||||
Basic and Diluted Earnings Per Share of Common Stock | ||||||||||||||||||||
Earnings Per Share of Common Stock from Continuing Operations | 0.19 | 0.18 | 0.47 | 0.17 | 1.01 | |||||||||||||||
Earnings (Loss) Per Share of Common Stock from Discontinued Operations | 0.02 | (0.07 | ) | 0.09 | 0.01 | 0.05 | ||||||||||||||
Basic and Diluted Earnings Per Share of Common Stock | 0.21 | 0.11 | 0.56 | 0.18 | 1.06 | |||||||||||||||
Cash Dividends Per Common Share | 0.27 | 0.27 | 0.27 | 0.27 | 1.08 | |||||||||||||||
212
PEPCO HOLDINGS
(20) DISCONTINUED OPERATIONS
OnIn April 20, 2010, the Board of Directors of PHI approved a plan for the disposition of PHI’s competitive wholesale power generation, marketing and supply business, which has been conducted through subsidiaries of Conectiv Energy. The plan consists of (i)Energy Holding Company (collectively Conectiv Energy). On July 1, 2010, PHI completed the sale of Conectiv Energy’s wholesale power generation business and (ii) the liquidation, within the succeeding twelve months,to Calpine Corporation (Calpine). The disposition of all of Conectiv Energy’s remaining assets and businesses, includingconsisting of its load service supply contracts, energy hedging portfolio, certain tolling agreements and other non-generation assets. In accordance with the plan, PHI on the same date entered into the Purchase Agreement with Calpine, under the terms of which, Calpine agreed to purchase Conectiv Energy’s wholesale power generation business.
On July 1, 2010, PHI completed the sale of its wholesale power generation business to Calpine. Under the terms of the Purchase Agreement, dated April 20, 2010, the $1.65 billion sales price was subject to several adjustments, including a $49 million payment for the value of the fuel inventory at the time of the closing and a $60 million reductionassets not included in the closing payment attributable to lower capital expenditures incurred by Calpine sale, is substantially complete.
PHI than were anticipated at the time of execution of the Purchase Agreement for Conectiv Energy’s 565 megawatt combined cycle generating facility that is under construction (known as the Delta project) during the period from January 1, 2010 through the date of the closing. After giving effect to these and other adjustments, PHI received proceeds at the closing in the amount of approximately $1.64 billion.
As a result of the adoption of the plan of disposition, PHI commenced reporting the results of operations of the former Conectiv Energy segment in discontinued operations in all periods presented in the accompanying consolidated statements of income. Further, the assets and liabilities of Conectiv Energy, excluding the related current and deferred income tax accounts and certain retained liabilities, are reported as held for sale as of each date presented in the accompanying consolidated balance sheets.
The remaining net assets of Conectiv Energy are zero at December 31, 2011. Net assets at December 31, 2010 of $45 million included accounts receivable of $81 million, inventory of $20 million, net derivative liabilities of $18 million and other miscellaneous receivables and payables. At December 31, 2011, there were no derivative assets and liabilities or financial assets and liabilities that would be accounted for at fair value on a recurring basis. At December 31, 2010, Conectiv Energy had $7 million of financial assets (with $4 million and $3 million categorized within levels 2 and 3 of the fair value hierarchy, respectively) and $90 million of financial liabilities accounted for at fair value on a recurring basis (with $10 million and $80 million categorized within levels 1 and 2 of the fair value hierarchy, respectively).
Operating Results
The operating results of Conectiv Energy for the years ended December 31, 2011, 2010 2009 and 20082009 are as follows:
| 2010 | 2009 | 2008 | 2011 | 2010 | 2009 | |||||||||||||||||||
| (millions of dollars) | (millions of dollars) | |||||||||||||||||||||||
Income from operations of discontinued operations, net of income tax expense | $ | 6 | $ | 12 | $ | 117 | ||||||||||||||||||
(Loss) income from operations of discontinued operations, net of income taxes | $ | (1 | ) | $ | 6 | $ | 12 | |||||||||||||||||
Net losses from dispositions of assets and businesses of discontinued operations, net of income taxes | (113 | ) | — | — | (2 | ) | (113 | ) | — | |||||||||||||||
|
|
| ||||||||||||||||||||||
(Loss) income from discontinued operations, net of income taxes | $ | (107 | ) | $ | 12 | $ | 117 | $ | (3 | ) | $ | (107 | ) | $ | 12 | |||||||||
|
|
| ||||||||||||||||||||||
Income(Loss) income from operations of discontinued operations, net of income taxes, for the year ended December 31, 2011, includes adjustments of $4 million to certain remaining miscellaneous assets and liabilities and certain accrued expenses for obligations associated with the sale of the wholesale power generation business to Calpine to reflect the actual amounts paid to Calpine during 2011.
Net losses from dispositions of assets and businesses of discontinued operations, net of income taxes for the year ended December 31, 2011 includes an after-tax loss associated with state income taxes payable on the sale of the wholesale power generation business and after-tax income of $1 million related to the sale of a tolling agreement in May 2011, which is offset by an expense of approximately $1 million (after-tax) which was incurred in connection with a financial transaction entered into with a third party on January 6, 2011, under which Conectiv Energy transferred to the third party its remaining portfolio of derivatives, including financially settled natural gas and electric power transactions, for all remaining periods from February 1, 2011 forward. In connection with the closing of the transaction, Conectiv Energy paid the third party $82 million, primarily representing the fair value of the derivatives at February 1, 2011, and an after-tax administrative fee of $1 million. Substantially all of the mark-to-market gains and losses associated with these derivatives were recorded in earnings through December 31, 2010 and accordingly no additional material gain or loss was recognized as a result of this transaction in 2011.
213
PEPCO HOLDINGS
(Loss) income from operations of discontinued operations for the year ended December 31, 2010, net of income taxes, also includes after-tax expenses for employee severance and retention benefits of $9 million and after-tax accrued expenses for certain obligations associated with the sale of the wholesale power generation business to Calpine of $12 million.
Net losses from dispositions of assets and businesses of discontinued operations, net of income taxes, of $113 million for the year ended December 31, 2010, includes (i) the after-tax loss on the sale of the wholesale power generation business to Calpine of $74 million, (ii) after-tax net losses on sales of assets and businesses not sold to Calpine of $13 million (which is inclusive(inclusive of the recognition of after-tax unrealized losses on derivative contracts considered no longer probable to occur of $50 million recorded in the second quarter of 2010), and (iii) tax charges ofaggregating $26 million for the establishment of valuation allowances against certain deferred tax assets primarily associated with state net operating losses, the remeasurement of deferred taxes for expected changes in state income tax apportionment factors, and the write-off of certain tax credit carryforwards no longer expected to be realized.
PEPCO HOLDINGS
The estimated after-tax proceeds from the sale of the wholesale power generation business to Calpine and the liquidation of all of Conectiv Energy’s remaining assets and businesses, combined with the return of cash collateral posted under the contracts, total approximately $1.7 billion, with a related current income tax obligation of approximately $218 million.
Balance Sheet Information
Details of the assets and liabilities of Conectiv Energy held for sale at December 31, 2010 and 2009 are as follows:
| December 31, 2010 | December 31, 2009 | |||||||
| (millions of dollars) | ||||||||
Current Assets | ||||||||
Cash and cash equivalents | $ | 1 | $ | 2 | ||||
Accounts receivable, less allowance for uncollectible accounts | 81 | 194 | ||||||
Inventories | 20 | 128 | ||||||
Derivative assets | 3 | 21 | ||||||
Prepaid expenses and other | 6 | 1 | ||||||
Total Current Assets | 111 | 346 | ||||||
Investments And Other Assets | ||||||||
Derivative assets | 4 | 27 | ||||||
Other | 2 | 2 | ||||||
Total Investments and Other Assets | 6 | 29 | ||||||
Property, Plant And Equipment | ||||||||
Property, plant and equipment | 2 | 2,286 | ||||||
Accumulated depreciation | (2 | ) | (664 | ) | ||||
Net Property, Plant and Equipment | — | 1,622 | ||||||
Current Liabilities | ||||||||
Accounts payable and accrued liabilities | 40 | 138 | ||||||
Derivative liabilities | 15 | 37 | ||||||
Other | 7 | 16 | ||||||
Total Current Liabilities | 62 | 191 | ||||||
Deferred Credits | ||||||||
Derivative liabilities | 10 | 8 | ||||||
Other | — | 11 | ||||||
Total Deferred Credits | 10 | 19 | ||||||
Net Assets | $ | 45 | $ | 1,787 | ||||
PEPCO HOLDINGS
Derivative Instruments and Hedging Activities
Conectiv Energy historically used derivative instruments primarily to reduce its financial exposure to changes in the value of its assets and obligations due to commodity price fluctuations. The derivative instruments used included forward contracts, futures, swaps, and exchange-traded and over-the-counter options. The two primary risk management objectives were: (i) to manage the spread between the cost of fuel used to operate electric generation facilities and the revenue received from the sale of the power produced by those facilities, and (ii) to manage the spread between retail saleswholesale sale commitments and the cost of supply used to service those commitments to ensure stable cash flows and lock in favorable prices and margins when they becomebecame available.
As of December 31, 2011, Conectiv Energy had disposed of all energy commodity contracts and all cash collateral associated with these contracts had been returned.
Through June 30, 2010, Conectiv Energy purchased energy commodity contracts in the form of futures, swaps, options and forward contracts to hedge price risk in connection with the purchase of physical natural gas, oil and coal to fuel its generation assets for sale to customers. Conectiv Energy also purchased energy commodity contracts in the form of electricity swaps, options and forward contracts to hedge price risk in connection with the purchase of electricity for distribution to requirements-load customers. Through June 30, 2010, Conectiv Energy sold electricity swaps, options and forward contracts to hedge price risk in connection with electric output from its generating facilities. Conectiv Energy accountsaccounted for most of its futures, swaps and certain forward contracts as cash flow hedges of forecasted transactions. Derivative contracts purchased or sold in excess of probable amounts of forecasted hedge transactions, are marked-to-market through current earnings. All option contracts are marked-to-market through current earnings. Certain natural gas and oil futures and swaps have been used as fair value hedges to protect the value of natural gas transportation contracts and physical fuel inventory. Some forward contracts are accounted for using standard accrual accounting since these contracts meet the requirements for normal purchase and normal sale accounting.
The tables below identify the balance sheet location and fair values of Conectiv Energy’s derivative instruments as of December 31, 2010 and 2009:
| As of December 31, 2010 | ||||||||||||||||||||
Balance Sheet Caption | Derivatives Designated as Hedging Instruments | Other Derivative Instruments | Gross Derivative Instruments | Effects of Cash Collateral and Netting | Net Derivative Instruments | |||||||||||||||
| (millions of dollars) | ||||||||||||||||||||
Derivative Assets (current assets held for sale) | $ | — | $ | 395 | $ | 395 | $ | (392 | ) | $ | 3 | |||||||||
Derivative Assets (non-current assets held for sale) | — | 31 | 31 | (27 | ) | 4 | ||||||||||||||
Total Derivative Assets | — | 426 | 426 | (419 | ) | 7 | ||||||||||||||
Derivative Liabilities (current liabilities associated with assets held for sale) | — | (472 | ) | (472 | ) | 457 | (15 | ) | ||||||||||||
Derivative Liabilities (non-current liabilities associated with assets held for sale) | — | (37 | ) | (37 | ) | 27 | (10 | ) | ||||||||||||
Total Derivative Liabilities | — | (509 | ) | (509 | ) | 484 | (25 | ) | ||||||||||||
Net Derivative (Liability) Asset | $ | — | $ | (83 | ) | $ | (83 | ) | $ | 65 | $ | (18 | ) | |||||||
PEPCO HOLDINGS
| As of December 31, 2009 | ||||||||||||||||||||
Balance Sheet Caption | Derivatives Designated as Hedging Instruments | Other Derivative Instruments | Gross Derivative Instruments | Effects of Cash Collateral and Netting | Net Derivative Instruments | |||||||||||||||
| (millions of dollars) | ||||||||||||||||||||
Derivative Assets (current assets held for sale) | $ | 52 | $ | 574 | $ | 626 | $ | (605 | ) | $ | 21 | |||||||||
Derivative Assets (non-current assets held for sale) | 23 | 44 | 67 | (40 | ) | 27 | ||||||||||||||
Total Derivative Assets | 75 | 618 | 693 | (645 | ) | 48 | ||||||||||||||
Derivative Liabilities (current liabilities associated with assets held for sale) | (236 | ) | (575 | ) | (811 | ) | 774 | (37 | ) | |||||||||||
Derivative Liabilities (non-current liabilities associated with assets held for sale) | (14 | ) | (27 | ) | (41 | ) | 33 | (8 | ) | |||||||||||
Total Derivative Liabilities | (250 | ) | (602 | ) | (852 | ) | 807 | (45 | ) | |||||||||||
Net Derivative (Liability) Asset | $ | (175 | ) | $ | 16 | $ | (159 | ) | $ | 162 | $ | 3 | ||||||||
Under FASB guidance on the offsetting of balance sheet accounts (ASC 210-20), PHI offsets the fair value amounts recognized for derivative instruments and the fair value amounts recognized for related collateral positions executed with the same counterparty under master netting agreements. The amount of cash collateral that was offset against these derivative positions is as follows:
| December 31, 2010 | December 31, 2009 | |||||||
| (millions of dollars) | ||||||||
Cash collateral pledged to counterparties with the right to reclaim | $ | 65 | $ | 168 | ||||
Cash collateral received from counterparties with the obligation to return | — | (6 | ) | |||||
As of December 31, 2010 and 2009, all cash collateral pledged or received related to Conectiv Energy’s derivative instruments accounted for at fair value was entitled to offset under master netting agreements.
Derivatives Designated as Hedging Instruments
Cash Flow Hedges
For energy commodity contracts that are designated and qualify as cash flow hedges,accordingly, the effective portion of the gaingains or losslosses on the derivative is reportedthese derivatives were reflected as a component of AOCL and iswere reclassified into income in the same period or periods during which the hedged transactions affect income.occurred. Gains and losses on the derivativederivatives representing either hedge ineffectiveness, the forecasted hedged transaction being deemed probable not to occur, or hedge components excluded from the assessment of effectiveness arewere recognized in current income. This information
214
PEPCO HOLDINGS
The amounts of pre-tax loss on commodity derivatives included in other comprehensive loss for the activity of Conectiv Energy duringfor the years ended December 31, 2011, 2010 and 2009 and 2008 isare provided in the table below:
PEPCO HOLDINGS
| Years Ended December 31, | ||||||||||||
| 2010 | 2009 | 2008 | ||||||||||
| (millions of dollars) | ||||||||||||
Amount of net pre-tax loss arising during the period included in other comprehensive loss | $ | (73 | ) | $ | (216 | ) | $ | (105 | ) | |||
Amount of net pre-tax (loss) gain reclassified into income: | ||||||||||||
Effective portion: | ||||||||||||
Loss from discontinued operations, net of income taxes | (164 | ) | (224 | ) | 45 | |||||||
Ineffective portion: | ||||||||||||
Loss from discontinued operations net of income taxes (a) | (82 | ) | — | (3 | ) | |||||||
Total net pre-tax (loss) gain reclassified into income | (246 | ) | (224 | ) | 42 | |||||||
Net pre-tax gain (loss) on commodity derivatives included in other comprehensive loss | $ | 173 | $ | 8 | $ | (147 | ) | |||||
| 2011 | 2010 | 2009 | ||||||||||
Amount of net pre-tax loss arising during the period included in accumulated other comprehensive loss | $ | — | $ | (73 | ) | $ | (216 | ) | ||||
|
|
|
|
|
| |||||||
Amount of net pre-tax loss reclassified into income: | ||||||||||||
Effective portion: | ||||||||||||
Loss from discontinued operations, net of income taxes | — | (164 | ) | (224 | ) | |||||||
Ineffective portion: | ||||||||||||
Loss from discontinued operations, net of income taxes (a) | — | (82 | ) | — | ||||||||
|
|
|
|
|
| |||||||
Total net pre-tax loss reclassified into income | — | (246 | ) | (224 | ) | |||||||
|
|
|
|
|
| |||||||
Net pre-tax gain on commodity derivatives included in accumulated other comprehensive loss comprehensive loss | $ | — | $ | 173 | $ | 8 | ||||||
|
|
|
|
|
| |||||||
| (a) | For the years ended December 31, 2010 |
As of December 31, 2010,To the extent that Conectiv Energy had no energy commodity contracts employed as cash flow hedges. As of December 31, 2009, Conectiv Energy had the following types and volumes of energy commodity contracts employed as cash flow hedges of forecasted purchases and forecasted sales.
| ||||||||
| ||||||||
| ||||||||
| ||||||||
| ||||||||
| ||||||||
| ||||||||
| ||||||||
| ||||||||
| ||||||||
| ||||||||
| ||||||||
PEPCO HOLDINGS
Cash Flow Hedges Included in Accumulated Other Comprehensive Loss
As of December 31, 2010, Conectiv Energy had no remaining AOCL. The tables below provide details regarding effective cash flow hedges of Conectiv Energy included in PHI’s consolidated balance sheet as of December 31, 2009. Cash flow hedges are marked to market on the balance sheet with corresponding adjustments to AOCL to the extent the hedges are effective. The data in the tables indicate the cumulative net loss after-tax related to effective cash flow hedges by contract type included in AOCL, the portion of AOCL expected to be reclassified to income during the next 12 months, and the maximum hedge or deferral term:
| Accumulated Other Comprehensive Loss After-tax (a) | Portion Expected to be Reclassified to Income during the Next 12 Months | Maximum Term | ||||||||||
| (millions of dollars) | ||||||||||||
Energy Commodity Contracts as of December 31, 2010 | $ | — | $ | — | — | |||||||
Energy Commodity Contracts as of December 31, 2009 (a) | $ | 103 | $ | 154 | 48 months | |||||||
Fair Value Hedges
In connection with its energy commodity activities, Conectiv Energy designates certain derivatives as fair value hedges. For derivative instruments that are designated and qualify as a fair value hedge, the gain or loss on the derivative as well as the offsetting gain or loss on the hedged item attributable to the hedged risk is recognized in current income. For the years ended December 31, 2010 and 2008, there was no such gain or loss recognized. For the year ended December 31, 2009, the net gains recognized in (Loss) income from discontinued operations, net of income taxes, was $1 million. As of December 31, 2010, Conectiv Energy had no outstanding commodity forward contract derivatives that were accounted for as fair value hedges of fuel inventory and natural gas transportation.
Other Derivative Activity
In connection with its energy commodity activities, Conectiv Energy holdsheld certain derivatives that dodid not qualify as hedges. Under FASB guidance on derivatives and hedging,hedges, these derivatives arewere recorded at fair value on the balance sheet with changes in fair value recognized in income.
The amountamounts of realized and unrealized derivative gains (losses) for Conectiv Energy included in (Loss) income from discontinued operations, net of income taxes, for the years ended December 31, 2011, 2010 and 2009 and 2008, isare provided in the table below:
| For the Year Ended December 31, | ||||||||||||
| 2010 | 2009 | 2008 | ||||||||||
| (millions of dollars) | ||||||||||||
Realized mark-to-market gains | $ | 26 | $ | 47 | $ | 57 | ||||||
Unrealized mark-to-market (losses) gains | (16 | ) | (57 | ) | 24 | |||||||
Total net mark-to-market gains (losses) | $ | 10 | $ | (10 | ) | $ | 81 | |||||
PEPCO HOLDINGS
| 2011 | 2010 | 2009 | ||||||||||
Realized mark-to-market gains | $ | — | $ | 26 | $ | 47 | ||||||
Unrealized mark-to-market losses | — | (16 | ) | (57 | ) | |||||||
|
|
|
|
|
| |||||||
Total net mark-to-market gains (losses) | $ | — | $ | 10 | $ | (10 | ) | |||||
|
|
|
|
|
| |||||||
As of December 31, 2010 and 2009, Conectiv Energy had the following net outstanding commodity forward contract volumes and net positions on derivatives that did not qualify for hedge accounting:215
| December 31, 2010 | December 31, 2009 | |||||||||||
Commodity | Quantity | Net Position | Quantity | Net Position | ||||||||
Coal (Tons) | — | — | 60,000 | Long | ||||||||
Natural gas (MMBtu) | 450,000 | Long | 2,268,024 | Long | ||||||||
Natural gas basis (MMBtu) | — | — | 12,445,000 | Long | ||||||||
Heating oil (Barrels) | 64,000 | Short | 139,000 | Short | ||||||||
Electricity (MWh) | 1,200 | Long | 76,324 | Long | ||||||||
Financial transmission rights (MWh) | 702,358 | Short | 1,241,237 | Short | ||||||||
Contingent Credit Risk Features
The primary contracts used by Conectiv Energy for derivative transactions are generally the same as those described in Note (15), “Derivative Instruments and Hedging Activities,” and include comparable provisions for mutual posting and administration of collateral security. If the aggregate fair value of the transactions in a net loss position exceeds the unsecured credit threshold, then collateral is required to be posted in an amount equal to the amount by which the unsecured credit threshold is exceeded. The obligations of Conectiv Energy are usually guaranteed by PHI. If PHI���s credit rating were to fall below “investment grade,” the unsecured credit threshold would typically be set at zero and collateral would be required for the entire net loss position. Exchange-traded contracts are required to be fully collateralized without regard to the credit rating of the holder.
The gross fair value of Conectiv Energy’s derivative liabilities, excluding the impact of offsetting transactions or collateral under master netting agreements, with credit risk-related contingent features on December 31, 2010 and 2009, was $117 million and $179 million, respectively. As of those dates, Conectiv Energy had posted cash collateral of $12 million and $17 million, respectively, in the normal course of business against the gross derivative liability resulting in a net liability of $105 million and $162 million, respectively, before giving effect to offsetting transactions that are encompassed within master netting agreements that would reduce this amount. Conectiv Energy’s net settlement amount in the event of a downgrade of PHI below “investment grade” as of December 31, 2010 and 2009, would have been an additional $58 million and $63 million, respectively, after taking into consideration the master netting agreements.
Depending on the contract terms, the collateral required to be posted by Conectiv Energy was of varying forms, including cash and letters of credit. As of December 31, 2010, Conectiv Energy had posted net cash collateral of $104 million and there were no outstanding letters of credit. At December 31, 2009, Conectiv Energy had posted net cash collateral of $240 million and letters of credit of $22 million. Of the approximately $104 million of net cash collateral outstanding at December 31, 2010, approximately $39 million represented deposits on commodity brokerage accounts and $65 million represented collateral pledged to counterparties with the right to reclaim. Of the approximately $240 million of net cash collateral outstanding at December 31, 2009, approximately $78 million represented deposits on commodity brokerage accounts and $162 million represented collateral pledged to counterparties with the right to reclaim.
On January 6, 2011, as part of its ongoing divestiture efforts, Conectiv Energy entered into a financial transaction with a third party under which Conectiv Energy transferred its remaining portfolio of derivatives, including financially settled natural gas and electric power transactions for all remaining periods from February 1, 2011 forward. In connection with the closing of the transaction, Conectiv Energy paid the third party $82 million, primarily representing the fair value of the derivative instruments at February 1, 2011 and an administrative fee of approximately $2 million that will be expensed in the first quarter of 2011. No additional material gain or loss will be recognized as a result of this transaction as the
PEPCO HOLDINGS
derivatives were previously marked to fair value through earnings in 2010. Approximately $68 million of collateral was returned to Conectiv Energy upon the closing of the transaction in January 2011. Approximately $11 million of the remaining $36 million in outstanding collateral will be returned to Conectiv Energy in connection with this transaction upon the novation of several over-the-counter transactions.
All of the remaining posted cash collateral, other than the $11 million referred to above, is held by the PJM and ISO New England Inc. regional transmission organizations and will be returned within the next several months upon completion of a reconciliation process.
PHI’s primary sources for posting cash collateral or letters of credit are its credit facilities. At December 31, 2010 and 2009, the amount of cash plus borrowing capacity under the primary credit facilities available to meet the future liquidity needs of Conectiv Energy and Pepco Energy Services, totaled $728 million and $820 million, respectively.
Fair Value Disclosures
Conectiv Energy has adopted FASB guidance on fair value measurement and disclosures (ASC 820) that established a framework for measuring fair value and expanded disclosures about fair value measurement that is further described in Note (16), “Fair Value Disclosures.”
As of December 31, 2010 level 2 instruments primarily consist of electricity derivatives. Power swaps are priced at liquid trading hub prices or valued using the liquid hub prices plus a congestion adder that is calculated using historical regression analysis. Natural gas futures and swaps are valued using broker quotes in liquid markets and other observable pricing data.
The level 3 instruments with the most significant amount of fair value at December 31, 2010 are electricity derivatives. The majority of Conectiv Energy’s pricing information for these level 3 valuations was obtained from a third party pricing system used widely throughout the energy industry.
The following tables set forth, by level within the fair value hierarchy, Conectiv Energy’s financial assets and liabilities that were accounted for at fair value on a recurring basis as of December 31, 2010 and 2009:
| Fair Value Measurements at December 31, 2010 | ||||||||||||||||
Description | Total | Quoted Prices in Active Markets for Identical Instruments (Level 1) | Significant Other Observable Inputs (Level 2) | Significant Unobservable Inputs (Level 3) | ||||||||||||
| (millions of dollars) | ||||||||||||||||
ASSETS | ||||||||||||||||
Derivative instruments (a) | ||||||||||||||||
Electricity (c) | $ | 7 | $ | — | $ | 4 | $ | 3 | ||||||||
| $ | 7 | $ | — | $ | 4 | $ | 3 | |||||||||
LIABILITIES | ||||||||||||||||
Derivative instruments (a) | ||||||||||||||||
Natural Gas (b) | $ | 35 | $ | 10 | $ | 25 | $ | — | ||||||||
Electricity (c) | 55 | — | 55 | — | ||||||||||||
| $ | 90 | $ | 10 | $ | 80 | $ | — | |||||||||
PEPCO HOLDINGS
| Fair Value Measurements at December 31, 2009 | ||||||||||||||||
Description | Total | Quoted Prices in Active Markets for Identical Instruments (Level 1) | Significant Other Observable Inputs (Level 2) | Significant Unobservable Inputs (Level 3) | ||||||||||||
| (millions of dollars) | ||||||||||||||||
ASSETS | ||||||||||||||||
Derivative instruments (a) | ||||||||||||||||
Coal (b) | $ | 8 | $ | — | $ | 8 | $ | — | ||||||||
Natural Gas (c) | 4 | — | 4 | — | ||||||||||||
Electricity (d) | 34 | — | 4 | 30 | ||||||||||||
Capacity (e) | 8 | 8 | — | — | ||||||||||||
| $ | 54 | $ | 8 | $ | 16 | $ | 30 | |||||||||
LIABILITIES | ||||||||||||||||
Derivative instruments (a) | ||||||||||||||||
Coal (b) | $ | 6 | $ | — | $ | 6 | $ | — | ||||||||
Natural Gas (c) | 74 | 52 | 22 | — | ||||||||||||
Electricity (d) | 126 | — | 123 | 3 | ||||||||||||
Oil (f) | 5 | 4 | 1 | — | ||||||||||||
Capacity (e) | 2 | 2 | — | — | ||||||||||||
| $ | 213 | $ | 58 | $ | 152 | $ | 3 | |||||||||
Reconciliations of the beginning and ending balances of Conectiv Energy’s fair value measurements using significant unobservable inputs (Level 3) for the years ended December 31, 2010 and 2009 are shown below:
| For the Year Ended December 31, | ||||||||
| 2010 | 2009 | |||||||
| (millions of dollars) | ||||||||
Beginning balance as of January 1 | $ | 27 | $ | 2 | ||||
Total gains or (losses) (realized and unrealized) | ||||||||
Included in loss from discontinued operations, net of taxes (a) | 81 | 18 | ||||||
Included in accumulated other comprehensive loss | (13 | ) | 25 | |||||
Purchases and issuances | — | — | ||||||
Settlements | (92 | ) | (11 | ) | ||||
Transfers in (out) of Level 3 | — | (7 | ) | |||||
Ending balance as of December 31 | $ | 3 | $ | 27 | ||||
PEPCO HOLDINGS
(21)RESTRUCTURING CHARGE
With the ongoing wind downwind-down of the retail energy supply business of Pepco Energy Services and the disposition of Conectiv Energy, PHI is repositioningrepositioned itself as a regulated transmission and distribution company.company during 2010. In connection with this repositioning, PHI commencedcompleted a comprehensive organizational review in the second quarter of 2010 to identifythat identified opportunities to streamline the organization and to achieve certain reductions in corporate overhead costs that are allocated to its operating segments. This review hassegments, which resulted in the adoption of a restructuring plan. PHI began implementingimplementation of the plan during the third quarter,2010, identifying 164 employee positions that were to be eliminated during the fourth quarter of 2010.eliminated. The plan also focuses on identifyingincludes additional cost reduction opportunities that are being implemented through process improvements and operational efficiencies.
In connection with the restructuring plan, PHI recorded a pre-tax restructuring charge of $30 million for the year ended December 31, 2010 related to severance, pension, and health and welfare benefits for employee terminations.terminations of $30 million in 2010. The severance, pension, and health and welfare benefits were estimated based on the years of service and compensation levels of the employees associated with the 164 eliminated positions. The restructuring charge has beenwas allocated to PHI’s operating segments and has beenwas reflected as a separate line item in the consolidated statementsstatement of income. The amountincome for the year ended December 31, 2010.
A reconciliation of PHI’s accrued restructuring charge recorded by segmentcharges for the year ended December 31, 2011 is as follows:
| For The Year Ended December 31, 2010 | ||||||||||||||||||||
| (millions of dollars) | ||||||||||||||||||||
| Power Delivery | Pepco Energy Services | Other Non- Regulated | Corporate and Other | PHI Consolidated | ||||||||||||||||
Employee severance, pension, and health and welfare benefits | $ | 29 | $ | — | $ | — | $ | 1 | $ | 30 | ||||||||||
Total restructuring charge | $ | 29 | $ | — | $ | — | $ | 1 | $ | 30 | ||||||||||
Reconciliations of PHI’s accrued restructuring charges for the year ended December 31, 2010 are as follows:
|
| |||||||||||||||||||
| Year Ended December 31, 2010 | ||||||||||||||||||||
| (millions of dollars) | ||||||||||||||||||||
| Power Delivery (a) | Pepco Energy Services | Other Non- Regulated | Corporate and Other | PHI Consolidated | ||||||||||||||||
Beginning balance as of January 1, 2010 | $ | — | $ | — | $ | — | $ | — | $ | — | ||||||||||
Restructuring charge | 29 | — | — | 1 | 30 | |||||||||||||||
Cash payments | (1 | ) | — | — | — | (1 | ) | |||||||||||||
Ending balance as of December 31, 2010 | $ | 28 | $ | — | $ | — | $ | 1 | $ | 29 | ||||||||||
| Year Ended December 31, 2011 | ||||||||||||
| (millions of dollars) | ||||||||||||
| Power Delivery | Corporate and Other | PHI Consolidated | ||||||||||
Beginning balance as of January 1, 2011 | $ | 28 | $ | 1 | $ | 29 | ||||||
Restructuring charge | — | — | — | |||||||||
Cash payments | (23 | ) | (1 | ) | (24 | ) | ||||||
|
|
|
|
|
| |||||||
Ending balance as of December 31, 2011 | $ | 5 | $ | — | $ | 5 | ||||||
|
|
|
|
|
| |||||||
216
PEPCO
Management’s Report on Internal Control over Financial Reporting
The management of Pepco is responsible for establishing and maintaining adequate internal control over financial reporting, as such term is defined in Rule 13a-15(f) and Rule 15d-15(f) under the Securities Exchange Act of 1934, as amended.Act. Because of its inherent limitations, internal control over financial reporting may not prevent or detect misstatements. Also, projections of any evaluation of effectiveness to future periods are subject to the risk that controls may become inadequate because of changes in conditions, or that the degree of compliance with the policies or procedures may deteriorate.
Management of Pepco assessed itsPepco’s internal control over financial reporting as of December 31, 20102011 based on the framework inInternal Control – Integrated Framework issued by the Committee of Sponsoring Organizations of the Treadway Commission. Based on its assessment, the management of Pepco concluded that Pepco’s internal control over financial reporting was effective as of December 31, 2010.2011.
217
PEPCO
Report of Independent Registered Public Accounting Firm
To the Shareholder and Board of Directors of
Potomac Electric Power Company
In our opinion, the financial statements of Potomac Electric Power Company (a wholly owned subsidiary of Pepco Holdings, Inc.) listed in the accompanying index appearing under Item 15(a)(1) present fairly, in all material respects, the financial position of Potomac Electric Power Company at December 31, 20102011 and December 31, 2009,2010, and the results of its operations and its cash flows for each of the three years in the period ended December 31, 20102011 in conformity with accounting principles generally accepted in the United States of America. In addition, in our opinion, the financial statement schedule of Potomac Electric Power Company listed in the index appearing under Item 15(a)(2) presents fairly, in all material respects, the information set forth therein when read in conjunction with the related financial statements. These financial statements and financial statement schedule are the responsibility of the Company’s management. Our responsibility is to express an opinion on these financial statements and financial statement schedule based on our audits. We conducted our audits of these statements in accordance with the standards of the Public Company Accounting Oversight Board (United States). Those standards require that we plan and perform the audit to obtain reasonable assurance about whether the financial statements are free of material misstatement. An audit includes examining, on a test basis, evidence supporting the amounts and disclosures in the financial statements, assessing the accounting principles used and significant estimates made by management, and evaluating the overall financial statement presentation. We believe that our audits provide a reasonable basis for our opinion.
/s/ PricewaterhouseCoopers LLP
Washington, D.C.
February 23, 2012
218
PEPCO
POTOMAC ELECTRIC POWER COMPANY
STATEMENTS OF INCOME
For the Year Ended December 31, | 2010 | 2009 | 2008 | |||||||||
| (millions of dollars) | ||||||||||||
Operating Revenue | $ | 2,288 | $ | 2,231 | $ | 2,322 | ||||||
Operating Expenses | ||||||||||||
Purchased energy | 1,152 | 1,223 | 1,335 | |||||||||
Other operation and maintenance | 354 | 328 | 302 | |||||||||
Restructuring charge | 15 | — | — | |||||||||
Depreciation and amortization | 162 | 145 | 141 | |||||||||
Other taxes | 364 | 302 | 288 | |||||||||
Effect of divestiture-related claims | 11 | (40 | ) | — | ||||||||
Total Operating Expenses | 2,058 | 1,958 | 2,066 | |||||||||
Operating Income | 230 | 273 | 256 | |||||||||
Other Income (Expenses) | ||||||||||||
Interest and dividend income | 1 | 1 | 9 | |||||||||
Interest expense | (98 | ) | (100 | ) | (93 | ) | ||||||
Other income | 12 | 9 | 10 | |||||||||
Other expenses | — | (1 | ) | (2 | ) | |||||||
Total Other Expenses | (85 | ) | (91 | ) | (76 | ) | ||||||
Income Before Income Tax Expense | 145 | 182 | 180 | |||||||||
Income Tax Expense | 37 | 76 | 64 | |||||||||
Net Income | $ | 108 | $ | 106 | $ | 116 | ||||||
For the Year Ended December 31, | 2011 | 2010 | 2009 | |||||||||
| (millions of dollars) | ||||||||||||
Operating Revenue | $ | 2,078 | $ | 2,288 | $ | 2,231 | ||||||
|
|
|
|
|
| |||||||
Operating Expenses | ||||||||||||
Purchased energy | 893 | 1,152 | 1,223 | |||||||||
Other operation and maintenance | 420 | 354 | 328 | |||||||||
Restructuring charge | — | 15 | — | |||||||||
Depreciation and amortization | 171 | 162 | 145 | |||||||||
Other taxes | 382 | 364 | 302 | |||||||||
Effects of divestiture-related claims | — | 11 | (40 | ) | ||||||||
|
|
|
|
|
| |||||||
Total Operating Expenses | 1,866 | 2,058 | 1,958 | |||||||||
|
|
|
|
|
| |||||||
Operating Income | 212 | 230 | 273 | |||||||||
|
|
|
|
|
| |||||||
Other Income (Expenses) | ||||||||||||
Interest and dividend income | — | 1 | 1 | |||||||||
Interest expense | (94 | ) | (98 | ) | (100 | ) | ||||||
Other income | 17 | 12 | 9 | |||||||||
Other expenses | — | — | (1 | ) | ||||||||
|
|
|
|
|
| |||||||
Total Other Expenses | (77 | ) | (85 | ) | (91 | ) | ||||||
|
|
|
|
|
| |||||||
Income Before Income Tax Expense | 135 | 145 | 182 | |||||||||
Income Tax Expense | 36 | 37 | 76 | |||||||||
|
|
|
|
|
| |||||||
Net Income | $ | 99 | $ | 108 | $ | 106 | ||||||
|
|
|
|
|
| |||||||
The accompanying Notes are an integral part of these Financial Statements.
219
PEPCO
POTOMAC ELECTRIC POWER COMPANY
BALANCE SHEETS
ASSETS | December 31, 2010 | December 31, 2009 | ||||||
| (millions of dollars) | ||||||||
CURRENT ASSETS | ||||||||
Cash and cash equivalents | $ | 88 | $ | 213 | ||||
Restricted cash equivalents | — | 1 | ||||||
Accounts receivable, less allowance for uncollectible accounts of $20 million and $17 million, respectively | 373 | 354 | ||||||
Inventories | 44 | 43 | ||||||
Prepayments of income taxes | 95 | 79 | ||||||
Income taxes receivable | 37 | — | ||||||
Prepaid expenses and other | 34 | 48 | ||||||
Total Current Assets | 671 | 738 | ||||||
INVESTMENTS AND OTHER ASSETS | ||||||||
Regulatory assets | 191 | 166 | ||||||
Prepaid pension expense | 274 | 295 | ||||||
Investment in trust | 25 | 25 | ||||||
Income taxes receivable | 34 | 64 | ||||||
Other | 57 | 70 | ||||||
Total Investments and Other Assets | 581 | 620 | ||||||
PROPERTY, PLANT AND EQUIPMENT | ||||||||
Property, plant and equipment | 6,185 | 5,865 | ||||||
Accumulated depreciation | (2,609 | ) | (2,481 | ) | ||||
Net Property, Plant and Equipment | 3,576 | 3,384 | ||||||
TOTAL ASSETS | $ | 4,828 | $ | 4,742 | ||||
| December 31, 2011 | December 31, 2010 | |||||||
| (millions of dollars) | ||||||||
ASSETS | ||||||||
CURRENT ASSETS | ||||||||
Cash and cash equivalents | $ | 12 | $ | 88 | ||||
Accounts receivable, less allowance for uncollectible accounts of $18 million and $20 million, respectively | 339 | 373 | ||||||
Inventories | 50 | 44 | ||||||
Prepayments of income taxes | 7 | 95 | ||||||
Income taxes receivable | 31 | 37 | ||||||
Prepaid expenses and other | 32 | 34 | ||||||
|
|
|
| |||||
Total Current Assets | 471 | 671 | ||||||
|
|
|
| |||||
INVESTMENTS AND OTHER ASSETS | ||||||||
Regulatory assets | 299 | 191 | ||||||
Prepaid pension expense | 289 | 274 | ||||||
Investment in trust | 31 | 25 | ||||||
Income taxes receivable | 24 | 34 | ||||||
Other | 55 | 57 | ||||||
|
|
|
| |||||
Total Investments and Other Assets | 698 | 581 | ||||||
|
|
|
| |||||
PROPERTY, PLANT AND EQUIPMENT | ||||||||
Property, plant and equipment | 6,578 | 6,185 | ||||||
Accumulated depreciation | (2,704 | ) | (2,609 | ) | ||||
|
|
|
| |||||
Net Property, Plant and Equipment | 3,874 | 3,576 | ||||||
|
|
|
| |||||
TOTAL ASSETS | $ | 5,043 | $ | 4,828 | ||||
|
|
|
| |||||
The accompanying Notes are an integral part of these Financial Statements.
220
PEPCO
POTOMAC ELECTRIC POWER COMPANY
BALANCE SHEETS
LIABILITIES AND EQUITY | December 31, 2010 | December 31, 2009 | ||||||
| (millions of dollars, except shares) | ||||||||
CURRENT LIABILITIES | ||||||||
Current portion of long-term debt | $ | — | $ | 16 | ||||
Accounts payable and accrued liabilities | 194 | 154 | ||||||
Accounts payable due to associated companies | 75 | 111 | ||||||
Capital lease obligations due within one year | 8 | 7 | ||||||
Taxes accrued | 62 | 37 | ||||||
Interest accrued | 18 | 18 | ||||||
Other | 119 | 124 | ||||||
Total Current Liabilities | 476 | 467 | ||||||
DEFERRED CREDITS | ||||||||
Regulatory liabilities | 147 | 145 | ||||||
Deferred income taxes, net | 958 | 893 | ||||||
Investment tax credits | 7 | 8 | ||||||
Other postretirement benefit obligations | 67 | 71 | ||||||
Income taxes payable | 3 | 5 | ||||||
Liabilities and accrued interest related to uncertain tax positions | 52 | 29 | ||||||
Other | 64 | 58 | ||||||
Total Deferred Credits | 1,298 | 1,209 | ||||||
LONG-TERM LIABILITIES | ||||||||
Long-term debt | 1,540 | 1,539 | ||||||
Capital lease obligations | 86 | 92 | ||||||
Total Long-Term Liabilities | 1,626 | 1,631 | ||||||
COMMITMENTS AND CONTINGENCIES (NOTE 13) | ||||||||
EQUITY | ||||||||
Common stock, $.01 par value, 200,000,000 shares authorized, 100 shares outstanding | — | — | ||||||
Premium on stock and other capital contributions | 705 | 705 | ||||||
Retained earnings | 723 | 730 | ||||||
Total Equity | 1,428 | 1,435 | ||||||
TOTAL LIABILITIES AND EQUITY | $ | 4,828 | $ | 4,742 | ||||
| December 31, 2011 | December 31, 2010 | |||||||
| (millions of dollars, except shares) | ||||||||
LIABILITIES AND EQUITY | ||||||||
CURRENT LIABILITIES | ||||||||
Short-term debt | $ | 74 | $ | — | ||||
Accounts payable and accrued liabilities | 209 | 194 | ||||||
Accounts payable due to associated companies | 57 | 75 | ||||||
Capital lease obligations due within one year | 8 | 8 | ||||||
Taxes accrued | 63 | 62 | ||||||
Interest accrued | 17 | 18 | ||||||
Other | 110 | 119 | ||||||
|
|
|
| |||||
Total Current Liabilities | 538 | 476 | ||||||
|
|
|
| |||||
DEFERRED CREDITS | ||||||||
Regulatory liabilities | 169 | 147 | ||||||
Deferred income taxes, net | 1,039 | 958 | ||||||
Investment tax credits | 5 | 7 | ||||||
Other postretirement benefit obligations | 66 | 67 | ||||||
Income taxes payable | — | 3 | ||||||
Liabilities and accrued interest related to uncertain tax positions | 38 | 52 | ||||||
Other | 68 | 64 | ||||||
|
|
|
| |||||
Total Deferred Credits | 1,385 | 1,298 | ||||||
|
|
|
| |||||
LONG-TERM LIABILITIES | ||||||||
Long-term debt | 1,540 | 1,540 | ||||||
Capital lease obligations | 78 | 86 | ||||||
|
|
|
| |||||
Total Long-Term Liabilities | 1,618 | 1,626 | ||||||
|
|
|
| |||||
COMMITMENTS AND CONTINGENCIES (NOTE 13) | ||||||||
EQUITY | ||||||||
Common stock, $.01 par value, 200,000,000 shares authorized, 100 shares outstanding | — | — | ||||||
Premium on stock and other capital contributions | 705 | 705 | ||||||
Retained earnings | 797 | 723 | ||||||
|
|
|
| |||||
Total Equity | 1,502 | 1,428 | ||||||
|
|
|
| |||||
TOTAL LIABILITIES AND EQUITY | $ | 5,043 | $ | 4,828 | ||||
|
|
|
| |||||
The accompanying Notes are an integral part of these Financial Statements.
221
PEPCO
POTOMAC ELECTRIC POWER COMPANY
STATEMENTS OF CASH FLOWS
For the Year Ended December 31, | 2010 | 2009 | 2008 | |||||||||
| (millions of dollars) | ||||||||||||
OPERATING ACTIVITIES | ||||||||||||
Net Income | $ | 108 | $ | 106 | $ | 116 | ||||||
Adjustments to reconcile net income to net cash from operating activities: | ||||||||||||
Depreciation and amortization | 162 | 145 | 141 | |||||||||
Effect of divestiture-related claims | 11 | (40 | ) | — | ||||||||
Changes in restricted cash equivalents related to Mirant settlement | — | 102 | 315 | |||||||||
Deferred income taxes | 74 | 122 | 185 | |||||||||
Investment tax credit adjustments | (2 | ) | (2 | ) | (2 | ) | ||||||
Changes in: | ||||||||||||
Accounts receivable | (15 | ) | 23 | (33 | ) | |||||||
Inventories | (1 | ) | 2 | — | ||||||||
Prepaid expenses | 3 | (9 | ) | (2 | ) | |||||||
Regulatory assets and liabilities, net | (34 | ) | (66 | ) | (309 | ) | ||||||
Accounts payable and accrued liabilities | 15 | 4 | (8 | ) | ||||||||
Pension contributions | — | (170 | ) | — | ||||||||
Prepaid pension expense, excluding contributions | 22 | 17 | 10 | |||||||||
Taxes accrued | 6 | 77 | (174 | ) | ||||||||
Interest accrued | (1 | ) | (1 | ) | 2 | |||||||
Other assets and liabilities | 11 | 21 | (18 | ) | ||||||||
Net Cash From Operating Activities | 359 | 331 | 223 | |||||||||
INVESTING ACTIVITIES | ||||||||||||
Investment in property, plant and equipment | (359 | ) | (288 | ) | (275 | ) | ||||||
DOE capital reimbursement awards received | 11 | — | — | |||||||||
Changes in restricted cash equivalents | 1 | (1 | ) | 1 | ||||||||
Net other investing activities | 3 | (1 | ) | 1 | ||||||||
Net Cash Used By Investing Activities | (344 | ) | (290 | ) | (273 | ) | ||||||
FINANCING ACTIVITIES | ||||||||||||
Dividends paid to Parent | (115 | ) | — | (89 | ) | |||||||
Capital contribution from Parent | — | 94 | 78 | |||||||||
Issuances of long-term debt | — | 110 | 500 | |||||||||
Reacquisition of long-term debt | (16 | ) | (50 | ) | (238 | ) | ||||||
(Repayments) issuances of short-term debt, net | — | (125 | ) | (55 | ) | |||||||
Net other financing activities | (9 | ) | (3 | ) | (19 | ) | ||||||
Net Cash (Used by) From Financing Activities | (140 | ) | 26 | 177 | ||||||||
Net (Decrease) Increase in Cash and Cash Equivalents | (125 | ) | 67 | 127 | ||||||||
Cash and Cash Equivalents at Beginning of Year | 213 | 146 | 19 | |||||||||
CASH AND CASH EQUIVALENTS AT END OF YEAR | $ | 88 | $ | 213 | $ | 146 | ||||||
SUPPLEMENTAL DISCLOSURE OF CASH FLOW INFORMATION | ||||||||||||
Cash paid for interest (net of capitalized interest of $4 million, $4 million and $2 million, respectively) | $ | 94 | $ | 97 | $ | 87 | ||||||
Cash (received) paid for income taxes | (20 | ) | (126 | ) | 60 | |||||||
For the Year Ended December 31, | 2011 | 2010 | 2009 | |||||||||
| (millions of dollars) | ||||||||||||
OPERATING ACTIVITIES | ||||||||||||
Net Income | $ | 99 | $ | 108 | $ | 106 | ||||||
Adjustments to reconcile net income to net cash from operating activities: | ||||||||||||
Depreciation and amortization | 171 | 162 | 145 | |||||||||
Effects of divestiture-related claims | — | 11 | (40 | ) | ||||||||
Changes in restricted cash equivalents related to Mirant settlement | — | — | 102 | |||||||||
Deferred income taxes | 73 | 74 | 122 | |||||||||
Investment tax credit amortization | (2 | ) | (2 | ) | (2 | ) | ||||||
Changes in: | ||||||||||||
Accounts receivable | 33 | (15 | ) | 23 | ||||||||
Inventories | (6 | ) | (1 | ) | 2 | |||||||
Prepaid expenses | 1 | 3 | (9 | ) | ||||||||
Regulatory assets and liabilities, net | (43 | ) | (34 | ) | (66 | ) | ||||||
Accounts payable and accrued liabilities | (27 | ) | 15 | 4 | ||||||||
Pension contributions | (40 | ) | — | (170 | ) | |||||||
Prepaid pension expense, excluding contributions | 24 | 22 | 17 | |||||||||
Taxes accrued | 73 | 6 | 77 | |||||||||
Interest accrued | (1 | ) | (1 | ) | (1 | ) | ||||||
Other assets and liabilities | 2 | 11 | 21 | |||||||||
|
|
|
|
|
| |||||||
Net Cash From Operating Activities | 357 | 359 | 331 | |||||||||
|
|
|
|
|
| |||||||
INVESTING ACTIVITIES | ||||||||||||
Investment in property, plant and equipment | (521 | ) | (359 | ) | (288 | ) | ||||||
Department of Energy capital reimbursement awards received | 48 | 11 | — | |||||||||
Changes in restricted cash equivalents | — | 1 | (1 | ) | ||||||||
Net other investing activities | (7 | ) | 3 | (1 | ) | |||||||
|
|
|
|
|
| |||||||
Net Cash Used By Investing Activities | (480 | ) | (344 | ) | (290 | ) | ||||||
|
|
|
|
|
| |||||||
FINANCING ACTIVITIES | ||||||||||||
Dividends paid to Parent | (25 | ) | (115 | ) | — | |||||||
Capital contribution from Parent | — | — | 94 | |||||||||
Issuances of long-term debt | — | — | 110 | |||||||||
Reacquisitions of long-term debt | — | (16 | ) | (50 | ) | |||||||
Issuances (Repayments) of short-term debt, net | 74 | — | (125 | ) | ||||||||
Net other financing activities | (2 | ) | (9 | ) | (3 | ) | ||||||
|
|
|
|
|
| |||||||
Net Cash From (Used by) Financing Activities | 47 | (140 | ) | 26 | ||||||||
|
|
|
|
|
| |||||||
Net (Decrease) Increase in Cash and Cash Equivalents | (76 | ) | (125 | ) | 67 | |||||||
Cash and Cash Equivalents at Beginning of Year | 88 | 213 | 146 | |||||||||
|
|
|
|
|
| |||||||
CASH AND CASH EQUIVALENTS AT END OF YEAR | $ | 12 | $ | 88 | $ | 213 | ||||||
|
|
|
|
|
| |||||||
SUPPLEMENTAL DISCLOSURE OF CASH FLOW INFORMATION | ||||||||||||
Cash paid for interest (net of capitalized interest of $8 million, $4 million and $4 million, respectively) | $ | 91 | $ | 94 | $ | 97 | ||||||
Cash received for income taxes | (108 | ) | (20 | ) | (126 | ) | ||||||
The accompanying Notes are an integral part of these Financial Statements.
222
PEPCO
POTOMAC ELECTRIC POWER COMPANY
STATEMENTS OF EQUITY
| Common Stock | Premium on Stock | Retained Earnings | Total | |||||||||||||||||
(millions of dollars, except shares) | Shares | Par Value | ||||||||||||||||||
BALANCE, DECEMBER 31, 2007 | 100 | $ | — | $ | 533 | $ | 597 | $ | 1,130 | |||||||||||
Net Income | — | — | — | 116 | 116 | |||||||||||||||
Dividends on common stock | — | — | — | (89 | ) | (89 | ) | |||||||||||||
Capital contribution from Parent | — | — | 78 | — | 78 | |||||||||||||||
BALANCE, DECEMBER 31, 2008 | 100 | — | 611 | 624 | 1,235 | |||||||||||||||
Net Income | — | — | — | 106 | 106 | |||||||||||||||
Capital contribution from Parent | — | — | 94 | — | 94 | |||||||||||||||
BALANCE, DECEMBER 31, 2009 | 100 | — | 705 | 730 | 1,435 | |||||||||||||||
Net Income | — | — | — | 108 | 108 | |||||||||||||||
Dividends on common stock | — | — | — | (115 | ) | (115 | ) | |||||||||||||
BALANCE, DECEMBER 31, 2010 | 100 | $ | — | $ | 705 | $ | 723 | $ | 1,428 | |||||||||||
| Common Stock | Premium | Retained | ||||||||||||||||||
(millions of dollars, except shares) | Shares | Par Value | on Stock | Earnings | Total | |||||||||||||||
BALANCE, DECEMBER 31, 2008 | 100 | $ | — | $ | 611 | $ | 624 | $ | 1,235 | |||||||||||
Net Income | — | — | — | 106 | 106 | |||||||||||||||
Capital contribution from Parent | — | — | 94 | — | 94 | |||||||||||||||
|
|
|
|
|
|
|
|
|
| |||||||||||
BALANCE, DECEMBER 31, 2009 | 100 | — | 705 | 730 | 1,435 | |||||||||||||||
Net Income | — | — | — | 108 | 108 | |||||||||||||||
Dividends on common stock | — | — | — | (115 | ) | (115 | ) | |||||||||||||
|
|
|
|
|
|
|
|
|
| |||||||||||
BALANCE, DECEMBER 31, 2010 | 100 | — | 705 | 723 | 1,428 | |||||||||||||||
Net Income | — | — | — | 99 | 99 | |||||||||||||||
Dividends on common stock | — | — | — | (25 | ) | (25 | ) | |||||||||||||
|
|
|
|
|
|
|
|
|
| |||||||||||
BALANCE, DECEMBER 31, 2011 | 100 | $ | — | $ | 705 | $ | 797 | $ | 1,502 | |||||||||||
|
|
|
|
|
|
|
|
|
| |||||||||||
The accompanying Notes are an integral part of these Financial Statements.
223
PEPCO
NOTES TO FINANCIAL STATEMENTS
POTOMAC ELECTRIC POWER COMPANY
(1)ORGANIZATION
Potomac Electric Power Company (Pepco) is engaged in the transmission and distribution of electricity in the District of Columbia and major portions of Prince George’s County and Montgomery County in suburban Maryland. Pepco also provides Default Electricity Supply, which is the supply of electricity at regulated rates to retail customers in its service territories who do not elect to purchase electricity from a competitive supplier. Default Electricity Supply is known as Standard Offer Service in both the District of Columbia and Maryland. Pepco is a wholly owned subsidiary of Pepco Holdings, Inc. (Pepco Holdings or PHI).
(2)SIGNIFICANT ACCOUNTING POLICIES
Use of Estimates
The preparation of financial statements in conformity with accounting principles generally accepted in the United States of America requires management to make certain estimates and assumptions that affect the reported amounts of assets, liabilities, revenues and expenses, and related disclosures of contingent assets and liabilities in the financial statements and accompanying notes. Although Pepco believes that its estimates and assumptions are reasonable, they are based upon information available to management at the time the estimates are made. Actual results may differ significantly from these estimates.
Significant matters that involve the use of estimates include the assessment of contingencies, the calculation of future cash flows and fair value amounts for use in asset impairment evaluations, pension and other postretirement benefits assumptions, unbilled revenue calculations, the assessment of the probability of recovery of regulatory assets, accrual of storm restoration costs, accrual of restructuring charges, recognition of changes in network service transmission rates for prior service year costs, accrual of self-insurance reserves for general and auto liability claims and income tax provisions and reserves. Additionally, Pepco is subject to legal, regulatory, and other proceedings and claims that arise in the ordinary course of its business. Pepco records an estimated liability for these proceedings and claims when it is probable that a loss has been incurred and the loss is determined to be probable and is reasonably estimable.
Storm Costs
During 2011, Pepco incurred significant costs associated with Hurricane Irene that affected its service territory. Total incremental storm costs associated with Hurricane Irene were $18 million, with $12 million incurred for repair work and $6 million incurred as capital expenditures. Costs incurred for repair work of $10 million were deferred as a regulatory asset to reflect the probable recovery of these storm costs in Pepco’s jurisdictions, and the remaining $2 million was charged to Other operation and maintenance expense. Pepco is seeking recovery of the incremental Hurricane Irene costs in each of its jurisdictions in pending or planned distribution rate case filings.
Restructuring ChargesCharge
PHI commenced a comprehensive organizational review in the second quarter of 2010 to identify opportunities to streamline the organization and to achieve certain reductions in corporate overhead costs allocated to its operating segments. The restructuring plan resulted in the elimination of 164 employee positions. Pepco’s accrual of $15 million in costs associated with termination benefits was based on estimated severance costs and actuarial calculations of the present value of certain changes in pension and other postretirement benefits for terminated employees. There were no material changes to this accrual in 2011.
224
PEPCO
Network Service Transmission Rates
In May of each year, Pepco provides its updated network service transmission rate to the Federal Energy Regulatory Commission (FERC) effective for the service year beginning June 1 of the current year and ending May 31 of the following year. The network service transmission rate includes a true-up for costs incurred in the prior service year that had not yet been reflected in rates charged to customers. In the first half of 2010, Pepco recorded an increase in transmission service revenue of $6 million that was then estimated to be collected over the 2010-2011 service year for costs incurred in the 2009 service year. In the fourth quarter of 2010, Pepco recorded an immaterial decrease in transmission service revenue that it
PEPCO
estimates will be reflected as a reduction in transmission service rates for the 2011-2012 service year based on costs incurred during the first seven months of the 2010 service year. Pepco will update its estimate of the reduction in transmission service revenue for the 2011-2012 service year in the first and second quarters of 2011 as it progresses toward the completion of the 2010-2011 service year and final cost information from the 2010-2011 service year becomes available. In the second quarter of 2011, Pepco expects to record a true-up as part of its updated transmission service rates that are submitted to FERC.
Revenue Recognition
Pepco recognizes revenue upon distribution of electricity to its customers, including amountsunbilled revenue for services rendered, but not yet billed (unbilled revenue). Pepco recorded amounts forbilled. Pepco’s unbilled revenue of $95was $82 million and $89$95 million as of December 31, 2011 and 2010, respectively, and 2009, respectively. Thesethese amounts are included in Accounts receivable. Pepco calculates unbilled revenue using an output basedoutput-based methodology. This methodology is based on the supply of electricity intended for distribution to customers. The unbilled revenue process requires management to make assumptions and judgments about input factors such as customer sales mix, temperature, and estimated line losses (estimates of electricity expected to be lost in the process of its transmission and distribution to customers). The assumptions and judgementsjudgments are inherently uncertain and susceptible to change from period to period, and if actual results differ from projected results, the impact could be material.
Taxes related to the consumption of electricity by its customers, such as fuel, energy, or other similar taxes, are components of Pepco’s tariffs and, as such, are billed to customers and recorded in Operating revenues.revenue. Accruals for the remittance of these taxes by Pepco are recorded in Other taxes. Excise tax related generally to the consumption of gasoline by Pepco in the normal course of business is charged to operations, maintenance or construction, and is not material.
Taxes Assessed by a Governmental Authority on Revenue-Producing Transactions
Taxes included in Pepco’s gross revenues were $350 million, $333 million $254 million and $241$254 million for the years ended December 31, 2011, 2010 and 2009, and 2008, respectively.
Long-Lived Assets Impairment Evaluation
Pepco evaluates certain long-lived assets to be held and used (for example, equipment and real estate) for impairment whenever events or changes in circumstances indicate that their carrying value may not be recoverable. Examples of such events or changes include a significant decrease in the market price of a long-lived asset or a significant adverse change in the manner an asset is being used or its physical condition. A long-lived asset to be held and used is written down to fair value if the expected future undiscounted cash flow from the asset is less than its carrying value.
225
PEPCO
For long-lived assets that can be classified as assets to be disposed of by sale, an impairment loss is recognized to the extent that the asset’s carrying value exceeds its fair value including costs to sell.
Income Taxes
Pepco, as a direct subsidiary of Pepco Holdings, is included in the consolidated federal income tax return of PHI. Federal income taxes are allocated to Pepco based upon the taxable income or loss amounts, determined on a separate return basis.
The financial statements include current and deferred income taxes. Current income taxes represent the amount of tax expected to be reported on Pepco’s state income tax returns and the amount of federal income tax allocated from Pepco Holdings.
PEPCO
Deferred income tax assets and liabilities represent the tax effects of temporary differences between the financial statement basis and tax basis of existing assets and liabilities and they are measured using presently enacted tax rates. The portion of Pepco’s deferred tax liability applicable to its utility operations that has not been recovered from utility customers represents income taxes recoverable in the future and is included in Regulatory assets on the balance sheets. See Note (6), “Regulatory Assets and Regulatory Liabilities,Matters,” for additional information.
Deferred income tax expense generally represents the net change during the reporting period in the net deferred tax liability and deferred recoverable income taxes.
Pepco recognizes interest on under or over paymentsunderpayments and overpayments of income taxes, interest on uncertain tax positions, and tax-related penalties in income tax expense.
Investment tax credits are being amortized to income over the useful lives of the related property.
Consolidation of Variable Interest Entities
Due to a variable element in the pricing structure of Pepco’s power purchase agreement with Panda-Brandywine, L.P. (Panda) entered into in 1991, pursuant to which Pepco was obligated to purchase from Panda 230 megawatts of capacity and energy annually through 2021 (the Panda PPA), Pepco potentially assumed the variability in the operations of the plants related to the Panda PPA and therefore had a variable interest in the entity.
During the third quarter of 2008, Pepco transferred the Panda PPA to Sempra Energy Trading LLP. Net purchase activities under the Panda PPA for the year ended December 31, 2008 were approximately $59 million.
Cash and Cash Equivalents
Cash and cash equivalents include cash on hand, cash invested in money market funds and commercial paper held with original maturities of three months or less. Additionally, deposits in PHI’s money pool, which Pepco and certain other PHI subsidiaries use to manage short-term cash management requirements, are considered cash equivalents. Deposits in the money pool are guaranteed by PHI. PHI deposits funds in the money pool to the extent that the pool has insufficient funds to meet the needs of its participants, which may require PHI to borrow funds for deposit from external sources.
Restricted Cash Equivalents
The restricted cash equivalents included in Current Assets and the restricted cash equivalents included in Investments and Other Assets consist of (i) cash held as collateral that is restricted from use for general corporate purposes and (ii) cash equivalents that are specifically segregated based on management’s intent to use such cash equivalents for a particular purpose. The classification as current or non-current conforms to the classification of the related liabilities.
Accounts Receivable and Allowance for Uncollectible Accounts
Pepco’s accounts receivable balance primarily consists of customer accounts receivable, other accounts receivable, and accrued unbilled revenue. Accrued unbilled revenue represents revenue earned in the current period but not billed to the customer until a future date (usually within one month after the receivable is recorded).
226
PEPCO
Pepco maintains an allowance for uncollectible accounts and changes in the allowance are recorded as an adjustment to Other operation and maintenance expense in the statements of income. Pepco determines the amount of the allowance based on specific identification of material amounts at risk by customer and
PEPCO
maintains a reserve based on its historical collection experience. The adequacy of this allowance is assessed on a quarterly basis by evaluating all known factors such as the aging of the receivables, historical collection experience, the economic and competitive environment and changes in the creditworthiness of its customers. Although management believes its allowance is adequate, it cannot anticipate with any certainty the changes in the financial condition of its customers. As a result, Pepco records adjustments to the allowance for uncollectible accounts in the period in which the new information that requires an adjustment to the reserve becomes known.
Inventories
Included in inventories are transmission and distribution materials and supplies. Pepco utilizes the weighted average cost method of accounting for inventory items. Under this method, an average price is determined for the quantity of units acquired at each price level and is applied to the ending quantity to calculate the total ending inventory balance. Materials and supplies inventory are recorded in inventory when purchased and then expensed or capitalized to plant, as appropriate, when installed.
Regulatory Assets and Regulatory Liabilities
Pepco is regulated by the Maryland Public Service Commission (MPSC) and the District of Columbia Public Service Commission (DCPSC). The transmission of electricity by Pepco is regulated by FERC.
Based on the regulatory framework in which it has operated, Pepco has historically applied, and in connection with its transmission and distribution business continues to apply, FASBthe Financial Accounting Standards Board (FASB) guidance on regulated operations (Accounting Standards Codification (ASC) 980). The guidance allows regulated entities, in appropriate circumstances, to defer the income statement impact of certain costs that are expected to be recovered in future rates through the establishment of regulatory assets. Management’s assessment of the probability of recovery of regulatory assets requires judgment and interpretation of laws, regulatory commission orders and other factors. If management subsequently determines, based on changes in facts or circumstances, that a regulatory asset is not probable of recovery, the regulatory asset would be eliminated through a charge to earnings.
Effective June 2007, the MPSC approved a bill stabilization adjustment mechanism (BSA) for retail customers. Effective November 2009, the DCPSC approved a BSA for retail customers. See Note (13) “Commitments and Contingencies(6), “Regulatory Matters – Regulatory and Other Matters – Rate Proceedings.” For customers to whom the BSA applies, Pepco recognizes distribution revenue based on an approved distribution charge per customer. From a revenue recognition standpoint, the BSA has the effect of decoupling the distribution revenue recognized in a reporting period from the amount of power delivered during that period. Pursuant to this mechanism, Pepco recognizes either (i) a positive adjustment equal to the amount by which revenue from Maryland and the District of Columbia retail distribution sales falls short of the revenue that Pepco is entitled to earn based on the approved distribution charge per customer, or (ii) a negative adjustment equal to the amount by which revenue from such distribution sales exceeds the revenue that Pepco is entitled to earn based on the approved distribution charge per customer (a Revenue Decoupling Adjustment). A net positive Revenue Decoupling Adjustment is recorded as a regulatory asset and a net negative Revenue Decoupling Adjustment is recorded as a regulatory liability.
227
PEPCO
Investment in Trust
Represents assets held in a trust for the benefit of participants in the Pepco Owned Life Insurance plan.
PEPCO
Property, Plant and Equipment
Property, plant and equipment are recorded at original cost, including labor, materials, asset retirement costs and other direct and indirect costs including capitalized interest. The carrying value of property, plant and equipment is evaluated for impairment whenever circumstances indicate the carrying value of those assets may not be recoverable. Upon retirement, the cost of regulated property, net of salvage, is charged to accumulated depreciation. For additional information regarding the treatment of asset removal obligations, see the “Asset Removal Costs” section included in this Note.
The annual provision for depreciation on electric property, plant and equipment is computed on a straight-line basis using composite rates by classes of depreciable property. Accumulated depreciation is charged with the cost of depreciable property retired, less salvage and other recoveries. Property, plant and equipment other than electric facilities is generally depreciated on a straight-line basis over the useful lives of the assets. The system-wide composite depreciation rates for 2011, 2010 2009, and 20082009 for Pepco’s transmission and distribution system property were approximately 2.6%, 2.7%,2.6% and 2.7%, respectively.
In 2010, Pepco received an award from the U.S. Department of Energy (DOE) under the American Recovery and Reinvestment Act of 2009. Pepco was awarded $149 million to fund a portion of the costs incurred for the implementation of an advanced metering infrastructure system, direct load control, distribution automation and communications infrastructure in its Maryland and District of Columbia service territories. Pepco has elected to recognize the awards as a reduction in the carrying value of the assets acquired rather than grant income over the service period.
Capitalized Interest and Allowance for Funds Used During Construction
In accordance with FASB guidance on regulated operations (ASC 980), utilities can capitalize the capital costs of financing the construction of plant and equipment as Allowance for Funds Used During Construction (AFUDC). This results in the debt portion of AFUDC being recorded as a reduction of Interest expense and the equity portion of AFUDC being recorded as an increase to Other income in the accompanying statements of income.
Pepco recorded AFUDC for borrowed funds of $4$8 million, $4 million and $2$4 million for the years ended December 31, 2011, 2010 2009, and 2008,2009, respectively.
Pepco recorded amounts for the equity component of AFUDC of $6$12 million, $3$6 million and $3 million for the years ended December 31, 2011, 2010 2009 and 2008,2009, respectively.
Leasing Activities
Pepco’s lease transactions include office space, equipment, software and vehicles. In accordance with FASB guidance on leases (ASC 840), these leases are classified as either operating leases or capital leases.
228
PEPCO
Operating Leases
An operating lease in which Pepco is the lessee generally results in a level income statement charge over the term of the lease, reflecting the rental payments required by the lease agreement. If rental payments are not made on a straight-line basis, Pepco’s policy is to recognize rent expense on a straight-line basis over the lease term unless another systematic and rational allocation basis is more representative of the time pattern in which the leased property is physically employed.
PEPCO
Capital Leases
For ratemaking purposes, capital leases in which Pepco is the lessee are treated as operating leases; therefore, in accordance with FASB guidance on regulated operations (ASC 980), the amortization of the leased asset is based on the recovery of rental payments through customer rates. Investments in equipment under capital leases are stated at cost, less accumulated depreciation. Depreciation is recorded on a straight-line basis over the equipment’s estimated useful life.
Amortization of Debt Issuance and Reacquisition Costs
Pepco defers and amortizes debt issuance costs and long-term debt premiums and discounts over the lives of the respective debt issues. When refinancing or redeeming existing debt, any unamortized premiums, discounts and debt issuance costs, as well as debt redemption costs, are classified as regulatory assets and are amortized generally over the life of the new issue.
Asset Removal Costs
In accordance with FASB guidance, asset removal costs are recorded as regulatory liabilities. At December 31, 2011 and 2010, and 2009, $122$144 million and $113$122 million of asset removal costs, respectively, are included in regulatoryRegulatory liabilities in the accompanying balance sheets.
Pension and Postretirement Benefit Plans
Pepco Holdings sponsors the PHI Retirement Plan, a non-contributory, retirementdefined benefit pension plan that covers substantially all employees of Pepco (the PHI Retirement Plan) and certain employees of other Pepco Holdings subsidiaries. Pepco Holdings also provides supplemental retirement benefits to certain eligible executives and key employees through nonqualified retirement plans and provides certain postretirement health care and life insurance benefits for eligible retired employees.
The PHI Retirement Plan is accounted for in accordance with FASB guidance on retirement benefits (ASC 715).
Dividend Restrictions
All of Pepco’s shares of outstanding common stock are held by PHI, its parent company. In addition to its future financial performance, the ability of Pepco to pay dividends to its parent company is subject to limits imposed by: (i) state corporate laws, which impose limitations on the funds that can be used to pay dividends, and (ii) the prior rights of holders of future preferred stock, if any, and existing and future mortgage bonds and other long-term debt issued by Pepco and any other restrictions imposed in connection with the incurrence of liabilities. Pepco has no shares of preferred stock outstanding. Pepco had approximately $723$797 million and $730$723 million of retained earnings available for payment of common stock dividends at December 31, 20102011 and 2009,2010, respectively. These amounts represent the total retained earnings balances at those dates.
229
PEPCO
Reclassifications and Adjustments
Certain prior period amounts have been reclassified in order to conform to current period presentation. The following adjustments have been recorded and are not considered material individually or in the aggregate:
Income Tax Adjustments
During 2011, Pepco recorded an adjustment to correct certain income tax errors related to prior periods associated with the interest on uncertain tax positions. The adjustment resulted in an increase in income tax expense of $1 million.
Operating Expense
DuringIn 2010, Pepco recorded an adjustment to correct certain errors related to other taxes which resulted in a decrease to Other taxes expense of $5 million (pre-tax).
During 2008, Pepco recorded adjustments to correct errors in Other operation and maintenance expenses for prior periods dating back to February 2005 during which (i) customer late payment fees were incorrectly recognized and (ii) stock-based compensation expense related to certain restricted stock awards granted under the Long-Term Incentive Plan was understated. These adjustments resulted in a total increase in Other operation and maintenance expenses of $6 million for the year ended December 31, 2008, all of which related to prior periods.
(3)NEWLY ADOPTED ACCOUNTING STANDARDS
Transfers and Servicing (ASC 860)
The FASB issued new guidance that removes the concept of a qualifying special-purpose entity (QSPE) from the guidance on transfers and servicing and the QSPE scope exception in the guidance on consolidation. The new guidance also changes the requirements for derecognizing financial assets and requires additional disclosures about a transferor’s continuing involvement in transferred financial assets. The guidance was effective for transfers of financial assets occurring in fiscal periods beginning on January 1, 2010 for Pepco. The guidance did not have a material impact on PHI’s overall financial condition, results of operations, or cash flows.
Fair Value MeasurementMeasurements and Disclosures (ASC 820)
The FASB issued new disclosure requirements that require significant items within the reconciliation of the Level 3 valuation category to be presented in separate categories for recurringpurchases, sales, issuances and non-recurring fair value measurements.settlements. The guidance was effective beginning with Pepco’s March 31, 20102011 financial statements, requiresstatements. Pepco has included the disaggregation of balance sheet items measured at fair value into subsets of balance sheet items based on the nature and risks of the items. The standard requires descriptions of pricing inputs and valuation methodologies for instruments with Level 2 or 3 valuation inputs. In addition, the standard requires information about any significant transfers of instruments between Level 1 and 2 valuation categories. These additional disclosures are includednew disclosure requirements in Note (12), “Fair Value Disclosures.Disclosures,” to its financial statements.
Consolidation of Variable Interest EntitiesCompensation Retirement Benefits—Multiemployer Plans (ASC 810)715-80)
TheIn September 2011, the FASB issued new consolidation guidance regarding variable interest entitiesdisclosure requirements for participants in multiemployer pension and postretirement benefit plans that would be effective January 1, 2010 that eliminates the quantitative analysis requirement and adds new qualitative factors to determine whether consolidation is required. The new qualitative factors are applied on a quarterly basis to interests in variable interest entities. Under the new guidance, the holder of the interestbeginning with the power to direct the most significant activities of the entity and the right to receive benefits or absorb losses significant to the entity would consolidate. The new guidance retains the provision that allows entities created beforePepco’s December 31, 20032011 financial statements. Most of these disclosures are not applicable to be scoped out fromPepco because it participates in PHI’s single employer pension plan and accounts for it as participation in a consolidation assessment if exhaustive efforts are taken and there is insufficient information to determine whether there is a relationship with a variable interest entity or the primary beneficiary of a variable interest entity. This guidance did not have a material impact on Pepco’s overall financial condition, results of operations, or cash flows.
Subsequent Events (ASC 855)
multiemployer plan. The FASB issued new guidance that eliminates the requirementdisclosure requirements for Pepco to disclose the date through which it has evaluated subsequent events beginning with its March 31, 2010 financial statements.
PEPCO
were limited and are already provided in Pepco’s Note (9), “Pension and Other Postretirement Benefits.”
(4)RECENTLY ISSUED ACCOUNTING STANDARDS, NOT YET ADOPTED
Fair Value MeasurementMeasurements and Disclosures (ASC 820)
TheIn May 2011, the FASB issued new disclosure requirements that require the disaggregation of the Level 3guidance on fair value measurement reconciliations into separate categories for significant purchases, sales, issuances, and settlements. This requirement isdisclosures that will be effective beginning with Pepco’s March 31, 20112012 financial statements. Pepco is evaluating the impact of thisThe new guidance will change how fair value is measured in specific instances and expand disclosures about fair value measurements. Pepco expects that it will have to provide additional disclosures, but does not expect this guidance to have a significant impact on its financial statement footnote disclosures.fair value measurements.
(5)SEGMENT INFORMATION
The company operates its business as one regulated utility segment, which includes all of its services as described above.
230
PEPCO
(6)REGULATORY ASSETS AND REGULATORY LIABILITIESMATTERS
Regulatory Assets and Regulatory Liabilities
The components of Pepco’s regulatory asset and liability balances at December 31, 20102011 and 20092010 are as follows:
| 2010 | 2009 | 2011 | 2010 | |||||||||||||
| (millions of dollars) | (millions of dollars) | |||||||||||||||
Regulatory Assets | ||||||||||||||||
Recoverable meter-related costs (a) | $ | 86 | $ | 15 | ||||||||||||
Deferred income taxes | $ | 45 | $ | 40 | 57 | 45 | ||||||||||
Recoverable workers’ compensation and long-term disability costs | 34 | 28 | ||||||||||||||
Deferred debt extinguishment costs (a) | 30 | 33 | ||||||||||||||
Demand-side management | 20 | 10 | ||||||||||||||
Blueprint for the Future | 10 | 5 | ||||||||||||||
Deferred energy supply costs | 8 | 6 | 4 | 8 | ||||||||||||
Deferred debt extinguishment costs (a) | 33 | 36 | ||||||||||||||
Recoverable meter related costs (a) | 15 | — | ||||||||||||||
Recoverable workers’ compensation and long-term disability costs | 28 | 32 | ||||||||||||||
Other | 62 | 52 | 58 | 47 | ||||||||||||
|
| |||||||||||||||
Total Regulatory Assets | $ | 191 | $ | 166 | $ | 299 | $ | 191 | ||||||||
|
| |||||||||||||||
Regulatory Liabilities | ||||||||||||||||
Asset removal costs | $ | 122 | $ | 113 | $ | 144 | $ | 122 | ||||||||
Deferred income taxes due to customers | 12 | 15 | ||||||||||||||
Deferred energy supply costs | 12 | 16 | ||||||||||||||
Other | 1 | 1 | 25 | 25 | ||||||||||||
|
| |||||||||||||||
Total Regulatory Liabilities | $ | 147 | $ | 145 | $ | 169 | $ | 147 | ||||||||
|
| |||||||||||||||
| (a) | A return is generally earned on these deferrals. |
A description for each category of regulatory assets and regulatory liabilities follows:
Recoverable Meter-Related Costs: Represents costs associated with the installation of smart meters and the early retirement of existing meters throughout Pepco’s service territory as a result of the Advanced Metering Infrastructure project.
Deferred Income Taxes:Represents a receivable from our customers for tax benefits Pepco previously flowed through before the company was ordered to account for the tax benefits as deferred income taxes. As the temporary differences between the financial statement basis and tax basis of assets reverse, the deferred recoverable balances are reversed.
Deferred Energy Supply Costs:Recoverable Workers’ Compensation and Long-Term Disability CostsThe regulatory asset represents primarily deferred energy: Represents accrued workers’ compensation and long-term disability costs associated with a net under-recovery of Default Electricity Supply costs in the District of Columbia thatfor Pepco, which are probable of recovery in rates. The regulatory liability represents deferred transmission and energy costs associated with a net over-recovery of Default Electricity Supply costs incurred in the District of Columbia and Maryland that will be refundedrecoverable from customers when actual claims are paid to customers.employees.
PEPCO
Deferred Debt Extinguishment Costs: Represents the costs of debt extinguishment for which recovery through regulated utility rates is considered probable and, if approved, will be amortized to interest expense during the authorized rate recovery period.
Recoverable Meter Related CostsDemand-Side Management:: Represents recoverable costs associated with the installation of smart meters and the early retirement of existing meters throughout Pepco’s service territory as a result of the Advanced Metering Infrastructure (AMI) project.customer energy efficiency programs.
Recoverable Workers’ CompensationBlueprint for the Future: Includes costs associated with Blueprint for the Future initiatives which include programs to help customers better manage their energy use and Long-Term Disability coststo allow each utility to better manage their electrical and natural gas distribution systems.
Deferred Energy Supply Costs: Represents futureThe regulatory asset represents primarily deferred costs associated with a net under-recovery of Default Electricity Supply costs incurred by Pepco that are probable of recovery of pay as you go reserves. Quarterly adjustments are made to reflect the difference between claims paid and claims accrued during the quarter to bring the account back to a pay as you go basis. There is a monthly amortization of the transition obligation.in rates.
Other: Represents miscellaneous regulatory assets that generally are being amortized over 1 to 20 years. Also includes the under-recovery of administrative costs associated with Default Electricity Supply in the District of Columbia and Maryland.
Asset Removal Costs: Pepco’s depreciation rates include a component for removal costs, as approved by the relevant federal and state regulatory commissions. As such, Pepco has recorded a regulatory liability for its estimate of the difference between incurred removal costs and the amount of removal costs recovered through depreciation rates.
Deferred Income Taxes Due to Customers: Represents the portions of deferred income tax liabilities applicable to Pepco’s utility operations that have not been reflected in current customer rates for which future payment to customers is probable. As temporary differences between the financial statement basis and tax basis of assets reverse, deferred recoverable income taxes are amortized.
231
PEPCO
Other: Represents miscellaneous regulatory liabilities.
Regulatory Proceedings
District of Columbia Divestiture Case
In June 2000, the DCPSC approved a divestiture settlement under which Pepco is required to share with its District of Columbia customers the net proceeds realized by Pepco from the sale of its generation-related assets in 2000. This approval left unresolved issues of (i) whether Pepco should be required to share with customers the excess deferred income taxes (EDIT) and accumulated deferred investment tax credits (ADITC) associated with the sold assets and, if so, whether such sharing would violate the normalization provisions of the Internal Revenue Code and its implementing regulations and (ii) whether Pepco was entitled to deduct certain costs in determining the amount of proceeds to be shared.
In May 2010, the DCPSC issued an order addressing all of the remaining issues related to the sharing of the proceeds of Pepco’s divestiture of its generating assets. In the order, the DCPSC ruled that Pepco is not required to share EDIT and ADITC with customers. However, the order also disallowed certain items that Pepco had included in the costs deducted from the proceeds of the sale of the generation assets. The disallowance of these costs, together with interest on the disallowed amount, increased the aggregate amount Pepco was required to distribute to customers, pursuant to the sharing formula, by approximately $11 million, which Pepco recognized as an expense in 2010 and refunded the amounts to its customers. In June 2010, Pepco filed an application for reconsideration of the DCPSC’s order. In July 2010, the DCPSC denied Pepco’s application for reconsideration. In September 2010, Pepco filed an appeal of the DCPSC’s decision with the District of Columbia Court of Appeals. On April 12, 2011, the Court of Appeals affirmed the DCPSC order. Pepco determined not to appeal this decision.
Maryland Public Service Commission Reliability Investigation
In August 2010, following major storm events that occurred in July and August 2010, the MPSC initiated a proceeding for the purpose of investigating the reliability of Pepco’s distribution system and the quality of distribution service Pepco provided to its customers. On December 21, 2011, the MPSC issued an order in the proceeding imposing a fine on Pepco of $1 million, which Pepco has paid. In accordance with the order, Pepco filed a detailed work plan for the next five years, which provides a comprehensive description of Pepco’s reliability enhancement plan, its emergency response improvement project, and other communication and service restoration improvements. Pepco is also required to file quarterly updates and a year-end status report with the MPSC providing, among other things, detailed information about its reliability and emergency response improvement objectives; its progress in meeting such objectives, together with an analysis of trends concerning the measured duration and frequency of customer interruptions compared to 2010 baseline data; the amount of spending associated with such objectives; an explanation for any inability to meet such objectives; any proposed changes in funding these improvement projects; any changes to any of these projects; and interim and final results of Pepco’s system inspection program. In addition, Pepco must provide additional detail in these reports about its Estimated Time to Restoration Manager and the Customer Advocate, which personnel have been added by Pepco as part of its emergency response improvement project, and to explore the benefits of damage prediction models. Finally, Pepco was required to consider the comments and suggestions of other interested parties in the reliability proceeding regarding improvements that Pepco might make to its reliability enhancement programs. In these reports, Pepco will be required to demonstrate that its reliability enhancement plan costs were prudently spent and produced a significant improvement in reliability, and if it is unable to do so, the MPSC may deny Pepco reimbursement for future reliability enhancement expenditures or impose additional fines.
232
PEPCO
The MPSC also stated in the order that it intends to review in Pepco’s pending electric distribution base rate case the recovery of reliability costs and to disallow incremental costs it determines to be the result of imprudent management. Pepco believes its reliability costs have been prudently incurred and it intends to seek to recover its expenditures in its pending rate case. Furthermore, Pepco believes that its reliability enhancement plan will enable Pepco to meet the MPSC’s requirements.
Rate Proceedings
Over the last several years, Pepco has proposed in its service territories the adoption of a mechanism to decouple retail distribution revenue from the amount of power delivered to retail customers. A BSA has been approved and implemented for electric service in Maryland and in the District of Columbia. The MPSC has issued an order requiring modification of the BSA in Maryland so that revenues lost as a result of major storm outages are not collected if electric service is not restored to the pre-major storm levels within 24 hours of the start of a major storm (as discussed below). Under the BSA, customer distribution rates are subject to adjustment (through a credit or surcharge mechanism), depending on whether actual distribution revenue per customer exceeds or falls short of the revenue-per-customer amount approved by the applicable public service commission.
District of Columbia
On July 8, 2011, Pepco filed an application with the DCPSC to increase its electric distribution base rates by approximately $42 million annually, based on a return on equity (ROE) of 10.75%. In the effort to reduce the shortfall in revenues due to the delay in time or lag between when costs are incurred and when they are reflected in rates (regulatory lag), the filing includes a request for the DCPSC to approve a reliability investment recovery mechanism (RIM), to recover reliability-related capital expenditures incurred between base rate cases. Through the RIM, Pepco would collect in a surcharge the amount of its reliability-related capital expenditures based on its budget for the current year. The budgeted amount would be reconciled with actual capital expenditures on an annual basis and any over-recovery or under-recovery would be reflected in the next year’s surcharge. The work undertaken pursuant to the RIM would be subject to a prudency review by the DCPSC in the next base rate case or at more frequent intervals as determined by the DCPSC. Pepco’s operating and maintenance costs and other capital expenditures would remain subject to recovery through the traditional ratemaking process. A decision by the DCPSC is expected in the second quarter of 2012.
Maryland
Electric Distribution Base Rates
On December 16, 2011, Pepco submitted an application with the MPSC to increase its electric distribution base rates. The filing seeks approval of an annual rate increase of approximately $68.4 million, based on a requested ROE of 10.75%. In the effort to reduce regulatory lag, the filing includes a request for the MPSC to approve a RIM to recover reliability-related capital expenditures incurred between base rate cases. Through the RIM, Pepco would collect in a surcharge the amount of its reliability-related capital expenditures based on its budget for the current year. The budgeted amount would be reconciled with actual capital expenditures on an annual basis and any over-recovery or under-recovery would be reflected in the next year’s surcharge. The work undertaken pursuant to the RIM would be subject to a prudency review by the MPSC in the next base rate case or at more frequent intervals as determined by the MPSC. Pepco’s operating and maintenance costs and other capital expenditures would remain subject to recovery through the traditional ratemaking process. Pepco also has requested MPSC approval of the use of fully forecasted test years in future Pepco rate cases. A decision by the MPSC is expected in July 2012.
233
PEPCO
Major Storm Damage Recovery Proceedings
In February 2011, the MPSC initiated proceedings involving Pepco, as well as DPL and unaffiliated utilities in Maryland, for the purpose of reviewing how the BSA operates to recover revenues lost as a result of major storm outages. On January 25, 2012, the MPSC issued an order modifying the BSA to prevent Pepco from collecting lost utility revenue through the BSA if electric service is not restored to the pre-major storm levels within 24 hours of the start of a major storm (defined by the MPSC as a weather-related event during which more than the lesser of 10% or 100,000 of an electric utility’s customers have a sustained outage for more than 24 hours). The period for which the lost utility revenue may not be collected through the BSA commences 24 hours after the start of the major storm and continues until all major storm-related outages are restored. The MPSC stated that waivers permitting collection of BSA revenues would be granted in rare and extraordinary circumstances where a utility can show that an outage was not due to inadequate emphasis on reliability and restoration efforts were reasonable under the circumstances. A similar provision excluding revenues lost as a result of major storm outages from the calculation of future BSA adjustments is already included in the BSA for Pepco in the District of Columbia as approved by the DCPSC. The financial impact of service interruptions due to a major storm as a result of this MPSC order would generally depend on the scope and duration of the outages.
(7)LEASING ACTIVITIES
Pepco leases its consolidated control center, which is an integrated energy management center used by Pepco to centrally control the operation of its transmission and distribution systems. This lease is accounted for as a capital lease and was initially recorded at the present value of future lease payments. The lease requires semi-annual payments of approximately $8 million over a 25-year period that began in December 1994, and provides for transfer of ownership of the system to Pepco for $1 at the end of the lease term. Under FASB guidance on regulated operations, the amortization of leased assets is modified so that the total interest expense charged on the obligation and amortization expense of the leased asset is equal to the rental expense allowed for rate-making purposes. The amortization expense is included within Depreciation and amortization in the statements of income. This lease is treated as an operating lease for rate-making purposes.
PEPCO
Capital lease assets recorded within Property, Plant and Equipment at December 31, 20102011 and 20092010 are comprised of the following:
| Original Cost | Accumulated Amortization | Net Book Value | Original Cost | Accumulated Amortization | Net Book Value | |||||||||||||||||||
| (millions of dollars) | ||||||||||||||||||||||||
At December 31, 2011 | ||||||||||||||||||||||||
Transmission | $ | 76 | $ | 33 | $ | 43 | ||||||||||||||||||
Distribution | 76 | 33 | 43 | |||||||||||||||||||||
Other | 3 | 3 | — | |||||||||||||||||||||
|
|
| ||||||||||||||||||||||
Total | $ | 155 | $ | 69 | $ | 86 | ||||||||||||||||||
| (millions of dollars) |
|
|
| |||||||||||||||||||||
At December 31, 2010 | ||||||||||||||||||||||||
Transmission | $ | 76 | $ | 29 | $ | 47 | $ | 76 | $ | 29 | $ | 47 | ||||||||||||
Distribution | 76 | 29 | 47 | 76 | 29 | 47 | ||||||||||||||||||
Other | 3 | 3 | — | 3 | 3 | — | ||||||||||||||||||
|
|
| ||||||||||||||||||||||
Total | $ | 155 | $ | 61 | $ | 94 | $ | 155 | $ | 61 | $ | 94 | ||||||||||||
|
|
| ||||||||||||||||||||||
At December 31, 2009 | ||||||||||||||||||||||||
Transmission | $ | 76 | $ | 27 | $ | 49 | ||||||||||||||||||
Distribution | 76 | 26 | 50 | |||||||||||||||||||||
Other | 3 | 3 | — | |||||||||||||||||||||
Total | $ | 155 | $ | 56 | $ | 99 | ||||||||||||||||||
The approximate annual commitments under capital leases are $15 million for each year 20112012 through 2015,2016, and $61$46 million thereafter.
234
PEPCO
Rental expense for operating leases was $4 million, $3$4 million and $4$3 million for the years ended December 31, 2011, 2010 2009 and 2008,2009, respectively.
Total future minimum operating lease payments for Pepco as of December 31, 20102011 are $4 million in 2011, $4$5 million in 2012, $4$5 million in 2013, $3$5 million in 2014, $4 million in 2015, $4 million in 2016, and $16 million thereafter.
(8)PROPERTY, PLANT AND EQUIPMENT
Property, plant and equipment is comprised of the following:
| Original Cost | Accumulated Depreciation | Net Book Value | Original Cost | Accumulated Depreciation | Net Book Value | |||||||||||||||||||
| (millions of dollars) | ||||||||||||||||||||||||
At December 31, 2011 | ||||||||||||||||||||||||
Distribution | $ | 4,661 | $ | 1,960 | $ | 2,701 | ||||||||||||||||||
Transmission | 986 | 398 | 588 | |||||||||||||||||||||
Construction work in progress | 438 | — | 438 | |||||||||||||||||||||
Non-operating and other property | 493 | 346 | 147 | |||||||||||||||||||||
|
|
| ||||||||||||||||||||||
Total | $ | 6,578 | $ | 2,704 | $ | 3,874 | ||||||||||||||||||
| (millions of dollars) |
|
|
| |||||||||||||||||||||
At December 31, 2010 | ||||||||||||||||||||||||
Distribution | $ | 4,541 | $ | 1,885 | $ | 2,656 | $ | 4,541 | $ | 1,885 | $ | 2,656 | ||||||||||||
Transmission | 884 | 379 | 505 | 884 | 379 | 505 | ||||||||||||||||||
Construction work in progress | 300 | — | 300 | 300 | — | 300 | ||||||||||||||||||
Non-operating and other property | 460 | 345 | 115 | 460 | 345 | 115 | ||||||||||||||||||
|
|
| ||||||||||||||||||||||
Total | $ | 6,185 | $ | 2,609 | $ | 3,576 | $ | 6,185 | $ | 2,609 | $ | 3,576 | ||||||||||||
|
|
| ||||||||||||||||||||||
At December 31, 2009 | ||||||||||||||||||||||||
Distribution | $ | 4,386 | $ | 1,808 | $ | 2,578 | ||||||||||||||||||
Transmission | 858 | 358 | 500 | |||||||||||||||||||||
Construction work in progress | 175 | — | 175 | |||||||||||||||||||||
Non-operating and other property | 446 | 315 | 131 | |||||||||||||||||||||
Total | $ | 5,865 | $ | 2,481 | $ | 3,384 | ||||||||||||||||||
The non-operating and other property amounts include balances for general plant, distribution plant and transmission plant held for future use, intangible plant and non-utility property. Utility plant is generally subject to a first mortgage lien.
PEPCO
(9)PENSION AND OTHER POSTRETIREMENT BENEFITS
Pepco accounts for its participation in its parent’s single-employer plans, the Pepco Holdings, benefit plansInc. Retirement Plan (the PHI Retirement Plan) and the Pepco Holdings, Inc. Welfare Plan for Retirees (the PHI OPEB Plan), as participation in a multi-employer plan.multiemployer plans. For 2011, 2010 2009, and 2008,2009, Pepco was responsible for $43 million, $40 million $38 million and $24$38 million, respectively, of the pension and other postretirement net periodic benefit cost incurred by PHI. On January 31, 2012, Pepco Holdings.made a discretionary tax-deductible contribution in the amount of $85 million to the PHI Retirement Plan. Pepco made discretionary, tax-deductible contributions of $40 million and $170 million to the PHI Retirement Plan for the years ended December 31, 2011 and 2009, respectively. No contribution was made for the year ended December 31, 2009. No2010. In addition, Pepco made contributions were madeof $7 million, $10 million and $8 million, respectively, to the PHI OPEB Plan for the years ended December 31, 2011, 2010 and 2008. In addition, Pepco made contributions of $10 million, $8 million, and $9 million, respectively, to the other postretirement benefit plans for the years ended December 31, 2010, 2009 and 2008.2009. At December 31, 20102011 and 2009,2010, Pepco’s Prepaid pension expense of $274$289 million and $295$274 million, and Other postretirement benefit obligations of $67$66 million and $71$67 million, effectively represent assets and benefit obligations resulting from Pepco’s participation in the Pepco Holdings benefit plans.
235
PEPCO
(10)DEBT
Long-Term Debt
Long-term debt outstanding as of December 31, 20102011 and 20092010 is presented below.
Type of Debt | Interest Rate | Maturity | 2010 | 2009 | Interest Rate | Maturity | 2011 | 2010 | ||||||||||||||||||||
| (millions of dollars) | (millions of dollars) | |||||||||||||||||||||||||||
First Mortgage Bonds | 4.95%(a)(b) | 2013 | $ | 200 | $ | 200 | ||||||||||||||||||||||
| 5.75%(a) | 2010 | $ | — | $ | 16 | 4.65%(a)(b) | 2014 | 175 | 175 | |||||||||||||||||||
| 4.95%(a)(b)(c) | 2013 | 200 | 200 | 6.20%(a)(b)(c) | 2022 | 110 | 110 | |||||||||||||||||||||
| 4.65%(a)(b)(c) | 2014 | 175 | 175 | 5.375%(a) | 2024 | 38 | 38 | |||||||||||||||||||||
| 6.20%(a)(b)(c) | 2022 | 110 | 110 | 5.75%(a)(b) | 2034 | 100 | 100 | |||||||||||||||||||||
| 5.375%(a) | 2024 | 38 | 38 | 5.40%(a)(b) | 2035 | 175 | 175 | |||||||||||||||||||||
| 5.75%(a)(b)(c) | 2034 | 100 | 100 | 6.50%(a)(b)(c) | 2037 | 500 | 500 | |||||||||||||||||||||
| ��5.40%(a)(b)(c) | 2035 | 175 | 175 | 7.90% | 2038 | 250 | 250 | |||||||||||||||||||||
| 6.50%(a)(b)(c) | 2037 | 500 | 500 |
|
| |||||||||||||||||||||||
| 7.90% | 2038 | 250 | 250 | |||||||||||||||||||||||||
Total First Mortgage Bonds | 1,548 | 1,564 | ||||||||||||||||||||||||||
Total long-term debt | 1,548 | 1,564 | 1,548 | 1,548 | ||||||||||||||||||||||||
Other long-term debt | 1 | — | 1 | 1 | ||||||||||||||||||||||||
Net unamortized discount | (9 | ) | (9 | ) | (9) | (9) | ||||||||||||||||||||||
Current portion of long-term debt | — | (16 | ) | — | — | |||||||||||||||||||||||
|
| |||||||||||||||||||||||||||
Total net long-term debt | $ | 1,540 | $ | 1,539 | $ | 1,540 | $ | 1,540 | ||||||||||||||||||||
|
| |||||||||||||||||||||||||||
| (a) | Represents a series of first mortgage bonds issued by Pepco (Collateral First Mortgage Bonds) as collateral for an outstanding series of senior notes issued by the company or tax-exempt bonds issued for the benefit of the company. The maturity date, optional and mandatory prepayment provisions, if any, interest rate, and interest payment dates on each series of senior notes or the company’s obligations in respect of the tax-exempt bonds are identical to the terms of the corresponding series of Collateral First Mortgage Bonds. Payments of principal and interest on a series of senior notes or the company’s obligations in respect of the tax-exempt bonds satisfy the corresponding payment obligations on the related series of Collateral First Mortgage Bonds. Because each series of senior notes or the company’s obligations in respect of the tax-exempt bonds and the corresponding series of Collateral First Mortgage Bonds securing that series of senior notes or tax-exempt bonds obligations effectively represents a single financial obligation, the senior notes and the tax-exempt bonds are not separately shown on the table. |
| (b) | Represents a series of Collateral First Mortgage Bonds issued by Pepco that in accordance with its terms will, at such time as there are no First mortgage bonds of Pepco outstanding (other than Collateral First Mortgage Bonds securing payment of senior notes), cease to secure the corresponding series of senior notes and will be cancelled. |
| (c) | Represents a series of Collateral First Mortgage Bonds as to which Pepco has agreed in connection with the issuance of the corresponding series of senior notes that, notwithstanding the terms of the Collateral First Mortgage Bonds described in footnote (b) above, it will not permit the release of the Collateral First Mortgage Bonds as security for the series of senior notes for so long as the senior notes remains outstanding, unless Pepco delivers to the senior note trustee comparable secured obligations to secure the senior notes. |
PEPCO
The outstanding First Mortgage Bonds are subject to a lien on substantially all of Pepco’s property, plant and equipment.
The aggregate principal amount of long-term debt outstanding at December 31, 2010,2011, that will mature in each of 20112012 through 20152016 and thereafter is as follows: zero in 2011 and 2012, $200 million in 2013, $175 million in 2014, zero in 2015 and 2016 and $1,173 million thereafter.
Pepco’s long-term debt is subject to certain covenants. As of December 31, 2010,2011, Pepco is in compliance with all such covenants.
Short-Term Debt
Pepco has traditionally used a number of sources to fulfill short-term funding needs, such as commercial paper, short-term notes, and bank lines of credit. Proceeds from short-term borrowings are used primarily to meet working capital needs, but may also be used to temporarily fund long-term capital requirements. Pepco had no
236
PEPCO
A detail of the components of Pepco’s short-term debt outstanding at December 31, 2011 and 2010 and 2009.is as follows:
| 2011 | 2010 | |||||||
| (millions of dollars) | ||||||||
Commercial paper | $ | 74 | $ | — | ||||
|
|
|
| |||||
Total | $ | 74 | $ | — | ||||
|
|
|
| |||||
Commercial Paper
Pepco maintainshas an ongoing commercial paper program of up to $500 million. The commercial paper notes can be issued with maturities up to 270 days from the date of issue. The commercial paper programmillion that is backed by Pepco’sits borrowing capacity under PHI’s $1.5 billion credit facility, which is described below under the heading “CreditCredit Facility.”
Pepco had no$74 million of commercial paper outstanding at December 31, 20102011 and 2009.zero outstanding at December 31, 2010. The weighted average interest rate for commercial paper issued during 2011 was 0.35%, and the weighted average maturity was two days. Pepco did not issue commercial paper during 2010 and 2009.2010.
Credit Facility
PHI, Pepco, Delmarva Power & Light Company (DPL) and Atlantic City Electric Company (ACE) maintain an unsecured syndicated credit facility to provide for their respective short-term liquidity needs. needs, including obtaining letters of credit, borrowing for general corporate purposes and supporting their commercial paper programs. On August 1, 2011, PHI, Pepco, DPL and ACE entered into an amended and restated credit agreement with respect to the facility, which among other changes extended the expiration date of the facility to August 1, 2016.
The aggregate borrowing limit under the amended and restated credit facility is $1.5 billion, all or any portion of which may be used to obtain loans orand up to issue$500 million of which may be used to obtain letters of credit. PHI’sThe facility also includes a swingline loan sub-facility, pursuant to which each company may make same day borrowings in an aggregate amount not to exceed 10% of the total amount of the facility. Any swingline loan must be repaid by the borrower within fourteen days of receipt. The initial credit limit under the facilitysublimit for PHI is $875 million. The credit limit of$750 million and $250 million for each of Pepco, DPL and ACE. The sublimits may be increased or decreased by the individual borrower during the term of the facility, except that (i) the sum of all of the borrower sublimits following any such increase or decrease must equal the total amount of the facility and (ii) the aggregate amount of credit used at any given time by (a) PHI may not exceed $1.25 billion and (b) each of Pepco, DPL or ACE ismay not exceed the lesser of $500 million and the maximum amount of short-term debt the company is permitted to have outstanding by its regulatory authorities, except thatauthorities. The total number of the aggregate amount of credit used by Pepco, DPL and ACE at any given time collectivelysublimit reallocations may not exceed $625 million. eight per year during the term of the facility.
The interest rate payable by each company on utilized funds is, at the borrowing company’s election, (i) the greater of the prevailing prime rate, and the federal funds effective rate plus 0.5% and one month LIBOR plus 1.0%, or (ii) the prevailing Eurodollar rate, plus a margin that varies according to the credit rating of the borrower. The facility also includes a “swingline loan sub-facility” pursuant to which each company may make same day borrowings in an aggregate amount not to exceed $150 million. Any swingline loan must be repaid by the borrower within seven days of receipt thereof.
The facility commitment expiration date is May 5, 2012, with each company having the right to elect to have 100% of the principal balance of the loans outstanding on the expiration date continued as non-revolving term loans for a period of one year from such expiration date.
The facility is intended to serve primarily as a source of liquidity to support the commercial paper programs of the respective companies. The companies are also permitted to use the facility to borrow funds for general corporate purposes and issue letters of credit. In order for a borrower to use the facility, certain representations and warranties must be true and correct, and the borrower must be in compliance with specified financial covenants, including (i) the requirement that each borrowing company maintain a ratio of total indebtedness to total capitalization of 65% or less, computed in accordance with the terms of the credit agreement, which calculation excludes from the definition of total indebtedness certain trust preferred
PEPCO
securities and deferrable interest subordinated debt (not to exceed 15% of total capitalization), (ii) with certain exceptions, a restriction on sales or other
237
PEPCO
dispositions of assets, other than certain sales and dispositions, and (iii) a restriction on the incurrence of liens on the assets of a borrower or any of its significant subsidiaries other than permitted liens. The credit agreement contains certain covenants and other customary agreements and requirements that, if not complied with, could result in an event of default and the acceleration of repayment obligations of one or more of the borrowers thereunder. Each of the borrowers was in compliance with all financial covenants under this facility as of December 31, 2011.
The absence of a material adverse change in the borrower’sPHI’s business, property, and results of operations or financial condition is not a condition to the availability of credit under the facility.credit agreement. The facilitycredit agreement does not include any rating triggers. As of December 31, 2010, each borrower was in compliance with the covenants of the credit facility.
At December 31, 20102011 and 2009,2010, the amount of cash plus borrowing capacity under the PHI credit facilitiesfacility available to meet the liquidity needs of PHI’s utility subsidiaries was $462$711 million and $582$462 million, respectively.
(11)INCOME TAXES
Pepco, as a direct subsidiary of PHI, is included in the consolidated federal income tax return of PHI. Federal income taxes are allocated to Pepco pursuant to a written tax sharing agreement that was approved by the Securities and Exchange Commission in connection with the establishment of PHI as a holding company. Under this tax sharing agreement, PHI’s consolidated federal income tax liability is allocated based upon PHI’s and its subsidiaries’ separate taxable income or loss.
The provision for income taxes, reconciliation of income tax expense, and components of deferred income tax liabilities (assets) are shown below.
Provision for Income Taxes
| For the Year Ended December 31, | For the Year Ended December 31, | |||||||||||||||||||||||
| 2010 | 2009 | 2008 | 2011 | 2010 | 2009 | |||||||||||||||||||
| (millions of dollars) | (millions of dollars) | |||||||||||||||||||||||
Current Tax Benefit | ||||||||||||||||||||||||
Federal | $ | (28 | ) | $ | (33 | ) | $ | (94 | ) | $ | (19 | ) | $ | (28 | ) | $ | (33 | ) | ||||||
State and local | (7 | ) | (11 | ) | (25 | ) | (16 | ) | (7 | ) | (11 | ) | ||||||||||||
|
|
| ||||||||||||||||||||||
Total Current Tax Benefit | (35 | ) | (44 | ) | (119 | ) | (35 | ) | (35 | ) | (44 | ) | ||||||||||||
|
|
| ||||||||||||||||||||||
Deferred Tax Expense (Benefit) | ||||||||||||||||||||||||
Federal | 52 | 95 | 147 | 54 | 52 | 95 | ||||||||||||||||||
State and local | 22 | 27 | 38 | 19 | 22 | 27 | ||||||||||||||||||
Investment tax credits | (2 | ) | (2 | ) | (2 | ) | ||||||||||||||||||
Investment tax credit amortization | (2 | ) | (2 | ) | (2 | ) | ||||||||||||||||||
|
|
| ||||||||||||||||||||||
Total Deferred Tax Expense | 72 | 120 | 183 | 71 | 72 | 120 | ||||||||||||||||||
|
|
| ||||||||||||||||||||||
Total Income Tax Expense | $ | 37 | $ | 76 | $ | 64 | $ | 36 | $ | 37 | $ | 76 | ||||||||||||
|
|
| ||||||||||||||||||||||
238
PEPCO
Reconciliation of Income Tax Expense
| For the Year Ended December 31, | For the Year Ended December 31, | |||||||||||||||||||||||||||||||||||||||||||||||
| 2010 | 2009 | 2008 | 2011 | 2010 | 2009 | |||||||||||||||||||||||||||||||||||||||||||
| (millions of dollars) | (millions of dollars) | |||||||||||||||||||||||||||||||||||||||||||||||
Income tax at Federal statutory rate | $ | 51 | 35.0 | % | $ | 64 | 35.0 | % | $ | 63 | 35.0 | % | $ | 47 | 35.0 | % | $ | 51 | 35.0 | % | $ | 64 | 35.0 | % | ||||||||||||||||||||||||
Increases (decreases) resulting from | ||||||||||||||||||||||||||||||||||||||||||||||||
Depreciation | 4 | 2.8 | % | 5 | 2.7 | % | 5 | 2.8 | % | (1 | ) | (0.7 | )% | 3 | 2.1 | % | 5 | 2.9 | % | |||||||||||||||||||||||||||||
Asset removal costs | (3 | ) | (2.1 | )% | (3 | ) | (1.6 | )% | (4 | ) | (2.2 | )% | (7 | ) | (5.0 | )% | (3 | ) | (2.1 | )% | (3 | ) | (1.6 | )% | ||||||||||||||||||||||||
State income taxes, net of federal effect | 8 | 5.5 | % | 10 | 5.5 | % | 11 | 6.1 | % | 8 | 5.5 | % | 8 | 5.5 | % | 10 | 5.5 | % | ||||||||||||||||||||||||||||||
Software amortization | (4 | ) | (2.8 | )% | 2 | 1.1 | % | 2 | 1.1 | % | — | (0.3 | )% | (4 | ) | (2.8 | )% | 2 | 1.1 | % | ||||||||||||||||||||||||||||
Tax credits | (2 | ) | (1.4 | )% | (2 | ) | (1.1 | )% | (2 | ) | (1.1 | )% | ||||||||||||||||||||||||||||||||||||
Investment tax credits | (2 | ) | (1.1 | )% | (2 | ) | (1.4 | )% | (2 | ) | (1.1 | )% | ||||||||||||||||||||||||||||||||||||
Change in estimates and interest related to uncertain and effectively settled tax positions | (11 | ) | (7.6 | )% | 4 | 2.2 | % | (6 | ) | (3.3 | )% | (9 | ) | (6.6 | )% | (11 | ) | (7.6 | )% | 4 | 2.2 | % | ||||||||||||||||||||||||||
Interest on Maryland state income tax refund, net of Federal effect | — | — | — | — | (3 | ) | (1.7 | )% | ||||||||||||||||||||||||||||||||||||||||
Other, net | (6 | ) | (3.9 | )% | (4 | ) | (2.0 | )% | (2 | ) | (1.1 | )% | — | (0.1 | )% | (5 | ) | (3.2 | )% | (4 | ) | (2.2 | )% | |||||||||||||||||||||||||
|
|
|
|
|
| |||||||||||||||||||||||||||||||||||||||||||
Income Tax Expense | $ | 37 | 25.5 | % | $ | 76 | 41.8 | % | $ | 64 | 35.6 | % | $ | 36 | 26.7 | % | $ | 37 | 25.5 | % | $ | 76 | 41.8 | % | ||||||||||||||||||||||||
|
|
|
|
|
| |||||||||||||||||||||||||||||||||||||||||||
Year ended December 31, 2011
During 2011, PHI reached a settlement with the Internal Revenue Service (IRS) with respect to interest due on its federal tax liabilities related to the November 2010 audit settlement for years 1996 through 2002. In connection with this agreement, PHI reallocated certain amounts that have been on deposit with the IRS since 2006 among liabilities in the settlement years and subsequent years. Primarily related to the settlement and reallocations, Pepco has recorded an additional tax benefit in the amount of $5 million (after-tax). This additional interest income was recorded in the second quarter of 2011.
During the third quarter of 2011, Pepco recalculated interest on its uncertain tax positions for open tax years based on different assumptions related to the application of its deposit made with the IRS in 2006. This resulted in an additional tax expense of $1 million (after-tax). Further during the third quarter of 2010, Pepco reversed $2 million of previously recorded tax benefits related to changes in estimates and interest related to uncertain and effectively settled tax positions.
During 2011, Pepco decided to adopt the safe harbor tax accounting method for certain repairs pursuant to IRS guidance. As a result, Pepco reversed $23 million of previously recorded liabilities on uncertain tax positions and reversed the associated $1 million of accrued interest.
In May 2011, Pepco received refunds of approximately $5 million and recorded tax benefits of approximately $4 million (after-tax) related to the filing of amended state tax returns. These amended returns reduced state taxable income due to an increase in tax basis on certain prior years’ asset dispositions.
Year ended December 31, 2010
In November 2010, PHI reached final settlement with the Internal Revenue Service (IRS)IRS with respect to its Federal tax returns for the years 1996 to 2002. In connection with the settlement, Pepco reallocated certain amounts on deposit with the IRS since 2006 among liabilities in the settlement years and subsequent years. In light of the settlement and reallocation, Pepco has recalculated the estimated interest due for the tax years 1996 to 2002. The revised estimate has resulted in the reversal of $24 million (after-tax) of previously accrued estimated interest due to the IRS. This reversal has been recorded as an income tax benefit in the fourth quarter of 2010, and is subject to adjustment when the IRS finalizes its calculation of the amount due. 2010.
239
PEPCO
This benefit was partially offset by the reversal of $8 million of previously recorded tax benefits and $5 million of other adjustments.
Also in the fourth quarter of 2010, Pepco corrected the tax accounting for software amortization. Accordingly, a regulatory asset was established and income tax expense was reduced by $4 million.
Year ended December 31, 2009
In March 2009, the IRS issued a Revenue Agent’s Report (RAR) for the audit of PHI’s consolidated Federal income tax returns for the calendar years 2003 to 2005. The IRS has proposed adjustments to PHI’s tax returns, including adjustments to Pepco’s capitalization of overhead costs for tax purposes and the deductibility of certain Pepco casualty losses. In conjunction with PHI, Pepco has appealed certain of the proposed adjustments and believes it has adequately reserved for the adjustments included in the RAR.Revenue Agent’s Report.
In November 2009, Pepco received a refund of prior years’ Federal income taxes of $51 million. The refund results from the carryback of PHI’s 2008 net operating loss for tax reporting purposes that reflected, among other things, significant tax deductions related to accelerated depreciation, the pension plan contributions paid in 2009 (which were deducted in 2008) and the cumulative effect of adopting a new method of tax reporting for certain repairs.
During 2009, a reconciliation of current and deferred income tax accounts was completed and, as a result, a $1 million net credit was booked to income tax expense. The 2009 adjustment is primarily included in “Other” in the reconciliation above.
Components of Deferred Income Tax Liabilities (Assets)
| At December 31, | ||||||||
| 2011 | 2010 | |||||||
| (millions of dollars) | ||||||||
Deferred Tax Liabilities (Assets) | ||||||||
Depreciation and other basis differences related to plant and equipment | $ | 902 | $ | 803 | ||||
Pension and other postretirement benefits | 117 | 100 | ||||||
Deferred taxes on amounts to be collected through future rates | 20 | 15 | ||||||
Federal and state net operating losses | (80 | ) | — | |||||
Other | 69 | 27 | ||||||
|
|
|
| |||||
Total Deferred Tax Liabilities, net | 1,028 | 945 | ||||||
Deferred tax assets included in Other Current Assets | 11 | 13 | ||||||
|
|
|
| |||||
Total Deferred Tax Liabilities, net non-current | $ | 1,039 | $ | 958 | ||||
|
|
|
| |||||
The net deferred tax liability represents the tax effect, at presently enacted tax rates, of temporary differences between the financial statement basis and tax basis of assets and liabilities. The portion of the net deferred tax liability applicable to Pepco’s operations, which has not been reflected in current service rates, represents income taxes recoverable through future rates, net, and is recorded as a regulatory asset on the balance sheet. No valuation allowance for deferred tax assets was required or recorded at December 31, 2011 and 2010.
The Tax Reform Act of 1986 repealed the investment tax credit for property placed in service after December 31, 1985, except for certain transition property. Investment tax credits previously earned on Pepco’s property continues to be amortized to income over the useful lives of the related property.
240
PEPCO
During 2008, Pepco completed an analysis of its current and deferred income tax accounts and, as a result, recorded a $3 million net credit to income tax expense in 2008, which is primarily included in “Other” in the reconciliation provided above. In addition, during 2008, Pepco recorded after-tax net interest income of $5 million under FASB guidance on income taxes (ASC 740) primarily related to the reversal of previously accrued interest payable resulting from a favorable tentative settlement of the mixed service cost issue with the IRS, and after-tax interest income of $2 million for interest received in 2008 on the Maryland state tax refund.
Reconciliation of Beginning and Ending Balances of Unrecognized Tax Benefits
| 2010 | 2009 | 2008 | 2011 | 2010 | 2009 | |||||||||||||||||||
| (millions of dollars) | (millions of dollars) | |||||||||||||||||||||||
Beginning balance as of January 1, | $ | 71 | $ | 62 | $ | 60 | $ | 190 | $ | 71 | $ | 62 | ||||||||||||
Tax positions related to current year: | ||||||||||||||||||||||||
Additions | 110 | — | 1 | — | 110 | — | ||||||||||||||||||
Reductions | — | (2 | ) | — | — | — | (2 | ) | ||||||||||||||||
Tax positions related to prior years: | ||||||||||||||||||||||||
Additions | 24 | 45 | 38 | 12 | 24 | 45 | ||||||||||||||||||
Reductions | (15 | ) | (34 | ) | (37 | ) | (26 | ) | (15 | ) | (34 | ) | ||||||||||||
Settlements | — | — | — | (3 | ) | — | — | |||||||||||||||||
|
|
| ||||||||||||||||||||||
Ending balance as of December 31, | $ | 190 | $ | 71 | $ | 62 | $ | 173 | $ | 190 | $ | 71 | ||||||||||||
|
|
| ||||||||||||||||||||||
Unrecognized Benefits That, If Recognized, Would Affect the Effective Tax Rate
Unrecognized tax benefits are related to tax positions that have been taken or are expected to be taken in tax returns that are not recognized in the financial statements because management has either measured the tax benefit at an amount less than the benefit claimed, or expected to be claimed, or has concluded that it is not more likely than not that the tax position will be ultimately sustained. For the majority of these tax positions, the ultimate deductibility is highly certain, but there is uncertainty about the timing of such deductibility. At December 31, 2010,2011, Pepco had $3$8 million of unrecognized tax benefits that, if recognized, would lower the effective tax rate.
Interest and Penalties
Pepco recognizes interest and penalties relating to its uncertain tax positions as an element of income tax expense. For the years ended December 31, 2011, 2010 2009 and 2008,2009, Pepco recognized $8 million of pre-tax interest income ($5 million after-tax), $27 million of pre-tax interest income ($16 million after-tax), and $7 million of pre-tax interest expense ($4 million after-tax), and $8 million of pre-tax interest income ($5 million after-tax), respectively, as a component of income tax expense. As of December 31, 2011, 2010 2009 and 2008,2009, Pepco had accrued interest receivablepayable of $8$6 million, accrued interest payablereceivable of $8 million and accrued interest payable of $4$8 million, respectively, related to effectively settled and uncertain tax positions.
Possible Changes to Unrecognized Tax Benefits
It is reasonably possible that the amount of the unrecognized tax benefit with respect to some of Pepco’s uncertain tax positions will significantly increase or decrease within the next 12 months. The final settlement of the 2003 to 2005 federal audit, the methodology change for deduction of capitalized construction costs, or state audits could impact the balances and related interest accruals significantly. At this time, an estimate of the range of reasonably possible outcomes cannot be determined.
PEPCO
Tax Years Open to Examination
Pepco, as a direct subsidiary of PHI, is included on PHI’s consolidated Federal income tax return. Pepco’s Federal income tax liabilities for all years through 2002 have been determined, subject to adjustment to the extent of any net operating loss or other loss or credit carrybacks from subsequent years. The open tax years for the significant states where Pepco files state income tax returns (District of Columbia and Maryland) are the same as for the Federal returns. As a result of the final determination of these years, Pepco has filed amended state returns requesting $20 million in refunds which are subject to review by the various states. If accepted by the states,To date, Pepco could reduce its state tax expense by an estimated $3 million.
Components of Deferred Income Tax Liabilities (Assets)has received $4 million in refunds.
| At December 31, | ||||||||
| 2010 | 2009 | |||||||
| (millions of dollars) | ||||||||
Deferred Tax Liabilities (Assets) | ||||||||
Depreciation and other basis differences related to plant and equipment | $ | 803 | $ | 765 | ||||
Pension and other postretirement benefits | 100 | 111 | ||||||
Deferred taxes on amounts to be collected through future rates | 15 | 16 | ||||||
Federal and state net operating losses | — | (18 | ) | |||||
Other | 27 | (7 | ) | |||||
Total Deferred Tax Liabilities, Net | 945 | 867 | ||||||
Deferred tax assets included in Other Current Assets | 13 | 22 | ||||||
Deferred tax assets included in Other Current Liabilities | — | 4 | ||||||
Total Deferred Tax Liabilities, Net - Non-Current | $ | 958 | $ | 893 | ||||
The net deferred tax liability represents the tax effect, at presently enacted tax rates, of temporary differences between the financial statement basis and tax basis of assets and liabilities. The portion of the net deferred tax liability applicable to Pepco’s operations, which has not been reflected in current service rates, represents income taxes recoverable through future rates, net, and is recorded as a regulatory asset on the balance sheet. No valuation allowance for deferred tax assets was required or recorded at December 31, 2010 and 2009.241
The Tax Reform Act of 1986 repealed the investment tax credit (ITC) for property placed in service after December 31, 1985, except for certain transition property. ITC previously earned on Pepco’s property continues to be amortized to income over the useful lives of the related property.
PEPCO
Other Taxes
Taxes other than income taxes for each year are shown below. These amounts are recoverable through rates.
| 2010 | 2009 | 2008 | ||||||||||
| (millions of dollars) | ||||||||||||
Gross Receipts/Delivery | $ | 108 | $ | 104 | $ | 106 | ||||||
Property | 42 | 41 | 38 | |||||||||
County Fuel and Energy | 154 | 94 | 90 | |||||||||
Environmental, Use and Other | 60 | 63 | 54 | |||||||||
Total | $ | 364 | $ | 302 | $ | 288 | ||||||
PEPCO
| 2011 | 2010 | 2009 | ||||||||||
| (millions of dollars) | ||||||||||||
Gross Receipts/Delivery | $ | 109 | $ | 108 | $ | 104 | ||||||
Property | 44 | 42 | 41 | |||||||||
County Fuel and Energy | 170 | 154 | 94 | |||||||||
Environmental, Use and Other | 59 | 60 | 63 | |||||||||
|
|
|
|
|
| |||||||
Total | $ | 382 | $ | 364 | $ | 302 | ||||||
|
|
|
|
|
| |||||||
(12)FAIR VALUE DISCLOSURES
Financial Instruments Measured at Fair Value of Assets and Liabilities Excluding Issued Debt and Equity Instrumentson a Recurring Basis
Pepco has adoptedapplies FASB guidance on fair value measurement and disclosures (ASC 820) whichthat established a framework for measuring fair value and expanded disclosures about fair value measurements. As defined in the guidance, fair value is the price that would be received to sell an asset or paid to transfer a liability in an orderly transaction between market participants at the measurement date (exit price). Pepco utilizes market data or assumptions that market participants would use in pricing the asset or liability, including assumptions about risk and the risks inherent in the inputs to the valuation technique. These inputs can be readily observable, market corroborated or generally unobservable. Accordingly, Pepco utilizes valuation techniques that maximize the use of observable inputs and minimize the use of unobservable inputs. The guidance establishes a fair value hierarchy that prioritizes the inputs used to measure fair value. The hierarchy gives the highest priority to unadjusted quoted prices in active markets for identical assets or liabilities (level 1) and the lowest priority to unobservable inputs (level 3). Pepco classifies its fair value balances in the fair value hierarchy based on the observability of the inputs used in the fair value calculation as follows:
Level 1 – Quoted prices are available in active markets for identical assets or liabilities as of the reporting date. Active markets are those in which transactions for the asset or liability occur in sufficient frequency and volume to provide pricing information on an ongoing basis.
Level 2 – Pricing inputs are other than quoted prices in active markets included in level 1, which are either directly or indirectly observable as of the reporting date. Level 2 includes those financial instruments that are valued using broker quotes in liquid markets and other observable data. Level 2 also includes those financial instruments that are valued using internally developed methodologies that have been corroborated by observable market data through correlation or by other means. Significant assumptions are observable in the marketplace throughout the full term of the instrument and can be derived from observable data or are supported by observable levels at which transactions are executed in the marketplace.
Executive deferred compensation plan assets consist of life insurance policies that are categorized as level 2 assets because their fair value isthey are priced based on the fair value of the assets underlying the policies. The underlying assets of these life insurance policies, which consist of short-term cash equivalents and fixed income securities that are priced using observable market data.data and can be liquidated for the value of the underlying assets as of December 31, 2011. The level 2 liability associated with the life insurance policies represents a deferred compensation obligation, the value of which is tracked via underlying insurance sub-accounts. The sub-accounts are designed to mirror existing mutual funds and money market funds that are observable and actively traded.
242
PEPCO
Level 3 – Pricing inputs include significant inputs that are generally less observable than those from objective sources. Level 3 includes those financial instruments that are valued using models or other valuation methodologies.
Executive deferred compensation plan assets and liabilities that are classified as level 3 include certain life insurance policies that are valued using the cash surrender value of the policies, net of loans against those policies, which does not represent a quoted price in an active market.
The following tables set forth, by level within the fair value hierarchy, Pepco’s financial assets and liabilities that were accounted for at fair value on a recurring basis as of December 31, 20102011 and 2009.2010. As required by the guidance, financial assets and liabilities are classified in their entirety based on the lowest level of input that is significant to the fair value measurement. Pepco’s assessment of the significance of a particular input to the fair value measurement requires the exercise of judgment, and may affect the valuation of fair value assets and liabilities and their placement within the fair value hierarchy levels.
PEPCO
| Fair Value Measurements at December 31, 2011 | ||||||||||||||||
Description | Total | Quoted Prices in Active Markets for Identical Instruments (Level 1) (a) | Significant Other Observable Inputs (Level 2) (a) | Significant Unobservable Inputs (Level 3) | ||||||||||||
| (millions of dollars) | ||||||||||||||||
ASSETS | ||||||||||||||||
Executive deferred compensation plan assets | ||||||||||||||||
Money Market Funds | $ | 12 | $ | 12 | $ | — | $ | — | ||||||||
Life Insurance Contracts | 57 | — | 40 | 17 | ||||||||||||
|
|
|
|
|
|
|
| |||||||||
| $ | 69 | $ | 12 | $ | 40 | $ | 17 | |||||||||
|
|
|
|
|
|
|
| |||||||||
LIABILITIES | ||||||||||||||||
Executive deferred compensation plan liabilities | ||||||||||||||||
Life Insurance Contracts | $ | 10 | $ | — | $ | 10 | $ | — | ||||||||
|
|
|
|
|
|
|
| |||||||||
| $ | 10 | $ | — | $ | 10 | $ | — | |||||||||
|
|
|
|
|
|
|
| |||||||||
| Fair Value Measurements at December 31, 2010 | ||||||||||||||||
Description | Total | Quoted Prices in Active Markets for Identical Instruments (Level 1) (a) | Significant Other Observable Inputs (Level 2) (a) | Significant Unobservable Inputs (Level 3) | ||||||||||||
| (millions of dollars) | ||||||||||||||||
ASSETS | ||||||||||||||||
Executive deferred compensation plan assets | ||||||||||||||||
Money Market Funds | $ | 6 | $ | 6 | $ | — | $ | — | ||||||||
Life Insurance Contracts | 59 | — | 41 | 18 | ||||||||||||
| $ | 65 | $ | 6 | $ | 41 | $ | 18 | |||||||||
LIABILITIES | ||||||||||||||||
Executive deferred compensation plan liabilities | ||||||||||||||||
Life Insurance Contracts | $ | 11 | $ | — | $ | 11 | $ | — | ||||||||
| $ | 11 | $ | — | $ | 11 | $ | — | |||||||||
(a) There were no significant transfers of instruments between level 1 and level 2 valuation categories.
|
| |||||||||||||||
| Fair Value Measurements at December 31, 2009 | ||||||||||||||||
Description | Total | Quoted Prices in Active Markets for Identical Instruments (Level 1) | Significant Other Observable Inputs (Level 2) | Significant Unobservable Inputs (Level 3) | ||||||||||||
| (millions of dollars) | ||||||||||||||||
ASSETS | ||||||||||||||||
Executive deferred compensation plan assets | ||||||||||||||||
Money Market Funds | $ | 9 | $ | 9 | $ | — | $ | — | ||||||||
Life Insurance Contracts | 55 | — | 37 | 18 | ||||||||||||
| $ | 64 | $ | 9 | $ | 37 | $ | 18 | |||||||||
LIABILITIES | ||||||||||||||||
Executive deferred compensation plan liabilities | ||||||||||||||||
Life Insurance Contracts | $ | 13 | $ | — | $ | 13 | $ | — | ||||||||
| $ | 13 | $ | — | $ | 13 | $ | — | |||||||||
| (a) | There were no significant transfers of instruments between level 1 and level 2 valuation categories. |
| Fair Value Measurements at December 31, 2010 | ||||||||||||||||
Description | Total | Quoted Prices in Active Markets for Identical Instruments (Level 1)(a) | Significant Other Observable Inputs (Level 2)(a) | Significant Unobservable Inputs (Level 3) | ||||||||||||
| (millions of dollars) | ||||||||||||||||
ASSETS | ||||||||||||||||
Executive deferred compensation plan assets | ||||||||||||||||
Money Market Funds | $ | 6 | $ | 6 | $ | — | $ | — | ||||||||
Life Insurance Contracts | 59 | — | 41 | 18 | ||||||||||||
|
|
|
|
|
|
|
| |||||||||
| $ | 65 | $ | 6 | $ | 41 | $ | 18 | |||||||||
|
|
|
|
|
|
|
| |||||||||
LIABILITIES | ||||||||||||||||
Executive deferred compensation plan liabilities | ||||||||||||||||
Life Insurance Contracts | $ | 11 | $ | — | $ | 11 | $ | — | ||||||||
|
|
|
|
|
|
|
| |||||||||
| $ | 11 | $ | — | $ | 11 | $ | — | |||||||||
|
|
|
|
|
|
|
| |||||||||
| (a) | There were no significant transfers of instruments between level 1 and level 2 valuation categories. |
243
PEPCO
Reconciliations of the beginning and ending balances of Pepco’s fair value measurements using significant unobservable inputs (Level 3) for the years ended December 31, 20102011 and 20092010 are shown below.
| Life Insurance Contracts | Life Insurance Contracts | |||||||||||||||
| Year Ended December 31, | Year Ended December 31, | |||||||||||||||
| 2010 | 2009 | 2011 | 2010 | |||||||||||||
| (millions of dollars) | (millions of dollars) | |||||||||||||||
Beginning balance as of January 1, | $ | 18 | $ | 17 | $ | 18 | $ | 18 | ||||||||
Total gains or (losses) (realized and unrealized): | ||||||||||||||||
Total gains (losses) (realized and unrealized): | ||||||||||||||||
Included in income | 3 | 4 | 6 | 3 | ||||||||||||
Included in accumulated other comprehensive loss | — | — | — | — | ||||||||||||
Purchases and issuances | (3 | ) | (3 | ) | ||||||||||||
Purchases | — | — | ||||||||||||||
Issuances | (3 | ) | (3 | ) | ||||||||||||
Settlements | — | — | (4 | ) | — | |||||||||||
Transfers in (out) of Level 3 | — | — | — | — | ||||||||||||
|
| |||||||||||||||
Ending balance as of December 31, | $ | 18 | $ | 18 | $ | 17 | $ | 18 | ||||||||
|
| |||||||||||||||
The breakdown of realized and unrealized gains or (losses) on level 3 instruments included in income as a component of Other operation and maintenance expense for the periods below were as follows:
Year Ended December 31, | Year Ended December 31, | |||||||||||||||
| 2010 | 2009 | 2011 | 2010 | |||||||||||||
| (millions of dollars) | (millions of dollars) | |||||||||||||||
Total gains included in income for the period | $ | 3 | $ | 4 | $ | 6 | $ | 3 | ||||||||
|
| |||||||||||||||
Change in unrealized gains relating to assets still held at reporting date | $ | 3 | $ | 4 | $ | 3 | $ | 3 | ||||||||
|
| |||||||||||||||
Fair Value of Debt and EquityOther Financial Instruments
The estimated fair values of Pepco’s issued debt and equity instruments at December 31, 20102011 and 20092010 are shown below:
| December 31, 2010 | December 31, 2009 | |||||||||||||||
| (millions of dollars) | ||||||||||||||||
| Carrying Amount | Fair Value | Carrying Amount | Fair Value | |||||||||||||
Long-Term Debt | $ | 1,540 | $ | 1,722 | $ | 1,555 | $ | 1,707 | ||||||||
| December 31, 2011 | December 31, 2010 | |||||||||||||||
| (millions of dollars) | ||||||||||||||||
| Carrying Amount | Fair Value | Carrying Amount | Fair Value | |||||||||||||
Long-Term Debt | $ | 1,540 | $ | 1,943 | $ | 1,540 | $ | 1,722 | ||||||||
The fair value of long-term debt issued by Pepco was based on actual trade prices as(where available), bid prices obtained from brokers and validated by PHI, or a discounted cash flow model. Prices obtained from brokers include observable market data on the target security or historical correlation and direct observation methodologies of December 31, 2010 and 2009.similar debt securities.
244
PEPCO
The carrying amounts of all other financial instruments in the accompanying financial statements approximate fair value.
PEPCO
(13)COMMITMENTS AND CONTINGENCIES
Regulatory and Other Matters
Proceeds from Settlement of Mirant Bankruptcy Claims
In 2007, Pepco received proceeds from the settlement of its Mirant Corporation (Mirant) bankruptcy claims relating to the Panda PPA. In September 2008, Pepco transferred the Panda PPA to an unaffiliated third party, along with a payment to the third party of a portion of the settlement proceeds. In March 2009, the DCPSC approved an allocation between Pepco and its District of Columbia customers of the District of Columbia portion of the Mirant bankruptcy settlement proceeds remaining after the transfer of the Panda PPA. As a result, Pepco recorded a pre-tax gain of $14 million in the first quarter of 2009 reflecting the District of Columbia proceeds retained by Pepco. In July 2009, the MPSC approved an allocation between Pepco and its Maryland customers of the Maryland portion of the Mirant bankruptcy settlement proceeds remaining after the transfer of the Panda PPA. As a result, Pepco recorded a pre-tax gain of $26 million in the third quarter of 2009 reflecting the Maryland proceeds retained by Pepco.
District of Columbia Divestiture Case
In June 2000, the DCPSC approved a divestiture settlement under which Pepco is required to share with its District of Columbia customers the net proceeds realized by Pepco from the sale of its generation-related assets in 2000. This approval left unresolved issues of (i) whether Pepco should be required to share with customers the excess deferred income taxes (EDIT) and accumulated deferred investment tax credits (ADITC) associated with the sold assets and, if so, whether such sharing would violate the normalization provisions of the Internal Revenue Code and its implementing regulations and (ii) whether Pepco was entitled to deduct certain costs in determining the amount of proceeds to be shared.
On May 18, 2010, the DCPSC issued an order addressing all of the remaining issues related to the sharing of the proceeds of Pepco’s divestiture of its generating assets. In the order, the DCPSC ruled that Pepco is not required to share EDIT and ADITC with customers. However, the order also disallowed certain items that Pepco had included in the costs deducted from the proceeds of the sale of the generation assets. The disallowance of these costs, together with interest on the disallowed amount, increases the aggregate amount Pepco is required to distribute to customers, pursuant to the sharing formula, by approximately $11 million. On June 17, 2010, Pepco filed an application for reconsideration of the DCPSC’s order, contesting (i) approximately $5 million of the total of $6 million in disallowances and (ii) approximately $4 million of the $5 million in interest to be credited to customers (reflecting a difference in the period of time over which interest was calculated as well as the balance to which interest would be applied). On July 16, 2010, the DCPSC denied Pepco’s application for reconsideration. On September 7, 2010, Pepco filed an appeal of the DCPSC’s decision with the District of Columbia Court of Appeals. PHI recognized an expense of $11 million for the year ended December 31, 2010 corresponding to the disallowed items. The appeal is still pending.
Maryland Public Service Commission Reliability Investigation
In August 2010, following the major storm events that occurred in July and August 2010, the MPSC initiated a proceeding for the purpose of investigating the reliability of the Pepco distribution system and the quality of distribution service Pepco is providing its customers. On February 10, 2011, the MPSC issued a notice expanding the scope of issues on which it requested testimony to include suggested remedies for the MPSC to consider imposing if the MPSC finds that Pepco has failed to meet its public service obligations. The possible remedies identified in the notice were the imposition of civil penalties, changes in the manner of Pepco’s operations, modification of Pepco’s service territory and revocation of Pepco’s authority to exercise its public utility franchise. The MPSC has retained an independent consultant to review and make recommendations regarding the reliability of Pepco’s distribution system and the quality of its service. The independent consultant’s report is due March 4, 2011. The MPSC has scheduled hearings on this matter to occur in mid-June 2011. While Pepco intends to cooperate fully with
PEPCO
the MPSC in its efforts to ensure that the electric service provided by Pepco to its Maryland customers is reliable, it intends to oppose vigorously any effort of the MPSC to impose any sanctions of the types specified in the February 10, 2011 notice. Although Pepco believes that it has a strong factual and legal basis to oppose such sanctions, it cannot predict the outcome of this proceeding.
Rate Proceedings
Over the last several years, Pepco has proposed the adoption of mechanisms to decouple retail distribution revenue from the amount of power delivered to retail customers. To date, a BSA has been approved and implemented for electric service in Maryland and the District of Columbia; however, the MPSC has initiated a proceeding to review how the BSA operates in Maryland to recover revenues lost as a result of major storm outages (as discussed below).
Under the BSA, customer distribution rates are subject to adjustment (through a credit or surcharge mechanism), depending on whether actual distribution revenue per customer exceeds or falls short of the revenue-per-customer amount approved by the applicable public service commission. The BSA increases rates if actual distribution revenues fall below the approved level and decreases rates if actual distribution revenues are above the approved level. The result is that, over time, Pepco collects its authorized revenues for distribution service. As a consequence, a BSA “decouples” distribution revenue from unit sales consumption and ties the growth in distribution revenues to the growth in the number of customers. Some advantages of the BSA are that it (i) eliminates revenue fluctuations due to weather and changes in customer usage patterns and, therefore, provides for more predictable distribution revenues that are better aligned with costs, (ii) provides for more reliable fixed-cost recovery, (iii) tends to stabilize customers’ delivery bills, and (iv) removes any disincentives for Pepco to promote energy efficiency programs for their customers, because it breaks the link between overall sales volumes and distribution revenues.
Maryland
In December 2009, Pepco filed an electric distribution base rate case in Maryland. The filing sought approval of an annual rate increase of approximately $40 million, based on a requested return on equity (ROE) of 10.75%. During the course of the proceeding, Pepco reduced its request to approximately $28.2 million. On August 6, 2010, the MPSC issued an order approving a rate increase of approximately $7.8 million, based on an ROE of 9.83%. On September 2, 2010, Pepco filed with the MPSC a motion for reconsideration of the following issues, which in the aggregate would increase annual revenue by approximately $8.5 million: (1) denial of inclusion in rate base of certain reliability plant investments, which occurred subsequent to the test period but before the rate effective period; (2) denial of Pepco’s request to increase depreciation rates to reflect a corrected formula relating to the cost of removal expenses; and (3) imposition of imputed cost savings to partially offset the costs of Pepco’s enhanced vegetation management program. Maryland law and regulation do not mandate a response time from the MPSC regarding Pepco’s motion and, therefore, it is not known when the MPSC will issue a ruling on the motion.
On February 1, 2011, the MPSC initiated proceedings for Pepco and DPL, as well as unaffiliated utilities such as Baltimore Gas & Electric Company and Southern Maryland Electric Cooperative, for the purpose of reviewing how the BSA operates to recover revenues lost as a result of major storm outages. In its orders initiating the proceedings, the MPSC expressed concern that the utilities’ respective BSAs may be allowing them to recover revenues lost during extended outages, therefore unintentionally eliminating an incentive to restore service quickly. The MPSC will consider whether the BSA, as currently in effect, is appropriate, whether the calculations or determinant factors for calculating the BSA should be modified, and if so, what modifications should be made. A similar adjustment was included in the BSA in the District of Columbia when the BSA was approved by the DCPSC.
PEPCO
General Litigation
In 1993, Pepco was served with Amended Complaints filed in the state Circuit Courts of Prince George’s County, Baltimore City and Baltimore County, Maryland in separate ongoing, consolidated proceedings known as “In re: Personal Injury Asbestos Case.” Pepco and other corporate entities were brought into these cases on a theory of premises liability. Under this theory, the plaintiffs argued that Pepco was negligent in not providing a safe work environment for employees or its contractors, who allegedly were exposed to asbestos while working on Pepco’s property. Initially, a total of approximately 448 individual plaintiffs added Pepco to their complaints. While the pleadings are not entirely clear, it appears that each plaintiff sought $2 million in compensatory damages and $4 million in punitive damages from each defendant.
Since the initial filings in 1993, additional individual suits have been filed against Pepco, and significant numbers of cases have been dismissed. As a result of two motions to dismiss, numerous hearings and meetings and one motion for summary judgment, Pepco has had approximately 400 of these cases successfully dismissed with prejudice, either voluntarily by the plaintiff or by the court. As of December 31, 2010,2011, there are approximately 180 cases still pending against Pepco in the Maryland State Courts, of Maryland, of which approximately 90 cases were filed after December 19, 2000, and were tendered to Mirant Corporation (Mirant) for defense and indemnification in connection with the sale by Pepco of its generation assets to Mirant in 2000.
While the aggregate amount of monetary damages sought in the remaining suits (excluding those tendered to Mirant) is approximately $360 million, PHI and Pepco believe the amounts claimed by the remaining plaintiffs are greatly exaggerated. The amount of total liability, if any, and any related insurance recovery cannot be determined at this time; however, based on information and relevant circumstances known at this time, neither PHI nor Pepco believes these suits will have a material adverse effect on its financial condition, results of operations or cash flows. However, iftime. If an unfavorable decision were rendered against Pepco, it could have a material adverse effect on Pepco’s and PHI’s financial condition, results of operations and cash flows.
Environmental LitigationMatters
Pepco is subject to regulation by various federal, regional, state, and local authorities with respect to the environmental effects of its operations, including air and water quality control, solid and hazardous waste disposal, and limitations on land use. In addition, federal and state statutes authorize governmental agencies to compel responsible parties to clean up certain abandoned or unremediated hazardous waste sites. Pepco may incur costs to clean up currently or formerly owned facilities or sites found to be contaminated, as well as other facilities or sites that may have been contaminated due to past disposal practices. Although penalties assessed for violations of environmental laws and regulations are not recoverable from Pepco’s customers, environmental clean-up costs incurred by Pepco would begenerally are included in its cost of service for ratemaking purposes. The total accrued liabilities for the environmental contingencies of Pepco described below at December 31, 2011 are summarized as follows:
| Transmission and Distribution | Legacy Regulated Generation | Other | Total | |||||||||||||
| (millions of dollars) | ||||||||||||||||
Beginning balance as of January 1 | $ | 12 | $ | 3 | $ | — | $ | 15 | ||||||||
Accruals | 2 | 1 | — | 3 | ||||||||||||
Payments | — | — | — | — | ||||||||||||
|
|
|
|
|
|
|
| |||||||||
Ending balance as of December 31 | 14 | 4 | — | 18 | ||||||||||||
Less amounts in Other Current Liabilities | 2 | — | — | 2 | ||||||||||||
|
|
|
|
|
|
|
| |||||||||
Amounts in Other Deferred Credits | $ | 12 | $ | 4 | $ | — | $ | 16 | ||||||||
|
|
|
|
|
|
|
| |||||||||
245
PEPCO
Peck Iron and Metal Site.
The U.S. Environmental Protection Agency (EPA) informed Pepco in a May 2009 letter that Pepco may be a potentially responsible party (PRP) under the Comprehensive Environmental Response, Compensation, and Liability Act of 1980 (CERCLA) with respect to the cleanup of the Peck Iron and Metal site in Portsmouth, Virginia, and for costs EPA has incurred in cleaning up the site. The EPA letter states that Peck Iron and Metal purchased, processed, stored and shipped metal scrap from military bases, governmental agencies and businesses and that Peck’s metal scrap operations resulted in the improper storage and disposal of hazardous substances. EPA bases its allegation that Pepco arranged for disposal or treatment of hazardous substances sent to the site on information provided by former Peck Iron and Metal personnel, who informed EPA that Pepco was a customer at the site. Pepco has advised EPA by letter that its records show no evidence of any sale of scrap metal by Pepco to the site. Even if EPA has such records and such sales did occur, Pepco believes that any such scrap metal sales aremay be entitled to the recyclable material exemption from CERCLA liability. At this time Pepco cannot predict how EPA will proceed regarding this matter, or what portion, if any, of the Peck Iron and Metal site
PEPCO
response costs EPA would seek to recover from Pepco. In a Federal Register notice published on November 4, 2009, EPA placed the Peck Iron and Metal site on the National Priorities List (NPL). The NPL, among other things, serves as a guide to EPA in determining which sites warrant further investigation to assess the nature and extent of the human health and environmental risks associated with a site. In September 2011, EPA initiated a remedial investigation/feasibility study (RI/FS) using federal funds. Pepco cannot at this time estimate an amount or range of reasonably possible loss associated with the RI/FS, any remediation activities to be performed at the site or any other costs that EPA might seek to impose on Pepco.
Ward Transformer Site.
In April 2009, a group of PRPs with respect to the Ward Transformer site in Raleigh, North Carolina, filed a complaint in the U.S. District Court for the Eastern District of North Carolina, alleging cost recovery and/or contribution claims against a number of entities, including Pepco, with respect to past and future response costs incurred by the PRP group in performing a removal action at the site. With the court’s permission, the plaintiffs filed amended complaints in September 2009. Pepco, as part of a group of defendants, filed a motion to dismiss in October 2009. In a March 24, 2010 order, the court denied the defendants’ motion to dismiss. Although it is too earlyThe next step in the processlitigation will be the filing of summary judgment motions regarding liability for certain “test case” defendants other than Pepco. The case has been stayed as to characterize the magnitude ofremaining defendants pending rulings upon the potential liabilitytest cases. Although Pepco cannot at this site,time estimate an amount or range of reasonably possible losses to which it may be exposed, Pepco does not believe that it had extensive business transactions, if any, with the Ward Transformer site.site and therefore, costs incurred to resolve this matter are not expected to be material.
Benning Road Site. On
In September 21, 2010, PHI received a letter from EPA stating that EPA and the District of Columbia Department of the Environment (DDOE) have identified the Benning Road location, consisting of a transmission and distribution facility operated by Pepco and a generation facility operated by Pepco Energy Services, as one of six land-based sites potentially contributing to contamination of the Lowerlower Anacostia River. The letter stated that the principal contaminants of concern are polychlorinated biphenyls (PCBs) and polycyclic aromatic hydrocarbons, that EPA is monitoring the efforts of DDOE and that EPA intends to use federal authority to address the Benning Road site if an agreement for a comprehensive study to evaluate (and, if necessary, as a result of the study, to clean upup) the facility)facility is not reached. In a letter dated October 8, 2010, the Office of the Attorney General of the District of Columbia notified PHI of the District’s intent to sue Pepco Energy Services and Pepco under the Resource Conservation and Recovery Act for abatement of conditions related to their historical activities, including the discharge of PCBs at the Benning Road site. The District’s letter also stated that EPA will list the Benning Road site on the NPL if contamination at the facility is not addressed in a timely manner and that if Pepco fails to meet the District’s deadline, the District intends to sue Pepco and Pepco Energy Services in federal court to seek a scientific study to identify the nature of conditions at the Benning Road site, abatement of conditions, compensation for natural resource damages and reimbursement of DDOE’s related costs.January 2011, Pepco and Pepco Energy Services entered into a proposed consent decree with DDOE filed in the federal District Court on February 1, 2011, which will require the PHI entitiesthat requires Pepco and Pepco Energy Services to conduct a remedial investigation and feasibility study (RI/FS)RI/FS for the Benning Road site and an approximately 10-15 acre portion of the adjacent Anacostia River. The RI/FS will form the basis for DDOE’s selection of a remedial action for the Benning Road site and for the Anacostia River sediment associated with the site. In February 2011, the District of Columbia filed a complaint against Pepco and Pepco Energy Services in the United States District Court for the District of Columbia for the purpose of obtaining judicial approval of the consent decree. The complaint asserted claims under CERCLA, the Resource Conservation and Recovery Act, and District of Columbia law seeking to compel Pepco and Pepco Energy Services to take
246
PEPCO
actions to investigate and clean up contamination allegedly originating from the Benning Road site, and to reimburse the District of Columbia for its response costs. On December 1, 2011, the District Court issued an order granting the motion to enter a revised consent decree will not be final until the DDOE files a motion requesting the Court to enter.The District Court’s order entering the consent decree after arequires DDOE to solicit and consider public comment period ends on March 7, 2011,the key RI/FS documents prior to final approval, requires DDOE to make final versions of all approved RI/FS documents available to the public, and requires the parties to submit a written status report to the District Court enters it. In lighton May 24, 2013 regarding the implementation of the requirements of the consent decree and any related plans for remediation. In addition, if the RI/FS has not been completed by May 24, 2013, the status report must provide an explanation and a showing of good cause for why the work has not been completed.
Pepco and Pepco Energy Services commenced work on the RI/FS upon entry of the consent decree. On December 21, 2011, they submitted a draft RI/FS Scope of Work and a draft Community Involvement Plan to DDOE for review. DDOE has solicited public comment on these documents, which were due by February 13, 2012, with respect to the draft Scope of Work, and are due by March 7, 2012 with respect to the Draft Community Involvement Plan. Depending on the nature and extent of public comments received, Pepco and Pepco Energy Services anticipate that EPA will refrain from listing the Benning Road facility on the NPL. PHI preliminarily estimates that costs for performing the RI/FSthese documents will be approximately $600,000approved and the remediation costsa draft RI/FS work plan will be approximately $13 million. PHI recognized expensesubmitted by the end of $14 million in the fourthfirst quarter of 2010 with respect to this matter and, as2012. The field work will commence after final work plan approval by DDOE.
The amount of December 31, 2010, has $14 millionremediation costs accrued for this matter.matter is included in the table above under the column entitled Transmission and Distribution.
Potomac River Mineral Oil Release
In January 2011, a coupling failure on a transformer cooler pipe resulted in a release of non-toxic mineral oil at Pepco’s Potomac River substation in Alexandria, Virginia. An overflow of an underground secondary containment reservoir resulted in approximately 4,500 gallons of mineral oil flowing into the Potomac River.
The release falls within the regulatory jurisdiction of multiple federal and state agencies. Beginning in March 2011, DDOE issued a series of compliance directives that require Pepco to prepare an incident report, provide certain records, and prepare and implement plans for sampling surface water and river sediments and assessing ecological risks and natural resources damages. Pepco has submitted an incident report and is providing the requested records. In December 2011, Pepco completed field sampling and anticipates submitting a report to DDOE during the second quarter of 2012.
On March 16, 2011, the Virginia Department of Environmental Quality (VADEQ) requested documentation regarding the release and the preparation of an emergency response report, which Pepco submitted to the agency on April 20, 2011. On March 25, 2011, Pepco received a notice of violation from VADEQ and in December 2011, VADEQ executed a consent agreement that had been executed by Pepco in August, pursuant to which Pepco paid a civil penalty of approximately $40,000.
During March 2011, EPA conducted an inspection of the Potomac River substation to review compliance with federal regulations regarding Spill Prevention, Control, and Countermeasure (SPCC) plans for facilities using oil-containing equipment in proximity to surface waters. As a result, EPA identified several potential violations of the SPCC regulations relating to SPCC plan content, recordkeeping, and secondary containment, which EPA advised may lead to an EPA demand for noncompliance penalties. As a result of the oil release, Pepco submitted a revised SPCC plan to EPA in August 2011 and implemented certain interim operational changes to the secondary containment systems at the facility which involve pumping accumulated storm water to an aboveground holding tank for off-site disposal. In December 2011, Pepco completed the installation of a treatment system designed to allow automatic discharge of accumulated storm water from the secondary containment system. Pepco is currently seeking DDOE’s
247
PEPCO
approval to commence operation of the new system and, after receiving such approval, will submit a further revised SPCC plan to EPA. In the meantime, Pepco will continue to use the above ground holding tank to manage storm water from the secondary containment system.
The U.S. Coast Guard assessed a $5,000 penalty against Pepco for the release of oil into the waters of the United States, which Pepco has paid.
In addition to the cost to remediate impacts to the river and shoreline, Pepco also may be liable for non-compliance penalties and/or natural resource damages in addition to those it has already paid. It is not possible to accurately estimate an amount or range of reasonably possible loss to which it may be exposed associated with this liability at this time; however, based on current information, PHI and Pepco do not believe this matter will have a material adverse effect on their respective financial conditions, results of operations or cash flows.
The amounts accrued for these matters are included in the table above under the column entitled Transmission and Distribution.
District of Columbia Tax Legislation
In December 2009,On June 14, 2011, the MayorCouncil of the District of Columbia approved legislation adopted by the City CouncilFiscal Year 2012 Budget Support Act of 2011 (the Budget Support Act). The Budget Support Act includes a provision requiring that imposes mandatory combined unitary business reporting beginning with tax year 2011, and revises the District’s related party expense disallowance beginning with tax year 2009. Because the City Council must still enact further legislation providing guidance on how to implement combined unitary business reporting before this provision is effective, PHI believes that the legislative process was not complete as of December 31, 2010, and, therefore, the effect of the legislation for combined unitary business tax reporting has not been accounted for as of December 31, 2010.
PEPCO
The legislation does not define the term “unitary business” and does not specify how combined tax reporting would differ from PHI’s current consolidated tax reportingcorporate taxpayers in the District of Columbia. However, based upon PHI’s interpretationColumbia calculate taxable income allocable or apportioned to the District of combinedColumbia by reference to the income and apportionment factors applicable to commonly controlled entities organized within the United States that are engaged in a unitary businessbusiness. This new tax reporting method resulted in other taxing jurisdictions, the legislation would likely result in a change in PHI’s overallan additional state income tax rate and, therefore, would likely require an adjustment to PHI’s net deferred income tax liabilities. Further, to the extent that the changeprovision of less than $1 million in rate increases net deferred income tax liabilities, PHI must determine if these increased tax liabilities are probable2011, which is reflected in Pepco’s results of recovery in future rates. No timetable has been established by the City Council to enact the required further legislation and, therefore, it is uncertain as to when combined unitary reporting will be effective for PHI’soperations. The District of Columbia tax returns.
Management continuesOffice of Tax and Revenue issued proposed regulations on January 20, 2012, to implement this reporting method. Pepco will continue to analyze these regulations and will record the impact, that the unitary business tax reporting aspectif any, of this legislation, if completed, may havesuch regulations on the financial position,PHI’s results of operations and cash flows of PHI and its subsidiaries.in the period in which the proposed regulations are adopted as final regulations.
Contractual Obligations
As of December 31, 2010,2011, Pepco had no contractual obligations under non-derivative fuel and power purchase contracts.
(14) RELATED PARTY TRANSACTIONS
PHI Service Company provides various administrative and professional services to PHI and its regulated and unregulated subsidiaries, including Pepco. The cost of these services is allocated in accordance with cost allocation methodologies set forth in the service agreement using a variety of factors, including the subsidiaries’ share of employees, operating expenses, assets, and other cost causal methods. These intercompany transactions are eliminated by PHI in consolidation and no profit results from these transactions at PHI. PHI Service Company costs directly charged or allocated to Pepco for the years ended December 31, 2011, 2010 2009 and 20082009 were approximately $185 million, $186 million $175 million, and $164$175 million, respectively.
Certain subsidiaries of Pepco Energy Services Inc. (collectively with its subsidiaries, Pepco Energy Services) perform utility maintenance services, including services that are treated as capital costs, for Pepco. Amounts charged to Pepco by these companies for the years ended December 31, 2011, 2010 2009 and 20082009 were approximately $20 million, $10 million and $9 million, and $11 million, respectively.
248
PEPCO
In addition to the transactions described above, Pepco’s financial statements include the following related party transactions in its statements of income:
| For the Year Ended December 31, | ||||||||||||||||||||||||
| 2010 | 2009 | 2008 | For the Year Ended December 31, | |||||||||||||||||||||
| (millions of dollars) | 2011 | 2010 | 2009 | |||||||||||||||||||||
Income (Expense) | (millions of dollars) | |||||||||||||||||||||||
Purchased power under Default Electricity Supply contracts with Conectiv Energy Supply, Inc. (a) | $ | — | (b) | $ | 1 | $ | (23 | ) | ||||||||||||||||
Purchased power under Default Electricity Supply contracts with Conectiv Energy Supply, Inc. (a)(b) | $ | — | $ | — | $ | 1 | ||||||||||||||||||
| (a) | Included in purchased energy expense. |
| (b) | During 2010, PHI |
PEPCO
As of December 31, 20102011 and 2009,2010, Pepco had the following balances on its balance sheets due to related parties:
| 2010 | 2009 | |||||||||||||||
| (millions of dollars) | 2011 | 2010 | ||||||||||||||
(Liability) Asset | (millions of dollars) | |||||||||||||||
Payable to Related Party (current) (a) | ||||||||||||||||
PHI Parent Company | $ | — | $ | (8 | ) | $ | 15 | $ | — | |||||||
PHI Service Company | (27 | ) | (3 | ) | (32 | ) | (27 | ) | ||||||||
Pepco Energy Services (b) | (48 | ) | (99 | ) | (40 | ) | (48 | ) | ||||||||
Other | — | (1 | ) | |||||||||||||
| �� |
|
| ||||||||||||||
Total | $ | (75 | ) | $ | (111 | ) | $ | (57 | ) | $ | (75 | ) | ||||
|
| |||||||||||||||
Money Pool Balance with Pepco Holdings (included in Cash and cash equivalents) | $ | 82 | $ | 203 | ||||||||||||
Money Pool Balance with Pepco Holdings (included in cash and cash equivalents) | $ | — | $ | 82 | ||||||||||||
|
| |||||||||||||||
| (a) |
| (b) | Pepco bills customers on behalf of Pepco Energy Services where customers have selected Pepco Energy Services as their alternative energy supplier or where Pepco Energy Services has performed work for certain government agencies under a General Services Administration area-wide agreement. |
PEPCO
(15)QUARTERLY FINANCIAL INFORMATION (UNAUDITED)
The quarterly data presented below reflect all adjustments necessary, in the opinion of management, for a fair presentation of the interim results. Quarterly data normally vary seasonally because of temperature variations and differences between summer and winter rates. Therefore, comparisons by quarter within a year are not meaningful.
| 2010 | 2011 | |||||||||||||||||||||||||||||||||||||||
| First Quarter | Second Quarter | Third Quarter | Fourth Quarter | Total | First Quarter | Second Quarter | Third Quarter | Fourth Quarter | Total | |||||||||||||||||||||||||||||||
| (millions of dollars) | (millions of dollars) | |||||||||||||||||||||||||||||||||||||||
Total Operating Revenue | $ | 552 | $ | 539 | $ | 706 | $ | 491 | $ | 2,288 | $ | 534 | $ | 506 | $ | 603 | $ | 435 | $ | 2,078 | ||||||||||||||||||||
Total Operating Expenses (a) (b) | 516 | 462 | 617 | 463 | 2,058 | |||||||||||||||||||||||||||||||||||
Total Operating Expenses | 491 | 454 | 521 | 400 | 1,866 | |||||||||||||||||||||||||||||||||||
Operating Income | 36 | 77 | 89 | 28 | 230 | 43 | 52 | 82 | 35 | 212 | ||||||||||||||||||||||||||||||
Other Expenses | (22 | ) | (22 | ) | (19 | ) | (22 | ) | (85 | ) | (18 | ) | (18 | ) | (21 | ) | (20 | ) | (77 | ) | ||||||||||||||||||||
Income Before Income Tax Expense | 14 | 55 | 70 | 6 | 145 | 25 | 34 | 61 | 15 | 135 | ||||||||||||||||||||||||||||||
Income Tax Expense (Benefit) | 6 | 23 | 33 | (25 | ) | 37 | ||||||||||||||||||||||||||||||||||
Income Tax Expense (a) | 7 | 2 | 23 | 4 | 36 | |||||||||||||||||||||||||||||||||||
Net Income | $ | 8 | $ | 32 | $ | 37 | $ | 31 | $ | 108 | $ | 18 | $ | 32 | $ | 38 | $ | 11 | $ | 99 | ||||||||||||||||||||
| 2009 | ||||||||||||||||||||||||||||||||||||||||
| First Quarter | Second Quarter | Third Quarter | Fourth Quarter | Total | ||||||||||||||||||||||||||||||||||||
| (millions of dollars) | ||||||||||||||||||||||||||||||||||||||||
Total Operating Revenue | $ | 577 | $ | 518 | $ | 648 | $ | 488 | $ | 2,231 | ||||||||||||||||||||||||||||||
Total Operating Expenses (c) | 522 | 465 | 527 | 444 | 1,958 | |||||||||||||||||||||||||||||||||||
Operating Income | 55 | 53 | 121 | 44 | 273 | |||||||||||||||||||||||||||||||||||
Other Expenses | (22 | ) | (23 | ) | (23 | ) | (23 | ) | (91 | ) | ||||||||||||||||||||||||||||||
Income Before Income Tax Expense | 33 | 30 | 98 | 21 | 182 | |||||||||||||||||||||||||||||||||||
Income Tax Expense | 14 | 13 | 40 | 9 | 76 | |||||||||||||||||||||||||||||||||||
Net Income | $ | 19 | $ | 17 | $ | 58 | $ | 12 | $ | 106 | ||||||||||||||||||||||||||||||
| (a) | Includes tax benefits of $5 million (after-tax) associated with an interest benefit related to federal tax liabilities and an additional tax benefit of $4 million (after-tax) related to the filing of amended state tax returns, each recorded in the second quarter. |
249
PEPCO
| 2010 | ||||||||||||||||||||
| First Quarter | Second Quarter | Third Quarter | Fourth Quarter | Total | ||||||||||||||||
| (millions of dollars) | ||||||||||||||||||||
Total Operating Revenue | $ | 552 | $ | 539 | $ | 706 | $ | 491 | $ | 2,288 | ||||||||||
Total Operating Expenses (a) (b) | 516 | 462 | 617 | 463 | 2,058 | |||||||||||||||
Operating Income | 36 | 77 | 89 | 28 | 230 | |||||||||||||||
Other Expenses | (22 | ) | (22 | ) | (19 | ) | (22 | ) | (85 | ) | ||||||||||
Income Before Income Tax Expense | 14 | 55 | 70 | 6 | 145 | |||||||||||||||
Income Tax Expense (Benefit) | 6 | 23 | 33 | (25 | ) | 37 | ||||||||||||||
Net Income | $ | 8 | $ | 32 | $ | 37 | $ | 31 | $ | 108 | ||||||||||
| (a) | Includes restructuring charges of $6 million and $9 million in the third and fourth quarters, respectively. |
| (b) | Includes expenses of $2 million and $9 million in the second and third quarters, respectively, related to the effects of divestiture-related claims. |
(16)RESTRUCTURING CHARGE
With the ongoing wind downwind-down of the retail energy supply business of Pepco Energy Services and the disposition of Conectiv Energy, PHI is repositioningrepositioned itself as a regulated transmission and distribution company.company during 2010. In connection with this repositioning, PHI commencedcompleted a comprehensive organizational review in the second quarter of 2010 to identifythat identified opportunities to streamline the organization and to achieve certain reductions in corporate overhead costs that are allocated to its operating segments. This review hassegments, which resulted in the adoption of a restructuring plan. PHI began implementingimplementation of the plan during the third quarter,2010, identifying 164 employee positions that were to be eliminated during the fourth quarter of 2010.eliminated. The plan also focuses on identifyingincluded additional cost reduction opportunities that were implemented through process improvements and operational efficiencies.
In connection with the restructuring plan, Pepco recorded a pre-tax restructuring charge of $15 million for the year ended December 31, 2010 related to its allocation of severance, pension, and health and welfare benefits for terminationsthe termination of corporate services employees at PHI.PHI of $15 million in 2010. The severance, pension, and health and welfare benefits were estimated based on the years of service and compensation levels of the employees associated with the 164 eliminated positions at PHI. The restructuring charge has beenwas reflected as a separate line item in the statementsstatement of income.
PEPCO
income for the year ended December 31, 2010.
A reconciliation of Pepco’s accrued restructuring charges for the year ended December 31, 20102011 is as follows:
| Year Ended December 31, 2010 | ||||
| (millions of dollars) | ||||
Beginning balance as of January 1, 2010 | $ | — | ||
Restructuring charge | 15 | |||
Cash payments | — | |||
Ending balance as of December 31, 2010 | $ | 15 | ||
| Year Ended December 31, 2011 | ||||
| (millions of dollars) | ||||
Beginning balance as of January 1, 2011 | $ | 15 | ||
Restructuring charge | — | |||
Cash payments | (12 | ) | ||
Ending balance as of December 31, 2011 | $ | 3 | ||
250
DPL
Management’s Report on Internal Control over Financial Reporting
The management of DPL is responsible for establishing and maintaining adequate internal control over financial reporting, as such term is defined in Rule 13a-15(f) and Rule 15d-15(f) under the Securities Exchange Act of 1934, as amended.Act. Because of its inherent limitations, internal control over financial reporting may not prevent or detect misstatements. Also, projections of any evaluation of effectiveness to future periods are subject to the risk that controls may become inadequate because of changes in conditions, or that the degree of compliance with the policies or procedures may deteriorate.
Management of DPL assessed itsDPL’s internal control over financial reporting as of December 31, 20102011 based on the framework inInternal Control – Integrated Framework issued by the Committee of Sponsoring Organizations of the Treadway Commission. Based on its assessment, the management of DPL concluded that DPL’s internal control over financial reporting was effective as of December 31, 2010.2011.
251
DPL
Report of Independent Registered Public Accounting Firm
To the Shareholder and Board of Directors of
Delmarva Power & Light Company
In our opinion, the financial statements of Delmarva Power & Light Company (a wholly owned subsidiary of Pepco Holdings, Inc.) listed in the accompanying index appearing under Item 15(a)(1) present fairly, in all material respects, the financial position of Delmarva Power & Light Company at December 31, 20102011 and December 31, 2009,2010, and the results of its operations and its cash flows for each of the three years in the period ended December 31, 20102011 in conformity with accounting principles generally accepted in the United States of America. In addition, in our opinion, the financial statement schedule of Delmarva Power & Light Company listed in the index appearing under Item 15(a)(2) presents fairly, in all material respects, the information set forth therein when read in conjunction with the related financial statements. These financial statements and financial statement schedule are the responsibility of the Company’s management. Our responsibility is to express an opinion on these financial statements and financial statement schedule based on our audits. We conducted our audits of these statements in accordance with the standards of the Public Company Accounting Oversight Board (United States). Those standards require that we plan and perform the audit to obtain reasonable assurance about whether the financial statements are free of material misstatement. An audit includes examining, on a test basis, evidence supporting the amounts and disclosures in the financial statements, assessing the accounting principles used and significant estimates made by management, and evaluating the overall financial statement presentation. We believe that our audits provide a reasonable basis for our opinion.
| /s/ PricewaterhouseCoopers LLP |
| Washington, D.C. |
| February 23, 2012 |
Washington, D.C.252
February 24, 2011
DPL
DELMARVA POWER & LIGHT COMPANY
STATEMENTS OF INCOME
For the Year Ended December 31, | 2010 | 2009 | 2008 | |||||||||
| (millions of dollars) | ||||||||||||
Operating Revenue | ||||||||||||
Electric | $ | 1,163 | $ | 1,135 | $ | 1,221 | ||||||
Natural gas | 237 | 268 | 318 | |||||||||
Total Operating Revenue | 1,400 | 1,403 | 1,539 | |||||||||
Operating Expenses | ||||||||||||
Purchased energy | 740 | 751 | 821 | |||||||||
Gas purchased | 164 | 193 | 245 | |||||||||
Other operation and maintenance | 255 | 238 | 222 | |||||||||
Restructuring charge | 8 | — | — | |||||||||
Depreciation and amortization | 83 | 76 | 72 | |||||||||
Other taxes | 37 | 35 | 35 | |||||||||
Gain on sale of assets | — | — | (4 | ) | ||||||||
Total Operating Expenses | 1,287 | 1,293 | 1,391 | |||||||||
Operating Income | 113 | 110 | 148 | |||||||||
Other Income (Expenses) | ||||||||||||
Interest and dividend income | — | 1 | 2 | |||||||||
Interest expense | (44 | ) | (44 | ) | (40 | ) | ||||||
Other income | 7 | 1 | 3 | |||||||||
Total Other Expenses | (37 | ) | (42 | ) | (35 | ) | ||||||
Income Before Income Tax Expense | 76 | 68 | 113 | |||||||||
Income Tax Expense | 31 | 16 | 45 | |||||||||
Net Income | $ | 45 | $ | 52 | $ | 68 | ||||||
For the Year Ended December 31, | 2011 | 2010 | 2009 | |||||||||
| (millions of dollars) | ||||||||||||
Operating Revenue | ||||||||||||
Electric | $ | 1,074 | $ | 1,163 | $ | 1,135 | ||||||
Natural gas | 230 | 237 | 268 | |||||||||
|
|
|
|
|
| |||||||
Total Operating Revenue | 1,304 | 1,400 | 1,403 | |||||||||
|
|
|
|
|
| |||||||
Operating Expenses | ||||||||||||
Purchased energy | 635 | 740 | 751 | |||||||||
Gas purchased | 155 | 164 | 193 | |||||||||
Other operation and maintenance | 239 | 255 | 238 | |||||||||
Restructuring charge | — | 8 | — | |||||||||
Depreciation and amortization | 89 | 83 | 76 | |||||||||
Other taxes | 37 | 37 | 35 | |||||||||
|
|
|
|
|
| |||||||
Total Operating Expenses | 1,155 | 1,287 | 1,293 | |||||||||
|
|
|
|
|
| |||||||
Operating Income | 149 | 113 | 110 | |||||||||
|
|
|
|
|
| |||||||
Other Income (Expenses) | ||||||||||||
Interest and dividend income | — | — | 1 | |||||||||
Interest expense | (44 | ) | (44 | ) | (44 | ) | ||||||
Other income | 8 | 7 | 1 | |||||||||
|
|
|
|
|
| |||||||
Total Other Expenses | (36 | ) | (37 | ) | (42 | ) | ||||||
|
|
|
|
|
| |||||||
Income Before Income Tax Expense | 113 | 76 | 68 | |||||||||
Income Tax Expense | 42 | 31 | 16 | |||||||||
|
|
|
|
|
| |||||||
Net Income | $ | 71 | $ | 45 | $ | 52 | ||||||
|
|
|
|
|
| |||||||
The accompanying Notes are an integral part of these Financial Statements.
253
DPL
DELMARVA POWER & LIGHT COMPANY
BALANCE SHEETS
ASSETS | December 31, 2010 | December 31, 2009 | ||||||
| (millions of dollars) | ||||||||
CURRENT ASSETS | ||||||||
Cash and cash equivalents | $ | 69 | $ | 26 | ||||
Accounts receivable, less allowance for uncollectible accounts of $13 million and $12 million, respectively | 212 | 193 | ||||||
Inventories | 41 | 40 | ||||||
Prepayments of income taxes | 62 | 64 | ||||||
Prepaid expenses and other | 22 | 19 | ||||||
Total Current Assets | 406 | 342 | ||||||
INVESTMENTS AND OTHER ASSETS | ||||||||
Goodwill | 8 | 8 | ||||||
Regulatory assets | 242 | 207 | ||||||
Prepaid pension expense | 139 | 157 | ||||||
Other | 21 | 28 | ||||||
Total Investments and Other Assets | 410 | 400 | ||||||
PROPERTY, PLANT AND EQUIPMENT | ||||||||
Property, plant and equipment | 3,000 | 2,807 | ||||||
Accumulated depreciation | (901 | ) | (860 | ) | ||||
Net Property, Plant and Equipment | 2,099 | 1,947 | ||||||
TOTAL ASSETS | $ | 2,915 | $ | 2,689 | ||||
ASSETS | December 31, 2011 | December 31, 2010 | ||||||
| (millions of dollars) | ||||||||
CURRENT ASSETS | ||||||||
Cash and cash equivalents | $ | 5 | $ | 69 | ||||
Accounts receivable, less allowance for uncollectible accounts of $12 million and $13 million, respectively | 186 | 212 | ||||||
Inventories | 44 | 41 | ||||||
Prepayments of income taxes | 14 | 62 | ||||||
Prepaid expenses and other | 28 | 22 | ||||||
|
|
|
| |||||
Total Current Assets | 277 | 406 | ||||||
|
|
|
| |||||
INVESTMENTS AND OTHER ASSETS | ||||||||
Goodwill | 8 | 8 | ||||||
Regulatory assets | 227 | 242 | ||||||
Prepaid pension expense | 162 | 139 | ||||||
Other | 23 | 21 | ||||||
|
|
|
| |||||
Total Investments and Other Assets | 420 | 410 | ||||||
|
|
|
| |||||
PROPERTY, PLANT AND EQUIPMENT | ||||||||
Property, plant and equipment | 3,188 | 3,000 | ||||||
Accumulated depreciation | (926 | ) | (901 | ) | ||||
|
|
|
| |||||
Net Property, Plant and Equipment | 2,262 | 2,099 | ||||||
|
|
|
| |||||
TOTAL ASSETS | $ | 2,959 | $ | 2,915 | ||||
|
|
|
| |||||
The accompanying Notes are an integral part of these Financial Statements.
255
254
DPL
DELMARVA POWER & LIGHT COMPANY
BALANCE SHEETS
LIABILITIES AND EQUITY | December 31, 2010 | December 31, 2009 | ||||||
| (millions of dollars, except shares) | ||||||||
CURRENT LIABILITIES | ||||||||
Short-term debt | $ | 105 | $ | 105 | ||||
Current portion of long-term debt | 35 | 31 | ||||||
Accounts payable and accrued liabilities | 98 | 106 | ||||||
Accounts payable due to associated companies | 34 | 14 | ||||||
Taxes accrued | 6 | 3 | ||||||
Interest accrued | 7 | 6 | ||||||
Derivative liabilities | 15 | 15 | ||||||
Other | 73 | 64 | ||||||
Total Current Liabilities | 373 | 344 | ||||||
DEFERRED CREDITS | ||||||||
Regulatory liabilities | 310 | 290 | ||||||
Deferred income taxes, net | 561 | 489 | ||||||
Investment tax credits | 7 | 7 | ||||||
Other postretirement benefit obligations | 22 | 23 | ||||||
Above-market purchased energy contracts and other electric restructuring liabilities | 14 | 17 | ||||||
Liabilities and accrued interest related to uncertain tax positions | 24 | 20 | ||||||
Derivative liabilities | 8 | 13 | ||||||
Other | 25 | 23 | ||||||
Total Deferred Credits | 971 | 882 | ||||||
LONG-TERM LIABILITIES | ||||||||
Long-term debt | 730 | 655 | ||||||
COMMITMENTS AND CONTINGENCIES (NOTE 15) | ||||||||
EQUITY | ||||||||
Common stock, $2.25 par value, 1,000 shares authorized, 1,000 shares outstanding | — | — | ||||||
Premium on stock and other capital contributions | 347 | 336 | ||||||
Retained earnings | 494 | 472 | ||||||
Total Equity | 841 | 808 | ||||||
TOTAL LIABILITIES AND EQUITY | $ | 2,915 | $ | 2,689 | ||||
LIABILITIES AND EQUITY | December 31, 2011 | December 31, 2010 | ||||||
| (millions of dollars, except shares) | ||||||||
CURRENT LIABILITIES | ||||||||
Short-term debt | $ | 152 | $ | 105 | ||||
Current portion of long-term debt | 66 | 35 | ||||||
Accounts payable and accrued liabilities | 92 | 98 | ||||||
Accounts payable due to associated companies | 21 | 34 | ||||||
Taxes accrued | 11 | 6 | ||||||
Interest accrued | 6 | 7 | ||||||
Derivative liabilities | 12 | 15 | ||||||
Other | 59 | 73 | ||||||
|
|
|
| |||||
Total Current Liabilities | 419 | 373 | ||||||
|
|
|
| |||||
DEFERRED CREDITS | ||||||||
Regulatory liabilities | 297 | 310 | ||||||
Deferred income taxes, net | 615 | 561 | ||||||
Investment tax credits | 6 | 7 | ||||||
Other postretirement benefit obligations | 22 | 22 | ||||||
Liabilities and accrued interest related to uncertain tax positions | 9 | 24 | ||||||
Derivative liabilities | 3 | 8 | ||||||
Other | 37 | 39 | ||||||
|
|
|
| |||||
Total Deferred Credits | 989 | 971 | ||||||
|
|
|
| |||||
LONG-TERM LIABILITIES | ||||||||
Long-term debt | 699 | 730 | ||||||
|
|
|
| |||||
COMMITMENTS AND CONTINGENCIES (NOTE 15) | ||||||||
EQUITY | ||||||||
Common stock, $2.25 par value, 1,000 shares authorized, 1,000 shares outstanding | — | — | ||||||
Premium on stock and other capital contributions | 347 | 347 | ||||||
Retained earnings | 505 | 494 | ||||||
|
|
|
| |||||
Total Equity | 852 | 841 | ||||||
|
|
|
| |||||
TOTAL LIABILITIES AND EQUITY | $ | 2,959 | $ | 2,915 | ||||
|
|
|
| |||||
The accompanying Notes are an integral part of these Financial Statements.
255
DPL
DELMARVA POWER & LIGHT COMPANY
STATEMENTS OF CASH FLOWS
For the Year Ended December 31, | 2010 | 2009 | 2008 | |||||||||
| (millions of dollars) | ||||||||||||
OPERATING ACTIVITIES | ||||||||||||
Net income | $ | 45 | $ | 52 | $ | 68 | ||||||
Adjustments to reconcile net income to net cash from operating activities: | ||||||||||||
Depreciation and amortization | 83 | 76 | 72 | |||||||||
Deferred income taxes | 74 | 60 | 33 | |||||||||
Investment tax credit adjustments | (1 | ) | (1 | ) | (1 | ) | ||||||
Other | — | — | (4 | ) | ||||||||
Changes in: | ||||||||||||
Accounts receivable | (21 | ) | 10 | (44 | ) | |||||||
Inventories | (1 | ) | 12 | (7 | ) | |||||||
Prepaid expenses | — | 1 | (7 | ) | ||||||||
Regulatory assets and liabilities, net | (12 | ) | 29 | 27 | ||||||||
Accounts payable and accrued liabilities | 31 | (26 | ) | (19 | ) | |||||||
Pension contributions | — | (10 | ) | — | ||||||||
Prepaid pension expense, excluding contributions | 18 | 37 | (6 | ) | ||||||||
Taxes accrued | 11 | (37 | ) | 12 | ||||||||
Other assets and liabilities | (1 | ) | 10 | (1 | ) | |||||||
Net Cash From Operating Activities | 226 | 213 | 123 | |||||||||
INVESTING ACTIVITIES | ||||||||||||
Investment in property, plant and equipment | (250 | ) | (193 | ) | (150 | ) | ||||||
Proceeds from sale of assets | — | 1 | 54 | |||||||||
Changes in restricted cash equivalents | — | — | 4 | |||||||||
Net other investing activities | 2 | 1 | (1 | ) | ||||||||
Net Cash Used By Investing Activities | (248 | ) | (191 | ) | (93 | ) | ||||||
FINANCING ACTIVITIES | ||||||||||||
Dividends paid to Parent | (23 | ) | (28 | ) | (52 | ) | ||||||
Capital contribution from Parent | 11 | 32 | 62 | |||||||||
Issuances of long-term debt | 109 | — | 400 | |||||||||
Reacquisitions of long-term debt | (31 | ) | — | (116 | ) | |||||||
Repayments of short-term debt, net | — | (141 | ) | (190 | ) | |||||||
Net other financing activities | (1 | ) | 3 | (7 | ) | |||||||
Net Cash From (Used By) Financing Activities | 65 | (134 | ) | 97 | ||||||||
Net Increase (Decrease) In Cash and Cash Equivalents | 43 | (112 | ) | 127 | ||||||||
Cash and Cash Equivalents at Beginning of Year | 26 | 138 | 11 | |||||||||
CASH AND CASH EQUIVALENTS AT END OF YEAR | $ | 69 | $ | 26 | $ | 138 | ||||||
SUPPLEMENTAL DISCLOSURE OF CASH FLOW INFORMATION | ||||||||||||
Cash paid for interest (net of capitalized interest of $2 million, $1 million and $1 million, respectively) | $ | 40 | $ | 41 | $ | 37 | ||||||
Cash (received) paid for income taxes | (49 | ) | (17 | ) | 1 | |||||||
For the Year Ended December 31, | 2011 | 2010 | 2009 | |||||||||
| (millions of dollars) | ||||||||||||
OPERATING ACTIVITIES | ||||||||||||
Net income | $ | 71 | $ | 45 | $ | 52 | ||||||
Adjustments to reconcile net income to net cash from operating activities: | ||||||||||||
Depreciation and amortization | 89 | 83 | 76 | |||||||||
Deferred income taxes | 57 | 74 | 60 | |||||||||
Investment tax credit amortization | (1 | ) | (1 | ) | (1 | ) | ||||||
Changes in: | ||||||||||||
Accounts receivable | 26 | (21 | ) | 10 | ||||||||
Inventories | (3 | ) | (1 | ) | 12 | |||||||
Regulatory assets and liabilities, net | (32 | ) | (12 | ) | 29 | |||||||
Accounts payable and accrued liabilities | (23 | ) | 31 | (26 | ) | |||||||
Pension contributions | (40 | ) | — | (10 | ) | |||||||
Prepaid pension expense, excluding contributions | 17 | 18 | 37 | |||||||||
Taxes accrued | 14 | 11 | (37 | ) | ||||||||
Other assets and liabilities | 3 | (1 | ) | 11 | ||||||||
|
|
|
|
|
| |||||||
Net Cash From Operating Activities | 178 | 226 | 213 | |||||||||
|
|
|
|
|
| |||||||
INVESTING ACTIVITIES | ||||||||||||
Investment in property, plant and equipment | (229 | ) | (250 | ) | (193 | ) | ||||||
Proceeds from sale of assets | — | — | 1 | |||||||||
Net other investing activities | (4 | ) | 2 | 1 | ||||||||
|
|
|
|
|
| |||||||
Net Cash Used By Investing Activities | (233 | ) | (248 | ) | (191 | ) | ||||||
|
|
|
|
|
| |||||||
FINANCING ACTIVITIES | ||||||||||||
Dividends paid to Parent | (60 | ) | (23 | ) | (28 | ) | ||||||
Capital contribution from Parent | — | 11 | 32 | |||||||||
Issuances of long-term debt | 35 | 109 | — | |||||||||
Reacquisitions of long-term debt | (35 | ) | (31 | ) | — | |||||||
Issuances (repayments) of short-term debt, net | 47 | — | (141 | ) | ||||||||
Net other financing activities | 4 | (1 | ) | 3 | ||||||||
|
|
|
|
|
| |||||||
Net Cash (Used By) From Financing Activities | (9 | ) | 65 | (134 | ) | |||||||
|
|
|
|
|
| |||||||
Net (Decrease) Increase In Cash and Cash Equivalents | (64 | ) | 43 | (112 | ) | |||||||
Cash and Cash Equivalents at Beginning of Year | 69 | 26 | 138 | |||||||||
|
|
|
|
|
| |||||||
CASH AND CASH EQUIVALENTS AT END OF YEAR | $ | 5 | $ | 69 | $ | 26 | ||||||
|
|
|
|
|
| |||||||
SUPPLEMENTAL DISCLOSURE OF CASH FLOW INFORMATION | ||||||||||||
Cash paid for interest (net of capitalized interest of $1 million, $2 million and $1 million, respectively) | $ | 43 | $ | 40 | $ | 41 | ||||||
Cash received for income taxes | (24 | ) | (49 | ) | (17 | ) | ||||||
The accompanying Notes are an integral part of these Financial Statements.
256
DPL
DELMARVA POWER & LIGHT COMPANY
STATEMENTS OF EQUITY
| Common Stock | Premium on Stock | Retained Earnings | Total | |||||||||||||||||
(millions of dollars, except shares) | Shares | Par Value | ||||||||||||||||||
BALANCE, DECEMBER 31, 2007 | 1,000 | $ | — | $ | 242 | $ | 432 | $ | 674 | |||||||||||
Net Income | — | — | — | 68 | 68 | |||||||||||||||
Dividends on common stock | — | — | — | (52 | ) | (52 | ) | |||||||||||||
Capital contribution from Parent | — | — | 62 | — | 62 | |||||||||||||||
BALANCE, DECEMBER 31, 2008 | 1,000 | — | 304 | 448 | 752 | |||||||||||||||
Net Income | — | — | — | 52 | 52 | |||||||||||||||
Dividends on common stock | — | — | — | (28 | ) | (28 | ) | |||||||||||||
Capital contribution from Parent | — | — | 32 | — | 32 | |||||||||||||||
BALANCE, DECEMBER 31, 2009 | 1,000 | — | 336 | 472 | 808 | |||||||||||||||
Net Income | — | — | — | 45 | 45 | |||||||||||||||
Dividends on common stock | — | — | — | (23 | ) | (23 | ) | |||||||||||||
Capital contribution from Parent | — | — | 11 | — | 11 | |||||||||||||||
BALANCE, DECEMBER 31, 2010 | 1,000 | $ | — | $ | 347 | $ | 494 | $ | 841 | |||||||||||
| Common Stock | Premium on Stock | Retained Earnings | Total | |||||||||||||||||
(millions of dollars, except shares) | Shares | Par Value | ||||||||||||||||||
BALANCE, DECEMBER 31, 2008 | 1,000 | $ | — | $ | 304 | $ | 448 | $ | 752 | |||||||||||
Net Income | — | — | — | 52 | 52 | |||||||||||||||
Dividends on common stock | — | — | — | (28 | ) | (28 | ) | |||||||||||||
Capital contribution from Parent | — | — | 32 | — | 32 | |||||||||||||||
|
|
|
|
|
|
|
|
|
| |||||||||||
BALANCE, DECEMBER 31, 2009 | 1,000 | — | 336 | 472 | 808 | |||||||||||||||
Net Income | — | — | — | 45 | 45 | |||||||||||||||
Dividends on common stock | — | — | — | (23 | ) | (23 | ) | |||||||||||||
Capital contribution from Parent | — | — | 11 | — | 11 | |||||||||||||||
|
|
|
|
|
|
|
|
|
| |||||||||||
BALANCE, DECEMBER 31, 2010 | 1,000 | — | 347 | 494 | 841 | |||||||||||||||
Net Income | — | — | — | 71 | 71 | |||||||||||||||
Dividends on common stock | — | — | — | (60 | ) | (60 | ) | |||||||||||||
|
|
|
|
|
|
|
|
|
| |||||||||||
BALANCE, DECEMBER 31, 2011 | 1,000 | $ | — | $ | 347 | $ | 505 | $ | 852 | |||||||||||
|
|
|
|
|
|
|
|
|
| |||||||||||
The accompanying Notes are an integral part of these Financial Statements.
257
DPL
NOTES TO FINANCIAL STATEMENTS
DELMARVA POWER & LIGHT COMPANY
(1)ORGANIZATION
Delmarva Power & Light Company (DPL) is engaged in the transmission and distribution of electricity in Delaware and portions of Maryland and provides natural gas distribution service in northern Delaware. Additionally, DPL provides Default Electricity Supply, which is the supply of electricity at regulated rates to retail customers in its service territories who do not elect to purchase electricity from a competitive supplier. Default Electricity Supply is known as Standard Offer Service in both Delaware and Maryland. DPL is a wholly owned subsidiary of Conectiv, LLC (Conectiv), which is wholly owned by Pepco Holdings, Inc. (Pepco Holdings or PHI).
In January 2008, DPL completed the sale of its retail electric distribution assets and the sale of its wholesale electric transmission assets, both located on Virginia’s Eastern Shore.
(2)SIGNIFICANT ACCOUNTING POLICIES
Use of Estimates
The preparation of financial statements in conformity with accounting principles generally accepted in the United States of America requires management to make certain estimates and assumptions that affect the reported amounts of assets, liabilities, revenues and expenses, and related disclosures of contingent assets and liabilities in the financial statements and accompanying notes. Although DPL believes that its estimates and assumptions are reasonable, they are based upon information available to management at the time the estimates are made. Actual results may differ significantly from these estimates.
Significant matters that involve the use of estimates include the assessment of contingencies, the calculation of future cash flows and fair value amounts for use in asset and goodwill impairment evaluations, fair value calculations (based on estimated market pricing) associated withfor derivative instruments, pension and other postretirement benefits assumptions, unbilled revenue calculations, the assessment of the probability of recovery of regulatory assets, accrual of storm restoration costs, accrual of restructuring charges, recognition of changes in network service transmission rates for prior service year costs, accrual of self-insurance reserves for general and auto liability claims and income tax provisions and reserves. Additionally, DPL is subject to legal, regulatory, and other proceedings and claims that arise in the ordinary course of its business. DPL records an estimated liability for these proceedings and claims when it is probable that a loss has been incurred and the loss is determined to be probable and is reasonably estimable.
Storm Costs
During 2011, DPL incurred significant costs associated with Hurricane Irene that affected its service territory. Total incremental storm costs associated with Hurricane Irene were $11 million, with $8 million incurred for repair work and $3 million incurred as capital expenditures. Costs incurred for repair work of $5 million were deferred as a regulatory asset to reflect the probable recovery of these storm costs in DPL’s jurisdictions, and the remaining $3 million was charged to Other operation and maintenance expense. Approximately $1 million of these total incremental storm costs have been estimated for the cost of restoration services provided by outside contractors. Since the invoices for such services had not been received at December 31, 2011, actual invoices may vary from these estimates. DPL is seeking recovery of the incremental Hurricane Irene costs in each of its jurisdictions in planned distribution rate case filings as discussed in Note (7), “Regulatory Matters – Regulatory Proceedings.”
258
DPL
Restructuring ChargesCharge
PHI commenced a comprehensive organizational review in the second quarter of 2010 to identify opportunities to streamline the organization and to achieve certain reductions in corporate overhead costs allocated to its operating segments. The restructuring plan resulted in the elimination of 164 employee positions. DPL’s accrual of $8 million in costs associated with termination benefits was based on estimated severance costs and actuarial calculations of the present value of certain changes in pension and other postretirement benefits for terminated employees.employees.There were no material changes to this accrual in 2011.
Network Service Transmission Rates
In May of each year, DPL provides its updated network service transmission rate to the Federal Energy Regulatory Commission (FERC) effective for the service year beginning June 1 of the current year and ending May 31 of the following year. The network service transmission rate includes a true-up for costs incurred in the prior service year that had not yet been reflected in rates charged to customers. In the first half of 2010, DPL recorded an immaterial decrease in transmission service revenue that will be adjusted
DPL
for over the 2010-2011 service year for costs incurred in the 2009 service year. In the fourth quarter of 2010, DPL recorded a decrease in transmission service revenue of $1 million that it estimates will be reflected as a reduction in transmission service rates for the 2011-2012 service year based on costs incurred during the first seven months of the 2010 service year. DPL will update its estimate of the reduction in transmission service revenue for the 2011-2012 service year in the first and second quarters of 2011 as it progresses toward the completion of the 2010-2011 service year and final cost information from the 2010-2011 service year becomes available. In the second quarter of 2011, DPL expects to record a true-up as part of its updated transmission service rates that are submitted to FERC.
Change in Accounting Principle
After the completion of the July 1, 2009 goodwill impairment test, DPL adopted a new accounting policy whereby DPL’s annual impairment review of goodwill will be performed annually as of November 1. Management believes that DPL’s new annual impairment testing date is preferable because it better aligns the timing of the test with management’s annual update of its long-term financial forecast. This change in accounting principle has had no effect on DPL’s financial statements.
Revenue Recognition
DPL recognizes revenues upon distribution of electricity and gas to its customers, including amountsunbilled revenue for services rendered, but not yet billed (unbilled revenue). DPL recorded amounts forbilled. DPL’s unbilled revenue of $72was $56 million and $68$72 million as of December 31, 2011 and 2010, respectively, and 2009, respectively. Thesethese amounts are included in Accounts receivable. DPL calculates unbilled revenue using an output basedoutput-based methodology. This methodology is based on the supply of electricity or gas intended for distribution to customers. The unbilled revenue process requires management to make assumptions and judgments about input factors such as customer sales mix, temperature, and estimated line losslosses (estimates of electricity and gas expected to be lost in the process of its transmission and distribution to customers). The assumptions and judgementsjudgments are inherently uncertain and susceptible to change from period to period, and if the actual results differ from the projected results, the impact could be material. Revenues from non-regulated electricity and gas sales are included in Electric revenues and Natural Gas revenues, respectively.
Taxes related to the consumption of electricity and gas by its customers, such as fuel, energy, or other similar taxes, are components of DPL’s tariffs and, as such, are billed to customers and recorded in Operating revenues.revenue. Accruals for the remittance of these taxes by DPL are recorded in Other taxes. Excise tax related generally to the consumption of gasoline by DPL in the normal course of business is charged to operations, maintenance or construction, and is not material.
259
DPL
Taxes Assessed by a Governmental Authority on Revenue-Producing Transactions
Taxes included in DPL’s gross revenues were $17$18 million, $17 million and $15$17 million for the years ended December 31, 2011, 2010 2009 and 2008,2009, respectively.
Accounting for Derivatives
DPL uses derivative instruments (forward contracts, futures, swaps, and exchange-traded and over-the-counter options) primarily to reduce natural gas commodity price volatility while limitingand to limit its customers’ exposure to increasesnatural gas price fluctuations under a hedging program approved by the Delaware Public Service Commission (DPSC). Derivatives are recorded in the market price of gas.consolidated balance sheets as derivative assets or derivative liabilities and measured at fair value unless designated as normal purchases or normal sales. DPL also manages commodity risk withenters physical natural gas andcontracts as part of the hedging program that qualify as normal purchases or normal sales, which are not required to be recorded in the financial statements until settled. DPLs capacity contracts that are not classified as derivatives. Changes in the fair value of derivatives that are not designated as cash flow hedges are reflected in income. The primary goalgain or loss on a derivative that is designated as a cash flow hedge is initially recorded in Accumulated Other Comprehensive Loss (a separate component of these activitiesequity) to the extent that the hedge is to reduce the exposure of its regulated retail gas customers to natural gas price fluctuations. effective.
All premiums paid and other transaction costs incurred as part of DPL’s natural gas hedging activity, in addition to all gains and losses related to hedging activities, are fully recoverable through the fuel adjustment clause approved by the Delaware Public Service Commission (DPSC),DPSC, and are deferred under Financial Accounting Standards Board (FASB) guidance on regulated operations (Accounting Standards Codification (ASC) 980) until recovered. At December 31, 2011, after the effects of cash collateral and netting, there was a net derivative liability of $15 million, offset by a $17 million regulatory asset. At December 31, 2010, after the effects of cash collateral and netting, there was a net derivative liability of $23 million, offset by a $31 million regulatory asset. At December 31, 2009, after the effects of cash collateral and netting, there was a net derivative liability of $28 million, offset by a $42 million regulatory asset.
DPL
Long-Lived Asset Impairment Evaluation
DPL evaluates certain long-lived assets to be held and used (for example, equipment and real estate) for impairment whenever events or changes in circumstances indicate that their carrying value may not be recoverable. Examples of such events or changes include a significant decrease in the market price of a long-lived asset or a significant adverse change in the manner an asset is being used or its physical condition. A long-lived asset to be held and used is written down to fair value if its expected future undiscounted cash flow from the asset is less than its carrying value.
For long-lived assets that can be classified as assets to be disposed of by sale, an impairment loss is recognized to the extent that the assets’ carrying value exceeds its fair value including costs to sell.
Income Taxes
DPL, as an indirect subsidiary of Pepco Holdings, is included in the consolidated federal income tax return of PHI. Federal income taxes are allocated to DPL based upon the taxable income or loss amounts, determined on a separate return basis.
The financial statements include current and deferred income taxes. Current income taxes represent the amount of tax expected to be reported on DPL’s state income tax returns and the amount of federal income tax allocated from Pepco Holdings.
Deferred income tax assets and liabilities represent the tax effects of temporary differences between the financial statement basis and tax basis of existing assets and liabilities, and they are measured using presently enacted tax rates. The portion of DPL’s deferred tax liability applicable to its utility operations that has not been recovered from utility customers represents income taxes recoverable in the future and is included in Regulatory assets on the balance sheets. See Note (7), “Regulatory Assets and Regulatory Liabilities,Matters,” for additional information.
260
DPL
Deferred income tax expense generally represents the net change during the reporting period in the net deferred tax liability and deferred recoverable income taxes.
DPL recognizes interest on under or over paymentsunderpayments and overpayments of income taxes, interest on uncertain tax positions, and tax-related penalties in income tax expense.
Investment tax credits are being amortized to income over the useful lives of the related property.
Consolidation of Variable Interest Entities
In accordance with FASB guidance on the consolidation of variable interest entities (ASC 810), DPL consolidates those variable interest entities with respect to which DPL is the primary beneficiary. The guidance addresses conditions under which an entity should be consolidated based upon variable interests rather than voting interests.
Entities—DPL Renewable Energy Transactions
DPL is subject to Renewable Energy Portfolio Standards (RPS) in the state of Delaware that require it to obtain renewable energy credits (RECs) for energy delivered to its customers. DPL’s costs associated with obtaining RECs to fulfill its RPS obligations are recoverable from its customers by law. DPL has entered into fourthree land-based wind power purchase agreements (PPAs) in the aggregate amount of 350128 megawatts that include the purchase of renewable energy credits (RECs) and one solar REC purchase agreementPPA with a nine10 megawatt facility. The DPSC has approved DPL’s entry into eachfacility as of December 31, 2011. All of the agreements and the recovery of DPL’s purchase costs through customer rates. The RECs purchased under all the agreements will help DPL fulfill a portion of its requirements under the State of Delaware’s Renewable Energy Portfolio Standards Act.
DPL
Of the wind PPAs, three of thefacilities associated with these PPAs are with land-based facilities and one of the PPAs is with an offshore facility. One of the land-based facilities became operational, and went into service in December 2009. DPL is obligated to purchase energy and RECs from this facility through 2024 in amounts generated and delivered not to exceed 50.25 megawatts at rates that are primarily fixed. DPL’s purchases under this PPA totaled $12 million for 2010. Purchases under the other wind agreements, which have terms ranging from 20 to 25 years, are currently expected to start in 2011 for the other two land-based contracts and 2016 for the offshore contract, if the projects are ultimately completed and operational. When they become operational, DPL is obligated to purchase energy and RECs in amounts generated and delivered by the sellerswind facilities and solar renewable energy credits (SRECs) from the solar facility at rates that are primarily fixed under these agreements. UnderDPL has concluded that consolidation is not required for any of these agreements under the FASB guidance on the consolidation of variable interest entities.
DPL is obligated to purchase energy and RECs from one of the agreements, DPL is also obligatedwind facilities through 2024 in amounts not to purchaseexceed 50 megawatts, the capacity associated with the facility at rates that are generally fixed. If the offshore wind facility developer is unable to obtain all necessary permits and financing commitments, this could result in setbacks in the construction schedules and the operational start datessecond of the offshore wind facility. If the wind facilities arethrough 2031 in amounts not operational by specified dates, DPL hasto exceed 40 megawatts, and the rightthird facility through 2031 in amounts not to terminateexceed 38 megawatts. DPL’s purchases under the PPAs.three wind PPAs totaled $18 million and $12 million for the years ended December 31, 2011 and 2010, respectively. The term of the agreement with the solar facility is 20 years and DPL is obligated to purchase RECsSRECs in an amount up to seventy70 percent of the energy output from the solar facility at a fixed price once.DPL’s purchases under the agreement were $1 million for the year ended December 31, 2011.
In addition to the three land-based wind PPAs, DPL has also entered into an offshore wind PPA for a 200 megawatt facility is operational, which is expectedthat has not yet been constructed. In December 2011, the developer of the offshore wind facility notified DPL that it was terminating the wind PPA for this facility. DPL received a $2 million termination payment from the developer that will be refunded to DPL’s Delaware customers.
On October 18, 2011, the DPSC approved a tariff submitted by DPL in accordance with the requirements of the RPS specific to fuel cell facilities totaling 30 megawatts to be constructed by a Qualified Fuel Cell Provider. The tariff and the RPS establish that DPL would be an agent to collect payments in advance from its distribution customers and remit them to the third quarterQualified Fuel Cell Provider for each megawatt hour of 2011.
energy produced by the fuel cell facilities over 20 years. DPL would have no liability to the Qualified Fuel Cell Provider other than to remit payments collected from its distribution customers pursuant to the tariff. The RPS provide for a reduction in DPL’s REC requirements based upon the actual energy output of the facilities. PHI has concluded that consolidation is not requiredDPL would account for any of these agreements under FASB guidance on the consolidation of variable interest entities (ASC 810).this arrangement as an agency transaction.
Cash and Cash Equivalents
Cash and cash equivalents include cash on hand, cash invested in money market funds and commercial paper held with original maturities of three months or less. Additionally, deposits in PHI’s money pool, which DPL and certain other PHI subsidiaries use to manage short-term cash management requirements, are considered cash equivalents. Deposits in the money pool are guaranteed by PHI. PHI deposits funds in the money pool to the extent that the pool has insufficient funds to meet the needs of its participants, which may require PHI to borrow funds for deposit from external sources.
261
DPL
Accounts Receivable and Allowance for Uncollectible Accounts
DPL’s accounts receivable balance primarily consists of customer accounts receivable, other accounts receivable, and accrued unbilled revenue. Accrued unbilled revenue represents revenue earned in the current period but not billed to the customer until a future date (usually within one month after the receivable is recorded).
DPL maintains an allowance for uncollectible accounts and changes in the allowance are recorded as an adjustment to Other operation and maintenance expense in the statements of income. DPL determines the amount of the allowance based on specific identification of material amounts at risk by customer and maintains a reserve based on its historical collection experience. The adequacy of this allowance is assessed on a quarterly basis by evaluating all known factors such as the aging of the receivables, historical collection experience, the economic and competitive environment and changes in the creditworthiness of its customers. Although management believes its allowance is adequate, it cannot anticipate with any certainty the changes in the financial condition of its customers. As a result, DPL records adjustments to the allowance for uncollectible accounts in the period in which the new information that requires an adjustment to the reserve becomes known.
DPL
Inventories
Included in inventories are transmission and distribution materials and supplies and natural gas. DPL utilizes the weighted average cost method of accounting for inventory items. Under this method, an average price is determined for the quantity of units acquired at each price level and is applied to the ending quantity to calculate the total ending inventory balance. Materials and supplies inventory are recorded in inventory when purchased and then expensed or capitalized to plant, as appropriate, when installed.
The cost of natural gas, including transportation costs, is included in inventory when purchased and charged to Gas purchased expense when used.
Goodwill
Goodwill represents the excess of the purchase price of an acquisition over the fair value of the net assets acquired at the acquisition date. All of DPL’s goodwill was generated by DPL’s acquisition of Conowingo Power Company in 1995. DPL tests its goodwill for impairment annually and whenever an event occurs or circumstances change in the interim that would more likely than not reduce the fair value of DPL below its carrying amount. After the completion of its July 1, 2009 annual impairment test, DPL changed the date ofperforms its annual impairment test toon November 1. Factors that may result in an interim impairment test include, but are not limited to: a change in the identified reporting units; an adverse change in business conditions; an adverse regulatory action; or an impairment of DPL’s long-lived assets. As described in Note (6), “Goodwill,” no impairment charge has been recorded for the year ended December 31, 2010.DPL’s goodwill was not impaired as of November 1, 2011.
Regulatory Assets and Regulatory Liabilities
Certain aspects of DPL’s business are subject to regulation by the DPSC and the Maryland Public Service Commission (MPSC), and, until the sale of its Virginia assets on January 2, 2008, were regulated by the Virginia State Corporation Commission. The transmission of electricity by DPL is regulated by FERC. DPL’s interstate transportation and wholesale sale of natural gas are regulated by FERC.
Based on the regulatory framework in which it has operated, DPL has historically applied, and in connection with its transmission and distribution business continues to apply, FASB guidance on regulated operations (ASC 980). The guidance allows regulated entities, in appropriate circumstances, to defer the income statement impact of certain costs that are expected to be recovered in future rates
262
DPL
through the establishment of regulatory assets. Management’s assessment of the probability of recovery of regulatory assets requires judgment and interpretation of laws, regulatory commission orders and other factors. If management subsequently determines, based on changes in facts or circumstances, that a regulatory asset is not probable of recovery, the regulatory asset would be eliminated through a charge to earnings.
Effective June 2007, the MPSC approved a bill stabilization adjustment mechanism (BSA) for retail customers. See Note (7), “Regulatory Matters – Regulatory Proceedings.” For customers to whom the BSA applies, DPL recognizes distribution revenue based on an approved distribution charge per customer. From a revenue recognition standpoint, the BSA has the effect of decoupling the distribution revenue recognized in a reporting period from the amount of power delivered during that period. Pursuant to this mechanism, DPL recognizes either (i) a positive adjustment equal to the amount by which revenue from Maryland retail distribution sales falls short of the revenue that DPL is entitled to earn based on the approved distribution charge per customer, or (ii) a negative adjustment equal to the amount by which revenue from such distribution sales exceeds the revenue that DPL is entitled to earn based on the approved distribution charge per customer (a Revenue Decoupling Adjustment). A net positive Revenue Decoupling Adjustment is recorded as a regulatory asset and a net negative Revenue Decoupling Adjustment is recorded as a regulatory liability.
DPL
Property, Plant and Equipment
Property, plant and equipment are recorded at original cost, including labor, materials, asset retirement costs and other direct and indirect costs including capitalized interest. The carrying value of property, plant and equipment is evaluated for impairment whenever circumstances indicate the carrying value of those assets may not be recoverable. Upon retirement, the cost of regulated property, net of salvage, is charged to accumulated depreciation. For additional information regarding the treatment of asset retirement obligations, see the “Asset Removal Costs” section included in this Note.
The annual provision for depreciation on electric and gas property, plant and equipment is computed on a straight-line basis using composite rates by classes of depreciable property. Accumulated depreciation is charged with the cost of depreciable property retired, less salvage and other recoveries. Property, plant and equipment other than electric and gas facilities is generally depreciated on a straight-line basis over the useful lives of the assets. The system-wide composite depreciation rate for 2011, 2010 2009 and 20082009 for DPL’s transmission and distribution system property was approximately 2.8%.
Capitalized Interest and Allowance for Funds Used During Construction
In accordance with FASB guidance on regulated operations (ASC 980), utilities can capitalize the capital costs of financing the construction of plant and equipment as Allowance for Funds Used During Construction (AFUDC). This results in the debt portion of AFUDC being recorded as a reduction of Interest expense and the equity portion of AFUDC being recorded as an increase to Other income in the accompanying statements of income.
DPL recorded AFUDC for borrowed funds of $2$1 million, $1$2 million, and $1 million for the years ended December 31, 2011, 2010, 2009, and 2008,2009, respectively.
DPL recorded amounts for the equity component of AFUDC of $3 million, $4 million zero and $1 millionzero for the years ended December 31, 2011, 2010 2009 and 2008,2009, respectively.
Leasing Activities
DPL’s lease transactions include plant, office space, equipment, software and vehicles. In accordance with FASB guidance on leases (ASC 840), these leases are classified as operating leases.
263
DPL
Operating Leases
An operating lease in which DPL is the lessee generally results in a level income statement charge over the term of the lease, reflecting the rental payments required by the lease agreement. If rental payments are not made on a straight-line basis, DPL’s policy is to recognize rent expense on a straight-line basis over the lease term unless another systematic and rational allocation basis is more representative of the time pattern in which the leased property is physically employed.
Amortization of Debt Issuance and Reacquisition Costs
DPL defers and amortizes debt issuance costs and long-term debt premiums and discounts over the lives of the respective debt issues. When refinancing or redeeming existing debt, any unamortized premiums, discounts and debt issuance costs, as well as debt redemption costs, are classified as regulatory assets and are amortized generally over the life of the original issue.
DPL
Asset Removal Costs
In accordance with FASB guidance, asset removal costs are recorded as regulatory liabilities. At both December 31, 2011 and 2010, $244 million and 2009, $239 million, respectively, of asset removal costs are included in regulatoryRegulatory liabilities in the accompanying balance sheets.
Pension and Postretirement Benefit Plans
Pepco Holdings sponsors the PHI Retirement Plan, a non-contributory, retirementdefined benefit pension plan that covers substantially all employees of DPL (the PHI Retirement Plan) and certain employees of other Pepco Holdings subsidiaries. Pepco Holdings also provides supplemental retirement benefits to certain eligible executives and key employees through nonqualified retirement plans and provides certain postretirement health care and life insurance benefits for eligible retired employees.
The PHI Retirement Plan is accounted for in accordance with FASB guidance on retirement benefits (ASC 715).
Dividend Restrictions
All of DPL’s shares of outstanding common stock are held by Conectiv, its parent company. In addition to its future financial performance, the ability of DPL to pay dividends to its parent company is subject to limits imposed by: (i) state corporate laws, which impose limitations on the funds that can be used to pay dividends, and (ii) the prior rights of holders of existing and future preferred stock, mortgage bonds and other long-term debt issued by DPL and any other restrictions imposed in connection with the incurrence of liabilities. DPL has no shares of preferred stock outstanding. DPL had approximately $494$505 million and $472$494 million of retained earnings available for payment of common stock dividends at December 31, 20102011 and 2009,2010, respectively. These amounts represent the total retained earnings balances at those dates.
Reclassifications and Adjustments
Certain prior period amounts have been reclassified in order to conform to current period presentation. The following adjustments have been recorded and are not considered material individually or in the aggregate:
OperatingDefault Electricity Supply Revenue and Costs Adjustments
During 2009,2011, DPL recorded additionaladjustments associated with the accounting for Default Electricity Supply revenue of $14 million relatedand costs. These adjustments were primarily due to the unbilled portionunder-recognition of the Gas Cost Rate (GCR) revenue, which was not previously recognized. Because the GCR revenue is deferred, an additionalallowed returns on working capital and administrative costs, and resulted in a pre-tax decrease in Other operation and maintenance expense of $14$11 million was recorded in 2009. Consequently, there was no impact on net income.for the year ended December 31, 2011.
264
DPL
Operating Revenue
During 2009, DPL recorded an adjustment to correct certain errors in the BSA calculation. The adjustment resulted in a decrease in revenue of $1 million for the year ended December 31, 2009.
Operating Expenses
During 2008, DPL recorded adjustments to correct errors in Other operation and maintenance expenses for prior periods dating back to May 2006 during which (i) customer late payment fees were incorrectly recognized and (ii) stock-based compensation expense related to certain restricted stock awards granted under the Long-Term Incentive Plan was understated. These adjustments resulted in a total increase in Other operation and maintenance expenses of $5 million for the year ended December 31, 2008, all of which related to prior periods.
DPL
million.
(3)NEWLY ADOPTED ACCOUNTING STANDARDS
Transfers and Servicing (ASC 860)
The FASB issued new guidance that removes the concept of a qualifying special-purpose entity (QSPE) from the guidance on transfers and servicing and the QSPE scope exception in the guidance on consolidation. The new guidance also changes the requirements for derecognizing financial assets and requires additional disclosures about a transferor’s continuing involvement in transferred financial assets. The guidance was effective for transfers of financial assets occurring in fiscal periods beginning on January 1, 2010 for DPL. This guidance did not have a material impact on DPL’s overall financial condition, results of operations, or cash flows.
Fair Value Measurement and Disclosures (ASC 820)
The FASB issued new disclosure requirements for recurring and non-recurring fair value measurements. The guidance, effective beginning with DPL’s March 31, 2010 financial statements, requires the disaggregation of balance sheet items measured at fair value into subsets of balance sheet items based on the nature and risks of the items. The standard requires descriptions of pricing inputs and valuation methodologies for instruments with Level 2 or 3 valuation inputs. In addition, the standard requires information about any significant transfers of instruments between Level 1 and 2 valuation categories. These additional disclosures are included in Note (14), “Fair Value Disclosures.”
Consolidation of Variable Interest Entities (ASC 810)
The FASB issued new consolidation guidance regarding variable interest entities effective January 1, 2010 that eliminates the quantitative analysis requirement and adds new qualitative factors to determine whether consolidation is required. The new qualitative factors are applied on a quarterly basis to interests in variable interest entities. Under the new guidance, the holder of the interest with the power to direct the most significant activities of the entity and the right to receive benefits or absorb losses significant to the entity would consolidate. The new guidance retains the provision that allows entities created before December 31, 2003 to be scoped out from a consolidation assessment if exhaustive efforts are taken and there is insufficient information to determine whether there is a relationship with a variable interest entity or the primary beneficiary of a variable interest entity. This guidance did not have a material impact on DPL’s overall financial condition, results of operations, or cash flows.
Subsequent Events (ASC 855)
The FASB issued new guidance that eliminates the requirement for DPL to disclose the date through which it has evaluated subsequent events beginning with its March 31, 2010 financial statements.
(4) RECENTLY ISSUED ACCOUNTING STANDARDS, NOT YET ADOPTED
Fair Value MeasurementMeasurements and Disclosures (ASC 820)
The FASB issued new disclosure requirements that require significant items within the disaggregationreconciliation of the Level 3 fair value measurement reconciliations intovaluation category to be presented in separate categories for significant purchases, sales, issuances and settlements. This requirement isThe guidance was effective beginning with DPL’s March 31, 2011 financial statements. DPL is evaluatinghas included the impact of this new guidance ondisclosure requirements in Note (14), “Fair Value Disclosures,” to its financial statement footnote disclosures.
DPL
statements.
Goodwill (ASC 350)
In December 2010, theThe FASB issued new guidance on performing goodwill impairment tests. Thetests that was effective beginning January 1, 2011 for DPL. Under the new guidance, eliminates the option to excludecarrying value of the reporting unit must include the liabilities that are part of the capital structure of the reporting unit when calculating the carrying value of the reporting unit. This is effective for DPL beginning January 1, 2011. Under the new guidance, the carrying value of the reporting unit is the net amount of the assets and liabilities allocated to the reporting unit. DPL already allocates liabilities to the reporting unit when performing its goodwill impairment test, so the new guidance isdid not expectedchange DPL’s goodwill impairment test methodology.
Compensation Retirement Benefits—Multiemployer Plans (ASC 715-80)
In September 2011, the FASB issued new disclosure requirements for participants in multiemployer pension and postretirement benefit plans that would be effective beginning with DPL’s December 31, 2011 financial statements. Most of these disclosures are not applicable to DPL because it participates in PHI’s single employer pension plan and accounts for it as participation in a multiemployer plan. The disclosure requirements for DPL were limited and are already provided in DPL’s Note (10), “Pension and Other Postretirement Benefits.”
(4)RECENTLY ISSUED ACCOUNTING STANDARDS, NOT YET ADOPTED
Fair Value Measurements and Disclosures (ASC 820)
In May 2011, the FASB issued new guidance on fair value measurement and disclosures that will be effective beginning with DPL’s March 31, 2012 financial statements. The new guidance will change how fair value is measured in specific instances and expand disclosures about fair value measurements. DPL currently performsexpects that it will have to provide additional disclosures, but does not expect this guidance to have a significant impact on its fair value measurements.
Goodwill (ASC 350)
In September 2011, the FASB issued new guidance that changes the annual and interim assessments of goodwill for impairment. The new guidance modifies the required annual impairment test by giving entities the option to perform a qualitative assessment of whether it is more likely than not that goodwill is impaired before performing a quantitative assessment. The new guidance also amends the events and circumstances that entities should assess to determine whether an interim quantitative impairment test is necessary. The new guidance is effective beginning January 1, 2012 for DPL as it did not elect the option to apply the guidance earlier. DPL did not employ the new qualitative assessment as part of its November 1, 2011 annual impairment test. DPL does not expect the new impairment guidance to have a material impact on its financial statements.
265
DPL
Balance Sheet (ASC 210)
In December 2011, the FASB issued new disclosure requirements for assets and liabilities, such as derivatives, that are subject to contractual netting arrangements. The new disclosures will include information about the gross exposures and net exposure under contractual netting arrangements as well as how the exposures are presented in the financial statements. The new disclosures are effective beginning with DPL’s March 31, 2013 financial statements. DPL is evaluating the impact of this new guidance on its financial statements.
(5) SEGMENT INFORMATION
The company operates its business as one regulated utility segment, which includes all of its services as described above.
(6)GOODWILL
DPL’s goodwill balance of $8 million was unchanged during the year ended December 31, 2010.2011. All of DPL’s goodwill was generated by its acquisition of Conowingo Power Company in 1995.
DPL’s annual impairment test as of November 1, 2010 indicated that goodwill was not impaired. As of December 31, 2010, after review of its significant assumptions in the goodwill impairment analysis, DPL concluded that there were no events requiring it to perform an interim goodwill impairment test. DPL performed its previous annual goodwill impairment test as of November 1, 2009, which2011 indicated that goodwill was not impaired.
In order to estimate the fair value of DPL’s business, DPL uses two valuation techniques: an income approach and a market approach. The income approach estimates fair value based on a discounted cash flow analysis using estimated future cash flows and a terminal value that is consistent with DPL’s long-term view of the business. This approach uses a discount rate based on the estimated weighted average cost of capital (WACC) for the reporting unit. DPL determines the estimated WACC by considering market-based information for the cost of equity and cost of debt as of the measurement date appropriate for DPL’s business. The market approach estimates fair value based on a multiple of earnings before interest, taxes, depreciation, and amortization (EBITDA) that management believes is consistent with EBITDA multiples for comparable utilities. DPL has consistently used this valuation framework to estimate the fair value of DPL’s business.
The estimation of fair value is dependent on a number of factors that are derived from the DPL business forecast, including but not limited to interest rates, growth assumptions, returns on rate base, operating and capital expenditure requirements, and other factors, changes in which could materially affect the results of impairment testing. Assumptions used in the models were consistent with historical experience, including assumptions concerning the recovery of operating costs and capital expenditures. Sensitive, interrelated and uncertain variables that could decrease the estimated fair value of the DPL business include utility sector market performance, sustained adverse business conditions, changes in forecasted revenues, higher operating and maintenance capital expenditure requirements, a significant increase in the cost of capital and other factors.
DPL’s gross amount of goodwill, accumulated impairment losses and carrying amount of goodwill for the years ended December 31, 2011 and 2010 were as follows:
| 2011 | 2010 | |||||||||||||||||||||||
| Gross Amount | Accumulated Impairment Losses | Carrying Amount | Gross Amount | Accumulated Impairment Losses | Carrying Amount | |||||||||||||||||||
| (millions of dollars) | ||||||||||||||||||||||||
Beginning balance as of January 1 | $ | 8 | $ | — | $ | 8 | $ | 8 | $ | — | $ | 8 | ||||||||||||
Impairment losses | — | — | — | — | — | — | ||||||||||||||||||
|
|
|
|
|
|
|
|
|
|
|
| |||||||||||||
Ending balance as of December 31 | $ | 8 | $ | — | $ | 8 | $ | 8 | $ | — | $ | 8 | ||||||||||||
|
|
|
|
|
|
|
|
|
|
|
| |||||||||||||
266
DPL
(7)REGULATORY ASSETS AND REGULATORY LIABILITIESMATTERS
Regulatory Assets and Regulatory Liabilities
The components of DPL’s regulatory asset and liability balances at December 31, 20102011 and 20092010 are as follows:
| 2010 | 2009 | 2011 | 2010 | |||||||||||||
| (millions of dollars) | (millions of dollars) | |||||||||||||||
Regulatory Assets | ||||||||||||||||
Deferred income taxes | $ | 65 | $ | 68 | $ | 61 | $ | 65 | ||||||||
Deferred energy supply costs (a) | 22 | 6 | ||||||||||||||
Deferred debt extinguishment costs (b) | 16 | 18 | ||||||||||||||
Recoverable meter related costs (b) | 29 | 5 | ||||||||||||||
COPCO acquisition adjustment (b) | 33 | 35 | ||||||||||||||
Gas derivatives | 31 | 42 | ||||||||||||||
COPCO acquisition adjustment (a) | 30 | 33 | ||||||||||||||
Recoverable meter-related costs (a) | 26 | 29 | ||||||||||||||
Deferred losses on gas derivatives | 17 | 31 | ||||||||||||||
Blueprint for the Future | 20 | 11 | ||||||||||||||
Deferred debt extinguishment costs (a) | 16 | 16 | ||||||||||||||
Deferred energy supply costs (b) | 15 | 22 | ||||||||||||||
Other | 46 | 33 | 42 | 35 | ||||||||||||
|
| |||||||||||||||
Total Regulatory Assets | $ | 242 | $ | 207 | $ | 227 | $ | 242 | ||||||||
|
| |||||||||||||||
Regulatory Liabilities | ||||||||||||||||
Asset removal costs | $ | 239 | $ | 239 | $ | 244 | $ | 239 | ||||||||
Deferred income taxes due to customers | 38 | 38 | 38 | 38 | ||||||||||||
Deferred energy supply costs | 23 | 12 | 12 | 23 | ||||||||||||
Other | 10 | 1 | 3 | 10 | ||||||||||||
|
| |||||||||||||||
Total Regulatory Liabilities | $ | 310 | $ | 290 | $ | 297 | $ | 310 | ||||||||
|
| |||||||||||||||
| (a) | A return is |
| (b) | A return is generally earned in Delaware on |
A description for each category of regulatory assets and regulatory liabilities follows:
Deferred Income Taxes: Represents a receivable from our customers for tax benefits DPL previously flowed through before the company was ordered to account for the tax benefits as deferred income taxes. As the temporary differences between the financial statement basis and tax basis of assets reverse, the deferred recoverable balances are reversed.
COPCO Acquisition Adjustment:On July 19, 2007, the MPSC issued an order which provided for the recovery of a portion of DPL’s goodwill. As a result of this order, $41 million in DPL goodwill was transferred to a regulatory asset. This item will be amortized from August 2007 through August 2018. The return earned is 12.95%.
Recoverable Meter-Related Costs: Represents costs associated with the installation of smart meters and the early retirement of existing meters throughout DPL’s service territory as a result of the Advanced Metering Infrastructure project.
Deferred Losses on Gas Derivatives:Represents losses associated with hedges of natural gas purchases that are recoverable through the GCR approved by the DPSC.
Blueprint for the Future:Includes costs associated with Blueprint for the Future initiatives which include programs to help customers better manage their energy use and to allow DPL to better manage its electrical and natural gas distribution systems.
Deferred Debt Extinguishment Costs: Represents the costs of debt extinguishment for which recovery through regulated utility rates is considered probable and, if approved, will be amortized to interest expense during the authorized rate recovery period.
267
DPL
Deferred Energy Supply Costs: The regulatory asset represents primarily deferred energy costs associated with a net under-recovery of Default Electricity Supply costs incurred in Maryland and deferred fuel costs for DPL’s gas business that are probable of recovery in rates. The gas deferred fuel costs are recovered over a twelve month period. The regulatory liability represents primarily deferred energy and transmission costs associated with a net over-recovery of Default Electricity Supply costs incurred in Delaware and Maryland that will be refunded to customers.
Deferred Debt Extinguishment Costs: Represents the costs of debt extinguishment for which recovery through regulated utility rates is considered probable and, if approved, will be amortized to interest expense during the authorized rate recovery period.
Recoverable Meter Related Costs: Represents costs associated with the installation of smart meters and the early retirement of existing meters throughout DPL’s service territory as a result of the Advanced Metering Infrastructure (AMI) project.
COPCO Acquisition Adjustment:On July 19, 2007, the MPSC issued an order which provided for the recovery of a portion of DPL’s goodwill. As a result of this order, $41 million in DPL goodwill was transferred to a regulatory asset. This item will be amortized from August 2007 through August 2018. The return earned is 12.95%.
DPL
Gas Derivatives:Represents losses associated with hedges of natural gas purchases that are recoverable through the Gas Cost Rate approved by the DPSC.
Other: Represents miscellaneous regulatory assets that generally are being amortized over 1 to 20 years.
Asset Removal Costs: DPL’s depreciation rates include a component for removal costs, as approved by the relevant federal and state regulatory commissions. As such, DPL has recorded a regulatory liability for its estimate of the difference between incurred removal costs and the amount of removal costs recovered through depreciation rates.
Deferred Income Taxes Due to Customers: Represents the portions of deferred income tax liabilities applicable to DPL’s utility operations that have not been reflected in current customer rates for which future payment to customers is probable. As the temporary differences between the financial statement basis and tax basis of assets reverse, deferred recoverable income taxes are amortized.
Other: Includes miscellaneous regulatory liabilities.
Regulatory Proceedings
Rate Proceedings
Over the last several years, DPL proposed in each of its service territories the adoption of a mechanism to decouple retail distribution revenue from the amount of power delivered to retail customers. To date:
A BSA has been approved and implemented for electric service in Maryland. The MPSC has issued an order requiring modification of the BSA in Maryland so that revenues lost as a result of major storm outages are not collected if electric service is not restored to the pre-major storm levels within 24 hours of the start of a major storm (as discussed below).
A modified fixed variable rate design (MFVRD) has been approved in concept for electric service in Delaware, but the implementation has been deferred by the DPSC pending the development of an implementation plan and a customer education plan. DPL anticipates that the MFVRD will be in place for electric service by early 2013.
A MFVRD has been approved in concept for natural gas service in Delaware, but implementation likewise has been deferred until development of an implementation plan and a customer education plan. DPL anticipates that the MFVRD will be in place for natural gas service by early 2013.
Under the BSA, customer distribution rates are subject to adjustment (through a credit or surcharge mechanism), depending on whether actual distribution revenue per customer exceeds or falls short of the revenue-per-customer amount approved by the applicable public service commission. The MFVRD approved in concept in Delaware provides for a fixed customer charge (i.e., not tied to the customer’s volumetric consumption) to recover the utility’s fixed costs, plus a reasonable rate of return. Although different from the BSA, DPL views the MFVRD as an appropriate distribution revenue decoupling mechanism.
268
DPL
Delaware
Gas Cost Rates
DPL makes an annual Gas Cost Rate (GCR) filing with the DPSC for the purpose of allowing DPL to recover natural gas procurement costs through customer rates. In August 2010, DPL made its 2010 GCR filing, which proposes rates that would allow DPL to recover an amount equal to a two-year amortization of currently under-recovered natural gas costs. In October 2010, the DPSC issued an order allowing DPL to place the new rates into effect on November 1, 2010, subject to refund and pending final DPSC approval. The effect of the proposed two-year amortization upon rates is an increase of 0.1% in the level of GCR. The parties in the proceeding submitted a proposed settlement to the hearing examiner on June 3, 2011, which includes the first year of DPL’s two-year amortization but provides that DPL will forego the interest ($171,000 for the 2011 to 2012 period covered by the GCR and $171,000 for the 2012 to 2013 period covered by the GCR) associated with that amortization. The proposed settlement was approved by the DPSC on October 18, 2011.
In August 2011, DPL made its 2011 GCR filing. The filing includes the second year of the effect of the proposed two-year amortization as proposed in DPL’s 2010 filing. On September 20, 2011, the DPSC issued an order allowing DPL to place the new rates into effect on November 1, 2011, subject to refund and pending final DPSC approval.
Natural Gas Distribution Base Rates
In July 2010, DPL submitted an application with the DPSC to increase its natural gas distribution base rates. As subsequently amended, the filing sought approval of an annual rate increase of approximately $10.2 million, based on a requested return on equity (ROE) of 11.0%, and requests approval of implementation of the MFVRD. As permitted by Delaware law, DPL placed an annual increase of approximately $2.5 million into effect, on a temporary basis, on August 31, 2010, and the remainder of approximately $7.7 million of the requested increase was placed into effect on February 2, 2011, in each case subject to refund and pending final DPSC approval. On June 21, 2011, the DPSC approved a settlement providing for an annual rate increase of approximately $5.8 million, based on an ROE of 10.0%. The decision deferred the implementation of the MFVRD until an implementation plan and a customer education plan are developed. As of December 31, 2011, the amount collected in excess of the approved rate has been refunded to customers through a bill credit.
Electric Distribution Base Rates
On December 2, 2011, DPL submitted an application with the DPSC to increase its electric distribution base rates. The filing seeks approval of an annual rate increase of approximately $31.8 million, based on a requested ROE of 10.75%, and requests approval of implementation of the MFVRD. DPL has requested that the rates become effective on January 31, 2012. In the effort to reduce the shortfall in revenues due to the delay in time or lag between when costs are incurred and when they are reflected in rates (regulatory lag), the filing includes a request for the DPSC to approve a reliability investment recovery mechanism (RIM) to recover reliability-related capital expenditures incurred between base rate cases. Through the RIM, DPL would collect in a surcharge the amount of its reliability-related capital expenditures based on its budget for the current year. The budgeted amount would be reconciled with actual capital expenditures on an annual basis and any over-recovery or under-recovery would be reflected in the next year’s surcharge. The work undertaken pursuant to the RIM would be subject to a prudency review by the DPSC in the next base rate case or at more frequent intervals as determined by the DPSC. DPL’s operating and maintenance costs and other capital expenditures would remain subject to recovery through the traditional ratemaking process. DPL has also requested DPSC approval of the use of fully forecasted test years in future DPL rate cases. On January 10, 2012, the DPSC entered an order suspending the full increase and
269
DPL
allowing a temporary rate increase of $2.5 million to go into effect on January 31, 2012, subject to refund and pending final DPSC approval. As permitted by Delaware law, DPL intends to place the remainder of approximately $29.3 million of the requested increase into effect on July 2, 2012, subject to refund and pending final DPSC approval.
Maryland
Electric Distribution Base Rates
On December 9, 2011, DPL submitted an application with the MPSC to increase its electric distribution base rates. The filing seeks approval of an annual rate increase of approximately $25.2 million, based on a requested ROE of 10.75%. In the effort to reduce regulatory lag, the filing includes a request for the MPSC to approve a RIM to recover reliability-related capital expenditures incurred between base rate cases. Through the RIM, DPL would collect in a surcharge the amount of its reliability-related capital expenditures based on its budget for the current year. The budgeted amount would be reconciled with actual capital expenditures on an annual basis and any over-recovery or under-recovery would be reflected in the next year’s surcharge. The work undertaken pursuant to the RIM would be subject to a prudency review by the MPSC in the next base rate case or at more frequent intervals as determined by the MPSC. DPL’s operating and maintenance costs and other capital expenditures would remain subject to recovery through the traditional ratemaking process. DPL has also requested MPSC approval of the use of fully forecasted test years in future DPL rate cases. A decision by the MPSC is expected in July 2012.
Major Storm Damage Recovery Proceedings
In February 2011, the MPSC initiated proceedings involving DPL, as well as Pepco and unaffiliated utilities in Maryland, for the purpose of reviewing how the BSA operates to recover revenues lost as a result of major storm outages. On January 25, 2012, the MPSC issued an order modifying the BSA to prevent DPL from collecting lost utility revenue through the BSA if electric service is not restored to the pre-major storm levels within 24 hours of the start of a major storm (defined by the MPSC as a weather-related event during which more than the lesser of 10% or 100,000 of an electric utility’s customers have a sustained outage for more than 24 hours). The period for which the lost utility revenue may not be collected through the BSA commences 24 hours after the start of the major storm and continues until all major storm-related outages are restored. The MPSC stated that waivers permitting collection of BSA revenues would be granted in rare and extraordinary circumstances where a utility can show that an outage was not due to inadequate emphasis on reliability and restoration efforts were reasonable under the circumstances. The financial impact of service interruptions due to a major storm as a result of this MPSC order would generally depend on the scope and duration of the outages.
(8) LEASING ACTIVITIES
DPL leases an 11.9% interest in the Merrill Creek Reservoir. The lease is an operating lease and payments over the remaining lease term, which ends in 2032, are $97$93 million in the aggregate. DPL also has long-term leases for certain other facilities and equipment. Total future minimum operating lease payments for DPL, including the Merrill Creek Reservoir lease, as of December 31, 2010,2011, are $11 million in 2011, $11$12 million in 2012, $10$11 million in each of the years 2013 through 2015, $9 million in 2016, and $112$108 million thereafter.
Rental expense for operating leases, including the Merrill Creek Reservoir lease, was $10$11 million, $9$10 million and $9 million for the years ended December 31, 2011, 2010 and 2009, and 2008, respectively.
270
DPL
(9) PROPERTY, PLANT AND EQUIPMENT
Property, plant and equipment is comprised of the following:
| Original Cost | Accumulated Depreciation | Net Book Value | Original Cost | Accumulated Depreciation | Net Book Value | |||||||||||||||||||
| (millions of dollars) | ||||||||||||||||||||||||
At December 31, 2011 | ||||||||||||||||||||||||
Distribution | $ | 1,580 | $ | 435 | $ | 1,145 | ||||||||||||||||||
Transmission | 788 | 230 | 558 | |||||||||||||||||||||
Gas | 429 | 133 | 296 | |||||||||||||||||||||
Construction work in progress | 151 | — | 151 | |||||||||||||||||||||
Non-operating and other property | 240 | 128 | 112 | |||||||||||||||||||||
|
|
| ||||||||||||||||||||||
Total | $ | 3,188 | $ | 926 | $ | 2,262 | ||||||||||||||||||
| (millions of dollars) |
|
|
| |||||||||||||||||||||
At December 31, 2010 | ||||||||||||||||||||||||
Distribution | $ | 1,515 | $ | 431 | $ | 1,084 | $ | 1,515 | $ | 431 | $ | 1,084 | ||||||||||||
Transmission | 740 | 219 | 521 | 740 | 219 | 521 | ||||||||||||||||||
Gas | 413 | 125 | 288 | 413 | 125 | 288 | ||||||||||||||||||
Construction work in progress | 124 | — | 124 | 124 | — | 124 | ||||||||||||||||||
Non-operating and other property | 208 | 126 | 82 | 208 | 126 | 82 | ||||||||||||||||||
|
|
| ||||||||||||||||||||||
Total | $ | 3,000 | $ | 901 | $ | 2,099 | $ | 3,000 | $ | 901 | $ | 2,099 | ||||||||||||
|
|
| ||||||||||||||||||||||
At December 31, 2009 | ||||||||||||||||||||||||
Distribution | $ | 1,430 | $ | 411 | $ | 1,019 | ||||||||||||||||||
Transmission | 684 | 211 | 473 | |||||||||||||||||||||
Gas | 398 | 116 | 282 | |||||||||||||||||||||
Construction work in progress | 92 | — | 92 | |||||||||||||||||||||
Non-operating and other property | 203 | 122 | 81 | |||||||||||||||||||||
Total | $ | 2,807 | $ | 860 | $ | 1,947 | ||||||||||||||||||
The non-operating and other property amounts include balances for general plant, plant held for future use, intangible plant and non-utility property. Utility plant is generally subject to a first mortgage lien.
DPL
Asset Sales
In January 2008, DPL completed (i) the sale of its retail electric distribution assets located on the Eastern Shore of Virginia for approximately $49 million, and (ii) the sale of its wholesale electric transmission assets located on the Eastern Shore of Virginia for approximately $5 million.
(10) PENSION AND OTHER POSTRETIREMENT BENEFITS
DPL accounts for its participation in its parent’s single-employer plans, the Pepco Holdings benefit plansInc. Retirement Plan (the PHI Retirement Plan) and the Pepco Holdings, Inc. Welfare Plan for Retirees (the PHI OPEB Plan), as participation in a multi-employer plan.multiemployer plans. For 2011, 2010 2009, and 2008,2009, DPL was responsible for $23 million, $28 million $25 million and $3$25 million, respectively, of the pension and other postretirement net periodic benefit cost incurred by Pepco Holdings.PHI. On January 31, 2012, DPL made a discretionary tax-deductible contribution in the amount of $85 million to the PHI Retirement Plan. DPL made discretionary, tax-deductible contributions of $40 million and $10 million to the PHI Retirement Plan for the years ended December 31, 2011 and 2009, respectively. No contribution was made for the year ended December 31, 2009. No2010. In addition, DPL made contributions were madeof $6 million, $9 million and $10 million, respectively, to the PHI OPEB Plan for the years ended December 31, 2011, 2010 and 2008. In addition, DPL made contributions of $9 million, $10 million and $9 million, respectively, to the other postretirement benefit plans for the years ended December 31, 2010, 2009 and 2008.2009. At December 31, 20102011 and 2009,2010, DPL’s Prepaid pension expense of $139$162 million and $157$139 million, and Other postretirement benefit obligations of $22 million and $23$22 million, effectively represent assets and benefit obligations resulting from DPL’s participation in the Pepco HoldingsPHI benefit plans.
271
DPL
(11) DEBT
Long-Term Debt
Long-term debt outstanding as of December 31, 20102011 and 20092010 is presented below:
Type of Debt | Interest Rate | Maturity | 2010 | 2009 | Interest Rate | Maturity | 2011 | 2010 | ||||||||||||||||||||
| (millions of dollars) | (millions of dollars) | |||||||||||||||||||||||||||
First Mortgage Bonds | ||||||||||||||||||||||||||||
| 6.40% | 2013 | $ | 250 | $ | 250 | 6.40% | 2013 | $ | 250 | $ | 250 | |||||||||||||||||
| 5.20% | 2019 | (c) | 31 | 31 | 5.22%(a) | 2016 | 100 | 100 | ||||||||||||||||||||
| 4.90% | 2026 | (b)(c) | 35 | 35 | 5.20%(a) | 2019 | 31 | 31 | ||||||||||||||||||||
| 5.22% | 2016 | (c) | 100 | 100 | 0.75%-4.90%(a)(b) | 2026 | 35 | 35 | ||||||||||||||||||||
|
| |||||||||||||||||||||||||||
| 416 | 416 | 416 | 416 | |||||||||||||||||||||||||
|
| |||||||||||||||||||||||||||
Unsecured Tax-Exempt Bonds | ||||||||||||||||||||||||||||
| 5.50% | 2025 | (a) | — | 15 | ||||||||||||||||||||||||
| 5.65% | 2028 | (a) | — | 16 | ||||||||||||||||||||||||
| 1.80% | 2025 | (d) | 15 | — | 1.80%(c) | 2025 | 15 | 15 | ||||||||||||||||||||
| 2.30% | 2028 | (d) | 16 | — | 2.30%(d) | 2028 | 16 | 16 | ||||||||||||||||||||
| 5.40% | 2031 | 78 | — | 5.40% | 2031 | 78 | 78 | |||||||||||||||||||||
|
| |||||||||||||||||||||||||||
| 109 | 31 | 109 | 109 | |||||||||||||||||||||||||
|
| |||||||||||||||||||||||||||
Medium-Term Notes (unsecured) | ||||||||||||||||||||||||||||
| 7.56%-7.58% | 2017 | 14 | 14 | 7.56%-7.58% | 2017 | 14 | 14 | |||||||||||||||||||||
| 6.81% | 2018 | 4 | 4 | 6.81% | 2018 | 4 | 4 | |||||||||||||||||||||
| 7.61% | 2019 | 12 | 12 | 7.61% | 2019 | 12 | 12 | |||||||||||||||||||||
| 7.72% | 2027 | 10 | 10 | 7.72% | 2027 | 10 | 10 | |||||||||||||||||||||
|
| |||||||||||||||||||||||||||
| 40 | 40 | 40 | 40 | |||||||||||||||||||||||||
|
| |||||||||||||||||||||||||||
Notes (unsecured) | ||||||||||||||||||||||||||||
| 5.00% | 2014 | 100 | 100 | 5.00% | 2014 | 100 | 100 | |||||||||||||||||||||
| 5.00% | 2015 | 100 | 100 | 5.00% | 2015 | 100 | 100 | |||||||||||||||||||||
|
| |||||||||||||||||||||||||||
| 200 | 200 | 200 | 200 | |||||||||||||||||||||||||
|
| |||||||||||||||||||||||||||
Total long-term debt | 765 | 687 | 765 | 765 | ||||||||||||||||||||||||
Other long-term debt | 1 | — | — | 1 | ||||||||||||||||||||||||
Unamortized discount | (1) | (1) | ||||||||||||||||||||||||||
Net unamortized discount | — | (1 | ) | |||||||||||||||||||||||||
Current portion of long-term debt | (35) | (31) | (66 | ) | (35 | ) | ||||||||||||||||||||||
|
| |||||||||||||||||||||||||||
Total net long-term debt | $ | 730 | $ | 655 | $ | 699 | $ | 730 | ||||||||||||||||||||
|
| |||||||||||||||||||||||||||
| (a) |
| Represents a series of First Mortgage Bonds issued by DPL (Collateral First Mortgage Bonds) as collateral for an outstanding series of senior notes issued by the company or tax-exempt bonds issued for the benefit of the company. The maturity date, optional and mandatory prepayment provisions, if any, interest rate, and interest payment dates on each series of senior notes or the obligations in respect of the tax-exempt bonds are identical to the terms of the corresponding series of Collateral First Mortgage Bonds. Payments of principal and interest on a series of senior notes or the company’s obligations in respect of the tax-exempt bonds satisfy the corresponding payment obligations on the related series of Collateral First Mortgage Bonds. Because each series of senior notes and tax-exempt bonds and the corresponding series of Collateral First Mortgage Bonds securing that series of senior notes or tax-exempt bonds effectively represents a single financial obligation, the senior notes and the tax-exempt bonds are not separately shown on the table. |
| These bonds bearing an interest note of 4.90% were repurchased. On June 1, 2011, DPL resold these bonds that were subject to mandatory repurchase on May 1, 2011 at an interest rate of 0.75%. The bonds are currently subject to mandatory tender on June 1, |
| (c) | On July 1, 2010, DPL purchased this series of tax-exempt bonds issued for the benefit of DPL by the Delaware Economic Development Authority (DEDA) pursuant to a mandatory repurchase provision in the indenture for the bonds that was triggered by the expiration of the original interest period for the bonds. While DPL held the bonds, they remained outstanding as a contractual matter, but were considered extinguished for accounting purposes. On December 1, 2010, DPL resold the bonds to the public, at which time the interest rate on the bonds was changed from 5.50% to a fixed rate of 1.80%. The bonds are subject to mandatory purchase by DPL on June 1, 2012. |
| (d) | On July 1, 2010, DPL purchased this series of tax-exempt bonds issued for the benefit of DPL by DEDA pursuant to a mandatory repurchase provision in the indenture for the bonds that was triggered by the expiration of the original interest period for the bonds. While DPL held the bonds, they remained outstanding as a contractual matter, but were considered extinguished for accounting purposes. On December 1, 2010, DPL resold the bonds to the public, at which time the interest rate on the bonds was changed from 5.65% to a fixed rate of 2.30%. The bonds are subject to mandatory purchase by DPL on June 1, 2012. |
272
DPL
The outstanding First Mortgage Bonds issued by DPL are subject to a lien on substantially all of DPL’s property, plant and equipment.
Maturities of long-term debt and sinking fund requirements during the next five years are as follows: $35 million in 2011, $31$66 million in 2012, $250 million in 2013, $100 million in 2014, $100 million in 2015, $100 million in 2016, and $249$149 million thereafter.
DPL
DPL’s long-term debt is subject to certain covenants. As of December 31, 2010,2011, DPL is in compliance with all such covenants.
Tax-Exempt Bonds
In April 2010, DEDA issued $78On June 1, 2011, DPL resold $35 million of 5.40% Gas Facilities Refunding Revenue Bonds due 2031 for the benefit of DPL. DPL used the proceeds to effect the redemption of the outstanding amounts of five series of tax-exempt bonds in an aggregate principal amount of $78 million that were purchased by DPL in 2008.
In December 2010, DPL resold (i) $15 million of 1.80% Pollution Control Refunding Revenue Bonds (Delmarva Power & Light Company Project) Series 2000C2001C due 2025, and (ii) $16 million of 2.30% Pollution Control Refunding Revenue2026 (the “Series 2001C Bonds”). The Series 2001C Bonds (Delmarva Power & Light Company Project) Series 2000D due 2028. The bonds were originally issued for the benefit of DPL in 20002001 and had been purchasedwere repurchased by DPL in July 2010on May 2, 2011, pursuant to a mandatory repurchase provision in the respective indenturesindenture for the bonds that wasSeries 2001C Bonds triggered by the expiration of the original interest rate period specified by the Series 2001C Bonds.
In connection with the issuance of the Series 2001C Bonds, DPL entered into a continuing disclosure agreement under which it is obligated to furnish certain information to the bondholders. At the time of the resale, the continuing disclosure agreement was amended and restated to designate the Municipal Securities Rulemaking Board as the sole repository for these continuing disclosure documents. The amendment and restatement of the bonds. The bonds are subjectcontinuing disclosure agreement did not change the operating or financial data that is required to mandatory purchasebe provided by DPL on June 1, 2012.under such agreement.
Short-Term Debt
DPL has traditionally used a number of sources to fulfill short-term funding needs, such as commercial paper, short-term notes, and bank lines of credit. Proceeds from short-term borrowings are used primarily to meet working capital needs, but may also be used to temporarily fund long-term capital requirements. A detail of the components of DPL’s short-term debt at December 31, 20102011 and 20092010 is as follows:
| 2010 | 2009 | |||||||
| (millions of dollars) | ||||||||
Variable Rate Demand Bonds | $ | 105 | $ | 105 | ||||
| 2011 | 2010 | |||||||
| (millions of dollars) | ||||||||
Variable rate demand bonds | $ | 105 | $ | 105 | ||||
Commercial paper | 47 | — | ||||||
|
|
|
| |||||
| $ | 152 | $ | 105 | |||||
|
|
|
| |||||
Commercial Paper
DPL maintainshas an ongoing commercial paper program of up to $500 million. The commercial paper notes can be issued with maturities up to 270 days from the date of issue. The commercial paper programmillion that is backed by DPL’sits borrowing capacity under PHI’s $1.5 billion credit facility, which is described below under the heading “CreditCredit Facility.”
DPL had no$47 million of commercial paper outstanding at December 31, 20102011 and 2009.zero outstanding at December 31, 2010. The weighted average interest rates for commercial paper issued during 20102011 and 20092010 were 0.34% and 0.56%, respectively.. The weighted average maturity of all commercial paper issued by DPL during 20102011 and 20092010 was two and five days, respectively.days.
273
DPL
Variable Rate Demand Bonds
Variable Rate Demand Bonds (VRDBs) are subject to repayment on the demand of the holders and, for this reason, are accounted for as short-term debt in accordance with GAAP. However, bonds submitted for purchase are remarketed by a remarketing agent on a best efforts basis. DPL expects thethat any bonds submitted for purchase will continue to be remarketed successfully due to the credit worthiness of the company and because the remarketing agent resets the interest rate to the then-current market rate. The bonds maybe converted to a fixed rate fixed term option to establish a maturity which corresponds to the date of final maturity of the bonds. On this basis, DPL views VRDBs as a source of long-term financing. The VRDBs outstanding in 20102011 mature as follows: 2017 ($26 million), 2024 ($33 million), 2028 ($16 million), and 2029 ($30 million). The weighted average interest rate for VRDBs was 0.53% during 2011 and 0.52% during 2010 and 1.78% during 2009.2010. Of the $105 million in VRDBs, $72 million of DPL’s obligations are secured by Collateral First Mortgage Bonds, which provide collateral to the investors in the event of a default by DPL.
DPL
Credit Facility
PHI, Potomac Electric Power Company (Pepco), DPL and Atlantic City Electric Company (ACE) maintain an unsecured syndicated credit facility to provide for their respective short-term liquidity needs. needs, including obtaining letters of credit, borrowing for general corporate purposes and supporting commercial paper programs. On August 1, 2011, PHI, Pepco, DPL and ACE entered into an amended and restated credit agreement with respect to the facility, which among other changes, extended the expiration date of the facility to August 1, 2016.
The aggregate borrowing limit under the amended and restated credit facility is $1.5 billion, all or any portion of which may be used to obtain loans orand up to issue$500 million of which may be used to obtain letters of credit. PHI’sThe facility also includes a swingline loan sub-facility, pursuant to which each company may make same day borrowings in an aggregate amount not to exceed 10% of the total amount of the facility. Any swingline loan must be repaid by the borrower within fourteen days of receipt. The initial credit limit under the facilitysublimit for PHI is $875 million. The credit limit of$750 million and $250 million for each of Pepco, DPL and ACE. The sublimits may be increased or decreased by the individual borrower during the term of the facility, except that (i) the sum of all of the borrower sublimits following any such increase or decrease must equal the total amount of the facility and (ii) the aggregate amount of credit used at any given time by (a) PHI may not exceed $1.25 billion and (b) each of Pepco, DPL or ACE ismay not exceed the lesser of $500 million and the maximum amount of short-term debt the company is permitted to have outstanding by its regulatory authorities, except thatauthorities. The total number of the aggregate amount of credit used by Pepco, DPL and ACE at any given time collectivelysublimit reallocations may not exceed $625 million. eight per year during the term of the facility.
The interest rate payable by each company on utilized funds is, at the borrowing company’s election, (i) the greater of the prevailing prime rate, and the federal funds effective rate plus 0.5% and one month LIBOR plus 1.0%, or (ii) the prevailing Eurodollar rate, plus a margin that varies according to the credit rating of the borrower. The facility also includes a “swingline loan sub-facility” pursuant to which each company may make same day borrowings in an aggregate amount not to exceed $150 million. Any swingline loan must be repaid by the borrower within seven days of receipt thereof.
The facility commitment expiration date is May 5, 2012, with each company having the right to elect to have 100% of the principal balance of the loans outstanding on the expiration date continued as non-revolving term loans for a period of one year from such expiration date.
The facility is intended to serve primarily as a source of liquidity to support the commercial paper programs of the respective companies. The companies are also permitted to use the facility to borrow funds for general corporate purposes and issue letters of credit. In order for a borrower to use the facility, certain representations and warranties must be true and correct, and the borrower must be in compliance with specified financial covenants, including (i) the requirement that each borrowing company maintain a ratio of total indebtedness to total capitalization of 65% or less, computed in accordance with the terms of the credit agreement, which calculation excludes from the definition of total indebtedness certain trust preferred securities and deferrable interest subordinated debt (not to exceed 15% of total capitalization), (ii) with certain exceptions, a restriction on sales or other dispositions of assets, other than certain sales and dispositions, and (iii) a restriction on the incurrence of liens on the assets of a borrower or any of its significant subsidiaries other than permitted liens. The credit agreement contains certain covenants and other customary agreements and requirements that, if not complied with, could result in an event of default and the acceleration of repayment obligations of one or more of the borrowers thereunder. Each of the borrowers was in compliance with all financial covenants under this facility as of December 31, 2011.
274
DPL
The absence of a material adverse change in the borrower’sPHI’s business, property, and results of operations or financial condition is not a condition to the availability of credit under the facility.credit agreement. The facilitycredit agreement does not include any rating triggers. As of December 31, 2010, each borrower was in compliance with the covenants of the credit facility.
At December 31, 20102011 and 2009,2010, the amount of cash, plus borrowing capacity under the PHI credit facilitiesfacility available to meet the liquidity needs of PHI’s utility subsidiaries was $711 million and $462 million, and $582 million, respectively.
DPL
(12) INCOME TAXES
DPL, as an indirect subsidiary of PHI, is included in the consolidated federal income tax return of PHI. Federal income taxes are allocated to DPL pursuant to a written tax sharing agreement that was approved by the Securities and Exchange Commission in connection with the establishment of PHI as a holding company. Under this tax sharing agreement, PHI’s consolidated federal income tax liability is allocated based upon PHI’s and its subsidiaries’ separate taxable income or loss.
The provision for income taxes, reconciliation of income tax expense, and components of deferred income tax liabilities (assets) are shown below.
Provision for Income Taxes
| For the Year Ended December 31, | For the Year Ended December 31, | |||||||||||||||||||||||
| 2010 | 2009 | 2008 | 2011 | 2010 | 2009 | |||||||||||||||||||
| (millions of dollars) | (millions of dollars) | |||||||||||||||||||||||
Current Tax (Benefit) Expense | ||||||||||||||||||||||||
Federal | $ | (37 | ) | $ | (26 | ) | $ | 11 | $ | (22 | ) | $ | (37 | ) | $ | (26 | ) | |||||||
State and local | (5 | ) | (17 | ) | 2 | 8 | (5 | ) | (17 | ) | ||||||||||||||
|
|
| ||||||||||||||||||||||
Total Current Tax (Benefit) Expense | (42 | ) | (43 | ) | 13 | |||||||||||||||||||
Total Current Tax Benefit | (14 | ) | (42 | ) | (43 | ) | ||||||||||||||||||
|
|
| ||||||||||||||||||||||
Deferred Tax Expense (Benefit) | ||||||||||||||||||||||||
Federal | 61 | 58 | 25 | 53 | 61 | 58 | ||||||||||||||||||
State and local | 13 | 2 | 8 | 4 | 13 | 2 | ||||||||||||||||||
Investment tax credit amortization | (1 | ) | (1 | ) | (1 | ) | (1 | ) | (1 | ) | (1 | ) | ||||||||||||
|
|
| ||||||||||||||||||||||
Total Deferred Tax Expense | 73 | 59 | 32 | 56 | 73 | 59 | ||||||||||||||||||
|
|
| ||||||||||||||||||||||
Total Income Tax Expense | $ | 31 | $ | 16 | $ | 45 | $ | 42 | $ | 31 | $ | 16 | ||||||||||||
|
|
| ||||||||||||||||||||||
275
DPL
Reconciliation of Income Tax Expense
| For the Year Ended December 31, | For the Year Ended December 31, | |||||||||||||||||||||||||||||||||||||||||||||||
| 2010 | 2009 | 2008 | 2011 | 2010 | 2009 | |||||||||||||||||||||||||||||||||||||||||||
| (millions of dollars) | (millions of dollars) | |||||||||||||||||||||||||||||||||||||||||||||||
Income tax at Federal statutory rate | $ | 27 | 35.0 | % | $ | 24 | 35.0 | % | $ | 40 | 35.0 | % | $ | 40 | 35.0 | % | $ | 27 | 35.0 | % | $ | 24 | 35.0 | % | ||||||||||||||||||||||||
Increases (decreases) resulting from | ||||||||||||||||||||||||||||||||||||||||||||||||
Depreciation | 1 | 1.3 | % | 2 | 2.9 | % | 1 | 0.9 | % | |||||||||||||||||||||||||||||||||||||||
Increases (decreases) resulting from Depreciation | 1 | 0.9 | % | 1 | 1.3 | % | 2 | 2.9 | % | |||||||||||||||||||||||||||||||||||||||
State income taxes, net of Federal effect | 4 | 5.3 | % | 4 | 5.9 | % | 6 | 5.3 | % | 6 | 5.3 | % | 4 | 5.3 | % | 4 | 5.9 | % | ||||||||||||||||||||||||||||||
State tax benefit related to prior years’ asset dispositions | — | — | (13 | ) | (19.1 | )% | — | — | — | — | — | — | (13 | ) | (19.1 | )% | ||||||||||||||||||||||||||||||||
Tax credits | (1 | ) | (1.3 | )% | (1 | ) | (1.5 | )% | (1 | ) | (0.9 | )% | ||||||||||||||||||||||||||||||||||||
Investment tax credits | (1 | ) | (0.9 | )% | (1 | ) | (1.3 | )% | (1 | ) | (1.5 | )% | ||||||||||||||||||||||||||||||||||||
Change in estimates and interest related to uncertain and effectively settled tax positions | 1 | 1.3 | % | (1 | ) | (1.5 | )% | (3 | ) | (2.7 | )% | (3 | ) | (2.7 | )% | 1 | 1.3 | % | (1 | ) | (1.5 | )% | ||||||||||||||||||||||||||
Adjustments to prior years’ taxes | — | — | 2 | 2.9 | % | (1 | ) | (0.9 | )% | — | — | — | — | 2 | 2.9 | % | ||||||||||||||||||||||||||||||||
Deferred tax basis adjustments | — | — | — | — | 2 | 1.8 | % | (1 | ) | (0.9 | )% | — | — | — | — | |||||||||||||||||||||||||||||||||
Other, net | (1 | ) | (0.8 | )% | (1 | ) | (1.1 | )% | 1 | 1.3 | % | — | 0.5 | % | (1 | ) | (0.8 | )% | (1 | ) | (1.1 | )% | ||||||||||||||||||||||||||
|
|
|
|
|
| |||||||||||||||||||||||||||||||||||||||||||
Income Tax Expense | $ | 31 | 40.8 | % | $ | 16 | 23.5 | % | $ | 45 | 39.8 | % | $ | 42 | 37.2 | % | $ | 31 | 40.8 | % | $ | 16 | 23.5 | % | ||||||||||||||||||||||||
|
|
|
|
|
| |||||||||||||||||||||||||||||||||||||||||||
DPL
During 2011, PHI reached a settlement with the Internal Revenue Service (IRS) with respect to interest due on its federal tax liabilities related to the November 2010 audit settlement for years 1996 through 2002. In connection with this agreement, PHI reallocated certain amounts that have been on deposit with the IRS since 2006 among liabilities in the settlement years and subsequent years. Primarily related to the settlement and reallocations, DPL recorded an additional $4 million (after-tax) interest benefit. This is partially offset by adjustments recorded in the third quarter of 2011 related to DPL’s settlement with the state taxing authorities resulting in $1 million (after-tax) of additional tax expense and the recalculation of interest on its uncertain tax positions for open tax years based on different assumptions related to the application of its deposit made with the IRS in 2006. This resulted in an additional tax expense of $1 million (after-tax).
Year ended December 31, 2010
In November 2010, PHI reached final settlement with the Internal Revenue Service (IRS)IRS with respect to its Federal tax returns for the years 1996 to 2002. In connection with the settlement, PHI reallocated certain amounts on deposit with the IRS since 2006 among liabilities in the settlement years and subsequent years. In light of the settlement and reallocations, DPL has recalculated the estimated interest due for the tax years 1996 to 2002. The revised estimate has resulted in an additional $3 million (after-tax) of estimated interest due to the IRS. This additional estimated interest expense has beenwas recorded in the fourth quarter of 2010 and is subject to adjustment when the IRS finalizes its calculation of the amount due.2010. This expense is partially offset by the reversal of $2 million of previously recorded tax liabilities.
Year ended December 31, 2009
During 2009, DPL recorded a decrease to tax expense of $13 million resulting from the receipt of a refund of $6 million (after-tax) of state income taxes and the establishment of a state income tax benefit carryforwardcarry forward of $7 million (after-tax), related to a change in tax reporting for certain asset dispositions occurring in prior years.
276
DPL
In March 2009, the IRS issued a Revenue Agent’s Report (RAR) for the audit of PHI’s consolidated Federal income tax returns for the calendar years 2003 to 2005. The IRS has proposed adjustments to PHI’s tax returns, including adjustments to DPL’s capitalization of overhead costs for tax purposes and the deductibility of certain DPL casualty losses. In conjunction with PHI, DPL has appealed certain of the proposed adjustments and believes it has adequately reserved for the adjustments included in the RAR.Revenue Agent’s Report.
In November 2009, DPL received a refund of prior years’ Federal income taxes of $10 million. The refund results from the carryback of a 2008 net operating loss for tax reporting purposes that reflected, among other things, significant tax deductions related to accelerated depreciation, the pension plan contributions paid in 2009 (which were deducted in 2008) and the cumulative effect of adopting a new method of tax reporting for certain repairs.
During 2008, DPL completed an analysisComponents of itsDeferred Income Tax Liabilities (Assets)
| As of December 31, | ||||||||
| 2011 | 2010 | |||||||
| (millions of dollars) | ||||||||
Deferred Tax Liabilities (Assets) | ||||||||
Depreciation and other basis differences related to plant and equipment | $ | 526 | $ | 475 | ||||
Deferred taxes on amounts to be collected through future rates | 14 | 14 | ||||||
State net operating losses | (57 | ) | (9 | ) | ||||
Pension and other postretirement benefits | 86 | 53 | ||||||
Other | 34 | 16 | ||||||
|
|
|
| |||||
Total Deferred Tax Liabilities, net | 603 | 549 | ||||||
Deferred tax assets included in Other Current Assets | 11 | 13 | ||||||
Deferred tax liabilities included in Other Current Liabilities | 1 | (1 | ) | |||||
|
|
|
| |||||
Total Deferred Tax Liabilities, net non-current | $ | 615 | $ | 561 | ||||
|
|
|
| |||||
The net deferred tax liability represents the tax effect, at presently enacted tax rates, of temporary differences between the financial statement basis and tax basis of assets and liabilities. The portion of the net deferred tax liability applicable to DPL’s operations, which has not been reflected in current service rates, represents income taxes recoverable through future rates, net, and deferred income tax accounts and,is recorded as a result,regulatory asset on the balance sheet. No valuation allowance for deferred tax assets was required or recorded a $2 million chargeat December 31, 2011 and 2010.
The Tax Reform Act of 1986 repealed the investment tax credit for property placed in service after December 31, 1985, except for certain transition property. Investment tax credits previously earned on DPL’s property continues to be amortized to income tax expense in 2008, which is primarily included in “Deferred tax basis adjustments” inover the reconciliation provided above. In addition, during 2008, DPL recorded after-tax net interest income of $3 million under FASB guidance on income taxes (ASC 740) primarily related to the reversal of previously accrued interest payable resulting from a favorable tentative settlementuseful lives of the mixed service cost issue with the IRS.related property.
Reconciliation of Beginning and Ending Balances of Unrecognized Tax Benefits
| 2010 | 2009 | 2008 | 2011 | 2010 | 2009 | |||||||||||||||||||
| (millions of dollars) | (millions of dollars) | |||||||||||||||||||||||
Beginning balance as of January 1, | $ | 39 | $ | 54 | $ | 41 | $ | 40 | $ | 39 | $ | 54 | ||||||||||||
Tax positions related to current year: | ||||||||||||||||||||||||
Additions | 3 | — | — | �� | — | 3 | — | |||||||||||||||||
Tax positions related to prior years: | ||||||||||||||||||||||||
Additions | 5 | 10 | 35 | 7 | 5 | 10 | ||||||||||||||||||
Reductions | (7 | ) | (25 | ) | (22 | ) | (12 | ) | (7 | ) | (25 | ) | ||||||||||||
Settlements | — | — | — | — | — | — | ||||||||||||||||||
|
|
| ||||||||||||||||||||||
Ending balance as of December 31, | $ | 40 | $ | 39 | $ | 54 | $ | 35 | $ | 40 | $ | 39 | ||||||||||||
|
|
| ||||||||||||||||||||||
277
DPL
Unrecognized Benefits That, If Recognized, Would Affect the Effective Tax Rate
Unrecognized tax benefits are related to tax positions that have been taken or are expected to be taken in tax returns that are not recognized in the financial statements because management has either measured the tax benefit at an amount less than the benefit claimed, or expected to be claimed, or has concluded that it is not more likely than not that the tax position will be ultimately sustained. For the majority of these tax positions, the ultimate deductibility is highly certain, but there is uncertainty about the timing of such deductibility. At December 31, 2010,2011, DPL had no unrecognized tax benefits that, if recognized, would lower the effective tax rate.
DPL
Interest and Penalties
DPL recognizes interest and penalties relating to its uncertain tax positions as an element of income tax expense. For the years ended December 31, 2011, 2010 2009 and 2008,2009, DPL recognized $6 million of pre-tax interest income ($4 million after-tax), $6 million of pre-tax interest expense ($4 million after-tax), and $3 million of pre-tax interest income ($2 million after-tax), and $5 million of pre-tax interest expense ($3 million after-tax), respectively, as a component of income tax expense. As of December 31, 2011, 2010 2009 and 2008,2009, DPL had $5 million,accrued interest receivable of $1 million and $3 million, respectively, of accrued interest payable of $5 million and $1 million, respectively, related to effectively settled and uncertain tax positions.
Possible Changes to Unrecognized Tax Benefits
It is reasonably possible that the amount of the unrecognized tax benefit with respect to some of DPL’s uncertain tax positions will significantly increase or decrease within the next 12 months. The final settlement of the 2003 to 2005 Federal audit, the methodology change for deduction of capitalized construction costs, or state audits could impact the balances and related interest accruals significantly. At this time, an estimate of the range of reasonably possible outcomes cannot be determined.
Tax Years Open to Examination
DPL, as an indirect subsidiary of PHI, is included on PHI’s consolidated Federal tax return. DPL’s Federal income tax liabilities for all years through 2002 have been determined, subject to adjustment to the extent of any net operating loss or other loss or credit carrybacks from subsequent years. The open tax years for the significant states where DPL files state income tax returns (Maryland Delaware, and Virginia)Delaware) are the same as for the Federal returns. As a result of the final determination of these years, DPL has filed amended state returns paying an additional $3 million in tax.
Components of Deferred Income Tax Liabilities (Assets)
| As of December 31, | ||||||||
| 2010 | 2009 | |||||||
| (millions of dollars) | ||||||||
Deferred Tax Liabilities (Assets) | ||||||||
Depreciation and other basis differences related to plant and equipment | $ | 475 | $ | 408 | ||||
Deferred taxes on amounts to be collected through future rates | 14 | 14 | ||||||
State net operating losses | (9 | ) | (7 | ) | ||||
Pension and other postretirement benefits | 53 | 52 | ||||||
Other | 16 | 11 | ||||||
Total Deferred Tax Liabilities, net | 549 | 478 | ||||||
Deferred tax assets included in Other Current Assets | 13 | 9 | ||||||
Deferred tax liabilities included in Other Current Liabilities | (1 | ) | 2 | |||||
Total Deferred Tax Liabilities, net - non-current | $ | 561 | $ | 489 | ||||
The net deferred tax liability represents the tax effect, at presently enacted tax rates, of temporary differences between the financial statement basis and tax basis of assets and liabilities. The portion of the net deferred tax liability applicable to DPL’s operations, which has not been reflected in current service rates, represents income taxes recoverable through future rates, net, and is recorded as a regulatory asset on the balance sheet. No valuation allowance for deferred tax assets was required or recorded at December 31, 2010 and 2009.
DPL
The Tax Reform Act of 1986 repealed the investment tax credit (ITC) for property placed in service after December 31, 1985, except for certain transition property. ITC previously earned on DPL’s property continues to be amortized to income over the useful lives of the related property.
Other Taxes
Taxes other than income taxes for each year are shown below. These amounts are recoverable through rates.
| 2010 | 2009 | 2008 | 2011 | 2010 | 2009 | |||||||||||||||||||
| (millions of dollars) | (millions of dollars) | |||||||||||||||||||||||
Gross Receipts/Delivery | $ | 16 | $ | 17 | $ | 17 | $ | 15 | $ | 16 | $ | 17 | ||||||||||||
Property | 19 | 18 | 18 | 19 | 19 | 18 | ||||||||||||||||||
Environmental, Use and Other | 2 | — | — | 3 | 2 | — | ||||||||||||||||||
|
|
| ||||||||||||||||||||||
Total | $ | 37 | $ | 35 | $ | 35 | $ | 37 | $ | 37 | $ | 35 | ||||||||||||
|
|
| ||||||||||||||||||||||
278
DPL
(13)DERIVATIVE INSTRUMENTS AND HEDGING ACTIVITIES
DPL uses derivative instruments in the form of forward contracts, futures, swaps and exchange-traded and over-the-counter options primarily to reduce natural gas commodity price volatility and limit its customers’ exposure to increases in the market price of gas.natural gas, under a hedging program approved by the DPSC. DPL also managesuses these derivatives to manage the commodity price risk associated with its physical natural gas andpurchase contracts. The natural gas purchase contracts qualify as normal purchases, which are not required to be recorded in the financial statements until settled. DPL’s capacity contracts that are not classified as derivatives. All premiums paid and other transaction costs incurred as part of DPL’s natural gas hedging activity, in addition to all gains and losses related to hedging activities, are deferred under FASB guidance on regulated operations (ASC 980) until recovered based on thefrom its customers through a fuel adjustment clause approved by the DPSC.
The tables below identify the balance sheet location and fair values of derivative instruments as of December 31, 20102011 and 2009:2010:
| As of December 31, 2010 | ||||||||||||||||||||
Balance Sheet Caption | Derivatives Designated as Hedging Instruments | Other Derivative Instruments | Gross Derivative Instruments | Effects of Cash Collateral and Netting | Net Derivative Instruments | |||||||||||||||
| (millions of dollars) | ||||||||||||||||||||
Derivative Assets (current assets) | $ | — | $ | — | $ | — | $ | — | $ | — | ||||||||||
Derivative Assets (non-current assets) | — | — | — | — | — | |||||||||||||||
Total Derivative Assets | — | — | — | — | — | |||||||||||||||
Derivative Liabilities (current liabilities) | (6 | ) | (15 | ) | (21 | ) | 6 | (15 | ) | |||||||||||
Derivative Liabilities (non-current liabilities) | — | (8 | ) | (8 | ) | — | (8 | ) | ||||||||||||
Total Derivative Liabilities | (6 | ) | (23 | ) | (29 | ) | 6 | (23 | ) | |||||||||||
Net Derivative (Liability) Asset | $ | (6 | ) | $ | (23 | ) | $ | (29 | ) | $ | 6 | $ | (23 | ) | ||||||
| As of December 31, 2011 | ||||||||||||||||||||
Balance Sheet Caption | Derivatives Designated as Hedging Instruments | Other Derivative Instruments | Gross Derivative Instruments | Effects of Cash Collateral and Netting | Net Derivative Instruments | |||||||||||||||
| (millions of dollars) | ||||||||||||||||||||
Derivative assets (current assets) | $ | — | $ | — | $ | — | $ | — | $ | — | ||||||||||
Derivative assets (non-current assets) | — | — | — | — | — | |||||||||||||||
|
|
|
|
|
|
|
|
|
| |||||||||||
Total Derivative assets | — | — | — | — | — | |||||||||||||||
|
|
|
|
|
|
|
|
|
| |||||||||||
Derivative liabilities (current liabilities) | — | (14 | ) | (14 | ) | 2 | (12 | ) | ||||||||||||
Derivative liabilities (non-current liabilities) | — | (3 | ) | (3 | ) | — | (3 | ) | ||||||||||||
|
|
|
|
|
|
|
|
|
| |||||||||||
Total Derivative liabilities | — | (17 | ) | (17 | ) | 2 | (15 | ) | ||||||||||||
|
|
|
|
|
|
|
|
|
| |||||||||||
Net Derivative (liability) asset | $ | — | $ | (17 | ) | $ | (17 | ) | $ | 2 | $ | (15 | ) | |||||||
|
|
|
|
|
|
|
|
|
| |||||||||||
| As of December 31, 2010 | ||||||||||||||||||||
Balance Sheet Caption | Derivatives Designated as Hedging Instruments | Other Derivative Instruments | Gross Derivative Instruments | Effects of Cash Collateral and Netting | Net Derivative Instruments | |||||||||||||||
| (millions of dollars) | ||||||||||||||||||||
Derivative assets (current assets) | $ | — | $ | — | $ | — | $ | — | $ | — | ||||||||||
Derivative assets (non-current assets) | — | — | — | — | — | |||||||||||||||
|
|
|
|
|
|
|
|
|
| |||||||||||
Total Derivative assets | — | — | — | — | — | |||||||||||||||
|
|
|
|
|
|
|
|
|
| |||||||||||
Derivative liabilities (current liabilities) | (6 | ) | (15 | ) | (21 | ) | 6 | (15 | ) | |||||||||||
Derivative liabilities (non-current liabilities) | — | (8 | ) | (8 | ) | — | (8 | ) | ||||||||||||
|
|
|
|
|
|
|
|
|
| |||||||||||
Total Derivative liabilities | (6 | ) | (23 | ) | (29 | ) | 6 | (23 | ) | |||||||||||
|
|
|
|
|
|
|
|
|
| |||||||||||
Net Derivative (liability) asset | $ | (6 | ) | $ | (23 | ) | $ | (29 | ) | $ | 6 | $ | (23 | ) | ||||||
|
|
|
|
|
|
|
|
|
| |||||||||||
279
DPL
| As of December 31, 2009 | ||||||||||||||||||||
Balance Sheet Caption | Derivatives Designated as Hedging Instruments | Other Derivative Instruments | Gross Derivative Instruments | Effects of Cash Collateral and Netting | Net Derivative Instruments | |||||||||||||||
| (millions of dollars) | ||||||||||||||||||||
Derivative Assets (current assets) | $ | — | $ | — | $ | — | $ | — | $ | — | ||||||||||
Derivative Assets (non-current assets) | — | — | — | — | — | |||||||||||||||
Total Derivative Assets | — | — | — | — | — | |||||||||||||||
Derivative Liabilities (current liabilities) | (10 | ) | (15 | ) | (25 | ) | 10 | (15 | ) | |||||||||||
Derivative Liabilities (non-current liabilities) | — | (14 | ) | (14 | ) | 1 | (13 | ) | ||||||||||||
Total Derivative Liabilities | (10 | ) | (29 | ) | (39 | ) | 11 | (28 | ) | |||||||||||
Net Derivative (Liability) Asset | $ | (10 | ) | $ | (29 | ) | $ | (39 | ) | $ | 11 | $ | (28 | ) | ||||||
Under FASB guidance on the offsetting of balance sheet accounts (ASC 210), DPL offsets the fair value amounts recognized for derivative instruments and fair value amounts recognized for related collateral positions executed with the same counterparty under a master netting agreements. The amount of cash collateral that was offset against these derivative positions is as follows:
| December 31, 2010 | December 31, 2009 | |||||||
| (millions of dollars) | ||||||||
Cash collateral pledged to counterparties with the right to reclaim | $ | 6 | $ | 11 | ||||
| December 31, 2011 | December 31, 2010 | |||||||
| (millions of dollars) | ||||||||
Cash collateral pledged to counterparties with the right to reclaim | $ | 2 | $ | 6 | ||||
As of December 31, 20102011 and 2009,2010, all DPL cash collateral pledged related to derivative instruments accounted for at fair value was entitled to be offset under master netting agreements.
Derivatives Designated as Hedging Instruments
Cash Flow Hedges
As described above, allAll premiums paid and other transaction costs incurred as part of DPL’s natural gas hedging activity, in addition to all of DPL’s gains and losses related to hedging activities, are deferred under FASB guidance on regulated operations until recovered from customers based on the fuel adjustment clause approved by the DPSC. The following table indicates the amounts deferred as regulatorynet unrealized derivative losses arising during the period included in Regulatory assets or liabilities and the locationrealized losses recognized in the statements of income of amounts reclassified to income through the fuel adjustment clause for the years ended December 31, 2011, 2010 and 2009 and 2008:associated with cash flow hedges:
| For the Year Ended December 31, | ||||||||||||
| 2010 | 2009 | 2008 | ||||||||||
| (millions of dollars) | ||||||||||||
Net Gain (Loss) Deferred as a Regulatory Asset or Liability | $ | 5 | $ | 21 | $ | (29 | ) | |||||
Net Loss Reclassified from Regulatory Asset or Liability to Purchased Energy or Gas Purchased | (12 | ) | (39 | ) | (6 | ) | ||||||
DPL
| For the Year Ended December 31, | ||||||||||||
| 2011 | 2010 | 2009 | ||||||||||
| (millions of dollars) | ||||||||||||
Net unrealized losses arising during the period included in Regulatory assets | $ | — | $ | (9 | ) | $ | (20 | ) | ||||
Net realized losses recognized in Purchased energy or Gas purchased | (5 | ) | (13 | ) | (41 | ) | ||||||
As of December 31, 20102011 and 2009,2010, DPL had the following outstanding commodity forward contracts that were entered into to hedge forecasted transactions:
| Quantities | ||||||||
Commodity | December 31, 2010 | December 31, 2009 | ||||||
Forecasted Purchases Hedges: | ||||||||
Natural Gas (One Million British Thermal Units (MMBtu)) | 1,670,000 | 5,695,000 | ||||||
| Quantities | ||||||||
Commodity | December 31, 2011 | December 31, 2010 | ||||||
Forecasted purchases hedges: | ||||||||
Natural gas (One Million British Thermal Units (MMBtu)) | — | 1,840,000 | ||||||
Effective October 1, 2011, DPL elected to no longer apply cash flow hedge accounting to its natural gas derivatives. These derivatives will continue to be employed as part of DPL’s natural gas hedging activities under the hedging program approved by the DPSC, and their dedesignation as cash flow hedges has not resulted in a change to the historical financial statement presentation because all of DPL’s gains and losses on these derivatives are recoverable from customers through the fuel adjustment clause approved by the DPSC.
280
DPL
Other Derivative Activity
DPL holds certain derivatives that doare not qualifyin hedge accounting relationships nor are they designated as hedges.normal purchases or normal sales. These derivatives are recorded at fair value on the balance sheetsheets with changes in the fair value recorded in income. In accordance with FASB guidance on regulatoryregulated operations, offsetting regulatory assetsliabilities or regulatory liabilitiesassets are recorded on the balance sheetBalance Sheets and the recognition of the derivative gain or recoveryloss is deferred because of the loss is deferred.DPSC-approved fuel adjustment clause. For the years ended December 31, 2011, 2010 and 2009, the net unrealized derivative losses arising during the period included in Regulatory assets and 2008, the amount of the derivative gain (loss)net realized losses recognized in the statements of income isare provided in the table below by line item:below:
| For the Year Ended December 31, | ||||||||||||
| 2010 | 2009 | 2008 | ||||||||||
| (millions of dollars) | ||||||||||||
Net Gain (Loss) Deferred as a Regulatory Asset or Liability | $ | 6 | $ | (8 | ) | $ | (13 | ) | ||||
Net Loss Reclassified from Regulatory Asset or Liability to Purchased Energy or Gas Purchased | (26 | ) | (11 | ) | (1 | ) | ||||||
| For the Year Ended December 31, | ||||||||||||
| 2011 | 2010 | 2009 | ||||||||||
| (millions of dollars) | ||||||||||||
Net unrealized losses arising during the period included in Regulatory assets | $ | (13 | ) | $ | (20 | ) | $ | (18 | ) | |||
Net realized losses recognized in Purchased energy or Gas purchased | (22 | ) | (26 | ) | (11 | ) | ||||||
As of December 31, 20102011 and 2009,2010, DPL had the following net outstanding natural gas commodity forward contracts that did not qualify for hedge accounting:
| December 31, 2010 | December 31, 2009 | December 31, 2011 | December 31, 2010 | |||||||||||||||||||||||||||||
Commodity | Quantity | Net Position | Quantity | Net Position | Quantity | Net Position | Quantity | Net Position | ||||||||||||||||||||||||
Natural Gas (MMBtu) | 7,827,635 | Long | 10,442,546 | Long | 6,161,200 | Long | 8,236,500 | Long | ||||||||||||||||||||||||
Contingent Credit Risk Features
The primary contracts used by DPL for derivative transactions are entered into under the International Swaps and Derivatives Association Master Agreement (ISDA) or similar agreements that closely mirror the principal credit provisions of the ISDA. The ISDAs include a Credit Support Annex (CSA) that governs the mutual posting and administration of collateral security. The failure of a party to comply with an obligation under the CSA, including an obligation to transfer collateral security when due or the failure to maintain any required credit support, constitutes an event of default under the ISDA for which the other party may declare an early termination and liquidation of all transactions entered into under the ISDA, including foreclosure against any collateral security. In addition, some of the ISDAs have cross default provisions under which a default by a party under another commodity or derivative contract, or the breach by a party of another borrowing obligation in excess of a specified threshold, is a breach under the ISDA.
DPL
The collateral requirements under the ISDA or similar agreements generally work as follows. The parties establish a dollar threshold of unsecured credit for each party in excess of which the party would be required to post collateral to secure its obligations to the other party. The amount of the unsecured credit threshold varies according to the senior, unsecured debt rating of the respective parties or that of a guarantor of the party’s obligations. The fair values of all transactions between the parties are netted under the master netting provisions. Transactions may include derivatives accounted for on-balance sheet as well as normal purchases and normal sales that are accounted for off-balance sheet. If the aggregate fair value of the transactions in a net loss position exceeds the unsecured credit threshold, then collateral is required to be posted in an amount equal to the amount by which the unsecured credit threshold is exceeded. The obligations of DPL are stand-alone obligations without the guaranty of PHI. If DPL’s credit rating were to fall below “investment grade,” the unsecured credit threshold would typically be set at zero and collateral would be required for the entire net loss position. Exchange-traded contracts are required to be fully collateralized without regard to the credit rating of the holder.
281
DPL
The gross fair value of DPL’s derivative liabilities, excluding the impact of offsetting transactions or collateral under master netting agreements, with credit-risk-related contingent features on December 31, 2011 and 2010, and 2009, was $23$15 million and $28$23 million, respectively. As of those dates, DPL had posted no cash collateral of zero and less than one million dollars, respectively, in the normal course of business against the gross derivative liability resulting in a net liability of $23$15 million and $28$23 million, respectively, before giving effect to offsetting transactions that are encompassed within master netting agreements that would reduce this amount. DPL’s net settlement amount in the event of a downgrade of DPL below “investment grade”investment grade as of December 31, 20102011 and 2009,2010, would have been approximately $31$15 million and $24$37 million, respectively, after taking into account the master netting agreements.
DPL’s primary sources for posting cash collateral or letters of credit are PHI’s credit facilities. At December 31, 20102011 and 2009,2010, the aggregate amount of cash plus borrowing capacity under the credit facilities available to meet the liquidity needs of PHI’s utility subsidiaries was $462$711 million and $582$462 million, respectively.
(14) FAIR VALUE DISCLOSURES
Financial Instruments Measured at Fair Value of Assets and Liabilities Excluding Issued Debt and Equity Instrumentson a Recurring Basis
DPL has adoptedapplies FASB guidance on fair value measurement and disclosures (ASC 820) whichthat established a framework for measuring fair value and expanded disclosures about fair value measurements. As defined in the guidance, fair value is the price that would be received to sell an asset or paid to transfer a liability in an orderly transaction between market participants at the measurement date (exit price). DPL utilizes market data or assumptions that market participants would use in pricing the asset or liability, including assumptions about risk and the risks inherent in the inputs to the valuation technique. These inputs can be readily observable, market corroborated or generally unobservable. Accordingly, DPL utilizes valuation techniques that maximize the use of observable inputs and minimize the use of unobservable inputs. The guidance establishes a fair value hierarchy that prioritizes the inputs used to measure fair value. The hierarchy gives the highest priority to unadjusted quoted prices in active markets for identical assets or liabilities (level 1) and the lowest priority to unobservable inputs (level 3). DPL classifies its fair value balances in the fair value hierarchy based on the observability of the inputs used in the fair value calculation as follows:
Level 1 – Quoted prices are available in active markets for identical assets or liabilities as of the reporting date. Active markets are those in which transactions for the asset or liability occur in sufficient frequency and volume to provide pricing information on an ongoing basis, such as the New York Mercantile Exchange (NYMEX).
DPL
Level 2 – Pricing inputs are other than quoted prices in active markets included in level 1, which are either directly or indirectly observable as of the reporting date. Level 2 includes those financial instruments that are valued using broker quotes in liquid markets and other observable data. Level 2 also includes those financial instruments that are valued using internally developed methodologies that have been corroborated by observable market data through correlation or by other means. Significant assumptions are observable in the marketplace throughout the full term of the instrument and can be derived from observable data or are supported by observable levels at which transactions are executed in the marketplace.
The level 2 liability associated with the life insurance policies represents a deferred compensation obligation, the value of which is tracked via underlying insurance sub-accounts. The sub-accounts are designed to mirror existing mutual funds and money market funds that are observable and actively traded.
Level 3 – Pricing inputs include significant inputs that are generally less observable than those from objective sources. Level 3 includes those financial instruments that are valued using models or other valuation methodologies.
282
DPL
Derivative instruments categorized as level 3 include natural gas options purchased by DPL as part of a natural gas hedging program approved by the DPSC. Some non-standard assumptions are used in their forwardThe valuation to adjust for the pricing; otherwise, most of the options follow NYMEX valuation. A few of the options have no significant NYMEX components, and have to be priced usingis based, in part, on internal volatility assumptions.assumptions extracted from historical NYMEX prices over a certain period of time.
Executive deferred compensation plan assets and liabilities that are classified as level 3 include certain life insurance policies that are valued using the cash surrender value of the policies, net of loans against those policies, which does not represent a quoted price in an active market.
The following tables set forth, by level within the fair value hierarchy, DPL’s financial assets and liabilities that were accounted for at fair value on a recurring basis as of December 31, 20102011 and 2009.2010. As required by the guidance, financial assets and liabilities are classified in their entirety based on the lowest level of input that is significant to the fair value measurement. DPL’s assessment of the significance of a particular input to the fair value measurement requires the exercise of judgment, and may affect the valuation of fair value assets and liabilities and their placement within the fair value hierarchy levels.
DPL
| Fair Value Measurements at December 31, 2010 | Fair Value Measurements at December 31, 2011 | |||||||||||||||||||||||||||||||
Description | Total | Quoted Prices in Active Markets for Identical Instruments (Level 1) (a) | Significant Other Observable Inputs (Level 2) (a) | Significant Unobservable Inputs (Level 3) | Total | Quoted Prices in Active Markets for Identical Instruments (Level 1) (a) | Significant Other Observable Inputs (Level 2) (a) | Significant Unobservable Inputs (Level 3) | ||||||||||||||||||||||||
| (millions of dollars) | (millions of dollars) | |||||||||||||||||||||||||||||||
ASSETS | ||||||||||||||||||||||||||||||||
Executive deferred compensation plan assets | ||||||||||||||||||||||||||||||||
Money Market Funds | $ | 2 | $ | 2 | $ | — | $ | — | $ | 2 | $ | 2 | $ | — | $ | — | ||||||||||||||||
Life Insurance Contracts | 1 | — | — | 1 | 1 | — | — | 1 | ||||||||||||||||||||||||
|
|
|
| |||||||||||||||||||||||||||||
| $ | 3 | $ | 2 | $ | — | $ | 1 | $ | 3 | $ | 2 | $ | — | $ | 1 | |||||||||||||||||
|
|
|
| |||||||||||||||||||||||||||||
LIABILITIES | ||||||||||||||||||||||||||||||||
Derivative instruments (b) | ||||||||||||||||||||||||||||||||
Natural Gas (c) | $ | 29 | $ | 6 | $ | — | $ | 23 | $ | 17 | $ | 2 | $ | — | $ | 15 | ||||||||||||||||
|
|
|
| |||||||||||||||||||||||||||||
| $ | 29 | $ | 6 | $ | — | $ | 23 | $ | 17 | $ | 2 | $ | — | $ | 15 | |||||||||||||||||
|
|
|
| |||||||||||||||||||||||||||||
| (a) | There were no significant transfers of instruments between level 1 and level 2 valuation categories. |
| (b) | The fair value of derivative liabilities reflect netting by counterparty before the impact of collateral. |
| (c) | Represents natural gas options purchased by DPL as part of a natural gas hedging program approved by the DPSC. |
| Fair Value Measurements at December 31, 2009 | ||||||||||||||||
Description | Total | Quoted Prices in Active Markets for Identical Instruments (Level 1) | Significant Other Observable Inputs (Level 2) | Significant Unobservable Inputs (Level 3) | ||||||||||||
| (millions of dollars) | ||||||||||||||||
ASSETS | ||||||||||||||||
Cash equivalents | ||||||||||||||||
Treasury Fund | $ | 19 | $ | 19 | $ | — | $ | — | ||||||||
Executive deferred compensation plan assets | ||||||||||||||||
Money Market Funds | 3 | 3 | — | — | ||||||||||||
Life Insurance Contracts | 1 | — | — | 1 | ||||||||||||
| $ | 23 | $ | 22 | $ | — | $ | 1 | |||||||||
LIABILITIES | ||||||||||||||||
Derivative instruments (a) | ||||||||||||||||
Natural Gas (b) | $ | 39 | $ | 10 | $ | — | $ | 29 | ||||||||
Executive deferred compensation plan liabilities | ||||||||||||||||
Life Insurance Contracts | 1 | — | 1 | — | ||||||||||||
| $ | 40 | $ | 10 | $ | 1 | $ | 29 | |||||||||
283
DPL
| Fair Value Measurements at December 31, 2010 | ||||||||||||||||
Description | Total | Quoted Prices in Active Markets for Identical Instruments (Level 1)(a) | Significant Other Observable Inputs (Level 2)(a) | Significant Unobservable Inputs (Level 3) | ||||||||||||
| (millions of dollars) | ||||||||||||||||
ASSETS | ||||||||||||||||
Executive deferred compensation plan assets | ||||||||||||||||
Money Market Funds | $ | 2 | $ | 2 | $ | — | $ | — | ||||||||
Life Insurance Contracts | 1 | — | — | 1 | ||||||||||||
|
|
|
|
|
|
|
| |||||||||
| $ | 3 | $ | 2 | $ | — | $ | 1 | |||||||||
|
|
|
|
|
|
|
| |||||||||
LIABILITIES | ||||||||||||||||
Derivative instruments (b) | ||||||||||||||||
Natural Gas (c) | $ | 29 | $ | 6 | $ | — | $ | 23 | ||||||||
|
|
|
|
|
|
|
| |||||||||
| $ | 29 | $ | 6 | $ | — | $ | 23 | |||||||||
|
|
|
|
|
|
|
| |||||||||
| (a) | There were no significant transfers of instruments between level 1 and level 2 valuation categories. |
| (b) | The fair value of derivative liabilities reflect netting by counterparty before the impact of collateral. |
| Represents natural gas options purchased by DPL as part of a natural gas hedging program approved by the DPSC. |
DPL
Reconciliations of the beginning and ending balances of DPL’s fair value measurements using significant unobservable inputs (Level 3) for the yearyears ended December 31, 20102011 and 20092010 are shown below:
| Year Ended December 31, 2010 | Year Ended December 31, 2011 | |||||||||||||||
| Natural Gas | Life Insurance Contracts | Natural Gas | Life Insurance Contracts | |||||||||||||
| (millions of dollars) | (millions of dollars) | |||||||||||||||
Beginning balance as of January 1, 2010 | $ | (29 | ) | $ | 1 | |||||||||||
Total gains or (losses) (realized and unrealized): | ||||||||||||||||
Beginning balance as of January 1, 2011 | $ | (23 | ) | $ | 1 | |||||||||||
Total gains (losses) (realized and unrealized): | ||||||||||||||||
Included in income | — | — | — | — | ||||||||||||
Included in accumulated other comprehensive loss | — | — | — | — | ||||||||||||
Included in regulatory liabilities | (16 | ) | — | (10 | ) | — | ||||||||||
Purchases and issuances | — | — | ||||||||||||||
Purchases | — | — | ||||||||||||||
Issuances | — | — | ||||||||||||||
Settlements | 22 | — | 18 | — | ||||||||||||
Transfers in (out) of Level 3 | — | — | — | — | ||||||||||||
|
| |||||||||||||||
Ending balance as of December 31, 2010 | $ | (23 | ) | $ | 1 | |||||||||||
Ending balance as of December 31, 2011 | $ | (15 | ) | $ | 1 | |||||||||||
|
| |||||||||||||||
| Year Ended December 31, 2009 | ||||||||
| Natural Gas | Life Insurance Contracts | |||||||
| (millions of dollars) | ||||||||
Beginning balance as of January 1, 2009 | $ | (24 | ) | $ | 1 | |||
Total gains or (losses) (realized and unrealized): | ||||||||
Included in income | — | — | ||||||
Included in accumulated other comprehensive loss | — | — | ||||||
Included in regulatory liabilities | (18 | ) | — | |||||
Purchases and issuances | — | — | ||||||
Settlements | 13 | — | ||||||
Transfers in (out) of Level 3 | — | — | ||||||
Ending balance as of December 31, 2009 | $ | (29 | ) | $ | 1 | |||
284
DPL
| Year Ended December 31, 2010 | ||||||||
| Natural Gas | Life Insurance Contracts | |||||||
| (millions of dollars) | ||||||||
Beginning balance as of January 1, 2010 | $ | (29 | ) | $ | 1 | |||
Total gains (losses) (realized and unrealized): | ||||||||
Included in income | — | — | ||||||
Included in accumulated other comprehensive loss | — | — | ||||||
Included in regulatory liabilities | (20 | ) | — | |||||
Purchases | — | — | ||||||
Issuances | — | — | ||||||
Settlements | 26 | — | ||||||
Transfers in (out) of Level 3 | — | — | ||||||
|
|
|
| |||||
Ending balance as of December 31, 2010 | $ | (23 | ) | $ | 1 | |||
|
|
|
| |||||
Fair Value of Debt and EquityOther Financial Instruments
The estimated fair values of DPL’s issued debt and equity instruments as of December 31, 20102011 and 20092010 are shown below:
| December 31, 2010 | December 31, 2009 | |||||||||||||||
| (millions of dollars) | ||||||||||||||||
| Carrying Amount | Fair Value | Carrying Amount | Fair Value | |||||||||||||
Long-Term Debt | $ | 765 | $ | 822 | $ | 686 | $ | 733 | ||||||||
| December 31, 2011 | December 31, 2010 | |||||||||||||||
| (millions of dollars) | ||||||||||||||||
| Carrying Amount | Fair Value | Carrying Amount | Fair Value | |||||||||||||
Long-Term Debt | $ | 765 | $ | 834 | $ | 765 | $ | 822 | ||||||||
The fair value of long-term debt issued by DPL was based on actual trade prices as of December 31, 2010 and 2009,(where available), bid prices obtained from brokers and validated by PHI, or a discounted cash flow model where actual trade prices were not available.model. Prices obtained from brokers include observable market data on the target security or historical correlation and direct observation methodologies of similar debt securities.
The carrying amounts of all other financial instruments in the accompanying financial statements approximate fair value.
DPL
(15) COMMITMENTS AND CONTINGENCIES
Regulatory and OtherEnvironmental Matters
Rate Proceedings
Over the last several years, DPL has proposed the adoption of mechanisms to decouple retail distribution revenue from the amount of power delivered to retail customers. To date:
A BSA has been approved and implemented for electric service in Maryland; however, the MPSC has initiated a proceeding to review how the BSA operates in Maryland to recover revenues lost as a result of major storm outages (as discussed below).
A modified fixed variable rate design (MFVRD) has been approved in concept for electric service in Delaware, but has been deferred by the DPSC as described below.
A MFVRD has been approved in concept for natural gas service in Delaware, but DPL anticipates that it will be deferred by the DPSC consistent with its treatment in the electric base rate case.
Under the BSA, customer distribution rates are subject to adjustment (through a credit or surcharge mechanism), depending on whether actual distribution revenue per customer exceeds or falls short of the revenue-per-customer amount approved by the applicable public service commission. The BSA increases rates if actual distribution revenues fall below the approved level and decreases rates if actual distribution revenues are above the approved level. The result is that, over time, DPL collects its authorized revenues for distribution service. As a consequence, a BSA “decouples” distribution revenue from unit sales consumption and ties the growth in distribution revenues to the growth in the number of customers. Some advantages of the BSA are that it (i) eliminates revenue fluctuations due to weather and changes in customer usage patterns and, therefore, provides for more predictable distribution revenues that are better aligned with costs, (ii) provides for more reliable fixed-cost recovery, (iii) tends to stabilize customers’ delivery bills, and (iv) removes any disincentives for DPL to promote energy efficiency programs for their customers, because it breaks the link between overall sales volumes and distribution revenues. The MFVRD approved in concept in Delaware provides for a fixed customer charge (i.e., not tied to the customer’s volumetric consumption) to recover the utility’s fixed costs, plus a reasonable rate of return. Although different from the BSA, DPL views the MFVRD as an appropriate distribution revenue decoupling mechanism.
Delaware
DPL makes an annual GCR filing with the DPSC for the purpose of allowing DPL to recover gas procurement costs through customer rates. In August 2010, DPL made its 2010 GCR filing, which proposes rates that would allow DPL to recover an amount equal to a two-year amortization of currently under-recovered gas costs. In October 2010, the DPSC issued an order placing the new rates into effect on November 1, 2010, subject to refund and pending final DPSC approval. The effect of the proposed two-year amortization upon rates is an increase of 0.1% in the level of GCR. If the DPSC does not accept DPL’s proposal, the full adjustment would result in an increase of 6.9% in the GCR.
In September 2009, DPL submitted an application to the DPSC to increase its electric distribution base rates. The filing, as revised in March 2010, sought approval of an annual rate increase of approximately $26.2 million, assuming approval of the implementation of the MFVRD, based on a requested return on equity (ROE) of 10.75%. As permitted by Delaware law, DPL placed an increase of approximately $2.5 million annually into effect, on a temporary basis, in November 2009, and the remainder of approximately $23.7 million of requested increase went into effect on April 19, 2010, in each case subject to refund and pending final DPSC approval. In June 2010, DPL lowered the requested annual rate increase to approximately $24.2 million. On January 18, 2011, the DPSC approved a rate increase of approximately $16.4 million, based on an ROE of 10.00%. In early 2011, DPL will refund to customers
DPL
the excess of the billed amounts over the DPSC approved increase. Consideration of the MFVRD has been deferred pending the development of an education plan for customers and workshops that are open to parties and the public for the purpose of developing a proposed implementation plan for the MFVRD.
On July 2, 2010, DPL submitted an application with the DPSC to increase its natural gas distribution base rates. As subsequently amended on September 10, 2010 (to replace test year data for the twelve months ended June 2010 with the actual data) and on October 11, 2010 (based on an update to DPL’s natural gas advanced metering infrastructure implementation schedule), the filing seeks approval of an annual rate increase of approximately $10.2 million, assuming the implementation of the MFVRD, based on a requested ROE of 11.00%. As permitted by Delaware law, DPL placed an annual increase of approximately $2.5 million annually into effect, on a temporary basis, on August 31, 2010, and the remainder of approximately $7.7 million of the requested increase went into effect on February 2, 2011, in each case subject to refund and pending final DPSC approval. Previously, in June 2009, DPL filed an application requesting approval for the implementation of the MFVRD for gas distribution rates. DPL anticipates that the DPSC will follow the same implementation approach it is following with respect to DPL’s MFVRD proposal for electric service, discussed above. The DPSC decision is still pending.
Maryland
On December 21, 2010, DPL filed an application with the MPSC to increase its electric distribution base rates by $17.8 million annually, based on an ROE of 10.75%. On December 28, 2010, the MPSC, consistent with its typical practice, issued an order suspending the proposed rate increase request for an initial period of 150 days from January 20, 2011 pending investigation by the MPSC.
On February 1, 2011, the MPSC initiated proceedings for DPL and Pepco, as well as unaffiliated utilities such as Baltimore Gas & Electric Company and Southern Maryland Electric Cooperative, for the purpose of reviewing how the BSA operates to recover revenues lost as a result of major storm outages. In its orders initiating the proceedings, the MPSC expressed concern that the utilities’ respective BSAs may be allowing them to recover revenues lost during extended outages, therefore unintentionally eliminating an incentive to restore service quickly. The MPSC will consider whether the BSA, as currently in effect, is appropriate, whether the calculations or determinant factors for calculating the BSA should be modified, and if so, what modifications should be made. A similar adjustment was included in the BSA for Pepco in the District of Columbia when the BSA was approved by the District of Columbia Public Service Commission.
Environmental Litigation
DPL is subject to regulation by various federal, regional, state, and local authorities with respect to the environmental effects of its operations, including air and water quality control, solid and hazardous waste disposal, and limitations on land use. In addition, federal and state statutes authorize governmental agencies to compel responsible parties to clean up certain abandoned or unremediated hazardous waste sites. DPL may incur costs to clean up currently or formerly owned facilities or sites found to be contaminated, as well as other facilities or sites that may have been contaminated due to past disposal practices. Although penalties assessed for violations of environmental laws and regulations are not recoverable from DPL’s customers, environmental clean-up costs incurred by DPL would begenerally are included in its cost of service for ratemaking purposes. The total accrued liabilities for the environmental contingencies of DPL described below at December 31, 2011 are summarized as follows:
285
DPL
| Transmission and Distribution | Legacy Regulated Generation | Other | Total | |||||||||||||
| (millions of dollars) | ||||||||||||||||
Beginning balance as of January 1 | $ | 1 | $ | 5 | $ | 2 | $ | 8 | ||||||||
Accruals | — | — | — | — | ||||||||||||
Payments | — | (1 | ) | — | (1 | ) | ||||||||||
|
|
|
|
|
| �� |
|
| ||||||||
Ending balance as of December 31 | 1 | 4 | 2 | 7 | ||||||||||||
Less amounts in Other Current Liabilities | 1 | 1 | 2 | 4 | ||||||||||||
|
|
|
|
|
|
|
| |||||||||
Amounts in Other Deferred Credits | $ | — | $ | 3 | $ | — | $ | 3 | ||||||||
|
|
|
|
|
|
|
| |||||||||
Ward Transformer Site.
In April 2009, a group of potentially responsible parties (PRPs) with respect to the Ward Transformer site in Raleigh, North Carolina, filed a complaint in the U.S. District Court for the Eastern District of North Carolina, alleging cost recovery and/or contribution claims against a number of entities, including DPL, with respect to past and future response costs incurred by the PRP group in performing a removal action at the site. With the court’s permission, the plaintiffs filed amended complaints in September 2009. DPL, as part of a group of defendants, filed a motion to dismiss in October 2009. In a March 24, 2010 order, the court denied the defendants’ motion to dismiss. Although it is too earlyThe next step in the processlitigation will be the filing of summary judgment motions regarding liability for certain “test case” defendants other than DPL. The case has been stayed as to characterize the magnitude ofremaining defendants pending rulings upon the potential liabilitytest cases. Although DPL cannot at this site,time estimate an amount or range of reasonably possible losses to which it may be exposed, DPL does not believe that it had extensive business transactions, if any, with the Ward Transformer site.
DPL
site and therefore, costs incurred to resolve this matter are not expected to be material.
Indian River Oil Release
In 2001, DPL entered into a consent agreement with the Delaware Department of Natural Resources and Environmental Control for remediation, site restoration, natural resource damage compensatory projects and other costs associated with environmental contamination resulting from an oil release at the Indian River generating facility, which was sold in June 2001. Based on updated engineering estimates obtainedThe amount of remediation costs accrued for this matter is included in the second quarter of 2010, DPL accrued an additional liability in the amount of approximately $4 million in 2010. As of December 31, 2010, DPL’s accrual for expected future costs to fulfill its obligationstable above under the consent agreement was approximately $5 million, of which approximately $1 million is expected to be incurred in 2011.column entitled Legacy Regulated Generation.
Contractual Obligations
As of December 31, 2010,2011, DPL’s contractual obligations under non-derivative fuel and power purchase contracts were $65 million in 2011,2012, $129 million in 20122013 to 2013, $1302014, $133 million in 20142015 to 2015,2016, and $771$268 million in 20162017 and thereafter.
(16) RELATED PARTY TRANSACTIONS
PHI Service Company provides various administrative and professional services to PHI and its regulated and unregulated subsidiaries, including DPL. The cost of these services is allocated in accordance with cost allocation methodologies set forth in the service agreement using a variety of factors, including the subsidiaries’ share of employees, operating expenses, assets, and other cost causal methods. These intercompany transactions are eliminated by PHI in consolidation and no profit results from these transactions at PHI. PHI Service Company costs directly charged or allocated to DPL for the years ended December 31, 2011, 2010 and 2009 and 2008 were $133 million, $139 million and $130 million, and $121 million, respectively.
286
DPL
In addition to the PHI Service Company charges described above, DPL’s financial statements include the following related party transactions in its statements of income:
| For the Year Ended December 31, | ||||||||||||
| 2010 | 2009 | 2008 | ||||||||||
| (millions of dollars) | ||||||||||||
(Expense) Income | ||||||||||||
Purchased power under Default Electricity Supply contracts with Conectiv Energy Supply, Inc. (a)(e) | $ | (103 | ) | $ | (88 | ) | $ | (180 | ) | |||
Intercompany lease transactions (b) | 7 | 7 | 7 | |||||||||
Transcompany pipeline gas sales with Conectiv Energy Supply, Inc. (c)(e) | — | — | 1 | |||||||||
Transcompany pipeline gas purchases with Conectiv Energy Supply, Inc. (d)(e) | (1 | ) | (1 | ) | (3 | ) | ||||||
| For the Year Ended December 31, | ||||||||||||
| 2011 | 2010 | 2009 | ||||||||||
| (millions of dollars) | ||||||||||||
Income (Expense) | ||||||||||||
Purchased power under Default Electricity Supply contracts with Conectiv Energy Supply, Inc. (a)(b) | $ | 1 | $ | (103 | ) | $ | (88 | ) | ||||
Intercompany lease transactions (c) | 5 | 7 | 7 | |||||||||
Transcompany pipeline gas purchases with Conectiv Energy Supply, Inc. (b)(d) | — | (1 | ) | (1 | ) | |||||||
| (a) | Included in purchased energy expense. |
| (b) |
| (c) | Included in |
| (d) | Included in gas purchased expense. |
DPL
As of December 31, 20102011 and 2009,2010, DPL had the following balances on its balance sheets due (to) from related parties:
| 2010 | 2009 | 2011 | 2010 | |||||||||||||
| (millions of dollars) | (millions of dollars) | |||||||||||||||
(Liability) Asset | ||||||||||||||||
(Payable to) Receivable from Related Party (current) (a) | ||||||||||||||||
PHI Service Company | $ | (19 | ) | $ | 22 | $ | (20 | ) | $ | (19 | ) | |||||
PHI Parent Company | — | (27 | ) | |||||||||||||
Conectiv Energy Supply, Inc. | (13 | ) | (7 | ) | (1 | ) | (13 | ) | ||||||||
Pepco Energy Services, Inc. and its subsidiaries (Pepco Energy Services) (b) | (2 | ) | (3 | ) | — | (2 | ) | |||||||||
Other | — | 1 | ||||||||||||||
|
| |||||||||||||||
Total | $ | (34 | ) | $ | (14 | ) | $ | (21 | ) | $ | (34 | ) | ||||
|
| |||||||||||||||
Money Pool Balance with Pepco Holdings (included in Cash and cash equivalents) | $ | 63 | $ | — | ||||||||||||
Money Pool Balance with Pepco Holdings (included in cash and cash equivalents) | $ | — | $ | 63 | ||||||||||||
|
| |||||||||||||||
| (a) |
| (b) | DPL bills customers on behalf of Pepco Energy Services where customers have selected Pepco Energy Services as their alternative energy supplier. |
287
DPL
(17) QUARTERLY FINANCIAL INFORMATION (UNAUDITED)
The quarterly data presented below reflect all adjustments necessary, in the opinion of management, for a fair presentation of the interim results. Quarterly data normally vary seasonally because of temperature variations and differences between summer and winter rates. Therefore, comparisons by quarter within a year are not meaningful.
| 2010 | 2011 | |||||||||||||||||||||||||||||||||||||||
| First Quarter | Second Quarter | Third Quarter | Fourth Quarter | Total | First Quarter | Second Quarter | Third Quarter | Fourth Quarter | Total | |||||||||||||||||||||||||||||||
| (millions of dollars) | (millions of dollars) | |||||||||||||||||||||||||||||||||||||||
Total Operating Revenue | $ | 394 | $ | 296 | $ | 377 | $ | 333 | $ | 1,400 | $ | 400 | $ | 284 | $ | 326 | $ | 294 | $ | 1,304 | ||||||||||||||||||||
Total Operating Expenses | 358 | 277 | 352 | 300 | 1,287 | 351 | 248 | 297 | 259 | 1,155 | ||||||||||||||||||||||||||||||
Operating Income | 36 | 19 | 25 | 33 | 113 | 49 | 36 | 29 | 35 | 149 | ||||||||||||||||||||||||||||||
Other Expenses | (9 | ) | (10 | ) | (9 | ) | (9 | ) | (37 | ) | (9 | ) | (9 | ) | (8 | ) | (10 | ) | (36 | ) | ||||||||||||||||||||
Income Before Income Tax Expense | 27 | 9 | 16 | 24 | 76 | 40 | 27 | 21 | 25 | 113 | ||||||||||||||||||||||||||||||
Income Tax Expense | 13 | 3 | 7 | 8 | 31 | 17 | 5 | 10 | 10 | 42 | ||||||||||||||||||||||||||||||
Net Income | $ | 14 | $ | 6 | $ | 9 | $ | 16 | $ | 45 | $ | 23 | $ | 22 | $ | 11 | $ | 15 | $ | 71 | ||||||||||||||||||||
| 2009 | ||||||||||||||||||||||||||||||||||||||||
| First Quarter | Second Quarter | Third Quarter | Fourth Quarter | Total | ||||||||||||||||||||||||||||||||||||
| (millions of dollars) | ||||||||||||||||||||||||||||||||||||||||
Total Operating Revenue | $ | 452 | $ | 291 | $ | 339 | $ | 321 | $ | 1,403 | ||||||||||||||||||||||||||||||
Total Operating Expenses | 408 | 274 | 321 | 290 | 1,293 | |||||||||||||||||||||||||||||||||||
Operating Income | 44 | 17 | 18 | 31 | 110 | |||||||||||||||||||||||||||||||||||
Other Expenses | (11 | ) | (10 | ) | (11 | ) | (10 | ) | (42 | ) | ||||||||||||||||||||||||||||||
Income Before Income Tax Expense | 33 | 7 | 7 | 21 | 68 | |||||||||||||||||||||||||||||||||||
Income Tax Expense (Benefit) | 12 | 2 | (7 | )(b) | 9 | 16 | ||||||||||||||||||||||||||||||||||
Net Income | $ | 21 | $ | 5 | $ | 14 | $ | 12 | $ | 52 | ||||||||||||||||||||||||||||||
| (a) | Includes tax benefits of $4 million (after-tax) associated with an interest benefit related to federal tax liabilities in the second quarter and an additional tax expense of $1 million (after-tax) resulting from a recalculation of interest on uncertain tax positions for open tax years in the third quarter. |
| 2010 | ||||||||||||||||||||
| First Quarter | Second Quarter | Third Quarter | Fourth Quarter | Total | ||||||||||||||||
| (millions of dollars) | ||||||||||||||||||||
Total Operating Revenue | $ | 394 | $ | 296 | $ | 377 | $ | 333 | $ | 1,400 | ||||||||||
Total Operating Expenses (a) | 358 | 277 | 352 | 300 | 1,287 | |||||||||||||||
Operating Income | 36 | 19 | 25 | 33 | 113 | |||||||||||||||
Other Expenses | (9 | ) | (10 | ) | (9 | ) | (9 | ) | (37 | ) | ||||||||||
Income Before Income Tax Expense | 27 | 9 | 16 | 24 | 76 | |||||||||||||||
Income Tax Expense | 13 | 3 | 7 | 8 | 31 | |||||||||||||||
Net Income | $ | 14 | $ | 6 | $ | 9 | $ | 16 | $ | 45 | ||||||||||
| (a) | Includes restructuring charges of $4 million and $4 million in the third and fourth quarters, respectively. |
DPL
(18)RESTRUCTURING CHARGE
With the ongoing wind downwind-down of the retail energy supply business of Pepco Energy Services and the disposition of Conectiv Energy, PHI is repositioningrepositioned itself as a regulated transmission and distribution company.company during 2010. In connection with this repositioning, PHI commencedcompleted a comprehensive organizational review in the second quarter of 2010 to identifythat identified opportunities to streamline the organization and to achieve certain reductions in corporate overhead costs that are allocated to its operating segments. This review hassegments, which resulted in the adoption of a restructuring plan. PHI began implementingimplementation of the plan during the third quarter,2010, identifying 164 employee positions that were to be eliminated during the fourth quarter of 2010.eliminated. The plan also focuses on identifyingincluded additional cost reduction opportunities that were implemented through process improvements and operational efficiencies.
In connection with the restructuring plan, DPL recorded a pre-tax restructuring charge of $8 million for the year ended December 31, 2010 related to its allocation of severance, pension, and health and welfare benefits for terminationsthe termination of corporate services employees at PHI.PHI of $8 million in 2010. The severance, pension, and health and welfare benefits were estimated based on the years of service and compensation levels of the employees associated with the 164 eliminated positions at PHI. The restructuring charge has beenwas reflected as a separate line item in the statementsstatement of income.income for the year ended December 31, 2010.
288
DPL
A reconciliation of DPL’s accrued restructuring charges for the year ended December 31, 20102011 is as follows:
| Year Ended December 31, 2010 (a) | ||||
| (millions of dollars) | ||||
Beginning balance as of January 1, 2010 | $ | — | ||
Restructuring charge | 8 | |||
Cash payments | (1 | ) | ||
Ending balance as of December 31, 2010 | $ | 7 | ||