
UNITED STATES
SECURITIES AND EXCHANGE COMMISSION
WASHINGTON, D.C. 20549
FORM 10-K
| x | ANNUAL REPORT PURSUANT TO SECTION 13 OR 15(d) OF THE SECURITIES EXCHANGE ACT OF 1934 |
For the fiscal year ended December 31, 20102012
or
| ¨ | TRANSITION REPORT PURSUANT TO SECTION 13 OR 15(d) OF THE SECURITIES EXCHANGE ACT OF 1934 |
For the transition period from to
Commission File Number: 001-33164
Domtar Corporation
(Exact name of registrant as specified in its charter)
| Delaware | 20-5901152 | |
(State or Other Jurisdiction of
| (I.R.S. Employer
|
395 de Maisonneuve Blvd. West
Montreal, Quebec, H3A 1L6, Canada
(Address of Principal Executive Offices)(Zip Code)
Registrant’s telephone number, including area code:(514) 848-5555
Securities registered pursuant to Section 12(b) of the Act:
Title of Each Class | Name of Each Exchange on Which Registered | |
Common Stock, par value $0.01 per share | New York Stock Exchange |
Securities registered pursuant to Section 12(g) of the Act: None
Indicate by check mark if the registrant is a well-known seasoned issuer, as defined in Rule 405 of the Securities Act. Yes x No ¨
Indicate by check mark if the registrant is not required to file reports pursuant to Section 13 or Section 15(d) of the Act. Yes ¨ No x
Indicate by check mark whether the registrant: (1) has filed all reports required to be filed by Section 13 or 15(d) of the Securities Exchange Act of 1934 during the preceding 12 months (or for such shorter period that the registrant was required to file such reports), and (2) has been subject to such filing requirements for the past 90 days. Yes x No ¨
Indicate by check mark whether the registrant has submitted electronically and posted on its corporate Website, if any, every Interactive Data File required to be submitted and posted pursuant to Rule 405 of Regulations S-T during the preceding 12 months (or for such shorter period that the registrant was required to submit and post such files). Yes x No ¨
Indicate by check mark if disclosure of delinquent filers pursuant to Item 405 of Regulation S-K is not contained herein, and will not be contained, to the best of registrant’s knowledge, in definitive proxy or information statements incorporated by reference in Part III of this Form 10-K or any amendment to this Form 10-K. ¨
Indicate by check mark whether the registrant is a large accelerated filer, an accelerated filer, a non-accelerated filer, or a smaller reporting company. See definition of “large accelerated filer,” “accelerated filer” and “smaller reporting company” in Rule 12b-2 of the Exchange Act. (Check one):
Large Accelerated Filer x Accelerated Filer ¨ Non-Accelerated Filer ¨ Smaller reporting company ¨
(Do not check if a smaller reporting company)
Indicate by check mark whether the registrant is a shell company (as defined in Rule 12b-2 of the Exchange Act). Yes ¨ No x
As of June 30, 2010,2012, the aggregate market value of the registrant’s common stock held by non-affiliates of the registrant was $2,073,567,134.2,707,214,110.
Number of shares of common stock outstanding as of February 23, 2011: 41,105,30519, 2013: 34,168,276
DOCUMENTS INCORPORATED BY REFERENCE
Portions of the Registrant’s Proxy Statement, to be filed within 120 days of the close of the registrant’s fiscal year, in connection with its 20112013 Annual Meeting of Stockholders are incorporated by reference into Part III of this Annual Report on Form 10-K.
DOMTAR CORPORATION
ANNUAL REPORT ON FORM 10-K
FOR THE YEAR ENDED DECEMBER 31, 20102012
| PAGE | ||||||
| PART I | ||||||
ITEM 1 | 4 | |||||
| 4 | ||||||
| 5 | ||||||
| 11 | ||||||
| 12 | ||||||
| 14 | ||||||
| 14 | ||||||
ITEM 1A | ||||||
ITEM 1B | 26 | |||||
ITEM 2 | 26 | |||||
ITEM 3 | 28 | |||||
ITEM 4 | 30 | |||||
| PART II | ||||||
ITEM 5 | 31 | |||||
| 31 | ||||||
| 31 | ||||||
| 31 | ||||||
| 33 | ||||||
ITEM 6 | 34 | |||||
ITEM 7 | MANAGEMENT’S DISCUSSION AND ANALYSIS OF FINANCIAL CONDITION AND RESULTS OF OPERATIONS | 35 | ||||
| 35 | ||||||
| 37 | ||||||
| 52 | ||||||
| PAGE | ||||||
| 56 | ||||||
| 57 | |||||
| 57 | ||||||
| 58 | ||||||
| 58 | ||||||
ITEM 7A | ||||||
ITEM 8 | ||||||
Report of PricewaterhouseCoopers LLP, Independent Registered Public | ||||||
Consolidated Statements of Earnings | ||||||
ITEM 9 | CHANGES IN AND DISAGREEMENTS WITH ACCOUNTANTS ON ACCOUNTING AND FINANCIAL DISCLOSURE | |||||
ITEM 9A | ||||||
ITEM 9B | ||||||
| PART III | ||||||
ITEM 10 | ||||||
ITEM 11 | ||||||
ITEM 12 | SECURITY OWNERSHIP OF CERTAIN BENEFICIAL OWNERS AND MANAGEMENT AND RELATED STOCKHOLDER MATTERS | |||||
ITEM 13 | CERTAIN RELATIONSHIPS AND RELATED TRANSACTIONS, AND DIRECTOR INDEPENDENCE | |||||
ITEM 14 | ||||||
| PART IV | ||||||
ITEM 15 | ||||||
| ||||||
| ITEM 1. | BUSINESS |
We design, manufacture, market and distribute a wide variety of fiber-based products including communication papers, specialty and packaging papers and adult incontinence products. The foundation of our business is a network of world class wood fiber converting assets that produce paper grade, fluff and specialty pulps. The majority of our pulp production is consumed internally to manufacture paper and consumer products. We are the largest integrated manufacturer and marketer of uncoated freesheet paper in North America and the second largest in the world based on production capacity. We are also a manufacturer of papergrade, fluff and specialty pulp. We design, manufacture, market and distribute a wide range of paper products forserving a variety of customers, including merchants, retail outlets, stationers, printers, publishers, converters and end-users. We are also a leading marketer and producer of a complete line of incontinence care products marketed primarily under the Attends® brand name. We own and operate Ariva (previously the Domtar Distribution Group)®, an extensivea network of strategically located paper and printing supplies distribution facilities. To learn more, visitwww.Domtar.com.
We also produced lumber and other specialty and industrial wood products up untiloperate the sale of our Wood business on June 30, 2010. Prior to June 30, 2010, we had threefollowing business segments: Papers, Paper Merchants and Wood. We now have two business segments: PapersPulp and Paper, Merchants.Distribution and Personal Care. We had revenues of $5.9$5.5 billion in 2010,2012, of which approximately 83%80% was from the PapersPulp and Paper segment, approximately 15%13% was from the Paper MerchantsDistribution segment and approximately 2%7% was from the WoodPersonal Care segment. Our Personal Care segment was formed on September 1, 2011, upon completion of the acquisition of Attends Healthcare Inc. (“Attends US”). On March 1, 2012, we completed the acquisition of Attends Healthcare Ltd. (“Attends Europe”), a manufacturer and supplier of adult incontinence care products in Northern Europe. In addition, on May 10, 2012, we completed the acquisition of EAM Corporation (“EAM”), a manufacturer of high quality airlaid and ultrathin laminated cores used in feminine hygiene, adult incontinence, baby diapers and other medical healthcare and performance packaging solutions. The acquired businesses are presented under our Personal Care reportable segment. Information regarding these business acquisitions is included in Part II, Item 8, Financial Statements and Supplementary Data of this Annual Report on Form 10-K, under Note 3 “Acquisition of Businesses.”
Throughout this Annual Report on Form 10-K, unless otherwise specified, “Domtar Corporation,” “the Company,” “Domtar,” “we,” “us” and “our” refer to Domtar Corporation, its subsidiaries, as well as its investments. Unless otherwise specified, “Domtar Inc.” refers to Domtar Inc., a 100% owned Canadian subsidiary.
Domtar Corporation was incorporated on August 16, 2006, for the sole purpose of holding the Weyerhaeuser Fine Paper Business and consummating the combination of the Weyerhaeuser Fine Paper Business with Domtar Inc. (the “Transaction”). The Weyerhaeuser Fine Paper Business was owned by Weyerhaeuser Company (“Weyerhaeuser”) prior to the completion of the Transaction on March 7, 2007. Domtar Corporation had no operations prior to March 7, 2007 when, upon the completion of the Transaction, we became an independent public holding company.
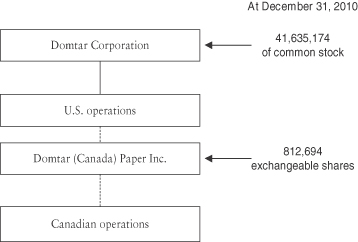
At December 31, 2010,2012, Domtar Corporation had a total of 41,635,17434,238,604 shares of common stock issued and outstanding, and Domtar (Canada) Paper Inc., an indirectly 100% owned subsidiary, had a total of 812,694607,814 exchangeable shares issued and outstanding. These exchangeable shares are intended to be substantially the economic equivalent to shares of our common stock and are currently exchangeable at the option of the holder on a one-for-one basis for shares of our common stock. As such, the total combined number of shares of common stock and exchangeable shares issued and outstanding was 42,447,86834,846,418 at December 31, 2010.2012. Our common shares are traded on the New York Stock Exchange and the Toronto Stock Exchange under the symbol “UFS” and our exchangeable shares are traded on the Toronto Stock Exchange under the symbol “UFX.” Information regarding our common stock and the exchangeable shares is included in Part II, Item 8, Financial Statements and Supplementary Data of this Annual Report on Form 10-K, under Note 1920 “Shareholders’ Equity.”
The following chart summarizes our corporate structure.
On June 30, 2010, we exited our Wood business, which comprised the manufacturing and marketing of lumber and other specialty and industrial wood products and the management of forest resources. As of July 1, 2010, weWe operate in the twothree reportable segments described below. Each reportable segment offers different products and services and requires different manufacturing processes, technology and/or marketing strategies.
The following summary briefly describes the operations included in each of our reportable segments:
PapersPulp and Paper – represents—Our Pulp and Paper segment comprises the aggregation of thedesign, manufacturing, sale and distribution of business, commercial printingcommunication and publishing,specialty and converting and specialtypackaging papers, as well as market softwood, fluff and hardwood market pulp.
Paper MerchantsDistribution –—Our Distribution segment involves the purchasing, warehousing, sale and distribution of our paper products and those of other paper manufacturers. These products include business and printing papers, and certain industrial products and printing supplies.
Personal Care—Our Personal Care segment, which we formed in September 2011, consists of the design, manufacturing, sale and distribution of adult incontinence products.
Information regarding our reportable segments is included in Part II, Item 7, Management’s Discussion and Analysis of Financial Condition and Results of Operations as well as Item 8, Financial Statements and Supplementary Data, under Note 22,23, of this Annual Report on Form 10-K. Geographic information is also included under Note 2223 of the Financial Statements and Supplementary Data.
FINANCIAL HIGHLIGHTS PER SEGMENT | Year ended December 31, 2010 | Year ended December 31, 2009 | Year ended December 31, 2008 | Year ended December 31, 2012 | Year ended December 31, 2011 | Year ended December 30, 2010 | ||||||||||||||||||
| (In millions of dollars, unless otherwise noted) | ||||||||||||||||||||||||
Sales: | ||||||||||||||||||||||||
Papers | $ | 5,070 | $ | 4,632 | $ | 5,440 | ||||||||||||||||||
Paper Merchants | 870 | 873 | 990 | |||||||||||||||||||||
Wood | 150 | 211 | 268 | |||||||||||||||||||||
Pulp and Paper | $ | 4,575 | $ | 4,953 | $ | 5,070 | ||||||||||||||||||
Distribution | 685 | 781 | 870 | |||||||||||||||||||||
Personal Care(2) | 399 | 71 | — | |||||||||||||||||||||
Wood(3) | — | — | 150 | |||||||||||||||||||||
|
|
| ||||||||||||||||||||||
Total for reportable segments | 6,090 | 5,716 | 6,698 | 5,659 | 5,805 | 6,090 | ||||||||||||||||||
Intersegment sales—Papers | (229 | ) | (231 | ) | (276 | ) | ||||||||||||||||||
Intersegment sales—Pulp and Paper | (177 | ) | (193 | ) | (229 | ) | ||||||||||||||||||
Intersegment sales—Wood | (11 | ) | (20 | ) | (28 | ) | — | — | (11 | ) | ||||||||||||||
|
|
| ||||||||||||||||||||||
Consolidated sales | $ | 5,850 | $ | 5,465 | $ | 6,394 | $ | 5,482 | $ | 5,612 | $ | 5,850 | ||||||||||||
Operating income (loss): | ||||||||||||||||||||||||
Papers(1) | $ | 667 | $ | 650 | ($ | 369 | ) | |||||||||||||||||
Paper Merchants | (3 | ) | 7 | 8 | ||||||||||||||||||||
Wood(1) | (54 | ) | (42 | ) | (73 | ) | ||||||||||||||||||
Operating income (loss):(1) | ||||||||||||||||||||||||
Pulp and Paper | $ | 346 | $ | 581 | $ | 667 | ||||||||||||||||||
Distribution | (16 | ) | — | (3 | ) | |||||||||||||||||||
Personal Care(2) | 45 | 7 | — | |||||||||||||||||||||
Wood(3) | — | — | (54 | ) | ||||||||||||||||||||
Corporate | (7 | ) | — | (3 | ) | (8 | ) | 4 | (7 | ) | ||||||||||||||
|
|
| ||||||||||||||||||||||
Total | $ | 603 | $ | 615 | ($ | 437 | ) | $ | 367 | $ | 592 | $ | 603 | |||||||||||
Segment assets: | ||||||||||||||||||||||||
Papers | $ | 5,088 | $ | 5,538 | $ | 5,399 | ||||||||||||||||||
Paper Merchants | 99 | 101 | 120 | |||||||||||||||||||||
Wood | — | 250 | 247 | |||||||||||||||||||||
Pulp and Paper | $ | 4,564 | $ | 4,874 | $ | 5,088 | ||||||||||||||||||
Distribution | 73 | 84 | 99 | |||||||||||||||||||||
Personal Care(2) | 841 | 458 | — | |||||||||||||||||||||
Wood(3) | — | — | — | |||||||||||||||||||||
Corporate | 839 | 630 | 338 | 645 | 453 | 839 | ||||||||||||||||||
|
|
| ||||||||||||||||||||||
Total | $ | 6,026 | $ | 6,519 | $ | 6,104 | $ | 6,123 | $ | 5,869 | $ | 6,026 | ||||||||||||
|
|
| ||||||||||||||||||||||
| (1) | Factors that affected the year-over-year comparison of financial results are discussed in the year-over-year and segment analysis included in Part II, Item 7, Management’s Discussion and Analysis of Financial Condition and Results of Operation of this Annual Report on Form 10-K. |
| (2) | On September 1, 2011, we acquired Attends US and formed a new reportable segment entitled Personal Care. Results of Attends US are included in the consolidated financial statements starting September 1, 2011. On March 1, and May 10, 2012, we grew our Personal Care segment with the acquisition of Attends Europe and EAM, respectively. Results of Attends Europe and EAM are included in the consolidated financial statements starting on March 1, 2012 and May 1, 2012, respectively. |
| (3) | We sold our Wood Products business on June 30, 2010. |
Our Operations
We are the largest integrated manufacturer and marketer of uncoated freesheet paper in North America and the second largest in the world based on production capacity. We have 10 pulp and paper mills in operation (eight in the United States and two in Canada) with an annual paper production capacity of approximately 3.8produce 4.2 million metric tons of uncoated freesheet paper. Approximately 81%hardwood, softwood and fluff pulp at 12 of our 13 mills (Port Huron being a non-integrated paper production capacity is domestic and the remaining 19% is located in Canada. Our paper manufacturing operations are supported by 15 converting and distribution operations, including a network of 11 plants located offsitemill). The majority of our pulp is consumed internally to manufacture paper making operations.and
In addition, we manufacture and sell pulp in excess of our internal requirements, and we
consumer products, with the balance being sold as market pulp. We also purchase papergrade pulp from third parties allowing us to optimize the logistics of our pulp capacity while reducing transportation costs.
We are the largest integrated marketer and manufacturer of uncoated freesheet paper in North America. We have 10 pulp and paper mills (eight in the United States and two in Canada), with an annual paper production capacity to sellof approximately 1.53.4 million metric tons of pulp per year depending on market conditions. Approximately 38%uncoated freesheet paper. Our paper manufacturing operations are supported by 15 converting and distribution operations including a network of 12 plants located offsite of our trade pulppaper making operations. Also, we have forms manufacturing operations at three offsite converting and distribution operations. Approximately 81% of our paper production capacity is domestic,in the U.S. and the remaining 62%19% is located in Canada.
We produce market pulp in excess of our internal requirements at our three non-integrated pulp mills in Kamloops, Dryden, and Plymouth as well as at our pulp and paper mills in Ashdown, Espanola, Ashdown, Hawesville, Windsor, Marlboro and Windsor.Nekoosa. We sell approximately 1.6 million metric tons of pulp per year depending on market conditions. Approximately 50% of our trade pulp production capacity is in the U.S., and the remaining 50% is located in Canada.
The table below lists our operating pulp and paper mills and their annual production capacity.
| Fiberline Pulp Capacity | Paper Capacity (1) | Trade Pulp (2) | Saleable | |||||||||||||||||||||||||||||||||||
Production Facility | # lines | (’000 ADMT) | # machines | (’000 ST) | (’000 ADMT) | Fiberline Pulp Capacity | Paper(1) | |||||||||||||||||||||||||||||||
| # lines | (‘000 ADMT) (2) | # machines | Category(3) | (‘000 ST) (2) | ||||||||||||||||||||||||||||||||||
Uncoated freesheet | Uncoated freesheet |
| Uncoated freesheet | |||||||||||||||||||||||||||||||||||
Ashdown, Arkansas | 3 | 810 | 4 | 906 | 86 | 3 | 747 | 3 | Communication | 703 | ||||||||||||||||||||||||||||
Windsor, Quebec | 1 | 454 | 2 | 655 | 40 | 1 | 447 | 2 | Communication | 641 | ||||||||||||||||||||||||||||
Hawesville, Kentucky | 1 | 455 | 2 | 593 | 47 | 1 | 430 | 2 | Communication | 578 | ||||||||||||||||||||||||||||
Kingsport, Tennessee | 1 | 275 | 1 | 432 | — | 1 | 282 | 1 | Communication | 414 | ||||||||||||||||||||||||||||
Johnsonburg, Pennsylvania | 1 | 238 | 2 | Communication | 369 | |||||||||||||||||||||||||||||||||
Marlboro, South Carolina | 1 | 338 | 1 | 389 | — | 1 | 325 | 1 | Specialty & Packaging | 278 | ||||||||||||||||||||||||||||
Johnsonburg, Pennsylvania | 1 | 231 | 2 | 362 | — | |||||||||||||||||||||||||||||||||
Nekoosa, Wisconsin | 1 | 166 | 3 | 151 | — | 1 | 155 | 3 | Specialty & Packaging | 118 | ||||||||||||||||||||||||||||
Rothschild, Wisconsin | 1 | 60 | 1 | 140 | — | 1 | 66 | 1 | Communication | 138 | ||||||||||||||||||||||||||||
Port Huron, Michigan | — | — | 4 | 113 | — | — | — | 4 | Specialty & Packaging | 114 | ||||||||||||||||||||||||||||
Espanola, Ontario | 2 | 351 | 2 | 76 | 114 | 2 | 352 | 2 | Specialty & Packaging | 77 | ||||||||||||||||||||||||||||
|
|
|
|
| ||||||||||||||||||||||||||||||||||
Total Uncoated freesheet | 12 | 3,140 | 22 | 3,817 | 287 | 12 | 3,042 | 21 | 3,430 | |||||||||||||||||||||||||||||
Pulp | Pulp |
| ||||||||||||||||||||||||||||||||||||
Kamloops, British Columbia | 2 | 477 | — | — | 477 | 1 | 380 | — | — | |||||||||||||||||||||||||||||
Dryden, Ontario | 1 | 327 | — | — | 327 | 1 | 328 | — | — | |||||||||||||||||||||||||||||
Plymouth, North Carolina | 2 | 444 | — | — | 444 | 2 | 438 | — | — | |||||||||||||||||||||||||||||
|
|
|
|
| ||||||||||||||||||||||||||||||||||
Total Pulp | 5 | 1,248 | — | — | 1,248 | 4 | 1,146 | — | — | |||||||||||||||||||||||||||||
|
|
|
| |||||||||||||||||||||||||||||||||||
Total | 17 | 4,388 | 22 | 3,817 | 1,535 | 16 | 4,188 | 21 | 3,430 | |||||||||||||||||||||||||||||
Total Trade Pulp(4) | 1,625 | |||||||||||||||||||||||||||||||||||||
Pulp purchases | 117 | 129 | ||||||||||||||||||||||||||||||||||||
| ||||||||||||||||||||||||||||||||||||||
Net pulp | 1,418 | 1,496 | ||||||||||||||||||||||||||||||||||||
| ||||||||||||||||||||||||||||||||||||||
| (1) | Paper capacity is based on an operating schedule of 360 days and the production at the winder. |
| (2) | ADMT refers to an air dry metric ton and ST refers to short ton. |
| (3) | Represents the majority of the capacity at each of these facilities. |
| (4) | Estimated third-party shipments dependent upon market |
Our Raw Materials
The manufacturing of pulp and paper requires wood fiber, chemicals and energy. We discuss these three major raw materials used in our manufacturing operations below.
Wood Fiber
United States pulp and paper mills
The fiber used by our pulp and paper mills in the United States is primarily hardwood and secondarily softwood, both being readily available in the market from multiple third-party sources. The mills obtain fiber from a variety of sources, depending on their location. These sources include a combination of long-term supply contracts, wood lot management arrangements, advance stumpage purchases and spot market purchases.
Canadian pulp and paper mills
The fiber used at our Windsor pulp and paper mill is hardwood originating from a variety of sources, including purchases on the open market in Canada and the United States, contracts with Quebec wood producers’ marketing boards, public land where we have wood supply allocations and from Domtar’s private lands. The softwood and hardwood fiber for our Espanola pulp and paper mill and the softwood fiber for our Dryden pulp mill, is obtained from third parties, directly or indirectly from public lands and through designated wood supply allocations for the pulp mills or from business-to-business arrangements from the Ontario sawmills sold to EACOM Timber Corporation.mills. The fiber used at our Kamloops pulp mill is all softwood, originating mostly from third-party sawmilling operations in the southern interiorsouthern-interior part of British Columbia.
Cutting rights on public lands related to our pulp and paper mills in Canada represent about 0.9 million cubic meters of softwood and 1.0 million cubic meters of hardwood, for a total of 1.9 million cubic meters of wood per year. Access to harvesting of fiber on public lands in Ontario and Quebec is subject to licenses and review by the respective governmental authorities.
During 2010,2012, the cost of wood fiber relating to our PapersPulp and Paper segment comprised approximately 20% of the total consolidated cost of sales.
Chemicals
We use various chemical compounds in our pulp and paper manufacturing facilitiesoperations that we purchase, primarily on a central basis, through contracts varying between one and twelveten years in length to ensure product availability. Most of the contracts have pricing that fluctuates based on prevailing market conditions. For pulp manufacturing, we use numerous chemicals including caustic soda, sodium chlorate, sulfuric acid, lime and peroxide. For paper manufacturing, we also use several chemical products including starch, precipitated calcium carbonate, optical brighteners, dyes and aluminum sulfate.
During 2010,2012, the cost of chemicals relating to our PapersPulp and Paper segment comprised approximately 11%13% of the total consolidated cost of sales.
Energy
Our operations consume substantial amounts of fuel including natural gas, fuel oil, coal and biomass, as well as electricity. We purchase substantial portions of the fuel we consume under supply contracts. Under most of these contracts, suppliers are committed to provide quantities within pre-determined ranges that provide us with our needs for a particular type of fuel at a specific facility. Most of these contracts have pricing that fluctuates based on prevailing market conditions. Natural gas, fuel oil, coal and biomass are consumed primarily to produce steam that is used in the manufacturing process and, to a lesser extent, to provide direct heat to be used in the chemical recovery process. About 75%76% of the total energy required to manufacture our products comes from renewable fuels such as bark and spent cooking liquor. The remainder of the energy comes from purchased fossil fuels such as natural gas, oil and coal.
We own power generating assets, including steam turbines, at all of our integrated pulp and paper mills, as well as hydro assets at fourthree locations: Espanola, our former Ottawa-Hull site, Nekoosa and Rothschild. Electricity is primarily used to drive motors and other equipment, as well as provide lighting. Approximately 71%72% of our electric power requirements are produced internally. We purchase the balance of our power requirements from local utilities.
During 2010,2012, energy costs relating to our PapersPulp and Paper segment comprised approximately 7%6% of the total consolidated cost of sales.
Our Transportation
Transportation of raw materials, wood fiber, chemicals and pulp into our mills is mostly done by rail and trucks although barges are used in certain circumstances. We rely strictly on third parties for the transportation of our pulp and paper products between our mills, converting operations, distribution centers and customers. Our paper products are shipped mostly by truck, and logistics are managed centrally in collaboration with each location. Our pulp is either shipped by vessel, rail or truck. We work with all the major railroads and approximately 300 trucking companies in the United States and Canada. The length of our carrier contracts are generally from one to three years. We pay diesel fuel surcharges which vary depending on market conditions, and the cost of diesel fuel.
During 2012, outbound transportation costs relating to our Pulp and Paper segment comprised approximately 11% of the total consolidated cost of sales.
Our Product Offering and Go-to-Market Strategy
Our uncoated freesheet papers are used for communication and specialty and packaging papers. Communication papers are further categorized into business and commercial printing and publishing and converting and specialty applications.
BusinessOurbusiness papers include copy and electronic imaging papers, which are used with ink jet and laser printers, photocopiers and plain-paper fax machines, as well as computer papers, preprinted forms and digital papers. These products are primarily for office and home use. Business papers accounted for approximately 46%45% of our shipments of paper products in 2010.2012.
Ourcommercial printing and publishing papers include uncoated freesheet papers, such as offset papers and opaques. These uncoated freesheet grades are used in sheet and roll fed offset presses across the spectrum of commercial printing end-uses, including digital printing. Our publishing papers include tradebook and lightweight uncoated papers used primarily in book publishing applications such as textbooks, dictionaries, catalogs, magazines, hard cover novels and financial documents. Design papers, a sub-group of commercial printing and publishing papers, have distinct features of color, brightness and texture and are targeted towards graphic artists, design and advertising agencies, primarily for special brochures and annual reports. Commercial printing and publishing papers accounted for approximately 27% of our shipments of paperThese products in 2010.
We also produce paper for several converting and specialty markets. These converting and specialty papers consist primarily ofinclude base papers that are converted into finished products, such as envelopes, tablets, business forms and data processing/computer formsforms. Commercial printing and base stock used by the flexible packaging industry in the production of food and medical packaging and other specialty papers for various other industrial applications, including base stock for sandpaper, base stock for medical gowns, drapes and packaging, as well as transfer paper for printing processes. We also participate in several converting grades for specialty and security applications. These converting and specialtypublishing papers accounted for approximately 27%40% of our shipments of paper products in 2010.2012.
We also produce paper for severalspecialty and packaging markets. These products consist primarily of base stock for thermal printing, flexible packaging, food packaging, medical gowns and drapes, sandpapers backing, carbonless printing, labels and other coating and laminating applications. We also manufacture papers for industrial and specialty applications including carrier papers, treated papers, security papers and specialized printing and converting applications. These specialty and packaging papers accounted for approximately 15% of our shipments of paper products in 2012. These grades of papers require a certain amount of innovation and agility in the manufacturing system.
The chart below illustrates our main paper products and their applications.
| Communication Papers | Specialty and Packaging Papers | |||||||||
Category | Business Papers | Commercial Printing and |
| |||||||
Type | Uncoated Freesheet | Uncoated Freesheet | ||||||||
Grade | Copy | Premium imaging Technology papers | Offset Colors Index Tag Bristol | Opaques Premium opaques Lightweight Tradebook |
Imaging papers Label papers Medical disposables | |||||
Application | Photocopies Office documents Presentations | Presentations Reports | Commercial
Direct mail Pamphlets Brochures Cards Posters | Stationery Brochures Annual reports Books Catalogs, Forms & Envelopes |
Food & candy packaging
Check and security papers Surgical gowns | |||||
Our customer service personnel work closely with sales, marketing and production staff to provide service and support to merchants, converters, end-users, stationers, printers and retailers. We promote our products directly to end-users and others who influence paper purchasing decisions in order to enhance brand recognition and increase product demand. In addition, our sales representatives work closely with mill-based new product development personnel and undertake joint marketing initiatives with customers in order to better understand their businesses and needs and to support their future requirements.
We sell business papers primarily to paper stationers, merchants, office equipment manufacturers stationers and retail outlets. We distribute uncoated commercial printing and publishing papers to end-users and commercial printers, mainly through paper merchants, as well as selling directly to converters. We sell our convertingspecialty and specialty productspackaging papers mainly to converters, who apply a further production process such as coating, laminating, folding or waxing to our papers before selling them to a variety of specialized end-users. We distributed approximately 37%33% of our paper products in 20102012 through a large network of paper merchants operating throughout North America, one of which we own (see “—Paper Merchants”“Distribution”). Paper merchants,Distributors, who sell our products to their own customers, representrepresents our largest group of customers.
The chart below illustrates our channels of distribution for our paper products.
| Communication Papers | Specialty and Packaging Papers | |||||||||||||
Category | Business Papers | Commercial Printing and Publishing Papers | ||||||||||||
Domtar sells to: | Merchants i | Office Equipment Manufacturers /Stationers i | Retailers i | Merchants i | Converters i | End-Users | Converters i | |||||||
Customer sells to: |
End-users |
End-users | End-users | Converters/ End-users | Merchants/ Retailers | End-users | ||||||||
We sell market pulp to customers in North America mainly through a North American sales force while sales to most overseas customers are made directly or through commission agents. We maintain pulp supplies at strategically located warehouses, which allow us to respond to orders on short notice. In 2010,2012, approximately 32% of our sales of market pulp were domestic, 6%11% were in Canada and 62%57% were in other countries.
Our ten largest customers represented approximately 50%39% of our 2010 Papers2012 Pulp and Paper segment sales or 42%32% of our total sales in 2010.2012. In 2010, none2012, Staples, one of our customers of our Pulp and Paper segment represented more than 10%approximately 11% of our total sales. The majority of our customers purchase products through individual purchase orders. In 2010,2012, approximately 74%79% of our PapersPulp and Paper segment sales were domestic, 10% were in Canada, and 16%11% were in other countries.
Transportation
Transportation of raw materials, wood fiber, chemicals and pulp to our mills is mostly done by rail although trucks are used in certain circumstances. We rely strictly on third parties for the transportation of our pulp and paper products between our mills, converting operations, distribution centers and customers. Our paper products are shipped mostly by truck, and logistics are managed centrally in collaboration with each location. Our pulp is either shipped by vessel, rail or truck. We work with all major railroads and truck companies in the U.S. and Canada. The length of our carrier contracts are generally from one to three years. We pay diesel fuel surcharges which vary depending on market conditions, but are mostly tied to the cost of diesel fuel.
During 2010, outbound transportation costs relating to our Papers segment comprised approximately 10% of the total cost of sales.
Our Operations
Our Paper MerchantsDistribution business involves the purchasing, warehousing, sale and distribution of our various products and those of other manufacturers. ProductsThese products include business, printing and publishing papers and certain industrialpackaging products. These products are sold to a wide and diverse customer base, which includes small, medium and large commercial printers, publishers, quick copy firms, catalog and retail companies and institutional entities.
Our Paper Merchants operateDistribution business operates in the United States and Canada under a single banner and umbrella name, Ariva.Ariva®. Ariva operates throughout the Northeast, Mid-Atlantic and Midwest areas from 1816 locations in the United States, including 1412 distribution centers serving customers across North America. The Canadian business operates in threetwo locations in Ontario; inOntario, two locations in Quebec; and from two locations in Atlantic Canada.
Sales are executed by our sales force, based at branches strategically located in served markets. We distribute about 52% of our paper sales from our own warehouse distribution system and about 48% of our paper sales through mill-direct deliveries (i.e., deliveries directly from manufacturers, including ourselves, to our customers).
The table below lists all of our Ariva locations.
Eastern Region |
| Ontario, Canada | Quebec, Canada | Atlantic Canada | ||||
Albany, New York | Cincinnati, Ohio | Montreal, Quebec | Halifax, Nova Scotia | |||||
Boston, Massachusetts | Cleveland, Ohio | Quebec City, Quebec | Mount Pearl, Newfoundland | |||||
Harrisburg, Pennsylvania | Columbus, Ohio | |||||||
Hartford, Connecticut | Covington, Kentucky | |||||||
Lancaster, Pennsylvania | Dayton, Ohio | |||||||
New York, New York | ||||||||
Philadelphia, Pennsylvania | ||||||||
Southport, Connecticut | ||||||||
Washington, |
Our Raw Materials
The distributionDistribution business sells annually approximately 0.70.5 million tons of paper, forms and industrial/packaging products from over 60 suppliers located around the world. Domtar products represent approximately 31%30% of the total.
Our Product Offering and Go-to-Market Strategy
Our product offerings address a broad range of printing, publishing, imaging, advertising, consumer and industrial needs and are comprised of uncoated, coated and specialized papers and industrialpackaging products. Our go-to-market strategy is to serve numerous segments of the commercial printing, publishing, retail, wholesale, catalog and industrial markets with logistics and services tailored to the needs of our customers. In 2010,2012, approximately 68%61% of our sales were made in the United States and 32%39% were made in Canada.
OUR COMPETITIVE STRENGTHSPERSONAL CARE
We believe that
Our Operations
Our Personal Care business sells and manufactures adult incontinence products and distributes disposable washcloths marketed primarily under the Attends® brand name. During 2012, we acquired Attends Europe, a manufacturer and supplier of adult incontinence care products in Northern Europe, consolidating our competitive strengths provide a solid foundation forownership of the executionAttends brand on both sides of our business strategy:
Leading market position.the Atlantic. We are one of the largest integrated manufacturer and marketerleading suppliers of uncoated freesheet paper inadult incontinence products sold into North America and the second largestNorthern Europe, selling to hospitals (acute care) and nursing homes (long-term care) and we have a growing presence in the homecare and retail channels.
We operate two manufacturing facilities, with each having the ability to produce multiple product categories. We also have a research and development facility and production lines which manufacture high quality airlaid and ultrathin laminated absorbent cores.
Attends operates in the United States and in Europe:
Greenville, North Carolina: R&D, manufacturing and distribution
Aneby, Sweden: R&D, manufacturing and distribution
Jesup, Georgia: R&D, manufacturing and distribution
Our Industry Dynamics
Aging population
We compete in an industry with fundamental drivers for long-term growth. The aging population suggests that adult incontinence will become much more prevalent over the next several decades, as baby boomers enter their senior years and medical advances continue to extend the average lifespan. As an example, the National Association for Continence (“NAFC”) estimates that 10,000 Americans are turning 65 years old every day, or 3.65 million people per year. By the year 2030, approximately 71 million Americans are estimated to be 65 years old or older, representing over 20% of the U.S. population. It is estimated that approximately 5% of the world population, or 340 million individuals, is incontinent. After age 65, nearly one in three people are estimated to suffer from incontinence.
Increased healthcare spending
We are expected to benefit from the overall increase in national healthcare spending, which is due to an aging population and is aided by the recent federal legislative expansion of health insurance coverage, in the United States. Spending will likely increase at an even faster rate as health insurance coverage is expanded and the number of insured patients with the improved ability to access healthcare products and services increases. Growing healthcare expenditures are expected to spur an increase in spending within each of the channels served by Attends.
Our Raw Materials
The primary raw materials used in our manufacturing process are nonwovens, fluff pulp, super absorbent polymers, polypropylene film, elastics, adhesives and packaging materials that are purchased on a central basis with contracts varying between one and five years. Most contracts have prices that fluctuate based on production capacity. This leadingprevailing market position provides us with key competitive advantages, including economies of scale, wider salesconditions.
Our Product Offering and marketing coverageGo-to-Market Strategy
Our products, which include branded and a broad product offering of business, printingprivate label briefs, protective underwear, underpads, pads and publishing and converting and specialty paper grades.
Efficient and cost-competitive assets. Our network of world-class assets allows us to be a low-cost producer of high volume papers and an efficient producer of value-added specialty papers. Our five largest mills focus on the production of high volume copy and offset papers while production at our other mills focuses on value-added paper products where quality, flexibility and servicewashcloths, are key factors. Most of our paper is produced at mills with integrated pulp production and cogeneration facilities, reducing our exposure to price volatility for purchased pulp and energy.
Proximity to customers. We have a broad manufacturing footprint supported by a network of converting and distribution operations located across North America. This proximity to customers provides opportunities for direct and enhanced customer service and minimizes freight distances, response time and delivery cost. These constitute key competitive advantages, particularlyavailable in the high volume copy and offset paper grades market segment. Customer proximity also allows for just-in-time delivery of high demand paper products in less than 48 hours to most major North American markets.
Strong franchise with customer-focused solutions. We sell paper to multiple market segments through a variety of channels, including paper merchants, converters, retail companiessizes, as well as with differing performance levels and publishers throughout North America. In addition,product attributes. Our broad product portfolio covers most price points across each product category.
We serve four channels: acute care, long-term care, homecare, and retail. Through the utilization of our flexible production platform, manufacturing expertise and efficient supply chain management, we are able to provide a complete and high-quality line of branded and unbranded products to customers across all channels. We maintain a strong market presence through our ownershipdirect sales organization in the United States, Canada and nine Northern European countries.
Our Product Development
We currently offer a comprehensive, full suite of Ariva. We willproducts, and we continue to buildfocus on product development to produce even more effective products for our positions by maximizing our strengths with centralized planning capabilitycustomers. We continue to explore materials and supply-chain management solutions.
High quality products with strong brand recognition. We enjoy a strong reputation for producing high quality paper products and market some of the most recognized and preferred papers in North America, including a wide range of business and commercial printing paper brands, such as Cougar®, Lynx® Opaque Ultra, Husky® Opaque Offset, First Choice®, and Domtar EarthChoice® Office Paper, part of a family of Forest Stewardship Council™ (FSC®) certified, environmentally and socially responsible paper.
Experienced management team. Our management team has significant experience and a record of success in the pulp and paper industry. We believe our employees’ expertise and know-how not only support the management team but help create operational efficiencies and enableprocesses that will allow us to deliver improved profitability from our manufacturing operations.manufacture products that absorb wetness quickly, while providing industry leading skin-dryness and superior containment.
OUR STRATEGIC INITIATIVES AND FINANCIAL PRIORITIES
WeAs a leading innovative fiber-based technology company, we strive to be recognized as the supplier of choice for branded and customer branded pulp and paper products in North Americaour customers, to be a core investment for our shareholders and to be recognized as leadersan industry leader in sustainabilitysustainability. We have three unwavering business objectives: (1) to grow and find ways to become less vulnerable to the manufacturesecular decline in communication paper demand, (2) to reduce volatility in our earnings profile by increasing the visibility and predictability of fiber-based products. our cash flows, and (3) to create value over time by ensuring that we maximize the strategic and operational use of our capital.
To achieve this goal and to create shareholder value,these goals, we have established the following business strategies:
Build customer loyaltyPerform: Drive performance in everything we do, focusing on customers, costs and cash. We are determined to operate our assets efficiently and to ensure we balance our production with our customer demand. We are building on the successful relationships that we have developed with key customers to support their businesses and to provide inventory reduction solutions through just-in-time delivery for the most-demanded products. We believe that we are a supplier of choice for customers who seek competitively-priced pulp and paper products and services.
Focus on generating free cash flow and maintaining financial discipline.We believe efficiently operated assets and carefully managed manufacturing costs are key to creating shareholder value.demand in papers. To generate free cash flow, we are focused on assigning our capital expenditures effectively and minimizing working capital requirements by reducing discretionary spending, reviewing procurement costs and pursuingrequirements. We apply prudent financial management policies to retain the balancing of production and inventory control.flexibility needed to successfully execute on our strategic roadmap.
LeverageGrow: To counteract the secular demand decline in our expertise to tap into growth opportunities. In order tocommunication paper products and sustain the success of our company, we believe that we must leverage our core competencies and expertise as operators of large scale operations in fiber sourcing and our expertise in the manufacturemarketing, manufacturing and distribution of fiber-based products and fiber sourcing.products. We are focused on optimizing and expanding our operations in markets with positive demand dynamics through the repurposing of assets, through investments to helporganically grow our business and counteract secular demand decline in our core North American fine paper business.or through strategic acquisitions.
Operate inBreak Out: Through agility and innovation, move from a responsible way. Customers, end-users, and all stakeholders in communities where we operate seek assurancespaper to a fiber-centric organization by seeking opportunities to break out from thetraditional pulp and paper industry that resources are managedmaking. We continue to explore opportunities to invest in a sustainable manner. We striveinnovative fiber-based technologies to provide these assurances by certifyingbring our manufacturingbusiness in new directions and distribution operations, namely with FSC chain-of-custody standards,leverage our expertise and our assets to extract the maximum value for the wood fiber we intend to haveconsume in our environmental management systems third-party verified against internationally recognized standards.operations.
Continue to growGrow our line of environmentally and ethically responsible papers.products: We believe we are delivering improvedbest-in-class service to customers through a broad range of product offerings and greater access to volume.certified products. The development of EarthChoice®, our line of environmentally and socially responsible paper, is providing a platform upon which to expand our offering to customers. The EarthChoice®This product line of papers, a product lineis supported by leading environmental groups and offers customers the solutions and peace of mind through the use of a combination of FSCForest Stewardship Council® (FSC®) virgin fiber and recycled fiber. FSC is
Operate in a responsible way: We try to make a positive difference every day by pursuing sustainable growth, valuing relationships, and responsibly managing our resources. We care for our customers, end-users and stakeholders in the communities where we operate, all seeking assurances that resources are managed in a sustainable manner. We strive to provide these assurances by certifying our distribution and manufacturing operations and measuring our performance against internationally recognized benchmarks. We are committed to the responsible use of forest resources across our operations and we are enrolled in programs and initiatives to encourage landowners engaged towards certification recognized by environmental groups as the most stringentto improve their market access and is third-party audited.increase their revenue opportunities.
The markets in which our businesses operate are highly competitive with well-established domestic and foreign manufacturers.
In the paper business, our paper production does not rely on proprietary processes or formulas, except in highly specialized papers or customized products. In order to gain market share in uncoated freesheet, we compete primarily on the basis of product quality, breadth of offering, service solutions and competitively priced paper products. We seek product differentiation through an extensive offering of high quality FSC-certified paper products. While we have a leading position in the North American uncoated freesheet market, we also compete with other paper grades, including coated freesheet, and with electronic transmission and document storage alternatives. As the use of these alternative products continues to grow, we continue to see a decrease in the overall demand for paper products or shifts from one type of paper to another. All of our pulp and paper manufacturing facilities are located in the United States or in Canada where we sell 84%89% of our products. The five largest manufacturers of uncoated freesheet papers in North America represent approximately 80% of the total production capacity. On a global basis, there are hundreds of manufacturers that produce and sell uncoated freesheet papers, eight of which have annual production capacities of over 1 million tons.papers. The level of competitive pressures from foreign producers in the North American market is highly dependent upon exchange rates, including the rate between the U.S. dollar and the Euro as well as the U.S. dollar and the Brazilian real.
The market pulp we sell is either fluff, softwood fluff pulp, or hardwood.hardwood pulp. The pulp market is highly fragmented with many manufacturers competing worldwide, some of whom have lower operating costs than we do.worldwide. Competition is primarily on the basis of access to low-cost wood fiber, product quality and competitively priced pulp products. The fluff pulp we sell is used in absorbent products, incontinence products, diapers and feminine hygiene products. The softwood and hardwood pulp we sell is primarily slow growth northern bleached softwood and hardwood kraft, and we produce specialty engineered pulp grades with a pre-determined mix of wood species. Our hardwood and softwood pulps are sold to a combination of “paper grade” customers who make printing and writing grades, and “non-paper grade”
customers who make a variety of products for specialty paper, packaging, tissue and industrial applications.applications, and customers who make printing and writing grades. We also seek product differentiation through the certification of our pulp mills to the FSC chain-of-custody standard and the procurement of FSC-certified virgin fiber. All of our market pulp production capacity is located in the United States or in Canada, and we sell 62%57% of our pulp to other countries.
In the adult incontinence business in North America, the top 5 manufacturers supply approximately 90% of the market share and have done so for at least the last 10 years. Competition is along the line of four major product categories—protective underwear, light pads, briefs and underpads with customers split between retail and institutional channels. The retail channel has the majority of sales concentrated in mass marketers and drug stores. The institutional channel includes extended care (long term care and homecare) and acute care facilities. In the adult incontinence business in Europe, we compete in the Western, Northern and Central Europe markets where the top 5 manufacturers supply approximately 80% to the healthcare channel and 99% of the retail channel. Competition is along the line of four major product categories: pads, pull-ons, briefs and underpads, with customers mostly split between mass retail, prescription and closed contract. The mass retail market is more fragmented than in North American markets with a mix of larger chains and smaller players. Approximately 70% of institutional and homecare expenditures are funded by local governments in Western Europe. In the adult incontinence business, the principal methods and elements of competition include brand recognition and loyalty, product innovation, quality and performance, price and marketing and distribution capabilities.
We have over 8,5009,300 employees, of which approximately 66%63% are employed in the United States, 31% in Canada, 5% in Europe and 34%1% in Canada.Asia. Approximately 59%53% of our employees are covered by collective bargaining agreements, generally on a facility-by-facility basis, certain of which expiredbasis. Certain agreements covering approximately 674 employees will expire in 20102013 and someothers will expire between 20112014 and 2015.
In 2008, we signed a four year umbrella agreement with the United Steelworkers Union, affecting approximately 3,000 employees at our U.S. locations. This agreement only covers certain economic elements, and all other contract issues will be negotiated at each operating location, as the related collective bargaining agreements become subject to renewal. The parties have agreed not to strike or lock-out during the terms of the respective local agreements.2017.
OUR APPROACH TO SUSTAINABILITY
Domtar delivers a higher, lasting value to our customers, employees, shareholders and communities by viewing our business decisions within the larger context of sustainability. As a renewable fiber-based company,
we take the long-term view on managing natural resources for the future. We adopted our Statement on Sustainable Growthprize efficiency in everything we do. We strive to govern our pathway to sustainability, from excellence in corporateminimize waste and encourage recycling. We have the highest standards for ethical standards to product stewardship. Consistently with our Statement, we define our actions under our Code of Ethics, policies addressingconduct, for caring about the health and safety environment, forestryof each other, and for maintaining the environmental quality in the communities where we live and work. We value the partnerships we have formed with non-governmental organizations and believe they make us a better company, even if we do not always agree on every issue. We pay attention to being agile to respond to new opportunities, and we are focused in order to turn innovation into value creation. By embracing sustainability as our operating philosophy, we seek to internalize the fact that the choices we have and the impact of the decisions we make on our stakeholders are all interconnected. Further, we believe that our business and the people and communities who depend upon us are better served as we weave this focus on sustainability into the things we do.
Domtar effects this commitment to sustainability at every level and every location across the company. With the support of the Board of Directors, our Management Committee empowers senior managers from manufacturing, technology, finance, sales and marketing and corporate staff functions to regularly come together and establish key sustainability performance metrics, and to routinely assess and report on progress. In 2011, Domtar decided to establish a new, vice-president position to help lead this effort, allowing the company’s organizational structure to better reflect the priority focus the company places on sustainable performance. At the same time, recognizing that the promise of sustainability is only achieved if it is woven into the fiber procurementof an organization, Domtar is committed to establishing EarthChoice Ambassadors—sustainability leaders and others.advocates—in every one of the company’s locations. We believe that weaving sustainability into our business positions Domtar for the future.
Our business is subject to a wide range of general and industry-specific laws and regulations in the United States and Canadaother countries were we have operations, relating to the protection of the environment, including those governing harvesting, air emissions, climate change, waste water discharges, the storage, management and disposal of hazardous substances and wastes, contaminated sites, landfill operation and closure obligations and health and safety matters. Compliance with these laws and regulations is a significant factor in the operation of our business. We may encounter situations in which our operations fail to maintain full compliance with applicable environmental requirements, possibly leading to civil or criminal fines, penalties or enforcement actions, including those that could result in governmental or judicial orders that stop or interrupt our operations or require us to take corrective measures at substantial costs, such as the installation of additional pollution control equipment or other remedial actions.
Compliance with U.S. federal, state and local and Canadian federal and provincial environmental laws and regulations involves capital expenditures as well as additional operating costs. For example, in December 2012, the United States Environmental Protection Agency will be promulgating regulations addressing the emissionsproposed a new set of hazardous air pollutants fromstandards related to all industrial boilers, including those present at pulp and paper mills, which will require the use of maximum achievable control technology.mills. Additional information regarding environmental matters is included in Part I, Item 3, Legal Proceedings, under the caption “Climate change regulation” and in Part II, Item 7, Management’s Discussion and Analysis of Financial Condition and Results of Operations of this Annual Report on Form 10-K, under the section of Critical accounting policies, caption “Environmental matters and other asset retirement obligations.”
Many of our brand name paper products are protected by registered trademarks. Our key trademarks include Cougar®, Lynx® Opaque Ultra, Husky® Opaque Offset, First Choice®, Domtar EarthChoice®, Attends®, NovaThin®, NovaZorb® and Domtar EarthChoiceAriva®. These brand names and trademarks are important to the business. Our numerous trademarks have been registered in the
United States and/or in other countries where our products are sold. The current registrations of these trademarks are effective for various periods of time. These trademarks may be renewed periodically, provided that we, as the registered owner, and/or licensee comply with all applicable renewal requirements, including the continued use of the trademarks in connection with similar goods.
We own U.S. and foreign patents, some of which have expired or been abandoned, and have several pending patent applications. Our management regards these patents and patent applications as important but does not consider any single patent or group of patents to be materially important to our business as a whole.
INTERNET AVAILABILITY OF INFORMATION
In this Annual Report on Form 10-K, we incorporate by reference certain information contained in other documents filed with the Securities and Exchange Commission (“SEC”) and we refer you to such information. We file annual, quarterly and current reports and other information with the SEC. You may read and copy any materials we file with the SEC at the SEC’s Public Reference Room at 100F Street, NE, Washington DC, 20549. You may obtain information on the operation of the Public Reference Room by calling 1-800-SEC-0330. The SEC maintains a website at www.sec.gov that contains our quarterly and current reports, proxy and information statements, and other information we file electronically with the SEC. You may also access, free of charge, our reports filed with the SEC through our website. Reports filed or furnished to the SEC will be available through our website as soon as reasonably practicable after they are filed or furnished to the SEC. The information contained on our website, www.domtar.com, is not, and should in no way be construed as, a part of this or any other report that we filed with or furnished to the SEC.
John D. Williams,age 56,58, has been president, chief executive officer and a director of the Company since January 1, 2009. Previously, Mr. Williams served as president of SCA Packaging Europe between 2005 and 2008. Prior to assuming his leadership position with SCA Packaging Europe, Mr. Williams held increasingly senior management and operational roles in the packaging business and related industries.
Melissa Anderson, age 46,48, is the senior vice-president, human resources of the Company. Ms. Anderson joined Domtar in January 2010. Previously, she was senior vice-president, human resources and government relations, at The Pantry, Inc., an independently operated convenience store chain in the southeastern United States. Prior to this, she held senior management positions with International Business Machine (“IBM”) over the span of 1719 years.
Daniel Buron, age 47,49, is the senior vice-president and chief financial officer of the Company. Mr. Buron was senior vice-president and chief financial officer of Domtar Inc. since May 2004. He joined Domtar Inc. in 1999. Prior to May 2004, he was vice-president, finance, pulp and paper sales division and, prior to September 2002, he was vice-president and controller. He has over 2224 years of experience in finance.
Michael Edwards, age 63,65, is the senior vice-president, pulp and paper manufacturing of the Company. Mr. Edwards was vice-president, fine paper manufacturing of Weyerhaeuser since 2002. Since joining Weyerhaeuser in 1994, he has held various management positions in the pulp and paper operations. Prior to Weyerhaeuser, Mr. Edwards worked at Domtar Inc. for 11 years. His career in the pulp and paper industry spans over 4749 years.
Michael Fagan, age 51, is the senior vice-president, personal care of the Company. Mr. Fagan joined Domtar in 2011, following the acquisition of Attends Healthcare Products, Inc. Mr. Fagan has been with Attends since 1999, when he was hired as Senior Vice President of Sales and Marketing. He was promoted to President and CEO in 2006. Prior to joining Attends, Mr. Fagan held a variety of sales development roles with Procter & Gamble, the previous owners of the Attends line of products.
Zygmunt Jablonski, age 57,59, is the senior vice-president, law and corporate affairs of the Company. Mr. Jablonski joined Domtar in 2008, after serving in various in-house counsel positions for major manufacturing and distribution companies in the paper industry for 13 years—most recently, as executive vice-president, general counsel and secretary.years. From 1985 to 1994, he practiced law in Washington, DC.
Patrick Loulou, age 44, is the senior vice-president, corporate development since he joined the Company in March 2007. Previously, he held a number of positions in the telecommunications sector as well as in management consulting. He has over 14 years of experience in corporate strategy and business development.
Mark Ushpol, age 47,49, is the senior vice-president, distribution of the Company. Mr. Ushpol joined Domtar in January 2010. Previously, he was sales and marketing director of Mondi Europe & International Uncoated Fine Paper, where he was in charge of global uncoated fine paper sales. He has over 2123 years of experience in senior marketing and sales management with the last 1416 years in the pulp and paper sector. Prior to that, he was involved in the plastics industry in South Africa for 8 years.
Patrick Loulou, age 42, is the senior vice-president, corporate development since he joined the Company in March 2007. Previously, he held a number of positions in the telecommunications sector as well as in management consulting. He has over 12 years experience in corporate strategy and business development.
Richard L. Thomas, age 57,59, is the senior vice-president, sales and marketing of the Company. Mr. Thomas was vice-president of fine papers of Weyerhaeuser since 2005. Prior to 2005, he was vice-president, business papers of Weyerhaeuser. Mr. Thomas joined Weyerhaeuser in 2002 when Willamette Industries, Inc. was acquired by Weyerhaeuser. At Willamette, he held various management positions in operations since joining in 1992. Previously, he was with Champion International Corporation for 12 years.
The information included in this Annual Report on Form 10-K may contain forward-looking statements relating to trends in, or representing management’s beliefs about, Domtar Corporation’s future growth, results of operations, performance and business prospects and opportunities. These forward-looking statements are generally denoted by the use of words such as “anticipate,” “believe,” “expect,” “intend,” “aim,” “target,” “plan,” “continue,” “estimate,” “project,” “may,” “will,” “should” and similar expressions. These statements reflect management’s current beliefs and are based on information currently available to management. Forward-looking statements are necessarily based upon a number of estimates and assumptions that, while considered reasonable by management, are inherently subject to known and unknown risks and uncertainties and other factors that could cause actual results to differ materially from historical results or those anticipated. Accordingly, no assurances can be given that any of the events anticipated by the forward-looking statements will occur, or if any occurs, what effect they will have on Domtar Corporation’s results of operations or financial condition. These factors include, but are not limited to:
conditionscontinued decline in the global capital and credit markets, and the economy generally, particularlyusage of fine paper products in the U.S. and Canada;our core North American market;
market demand for Domtar Corporation’s products;our ability to implement our business diversification initiatives, including strategic acquisitions;
product selling prices;
raw material prices, including wood fiber, chemical and energy;
conditions in the global capital and credit markets, and the economy generally, particularly in the U.S. and Canada;
performance of Domtar Corporation’s manufacturing operations, including unexpected maintenance requirements;
the level of competition from domestic and foreign producers;
the effect of, or change in, forestry, land use, environmental and other governmental regulations (including tax), and accounting regulations;
the effect of weather and the risk of loss from fires, floods, windstorms, hurricanes and other natural disasters;
transportation costs;
the loss of current customers or the inability to obtain new customers;
legal proceedings;
changes in asset valuations, including write downs of property, plant and equipment, inventory, accounts receivable or other assets for impairment or other reasons;
changes in currency exchange rates, particularly the relative value of the U.S. dollar to the Canadian dollar;
the effect of timing of retirements and changes in the market price of Domtar Corporation’s common stock on charges for stock-based compensation;
performance of pension fund investments and related derivatives, if any; and
the other factors described under “Risk Factors,” in itemPart I, Item 1A of this Annual Report on Form 10-K.
You are cautioned not to unduly rely on such forward-looking statements, which speak only as of the date made, when evaluating the information presented in this Annual Report on Form 10-K. Unless specifically required by law, Domtar Corporation assumes no obligation to update or revise these forward-looking statements to reflect new events or circumstances.
| ITEM 1A. | RISK FACTORS |
You should carefully consider the risks described below in addition to the other information presented in this Annual Report on Form 10-K.
RISKS RELATING TO THE INDUSTRYINDUSTRIES AND BUSINESSES OF THE COMPANY
Some of theThe Company’s paper products are vulnerable to long-term declines in demand due to competing technologies or materials.
The Company’s paper business competes with electronic transmission and document storage alternatives, as well as with paper grades it does not produce, such as uncoated groundwood. As a result of such competition, the Company is experiencing on-going decreasing demand for most of its existing paper products. As the use of these alternatives grows, demand for paper products is likely to further decline. Declines in demand for our paper products may adversely affect the Company’s business, results of operations and financial position.
Failure to successfully implement ourthe Company business diversification initiatives could have a material adverse affect on ourits business, financial results or conditioncondition.
We areThe Company is pursuing strategic initiatives that management considers important to our long-term success including,success. The most recent initiatives include, but are not limited to, optimizingthe acquisitions in adult incontinence business and expanding our operations in markets with positive demand dynamicsthe conversion of a commodity paper mill to produce lighter basis weight specialty paper. The intent of these initiatives is to help grow ourthe business and counteract the secular demand decline in our core North American paper business. These initiatives may involve organic growth, select joint ventures and strategic acquisitions. The success of these initiatives will depend, among other things, on our ability to identify potential strategic initiatives, understand the key trends and principal drivers affecting businesses to be acquired and to execute the initiatives in a cost effective manner. There are significant risks involved with the execution of these initiatives, including significant business, economic and competitive uncertainties, many of which are outside of our control.
Strategic acquisitions may expose us to additional risks. We may have to compete for acquisition targets and any acquisitions we make may fail to accomplish our strategic objectives or may not perform as expected. In addition, the costs of integrating an acquired business may exceed our estimates and may take significant time and attention from senior management. Accordingly, we cannot predict whether we will succeed in implementing these strategic initiatives. If we fail to successfully diversify our business, it may have a material adverse effect on our competitive position, financial condition and operating results.
The pulp and paper industry is highly cyclical. Fluctuations in the prices of and the demand for the Company’s pulp and paper products could result in lower sales volumes and smaller profit margins.
The pulp and paper industry is highly cyclical. Historically, economic and market shifts, fluctuations in capacity and changes in foreign currency exchange rates have created cyclical changes in prices, sales volume and margins for the Company’s pulp and paper products. The length and magnitude of industry cycles have
varied over time and by product, but generally reflect changes in macroeconomic conditions and levels of industry capacity. Most of the Company’s paper products are commodities that are widely available from other producers. Even the Company’s non-commodity products, such as value-added papers, are susceptible to commodity dynamics. Because commodity products have few distinguishing qualities from producer to producer, competition for these products is based primarily on price, which is determined by supply relative to demand.
The overall levels of demand for the products the Company manufactures and distributes, and consequently its sales and profitability, reflect fluctuations in levels of end-user demand, which depend in part on general macroeconomic conditions in North America and worldwide, the continuation of the current level of service and cost of postal services, as well as competition from electronic substitution. See—“ConditionsSee “Conditions in the global capital and credit markets, and the economy generally, can adversely affect the Company business, results of operations and financial position” and “Some of the“The Company’s paper products are vulnerable to long-term declines in demand due to competing technologies or materials.” For example, demand for cut-size office paper may fluctuate with levels of white-collar employment.
Industry supply of pulp and paper products is also subject to fluctuation, as changing industry conditions can influence producers to idle or permanently close individual machines or entire mills. Such closures can result in significant cash and/or non-cash charges. In addition, to avoid substantial cash costs in connection with idling or closing a mill, some producers will choose to continue to operate at a loss, sometimes even a cash loss, which could prolong weak pricing environments due to oversupply. Oversupply can also result from producers introducing new capacity in response to favorable short-term pricing trends.
Industry supply of pulp and paper products is also influenced by overseas production capacity, which has grown in recent years and is expected to continue to grow.
As a result, prices for all of the Company’s pulp and paper products are driven by many factors outside of its control, and the Company has little influence over the timing and extent of price changes, which are often volatile. Because market conditions beyond the Company’s control determine the prices for its commodity products, the price for any one or more of these products may fall below its cash production costs, requiring the Company to either incur cash losses on product sales or cease production at one or more of its pulp and paper manufacturing facilities. The Company continuously evaluates potential adjustments to its production capacity, which may include additional closures of machines or entire mills, and the Company could recognize significant cash and/or non-cash charges relating to any such closures in future periods. See Part II, Item 7, Management’s Discussion and Analysis of Financial Condition and Results of Operation, under “Restructuring“Closure and restructuring activities.” Therefore, the Company’s profitability with respect to these products depends on managing its cost structure, particularly wood fiber, chemical and energy costs, which represent the largest components of its operating costs and can fluctuate based upon factors beyond its control, as described below. If the prices of or demand for its pulp and paper products decline, or if its wood fiber, chemical or energy costs increase, or both, its sales and profitability could be materially and adversely affected.
Conditions in the global capital and credit markets and the economy generally, can adversely affect the CompanyCompany’s business, results of operations and financial position.
A significant or prolonged downturn in general economic condition may affect the Company’s sales and profitability. The Company has exposure to counterparties with which we routinely execute transactions. Such counterparties include commercial banks, insurance companies and other financial institutions, some of which may be exposed to bankruptcy or liquidity risks. While the Company has not realized any significant losses to date, a bankruptcy or illiquidity event by one of its significant counterparties may materially and adversely affect the Company’s access to capital, future business and results of operations.
In addition, our customers and suppliers may be adversely affected by severe economic conditions. This could result in reduced demand for our products or our inability to obtain necessary supplies at reasonable costs or at all.
The Company faces intense competition in its markets, and the failure to compete effectively would have a material adverse effect on its business and results of operations.
The Company competes with both U.S. and Canadian producers and, for many of its product lines, global producers, some of which may have greater financial resources and lower production costs than the Company. The principal basis for competition is selling price. The Company’s ability to maintain satisfactory margins depends in large part on its ability to control its costs. The Company cannot provide assurance that it will compete effectively and maintain current levels of sales and profitability. If the Company cannot compete effectively, such failure will have a material adverse effect on its business and results of operations.
The Company’s manufacturingpulp and paper businesses may have difficulty obtaining wood fiber at favorable prices, or at all.
Wood fiber is the principal raw material used by the Company, comprising approximately 20% of the total cost of sales during 2010.2012. Wood fiber is a commodity, and prices historically have been cyclical. The primary source for wood fiber is timber. Environmental litigation and regulatory developments, alternative use for energy production and reduction in harvesting related to the housing market, have caused, and may cause in the future, significant reductions in the amount of timber available for commercial harvest in the United States and Canada. In addition, future domestic or foreign legislation and litigation concerning the use of timberlands, the protection of endangered species, the promotion of forest health and the response to and prevention of catastrophic wildfires could also affect timber supplies. Availability of harvested timber may be further limited by adverse weather, fire, insect infestation, disease, ice storms, wind storms, flooding and other natural and man made causes, thereby reducing supply and increasing prices. Wood fiber pricing is subject to regional market influences, and the Company’s cost of wood fiber may increase in particular regions due to market shifts in those regions. Any sustained increase in wood fiber prices would increase the Company’s operating costs, and the Company may be unable to increase prices for its products in response to increased wood fiber costs due to additional factors affecting the demand or supply of these products.
The Company currently obtainsmeets its wood fiber requirements by purchasing wood fiber from third parties and in part by harvesting timber pursuant to its forest licenses and forest management agreements. If the Company’s cutting rights, pursuant to its forest licenses or forest management agreements are reduced, or any third-party supplier of wood fiber stops selling or is unable to sell wood fiber to the Company, itsour financial condition or results of operations could be materially and adversely affected.
An increase in the cost of the Company’s purchased energy or chemicals would lead to higher manufacturing costs, thereby reducing its margins.
The Company’s operations consume substantial amounts of energy such as electricity, natural gas, fuel oil, coal and hog fuel. Energy comprised approximately 7% of the total cost of sales in 2010. Energy prices, particularly for electricity, natural gas and fuel oil, have been volatile in recent years. As a result, fluctuations in energy prices will impact the Company’s manufacturing costs and contribute to earnings volatility. While the Company purchases substantial portions of its energy under supply contracts, most of these contracts are based on market pricing.
Other raw materials the Company uses include various chemical compounds, such as precipitated calcium carbonate, sodium chlorate and sodium hydroxide, sulfuric acid, dyes, peroxide, methanol and aluminum sulfate. Purchases of chemicals comprised approximately 11% of the total cost of sales in 2010. The costs of these chemicals have been volatile historically, and they are influenced by capacity utilization, energy prices and other factors beyond the Company’s control.
Due to the commodity nature of the Company’s products, the relationship between industry supply and demand for these products, rather than solely changes in the cost of raw materials, will determine the Company’s ability to increase prices. Consequently, the Company may be unable to pass on increases in its operating costs to
its customers. Any sustained increase in chemical or energy prices without any corresponding increase in product pricing would reduce the Company’s operating margins and may have a material adverse effect on its business and results of operations.
The Company depends on third parties for transportation services.
The Company relies primarily on third parties for transportation of the products it manufactures and/or distributes, as well as delivery of its raw materials. In particular, a significant portion of the goods it manufactures and raw materials it uses are transported by railroad or trucks, which are highly regulated. If any of its third-party transportation providers were to fail to deliver the goods the Company manufactures or distributes in a timely manner, the Company may be unable to sell those products at full value, or at all. Similarly, if any of these providers were to fail to deliver raw materials to the Company in a timely manner, it may be unable to manufacture its products in response to customer demand. In addition, if any of these third parties were to cease operations or cease doing business with the Company, it may be unable to replace them at reasonable cost. Any failure of a third-party transportation provider to deliver raw materials or finished products in a timely manner could harm the Company’s reputation, negatively impact its customer relationships and have a material adverse effect on its financial condition and operating results.
The Company could experience disruptions in operations and/or increased labor costs due to labor disputes or restructuring activities.
Employees at 2523 of the Company’s facilities, representing a majority of the Company’s 8,5009,300 employees, are represented by unions through collective bargaining agreements generally on a facility-by-facility basis, certainfacility basis. Certain of which expiredthese agreements will expire in 20102013 and someothers will expire between 20112014 and 2015. Currently, 11 collective bargaining agreements are up for renegotiation2017. As of which only three are currently under negotiation. TheDecember 31, 2012, all unionized employees in the U.S., Canada and Europe were covered by a ratified agreement. In the future, the Company may not be able to negotiate acceptable new collective bargaining agreements, which could result in strikes or work stoppages or other labor disputes by affected workers. Renewal of collective bargaining agreements could also result in higher wages or benefits paid to union members. In addition, labor organizing activities could occur at any of the Company’s facilities. Therefore, the Company could experience a disruption of its operations or higher ongoing labor costs, which could have a material adverse effect on its business and financial condition.
In connection with the Company’s restructuring efforts, the Company has suspended operations at, or closed or announced its intention to close, various facilities and may incur liability with respect to affected employees, which could have a material adverse effect on its business or financial condition. In addition, the Company continues to evaluate potential adjustments to its production capacity, which may include additional closures of machines or entire mills, and the Company could recognize significant cash and/or non-cash charges relating to any such closures in the future.
The pulp and paper mill in Prince Albert was closed in the first quarter of 2006 and has not been operated since. In December 2009, we decided to dismantle the Prince Albert facility. In a grievance relating to the closure of the Prince Albert facility, the union claimed that it was entitled to the accumulated pension benefits during the actual layoff period because, according to the union, a majority of employees still had recall rights during the layoff. Arbitration in this matter was held on February 16 to 18, 2010, and the arbitrator ruled in favor of the Company on August 24, 2010. The arbitrator’s decision is subject to the union’s right to apply for judicial review.
The Company relies heavily on a small number of significant customers, including one customer that represented approximately 9%11% of the Company’s sales in 2010.2012. A loss of any of these significant customers could materially adversely affect the Company’s business, financial condition or results of operations.
The Company heavily relies on a small number of significant customers. The Company’s largest customer, Staples, represented approximately 9%11% of the Company’s sales in 2010.2012. A significant reduction in sales to any of the
Company’s key customers, which could be due to factors outside its control, such as purchasing diversification or financial difficulties experienced by these customers, could materially adversely affect the Company’s business, financial condition or results of operations.
A material disruption at one or more of the Company’s manufacturing facilities could prevent it from meeting customer demand, reduce its sales and/or negatively impact its net income.
Any of the Company’s pulp or paper manufacturing facilities, or any of its machines within an otherwise operational facility, could cease operations unexpectedly due to a number of events, including:
unscheduled maintenance outages;
prolonged power failures;
equipment failure;
chemical spill or release;
explosion of a boiler;
the effect of a drought or reduced rainfall on its water supply;
labor difficulties;
government regulations;
disruptions in the transportation infrastructure, including roads, bridges, railroad tracks and tunnels;
adverse weather, fires, floods, earthquakes, hurricanes or other catastrophes;
terrorism or threats of terrorism; or
other operational problems, including those resulting from the risks described in this section.
Events such as those listed above have resulted in operating losses in the past. Future events may cause shutdowns, which may result in additional downtime and/or cause additional damage to the Company’s facilities. Any such downtime or facility damage could prevent the Company from meeting customer demand for its products and/or require it to make unplanned capital expenditures. If one or more of these machines or facilities were to incur significant downtime, it may have a material adverse effect on the Company financial results and financial position.
The Company’s indebtedness, which is approximately $827 million as of December 31, 2010, could adversely affect its financial condition and impair its ability to operate its business.
As of December 31, 2010, the Company had approximately $827 million of outstanding indebtedness, including $21 million of capital leases and $806 million of unsecured notes.
The Company’s degree of indebtedness could have important consequences to the Company’s financial condition, operating results and business, including the following:
it may limit the Company’s ability to obtain additional debt or equity financing for working capital, capital expenditures, product development, debt service requirements, acquisitions and general corporate or other purposes;
a portion of the Company’s cash flows from operations will be dedicated to payments on its indebtedness and will not be available for other purposes, including operations, capital expenditures and future business opportunities;
the debt service requirements of the Company’s indebtedness could make it more difficult for the Company to satisfy its other obligations;
the Company’s borrowings under the senior secured revolving credit facilities are at variable rates of interest, exposing the Company to increased debt service obligations in the event of increased interest rates;
it may limit the Company’s ability to adjust to changing market conditions and place it at a competitive disadvantage compared to its competitors that have less debt; and
it may increase the Company’s vulnerability to a downturn in general economic conditions or in its business, and may make the Company unable to carry out capital spending that is important to its growth.
In addition, the Company is subject to agreements that require meeting and maintaining certain financial ratios and tests. A significant or prolonged downturn in general business and economic conditions may affect the Company’s ability to comply with these covenants or meet those financial ratios and tests and could require the Company to take action to reduce its debt or to act in a manner contrary to its current business objectives.
A breach of any of the senior secured revolving credit facility or long-term note indenture covenants may result in an event of default under those agreements. This may allow the counterparties to those agreements to declare all amounts outstanding thereunder, together with accrued interest, to be immediately due and payable. If this occurs, the Company may not be able to refinance the indebtedness on favorable terms, or at all, or repay the accelerated indebtedness.
The Company’s operations require substantial capital, and it may not have adequate capital resources to provide for all of its capital requirements.
The Company’s businesses are capital intensive and require that it regularly incur capital expenditures in order to maintain its equipment, increase its operating efficiency and comply with environmental laws. In 2010,2012, the Company’s total capital expenditures were $153$236 million (2009—(2011—$106144 million). In addition, $51 million was spent under the Pulp and Paper Green Transformation Program (2009—nil), which is reimbursed by the Government of Canada.
If the Company’s available cash resources and cash generated from operations are not sufficient to fund its operating needs and capital expenditures, the Company would have to obtain additional funds from borrowings or other available sources or reduce or delay its capital expenditures. The Company may not be able to obtain additional funds on favorable terms, or at all. In addition, the Company’s debt service obligations will reduce its available cash flows. If the Company cannot maintain or upgrade its equipment as it requires or allocate funds to ensure environmental compliance, it could be required to curtail or cease some of its manufacturing operations, or it may become unable to manufacture products that compete effectively in one or more of its product lines.
Despite current indebtedness levels, theThe Company and its subsidiaries may incur substantially more debt. This could further exacerbate theincrease risks associated with its leverage.
The Company and its subsidiaries may incur substantial additional indebtedness in the future. Although the senior secured revolving credit facility contains restrictions on the incurrence of additional indebtedness, including secured indebtedness, these restrictions are subject to a number of qualifications and exceptions, and additional indebtedness incurred in compliance with these restrictions could be substantial. As of December 31, 2010,2012, the Company had no borrowings under the senior secured revolving credit facility and had outstanding letters of credit amounting to $50$12 million under this senior securedits revolving credit facility, resulting in $700$588 million of availability for future drawings under this credit facility. Also, the Company can use securitization of certain receivables to provide additional liquidity to fund its operations. At December 31, 2012 the Company had no borrowings and $38 million of letters of credit outstanding under the securitization program (2011—nil and $28 million), resulting in $112 million of availability for future drawings under this program. Other new borrowings could also be incurred by Domtar Corporation or its subsidiaries. Among other things, the Company could determine to incur additional debt in connection with a strategic acquisition. If the Company incurs additional debt, the risks associated with its leverage would increase.
The Company’s ability to generate the significant amount of cash needed to pay interest and principal on the Domtar CorporationCompany’s unsecured long-term notes and service its other debt and financial obligations and its ability to refinance all or a portion of its indebtedness or obtain additional financing depends on many factors beyond the Company’s control.
TheFor 2012, the Company has considerablehad approximately $116 million in debt service, obligations.including $47 million of tender offer premium. The Company’s ability to make payments on and refinance its debt, including the Domtar CorporationCompany’s unsecured long-term notes and amounts borrowed under its senior secured revolving credit facility, if any, and other financial obligations and to fund its operations will depend on its ability to generate substantial operating cash flow. The Company’s cash flow generation will depend on its future performance, which will be subject to prevailing economic conditions and to financial, business and other factors, many of which are beyond its control.
The Company’s business may not generate sufficient cash flow from operations and future borrowings may not be available to the Company under its senior secured revolving credit facility or otherwise in amounts sufficient to enable the Company to service its indebtedness, including the Domtar CorporationCompany’s unsecured long-term notes, and borrowings, if any, under its senior secured revolving credit facilitiesfacility or to fund its other liquidity needs. If the Company cannot service its debt, the Company will have to take actions such as reducing or delaying capital investments, selling assets, restructuring or refinancing its debt or seeking additional equity capital. Any of these remedies may not be effected on commercially reasonable terms, or at all, and may impede the implementation of its business strategy. Furthermore, the senior secured revolving credit facility may restrict the Company from adopting any of these alternatives. Because of these and other factors that may be beyond its control, the Company may be unable to service its indebtedness.
The Company is affected by changes in currency exchange rates.
The Company manufactures a significant portion of pulphas manufacturing and paperconverting operations in Canada. Sales of these products by the Company’s Canadian operations will be invoiced in U.S. dollars or in Canadian dollars linked to U.S. pricing but most of the costs relating to these products will be incurred in Canadian dollars.United States, Canada, Sweden and China. As a result, any decreaseit is exposed to movements in foreign currency exchange rates in Canada, Europe and Asia. Moreover, certain assets and liabilities are denominated in currencies other than the U.S. dollar and are exposed to foreign currency movements. Therefor, the Company’s earnings are affected by increases or decreases in the value of the U.S. dollar relative to the Canadian dollar will reduce the Company’s profitability.
Exchange rate fluctuations are beyond the Company’s control. From 2003 to 2010, the Canadian dollar had appreciated over 58% relative to the U.S. dollar. In 2010, when compared to 2009, the Canadian dollar increased in value by approximately 5%and of other European and Asian currencies relative to the U.S. dollar. The levelCompany’s Swedish subsidiary is exposed to movements in foreign currency exchange rates on transactions denominated in a different currency than its Euro functional currency. The Company’s risk management policy allows it to hedge a significant portion of its exposure to fluctuations in foreign currency exchange rates for periods up to three years. The Company may use derivative instruments (currency options and foreign exchange forward contracts) to mitigate its exposure to fluctuations in foreign currency exchange rates or to designate them as hedging instruments in order to hedge the subsidiary’s cash flow risk for purposes of the Canadian dollarconsolidated financial statements. There can have a material adverse effect onbe no assurance that the sales and profitability ofCompany will be protected against substantial foreign currency fluctuations. This factor could adversely affect the Canadian operations.Company’s financial results.
The Company has liabilities with respect to its pension plans and the actual cost of its pension plan obligations could exceed current provisions. As of December 31, 2010,2012, the Company’s defined benefit plans had a surplus of $36$42 million on certain plans and a deficit of $100$189million on others on an ongoing basis.others.
The Company’s future funding obligations for theits defined benefit pension plans depend upon changes to the level of benefits provided by the plans, the future performance of assets set aside in trusts for these plans, the level of interest rates used to determine minimum funding levels, actuarial data and experience, and any changes in government laws and regulations. As of December 31, 2010,2012, the Company’s Canadian defined benefit pension plans held assets with a fair value of $1,380$1,505 million (CDN $1,372$1,497 million), including a fair value of $214$213 million (CDN $213$211 million) of restructured asset backed notes (“ABN”) (formerly asset backed commercial paper (“ABCP”)).
Most of the ABCPABN investments were subject to restructuring (under the court order governing the Montreal Accord that was completed in January 2009) while the remainder is in conduits restructured outside the Montreal Accord or subject to litigation between the sponsor and the credit counterparty.
At December 31, 2010,2012, the Company determined that the fair value of these ABCPABN investments was $214$213 million (CDN $213$211 million) (2009—
(2011—$205 million (CDN $214$208 million)). Possible changes that could have a material effect on the future value of the ABCPABN include (1) changes in the value of the underlying assets and the related derivatives transaction,derivative transactions, (2) developments related to the liquidity of the ABCPABN market, and (3) a severe and prolonged economic slowdown in North America and the bankruptcy of referenced corporate credits.credits and (4) the passage of time, as most of the notes will mature by early 2017.
The Company does not expect any potential short termshort-term liquidity issues to affect the pension funds since pension fund obligations are primarily long-term in nature. Losses in pension fund investments, if any, would result in future increased contributions by the Company or its Canadian subsidiaries. Additional contributions to these pension funds would be required to be paid over 5 year or 10 year periods, depending upon the applicable provincial requirement for funding solvency deficits. Losses, if any, would also impact operating results over a longer period of time and immediately increase liabilities and reduce equity.
The Company could incur substantial costs as a result of compliance with, violations of or liabilities under applicable environmental laws and regulations. It could also incur costs as a result of asbestos-related personal injury litigation.
The Company is subject in both the United States and Canada, to a wide range of general and industry-specific laws and regulations in the United States and other countries were we have operations, relating to the protection of the environment and natural resources, including those governing air emissions, greenhouse gases and climate change, wastewater discharges, harvesting, silvicultural activities, the storage, management and disposal of hazardous substances and wastes, the cleanup of contaminated sites, landfill operation and closure obligations, forestry operations and endangered species habitat, and health and safety matters. In particular, the pulp and paper industry in the United States is subject to the United States Environmental Protection Agency’s (“EPA”) “Cluster Rules”.Rules.”
The Company has incurred, and expects that it will continue to incur, significant capital, operating and other expenditures complying with applicable environmental laws and regulations as a result of remedial obligations. The Company incurred approximately $62$64 million of operating expenses and $3$4 million of capital expenditures in connection with environmental compliance and remediation for 2010.in 2012. As of December 31, 20102012, the Company had a provision of $107$83 million for environmental expenditures, including certain asset retirement obligations (such as for land filllandfill capping and asbestos removal) ($11192 million as of December 31, 2009)2011). The pulp and paper mill in Prince Albert was closed in the first quarter of 2006 and has not been operated since. In December 2009, the Company decided to dismantle the Prince Albert facility. The Province of Saskatchewan may require active decommissioning and reclamation at the facility. In the event decommissioning and reclamation is required at the facility, the work is likely to include investigation and remedial action for areas of significant environmental impacts. The Company has a reserve for the estimated required environmental remediation at the site.
The Company also could incur substantial costs, such as civil or criminal fines, sanctions and enforcement actions (including orders limiting its operations or requiring corrective measures, installation of pollution control equipment or other remedial actions), cleanup and closure costs, and third-party claims for property damage and personal injury as a result of violations of, or liabilities under, environmental laws and regulations. The Company’s ongoing efforts to identify potential environmental concerns that may be associated with its past and present properties will lead to future environmental investigations. Those efforts will likely result in the determination of additional environmental costs and liabilities which cannot be reasonably estimated at this time.
As the owner and operator of real estate, the Company may be liable under environmental laws for cleanup, closure and other damages resulting from the presence and release of hazardous substances, including asbestos, on or from its properties or operations. The amount and timing of environmental expenditures is difficult to predict, and, in some cases, the Company’s liability may be imposed without regard to contribution or to whether it knew of, or caused, the release of hazardous substances and may exceed forecasted amounts or the value of the property itself. The discovery of additional contamination or the imposition of additional cleanup obligations at the Company’s or third-party sites may result in significant additional costs. Any material liability the Company incurs could adversely impact its financial condition or preclude it from making capital expenditures that would otherwise benefit its business.
In addition, the Company may be subject to asbestos-related personal injury litigation arising out of exposure to asbestos on or from its properties or operations, and may incur substantial costs as a result of any defense, settlement, or adverse judgment in such litigation. The Company may not have access to insurance proceeds to cover costs associated with asbestos-related personal injury litigation.
Enactment of new environmental laws or regulations or changes in existing laws or regulations, or interpretation thereof, might require significant expenditures. For example, changes in climate change regulation —Seeregulation—See Part I, Item 3, Legal Proceedings, under the caption “Climate change regulation”,regulation,” and see itemPart II, Item 8, – Note 20 Commitments21 “Commitments and ContingenciesContingencies” under the caption “Industrial Boiler Maximum Achievable Controlled Technology Standard.Standard (“MACT”).”
The Company may be unable to generate funds or other sources of liquidity and capital to fund environmental liabilities or expenditures.
Failure to comply with applicable laws and regulations could have a material adverse affect on our business, financial results or condition.
In addition to environmental laws, our business and operations are subject to a broad range of other laws and regulations in the United States and Canada as well as other jurisdictions in which we operate, including antitrust and competition laws, occupational health and safety laws and employment laws. Many of these laws and regulations are complex and subject to evolving and differing interpretation. If the Company is determined to have violated any such laws or regulations, whether inadvertently or willfully, it may be subject to civil and criminal penalties, including substantial fines, or claims for damages by third parties which may have a material adverse effect on the Company’s financial position, results of operations or cash flows.
The Company’s intellectual property rights are valuable, and any inability to protect them could reduce the value of its products and its brands.
The Company relies on patent, trademark and other intellectual property laws of the United States and other countries to protect its intellectual property rights. However, the Company may be unable to prevent third parties from using its intellectual property without its authorization, which may reduce any competitive advantage it has developed. If the Company had to litigate to protect these rights, any proceedings could be costly, and it may not prevail. The Company cannot guarantee that any United States or foreign patents, issued or pending, will provide it with any competitive advantage or will not be challenged by third parties. Additionally, the Company has obtained and applied for United States and foreign trademark registrations, and will continue to evaluate the registration of additional service marks and trademarks, as appropriate. The Company cannot guarantee that any of its pending patent or trademark applications will be approved by the applicable governmental authorities and, even if the applications are approved, third parties may seek to oppose or otherwise challenge these registrations. The failure to secure any pending patent or trademark applications may limit the Company’s ability to protect the intellectual property rights that these applications were intended to cover.
Interruption or failures of the Company information technology systems could have a material adverse effect on our business operations and financial results.
The Company information technology systems, some of which are dependent on services provided by third parties, serve an important role in the efficient operation of its business. This role includes ordering and managing materials from suppliers, managing its inventory, converting materials to finished products, facilitating order entry and fulfillment, processing transactions, summarizing and reporting its financial results, facilitating internal and external communications, administering human resources functions, and providing other processes necessary to manage its business. The failure of these information technology systems to perform as anticipated could disrupt the Company’s business and negatively impact its financial results. In addition, these information technology systems could be damaged or cease to function properly due to any number of causes, such as catastrophic events, power outages, security breaches, computer viruses, or cyber-based attacks. While the Company has contingency plans in place to prevent or mitigate the impact of these events, if they were to occur and the Company disaster recovery plans do not effectively address the issues on a timely basis, the Company could suffer interruptions in its ability to manage its operations, which may adversely affect its business and financial results.
If the Company is unable to successfully retain and develop executive leadership and other key personnel, it may be unable to fully realize critical organizational strategies, goals and objectives.
The success of the Company is substantially dependent on the efforts and abilities of its key personnel, including its executive management team, to develop and implement its business strategies and manage its operations. The failure to retain key personnel or to develop successors with appropriate skills and experience for key positions in the Company could adversely affect the development and achievement of critical organizational strategies, goals and objectives. There can be no assurance that the Company will be able to retain or develop the key personnel it needs and the failure to do so may adversely affect its financial condition and results of operations.
A third party has demanded an increase in consideration from Domtar Inc. under an existing contract.
In July 1998, Domtar Inc. (now a 100% owned subsidiary of Domtar Corporation) acquired all of the issued and outstanding shares of E.B. Eddy Limited and E.B. Eddy Paper, Inc. (“E.B. Eddy”), an integrated producer of specialty paper and wood products. The purchase agreement includesincluded a purchase price adjustment whereby, in the event of the acquisition by a third-party of more than 50% of the shares of Domtar Inc. in specified
circumstances, Domtar Inc. may be required to pay an increase in consideration of up to a maximum of $121 million (CDN$120 million). This, an amount gradually declinesdeclining over a 25-year period and atperiod. At March 7, 2007, the maximum amount of the purchase price adjustment was approximately $111 million (CDN$110 million).
On March 14, 2007, the Company received a letter from George Weston Limited (the previous owner of E.B. Eddy and a party to the purchase agreement) demanding payment of $111 million (CDN$110 million) as a result of the consummation of the Transaction.series of transactions whereby the Fine Paper Business of Weyerhaeuser Company was transferred to the Company and the Company acquired Domtar Inc. on March 7, 2007 (the “Transaction”). On June 12, 2007, an action was commenced by George Weston Limited against Domtar Inc. in the Superior Court of Justice of the provinceProvince of Ontario, Canada, claiming that the consummation of the Transaction triggered the purchase price adjustment and sought a purchase price adjustment of $111 million (CDN$110 million) as well as additional compensatory damages. On March 31, 2011, George Weston Limited filed a motion for summary judgment. On September 3, 2012, the Court directed that this matter proceed to examinations for discovery and trial, rather than proceed by way of summary judgment. A trial is expected to commence on October 21, 2013. The Company does not believe that the consummation of the Transaction triggers an obligation to pay an increase in consideration under the purchase price adjustment and intends to defend itself vigorously against any claims with respect thereto. However, the Company may not be successful in itsthe defense of such claims, and if itthe Company is ultimately required to pay an increase in consideration, such payment may have a material adverse effect on the Company’s financial position, results of operations or cash flows. No provision is recorded for this potential purchase price adjustment.matter.
| ITEM 1B. | UNRESOLVED STAFF COMMENTS |
None.
| ITEM 2. | PROPERTIES |
A description of our mills and related properties is included in Part I, Item I, Business, of this Annual Report on Form 10-K.
Production facilities
We own all of our production facilities with the exception of certain portions that are subject to leases with government agencies in connection with industrial development bond financings or fee-in-lieu-of-tax agreements, and lease substantially all of our sales offices, regional replenishment centers and warehouse facilities. We believe our properties are in good operating condition and are suitable and adequate for the operations for which they are used. We own substantially all of the equipment used in our facilities.
Forestlands
We optimizeoptimized 16 million acres of forestland directly and indirectly licensed or owned in Canada and the United States through efficient management and the application of certified sustainable forest management practices such that a continuous supply of wood is available for future needs.
Listing of facilities and locations
Head Office
Montreal, Quebec
PapersPulp and Paper
Operation Center:
Fort Mill, South Carolina
Uncoated Freesheet:
Ashdown, Arkansas
Espanola, Ontario
Hawesville, Kentucky
Johnsonburg, Pennsylvania
Kingsport, Tennessee
Marlboro, South Carolina
Nekoosa, Wisconsin
Port Huron, Michigan
Rothschild, Wisconsin
Windsor, Quebec
Pulp:
Dryden, Ontario
Kamloops, British Columbia
Plymouth, North Carolina
Chip Mills:
Hawesville, Kentucky
Johnsonburg, Pennsylvania
Kingsport, Tennessee
Marlboro, South Carolina
Converting and Distribution—Onsite:
Ashdown, Arkansas
Rothschild, Wisconsin
Windsor, Quebec
Converting and Distribution—Offsite:
Addison, Illinois
Brownsville, Tennessee
Dallas, Texas
DuBois, Pennsylvania
Griffin, Georgia
Indianapolis, Indiana
Mira Loma, California
Owensboro, Kentucky
Ridgefields, Tennessee
Rock Hill, South Carolina
Tatum, South Carolina
Washington Court House, Ohio
Zengcheng, China
Forms Manufacturing:
Dallas, Texas
Indianapolis, Indiana
Rock Hill, South Carolina
Enterprise Group*—United States:
Birmingham, Alabama
Chandler,Phoenix, Arizona
Little Rock, Arkansas
Hayward, California
Riverside, California
Denver, Colorado
Jacksonville, Florida
Lakeland, Florida
Miami,Medley, Florida
Duluth, Georgia
Boise, Idaho
Addison, Illinois
East Peoria, Illinois
Evansville,Indianapolis, Indiana
Fort Wayne,Piper, Indiana
Indianapolis, IndianaAltoona, Iowa
Kansas City, Kansas
Lexington, Kentucky
Louisville, Kentucky
Harahan, Louisiana
Boston,Mansfield, Massachusetts
Wayland, Michigan
Wayne, Michigan
Minneapolis, Minnesota
Jackson, Mississippi
St. Louis,Overland, Missouri
Omaha, Nebraska
Hoboken, New Jersey
Albuquerque, New Mexico
Buffalo, New York
Syracuse, New York
Charlotte, North Carolina
Brookpark, Ohio
Cincinnati, Ohio
Plain City, Ohio
Oklahoma City, Oklahoma
Tulsa, Oklahoma
Langhorne, Pennsylvania
Pittsburgh, Pennsylvania
Rock Hill, South Carolina
Chattanooga, Tennessee
Knoxville, Tennessee
Memphis, Tennessee
Nashville,Antioch, Tennessee
DFW Airport, Texas
El Paso, Texas
Garland, Texas
Houston, Texas
San Antonio, Texas
Salt Lake City, Utah
Richmond, Virginia
Kent, Washington
Vancouver, Washington
Milwaukee, Wisconsin
Enterprise Group*—Canada:
Calgary, Alberta
Montreal,Dorval, Quebec
Toronto,Brampton, Ontario
Vancouver,Delta, British Columbia
Regional Replenishment Centers (RRC)—United States:
Charlotte, North Carolina
Chicago,Addison, Illinois
Dallas,Garland, Texas
Jacksonville, Florida
Langhorne, Pennsylvania
Los Angeles,Mira Loma, California
Kent, Washington
Regional Replenishment Centers (RRC)—Canada:
Richmond, Quebec
Toronto,Missisauga, Ontario
Winnipeg, Manitoba
Representative office—International
Guangzhou, China
Hong Kong, China
Paper MerchantsDistribution
Divisional Head Office:
Covington, Kentucky
Ariva—Eastern Region:
Albany, New York
Boston, Massachusetts
Harrisburg, Pennsylvania
Hartford, Connecticut
Lancaster, Pennsylvania
New York, New York
Philadelphia, Pennsylvania
Southport, Connecticut
Washington, DC/DC / Baltimore, Maryland
MidWestAriva—Midwest Region:
Covington, Kentucky
Cincinnati, Ohio
Cleveland, Ohio
Columbus, Ohio
Uniontown, Ohio
Dayton, Ohio
Dallas/Fort Worth, Texas
Fort Wayne, Indiana
Indianapolis, Indiana
Ariva—Canada:
London, Ontario
Ottawa, Ontario
Toronto, Ontario
Montreal, Quebec
Quebec City, Quebec
Halifax, Nova Scotia
Mount Pearl, Newfoundland
Personal Care
Divisional Head Office:
Raleigh, North Carolina
Attends—North America
Manufacturing and Distribution:
Greenville, North Carolina
Attends—Europe
Manufacturing and Distribution:
Aneby, Sweden
EAM Corporation
Manufacturing and Distribution:
Jesup, Georgia
| * | Enterprise Group is involved in the sale and distribution of Domtar papers, notably continuous forms, cut size business papers as well as digital papers, converting rolls and specialty products. |
| ITEM 3. | LEGAL PROCEEDINGS |
Currently, a small number of claims and litigation matters have arisen in the ordinary course of business. Although the final outcome of any legal proceeding is subject to a number of variables and cannot be predicted with any degree of certainty, management currently believes that the ultimate outcome of these legal proceedings will not have a material adverse effect on the Company’s long-term results of operations, cash flow or financial position.
In the normal course of operations, the Company becomes involved in various legal actions mostly related to contract disputes, patent infringements, environmental and product warranty claims, and labor issues. The Company periodically reviews the status of these proceedings and assesses the likelihood of any adverse judgments or outcomes of these legal proceedings, as well as analyzes probable losses. WhileAlthough the Companyfinal outcome of any legal proceeding is subject to a number of variables and cannot be predicted with any degree of certainty, management currently believes that the ultimate dispositionoutcome of these matterscurrent legal proceedings will not have a material adverse effect on itsthe Company’s long-term results of operations, cash flow or financial condition,position. However, an adverse outcome in one or more of the following significant legal proceedings could have a material adverse effect on ourthe Company results or cash flow in a given quarter or year.
Prince Albert facility
The pulp and paper mill in Prince Albert was closed in the first quarter of 2006 and has not been operated since. In December 2009, the Company decided to dismantle the Prince Albert facility. In a grievance relating to the closure of the Prince Albert facility, the union claimed that it was entitled to the accumulated pension benefits during the actual layoff period because, according to the union, a majority of employees still had recall rights during the layoff. Arbitration in this matter was held on February 16 to 18, 2010, and the arbitrator ruled in favor of the Company on August 24, 2010. The arbitrator’s decision is subject to the union’s right to apply for judicial review.
Acquisition of E.B. Eddy Limited and E.B. Eddy Paper, Inc.
In July 1998, Domtar Inc. (now a 100% owned subsidiary of Domtar Corporation) acquired all of the issued and outstanding shares of E.B. Eddy Limited and E.B. Eddy Paper, Inc. (“E.B. Eddy”), an integrated producer of specialty paper and wood products. The purchase agreement includesincluded a purchase price adjustment whereby, in the event of the acquisition by a third-partythird party of more than 50% of the shares of Domtar Inc. in specified circumstances, Domtar Inc. may be required to pay an increase in consideration of up to a maximum of $121 million (CDN$120 million), an amount gradually declining over a 25-year period. At March 7, 2007, the closing date of the combination of the Weyerhaeuser Fine Paper Business with Domtar Inc., the maximum amount of the purchase price adjustment was approximately $111 million (CDN$110 million).
On March 14, 2007, the Company received a letter from George Weston Limited (the previous owner of E.B. Eddy and a party to the purchase agreement) demanding payment of $111 million (CDN$110 million) as a result of the consummation of the Transaction.series of transactions whereby the Fine Paper Business of Weyerhaeuser Company was transferred to the Company and the Company acquired Domtar Inc. on March 7, 2007 (the “Transaction”). On June 12, 2007, an action was commenced by George Weston
Limited against Domtar Inc. in the Superior Court of Justice of the Province of Ontario, Canada, claiming that the consummation of the Transaction triggered the purchase price adjustment and sought a purchase price adjustment of $111 million (CDN$110 million) as well as additional compensatory damages. On March 31, 2011, George Weston Limited filed a motion for summary judgment. On September 3, 2012, the court directed that this matter proceed to examination for discovery and trial, rather than proceed by way of summary judgment. The trial is expected to commence on October 21, 2013. The Company does not believe that the consummation of the Transaction
triggers an obligation to pay an increase in consideration under the purchase price adjustment and intends to defend itself vigorously against any claims with respect thereto. However, the Company may not be successful in the defense of such claims, and if the Company is ultimately required to pay an increase in consideration, such payment may have a material adverse effect on the Company’s financial position, results of operations or cash flows. No provision is recorded for this potential purchase price adjustment.matter.
Asbestos claims
Various asbestos-related personal injury claims have been filed in U.S. state and federal courts against Domtar Industries Inc. and certain other affiliates of the Company in connection with alleged exposure by people to products or premises containing asbestos. While the Company believes that the ultimate disposition of these matters, both individually and on an aggregate basis, will not have a material adverse effect on its financial condition, there can be no assurance that the Company will not incur substantial costs as a result of any such claim. These claims have not yielded a significant exposure in the past. The Company has recorded a provision for these claims and any reasonable possible loss in excess of the provision is not considered to be material.
Environment
The Company is subject to environmental laws and regulations enacted by federal, provincial, state and local authorities.
Domtar Inc. and the Company is or may be a “potentially responsible party” with respect to various hazardous waste sites that are being addressed pursuant to the Comprehensive Environmental Response, Compensation, and Liability Act of 1980 (“Superfund”) or similar laws. Domtar continues to take remedial action under its Care and Control Program, as such sites mostly relate to its former wood preserving operating sites, and a number of operating sites due to possible soil, sediment or groundwater contamination. The investigation and remediation process is lengthy and subject to the uncertainties of changes in legal requirements, technological developments and, if and when applicable, the allocation of liability among potentially responsible parties.
The pulp and paper mill in Prince Albert was closed in the first quarter of 2006 and has not been operated since. In December 2009, the Company decided to dismantle the Prince Albert facility. The Province of Saskatchewan may require active decommissioning and reclamation at the facility. In the event decommissioning and reclamation is required at the facility, the work is likely to include investigation and remedial action for areas of significant environmental impacts. The Company has a reserve for the estimated required environmental remediation at the site.
An action was commenced by Seaspan International Ltd. (“Seaspan”) in the Supreme Court of British Columbia, on March 31, 1999 against Domtar Inc. and others with respect to alleged contamination of Seaspan’s site bordering Burrard Inlet in North Vancouver, British Columbia, including contamination of sediments in Burrard Inlet, due to the presence of creosote and heavy metals. AsBeyond the filing of July 3, 2002,preliminary pleadings, no steps have been taken by the parties entered into a partial Settlement Agreement (the “Settlement Agreement”) which provided that, whilein this action. On February 16, 2010, the agreement is performed in accordance with its terms, the action commenced by Seaspan will be held in abeyance. The Settlement Agreement focused on the sharing of costs between Seaspan and Domtar Inc. for certain remediation of contamination referred to in the plaintiff’s claim. The Settlement Agreement did not address all of the plaintiff’s claims and such claims cannot be reasonably determined at this time. On June 3, 2008, Domtar was notified by Seaspan that it terminated the Settlement Agreement. The government of British Columbia issued on February 16, 2010 a Remediation Order to Seaspan and Domtar Inc. (“responsible persons”) in order to define and implement an action plan to address soil, sediment and
groundwater issues. This Order was appealed to the Environmental Appeal Board (the “Board”(“Board”) on March 17, 2010 but there is no suspension in the execution of this Order unless the Board orders otherwise. The appeal hearing scheduledhas been adjourned and has been preliminarily re-scheduled for January 2011 was cancelled with no alternative date scheduled asthe fall of yet.2013. The relevant government authorities selected a remediation approach on July 15, 2011 and on January 8, 2013 the same authorities decided that each responsible persons’ implementation plan is satisfactory and that the responsible persons are reviewing several remediation plans.to decide which plan is to be used. On February 6, 2013, the responsible persons appealed the January 8, 2013 decision and Seaspan applied for a stay of execution. On February 18, 2013, the Board granted an interim stay of the January 8, 2013 decision. The Company has recorded an environmental reserve to address estimated exposure.exposure and the reasonably possible loss in excess of the reserve is not considered to be material for this matter.
At December 31, 2010,2012, the Company had a provision of $107$83 million ($92 million at December 31, 2011) for environmental matters and other asset retirement obligations ($111 million in 2009).obligations. Certain of these amounts have been discounted due to more certainty of the timing of expenditures. Additional costs, not known or identifiable, could be incurred for remediation efforts. Based on policies and procedures in place to monitor environmental exposure, management believes that such additional remediation costs would not have a material adverse effect on the Company’s financial position, result of operations or cash flows.
Climate change regulation
Since 1997, when an international conference on global warming concluded an agreement known as the Kyoto Protocol, which called for reductions of certain emissions that may contribute to increases in atmospheric greenhouse gas (“GHG”) concentrations, various international, national and local laws have been proposed or implemented focusing on reducing GHG emissions. These actual or proposed laws do or may apply in the countries where the Company currently has, or may have in the future, manufacturing facilities or investments.
In the United States, the 112th Congress may considerhas considered legislation to reduce emissions of GHGs. In June 2009,GHGs, although it appears that the U.S. House of Representatives passed The American Clean Energy and Security Act of 2009, a cap-and-trade bill designedfederal government will continue to consider methods to reduce GHG emissions. In September 2009 the Clean Energy Jobsemissions from public utilities and American Power Act was introduced in the U.S. Senate, but the legislation ultimately was not passed. In December 2009, the Carbon Limits and Energy for America’s Recovery (CLEAR) Act was also introduced in the U.S. Senate. In addition, severalcertain other emitters. Several states already are already requiring the reduction ofregulating GHG emissions by certain companies andfrom public utilities and certain other significant emitters, primarily through the planned development of GHG emission inventories and/or stateregional GHG cap-and-trade programs. In addition,Furthermore, the U.S. Environmental Protection Agency (“EPA”) is beginning to regulatehas adopted and implemented GHG emissions. The U.S. Supreme Court ruled in April 2007 inMassachusetts et al. v. EPA, that GHGs fallpermitting requirements for new source and modifications of existing industrial facilities and has recently proposed GHG performance standard for new electric utilities under the federalagency’s existing Clean Air Act’s definition of “air pollutant.” In December 2009, the EPA issued its “endangerment findings” which found that GHGs endanger public health and welfare. The finding itself does not impose any requirement on our industry but is a pre-requisite for EPA to regulate GHG emissions.Act authority. Passage of climate controlGHG legislation or other regulatory initiatives by Congress or various U.S. States,individual states, or the adoption of regulations by the EPA or analogous state agencies, that restrict emissions of GHGs in areas in which the Company conducts business maycould have a material effect on our operations. Thevariety of impacts upon the Company, expectsincluding requiring it to implement GHG containment and reduction programs or to pay taxes or other fees with respect to any failure to achieve the mandated results. This, in turn, will increase the Company’s operating costs. However, the Company does not expect to be disproportionately affected by these measures compared with other pulp and paper operationsproducers in the United States. There
The province of Quebec initiated, as part of its commitment to the Western Climate Initiative (“WCI”), a GHG cap-and-trade system on January 1, 2012. Reduction targets for Quebec have been promulgated and are effective starting January 1, 2013. The Company does not expect the cost of compliance will have a material impact on the Company’s financial position, results of operations or cash flows. With the exception of the British Columbia carbon tax, which applies to the purchase of fossil fuels within the province and which was implemented in 2008, there are presently no federal or provincial legislative orlegislation on regulatory obligations to reduce GHGthat affect the emission of GHGs for ourthe Company’s pulp and paper operations elsewhere in Canada.
Under the Copenhagen Accord, the Government of Canada has committed to reducing greenhouse gases by 17% from 2005 levels by 2020. A sector by sector approach is being used to set performance standards to reduce greenhouse gases. On September 5, 2012, final regulations were published for the coal-fired electrical generators which will go in force July 1, 2015. The industry sector, which includes pulp and paper, is the next sector to undergo this review. The Company does not expect the performance standards to be disproportionately affected by these future measures compared with other pulp and paper producers in Canada.
While it is likely that there will be increased regulation relating to GHG and climate change,emissions in the future, at this stage it is not possible to estimate either a timetable for the promulgation or implementation of any new regulations or the Company’s cost of compliance to said regulations. The impact could, however, be material.
| ITEM 4. |
Not applicable.
| ITEM 5. | MARKET FOR REGISTRANT’S COMMON EQUITY, RELATED STOCKHOLDER MATTERS AND ISSUER PURCHASES OF EQUITY SECURITIES |
Domtar Corporation’s common stock is traded on the New York Stock Exchange and the Toronto Stock Exchange under the symbol “UFS.” The following table sets forth the price ranges of our common stock during 20102012 and 2009 on the New York Stock Exchange and the Toronto Stock Exchange. Effective June 10, 2009 at 6:01 p.m. (ET), the Company effected a reverse stock split of Domtar’s outstanding shares, at a split ratio of 1-for-12. Shareholder approval for the reverse stock split was obtained at the Annual General Meeting held on May 29, 2009. Price ranges for 2009 were adjusted to reflect the reverse stock split.2011.
| New York Stock Exchange ($) | Toronto Stock Exchange (CDN$) | New York Stock Exchange ($) | Toronto Stock Exchange (CDN$) | |||||||||||||||||||||||||||||||||||||||||||||
| High | Low | Close | High | Low | Close | High | Low | Close | High | Low | Close | |||||||||||||||||||||||||||||||||||||
2010 Quarter | ||||||||||||||||||||||||||||||||||||||||||||||||
2012 Quarter | ||||||||||||||||||||||||||||||||||||||||||||||||
First | 69.99 | 47.26 | 64.41 | 70.75 | 50.90 | 65.44 | 100.59 | 83.98 | 95.38 | 99.71 | 84.92 | 95.28 | ||||||||||||||||||||||||||||||||||||
Second | 78.93 | 48.33 | 49.15 | 79.36 | 50.75 | 52.02 | 99.27 | 75.64 | 76.71 | 98.34 | 78.00 | 78.00 | ||||||||||||||||||||||||||||||||||||
Third | 66.44 | 46.25 | 64.58 | 69.50 | 48.85 | 67.00 | 78.80 | 69.73 | 78.29 | 80.00 | 70.25 | 77.07 | ||||||||||||||||||||||||||||||||||||
Fourth | 84.96 | 62.86 | 75.92 | 86.28 | 64.36 | 75.69 | 84.66 | 73.08 | 83.52 | 84.00 | 73.21 | 82.90 | ||||||||||||||||||||||||||||||||||||
|
|
|
|
|
| |||||||||||||||||||||||||||||||||||||||||||
Year | 84.96 | 46.25 | 75.92 | 86.28 | 48.85 | 75.69 | 100.59 | 69.73 | 83.52 | 99.71 | 70.25 | 82.90 | ||||||||||||||||||||||||||||||||||||
2009 Quarter | ||||||||||||||||||||||||||||||||||||||||||||||||
2011 Quarter | ||||||||||||||||||||||||||||||||||||||||||||||||
First | 25.56 | 6.12 | 11.40 | 30.84 | 7.80 | 14.16 | 93.88 | 75.49 | 91.78 | 92.71 | 75.43 | 89.00 | ||||||||||||||||||||||||||||||||||||
Second | 23.28 | 10.56 | 16.58 | 27.72 | 13.20 | 19.30 | 105.80 | 84.72 | 94.72 | 102.31 | 81.53 | 91.37 | ||||||||||||||||||||||||||||||||||||
Third | 42.00 | 13.91 | 35.22 | 44.93 | 15.60 | 37.86 | 99.65 | 64.58 | 68.17 | 95.44 | 63.88 | 71.36 | ||||||||||||||||||||||||||||||||||||
Fourth | 59.10 | 35.41 | 55.41 | 62.07 | 38.29 | 58.21 | 85.21 | 62.28 | 79.96 | 84.82 | 66.12 | 81.51 | ||||||||||||||||||||||||||||||||||||
|
|
|
|
|
| |||||||||||||||||||||||||||||||||||||||||||
Year | 59.10 | 6.12 | 55.41 | 62.07 | 7.80 | 58.21 | 105.80 | 62.28 | 79.96 | 102.31 | 63.88 | 81.51 | ||||||||||||||||||||||||||||||||||||
|
|
|
|
|
| |||||||||||||||||||||||||||||||||||||||||||
At December 31, 2010,2012, the number of shareholders of record (registered and non-registered) of Domtar Corporation common stock was approximately 11,3737,870 and the number of shareholders of record (registered and non-registered) of Domtar (Canada) Paper Inc. exchangeable shares was approximately 7,300.6,519.
DIVIDENDS AND STOCK REPURCHASE PROGRAM
In 2010, Domtar Corporation declared three and paid two quarterly dividends of $0.25 per share to holders of the Company’s common stock, as well as holders of exchangeable shares of Domtar (Canada) Paper Inc., a subsidiary of Domtar Corporation. The total dividends of approximately $11 million and $10 million were paid on July 15 and October 15, 2010, respectively, and the third total dividend of approximately $11 million was paid on January 17, 2011.
On February 23, 2011, our20, 2013, the Board of Directors approved a quarterly dividend of $0.25$0.45 per share to be paid to holders of the Company’s common stock, as well as holders of exchangeable shares of Domtar (Canada) Paper Inc. This dividend is to be paid on April 15, 20112013 to shareholders of record on March 15, 2011.2013.
During 2012, Domtar Corporation declared and paid four quarterly dividends. The first quarter dividend was $0.35 per share, relating to 2011, and the remainder were $0.45 per share relating to 2012, to holders of the Company’s common stock, as well as holders of exchangeable shares of Domtar (Canada) Paper Inc., a subsidiary of Domtar Corporation. The total dividends of approximately $13 million, $16 million, $16 million and $16 million were paid on April 16, 2012, July 16, 2012, October 15, 2012 and January 15, 2013, respectively.
During 2011, Domtar Corporation declared and paid four quarterly dividends. The first quarter dividend was $0.25 per share relating to 2010 and the remainder were $0.35 per share relating to 2011, to holders of the Company’s common stock, as well as holders of exchangeable shares of Domtar (Canada) Paper Inc., a subsidiary of Domtar Corporation. The total dividends of approximately $10 million, $15 million and $13 million were paid on April 15, July 15 and October 17, 2011, respectively, and the fourth quarter dividend of approximately $13 million was paid on January 15, 2012.
In addition, on May 4, 2010, the Board of Directors authorized a stock repurchase program (the “Program”) for up to $150 million of the Company’s common stock. On May 4, 2011, the Company’s Board of Directors approved an increase to the Program from $150 million to $600 million. On December 15, 2011, the Company’s Board of Directors approved another increase to the Program from $600 million to $1 billion. Under the Program, the Company is authorized to repurchase from time to time shares of its outstanding common stock on the open market or in privately negotiated transactions in the United States. The timing and amount of stock repurchases will depend on a variety
of factors, including the market conditions as well as corporate and regulatory considerations. The Program may be suspended, modified or discontinued at any time and the Company has no obligation to repurchase any amount of its common stock under the Program. The Program has no set expiration date. The Company repurchases its common stock, from time to time, in part to reduce the dilutive effects of its stock options, awards, and employee stock purchase plan and to improve shareholders’ returns.
The Company makes open market purchases of its common stock using general corporate funds. Additionally, it may enter into structured stock repurchase agreements with large financial institutions using general corporate funds in order to lower the average cost to acquire shares. The agreements require the Company to make an up-front paymentpayments to the counterparty financial institutioninstitutions which results in either (i) the receipt of stock at the beginning of the term of the agreementagreements followed by a share adjustment at the maturity of the agreement,agreements, or (ii) the receipt of either stock or cash at the maturity of the agreementagreements, depending upon the price of the stock.
During 2010,2012, the Company repurchased 738,0472,000,925 shares at an average price of $59.96$78.32 for a total cost of $44 million. Also,$157 million (2011—5,921,732; $83.52 and $494 million, respectively). As of February 21, 2013, the Company entered into structured stock repurchase agreements that did not result inrepurchased 156,500 shares at an average price of $76.18 for a total cost of $12 million since the repurchasebeginning of shares but resulted in net gains of $2 million which are recorded as a component of Shareholders’ equity. 2013.
All shares repurchased are recorded as Treasury stock on the Consolidated Balance Sheets under the par value method at $0.01 per share.
Share repurchase activity under our share repurchase program was as follows during the year ended December 31, 2010:2012:
Period | (a) Total Number of Shares Purchased | (b) Average Price Paid per Share | (c) Total Number of Shares Purchased as Part of Publicly Announced Plans or Programs | (d) Approximate Dollar Value of Shares that May Yet be Purchased under the Plans or Programs (in 000s) | ||||||||||||
April 1 through June 30, 2010 | 340,130 | $ | 55.79 | 340,130 | $ | 131,023 | ||||||||||
July 1 through September 30, 2010 | 399,720 | $ | 63.23 | 399,720 | $ | 105,748 | ||||||||||
October 1 through October 31, 2010 | — | $ | — | — | $ | 105,748 | ||||||||||
November 1 through November 30, 2010 | | (1,803 | ) | $ | — | — | $ | 105,748 | ||||||||
December 1 through December 31, 2010 | — | $ | — | — | $ | 105,748 | ||||||||||
| 738,047 | $ | 56.82 | 738,047 | $ | 105,748 | |||||||||||
Period | (a) Total Number of Shares Purchased | (b) Average Price Paid per Share | (c) Total Number of Shares Purchased as Part of Publicly Announced Plans or Programs | (d) Approximate Dollar Value of Shares that May Yet be Purchased under the Plans or Programs (in 000s) | ||||||||||||
January 1 through March 31, 2012 | 37,171 | $ | 94.57 | 37,171 | $ | 457,670 | ||||||||||
April 1 through June 30, 2012 | 891,902 | $ | 80.27 | 891,902 | $ | 386,078 | ||||||||||
July 1 through September 30, 2012 | 592,594 | $ | 75.52 | 592,594 | $ | 341,326 | ||||||||||
October 1 through December 31, 2012 | 479,258 | $ | 76.89 | 479,258 | $ | 304,477 | ||||||||||
|
|
|
|
|
|
|
| |||||||||
| 2,000,925 | $ | 78.32 | 2,000,925 | $ | 304,477 | |||||||||||
|
|
|
|
|
|
|
| |||||||||
This graph compares the return on a $100 investment in the Company’s common stock on March 7,December 31, 2007 with a $100 investment in an equally-weighted portfolio of a peer group(1), a $100 investment in the S&P 500 Index and a $100 investment in the S&P 500 Materials400 MidCap Index. This graph assumes that returns are in local currencies and assumes quarterly reinvestment of dividends. The measurement dates are the last trading day of the period as shown.
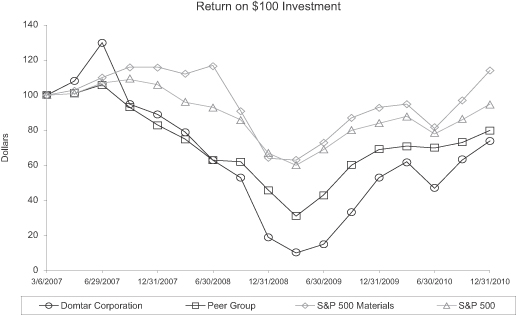
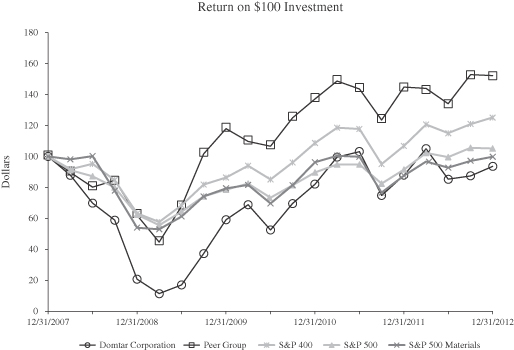
In May 2011, Domtar Corporation was added to the Standard and Poor’s MidCap 400 Index and since then we are using this Index.
| (1) | On May 18, 2007, the Human Resources Committee of the Board of Directors established performance measures as part of the Performance Conditioned Restricted Stock Unit (“PCRSUs”) Agreement including the achievement of a total shareholder return compared to a peer group. |
This graph assumes that returns are in local currencies and assumes quarterly reinvestment of dividends and special dividends.
AbitibiBowater and Smurfit-Stone were removed from the peer group in the fourth quarter of 2008 due to their bankruptcy proceedings. Smurfit-Stone was re-included in the peer group and subsequently reset to 100 once their shares were relisted on July 1, 2010.
| ITEM 6. | SELECTED FINANCIAL DATA |
The following sets forth selected historical financial data of the Company for the periods and as of the dates indicated. The selected financial data as of December 31, 2006, December 30, 2007, December 31, 2008, December 31, 2009 and December 31, 2010 and for the fiscal years then ended December 31, 2006, December 30, 2007, December 31, 2008, December 31, 2009 and December 31, 2010 have been derived from the audited financial statements of Domtar Corporation for 2010, 2009, 2008 and 2007, and the Weyerhaeuser Fine Paper Business for 2006. The fiscal years of 2006 and 2007 ended on the last Sunday of the calendar year. Starting in 2008, the fiscal year was based on the calendar year and ends December 31. Fiscal year 2010, 2009, 2008 and 2007 consisted of 52 weeks. Fiscal year 2006 consisted of 53 weeks.Corporation.
The Company acquired Domtar Inc. as of March 7, 2007. Accordingly, the results of operations for Domtar Inc. are reflected in the financial statements only as of and for the period after that date. Prior to March 7, 2007, the financial statements of the Company reflect only the results of operations of the Weyerhaeuser Fine Paper Business. The following table should be read in conjunction with ItemsPart II, Item 7, Management’s Discussion and Analysis of Financial Condition and Results of Operations and Part II, Item 8, Financial Statements and Supplementary Data of this Annual Report on Form 10-K.
| Year ended | Year ended | |||||||||||||||||||||||||||||||||||||||
FIVE YEAR FINANCIAL SUMMARY | December 31, 2010 | December 31, 2009 | December 31, 2008 | December 30, 2007 | December 31, 2006 | December 31, 2012 | December 31, 2011 | December 31, 2010 | December 31, 2009 | December 31, 2008 (1) | ||||||||||||||||||||||||||||||
| (In millions of dollars, except per share figures) | ||||||||||||||||||||||||||||||||||||||||
| (In millions of dollars, except per share figures) | ||||||||||||||||||||||||||||||||||||||||
Statement of Income Data: | ||||||||||||||||||||||||||||||||||||||||
Sales | $ | 5,850 | $ | 5,465 | $ | 6,394 | $ | 5,947 | $ | 3,306 | $ | 5,482 | $ | 5,612 | $ | 5,850 | $ | 5,465 | $ | 6,394 | ||||||||||||||||||||
Closure and restructuring costs and, impairment and write-down of goodwill, property, plant and equipment and intangible assets | 77 | 125 | 751 | 110 | 764 | 44 | 137 | 77 | 125 | 751 | ||||||||||||||||||||||||||||||
Depreciation and amortization | 395 | 405 | 463 | 471 | 311 | 385 | 376 | 395 | 405 | 463 | ||||||||||||||||||||||||||||||
Operating income (loss) | 603 | 615 | (437 | ) | 270 | (556 | ) | 367 | 592 | 603 | 615 | (437 | ) | |||||||||||||||||||||||||||
Net earnings (loss) | 605 | 310 | (573 | ) | 70 | (609 | ) | 172 | 365 | 605 | 310 | (573 | ) | |||||||||||||||||||||||||||
Net earnings (loss) per share—basic | $ | 14.14 | $ | 7.21 | ($ | 13.33 | ) | $ | 1.77 | ($ | 25.70 | ) | $ | 4.78 | $ | 9.15 | $ | 14.14 | $ | 7.21 | ($ | 13.33 | ) | |||||||||||||||||
Net earnings (loss) per share—diluted | $ | 14.00 | $ | 7.18 | ($ | 13.33 | ) | $ | 1.76 | ($ | 25.70 | ) | $ | 4.76 | $ | 9.08 | $ | 14.00 | $ | 7.18 | ($ | 13.33 | ) | |||||||||||||||||
Cash dividends declared per common and exchangeable share | $ | 0.75 | — | — | — | — | ||||||||||||||||||||||||||||||||||
Cash dividends declared and paid per common and exchangeable share | $ | 1.70 | $ | 1.30 | $ | 0.75 | — | — | ||||||||||||||||||||||||||||||||
Balance Sheet Data: | ||||||||||||||||||||||||||||||||||||||||
Cash and cash equivalents | $ | 530 | $ | 324 | $ | 16 | $ | 71 | $ | 1 | $ | 661 | $ | 444 | $ | 530 | $ | 324 | $ | 16 | ||||||||||||||||||||
Net property, plant and equipment | 3,767 | 4,129 | 4,301 | 5,362 | 3,065 | 3,401 | 3,459 | 3,767 | 4,129 | 4,301 | ||||||||||||||||||||||||||||||
Total assets | 6,026 | 6,519 | 6,104 | 7,726 | 3,998 | 6,123 | 5,869 | 6,026 | 6,519 | 6,104 | ||||||||||||||||||||||||||||||
Working capital | 648 | 660 | 655 | 1,024 | 841 | |||||||||||||||||||||||||||||||||||
Long-term debt due within one year | 79 | 4 | 2 | 11 | 18 | |||||||||||||||||||||||||||||||||||
Long-term debt | 825 | 1,701 | 2,110 | 2,213 | 32 | 1,128 | 837 | 825 | 1,701 | 2,110 | ||||||||||||||||||||||||||||||
Total shareholders’ equity | 3,202 | 2,662 | 2,143 | 3,197 | 2,915 | 2,877 | 2,972 | 3,202 | 2,662 | 2,143 | ||||||||||||||||||||||||||||||
| (1) | In 2008, we conducted an impairment test on our goodwill and concluded that goodwill was impaired and we recorded a non-cash impairment charge of $321 million. Also in 2008, we conducted impairment tests on our Dryden, Ontario and Columbus, Mississippi mills and concluded the assets were impaired and recorded a non-cash impairment charge of $360 million. |
| ITEM 7. | MANAGEMENT’S DISCUSSION AND ANALYSIS OF FINANCIAL CONDITION AND RESULTS OF OPERATIONS |
This Management’s Discussion and Analysis of Financial Condition and Results of Operations (“MD&A”) should be read in conjunction with Domtar Corporation’s audited consolidated financial statements and notes thereto included in Part II, Item 8, Financial Statements and Supplementary Data of this Annual Report on Form 10-K. Throughout this MD&A, unless otherwise specified, “Domtar Corporation,” “the Company,” “Domtar,” “we,” “us” and “our” refer to Domtar Corporation and its subsidiaries, as well as its investments. Domtar Corporation’s common stock is listed on the New York Stock Exchange and the Toronto Stock Exchange. Except where otherwise indicated, all financial information reflected herein is determined on the basis of accounting principles generally accepted in the United States (“GAAP”).
In accordance with industry practice, in this report, the term “ton” or the symbol “ST” refers to a short ton, an imperial unit of measurement equal to 0.9072 metric tons. The term “metric ton” or the symbol “ADMT” refers to an air dry metric ton and the term “MFBM” refers to million foot board measure.ton. In this report, unless otherwise indicated, all dollar amounts are expressed in U.S. dollars, and the term “dollars” and the symbol “$” refer to U.S. dollars. In the following discussion, unless otherwise noted, references to increases or decreases in income and expense items, prices, contribution to net earnings (loss), and shipment volume are based on the twelve month periods ended December 31, 2010, 20092012, 2011 and 2008.2010. The twelve month periods are also referred to as 2010, 20092012, 2011 and 2008.2010.
In 2010,2012, we reported operating income of $603$367 million, a decrease of $12$225 million compared to $615$592 million in 2009. In 2009,2011. This decrease in operating income included $498is mainly due to a decrease in our pulp and paper segment, which experienced lower selling prices for pulp ($184 million reflecting a selling price decrease of alternative fuel tax credits compared to $25 million in 2010. Excluding the impact of the alternative fuel tax credits, our operating results in 2010 improvedapproximately 16% when compared to 2009 primarily due2011), lower paper shipments ($39 million reflecting a decrease in demand for our paper by approximately 6% when compared to our Paper segment, which experienced higher average selling prices.2011) as well as the negative impact of lower production volume ($60 million). Our strategy of maintaining our production levels in line with our customer demand has resulted in taking lack-of-order downtime and machine slowdowns of 30,00085,000 tons of paper and nil metric tons of pulp in 20102012, compared to 467,00047,000 tons of paper and 261,000 metric tons of pulp in 2009.2011. We also saw an improvement in our pulp shipments, which experienced an 8% volume increase compared to 2009. In 2010, we also had lower chemicaldeliveries in our Distribution segment and energy costs.higher costs for chemicals and fiber in 2012 when compared to 2011. These factorscost increases were partially offset by higher maintenance costs, higher fiber costs, higher freight costslower impairment and a negative impact of a stronger Canadian dollar (net of our hedging program). Other items significantly impacting our operating income comparability include net losses on disposalswrite-down of property, plant and equipment and saleintangible assets costs of businesses and trademarks of $33$71 million, recorded in 2010 compared to net gains of $7 million in 2009; and an aggregate $27 million charge in 2010 attributable tolower closure and restructuring costs of $22 million, lower energy costs of $18 million and higher pulp shipments of $13 million in 2012. In addition, we had an increase in operating income in our Personal Care segment of $38 million when compared to an aggregate $63 million charge2011. This increase in 2009.operating income in our Personal Care segment is mostly related to the inclusion of a full year of results for Attends Healthcare Inc. (“Attends US”) as well as the acquisition of Attends Healthcare Limited (“Attends Europe”) in the first quarter of 2012 and the acquisition of EAM Corporation (“EAM”) in the second quarter of 2012.
These and other factors that affected the year-over-year comparison of financial results are discussed in the year-over-year and segment analysis.
WeIn 2013, we expect market demand for uncoated freesheet paper to decline at a 3 to 4% rate in North American paper demandAmerica, but our shipments are expected to continue declining long-term, partially offset bytrend slightly better than market due to an exposure to stable specialty and packaging papers and the incremental volume from the supply agreement signed with Appleton. Paper prices are expected to remain at levels similar to year-end while we expect a gradual returnslow and steady recovery in pulp prices. The implementation of employmentour growth plans in the U.S. closerPersonal Care segment are expected to pre-recession levels. Our Papers segment is benefitingyield incremental earnings beginning in the fourth quarter of 2013.
Acquisition of Businesses
On May 10, 2012, we completed the acquisition of 100% of the outstanding shares of EAM, a leading manufacturer of high quality absorbent composite solutions, from Kinderhook Industries, LLC. EAM produces airlaid and ultrathin laminated absorbent cores with brands such as NovaThin® and NovaZorb® used in feminine
hygiene, adult incontinence, baby diapers and other medical healthcare and performance packaging solutions. EAM operates a more favorable pulp product mix that should resultmanufacturing, research and development and distribution facility in reduced pricing volatility. Rising commodity pricing shouldJesup, Georgia. The purchase price was $61 million in cash, including working capital, net of cash acquired of $1 million. The results of EAM’s operations have been included in the consolidated financial statements since May 1, 2012, the effective date of the transaction and are presented in the Personal Care reportable segment.
On March 1, 2012, we completed the acquisition of 100% of the outstanding shares of Attends Europe, a manufacturer and supplier of adult incontinence care products in Northern Europe. Attends Europe sells and markets a complete line of branded and private-label adult incontinence products distributed through several channels, with sales organizations in nine Northern European countries. Attends Europe operates a manufacturing, research and development and distribution facility in Aneby, Sweden, and also put pressure on someoperates a distribution center in Germany. The purchase price was $232 million (€173 million) in cash, including working capital, net of our input costsacquired cash of $4 million (€3 million). The results of Attends Europe’s operations have been included in 2011.
While the economy appears to be stabilizing, employment remains slow to recover. Though weconsolidated financial statements since March 1, 2012, the effective date of the transaction and are entering 2011presented in a strong position, we will continue to manage our business conservatively, looking to grow profitably and to create shareholder value.the Personal Care reportable segment.
Closure and Restructuring activitiesActivities and Impairment and Write-down of Property, Plant and Equipment and Intangible Assets
We regularly review our overall production capacity with the objective of aligning our production capacity with anticipated long-term demand.
In November 2010, we announced the start up of our new fluff pulp machine in Plymouth, North Carolina, which has an annual production capacity of approximately 444,000 metric tons. The conversion of our Plymouth pulp and paper mill in 2009 is discussed below.
In July 2010, we announced our decision to end all manufacturing activities at our forms converting plant in Cerritos, California. Operations ceased on July 16, 2010. Approximately 50 plant employees were impacted by this decision.
In March 2010, we announced the permanent closure of our coated groundwood paper mill in Columbus, Mississippi. Operations ceased in April 2010. This measure resulted in the permanent curtailment of approximately 238,000 tons of coated groundwood production capacity per year as well as approximately 70,000 metric tons of thermo-mechanical pulp, and affected approximately 219 employees.
Our Prince Albert pulp and paper mill was closed in the first quarter of 2006 and has not been operated since. The dismantling of the paper machine and converting equipment was completed in 2008. In December 2009,2011, we decided to dismantlewithdraw from one of our Prince Albert facility. We removed machinerymultiemployer pension plans and equipment from the siterecorded a withdrawal liability and may take further stepsa charge to engage the servicesearnings of demolition contractors and file for$32 million. In 2012, as a demolition permit, butresult of a revision in the meantimeestimated withdrawal liability, we are also evaluating other optionsrecorded a further charge to earnings of $14 million. Also in 2012, we withdrew from a second multiemployer pension plan and recorded a withdrawal liability and a charge to earnings of $1 million. While this is our best estimate of the ultimate cost of the withdrawal from these plans at December 31, 2012, additional withdrawal liabilities may be incurred based on the final fund assessment expected to occur in the second quarter of 2013. Further, we remain liable for potential additional withdrawal liabilities to the site.fund in the event of a mass withdrawal, as defined by statute, occurring anytime within the next three years.
In February 2009,During the fourth quarter of 2012, we announced the permanent shut down of a paperpulp machine at our PlymouthKamloops, British Columbia pulp and paper mill effective at(“Kamloops mill”). The pulp machine is expected to be closed by the end of February 2009.March 2013. This measure resulteddecision will result in thea permanent curtailment of our annual pulp production by approximately 293,000 tons120,000 ADMT of paper production capacity per year and affected approximately 185 employees. In October 2009, we announced that we would convert our Plymouthsawdust softwood pulp and paper mill to 100% fluff pulp production atwill affect approximately 125 employees. As a costresult of $74 million. Our annual fluff pulp making capacity has increased to 444,000 metric tons. The mill conversion also resulted in thethis permanent shut down of Plymouth’s remaining paper machine with an annual production capacity of 199,000 tons. The mill conversion helped preserve approximately 360 positions. In connection with this announcement,shutdown, we recognized $13recorded $7 million of accelerated depreciation inimpairment on property, plant and equipment (a component of Impairment and write-down of property, plant and equipment and intangible assets on the fourth quarterConsolidated Statement of 2009,Earnings and Comprehensive Income), $5 million of severance and termination costs and $4 million of inventory write-downs. We expect to record a further $39$12 million of accelerated depreciation over the first nine monthsquarter of 2010 was recorded2013 in relation to these assets and $3 million of other costs in 2013.
During the first quarter of 2012, we recorded a $2 million write-down of property, plant and equipment at our Mira Loma, California converting plant (“Mira Loma plant”) in Impairment and write-down of property, plant and equipment (a component of Impairment and write-down of property, plant and equipment and intangible assets that ceased productive useon the Consolidated Statement of Earnings and Comprehensive Income).
During 2012, other costs related to previous and ongoing closures include $1 million in October 2010. The remaining assetsseverance and termination costs, $1 million of inventory write-downs and $5 million in other costs.
Deterioration in sales and operating results of Ariva U.S., a subsidiary included in our Distribution segment, has led us to test the customer relationships of this facility were testedasset group for impairment at the timerecoverability. As of this 2009 announcement, and no additionalDecember 31, 2012, we recognized an impairment charge was required.
In April 2009, we announced that we would idleof $5 million included in Impairment and write-down of property, plant and equipment and intangible assets related to customer relationships in the Distribution segment as a result of the revised long-term forecast used in our Dryden pulp facility for approximately ten weeks, effective April 25, 2009. This decision was taken in response to continued weak global demand at that time for pulp and the need to manage inventory levels. In addition, we also idled our former Ear Falls sawmill for approximately seven weeks, effective April 10, 2009, as this sawmill was a supplier of chips to our Dryden pulp mill. These temporary measures affected approximately 500 employees at the pulp mill, sawmill and related forestland operations. Our Dryden pulp mill has an annual softwood pulp production capacity of 319,000 metric tons. The former Ear Falls sawmill had an annual production capacity of 190 MFBM. Our Dryden pulp mill restarted its pulp production in July 2009. Our former Ear Falls sawmill restarted its operations in August 2009, but we decided to indefinitely idle the sawmill again, effectivebudget exercise in the fourth quarter of 2009.
In2012. We concluded that no further impairment or impairment indicators exist as of December 2008, we announced the permanent closure of our Lebel-sur-Quévillon pulp mill. Operations at our Lebel-sur-Quévillon pulp mill had been indefinitely idled in November 2005 due to unfavorable economic conditions. As of November 2005, our Lebel-sur-Quévillon pulp mill had an annual production capacity of approximately 300,000 metric tons and employed approximately 425 employees. In addition, we announced the permanent closure of our Lebel-sur-Quévillon sawmill, which had been indefinitely idled since 2006, at which time it employed approximately 140 employees.
In November 2008, we announced and closed our paper machine and converting operations at our Dryden mill. This measure resulted in the permanent curtailment of approximately 151,000 tons of paper capacity per year and affected approximately 195 employees.31, 2012.
We continue to evaluate potential adjustments to our production capacity, which may include additional closures of machines or entire mills, and we could recognize significant cash and/or non-cash charges relating to any such closures in future periods. Information relating to all our closure and restructuring activities are contained under the caption Closure and Restructuring of the segment analyses, of this MD&A, where applicable.
Sale of Woodland, Maine hardwood market pulp millHydro Assets in Ottawa, Ontario and Gatineau, Quebec
On September 30, 2010, the CompanyNovember 20, 2012, we sold its Woodland hardwood market pulp mill,our hydro electric assets in Ottawa, Ontario and related assets, located in Baileyville, Maine and New Brunswick, Canada.Gatineau, Quebec. The purchase pricetransaction was for an aggregate value of $60approximately $46 million plus net working capital(CDN $46 million) and included three power stations (21 megawatts of $8 million. The sale resultedinstalled capacity), water rights in the area, as well as Domtar Inc.’s equity stake in the Chaudière Water Power Inc., a gain on disposalring dam consortium. We had approximately 12 workers operating the hydro assets in Ottawa/ Gatineau which became employees of the Woodland, Maine millbuyer upon the closing of $10 million netthe transaction. As a result of relatedthis transaction, we incurred a loss relating to the curtailment of the pension curtailments costsplan of $2 million.
The Woodland, Maine mill was our only non-integrated hardwood market pulp mill. It had an annual production capacitymillion and legal fees of 395,000 metric tons and employed approximately 300 people.
Sale$1 million, both of Wood business
On June 30, 2010, the Company sold its Wood business to EACOM Timber Corporation (“EACOM”), following the obtainment of various third party consents and customary closing conditions, which included approvals of the transfers of cutting rights in Quebec and Ontario, for proceeds of $75 million (CDN$80 million) plus working capital of approximately $42 million (CDN$45 million). We received 19% of the proceeds in shares of EACOM giving Domtar an approximate 12% ownership interest in EACOM. The sale resulted in a loss on disposal of the Wood business and related pension curtailments and settlements of $50 million, which wasare recorded in the second quarter of 2010 in Other operating loss (income) on the Consolidated StatementStatements of Earnings (Loss). The investment in EACOM was then accounted for under the equity method.and Comprehensive Income.
The transaction included the saleSenior Notes Offering
On August 20, 2012, we issued $250 million aggregate principal amount of five operating sawmills: Timmins, Nairn Centre and Gogama in Ontario, and Val-d’Or and Matagami in Quebec; as well as two non-operating sawmills: Ear Falls in Ontario and Ste-Marie in Quebec. The sawmills have approximately 3.5 million cubic meters of annual harvesting rights and a production capacity of close to 900 million board feet. Also included in the transaction was the Sullivan remanufacturing facility in Quebec and our interests in two investments: Anthony-Domtar Inc. and Elk Lake Planning Mill Limited.
In December 2010, in an unrelated transaction, the Company sold its investment in EACOM for CDN$0.51 per common sharesenior 6.25% Notes due 2042 for net proceeds of $24$247 million. The net proceeds from the offering of the Notes were placed in short-term investment vehicles pending being used for general corporate purposes.
On March 7, 2012, we issued $300 million (CDN$24 million) resultingaggregate principal amount of senior 4.4% Notes, due 2022 for net proceeds of $297 million. The net proceeds from the offering were used in no further gain or loss. Domtar has fiber supply agreements in place with its former wood division at its Drydenpart to fund the purchase price of the 5.375% Notes due 2013, 7.125% Notes due 2015, 9.5% Notes due 2016, and Espanola facilities. Since these continuing cash outflows are expected to be significant10.75% Notes due 2017 tendered and accepted for purchase pursuant to the former Wood business,tender offer described below, including the salepayment of accrued interest and applicable early tender premiums not funded with cash on hand, as well as for general corporate purposes.
Tender Offer for Certain Outstanding Notes
On February 22, 2012, we announced the Wood business didcommencement of a cash tender offer for our outstanding 5.375% Notes due 2013, 7.125% Notes due 2015, 9.5% Notes due 2016, and 10.75% Notes due 2017, such that the maximum aggregate consideration for Notes purchased in the tender offer, excluding accrued and unpaid interest, would not qualifyexceed $250 million. The tender offer expired on March 21, 2012 and we repurchased $186 million of notes for an aggregate consideration of $233 million, excluding accrued and unpaid interest. We incurred $47 million of tender premiums and $3 million of additional charges as a discontinued operation under ASC 205-20.result of this extinguishment.
Dividend and Stock Repurchase Program
In 2010,2012, we declared three and paid two quarterly dividends of $0.25 per share to holders of the Company’s common stock, as well as holders of exchangeablerepurchased 2,000,925 shares of Domtar (Canada) Paper Inc., a subsidiary of Domtar Corporation. Cash dividends of approximately $11 million and $10 million were paid on July 15 and October 15, 2010, respectively, with the third dividend of approximately $11 million paid on January 17, 2011.
On February 23, 2011, our Board of Directors approved a quarterly dividend of $0.25 per share to be paid to holders of the Company’s common stock, as well as holders of exchangeable shares of Domtar (Canada) Paper Inc. This dividend is to be paid on April 15, 2011 to shareholders of record on March 15, 2011.
In addition, on May 4, 2010 our Board of Directors authorized a stock repurchase program (the “Program”) for up to $150 million of the Company’s common stock. Under the Program, the Company is authorized to repurchase from time to time shares of its outstanding common stock on the open market or in privately negotiated transactions in the United States. The timing and amount of stock repurchases will depend on a variety of factors, including the market conditions as well as corporate and regulatory considerations. The Program may
be suspended, modified or discontinued at any time and the Company has no obligation to repurchase any amount of its common stock under the Program. The Program has no set expiration date. We repurchase our common stock, from time to time, in part to reduce the dilutive effects of our stock options, awards, and employee stock purchase plan and to improve shareholders’ returns.
We make open market purchases of our common stock using general corporate funds. Additionally, we may enter into structured stock repurchase agreements with large financial institutions to lower the average cost of shares that we repurchase with general corporate funds. In 2010, we entered into agreements that required us to make an up-front payment to the counterparty financial institution which resulted in either (i) the receipt of stock at the beginning of the term of the agreement followed by a share adjustment at the maturity of the agreement, or (ii) the receipt of either stock or cash at the maturity of the agreement depending upon the price of the stock.
During 2010, the Company repurchased 738,047 shares at an average price of $59.96$78.32 for a total cost of $44$157 million and paid quarterly cash dividends in an aggregate amount of $58 million. Also,
RECENT DEVELOPMENTS
On February 25, 2013, we announced that we will redeem approximately $71 million in aggregate principal amount of our 5.375% Notes due 2013, representing the Company entered into structured stock repurchase agreements that did not resultmajority of the notes outstanding. The notes will be redeemed at a redemption price of 100 percent of the principal amount, plus accrued and unpaid interest, as well as a make-whole premium.
We operate the following business activities: Pulp and Paper, Distribution and Personal Care. A description of our business is included in Part I, Item 1, under the section “Business” of this Annual Report on Form 10-K.
CONSOLIDATED RESULTS OF OPERATIONS AND SEGMENTS REVIEW
The following table includes the consolidated financial results of Domtar Corporation for the years ended December 31, 2012, 2011 and 2010:
FINANCIAL HIGHLIGHTS | Year ended December 31, 2012 | Year ended December 31, 2011 | Year ended December 31, 2010 | |||||||||
| (In millions of dollars, unless otherwise noted) | ||||||||||||
Sales | $ | 5,482 | $ | 5,612 | $ | 5,850 | ||||||
Operating income | 367 | 592 | 603 | |||||||||
Net earnings | 172 | 365 | 605 | |||||||||
Net earnings per common share (in dollars)1: | ||||||||||||
Basic | 4.78 | 9.15 | 14.14 | |||||||||
Diluted | 4.76 | 9.08 | 14.00 | |||||||||
Operating income (loss) per segment: | ||||||||||||
Pulp and Paper | $ | 346 | $ | 581 | $ | 667 | ||||||
Distribution | (16 | ) | — | (3 | ) | |||||||
Personal Care | 45 | 7 | — | |||||||||
Wood2 | — | — | (54 | ) | ||||||||
Corporate | (8 | ) | 4 | (7 | ) | |||||||
|
|
|
|
|
| |||||||
Total | $ | 367 | $ | 592 | $ | 603 | ||||||
| At December 31, 2012 | At December 31, 2011 | At December 31, 2010 | ||||||||||
Total assets | $ | 6,123 | $ | 5,869 | $ | 6,026 | ||||||
Total long-term debt, including current portion | $ | 1,207 | $ | 841 | $ | 827 | ||||||
|
|
|
|
|
| |||||||
| 2 | Our Wood segment was sold in the second quarter of 2010. A description of the sale transaction is included under the Wood segment analysis. |
YEAR ENDED DECEMBER 31, 2012 VERSUS
YEAR ENDED DECEMBER 31, 2011
Sales
Sales for 2012 amounted to $5,482 million, a decrease of $130 million, or 2%, from sales of $5,612 million in 2011. This decrease in sales is mainly attributable to a decrease in our average selling price for pulp (an impact of $184 million reflecting a selling price decrease of approximately 16% when compared to the average selling price of 2011) and paper (an impact of $26 million reflecting a selling price decrease of less than 1% when compared to the average selling price of 2011). In addition, volume for our paper sales decreased ($206 million, a decrease of approximately 6% when compared to 2011) and deliveries decreased in our Distribution segment ($95 million, a decrease in deliveries of approximately 14% when compared to 2011). These decreases were partially offset by the increase in sales due to the inclusion of a full year of sales from Attends US as well as the acquisition of Attends Europe and EAM in the repurchasefirst and second quarter of shares but2012, respectively ($328 million). We also had higher pulp shipments ($52 million, an increase of approximately 4% when compared to 2011).
Cost of Sales, excluding Depreciation and Amortization
Cost of sales, excluding depreciation and amortization, amounted to $4,321 million in 2012, an increase of $150 million, or 4%, compared to cost of sales, excluding depreciation and amortization, of $4,171 million in 2011. This increase is mainly attributable to the inclusion of a full year of cost of sales for Attends US, and the acquisition of Attends Europe and EAM in the first and second quarter of 2012, respectively, which resulted in an increase in cost of sales of $242 million. In addition, we had higher volume for pulp ($39 million), higher costs for chemicals and fiber ($30 million and $29 million, respectively), and higher fixed costs ($21 million due mostly to an increase in salaries and wages). These were partially offset by lower shipments for paper ($107 million), lower energy costs ($18 million), and lower purchased pulp costs ($10 million) as well as a decrease in cost of sales in the Distribution segment ($88 million) due to lower deliveries in 2012 when compared to 2011.
Depreciation and Amortization
Depreciation and amortization amounted to $385 million in 2012, an increase of $9 million, or 2%, compared to depreciation and amortization of $376 million in 2011. This increase is primarily due to the inclusion of depreciation and amortization expenses for a full year for Attends US and the acquisition of Attends Europe and EAM in the first and second quarter of 2012, respectively ($16 million). Depreciation and amortization charges decreased in the Pulp and Paper segment by $7 million primarily due to the permanent shut down of one of our paper machines at our Ashdown mill as well as certain assets reaching their useful lives.
Selling, General and Administrative Expenses
SG&A expenses amounted to $358 million in 2012, an increase of $18 million, or 5%, compared to SG&A expenses of $340 million in 2011. This increase in SG&A is primarily due to the inclusion of selling, general and administrative expenses for a full year for Attends US and the acquisition of Attends Europe and EAM in the first and second quarter of 2012, respectively, resulting in an increase of $31 million as well as increase in general administrative charges of $16 million due in part to an increase in merger and acquisition costs of $4 million. These increases were partially offset by a decrease of $17 million related to our short-term incentive plan and a gain of $12 million related to the curtailment of a post-retirement benefit plan in 2012.
Other Operating (Income) Loss
Other operating loss amounted to $7 million in 2012, an increase of $11 million compared to other operating income of $4 million in 2011. This increase in other operating loss is primarily due to net losses of $2 million from sales of property, plant and equipment and businesses in 2012 compared to net gains of $2$6 million which are recorded asin 2011. In addition, we had a negative impact of a stronger Canadian dollar on our working capital items ($5 million). These losses were partially offset by a decrease in environmental provision of $1 million, and a decrease in bad debt expense of $1 million.
Operating Income
Operating income in 2012 amounted to $367 million, a decrease of $225 million compared to operating income of $592 million in 2011, due mostly to the factors mentioned above. This decrease is partially offset by lower impairment and write-down of property, plant and equipment costs of $71 million (a component of Shareholders’ equity. All shares repurchased are recorded as Treasury stockImpairment and write-down of property, plant and equipment and intangible assets on the Consolidated Balance SheetsStatement of Earnings and Comprehensive Income). In 2012, we recorded $7 million of impairment on property, plant and equipment due to the permanent shut down of the pulp machine at our Kamloops mill, $5 million of impairment charges related to customer relationships in our Distribution segment and $2 million write-down of property, plant and equipment at our Mira Loma plant, compared to the $73 million accelerated depreciation charge related to the closure of a paper machine at our Ashdown mill (in the third quarter of 2011) and the $12 million impairment charge on assets at our Lebel-sur-Quévillion, Quebec pulp mill and sawmill (“Lebel-sur-Quévillion mill”) in 2011. In addition, we had lower closure and restructuring charges of $22 million when compare to 2011, primarily due to the closure of a paper machine at our Ashdown mill in 2011 as well as the withdrawal from two of our U.S. multiemployer plans where we incurred a withdrawal of $15 million in 2012 compared to $32 million in 2011. Additional information about impairment and write-down charges is included under the par value method at $0.01 per share.section “Impairment of Property, Plant & Equipment,” under the caption “Critical Accounting Policies” of this MD&A.
SubsequentInterest Expense
We incurred $131 million of net interest expense in 2012, an increase of $44 million compared to December 31, 2010,net interest expense of $87 million in 2011. This increase in interest expense is primarily due to the partial repurchase of our 10.75% Notes, 9.5% Notes, 7.125% Notes and 5.375% Notes, on which we repurchased 219,938 sharesincurred $47 million of tender premiums and $3 million of additional charges as a result of this extinguishment. In addition, there was an increase in interest expense of $16 million on the issuance of $300 million aggregate principal amount of senior 4.4% Notes due 2022 and $250 million aggregate principal amount of senior 6.25% Notes due 2042. These increases were offset by the decrease in interest expense of $15 million on the remaining 10.75% Notes, 9.5% Notes, 7.125% Notes and 5.375% Notes. We expect to have approximately $90 million of interest expense in 2013.
Income Taxes
For 2012, our income tax expense amounted to $58 million compared to a tax expense of $133 million in 2011, which approximated an effective tax rate of 25% and 26% for $202012 and 2011, respectively.
A number of items impacted the 2012 effective tax rate. We recognized a tax benefit of $10 million for the U.S. manufacturing deduction and recorded an $8 million tax benefit related to federal, state, and provincial credits and special deductions. The effective tax rate for 2012 was also impacted by an increase in our unrecognized tax benefits of $6 million, mainly accrued interest, and a $3 million benefit related to enacted tax law changes, mainly a tax rate reduction in Sweden, which is partially offset by U.S. tax law changes in several states.
A number of items impacted the 2011 effective tax rate. In 2011, we had a significantly larger manufacturing deduction in the U.S. than in prior years since we utilized the remaining federal net operating loss
carryforward in 2010. This deduction resulted in a tax benefit of $12 million and took deliverywe also recorded a $16 million tax benefit related to federal, state, and provincial credits and special deductions. Additionally, we recognized a state tax benefit of 394,791 shares upfront in respect$3 million due to structure share repurchase agreements of $40 million.the U.S. restructuring that impacted the 2011 effective tax rate by reducing state income tax expense.
Cellulosic Biofuel Credit
In July 2010, the U.S. Internal Revenue Service (“IRS”) Office of Chief Counsel released an Advice Memorandum concluding that qualifying cellulosecellulosic biofuel sold or used before January 1, 2010, qualifiesis eligible for the cellulosic biofuel producer credit (“CBPC”) and willwould not be required to be registered by the Environmental Protection Agency. Each gallon of qualifying cellulose biofuel produced by any taxpayer operating a pulp and paper mill and used as a fuel in the taxpayer’s trade or business during calendar year 2009 willwould qualify for the $1.01 non-refundable CBPC. A taxpayer willcould be able to claim the credit on its federal income tax return for the 2009 tax year upon the receipt of a letter of registration from the IRS and any unused CBPC maycould be carried forward until 20152016 to offset a portion of federal taxes otherwise payable.
We havehad approximately 207 million gallons of cellulose biofuel that qualifiesqualified for this CBPC for which we havehad not previously made claimsclaimed under the Alternative Fuel MixtureTax Credit (“AFMC”AFTC”) that representsrepresented approximately $209 million of CBPC or approximately $127 million of after tax benefit to the Corporation.Company. In July 2010, we submitted an application with the IRS to be registered for the CBPC and on September 28, 2010, we received our notification from the IRS that we arewere successfully registered. On October 15, 2010, the IRS Office of Chief Counsel issued an Advice Memorandum concluding that the AFMCAFTC and CBPC could be claimed in the same year for different volumes of black liquor.biofuel. In November 2010, we filed an amended 2009 tax return with the IRS claiming a cellulosic biofuel producer credit of $209 million and recorded a net tax benefit of $127 million in incomeIncome tax expense (benefit) on the Consolidated Statement of Earnings (Loss). As of December 31, 2010, approximately $170 million of this credit remains to offset future U.S. federal income tax liability.
Valuation Allowances
The Company released the valuation allowance on its Canadian net deferred tax assets during the fourth quarter of 2010. The full $164 million valuation allowance balance that existed at January 1st 2010 was either utilized during 2010 or reversed based on future projected income, which impacted the Canadian and overall consolidated effective tax rate.
Alternative Fuel Tax Credits
The U.S. Internal Revenue Code of 1986, as amended (the “Code”) permitted a refundable excise tax credit, until the end of 2009, for the production and use of alternative bio fuel mixtures derived from biomass. We submitted an application with the IRS to be registered as an alternative fuel mixer and received notification that our registration had been accepted in late March 2009. We began producing and consuming alternative fuel mixtures in February 2009 at our eligible mills. Although the credit ended at the end of 2009, in 2010, we recorded $25 million of such credits in Other operating loss (income) on the Consolidated Statement of Earnings (Loss) compared to $498 million in 2009. The $25 million represented an adjustment to amounts presented as deferred revenue at December 31, 2009 and was released to income following guidance issued by the IRS in March 2010. We recorded an income tax expense of $7 million in 2010 compared to $162 million in 2009 related to the alternative fuel mixture income. The amounts for the refundable credits are based on the volume of alternative bio fuel mixtures produced and burned during that period.
In 2009, we received a $140 million cash refund and another $368 million cash refund, net of federal income tax offsets, in 2010. Additional information regarding unrecognized tax benefits is included in Item 8, Financial Statements and Supplementary Data of this Annual Report on Form 10-K, under Note 9 “Income taxes.”
Following the sale of our Wood business on June 30, 2010, our reporting segments correspond to the following business activities: Papers and Paper Merchants. A description of our business is included in Part I, Item 1, Business of this Annual Report on Form 10-K.
Papers
We are the largest integrated manufacturer and marketer of uncoated freesheet paper in North America and the second largest in the world based on production capacity. We have 10 pulp and paper mills in operation (eight in the United States and two in Canada) with an annual paper production capacity of approximately 3.9 million tons of uncoated freesheet paper. Our paper manufacturing operations are supported by 14 converting and distribution operations including a network of 11 plants located offsite of our paper making operations. Also, we have forms manufacturing operations at two of the offsite converting and distribution operations and two stand-alone forms manufacturing operations. In addition we produce market pulp at our three non-integrated pulp mills in Kamloops, Dryden, and Plymouth as well as at our pulp and paper mills in Espanola, Ashdown, Hawesville, and Windsor.
We design, manufacture, market and distribute a wide range of fine paper products for a variety of consumers, including merchants, retail outlets, stationers, printers, publishers, converters and end-users. Approximately 81% of our paper production capacity is domestic and the remaining 19% is located in Canada. We also manufacture and sell pulp in excess of our internal requirements and we purchase papergrade pulp from third parties allowing us to optimize the logistics of our pulp capacity while reducing transportation costs. We have the capacity to sell approximately 1.5 million metric tons of pulp per year depending on market conditions. Approximately 38% of our trade pulp production capacity is domestic and the remaining 62% is located in Canada.
Paper Merchants
Our Paper Merchants business consists of an extensive network of strategically located paper distribution facilities, comprising the purchasing, warehousing, sale and distribution of our various products and those of other manufacturers. These products include business, printing and publishing papers and certain industrial products. These products are sold to a wide and diverse customer base, which includes small, medium and large commercial printers, publishers, quick copy firms, catalog and retail companies and institutional entities. Our
paper merchants operate in the United States and Canada under a single banner and umbrella name, Ariva. Ris Paper, part of Ariva, operates throughout the Northeast, Mid-Atlantic and Midwest areas from 18 locations in the United States, including 14 distribution centers serving customers across North America. In Canada, Ariva operates as Buntin Reid in three locations in Ontario; JBR/La Maison du Papier in two locations in Quebec; and The Paper House in two locations in Atlantic Canada.
Wood
Before the sale of our Wood business on June 30, 2010, our Wood business comprised the manufacturing, marketing and distribution of lumber and wood-based value-added products, and the management of forest resources. We operated seven sawmills with a production capacity of approximately 900 million board feet of lumber and one remanufacturing facility.
CONSOLIDATED RESULTS OF OPERATIONS AND SEGMENTS REVIEW
The following table includes the consolidated financial results of Domtar CorporationComprehensive Income for the year ended December 31, 2010, 2009 and 2008.2010. As of December 31, 2012, we have utilized all of the remaining credit.
FINANCIAL HIGHLIGHTS | Year ended December 31, 2010 | Year ended December 31, 2009 | Year ended December 31, 2008 | |||||||||
| (In millions of dollars, unless otherwise noted) | ||||||||||||
Sales | $ | 5,850 | $ | 5,465 | $ | 6,394 | ||||||
Operating income (loss) | 603 | 615 | (437 | ) | ||||||||
Net earnings (loss) | 605 | 310 | (573 | ) | ||||||||
Net earnings (loss) per common share (in dollars)(1): | ||||||||||||
Basic | 14.14 | 7.21 | (13.33 | ) | ||||||||
Diluted | 14.00 | 7.18 | (13.33 | ) | ||||||||
Operating income (loss) per segment: | ||||||||||||
Papers | $ | 667 | $ | 650 | ($369 | ) | ||||||
Paper Merchants | (3 | ) | 7 | 8 | ||||||||
Wood | (54 | ) | (42 | ) | (73 | ) | ||||||
Corporate | (7 | ) | — | (3 | ) | |||||||
Total | $ | 603 | $ | 615 | ($437 | ) | ||||||
| At December 31, 2010 | At December 31, 2009 | At December 31, 2008 | ||||||||||
Total assets | $ | 6,026 | $ | 6,519 | $ | 6,104 | ||||||
Total long-term debt, including current portion | $ | 827 | $ | 1,712 | $ | 2,128 | ||||||
YEAR ENDED DECEMBER 31, 2010 VERSUSValuation Allowances
YEAR ENDED DECEMBER 31, 2009
Sales
Sales for 2010 amounted to $5,850 million, an increase of $385 million, or 7%, from sales of $5,465 million in 2009. The increase in sales was mainly attributable to higher average selling prices for pulp and paper ($375 million and $145 million, respectively) as well as to higher shipments for pulp ($68 million), reflecting stronger market demand for pulp for the first half of 2010. These factors were partially offset by lower shipments for paper ($151 million) reflectingIn 2012, we recorded a decrease of 4% when compared to 2009 mostly due to the closure of our Columbus, Mississippi paper mill and the conversion to 100% fluff pulp production of our Plymouth pulp and paper mill. The sale of our Wood business in the second quarter of 2010 also partially offset this increase in sales.
Cost of Sales, excluding Depreciation and Amortization
Cost of sales, excluding depreciation and amortization, amounted to $4,417 million in 2010, a decrease of $55 million, or 1%, compared to cost of sales, excluding depreciation and amortization, of $4,472 million in 2009. This decrease was mainly attributable to lower shipments for paper ($151 million), lower chemical and energy costs ($55 million and $25 million, respectively) as well as due to the sale of our Wood business ($73 million) in the second quarter of 2010. These factors were partially offset by higher shipments for pulp ($68 million), higher maintenance costs ($83 million), higher fiber costs ($23 million), higher freight costs ($34 million) and the unfavorable impact of a stronger Canadian dollar on our Canadian denominated expenses, net of our hedging program ($46 million).
Depreciation and Amortization
Depreciation and amortization amounted to $395 million in 2010, a decrease of $10 million, or 2%, compared to depreciation and amortization of $405 million in 2009. This decrease is primarily due to the sale of our Wood business in the second quarter of 2010 and by the write-down of property, plant and equipment due to the permanent closure of a paper machine and manufacturing equipment in the first and last quarters of 2009 at our Plymouth pulp and paper mill. These factors were partially offset by the negative impact of a stronger Canadian dollar in 2010 when compared to 2009.
Selling, General and Administrative Expenses
SG&A expenses amounted to $338 million in 2010, a decrease of $7 million, or 2%, compared to SG&A expenses of $345 million in 2009. This decrease in SG&A is primarily due to a post-retirement curtailment gainvaluation allowance of $10 million related to the harmonization of certain of our post-retirement benefit plans. These factors were partially offset by the negative impact of a stronger Canadian dollar in 2010 when compared to 2009.
Other Operating Loss (Income)
Other operatingforeign loss amounted to $20carryforwards. Of this amount, $9 million in 2010, a decrease in other operating income of $517 million compared to other operating income of $497 million in 2009. This decrease in other operating income is primarily due to a refundable excise tax credithas been accounted for the production and use of alternative bio fuel mixtures of $25 million recognized in 2010 compared to $498 million recognized in 2009 as well as due to a loss on sale of our Wood business of $50 million recorded in 2010, partially offset by a gain on sale of our Woodland, Maine market pulp mill of $10 million recorded in 2010.
Operating Income
Operating income in 2010 amounted to $603 million, a decrease of $12 million compared to operating income of $615 million in 2009, in part due to the factors mentioned above, partially offset by lower closure and restructuring costs due to the closure of one paper machine at our Plymouth pulp and paper mill in the first quarter of 2009 and the subsequent announcement in the fourth quarter of 2009 of its conversion to 100% fluff pulp production. The decrease in operating income was also partially offset by an aggregate $50 million charge in 2010 for impairment and write-down of property, plant and equipment, compared to a $62 million charge in 2009. Additional information about impairment and write-down charges is included under the section “Impairment of Long-Lived assets,” under the caption “Critical Accounting Policies” of this MD&A.
Interest Expense
We incurred $155 million of interest expense in 2010, an increase of $30 million compared to interest expense of $125 million in 2009. This increase in interest expense is primarily due to a charge of $47 million incurred on the repurchase of the 5.375%, 7.125%business combination and 7.875% Notes in 2010, which included tender premiums and fees of $35$1 million and a net loss on the reversal of a fair value decrement of $12 million, as compared to a gain of $15 million related to the repurchase of the 7.875% Notes in 2009. This increase is partially offset by a lower long-term debt balance outstanding in 2010 compared to 2009.
Income Taxes
For 2010, our income tax benefit amounted to $157 million compared to a tax expense of $180 million for 2009.
During 2010, the Company recorded $25 million of income related to alternative fuel tax credits in Other operating loss (income) on the Consolidated Statement of Earnings (Loss). The $25 million represented an adjustment to amounts presented as deferred revenue at December 31, 2009 and was released to income following guidance issued by the IRS in March 2010. This income resulted in an income tax benefit of $9 million and an additional liability for uncertain income tax positions of $7 million, both of which impacted the U.S.overall consolidated effective tax rate for 2010. Additionally, the Company2012. In 2011, we recorded a netvaluation allowance of $4 million related to state tax benefit of $127 million from claiming a CBPCcredits in 2010 ($209 million of CBPC net of tax expense of $82 million), whichthe U.S. that we expect will expire prior to utilization. This impacted the U.S. effective tax rate. Finally, the Company released the valuation allowance on its Canadian net deferred tax assets during the fourth quarter of 2010. The full $164 million valuation allowance balance that existed at January 1st, 2010 was either utilized during 2010 or reversed at the end of 2010 based on future projected income, which impacted the Canadian and overall consolidated effective tax rate.rate for 2011.
Equity Loss
AsWe incurred a $6 million equity loss, net of December 31, 2009, the Company had a valuation allowancetaxes of $164 million on its Canadian net deferred tax assets, which primarily consisted of net operating losses, scientific research and experimental development expenditures not previously deducted and un-depreciated tax basis of property, plant, and equipment. Evaluating the need for an amount of a valuation allowance for deferred tax assets often requires significant judgment. All available evidence, both positive and negative, is considered when determining whether, based on the weight of that evidence, a valuation allowance is needed. Specifically, we evaluated the following items:
Historical income/(losses)—particularly the most recent three-year period
Reversals of future taxable temporary differences
Projected future income/(losses)
Tax planning strategies
Divestitures
Innil, with regard to our evaluation process, we give the most weight to historical income or losses. During the fourth quarter of 2010, after evaluating all available positive and negative evidence, although realization is not assured, we determined that it is more likely than not that the Canadian net deferred tax assets will be fully realizedjoint venture Celluforce Inc. in the future prior to expiration. Key factors contributing to this conclusion that the positive evidence ultimately outweighed existing negative evidence during the fourth quarter of 2010 included the fact that the Canadian operations, excluding the loss-generating Wood business (sold to a third party on June 30, 2010) and elements of other comprehensive income, went from a three-year cumulative loss position to a three-year cumulative income position during the fourth quarter of 2010; we have been able to demonstrate continual profitability throughout 2010; and are projected to continue to be profitable in the coming years.
During 2009, we recorded a net liability of $162 million for unrecognized income tax benefits associated with the alternative fuel mixture tax credits income. If our income tax positions with respect to the alternative fuel mixture tax credits are sustained, either all or in part, then we would recognize a tax benefit in the future equal to the amount of the benefits sustained. Our tax treatment of the income related to the alternative fuel mixture tax credits resulted in the recognition of a tax benefit of $36 million which impacted the U.S. effective tax rate. This credit expired December 31, 2009. The Canadian effective tax rate was impacted by the additional valuation allowance recorded against new Canadian deferred tax assets in the amount of $29 million during 2009.2012 (2011- $7 million).
Net Earnings
Net earnings amounted to $605$172 million ($14.004.76 per common share on a diluted basis) in 2010, an increase2012, a decrease of $295$193 million compared to net earnings of $310$365 million ($7.189.08 per common share on a diluted basis) in 2009,2011, mainly due to the factors mentioned above.
FOURTH QUARTER OVERVIEW
For the fourth quarter of 2010,2012, we reported operating income of $155$43 million, a decrease of $48$56 million compared to operating income of $203$99 million in the fourth quarter of 2009.2011. Overall, our core operating results for the fourth quarter of 2010 improved2012 declined when compared to the fourth quarter of 2009,2011, primarily due to our Pulp and Paper segment which experienced higher average($52 million). Average selling prices as well asdeclined quarter over quarter for both pulp and paper
($41 million) and the negative impact of lack-of-order and maintenance downtime increased by $14 million, mostly due to higher shipmentsdifficult market conditions. In addition, we had lower volume for pulp. These factors were partially offset by lower shipments forpulp and paper higher freight costs, higher maintenance costs and($6 million), the unfavorablenegative impact of a stronger Canadian dollar on our Canadian denominated expenses, net of our hedging program. Other items significantly impactingprogram ($8 million) and higher costs for fiber and chemicals ($7 million and $6 million, respectively). Operating income in our operating income comparability include no alternative fuelDistribution segment also decreased, mostly as a result of lower deliveries ($8 million). Our Personal Care segment, however, reported favorable results due to the acquisition of Attends Europe and EAM in the first and second quarter of 2012, respectively ($6 million).
Our effective tax credits recordedrate in the fourth quarter of 2010 compared2012 of 5% was primarily the result of a $3 million benefit related to $162 million pre-tax recordedenacted tax law changes, a tax rate reduction in the fourth quarter of 2009; a decreaseSweden which was partially offset by U.S. tax law changes in our closure and restructuring costs of $28 million due to our Plymouth pulp and paper mill reorganization in the fourth quarter of 2009; and a $27 million charge for impairment and write-down of property, plant and equipment in the fourth quarter of 2009 primarily associated with the accelerated depreciation of the aforementioned reorganization of our Plymouth pulp and paper millseveral states, and an impairment charge related to our Prince Albert facility.
Our effective tax rate benefit in the fourth quarteradditional $1 million of 2010 of 158% was primarily impacted by a tax benefit of $127 million from claiming a CBCP as well as a reversal of valuation allowance on Canadian deferred income tax balances of $100 million.federal credit.
YEAR ENDED DECEMBER 31, 20092011 VERSUS
YEAR ENDED DECEMBER 30, 200831, 2010
Sales
Sales for 20092011 amounted to $5,465$5,612 million, a decrease of $929$238 million, or 15%4%, from sales of $6,394$5,850 million in 2008.2010. The decrease in sales wasis mainly attributable to lower shipmentsthe closure of our Columbus, Mississippi paper mill (“Columbus mill”) in 2010, the sale of our Woodland, Maine market pulp mill (“Woodland mill”) in 2010 ($150 million) and the sale of our Wood business in 2010 ($139 million). In addition, volumes for paper ($612 million), reflecting
softer market demand for uncoated freesheet in our paper business which declined approximately 15% when compared to 2008, lower average selling prices for pulp and paper decreased ($239 million29 million) and $30 million, respectively)our Distribution segment decreased ($118 million) as a result of the sale of a business unit in the first quarter of 2011 and from difficult market conditions. This decrease was slightly offset by the increase in sales due to the acquisition of Attends US in 2011 ($71 million), lower shipments for our wood products and lower averageslightly higher selling prices ($34 million and $15 million, respectively) as well as lower deliveries forin all our Paper Merchants business. These factors were partially offset by higher shipments for pulpsegments ($11783 million) reflecting an increase of 12% when compared to 2008..
Cost of Sales, excluding Depreciation and Amortization
Cost of sales, excluding depreciation and amortization, amounted to $4,472$4,171 million in 2009,2011, a decrease of $753$246 million, or 14%6%, compared to cost of sales, excluding depreciation and amortization, of $5,225$4,417 million in 2008.2010. This decrease wasis mainly attributable to the impact of lower shipments for paperin our Pulp and Paper segment ($427140 million), lower freightin part due to the sale of our Woodland mill, and in our Distribution segment ($113 million) due to the sale of a business unit, and the sale of our Wood business ($131 million). In addition, there were decreased maintenance costs ($8834 million), lower costs for maintenanceenergy and fiber ($8633 million and $12 million, respectively). These factors were offset by the acquisition of Attends US in 2011 ($56 million), increased costs for chemicals and freight ($60 million and $33 million, respectively) and the favorablenegative impact of a weakerstronger Canadian dollar on our Canadian denominated expenses, net of our hedging program ($7837 million), lower costs for raw materials, including fiber ($31 million), energy ($22 million) and chemicals ($15 million), and the realization of savings stemming from restructuring activities. These factors were partially offset by higher shipments for pulp ($128 million), higher costs related to the increase in lack-of-order downtime and machine slowbacks ($109 million) as well as higher costs for our variable compensation program. In the first quarter of 2008, we also recorded the reversal of a provision for $23 million due to the early termination by the counterparty of an unfavorable contract..
Depreciation and Amortization
Depreciation and amortization amounted to $405$376 million in 2009,2011, a decrease of $58$19 million, or 13%5%, compared to depreciation and amortization of $463$395 million in 2008.2010. This decrease is primarily due to the implementationsale of restructuring activities in 2008 which resulted in impairment charges and write-down of property, plant and equipmentour Wood business in the fourthsecond quarter of 2008 at2010, the sale of our Dryden facility as well as impairment charges at our Columbus, Mississippi paperWoodland mill in the third quarter of 2010 and write-down of property, plant and equipment for accelerated depreciation due to the permanent closure of a paper machine at our Ashdown mill in the firstthird quarter of 2009 at our Plymouth pulp and paper. The decrease was also influenced2011, partially offset by the favorable impactacquisition of a weaker Canadian dollarAttends US in 2009 when compared to 2008.2011 of $4 million.
Selling, General and Administrative Expenses
SG&A expenses amounted to $345$340 million in 2009, a decrease2011, an increase of $55$2 million, or 14%1%, compared to SG&A expenses of $400$338 million in 2008.2010. This decreaseincrease in SG&A is primarily due to integration costsa post-retirement curtailment gain of $10 million recorded in 20082010, related to the harmonization of certain of our post-retirement benefit plans and the acquisition of Attends US in 2011 ($324 million) not recurring in 2009, the favorable impact of a weaker Canadian dollar ($13 million) as well as lower overall expenses resulting from cost reduction initiatives. These factors were partially. This is offset by higher costsa decrease of $12 million related to our variable compensation program.short-term incentive plan.
Other Operating Income(Income) Loss
Other operating income amounted to $497$4 million in 2009,2011, an increase of $489$24 million compared to other operating incomeloss of $8$20 million in 2008.2010. This increase in other operating income is primarily due to net gains of $6 million from the sale of property, plant and equipment and businesses compared to a $33 million net loss in 2010, which was driven by a gain on sale of our Woodland mill of $10 million, gain on sale of property, plant and equipment of $6 million, offset by a loss on sale of our Wood business of $50 million. Also, in 2010, other operating loss included a refundable excise tax credit for the production and use of alternative bio fuel mixtures of $498$25 million recognizedwhich did not recur in 2009 as well as gains on sales of land recorded in 2009 ($7 million), partially offset by a gain of $6 million related to the sale of trademarks recorded in the second quarter of 2008.2011.
Operating Income (Loss)
Operating income in 20092011 amounted to $615$592 million, an increasea decrease of $1,052$11 million compared to operating lossincome of $603 million in 2008 of $437 million, primarily2010, in part due to the alternative fuel tax credits recorded in 2009, partially offset by an aggregate $62 million charge in 2009 forfactors mentioned above, as well as higher impairment and write-down of property, plant and equipment comparedof $35 million, due to accelerated depreciation related to the announced closure of a $325 million charge forpaper machine at our Ashdown mill and the impairment of goodwillassets at our Lebel-sur-Quévillion mill, and intangible assets recordedhigher closure and restructuring costs ($25 million) in 2011 primarily due to the fourth
quarterwithdrawal from one of 2008,our U.S. multiemployer pension plans ($32 million) and a $383 million charge forrecorded loss from a pension curtailment associated with the impairment and write-down on property, plant and equipment in 2008.conversion of certain of our U.S. defined benefit pension plans to defined contribution plans. Additional information about impairment and write-down charges is included under the section “Impairment of Long-Lived assets,” under the caption “Critical Accounting Policies” of this MD&A. The increase is also attributable to the factors mentioned above. This increase was partially offset by higher closure and restructuring costs ($20 million) in 2009 when compared to 2008. The increase in closure and restructuring costs is primarily due to the aforementioned closure of one paper machine at our Plymouth pulp and paper mill in the first quarter of 2009 and the subsequent announcement in October 2009 of its conversion to 100% fluff pulp production, expected to be effective in the fourth quarter of 2010, as well as the closure of our paper machine at our Dryden pulp and paper mill effective in the fourth quarter of 2008.
Interest Expense
We incurred $125$87 million of net interest expense in 2009,2011, a decrease of $8$68 million compared to interest expense of $133$155 million in 2008.2010. This decrease in interest expense is primarily due to a gainthe repurchase of $15 million related to the reduction of the fair value increment associated with the portion of theour 5.375%, 7.125% and 7.875% Notes we repurchased inand the second quarter of 2009, lower long-term debt due to our repurchase of $60 million and $400 million aggregate principal amountrepayment of our outstanding 7.875% Notes due 2011,term loan in the fourth quarter of 20082010, on which we incurred tender premiums of $35 million, and second quartera net loss on the reversal of 2009, respectively, as well as lower interest rates in 2009 compared to 2008 with respect to our tranche B term loan. These factors were partially offset bya fair value decrement of $12 million. In addition, interest expense fromon the issuance5.375%, 7.125% and 7.875% Notes decreased by $21 million as a result of the 10.75% Notes due 2017 in the second quarter of 2009, a $4 million premium paid on the repurchase of our 7.875% Notes due 2011 in the second quarter of 2009 as well as tender expenses of $1 million.repurchase.
Income Taxes
For 2009,2011, our income tax expense amounted to $180$133 million compared to $3 million for 2008.
During 2009, we recorded a net liability of $162 million for unrecognized income tax benefits associated with the alternative fuel mixture tax credits income. If our income tax positions with respect to the alternative fuel mixture tax credits are sustained, either all or in part, then we would recognize a tax benefit in the future equal to the amount of the benefits sustained. Our tax treatment of the income related to the alternative fuel mixture tax credits resulted in the recognition of a tax benefit of $36$157 million for 2010, which approximated an effective tax rate of 26% and 35% for 2011 and 2010, respectively.
A number of items impacted the 2011 effective tax rate. For 2011, we had a significantly larger manufacturing deduction in the U.S. than in prior years since we utilized the remaining federal net operating loss carryforward in 2010. This deduction resulted in a tax benefit of $12 million and we also recorded a $16 million tax benefit related to federal, state, and provincial credits and special deductions. Additionally, we recognized a state tax benefit of $3 million due to the U.S. restructuring that impacted the 2011 effective tax rate by reducing state income tax expense.
During 2010, we recorded $25 million of income related to alternative fuel tax credits in Other operating (income) loss on the Consolidated Statement of Earnings and Comprehensive Income. The $25 million represented an adjustment to amounts presented as deferred revenue at December 31, 2009 and was released to income following guidance issued by the Internal Revenue Service (“IRS”) in March 2010. This income resulted in an income tax benefit of $9 million and an additional liability for uncertain income tax positions of $7 million, both of which impacted the U.S. effective tax rate for 2010. Additionally, we recorded a net tax benefit of $127 million from claiming a Cellulosic Biofuel Producer Credit in 2010 ($209 million of credit net of tax expense of $82 million), which also impacted the U.S. effective tax rate. Finally, we released the valuation allowance on our Canadian net deferred tax assets during the fourth quarter of 2010. The full $164 million valuation allowance
balance that existed at January 1, 2010, was either utilized during 2010, or reversed at the end of 2010, based on future projected income, which impacted the Canadian and overall consolidated effective tax rate.
Valuation Allowances
In 2011, we recorded a valuation allowance of $4 million related to state tax credits in the U.S. that we expect will expire prior to utilization. This credit expired December 31, 2009. The Canadianimpacted the U.S. and overall consolidated effective tax rate was impacted byfor 2011.
In 2010, we released the additional valuation allowance recorded against newon our Canadian net deferred tax assets induring the amountfourth quarter. The full $164 million valuation allowance balance that existed at January 1st, 2010, was either utilized during 2010 or reversed at the end of $29 million.
During 2008, we recorded a non-tax deductible goodwill impairment charge of $321 million and as a result, both2010, based on future projected income, which impacted the Canadian and U.S.consolidated effective tax rates were impacted. The Canadian effective tax rate was also impacted byrate.
Equity Earnings
We incurred a valuation allowance taken on the$7 million loss, net Canadian deferred tax assetsof taxes, with regards to our joint venture with Celluforce Inc. in the amount of $52 million.2011. Celluforce Inc. began operations in 2011.
Net Earnings (Loss)
Net earnings amounted to $310$365 million ($7.189.08 per common share on a diluted basis) in 2009, an increase2011, a decrease of $883$240 million compared to net lossearnings of $573$605 million ($13.3314.00 per common share on a diluted basis) in 20082010, mainly due to the charge for impairment of goodwill, property, plant and equipment and intangible assets recorded in the fourth quarter of 2008, as well as the other factors mentioned above.
PAPERSPULP AND PAPER
SELECTED INFORMATION | Year ended December 31, 2010 | Year ended December 31, 2009 | Year ended December 31, 2008 | Year ended December 31, 2012 | Year ended December 31, 2011 | Year ended December 31, 2010 | ||||||||||||||||||
| (In millions of dollars, unless otherwise noted) | ||||||||||||||||||||||||
| (In millions of dollars, unless otherwise noted) | ||||||||||||||||||||||||
Sales | ||||||||||||||||||||||||
Total sales | $ | 5,070 | $ | 4,632 | $ | 5,440 | $ | 4,575 | $ | 4,953 | $ | 5,070 | ||||||||||||
Intersegment sales | (229 | ) | (231 | ) | (276 | ) | ($ | 177 | ) | ($ | 193 | ) | ($ | 229 | ) | |||||||||
|
|
| ||||||||||||||||||||||
| $ | 4,841 | $ | 4,401 | $ | 5,164 | 4,398 | 4,760 | 4,841 | ||||||||||||||||
Operating income (loss) | 667 | 650 | (369 | ) | ||||||||||||||||||||
Operating income | 346 | 581 | 667 | |||||||||||||||||||||
Shipments | ||||||||||||||||||||||||
Paper (in thousands of ST) | 3,597 | 3,757 | 4,406 | 3,320 | 3,534 | 3,597 | ||||||||||||||||||
Pulp (in thousands of ADMT) | 1,662 | 1,539 | 1,372 | 1,557 | 1,497 | 1,662 | ||||||||||||||||||
Sales and Operating Income
Sales
Sales in our PapersPulp and Paper segment amounted to $4,841$4,398 million in 2010, an increase2012, a decrease of $440$362 million, or 10%8%, compared to sales of $4,401$4,760 million in 2009. The increase2011. This decrease in sales is mostly attributable to higherthe decrease in our average selling prices for pulp (an impact of $184 million reflecting a selling price decrease of approximately 16% when compared to the average selling price of 2011) and average selling prices for paper and higher(an impact of $26 million reflecting a selling price decrease of less than 1% when compared to the average selling prices for pulp,price of 2011), as well as higherlower shipments for pulpof paper ($206 million, a decrease of approximately 8%, reflecting stronger market demand for pulp in the first half of 2010. As a result of stronger market demand, we took lower lack-of-order downtime and machine slowdown in 20106% when compared to 2009.2011), in part due to decrease in demand for our paper. These factors were partially offset by loweran increase in pulp shipments for paper($52 million, an increase of approximately 4% when compared to 2011).
Sales in our Pulp and Paper segment amounted to $4,760 million in 2011, a decrease of $81 million, or 2%, compared to sales of $4,841 million in 2010. The decrease in sales is mostly attributable to lower shipments in both pulp (approximately 10%) and paper (approximately 2%), due to the exit from the coated groundwood market with the closure of our Columbus Mississippi paper mill and due to declining demand.
Sales inthe sale of our Papers segment amounted to $4,401 million in 2009, a decrease of $763 million, or 15%, compared to sales of $5,164 million in 2008. The decrease in sales is attributable to lower shipments for paper of approximately 15%, reflecting softer market demand for uncoated freesheet paper and coated groundwood, and lower averageWoodland mill, partially offset by increased selling prices forin pulp and paper. As a result of softer market demand for uncoated freesheet paper and coated groundwood, we also took higher lack-of-order downtime and machine slowdown in 2009 when compared to 2008, resulting in the availability of more market pulp as pulp shipments increased approximately 12%. As a result of the softer demand for uncoated freesheet paper, we have undertaken several restructuring activities. These activities include the reorganization of our Dryden paper mill at the end of 2007 and its subsequent closure in November 2008, the closure of our Port Edwards paper mill effective at the end of the second quarter of 2008, the closure of one paper machine at our Plymouth pulp and paper mill effective in the first quarter of 2009 and the announcement in October 2009 of its conversion to 100% fluff pulp production, completed in the fourth quarter of 2010.
Operating Income (Loss)
Operating income in our PapersPulp and Paper segment amounted to $667$346 million in 2010, an increase2012, a decrease of $17$235 million, when compared to operating income of $650$581 million in 2009.2011. Overall, our operating results improved in 2010declined when compared to 20092011 primarily due to higher averagelower selling prices for ourboth pulp and paper products. Our strategyas described above. Also contributing to the decrease in operating income were higher costs for chemicals and fiber ($30 million and $29 million, respectively), an increase in lack-of-order and maintenance downtime of maintaining$96 million, mostly due to decrease in demand for our production levels in line with our customer demand resulted in taking lack-of-order downtime and machine slowdowns of 30,000 tons of paper and nil metric tonsthe negative impact of pulp in 2010 compared to 467,000 tonsstronger Canadian dollar on our Canadian denominated expenses, net of paper and 261,000 metric tons of pulp in 2009. We saw an improvement in our pulp shipments, which experienced an 8% volume increase compared to 2009. In 2010, we also had lower chemicals and energy costs.hedging program ($3 million). These factors were partially offset by the decrease in energy costs ($18 million) in part due to a reduction in the price of natural gas due to high North-American supply, decrease in outside purchased pulp costs of $10 million due to a decrease in the market price of recycled fiber in 2012 when compared to 2011, and decrease in freight costs ($5 million). In addition, we had lower impairment and write-off of property, plant and equipment of $76 million and lower closure and restructuring costs of $24 million when compared to 2011, both of which are partially due to the permanent shut down of one of our paper machines at our Ashdown mill in the third quarter of 2011.
Operating income in our Pulp and Paper segment amounted to $581 million in 2011, a decrease of $86 million, when compared to operating income of $667 million in 2010. Overall, our operating results declined when compared to 2010 primarily due to increased impairment and write-off of property, plant and equipment of $35 million resulting from the impairments at our Ashdown mill and Lebel-sur-Quévillon mills and increased closure and restructuring of $25 million in alternative fuel tax credits recorded in 2010, comparedmainly due to our withdrawal from a U.S. multi-employer plan, and from a pension curtailment loss associated with the $498conversion of certain of our U.S. defined benefit pension plans to defined contribution pension plans. Our operating results also declined due to lower shipments as a result of pulp and paper as described above, higher costs for chemicals and freight ($60 million recorded in 2009 as well as by higher maintenance costs, higher fiber costs, higher freight costs and a$33 million, respectively), and the negative impact of a stronger Canadian dollar (net of our hedging program). Other items significantly impacting our operating income comparability include net gains on disposals of property,
plant and equipment and sale of businesses of $17 million recorded in 2010 compared to net losses of $4 million in 2009 and an aggregate $26 million charge in 2010 attributable to closure and restructuring costs compared to an aggregate $52 million charge in 2009.
Operating income in our Papers segment amounted to $650 million in 2009, an increase of $1,019 million, when compared to operating loss of $369 million in 2008, mostly attributable to the $498 million in alternative fuel tax credits recorded in 2009,($37 million), partially offset by the aggregate $62lower energy usage and fiber costs ($33 million charge for impairment and write-down of property, plant and equipment in 2009, compared to the aggregate $694$12 million, charge for impairment and write-down of goodwill and property, plant and equipment recorded in the fourth quarter of 2008. In addition, our operating income was impacted by lower freight costs, lower maintenance costs, the favorable impact of a weaker Canadian dollar, higher pulp shipments, lower cost for raw materials, including fiber, energy and chemicals, the realization of savings stemming from restructuring and synergy activities as well as lower depreciation and amortization expense. These factors were more than offset by lower shipments for paper, lower average selling prices for pulp and paper as well as higher closure and restructuring costs. In the first quarter of 2008, we also recorded the reversal of a provision for $23 million due to the early termination by the counterparty of an unfavorable contract.respectively).
Pricing Environment
Paper
Overall average sales prices in our paper business experienced a small increasedecrease of $5/ton or less than 1%, in 20102012 compared to 2009. Our overall2011. Overall average paper sales prices were higher by $44/in our paper business experienced a small increase of $17/ton, or 4%2%, in 20102011 compared to 2009.2010.
Pulp
Our average pulp sales prices experienced a large increase in 2010 compared to 2009. Our sales price increased by $224/significant decrease of $123/metric ton, or 43%16%, in 20102012 compared to 2009.2011. Our average pulp sales prices experienced a small increase in of $15/metric ton, or 2%, in 2011 compared to 2010.
Operations
Paper Shipments
Our paper shipments decreased by 160,000214,000 tons, or 4%6%, in 20102012 compared to 2009,2011, primarily due to a decrease in demand for our paper and the dedication of resources to produce lower basis weight grades at our Malboro, South Carolina pulp and paper mill in order to fulfill requirements per the Appleton agreement. Our paper shipments decreased by 63,000tons, or 2%, in 2011 compared to 2010, primarily due to the closure of our Columbus Mississippimill, the conversion of our Plymouth, North Carolina pulp and paper mill.mill (“Plymouth mill”) to 100% fluff pulp production and a decrease in demand for our paper.
Pulp Shipments
Our pulp trade shipments increased by 123,00060,000 metric tons, or 8%4%, in 20102012 compared to 2009. The2011. This increase is primarily due to lack-of-order downtime for paper. As such, we strategically increased our pulp production and third party sales. Our pulp trade shipments decreased by 165,000metric tons, or 10%, in 2011 compared to 2010. This decrease was primarily due to the sale of our hardwood market pulp mill in Woodland, Maine in the third quarter of 2010. Excluding shipments from our Woodland mill, our pulp trade shipments increased by 146,000 metric tons or 11% compared to 2010, which resulted mostly from an increase in market demanddemand.
Labor
In the U.S., an umbrella agreement with the United Steelworkers Union (“USW”) expiring in 2015 and affecting approximately 2,900 employees at eight U.S. mills and one converting operation was ratified effective December 1, 2011. This agreement only covers certain economic elements, and all other issues are negotiated at each operating location, as the related collective bargaining agreements (“CBAs”) become subject to renewal. The parties have agreed not to strike or lock-out during the terms of the respective local agreements. Should the parties fail to reach an agreement during the local negotiations, the related collective bargaining agreements are automatically renewed for another four years. All agreements in the U.S. are currently ratified.
In Canada, all agreements are ratified with the latest being the International Union of Operating Engineers (“IUOE”) local 865 at our Dryden, Ontario mill. This agreement was negotiated and ratified on November 6, 2012. Canadian collective agreements are unrelated to the umbrella agreement with the USW covering our U.S. locations.
On December 13, 2012, we announced the permanent shut down of our pulp machine at our Kamloops mill. This permanent closure will affect approximately 125 employees and layoffs and severances will begin in the second quarter of 2013. We will apply the CBA to develop a labor adjustment plan.
As of December 31, 2012 all unionized Pulp and Paper employees in the U.S. and Canada are covered by a ratified agreement (not a part of the Umbrella Agreement expiring in 2015).
Closure and Restructuring
In 2012, we incurred $27 million of closure and restructuring costs ($136 million in 2011), and $9 million of impairment and write-down of property, plant and equipment and intangible assets in 2012 ($85 million in 2011).
Closure and restructuring costs are based on management’s best estimates. Although we do not anticipate significant changes, actual costs may differ from these estimates due to subsequent developments such as the results of environmental studies, the ability to find a buyer for assets set to be dismantled and demolished and other business developments. As such, additional costs and further write-downs may be required in future periods.
In 2011, we decided to withdraw from one of our multiemployer pension plans and recorded a withdrawal liability and a charge to earnings of $32 million. In 2012, as a result of a revision in the estimated withdrawal liability, we recorded a further charge to earnings of $14 million. Also in 2012, we withdrew from a second multiemployer pension plan and recorded a withdrawal liability and a charge to earnings of $1 million. While this is our best estimate of the ultimate cost of the withdrawal from these plans at December 31, 2012, additional withdrawal liabilities may be incurred based on the final fund assessment expected to occur in the second quarter of 2013. Further, we remain liable for potential additional withdrawal liabilities to the fund in the event of a mass withdrawal, as defined by statute, occurring anytime within the next three years.
We also incurred, in the fourth quarter of 2011, a $9 million loss from an estimated pension curtailment associated with the conversion of certain of our U.S. defined benefit pension plans to defined contribution pension plans recorded as a component of closure and restructuring costs.
Kamloops, British Columbia pulp mill—2012
On December 13, 2012, we announced the permanent shut down of a pulp machine at our Kamloops mill. This decision will result in a permanent curtailment of our annual pulp production by approximately 120,000 ADMT of sawdust softwood pulp and will affect approximately 125 employees. As a result of this permanent shutdown, we recorded $7 million of impairment on property, plant and equipment, $5 million of severance and termination costs and a $4 million write-down of inventory. The pulp machine is expected to be closed by the end of March 2013.
Mira Loma, California converting plant—2012
During the first quarter of 2012, we recorded a $2 million write-down of property, plant and equipment at our Mira Loma plant, in Impairment and write-down of property, plant and equipment and intangible assets.
Lebel-sur-Quévillon, Quebec pulp mill and sawmill—2011 and 2012
Operations at the pulp mill were idled in November 2005 due to unfavorable economic conditions and the sawmill was indefinitely idled in 2006 and then permanently closed in 2008. At the time, the pulp mill and sawmill employed approximately 425 and 140 employees, respectively. The Lebel-sur-Quévillon mill had an annual production capacity of 300,000 metric tons. During 2011, we reversed $2 million of severance and termination costs related to our Lebel-sur-Quévillon mill and following the signing of a definitive agreement for the first halfsale of our Lebel-sur-Quévillon assets, we recorded a $12 million impairment and write-down of property, plant and equipment and intangible assets relating to the remaining assets net book value. During the second quarter of 2012, we concluded the sale of our pulp and sawmill assets to a buyer and our land related to those assets to a subsidiary of the Government of Quebec for net proceeds of $1, respectively.
Ashdown, Arkansas pulp and paper mill—2011
On March 29, 2011, we announced that we would permanently shut down one of four paper machines at our Ashdown mill. This measure reduced our annual uncoated freesheet paper production capacity by approximately 125,000 short tons. The mill’s workforce was reduced by approximately 110 employees. As a result of this permanent shutdown, we recorded a $1 million write-down of inventory and $1 million of severance and termination costs as well as $73 million of accelerated depreciation (a component of Impairment and write-down of property, plant and equipment and intangible assets on the Consolidated Statement of Earnings and Comprehensive Income). Operations ceased on August 1, 2011.
Plymouth, North Carolina pulp mill (formerly a pulp and paper mill)—2010 and 2011
In 2010, as a result of the decision to permanently shut down the remaining paper machine and convert the Plymouth facility to 100% fluff pulp production in the fourth quarter of 2009, we recognized in Impairment and write-down of property, plant and equipment, a $1 million write-down to the related paper machine and $39 million of accelerated depreciation. We also recorded a $1 million write-down of inventory related to the reconfiguration of the Plymouth mill. During 2011, we reversed $2 million of severance and termination costs.
Cerritos, California forms converting plant—2011
During the second quarter of 2010, we announced the closure of our Cerritos, California forms converting plant (“Cerritos plant”), and recorded a $1 million write-down for the related assets (a component of Impairment and write-down of property, plant and equipment and intangible assets on the Consolidated Statement of Earnings and Comprehensive Income), and $1 million in severance and termination costs. Operations ceased on July 16, 2010.
Columbus, Mississippi paper mill—2010
On March 16, 2010, we announced that we would permanently close our coated groundwood paper mill in Columbus, Mississippi. This measure resulted in the permanent curtailment of 238,000 tons of coated
groundwood and 70,000 metric tons of thermo-mechanical pulp, as well as affected approximately 219 employees. We recorded a $9 million write-down for the related fixed assets, $8 million of severance and termination costs and a $8 million of write-down of inventory. Operations ceased in April 2010.
During 2012, other costs related to previous and ongoing closures include $1 million in severance and termination costs, a $1 million write-down of inventory, $2 million in pension and $3 million in other costs (2011: $4 million, $1 million, nil and $4 million, respectively and 2010: $3 million, nil, nil and $6 million, respectively).
For more details on the closure and restructuring costs, refer to Part II, Item 8, Financial Statements and Supplementary Data of this Annual Report on Form 10-K, under Note 16 “Closure and restructuring costs and liabilities.”
Sale of Woodland, Maine hardwood market pulp mill—2010
On September 30, 2010, we sold our Woodland hardwood market pulp mill (“Woodland mill”), hydro electric assets and related assets, located in Baileyville, Maine and New Brunswick, Canada. The purchase price was for an aggregate value of $60 million plus net working capital of $8 million. The sale resulted in a gain on disposal of the Woodland mill of $10 million, net of related pension curtailments costs of $2 million and has been recorded as a component of other operating loss (income) on the Consolidated Statement of Earnings and Comprehensive Income. The Woodland mill was our only non-integrated hardwood market pulp mill. The mill had an annual production capacity of 395,000 metric tons and approximately 300 employees.
Other
Natural Resources Canada Pulp and Paper Green Transformation Program
On June 17, 2009, the Government of Canada announced that it was developing a Pulp and Paper Green Transformation Program (“the Green Transformation Program”) to help pulp and paper companies make investments to improve the environmental performance of their Canadian facilities. The Green Transformation Program was capped at CDN$1 billion. The funding of capital investments at eligible mills had to be completed no later than March 31, 2012 and all projects were subject to the approval of the Government of Canada.
We were allocated CDN$144 million through this Green Transformation Program, of which all was approved. The funds were spent on capital projects to improve energy efficiency and environmental performance in our Canadian pulp and paper mills and any amounts received were accounted for as an offset to the applicable plant and equipment asset amount. As of December 31, 2012, we have received a total of $143 million (CDN $143 million) (CDN $17 million in 2012, CDN$73 million in 2011 and CDN$53 million in 2010), mostly related to eligible projects at our Kamloops, Dryden and Windsor pulp and paper mills.
Alternative Fuel Tax Credits
The U.S. Internal Revenue Code of 1986, as amended (the “Code”) permitted a refundable excise tax credit, until the end of 2009, for the production and use of alternative bio fuelbiofuel mixtures derived from biomass. We submitted an application with the IRS to be registered as an alternative fuel mixer and received notification that our registration had been accepted in late March 2009. We began producing and consuming alternative fuel mixtures in February 2009 at our eligible mills. Although the credit ended at the end of 2009, in 2010, we recorded $25 million of such credits in Other operating (income) loss (income) on the Consolidated Statement of Earnings (Loss) compared to $498 million in 2009.and Comprehensive Income. The $25 million represented an adjustment to amounts presented as deferred revenue at December 31, 2009, and was released to income following guidance issued by the IRS in March 2010. We recorded an income tax expense of $7 million in 2010 compared to $162 million in 2009 related to the alternative fuel mixture income. The amounts for the refundable credits are based on the volume of alternative bio fuel mixtures produced and burned during that period.
In 2009, we received a $140 million cash refund and another $368 million cash refund, net of federal income tax offsets, in 2010. Additional information regarding unrecognized tax benefits is included in Item 8, Financial Statements and Supplementary Data of this Annual Report on Form 10-K, under Note 9 “Income taxes.”
Labor
We have an umbrella agreement with the United Steelworkers Union (“USW”), expiring in 2012, affecting approximately 3,000 employees at our U.S. locations. This agreement only covers certain economic elements, and all other issues are negotiated at each operating location, as the related collective bargaining agreements become subject to renewal. The parties have agreed not to strike or lock-out during the terms of the respective local agreements. Should the parties fail to reach an agreement during the local negotiations, the related collective bargaining agreements are automatically renewed for another four years.
We have four collective agreements that expired in 2010, one of which expired in April at our Windsor facility in Quebec, Canada, which is currently in negotiation with the Confederation of National Trade Unions (“CNTU”), two that expired in May at our Nekoosa, Wisconsin facility, which negotiations have been completed with two ratification agreements, and one that expired in August at our Hawesville, Kentucky facility, for which negotiations are completed and the terms of the USW umbrella agreement applies. At our Kingsport, Tennessee facility, local negotiations with the USW have begun in February 2011 for the agreement that expired at the end of January 2011.
Agreements that expired in 2009 at our Dryden and Espanola facilities in Canada are scheduled for negotiation with the Communication, Energy and Paperworkers Union of Canada (“CEP”). In Espanola, negotiations started in late 2010 while in Dryden, negotiations are delayed at this time. These Canadian collective agreements are unrelated to the umbrella agreement with the USW covering our U.S. locations.
Closure and Restructuring
In 2010, we incurred $76 million of closure and restructuring costs ($114 million in 2009), including the impairment and write-down of property, plant and equipment of $50 million in 2010, compared to $62 million in 2009. For more details on the closure and restructuring costs, refer to Item 8, Financial Statements and Supplementary Data, Note 14, of this Annual Report on Form 10-K.
Closure and restructuring costs are based on management’s best estimates. Although the Company does not anticipate significant changes, actual costs may differ from these estimates due to subsequent developments such as the results of environmental studies, the ability to find a buyer for assets set to be dismantled and demolished and other business developments. As such, additional costs and further write-downs may be required in future periods.
2010
In November 2010, we announced the start up of our new fluff pulp machine in Plymouth, North Carolina, which has an annual production capacity of approximately 444,000 metric tons. The conversion of our Plymouth pulp and paper mill in 2009 is discussed below.
In July 2010, we announced our decision to end all manufacturing activities at our forms converting plant in Cerritos, California. Operations ceased on July 16, 2010. Approximately 50 plant employees were impacted by this decision.
In March 2010, we announced the permanent closure of our coated groundwood paper mill in Columbus, Mississippi. Operations ceased in April 2010. This measure resulted in the permanent curtailment of approximately 238,000 tons of coated groundwood production capacity per year as well as approximately 70,000 metric tons of thermo-mechanical pulp, and affected 219 employees.
2009
Our Prince Albert pulp and paper mill was closed in the first quarter of 2006 and has not been operated since. In December 2009, we decided to dismantle our Prince Albert facility. We removed machinery and equipment from the site and may take further steps to engage the services of demolition contractors and file for a demolition permit, but in the meantime, we are evaluating other options for the site. The dismantling of the paper machine and converting equipment was completed in 2008. As a result of a review of current options for the disposal of the assets of this facility in the fourth quarter of 2009, we revised the estimated net realizable values of the remaining assets and recorded a non-cash write-down of $14 million in the fourth quarter of 2009, related to fixed assets, mainly a turbine and a boiler. The write-down represents the difference between the new estimated liquidation or salvage value of the fixed assets and their carrying values.
In February 2009, we announced the permanent shut down of a paper machine at our Plymouth pulp and paper mill, effective at the end of February 2009. This measure resulted in the permanent curtailment of 293,000 tons of paper production capacity per year and affected approximately 185 employees. In October 2009, we announced that we would convert our Plymouth pulp and paper mill to 100% fluff pulp production at a cost of $74 million. Our annual fluff pulp making capacity has increased to 444,000 metric tons. The mill conversion also resulted in the permanent shut down of Plymouth’s remaining paper machine with an annual production capacity of 199,000 tons. The mill conversion helped preserve approximately 360 positions. In connection with this announcement, we recognized $13 million of accelerated depreciation in the fourth quarter of 2009, and a further $39 million of accelerated depreciation over the first nine months of 2010 was recorded in relation to the assets that ceased productive use in October 2010. The remaining assets of this facility have been tested for impairment at the time of this 2009 announcement and no additional impairment charge was required.
Our Woodland pulp mill, which was indefinitely idled in May 2009, was reopened effective June 26, 2009, and substantially all employees were called back to work in June for the restart of pulp production. Our Woodland pulp mill has an annual hardwood production capacity of approximately 398,000 metric tons, and approximately 300 employees were reinstated. The timely benefits from the refundable tax credits for the production and use of alternative bio fuel mixtures, and other important conditions, such as stronger global demand, improving prices and favorable currency exchange rates made the reopening possible. We sold our Woodland pulp mill on September 30, 2010.
In April 2009, we announced that we would idle our Dryden pulp facility for approximately ten weeks, effective April 25, 2009. This decision was taken in response to continued weak global demand for pulp and the need to manage inventory levels. Our Dryden pulp mill has an annual softwood pulp production capacity of 319,000 metric tons. Our Dryden pulp mill restarted its pulp production in July 2009.
Other
Natural Resources Canada Pulp and Paper Green Transformation Program
On June 17, 2009, the Government of Canada announced that it was developing a Pulp and Paper Green Transformation Program (“the Green Transformation Program”) to help pulp and paper companies make investments to improve the environmental performance of their Canadian facilities. The Green Transformation Program is capped at CDN$1 billion. The funding of capital investments at eligible mills must be completed no later than March 31, 2012 and all projects are subject to the approval of the Government of Canada.
Eligible projects must demonstrate an environmental benefit by either improving energy efficiency or increasing renewable energy production. Although amounts will not be received until qualifying capital expenditures have been made, we have been allocated $144 million (CDN$143 million) through this Green Transformation Program, of which, $138 million (CDN$137 million) has been approved to date. The funds are to be spent on capital projects to improve energy efficiency and environmental performance in our Canadian pulp
and paper mills and any amounts received will be accounted for as an offset to the applicable plant and equipment asset amount. As of December 31, 2010, we have received $51 million (CDN$53 million) mostly related to eligible projects at our Kamloops, Dryden and Windsor pulp and paper mills.
PAPER MERCHANTSDISTRIBUTION
SELECTED INFORMATION | Year ended December 31, 2010 | Year ended December 31, 2009 | Year ended December 31, 2008 | Year ended December 31, 2012 | Year ended December 31, 2011 | Year ended December 31, 2010 | ||||||||||||||||||
| (In millions of dollars) | ||||||||||||||||||||||||
| (In millions of dollars) | ||||||||||||||||||||||||
Sales | $ | 870 | $ | 873 | $ | 990 | $ | 685 | $ | 781 | $ | 870 | ||||||||||||
Operating income (loss) | (3 | ) | 7 | 8 | (16 | ) | — | (3 | ) | |||||||||||||||
Sales and Operating Income
Sales
Sales in our Paper MerchantsDistribution segment amounted to $870$685 million in 2010,2012, a decrease of $3$96 million compared to sales of $873$781 million in 2009.2011. This decrease in sales is mostly attributable to a decrease in shipmentsdeliveries of approximately 2%.14%, resulting from difficult market conditions as well as the sale of a business unit at the end of the first quarter of 2011.
Sales in our Paper MerchantsDistribution segment amounted to $873$781 million in 2009,2011, a decrease of $117$89 million compared to sales of $990$870 million in 2008.2010. This decrease in sales wasis mostly attributable to softer market demand which resulted in a decrease in shipments of approximately 9%, as well as a decrease in selling prices.
Operating Income (Loss)
Operating loss amounted to $3 million in 2010, a decrease in operating income of $10 million when compared to operating income of $7 million in 2009. The decrease in operating income is attributable to margins temporarily contracting due to supplier price increases, as well as to a decrease in deliveries in 2010 when compared to 2009.
Operating income amounted to $7 million in 2009, a decrease of $1 million when compared to operating income of $8 million in 2008. The decrease in operating income is attributable to a decrease in shipments in 2009 when compared to 2008, and an increase in closure and restructuring costs of $2 million in 2009. The factors were partially offset by lower SG&A costs in 2009 when compared to 2008.
Operations
Labor
We have collective agreements covering six locations in the U.S.14%, of which one expired in 2010, two will expire in 2011 and three will expire in 2013. We have four collective agreements covering four locations in Canada, of which one expired in 2008, one expired in 2009 and two expired in 2010.
WOOD
SELECTED INFORMATION | Year ended December 31, 2010 | Year ended December 31, 2009 | Year ended December 31, 2008 | |||||||||
| (In millions of dollars, unless otherwise noted) | ||||||||||||
Sales | $ | 150 | $ | 211 | $ | 268 | ||||||
Intersegment sales | (11 | ) | (20 | ) | (28 | ) | ||||||
| 139 | 191 | 240 | ||||||||||
Operating loss | (54 | ) | (42 | ) | (73 | ) | ||||||
Shipments (millions of FBM) | 351 | 574 | 677 | |||||||||
Benchmark prices (1): | ||||||||||||
Lumber G.L. 2x4x8 stud ($/MFBM) | $ | 348 | $ | 259 | $ | 280 | ||||||
Lumber G.L. 2x4 R/L no. 1 & no. 2 ($/MFBM) | 350 | 270 | 304 | |||||||||
Sale of Wood business
On June 30, 2010, the Company sold its Wood business to EACOM and exited the manufacturing and marketing of lumber and wood-based value-added products. Domtar has fiber supply agreements in place with its former wood division at its Dryden and Espanola facilities. Since these continuing cash outflows are expected to be significant to the former Wood business,resulting from the sale of the Wooda business did not qualify as a discontinued operation under ASC 205-20.
Sales
Sales in our Wood segment amounted to $139 million in 2010, a decrease of $52 million, or 27%, compared to sales of $191 million in 2009. The decrease in sales is attributable to a decrease in shipments due to the sale of our Wood businessunit at the end of the secondfirst quarter of 2010, partially offset by an increase in sales attributable to higher average selling prices for wood products.
Sales in our Wood segment amounted to $191 million in 2009, a decrease of $49 million, or 20%, compared to sales of $240 million in 2008. The decrease in sales is attributable to the slowdown in the U.S. housing industry which resulted in lower average selling prices2011 and lower shipments for wood products.from difficult market conditions.
Operating Loss
Operating loss in the Wood segment amounted to $54$16 million in 2010,2012, an increase of $12$16 million when compared to an operating loss of $42 millionnil in 2009, mostly2011. The increase in operating loss is attributable to the decrease in deliveries, lower margins as well as a write-off of intangible assets of $5 million in 2012.
Operating income amounted to nil in 2011, an increase of $3 million when compared to operating loss of $3 million in 2010. The increase in operating income is attributable to the gain on sale of our Wooda business unit of $50$3 million recordedat the end of the first quarter of 2011.
Operations
Labor
We have collective agreements covering six locations in the second quarterU.S. and four locations in Canada. As of 2010, partially offset by higher margins.December 31, 2012, we have no outstanding agreements and ten ratified agreements affecting approximately 155 employees in the U.S. and Canada.
Operating loss
Impairment of Intangible Assets
Deterioration in sales and operating results of Ariva U.S., a subsidiary included in our WoodDistribution segment, amountedhas led us to $42recognize an impairment charge of $5 million in 2009, a decrease in operating loss of $31 million compared to an operating loss of $73 million in 2008, mostly attributable to the aggregate $14 million charge for impairmentunder Impairment and write-down of property, plant and equipment and intangible assets related to customer relationships in 2008. This decreaseour Distribution segment as a result of the revised long-term forecast used in operating loss is also attributable to the favorable impact of a weaker Canadian dollar in 2009 when compared to 2008, lower depreciation and amortization expense due to the write-down of property, plant and equipmentour annual budget exercise in the fourth quarter of 2008, lower SG&A expenses2012.
PERSONAL CARE
SELECTED INFORMATION | Year ended December 31, 2012 | Year ended December 31, 2011 | Year ended December 31, 2010 | |||||||||
| (In millions of dollars) | ||||||||||||
Sales | $ | 399 | $ | 71 | N/A | |||||||
Operating income | 45 | 7 | N/A | |||||||||
Sales and Operating Income
Sales
Sales in our Personal Care segment amounted to $399 million in 2012, an increase of $328 million, when compared to sales of $71 million in 2011. This increase is mainly due to the inclusion of a full year of Attends US of $140 million, as well as gainsthe acquisition of $8 million on sales of landAttends Europe and EAM in the thirdfirst and second quarter of 2009 and a gain2012, respectively, of $3$189 million.
Sales in our Personal Care segment amounted to $71 million for the year ended December 31, 2011, representing only four months of operations of Attends US, following the completion of the acquisition on September 1, 2011.
For more details on the dissolutionAttends Europe and EAM acquisitions, refer to Part II, Item 8, Financial Statement and Supplementary Data of this Annual Report on Form 10-K , under Note 3 “Acquisition of Businesses.”
Operating Income
Operating income amounted to $45 million in 2012, an increase of $38 million, when compared to operating income of $7 million in 2011. This increase is mainly due to the inclusion of a subsidiaryfull year of Attends US as well as the acquisition of Attends Europe and EAM in the first and second quarter of 2012, respectively. This increase was partially offset by an increase in selling, general and administrative costs, mostly due to the creation of our new divisional head office in Raleigh, North Carolina for our Personal Care segment.
Operating income amounted to $7 million for the year ended December 31, 2011, representing only four months of operations, following the completion of the acquisition of Attends US and included the negative impact of purchase accounting fair value adjustments of $1 million.
Operations
Labor
We employ approximately 832 employees in our Personal Care segment. Approximately 374 non-unionized employees are in North America, including 54 employees at EAM and 458 employees are in Europe of which the majority are unionized.
WOOD
SELECTED INFORMATION | Year ended December 31, 2012 | Year ended December 31, 2011 | Year ended December 31, 2010 | |||||||||
| (In millions of dollars, unless otherwise noted) | ||||||||||||
Sales (1) | $ | — | $ | — | $ | 150 | ||||||
Intersegment sales | $ | — | $ | — | (11 | ) | ||||||
|
|
|
|
|
| |||||||
| $ | — | $ | — | 139 | ||||||||
Operating loss (1) | $ | — | $ | — | (54 | ) | ||||||
| (1) | Sale of Wood Business |
On June 30, 2010, we sold our Wood business to EACOM Timber Corporation (“EACOM”) and exited the manufacturing and marketing of lumber and wood-based value-added products. The sale followed the obtainment of various third party consents and customary closing conditions, which included approvals of transfers of cutting rights in Quebec and Ontario, for proceeds of $75 million (CDN$80 million) plus elements of working capital of approximately $42 million (CDN$45 million). We received 19% of the proceeds in shares of EACOM representing an approximate 12% ownership interest in EACOM. The sale resulted in a loss on disposal of the Wood business and related pension and other post-retirement benefit plan curtailments and settlements of $50 million, which was recorded in the second quarter of 2009. These factors were partially offset by lower average selling prices2010 in Other operating (income) loss on the Consolidated Statement of Earnings and lower shipmentsComprehensive Income. Our investment in EACOM was then accounted for under the equity method.
The transaction included the sale of our wood productsfive operating sawmills: Timmins, Nairn Centre and Gogama in Ontario, and Val-d’Or and Matagami in Quebec; as well as higher closuretwo non-operating sawmills: Ear Falls in Ontario and restructuring costs. Our second quarterSte-Marie in Quebec. The sawmills had approximately 3.5 million cubic meters of 2008 alsoannual harvesting rights and a production capacity of close to 900 million board feet. Also included ain the transaction was the Sullivan remanufacturing facility in Quebec and our interests in two investments: Anthony-Domtar Inc. and Elk Lake Planning Mill Limited.
In December 2010, in an unrelated transaction, we sold our remaining investment in EACOM Timber Corporation for CDN$0.51 per common share for net proceeds of $24 million (CDN$24 million) resulting in no further gain of approximately $1 million onor loss. We have fiber supply agreements in place with our former wood division at our Espanola mill. Since these continuing cash outflows are expected to be significant to the former Wood business, the sale of our investment in Olav Haavaldsrud Timber Company Limited (“Haavaldsrud”).the Wood business did not qualify as a discontinued operation under Accounting Standards Codification 205-20.
STOCK-BASED COMPENSATION EXPENSE
In May 2010, a numberUnder the Omnibus Incentive Plan (the “Omnibus Plan”), we may award to key employees and non-employee directors at the discretion of new equity awards were granted, consistingthe Board of Directors’ Human Resources Committee, non-qualified stock options, incentive stock options, stock appreciation rights, restricted stock units, non-qualifiedperformance-conditioned restricted stock optionsunits, performance share units, deferred share units and performance stock options,other stock-based awards which are subject to service, and for certain awards, to performance conditions. We generally grant awards annually and we use, when available, treasury stock to fulfill awards settled in common stock and options exercises.
For the year ended December 31, 2010,2012, compensation expense recognized in our results of operations was approximately $25$20 million (2011—$23 million; 2010—$25 million) for all of the outstanding awards, compared to $27 million in 2009.awards. Compensation costs not yet recognized amounted to approximately $22$11 million in 2010 (2009—(2011—$2116 million; 2010—$22 million), and will be recognized over the remaining service period.period of approximately 25 months. The aggregate value of liability awards settled in 2012 was $35 million. The total fair value of shares vested in 2012 was $6 million. Compensation costs for performance awards are based on management’s best estimate of the final
performance measurement. As a result of stock-based compensation awards exercised during the period, we recognized a $1 million tax benefit, which is included in Additional paid-in capital in the Consolidated Balance Sheets.
LIQUIDITY AND CAPITAL RESOURCES
Our principal cash requirements are for ongoing operating costs, pension contributions, working capital and capital expenditures, as well as principal and interest payments on our debt. We expect to fund our liquidity needs primarily with internally generated funds from our operations and, to the extent necessary, through borrowings under our contractually committed credit facility, of which $700$588 million is currently undrawn and available or through our receivables securitization program, of which $112 million is currently undrawn and available. Under extreme market conditions, there can be no assurance that this agreement would be available or sufficient. See “Capital Resources” below.
Our ability to make payments on and to refinance our indebtedness, including debt we could incur under the credit facility and outstanding Domtar Corporation notes, and for ongoing operating costs including pension contributions, working capital, and capital expenditures, as well as principal and interest payments on our debt, will depend on our ability to generate cash in the future, which is subject to general economic, financial, competitive, legislative, regulatory and other factors that are beyond our control. Our credit facility and debt indentures, as well as terms of any future indebtedness, impose, or may impose, various restrictions and covenants on us that could limit our ability to respond to market conditions, to provide for unanticipated capital investments or to take advantage of business opportunities.
Operating Activities
Cash flows provided from operating activities totaled $1,166$551 million in 2010,2012, a $374$332 million increasedecrease compared to $883 million in 2011. This decrease in cash flows provided from operating activities is primarily due to a decrease in profitability and the negative impact of $792the $47 million tender premiums paid on the partial repurchase of our 10.75% Notes, 9.5% Notes, 7.125% Notes and 5.375% Notes.
Cash flows provided from operating activities totaled $883 million in 2009.2011, a $283 million decrease compared to $1,166 million in 2010. This increasedecrease in cash flows provided from operating activities is primarily related to the $368 million cash received in the second quarter of 2010 recorded as a receivable in 2009, with regards to the alternative fuel tax credits, as well as increased profitability. This is partially offset by a lower source of cash in 2010 as a result of a higher decrease in inventory levels in 2009 than in 2010 and an increase in our pension and post-retirement contributions over expenses of $59 million.credits.
Our operating cash flow requirements are primarily for salaries and benefits, the purchase of fiber, energy and raw materials and other expenses such as property taxes.
Investing Activities
Cash flows provided fromused for investing activities in 20102012 amounted to $58$486 million, a $143$91 million increase compared to cash flows used for investing activities of $85$395 million in 2009.2011. This increase in cash flows used for investing activities is due to the increase in additions to property, plant and equipment of $92 million due mainly to additions in the Personal Care segment as well as increased spending in the Pulp and Paper segment for upgrades and modifications to our existing assets. This increase is also due to the acquisition of Attends Europe in the first quarter of 2012 for $232 million (€173 million) and the acquisition of EAM in the second quarter of 2012 for $61 million, compared to the prior year acquisition of Attends US for $288 million.
Our annual capital expenditures are expected to be between $260 million and $280 million, or 67% and 73% of our estimated annual depreciation expense in 2013.
Cash flows used for investing activities in 2011 amounted to $395 million, a $453 million decrease compared to cash flows provided from investing activities of $58 million in 2010. This decrease in cash flows provided from investing activities is primarily related to the acquisition of Attends US for $288 million. In addition, there were lower proceeds from the sale of our Woodland, Maine millbusinesses and investments of $64$175 million anddue to the proceeds from disposalprior year sale of our Wood business of $121 million,and our Woodland mill. This was partially offset by higherlower capital spending of $47$9 million in 2010 when compared to 2009.2011.
We intend to limit our annual capital expenditures to below 50% of annual depreciation expense in 2011, excluding the spending under the Natural Resources Canada Pulp and Paper Green Transformation Program, for which we expect to be reimbursed.
Financing Activities
Cash flows used forprovided from financing activities totaled $1,018$152 million in 20102012 compared to cash flows used for financing activities of $414$574 million in 2009.2011. This $604$726 million increase in cash flows provided from financing activities is mainly attributable to the issuance of $250 million of 6.25% Notes due 2042 in the third quarter of 2012 and the issuance of $300 million of 4.4% Notes due 2022 in the first quarter of 2012 and is offset by the impact of the cash tender offer during the second quarter of 2012. In the tender offer, we repurchased $1 million of 5.375% Notes due 2013, $47 million of 7.125% Notes due 2015, $31 million of 9.5% Notes due 2016 and $107 million of 10.75% Notes due 2017, for a total cash consideration of $186 million, excluding accrued and unpaid interest. Also, we repurchased shares of our common stock for a total cost of $157 million in 2012 compared to $494 million in 2011 and made dividend payments of $58 million in 2012 compared to $49 million in 2011.
Cash flows used for financing activities totaled $574 million in 2011 compared to $1,018 million in 2010. This $444 million decrease in cash flows used for financing activities is mainly attributable to the repurchase of our 7.875%10.75% Notes of $135for $15 million in the fourth quarter of 2010,2011 versus the repayment in full of our tranche B term loan offor $336 million and the repurchase of $238$560 million of our 5.375%, 7.125% and 7.875% Notes due 2013 and $187in 2010. These factors were partially offset by higher common stock repurchases of $494 million of our 7.125% Notes due 2015 pursuantin 2011 when compared to a cash tender offer in the second quarter of 2010. In addition, we used $44 million for a common stock repurchase, $35in 2010 as well as dividend payments of $49 million for debt repurchase premiums and fees andin 2011 compared to $21 million for dividend payments. This compares to the repurchase of approximately $400 million of our 7.875% Notes due 2011, the repurchase of approximately $38 million of our 5.375% Notes due 2013, the issuance of long-term debt of $385 million, the repayment of $270 million of our tranche B term loan and the repayment of borrowings under our revolving credit facility in 2009.2010.
Capital Resources
Net indebtedness, consisting of bank indebtedness and long-term debt, net of cash and cash equivalents, was $320$564 million at December 31, 2010,2012, compared to $1,431$404 million at December 31, 2009.2011. The $1,111$160 million decreaseincrease in net indebtedness is primarily due to a higher cashdebt level as wella result of the issuance of $250 million of 6.25% Notes due 2042 in the third quarter of 2012 and the issuance of $300 million of 4.4% Notes due 2022 in the first quarter of 2012, offset by the partial repayment of the 5.375%, 7.125%, 9.50% and 10.75% Notes in the second quarter of 2012. Also contributing to the increase in net indebtedness was the use of cash related to the acquisition of Attends Europe ($232 million) and EAM ($61 million).
Unsecured Notes Tender
As a result of a cash tender offer during the first quarter of 2012, we repurchased $1 million of the 5.375% Notes due 2013, $47 million of the 7.125% Notes due 2015, $31 million of the 9.5% Notes due 2016 and $107 million of the 10.75% Notes due 2017. We incurred $47 million of tender premiums and additional charges of $3 million as a result of this extinguishment, both of which are included in Interest expense in the Consolidated Statements of Earnings and Comprehensive Income.
During the third quarter of 2011, we repurchased $15 million of the 10.75% Notes due 2017 and recorded a charge of $4 million on repurchase of ourthe Notes.
On October 19, 2010, we redeemed $135 million of the 7.875% Notes due 2011, and recorded a charge of $135$7 million inrelated to the fourthrepurchase of the Notes.
As a result of the cash tender offer during the second quarter of 2010, the repayment in full of our tranche B term loan of $336 million and the repurchase ofwe repurchased $238 million of ourthe 5.375% Notes due 2013 and $187 million of ourthe 7.125% Notes due 2015. We recorded a charge of $40 million related to the repurchase of the Notes.
Senior Notes Offering
On August 20, 2012, we issued $250 million of 6.25% Notes due 2042 for net proceeds of $247 million. The net proceeds from the offering of the Notes were placed in short-term investment vehicles pending being used for general corporate purposes.
On March 7, 2012, we issued $300 million of 4.4% Notes due 2022, for net proceeds of $297 million. The net proceeds from the offering of the Notes were used to fund a portion of the purchase of the 5.375% Notes due 2013, 7.125% Notes due 2015, 9.5% Notes due 2016 and 10.75% Notes due 2017 tendered and accepted by us pursuant to a cash tender offer, including the payment of accrued interest and applicable early tender premiums, not funded with cash on hand, as well as for general corporate purposes.
The Notes are redeemable, in whole or in part, at our option at any time. In the event of a change in control, each holder will have the right to require us to repurchase all or any part of such holder’s Notes at a purchase price in cash equal to 101% of the principal amount of the Notes, plus any accrued and unpaid interest. The Notes are unsecured obligations and rank equally with existing and future unsecured and unsubordinated indebtedness. The Notes are fully and unconditionally guaranteed on an unsecured basis by direct and indirect, existing and future, U.S. 100% owned subsidiaries, which currently guarantee indebtedness under the Credit Agreement as well as our other unsecured unsubordinated indebtedness.
Bank Facility
On June 15, 2012, we amended and restated our existing Credit Agreement (the “Credit Agreement”), among us, certain subsidiary borrowers, certain subsidiary guarantors and the lenders and agents party thereto. The Credit Agreement amended our existing $600 million revolving credit facility that was scheduled to mature June 23, 2015.
The Credit Agreement provides for a revolving credit facility (including a letter of credit sub-facility and a swingline sub-facility) that matures on June 15, 2017. The maximum aggregate amount of availability under the revolving Credit Agreement is $600 million, which may be borrowed in U.S. Dollars, Canadian Dollars (in an amount up to the Canadian Dollar equivalent of $150 million) and Euros (in an amount up to the Euro equivalent of $200 million). Borrowings may be made by us, by our U.S. subsidiary Domtar Paper Company, LLC, by our Canadian subsidiary Domtar Inc. and by any additional borrower designated by us in accordance with the Credit Agreement. We may increase the maximum aggregate amount of availability under the revolving Credit Agreement by up to $400 million, and the Borrowers may extend the final maturity of the Credit Agreement by one year, if, in each case, certain conditions are satisfied, including (i) the absence of any event of default or default under the Credit Agreement and (ii) the consent of the lenders participating in each such increase or extension, as applicable.
Borrowings under the Credit Agreement will bear interest at a rate dependent on our credit ratings at the time of such borrowing and will be calculated at the Borrowers’ option according to a base rate, prime rate, LIBO rate, EURIBO rate or the Canadian bankers’ acceptance rate plus an applicable margin, as the case may be. In addition, we must pay facility fees quarterly at rates dependent on our credit ratings.
The Credit Agreement contains customary covenants, including two financial covenants: (i) an interest coverage ratio as defined in the second quarter of 2010.
Our Credit Agreement, consiststhat must be maintained at a level of not less than 3 to 1 and (ii) a $750 million senior secured revolving credit facility. Noleverage ratio, as defined in the Credit Agreement, that must be maintained at a level of not greater than 3.75 to 1. At December 31, 2012, we were in compliance with our covenants, and no amounts were drawn and outstanding at Decemberborrowed (December 31, 2010 (2009—$6 million recorded in bank indebtedness)2011—nil). At December 31, 2010,2012, we had outstanding letters of credit amounting to $50$12 million under this credit facility (2009—(December 31, 2011—$5329 million). The revolving credit facility may be used by the Company, Domtar Paper Company, LLC and Domtar Inc. for general corporate purposes and a portion is available for letters of credit. Borrowings by the Company and Domtar Paper Company, LLC
All borrowings under the revolving credit facilityCredit Agreement are available in U.S. dollars, and borrowings by Domtar Inc.unsecured. However, certain of our domestic subsidiaries will unconditionally guarantee any obligations from time to time arising under the revolving credit facilityCredit Agreement, and certain of our subsidiaries that are availablenot organized in U.S. dollars and/or Canadian dollars and are limited to $150 million (orthe United States will unconditionally guarantee any obligations of Domtar Inc., the Canadian dollar equivalent thereof).
The revolving credit facility matures on March 7, 2012. Amounts drawnsubsidiary borrower, or of additional borrowers that are not organized in the United States, under the revolving credit facility bear annual interest at either a Eurodollar rate plus a margin of between 1.25% and 2.25%, or an alternate base rate plus a margin of between 0.25% and 1.25%. Amounts drawn under the revolving credit facility by Domtar Inc. in U.S. dollars bear annual interest at either a Eurodollar rate plus a margin of between 1.25% and 2.25%, or a U.S. base rate plus a margin of between 0.25% and 1.25%. Amounts drawn under the revolving credit facility by Domtar Inc. in Canadian dollars bear annual interest at the Canadian prime rate plus a margin of between 0.25% and 1.25%. Domtar Inc. may also issue bankers’ acceptances denominated in Canadian dollars which are subject to an acceptance fee, payable on the date of acceptance, which is calculated at a rate per annum equal to between 1.25% and 2.25%. The interest rate margins and the acceptance fee,Credit Agreement, in each case, with respectsubject to the revolving credit facility, are subject to change based on the Company’s consolidated leverage ratio.
The Credit Agreement contains a number of covenants that, among other things, limit the abilityprovisions of the Company and its subsidiaries to make capital expenditures and place restrictions on other matters customarily restricted in senior secured credit facilities, including restrictions on indebtedness (including guarantee obligations), liens (including sale and leasebacks), fundamental changes, sales or dispositionCredit Agreement.
If there is a change of property or assets, investments (including loans, advances, guarantees and acquisitions), transactions with affiliates, hedge agreements, changes in fiscal periods, environmental activity, optional payments and modifications of other material debt instruments, negative pledges and agreements restricting subsidiary distributions and changes in lines of business. As longcontrol, as the revolving credit commitments are outstanding, we are required to comply with a consolidated EBITDA (as defined under the Credit Agreement) to consolidated cash interest coverage ratio of greater than 2.5xAgreement, the Credit Agreement will be terminated and a consolidated debt to consolidated EBITDA (as definedany outstanding obligations under the Credit Agreement) ratio of less than 4.5x. At December 31, 2010, we were in compliance with our covenants.Agreement will automatically become immediately due and payable.
A significant or prolonged downturn in general business and economic conditions may affect our ability to comply with our covenants or meet those financial ratios and tests and could require us to take action to reduce our debt or to act in a manner contrary to our current business objectives.
A breach of any of our Credit Agreement or indenture covenants, orincluding failure to maintain a required ratio or meet a required test, may result in an event of default under those agreements.the Credit Agreement. This may allow the counterparties to those agreementsadministrative agent under the Credit Agreement to declare all amounts outstanding thereunder, together with accrued interest, to be immediately due and payable. If this occurs, we may not be able to refinance the indebtedness on favorable terms, or at all, or repay the accelerated indebtedness.
The Company’s direct and indirect, existing and future, U.S. 100% owned subsidiaries serve as guarantors of the senior secured credit facilities for any obligations thereunder of the U.S. borrowers, subject to agreed exceptions. The Company and its subsidiaries serve as guarantors of Domtar Inc.’s obligations as a borrower under the senior secured credit facilities, subject to agreed exceptions. Domtar Inc. does not guarantee Domtar Corporation’s obligations under the Credit Agreement.
On March 18, 2010, we entered into the Second Amendment to our Credit Agreement, dated March 7, 2007. The Second Amendment amended the Credit Agreement to permit the Company and its subsidiaries to make any optional or voluntary payment, prepayment, repurchase or redemption of or otherwise optionally or voluntarily defease or segregate funds with respect to all or a portion of the Company’s Unsecured notes, so long as the consolidated senior secured leverage ratio of the Company does not exceed 1.5 to 1 and at least 50% of the revolving credit commitments under the credit agreement are unutilized, in each case at the time of prepayment and giving effect thereto.
Our obligations in respect to the senior secured credit facilities are secured by all of the equity interests of the Company’s direct and indirect U.S. subsidiaries, other than 65% of the equity interests of the Company’s direct and indirect “first-tier” foreign subsidiaries, subject to agreed exceptions, and a perfected first priority security interest in substantially all of the Company’s and its direct and indirect U.S. subsidiaries’ tangible and intangible assets. The obligations of Domtar Inc., and the obligations of the non-U.S. guarantors, in respect of the senior secured credit facilities are secured by all of the equity interests of the Company’s direct and indirect subsidiaries, subject to agreed exceptions, and a perfected first priority security interest, lien and hypothec in the inventory of Domtar Inc., its immediate parent, and its direct and indirect subsidiaries.
Receivables Securitization
The Company usesWe have a receivables securitization program that matures in November 2013, with a utilization limit for borrowings or letters of certain receivables to provide additional liquidity to fund our operations, particularly when it is cost effective to do so. The costscredit of $150 million.
At December 31, 2012, we had no borrowings and $38 million of letters of credit under the program may vary based on changes in interest rates. The Company’s securitization program consists of the sale of our domestic receivables to a bankruptcy remote consolidated subsidiary which, in turn, transfers a senior beneficial interest in them to a special purpose entity managed by a financial institution for multiple sellers of receivables. The program normally allows the daily sale of new receivables to replace those that have been collected. We retain a subordinated interest which is included in Receivables on the Consolidated Balance Sheets(December 31, 2011—nil and will be collected only after the senior beneficial interest has been settled. The book value of the retained subordinated interest approximates fair value. Fair value is determined on a discounted cash flow basis. The Company retains responsibility for servicing the receivables sold but does not record a servicing asset or liability as the fees received by the Company for this service approximate the fair value of the services rendered.
$28 million, respectively). The program contains provisions restricting its availability if certain termination events, occurwhich include, but are not limited to, matters related to receivable performance, or if a default occurs under our credit facility.
In November 2010, the agreement governing this receivables securitization program was amended and extended to mature in November 2013. The available proceeds that may be receivedcertain defaults occurring under the program are
limited to $150 million. At December 31, 2010 no amounts werecredit facility, and certain judgments being entered against us or our subsidiaries that remain outstanding under the program (2009—$20 million). The accounting treatment with respect to the transfers of such receivables has changed in January 2010 with the amendment of the “Transfer and Servicing” topic issued by the FASB, please refer to Item 8, Financial Statements and Supplementary Data, Note 2, of this Annual Report on Form 10-K for additional information. Sales of receivables under this program are accounted for as secured borrowings in 2010 and were accounted for as off balance sheet financing in 2009. Before 2010, gains and losses on securitization of receivables were calculated as the difference between the carrying amount of the receivables sold and the sum of the cash proceeds upon sale and the fair value of the retained subordinated interest in such receivables on the date of the transfer.
In 2010, a net charge of $2 million (2009—$2 million; 2008—$5 million) resulted from the programs described above and was included in Interest expense in the Consolidated Statements of Earnings (Loss). The net cash outflow in 2010, from the reduction of senior beneficial interest under the program was $20 million (2009—$90 million).60 consecutive days.
Domtar Canada Paper Inc. Exchangeable Shares
Upon the consummation of a series of transactions whereby the Transaction,Fine Paper Business of Weyerhaeuser Company was transferred to the Company and the Company acquired Domtar Inc. (the “Transaction”), Domtar Inc. shareholders had the option to receive either common stock of the Company or shares of Domtar (Canada) Paper Inc. that are exchangeable for common stock of the Company. As of December 31, 2010,2012, there were 812,694607,814 exchangeable shares issued and outstanding. The exchangeable shares of Domtar (Canada) Paper Inc. are intended to be substantially the economic equivalent to shares of the Company’s common stock. These shareholders may exchange the exchangeable shares for shares of Domtar Corporation common stock on a one-for-one basis at any time. The exchangeable shares may be redeemed by Domtar (Canada) Paper Inc. on a redemption date to be set by the Board of Directors, which cannot be prior to July 31, 2023, or upon the occurrence of certain specified events, including, upon at least 60 days prior written notice to the holders, in the event less than 416,667 exchangeable shares (excluding any exchangeable shares held directly or indirectly by us) are outstanding at any time. Additional information regarding the exchangeable shares is included in Part II, Item 8, Financial Statements and Supplementary Data of this Annual Report on Form 10-K, under Note 20 “Shareholder’s equity.”
OFF BALANCE SHEET ARRANGEMENTS
In the normal course of business, we finance certain of our activities off balance sheet through operating leases.
Indemnifications
In the normal course of business, we offer indemnifications relating to the sale of our businesses and real estate. In general, these indemnifications may relate to claims from past business operations, the failure to abide by covenants and the breach of representations and warranties included in sales agreements. Typically, such representations and warranties relate to taxation, environmental, product and employee matters. The terms of these indemnification agreements are generally for an unlimited period of time. At December 31, 2010,2012, we are unable to estimate the potential maximum liabilities for these types of indemnification guarantees as the amounts are contingent upon the outcome of future events, the nature and likelihood of which cannot be reasonably estimated at this time. Accordingly, no provisionsprovision has been recorded. These indemnifications have not yielded significant expenses in the past.
Tax Sharing Agreement
In conjunction with the Transaction, we signed a Tax Sharing Agreement that governs both our and Weyerhaeuser’s rights and obligations after the Transaction with respect to taxes for both pre and post-Distribution periods in regards to ordinary course taxes, and also covers related administrative matters. The Distribution refers to the distribution of shares of the Company to Weyerhaeuser shareholders. We will generally be required to indemnify Weyerhaeuser and Weyerhaeuser shareholders against any tax resulting from the Distribution if that tax results from an act or omission to act by us after the Distribution. If Weyerhaeuser,
however, should recognize a gain on the Distribution for reasons not related to an act or omission to act by the Company after the Distribution, Weyerhaeuser would be responsible for such taxes and would not be entitled to indemnification by us under the Tax Sharing Agreement.
Pension Plans
We have indemnified and held harmless the trustees of our pension funds, and the respective officers, directors, employees and agents of such trustees, from any and all costs and expenses arising out of the performance of their obligations under the relevant trust agreements, including in respect of their reliance on authorized instructions from us or for failing to act in the absence of authorized instructions. These indemnifications survive the termination of such agreements. At December 31, 2010,2012, we hadhave not recorded a liability associated with these indemnifications, as we do not expect to make any payments pertaining to these indemnifications.
E.B. Eddy Acquisition
On July 31, 1998, Domtar Inc. (now a 100% owned subsidiary of Domtar Corporation) acquired all of the issued and outstanding shares of E.B. Eddy Limited and E.B. Eddy Paper, Inc. (“E.B. Eddy”), an integrated producer of specialty paper and wood products. The purchase agreement includesincluded a purchase price adjustment whereby, in the event of the acquisition by a third-partythird party of more than 50% of the shares of Domtar Inc. in specified circumstances, Domtar Inc. may be required to pay an increase in consideration of up to a maximum of $121 million (CDN$120 million), an amount which is gradually declining over a 25-year period. At March 7, 2007, the maximum amount of the purchase price adjustment was approximately $111 million (CDN$110 million).
On March 14, 2007, we received a letter from George Weston Limited (the previous owner of E.B. Eddy and a party to the purchase agreement) demanding payment of $111 million (CDN$110 million) as a result of the consummation of the Transaction. On June 12, 2007, an action was commenced by George Weston Limited against Domtar Inc. in the Superior Court of Justice of the Province of Ontario, Canada, claiming that the consummation of the Transaction triggered the purchase price adjustment and sought a purchase price adjustment of $111 million (CDN$110 million) as well as additional compensatory damages. On March 31, 2011, George Weston Limited filed a motion for summary judgment. On September 3, 2012, the Court directed that this matter proceed to examinations for discovery and trial, rather than proceed by way of summary judgment. The trial is expected to commence on October 21, 2013. We do not believe that the consummation of the Transaction triggers an obligation to pay an increase in consideration under the purchase price adjustment and intendintends to defend ourselves vigorously against any claims with respect thereto. However, we may not be successful in ourthe defense of such claims, and if we are ultimately required to pay an increase in consideration, such payment may have a material adverse effect on our financial position, results of operations or cash flows. No provision is recorded for this potential purchase price adjustment.matter.
CONTRACTUAL OBLIGATIONS AND COMMERCIAL COMMITMENTS
In the normal course of business, we enter into certain contractual obligations and commercial commitments. The following tables provide our obligations and commitments at December 31, 2010:
CONTRACTUAL OBLIGATIONS2012:
CONTRACT TYPE | 2011 | 2012 | 2013 | 2014 | 2015 | THEREAFTER | TOTAL | 2013 | 2014 | 2015 | 2016 | 2017 | THEREAFTER | TOTAL | ||||||||||||||||||||||||||||||||||||||||||
| (in million of dollars) | ||||||||||||||||||||||||||||||||||||||||||||||||||||||||
Notes | — | — | $ | 74 | — | $ | 213 | $ | 525 | $ | 812 | |||||||||||||||||||||||||||||||||||||||||||||
Capital leases | 3 | 4 | 3 | 4 | 3 | 15 | 32 | |||||||||||||||||||||||||||||||||||||||||||||||||
| (in million of dollars) | ||||||||||||||||||||||||||||||||||||||||||||||||||||||||
Notes (excluding interest) | $ | 72 | — | $ | 167 | $ | 94 | $ | 278 | $ | 550 | $ | 1,161 | |||||||||||||||||||||||||||||||||||||||||||
Capital leases (including interest) | 9 | 8 | 6 | 6 | 4 | 37 | 70 | |||||||||||||||||||||||||||||||||||||||||||||||||
|
|
|
|
|
|
| ||||||||||||||||||||||||||||||||||||||||||||||||||
Long-term debt | 3 | 4 | 77 | 4 | 216 | 540 | 844 | 81 | 8 | 173 | 100 | 282 | 587 | 1,231 | ||||||||||||||||||||||||||||||||||||||||||
Operating leases | 25 | 17 | 11 | 9 | 4 | 5 | 71 | 30 | 23 | 14 | 8 | 5 | 14 | 94 | ||||||||||||||||||||||||||||||||||||||||||
Liabilities related to uncertain tax benefits(1) | — | — | — | — | — | — | 242 | — | — | — | — | — | — | 254 | ||||||||||||||||||||||||||||||||||||||||||
|
|
|
|
|
|
| ||||||||||||||||||||||||||||||||||||||||||||||||||
Total obligations | $ | 28 | $ | 21 | $ | 88 | $ | 13 | $ | 220 | $ | 545 | $ | 1,157 | $ | 111 | $ | 31 | $ | 187 | $ | 108 | $ | 287 | $ | 601 | 1,579 | |||||||||||||||||||||||||||||
|
|
|
|
|
|
| ||||||||||||||||||||||||||||||||||||||||||||||||||
COMMERCIAL OBLIGATIONS
COMMITMENT TYPE | 2011 | 2012 | 2013 | 2014 | 2015 | THEREAFTER | TOTAL | |||||||||||||||||||||
| (in million of dollars) | ||||||||||||||||||||||||||||
Other commercial commitments(2) | $ | 83 | $ | 24 | $ | 4 | $ | 3 | $ | 3 | $ | 4 | $ | 121 | ||||||||||||||
COMMITMENT TYPE Other commercial commitments(2) 2013 2014 2015 2016 2017 THEREAFTER TOTAL (in million of dollars) $ 112 $ 7 $ 5 $ 3 $ 3 $ 1 $ 131
| (1) | We have recognized total liabilities related to uncertain tax benefits of |
| (2) | Includes commitments to purchase property, plant and equipment, roundwood, wood chips, gas and certain chemicals. Purchase orders in the normal course of business are excluded. |
In addition, we expect to contribute a minimum total amount of $53$25 million to the pension plans in 2011.2013.
For 20112013 and the foreseeable future, we expect cash flows from operations and from our various sources of financing to be sufficient to meet our contractual obligations and commercial commitments.
RECENT ACCOUNTING PRONOUNCEMENTSCHANGES IMPLEMENTED
Accounting Change Implemented in 2010
Transfers of financial AssetsComprehensive Income
In June 2009,2011, the Financial Accounting Standards Board (“FASB”) issued changes to the presentation of comprehensive income. These changes give an entity the option to present the total of comprehensive income, the components of net income, and the components of other comprehensive income either in a single continuous statement of comprehensive income or in two separate but consecutive statements. The option to present components of other comprehensive income as part of the statement of changes in stockholders’ equity was eliminated. The nature of the items that must be reported in other comprehensive income and the requirements for reclassification from other comprehensive income to net income were not changed. Additionally, no changes were made to the calculation and presentation of earnings per share. We adopted the new requirement on January 1, 2012 with no impact on the consolidated financial statements except for the change in presentation. We have chosen to present a single continuous statement of comprehensive income.
Intangibles—Goodwill and Other
In July 2012, the FASB issued Accountingan update to Intangibles—Goodwill and Other, which simplifies how entities test indefinite-lived intangible assets for Transfers of Financial Assets, which amends the derecognition guidance requiredimpairment by the Transfers and Servicing Topic of FASB ASC. Some of the major changes undertaken by this amendment include:
Eliminating the concept of a Qualified Special Purpose Entity (“QSPE”) since the FASB believes, on the basis of recent experience, that many entities that have been accounted for as QSPEs are not truly passive, a belief that challenges the premise on which the QSPE exception was based.
Modifying the derecognition provisions as required by the Transfers and Servicing Topic of FASB ASC. Specifically aimed to:
transfers of individual or groups of financial assets in their entirety and
transfers of participating interests.
The new amendment is effective for financial asset transfers occurring after the beginning ofpermitting an entity’sentity to first fiscal year that begins after November 15, 2009. The Company adopted the new requirements on January 1, 2010. Upon adoption, the new guidance resulted in an increase in Subordinated interest in securitized receivables of $20 million presented in Receivables and a corresponding increase in Long-term debt due within one year in the Consolidated Balance Sheet.
Variable Interest Entities
In June and December 2009, the FASB issued guidance which requires an enterprise to perform an analysisassess qualitative factors to determine whether it is more likely than not that the enterprise’s variable interest or interests giveindefinite-lived intangible asset is impaired. If the entity concludes that it a controlling financial interest in a variable interest entity. This guidance requires ongoing reassessments of whether an enterprise is more likely than not that the primary beneficiary of a variable interest entity, eliminatesindefinite-lived intangible asset is impaired, then it is required to perform the quantitative approach previously required for determining the primary beneficiary of a variable interest entity and requires enhanced disclosures that will provide users of financial statements with more transparent information about an enterprise’s involvement in a variable interestimpairment test.
entity. This guidance isThe amended provisions are effective for annual and interim impairment tests performed for fiscal years beginning after NovemberSeptember 15, 2009, and for interim and annual reporting periods thereafter. The Company2012 with early adoption permitted. We adopted the new requirements on January 1, 2010requirement as of its publication date with no significant impact as the Company has no interests in variable interest entities.on our consolidated financial statements.
Future Accounting ChangesFUTURE ACCOUNTING CHANGES
Fair Value DisclosuresComprehensive Income
In January 2010,February 2013, the FASB issued an Updateupdate to Comprehensive Income, which requires an entity to provide information regarding the amounts reclassified out of accumulated other comprehensive income by component. The standard requires that companies present either in a single note or parenthetically on the face of the Fair Value Measurements and Disclosures Topic of FASB ASC requiring new disclosures and amending existing guidance. This Update provides amendments that require new disclosures as follows:
A reporting entity should disclose separatelyfinancial statements, the amountseffect of significant transfersamounts reclassified from each component of accumulated other comprehensive income based on its source, and the income statement line items affected by the reclassification. If a component is not required to be reclassified to net income in and out of Level 1 and Level 2 fair value measurements and describeits entirety, companies would instead cross reference to the reasonsrelated footnote for transfers;
In the reconciliation for fair value measurements using significant unobservable inputs (Level 3), a reporting entity should present separately information about purchases, sales, issuances, and settlements.
This Update also provides amendments that clarify existing disclosures as follows:additional information.
A reporting entity should provide fair value measurements for each class of assets and liabilities;
A reporting entity should provide disclosures about the valuation techniques and inputs used to measure fair value for both recurring and nonrecurring fair value measurements that fall either in Level 2 or Level 3.
These modifications are effective for interim and annual periods beginning after December 15, 2009, except2012. We are currently evaluating these changes to determine which option will be chosen for the disclosures about purchases, sales, issuances, and settlementspresentation of amounts reclassified out of accumulated other comprehensive income. Other than the change in the roll forward activity in Level 3 fair value measurements. Those disclosures are effective for interim and annual periods beginning after December 15, 2010. The Company adopted the new required disclosures effective January 1st, 2010 and doespresentation, we have determined these changes will not anticipate the new Level 3 disclosure requirements to have a significant impact when adopted.
Stock Compensation
In April 2010, the FASB issued an update to Compensation—Stock Compensation, which addresses the classification of an employee share-based payment award with an exercise price denominated in the currency of a market in which the underlying security trades. This Update clarifies that those employee share-based payment awards should not be considered to contain a condition that is not a market, performance, or service condition and therefore, an entity would not classify such an award as a liability if it otherwise qualifies as equity.
This Update is effective for fiscal years and interim periods beginning on or after December 15, 2010 with early adoption permitted. The adoption of this update will have no impact on the Company’s consolidated financial statements.
The preparation of financial statements in conformity with GAAP requires management to make estimates and assumptions that affect our results of operations and financial position. On an ongoing basis, management reviews its estimates, including those related to environmental matters and other asset retirement obligations, useful lives, impairment of long-livedproperty, plant and equipment, impairment of intangibles impairment of goodwill, impairment of indefinite-lived intangible assets, pension plans and other post-retirement benefit plans, and income taxes and closure and restructuring costs based on currently available information. Actual results could differ from those estimates.
Critical accounting policies reflect matters that contain a significant level of management estimates about future events, reflect the most complex and subjective judgments, and are subject to a fair degree of measurement uncertainty.
Environmental Matters and Other Asset Retirement Obligations
Environmental expenditures for effluent treatment, air emission, landfill operation and closure, asbestos containment and removal, bark pile management, silvicultural activities and site remediation (together referred to as environmental matters) are expensed or capitalized depending on their future economic benefit. InOperating cost, in the normal course of business, we incur certain operating costs for environmental matters that are expensed as incurred. Expenditures for property, plant and equipment that prevent future environmental impacts are capitalized and amortized on a straight-line basis over 10 to 40 years. Provisions for environmental matters are not discounted, except for a portion which is discounted due to more certaintyuncertainty with respect to timing of expenditures, and isare recorded when remediation efforts are probable and can be reasonably estimated.
We recognize asset retirement obligations, at fair value, in the period in which we incur a legal obligation associated with the retirement of an asset. Our asset retirement obligations are principally linked to landfill capping obligations, asbestos removal obligations and demolition of certain abandoned buildings. Conditional asset retirement obligations are recognized, at fair value, when the fair value of the liability can be reasonably estimated or on a probability weighted discounted cash flow estimate. The associated costs are capitalized as part of the carrying value of the related asset and depreciated over its remaining useful life. The liability is accreted using the credit adjusted risk-free interest rate used to discount the cash flow.flows.
The estimate of fair value of the asset retirement obligations is based on the results of the expected future cash flow approach, in which multiple cash flow scenarios that reflect a range of possible outcomes are considered. We have established cash flow scenarios for each individual asset retirement obligation. Probabilities are applied to each of the cash flow scenarios to arrive at an expected future cash flow. There is no supplemental risk adjustment made to the expected cash flows. The expected cash flow for each of the asset retirement obligations are discounted using the credit adjusted risk-free interest rate for the corresponding period until the settlement date. The rates used vary based on the prevailing rate at the moment of recognition of the liability and on its settlement period. The rates used vary between 5.5% and 12.0%.
Cash flow estimates incorporate either assumptions that marketplace participants would use in their estimates of fair value, whenever that information is available without undue cost and effort, or assumptions developed by internal experts.
In 2010,2012, our operating expenses for environmental matters amounted to $64 million ($62 million in 2011, $62 million ($71 million in 2009)2010).
We made capital expenditures for environmental matters of $4 million in 2012 ($8 million in 2011, $3 million in 2010, excluding the $512010). This excludes $6 million spent under the Pulp and Paper Green Transformation Program, which was reimbursed by the Government of Canada, ($283 million in 2009, $42011 and $51 million in 2008)2010) for the improvement of air emissions and energy efficiency, effluent treatment and remedial actions to address environmental compliance. The EPA has proposed several standards related to emissions from boilers and process heaters included in our manufacturing processes. These standards are referred to as Boiler MACT. A final rule was released in late February 2011, however, the EPA has provided for a process referred to as “reconsideration” for certain portions of the final rule, thus delaying enactment and making uncertain what actions the agency will take with those portions of the rule subject to reconsideration. Compliance with Boiler MACT will beAt this time, management does not expect any additional required three years after a final rule is enacted.
It is apparentexpenditure that owners and operators of boilers will be required to address multiple industrial boilers and process heaters in order to comply with the final rule. Until a final rule is enacted, it is not possible to provide an estimated cost of compliance, but compliance maywould have a significant impactmaterial adverse effect on our financial position, results of operations financial position or cash flows.
We are also a party to various proceedings relating to the cleanup of hazardous waste sites under the Comprehensive Environmental Response Compensation and Liability Act, commonly known as “Superfund,” and similar state laws. The EPA and/or various state agencies have notified us that we may be a potentially responsible party with respect to other hazardous waste sites as to which no proceedings have been instituted against us. We continue to take remedial action under our Care and Control Program, as such sites mostly relate to our former wood preserving operating sites, and a number of operating sites due to possible soil, sediment or groundwater contamination. The investigation and remediation process is lengthy and subject to the uncertainties of changes in legal requirements, technological developments and, if and when applicable, the allocation of liability among potentially responsible parties.
An action was commenced by Seaspan International Ltd. (“Seaspan”) in the Supreme Court of British Columbia, on March 31, 1999 against Domtar Inc. and others with respect to alleged contamination of Seaspan’s site bordering Burrard Inlet in North Vancouver, British Columbia, including contamination of sediments in Burrard Inlet, due to the presence of creosote and heavy metals. Beyond the filing of preliminary pleadings, no steps have been taken by the parties in this action. On February 16, 2010, the government of British Columbia issued a Remediation Order to Seaspan and Domtar Inc. (“responsible persons”) in order to define and implement an action plan to address soil, sediment and groundwater issues. This Order was appealed to the Environmental Appeal Board (“Board”) on March 17, 2010 but there is no suspension in the execution of this Order unless the Board orders otherwise. The appeal hearing scheduledhas been adjourned and has been preliminarily re-scheduled for January 2011 was cancelled with no alternative date scheduled asthe fall of yet.2013. The relevant government authorities are reviewing several plansselected a remediation approach on July 15, 2011, and on January 8, 2013, the same authorities decided that each responsible persons’ implementation plan is satisfactory and that the responsible persons decide which plan is to be used. On February 6, 2013, the responsible persons appealed the January 8, 2013 decision and Seaspan applied for a decision is expected instay of execution. On February 18, 2013, the first quarterBoard granted an interim stay of 2011. The Company hasthe January 8, 2013 decision. We recorded an environmental reserve to address its estimated exposure and the estimated exposure.reasonably possible loss in excess of the reserve is not considered to be material for this matter.
We are also a party to various proceedings relating to the cleanup of hazardous waste sites under the Comprehensive Environmental Response Compensation and Liability Act, commonly known as “Superfund,” and similar state laws. The Environmental Protection Agency (“EPA”) and/or various state agencies have notified us that we may be a potentially responsible party with respect to other hazardous waste sites as to which no proceedings have been instituted against us. We continue to take remedial action under our Care and Control Program, at our former wood preserving sites, and at a number of operating sites due to possible soil, sediment or groundwater contamination. The investigation and remediation process is lengthy and subject to the uncertainties of changes in legal requirements, technological developments and, if and when applicable, the allocation of liability among potentially responsible parties.
At December 31, 2012, we had a provision of $83 million ($92 million at December 31, 2011) for environmental matters and other asset retirement obligations. Certain of these amounts have been discounted due to more certainty of the timing of expenditures using the credit adjusted risk-free interest rate for the corresponding period until the settlement date. The rates used vary, based on the prevailing rate at the moment of recognition of the liability and on its settlement period. Additional costs, not known or identifiable, could be
incurred for remediation efforts. Based on policies and procedures in place to monitor environmental exposure, we believe that such additional remediation costs would not have a material adverse effect on our financial position, results of operations or cash flows.
While we believe that we have determined the costs for environmental matters likely to be incurred, based on known information, our ongoing efforts to identify potential environmental concerns that may be associated with the properties may lead to future environmental investigations. These efforts may result in the determination of additional environmental costs and liabilities, which cannot be reasonably estimated at this time. For example, changes in climate change regulation——See Part I, Item 3, Legal Proceedings, under the caption “Climate change regulation.”
At December 31, 2010, we had a provision of $107 million ($111 million at December 31, 2009) for environmental matters and other asset retirement obligations. Certain of these amounts have been discounted due to more certainty of the timing of expenditures. Additional costs, not known or identifiable, could be incurred for remediation efforts. Based on policies and procedures in place to monitor environmental exposure, we believe that such additional remediation costs would not have a material adverse effect on our financial position, results of operations or cash flows.
At December 31, 2010,2012, anticipated undiscounted payments in each of the next five years are as follows:
| 2011 | 2012 | 2013 | 2014 | 2015 | THEREAFTER | TOTAL | ||||||||||||||||||||||
| (in millions of dollars) | ||||||||||||||||||||||||||||
Environmental provision and other asset retirement obligations | $ | 28 | $ | 42 | $ | 4 | $ | 5 | $ | 2 | $ | 75 | $ | 156 | ||||||||||||||
| 2013 | 2014 | 2015 | 2016 | 2017 | Thereafter | Total | ||||||||
| Environmental provision and other asset retirement obligations | $ 19 | $ 26 | $ 5 | $ 2 | $ 1 | $ 76 | $ 129 |
Industrial Boiler Maximum Achievable Control Technology Standard (“MACT”)
On December 2, 2011, the EPA proposed a new set of standards related to emissions from boilers and process heaters included in our manufacturing processes. These standards are generally referred to as Boiler MACT and seek to require reductions in the emission of certain hazardous air pollutants or surrogates of hazardous air pollutants. The EPA announced the final rule on December 12, 2012, and it was subsequently published in the Federal Register on January 31, 2013. Compliance will be required by the end of 2015 or early 2016 for existing emission units or upon startup for any new emission units. We expect that the capital cost required to comply with the Boiler MACT rules, is between $25 million and $35 million. We are currently assessing the associated increase in operating costs as well as alternate compliance strategies.
Useful Lives
Our property, plant and equipment are stated at cost less accumulated depreciation, including asset impairment write-downs. Interest costs are capitalized for significant capital projects. For timber limits and timberlands, amortization is calculated using the unit of production method. For deferred financing fees, amortization is calculated using the effective interest rate method. For all other assets, amortization is calculated using the straight-line method over the estimated useful lives of the assets. Buildings and improvements are amortized over periods of 10 to 40 years and machinery and equipment over periods of 3 to 20 years. No depreciation is recorded on assets under construction.
Our intangible assets are stated at cost less accumulated amortization, including any applicable intangible asset impairment write-down. Water rights, customer relationships, technology, trade names, supplier agreements and a supplier agreementnon-compete agreements are
amortized on a straight-line basis over their estimated useful lives of 40 years, 1720 to 40 years, 7 to 20 years, 7 years, 5 years, and 59 years, respectively. Power purchase agreements are amortized on a straight-line basis over the term of the contract. The weighted-average amortization period is 25 years for power purchase agreements. One trade name is considered to have an indefinite useful life and is therefore not amortized.
On a regular basis, we review the estimated useful lives of our property, plant and equipment as well as our intangible assets. Assessing the reasonableness of the estimated useful lives of property, plant and equipment and intangible assets requires judgment and is based on currently available information. Changes in circumstances such as technological advances, changes to our business strategy, changes to our capital strategy or changes in regulation can result in the actual useful lives differing from our estimates. Revisions to the estimated useful lives of property, plant and equipment and intangible assets constitute a change in accounting estimate and are dealt with prospectively by amending depreciation and amortization rates.
A change in the remaining estimated useful life of a group of assets, or their estimated net salvage value, will affect the depreciation or amortization rate used to depreciate or amortize the group of assets and thus affect depreciation or amortization expense as reported in our results of operations. A change of one year in the composite estimated useful life of our fixed asset base would impact annual depreciation and amortization expense by approximately $18 million. In 2010,2012, we recorded depreciation and amortization expense of $395$385 million compared to $405$376 million and $395 million in 2009.2011 and 2010, respectively. At December 31, 2010,2012, we had property, plant and equipment with a net book value of $3,767$3,401 million ($4,1293,459 million in 2009)2011) and intangible assets, net of amortization of $56$309 million ($85204 million in 2009)2011).
Impairment of Long-Lived AssetsProperty, Plant and Equipment
Long-lived assetsProperty, plant and equipment are reviewed for impairment upon the occurrence of events or changes in circumstances indicating that, at the lowest level of determinable cash flows, the carrying value of the long-lived assets may not be recoverable. Step I of the impairment test assesses if the carrying value of the long-lived assets exceeds their estimated undiscounted future cash flows in order to assess if the assetsproperty, plant and equipment are impaired. In the event the estimated undiscounted future cash flows are lower than the net book value of the assets, a Step II impairment test must be carried out to determine the impairment charge. In Step II, long-lived assetsproperty, plant and equipment are written down to their estimated fair values. Given that there is generally no readily available quoted value for our long-lived assets,property, plant and equipment, we determine fair value of our long-lived assets using the estimated discounted future cash flow (“DCF”) expected from their use and eventual disposition, and by using the liquidation or salvage value in the case of idled assets. The DCF in Step II is based on the undiscounted cash flows in Step I.
Kamloops, British Columbia Pulp Mill, Closure of a Pulp Machine
During the fourth quarter of 2012, we announced the permanent shut down of a pulp machine at our Kamloops mill. This decision will result in a permanent curtailment of our annual pulp production by approximately 120,000 ADMT of sawdust softwood pulp, and will affect approximately 125 employees. These measures are expected to be in place by the end of March 2013. We recognized a $5 million write-down of property, plant and equipment and $2 million of accelerated depreciation, included in Impairment and write-down of property, plant and equipment and intangible assets, with respect to the assets that will cease productive use in March 2013, when the shut down is completed. We expect to record an additional $12 million of accelerated depreciation during the first quarter of 2013 in relation to these assets.
Given the decision to permanently shut down the pulp machine and the substantial change in use, we conducted a Step I impairment test in the fourth quarter of 2012 and concluded that the undiscounted estimated future cash flows associated with the remaining property, plant and equipment exceeded the then carrying value of the asset group of $202 million by a significant amount and, as such, no additional impairment charge was required.
Estimates of undiscounted future cash flows used to test the recoverability of the property, plant and equipment included key assumptions related to selling prices, inflation-adjusted cost projections, forecasted exchange rate for the U.S. dollar when applicable and the estimated useful life of the property, plant and equipment.
Mira Loma, California Converting Plant
During the first quarter of 2012, we recorded a $2 million write-down of property, plant and equipment at our Mira Loma plant, in Impairment and write-down of property, plant and equipment (a component of Impairment and write-down of property, plant and equipment and intangible assets on the consolidated statement of earnings).
Ashdown, Arkansas Pulp and Paper Mill – Closure of a Paper Machine
As a result of the decision to permanently shut down one of four paper machines on March 29, 2011, we recognized $73 million of accelerated depreciation in 2011. Given the substantial decline in the production capacity, at our Ashdown mill, we conducted a quantitative impairment test in the fourth quarter of 2011 and
concluded that the recognition of an impairment loss for the Ashdown mill’s remaining property, plant and equipment was not required as the aggregate undiscounted future cash flows exceeded the carrying value.
Plymouth, North Carolina Pulp and Paper Mill—Conversion to Fluff Pulp
As a result of the decision to permanently shut down the remaining paper machine and convert our Plymouth facility to 100% fluff pulp production in the fourth quarter of 2009, we recognized, under Impairment and write-down of property, plant and equipment, $39 million of accelerated depreciation in 2010 in addition to $13 million in the fourth quarter of 2009 and a $1 million write-down for the related paper machine in 2010.
Given the substantial change in use of the pulp and paper mill, we conducted a Step I impairment test in the fourth quarter of 2009 and concluded that the recognition of an impairment loss for theour Plymouth mill’s long-lived assetsremaining property, plant and equipment was not required as the aggregate estimated undiscounted future cash flows exceeded the then carrying value of the asset group of $336 million at the time of the announcement by a significant amount.
Estimates of undiscounted future cash flows used to test the recoverability of the fixed assetsproperty, plant and equipment included key assumptions related to trendselling prices, inflation-adjusted cost projections, forecasted exchange rate for the U.S. dollar when applicable and the estimated useful life of the fixed assets. The main sourcesproperty, plant and equipment.
Impairment of such assumptionsintangibles
Definite-lived intangible assets are reviewed for impairment upon the occurrence of events or changes in circumstances indicating that, at the lowest level of determinable cash flows, the carrying value of the intangible may not be recoverable.
Deterioration in sales and operating results of Ariva U.S., a subsidiary included in our Distribution segment, has led us to test the customer relationships of this asset group for recoverability. As of December 31, 2012, we recognized an impairment charge of $5 million included in Impairment and write-down of property, plant and equipment and intangible assets related benchmarks were largelyto customer relationships in the sameDistribution segment, based on the revised long-term forecast in the fourth quarter of 2012. We concluded that no further impairment or impairment indicators exist as those listed under “Impairment of Goodwill” below.December 31, 2012.
Changes in our assumptions and estimates may affect our forecasts and may lead to an outcome where impairment charges would be required. In addition, actual results may vary from our forecasts, and such variations may be material and unfavorable, thereby triggering the need for future impairment tests where our conclusions may differ in reflection of prevailing market conditions.
Impairment of Goodwill
All goodwill as of December 31, 2012 resided in our Personal Care segment. The goodwill in the Personal Care segment originates from the acquisitions of Attends US on September 1, 2011 ($163 million), Attends Europe on March 1, 2012 ($69 million) and EAM on May 10, 2012 ($31 million).
For purposes of impairment testing, goodwill must be assigned to one or more of our reporting units. We test goodwill at the reporting unit level. Goodwill is not amortized and is evaluated at the beginning of the fourth quarter of every year or more frequently whenever indicators of potential impairment exist. We have the option to first assess qualitative factors to determine whether it is more likely than not that the fair value of a reporting unit is less than its carrying amount. In performing the qualitative assessment, we identify the relevant drivers of fair value of a reporting unit and the relevant events and circumstances that may have an impact on those drivers of fair value. This process involves significant judgment and assumptions including the assessment of the results of the most recent fair value calculations, the identification of macroeconomic conditions, industry and market considerations, cost factors, overall financial performance, specific events affecting us and the business, and making the assessment on whether each relevant factor will impact the impairment test positively or negatively and the magnitude of any such impact. If, after assessing the totality of events or circumstances, we determine it is more likely than not that the fair value of a reporting unit is less than its carrying amount, then performing the
Step I of the two-step impairment test is necessary. The Step I goodwill impairment test determines whether the fair value of a reporting unit exceeds the net carrying amount of that reporting unit, including goodwill, as of the assessment date in order to assess if goodwill is impaired. If the fair value is greater than the net carrying amount, no impairment is necessary. In the event that the net carrying amount exceeds the fair value, the Step II goodwill impairment test must be performed in order to determine the amount of the impairment charge. The implied fair value of goodwill in this test is estimated in the same way as goodwill was determined at the date of the acquisition in a business combination. That is, the excess of the fair value of the reporting unit over the fair value of the identifiable net assets of the reporting unit represents the implied value of goodwill. To accomplish this Step II test, the fair value of the reporting unit’s goodwill must be estimated and compared to its carrying value. The excess of the carrying value over the fair value is taken as an impairment charge in the period.
In the fourth quarter of 2012, we assessed qualitative factors to determine whether the existence of events or circumstances led to a determination that it was more likely than not that the fair value of the reporting unit was less than its carrying amount. After assessing the totality of events and circumstances, we determined it was not more likely than not that the fair value of the reporting unit was less than its carrying amount. Thus, performing the two-step impairment test was unnecessary and no impairment charge was recorded for goodwill.
Impairment of indefinite-lived intangible assets
All indefinite-lived intangible assets as of December 31, 2012 resided in our Personal Care segment. The indefinite-lived intangible assets in the Personal Care segment originate from the acquisitions of Attends US on September 1, 2011 ($61 million) and Attends Europe on March 1, 2012 ($54 million), and both refer to trade names.
For purposes of impairment testing, indefinite-lived intangible assets must be assigned to one or more of our reporting units. We test indefinite-lived intangible assets at the reporting unit level. Indefinite-lived intangibles assets are not amortized and are evaluated at the beginning of the fourth quarter of every year or more frequently whenever indicators of potential impairment exist. We have the option to first assess qualitative factors to determine whether it is more likely than not that the fair value of a reporting unit is less than its carrying amount. In performing the qualitative assessment, we identify the relevant drivers of fair value of a reporting unit and the relevant events and circumstances that may have an impact on those drivers of fair value. This process involves significant judgment and assumptions including the assessment of the results of the most recent fair value calculations, the identification of macroeconomic conditions, industry and market considerations, cost factors, overall financial performance, specific events affecting us and the business, and making the assessment on whether each relevant factor will impact the impairment test positively or negatively and the magnitude of any such impact. If, after assessing the totality of events or circumstances, we determine it is more likely than not that the fair value of a reporting unit is less than its carrying amount, then performing the Step I of the two-step impairment test is necessary. The Step I impairment test determines whether the fair value of a reporting unit exceeds the net carrying amount of that reporting unit, including indefinite-lived intangible assets, as of the assessment date in order to assess if indefinite-lived intangible assets are impaired. If the fair value is greater than the net carrying amount, no impairment is necessary. In the event that the net carrying amount exceeds the fair value, the Step II impairment test must be performed in order to determine the amount of the impairment charge. The implied fair value of indefinite-lived intangible assets in this test is estimated in the same way as indefinite-lived intangible assets were determined at the date of the acquisition in a business combination. To accomplish this Step II test, the fair value of the reporting unit’s indefinite-lived intangible assets must be estimated and compared to its carrying value. The excess of the carrying value over the fair value is taken as an impairment charge in the period.
In the fourth quarter of 2012, we assessed qualitative factors to determine whether the existence of events or circumstances led to a determination that it was more likely than not that the fair value of the reporting unit was less than its carrying amount. After assessing the totality of events and circumstances, we determined it was not more likely than not that the fair value of the reporting unit was less than its carrying amount. Thus, performing the two-step impairment test was unnecessary and no impairment charge was recorded for indefinite-lived intangible assets.
Pension Plans and Other Post-Retirement Benefit Plans
We have several defined contribution plans and multiemployer plans. The pension expense under these plans is equal to our contribution. Defined contribution pension expense was $24 million for the year ended December 31, 2012 (2011—$24 million and 2010—$25 million).
We sponsor both contributory and non-contributory U.S. and non-U.S. defined benefit pension plans that cover the majority of our employees. Non-unionized employees in Canada joining the Company after June 1, 2000, participate in defined contribution pension plans. Salaried employees in the U.S. joining the Company after January 1, 2008 participate in a defined contribution pension plan. Also, starting on January 1, 2013, all unionized employees covered under the agreement with the United Steel Workers not grandfathered under the existing defined benefit pension plans will transition to a defined contribution pension plan for future service. We also sponsor a number of other post-retirement benefit plans for eligible U.S. and non-U.S. employees; the plans are unfunded and include life insurance programs, medical and dental benefits. We also provide supplemental unfunded defined benefit pension plans to certain senior management employees.
We account for pensions and other post-retirement benefits in accordance with Compensation-Retirement Benefits Topic of the Financial Accounting Standards Board-Accounting Standards Committee (“FASB ASC”) which requires employers to recognize the overfunded or underfunded status of defined benefit pension plans as an asset or liability in its Consolidated Balance Sheets. Pension and other post-retirement benefit assumptions include the discount rate, the expected long-term rate of return on plan assets, the rate of compensation increase, health care cost trend rates, mortality rates, employee early retirements and terminations or disabilities. Changes in these assumptions result in actuarial gains or losses which we have amortized over the expected average remaining service life of the active employee group covered by the plans only to the extent that the unrecognized net actuarial gains and losses are in excess of 10% of the accrued benefit obligation at the beginning of the year over the average remaining service period of approximately 9 years of the active employee group covered by the pension plans and 10 years of the active employee group covered by the other post-retirement benefits plan.
An expected rate of return on plan assets of 6.0% was considered appropriate by our management for the determination of pension expense for 2012. Effective January 1, 2013, we will use 5.5%, 7.2% and 3.5% as the expected return on plan assets for Canada, the United States and Europe, which reflects the current view of long-term investment returns. The overall expected long-term rate of return on plan assets is based on management’s best estimate of the long-term returns of the major asset classes (cash and cash equivalents, equities and bonds) weighted by the actual allocation of assets at the measurement date, net of expenses. This rate includes an equity risk premium over government bond returns for equity investments and a value-added premium for the contribution to returns from active management.
We set our discount rate assumption annually to reflect the rates available on high-quality, fixed income debt instruments, with a duration that is expected to match the timing and amount of expected benefit payments. High-quality debt instruments are corporate bonds with a rating of AA or better. The discount rates at December 31, 2012, for pension plans were estimated at 4.1% for the accrued benefit obligation and 4.8% for the net periodic benefit cost for 2012 and for post-retirement benefit plans were estimated at 4.2% for the accrued benefit obligation and 2.9% for the net periodic benefit cost for 2012.
The rate of compensation increase is another significant assumption in the actuarial model for pension (set at 2.7% for the accrued benefit obligation and 2.8% for the net periodic benefit cost) and for post-retirement benefits (set at 2.8% for the accrued benefit obligation and 2.8% for the net periodic benefit cost) and is determined based upon our long-term plans for such increases.
For measurement purposes, a 5.4% weighted-average annual rate of increase in the per capita cost of covered health care benefits was assumed for 2013. The rate was assumed to decrease gradually to 4.1% by 2033 and remain at that level thereafter.
The following table summarizesprovides a sensitivity analysis of the approximatekey weighted average economic assumptions used in measuring the accrued pension benefit obligation, the accrued other post-retirement benefit obligation and related net periodic benefit cost for 2012. The sensitivity analysis should be used with caution as it is hypothetical and changes in each key assumption may not be linear. The sensitivities in each key variable have been calculated independently of each other.
Sensitivity Analysis
| PENSION | OTHER POST-RETIREMENT BENEFIT | |||||||||||||||
PENSION AND OTHER POST-RETIREMENT | ACCRUED BENEFIT OBLIGATION | NET PERIODIC BENEFIT COST | ACCRUED BENEFIT OBLIGATION | NET PERIODIC BENEFIT COST | ||||||||||||
| (in millions of dollars) | ||||||||||||||||
Expected rate of return on assets | ||||||||||||||||
Impact of: | ||||||||||||||||
1% increase | N/A | ($16 | ) | N/A | N/A | |||||||||||
1% decrease | N/A | 16 | N/A | N/A | ||||||||||||
Discount rate | ||||||||||||||||
Impact of: | ||||||||||||||||
1% increase | ($211 | ) | (15 | ) | ($14 | ) | (1 | ) | ||||||||
1% decrease | 246 | 20 | 18 | 1 | ||||||||||||
Assumed overall health care cost trend | ||||||||||||||||
Impact of: | ||||||||||||||||
1% increase | N/A | N/A | 10 | 1 | ||||||||||||
1% decrease | N/A | N/A | (9 | ) | (1 | ) | ||||||||||
The assets of the pension plans are held by a number of independent trustees and are accounted for separately in our pension funds. Our investment strategy for the assets in the pension plans is to maintain a diversified portfolio of assets, invest in a prudent manner to maintain the security of funds while maximizing returns within the guidelines provided in the investment policy. Diversification of the pension plans’ holdings is maintained in order to reduce the pension plans’ annual return variability, reduce market exposure and credit exposure to any single issuer and to any single component of the capital markets, to reduce exposure to unexpected inflation, to enhance the long-term risk-adjusted return potential of the pension plans and to reduce funding risk. Our pension funds are not permitted to own any of the Company’s shares or debt instruments.
The following table shows the allocation of the plan assets, based on the fair value of the assets held and the target allocation for 2012:
| Target allocation | Percentage of plan assets at December 31, 2012 | Percentage of plan assets at December 31, 2011 | ||||||||||
Fixed income | ||||||||||||
Cash and cash equivalents | 0% – 10% | 4 | % | 5 | % | |||||||
Bonds | 51% – 61% | 55 | % | 58 | % | |||||||
Equity | ||||||||||||
Canadian Equity | 7% – 15% | 11 | % | 10 | % | |||||||
US Equity | 8% – 18% | 12 | % | 12 | % | |||||||
International Equity | 14% – 24% | 18 | % | 15 | % | |||||||
|
|
|
| |||||||||
Total(1) | 100 | % | 100 | % | ||||||||
|
|
|
| |||||||||
| (1) | Approx imately 85% of the pension plan assets relate to Canadian plans and 15% relate to U.S. plans. |
Our pension plan funding policy is to contribute annually the amount required to provide for benefits earned in the year, and to fund solvency deficiencies, funding shortfalls and past service obligations over periods not exceeding those permitted by the applicable regulatory authorities. Past service obligations primarily arise from improvements to plan benefits. The other post-retirement benefit plans are not funded and contributions are made annually to cover benefit payments. We expect to contribute a minimum total amount of $25 million in 2013 compared to $86 million in 2012 (2011—$95 million) to the pension plans. The payments made in 2012 to the other post-retirement benefit plans amounted to $7 million (2011—$8 million).
The estimated future benefit payments from the plans for the next ten years at December 31, 2012 are as follows:
ESTIMATED FUTURE BENEFIT PAYMENTS FROM THE PLANS | PENSION PLANS | OTHER POST- RETIREMENT BENEFIT PLANS | ||||||
| (in millions of dollars) | ||||||||
2013 | $ | 152 | $ | 5 | ||||
2014 | 102 | 7 | ||||||
2015 | 105 | 7 | ||||||
2016 | 108 | 7 | ||||||
2017 | 111 | 6 | ||||||
2018 – 2022 | 600 | 34 | ||||||
Asset Backed Notes
At December 31, 2012, our Canadian defined benefit pension funds held restructured asset backed notes (“ABN”) (formerly asset backed commercial paper (“ABCP”)) valued at $213 million (CDN$211 million). At December 31, 2011, our plans held ABN valued at $205 million (CDN$208 million). During 2012, the total value of the ABN benefited from an increase in value of $41 million (CDN$40 million). For the same period, the total value of the ABN was reduced by repayments and sales totalling $37 million (CDN$37 million), partially offset by the $4 million impact of an increase in the value of the Canadian dollar.
Most of these ABN, with a current value of $193 million (2011—$178 million; 2010—$193 million), were subject to restructuring under the court order governing the Montreal Accord that was completed in January 2009. About $177 million of these notes (nominal value $213 million) are expected to mature in four years. These notes are valued based upon current market quotes. The market values are supported by the value of the underlying investments held by the issuing conduit. The values for the $16 million (nominal value $39 million) of remaining ABN, that also were subject to the Montreal Accord, were sourced either from the asset manager of the ABN, or from trading values for similar securities of similar credit quality.
An additional $20 million of ABN (nominal value $38 million) were restructured separately from the Montreal Accord. They are valued based upon the value of the collateral investments held in the conduit issuer, reduced by the negative value of credit default derivatives, with an additional discount (equivalent 1.75% per annum) applied for illiquidity. Approximately $11 million of these notes (nominal value $11 million) are expected to mature at par in late 2013 with the remaining $9 million of notes (nominal value $12 million) maturing in 2016. The outcome for a zero-value note (nominal value $15 million), remains subject to the outcome of ongoing litigation.
Possible changes that could impact the future value of ABN include: (1) changes in the value of the underlying assets and the related derivative transactions, (2) developments related to the liquidity of the ABN market, (3) a severe and prolonged economic slowdown in North America and the bankruptcy of referenced corporate credits, and (4) the passage of time, as most of the notes will mature by early 2017.
Multiemployer Plans
We contribute to seven multiemployer defined benefit pension plans under the terms of collective agreements that cover certain Canadian union-represented employees (Canadian multiemployer plans) and certain U.S. union-represented employees (U.S. multiemployer plans). The risks of participating in these multiemployer plans are different from single-employer plans in the following aspects:
| a) | assets contributed to the multiemployer plan by one employer may be used to provide benefits to employees of other participating employers; |
| b) | for the U.S. multiemployer plans, if a participating employer stops contributing to the plan, the unfunded obligations of the plan are borne by the remaining participating employers; and |
| c) | for the U.S. multiemployer plans, if we choose to stop participating in some of our multiemployer plans, we may be required to pay those plans an amount based on the underfunded status of the plan, referred to as a withdrawal liability. |
Our participation in these plans for the annual periods ended December 31 is outlined in the table below. The plan’s 2012 and 2011 actuarial status certification was completed as of January 1, 2012 and January 1, 2011 respectively, and is based on the plan’s actuarial valuation as of December 31, 2011 and December 31, 2010 respectively. This represents the most recent Pension Protection Act (“PPA”) zone status available. The zone status is based on information received from the plan and is certified by the plan’s actuary. One significant plan is in the red zone, which means it is less than 65% funded and requires a financial improvement plan (“FIP”) or a rehabilitation plan (“RP”).
| Pension Protection Act Zone Status | Contributions from Domtar to Multiemployer (c) | Expiration date of collective bargaining agreement | ||||||||||||||||||||||||||||||||||
Pension Fund | EIN / Pension Plan Number | 2012 | 2011 | FIP / RP Status Pending / Implemented | 2012 | 2011 | 2010 | Surcharge imposed | ||||||||||||||||||||||||||||
U.S. Multiemployer Plans | $ | $ | $ | |||||||||||||||||||||||||||||||||
PACE Industry Union- | ||||||||||||||||||||||||||||||||||||
Management Pension Fund(a) | 11-6166763-001 | Red | Red | Yes - Implemented | 3 | 3 | 3 | Yes | January 27, 2015 | |||||||||||||||||||||||||||
Canadian Multiemployer Plans | ||||||||||||||||||||||||||||||||||||
Pulp and Paper Industry | ||||||||||||||||||||||||||||||||||||
Pension Plan(b) | N/A | N/A | N/A | N/A | 2 | 3 | 2 | N/A | April 30, 2017 | |||||||||||||||||||||||||||
|
|
|
|
|
| |||||||||||||||||||||||||||||||
| Total | 5 | 6 | 5 | |||||||||||||||||||||||||||||||||
Total contributions made to all plans that are not individually significant |
| 1 | 1 | 1 | ||||||||||||||||||||||||||||||||
|
|
|
|
|
| |||||||||||||||||||||||||||||||
Total contributions made to all plans |
| 6 | 7 | 6 | ||||||||||||||||||||||||||||||||
|
|
|
|
|
| |||||||||||||||||||||||||||||||
| (a) | We withdrew from PACE Industry Union-Management Pension Fund effective December 31, 2012. |
| (b) | In the event that the Canadian multiemployer plan is underfunded, the monthly benefit amount can be reduced by the trustees of the plan. Moreover, we are not responsible for the underfunded status of the plan because the Canadian multiemployer plans do not require participating employers to pay a withdrawal liability or penalty upon withdrawal. |
| (c) | For each of the three years presented, our contributions to each multiemployer plan do not represent more than five percent of total contributions to each plan as indicated in the plan’s most recently available annual report. |
In 2011, we decided to withdraw from one of our multiemployer pension plans and recorded a withdrawal liability and a charge to earnings of $32 million. In 2012, as a result of a revision in the estimated withdrawal liability, we recorded a further charge to earnings of $14 million. Also in 2012, we withdrew from a second multiemployer pension plan and recorded a withdrawal liability and a charge to earnings of $1 million. While this is our best estimate of the ultimate cost of the withdrawal from these plans at December 31, 2012, additional withdrawal liabilities may be incurred based on the final fund assessment expected to occur in the second quarter of 2013. Further, we remain liable for potential additional withdrawal liabilities to the fund in the event of a mass withdrawal, as defined by statute, occurring anytime within the next three years. Refer to Part II, Item 8, Financial Statement and Supplementary Data of this Annual Report on Form 10-K, under Note 16 “Closure and Restructuring Costs and Liability.”
Income Taxes
We use the asset and liability method of accounting for income taxes. Under this method, deferred tax assets and liabilities are determined according to differences between the carrying amounts and tax bases of the assets and liabilities. The change in the net deferred tax asset or liability is included in earnings. Deferred tax assets and liabilities are measured using enacted tax rates and laws expected to apply in the years in which assets and liabilities are expected to be recovered or settled. For these years, a projection of taxable income and an assumption of the ultimate recovery or settlement period for temporary differences are required. The projection of future taxable income is based on management’s best estimate and may vary from actual taxable income.
On a quarterly basis, we assess the need to establish a valuation allowance for deferred tax assets and, if it is deemed more likely than not that our deferred tax assets will not be realized based on these taxable income projections, a valuation allowance is recorded. In general, “realization” refers to the incremental benefit achieved through the reduction in future taxes payable or an increase in future taxes refundable from the deferred tax assets. Evaluating the need for an amount of a valuation allowance for deferred tax assets often requires significant judgment. All available evidence, both positive and negative, should be considered to determine whether, based on the weight of that evidence, a valuation allowance is needed.
In our evaluation process, we give the most weight to historical income or losses. After evaluating all available positive and negative evidence, although realization is not assured, we determined that it is more likely than not that the results of future operations will generate sufficient taxable income to realize the deferred tax assets, with the exception of certain foreign loss carryforwards for which a valuation allowance of $10 million was recorded in 2012, and certain state credits for which a valuation allowance of $4 million was recorded in 2011.
Our short-term deferred tax assets are mainly composed of temporary differences related to various accruals, accounting provisions, as well as a portion of our net operating loss carryforwards and available tax credits. The majority of these items are expected to be utilized or paid out over the next year. Our long-term deferred tax assets and liabilities are mainly composed of temporary differences pertaining to plant, equipment, pension and post-retirement liabilities, the remaining portion of net operating loss carryforwards and other tax attributes, and other items. Estimating the ultimate settlement period requires judgment and our best estimates. The reversal of timing differences is expected at enacted tax rates, which could change due to changes in income tax laws or the introduction of tax changes through the presentation of annual budgets by different governments. As a result, a change in the timing and the income tax rate at which the components will reverse could materially affect deferred tax expense in our future results of operations.
In addition, U.S. and foreign tax rules and regulations are subject to interpretation and require judgment that may be challenged by taxation authorities. To the best of our knowledge, we have adequately provided for our future tax consequences based upon current facts and circumstances and current tax law. In accordance with Income Taxes Topic of FASB ASC 740, we evaluate new tax positions that result in a tax benefit to us and
determine the amount of tax benefits that can be recognized. The remaining unrecognized tax benefits are evaluated on a quarterly basis to determine if changes in recognition or classification are necessary. Significant changes in the amount of unrecognized tax benefits expected within the next 12 months are disclosed quarterly. Future recognition of unrecognized tax benefits would impact the effective tax rate in the period the benefits are recognized. At December 31, 2012, we had gross unrecognized tax benefits of $254 million. If our income tax positions with respect to the alternative fuel tax credits are sustained, either all or in part, then we would recognize a tax benefit in the future equal to the amount of the benefits sustained. Our tax treatment of the income related to the alternative fuel tax credits resulted in the recognition of a tax benefit of $2 million in 2010, which impacted the effective tax rate. This credit expired December 31, 2009. Refer to Part II, Item 8, Financial Statements and Supplementary Data of this Annual Report on Form 10-K, under Note 10 “Income taxes” for details on the unrecognized tax benefits.
Cellulosic Biofuel Credit
In July 2010, the U.S. IRS Office of Chief Counsel released an Advice Memorandum concluding that qualifying cellulosic biofuel sold or used before January 1, 2010, is eligible for the CBPC and would not be required to be registered by the Environmental Protection Agency. Each gallon of qualifying cellulose biofuel produced by any taxpayer operating a pulp and paper mill and used as a fuel in the taxpayer’s trade or business during calendar year 2009 would qualify for the $1.01 non-refundable CBPC. A taxpayer could be able to claim the credit on its federal income tax return for the 2009 tax year upon the receipt of a letter of registration from the IRS and any unused CBPC could be carried forward until 2016 to offset a portion of federal taxes otherwise payable.
We had approximately 207 million gallons of cellulose biofuel that qualified for this CBPC for which we had not previously claimed under the Alternative Fuel Tax Credit (“AFTC”) that represented approximately $209 million of CBPC or approximately $127 million of after tax benefit to the Corporation. In July 2010, we submitted an application with the IRS to be registered for the CBPC and on September 28, 2010, we received our notification from the IRS that we were successfully registered. On October 15, 2010 the IRS Office of Chief Counsel issued an Advice Memorandum concluding that the AFTC and CBPC could be claimed in the same year for different volumes of biofuel. In November 2010, we filed an amended 2009 tax return with the IRS claiming a cellulosic biofuel producer credit of $209 million and recorded a net tax benefit of $127 million in Income tax expense (benefit) on the Consolidated Statement of Earnings and Comprehensive Income for the year ended December 31, 2010. As of December 31, 2012, we have utilized all of the remaining credit.
Alternative Fuel Tax Credits
The U.S. Internal Revenue Code of 1986, as amended (the “Code”) permitted a refundable excise tax credit, until the end of 2009, for the production and use of alternative biofuel mixtures derived from biomass. We submitted an application with the IRS to be registered as an alternative fuel mixer and received notification that our registration had been accepted in late March 2009. We began producing and consuming alternative fuel mixtures in February 2009 at our eligible mills. Although the credit ended at the end of 2009, in 2010, we recorded $25 million of such credits in Other operating (income) loss on the Consolidated Statement of Earnings and Comprehensive Income. The $25 million represented an adjustment to amounts presented as deferred revenue at December 31, 2009 and was released to income following guidance issued by the IRS in March 2010. We recorded an income tax expense of $7 million in 2010 related to the alternative fuel mixture income. The amounts for the refundable credits are based on the volume of alternative biofuel mixtures produced and burned during that period. To date, we have received $508 million in refunds, net of federal income tax offsets.
There has been no change in our status with respect to the alternative fuel tax credits previously claimed but we continue to assess the possibility of converting some of these credits into additional CBPC. Any such conversion would require the repayment of any alternative fuel tax credit refund previously received in exchange for a credit to be used against future federal income tax.
As of December 31, 2012, we have gross unrecognized tax benefits and interest of $198 million and related deferred tax assets of $17 million associated with the alternative fuel tax credits claimed on our 2009 tax return. During the second quarter of 2012, the IRS began an audit of our 2009 U.S. income tax return. The completion of the audit by the IRS or the issuance of authoritative guidance will result in the release of the provision or settlement of the liability in cash of some or all of these previously unrecognized tax benefits. As of December 31, 2012, we had gross unrecognized tax benefits and interest of $198 million and related deferred tax assets of $17 million associated with the alternative fuel tax credit claims on our 2009 tax return. The recognition of these benefits, $181 million net of deferred taxes, would impact our effective tax rate. We reasonably expect the audit to be settled within the next 12 months which could result in a significant change to the amount of unrecognized tax benefits. However, audit outcomes and the timing of audit settlements are subject to significant uncertainty. Additional information regarding unrecognized tax benefits is included in Part II, Item 8, Financial Statements and Supplementary Data of this Annual Report on Form 10-K, under Note 10 “Income taxes.”
Closure and Restructuring Costs
Closure and restructuring costs are recognized as liabilities in the period when they are incurred and are measured at their fair value. For such recognition to occur, management, with the appropriate level of authority, must have approved and committed to a firm plan and appropriate communication to those affected must have occurred. These provisions may require an estimation of costs such as severance and termination benefits, pension and related curtailments, environmental remediation and may also include expenses related to demolition and outplacement. Actions taken may also require an evaluation of any remaining assets to determine required write-downs, if any, and a review of estimated remaining useful lives which may lead to accelerated depreciation expense.
Estimates of cash flows and fair value relating to closures and restructurings require judgment. Closure and restructuring liabilities are based on management’s best estimates of future events at December 31, 2012. Closure and restructuring cost estimates are dependent on future events. Although we do not anticipate significant changes, the actual costs may differ from these estimates due to subsequent developments such as the results of environmental studies, the ability to find a buyer for assets set to be dismantled and demolished and other business developments. As such, additional costs and further working capital adjustments may be required in future periods.
| ITEM 7A. | QUANTITATIVE AND QUALITATIVE DISCLOSURE ABOUT MARKET RISK |
Our income can be impacted by the following sensitivities:
SENSITIVITY ANALYSIS | ||||
| (In millions of dollars, unless otherwise noted) | ||||
Each $10/unit change in the selling price of the following products1: | ||||
Papers | ||||
20-lb repro bond, 92 bright (copy) | $ | 10 | ||
50-lb offset, rolls | 2 | |||
Other | 21 | |||
Pulp—net position | 16 | |||
Foreign exchange, excluding depreciation and amortization | 9 | |||
Energy 2 | ||||
Natural gas: $0.25/MMBtu change in price before hedging | 4 | |||
| 1 | Based on estimated 2013 capacity (ST or ADMT). |
| 2 | Based on estimated 2013 consumption levels. The allocation between energy sources may vary during the year in order to take advantage of market conditions. |
Note that we may, from time to time, hedge part of our foreign exchange, pulp, interest rate and energy positions, which may therefore impact the above sensitivities.
In the normal course of business, we are exposed to certain keyfinancial risks. We do not use derivative instruments for speculative purposes; although all derivative instruments purchased to minimize risk may not qualify for hedge accounting.
INTEREST RATE RISK
We are exposed to interest rate risk arising from fluctuations in interest rates on our cash and cash equivalents, bank indebtedness, bank credit facility and long-term debt. We may manage this interest rate exposure through the use of derivative instruments such as interest rate swap contracts.
CREDIT RISK
We are exposed to credit risk on the accounts receivable from our customers. In order to reduce this risk, we review new customers’ credit history before granting credit and conduct regular reviews of existing customers’ credit performance. As of December 31, 2012, one of our Pulp and Paper segment customers located in the United States represented 11% ($64 million) ((2011 – 9% ($58 million)) of our total receivables.
We are also exposed to credit risk in the event of non-performance by counterparties to our financial instruments. We minimize this exposure by entering into contracts with counterparties that we believe to be of high credit quality. Collateral or other security to support financial instruments subject to credit risk is usually not obtained. We regularly monitor the credit standing of counterparties. Additionally, we are exposed to credit risk in the event of non-performance by our insurers. We minimize our exposure by doing business only with large reputable insurance companies.
COST RISK
Cash flow hedges
We purchase natural gas at the prevailing market price at the time of delivery. In order to manage the cash flow risk associated with purchases of natural gas, we may utilize derivative financial instruments or physical purchases to fix the price of forecasted natural gas purchases. We formally document the hedge relationships, including identification of the hedging instruments and the hedged items, the risk management objectives and strategies for undertaking the hedge transactions, and the methodologies used to assess effectiveness and measure ineffectiveness. Current contracts are used to hedge forecasted purchases over the next five years. The effective portion of changes in the fair value of derivative contracts designated as cash flow hedges is recorded as a component of Accumulated other comprehensive loss within Shareholders’ equity, and is recognized in Cost of sales in the period in which the hedged transaction occurs.
The following table presents the volumes under derivative financial instruments for natural gas contracts outstanding as of December 31, 2012 to hedge forecasted purchases:
Commodity | Notional contractual quantity under derivative contracts |
| Notional contractual value under derivative contracts (in millions of dollars) | Percentage of forecasted purchases under derivative contracts for | ||||||||||||||||||||||||
| 2013 | 2014 | 2015 | 2016 | |||||||||||||||||||||||||
Natural gas | 13,320,000 | MMBTU | (1) | $ | 56 | 31 | % | 34 | % | 15 | % | 12 | % | |||||||||||||||
| (1) | MMBTU: Millions of British thermal units |
The natural gas derivative contracts were fully effective for accounting purposes as of December 31, 2012. The critical terms of the hedging instruments and the hedged items match. As a result, there were no amounts reflected in the Consolidated Statements of Earnings and Comprehensive Income and Other comprehensive income for the year ended December 31, 2012 resulting from hedge ineffectiveness (2011 and 2010 – nil).
FOREIGN CURRENCY RISK
Cash flow hedges
We have manufacturing and converting operations in the United States, Canada, Sweden and China. As a result, we are exposed to movements in foreign currency exchange rates in Canada, Europe and Asia. Moreover, certain assets and liabilities are denominated in currencies other than the U.S. dollar and are exposed to foreign currency movements. Therefore, our earnings are affected by increases or decreases in the value of the Canadian dollar and of other European and Asian currencies relative to the U.S. dollar. Our Swedish subsidiary is exposed to movements in foreign currency exchange rates on transactions denominated in a different currency than its Euro functional currency. Our risk management policy allows it to hedge a significant portion of its exposure to fluctuations in foreign currency exchange rates for periods up to three years. We may use derivative instruments (currency options and foreign exchange forward contracts) to mitigate our exposure to fluctuations in foreign currency exchange rates or to designate them as hedging instruments in order to hedge the subsidiary’s cash flow risk for purposes of the consolidated financial statements.
We formally document the relationship between hedging instruments and hedged items, as well as its risk management objectives and strategies for undertaking the hedge transactions. Foreign exchange currency options contracts used to hedge forecasted purchases in Canadian dollars by the Canadian subsidiary and forecasted sales in British Pound Sterling and forecasted purchases in U.S. dollars by the Swedish subsidiary are designated as cash flow hedges. Current contracts are used to hedge forecasted sales or purchases over the next 12 months. The effective portion of changes in the fair value of derivative contracts designated as cash flow hedges is recorded as a component of Other comprehensive income (loss) and is recognized in Cost of sales or in Sales in the period in which the hedged transaction occurs.
Net investment hedge
We use foreign exchange currency option contracts maturing in February 2013, to hedge the net assets of Attends Europe to offset the foreign currency translation and economic exposures related to its investment in the subsidiary. We are exposed to movements in foreign currency exchange rates of the Euro versus the U.S. dollar as Attends Europe has a Euro functional currency whereas the Company has a U.S. dollar functional and reporting currency. The effective portion of changes in the fair value of derivative contracts designated as net investment hedges is recorded in Other comprehensive income (loss) as part of the Foreign currency translation adjustments.
The following table presents the currency values under contracts pursuant to currency options outstanding as of December 31, 2012 to hedge forecasted purchases:
Contract | Notional contractual value | Percentage of forecasted net exposures under contracts for | ||||
2013 | ||||||
Currency options purchased | CDN | $ 425 | 50% | |||
| EUR | € 176 | 92% | ||||
| USD | $ 34 | 100% | ||||
| GBP | £ 19 | 93% | ||||
Currency options sold | CDN | $ 425 | 50% | |||
| EUR | € 76 | 40% | ||||
| USD | $ 34 | 100% | ||||
| GBP | £ 19 | 93% |
The currency options are fully effective as at December 31, 2012. The critical terms of the hedging instruments and the hedged items match. As a result, there were no amounts reflected in the Consolidated Statements of Earnings and Comprehensive Income for the year ended December 31, 2012 resulting from hedge ineffectiveness (2011 and 2010 – nil).
| ITEM 8. | FINANCIAL STATEMENTS AND SUPPLEMENTARY DATA |
Management’s Reports to Shareholders of Domtar Corporation
Management’s Report on Financial Statements and Practices
The accompanying Consolidated Financial Statements of Domtar Corporation and its subsidiaries (the “Company”) were prepared by management. The statements were prepared in accordance with accounting principles generally accepted in the United States of America and include amounts that are based on management’s best judgments and estimates. Management is responsible for the completeness, accuracy and objectivity of the financial statements. The other financial information included in the annual report is consistent with that in the financial statements.
Management has established and maintains a system of internal accounting and other controls for the Company and its subsidiaries. This system and its established accounting procedures and related controls are designed to provide reasonable assurance that assets are safeguarded, that the books and records properly reflect all transactions, that policies and procedures are implemented by qualified personnel, and that published financial statements are properly prepared and fairly presented. The Company’s system of internal control is supported by written policies and procedures, contains self-monitoring mechanisms, and is audited by the internal audit function. Appropriate actions are taken by management to correct deficiencies as they are identified.
Management’s Report on Internal Control over Financial Reporting
Management is responsible for establishing and maintaining adequate internal control over financial reporting for the Company. In order to evaluate the effectiveness of internal control over financial reporting, management has conducted an assessment, including testing, using the criteria established inInternal Control—Integrated Framework, issued by the Committee of Sponsoring Organizations of the Treadway Commission (COSO). The Company’s system of internal control over financial reporting is designed to provide reasonable assurance regarding the reliability of financial reporting and the preparation of financial statements for external purposes in accordance with generally accepted accounting principles. The Company’s internal control over financial reporting includes those policies and procedures that (i) pertain to the maintenance of records that, in reasonable detail, accurately and fairly reflect the transactions and dispositions of the assets of the Company; (ii) provide reasonable assurance that transactions are recorded as necessary to permit preparation of financial statements in accordance with generally accepted accounting principles, and that receipts and expenditures of the Company are being made only in accordance with authorizations of management and directors of the Company; and (iii) provide reasonable assurance regarding prevention or timely detection of unauthorized acquisition, use, or disposition of the Company’s assets that could have a material effect on the financial statements.
Because of its inherent limitations, internal control over financial reporting may not prevent or detect misstatements. Also, projections of any evaluation of effectiveness to future periods are subject to the risk that controls may become inadequate because of changes in conditions, or that the degree of compliance with the policies or procedures may deteriorate.
Based on the assessment, management has concluded that the Company maintained effective internal control over financial reporting as of December 31, 2012, based on criteria inInternal Control—Integrated Framework issued by the COSO.
The effectiveness of the Company’s internal control over financial reporting as of December 31, 2012 has been audited by PricewaterhouseCoopers LLP, an independent registered public accounting firm, as stated in their report, which is included herein.
Report of Independent Registered Public Accounting Firm
To the Board of Directors and Shareholders of Domtar Corporation:
In our opinion, the accompanying consolidated balance sheets and the related consolidated statements of earnings and comprehensive income, shareholders’ equity and cash flows present fairly, in all material respects, the financial position of Domtar Corporation and its subsidiaries at December 31, 2012 and December 31, 2011, and the results of their operations and their cash flows for each of the three years in the period ended December 31, 2012 in conformity with accounting principles generally accepted in the United States of America. In addition, in our opinion, the financial statement schedule listed in the index appearing under Item 15(a)(2) presents fairly, in all material respects, the information set forth therein when read in conjunction with the related consolidated financial statements. Also in our opinion, the Company maintained, in all material respects, effective internal control over financial reporting as of December 31, 2012, based on criteria established inInternal Control— Integrated Frameworkissued by the Committee of Sponsoring Organizations of the Treadway Commission (COSO). The Company’s management is responsible for these financial statements and financial statement schedule, for maintaining effective internal control over financial reporting and for its assessment of the effectiveness of internal control over financial reporting, included in the accompanying Management’s Report on Internal Control over Financial Reporting. Our responsibility is to express opinions on these financial statements, on the financial statement schedule, and on the Company’s internal control over financial reporting based on our integrated audits. We conducted our audits in accordance with the standards of the Public Company Accounting Oversight Board (United States). Those standards require that we plan and perform the audits to obtain reasonable assurance about whether the financial statements are free of material misstatement and whether effective internal control over financial reporting was maintained in all material respects. Our audits of the financial statements included examining, on a test basis, evidence supporting the amounts and disclosures in the financial statements, assessing the accounting principles used and significant estimates made by management, and evaluating the overall financial statement presentation. Our audit of internal control over financial reporting included obtaining an understanding of internal control over financial reporting, assessing the risk that a material weakness exists, and testing and evaluating the design and operating effectiveness of internal control based on the assessed risk. Our audits also included performing such other procedures as we considered necessary in the circumstances. We believe that our audits provide a reasonable basis for our opinions.
A company’s internal control over financial reporting is a process designed to provide reasonable assurance regarding the reliability of financial reporting and the preparation of financial statements for external purposes in accordance with generally accepted accounting principles. A company’s internal control over financial reporting includes those policies and procedures that (i) pertain to the maintenance of records that, in reasonable detail, accurately and fairly reflect the transactions and dispositions of the assets of the company; (ii) provide reasonable assurance that transactions are recorded as necessary to permit preparation of financial statements in accordance with generally accepted accounting principles, and that receipts and expenditures of the company are being made only in accordance with authorizations of management and directors of the company; and (iii) provide reasonable assurance regarding prevention or timely detection of unauthorized acquisition, use, or disposition of the company’s assets that could have a material effect on the financial statements.
Because of its inherent limitations, internal control over financial reporting may not prevent or detect misstatements. Also, projections of any evaluation of effectiveness to future periods are subject to the risk that controls may become inadequate because of changes in conditions, or that the degree of compliance with the policies or procedures may deteriorate.
/s/ PricewaterhouseCoopers LLP
PricewaterhouseCoopers LLP
Charlotte, North Carolina
February 25, 2013
DOMTAR CORPORATION
CONSOLIDATED STATEMENTS OF EARNINGS AND COMPREHENSIVE INCOME
(IN MILLIONS OF DOLLARS, UNLESS OTHERWISE NOTED)
| Year ended December 31, 2012 | Year ended December 31, 2011 | Year ended December 31, 2010 | ||||||||||
| $ | $ | $ | ||||||||||
Sales | 5,482 | 5,612 | 5,850 | |||||||||
Operating expenses | ||||||||||||
Cost of sales, excluding depreciation and amortization | 4,321 | 4,171 | 4,417 | |||||||||
Depreciation and amortization | 385 | 376 | 395 | |||||||||
Selling, general and administrative | 358 | 340 | 338 | |||||||||
Impairment and write-down of property, plant and equipment and intangible assets (NOTE 4) | 14 | 85 | 50 | |||||||||
Closure and restructuring costs (NOTE 16) | 30 | 52 | 27 | |||||||||
Other operating loss (income), net (NOTE 8) | 7 | (4 | ) | 20 | ||||||||
|
|
|
|
|
| |||||||
| 5,115 | 5,020 | 5,247 | ||||||||||
|
|
|
|
|
| |||||||
Operating income | 367 | 592 | 603 | |||||||||
Interest expense, net (NOTE 9) | 131 | 87 | 155 | |||||||||
|
|
|
|
|
| |||||||
Earnings before income taxes and equity earnings | 236 | 505 | 448 | |||||||||
Income tax expense (benefit) (NOTE 10) | 58 | 133 | (157 | ) | ||||||||
Equity loss, net of taxes | 6 | 7 | — | |||||||||
|
|
|
|
|
| |||||||
Net earnings | 172 | 365 | 605 | |||||||||
|
|
|
|
|
| |||||||
Per common share (in dollars) (NOTE 6) | ||||||||||||
Net earnings | ||||||||||||
Basic | 4.78 | 9.15 | 14.14 | |||||||||
Diluted | 4.76 | 9.08 | 14.00 | |||||||||
Weighted average number of common and exchangeable shares outstanding (millions) | ||||||||||||
Basic | 36.0 | 39.9 | 42.8 | |||||||||
Diluted | 36.1 | 40.2 | 43.2 | |||||||||
Net earnings | 172 | 365 | 605 | |||||||||
Other comprehensive income (loss): | ||||||||||||
Net derivative gains (losses) on cash flow hedges: | ||||||||||||
Net losses arising during the period, net of tax of $1 (2011—$7; 2010—$3) | — | (13 | ) | (4 | ) | |||||||
Less: Reclassification adjustment for (gains) losses included in net earnings, net of tax of $(5) (2011—$(2); 2010—$(1)) | 8 | (1 | ) | (2 | ) | |||||||
Foreign currency translation adjustments | 23 | (25 | ) | 66 | ||||||||
Change in unrecognized losses and prior service cost related to pension and post-retirement benefit plans, net of tax of $30 (2011—$15; 2010 $19) | (85 | ) | (25 | ) | (54 | ) | ||||||
|
|
|
|
|
| |||||||
Other comprehensive income (loss) | (54 | ) | (64 | ) | 6 | |||||||
|
|
|
|
|
| |||||||
Comprehensive income | 118 | 301 | 611 | |||||||||
|
|
|
|
|
| |||||||
The accompanying notes are an integral part of the consolidated financial statements.
DOMTAR CORPORATION
(IN MILLIONS OF DOLLARS, UNLESS OTHERWISE NOTED)
| At | ||||||||
| December 31, 2012 | December 31, 2011 | |||||||
| $ | $ | |||||||
Assets | ||||||||
Current assets | ||||||||
Cash and cash equivalents | 661 | 444 | ||||||
Receivables, less allowances of $4 and $5 | 562 | 644 | ||||||
Inventories (NOTE 11) | 675 | 652 | ||||||
Prepaid expenses | 24 | 22 | ||||||
Income and other taxes receivable | 48 | 47 | ||||||
Deferred income taxes (NOTE 10) | 45 | 125 | ||||||
|
|
|
| |||||
Total current assets | 2,015 | 1,934 | ||||||
Property, plant and equipment, at cost | 8,793 | 8,448 | ||||||
Accumulated depreciation | (5,392 | ) | (4,989 | ) | ||||
|
|
|
| |||||
Net property, plant and equipment (NOTE 13) | 3,401 | 3,459 | ||||||
Goodwill (NOTE 12) | 263 | 163 | ||||||
Intangible assets, net of amortization (NOTE 14) | 309 | 204 | ||||||
Other assets (NOTE 15) | 135 | 109 | ||||||
|
|
|
| |||||
Total assets | 6,123 | 5,869 | ||||||
|
|
|
| |||||
Liabilities and shareholders’ equity | ||||||||
Current liabilities | ||||||||
Bank indebtedness | 18 | 7 | ||||||
Trade and other payables (NOTE 17) | 646 | 688 | ||||||
Income and other taxes payable | 15 | 17 | ||||||
Long-term debt due within one year (NOTE 18) | 79 | 4 | ||||||
|
|
|
| |||||
Total current liabilities | 758 | 716 | ||||||
Long-term debt (NOTE 18) | 1,128 | 837 | ||||||
Deferred income taxes and other (NOTE 10) | 903 | 927 | ||||||
Other liabilities and deferred credits (NOTE 19) | 457 | 417 | ||||||
Commitments and contingencies (NOTE 21) | ||||||||
Shareholders’ equity (NOTE 20) | ||||||||
Common stock $0.01 par value; authorized 2,000,000,000 shares; issued: 42,523,896 and 42,506,732 shares | — | — | ||||||
Treasury stock $0.01 par value; 8,285,292 and 6,375,532 shares | — | — | ||||||
Exchangeable shares No par value; unlimited shares authorized; issued and held by nonaffiliates: 607,814 and 619,108 shares | 48 | 49 | ||||||
Additional paid-in capital | 2,175 | 2,326 | ||||||
Retained earnings | 782 | 671 | ||||||
Accumulated other comprehensive loss | (128 | ) | (74 | ) | ||||
|
|
|
| |||||
Total shareholders’ equity | 2,877 | 2,972 | ||||||
|
|
|
| |||||
Total liabilities and shareholders’ equity | 6,123 | 5,869 | ||||||
|
|
|
| |||||
The accompanying notes are an integral part of the consolidated financial statements.
DOMTAR CORPORATION
CONSOLIDATED STATEMENT OF SHAREHOLDERS’ EQUITY
(IN MILLIONS OF DOLLARS, UNLESS OTHERWISE NOTED)
| Issued and outstanding common and exchangeable shares (millions of shares) | Exchangeable shares | Additional paid-in capital | Retained earnings (Accumulated deficit) | Accumulated other comprehensive loss | Total shareholders’ equity | |||||||||||||||||||
| $ | $ | $ | $ | $ | ||||||||||||||||||||
Balance at December 31, 2009 | 43.0 | 78 | 2,816 | (216 | ) | (16 | ) | 2,662 | ||||||||||||||||
Conversion of exchangeable shares | — | (14 | ) | 14 | — | — | — | |||||||||||||||||
Stock-based compensation | 0.1 | — | 5 | — | — | 5 | ||||||||||||||||||
Net earnings | — | — | — | 605 | — | 605 | ||||||||||||||||||
Net derivative losses on cash flow hedges: | ||||||||||||||||||||||||
Net loss arising during the period, net of tax of $3 | — | — | — | — | (4 | ) | (4 | ) | ||||||||||||||||
Less: Reclassification adjustments for gains included in net earnings, net of tax of $(1) | — | — | — | — | (2 | ) | (2 | ) | ||||||||||||||||
Foreign currency translation adjustments | — | — | — | — | 66 | 66 | ||||||||||||||||||
Change in unrecognized losses and prior service cost related to pension and post-retirement benefit plans, net of tax of $19 | — | — | — | — | (54 | ) | (54 | ) | ||||||||||||||||
Stock repurchase, net of gain of $2 | (0.7 | ) | — | (42 | ) | — | — | (42 | ) | |||||||||||||||
Cash dividends | — | — | — | (32 | ) | — | (32 | ) | ||||||||||||||||
Other | — | — | (2 | ) | — | — | (2 | ) | ||||||||||||||||
|
|
|
|
|
|
|
|
|
|
|
| |||||||||||||
Balance at December 31, 2010 | 42.4 | 64 | 2,791 | 357 | (10 | ) | 3,202 | |||||||||||||||||
Conversion of exchangeable shares | — | (15 | ) | 15 | — | — | — | |||||||||||||||||
Stock-based compensation | 0.3 | — | 14 | — | — | 14 | ||||||||||||||||||
Net earnings | — | — | — | 365 | — | 365 | ||||||||||||||||||
Net derivative losses on cash flow hedges: | ||||||||||||||||||||||||
Net loss arising during the period, net of tax of $7 | — | — | — | — | (13 | ) | (13 | ) | ||||||||||||||||
Less: Reclassification adjustments for gains included in net earnings, net of tax of $(2) | — | — | — | — | (1 | ) | (1 | ) | ||||||||||||||||
Foreign currency translation adjustments | — | — | — | — | (25 | ) | (25 | ) | ||||||||||||||||
Change in unrecognized losses and prior service cost related to pension and post-retirement benefit plans, net of tax of $15 | — | — | — | — | (25 | ) | (25 | ) | ||||||||||||||||
Stock repurchase | (5.9 | ) | — | (494 | ) | — | — | (494 | ) | |||||||||||||||
Cash dividends | — | — | — | (51 | ) | — | (51 | ) | ||||||||||||||||
|
|
|
|
|
|
|
|
|
|
|
| |||||||||||||
Balance at December 31, 2011 | 36.8 | 49 | 2,326 | 671 | (74 | ) | 2,972 | |||||||||||||||||
Conversion of exchangeable shares | — | (1 | ) | 1 | — | — | — | |||||||||||||||||
Stock-based compensation, net of tax | — | — | 5 | — | — | 5 | ||||||||||||||||||
Net earnings | — | — | — | 172 | — | 172 | ||||||||||||||||||
Net derivative losses on cash flow hedges: | ||||||||||||||||||||||||
Net loss arising during the period, net of tax of $1 | — | — | — | — | — | — | ||||||||||||||||||
Less: Reclassification adjustments for losses included in net earnings, net of tax of $(5) | — | — | — | — | 8 | 8 | ||||||||||||||||||
Foreign currency translation adjustments | — | — | — | — | 23 | 23 | ||||||||||||||||||
Change in unrecognized losses and prior service cost related to pension and post-retirement benefit plans, net of tax of $30 | — | — | — | — | (85 | ) | (85 | ) | ||||||||||||||||
Stock repurchase | (2.0 | ) | — | (157 | ) | — | — | (157 | ) | |||||||||||||||
Cash dividends | — | — | — | (61 | ) | — | (61 | ) | ||||||||||||||||
|
|
|
|
|
|
|
|
|
|
|
| |||||||||||||
Balance at December 31, 2012 | 34.8 | 48 | 2,175 | 782 | (128 | ) | 2,877 | |||||||||||||||||
|
|
|
|
|
|
|
|
|
|
|
| |||||||||||||
The accompanying notes are an integral part of the consolidated financial statements.
DOMTAR CORPORATION
CONSOLIDATED STATEMENTS OF CASH FLOWS
(IN MILLIONS OF DOLLARS)
| Year ended December 31, 2012 | Year ended December 31, 2011 | Year ended December 31, 2010 | ||||||||||
| $ | $ | $ | ||||||||||
Operating activities | ||||||||||||
Net earnings | 172 | 365 | 605 | |||||||||
Adjustments to reconcile net earnings to cash flows from operating activities | ||||||||||||
Depreciation and amortization | 385 | 376 | 395 | |||||||||
Deferred income taxes and tax uncertainties (NOTE 10) | (1 | ) | 40 | (174 | ) | |||||||
Impairment and write-down of property, plant and equipment and intangible assets (NOTE 4) | 14 | 85 | 50 | |||||||||
Loss on repurchase of long-term debt and debt restructuring costs | — | 4 | 47 | |||||||||
Net losses (gains) on disposals of property, plant and equipment and sale of businesses | 2 | (6 | ) | 33 | ||||||||
Stock-based compensation expense | 5 | 3 | 5 | |||||||||
Equity loss, net | 6 | 7 | — | |||||||||
Other | (13 | ) | — | (2 | ) | |||||||
Changes in assets and liabilities, excluding the effects of acquisition and sale of businesses | ||||||||||||
Receivables | 99 | (12 | ) | (73 | ) | |||||||
Inventories | 5 | 2 | 39 | |||||||||
Prepaid expenses | (3 | ) | 2 | 6 | ||||||||
Trade and other payables | (118 | ) | (27 | ) | (11 | ) | ||||||
Income and other taxes | (4 | ) | 33 | 344 | ||||||||
Difference between employer pension and other post-retirement contributions and pension and other post-retirement expense | (13 | ) | (18 | ) | (120 | ) | ||||||
Other assets and other liabilities | 15 | 29 | 22 | |||||||||
|
|
|
|
|
| |||||||
Cash flows provided from operating activities | 551 | 883 | 1,166 | |||||||||
|
|
|
|
|
| |||||||
Investing activities | ||||||||||||
Additions to property, plant and equipment | (236 | ) | (144 | ) | (153 | ) | ||||||
Proceeds from disposals of property, plant and equipment | 49 | 34 | 26 | |||||||||
Proceeds from sale of businesses and investments | — | 10 | 185 | |||||||||
Acquisition of businesses, net of cash acquired | (293 | ) | (288 | ) | — | |||||||
Investment in joint venture | (6 | ) | (7 | ) | — | |||||||
|
|
|
|
|
| |||||||
Cash flows (used for) provided from investing activities | (486 | ) | (395 | ) | 58 | |||||||
|
|
|
|
|
| |||||||
Financing activities | ||||||||||||
Dividend payments | (58 | ) | (49 | ) | (21 | ) | ||||||
Net change in bank indebtedness | 11 | (16 | ) | (19 | ) | |||||||
Issuance of long-term debt | 548 | — | — | |||||||||
Repayment of long-term debt | (192 | ) | (18 | ) | (898 | ) | ||||||
Debt issue and tender offer costs | — | (7 | ) | (35 | ) | |||||||
Stock repurchase | (157 | ) | (494 | ) | (44 | ) | ||||||
Prepaid on structured stock repurchase, net | — | — | 2 | |||||||||
Other | — | 10 | (3 | ) | ||||||||
|
|
|
|
|
| |||||||
Cash flows provided from (used for) financing activities | 152 | (574 | ) | (1,018 | ) | |||||||
|
|
|
|
|
| |||||||
Net increase (decrease) in cash and cash equivalents | 217 | (86 | ) | 206 | ||||||||
Cash and cash equivalents at beginning of year | 444 | 530 | 324 | |||||||||
|
|
|
|
|
| |||||||
Cash and cash equivalents at end of year | 661 | 444 | 530 | |||||||||
|
|
|
|
|
| |||||||
Supplemental cash flow information | ||||||||||||
Net cash payments for: | ||||||||||||
Interest (including $47 million of tender offer premiums in 2012) | 116 | 74 | 107 | |||||||||
Income taxes paid | 76 | 60 | 28 | |||||||||
|
|
|
|
|
| |||||||
The accompanying notes are an integral part of the consolidated financial statements.
INDEX FOR NOTES TO CONSOLIDATED FINANCIAL STATEMENTS
NOTE 1 | SUMMARY OF SIGNIFICANT ACCOUNTING POLICIES | 80 | ||
NOTE 2 | RECENT ACCOUNTING PRONOUNCEMENTS | 87 | ||
NOTE 3 | ACQUISITION OF BUSINESSES | 88 | ||
NOTE 4 | IMPAIRMENT AND WRITE-DOWN OF PROPERTY, PLANT AND EQUIPMENT AND INTANGIBLE ASSETS | 91 | ||
NOTE 5 | STOCK-BASED COMPENSATION | 93 | ||
NOTE 6 | EARNINGS PER SHARE | 98 | ||
NOTE 7 | PENSION PLANS AND OTHER POST-RETIREMENT BENEFIT PLANS | 99 | ||
NOTE 8 | OTHER OPERATING LOSS (INCOME), NET | 111 | ||
NOTE 9 | INTEREST EXPENSE, NET | 112 | ||
NOTE 10 | INCOME TAXES | 112 | ||
NOTE 11 | INVENTORIES | 118 | ||
NOTE 12 | GOODWILL | 119 | ||
NOTE 13 | PROPERTY, PLANT AND EQUIPMENT | 119 | ||
NOTE 14 | INTANGIBLE ASSETS | 120 | ||
NOTE 15 | OTHER ASSETS | 121 | ||
NOTE 16 | CLOSURE AND RESTRUCTURING COSTS AND LIABILITY | 121 | ||
NOTE 17 | TRADE AND OTHER PAYABLES | 125 | ||
NOTE 18 | LONG-TERM DEBT | 125 | ||
NOTE 19 | OTHER LIABILITIES AND DEFERRED CREDITS | 129 | ||
NOTE 20 | SHAREHOLDERS’ EQUITY | 130 | ||
NOTE 21 | COMMITMENTS AND CONTINGENCIES | 132 | ||
NOTE 22 | DERIVATIVES AND HEDGING ACTIVITIES AND FAIR VALUE MEASUREMENT | 137 | ||
NOTE 23 | SEGMENT DISCLOSURES | 142 | ||
NOTE 24 | SUPPLEMENTAL GUARANTOR FINANCIAL INFORMATION | 146 | ||
NOTE 25 | SALE OF WOOD BUSINESS AND WOODLAND MILL | 155 | ||
DOMTAR CORPORATION
NOTES TO CONSOLIDATED FINANCIAL STATEMENTS
DECEMBER 31, 2012
(IN MILLIONS OF DOLLARS, UNLESS OTHERWISE NOTED)
SUMMARY OF SIGNIFICANT ACCOUNTING POLICIES
NATURE OF OPERATIONS
Domtar designs, manufactures, markets and distributes a wide variety of fiber-based products including communications papers, specialty and packaging papers and adult incontinence products. The foundation of its business is the efficient operation of pulp mills, converting fiber into papergrade, fluff and specialty pulps. The majority of this pulp production is consumed internally to make communication papers and specialty and packaging papers with the balance sold as a market pulp. Domtar is the largest integrated marketer and manufacturer of uncoated freesheet paper in North America. In addition, Domtar operates manufacturing, research and development and distribution facilities to sell adult incontinence care products including washcloths, marketed primarily under the Attends® brand name. The Company also owns and operates Ariva®, a network of strategically located paper distribution facilities. The Company also produced lumber and other speciality and industrial wood products up until the sale of the Wood business on June 30, 2010.
ACCOUNTING PRINCIPLES
The Company’s consolidated financial statements have been prepared in accordance with accounting principles generally accepted in the United States of America (“GAAP”). The consolidated financial statements include the accounts of Domtar Corporation and its controlled subsidiaries. Significant intercompany transactions have been eliminated on consolidation. Investment in an affiliated company, where the Company has joint control over their operations, is accounted for by the equity method. The Company’s share of equity earnings totaled a loss, net of taxes, of $6 million.
To conform with the basis of presentation adopted in the current period, certain figures previously reported in the Statements of Cash Flows, have been reclassified.
USE OF ESTIMATES
The consolidated financial statements have been prepared in conformity with GAAP, which requires management to make estimates and assumptions that affect the reported amounts of revenues and expenses during the year, the reported amounts of assets and liabilities, and the disclosure of contingent assets and liabilities at the date of the consolidated financial statements. On an ongoing basis, management reviews the estimates and assumptions, including but not limited to those related to closure and restructuring costs, income taxes, useful lives, asset impairment charges, environmental matters and other asset retirement obligations, pension and other post-retirement benefit plans and, commitments and contingencies, based on currently available information. Actual results could differ from those estimates.
TRANSLATION OF FOREIGN CURRENCIES
The Company determines its international subsidiaries’ functional currency by reviewing the currencies in which their respective operating activities occur. The Company translates assets and liabilities of its non-U.S.
DOMTAR CORPORATION
NOTES TO CONSOLIDATED FINANCIAL STATEMENTS
DECEMBER 31, 2012
(IN MILLIONS OF DOLLARS, UNLESS OTHERWISE NOTED)
NOTE 1. SUMMARY OF SIGNIFICANT ACCOUNTING POLICIES (CONTINUED)
dollar functional currency subsidiaries into U.S. dollars using the rate in effect at the balance sheet date and revenues and expenses are translated at the average exchange rates during the year. Foreign currency translation gains and losses are included in Shareholders’ equity as a component of Accumulated other comprehensive loss in the accompanying Consolidated Balance Sheets.
Monetary assets and liabilities denominated in a currency that is different from a reporting entity’s functional currency must first be remeasured from the applicable currency to the legal entity’s functional currency. The effect of this remeasurement process is recognized in the Consolidated Statements of Earnings and Comprehensive Income and is partially offset by our economic hedging program (refer to Note 22). At December 31, 2012, the accumulated translation adjustment accounts amounted to $208 million (2011—$185 million).
REVENUE RECOGNITION
Domtar Corporation recognizes revenues when pervasive evidence of an arrangement exists, the customer takes title and assumes the risks and rewards of ownership, the sales price charged is fixed or determinable and when collection is reasonably assured. Revenue is recorded at the time of shipment for terms designated free on board (“f.o.b.”) shipping point. For sales transactions designated f.o.b. destination, revenue is recorded when the product is delivered to the customer’s delivery site, when the title and risk of loss are transferred.
SHIPPING AND HANDLING COSTS
The Company classifies shipping and handling costs as a component of Cost of sales in the Consolidated Statements of Earnings and Comprehensive Income.
CLOSURE AND RESTRUCTURING COSTS
Closure and restructuring costs are recognized as liabilities in the period when they are incurred and are measured at their fair value. For such recognition to occur, management, with the appropriate level of authority, must have approved and committed to a firm plan and appropriate communication to those affected must have occurred. These provisions may require an estimation of costs such as severance and termination benefits, pension and related curtailments, environmental remediation and may also include expenses related to demolition and outplacement. Actions taken may also require an evaluation of any remaining assets to determine required write-downs, if any, and a review of estimated remaining useful lives which may lead to accelerated depreciation expense.
Estimates of cash flows and fair value relating to closures and restructurings require judgment. Closure and restructuring liabilities are based on management’s best estimates of future events at December 31, 2012. Closure and restructuring cost estimates are dependent on future events. Although the Company does not anticipate significant changes, the actual costs may differ from these estimates due to subsequent developments such as the results of environmental studies, the ability to find a buyer for assets set to be dismantled and demolished and other business developments. As such, additional costs and further working capital adjustments may be required in future periods.
DOMTAR CORPORATION
NOTES TO CONSOLIDATED FINANCIAL STATEMENTS
DECEMBER 31, 2012
(IN MILLIONS OF DOLLARS, UNLESS OTHERWISE NOTED)
NOTE 1. SUMMARY OF SIGNIFICANT ACCOUNTING POLICIES (CONTINUED)
INCOME TAXES
Domtar Corporation uses the asset and liability method of accounting for income taxes. Under this method, deferred tax assets and liabilities are determined according to differences between the carrying amounts and tax bases of the assets and liabilities. The Company records its worldwide tax provision based on the respective tax rules and regulations for the jurisdictions in which it operates. The change in the net deferred tax asset or liability is included in Income tax expense or in Other comprehensive income (loss) in the Consolidated Statements of Earnings and Comprehensive Income. Deferred tax assets and liabilities are measured using enacted tax rates and laws expected to apply in the years in which the assets and liabilities are expected to be recovered or settled. Uncertain tax positions are recorded based upon the Company’s evaluation of whether it is “more likely than not” (a probability level of more than 50 percent) that, based upon its technical merits, the tax position will be sustained upon examination by the taxing authorities. The Company establishes a valuation allowance for deferred tax assets when it is more likely than not that they will not be realized. In general, “realization” refers to the incremental benefit achieved through the reduction in future taxes payable or an increase in future taxes refundable from the deferred tax assets.
The Company recognizes interest and penalties related to income tax matters as a component of Income tax expense in the Consolidated Statements of Earnings and Comprehensive Income.
CASH AND CASH EQUIVALENTS
Cash and cash equivalents include cash and short-term investments with original maturities of less than three months and are presented at cost which approximates fair value.
RECEIVABLES
Receivables are recorded net of a provision for doubtful accounts that is based on expected collectability. The securitization of receivables is accounted for as secured borrowings. Accordingly, financing expenses related to the securitization of receivables are recognized in earnings as a component of Interest expense in the Consolidated Statements of Earnings and Comprehensive Income.
INVENTORIES
Inventories are stated at the lower of cost or market. Cost includes labor, materials and production overhead. The last-in, first-out (“LIFO”) method is used to cost certain U.S. raw materials, in process and finished goods inventories. LIFO inventories were $264 million and $267 million at December 31, 2012 and 2011, respectively. The balance of U.S. raw material inventories, all materials and supplies inventories and all foreign inventories are costed at either the first-in, first-out (“FIFO”) or average cost methods. Had the inventories for which the LIFO method is used been valued under the FIFO method, the amounts at which product inventories are stated would have been $62 million and $56 million greater at December 31, 2012 and 2011, respectively.
DOMTAR CORPORATION
NOTES TO CONSOLIDATED FINANCIAL STATEMENTS
DECEMBER 31, 2012
(IN MILLIONS OF DOLLARS, UNLESS OTHERWISE NOTED)
NOTE 1. SUMMARY OF SIGNIFICANT ACCOUNTING POLICIES (CONTINUED)
PROPERTY, PLANT AND EQUIPMENT
Property, plant and equipment are stated at cost less accumulated depreciation including asset impairment write-downs. Interest costs are capitalized for significant capital projects. For timber limits and timberlands, amortization is calculated using the units of production method. For all other assets, amortization is calculated using the straight-line method over the estimated useful lives of the assets. Buildings and improvements are amortized over periods of 10 to 40 years and machinery and equipment over periods of 3 to 20 years. No depreciation is recorded on assets under construction.
IMPAIRMENT OF LONG-LIVED ASSETS
Long-lived assets are reviewed for impairment upon the occurrence of events or changes in circumstances indicating that the carrying value of the assets may not be recoverable, as measured by comparing their net book value to their estimated undiscounted future cash flows. Impaired assets are recorded at estimated fair value, determined principally by using discounted future cash flows expected from their use and eventual disposition (refer to Note 4).
GOODWILL AND OTHER INTANGIBLE ASSETS
Goodwill is not amortized and is evaluated at the beginning of the fourth quarter of every year or more frequently whenever indicators of potential impairment exist. The Company performs the impairment test of goodwill at its reporting unit level. The Company has the option to first assess qualitative factors to determine whether it is more likely than not that the fair value of a reporting unit is less than its carrying amount. In performing the qualitative assessment, the Company identifies the relevant drivers of fair value of a reporting unit and the relevant events and circumstances that may have an impact on those drivers of fair value. This process involves significant judgement and assumptions including the assessment of the results of the most recent fair value calculations, the identification of macroeconomic conditions, industry and market considerations, cost factors, overall financial performance, specific events affecting the Company and the business, and making the assessment on whether each relevant factor will impact the impairment test positively or negatively and the magnitude of any such impact. If, after assessing the totality of events or circumstances, the Company determines that it is more likely than not that the fair value of a reporting unit is less than its carrying amount, then it performs Step I of the two-step impairment test. The Company can also elect to bypass the qualitative assessment and proceed directly to the Step 1 of the impairment test.
The first step is to compare the fair value of a reporting unit to its carrying value, including goodwill. The Company uses a discounted cash flow model to determine the fair value of a reporting unit. The assumptions used in the model are consistent with those we believe hypothetical marketplace participants would use. In the event that the net carrying amount exceeds the fair value of the business, the second step of the impairment test must be performed in order to determine the amount of the impairment charge. Fair value of goodwill in the Step II impairment test is estimated in the same way as goodwill was determined at the date of the acquisition in a business combination, that is, the excess of the fair value of the reporting unit over the fair value of the identifiable net assets of the business.
All goodwill as of December 31, 2009, while holding all other assumptions constant:2012 resides in the Personal Care segment, and originates from the acquisitions of Attends Healthcare Inc. on September 1, 2011, Attends Healthcare Limited on March 1, 2012 and EAM Corporation on May 10, 2012. Please refer to Note 3 “Acquisition of businesses” for additional information regarding these acquisitions.
DOMTAR CORPORATION
NOTES TO CONSOLIDATED FINANCIAL STATEMENTS
DECEMBER 31, 2012
(IN MILLIONS OF DOLLARS, UNLESS OTHERWISE NOTED)
Key Assumption | Increase of | Approximate impact on the undiscounted cash flows | ||||||
| (In millions of dollars) | ||||||||
Fluff pulp pricing | $ | 5/ton | $ | 31 | ||||
NOTE 1. SUMMARY OF SIGNIFICANT ACCOUNTING POLICIES (CONTINUED)
Indefinite-lived intangible assets are not amortized and are evaluated at the beginning of the fourth quarter of every year, or more frequently whenever indicators of potential impairment exist. The Company has the option to first assess qualitative factors to determine whether it is more likely than not that the fair value of indefinite-lived intangible assets are less than their carrying amounts. The qualitative assessment follows the same process as the one performed for goodwill, as described above. If, after assessing the qualitative factors, the Company determines that it is more likely than not that the indefinite-lived intangible assets are less than their carrying amounts, then an impairment test is required. The Company can also elect to proceed directly to the quantitative test. The impairment test consists of comparing the fair value of the indefinite-lived intangible assets determined using a variety of methodologies to their carrying amount. If the carrying amounts of the indefinite-lived intangible assets exceed their fair value, an impairment loss is recognized in an amount equal to that excess. Indefinite-lived intangible assets include trade names related to Attends®. The Company evaluates its indefinite-lived intangible assets each reporting period to determine whether events and circumstances continue to support indefinite useful lives.
Definite lived intangible assets are stated at cost less amortization and are reviewed for impairment whenever events or changes in circumstances indicate that their carrying amount may not be recoverable. Definite lived intangible assets include water rights, customer relationships, technology, trade names and supplier and non-compete agreements which are being amortized using the straight-line method over their estimated useful lives. Power purchase agreements are amortized using the straight-line method over the term of the respective contract. Cutting rights were amortized using the units of production method and were sold June 30, 2010 as part of the sale of the Wood business (refer to Note 25). Any potential impairment for definite lived intangible assets will be calculated in the same manner as that disclosed under impairment of long-lived assets.
Amortization is based mainly on the following useful lives:
Useful life | ||
Water rights | 40 years | |
Customer relationships | 20 to 40 years | |
Technology | 7 to 20 years | |
Trade names | 7 years | |
Supplier agreements | 5 years | |
Power purchase agreements | 25 years | |
Non-Compete agreements | 9 years |
OTHER ASSETS
Other assets are recorded at cost. Direct financing costs related to the issuance of long-term debt are deferred and amortized using the effective interest rate method.
ENVIRONMENTAL COSTS
Environmental expenditures for effluent treatment, air emission, landfill operation and closure, asbestos containment and removal, bark pile management, silvicultural activities and site remediation (together referred to as environmental matters) are expensed or capitalized depending on their future economic benefit. In the normal course of business, Domtar Corporation incurs certain operating costs for environmental matters that are
DOMTAR CORPORATION
NOTES TO CONSOLIDATED FINANCIAL STATEMENTS
DECEMBER 31, 2012
(IN MILLIONS OF DOLLARS, UNLESS OTHERWISE NOTED)
NOTE 1. SUMMARY OF SIGNIFICANT ACCOUNTING POLICIES (CONTINUED)
expensed as incurred. Expenditures for property, plant and equipment that prevent future environmental impacts are capitalized and amortized on a straight-line basis over 10 to 40 years. Provisions for environmental matters are not discounted, due to uncertainty with respect to timing of expenditures, and are recorded when remediation efforts are probable and can be reasonably estimated.
ASSET RETIREMENT OBLIGATIONS
Asset retirement obligations are recognized, at fair value, in the period in which Domtar Corporation incurs a legal obligation associated with the retirement of an asset. Conditional asset retirement obligations are recognized, at fair value, when the fair value of the liability can be reasonably estimated or on a probability-weighted discounted cash flow estimate. The associated costs are capitalized as part of the carrying value of the related asset and depreciated over its remaining useful life. The liability is accreted using the credit adjusted risk-free interest rate used to discount the cash flow.
STOCK-BASED COMPENSATION AND OTHER STOCK-BASED PAYMENTS
Domtar Corporation recognizes the cost of employee services received in exchange for awards of equity instruments over the requisite service period, based on their grant date fair value for awards accounted for as equity and based on the quoted market value of each reporting period for awards accounted for as liability. The Company awards are accounted for as compensation expense and presented in Additional paid-in-capital on the Consolidated Balance Sheets for Equity type awards and presented in Other long-term liabilities and deferred credits on the Consolidated Balance Sheets for Liability type awards.
The Company’s awards may be subject to market, performance and/or service conditions. Any consideration paid by plan participants on the exercise of stock options or the purchase of shares is credited to Additional paid-in-capital on the Consolidated Balance Sheets. The par value included in the Additional paid-in-capital component of stock-based compensation is transferred to Common shares upon the issuance of shares of common stock.
Unless otherwise determined at the time of the grant, awards subject to service conditions vest in approximately equal installments over three years beginning on the first anniversary of the grant date and performance-based awards vest based on achievement of pre-determined performance goals over performance periods of three years. The majority of non-qualified stock options and performance share units expire at various dates no later than seven years from the date of grant. Deferred Share Units vest immediately at the grant date and are remeasured at each reporting period, until settlement, using the quoted market value.
Under the 2007 Omnibus Incentive Plan (the “Omnibus Plan”), a maximum of 1,422,214 shares are reserved for issuance in connection with awards granted or to be granted.
DERIVATIVE INSTRUMENTS
Derivative instruments are utilized by Domtar Corporation as part of the overall strategy to manage exposure to fluctuations in foreign currency and price on certain purchases. As a matter of policy, derivatives are not used for trading or speculative purposes. All derivatives are recorded at fair value either as assets or
DOMTAR CORPORATION
NOTES TO CONSOLIDATED FINANCIAL STATEMENTS
DECEMBER 31, 2012
(IN MILLIONS OF DOLLARS, UNLESS OTHERWISE NOTED)
NOTE 1. SUMMARY OF SIGNIFICANT ACCOUNTING POLICIES (CONTINUED)
liabilities. When derivative instruments have been designated within a hedge relationship and are highly effective in offsetting the identified risk characteristics of specific financial assets and liabilities or group of financial assets and liabilities, hedge accounting is applied.
In a fair value hedge, changes in fair value of derivatives are recognized in the Consolidated Statements of Earnings and Comprehensive Income. The change in fair value of the hedged item attributable to the hedged risk is also recorded in the Consolidated Statements of Earnings and Comprehensive Income by way of a corresponding adjustment of the carrying amount of the hedged item recognized in the Consolidated Balance Sheets. In a cash flow hedge, changes in fair value of derivative instruments are recorded in Other comprehensive income (loss). These amounts are reclassified in the Consolidated Statements of Earnings and Comprehensive Income in the periods in which results are affected by the cash flows of the hedged item within the same line item. Any hedge ineffectiveness is recorded in the Consolidated Statements of Earnings and Comprehensive Income when incurred.
PENSION PLANS
Domtar Corporation’s plans include funded and unfunded defined benefit and defined contribution pension plans. Domtar Corporation recognizes the overfunded or underfunded status of defined benefit and underfunded defined contribution pension plans as an asset or liability in the Consolidated Balance Sheets. The net periodic benefit cost includes the following:
The cost of pension benefits provided in exchange for employees’ services rendered during the period,
The interest cost of pension obligations,
The expected long-term return on pension fund assets based on a market value of pension fund assets,
Gains or losses on settlements and curtailments,
The straight-line amortization of past service costs and plan amendments over the average remaining service period of approximately 9 years of the active employee group covered by the plans, and
The amortization of cumulative net actuarial gains and losses in excess of 10% of the greater of the accrued benefit obligation or market value of plan assets at the beginning of the year over the average remaining service period of approximately 9 years of the active employee group covered by the plans.
The defined benefit plan obligations are determined in accordance with the projected unit credit actuarial cost method.
OTHER POST-RETIREMENT BENEFIT PLANS
The Company recognizes the unfunded status of other post-retirement benefit plans (other than multiemployer plans) as a liability in the Consolidated Balance Sheets. These benefits, which are funded by Domtar Corporation as they become due, include life insurance programs, medical and dental benefits and short-term and long-term disability programs. We amortize the cumulative net actuarial gains and losses in excess of 10% of the accrued benefit obligation at the beginning of the year over the average remaining service period of approximately 10 years of the active employee group covered by the plans.
DOMTAR CORPORATION
NOTES TO CONSOLIDATED FINANCIAL STATEMENTS
DECEMBER 31, 2012
(IN MILLIONS OF DOLLARS, UNLESS OTHERWISE NOTED)
NOTE 1. SUMMARY OF SIGNIFICANT ACCOUNTING POLICIES (CONTINUED)
GUARANTEES
A guarantee is a contract or an indemnification agreement that contingently requires Domtar Corporation to make payments to the other party of the contract or agreement, based on changes in an underlying item that is related to an asset, a liability or an equity security of the other party or on a third party’s failure to perform under an obligating agreement. It could also be an indirect guarantee of the indebtedness of another party, even though the payment to the other party may not be based on changes in an underlying item that is related to an asset, a liability or an equity security of the other party. Guarantees, when applicable, are accounted for at fair value.
RECENT ACCOUNTING PRONOUNCEMENTS
ACCOUNTING CHANGES IMPLEMENTED
Plymouth Pulp and Paper Mill—Closure of Paper MachineCOMPREHENSIVE INCOME
In June 2011, the Financial Accounting Standards Board (“FASB”) issued changes to the presentation of comprehensive income. These changes give an entity the option to present the total of comprehensive income, the components of net income, and the components of other comprehensive income either in a single continuous statement of comprehensive income or in two separate but consecutive statements. The option to present components of other comprehensive income as part of the statement of changes in shareholders’ equity was eliminated. The nature of the items that must be reported in other comprehensive income and the requirements for reclassification from other comprehensive income to net income were not changed. Additionally, no changes were made to the calculation and presentation of earnings per share. The Company adopted the new requirement on January 1, 2012 with no impact on the Company’s consolidated financial statements except for the change in presentation. The Company has chosen to present a single continuous statement of comprehensive income.
INTANGIBLES—GOODWILL AND OTHER
In July 2012, the FASB issued an update to Intangibles—Goodwill and Other, which simplifies how entities test indefinite-lived intangible assets for impairment by permitting an entity to first assess qualitative factors to determine whether it is more likely than not that the indefinite-lived intangible asset is impaired. If the entity concludes that it is more likely than not that the indefinite-lived intangible asset is impaired, then it is required to perform the quantitative impairment test. The amended provisions are effective for annual and interim impairment tests performed for fiscal years beginning after September 15, 2012 with early adoption permitted. The Company adopted the new requirement as of its publication date with no impact on the Company’s consolidated financial statements.
DOMTAR CORPORATION
NOTES TO CONSOLIDATED FINANCIAL STATEMENTS
DECEMBER 31, 2012
(IN MILLIONS OF DOLLARS, UNLESS OTHERWISE NOTED)
NOTE 2. RECENT ACCOUNTING PRONOUNCEMENTS (CONTINUED)
FUTURE ACCOUNTING CHANGES
COMPREHENSIVE INCOME
In February 2013, the FASB issued an update to Comprehensive Income, which requires an entity to provide information regarding the amounts reclassified out of accumulated other comprehensive income by component. The standard requires that companies present either in a single note or parenthetically on the face of the financial statements, the effect of significant amounts reclassified from each component of accumulated other comprehensive income based on its source, and the income statement line items affected by the reclassification. If a component is not required to be reclassified to net income in its entirety, companies would instead cross reference to the related footnote for additional information.
These modifications are effective for interim and annual periods beginning after December 15, 2012. The Company is currently evaluating these changes to determine which option will be chosen for the presentation of amounts reclassified out of accumulated other comprehensive income. Other than the change in presentation, the Company has determined these changes will not have an impact on the consolidated financial statements.
ACQUISITION OF BUSINESSES
EAM Corporation
On May 10, 2012, the Company completed the acquisition of 100% of the outstanding shares of EAM Corporation (“EAM”). EAM manufactures high quality airlaid and ultrathin laminated absorbent cores used in feminine hygiene, adult incontinence, baby diapers, and other medical healthcare and performance packaging solutions. EAM operates a manufacturing, research and development and distribution facility in Jesup, Georgia. EAM has approximately 54 employees. The results of EAM’s operations have been included in the consolidated financial statements since May 1, 2012, the effective time of the transaction, and are presented in the Personal Care reportable segment. The purchase price was $61 million in cash, including working capital, net of cash acquired of $1 million. The acquisition was accounted for as a business combination under the acquisition method of accounting, in accordance with the Business Combinations Topic of FASB Accounting Standards Codification (“ASC”).
The total purchase price was allocated to tangible and intangible assets acquired and liabilities assumed based on the Company’s estimates of their fair value, which are based on information currently available. During the fourth quarter of 2009, we2012, the Company completed the evaluation of all assets and liabilities.
DOMTAR CORPORATION
NOTES TO CONSOLIDATED FINANCIAL STATEMENTS
DECEMBER 31, 2012
(IN MILLIONS OF DOLLARS, UNLESS OTHERWISE NOTED)
NOTE 3. ACQUISITION OF BUSINESSES (CONTINUED)
The table below illustrates the purchase price allocation:
Fair value of net assets acquired at the date of acquisition | ||||||||
Receivables | $ | 6 | ||||||
Inventory | 2 | |||||||
Property, plant and equipment | 13 | |||||||
Intangible assets (Note 14) | ||||||||
Customer relationships(1) | 19 | |||||||
Technology(2) | 8 | |||||||
Non-compete(3) | 1 | |||||||
| 28 | ||||||||
Goodwill (Note 12) | 31 | |||||||
|
| |||||||
Total assets | 80 | |||||||
Less: Liabilities | ||||||||
Trade and other payables | 4 | |||||||
Deferred income tax liabilities and unrecognized tax benefits | 15 | |||||||
|
| |||||||
Total liabilities | 19 | |||||||
Fair value of net assets acquired at the date of acquisition | 61 | |||||||
| (1) | The useful life of the Customer relationships acquired is 30 years. |
| (2) | The useful lives of the Technology acquired are between 7 and 20 years. |
| (3) | The useful life of the Non-compete acquired is 9 years. |
Attends Healthcare Limited
On March 1, 2012, the Company completed the acquisition of 100% of the outstanding shares of Attends Healthcare Limited (“Attends Europe”). Attends Europe manufactures and supplies adult incontinence care products in Northern Europe. Attends Europe operates a manufacturing, research and development and distribution facility in Aneby, Sweden and also operates a distribution center in Germany. Attends Europe has approximately 458 employees. The results of Attends Europe’s operations have been included in the consolidated financial statements since March 1, 2012, and are presented in the Personal Care reportable segment. The purchase price was $232 million (€173 million) in cash, including working capital, net of acquired cash of $4 million (€3 million). The acquisition was accounted for as a business combination under the acquisition method of accounting, in accordance with the Business Combinations Topic of FASB ASC.
The total purchase price was allocated to tangible and intangible assets acquired and liabilities assumed based on the Company’s estimates of their fair value, which are based on information currently available. During the fourth quarter of 2012, the Company completed the evaluation of all assets and liabilities.
DOMTAR CORPORATION
NOTES TO CONSOLIDATED FINANCIAL STATEMENTS
DECEMBER 31, 2012
(IN MILLIONS OF DOLLARS, UNLESS OTHERWISE NOTED)
NOTE 3. ACQUISITION OF BUSINESSES (CONTINUED)
The table below illustrates the purchase price allocation:
Fair value of net assets acquired at the date of acquisition | ||||||||
Receivables | $ | 21 | ||||||
Inventory | 22 | |||||||
Property, plant and equipment | 67 | |||||||
Intangible assets (Note 14) | ||||||||
Trade names(1) | 54 | |||||||
Customer relationships(2) | 71 | |||||||
| 125 | ||||||||
Goodwill (Note 12) | 71 | |||||||
|
| |||||||
Total assets | 306 | |||||||
Less: Liabilities | ||||||||
Trade and other payables | 27 | |||||||
Capital lease obligation | 6 | |||||||
Deferred income tax liabilities and unrecognized tax benefits | 38 | |||||||
Pension | 3 | |||||||
|
| |||||||
Total liabilities | 74 | |||||||
Fair value of net assets acquired at the date of acquisition | 232 | |||||||
| (1) | Indefinite useful life. |
| (2) | The useful life of the Customer relationships acquired is 30 years. |
Attends Healthcare Inc.
On September 1, 2011, Domtar Corporation completed the acquisition of 100% of the outstanding shares of Attends Healthcare Inc. (“Attends US”). Attends US sells and markets a complete line of adult incontinence care products and distributes washcloths marketed primarily under the Attends® brand name. The company has a wide product offering and it serves a diversified customer base in multiple channels throughout the United States and Canada. Attends US has approximately 320 employees and the production facility is located in Greenville, North Carolina. The results of Attends US’ operations have been included in the consolidated financial statements since September 1, 2011, and are presented in the Personal Care reportable segment. The purchase price was $288 million in cash, including working capital, net of acquired cash of $12 million. The acquisition was accounted for as a business combination under the acquisition method of accounting, in accordance with the Business Combinations Topic of FASB ASC.
The total purchase price was allocated to tangible and intangible assets acquired and liabilities assumed based on the Company’s estimates of their fair value, which are based on information currently available. During the fourth quarter of 2011, the Company completed the evaluation of all assets and liabilities.
DOMTAR CORPORATION
NOTES TO CONSOLIDATED FINANCIAL STATEMENTS
DECEMBER 31, 2012
(IN MILLIONS OF DOLLARS, UNLESS OTHERWISE NOTED)
NOTE 3. ACQUISITION OF BUSINESSES (CONTINUED)
The table below illustrates the purchase price allocation:
Fair value of net assets acquired at the date of acquisition | ||||||||
Receivables | $ | 12 | ||||||
Inventory | 17 | |||||||
Property, plant and equipment | 54 | |||||||
Intangible assets (Note 14) | ||||||||
Trade names(1) | 61 | |||||||
Customer relationships(2) | 93 | |||||||
| 154 | ||||||||
Goodwill (Note 12) | 163 | |||||||
Other assets | 4 | |||||||
|
| |||||||
Total assets | 404 | |||||||
Less: Liabilities | ||||||||
Trade and other payables | 15 | |||||||
Income and other taxes payable | 2 | |||||||
Capital lease obligation | 31 | |||||||
Deferred income tax liabilities and unrecognized tax benefits | 66 | |||||||
Other liabilities | 2 | |||||||
|
| |||||||
Total liabilities | 116 | |||||||
Fair value of net assets acquired at the date of acquisition | 288 | |||||||
| (1) | Indefinite useful life. |
| (2) | The useful life of the Customer relationships acquired is 40 years. |
For all acquisitions, goodwill represents the future economic benefit arising from other assets acquired that could not be individually identified and separately recognized. The goodwill is attributable to the general reputation of the business, the assembled workforce, and the expected future cash flows of the business. Disclosed goodwill is not deductible for tax purposes. Pro forma results have not been provided, as these acquisitions have no material impact on the Company.
IMPAIRMENT AND WRITE-DOWN OF PROPERTY, PLANT AND EQUIPMENT
AND INTANGIBLE ASSETS
We review intangible assets and property, plant and equipment for impairment upon the occurrence of events or changes in circumstances indicating that, at the lowest level of determinable cash flows, the carrying value of the intangible and long-lived assets may not be recoverable.
Estimates of undiscounted future cash flows used to test the recoverability of the fixed assets included key assumptions related to selling prices, inflation-adjusted cost projections, forecasted exchange rate for the U.S. dollar when applicable and the estimated useful life of the fixed assets.
DOMTAR CORPORATION
NOTES TO CONSOLIDATED FINANCIAL STATEMENTS
DECEMBER 31, 2012
(IN MILLIONS OF DOLLARS, UNLESS OTHERWISE NOTED)
NOTE 4. IMPAIRMENT AND WRITE-DOWN OF PROPERTY, PLANT AND EQUIPMENT AND INTANGIBLE ASSETS (CONTINUED)
IMPAIRMENT OF PROPERTY, PLANT AND EQUIPMENT
Kamloops, Closure of a pulp machine
During the fourth quarter of 2012, the Company announced that we wouldit will permanently reduce our paper manufacturingshut down one pulp machine at our Plymouthits Kamloops pulp mill. This decision will result in a permanent curtailment of the Company’s annual pulp production by approximately 120,000 air-dried metric tons of sawdust softwood pulp, and paper mill,will affect approximately 125 employees. These measures are expected to be in place by closing one of the two paper machines comprising the mill’s paper production unit. As a result, at the end of February 2009, there wasMarch 2013.
The Company recognized a curtailment$5 million write-down of 293,000 tonsproperty, plant and equipment and $2 million of accelerated depreciation, included in Impairment and write-down of property, plant and equipment and intangible assets, with respect to the assets that will cease productive use in March 2013, when the shut-down is completed. The Company expects to record an additional $12 million of accelerated depreciation over the first 3 months of 2013 in relation to these assets. Given the decision to close the pulp machine, the Company assessed its ability to recover the carrying value of the mill’s paper production capacity andKamloops mill from the closure affected approximately 185 employees and a $35 million accelerated depreciation charge was recorded in the first quarter of 2009 for the related plant and equipment. Given the closure of the paper machine, we conducted a Step I impairment test on our Plymouth mill operation’s fixed assets andundiscounted estimated future cash flows. The Company concluded that the undiscounted estimated future cash flows associated with the long-lived assets exceeded their carrying value and, as such, no additional impairment charge was required.
Mira Loma, California converting plant
During the first quarter of 2012, the Company recorded a $2 million write-down of property, plant and equipment at its Mira Loma location, in Impairment and write-down of property, plant and equipment and intangible assets.
Ashdown, Arkansas pulp and paper mill—Closure of a paper machine
As a result of the decision to permanently shut down one of four paper machines on March 29, 2011, the Company recognized $73 million of accelerated depreciation, included in Impairment and write-down of property, plant and equipment and intangible assets, in 2011. Given the substantial decline in the production capacity, at its Ashdown mill, the Company conducted a quantitative impairment test in the fourth quarter of 2011 and concluded that the recognition of an impairment loss for the Ashdown mill’s remaining long-lived assets was not required.
Lebel-sur-Quévillon Pulp Mill and Sawmill—Impairment of assets
In the fourth quarter of 2008, the Company decided to permanently shut down the Lebel-sur-Quévillon pulp mill and sawmills. In 2011, following the signing of a definitive agreement, the Company recorded a $12 million impairment and write-down of property, plant and equipment relating to the remaining assets’ net book value. During the second quarter of 2012, the Company sold its pulp and sawmill assets to Fortress Global Cellulose Ltd. (“Fortress”) and its lands related to those assets to a subsidiary of the Government of Quebec.
Plymouth Pulp and Paper Mill—Conversion to Fluff Pulp
In 2010, as a result of the decision to permanently shut down the remaining paper machine and convert the Plymouth facility to 100% fluff pulp production in the fourth quarter of 2009, the Company recognized in
DOMTAR CORPORATION
NOTES TO CONSOLIDATED FINANCIAL STATEMENTS
DECEMBER 31, 2012
(IN MILLIONS OF DOLLARS, UNLESS OTHERWISE NOTED)
NOTE 4. IMPAIRMENT AND WRITE-DOWN OF PROPERTY, PLANT AND EQUIPMENT AND INTANGIBLE ASSETS (CONTINUED)
Impairment and write-down of property, plant and equipment and intangible assets, a $1 million write-down to the related paper machine and $39 million of accelerated depreciation.
Pension Plans and Other Post-Retirement Benefit Plans We have several defined contribution plans and multiemployer plans. The pension expense under these plans is equal to our contribution. Defined contribution pension expense was $24 million for the year ended December 31, 2012 (2011—$24 million and 2010—$25 million). We sponsor both contributory and non-contributory U.S. and non-U.S. defined benefit pension plans that cover the majority of our employees. Non-unionized employees in Canada joining the Company after June 1, 2000, participate in defined contribution pension plans. Salaried employees in the U.S. joining the Company after January 1, 2008 participate in a defined contribution pension plan. Also, starting on January 1, 2013, all unionized employees covered under the agreement with the United Steel Workers not grandfathered under the existing defined benefit pension plans will transition to a defined contribution pension plan for future service. We also sponsor a number of other post-retirement benefit plans for eligible U.S. and non-U.S. employees; the plans are unfunded and include life insurance programs, medical and dental benefits. We also provide supplemental unfunded defined benefit pension plans to certain senior management employees. We account for pensions and other post-retirement benefits in accordance with Compensation-Retirement Benefits Topic of the Financial Accounting Standards Board-Accounting Standards Committee (“FASB ASC”) which requires employers to recognize the overfunded or underfunded status of defined benefit pension plans as an asset or liability in its Consolidated Balance Sheets. Pension and other post-retirement benefit assumptions include the discount rate, the expected long-term rate of return on plan assets, the rate of compensation increase, health care cost trend rates, mortality rates, employee early retirements and terminations or disabilities. Changes in these assumptions result in actuarial gains or losses which we have amortized over the expected average remaining service life of the active employee group covered by the plans only to the extent that the unrecognized net actuarial gains and losses are in excess of 10% of the accrued benefit obligation at the beginning of the year over the average remaining service period of approximately 9 years of the active employee group covered by the pension plans and 10 years of the active employee group covered by the other post-retirement benefits plan. An expected rate of return on plan assets of 6.0% was considered appropriate by our management for the determination of pension expense for 2012. Effective January 1, 2013, we will use 5.5%, 7.2% and 3.5% as the expected return on plan assets for Canada, the United States and Europe, which reflects the current view of long-term investment returns. The overall expected long-term rate of return on plan assets is based on management’s best estimate of the long-term returns of the major asset classes (cash and cash equivalents, equities and bonds) weighted by the actual allocation of assets at the measurement date, net of expenses. This rate includes an equity risk premium over government bond returns for equity investments and a value-added premium for the contribution to returns from active management. We set our discount rate assumption annually to reflect the rates available on high-quality, fixed income debt instruments, with a duration that is expected to match the timing and amount of expected benefit payments. High-quality debt instruments are corporate bonds with a rating of AA or better. The discount rates at December 31, 2012, for pension plans were estimated at 4.1% for the accrued benefit obligation and 4.8% for the net periodic benefit cost for 2012 and for post-retirement benefit plans were estimated at 4.2% for the accrued benefit obligation and 2.9% for the net periodic benefit cost for 2012. The rate of compensation increase is another significant assumption in the actuarial model for pension (set at 2.7% for the accrued benefit obligation and 2.8% for the net periodic benefit cost) and for post-retirement benefits (set at 2.8% for the accrued benefit obligation and 2.8% for the net periodic benefit cost) and is determined based upon our long-term plans for such increases. For measurement purposes, a 5.4% weighted-average annual rate of increase in the per capita cost of covered health care benefits was assumed for 2013. The rate was assumed to decrease gradually to 4.1% by 2033 and remain at that level thereafter.
The following table provides a sensitivity analysis of the key weighted average economic assumptions used in measuring the accrued pension benefit obligation, the accrued other post-retirement benefit obligation and related net periodic benefit cost for 2012. The sensitivity analysis should be used with caution as it is hypothetical and changes in each key assumption may not be linear. The sensitivities in each key variable have been calculated independently of each other.
Columbus Paper MillSensitivity Analysis
| PENSION | OTHER POST-RETIREMENT BENEFIT | |||||||||||||||
PENSION AND OTHER POST-RETIREMENT | ACCRUED BENEFIT OBLIGATION | NET PERIODIC BENEFIT COST | ACCRUED BENEFIT OBLIGATION | NET PERIODIC BENEFIT COST | ||||||||||||
| (in millions of dollars) | ||||||||||||||||
Expected rate of return on assets | ||||||||||||||||
Impact of: | ||||||||||||||||
1% increase | N/A | ($16 | ) | N/A | N/A | |||||||||||
1% decrease | N/A | 16 | N/A | N/A | ||||||||||||
Discount rate | ||||||||||||||||
Impact of: | ||||||||||||||||
1% increase | ($211 | ) | (15 | ) | ($14 | ) | (1 | ) | ||||||||
1% decrease | 246 | 20 | 18 | 1 | ||||||||||||
Assumed overall health care cost trend | ||||||||||||||||
Impact of: | ||||||||||||||||
1% increase | N/A | N/A | 10 | 1 | ||||||||||||
1% decrease | N/A | N/A | (9 | ) | (1 | ) | ||||||||||
The assets of the pension plans are held by a number of independent trustees and are accounted for separately in our pension funds. Our investment strategy for the assets in the pension plans is to maintain a diversified portfolio of assets, invest in a prudent manner to maintain the security of funds while maximizing returns within the guidelines provided in the investment policy. Diversification of the pension plans’ holdings is maintained in order to reduce the pension plans’ annual return variability, reduce market exposure and credit exposure to any single issuer and to any single component of the capital markets, to reduce exposure to unexpected inflation, to enhance the long-term risk-adjusted return potential of the pension plans and to reduce funding risk. Our pension funds are not permitted to own any of the Company’s shares or debt instruments.
The following table shows the allocation of the plan assets, based on the fair value of the assets held and the target allocation for 2012:
| Target allocation | Percentage of plan assets at December 31, 2012 | Percentage of plan assets at December 31, 2011 | ||||||||||
Fixed income | ||||||||||||
Cash and cash equivalents | 0% – 10% | 4 | % | 5 | % | |||||||
Bonds | 51% – 61% | 55 | % | 58 | % | |||||||
Equity | ||||||||||||
Canadian Equity | 7% – 15% | 11 | % | 10 | % | |||||||
US Equity | 8% – 18% | 12 | % | 12 | % | |||||||
International Equity | 14% – 24% | 18 | % | 15 | % | |||||||
|
|
|
| |||||||||
Total(1) | 100 | % | 100 | % | ||||||||
|
|
|
| |||||||||
| (1) | Approx imately 85% of the pension plan assets relate to Canadian plans and 15% relate to U.S. plans. |
Our pension plan funding policy is to contribute annually the amount required to provide for benefits earned in the year, and to fund solvency deficiencies, funding shortfalls and past service obligations over periods not exceeding those permitted by the applicable regulatory authorities. Past service obligations primarily arise from improvements to plan benefits. The other post-retirement benefit plans are not funded and contributions are made annually to cover benefit payments. We expect to contribute a minimum total amount of $25 million in 2013 compared to $86 million in 2012 (2011—$95 million) to the pension plans. The payments made in 2012 to the other post-retirement benefit plans amounted to $7 million (2011—$8 million).
The estimated future benefit payments from the plans for the next ten years at December 31, 2012 are as follows:
ESTIMATED FUTURE BENEFIT PAYMENTS FROM THE PLANS | PENSION PLANS | OTHER POST- RETIREMENT BENEFIT PLANS | ||||||
| (in millions of dollars) | ||||||||
2013 | $ | 152 | $ | 5 | ||||
2014 | 102 | 7 | ||||||
2015 | 105 | 7 | ||||||
2016 | 108 | 7 | ||||||
2017 | 111 | 6 | ||||||
2018 – 2022 | 600 | 34 | ||||||
Asset Backed Notes
At December 31, 2012, our Canadian defined benefit pension funds held restructured asset backed notes (“ABN”) (formerly asset backed commercial paper (“ABCP”)) valued at $213 million (CDN$211 million). At December 31, 2011, our plans held ABN valued at $205 million (CDN$208 million). During 2012, the total value of the ABN benefited from an increase in value of $41 million (CDN$40 million). For the same period, the total value of the ABN was reduced by repayments and sales totalling $37 million (CDN$37 million), partially offset by the $4 million impact of an increase in the value of the Canadian dollar.
Most of these ABN, with a current value of $193 million (2011—$178 million; 2010—$193 million), were subject to restructuring under the court order governing the Montreal Accord that was completed in January 2009. About $177 million of these notes (nominal value $213 million) are expected to mature in four years. These notes are valued based upon current market quotes. The market values are supported by the value of the underlying investments held by the issuing conduit. The values for the $16 million (nominal value $39 million) of remaining ABN, that also were subject to the Montreal Accord, were sourced either from the asset manager of the ABN, or from trading values for similar securities of similar credit quality.
An additional $20 million of ABN (nominal value $38 million) were restructured separately from the Montreal Accord. They are valued based upon the value of the collateral investments held in the conduit issuer, reduced by the negative value of credit default derivatives, with an additional discount (equivalent 1.75% per annum) applied for illiquidity. Approximately $11 million of these notes (nominal value $11 million) are expected to mature at par in late 2013 with the remaining $9 million of notes (nominal value $12 million) maturing in 2016. The outcome for a zero-value note (nominal value $15 million), remains subject to the outcome of ongoing litigation.
Possible changes that could impact the future value of ABN include: (1) changes in the value of the underlying assets and the related derivative transactions, (2) developments related to the liquidity of the ABN market, (3) a severe and prolonged economic slowdown in North America and the bankruptcy of referenced corporate credits, and (4) the passage of time, as most of the notes will mature by early 2017.
Multiemployer Plans
We contribute to seven multiemployer defined benefit pension plans under the terms of collective agreements that cover certain Canadian union-represented employees (Canadian multiemployer plans) and certain U.S. union-represented employees (U.S. multiemployer plans). The risks of participating in these multiemployer plans are different from single-employer plans in the following aspects:
| a) | assets contributed to the multiemployer plan by one employer may be used to provide benefits to employees of other participating employers; |
| b) | for the U.S. multiemployer plans, if a participating employer stops contributing to the plan, the unfunded obligations of the plan are borne by the remaining participating employers; and |
| c) | for the U.S. multiemployer plans, if we choose to stop participating in some of our multiemployer plans, we may be required to pay those plans an amount based on the underfunded status of the plan, referred to as a withdrawal liability. |
Our participation in these plans for the annual periods ended December 31 is outlined in the table below. The plan’s 2012 and 2011 actuarial status certification was completed as of January 1, 2012 and January 1, 2011 respectively, and is based on the plan’s actuarial valuation as of December 31, 2011 and December 31, 2010 respectively. This represents the most recent Pension Protection Act (“PPA”) zone status available. The zone status is based on information received from the plan and is certified by the plan’s actuary. One significant plan is in the red zone, which means it is less than 65% funded and requires a financial improvement plan (“FIP”) or a rehabilitation plan (“RP”).
| Pension Protection Act Zone Status | Contributions from Domtar to Multiemployer (c) | Expiration date of collective bargaining agreement | ||||||||||||||||||||||||||||||||||
Pension Fund | EIN / Pension Plan Number | 2012 | 2011 | FIP / RP Status Pending / Implemented | 2012 | 2011 | 2010 | Surcharge imposed | ||||||||||||||||||||||||||||
U.S. Multiemployer Plans | $ | $ | $ | |||||||||||||||||||||||||||||||||
PACE Industry Union- | ||||||||||||||||||||||||||||||||||||
Management Pension Fund(a) | 11-6166763-001 | Red | Red | Yes - Implemented | 3 | 3 | 3 | Yes | January 27, 2015 | |||||||||||||||||||||||||||
Canadian Multiemployer Plans | ||||||||||||||||||||||||||||||||||||
Pulp and Paper Industry | ||||||||||||||||||||||||||||||||||||
Pension Plan(b) | N/A | N/A | N/A | N/A | 2 | 3 | 2 | N/A | April 30, 2017 | |||||||||||||||||||||||||||
|
|
|
|
|
| |||||||||||||||||||||||||||||||
| Total | 5 | 6 | 5 | |||||||||||||||||||||||||||||||||
Total contributions made to all plans that are not individually significant |
| 1 | 1 | 1 | ||||||||||||||||||||||||||||||||
|
|
|
|
|
| |||||||||||||||||||||||||||||||
Total contributions made to all plans |
| 6 | 7 | 6 | ||||||||||||||||||||||||||||||||
|
|
|
|
|
| |||||||||||||||||||||||||||||||
| (a) | We withdrew from PACE Industry Union-Management Pension Fund effective December 31, 2012. |
| (b) | In the event that the Canadian multiemployer plan is underfunded, the monthly benefit amount can be reduced by the trustees of the plan. Moreover, we are not responsible for the underfunded status of the plan because the Canadian multiemployer plans do not require participating employers to pay a withdrawal liability or penalty upon withdrawal. |
| (c) | For each of the three years presented, our contributions to each multiemployer plan do not represent more than five percent of total contributions to each plan as indicated in the plan’s most recently available annual report. |
In 2011, we decided to withdraw from one of our multiemployer pension plans and recorded a withdrawal liability and a charge to earnings of $32 million. In 2012, as a result of a revision in the estimated withdrawal liability, we recorded a further charge to earnings of $14 million. Also in 2012, we withdrew from a second multiemployer pension plan and recorded a withdrawal liability and a charge to earnings of $1 million. While this is our best estimate of the ultimate cost of the withdrawal from these plans at December 31, 2012, additional withdrawal liabilities may be incurred based on the final fund assessment expected to occur in the second quarter of 2013. Further, we remain liable for potential additional withdrawal liabilities to the fund in the event of a mass withdrawal, as defined by statute, occurring anytime within the next three years. Refer to Part II, Item 8, Financial Statement and Supplementary Data of this Annual Report on Form 10-K, under Note 16 “Closure and Restructuring Costs and Liability.”
Income Taxes
We use the asset and liability method of accounting for income taxes. Under this method, deferred tax assets and liabilities are determined according to differences between the carrying amounts and tax bases of the assets and liabilities. The change in the net deferred tax asset or liability is included in earnings. Deferred tax assets and liabilities are measured using enacted tax rates and laws expected to apply in the years in which assets and liabilities are expected to be recovered or settled. For these years, a projection of taxable income and an assumption of the ultimate recovery or settlement period for temporary differences are required. The projection of future taxable income is based on management’s best estimate and may vary from actual taxable income.
On March 16, 2010,a quarterly basis, we announcedassess the need to establish a valuation allowance for deferred tax assets and, if it is deemed more likely than not that our deferred tax assets will not be realized based on these taxable income projections, a valuation allowance is recorded. In general, “realization” refers to the incremental benefit achieved through the reduction in future taxes payable or an increase in future taxes refundable from the deferred tax assets. Evaluating the need for an amount of a valuation allowance for deferred tax assets often requires significant judgment. All available evidence, both positive and negative, should be considered to determine whether, based on the weight of that evidence, a valuation allowance is needed.
In our evaluation process, we give the most weight to historical income or losses. After evaluating all available positive and negative evidence, although realization is not assured, we determined that it is more likely than not that the results of future operations will generate sufficient taxable income to realize the deferred tax assets, with the exception of certain foreign loss carryforwards for which a valuation allowance of $10 million was recorded in 2012, and certain state credits for which a valuation allowance of $4 million was recorded in 2011.
Our short-term deferred tax assets are mainly composed of temporary differences related to various accruals, accounting provisions, as well as a portion of our net operating loss carryforwards and available tax credits. The majority of these items are expected to be utilized or paid out over the next year. Our long-term deferred tax assets and liabilities are mainly composed of temporary differences pertaining to plant, equipment, pension and post-retirement liabilities, the remaining portion of net operating loss carryforwards and other tax attributes, and other items. Estimating the ultimate settlement period requires judgment and our best estimates. The reversal of timing differences is expected at enacted tax rates, which could change due to changes in income tax laws or the introduction of tax changes through the presentation of annual budgets by different governments. As a result, a change in the timing and the income tax rate at which the components will reverse could materially affect deferred tax expense in our future results of operations.
In addition, U.S. and foreign tax rules and regulations are subject to interpretation and require judgment that may be challenged by taxation authorities. To the best of our knowledge, we have adequately provided for our future tax consequences based upon current facts and circumstances and current tax law. In accordance with Income Taxes Topic of FASB ASC 740, we evaluate new tax positions that result in a tax benefit to us and
determine the amount of tax benefits that can be recognized. The remaining unrecognized tax benefits are evaluated on a quarterly basis to determine if changes in recognition or classification are necessary. Significant changes in the amount of unrecognized tax benefits expected within the next 12 months are disclosed quarterly. Future recognition of unrecognized tax benefits would impact the effective tax rate in the period the benefits are recognized. At December 31, 2012, we had gross unrecognized tax benefits of $254 million. If our income tax positions with respect to the alternative fuel tax credits are sustained, either all or in part, then we would permanently close our coated groundwood paper millrecognize a tax benefit in Columbus, Mississippi. This measurethe future equal to the amount of the benefits sustained. Our tax treatment of the income related to the alternative fuel tax credits resulted in the permanent curtailmentrecognition of 238,000 tonsa tax benefit of coated groundwood and 70,000 metric tons of thermo-mechanical pulp, as well as affected 219 employees. We recorded a $9$2 million write-down forin 2010, which impacted the related fixed assets under Impairment and write-down of property, plant and equipment and $16 million of other charges under Closure and restructuring costs, refereffective tax rate. This credit expired December 31, 2009. Refer to Part II, Item 8, Financial Statements and Supplementary Data Note 14, of this Annual Report on Form 10-K. Operations ceased10-K, under Note 10 “Income taxes” for details on the unrecognized tax benefits.
Cellulosic Biofuel Credit
In July 2010, the U.S. IRS Office of Chief Counsel released an Advice Memorandum concluding that qualifying cellulosic biofuel sold or used before January 1, 2010, is eligible for the CBPC and would not be required to be registered by the Environmental Protection Agency. Each gallon of qualifying cellulose biofuel produced by any taxpayer operating a pulp and paper mill and used as a fuel in April 2010.the taxpayer’s trade or business during calendar year 2009 would qualify for the $1.01 non-refundable CBPC. A taxpayer could be able to claim the credit on its federal income tax return for the 2009 tax year upon the receipt of a letter of registration from the IRS and any unused CBPC could be carried forward until 2016 to offset a portion of federal taxes otherwise payable.
DuringWe had approximately 207 million gallons of cellulose biofuel that qualified for this CBPC for which we had not previously claimed under the fourth quarterAlternative Fuel Tax Credit (“AFTC”) that represented approximately $209 million of 2008,CBPC or approximately $127 million of after tax benefit to the Corporation. In July 2010, we submitted an application with the IRS to be registered for the CBPC and on September 28, 2010, we received our notification from the IRS that we were informedsuccessfully registered. On October 15, 2010 the IRS Office of Chief Counsel issued an Advice Memorandum concluding that beginningthe AFTC and CBPC could be claimed in earlythe same year for different volumes of biofuel. In November 2010, we filed an amended 2009 our Columbus, paper mill would cease totax return with the IRS claiming a cellulosic biofuel producer credit of $209 million and recorded a net tax benefit from a favorable power purchase agreement. This changeof $127 million in circumstances impactedIncome tax expense (benefit) on the profitability outlookConsolidated Statement of Earnings and Comprehensive Income for the foreseeable future and triggered the need for a Step I impairment testyear ended December 31, 2010. As of the fixed assets. Estimates of undiscounted future cash flows used to test the recoverability of the fixed assets included key assumptions related to trend prices, inflation-adjusted cost projections, and the estimated useful life of the fixed assets. The main sources of such assumptions and related benchmarks were largely the same as those listed under “Impairment of Goodwill” below.
Step I of the impairment test demonstrated that the carrying values of the fixed assets exceeded their estimated undiscounted future cash flows, indicating that an impairment exists. A Step II test was undertaken to determine the fair valueDecember 31, 2012, we have utilized all of the remaining assets,credit.
Alternative Fuel Tax Credits
The U.S. Internal Revenue Code of 1986, as amended (the “Code”) permitted a refundable excise tax credit, until the end of 2009, for the production and use of alternative biofuel mixtures derived from biomass. We submitted an application with the IRS to be registered as an alternative fuel mixer and received notification that our registration had been accepted in late March 2009. We began producing and consuming alternative fuel mixtures in February 2009 at our eligible mills. Although the credit ended at the end of 2009, in 2010, we recorded a non-cash impairment charge$25 million of $95such credits in Other operating (income) loss on the Consolidated Statement of Earnings and Comprehensive Income. The $25 million represented an adjustment to amounts presented as deferred revenue at December 31, 2009 and was released to income following guidance issued by the IRS in March 2010. We recorded an income tax expense of $7 million in 2010 related to the fourth quarteralternative fuel mixture income. The amounts for the refundable credits are based on the volume of 2008alternative biofuel mixtures produced and burned during that period. To date, we have received $508 million in refunds, net of federal income tax offsets.
There has been no change in our status with respect to reduce the alternative fuel tax credits previously claimed but we continue to assess the possibility of converting some of these credits into additional CBPC. Any such conversion would require the repayment of any alternative fuel tax credit refund previously received in exchange for a credit to be used against future federal income tax.
As of December 31, 2012, we have gross unrecognized tax benefits and interest of $198 million and related deferred tax assets to their estimated fair value.
Cerritos
of $17 million associated with the alternative fuel tax credits claimed on our 2009 tax return. During the second quarter of 2010,2012, the IRS began an audit of our 2009 U.S. income tax return. The completion of the audit by the IRS or the issuance of authoritative guidance will result in the release of the provision or settlement of the liability in cash of some or all of these previously unrecognized tax benefits. As of December 31, 2012, we decidedhad gross unrecognized tax benefits and interest of $198 million and related deferred tax assets of $17 million associated with the alternative fuel tax credit claims on our 2009 tax return. The recognition of these benefits, $181 million net of deferred taxes, would impact our effective tax rate. We reasonably expect the audit to closebe settled within the Cerritos, Califonia forms converting plant,next 12 months which could result in a significant change to the amount of unrecognized tax benefits. However, audit outcomes and recorded a $1 million write-down for the related assets under Impairment and write-downtiming of property, plant and equipment and $1 millionaudit settlements are subject to significant uncertainty. Additional information regarding unrecognized tax benefits is included in severance and termination costs under Closure and restructuring costs, refer toPart II, Item 8, Financial Statements and Supplementary Data Note 14, of this Annual Report on Form 10-K. Operations ceased10-K, under Note 10 “Income taxes.”
Closure and Restructuring Costs
Closure and restructuring costs are recognized as liabilities in the period when they are incurred and are measured at their fair value. For such recognition to occur, management, with the appropriate level of authority, must have approved and committed to a firm plan and appropriate communication to those affected must have occurred. These provisions may require an estimation of costs such as severance and termination benefits, pension and related curtailments, environmental remediation and may also include expenses related to demolition and outplacement. Actions taken may also require an evaluation of any remaining assets to determine required write-downs, if any, and a review of estimated remaining useful lives which may lead to accelerated depreciation expense.
Estimates of cash flows and fair value relating to closures and restructurings require judgment. Closure and restructuring liabilities are based on July 16, 2010.management’s best estimates of future events at December 31, 2012. Closure and restructuring cost estimates are dependent on future events. Although we do not anticipate significant changes, the actual costs may differ from these estimates due to subsequent developments such as the results of environmental studies, the ability to find a buyer for assets set to be dismantled and demolished and other business developments. As such, additional costs and further working capital adjustments may be required in future periods.
| ITEM 7A. | QUANTITATIVE AND QUALITATIVE DISCLOSURE ABOUT MARKET RISK |
Our income can be impacted by the following sensitivities:
SENSITIVITY ANALYSIS | ||||
| (In millions of dollars, unless otherwise noted) | ||||
Each $10/unit change in the selling price of the following products1: | ||||
Papers | ||||
20-lb repro bond, 92 bright (copy) | $ | 10 | ||
50-lb offset, rolls | 2 | |||
Other | 21 | |||
Pulp—net position | 16 | |||
Foreign exchange, excluding depreciation and amortization | 9 | |||
Energy 2 | ||||
Natural gas: $0.25/MMBtu change in price before hedging | 4 | |||
| 1 | Based on estimated 2013 capacity (ST or ADMT). |
| 2 | Based on estimated 2013 consumption levels. The allocation between energy sources may vary during the year in order to take advantage of market conditions. |
Note that we may, from time to time, hedge part of our foreign exchange, pulp, interest rate and energy positions, which may therefore impact the above sensitivities.
In the normal course of business, we are exposed to certain financial risks. We do not use derivative instruments for speculative purposes; although all derivative instruments purchased to minimize risk may not qualify for hedge accounting.
Prince AlbertINTEREST RATE RISK
We are exposed to interest rate risk arising from fluctuations in interest rates on our cash and cash equivalents, bank indebtedness, bank credit facility and long-term debt. We may manage this interest rate exposure through the use of derivative instruments such as interest rate swap contracts.
CREDIT RISK
We are exposed to credit risk on the accounts receivable from our customers. In order to reduce this risk, we review new customers’ credit history before granting credit and conduct regular reviews of existing customers’ credit performance. As of December 31, 2012, one of our Pulp Milland Paper segment customers located in the United States represented 11% ($64 million) ((2011 – 9% ($58 million)) of our total receivables.
We are also exposed to credit risk in the event of non-performance by counterparties to our financial instruments. We minimize this exposure by entering into contracts with counterparties that we believe to be of high credit quality. Collateral or other security to support financial instruments subject to credit risk is usually not obtained. We regularly monitor the credit standing of counterparties. Additionally, we are exposed to credit risk in the event of non-performance by our insurers. We minimize our exposure by doing business only with large reputable insurance companies.
COST RISK
Cash flow hedges
We purchase natural gas at the prevailing market price at the time of delivery. In order to manage the cash flow risk associated with purchases of natural gas, we may utilize derivative financial instruments or physical purchases to fix the price of forecasted natural gas purchases. We formally document the hedge relationships, including identification of the hedging instruments and the hedged items, the risk management objectives and strategies for undertaking the hedge transactions, and the methodologies used to assess effectiveness and measure ineffectiveness. Current contracts are used to hedge forecasted purchases over the next five years. The effective portion of changes in the fair value of derivative contracts designated as cash flow hedges is recorded as a component of Accumulated other comprehensive loss within Shareholders’ equity, and is recognized in Cost of sales in the period in which the hedged transaction occurs.
The following table presents the volumes under derivative financial instruments for natural gas contracts outstanding as of December 31, 2012 to hedge forecasted purchases:
Commodity | Notional contractual quantity under derivative contracts |
| Notional contractual value under derivative contracts (in millions of dollars) | Percentage of forecasted purchases under derivative contracts for | ||||||||||||||||||||||||
| 2013 | 2014 | 2015 | 2016 | |||||||||||||||||||||||||
Natural gas | 13,320,000 | MMBTU | (1) | $ | 56 | 31 | % | 34 | % | 15 | % | 12 | % | |||||||||||||||
| (1) | MMBTU: Millions of British thermal units |
The natural gas derivative contracts were fully effective for accounting purposes as of December 31, 2012. The critical terms of the hedging instruments and the hedged items match. As a result, there were no amounts reflected in the Consolidated Statements of a review of current optionsEarnings and Comprehensive Income and Other comprehensive income for the disposalyear ended December 31, 2012 resulting from hedge ineffectiveness (2011 and 2010 – nil).
FOREIGN CURRENCY RISK
Cash flow hedges
We have manufacturing and converting operations in the United States, Canada, Sweden and China. As a result, we are exposed to movements in foreign currency exchange rates in Canada, Europe and Asia. Moreover, certain assets and liabilities are denominated in currencies other than the U.S. dollar and are exposed to foreign currency movements. Therefore, our earnings are affected by increases or decreases in the value of the Canadian dollar and of other European and Asian currencies relative to the U.S. dollar. Our Swedish subsidiary is exposed to movements in foreign currency exchange rates on transactions denominated in a different currency than its Euro functional currency. Our risk management policy allows it to hedge a significant portion of its exposure to fluctuations in foreign currency exchange rates for periods up to three years. We may use derivative instruments (currency options and foreign exchange forward contracts) to mitigate our exposure to fluctuations in foreign currency exchange rates or to designate them as hedging instruments in order to hedge the subsidiary’s cash flow risk for purposes of the consolidated financial statements.
We formally document the relationship between hedging instruments and hedged items, as well as its risk management objectives and strategies for undertaking the hedge transactions. Foreign exchange currency options contracts used to hedge forecasted purchases in Canadian dollars by the Canadian subsidiary and forecasted sales in British Pound Sterling and forecasted purchases in U.S. dollars by the Swedish subsidiary are designated as cash flow hedges. Current contracts are used to hedge forecasted sales or purchases over the next 12 months. The effective portion of changes in the fair value of derivative contracts designated as cash flow hedges is recorded as a component of Other comprehensive income (loss) and is recognized in Cost of sales or in Sales in the period in which the hedged transaction occurs.
Net investment hedge
We use foreign exchange currency option contracts maturing in February 2013, to hedge the net assets of Attends Europe to offset the foreign currency translation and economic exposures related to its investment in the subsidiary. We are exposed to movements in foreign currency exchange rates of the Euro versus the U.S. dollar as Attends Europe has a Euro functional currency whereas the Company has a U.S. dollar functional and reporting currency. The effective portion of changes in the fair value of derivative contracts designated as net investment hedges is recorded in Other comprehensive income (loss) as part of the Foreign currency translation adjustments.
The following table presents the currency values under contracts pursuant to currency options outstanding as of December 31, 2012 to hedge forecasted purchases:
Contract | Notional contractual value | Percentage of forecasted net exposures under contracts for | ||||
2013 | ||||||
Currency options purchased | CDN | $ 425 | 50% | |||
| EUR | € 176 | 92% | ||||
| USD | $ 34 | 100% | ||||
| GBP | £ 19 | 93% | ||||
Currency options sold | CDN | $ 425 | 50% | |||
| EUR | € 76 | 40% | ||||
| USD | $ 34 | 100% | ||||
| GBP | £ 19 | 93% |
The currency options are fully effective as at December 31, 2012. The critical terms of the hedging instruments and the hedged items match. As a result, there were no amounts reflected in the Consolidated Statements of Earnings and Comprehensive Income for the year ended December 31, 2012 resulting from hedge ineffectiveness (2011 and 2010 – nil).
| ITEM 8. | FINANCIAL STATEMENTS AND SUPPLEMENTARY DATA |
Management’s Reports to Shareholders of Domtar Corporation
Management’s Report on Financial Statements and Practices
The accompanying Consolidated Financial Statements of Domtar Corporation and its subsidiaries (the “Company”) were prepared by management. The statements were prepared in accordance with accounting principles generally accepted in the United States of America and include amounts that are based on management’s best judgments and estimates. Management is responsible for the completeness, accuracy and objectivity of the financial statements. The other financial information included in the annual report is consistent with that in the financial statements.
Management has established and maintains a system of internal accounting and other controls for the Company and its subsidiaries. This system and its established accounting procedures and related controls are designed to provide reasonable assurance that assets are safeguarded, that the books and records properly reflect all transactions, that policies and procedures are implemented by qualified personnel, and that published financial statements are properly prepared and fairly presented. The Company’s system of internal control is supported by written policies and procedures, contains self-monitoring mechanisms, and is audited by the internal audit function. Appropriate actions are taken by management to correct deficiencies as they are identified.
Management’s Report on Internal Control over Financial Reporting
Management is responsible for establishing and maintaining adequate internal control over financial reporting for the Company. In order to evaluate the effectiveness of internal control over financial reporting, management has conducted an assessment, including testing, using the criteria established inInternal Control—Integrated Framework, issued by the Committee of Sponsoring Organizations of the Treadway Commission (COSO). The Company’s system of internal control over financial reporting is designed to provide reasonable assurance regarding the reliability of financial reporting and the preparation of financial statements for external purposes in accordance with generally accepted accounting principles. The Company’s internal control over financial reporting includes those policies and procedures that (i) pertain to the maintenance of records that, in reasonable detail, accurately and fairly reflect the transactions and dispositions of the assets of this facilitythe Company; (ii) provide reasonable assurance that transactions are recorded as necessary to permit preparation of financial statements in accordance with generally accepted accounting principles, and that receipts and expenditures of the Company are being made only in accordance with authorizations of management and directors of the Company; and (iii) provide reasonable assurance regarding prevention or timely detection of unauthorized acquisition, use, or disposition of the Company’s assets that could have a material effect on the financial statements.
Because of its inherent limitations, internal control over financial reporting may not prevent or detect misstatements. Also, projections of any evaluation of effectiveness to future periods are subject to the risk that controls may become inadequate because of changes in conditions, or that the degree of compliance with the policies or procedures may deteriorate.
Based on the assessment, management has concluded that the Company maintained effective internal control over financial reporting as of December 31, 2012, based on criteria inInternal Control—Integrated Framework issued by the COSO.
The effectiveness of the Company’s internal control over financial reporting as of December 31, 2012 has been audited by PricewaterhouseCoopers LLP, an independent registered public accounting firm, as stated in their report, which is included herein.
Report of Independent Registered Public Accounting Firm
To the Board of Directors and Shareholders of Domtar Corporation:
In our opinion, the accompanying consolidated balance sheets and the related consolidated statements of earnings and comprehensive income, shareholders’ equity and cash flows present fairly, in all material respects, the financial position of Domtar Corporation and its subsidiaries at December 31, 2012 and December 31, 2011, and the results of their operations and their cash flows for each of the three years in the fourth quarterperiod ended December 31, 2012 in conformity with accounting principles generally accepted in the United States of 2009,America. In addition, in our opinion, the financial statement schedule listed in the index appearing under Item 15(a)(2) presents fairly, in all material respects, the information set forth therein when read in conjunction with the related consolidated financial statements. Also in our opinion, the Company maintained, in all material respects, effective internal control over financial reporting as of December 31, 2012, based on criteria established inInternal Control— Integrated Frameworkissued by the Committee of Sponsoring Organizations of the Treadway Commission (COSO). The Company’s management is responsible for these financial statements and financial statement schedule, for maintaining effective internal control over financial reporting and for its assessment of the effectiveness of internal control over financial reporting, included in the accompanying Management’s Report on Internal Control over Financial Reporting. Our responsibility is to express opinions on these financial statements, on the financial statement schedule, and on the Company’s internal control over financial reporting based on our integrated audits. We conducted our audits in accordance with the standards of the Public Company Accounting Oversight Board (United States). Those standards require that we revisedplan and perform the audits to obtain reasonable assurance about whether the financial statements are free of material misstatement and whether effective internal control over financial reporting was maintained in all material respects. Our audits of the financial statements included examining, on a test basis, evidence supporting the amounts and disclosures in the financial statements, assessing the accounting principles used and significant estimates made by management, and evaluating the overall financial statement presentation. Our audit of internal control over financial reporting included obtaining an understanding of internal control over financial reporting, assessing the risk that a material weakness exists, and testing and evaluating the design and operating effectiveness of internal control based on the assessed risk. Our audits also included performing such other procedures as we considered necessary in the circumstances. We believe that our audits provide a reasonable basis for our opinions.
A company’s internal control over financial reporting is a process designed to provide reasonable assurance regarding the reliability of financial reporting and the preparation of financial statements for external purposes in accordance with generally accepted accounting principles. A company’s internal control over financial reporting includes those policies and procedures that (i) pertain to the maintenance of records that, in reasonable detail, accurately and fairly reflect the transactions and dispositions of the assets of the company; (ii) provide reasonable assurance that transactions are recorded as necessary to permit preparation of financial statements in accordance with generally accepted accounting principles, and that receipts and expenditures of the company are being made only in accordance with authorizations of management and directors of the company; and (iii) provide reasonable assurance regarding prevention or timely detection of unauthorized acquisition, use, or disposition of the company’s assets that could have a material effect on the financial statements.
Because of its inherent limitations, internal control over financial reporting may not prevent or detect misstatements. Also, projections of any evaluation of effectiveness to future periods are subject to the risk that controls may become inadequate because of changes in conditions, or that the degree of compliance with the policies or procedures may deteriorate.
/s/ PricewaterhouseCoopers LLP
PricewaterhouseCoopers LLP
Charlotte, North Carolina
February 25, 2013
DOMTAR CORPORATION
CONSOLIDATED STATEMENTS OF EARNINGS AND COMPREHENSIVE INCOME
(IN MILLIONS OF DOLLARS, UNLESS OTHERWISE NOTED)
| Year ended December 31, 2012 | Year ended December 31, 2011 | Year ended December 31, 2010 | ||||||||||
| $ | $ | $ | ||||||||||
Sales | 5,482 | 5,612 | 5,850 | |||||||||
Operating expenses | ||||||||||||
Cost of sales, excluding depreciation and amortization | 4,321 | 4,171 | 4,417 | |||||||||
Depreciation and amortization | 385 | 376 | 395 | |||||||||
Selling, general and administrative | 358 | 340 | 338 | |||||||||
Impairment and write-down of property, plant and equipment and intangible assets (NOTE 4) | 14 | 85 | 50 | |||||||||
Closure and restructuring costs (NOTE 16) | 30 | 52 | 27 | |||||||||
Other operating loss (income), net (NOTE 8) | 7 | (4 | ) | 20 | ||||||||
|
|
|
|
|
| |||||||
| 5,115 | 5,020 | 5,247 | ||||||||||
|
|
|
|
|
| |||||||
Operating income | 367 | 592 | 603 | |||||||||
Interest expense, net (NOTE 9) | 131 | 87 | 155 | |||||||||
|
|
|
|
|
| |||||||
Earnings before income taxes and equity earnings | 236 | 505 | 448 | |||||||||
Income tax expense (benefit) (NOTE 10) | 58 | 133 | (157 | ) | ||||||||
Equity loss, net of taxes | 6 | 7 | — | |||||||||
|
|
|
|
|
| |||||||
Net earnings | 172 | 365 | 605 | |||||||||
|
|
|
|
|
| |||||||
Per common share (in dollars) (NOTE 6) | ||||||||||||
Net earnings | ||||||||||||
Basic | 4.78 | 9.15 | 14.14 | |||||||||
Diluted | 4.76 | 9.08 | 14.00 | |||||||||
Weighted average number of common and exchangeable shares outstanding (millions) | ||||||||||||
Basic | 36.0 | 39.9 | 42.8 | |||||||||
Diluted | 36.1 | 40.2 | 43.2 | |||||||||
Net earnings | 172 | 365 | 605 | |||||||||
Other comprehensive income (loss): | ||||||||||||
Net derivative gains (losses) on cash flow hedges: | ||||||||||||
Net losses arising during the period, net of tax of $1 (2011—$7; 2010—$3) | — | (13 | ) | (4 | ) | |||||||
Less: Reclassification adjustment for (gains) losses included in net earnings, net of tax of $(5) (2011—$(2); 2010—$(1)) | 8 | (1 | ) | (2 | ) | |||||||
Foreign currency translation adjustments | 23 | (25 | ) | 66 | ||||||||
Change in unrecognized losses and prior service cost related to pension and post-retirement benefit plans, net of tax of $30 (2011—$15; 2010 $19) | (85 | ) | (25 | ) | (54 | ) | ||||||
|
|
|
|
|
| |||||||
Other comprehensive income (loss) | (54 | ) | (64 | ) | 6 | |||||||
|
|
|
|
|
| |||||||
Comprehensive income | 118 | 301 | 611 | |||||||||
|
|
|
|
|
| |||||||
The accompanying notes are an integral part of the consolidated financial statements.
DOMTAR CORPORATION
(IN MILLIONS OF DOLLARS, UNLESS OTHERWISE NOTED)
| At | ||||||||
| December 31, 2012 | December 31, 2011 | |||||||
| $ | $ | |||||||
Assets | ||||||||
Current assets | ||||||||
Cash and cash equivalents | 661 | 444 | ||||||
Receivables, less allowances of $4 and $5 | 562 | 644 | ||||||
Inventories (NOTE 11) | 675 | 652 | ||||||
Prepaid expenses | 24 | 22 | ||||||
Income and other taxes receivable | 48 | 47 | ||||||
Deferred income taxes (NOTE 10) | 45 | 125 | ||||||
|
|
|
| |||||
Total current assets | 2,015 | 1,934 | ||||||
Property, plant and equipment, at cost | 8,793 | 8,448 | ||||||
Accumulated depreciation | (5,392 | ) | (4,989 | ) | ||||
|
|
|
| |||||
Net property, plant and equipment (NOTE 13) | 3,401 | 3,459 | ||||||
Goodwill (NOTE 12) | 263 | 163 | ||||||
Intangible assets, net of amortization (NOTE 14) | 309 | 204 | ||||||
Other assets (NOTE 15) | 135 | 109 | ||||||
|
|
|
| |||||
Total assets | 6,123 | 5,869 | ||||||
|
|
|
| |||||
Liabilities and shareholders’ equity | ||||||||
Current liabilities | ||||||||
Bank indebtedness | 18 | 7 | ||||||
Trade and other payables (NOTE 17) | 646 | 688 | ||||||
Income and other taxes payable | 15 | 17 | ||||||
Long-term debt due within one year (NOTE 18) | 79 | 4 | ||||||
|
|
|
| |||||
Total current liabilities | 758 | 716 | ||||||
Long-term debt (NOTE 18) | 1,128 | 837 | ||||||
Deferred income taxes and other (NOTE 10) | 903 | 927 | ||||||
Other liabilities and deferred credits (NOTE 19) | 457 | 417 | ||||||
Commitments and contingencies (NOTE 21) | ||||||||
Shareholders’ equity (NOTE 20) | ||||||||
Common stock $0.01 par value; authorized 2,000,000,000 shares; issued: 42,523,896 and 42,506,732 shares | — | — | ||||||
Treasury stock $0.01 par value; 8,285,292 and 6,375,532 shares | — | — | ||||||
Exchangeable shares No par value; unlimited shares authorized; issued and held by nonaffiliates: 607,814 and 619,108 shares | 48 | 49 | ||||||
Additional paid-in capital | 2,175 | 2,326 | ||||||
Retained earnings | 782 | 671 | ||||||
Accumulated other comprehensive loss | (128 | ) | (74 | ) | ||||
|
|
|
| |||||
Total shareholders’ equity | 2,877 | 2,972 | ||||||
|
|
|
| |||||
Total liabilities and shareholders’ equity | 6,123 | 5,869 | ||||||
|
|
|
| |||||
The accompanying notes are an integral part of the consolidated financial statements.
DOMTAR CORPORATION
CONSOLIDATED STATEMENT OF SHAREHOLDERS’ EQUITY
(IN MILLIONS OF DOLLARS, UNLESS OTHERWISE NOTED)
| Issued and outstanding common and exchangeable shares (millions of shares) | Exchangeable shares | Additional paid-in capital | Retained earnings (Accumulated deficit) | Accumulated other comprehensive loss | Total shareholders’ equity | |||||||||||||||||||
| $ | $ | $ | $ | $ | ||||||||||||||||||||
Balance at December 31, 2009 | 43.0 | 78 | 2,816 | (216 | ) | (16 | ) | 2,662 | ||||||||||||||||
Conversion of exchangeable shares | — | (14 | ) | 14 | — | — | — | |||||||||||||||||
Stock-based compensation | 0.1 | — | 5 | — | — | 5 | ||||||||||||||||||
Net earnings | — | — | — | 605 | — | 605 | ||||||||||||||||||
Net derivative losses on cash flow hedges: | ||||||||||||||||||||||||
Net loss arising during the period, net of tax of $3 | — | — | — | — | (4 | ) | (4 | ) | ||||||||||||||||
Less: Reclassification adjustments for gains included in net earnings, net of tax of $(1) | — | — | — | — | (2 | ) | (2 | ) | ||||||||||||||||
Foreign currency translation adjustments | — | — | — | — | 66 | 66 | ||||||||||||||||||
Change in unrecognized losses and prior service cost related to pension and post-retirement benefit plans, net of tax of $19 | — | — | — | — | (54 | ) | (54 | ) | ||||||||||||||||
Stock repurchase, net of gain of $2 | (0.7 | ) | — | (42 | ) | — | — | (42 | ) | |||||||||||||||
Cash dividends | — | — | — | (32 | ) | — | (32 | ) | ||||||||||||||||
Other | — | — | (2 | ) | — | — | (2 | ) | ||||||||||||||||
|
|
|
|
|
|
|
|
|
|
|
| |||||||||||||
Balance at December 31, 2010 | 42.4 | 64 | 2,791 | 357 | (10 | ) | 3,202 | |||||||||||||||||
Conversion of exchangeable shares | — | (15 | ) | 15 | — | — | — | |||||||||||||||||
Stock-based compensation | 0.3 | — | 14 | — | — | 14 | ||||||||||||||||||
Net earnings | — | — | — | 365 | — | 365 | ||||||||||||||||||
Net derivative losses on cash flow hedges: | ||||||||||||||||||||||||
Net loss arising during the period, net of tax of $7 | — | — | — | — | (13 | ) | (13 | ) | ||||||||||||||||
Less: Reclassification adjustments for gains included in net earnings, net of tax of $(2) | — | — | — | — | (1 | ) | (1 | ) | ||||||||||||||||
Foreign currency translation adjustments | — | — | — | — | (25 | ) | (25 | ) | ||||||||||||||||
Change in unrecognized losses and prior service cost related to pension and post-retirement benefit plans, net of tax of $15 | — | — | — | — | (25 | ) | (25 | ) | ||||||||||||||||
Stock repurchase | (5.9 | ) | — | (494 | ) | — | — | (494 | ) | |||||||||||||||
Cash dividends | — | — | — | (51 | ) | — | (51 | ) | ||||||||||||||||
|
|
|
|
|
|
|
|
|
|
|
| |||||||||||||
Balance at December 31, 2011 | 36.8 | 49 | 2,326 | 671 | (74 | ) | 2,972 | |||||||||||||||||
Conversion of exchangeable shares | — | (1 | ) | 1 | — | — | — | |||||||||||||||||
Stock-based compensation, net of tax | — | — | 5 | — | — | 5 | ||||||||||||||||||
Net earnings | — | — | — | 172 | — | 172 | ||||||||||||||||||
Net derivative losses on cash flow hedges: | ||||||||||||||||||||||||
Net loss arising during the period, net of tax of $1 | — | — | — | — | — | — | ||||||||||||||||||
Less: Reclassification adjustments for losses included in net earnings, net of tax of $(5) | — | — | — | — | 8 | 8 | ||||||||||||||||||
Foreign currency translation adjustments | — | — | — | — | 23 | 23 | ||||||||||||||||||
Change in unrecognized losses and prior service cost related to pension and post-retirement benefit plans, net of tax of $30 | — | — | — | — | (85 | ) | (85 | ) | ||||||||||||||||
Stock repurchase | (2.0 | ) | — | (157 | ) | — | — | (157 | ) | |||||||||||||||
Cash dividends | — | — | — | (61 | ) | — | (61 | ) | ||||||||||||||||
|
|
|
|
|
|
|
|
|
|
|
| |||||||||||||
Balance at December 31, 2012 | 34.8 | 48 | 2,175 | 782 | (128 | ) | 2,877 | |||||||||||||||||
|
|
|
|
|
|
|
|
|
|
|
| |||||||||||||
The accompanying notes are an integral part of the consolidated financial statements.
DOMTAR CORPORATION
CONSOLIDATED STATEMENTS OF CASH FLOWS
(IN MILLIONS OF DOLLARS)
| Year ended December 31, 2012 | Year ended December 31, 2011 | Year ended December 31, 2010 | ||||||||||
| $ | $ | $ | ||||||||||
Operating activities | ||||||||||||
Net earnings | 172 | 365 | 605 | |||||||||
Adjustments to reconcile net earnings to cash flows from operating activities | ||||||||||||
Depreciation and amortization | 385 | 376 | 395 | |||||||||
Deferred income taxes and tax uncertainties (NOTE 10) | (1 | ) | 40 | (174 | ) | |||||||
Impairment and write-down of property, plant and equipment and intangible assets (NOTE 4) | 14 | 85 | 50 | |||||||||
Loss on repurchase of long-term debt and debt restructuring costs | — | 4 | 47 | |||||||||
Net losses (gains) on disposals of property, plant and equipment and sale of businesses | 2 | (6 | ) | 33 | ||||||||
Stock-based compensation expense | 5 | 3 | 5 | |||||||||
Equity loss, net | 6 | 7 | — | |||||||||
Other | (13 | ) | — | (2 | ) | |||||||
Changes in assets and liabilities, excluding the effects of acquisition and sale of businesses | ||||||||||||
Receivables | 99 | (12 | ) | (73 | ) | |||||||
Inventories | 5 | 2 | 39 | |||||||||
Prepaid expenses | (3 | ) | 2 | 6 | ||||||||
Trade and other payables | (118 | ) | (27 | ) | (11 | ) | ||||||
Income and other taxes | (4 | ) | 33 | 344 | ||||||||
Difference between employer pension and other post-retirement contributions and pension and other post-retirement expense | (13 | ) | (18 | ) | (120 | ) | ||||||
Other assets and other liabilities | 15 | 29 | 22 | |||||||||
|
|
|
|
|
| |||||||
Cash flows provided from operating activities | 551 | 883 | 1,166 | |||||||||
|
|
|
|
|
| |||||||
Investing activities | ||||||||||||
Additions to property, plant and equipment | (236 | ) | (144 | ) | (153 | ) | ||||||
Proceeds from disposals of property, plant and equipment | 49 | 34 | 26 | |||||||||
Proceeds from sale of businesses and investments | — | 10 | 185 | |||||||||
Acquisition of businesses, net of cash acquired | (293 | ) | (288 | ) | — | |||||||
Investment in joint venture | (6 | ) | (7 | ) | — | |||||||
|
|
|
|
|
| |||||||
Cash flows (used for) provided from investing activities | (486 | ) | (395 | ) | 58 | |||||||
|
|
|
|
|
| |||||||
Financing activities | ||||||||||||
Dividend payments | (58 | ) | (49 | ) | (21 | ) | ||||||
Net change in bank indebtedness | 11 | (16 | ) | (19 | ) | |||||||
Issuance of long-term debt | 548 | — | — | |||||||||
Repayment of long-term debt | (192 | ) | (18 | ) | (898 | ) | ||||||
Debt issue and tender offer costs | — | (7 | ) | (35 | ) | |||||||
Stock repurchase | (157 | ) | (494 | ) | (44 | ) | ||||||
Prepaid on structured stock repurchase, net | — | — | 2 | |||||||||
Other | — | 10 | (3 | ) | ||||||||
|
|
|
|
|
| |||||||
Cash flows provided from (used for) financing activities | 152 | (574 | ) | (1,018 | ) | |||||||
|
|
|
|
|
| |||||||
Net increase (decrease) in cash and cash equivalents | 217 | (86 | ) | 206 | ||||||||
Cash and cash equivalents at beginning of year | 444 | 530 | 324 | |||||||||
|
|
|
|
|
| |||||||
Cash and cash equivalents at end of year | 661 | 444 | 530 | |||||||||
|
|
|
|
|
| |||||||
Supplemental cash flow information | ||||||||||||
Net cash payments for: | ||||||||||||
Interest (including $47 million of tender offer premiums in 2012) | 116 | 74 | 107 | |||||||||
Income taxes paid | 76 | 60 | 28 | |||||||||
|
|
|
|
|
| |||||||
The accompanying notes are an integral part of the consolidated financial statements.
INDEX FOR NOTES TO CONSOLIDATED FINANCIAL STATEMENTS
NOTE 1 | SUMMARY OF SIGNIFICANT ACCOUNTING POLICIES | 80 | ||
NOTE 2 | RECENT ACCOUNTING PRONOUNCEMENTS | 87 | ||
NOTE 3 | ACQUISITION OF BUSINESSES | 88 | ||
NOTE 4 | IMPAIRMENT AND WRITE-DOWN OF PROPERTY, PLANT AND EQUIPMENT AND INTANGIBLE ASSETS | 91 | ||
NOTE 5 | STOCK-BASED COMPENSATION | 93 | ||
NOTE 6 | EARNINGS PER SHARE | 98 | ||
NOTE 7 | PENSION PLANS AND OTHER POST-RETIREMENT BENEFIT PLANS | 99 | ||
NOTE 8 | OTHER OPERATING LOSS (INCOME), NET | 111 | ||
NOTE 9 | INTEREST EXPENSE, NET | 112 | ||
NOTE 10 | INCOME TAXES | 112 | ||
NOTE 11 | INVENTORIES | 118 | ||
NOTE 12 | GOODWILL | 119 | ||
NOTE 13 | PROPERTY, PLANT AND EQUIPMENT | 119 | ||
NOTE 14 | INTANGIBLE ASSETS | 120 | ||
NOTE 15 | OTHER ASSETS | 121 | ||
NOTE 16 | CLOSURE AND RESTRUCTURING COSTS AND LIABILITY | 121 | ||
NOTE 17 | TRADE AND OTHER PAYABLES | 125 | ||
NOTE 18 | LONG-TERM DEBT | 125 | ||
NOTE 19 | OTHER LIABILITIES AND DEFERRED CREDITS | 129 | ||
NOTE 20 | SHAREHOLDERS’ EQUITY | 130 | ||
NOTE 21 | COMMITMENTS AND CONTINGENCIES | 132 | ||
NOTE 22 | DERIVATIVES AND HEDGING ACTIVITIES AND FAIR VALUE MEASUREMENT | 137 | ||
NOTE 23 | SEGMENT DISCLOSURES | 142 | ||
NOTE 24 | SUPPLEMENTAL GUARANTOR FINANCIAL INFORMATION | 146 | ||
NOTE 25 | SALE OF WOOD BUSINESS AND WOODLAND MILL | 155 | ||
DOMTAR CORPORATION
NOTES TO CONSOLIDATED FINANCIAL STATEMENTS
DECEMBER 31, 2012
(IN MILLIONS OF DOLLARS, UNLESS OTHERWISE NOTED)
SUMMARY OF SIGNIFICANT ACCOUNTING POLICIES
NATURE OF OPERATIONS
Domtar designs, manufactures, markets and distributes a wide variety of fiber-based products including communications papers, specialty and packaging papers and adult incontinence products. The foundation of its business is the efficient operation of pulp mills, converting fiber into papergrade, fluff and specialty pulps. The majority of this pulp production is consumed internally to make communication papers and specialty and packaging papers with the balance sold as a market pulp. Domtar is the largest integrated marketer and manufacturer of uncoated freesheet paper in North America. In addition, Domtar operates manufacturing, research and development and distribution facilities to sell adult incontinence care products including washcloths, marketed primarily under the Attends® brand name. The Company also owns and operates Ariva®, a network of strategically located paper distribution facilities. The Company also produced lumber and other speciality and industrial wood products up until the sale of the Wood business on June 30, 2010.
ACCOUNTING PRINCIPLES
The Company’s consolidated financial statements have been prepared in accordance with accounting principles generally accepted in the United States of America (“GAAP”). The consolidated financial statements include the accounts of Domtar Corporation and its controlled subsidiaries. Significant intercompany transactions have been eliminated on consolidation. Investment in an affiliated company, where the Company has joint control over their operations, is accounted for by the equity method. The Company’s share of equity earnings totaled a loss, net of taxes, of $6 million.
To conform with the basis of presentation adopted in the current period, certain figures previously reported in the Statements of Cash Flows, have been reclassified.
USE OF ESTIMATES
The consolidated financial statements have been prepared in conformity with GAAP, which requires management to make estimates and assumptions that affect the reported amounts of revenues and expenses during the year, the reported amounts of assets and liabilities, and the disclosure of contingent assets and liabilities at the date of the consolidated financial statements. On an ongoing basis, management reviews the estimates and assumptions, including but not limited to those related to closure and restructuring costs, income taxes, useful lives, asset impairment charges, environmental matters and other asset retirement obligations, pension and other post-retirement benefit plans and, commitments and contingencies, based on currently available information. Actual results could differ from those estimates.
TRANSLATION OF FOREIGN CURRENCIES
The Company determines its international subsidiaries’ functional currency by reviewing the currencies in which their respective operating activities occur. The Company translates assets and liabilities of its non-U.S.
DOMTAR CORPORATION
NOTES TO CONSOLIDATED FINANCIAL STATEMENTS
DECEMBER 31, 2012
(IN MILLIONS OF DOLLARS, UNLESS OTHERWISE NOTED)
NOTE 1. SUMMARY OF SIGNIFICANT ACCOUNTING POLICIES (CONTINUED)
dollar functional currency subsidiaries into U.S. dollars using the rate in effect at the balance sheet date and revenues and expenses are translated at the average exchange rates during the year. Foreign currency translation gains and losses are included in Shareholders’ equity as a component of Accumulated other comprehensive loss in the accompanying Consolidated Balance Sheets.
Monetary assets and liabilities denominated in a currency that is different from a reporting entity’s functional currency must first be remeasured from the applicable currency to the legal entity’s functional currency. The effect of this remeasurement process is recognized in the Consolidated Statements of Earnings and Comprehensive Income and is partially offset by our economic hedging program (refer to Note 22). At December 31, 2012, the accumulated translation adjustment accounts amounted to $208 million (2011—$185 million).
REVENUE RECOGNITION
Domtar Corporation recognizes revenues when pervasive evidence of an arrangement exists, the customer takes title and assumes the risks and rewards of ownership, the sales price charged is fixed or determinable and when collection is reasonably assured. Revenue is recorded at the time of shipment for terms designated free on board (“f.o.b.”) shipping point. For sales transactions designated f.o.b. destination, revenue is recorded when the product is delivered to the customer’s delivery site, when the title and risk of loss are transferred.
SHIPPING AND HANDLING COSTS
The Company classifies shipping and handling costs as a component of Cost of sales in the Consolidated Statements of Earnings and Comprehensive Income.
CLOSURE AND RESTRUCTURING COSTS
Closure and restructuring costs are recognized as liabilities in the period when they are incurred and are measured at their fair value. For such recognition to occur, management, with the appropriate level of authority, must have approved and committed to a firm plan and appropriate communication to those affected must have occurred. These provisions may require an estimation of costs such as severance and termination benefits, pension and related curtailments, environmental remediation and may also include expenses related to demolition and outplacement. Actions taken may also require an evaluation of any remaining assets to determine required write-downs, if any, and a review of estimated remaining useful lives which may lead to accelerated depreciation expense.
Estimates of cash flows and fair value relating to closures and restructurings require judgment. Closure and restructuring liabilities are based on management’s best estimates of future events at December 31, 2012. Closure and restructuring cost estimates are dependent on future events. Although the Company does not anticipate significant changes, the actual costs may differ from these estimates due to subsequent developments such as the results of environmental studies, the ability to find a buyer for assets set to be dismantled and demolished and other business developments. As such, additional costs and further working capital adjustments may be required in future periods.
DOMTAR CORPORATION
NOTES TO CONSOLIDATED FINANCIAL STATEMENTS
DECEMBER 31, 2012
(IN MILLIONS OF DOLLARS, UNLESS OTHERWISE NOTED)
NOTE 1. SUMMARY OF SIGNIFICANT ACCOUNTING POLICIES (CONTINUED)
INCOME TAXES
Domtar Corporation uses the asset and liability method of accounting for income taxes. Under this method, deferred tax assets and liabilities are determined according to differences between the carrying amounts and tax bases of the assets and liabilities. The Company records its worldwide tax provision based on the respective tax rules and regulations for the jurisdictions in which it operates. The change in the net deferred tax asset or liability is included in Income tax expense or in Other comprehensive income (loss) in the Consolidated Statements of Earnings and Comprehensive Income. Deferred tax assets and liabilities are measured using enacted tax rates and laws expected to apply in the years in which the assets and liabilities are expected to be recovered or settled. Uncertain tax positions are recorded based upon the Company’s evaluation of whether it is “more likely than not” (a probability level of more than 50 percent) that, based upon its technical merits, the tax position will be sustained upon examination by the taxing authorities. The Company establishes a valuation allowance for deferred tax assets when it is more likely than not that they will not be realized. In general, “realization” refers to the incremental benefit achieved through the reduction in future taxes payable or an increase in future taxes refundable from the deferred tax assets.
The Company recognizes interest and penalties related to income tax matters as a component of Income tax expense in the Consolidated Statements of Earnings and Comprehensive Income.
CASH AND CASH EQUIVALENTS
Cash and cash equivalents include cash and short-term investments with original maturities of less than three months and are presented at cost which approximates fair value.
RECEIVABLES
Receivables are recorded net of a provision for doubtful accounts that is based on expected collectability. The securitization of receivables is accounted for as secured borrowings. Accordingly, financing expenses related to the securitization of receivables are recognized in earnings as a component of Interest expense in the Consolidated Statements of Earnings and Comprehensive Income.
INVENTORIES
Inventories are stated at the lower of cost or market. Cost includes labor, materials and production overhead. The last-in, first-out (“LIFO”) method is used to cost certain U.S. raw materials, in process and finished goods inventories. LIFO inventories were $264 million and $267 million at December 31, 2012 and 2011, respectively. The balance of U.S. raw material inventories, all materials and supplies inventories and all foreign inventories are costed at either the first-in, first-out (“FIFO”) or average cost methods. Had the inventories for which the LIFO method is used been valued under the FIFO method, the amounts at which product inventories are stated would have been $62 million and $56 million greater at December 31, 2012 and 2011, respectively.
DOMTAR CORPORATION
NOTES TO CONSOLIDATED FINANCIAL STATEMENTS
DECEMBER 31, 2012
(IN MILLIONS OF DOLLARS, UNLESS OTHERWISE NOTED)
NOTE 1. SUMMARY OF SIGNIFICANT ACCOUNTING POLICIES (CONTINUED)
PROPERTY, PLANT AND EQUIPMENT
Property, plant and equipment are stated at cost less accumulated depreciation including asset impairment write-downs. Interest costs are capitalized for significant capital projects. For timber limits and timberlands, amortization is calculated using the units of production method. For all other assets, amortization is calculated using the straight-line method over the estimated net realizable valuesuseful lives of the remainingassets. Buildings and improvements are amortized over periods of 10 to 40 years and machinery and equipment over periods of 3 to 20 years. No depreciation is recorded on assets and recorded a non-cash write-downunder construction.
IMPAIRMENT OF LONG-LIVED ASSETS
Long-lived assets are reviewed for impairment upon the occurrence of $14 million, related to fixed assets, primarily a turbine and a boiler. The write-down representedevents or changes in circumstances indicating that the difference between the new estimated liquidation or salvagecarrying value of the fixed assets andmay not be recoverable, as measured by comparing their carrying values.
Dryden Pulp and Paper Mill
In the fourth quarter of 2008, as a result of the decisionnet book value to permanently shut down the remaining paper machine and converting center of the Dryden mill, we wrote-down these assets to their estimated recoverable amount via a non-cash impairment change of $11 million. Given the substantial change in use of the pulp and paper mill, we conducted a Step I impairment test on the remaining Dryden pulp mill operation’s fixed assets. Estimates of undiscounted future cash flows used to test the recoverability of the fixed assets included key assumptions related to trend prices, inflation-adjusted cost projections, the forecasted exchange rate for the U.S. dollar and the estimated useful life of the fixed assets. The main sources of such assumptions and related benchmarks were largely the same as those listed under “Impairment of Goodwill” below.
Step I of the impairment test demonstrated that the carrying values of the fixed assets exceeded their estimated undiscounted future cash flows, indicating that an impairment exists. A Step II test was undertaken to determine theflows. Impaired assets are recorded at estimated fair value, of the remaining assets and we recorded a non-cash impairment charge of $265 million in the fourth quarter of 2008 to reduce the assets to their estimated fair value.
Former Wood Segment
In the fourth quarter of 2009 and 2008, we conducted an impairment test on the fixed assets and intangible assets (“the Asset Group”) of the former Wood reportable segment. The need for such test was triggereddetermined principally by operating losses sustained by the segment in 2007, 2008 and 2009, as well as short-term forecasted operating losses.
We completed the Step I impairment test during each period and concluded that the recognition of an impairment loss for the former Wood reportable segment’s long-lived assets was not required as the aggregate estimated undiscountedusing discounted future cash flows exceeded the carrying value of the Asset Group of $161 million by a significant amount.
Estimates of undiscounted future cash flows usedexpected from their use and eventual disposition (refer to test the recoverability of the Asset Group included key assumptions related to trend prices, inflation-adjusted cost projections, forecasted exchange rate for the U.S. dollar and the estimated useful life of the Asset Group. We believe such assumptions to be reasonable and to reflect forecasted market conditions at the valuation date. They involve a high degree of judgment and complexity and reflect our best estimates with the information available at the time our forecasts were developed. To this end, we evaluate the appropriateness of our assumptions as well as our overall forecasts by comparing projected results of upcoming years with actual results of preceding years and validating that differences therein are reasonable. Key assumptions were related to trend prices (based on data from Resource Information Systems Inc. or “RISI”, an authoritative independent source in the global forest products industry), material and energy costs and foreign exchange rates. A number of benchmarks from independent industry and other economic publications were used in order to develop projections for the forecast period.
The following table summarizes the approximate impact that a change in certain key assumptions would have on the estimated undiscounted future cash flows at December 31, 2009, while holding all other assumptions constant:
Key Assumptions | Increase of | Approximate impact on the undiscounted cash flows | ||||||
| (In millions of dollars) | ||||||||
Foreign exchange rates ($US to $CDN) | $ | 0.01 | ($ | 30 | ) | |||
Lumber pricing | $ | 5 /MFBM | 32 | |||||
Changes in our assumptions and estimates may affect our forecasts and may lead to an outcome where impairment charges would be required. In addition, actual results may vary from our forecasts and such variations may be material and unfavorable, thereby triggering the need for future impairment tests where our conclusions may differ in reflection of prevailing market conditions.Note 4).
Lebel-sur-Quévillon Pulp Mill and Sawmill
Pursuant to the decision in the fourth quarter of 2008 to permanently shut down the Lebel-sur-Quévillon pulp mill and sawmill of the Papers and former Wood segments, respectively, we have recorded a non-cash write-down of $4 million related to fixed assets at both locations consisting mainly of a turbine, a recovery system and saw lines. The write-down represented the difference between the estimated liquidation or salvage value of the fixed assets and their carrying values.
White River Sawmill
In the fourth quarter of 2008, the net assets of the White River sawmill of the former Wood segment were held for sale and measured at the lower of its carrying value or estimated fair value less cost to sell. The fair value was determined by analyzing values assigned to it in a current potential sale transaction together with conditions prevailing in the markets where the sawmill operated. Pursuant to such analysis, non-cash write-downs amounting to $8 million related to fixed assets and $4 million related to intangible assets were recorded in the fourth quarter of 2008 to reflect the difference between their respective estimated fair values less cost to sell and their carrying values. The sawmill was sold in June 2009 and we recorded a gain of $1 million related to the transaction.
Impairment of GoodwillGOODWILL AND OTHER INTANGIBLE ASSETS
Goodwill is not amortized and is subject to an annual goodwill impairment test. This test is carried outevaluated at the beginning of the fourth quarter of every year or more frequently if events or changes in circumstances indicate that goodwill might be impaired. A Step I goodwillwhenever indicators of potential impairment exist. The Company performs the impairment test determinesof goodwill at its reporting unit level. The Company has the option to first assess qualitative factors to determine whether it is more likely than not that the fair value of a reporting unit exceedsis less than its carrying amount. In performing the net carrying amountqualitative assessment, the Company identifies the relevant drivers of thatfair value of a reporting unit and the relevant events and circumstances that may have an impact on those drivers of fair value. This process involves significant judgement and assumptions including goodwill, asthe assessment of the results of the most recent fair value calculations, the identification of macroeconomic conditions, industry and market considerations, cost factors, overall financial performance, specific events affecting the Company and the business, and making the assessment date in order to assess if goodwillon whether each relevant factor will impact the impairment test positively or negatively and the magnitude of any such impact. If, after assessing the totality of events or circumstances, the Company determines that it is impaired. Ifmore likely than not that the fair value of a reporting unit is greaterless than the netits carrying amount, nothen it performs Step I of the two-step impairment test. The Company can also elect to bypass the qualitative assessment and proceed directly to the Step 1 of the impairment test.
The first step is necessary.to compare the fair value of a reporting unit to its carrying value, including goodwill. The Company uses a discounted cash flow model to determine the fair value of a reporting unit. The assumptions used in the model are consistent with those we believe hypothetical marketplace participants would use. In the event that the net carrying amount exceeds the fair value a Step II goodwillof the business, the second step of the impairment test must be performed in order to determine the amount of the impairment charge. The implied fairFair value of goodwill in thisthe Step II impairment test is estimated in the same way as goodwill was determined at the date of the acquisition in a business combination. Thatcombination, that is, the excess of the fair value of the reporting unit over the fair value of the identifiable net assets of the reporting unit representsbusiness.
All goodwill as of December 31, 2012 resides in the impliedPersonal Care segment, and originates from the acquisitions of Attends Healthcare Inc. on September 1, 2011, Attends Healthcare Limited on March 1, 2012 and EAM Corporation on May 10, 2012. Please refer to Note 3 “Acquisition of businesses” for additional information regarding these acquisitions.
DOMTAR CORPORATION
NOTES TO CONSOLIDATED FINANCIAL STATEMENTS
DECEMBER 31, 2012
(IN MILLIONS OF DOLLARS, UNLESS OTHERWISE NOTED)
NOTE 1. SUMMARY OF SIGNIFICANT ACCOUNTING POLICIES (CONTINUED)
Indefinite-lived intangible assets are not amortized and are evaluated at the beginning of the fourth quarter of every year, or more frequently whenever indicators of potential impairment exist. The Company has the option to first assess qualitative factors to determine whether it is more likely than not that the fair value of goodwill. To accomplish this Step IIindefinite-lived intangible assets are less than their carrying amounts. The qualitative assessment follows the same process as the one performed for goodwill, as described above. If, after assessing the qualitative factors, the Company determines that it is more likely than not that the indefinite-lived intangible assets are less than their carrying amounts, then an impairment test is required. The Company can also elect to proceed directly to the quantitative test. The impairment test consists of comparing the fair value of the indefinite-lived intangible assets determined using a variety of methodologies to their carrying amount. If the carrying amounts of the indefinite-lived intangible assets exceed their fair value, an impairment loss is recognized in an amount equal to that excess. Indefinite-lived intangible assets include trade names related to Attends®. The Company evaluates its indefinite-lived intangible assets each reporting unit’s goodwill mustperiod to determine whether events and circumstances continue to support indefinite useful lives.
Definite lived intangible assets are stated at cost less amortization and are reviewed for impairment whenever events or changes in circumstances indicate that their carrying amount may not be recoverable. Definite lived intangible assets include water rights, customer relationships, technology, trade names and supplier and non-compete agreements which are being amortized using the straight-line method over their estimated useful lives. Power purchase agreements are amortized using the straight-line method over the term of the respective contract. Cutting rights were amortized using the units of production method and comparedwere sold June 30, 2010 as part of the sale of the Wood business (refer to its carrying value.Note 25). Any potential impairment for definite lived intangible assets will be calculated in the same manner as that disclosed under impairment of long-lived assets.
Amortization is based mainly on the following useful lives:
Useful life | ||
Water rights | 40 years | |
Customer relationships | 20 to 40 years | |
Technology | 7 to 20 years | |
Trade names | 7 years | |
Supplier agreements | 5 years | |
Power purchase agreements | 25 years | |
Non-Compete agreements | 9 years |
OTHER ASSETS
Other assets are recorded at cost. Direct financing costs related to the issuance of long-term debt are deferred and amortized using the effective interest rate method.
ENVIRONMENTAL COSTS
Environmental expenditures for effluent treatment, air emission, landfill operation and closure, asbestos containment and removal, bark pile management, silvicultural activities and site remediation (together referred to as environmental matters) are expensed or capitalized depending on their future economic benefit. In the normal course of business, Domtar Corporation incurs certain operating costs for environmental matters that are
DOMTAR CORPORATION
NOTES TO CONSOLIDATED FINANCIAL STATEMENTS
DECEMBER 31, 2012
(IN MILLIONS OF DOLLARS, UNLESS OTHERWISE NOTED)
NOTE 1. SUMMARY OF SIGNIFICANT ACCOUNTING POLICIES (CONTINUED)
expensed as incurred. Expenditures for property, plant and equipment that prevent future environmental impacts are capitalized and amortized on a straight-line basis over 10 to 40 years. Provisions for environmental matters are not discounted, due to uncertainty with respect to timing of expenditures, and are recorded when remediation efforts are probable and can be reasonably estimated.
ASSET RETIREMENT OBLIGATIONS
Asset retirement obligations are recognized, at fair value, in the period in which Domtar Corporation incurs a legal obligation associated with the retirement of an asset. Conditional asset retirement obligations are recognized, at fair value, when the fair value of the liability can be reasonably estimated or on a probability-weighted discounted cash flow estimate. The excessassociated costs are capitalized as part of the carrying value of the related asset and depreciated over its remaining useful life. The liability is accreted using the credit adjusted risk-free interest rate used to discount the cash flow.
STOCK-BASED COMPENSATION AND OTHER STOCK-BASED PAYMENTS
Domtar Corporation recognizes the cost of employee services received in exchange for awards of equity instruments over the requisite service period, based on their grant date fair value for awards accounted for as equity and based on the quoted market value of each reporting period for awards accounted for as liability. The Company awards are accounted for as compensation expense and presented in Additional paid-in-capital on the Consolidated Balance Sheets for Equity type awards and presented in Other long-term liabilities and deferred credits on the Consolidated Balance Sheets for Liability type awards.
The Company’s awards may be subject to market, performance and/or service conditions. Any consideration paid by plan participants on the exercise of stock options or the purchase of shares is takencredited to Additional paid-in-capital on the Consolidated Balance Sheets. The par value included in the Additional paid-in-capital component of stock-based compensation is transferred to Common shares upon the issuance of shares of common stock.
Unless otherwise determined at the time of the grant, awards subject to service conditions vest in approximately equal installments over three years beginning on the first anniversary of the grant date and performance-based awards vest based on achievement of pre-determined performance goals over performance periods of three years. The majority of non-qualified stock options and performance share units expire at various dates no later than seven years from the date of grant. Deferred Share Units vest immediately at the grant date and are remeasured at each reporting period, until settlement, using the quoted market value.
Under the 2007 Omnibus Incentive Plan (the “Omnibus Plan”), a maximum of 1,422,214 shares are reserved for issuance in connection with awards granted or to be granted.
DERIVATIVE INSTRUMENTS
Derivative instruments are utilized by Domtar Corporation as part of the overall strategy to manage exposure to fluctuations in foreign currency and price on certain purchases. As a matter of policy, derivatives are not used for trading or speculative purposes. All derivatives are recorded at fair value either as assets or
DOMTAR CORPORATION
NOTES TO CONSOLIDATED FINANCIAL STATEMENTS
DECEMBER 31, 2012
(IN MILLIONS OF DOLLARS, UNLESS OTHERWISE NOTED)
NOTE 1. SUMMARY OF SIGNIFICANT ACCOUNTING POLICIES (CONTINUED)
liabilities. When derivative instruments have been designated within a hedge relationship and are highly effective in offsetting the identified risk characteristics of specific financial assets and liabilities or group of financial assets and liabilities, hedge accounting is applied.
In a fair value hedge, changes in fair value of derivatives are recognized in the Consolidated Statements of Earnings and Comprehensive Income. The change in fair value of the hedged item attributable to the hedged risk is also recorded in the Consolidated Statements of Earnings and Comprehensive Income by way of a corresponding adjustment of the carrying amount of the hedged item recognized in the Consolidated Balance Sheets. In a cash flow hedge, changes in fair value of derivative instruments are recorded in Other comprehensive income (loss). These amounts are reclassified in the Consolidated Statements of Earnings and Comprehensive Income in the periods in which results are affected by the cash flows of the hedged item within the same line item. Any hedge ineffectiveness is recorded in the Consolidated Statements of Earnings and Comprehensive Income when incurred.
PENSION PLANS
Domtar Corporation’s plans include funded and unfunded defined benefit and defined contribution pension plans. Domtar Corporation recognizes the overfunded or underfunded status of defined benefit and underfunded defined contribution pension plans as an asset or liability in the Consolidated Balance Sheets. The net periodic benefit cost includes the following:
The cost of pension benefits provided in exchange for employees’ services rendered during the period,
The interest cost of pension obligations,
The expected long-term return on pension fund assets based on a market value of pension fund assets,
Gains or losses on settlements and curtailments,
The straight-line amortization of past service costs and plan amendments over the average remaining service period of approximately 9 years of the active employee group covered by the plans, and
The amortization of cumulative net actuarial gains and losses in excess of 10% of the greater of the accrued benefit obligation or market value of plan assets at the beginning of the year over the average remaining service period of approximately 9 years of the active employee group covered by the plans.
The defined benefit plan obligations are determined in accordance with the projected unit credit actuarial cost method.
OTHER POST-RETIREMENT BENEFIT PLANS
The Company recognizes the unfunded status of other post-retirement benefit plans (other than multiemployer plans) as a liability in the Consolidated Balance Sheets. These benefits, which are funded by Domtar Corporation as they become due, include life insurance programs, medical and dental benefits and short-term and long-term disability programs. We amortize the cumulative net actuarial gains and losses in excess of 10% of the accrued benefit obligation at the beginning of the year over the average remaining service period of approximately 10 years of the active employee group covered by the plans.
DOMTAR CORPORATION
NOTES TO CONSOLIDATED FINANCIAL STATEMENTS
DECEMBER 31, 2012
(IN MILLIONS OF DOLLARS, UNLESS OTHERWISE NOTED)
NOTE 1. SUMMARY OF SIGNIFICANT ACCOUNTING POLICIES (CONTINUED)
GUARANTEES
A guarantee is a contract or an indemnification agreement that contingently requires Domtar Corporation to make payments to the other party of the contract or agreement, based on changes in an underlying item that is related to an asset, a liability or an equity security of the other party or on a third party’s failure to perform under an obligating agreement. It could also be an indirect guarantee of the indebtedness of another party, even though the payment to the other party may not be based on changes in an underlying item that is related to an asset, a liability or an equity security of the other party. Guarantees, when applicable, are accounted for at fair value.
RECENT ACCOUNTING PRONOUNCEMENTS
ACCOUNTING CHANGES IMPLEMENTED
COMPREHENSIVE INCOME
In June 2011, the Financial Accounting Standards Board (“FASB”) issued changes to the presentation of comprehensive income. These changes give an entity the option to present the total of comprehensive income, the components of net income, and the components of other comprehensive income either in a single continuous statement of comprehensive income or in two separate but consecutive statements. The option to present components of other comprehensive income as part of the statement of changes in shareholders’ equity was eliminated. The nature of the items that must be reported in other comprehensive income and the requirements for reclassification from other comprehensive income to net income were not changed. Additionally, no changes were made to the calculation and presentation of earnings per share. The Company adopted the new requirement on January 1, 2012 with no impact on the Company’s consolidated financial statements except for the change in presentation. The Company has chosen to present a single continuous statement of comprehensive income.
INTANGIBLES—GOODWILL AND OTHER
In July 2012, the FASB issued an update to Intangibles—Goodwill and Other, which simplifies how entities test indefinite-lived intangible assets for impairment by permitting an entity to first assess qualitative factors to determine whether it is more likely than not that the indefinite-lived intangible asset is impaired. If the entity concludes that it is more likely than not that the indefinite-lived intangible asset is impaired, then it is required to perform the quantitative impairment test. The amended provisions are effective for annual and interim impairment tests performed for fiscal years beginning after September 15, 2012 with early adoption permitted. The Company adopted the new requirement as of its publication date with no impact on the Company’s consolidated financial statements.
DOMTAR CORPORATION
NOTES TO CONSOLIDATED FINANCIAL STATEMENTS
DECEMBER 31, 2012
(IN MILLIONS OF DOLLARS, UNLESS OTHERWISE NOTED)
NOTE 2. RECENT ACCOUNTING PRONOUNCEMENTS (CONTINUED)
FUTURE ACCOUNTING CHANGES
COMPREHENSIVE INCOME
In February 2013, the FASB issued an update to Comprehensive Income, which requires an entity to provide information regarding the amounts reclassified out of accumulated other comprehensive income by component. The standard requires that companies present either in a single note or parenthetically on the face of the financial statements, the effect of significant amounts reclassified from each component of accumulated other comprehensive income based on its source, and the income statement line items affected by the reclassification. If a component is not required to be reclassified to net income in its entirety, companies would instead cross reference to the related footnote for additional information.
These modifications are effective for interim and annual periods beginning after December 15, 2012. The Company is currently evaluating these changes to determine which option will be chosen for the presentation of amounts reclassified out of accumulated other comprehensive income. Other than the change in presentation, the Company has determined these changes will not have an impact on the consolidated financial statements.
ACQUISITION OF BUSINESSES
EAM Corporation
On May 10, 2012, the Company completed the acquisition of 100% of the outstanding shares of EAM Corporation (“EAM”). EAM manufactures high quality airlaid and ultrathin laminated absorbent cores used in feminine hygiene, adult incontinence, baby diapers, and other medical healthcare and performance packaging solutions. EAM operates a manufacturing, research and development and distribution facility in Jesup, Georgia. EAM has approximately 54 employees. The results of EAM’s operations have been included in the consolidated financial statements since May 1, 2012, the effective time of the transaction, and are presented in the Personal Care reportable segment. The purchase price was $61 million in cash, including working capital, net of cash acquired of $1 million. The acquisition was accounted for as a business combination under the acquisition method of accounting, in accordance with the Business Combinations Topic of FASB Accounting Standards Codification (“ASC”).
The total purchase price was allocated to tangible and intangible assets acquired and liabilities assumed based on the Company’s estimates of their fair value, which are based on information currently available. During the fourth quarter of 2012, the Company completed the evaluation of all assets and liabilities.
DOMTAR CORPORATION
NOTES TO CONSOLIDATED FINANCIAL STATEMENTS
DECEMBER 31, 2012
(IN MILLIONS OF DOLLARS, UNLESS OTHERWISE NOTED)
NOTE 3. ACQUISITION OF BUSINESSES (CONTINUED)
The table below illustrates the purchase price allocation:
Fair value of net assets acquired at the date of acquisition | ||||||||
Receivables | $ | 6 | ||||||
Inventory | 2 | |||||||
Property, plant and equipment | 13 | |||||||
Intangible assets (Note 14) | ||||||||
Customer relationships(1) | 19 | |||||||
Technology(2) | 8 | |||||||
Non-compete(3) | 1 | |||||||
| 28 | ||||||||
Goodwill (Note 12) | 31 | |||||||
|
| |||||||
Total assets | 80 | |||||||
Less: Liabilities | ||||||||
Trade and other payables | 4 | |||||||
Deferred income tax liabilities and unrecognized tax benefits | 15 | |||||||
|
| |||||||
Total liabilities | 19 | |||||||
Fair value of net assets acquired at the date of acquisition | 61 | |||||||
| (1) | The useful life of the Customer relationships acquired is 30 years. |
| (2) | The useful lives of the Technology acquired are between 7 and 20 years. |
| (3) | The useful life of the Non-compete acquired is 9 years. |
Attends Healthcare Limited
On March 1, 2012, the Company completed the acquisition of 100% of the outstanding shares of Attends Healthcare Limited (“Attends Europe”). Attends Europe manufactures and supplies adult incontinence care products in Northern Europe. Attends Europe operates a manufacturing, research and development and distribution facility in Aneby, Sweden and also operates a distribution center in Germany. Attends Europe has approximately 458 employees. The results of Attends Europe’s operations have been included in the consolidated financial statements since March 1, 2012, and are presented in the Personal Care reportable segment. The purchase price was $232 million (€173 million) in cash, including working capital, net of acquired cash of $4 million (€3 million). The acquisition was accounted for as a business combination under the acquisition method of accounting, in accordance with the Business Combinations Topic of FASB ASC.
The total purchase price was allocated to tangible and intangible assets acquired and liabilities assumed based on the Company’s estimates of their fair value, which are based on information currently available. During the fourth quarter of 2012, the Company completed the evaluation of all assets and liabilities.
DOMTAR CORPORATION
NOTES TO CONSOLIDATED FINANCIAL STATEMENTS
DECEMBER 31, 2012
(IN MILLIONS OF DOLLARS, UNLESS OTHERWISE NOTED)
NOTE 3. ACQUISITION OF BUSINESSES (CONTINUED)
The table below illustrates the purchase price allocation:
Fair value of net assets acquired at the date of acquisition | ||||||||
Receivables | $ | 21 | ||||||
Inventory | 22 | |||||||
Property, plant and equipment | 67 | |||||||
Intangible assets (Note 14) | ||||||||
Trade names(1) | 54 | |||||||
Customer relationships(2) | 71 | |||||||
| 125 | ||||||||
Goodwill (Note 12) | 71 | |||||||
|
| |||||||
Total assets | 306 | |||||||
Less: Liabilities | ||||||||
Trade and other payables | 27 | |||||||
Capital lease obligation | 6 | |||||||
Deferred income tax liabilities and unrecognized tax benefits | 38 | |||||||
Pension | 3 | |||||||
|
| |||||||
Total liabilities | 74 | |||||||
Fair value of net assets acquired at the date of acquisition | 232 | |||||||
| (1) | Indefinite useful life. |
| (2) | The useful life of the Customer relationships acquired is 30 years. |
Attends Healthcare Inc.
On September 1, 2011, Domtar Corporation completed the acquisition of 100% of the outstanding shares of Attends Healthcare Inc. (“Attends US”). Attends US sells and markets a complete line of adult incontinence care products and distributes washcloths marketed primarily under the Attends® brand name. The company has a wide product offering and it serves a diversified customer base in multiple channels throughout the United States and Canada. Attends US has approximately 320 employees and the production facility is located in Greenville, North Carolina. The results of Attends US’ operations have been included in the consolidated financial statements since September 1, 2011, and are presented in the Personal Care reportable segment. The purchase price was $288 million in cash, including working capital, net of acquired cash of $12 million. The acquisition was accounted for as a business combination under the acquisition method of accounting, in accordance with the Business Combinations Topic of FASB ASC.
The total purchase price was allocated to tangible and intangible assets acquired and liabilities assumed based on the Company’s estimates of their fair value, which are based on information currently available. During the fourth quarter of 2011, the Company completed the evaluation of all assets and liabilities.
DOMTAR CORPORATION
NOTES TO CONSOLIDATED FINANCIAL STATEMENTS
DECEMBER 31, 2012
(IN MILLIONS OF DOLLARS, UNLESS OTHERWISE NOTED)
NOTE 3. ACQUISITION OF BUSINESSES (CONTINUED)
The table below illustrates the purchase price allocation:
Fair value of net assets acquired at the date of acquisition | ||||||||
Receivables | $ | 12 | ||||||
Inventory | 17 | |||||||
Property, plant and equipment | 54 | |||||||
Intangible assets (Note 14) | ||||||||
Trade names(1) | 61 | |||||||
Customer relationships(2) | 93 | |||||||
| 154 | ||||||||
Goodwill (Note 12) | 163 | |||||||
Other assets | 4 | |||||||
|
| |||||||
Total assets | 404 | |||||||
Less: Liabilities | ||||||||
Trade and other payables | 15 | |||||||
Income and other taxes payable | 2 | |||||||
Capital lease obligation | 31 | |||||||
Deferred income tax liabilities and unrecognized tax benefits | 66 | |||||||
Other liabilities | 2 | |||||||
|
| |||||||
Total liabilities | 116 | |||||||
Fair value of net assets acquired at the date of acquisition | 288 | |||||||
| (1) | Indefinite useful life. |
| (2) | The useful life of the Customer relationships acquired is 40 years. |
For all acquisitions, goodwill represents the future economic benefit arising from other assets acquired that could not be individually identified and separately recognized. The goodwill is attributable to the general reputation of the business, the assembled workforce, and the expected future cash flows of the business. Disclosed goodwill is not deductible for tax purposes. Pro forma results have not been provided, as these acquisitions have no material impact on the Company.
IMPAIRMENT AND WRITE-DOWN OF PROPERTY, PLANT AND EQUIPMENT
AND INTANGIBLE ASSETS
We review intangible assets and property, plant and equipment for impairment upon the occurrence of events or changes in circumstances indicating that, at the lowest level of determinable cash flows, the carrying value of the intangible and long-lived assets may not be recoverable.
Estimates of undiscounted future cash flows used to test the recoverability of the fixed assets included key assumptions related to selling prices, inflation-adjusted cost projections, forecasted exchange rate for the U.S. dollar when applicable and the estimated useful life of the fixed assets.
DOMTAR CORPORATION
NOTES TO CONSOLIDATED FINANCIAL STATEMENTS
DECEMBER 31, 2012
(IN MILLIONS OF DOLLARS, UNLESS OTHERWISE NOTED)
NOTE 4. IMPAIRMENT AND WRITE-DOWN OF PROPERTY, PLANT AND EQUIPMENT AND INTANGIBLE ASSETS (CONTINUED)
IMPAIRMENT OF PROPERTY, PLANT AND EQUIPMENT
Kamloops, Closure of a pulp machine
During the fourth quarter of 2012, the Company announced that it will permanently shut down one pulp machine at its Kamloops pulp mill. This decision will result in a permanent curtailment of the Company’s annual pulp production by approximately 120,000 air-dried metric tons of sawdust softwood pulp, and will affect approximately 125 employees. These measures are expected to be in place by the end of March 2013.
The Company recognized a $5 million write-down of property, plant and equipment and $2 million of accelerated depreciation, included in Impairment and write-down of property, plant and equipment and intangible assets, with respect to the assets that will cease productive use in March 2013, when the shut-down is completed. The Company expects to record an additional $12 million of accelerated depreciation over the first 3 months of 2013 in relation to these assets. Given the decision to close the pulp machine, the Company assessed its ability to recover the carrying value of the Kamloops mill from the undiscounted estimated future cash flows. The Company concluded that the undiscounted estimated future cash flows associated with the long-lived assets exceeded their carrying value and, as such, no additional impairment charge was required.
Mira Loma, California converting plant
During the first quarter of 2012, the Company recorded a $2 million write-down of property, plant and equipment at its Mira Loma location, in Impairment and write-down of property, plant and equipment and intangible assets.
Ashdown, Arkansas pulp and paper mill—Closure of a paper machine
As a result of the decision to permanently shut down one of four paper machines on March 29, 2011, the Company recognized $73 million of accelerated depreciation, included in Impairment and write-down of property, plant and equipment and intangible assets, in 2011. Given the substantial decline in the period.
For purposes ofproduction capacity, at its Ashdown mill, the Company conducted a quantitative impairment testing, goodwill must be assigned to one or more of our reporting units. We test goodwill at the reporting unit level. All goodwill, as of December 30, 2007, resided in the Papers segment and based upon the impairment test conducted in the fourth quarter of 2008, as described below, was determined to be impaired2011 and written-off.
Step I Impairment Test
We determinedconcluded that the discounted cash flow method (“DCF”) was the most appropriate approach to determine fair valuerecognition of the Papers reporting unit. We have developed our projection of estimated future cash flowsan impairment loss for the period from 2009 to 2013 (the “Forecast Period”) to serve as the basis of the DCF as well as a terminal value. In doing so, we have used a number of key assumptions and benchmarks that are discussed under “Key Assumptions” below. Our discounted future cash flow analysis resulted in a fair value of the reporting unit below the carrying value of the Papers reporting units net assets.
In order to evaluate the appropriateness of the conclusions of our Step I impairment test, our estimated fair value as a wholeAshdown mill’s remaining long-lived assets was reconciled to our market capitalization and compared to selected transactions involving the sale of comparable companies.not required.
Step II Lebel-sur-Quévillon Pulp Mill and Sawmill—Impairment Testof assets
In Step IIthe fourth quarter of 2008, the Company decided to permanently shut down the Lebel-sur-Quévillon pulp mill and sawmills. In 2011, following the signing of a definitive agreement, the Company recorded a $12 million impairment and write-down of property, plant and equipment relating to the remaining assets’ net book value. During the second quarter of 2012, the Company sold its pulp and sawmill assets to Fortress Global Cellulose Ltd. (“Fortress”) and its lands related to those assets to a subsidiary of the impairment test, the estimated fair valueGovernment of Quebec.
Plymouth Pulp and Paper Mill—Conversion to Fluff Pulp
In 2010, as a result of the Papers reporting unit, determined in Step I, was allocateddecision to its tangiblepermanently shut down the remaining paper machine and identified intangible assets, based on their relative fair values, in orderconvert the Plymouth facility to arrive at the fair value of goodwill. To this end, different valuation techniques were used to determine the fair values of individual tangible and intangible assets. A depreciated replacement cost method was mainly used to determine the fair value of fixed assets to the extent such values did not have economic obsolescence. Economic obsolescence was based on cash flow projections. For idled mills of the Papers reporting unit, liquidation or salvage values were largely used as an indication of the fair values of their assets. The fair value of identified intangible assets, mainly consisting of marketing, customer and contract-related assets, were determined using an income approach.
The impairment test concluded that goodwill was impaired and we recorded a non-cash impairment charge of $321 million100% fluff pulp production in the fourth quarter of 2008 to reflect2009, the complete write-off of the goodwill.Company recognized in
DOMTAR CORPORATION
Key AssumptionsNOTES TO CONSOLIDATED FINANCIAL STATEMENTS
The various valuation techniques used in Steps I and II incorporate a number of assumptions that we believed to be reasonable and to reflect forecasted market conditions at the valuation date. Assumptions in estimating future cash flows were subject to a high degree of judgement. We made all efforts to forecast future cash flows as accurately as possible with the information available at the time a forecast was made. To this end, we evaluated the appropriateness of our assumptions as well as our overall forecasts by comparing projected results of upcoming years with actual results of preceding years and validating those differences therein were reasonable. Key assumptions related to: prices trends, material and energy costs, the discount rate, rate of decline of demand, the terminal growth rate, and foreign exchange rates. A number of benchmarks from independent industry and other economic publications were used in order to develop projections for the forecast period. Examples of such benchmarks and other assumptions included:DECEMBER 31, 2012
(IN MILLIONS OF DOLLARS, UNLESS OTHERWISE NOTED)
Revenues—the evolution of pulp and paper pricing over the forecast period was based on data from RISI.NOTE 4. IMPAIRMENT AND WRITE-DOWN OF PROPERTY, PLANT AND EQUIPMENT AND INTANGIBLE ASSETS (CONTINUED)
Direct costs mainly consistedImpairment and write-down of fiber, wood, chemicalproperty, plant and energy costs. The evolutionequipment and intangible assets, a $1 million write-down to the related paper machine and $39 million of these direct costs over the forecast period was based on data from a number of benchmarks related to: selling prices of pulp, oil prices, housing starts, US producer price index, mixed chemical index, corn, natural gas, coal and electricity.
Foreign exchange rate estimates were based on a number of economic forecasts including those of Consensus Economics, Inc.
Discount rate—The discount rate used to determine the present value of the Papers reporting unit’s forecasted cash flows represented our weighted average cost of capital (“WACC”). Our WACC was determined to be between 10.5% and 11%.
Rate of decline of demand and terminal growth rate—we assumed that a number of business and commercial papers would see demand declines in line with industry expectations. This was reflected in our assumptions in the rate of decline in demand over the forecast period as well as in our assumption of the terminal growth rate.
Pension Plans and Other Post-Retirement Benefit Plans
We have several defined contribution plans and multi-employermultiemployer plans. The pension expense under these plans is equal to our contribution. PensionDefined contribution pension expense was $25$24 million for the year ended December 31, 2010 ($2012 (2011—$24 million in 2009 and $21 million in 2008)2010—$25 million).
We have severalsponsor both contributory and non-contributory U.S. and non-U.S. defined benefit pension plans covering substantiallythat cover the majority of our employees. Non-unionized employees in Canada joining the Company after June 1, 2000, participate in defined contribution pension plans. Salaried employees in the U.S. joining the Company after January 1, 2008 participate in a defined contribution pension plan. Also, starting on January 1, 2013, all employees. Inunionized employees covered under the agreement with the United States, this includesSteel Workers not grandfathered under the existing defined benefit pension plans that are qualified under the Internal Revenue Code (“qualified”) as well aswill transition to a defined contribution pension plan that provides benefits in addition to those provided under the qualifiedfor future service. We also sponsor a number of other post-retirement benefit plans for a select group of employees, which is not qualified under the Internal Revenue Code (“unqualified’). In Canada, plans are registered under the Income Tax Acteligible U.S. and under their respective provincial pension acts (“registered”), or plans may provide additional benefits to a select group of employees, and not be registered under the Income Tax Act or provincial pension acts (“non-registered”). The defined benefit plans are generally contributory in Canada and non-contributory in the United States. We also provide post-retirement plans to eligible Canadian and U.S.non-U.S. employees; the plans are unfunded and include life insurance programs, medical and dental benefits and short-term and long-term disability programs. Thebenefits. We also provide supplemental unfunded defined benefit pension and other post-retirement expense and the related obligations are actuarially determined using management’s most probable assumptions.plans to certain senior management employees.
We account for pensions and other post-retirement benefits in accordance with Compensation-Retirement Benefits Topic of the Financial Accounting Standards Board-Accounting Standards Committee (“FASB ASCASC”) which requires employers to recognize the overfunded or underfunded status of defined benefit pension plans as an asset or liability in its Consolidated Balance Sheets. Pension and other post-retirement benefit assumptions include the discount rate, the expected long-term rate of return on plan assets, the rate of compensation increase, health care cost trend rates, mortality rates, employee early retirements and terminations or disabilities. Changes in these assumptions result in actuarial gains or losses which we have elected to amortizeamortized over the expected average remaining service life of the active employee group covered by the plans only to the extent that the unrecognized net actuarial gains and losses are in excess of 10% of the greater of the accrued benefit obligation and the market-related value of plan assets at the beginning of the year.year over the average remaining service period of approximately 9 years of the active employee group covered by the pension plans and 10 years of the active employee group covered by the other post-retirement benefits plan.
An expected rate of return on plan assets of 7.0%6.0% was considered appropriate by our management for the determination of pension expense for 2010.2012. Effective January 1, 2011,2013, we will use 6.75%5.5%, 7.2% and 3.5% as the expected return on plan assets for Canada, the United States and Europe, which reflects the current view of long-term investment returns. The overall expected long-term rate of return on plan assets is based on management’s best estimate of the long-term returns of the major asset classes (cash and cash equivalents, equities and bonds) weighted by the actual allocation of assets at the measurement date, net of expenses. This rate includes an equity risk premium over government bond returns for equity investments and a value-added premium for the contribution to returns from active management.
We set our discount rate assumption annually to reflect the rates available on high-quality, fixed income debt instruments, with a duration that is expected to match the timing and amount of expected benefit payments. High-quality debt instruments are corporate bonds with a rating of AA or better. The discount rates at December 31, 20102012, for pension plans were estimated at 5.5%4.1% for the accrued benefit obligation and 6.3%4.8% for the net periodic benefit cost for 20102012 and for post-retirement benefit plans were estimated at 5.5%4.2% for the accrued benefit obligation and 6.4%2.9% for the net periodic benefit cost for 2010.2012.
The rate of compensation increase is another significant assumption in the actuarial model for pension (set at 2.7% for the accrued benefit obligation and 2.9%2.8% for the net periodic benefit cost) and for post-retirement benefits (set at 2.8% for the accrued benefit obligation and 2.8% for the net periodic benefit cost) and is determined based upon our long-term plans for such increases.
For measurement purposes, a 6.2%5.4% weighted-average annual rate of increase in the per capita cost of covered health care benefits was assumed for 2011.2013. The rate was assumed to decrease gradually to 4.1% by 20282033 and remain at that level thereafter.
The following table provides a sensitivity analysis of the key weighted average economic assumptions used in measuring the accrued pension benefit obligation, the accrued other post-retirement benefit obligation and related net periodic benefit cost for 2011.2012. The sensitivity analysis should be used with caution as it is hypothetical and changes in each key assumption may not be linear. The sensitivities in each key variable have been calculated independently of each other.
SENSITIVITY ANALYSISSensitivity Analysis
| PENSION | OTHER POST-RETIREMENT BENEFIT | |||||||||||||||
PENSION AND OTHER POST-RETIREMENT BENEFIT PLANS | ACCRUED BENEFIT OBLIGATION | NET PERIODIC BENEFIT COST | ACCRUED BENEFIT OBLIGATION | NET PERIODIC BENEFIT COST | ||||||||||||
| (In millions of dollars) | ||||||||||||||||
Expected rate of return on assets | ||||||||||||||||
Impact of: | ||||||||||||||||
1% increase | N/A | ($13 | ) | N/A | N/A | |||||||||||
1% decrease | N/A | 13 | N/A | N/A | ||||||||||||
Discount rate | ||||||||||||||||
Impact of: | ||||||||||||||||
1% increase | ($177 | ) | (12 | ) | ($12 | ) | ($1 | ) | ||||||||
1% decrease | 202 | 17 | 15 | 1 | ||||||||||||
Assumed overall health care cost trend | ||||||||||||||||
Impact of: | ||||||||||||||||
1% increase | N/A | N/A | 4 | — | ||||||||||||
1% decrease | N/A | N/A | (8 | ) | (1 | ) | ||||||||||
| PENSION | OTHER POST-RETIREMENT BENEFIT | |||||||||||||||
PENSION AND OTHER POST-RETIREMENT | ACCRUED BENEFIT OBLIGATION | NET PERIODIC BENEFIT COST | ACCRUED BENEFIT OBLIGATION | NET PERIODIC BENEFIT COST | ||||||||||||
| (in millions of dollars) | ||||||||||||||||
Expected rate of return on assets | ||||||||||||||||
Impact of: | ||||||||||||||||
1% increase | N/A | ($16 | ) | N/A | N/A | |||||||||||
1% decrease | N/A | 16 | N/A | N/A | ||||||||||||
Discount rate | ||||||||||||||||
Impact of: | ||||||||||||||||
1% increase | ($211 | ) | (15 | ) | ($14 | ) | (1 | ) | ||||||||
1% decrease | 246 | 20 | 18 | 1 | ||||||||||||
Assumed overall health care cost trend | ||||||||||||||||
Impact of: | ||||||||||||||||
1% increase | N/A | N/A | 10 | 1 | ||||||||||||
1% decrease | N/A | N/A | (9 | ) | (1 | ) | ||||||||||
The assets of the pension plans are held by a number of independent trustees and are accounted for separately in our pension funds. Our investment strategy for the assets in the pension plans is to maintain a diversified portfolio of assets, investedinvest in a prudent manner to maintain the security of funds while maximizing returns within the guidelines provided in the investment policy. The Company’sDiversification of the pension plans’ holdings is maintained in order to reduce the pension plans’ annual return variability, reduce market exposure and credit exposure to any single issuer and to any single component of the capital markets, to reduce exposure to unexpected inflation, to enhance the long-term risk-adjusted return potential of the pension plans and to reduce funding risk. Our pension funds are not permitted to own any of the Company’s shares or debt instruments. The target asset allocation is based on the expected duration of the benefit obligation.
The following table shows the allocation of the plan assets, based on the fair value of the assets held and the target allocation for 2010:2012:
ALLOCATION OF PLAN ASSETSat December 31 | TARGET ALLOCATION | PERCENTAGE PLAN ASSETS AT DECEMBER 31, 2010 | PERCENTAGE PLAN ASSETS AT DECEMBER 31, 2009 | |||||||||||||||||||||
| (in %) | Target allocation | Percentage of plan assets at December 31, 2012 | Percentage of plan assets at December 31, 2011 | |||||||||||||||||||||
Fixed income | ||||||||||||||||||||||||
Cash and cash equivalents | 0% – 10% | 3 | % | 8 | % | 0% – 10% | 4 | % | 5 | % | ||||||||||||||
Bonds | 53% – 63% | 58 | % | 51 | % | 51% – 61% | 55 | % | 58 | % | ||||||||||||||
Equity | ||||||||||||||||||||||||
Canadian equity | 7% – 15% | 11 | % | 13 | % | |||||||||||||||||||
U.S. equity | 7% – 17% | 14 | % | 17 | % | |||||||||||||||||||
International equity | 13% – 23% | 14 | % | 11 | % | |||||||||||||||||||
Canadian Equity | 7% – 15% | 11 | % | 10 | % | |||||||||||||||||||
US Equity | 8% – 18% | 12 | % | 12 | % | |||||||||||||||||||
International Equity | 14% – 24% | 18 | % | 15 | % | |||||||||||||||||||
|
| |||||||||||||||||||||||
Total(1) | 100 | % | 100 | % | 100 | % | 100 | % | ||||||||||||||||
|
| |||||||||||||||||||||||
| (1) |
Our pension plan funding policy is to contribute annually the amount required to provide for benefits earned in the year, and to fund both solvency deficiencies, funding shortfalls and past service obligations over periods not exceeding those permitted by the applicable regulatory authorities. Past service obligations primarily arise from improvements to plan benefits. The other post-retirement benefit plans are not funded and contributions are made annually to cover benefit payments. We expect to contribute a minimum total amount of $53$25 million in 20112013 compared to $161$86 million in 2010 (2009—2012 (2011—$13095 million) to the pension plans. The payments made in 20102012 to the other post-retirement benefit plans amounted to $8$7 million (2009—(2011—$8 million).
The estimated future benefit payments from the plans for the next ten years at December 31, 20102012 are as follows:
ESTIMATED FUTURE BENEFIT PAYMENTS FROM THE PLANS | PENSION PLANS | OTHER POST- RETIREMENT BENEFIT PLANS | PENSION PLANS | OTHER POST- RETIREMENT BENEFIT PLANS | ||||||||||||
| (in millions of dollars) | ||||||||||||||||
2011 | $ | 101 | $ | 7 | ||||||||||||
2012 | 101 | 7 | ||||||||||||||
| (in millions of dollars) | ||||||||||||||||
2013 | 130 | 7 | $ | 152 | $ | 5 | ||||||||||
2014 | 106 | 8 | 102 | 7 | ||||||||||||
2015 | 108 | 7 | 105 | 7 | ||||||||||||
2016 – 2020 | 596 | 37 | ||||||||||||||
2016 | 108 | 7 | ||||||||||||||
2017 | 111 | 6 | ||||||||||||||
2018 – 2022 | 600 | 34 | ||||||||||||||
Asset Backed Commercial PaperNotes
At December 31, 2010, Domtar Corporation’s2012, our Canadian defined benefit pension funds held restructured asset backed notes (“ABN”) (formerly asset backed commercial paper (“ABCP”)) valued at $214$213 million (CDN$213211 million). At December 31, 2009, the2011, our plans held ABCP investmentsABN valued at $205 million (CDN$214208 million). During 2010,2012, the total value of the notesABN benefited from an increase in value of $41 million (CDN$40 million). For the same period, the total value of the ABN was reduced by repayments and sales totalling $37 million (CDN$37 million), partially offset by the $4 million impact of an increase in the value of the Canadian dollar of $9 million, and an increase in market value of $20 million (CDN$21 million). Repayments and sales in 2010 totalled $20 million (CDN$21 million).dollar.
Most of these investments (90%ABN, with a current value of the market value (2009—91% of the market value)$193 million (2011—$178 million; 2010—$193 million), were subject to restructuring under the court order governing the Montreal Accord that was completed in January 2009, while2009. About $177 million of these notes (nominal value $213 million) are expected to mature in four years. These notes are valued based upon current market quotes. The market values are supported by the remainder are in conduits restructured outsidevalue of the Montreal Accord or subject to litigation between the sponsor and the credit counterparty.
There is no active, liquid quoted market for the ABCPunderlying investments held by the Company’s pension plan.issuing conduit. The fairvalues for the $16 million (nominal value $39 million) of the ABCP notes is mainly based on a financial model incorporating uncertainties regarding return, credit spreads, the nature and credit risk of underlying assets, the amounts and timing of cash inflows and the limited market for new notes as at December 31, 2010.
The largest conduit owned by the pension plans in the Montreal Accord consists mainly of collateral investmentsremaining ABN, that back credit default derivatives that protect counterparties against credit defaults above a specified threshold on different portfolios of corporate credits. The valuation methodology was based upon determining an appropriate credit spread for each class of notes based upon the implied protection level provided by each class against potential credit defaults. This was done by comparison to spreads for an investment grade credit default index and the comparable tranches within the index for equivalent credit protection. In addition, a liquidity premium of 1.75% was added to this spread. The resulting spread was used to calculate the present value of all such notes, based upon the anticipated maturity date. An additional discount of 2.5% was applied to reflect uncertainty over collateral values held to support the derivative transactions. An increase in the discount rate of 1% would reduce the value by $7 million (CDN$7 million) for these notes.
The value of the remaining notes thatalso were subject to the Montreal Accord, were sourced either from the asset manager of these notes,the ABN, or from trading values for similar securities of similar credit quality. The conduits outside
An additional $20 million of ABN (nominal value $38 million) were restructured separately from the Montreal Accord, which also provide protection to counterparties against credit defaults through derivatives, wereAccord. They are valued based upon the value of the collateral valueinvestments held in the conduit net ofissuer, reduced by the marketnegative value of the credit default derivatives, as provided by the sponsor of the conduit, with an additional discount (equivalent to 1.75% per annum) applied for illiquidity. One conduit stillApproximately $11 million of these notes (nominal value $11 million) are expected to mature at par in late 2013 with the remaining $9 million of notes (nominal value $12 million) maturing in 2016. The outcome for a zero-value note (nominal value $15 million), remains subject to litigation was valued at zero.the outcome of ongoing litigation.
Possible changes that could have a material effect onimpact the future value of the ABCP includeABN include: (1) changes in the value of the underlying assets and the related derivative transactions, (2) developments related to the liquidity of the ABCPABN market, and (3) a severe and prolonged economic slowdown in North America and the bankruptcy of referenced corporate credits.credits, and (4) the passage of time, as most of the notes will mature by early 2017.
Multiemployer Plans
We do not expect liquidity issuescontribute to affectseven multiemployer defined benefit pension plans under the pension funds since pension fund obligationsterms of collective agreements that cover certain Canadian union-represented employees (Canadian multiemployer plans) and certain U.S. union-represented employees (U.S. multiemployer plans). The risks of participating in these multiemployer plans are primarily long-term in nature. Lossesdifferent from single-employer plans in the following aspects:
| a) | assets contributed to the multiemployer plan by one employer may be used to provide benefits to employees of other participating employers; |
| b) | for the U.S. multiemployer plans, if a participating employer stops contributing to the plan, the unfunded obligations of the plan are borne by the remaining participating employers; and |
| c) | for the U.S. multiemployer plans, if we choose to stop participating in some of our multiemployer plans, we may be required to pay those plans an amount based on the underfunded status of the plan, referred to as a withdrawal liability. |
Our participation in these plans for the annual periods ended December 31 is outlined in the table below. The plan’s 2012 and 2011 actuarial status certification was completed as of January 1, 2012 and January 1, 2011 respectively, and is based on the plan’s actuarial valuation as of December 31, 2011 and December 31, 2010 respectively. This represents the most recent Pension Protection Act (“PPA”) zone status available. The zone status is based on information received from the plan and is certified by the plan’s actuary. One significant plan is in the red zone, which means it is less than 65% funded and requires a financial improvement plan (“FIP”) or a rehabilitation plan (“RP”).
| Pension Protection Act Zone Status | Contributions from Domtar to Multiemployer (c) | Expiration date of collective bargaining agreement | ||||||||||||||||||||||||||||||||||
Pension Fund | EIN / Pension Plan Number | 2012 | 2011 | FIP / RP Status Pending / Implemented | 2012 | 2011 | 2010 | Surcharge imposed | ||||||||||||||||||||||||||||
U.S. Multiemployer Plans | $ | $ | $ | |||||||||||||||||||||||||||||||||
PACE Industry Union- | ||||||||||||||||||||||||||||||||||||
Management Pension Fund(a) | 11-6166763-001 | Red | Red | Yes - Implemented | 3 | 3 | 3 | Yes | January 27, 2015 | |||||||||||||||||||||||||||
Canadian Multiemployer Plans | ||||||||||||||||||||||||||||||||||||
Pulp and Paper Industry | ||||||||||||||||||||||||||||||||||||
Pension Plan(b) | N/A | N/A | N/A | N/A | 2 | 3 | 2 | N/A | April 30, 2017 | |||||||||||||||||||||||||||
|
|
|
|
|
| |||||||||||||||||||||||||||||||
| Total | 5 | 6 | 5 | |||||||||||||||||||||||||||||||||
Total contributions made to all plans that are not individually significant |
| 1 | 1 | 1 | ||||||||||||||||||||||||||||||||
|
|
|
|
|
| |||||||||||||||||||||||||||||||
Total contributions made to all plans |
| 6 | 7 | 6 | ||||||||||||||||||||||||||||||||
|
|
|
|
|
| |||||||||||||||||||||||||||||||
| (a) | We withdrew from PACE Industry Union-Management Pension Fund effective December 31, 2012. |
| (b) | In the event that the Canadian multiemployer plan is underfunded, the monthly benefit amount can be reduced by the trustees of the plan. Moreover, we are not responsible for the underfunded status of the plan because the Canadian multiemployer plans do not require participating employers to pay a withdrawal liability or penalty upon withdrawal. |
| (c) | For each of the three years presented, our contributions to each multiemployer plan do not represent more than five percent of total contributions to each plan as indicated in the plan’s most recently available annual report. |
In 2011, we decided to withdraw from one of our multiemployer pension plans and recorded a withdrawal liability and a charge to earnings of $32 million. In 2012, as a result of a revision in the estimated withdrawal liability, we recorded a further charge to earnings of $14 million. Also in 2012, we withdrew from a second multiemployer pension plan and recorded a withdrawal liability and a charge to earnings of $1 million. While this is our best estimate of the ultimate cost of the withdrawal from these plans at December 31, 2012, additional withdrawal liabilities may be incurred based on the final fund investments, if any, would resultassessment expected to occur in future increased contributionsthe second quarter of 2013. Further, we remain liable for potential additional withdrawal liabilities to the fund in the event of a mass withdrawal, as defined by us or our Canadian subsidiaries. Additional contributionsstatute, occurring anytime within the next three years. Refer to these pension funds would be required to be paid over five-year or ten-year periods, depending upon applicable provincial jurisdictionPart II, Item 8, Financial Statement and its requirements for amortization. Losses, if any, would also impact operating earnings over a longer periodSupplementary Data of timethis Annual Report on Form 10-K, under Note 16 “Closure and immediately increase liabilitiesRestructuring Costs and reduce equity.Liability.”
Income Taxes
We use the asset and liability method of accounting for income taxes. Under this method, deferred tax assets and liabilities are determined according to differences between the carrying amounts and tax bases of the assets and liabilities. The change in the net deferred tax asset or liability is included in earnings. Deferred tax assets and liabilities are measured using enacted tax rates and laws expected to apply in the years in which assets and liabilities are expected to be recovered or settled. For these years, a projection of taxable income and an assumption of the ultimate recovery or settlement period for temporary differences are required. The projection of future taxable income is based on management’s best estimate and may vary from actual taxable income.
On a quarterly basis, we assess the need to establish a valuation allowance for deferred tax assets and, if it is deemed more likely than not that our deferred tax assets will not be realized based on these taxable income projections, a valuation allowance is recorded. In general, “realization” refers to the incremental benefit achieved through the reduction in future taxes payable or an increase in future taxes refundable from the deferred tax assets. Evaluating the need for an amount of a valuation allowance for deferred tax assets often requires significant judgment. All available evidence, both positive and negative, should be considered to determine whether, based on the weight of that evidence, a valuation allowance is needed.
As of December 31, 2009, the Company had a valuation allowance of $164 million on its Canadian net deferred tax assets, which primarily consisted of net operating losses, scientific research and experimental development expenditures not previously deducted and un-depreciated tax basis of property, plant, and equipment. Evaluating the need for an amount of a valuation allowance for deferred tax assets often requires significant judgment. All available evidence, both positive and negative, is considered when determining whether, based on the weight of that evidence, a valuation allowance is needed. Specifically, we evaluated the following items:
Historical income/(losses)—particularly the most recent three-year period
Reversals of future taxable temporary differences
Projected future income/(losses)
Tax planning strategies
Divestitures
In our evaluation process, we give the most weight to historical income or losses. During the fourth quarter of 2010, afterAfter evaluating all available positive and negative evidence, although realization is not assured, we determined that it is more likely than not that the Canadian netresults of future operations will generate sufficient taxable income to realize the deferred tax assets, will be fully realizedwith the exception of certain foreign loss carryforwards for which a valuation allowance of $10 million was recorded in the future prior to expiration. Key factors contributing to this conclusion that the positive evidence ultimately outweighed the existing negative evidence during the fourth quarter2012, and certain state credits for which a valuation allowance of 2010 included the fact that the Canadian operations, excluding the loss-generating Wood business (sold to a third party on June 30, 2010) and elements of other comprehensive income, went from a three-year cumulative loss position to a three-year cumulative income position during the fourth quarter of 2010; we have been able to demonstrate continual profitability throughout 2010 and are projected to continue to be profitable$4 million was recorded in the coming years.2011.
Our short-term deferred tax assets are mainly composed of temporary differences related to various accruals, accounting provisions, as well as a portion of our net operating loss carry forwardscarryforwards and available tax credits. The majority of these items are expected to be utilized or paid out over the next year. Our long-term deferred tax assets and liabilities are mainly composed of temporary differences pertaining to plant, equipment, pension and post-retirement liabilities, the remaining portion of net operating loss carry forwardscarryforwards and other tax attributes, and other items. Estimating the ultimate settlement period requires judgment and our best estimates. The reversal of timing differences is expected at enacted tax rates, which could change due to changes in income tax laws or the introduction of tax changes through the presentation of annual budgets by different governments. As a result, a change in the timing and the income tax rate at which the components will reverse could materially affect deferred tax expense in our future results of operations.
In addition, AmericanU.S. and Canadianforeign tax rules and regulations are subject to interpretation and require judgment that may be challenged by taxation authorities. To the best of our knowledge, we have adequately provided for our future tax consequences based upon current facts and circumstances and current tax law. In accordance with Income Taxes Topic of FASB ASC 740, we evaluate new tax positions that result in a tax benefit to the Companyus and
determine the amount of tax benefits that can be recognized. The remaining unrecognized tax benefits are evaluated on a quarterly basis to determine if changes in recognition or classification are necessary. Significant changes in the amount of unrecognized tax benefits expected within the next 12 months are disclosed quarterly. Future recognition of unrecognized tax benefits would impact the effective tax rate in the period the benefits are recognized. At December 31, 2010,2012, we had gross unrecognized tax benefits of $242$254 million. If our income tax positions with respect to the alternative fuel mixture tax credits are sustained, either all or in part, then we would recognize a tax benefit in the future equal to the amount of the benefits sustained. Our tax treatment of the income related to the alternative fuel mixture tax credits resulted in the recognition of a tax benefit of $2 million in 2010, ($36 million in 2009) which impacted the U.S. effective tax rate. This credit expired December 31, 2009. Refer to Part II, Item 8, Financial Statements and Supplementary Data Note 9, of this Annual Report on Form 10-K, under Note 10 “Income taxes” for detaildetails on the unrecognized tax benefits.
Cellulosic Biofuel Credit
In July 2010, the U.S. IRS Office of Chief Counsel released an Advice Memorandum concluding that qualifying cellulosic biofuel sold or used before January 1, 2010, is eligible for the CBPC and would not be required to be registered by the Environmental Protection Agency. Each gallon of qualifying cellulose biofuel produced by any taxpayer operating a pulp and paper mill and used as a fuel in the taxpayer’s trade or business during calendar year 2009 would qualify for the $1.01 non-refundable CBPC. A taxpayer could be able to claim the credit on its federal income tax return for the 2009 tax year upon the receipt of a letter of registration from the IRS and any unused CBPC could be carried forward until 2016 to offset a portion of federal taxes otherwise payable.
We had approximately 207 million gallons of cellulose biofuel that qualified for this CBPC for which we had not previously claimed under the Alternative Fuel Tax Credit (“AFTC”) that represented approximately $209 million of CBPC or approximately $127 million of after tax benefit to the Corporation. In July 2010, we submitted an application with the IRS to be registered for the CBPC and on September 28, 2010, we received our notification from the IRS that we were successfully registered. On October 15, 2010 the IRS Office of Chief Counsel issued an Advice Memorandum concluding that the AFTC and CBPC could be claimed in the same year for different volumes of biofuel. In November 2010, we filed an amended 2009 tax return with the IRS claiming a cellulosic biofuel producer credit of $209 million and recorded a net tax benefit of $127 million in Income tax expense (benefit) on the Consolidated Statement of Earnings and Comprehensive Income for the year ended December 31, 2010. As of December 31, 2012, we have utilized all of the remaining credit.
Alternative Fuel Tax Credits
The U.S. Internal Revenue Code of 1986, as amended (the “Code”) permitted a refundable excise tax credit, until the end of 2009, for the production and use of alternative bio fuelbiofuel mixtures derived from biomass. We submitted an application with the IRS to be registered as an alternative fuel mixer and received notification that our registration had been accepted in late March 2009. We began producing and consuming alternative fuel mixtures in February 2009 at our eligible mills. InAlthough the credit ended at the end of 2009, in 2010, we recorded $25 million of such credits in Other operating (income) loss (income) on the Consolidated Statement of Earnings (Loss) compared to $498 million in 2009.and Comprehensive Income. The $25 million represented an adjustment to amounts presented as deferred revenue at December 31, 2009 and was released to income following guidance issued by the IRS in March 2010. We recorded an income tax expense of $7 million in 2010 compared to $162 million in 2009 related to the alternative fuel mixture income. The amounts for the refundable credits are based on the volume of alternative bio fuelbiofuel mixtures produced and burned during that period. The credit expired December 31, 2009.
In 2009,To date, we have received a $140$508 million cash refund and another $368 million cash refund,in refunds, net of federal income tax offsets,offsets.
There has been no change in 2010.our status with respect to the alternative fuel tax credits previously claimed but we continue to assess the possibility of converting some of these credits into additional CBPC. Any such conversion would require the repayment of any alternative fuel tax credit refund previously received in exchange for a credit to be used against future federal income tax.
As of December 31, 2012, we have gross unrecognized tax benefits and interest of $198 million and related deferred tax assets of $17 million associated with the alternative fuel tax credits claimed on our 2009 tax return. During the second quarter of 2012, the IRS began an audit of our 2009 U.S. income tax return. The completion of the audit by the IRS or the issuance of authoritative guidance will result in the release of the provision or settlement of the liability in cash of some or all of these previously unrecognized tax benefits. As of December 31, 2012, we had gross unrecognized tax benefits and interest of $198 million and related deferred tax assets of $17 million associated with the alternative fuel tax credit claims on our 2009 tax return. The recognition of these benefits, $181 million net of deferred taxes, would impact our effective tax rate. We reasonably expect the audit to be settled within the next 12 months which could result in a significant change to the amount of unrecognized tax benefits. However, audit outcomes and the timing of audit settlements are subject to significant uncertainty. Additional information regarding unrecognized tax benefits is included in Part II, Item 8, Financial Statements and Supplementary Data of this Annual Report on Form 10-K, under Note 910 “Income taxes.”
Cellulosic Biofuel Credit
In July 2010, the IRS Office of Chief Counsel released an Advice Memorandum concluding that qualifying cellulose biofuel sold or used before January 1, 2010, qualifies for the cellulosic biofuel producer credit (“CBPC”) and will not be required to be registered by the Environmental Protection Agency. Each gallon of qualifying cellulose biofuel produced by any taxpayer operating a pulp and paper mill and used as a fuel in the taxpayer’s trade or business during calendar year 2009 will qualify for the $1.01 non-refundable CBPC.
A taxpayer will be able to claim the credit on its federal income tax return for the 2009 tax year upon the receipt of a letter of registration from the IRS and any unused CBPC may be carried forward until 2015 to offset a portion of federal taxes otherwise payable.
We have approximately 207 million gallons of cellulose biofuel that qualifies for this CBPC for which we have not previously made claims under the Alternative Fuel Mixture Credit (“AFMC”) that represents approximately $209 million of CBPC or approximately $127 million of after tax benefit to the Corporation. In July 2010, we submitted an application with the IRS to be registered for the CBPC and on September 28, 2010, we received our notification from the IRS that we are successfully registered. On October 15, 2010 the IRS Office of Chief Counsel issued an Advice Memorandum concluding that the AFMC and CBPC could be claimed in the same year for different volumes of black liquor. In November 2010, we filed an amended 2009 tax return with the IRS claiming a cellulosic biofuel producer credit of $209 million and recorded a net tax benefit of $127 million in income tax expense (benefit) on the Consolidated Statement of Earnings (Loss). As of December 31, 2010, approximately $170 million of this credit remains to offset future U.S. federal income tax liability.
Closure and Restructuring Costs
Closure and restructuring costs are recognized as liabilities in the period when they are incurred and are measured at their fair value. For such recognition to occur, management, with the appropriate level of authority, must have approved and committed to a firm plan and appropriate communication to those affected must have occurred. These provisions may require an estimation of costs such as severance and termination benefits, pension and related curtailments, environmental remediation and may also include expenses related to demolition training and outplacement. Actions taken may also require an evaluation of any remaining assets to determine the required write-downs, if any, and a review of estimated remaining useful lives which may lead to accelerated depreciation expense.
Estimates of cash flows and fair value relating to closures and restructurings require judgment. Closure and restructuring costsliabilities are based on management’s best estimates of future events at December 31, 2010.2012. Closure and restructuring cost estimates are dependent on future events. Although we do not anticipate significant changes, the actual costs may differ from these estimates due to subsequent developments such as the results of environmental studies, the ability to find a buyer for assets set to be dismantled and demolished and other business developments. As such, additional costs and further working capital write-downsadjustments may be required in future periods.
| ITEM 7A. | QUANTITATIVE AND QUALITATIVE DISCLOSURE ABOUT MARKET RISK |
Our income can be impacted by the following sensitivities:
SENSITIVITY ANALYSIS | ||||||||
| (In millions of dollars, unless otherwise noted) | ||||||||
Each $10/unit change in the selling price of the following products:(1) | ||||||||
Each $10/unit change in the selling price of the following products1: | ||||||||
Papers | ||||||||
20-lb repro bond, 92 bright (copy) | $ | 13 | $ | 10 | ||||
50-lb offset, rolls | 1 | 2 | ||||||
Other | 21 | 21 | ||||||
Pulp—net position | 14 | 16 | ||||||
Foreign exchange, excluding depreciation and amortization (US $0.01 change in relative value to the Canadian dollar before hedging) | 10 | 9 | ||||||
Energy(2) | ||||||||
Energy 2 | ||||||||
Natural gas: $0.25/MMBtu change in price before hedging | 4 | 4 | ||||||
Crude oil: $10/barrel change in price before hedging | 1 | |||||||
| Based on estimated |
| Based on estimated |
Note that Domtarwe may, from time to time, hedge part of itsour foreign exchange, pulp, interest rate and energy positions, which may therefore impact the above sensitivities.
In the normal course of business, we are exposed to certain financial risks. We do not use derivative instruments for speculative purposes; although all derivative instruments purchased to minimize risk may not qualify for hedge accounting.
INTEREST RATE RISK
We are exposed to interest rate risk arising from fluctuations in interest rates on our cash and cash equivalents, bank indebtedness, bank credit facility and long-term debt. We may manage this interest rate exposure through the use of derivative instruments such as interest rate swap contracts.
CREDIT RISK
We are exposed to credit risk on the accounts receivable from our customers. In order to reduce this risk, we review new customers’ credit historieshistory before granting credit and conduct regular reviews of existing customers’ credit performance. As atof December 31, 2010 and December 31, 2009, we had no customer that represented more than 10%2012, one of our receivables, prior toPulp and Paper segment customers located in the effectUnited States represented 11% ($64 million) ((2011 – 9% ($58 million)) of receivables securitization.our total receivables.
We are also exposed to credit risk in the event of non-performance by counterparties to our financial instruments. We minimize this exposure by entering into contracts with counterparties that we believe to be of high credit quality. Collateral or other security to support financial instruments subject to credit risk is usually not obtained. We regularly monitor the credit standing of counterparties. Additionally, we are exposed to credit risk in the event of non-performance by our insurers. We minimize our exposure by doing business only with large reputable insurance companies.
COST RISK
Cash flow hedges
We purchase natural gas and oil at the prevailing market price at the time of delivery. In order to manage the cash flow risk associated with purchases of natural gas, and oil, we may utilize derivative financial instruments or physical purchases to fix the price of forecasted natural gas and oil purchases. We formally document the hedge relationships, including identification of the hedging instruments and the hedged items, the risk management
objectives and strategies for undertaking the hedge transactions, and the methodologies used to assess effectiveness and measure ineffectiveness. Current contracts are used to hedge forecasted purchases over the next threefive years. The effective portion of changes in the fair value of derivative contracts designated as cash flow hedges is recorded as a component of Accumulated other comprehensive loss within Shareholders’ equity, and is recognized in Cost of sales in the period in which the hedged transaction occurs.
The following table presents the volumes under derivative financial instruments for natural gas contracts outstanding as of December 31, 20102012 to hedge forecasted purchases:
Commodity | Notional contractual quantity under derivative contracts | Notional contractual value under derivative contracts (in millions of dollars) | Percentage of forecasted purchases under derivative contracts for | Notional contractual quantity under derivative contracts |
| Notional contractual value under derivative contracts (in millions of dollars) | Percentage of forecasted purchases under derivative contracts for | |||||||||||||||||||||||||||||||||||||||||||||
| 2011 | 2012 | 2013 | ||||||||||||||||||||||||||||||||||||||||||||||||||
Commodity | Notional contractual quantity under derivative contracts |
| Notional contractual value under derivative contracts (in millions of dollars) | 2013 | 2014 | 2015 | 2016 | |||||||||||||||||||||||||||||||||||||||||||||
| 6,690,000 | MMBTU | (1) | $ | 40 | 29 | % | 11 | % | 3 | % | 31 | % | 34 | % | 15 | % | 12 | % | ||||||||||||||||||||||||||||||||||
| (1) | MMBTU: Millions of British thermal units |
The natural gas derivative contracts were fully effective for accounting purposes as of December 31, 2010.2012. The critical terms of the hedging instruments and the hedged items match. As a result, there were no amounts reflected in the Consolidated Statements of Earnings and Comprehensive Income and Other comprehensive income for the year ended December 31, 20102012 resulting from hedge ineffectiveness (2009—(2011 and 2010 – nil).
FOREIGN CURRENCY RISK
Cash flow hedges
We have manufacturing and converting operations in the United States, Canada, Sweden and Canada.China. As a result, we are exposed to movements in the foreign currency exchange raterates in Canada. Also,Canada, Europe and Asia. Moreover, certain assets and liabilities are denominated in Canadian dollarscurrencies other than the U.S. dollar and are exposed to foreign currency movements. As a result,Therefore, our earnings are affected by increases or decreases in the value of the Canadian dollar and of other European and Asian currencies relative to the U.S. dollar. Our Swedish subsidiary is exposed to movements in foreign currency exchange rates on transactions denominated in a different currency than its Euro functional currency. Our risk management policy allows usit to hedge a significant portion of ourits exposure to fluctuations in foreign currency exchange rates for periods up to three years. We may use derivative instruments (currency options and foreign exchange forward contracts) to mitigate our exposure to fluctuations in foreign currency exchange rates. Foreign exchange forward contracts are contracts whereby we haverates or to designate them as hedging instruments in order to hedge the obligation to buy Canadian dollars at a specific rate. Currency options purchased are contracts whereby we havesubsidiary’s cash flow risk for purposes of the right, but not the obligation, to buy Canadian dollars at the strike rate if the Canadian dollar trades above that rate. Currency options sold are contracts whereby we have the obligation to buy Canadian dollars at the strike rate if the Canadian dollar trades below that rate.consolidated financial statements.
We formally document the relationship between hedging instruments and hedged items, as well as ourits risk management objectives and strategies for undertaking the hedge transactions. Foreign exchange forward contracts and currency options contracts used to hedge forecasted purchases in Canadian dollars by the Canadian subsidiary and forecasted sales in British Pound Sterling and forecasted purchases in U.S. dollars by the Swedish subsidiary are designated as cash flow hedges. Current contracts are used to hedge forecasted sales or purchases over the next 12 months. The effective portion of changes in the fair value of derivative contracts designated as cash flow hedges is recorded as a component of Accumulated otherOther comprehensive loss within Shareholders’ equity,income (loss) and is recognized in Cost of sales or in Sales in the period in which the hedged transaction occurs.
Net investment hedge
We use foreign exchange currency option contracts maturing in February 2013, to hedge the net assets of Attends Europe to offset the foreign currency translation and economic exposures related to its investment in the subsidiary. We are exposed to movements in foreign currency exchange rates of the Euro versus the U.S. dollar as Attends Europe has a Euro functional currency whereas the Company has a U.S. dollar functional and reporting currency. The effective portion of changes in the fair value of derivative contracts designated as net investment hedges is recorded in Other comprehensive income (loss) as part of the Foreign currency translation adjustments.
The following table presents the currency values under contracts pursuant to currency options outstanding as of December 31, 20102012 to hedge forecasted purchases:
Contract | Notional contractual value | Percentage of forecasted net exposures under contracts for | ||||||||||||||||
2013 | ||||||||||||||||||
Currency options purchased | CDN | $ 425 | 50% | |||||||||||||||
| EUR | € 176 | 92% | ||||||||||||||||
| Percentage of CDN denominated forecasted expenses, net of revenues, under contracts for | USD | $ 34 | 100% | |||||||||||||||
Contract | Notional contractual value | 2011 | ||||||||||||||||
Currency options purchased | CDN | $ | 400 | 50 | % | |||||||||||||
| GBP | £ 19 | 93% | ||||||||||||||||
Currency options sold | CDN | $ | 400 | 50 | % | CDN | $ 425 | 50% | ||||||||||
| EUR | € 76 | 40% | ||||||||||||||||
| USD | $ 34 | 100% | ||||||||||||||||
| GBP | £ 19 | 93% | ||||||||||||||||
The currency options are fully effective as at December 31, 2010.2012. The critical terms of the hedging instruments and the hedged items match. As a result, there were no amounts reflected in the Consolidated Statements of Earnings and Comprehensive Income for the year ended December 31, 20102012 resulting from hedge ineffectiveness (2009—(2011 and 2010 – nil).
| ITEM 8. | FINANCIAL STATEMENTS AND SUPPLEMENTARY DATA |
Management’s Reports to Shareholders of Domtar Corporation
Management’s Report on Financial Statements and Practices
The accompanying Consolidated Financial Statements of Domtar Corporation and its subsidiaries (the “Company”) were prepared by management. The statements were prepared in accordance with accounting principles generally accepted in the United States of America and include amounts that are based on management’s best judgments and estimates. Management is responsible for the completeness, accuracy and objectivity of the financial statements. The other financial information included in the annual report is consistent with that in the financial statements.
Management has established and maintains a system of internal accounting and other controls for the Company and its subsidiaries. This system and its established accounting procedures and related controls are designed to provide reasonable assurance that assets are safeguarded, that the books and records properly reflect all transactions, that policies and procedures are implemented by qualified personnel, and that published financial statements are properly prepared and fairly presented. The Company’s system of internal control is supported by written policies and procedures, contains self-monitoring mechanisms, and is audited by the internal audit function. Appropriate actions are taken by management to correct deficiencies as they are identified.
Management’s Report on Internal Control over Financial Reporting
Management is responsible for establishing and maintaining adequate internal control over financial reporting for the Company. In order to evaluate the effectiveness of internal control over financial reporting, management has conducted an assessment, including testing, using the criteria established inInternal Control—Integrated Framework, issued by the Committee of Sponsoring Organizations of the Treadway Commission (COSO). The Company’s system of internal control over financial reporting is designed to provide reasonable assurance regarding the reliability of financial reporting and the preparation of financial statements for external purposes in accordance with generally accepted accounting principles. The Company’s internal control over financial reporting includes those policies and procedures that (i) pertain to the maintenance of records that, in reasonable detail, accurately and fairly reflect the transactions and dispositions of the assets of the Company; (ii) provide reasonable assurance that transactions are recorded as necessary to permit preparation of financial statements in accordance with generally accepted accounting principles, and that receipts and expenditures of the Company are being made only in accordance with authorizations of management and directors of the Company; and (iii) provide reasonable assurance regarding prevention or timely detection of unauthorized acquisition, use, or disposition of the Company’s assets that could have a material effect on the financial statements.
Because of its inherent limitations, internal control over financial reporting may not prevent or detect misstatements. Also, projections of any evaluation of effectiveness to future periods are subject to the risk that controls may become inadequate because of changes in conditions, or that the degree of compliance with the policies or procedures may deteriorate.
Based on the assessment, management has concluded that the Company maintained effective internal control over financial reporting as of December 31, 2010,2012, based on criteria inInternal Control—Integrated Framework issued by the COSO.
The effectiveness of the Company’s internal control over financial reporting as of December 31, 20102012 has been audited by PricewaterhouseCoopers LLP, an independent registered public accounting firm, as stated in their report, which is included herein.
Report of Independent Registered Public Accounting Firm
To the Board of Directors and Shareholders of Domtar Corporation:
In our opinion, the accompanying consolidated balance sheets and the related consolidated statements of earnings (loss),and comprehensive income, shareholders’ equity and cash flows present fairly, in all material respects, the financial position of Domtar Corporation and its subsidiaries at December 31, 20102012 and December 31, 2009,2011, and the results of their operations and their cash flows for each of the three years in the period ended December 31, 20102012 in conformity with accounting principles generally accepted in the United States of America. In addition, in our opinion, the financial statement schedule listed in the index appearing under Item 15(a)(2) presents fairly, in all material respects, the information set forth therein when read in conjunction with the related consolidated financial statements. Also in our opinion, the Company maintained, in all material respects, effective internal control over financial reporting as of December 31, 2010,2012, based on criteria established inInternal Control—Integrated Frameworkissued by the Committee of Sponsoring Organizations of the Treadway Commission (COSO). The Company’s management is responsible for these financial statements and financial statement schedule, for maintaining effective internal control over financial reporting and for its assessment of the effectiveness of internal control over financial reporting, included in the accompanying Management’s Report on Internal Control over Financial Reporting. Our responsibility is to express opinions on these financial statements, on the financial statement schedule, and on the Company’s internal control over financial reporting based on our integrated audits. We conducted our audits in accordance with the standards of the Public Company Accounting Oversight Board (United States). Those standards require that we plan and perform the audits to obtain reasonable assurance about whether the financial statements are free of material misstatement and whether effective internal control over financial reporting was maintained in all material respects. Our audits of the financial statements included examining, on a test basis, evidence supporting the amounts and disclosures in the financial statements, assessing the accounting principles used and significant estimates made by management, and evaluating the overall financial statement presentation. Our audit of internal control over financial reporting included obtaining an understanding of internal control over financial reporting, assessing the risk that a material weakness exists, and testing and evaluating the design and operating effectiveness of internal control based on the assessed risk. Our audits also included performing such other procedures as we considered necessary in the circumstances. We believe that our audits provide a reasonable basis for our opinions.
A company’s internal control over financial reporting is a process designed to provide reasonable assurance regarding the reliability of financial reporting and the preparation of financial statements for external purposes in accordance with generally accepted accounting principles. A company’s internal control over financial reporting includes those policies and procedures that (i) pertain to the maintenance of records that, in reasonable detail, accurately and fairly reflect the transactions and dispositions of the assets of the company; (ii) provide reasonable assurance that transactions are recorded as necessary to permit preparation of financial statements in accordance with generally accepted accounting principles, and that receipts and expenditures of the company are being made only in accordance with authorizations of management and directors of the company; and (iii) provide reasonable assurance regarding prevention or timely detection of unauthorized acquisition, use, or disposition of the company’s assets that could have a material effect on the financial statements.
Because of its inherent limitations, internal control over financial reporting may not prevent or detect misstatements. Also, projections of any evaluation of effectiveness to future periods are subject to the risk that controls may become inadequate because of changes in conditions, or that the degree of compliance with the policies or procedures may deteriorate.
/s/ PricewaterhouseCoopers LLP
PricewaterhouseCoopers LLP
Charlotte, North Carolina
February 25, 20112013
DOMTAR CORPORATION
CONSOLIDATED STATEMENTS OF EARNINGS (LOSS)AND COMPREHENSIVE INCOME
(IN MILLIONS OF DOLLARS, UNLESS OTHERWISE NOTED)
| Year ended December 31, 2010 | Year ended December 31, 2009 | Year ended December 31, 2008 | ||||||||||
| $ | $ | $ | ||||||||||
Sales | 5,850 | 5,465 | 6,394 | |||||||||
Operating expenses | ||||||||||||
Cost of sales, excluding depreciation and amortization | 4,417 | 4,472 | 5,225 | |||||||||
Depreciation and amortization | 395 | 405 | 463 | |||||||||
Selling, general and administrative | 338 | 345 | 400 | |||||||||
Impairment and write-down of property, plant and equipment (NOTE 3) | 50 | 62 | 383 | |||||||||
Impairment of goodwill and intangible assets (NOTE 3) | — | — | 325 | |||||||||
Closure and restructuring costs (NOTE 14) | 27 | 63 | 43 | |||||||||
Other operating loss (income), net (NOTE 7) | 20 | (497 | ) | (8 | ) | |||||||
| 5,247 | 4,850 | 6,831 | ||||||||||
Operating income (loss) | 603 | 615 | (437 | ) | ||||||||
Interest expense, net (NOTE 8) | 155 | 125 | 133 | |||||||||
Earnings (loss) before income taxes | 448 | 490 | (570 | ) | ||||||||
Income tax (benefit) expense (NOTE 9) | (157 | ) | 180 | 3 | ||||||||
Net earnings (loss) | 605 | 310 | (573 | ) | ||||||||
Per common share (in dollars) (NOTE 5) | ||||||||||||
Net earnings (loss) | ||||||||||||
Basic | 14.14 | 7.21 | (13.33 | ) | ||||||||
Diluted | 14.00 | 7.18 | (13.33 | ) | ||||||||
Weighted average number of common and exchangeable shares outstanding (millions) | ||||||||||||
Basic | 42.8 | 43.0 | 43.0 | |||||||||
Diluted | 43.2 | 43.2 | 43.0 | |||||||||
| Year ended December 31, 2012 | Year ended December 31, 2011 | Year ended December 31, 2010 | ||||||||||
| $ | $ | $ | ||||||||||
Sales | 5,482 | 5,612 | 5,850 | |||||||||
Operating expenses | ||||||||||||
Cost of sales, excluding depreciation and amortization | 4,321 | 4,171 | 4,417 | |||||||||
Depreciation and amortization | 385 | 376 | 395 | |||||||||
Selling, general and administrative | 358 | 340 | 338 | |||||||||
Impairment and write-down of property, plant and equipment and intangible assets (NOTE 4) | 14 | 85 | 50 | |||||||||
Closure and restructuring costs (NOTE 16) | 30 | 52 | 27 | |||||||||
Other operating loss (income), net (NOTE 8) | 7 | (4 | ) | 20 | ||||||||
|
|
|
|
|
| |||||||
| 5,115 | 5,020 | 5,247 | ||||||||||
|
|
|
|
|
| |||||||
Operating income | 367 | 592 | 603 | |||||||||
Interest expense, net (NOTE 9) | 131 | 87 | 155 | |||||||||
|
|
|
|
|
| |||||||
Earnings before income taxes and equity earnings | 236 | 505 | 448 | |||||||||
Income tax expense (benefit) (NOTE 10) | 58 | 133 | (157 | ) | ||||||||
Equity loss, net of taxes | 6 | 7 | — | |||||||||
|
|
|
|
|
| |||||||
Net earnings | 172 | 365 | 605 | |||||||||
|
|
|
|
|
| |||||||
Per common share (in dollars) (NOTE 6) | ||||||||||||
Net earnings | ||||||||||||
Basic | 4.78 | 9.15 | 14.14 | |||||||||
Diluted | 4.76 | 9.08 | 14.00 | |||||||||
Weighted average number of common and exchangeable shares outstanding (millions) | ||||||||||||
Basic | 36.0 | 39.9 | 42.8 | |||||||||
Diluted | 36.1 | 40.2 | 43.2 | |||||||||
Net earnings | 172 | 365 | 605 | |||||||||
Other comprehensive income (loss): | ||||||||||||
Net derivative gains (losses) on cash flow hedges: | ||||||||||||
Net losses arising during the period, net of tax of $1 (2011—$7; 2010—$3) | — | (13 | ) | (4 | ) | |||||||
Less: Reclassification adjustment for (gains) losses included in net earnings, net of tax of $(5) (2011—$(2); 2010—$(1)) | 8 | (1 | ) | (2 | ) | |||||||
Foreign currency translation adjustments | 23 | (25 | ) | 66 | ||||||||
Change in unrecognized losses and prior service cost related to pension and post-retirement benefit plans, net of tax of $30 (2011—$15; 2010 $19) | (85 | ) | (25 | ) | (54 | ) | ||||||
|
|
|
|
|
| |||||||
Other comprehensive income (loss) | (54 | ) | (64 | ) | 6 | |||||||
|
|
|
|
|
| |||||||
Comprehensive income | 118 | 301 | 611 | |||||||||
|
|
|
|
|
| |||||||
The accompanying notes are an integral part of the consolidated financial statements.
DOMTAR CORPORATION
(IN MILLIONS OF DOLLARS, UNLESS OTHERWISE NOTED)
| At | ||||||||||||||||
| December 31, 2010 | December 31, 2009 | December 31, 2012 | December 31, 2011 | |||||||||||||
| $ | $ | $ | $ | |||||||||||||
Assets | ||||||||||||||||
Current assets | ||||||||||||||||
Cash and cash equivalents | 530 | 324 | 661 | 444 | ||||||||||||
Receivables, less allowances of $7 and $8 | 601 | 536 | ||||||||||||||
Inventories (NOTE 10) | 648 | 745 | ||||||||||||||
Receivables, less allowances of $4 and $5 | 562 | 644 | ||||||||||||||
Inventories (NOTE 11) | 675 | 652 | ||||||||||||||
Prepaid expenses | 28 | 46 | 24 | 22 | ||||||||||||
Income and other taxes receivable | 78 | 414 | 48 | 47 | ||||||||||||
Deferred income taxes (NOTE 9) | 115 | 137 | ||||||||||||||
Deferred income taxes (NOTE 10) | 45 | 125 | ||||||||||||||
|
| |||||||||||||||
Total current assets | 2,000 | 2,202 | 2,015 | 1,934 | ||||||||||||
Property, plant and equipment, at cost | 9,255 | 9,575 | 8,793 | 8,448 | ||||||||||||
Accumulated depreciation | (5,488 | ) | (5,446 | ) | (5,392 | ) | (4,989 | ) | ||||||||
|
| |||||||||||||||
Net property, plant and equipment (NOTE 11) | 3,767 | 4,129 | ||||||||||||||
Intangible assets, net of amortization (NOTE 12) | 56 | 85 | ||||||||||||||
Other assets (NOTE 13) | 203 | 103 | ||||||||||||||
Net property, plant and equipment (NOTE 13) | 3,401 | 3,459 | ||||||||||||||
Goodwill (NOTE 12) | 263 | 163 | ||||||||||||||
Intangible assets, net of amortization (NOTE 14) | 309 | 204 | ||||||||||||||
Other assets (NOTE 15) | 135 | 109 | ||||||||||||||
|
| |||||||||||||||
Total assets | 6,026 | 6,519 | 6,123 | 5,869 | ||||||||||||
|
| |||||||||||||||
Liabilities and shareholders’ equity | ||||||||||||||||
Current liabilities | ||||||||||||||||
Bank indebtedness | 23 | 43 | 18 | 7 | ||||||||||||
Trade and other payables (NOTE 16) | 678 | 686 | ||||||||||||||
Trade and other payables (NOTE 17) | 646 | 688 | ||||||||||||||
Income and other taxes payable | 22 | 31 | 15 | 17 | ||||||||||||
Long-term debt due within one year (NOTE 17) | 2 | 11 | ||||||||||||||
Long-term debt due within one year (NOTE 18) | 79 | 4 | ||||||||||||||
|
| |||||||||||||||
Total current liabilities | 725 | 771 | 758 | 716 | ||||||||||||
Long-term debt (NOTE 17) | 825 | 1,701 | ||||||||||||||
Deferred income taxes and other (NOTE 9) | 924 | 1,019 | ||||||||||||||
Other liabilities and deferred credits (NOTE 18) | 350 | 366 | ||||||||||||||
Long-term debt (NOTE 18) | 1,128 | 837 | ||||||||||||||
Deferred income taxes and other (NOTE 10) | 903 | 927 | ||||||||||||||
Other liabilities and deferred credits (NOTE 19) | 457 | 417 | ||||||||||||||
Commitments and contingencies (NOTE 20) | ||||||||||||||||
Commitments and contingencies (NOTE 21) | ||||||||||||||||
Shareholders’ equity | ||||||||||||||||
Common stock (NOTE 19) $0.01 par value; authorized 2,000,000,000 shares; issued: 42,300,031 and 42,062,408 shares | — | — | ||||||||||||||
Treasury stock (NOTE 19) $0.01 par value; 664,857 and nil shares | — | — | ||||||||||||||
Exchangeable shares (NOTE 19) No par value; unlimited shares authorized; issued and held by nonaffiliates: 812,694 and 982,321 shares | 64 | 78 | ||||||||||||||
Shareholders’ equity (NOTE 20) | ||||||||||||||||
Common stock $0.01 par value; authorized 2,000,000,000 shares; issued: 42,523,896 and 42,506,732 shares | — | — | ||||||||||||||
Treasury stock $0.01 par value; 8,285,292 and 6,375,532 shares | — | — | ||||||||||||||
Exchangeable shares No par value; unlimited shares authorized; issued and held by nonaffiliates: 607,814 and 619,108 shares | 48 | 49 | ||||||||||||||
Additional paid-in capital | 2,791 | 2,816 | 2,175 | 2,326 | ||||||||||||
Retained earnings (accumulated deficit) | 357 | (216 | ) | |||||||||||||
Retained earnings | 782 | 671 | ||||||||||||||
Accumulated other comprehensive loss | (10 | ) | (16 | ) | (128 | ) | (74 | ) | ||||||||
|
| |||||||||||||||
Total shareholders’ equity | 3,202 | 2,662 | 2,877 | 2,972 | ||||||||||||
|
| |||||||||||||||
Total liabilities and shareholders’ equity | 6,026 | 6,519 | 6,123 | 5,869 | ||||||||||||
|
| |||||||||||||||
The accompanying notes are an integral part of the consolidated financial statements.
DOMTAR CORPORATION
CONSOLIDATED STATEMENTSSTATEMENT OF SHAREHOLDERS’ EQUITY
(IN MILLIONS OF DOLLARS, UNLESS OTHERWISE NOTED)
| Issued and outstanding common and exchangeable shares (millions of shares) | Common stock, at par | Exchangeable shares | Additional paid-in capital | Retained earnings (Accumulated deficit) | Accumulated other comprehensive income (loss) | Total shareholders’ equity | Issued and outstanding common and exchangeable shares (millions of shares) | Exchangeable shares | Additional paid-in capital | Retained earnings (Accumulated deficit) | Accumulated other comprehensive loss | Total shareholders’ equity | ||||||||||||||||||||||||||||||||||||||||
| $ | $ | $ | $ | $ | $ | $ | $ | $ | $ | $ | ||||||||||||||||||||||||||||||||||||||||||
Balance at December 30, 2007 | 515.4 | 5 | 293 | 2,573 | 47 | 279 | 3,197 | |||||||||||||||||||||||||||||||||||||||||||||
Conversion of exchangeable shares | — | — | (155 | ) | 155 | — | — | — | ||||||||||||||||||||||||||||||||||||||||||||
Issuance of common shares | 0.1 | — | — | 1 | — | — | 1 | |||||||||||||||||||||||||||||||||||||||||||||
Stock-based compensation | — | — | — | 14 | — | — | 14 | |||||||||||||||||||||||||||||||||||||||||||||
Net loss | — | — | — | — | (573 | ) | — | (573 | ) | |||||||||||||||||||||||||||||||||||||||||||
Net derivative losses on cash flow hedges: | ||||||||||||||||||||||||||||||||||||||||||||||||||||
Net loss arising during the period, net of tax of $3 | — | — | — | — | — | (77 | ) | (77 | ) | |||||||||||||||||||||||||||||||||||||||||||
Less: Reclassification adjustments for losses included in net loss, net of tax of nil | 25 | 25 | ||||||||||||||||||||||||||||||||||||||||||||||||||
Foreign currency translation adjustments | — | — | — | — | — | (392 | ) | (392 | ) | |||||||||||||||||||||||||||||||||||||||||||
Change in unrecognized losses and prior service cost related to pension and post retirement benefit plans, net of tax | — | — | — | — | — | (53 | ) | (53 | ) | |||||||||||||||||||||||||||||||||||||||||||
Amortization of prior service costs | — | — | — | — | — | 1 | 1 | |||||||||||||||||||||||||||||||||||||||||||||
Balance at December 31, 2008 | 515.5 | 5 | 138 | 2,743 | (526 | ) | (217 | ) | 2,143 | |||||||||||||||||||||||||||||||||||||||||||
Conversion of exchangeable shares | — | — | (60 | ) | 60 | — | — | — | ||||||||||||||||||||||||||||||||||||||||||||
Reverse stock split (12:1) | (472.5 | ) | (5 | ) | — | 5 | — | — | — | |||||||||||||||||||||||||||||||||||||||||||
Stock-based compensation | — | — | — | 8 | — | — | 8 | |||||||||||||||||||||||||||||||||||||||||||||
Net earnings | — | — | — | — | 310 | — | 310 | |||||||||||||||||||||||||||||||||||||||||||||
Net derivative gains on cash flow hedges: | ||||||||||||||||||||||||||||||||||||||||||||||||||||
Net gain arising during the period, net of tax of $2 | — | — | — | — | — | 51 | 51 | |||||||||||||||||||||||||||||||||||||||||||||
Less: Reclassification adjustments for losses included in net earnings, net of tax of $1 | — | — | — | — | — | 18 | 18 | |||||||||||||||||||||||||||||||||||||||||||||
Foreign currency translation adjustments | — | — | — | — | — | 206 | 206 | |||||||||||||||||||||||||||||||||||||||||||||
Change in unrecognized losses and prior service cost related to pension and post retirement benefit plans, net of tax | — | — | — | — | — | (74 | ) | (74 | ) | |||||||||||||||||||||||||||||||||||||||||||
Balance at December 31, 2009 | 43.0 | — | 78 | 2,816 | (216 | ) | (16 | ) | 2,662 | 43.0 | 78 | 2,816 | (216 | ) | (16 | ) | 2,662 | |||||||||||||||||||||||||||||||||||
Conversion of exchangeable shares | — | — | (14 | ) | 14 | — | — | — | — | (14 | ) | 14 | — | — | — | |||||||||||||||||||||||||||||||||||||
Stock-based compensation | 0.1 | — | — | 5 | — | — | 5 | 0.1 | — | 5 | — | — | 5 | |||||||||||||||||||||||||||||||||||||||
Net earnings | — | — | — | — | 605 | — | 605 | — | — | — | 605 | — | 605 | |||||||||||||||||||||||||||||||||||||||
Net derivative losses on cash flow hedges: | ||||||||||||||||||||||||||||||||||||||||||||||||||||
Net loss arising during the period, net of tax of $3 | — | — | — | — | — | (4 | ) | (4 | ) | — | — | — | — | (4 | ) | (4 | ) | |||||||||||||||||||||||||||||||||||
Less: Reclassification adjustments for gains included in net earnings, net of tax of $(1) | — | — | — | — | — | (2 | ) | (2 | ) | — | — | — | — | (2 | ) | (2 | ) | |||||||||||||||||||||||||||||||||||
Foreign currency translation adjustments | — | — | — | — | — | 66 | 66 | — | — | — | — | 66 | 66 | |||||||||||||||||||||||||||||||||||||||
Change in unrecognized losses and prior service cost related to pension and post retirement benefit plans, net of tax | — | — | — | — | — | (54 | ) | (54 | ) | |||||||||||||||||||||||||||||||||||||||||||
Stock repurchase | (0.7 | ) | — | — | (42 | ) | — | — | (42 | ) | ||||||||||||||||||||||||||||||||||||||||||
Change in unrecognized losses and prior service cost related to pension and post-retirement benefit plans, net of tax of $19 | — | — | — | — | (54 | ) | (54 | ) | ||||||||||||||||||||||||||||||||||||||||||||
Stock repurchase, net of gain of $2 | (0.7 | ) | — | (42 | ) | — | — | (42 | ) | |||||||||||||||||||||||||||||||||||||||||||
Cash dividends | — | — | — | — | (32 | ) | — | (32 | ) | — | — | — | (32 | ) | — | (32 | ) | |||||||||||||||||||||||||||||||||||
Other | — | — | — | (2 | ) | — | — | (2 | ) | — | — | (2 | ) | — | — | (2 | ) | |||||||||||||||||||||||||||||||||||
|
|
|
|
|
| |||||||||||||||||||||||||||||||||||||||||||||||
Balance at December 31, 2010 | 42.4 | — | 64 | 2,791 | 357 | (10 | ) | 3,202 | 42.4 | 64 | 2,791 | 357 | (10 | ) | 3,202 | |||||||||||||||||||||||||||||||||||||
Conversion of exchangeable shares | — | (15 | ) | 15 | — | — | — | |||||||||||||||||||||||||||||||||||||||||||||
Stock-based compensation | 0.3 | — | 14 | — | — | 14 | ||||||||||||||||||||||||||||||||||||||||||||||
Net earnings | — | — | — | 365 | — | 365 | ||||||||||||||||||||||||||||||||||||||||||||||
Net derivative losses on cash flow hedges: | ||||||||||||||||||||||||||||||||||||||||||||||||||||
Net loss arising during the period, net of tax of $7 | — | — | — | — | (13 | ) | (13 | ) | ||||||||||||||||||||||||||||||||||||||||||||
Less: Reclassification adjustments for gains included in net earnings, net of tax of $(2) | — | — | — | — | (1 | ) | (1 | ) | ||||||||||||||||||||||||||||||||||||||||||||
Foreign currency translation adjustments | — | — | — | — | (25 | ) | (25 | ) | ||||||||||||||||||||||||||||||||||||||||||||
Change in unrecognized losses and prior service cost related to pension and post-retirement benefit plans, net of tax of $15 | — | — | — | — | (25 | ) | (25 | ) | ||||||||||||||||||||||||||||||||||||||||||||
Stock repurchase | (5.9 | ) | — | (494 | ) | — | — | (494 | ) | |||||||||||||||||||||||||||||||||||||||||||
Cash dividends | — | — | — | (51 | ) | — | (51 | ) | ||||||||||||||||||||||||||||||||||||||||||||
|
|
|
|
|
| |||||||||||||||||||||||||||||||||||||||||||||||
Balance at December 31, 2011 | 36.8 | 49 | 2,326 | 671 | (74 | ) | 2,972 | |||||||||||||||||||||||||||||||||||||||||||||
Conversion of exchangeable shares | — | (1 | ) | 1 | — | — | — | |||||||||||||||||||||||||||||||||||||||||||||
Stock-based compensation, net of tax | — | — | 5 | — | — | 5 | ||||||||||||||||||||||||||||||||||||||||||||||
Net earnings | — | — | — | 172 | — | 172 | ||||||||||||||||||||||||||||||||||||||||||||||
Net derivative losses on cash flow hedges: | ||||||||||||||||||||||||||||||||||||||||||||||||||||
Net loss arising during the period, net of tax of $1 | — | — | — | — | — | — | ||||||||||||||||||||||||||||||||||||||||||||||
Less: Reclassification adjustments for losses included in net earnings, net of tax of $(5) | — | — | — | — | 8 | 8 | ||||||||||||||||||||||||||||||||||||||||||||||
Foreign currency translation adjustments | — | — | — | — | 23 | 23 | ||||||||||||||||||||||||||||||||||||||||||||||
Change in unrecognized losses and prior service cost related to pension and post-retirement benefit plans, net of tax of $30 | — | — | — | — | (85 | ) | (85 | ) | ||||||||||||||||||||||||||||||||||||||||||||
Stock repurchase | (2.0 | ) | — | (157 | ) | — | — | (157 | ) | |||||||||||||||||||||||||||||||||||||||||||
Cash dividends | — | — | — | (61 | ) | — | (61 | ) | ||||||||||||||||||||||||||||||||||||||||||||
|
|
|
|
|
| |||||||||||||||||||||||||||||||||||||||||||||||
Balance at December 31, 2012 | 34.8 | 48 | 2,175 | 782 | (128 | ) | 2,877 | |||||||||||||||||||||||||||||||||||||||||||||
|
|
|
|
|
| |||||||||||||||||||||||||||||||||||||||||||||||
The accompanying notes are an integral part of the consolidated financial statements.
DOMTAR CORPORATION
CONSOLIDATED STATEMENTS OF CASH FLOWS
(IN MILLIONS OF DOLLARS)
| Year ended December 31, 2010 | Year ended December 31, 2009 | Year ended December 31, 2008 | Year ended December 31, 2012 | Year ended December 31, 2011 | Year ended December 31, 2010 | |||||||||||||||||||
| $ | $ | $ | $ | $ | $ | |||||||||||||||||||
Operating activities | ||||||||||||||||||||||||
Net earnings (loss) | 605 | 310 | (573 | ) | ||||||||||||||||||||
Adjustments to reconcile net earnings (loss) to cash flows from operating activities | ||||||||||||||||||||||||
Net earnings | 172 | 365 | 605 | |||||||||||||||||||||
Adjustments to reconcile net earnings to cash flows from operating activities | ||||||||||||||||||||||||
Depreciation and amortization | 395 | 405 | 463 | 385 | 376 | 395 | ||||||||||||||||||
Deferred income taxes and tax uncertainties (NOTE 9) | (174 | ) | 157 | (42 | ) | |||||||||||||||||||
Impairment and write-down of property, plant and equipment (NOTE 3) | 50 | 62 | 383 | |||||||||||||||||||||
Impairment of goodwill and intangible assets (NOTE 3) | — | — | 325 | |||||||||||||||||||||
Loss (gain) on repurchase of long-term debt and debt restructuring costs | 47 | (12 | ) | (11 | ) | |||||||||||||||||||
Net losses (gains) on disposals of property, plant and equipment and sale of businesses and trademarks | 33 | (7 | ) | (9 | ) | |||||||||||||||||||
Deferred income taxes and tax uncertainties (NOTE 10) | (1 | ) | 40 | (174 | ) | |||||||||||||||||||
Impairment and write-down of property, plant and equipment and intangible assets (NOTE 4) | 14 | 85 | 50 | |||||||||||||||||||||
Loss on repurchase of long-term debt and debt restructuring costs | — | 4 | 47 | |||||||||||||||||||||
Net losses (gains) on disposals of property, plant and equipment and sale of businesses | 2 | (6 | ) | 33 | ||||||||||||||||||||
Stock-based compensation expense | 5 | 8 | 16 | 5 | 3 | 5 | ||||||||||||||||||
Equity loss, net | 6 | 7 | — | |||||||||||||||||||||
Other | (2 | ) | 16 | 12 | (13 | ) | — | (2 | ) | |||||||||||||||
Changes in assets and liabilities, excluding the effects of sale of business | ||||||||||||||||||||||||
Changes in assets and liabilities, excluding the effects of acquisition and sale of businesses | ||||||||||||||||||||||||
Receivables | (73 | ) | (55 | ) | 7 | 99 | (12 | ) | (73 | ) | ||||||||||||||
Inventories | 39 | 261 | (85 | ) | 5 | 2 | 39 | |||||||||||||||||
Prepaid expenses | 6 | (3 | ) | (19 | ) | (3 | ) | 2 | 6 | |||||||||||||||
Trade and other payables | (11 | ) | 38 | �� | (117 | ) | (118 | ) | (27 | ) | (11 | ) | ||||||||||||
Income and other taxes | 344 | (357 | ) | 13 | (4 | ) | 33 | 344 | ||||||||||||||||
Difference between employer pension and other post-retirement contributions and pension and other post-retirement expense | (120 | ) | (61 | ) | (141 | ) | (13 | ) | (18 | ) | (120 | ) | ||||||||||||
Other assets and other liabilities | 22 | 30 | (25 | ) | 15 | 29 | 22 | |||||||||||||||||
|
|
| ||||||||||||||||||||||
Cash flows provided from operating activities | 1,166 | 792 | 197 | 551 | 883 | 1,166 | ||||||||||||||||||
|
|
| ||||||||||||||||||||||
Investing activities | ||||||||||||||||||||||||
Additions to property, plant and equipment | (153 | ) | (106 | ) | (163 | ) | (236 | ) | (144 | ) | (153 | ) | ||||||||||||
Proceeds from disposals of property, plant and equipment and sale of trademarks | 26 | 21 | 35 | |||||||||||||||||||||
Proceeds from disposals of property, plant and equipment | 49 | 34 | 26 | |||||||||||||||||||||
Proceeds from sale of businesses and investments | 185 | — | — | — | 10 | 185 | ||||||||||||||||||
Business acquisition—joint venture | — | — | (12 | ) | ||||||||||||||||||||
Acquisition of businesses, net of cash acquired | (293 | ) | (288 | ) | — | |||||||||||||||||||
Investment in joint venture | (6 | ) | (7 | ) | — | |||||||||||||||||||
|
|
| ||||||||||||||||||||||
Cash flows provided from (used for) investing activities | 58 | (85 | ) | (140 | ) | |||||||||||||||||||
Cash flows (used for) provided from investing activities | (486 | ) | (395 | ) | 58 | |||||||||||||||||||
|
|
| ||||||||||||||||||||||
Financing activities | ||||||||||||||||||||||||
Dividend payments | (21 | ) | — | — | (58 | ) | (49 | ) | (21 | ) | ||||||||||||||
Net change in bank indebtedness | (19 | ) | — | (24 | ) | 11 | (16 | ) | (19 | ) | ||||||||||||||
Change of revolving bank credit facility | — | (60 | ) | 10 | ||||||||||||||||||||
Issuance of long-term debt | — | 385 | — | 548 | — | — | ||||||||||||||||||
Repayment of long-term debt | (898 | ) | (725 | ) | (95 | ) | (192 | ) | (18 | ) | (898 | ) | ||||||||||||
Debt issue and tender offer costs | (35 | ) | (14 | ) | — | — | (7 | ) | (35 | ) | ||||||||||||||
Stock repurchase | (44 | ) | — | — | (157 | ) | (494 | ) | (44 | ) | ||||||||||||||
Prepaid and premium on structured stock repurchase, net | 2 | — | — | |||||||||||||||||||||
Prepaid on structured stock repurchase, net | — | — | 2 | |||||||||||||||||||||
Other | (3 | ) | — | — | — | 10 | (3 | ) | ||||||||||||||||
|
|
| ||||||||||||||||||||||
Cash flows used for financing activities | (1,018 | ) | (414 | ) | (109 | ) | ||||||||||||||||||
Cash flows provided from (used for) financing activities | 152 | (574 | ) | (1,018 | ) | |||||||||||||||||||
|
|
| ||||||||||||||||||||||
Net increase (decrease) in cash and cash equivalents | 206 | 293 | (52 | ) | 217 | (86 | ) | 206 | ||||||||||||||||
Translation adjustments related to cash and cash equivalents | — | 15 | (3 | ) | ||||||||||||||||||||
Cash and cash equivalents at beginning of year | 324 | 16 | 71 | 444 | 530 | 324 | ||||||||||||||||||
|
|
| ||||||||||||||||||||||
Cash and cash equivalents at end of year | 530 | 324 | 16 | 661 | 444 | 530 | ||||||||||||||||||
|
|
| ||||||||||||||||||||||
Supplemental cash flow information | ||||||||||||||||||||||||
Net cash payments for: | ||||||||||||||||||||||||
Interest | 107 | 125 | 120 | |||||||||||||||||||||
Income taxes paid (refund) | 28 | (20 | ) | 49 | ||||||||||||||||||||
Interest (including $47 million of tender offer premiums in 2012) | 116 | 74 | 107 | |||||||||||||||||||||
Income taxes paid | 76 | 60 | 28 | |||||||||||||||||||||
|
|
| ||||||||||||||||||||||
The accompanying notes are an integral part of the consolidated financial statements.
TABLE OF CONTENTS
INDEX FOR NOTES TO CONSOLIDATED FINANCIAL STATEMENTS
NOTE 1 | 80 | |||||
NOTE 2 | 87 | |||||
NOTE 3 |
| 88 | ||||
NOTE 4 | 91 | |||||
NOTE 5 | 93 | |||||
NOTE 6 |
| 98 | ||||
NOTE 7 | PENSION PLANS AND OTHER | 99 | ||||
NOTE 8 | 111 | |||||
NOTE 9 | 112 | |||||
NOTE 10 | 112 | |||||
NOTE 11 | 118 | |||||
NOTE 12 | 119 | |||||
NOTE 13 | 119 | |||||
NOTE 14 | 120 | |||||
NOTE 15 |
| 121 | ||||
NOTE 16 |
| 121 | ||||
NOTE 17 | 125 | |||||
NOTE 18 | 125 | |||||
NOTE 19 | 129 | |||||
NOTE 20 | 130 | |||||
NOTE 21 |
| 132 | ||||
NOTE 22 |
| 137 | ||||
NOTE 23 |
| 142 | ||||
NOTE 24 | SUPPLEMENTAL GUARANTOR FINANCIAL INFORMATION | 146 | ||||
NOTE 25 | SALE OF WOOD BUSINESS AND WOODLAND MILL | 155 | ||||
DOMTAR CORPORATION
NOTES TO CONSOLIDATED FINANCIAL STATEMENTS
DECEMBER 31, 20102012
(IN MILLIONS OF DOLLARS, UNLESS OTHERWISE NOTED)
SUMMARY OF SIGNIFICANT ACCOUNTING POLICIES
NATURE OF OPERATIONS
Domtar Corporation was incorporated on August 16, 2006, fordesigns, manufactures, markets and distributes a wide variety of fiber-based products including communications papers, specialty and packaging papers and adult incontinence products. The foundation of its business is the sole purposeefficient operation of holdingpulp mills, converting fiber into papergrade, fluff and specialty pulps. The majority of this pulp production is consumed internally to make communication papers and specialty and packaging papers with the Weyerhaeuser Fine Paper Business and consummating the combination of the Weyerhaeuser Fine Paper Business with Domtar Inc. (the “Transaction”). The Weyerhaeuser Fine Paper Business was owned by Weyerhaeuser Company (“Weyerhaeuser”) prior to the completion of the Transaction on March 7, 2007. Domtar Corporation had no operations prior to March 7, 2007 when, upon the completion of the Transaction, it became an independent public holding company.
balance sold as a market pulp. Domtar is anthe largest integrated manufacturermarketer and marketermanufacturer of uncoated freesheet paper with paper, pulpin North America. In addition, Domtar operates manufacturing, research and convertingdevelopment and distribution facilities into sell adult incontinence care products including washcloths, marketed primarily under the United States and Canada.Attends® brand name. The Company also owns and operates Ariva (previously Domtar Distribution Group)®, which involves the purchasing, warehousing, sale anda network of strategically located paper distribution of various paper products made by Domtar and by other manufacturers.facilities. The Company also produced lumber and other specialtyspeciality and industrial wood products up until the sale of the Wood business on June 30, 2010.
ACCOUNTING PRINCIPLES
The Company’s Consolidated Financial Statementsconsolidated financial statements have been prepared in accordance with accounting principles generally accepted in the United States of America (“GAAP”). The consolidated financial statements include the accounts of Domtar Corporation and its controlled subsidiaries. Significant intercompany transactions have been eliminated on consolidation. Investment in an affiliated company, where the Company has joint control over their operations, is accounted for by the equity method. The Company’s share of equity earnings totaled a loss, net of taxes, of $6 million.
To conform with the basis of presentation adopted in the current period, certain figures previously reported in the Statements of Cash Flows, have been reclassified.
USE OF ESTIMATES
The consolidated financial statements have been prepared in conformity with GAAP, which requirerequires management to make estimates and assumptions that affect the reported amounts of revenues and expenses during the year, the reported amounts of assets and liabilities, and the disclosure of contingent assets and liabilities at the date of the consolidated financial statements. On an ongoing basis, management reviews the estimates and assumptions, including but not limited to those related to environmental matters, useful lives, impairment of long-lived assets, pension and other employee future benefit plans, income taxes, closure and restructuring costs, income taxes, useful lives, asset impairment charges, environmental matters and other asset retirement obligations, pension and other post-retirement benefit plans and, commitments and contingencies, and asset retirement obligations, based on currently available information. Actual results could differ from those estimates.
TRANSLATION OF FOREIGN CURRENCIES
The local currency is considered theCompany determines its international subsidiaries’ functional currency forby reviewing the Company’s operations outside the United States. Foreign currency denominatedcurrencies in which their respective operating activities occur. The Company translates assets and liabilities are translatedof its non-U.S.
DOMTAR CORPORATION
NOTES TO CONSOLIDATED FINANCIAL STATEMENTS
DECEMBER 31, 2012
(IN MILLIONS OF DOLLARS, UNLESS OTHERWISE NOTED)
NOTE 1. SUMMARY OF SIGNIFICANT ACCOUNTING POLICIES (CONTINUED)
dollar functional currency subsidiaries into U.S. dollars atusing the rate in effect at the balance sheet date and revenues and expenses are translated at the average exchange rates during the year. All gains and losses arising from the translation of the financial statements of these foreign subsidiaries are included in Accumulated other comprehensive loss, a component of Shareholders’ equity. Foreign currency transaction gaintranslation gains and losses are included in operationsShareholders’ equity as a component of Accumulated other comprehensive loss in the period they occur.
NOTES TO CONSOLIDATED FINANCIAL STATEMENTS
DECEMBERMonetary assets and liabilities denominated in a currency that is different from a reporting entity’s functional currency must first be remeasured from the applicable currency to the legal entity’s functional currency. The effect of this remeasurement process is recognized in the Consolidated Statements of Earnings and Comprehensive Income and is partially offset by our economic hedging program (refer to Note 22). At December 31, 2010
(IN MILLIONS OF DOLLARS, UNLESS OTHERWISE NOTED)
NOTE 1. SUMMARY OF SIGNIFICANT ACCOUNTING POLICIES (CONTINUED)
2012, the accumulated translation adjustment accounts amounted to $208 million (2011—$185 million).
REVENUE RECOGNITION
Domtar Corporation recognizes revenues when pervasive evidence of an arrangement exists, the customer takes title and assumes the risks and rewards of ownership, the sales price charged is fixed or determinable and when collection is reasonably assured. Revenue is recorded at the time of shipment for terms designated free on board (f.o.b)(“f.o.b.”) shipping point. For sales transactions designated f.o.b. destination, revenue is recorded when the product is delivered to the customer’s delivery site, when the title and risk of loss are transferred.
SHIPPING AND HANDLING COSTS
The Company classifies shipping and handling costs as a component of Cost of sales in the Consolidated Statements of Earnings (Loss).and Comprehensive Income.
CLOSURE AND RESTRUCTURING COSTS
Closure and restructuring costs are recognized as liabilities in the period when they are incurred and are measured at their fair value. For such recognition to occur, management, with the appropriate level of authority, must have approved and committed to a firm plan and appropriate communication to those affected must have occurred. These provisions may require an estimation of costs such as severance and termination benefits, pension and related curtailments, environmental remediation and may also include expenses related to demolition training and outplacement. Actions taken may also require an evaluation of any remaining assets to determine required write-downs, if any, and a review of estimated remaining useful lives which may lead to accelerated depreciation expense.
Estimates of cash flows and fair value relating to closures and restructurings require judgment. Closure and restructuring liabilities are based on management’s best estimates of future events at December 31, 2010.2012. Closure and restructuring costscost estimates are dependent on future events. Although the Company does not anticipate significant changes, the actual costs may differ from these estimates due to subsequent developments such as the results of environmental studies, the ability to find a buyer for assets set to be dismantled and demolished and other business developments. As such, additional costs and further working capital write-downsadjustments may be required in future periods.
DOMTAR CORPORATION
NOTES TO CONSOLIDATED FINANCIAL STATEMENTS
DECEMBER 31, 2012
(IN MILLIONS OF DOLLARS, UNLESS OTHERWISE NOTED)
NOTE 1. SUMMARY OF SIGNIFICANT ACCOUNTING POLICIES (CONTINUED)
INCOME TAXES
Domtar Corporation uses the asset and liability method of accounting for income taxes. Under this method, deferred tax assets and liabilities are determined according to differences between the carrying amounts and tax bases of the assets and liabilities. The Company records its worldwide tax provision based on the respective tax rules and regulations for the jurisdictions in which it operates. The change in the net deferred tax asset or liability is included in Net earningsIncome tax expense or in Other comprehensive income (loss) in the Consolidated Statements of Earnings and Accumulated other comprehensive loss.Comprehensive Income. Deferred tax assets and liabilities are measured using enacted tax rates and laws expected to apply in the years in which the assets and liabilities are expected to be recovered or settled. Uncertain tax positions are recorded based upon the Company’s evaluation of whether it is “more likely than not” (a probability level of more than 50 percent) that, based upon its technical merits, the tax position will be sustained upon examination by the taxing authorities. The Company establishes a valuation allowance for deferred tax assets when it is more likely than not that they will not be realized. In general, “realization” refers to the incremental benefit achieved through the reduction in future taxes payable or an increase in future taxes refundable from the deferred tax assets.
NOTES TO CONSOLIDATED FINANCIAL STATEMENTS
DECEMBER 31, 2010
(IN MILLIONS OF DOLLARS, UNLESS OTHERWISE NOTED)
NOTE 1. SUMMARY OF SIGNIFICANT ACCOUNTING POLICIES (CONTINUED)
The Company recognizes interest and penalties related to income tax matters as a component of Income tax (benefit) expense in the Consolidated StatementStatements of Earnings (Loss).and Comprehensive Income.
CASH AND CASH EQUIVALENTS
Cash and cash equivalents include cash and short-term investments with original maturities of less than three months and are presented at cost which approximates fair value.
RECEIVABLES
Receivables are recorded net of a provision for doubtful accounts that is based on expected collectability. Gains or losses onThe securitization of receivables are calculatedis accounted for as the difference between the carrying amount of the receivables sold and the sum of the cash proceeds on sale and the fair value of the retained subordinate interest in such receivables on the date of transfer. Fair value is determined on a discounted cash flow basis. Gains or lossessecured borrowings. Accordingly, financing expenses related to the securitization of receivables are recognized in earnings as a component of Interest expense in the Consolidated Statements of Earnings (Loss) in the period when the sale occurs.and Comprehensive Income.
INVENTORIES
Inventories are stated at the lower of cost or market. Cost includes labor, materials and production overhead. The last-in, first-out (“LIFO”) method is used to cost certain domesticU.S. raw materials, in process and finished goods inventories. LIFO inventories were $296$264 million and $304$267 million at December 31, 20102012 and December 31, 2009,2011, respectively. The balance of domesticU.S. raw material inventories, all materials and supplies inventories and all foreign inventories are costed at either the first-in, first-out (“FIFO”) or average cost methods. Had the inventories for which the LIFO method is used been valued under the FIFO method, the amounts at which product inventories are stated would have been $52$62 million and $58$56 million greater at December 31, 20102012 and December2011, respectively.
DOMTAR CORPORATION
NOTES TO CONSOLIDATED FINANCIAL STATEMENTS
DECEMBER 31, 2009, respectively.2012
(IN MILLIONS OF DOLLARS, UNLESS OTHERWISE NOTED)
NOTE 1. SUMMARY OF SIGNIFICANT ACCOUNTING POLICIES (CONTINUED)
PROPERTY, PLANT AND EQUIPMENT
Property, plant and equipment are stated at cost less accumulated depreciation including asset impairment write-downs. Interest costs are capitalized for significant capital projects. For timber limits and timberlands, amortization is calculated using the units of production method. For all other assets, amortization is calculated using the straight-line method over the estimated useful lives of the assets. Buildings and improvements are amortized over periods of 10 to 40 years and machinery and equipment over periods of 3 to 20 years. No depreciation is recorded on assets under construction.
IMPAIRMENT OF LONG-LIVED ASSETS
Long-lived assets are reviewed for impairment upon the occurrence of events or changes in circumstances indicating that the carrying value of the assets may not be recoverable, as measured by comparing their net book value to their estimated undiscounted future cash flows. Impaired assets are recorded at estimated fair value, determined principally by using discounted future cash flows expected from their use and eventual disposition.disposition (refer to Note 4).
GOODWILL AND OTHER INTANGIBLE ASSETS
Goodwill is not amortized and is subject to an impairment test, annuallyevaluated at the beginning of the fourth quarter of every year or more frequently if events or changes in circumstances indicate that it might be impaired. For purposeswhenever indicators of testing forpotential impairment exist. The Company performs the balance
NOTES TO CONSOLIDATED FINANCIAL STATEMENTS
DECEMBER 31, 2010
(IN MILLIONS OF DOLLARS, UNLESS OTHERWISE NOTED)
NOTE 1. SUMMARY OF SIGNIFICANT ACCOUNTING POLICIES (CONTINUED)
of goodwill is assigned to one or more of the Company’s reporting units. A reporting unit to which goodwill must be assigned is determined to be an operating segment or one level below an operating segment, referred to as a component. A component of an operating segment is a reporting unit if the component constitutes a business for which discrete financial information is available and segment management regularly reviews the operating results of that component. Two or more components of an operating segment shall be aggregated and deemed a single reporting unit if the components have similar economic characteristics.
A Step I impairment test of goodwill of one orat its reporting unit level. The Company has the option to first assess qualitative factors to determine whether it is more reporting units is accomplished mainly by determining whetherlikely than not that the fair value of a reporting unit based upon discounted estimated cash flows, exceedsis less than its carrying amount. In performing the net carrying amountqualitative assessment, the Company identifies the relevant drivers of thatfair value of a reporting unit asand the relevant events and circumstances that may have an impact on those drivers of fair value. This process involves significant judgement and assumptions including the assessment of the results of the most recent fair value calculations, the identification of macroeconomic conditions, industry and market considerations, cost factors, overall financial performance, specific events affecting the Company and the business, and making the assessment date.on whether each relevant factor will impact the impairment test positively or negatively and the magnitude of any such impact. If, after assessing the totality of events or circumstances, the Company determines that it is more likely than not that the fair value of a reporting unit is greaterless than the netits carrying amount, nothen it performs Step I of the two-step impairment test. The Company can also elect to bypass the qualitative assessment and proceed directly to the Step 1 of the impairment test.
The first step is necessary.to compare the fair value of a reporting unit to its carrying value, including goodwill. The Company uses a discounted cash flow model to determine the fair value of a reporting unit. The assumptions used in the model are consistent with those we believe hypothetical marketplace participants would use. In the event that the net carrying amount exceeds the sumfair value of the discounted estimated cash flows, a Step IIbusiness, the second step of the impairment test must be performed wherebyin order to determine the fair valueamount of the reporting unit’s goodwill must be estimated to determine if it is less than its net carrying amount.impairment charge. Fair value of goodwill in the Step II impairment test is estimated in the same way as goodwill was determined at the date of the acquisition in a business combination, that is, the excess of the fair value of the reporting unit over the fair value of the identifiable net assets of the business.
All goodwill as of December 31, 2012 resides in the Personal Care segment, and originates from the acquisitions of Attends Healthcare Inc. on September 1, 2011, Attends Healthcare Limited on March 1, 2012 and EAM Corporation on May 10, 2012. Please refer to Note 3 “Acquisition of businesses” for additional information regarding these acquisitions.
DOMTAR CORPORATION
NOTES TO CONSOLIDATED FINANCIAL STATEMENTS
DECEMBER 31, 2012
(IN MILLIONS OF DOLLARS, UNLESS OTHERWISE NOTED)
NOTE 1. SUMMARY OF SIGNIFICANT ACCOUNTING POLICIES (CONTINUED)
Indefinite-lived intangible assets are not amortized and are evaluated at the beginning of the fourth quarter of every year, or more frequently whenever indicators of potential impairment exist. The Company has the option to first assess qualitative factors to determine whether it is more likely than not that the fair value of indefinite-lived intangible assets are less than their carrying amounts. The qualitative assessment follows the same process as the one performed for goodwill, as described above. If, after assessing the qualitative factors, the Company determines that it is more likely than not that the indefinite-lived intangible assets are less than their carrying amounts, then an impairment test is required. The Company can also elect to proceed directly to the quantitative test. The impairment test consists of comparing the fair value of the indefinite-lived intangible assets determined using a variety of methodologies to their carrying amount. If the carrying amounts of the indefinite-lived intangible assets exceed their fair value, an impairment loss is recognized in an amount equal to that excess. Indefinite-lived intangible assets include trade names related to Attends®. The Company evaluates its indefinite-lived intangible assets each reporting unit.period to determine whether events and circumstances continue to support indefinite useful lives.
IntangibleDefinite lived intangible assets are stated at cost less amortization and are reviewed for impairment whenever events or changes in circumstances indicate that their carrying amount may not be recoverable. Definite lived intangible assets include water rights, customer relationships, technology, trade names and supplier and non-compete agreements which are being amortized on ausing the straight-line basismethod over their estimated useful lives of 40 years, 17 years, 7 years and 5 years, respectively.lives. Power purchase agreements are amortized on ausing the straight-line basismethod over the term of the respective contract. The weighted-average amortization period is 25 years for power purchase agreements. Cutting rights were amortized using the units of production method and were sold June 30, 2010 as part of the sale of the Wood business (see note 24)(refer to Note 25). Any potential impairment for definite lived intangible assets will be calculated in the same manner as that disclosed under impairment of long-lived assets.
Amortization is based mainly on the following useful lives:
Useful life | ||
Water rights | 40 years | |
Customer relationships | 20 to 40 years | |
Technology | 7 to 20 years | |
Trade names | 7 years | |
Supplier agreements | 5 years | |
Power purchase agreements | 25 years | |
Non-Compete agreements | 9 years |
OTHER ASSETS
Other assets are recorded at cost. Direct financing costs related to the issuance of long-term debt are deferred and amortized using the effective interest rate method.
ENVIRONMENTAL COSTS
Environmental expenditures for effluent treatment, air emission, landfill operation and closure, asbestos containment and removal, bark pile management, silvicultural activities and site remediation (together referred to as environmental matters) are expensed or capitalized depending on their future economic benefit. In the normal course of business, Domtar Corporation incurs certain operating costs for environmental matters that are
DOMTAR CORPORATION
NOTES TO CONSOLIDATED FINANCIAL STATEMENTS
DECEMBER 31, 2012
(IN MILLIONS OF DOLLARS, UNLESS OTHERWISE NOTED)
NOTE 1. SUMMARY OF SIGNIFICANT ACCOUNTING POLICIES (CONTINUED)
expensed as incurred. Expenditures for property, plant and equipment that prevent future environmental impacts are capitalized and amortized on a straight-line basis over 10 to 40 years. Provisions for environmental matters are not discounted, except for a portion which is discounted due to more certaintyuncertainty with respect to timing of expenditures, and are recorded when remediation efforts are probable and can be reasonably estimated.
ASSET RETIREMENT OBLIGATIONS
Asset retirement obligations are recognized, at fair value, in the period in which Domtar Corporation incurs a legal obligation associated with the retirement of an asset. Conditional asset retirement obligations are recognized, at fair value, when the fair value of the liability can be reasonably estimated or on a probability-
NOTES TO CONSOLIDATED FINANCIAL STATEMENTS
DECEMBER 31, 2010
(IN MILLIONS OF DOLLARS, UNLESS OTHERWISE NOTED)
NOTE 1. SUMMARY OF SIGNIFICANT ACCOUNTING POLICIES (CONTINUED)
weightedprobability-weighted discounted cash flow estimate. The associated costs are capitalized as part of the carrying value of the related asset and depreciated over its remaining useful life. The liability is accreted using the credit adjusted risk-free interest rate used to discount the cash flow.
STOCK-BASED COMPENSATION AND OTHER STOCK-BASED PAYMENTS
Domtar Corporation usesrecognizes the cost of employee services received in exchange for awards of equity instruments over the requisite service period, based on their grant date fair value for awards accounted for as equity and based approachon the quoted market value of accountingeach reporting period for stock-based paymentsawards accounted for as liability. The Company awards are accounted for as compensation expense and presented in Additional paid-in-capital on the Consolidated Balance Sheets for Equity type awards and presented in Other long-term liabilities and deferred credits on the Consolidated Balance Sheets for Liability type awards.
The Company’s awards may be subject to directors and employees and for stock options granted to employees.market, performance and/or service conditions. Any consideration paid by plan participants on the exercise of stock options or the purchase of shares is credited to Additional paid-in capitalpaid-in-capital on the Consolidated Balance Sheet.Sheets. The par value included in the Additional paid-in-capital component of stock-based compensation is transferred to Common shares upon the issuance of shares of common stock.
Unless otherwise determined at the time of the grant, time-based awards subject to service conditions vest in approximately equal installments over three years beginning on the first anniversary of the grant date and performance-based awards vest based on achievement of pre-determined performance goals over performance periods of three years. Awards may be subject to bothThe majority of non-qualified stock options and performance and time-based vesting. The Additional paid-in capital componentshare units expire at various dates no later than seven years from the date of stock-based compensation is transferred to common shares upon the issuance of shares of common stock.
grant. Deferred Share Units vest immediately at the grant date and are remeasured at each reporting period, until settlement, using the quoted market value. Deferred Share Units
Under the 2007 Omnibus Incentive Plan (the “Omnibus Plan”), a maximum of 1,422,214 shares are accountedreserved for as compensation expense and presentedissuance in Other liabilities and deferred credits on the Consolidated Balance Sheets.connection with awards granted or to be granted.
DERIVATIVE INSTRUMENTS
Derivative instruments are utilized by Domtar Corporation as part of the overall strategy to manage exposure to fluctuations in foreign currency and price on certain purchases. As a matter of policy, derivatives are not used for trading or speculative purposes. All derivatives are recorded at fair value either as assets or
DOMTAR CORPORATION
NOTES TO CONSOLIDATED FINANCIAL STATEMENTS
DECEMBER 31, 2012
(IN MILLIONS OF DOLLARS, UNLESS OTHERWISE NOTED)
NOTE 1. SUMMARY OF SIGNIFICANT ACCOUNTING POLICIES (CONTINUED)
liabilities. When derivative instruments have been designated within a hedge relationship and are highly effective in offsetting the identified risk characteristics of specific financial assets and liabilities or group of financial assets and liabilities, hedge accounting is applied.
In a fair value hedge, changes in fair value of derivatives are recognized in the Consolidated StatementStatements of Earnings (Loss).and Comprehensive Income. The change in fair value of the hedged item attributable to the hedged risk is also recorded in the Consolidated StatementStatements of Earnings (Loss)and Comprehensive Income by way of a corresponding adjustment of the carrying amount of the hedged item recognized in the Consolidated Balance Sheet.Sheets. In a cash flow hedge, changes in fair value of derivative instruments are recorded in Other comprehensive income (loss). These amounts are reclassified in the Consolidated StatementStatements of Earnings (Loss)and Comprehensive Income in the periods in which results are affected by the cash flows of the hedged item within the same line item. Any hedge ineffectiveness is recorded in the Consolidated StatementStatements of Earnings (Loss)and Comprehensive Income when incurred.
PENSION PLANS
Domtar Corporation’s plans include funded and unfunded defined benefit pension plans and defined contribution pension plans. Domtar Corporation recognizes the overfunded or underfunded status of defined benefit and underfunded defined contribution pension plans as an asset or liability in the Consolidated Balance Sheets. The net periodic benefit cost includes the following:
The cost of pension benefits provided in exchange for employees’ services rendered during the period,
NOTES TO CONSOLIDATED FINANCIAL STATEMENTS
DECEMBER 31, 2010
(IN MILLIONS OF DOLLARS, UNLESS OTHERWISE NOTED)
NOTE 1. SUMMARY OF SIGNIFICANT ACCOUNTING POLICIES (CONTINUED)
The interest cost of pension obligations,
The expected long-term return on pension fund assets based on a market value of pension fund assets,
Gains or losses on settlements and curtailments,
The straight-line amortization of past service costs and plan amendments over the average remaining service period of approximately 119 years of the active employee group covered by the plans, and
The amortization of cumulative net actuarial gains and losses in excess of 10% of the greater of the accrued benefit obligation or market value of plan assets at the beginning of the year over the average remaining service period of approximately 119 years of the active employee group covered by the plans.
The defined benefit plan obligations are determined in accordance with the projected unit credit actuarial cost method.
IMPAIRMENT OF LONG-LIVED ASSETS
Long-lived assets are reviewed for impairment upon the occurrence of events or changes in circumstances indicating that the carrying value of the assets may not be recoverable, as measured by comparing their net book value to their estimated undiscounted future cash flows. Impaired assets are recorded at estimated fair value, determined principally by using discounted future cash flows expected from their use and eventual disposition (refer to Note 4).
GOODWILL AND OTHER INTANGIBLE ASSETS
Goodwill is not amortized and is evaluated at the beginning of the fourth quarter of every year or more frequently whenever indicators of potential impairment exist. The Company performs the impairment test of goodwill at its reporting unit level. The Company has the option to first assess qualitative factors to determine whether it is more likely than not that the fair value of a reporting unit is less than its carrying amount. In performing the qualitative assessment, the Company identifies the relevant drivers of fair value of a reporting unit and the relevant events and circumstances that may have an impact on those drivers of fair value. This process involves significant judgement and assumptions including the assessment of the results of the most recent fair value calculations, the identification of macroeconomic conditions, industry and market considerations, cost factors, overall financial performance, specific events affecting the Company and the business, and making the assessment on whether each relevant factor will impact the impairment test positively or negatively and the magnitude of any such impact. If, after assessing the totality of events or circumstances, the Company determines that it is more likely than not that the fair value of a reporting unit is less than its carrying amount, then it performs Step I of the two-step impairment test. The Company can also elect to bypass the qualitative assessment and proceed directly to the Step 1 of the impairment test.
The first step is to compare the fair value of a reporting unit to its carrying value, including goodwill. The Company uses a discounted cash flow model to determine the fair value of a reporting unit. The assumptions used in the model are consistent with those we believe hypothetical marketplace participants would use. In the event that the net carrying amount exceeds the fair value of the business, the second step of the impairment test must be performed in order to determine the amount of the impairment charge. Fair value of goodwill in the Step II impairment test is estimated in the same way as goodwill was determined at the date of the acquisition in a business combination, that is, the excess of the fair value of the reporting unit over the fair value of the identifiable net assets of the business.
All goodwill as of December 31, 2012 resides in the Personal Care segment, and originates from the acquisitions of Attends Healthcare Inc. on September 1, 2011, Attends Healthcare Limited on March 1, 2012 and EAM Corporation on May 10, 2012. Please refer to Note 3 “Acquisition of businesses” for additional information regarding these acquisitions.
DOMTAR CORPORATION
NOTES TO CONSOLIDATED FINANCIAL STATEMENTS
DECEMBER 31, 2012
(IN MILLIONS OF DOLLARS, UNLESS OTHERWISE NOTED)
NOTE 1. SUMMARY OF SIGNIFICANT ACCOUNTING POLICIES (CONTINUED)
Indefinite-lived intangible assets are not amortized and are evaluated at the beginning of the fourth quarter of every year, or more frequently whenever indicators of potential impairment exist. The Company has the option to first assess qualitative factors to determine whether it is more likely than not that the fair value of indefinite-lived intangible assets are less than their carrying amounts. The qualitative assessment follows the same process as the one performed for goodwill, as described above. If, after assessing the qualitative factors, the Company determines that it is more likely than not that the indefinite-lived intangible assets are less than their carrying amounts, then an impairment test is required. The Company can also elect to proceed directly to the quantitative test. The impairment test consists of comparing the fair value of the indefinite-lived intangible assets determined using a variety of methodologies to their carrying amount. If the carrying amounts of the indefinite-lived intangible assets exceed their fair value, an impairment loss is recognized in an amount equal to that excess. Indefinite-lived intangible assets include trade names related to Attends®. The Company evaluates its indefinite-lived intangible assets each reporting period to determine whether events and circumstances continue to support indefinite useful lives.
Definite lived intangible assets are stated at cost less amortization and are reviewed for impairment whenever events or changes in circumstances indicate that their carrying amount may not be recoverable. Definite lived intangible assets include water rights, customer relationships, technology, trade names and supplier and non-compete agreements which are being amortized using the straight-line method over their estimated useful lives. Power purchase agreements are amortized using the straight-line method over the term of the respective contract. Cutting rights were amortized using the units of production method and were sold June 30, 2010 as part of the sale of the Wood business (refer to Note 25). Any potential impairment for definite lived intangible assets will be calculated in the same manner as that disclosed under impairment of long-lived assets.
Amortization is based mainly on the following useful lives:
Useful life | ||
Water rights | 40 years | |
Customer relationships | 20 to 40 years | |
Technology | 7 to 20 years | |
Trade names | 7 years | |
Supplier agreements | 5 years | |
Power purchase agreements | 25 years | |
Non-Compete agreements | 9 years |
OTHER POST-RETIREMENT BENEFIT PLANSASSETS
Other assets are recorded at cost. Direct financing costs related to the issuance of long-term debt are deferred and amortized using the effective interest rate method.
ENVIRONMENTAL COSTS
Environmental expenditures for effluent treatment, air emission, landfill operation and closure, asbestos containment and removal, bark pile management, silvicultural activities and site remediation (together referred to as environmental matters) are expensed or capitalized depending on their future economic benefit. In the normal course of business, Domtar Corporation incurs certain operating costs for environmental matters that are
DOMTAR CORPORATION
NOTES TO CONSOLIDATED FINANCIAL STATEMENTS
DECEMBER 31, 2012
(IN MILLIONS OF DOLLARS, UNLESS OTHERWISE NOTED)
NOTE 1. SUMMARY OF SIGNIFICANT ACCOUNTING POLICIES (CONTINUED)
expensed as incurred. Expenditures for property, plant and equipment that prevent future environmental impacts are capitalized and amortized on a straight-line basis over 10 to 40 years. Provisions for environmental matters are not discounted, due to uncertainty with respect to timing of expenditures, and are recorded when remediation efforts are probable and can be reasonably estimated.
ASSET RETIREMENT OBLIGATIONS
Asset retirement obligations are recognized, at fair value, in the period in which Domtar Corporation incurs a legal obligation associated with the retirement of an asset. Conditional asset retirement obligations are recognized, at fair value, when the fair value of the liability can be reasonably estimated or on a probability-weighted discounted cash flow estimate. The associated costs are capitalized as part of the carrying value of the related asset and depreciated over its remaining useful life. The liability is accreted using the credit adjusted risk-free interest rate used to discount the cash flow.
STOCK-BASED COMPENSATION AND OTHER STOCK-BASED PAYMENTS
Domtar Corporation recognizes the cost of employee services received in exchange for awards of equity instruments over the requisite service period, based on their grant date fair value for awards accounted for as equity and based on the quoted market value of each reporting period for awards accounted for as liability. The Company awards are accounted for as compensation expense and presented in Additional paid-in-capital on the Consolidated Balance Sheets for Equity type awards and presented in Other long-term liabilities and deferred credits on the Consolidated Balance Sheets for Liability type awards.
The Company’s awards may be subject to market, performance and/or service conditions. Any consideration paid by plan participants on the exercise of stock options or the purchase of shares is credited to Additional paid-in-capital on the Consolidated Balance Sheets. The par value included in the Additional paid-in-capital component of stock-based compensation is transferred to Common shares upon the issuance of shares of common stock.
Unless otherwise determined at the time of the grant, awards subject to service conditions vest in approximately equal installments over three years beginning on the first anniversary of the grant date and performance-based awards vest based on achievement of pre-determined performance goals over performance periods of three years. The majority of non-qualified stock options and performance share units expire at various dates no later than seven years from the date of grant. Deferred Share Units vest immediately at the grant date and are remeasured at each reporting period, until settlement, using the quoted market value.
Under the 2007 Omnibus Incentive Plan (the “Omnibus Plan”), a maximum of 1,422,214 shares are reserved for issuance in connection with awards granted or to be granted.
DERIVATIVE INSTRUMENTS
Derivative instruments are utilized by Domtar Corporation as part of the overall strategy to manage exposure to fluctuations in foreign currency and price on certain purchases. As a matter of policy, derivatives are not used for trading or speculative purposes. All derivatives are recorded at fair value either as assets or
DOMTAR CORPORATION
NOTES TO CONSOLIDATED FINANCIAL STATEMENTS
DECEMBER 31, 2012
(IN MILLIONS OF DOLLARS, UNLESS OTHERWISE NOTED)
NOTE 1. SUMMARY OF SIGNIFICANT ACCOUNTING POLICIES (CONTINUED)
liabilities. When derivative instruments have been designated within a hedge relationship and are highly effective in offsetting the identified risk characteristics of specific financial assets and liabilities or group of financial assets and liabilities, hedge accounting is applied.
In a fair value hedge, changes in fair value of derivatives are recognized in the Consolidated Statements of Earnings and Comprehensive Income. The change in fair value of the hedged item attributable to the hedged risk is also recorded in the Consolidated Statements of Earnings and Comprehensive Income by way of a corresponding adjustment of the carrying amount of the hedged item recognized in the Consolidated Balance Sheets. In a cash flow hedge, changes in fair value of derivative instruments are recorded in Other comprehensive income (loss). These amounts are reclassified in the Consolidated Statements of Earnings and Comprehensive Income in the periods in which results are affected by the cash flows of the hedged item within the same line item. Any hedge ineffectiveness is recorded in the Consolidated Statements of Earnings and Comprehensive Income when incurred.
PENSION PLANS
Domtar Corporation’s plans include funded and unfunded defined benefit and defined contribution pension plans. Domtar Corporation recognizes the overfunded or underfunded status of other post-retirementdefined benefit and underfunded defined contribution pension plans (other than multiemployer plans) as aan asset or liability in the Consolidated Balance Sheets. TheseThe net periodic benefit cost includes the following:
The cost of pension benefits which are fundedprovided in exchange for employees’ services rendered during the period,
The interest cost of pension obligations,
The expected long-term return on pension fund assets based on a market value of pension fund assets,
Gains or losses on settlements and curtailments,
The straight-line amortization of past service costs and plan amendments over the average remaining service period of approximately 9 years of the active employee group covered by Domtar Corporation as they become due, include life insurance programs, medicalthe plans, and dental benefits and short-term and long-term disability programs. Domtar Corporation amortizes the
The amortization of cumulative net actuarial gains and losses in excess of 10% of the greater of the accrued benefit obligation or market value of plan assets at the beginning of the year over the average remaining service period of approximately 139 years of the active employee group covered by the plans.
GUARANTEES
A guarantee is a contract or an indemnification agreement that contingently requires Domtar Corporation to make payments to the other party of the contract or agreement, based on changesThe defined benefit plan obligations are determined in an underlying item that is related to an asset, a liability or an equity security of the other party or on a third party’s failure to perform under an obligating agreement. It could also be an indirect guarantee of the indebtedness of another party, even though the payment to the other party may not be based on changes in an underlying item that is related to an asset, a liability or an equity security of the other party. Guarantees, when applicable, are accounted for at fair value.
ALTERNATIVE FUEL MIXTURE TAX CREDITS
The U.S. Internal Revenue Code of 1986, as amended (the “Code”) permitted a refundable excise tax credit, until the end of 2009, for the production and use of alternative fuel mixtures derived from biomass. The Company submitted an applicationaccordance with the U.S. Internal Revenue Service (“IRS”) to be registered as an alternative fuel mixer and received notification that its registration had been accepted in March 2009. The Company began producing and consuming alternative fuel mixtures in February 2009 at its eligible mills.
The Company recorded $25 million in such credits in 2010 ($498 million in 2009) in Other operating loss (income) on the Consolidated Statements of Earnings (Loss) based on the volume of alternative mixtures produced and burned during 2009. The $25 million recorded in 2010 represented an adjustment to amounts presented as deferred revenue at December 31, 2009. The $25 million was released to income following guidance issued by the IRS in March 2010. The Company also recorded income tax expense of $7 million in 2010 (2009 – $162 million) related to the alternative fuel mixture income. According to the Code, the taxprojected unit credit expires at theactuarial cost method.
NOTES TO CONSOLIDATED FINANCIAL STATEMENTS
DECEMBER 31, 2010
(IN MILLIONS OF DOLLARS, UNLESS OTHERWISE NOTED)
end of 2009. Please refer to note 9, “Income Taxes,” for additional information regarding unrecognized tax benefits. The Company received a $368 million refund, net of federal income tax offsets, in 2010 (2009 – $140 million).
RECENT ACCOUNTING PRONOUNCEMENTS
ACCOUNTING CHANGES IMPLEMENTED IN 2010
TRANSFERS OF FINANCIAL ASSETS
In June 2009, the FASB issued Accounting for Transfers of Financial Assets, which amends the derecognition guidance required by the Transfers and Servicing Topic of FASB ASC. Some of the major changes undertaken by this amendment include:
Eliminating the concept of a Qualified Special Purpose Entity (“QSPE”) since the FASB believes, on the basis of recent experience, that many entities that have been accounted for as QSPEs are not truly passive, a belief that challenges the premise on which the QSPE exception was based.
Modifying the derecognition provisions as required by the Transfers and Servicing Topic of FASB ASC. Specifically aimed to:
transfers of individual or groups of financial assets in their entirety and
transfers of participating interests.
The new amendment is effective for financial asset transfers occurring after the beginning of an entity’s first fiscal year that begins after November 15, 2009. The Company adopted the new requirements on January 1, 2010. Upon adoption, the new guidance resulted in an increase in Subordinated interest in securitized receivables of $20 million presented in Receivables and a corresponding increase in Long-term debt due within one year in the Consolidated Balance Sheet.
VARIABLE INTEREST ENTITIES
In June and December 2009, the FASB issued guidance which requires an enterprise to perform an analysis to determine whether the enterprise’s variable interest or interests give it a controlling financial interest in a variable interest entity. This guidance requires ongoing reassessments of whether an enterprise is the primary beneficiary of a variable interest entity, eliminates the quantitative approach previously required for determining
NOTES TO CONSOLIDATED FINANCIAL STATEMENTS
DECEMBER 31, 2010
(IN MILLIONS OF DOLLARS, UNLESS OTHERWISE NOTED)
NOTE 2. RECENT ACCOUNTING PRONOUNCEMENTS (CONTINUED)
the primary beneficiary of a variable interest entity and requires enhanced disclosures that will provide users of financial statements with more transparent information about an enterprise’s involvement in a variable interest entity. This guidance is effective for fiscal years beginning after November 15, 2009, and for interim and annual reporting periods thereafter. The Company adopted the new requirements on January 1, 2010 with no significant impact as the Company has no interests in variable interest entities.
FUTURE ACCOUNTING CHANGES
FAIR VALUE DISCLOSURES
In January 2010, the FASB issued an Update of the Fair Value Measurements and Disclosures Topic of FASB ASC requiring new disclosures and amending existing guidance. This Update provides amendments that require new disclosures as follows:
A reporting entity should disclose separately the amounts of significant transfers in and out of Level 1 and Level 2 fair value measurements and describe the reasons for transfers;
In the reconciliation for fair value measurements using significant unobservable inputs (Level 3), a reporting entity should present separately information about purchases, sales, issuances, and settlements.
This Update also provides amendments that clarify existing disclosures as follows:
A reporting entity should provide fair value measurements for each class of assets and liabilities;
A reporting entity should provide disclosures about the valuation techniques and inputs used to measure fair value for both recurring and nonrecurring fair value measurements that fall either in Level 2 or Level 3.
These modifications are effective for interim and annual periods beginning after December 15, 2009, except for the disclosures about purchases, sales, issuances, and settlements in the roll forward activity in Level 3 fair value measurements. Those disclosures are effective for interim and annual periods beginning after December 15, 2010. The Company adopted the new required disclosures effective January 1st, 2010 and does not anticipate the new Level 3 disclosure requirements to have a significant impact when adopted.
STOCK COMPENSATION
In April 2010, the FASB issued an update to Compensation – Stock Compensation, which addresses the classification of an employee share-based payment award with an exercise price denominated in the currency of a market in which the underlying security trades. This Update clarifies that those employee share-based payment awards should not be considered to contain a condition that is not a market, performance, or service condition and therefore, an entity would not classify such an award as a liability if it otherwise qualifies as equity.
This Update is effective for fiscal years and interim periods beginning on or after December 15, 2010 with early adoption permitted. The adoption of this update will have no impact on the Company’s consolidated financial statements.
NOTES TO CONSOLIDATED FINANCIAL STATEMENTS
DECEMBER 31, 2010
(IN MILLIONS OF DOLLARS, UNLESS OTHERWISE NOTED)
IMPAIRMENT AND WRITE-DOWN OF GOODWILL AND LONG-LIVED ASSETS
IMPAIRMENT OF LONG-LIVED ASSETS
Long-lived assets are reviewed for impairment upon the occurrence of events or changes in circumstances indicating that the carrying value of the assets may not be recoverable, as measured by comparing their net book value to their estimated undiscounted future cash flows. Impaired assets are recorded at estimated fair value, determined principally by using discounted future cash flows expected from their use and eventual disposition (refer to Note 4).
GOODWILL AND OTHER INTANGIBLE ASSETS
Goodwill is not amortized and is evaluated at the beginning of the fourth quarter of every year or more frequently whenever indicators of potential impairment exist. The Company performs the impairment test of goodwill at its reporting unit level. The Company has the option to first assess qualitative factors to determine whether it is more likely than not that the fair value of a reporting unit is less than its carrying amount. In performing the qualitative assessment, the Company identifies the relevant drivers of fair value of a reporting unit and the relevant events and circumstances that may have an impact on those drivers of fair value. This process involves significant judgement and assumptions including the assessment of the results of the most recent fair value calculations, the identification of macroeconomic conditions, industry and market considerations, cost factors, overall financial performance, specific events affecting the Company and the business, and making the assessment on whether each relevant factor will impact the impairment test positively or negatively and the magnitude of any such impact. If, after assessing the totality of events or circumstances, the Company determines that it is more likely than not that the fair value of a reporting unit is less than its carrying amount, then it performs Step I of the two-step impairment test. The Company can also elect to bypass the qualitative assessment and proceed directly to the Step 1 of the impairment test.
The first step is to compare the fair value of a reporting unit to its carrying value, including goodwill. The Company uses a discounted cash flow model to determine the fair value of a reporting unit. The assumptions used in the model are consistent with those we believe hypothetical marketplace participants would use. In the event that the net carrying amount exceeds the fair value of the business, the second step of the impairment test must be performed in order to determine the amount of the impairment charge. Fair value of goodwill in the Step II impairment test is estimated in the same way as goodwill was determined at the date of the acquisition in a business combination, that is, the excess of the fair value of the reporting unit over the fair value of the identifiable net assets of the business.
All goodwill as of December 31, 2012 resides in the Personal Care segment, and originates from the acquisitions of Attends Healthcare Inc. on September 1, 2011, Attends Healthcare Limited on March 1, 2012 and EAM Corporation on May 10, 2012. Please refer to Note 3 “Acquisition of businesses” for additional information regarding these acquisitions.
DOMTAR CORPORATION
NOTES TO CONSOLIDATED FINANCIAL STATEMENTS
DECEMBER 31, 2012
(IN MILLIONS OF DOLLARS, UNLESS OTHERWISE NOTED)
NOTE 1. SUMMARY OF SIGNIFICANT ACCOUNTING POLICIES (CONTINUED)
Indefinite-lived intangible assets are not amortized and are evaluated at the beginning of the fourth quarter of every year, or more frequently whenever indicators of potential impairment exist. The Company has the option to first assess qualitative factors to determine whether it is more likely than not that the fair value of indefinite-lived intangible assets are less than their carrying amounts. The qualitative assessment follows the same process as the one performed for goodwill, as described above. If, after assessing the qualitative factors, the Company determines that it is more likely than not that the indefinite-lived intangible assets are less than their carrying amounts, then an impairment test is required. The Company can also elect to proceed directly to the quantitative test. The impairment test consists of comparing the fair value of the indefinite-lived intangible assets determined using a variety of methodologies to their carrying amount. If the carrying amounts of the indefinite-lived intangible assets exceed their fair value, an impairment loss is recognized in an amount equal to that excess. Indefinite-lived intangible assets include trade names related to Attends®. The Company evaluates its indefinite-lived intangible assets each reporting period to determine whether events and circumstances continue to support indefinite useful lives.
Definite lived intangible assets are stated at cost less amortization and are reviewed for impairment whenever events or changes in circumstances indicate that their carrying amount may not be recoverable. Definite lived intangible assets include water rights, customer relationships, technology, trade names and supplier and non-compete agreements which are being amortized using the straight-line method over their estimated useful lives. Power purchase agreements are amortized using the straight-line method over the term of the respective contract. Cutting rights were amortized using the units of production method and were sold June 30, 2010 as part of the sale of the Wood business (refer to Note 25). Any potential impairment for definite lived intangible assets will be calculated in the same manner as that disclosed under impairment of long-lived assets.
Amortization is based mainly on the following useful lives:
Useful life | ||
Water rights | 40 years | |
Customer relationships | 20 to 40 years | |
Technology | 7 to 20 years | |
Trade names | 7 years | |
Supplier agreements | 5 years | |
Power purchase agreements | 25 years | |
Non-Compete agreements | 9 years |
OTHER ASSETS
Other assets are recorded at cost. Direct financing costs related to the issuance of long-term debt are deferred and amortized using the effective interest rate method.
ENVIRONMENTAL COSTS
Environmental expenditures for effluent treatment, air emission, landfill operation and closure, asbestos containment and removal, bark pile management, silvicultural activities and site remediation (together referred to as environmental matters) are expensed or capitalized depending on their future economic benefit. In the normal course of business, Domtar Corporation incurs certain operating costs for environmental matters that are
DOMTAR CORPORATION
NOTES TO CONSOLIDATED FINANCIAL STATEMENTS
DECEMBER 31, 2012
(IN MILLIONS OF DOLLARS, UNLESS OTHERWISE NOTED)
NOTE 1. SUMMARY OF SIGNIFICANT ACCOUNTING POLICIES (CONTINUED)
expensed as incurred. Expenditures for property, plant and equipment that prevent future environmental impacts are capitalized and amortized on a straight-line basis over 10 to 40 years. Provisions for environmental matters are not discounted, due to uncertainty with respect to timing of expenditures, and are recorded when remediation efforts are probable and can be reasonably estimated.
ASSET RETIREMENT OBLIGATIONS
Asset retirement obligations are recognized, at fair value, in the period in which Domtar Corporation incurs a legal obligation associated with the retirement of an asset. Conditional asset retirement obligations are recognized, at fair value, when the fair value of the liability can be reasonably estimated or on a probability-weighted discounted cash flow estimate. The associated costs are capitalized as part of the carrying value of the related asset and depreciated over its remaining useful life. The liability is accreted using the credit adjusted risk-free interest rate used to discount the cash flow.
STOCK-BASED COMPENSATION AND OTHER STOCK-BASED PAYMENTS
Domtar Corporation recognizes the cost of employee services received in exchange for awards of equity instruments over the requisite service period, based on their grant date fair value for awards accounted for as equity and based on the quoted market value of each reporting period for awards accounted for as liability. The Company awards are accounted for as compensation expense and presented in Additional paid-in-capital on the Consolidated Balance Sheets for Equity type awards and presented in Other long-term liabilities and deferred credits on the Consolidated Balance Sheets for Liability type awards.
The Company’s awards may be subject to market, performance and/or service conditions. Any consideration paid by plan participants on the exercise of stock options or the purchase of shares is credited to Additional paid-in-capital on the Consolidated Balance Sheets. The par value included in the Additional paid-in-capital component of stock-based compensation is transferred to Common shares upon the issuance of shares of common stock.
Unless otherwise determined at the time of the grant, awards subject to service conditions vest in approximately equal installments over three years beginning on the first anniversary of the grant date and performance-based awards vest based on achievement of pre-determined performance goals over performance periods of three years. The majority of non-qualified stock options and performance share units expire at various dates no later than seven years from the date of grant. Deferred Share Units vest immediately at the grant date and are remeasured at each reporting period, until settlement, using the quoted market value.
Under the 2007 Omnibus Incentive Plan (the “Omnibus Plan”), a maximum of 1,422,214 shares are reserved for issuance in connection with awards granted or to be granted.
DERIVATIVE INSTRUMENTS
Derivative instruments are utilized by Domtar Corporation as part of the overall strategy to manage exposure to fluctuations in foreign currency and price on certain purchases. As a matter of policy, derivatives are not used for trading or speculative purposes. All derivatives are recorded at fair value either as assets or
DOMTAR CORPORATION
NOTES TO CONSOLIDATED FINANCIAL STATEMENTS
DECEMBER 31, 2012
(IN MILLIONS OF DOLLARS, UNLESS OTHERWISE NOTED)
NOTE 1. SUMMARY OF SIGNIFICANT ACCOUNTING POLICIES (CONTINUED)
liabilities. When derivative instruments have been designated within a hedge relationship and are highly effective in offsetting the identified risk characteristics of specific financial assets and liabilities or group of financial assets and liabilities, hedge accounting is applied.
In a fair value hedge, changes in fair value of derivatives are recognized in the Consolidated Statements of Earnings and Comprehensive Income. The change in fair value of the hedged item attributable to the hedged risk is also recorded in the Consolidated Statements of Earnings and Comprehensive Income by way of a corresponding adjustment of the carrying amount of the hedged item recognized in the Consolidated Balance Sheets. In a cash flow hedge, changes in fair value of derivative instruments are recorded in Other comprehensive income (loss). These amounts are reclassified in the Consolidated Statements of Earnings and Comprehensive Income in the periods in which results are affected by the cash flows of the hedged item within the same line item. Any hedge ineffectiveness is recorded in the Consolidated Statements of Earnings and Comprehensive Income when incurred.
PENSION PLANS
Domtar Corporation’s plans include funded and unfunded defined benefit and defined contribution pension plans. Domtar Corporation recognizes the overfunded or underfunded status of defined benefit and underfunded defined contribution pension plans as an asset or liability in the Consolidated Balance Sheets. The net periodic benefit cost includes the following:
The cost of pension benefits provided in exchange for employees’ services rendered during the period,
The interest cost of pension obligations,
The expected long-term return on pension fund assets based on a market value of pension fund assets,
Gains or losses on settlements and curtailments,
The straight-line amortization of past service costs and plan amendments over the average remaining service period of approximately 9 years of the active employee group covered by the plans, and
The amortization of cumulative net actuarial gains and losses in excess of 10% of the greater of the accrued benefit obligation or market value of plan assets at the beginning of the year over the average remaining service period of approximately 9 years of the active employee group covered by the plans.
The defined benefit plan obligations are determined in accordance with the projected unit credit actuarial cost method.
OTHER POST-RETIREMENT BENEFIT PLANS
The Company recognizes the unfunded status of other post-retirement benefit plans (other than multiemployer plans) as a liability in the Consolidated Balance Sheets. These benefits, which are funded by Domtar Corporation as they become due, include life insurance programs, medical and dental benefits and short-term and long-term disability programs. We amortize the cumulative net actuarial gains and losses in excess of 10% of the accrued benefit obligation at the beginning of the year over the average remaining service period of approximately 10 years of the active employee group covered by the plans.
DOMTAR CORPORATION
NOTES TO CONSOLIDATED FINANCIAL STATEMENTS
DECEMBER 31, 2012
(IN MILLIONS OF DOLLARS, UNLESS OTHERWISE NOTED)
NOTE 1. SUMMARY OF SIGNIFICANT ACCOUNTING POLICIES (CONTINUED)
GUARANTEES
A guarantee is a contract or an indemnification agreement that contingently requires Domtar Corporation to make payments to the other party of the contract or agreement, based on changes in an underlying item that is related to an asset, a liability or an equity security of the other party or on a third party’s failure to perform under an obligating agreement. It could also be an indirect guarantee of the indebtedness of another party, even though the payment to the other party may not be based on changes in an underlying item that is related to an asset, a liability or an equity security of the other party. Guarantees, when applicable, are accounted for at fair value.
RECENT ACCOUNTING PRONOUNCEMENTS
ACCOUNTING CHANGES IMPLEMENTED
COMPREHENSIVE INCOME
In June 2011, the Financial Accounting Standards Board (“FASB”) issued changes to the presentation of comprehensive income. These changes give an entity the option to present the total of comprehensive income, the components of net income, and the components of other comprehensive income either in a single continuous statement of comprehensive income or in two separate but consecutive statements. The option to present components of other comprehensive income as part of the statement of changes in shareholders’ equity was eliminated. The nature of the items that must be reported in other comprehensive income and the requirements for reclassification from other comprehensive income to net income were not changed. Additionally, no changes were made to the calculation and presentation of earnings per share. The Company adopted the new requirement on January 1, 2012 with no impact on the Company’s consolidated financial statements except for the change in presentation. The Company has chosen to present a single continuous statement of comprehensive income.
INTANGIBLES—GOODWILL AND OTHER
In July 2012, the FASB issued an update to Intangibles—Goodwill and Other, which simplifies how entities test indefinite-lived intangible assets for impairment by permitting an entity to first assess qualitative factors to determine whether it is more likely than not that the indefinite-lived intangible asset is impaired. If the entity concludes that it is more likely than not that the indefinite-lived intangible asset is impaired, then it is required to perform the quantitative impairment test. The amended provisions are effective for annual and interim impairment tests performed for fiscal years beginning after September 15, 2012 with early adoption permitted. The Company adopted the new requirement as of its publication date with no impact on the Company’s consolidated financial statements.
DOMTAR CORPORATION
NOTES TO CONSOLIDATED FINANCIAL STATEMENTS
DECEMBER 31, 2012
(IN MILLIONS OF DOLLARS, UNLESS OTHERWISE NOTED)
NOTE 2. RECENT ACCOUNTING PRONOUNCEMENTS (CONTINUED)
FUTURE ACCOUNTING CHANGES
COMPREHENSIVE INCOME
In February 2013, the FASB issued an update to Comprehensive Income, which requires an entity to provide information regarding the amounts reclassified out of accumulated other comprehensive income by component. The standard requires that companies present either in a single note or parenthetically on the face of the financial statements, the effect of significant amounts reclassified from each component of accumulated other comprehensive income based on its source, and the income statement line items affected by the reclassification. If a component is not required to be reclassified to net income in its entirety, companies would instead cross reference to the related footnote for additional information.
These modifications are effective for interim and annual periods beginning after December 15, 2012. The Company is currently evaluating these changes to determine which option will be chosen for the presentation of amounts reclassified out of accumulated other comprehensive income. Other than the change in presentation, the Company has determined these changes will not have an impact on the consolidated financial statements.
ACQUISITION OF BUSINESSES
EAM Corporation
On May 10, 2012, the Company completed the acquisition of 100% of the outstanding shares of EAM Corporation (“EAM”). EAM manufactures high quality airlaid and ultrathin laminated absorbent cores used in feminine hygiene, adult incontinence, baby diapers, and other medical healthcare and performance packaging solutions. EAM operates a manufacturing, research and development and distribution facility in Jesup, Georgia. EAM has approximately 54 employees. The results of EAM’s operations have been included in the consolidated financial statements since May 1, 2012, the effective time of the transaction, and are presented in the Personal Care reportable segment. The purchase price was $61 million in cash, including working capital, net of cash acquired of $1 million. The acquisition was accounted for as a business combination under the acquisition method of accounting, in accordance with the Business Combinations Topic of FASB Accounting Standards Codification (“ASC”).
The total purchase price was allocated to tangible and intangible assets acquired and liabilities assumed based on the Company’s estimates of their fair value, which are based on information currently available. During the fourth quarter of 2012, the Company completed the evaluation of all assets and liabilities.
DOMTAR CORPORATION
NOTES TO CONSOLIDATED FINANCIAL STATEMENTS
DECEMBER 31, 2012
(IN MILLIONS OF DOLLARS, UNLESS OTHERWISE NOTED)
NOTE 3. ACQUISITION OF BUSINESSES (CONTINUED)
The table below illustrates the purchase price allocation:
Fair value of net assets acquired at the date of acquisition | ||||||||
Receivables | $ | 6 | ||||||
Inventory | 2 | |||||||
Property, plant and equipment | 13 | |||||||
Intangible assets (Note 14) | ||||||||
Customer relationships(1) | 19 | |||||||
Technology(2) | 8 | |||||||
Non-compete(3) | 1 | |||||||
| 28 | ||||||||
Goodwill (Note 12) | 31 | |||||||
|
| |||||||
Total assets | 80 | |||||||
Less: Liabilities | ||||||||
Trade and other payables | 4 | |||||||
Deferred income tax liabilities and unrecognized tax benefits | 15 | |||||||
|
| |||||||
Total liabilities | 19 | |||||||
Fair value of net assets acquired at the date of acquisition | 61 | |||||||
| (1) | The useful life of the Customer relationships acquired is 30 years. |
| (2) | The useful lives of the Technology acquired are between 7 and 20 years. |
| (3) | The useful life of the Non-compete acquired is 9 years. |
Attends Healthcare Limited
On March 1, 2012, the Company completed the acquisition of 100% of the outstanding shares of Attends Healthcare Limited (“Attends Europe”). Attends Europe manufactures and supplies adult incontinence care products in Northern Europe. Attends Europe operates a manufacturing, research and development and distribution facility in Aneby, Sweden and also operates a distribution center in Germany. Attends Europe has approximately 458 employees. The results of Attends Europe’s operations have been included in the consolidated financial statements since March 1, 2012, and are presented in the Personal Care reportable segment. The purchase price was $232 million (€173 million) in cash, including working capital, net of acquired cash of $4 million (€3 million). The acquisition was accounted for as a business combination under the acquisition method of accounting, in accordance with the Business Combinations Topic of FASB ASC.
The total purchase price was allocated to tangible and intangible assets acquired and liabilities assumed based on the Company’s estimates of their fair value, which are based on information currently available. During the fourth quarter of 2012, the Company completed the evaluation of all assets and liabilities.
DOMTAR CORPORATION
NOTES TO CONSOLIDATED FINANCIAL STATEMENTS
DECEMBER 31, 2012
(IN MILLIONS OF DOLLARS, UNLESS OTHERWISE NOTED)
NOTE 3. ACQUISITION OF BUSINESSES (CONTINUED)
The table below illustrates the purchase price allocation:
Fair value of net assets acquired at the date of acquisition | ||||||||
Receivables | $ | 21 | ||||||
Inventory | 22 | |||||||
Property, plant and equipment | 67 | |||||||
Intangible assets (Note 14) | ||||||||
Trade names(1) | 54 | |||||||
Customer relationships(2) | 71 | |||||||
| 125 | ||||||||
Goodwill (Note 12) | 71 | |||||||
|
| |||||||
Total assets | 306 | |||||||
Less: Liabilities | ||||||||
Trade and other payables | 27 | |||||||
Capital lease obligation | 6 | |||||||
Deferred income tax liabilities and unrecognized tax benefits | 38 | |||||||
Pension | 3 | |||||||
|
| |||||||
Total liabilities | 74 | |||||||
Fair value of net assets acquired at the date of acquisition | 232 | |||||||
| (1) | Indefinite useful life. |
| (2) | The useful life of the Customer relationships acquired is 30 years. |
Attends Healthcare Inc.
On September 1, 2011, Domtar Corporation completed the acquisition of 100% of the outstanding shares of Attends Healthcare Inc. (“Attends US”). Attends US sells and markets a complete line of adult incontinence care products and distributes washcloths marketed primarily under the Attends® brand name. The company has a wide product offering and it serves a diversified customer base in multiple channels throughout the United States and Canada. Attends US has approximately 320 employees and the production facility is located in Greenville, North Carolina. The results of Attends US’ operations have been included in the consolidated financial statements since September 1, 2011, and are presented in the Personal Care reportable segment. The purchase price was $288 million in cash, including working capital, net of acquired cash of $12 million. The acquisition was accounted for as a business combination under the acquisition method of accounting, in accordance with the Business Combinations Topic of FASB ASC.
The total purchase price was allocated to tangible and intangible assets acquired and liabilities assumed based on the Company’s estimates of their fair value, which are based on information currently available. During the fourth quarter of 2011, the Company completed the evaluation of all assets and liabilities.
DOMTAR CORPORATION
NOTES TO CONSOLIDATED FINANCIAL STATEMENTS
DECEMBER 31, 2012
(IN MILLIONS OF DOLLARS, UNLESS OTHERWISE NOTED)
NOTE 3. ACQUISITION OF BUSINESSES (CONTINUED)
The table below illustrates the purchase price allocation:
Fair value of net assets acquired at the date of acquisition | ||||||||
Receivables | $ | 12 | ||||||
Inventory | 17 | |||||||
Property, plant and equipment | 54 | |||||||
Intangible assets (Note 14) | ||||||||
Trade names(1) | 61 | |||||||
Customer relationships(2) | 93 | |||||||
| 154 | ||||||||
Goodwill (Note 12) | 163 | |||||||
Other assets | 4 | |||||||
|
| |||||||
Total assets | 404 | |||||||
Less: Liabilities | ||||||||
Trade and other payables | 15 | |||||||
Income and other taxes payable | 2 | |||||||
Capital lease obligation | 31 | |||||||
Deferred income tax liabilities and unrecognized tax benefits | 66 | |||||||
Other liabilities | 2 | |||||||
|
| |||||||
Total liabilities | 116 | |||||||
Fair value of net assets acquired at the date of acquisition | 288 | |||||||
| (1) | Indefinite useful life. |
| (2) | The useful life of the Customer relationships acquired is 40 years. |
For all acquisitions, goodwill represents the future economic benefit arising from other assets acquired that could not be individually identified and separately recognized. The goodwill is attributable to the general reputation of the business, the assembled workforce, and the expected future cash flows of the business. Disclosed goodwill is not deductible for tax purposes. Pro forma results have not been provided, as these acquisitions have no material impact on the Company.
IMPAIRMENT AND WRITE-DOWN OF PROPERTY, PLANT AND EQUIPMENT
AND INTANGIBLE ASSETS
We review intangible assets and property, plant and equipment for impairment upon the occurrence of events or changes in circumstances indicating that, at the lowest level of determinable cash flows, the carrying value of the intangible and long-lived assets may not be recoverable. Step I
Estimates of undiscounted future cash flows used to test the recoverability of the impairment test assesses iffixed assets included key assumptions related to selling prices, inflation-adjusted cost projections, forecasted exchange rate for the U.S. dollar when applicable and the estimated useful life of the fixed assets.
DOMTAR CORPORATION
NOTES TO CONSOLIDATED FINANCIAL STATEMENTS
DECEMBER 31, 2012
(IN MILLIONS OF DOLLARS, UNLESS OTHERWISE NOTED)
NOTE 4. IMPAIRMENT AND WRITE-DOWN OF PROPERTY, PLANT AND EQUIPMENT AND INTANGIBLE ASSETS (CONTINUED)
IMPAIRMENT OF PROPERTY, PLANT AND EQUIPMENT
Kamloops, Closure of a pulp machine
During the fourth quarter of 2012, the Company announced that it will permanently shut down one pulp machine at its Kamloops pulp mill. This decision will result in a permanent curtailment of the Company’s annual pulp production by approximately 120,000 air-dried metric tons of sawdust softwood pulp, and will affect approximately 125 employees. These measures are expected to be in place by the end of March 2013.
The Company recognized a $5 million write-down of property, plant and equipment and $2 million of accelerated depreciation, included in Impairment and write-down of property, plant and equipment and intangible assets, with respect to the assets that will cease productive use in March 2013, when the shut-down is completed. The Company expects to record an additional $12 million of accelerated depreciation over the first 3 months of 2013 in relation to these assets. Given the decision to close the pulp machine, the Company assessed its ability to recover the carrying value of the long-lived assets exceeds theirKamloops mill from the undiscounted estimated future cash flows. The Company concluded that the undiscounted estimated future cash flows associated with the long-lived assets exceeded their carrying value and, as such, no additional impairment charge was required.
Mira Loma, California converting plant
During the first quarter of 2012, the Company recorded a $2 million write-down of property, plant and equipment at its Mira Loma location, in orderImpairment and write-down of property, plant and equipment and intangible assets.
Ashdown, Arkansas pulp and paper mill—Closure of a paper machine
As a result of the decision to assess ifpermanently shut down one of four paper machines on March 29, 2011, the Company recognized $73 million of accelerated depreciation, included in Impairment and write-down of property, plant and equipment and intangible assets, are impaired. in 2011. Given the substantial decline in the production capacity, at its Ashdown mill, the Company conducted a quantitative impairment test in the fourth quarter of 2011 and concluded that the recognition of an impairment loss for the Ashdown mill’s remaining long-lived assets was not required.
Lebel-sur-Quévillon Pulp Mill and Sawmill—Impairment of assets
In the eventfourth quarter of 2008, the estimated undiscounted future cash flows are lower thanCompany decided to permanently shut down the Lebel-sur-Quévillon pulp mill and sawmills. In 2011, following the signing of a definitive agreement, the Company recorded a $12 million impairment and write-down of property, plant and equipment relating to the remaining assets’ net book valuevalue. During the second quarter of 2012, the Company sold its pulp and sawmill assets to Fortress Global Cellulose Ltd. (“Fortress”) and its lands related to those assets to a subsidiary of the assets, a Step II impairment test must be carried out to determine the impairment charge. In Step II, long-lived assets are written down to their estimated fair values. Given there is generally no readily available quoted value for the Company’s long-lived assets, the Company determines fair valueGovernment of its long-lived assets using the estimated discounted future cash flow (“DCF”) expected from their use and eventual disposition, and by using the liquidation or salvage value in the case of idled assets. The DCF in Step II is based on the undiscounted cash flows in Step I.Quebec.
Papers Segment
Plymouth Pulp and Paper Mill
Mill—Conversion to Fluff Pulp
AsIn 2010, as a result of the decision to permanently shut down the remaining paper machine and convert the Plymouth facility to 100% fluff pulp production in the fourth quarter of 2009, the Company recognized under in
DOMTAR CORPORATION
NOTES TO CONSOLIDATED FINANCIAL STATEMENTS
DECEMBER 31, 2012
(IN MILLIONS OF DOLLARS, UNLESS OTHERWISE NOTED)
NOTE 4. IMPAIRMENT AND WRITE-DOWN OF PROPERTY, PLANT AND EQUIPMENT AND INTANGIBLE ASSETS (CONTINUED)
Impairment and write-down of property, plant and equipment and intangible assets, a $1 million write-down to the related paper machine and $39 million of accelerated depreciationdepreciation.
Columbus Paper Mill
On March 16, 2010, the Company announced that it would permanently close its coated groundwood paper mill in 2010 compared to $13 millionColumbus, Mississippi. This measure resulted in the fourthpermanent curtailment of 238,000 tons of coated groundwood and 70,000 metric tons of thermo-mechanical pulp and affected approximately 219 employees. The Company recorded a $9 million write-down for the related fixed assets included in Impairment and write-down of property, plant and equipment and intangible assets and $16 million of other charges included in Closure and restructuring costs (refer to Note 16). Operations ceased in April 2010.
Cerritos
During the second quarter of 20092010, the Company decided to close the Cerritos, California forms converting plant, and recorded a $1 million write-down for the related paper machineassets included in Impairment and write-down of property, plant and equipment and intangible assets and $1 million in severance and termination costs included in Closure and restructuring costs (refer to Note 16). Operations ceased on July 16, 2010.
Given the substantial changeIMPAIRMENT OF INTANGIBLE ASSETS
Deterioration in usesales and operating results of the pulp and paper mill,Ariva U.S., a subsidiary included in our Distribution segment, has led the Company conducted a Step Ito test the customer relationships of this asset group for recoverability. As of December 31, 2012, the Company recognized an impairment testcharge of $5 million included in Impairment and write-down of property, plant and equipment and intangible assets related to customer relationships in the Distribution segment, based on the revised long-term forecast in the fourth quarter of 2009 and2012. The Company concluded that the recognitionno further impairment or impairment indicators exist as of an impairment loss for the Plymouth mill’s long-lived assets was not required as the aggregate estimated undiscounted future cash flows exceeded the carrying value of the asset group of $336 million at the time of the announcement by a significant amount.
Estimates of undiscounted future cash flows used to test the recoverability of the fixed assets included key assumptions related to trend prices, inflation-adjusted cost projections, and the estimated useful life of the fixed assets. The main sources of such assumptions and related benchmarks were largely the same as those listed under “Impairment of Goodwill” below.December 31, 2012.
Changes in the assumptions and estimates may affect the Company’s forecasts and may lead to an outcome where impairment charges would be required. In addition, actual results may vary from the Company’s forecasts, and such variations may be material and unfavorable, thereby triggering the need for future impairment tests where the Company’s conclusions may differ in reflection of prevailing market conditions.
NOTES TO CONSOLIDATED FINANCIAL STATEMENTS
DECEMBER 31, 2010
(IN MILLIONS OF DOLLARS, UNLESS OTHERWISE NOTED)
NOTE 3. IMPAIRMENT AND WRITE-DOWN OF GOODWILL AND LONG-LIVED ASSETS (CONTINUED)
The following table summarizes the approximate impact that a change in the key assumption would have on the estimated undiscounted future cash flows at December 31, 2009, while holding all other assumptions constant:
| ||||||
| ||||||
Closure of Paper Machine
In the first quarter of 2009, the Company announced that it would permanently reduce its paper manufacturing at its Plymouth pulp and paper mill, by closing one of the two paper machines comprising the mill’s paper production unit. As a result, at the end of February 2009, there was a curtailment of 293,000 tons of the mill’s paper production capacity and the closure affected approximately 185 employees and a $35 million accelerated depreciation charge was recorded in the first quarter of 2009 for the related plant and equipment. Given the closure of the paper machine, the Company conducted a Step I impairment test on the Plymouth mill operation’s fixed assets and concluded that the undiscounted estimated future cash flows associated with the long-lived assets exceeded their carrying value and, as such, no additional impairment charge was required.
Columbus Paper Mill
On March 16, 2010, the Company announced that it would permanently close its coated groundwood paper mill in Columbus, Mississippi. This measure resulted in the permanent curtailment of 238,000 tons of coated groundwood and 70,000 metric tons of thermo-mechanical pulp, as well as affected 219 employees. The Company recorded a $9 million write-down for the related fixed assets under Impairment and write-down of property, plant and equipment and $16 million of other charges under Closure and restructuring costs (see Note 14). Operations ceased in April 2010.
During the fourth quarter of 2008, the Company was informed that beginning in early 2009 the Columbus paper mill would cease to benefit from a favorable power purchase agreement. This change in circumstances impacted the profitability outlook for the foreseeable future and triggered the need for a Step I impairment test of the fixed assets. Estimates of undiscounted future cash flows used to test the recoverability of the fixed assets included key assumptions related to trend prices, inflation-adjusted cost projections, and the estimated useful life of the fixed assets. The main sources of such assumptions and related benchmarks were largely the same as those listed under “Impairment of Goodwill” below.
Step I of the impairment test demonstrated that the carrying values of the fixed assets exceeded their estimated undiscounted future cash flows, indicating that an impairment existed. A Step II test was undertaken to determine the fair value of the remaining assets and the Company recorded a non-cash impairment charge of $95 million in the fourth quarter of 2008 to reduce the assets to their estimated fair value.
NOTES TO CONSOLIDATED FINANCIAL STATEMENTS
DECEMBER 31, 2010
(IN MILLIONS OF DOLLARS, UNLESS OTHERWISE NOTED)
NOTE 3. IMPAIRMENT AND WRITE-DOWN OF GOODWILL AND LONG-LIVED ASSETS (CONTINUED)
Cerritos
During the second quarter of 2010, the Company decided to close the Cerritos, California forms converting plant, and recorded a $1 million write-down for the related assets under Impairment and write-down of property, plant and equipment and $1 million in severance and termination costs under Closure and restructuring costs (see Note 14). Operations ceased on July 16, 2010.
Prince Albert Pulp Mill
As a result of a review of the current options for the disposal of the assets of this facility in the fourth quarter of 2009, the Company revised the estimated net realizable values of the remaining assets and recorded a non-cash write-down of $14 million related to fixed assets, primarily a turbine and a boiler. The write-down represented the difference between the new estimated liquidation or salvage value of the fixed assets and their carrying values.
Dryden Pulp and Paper Mill
In the fourth quarter of 2008, as a result of the decision to permanently shut down the remaining paper machine and converting center of the Dryden mill, the Company wrote-down these assets to their estimated recoverable amount via a non-cash impairment charge of $11 million. Given the substantial change in use of the pulp and paper mill, the Company conducted a Step I impairment test on the remaining Dryden pulp mill operation’s fixed assets. Estimates of undiscounted future cash flows used to test the recoverability of the fixed assets included key assumptions related to trend prices, inflation-adjusted cost projections, the forecasted exchange rate for the U.S. dollar and the estimated useful life of the fixed assets. The main sources of such assumptions and related benchmarks were largely the same as those listed under “Impairment of Goodwill” below.
Step I of the impairment test demonstrated that the carrying values of the fixed assets exceeded their estimated undiscounted future cash flows, indicating that an impairment existed. A Step II test was undertaken to determine the fair value of the remaining assets and the Company recorded a non-cash impairment charge of $265 million in the fourth quarter of 2008, to reduce the assets to their estimated fair value.
Former Wood Segment
In the fourth quarters of 2009 and 2008, the Company conducted an impairment test on the fixed assets and intangible assets (“the Asset Group”) of the former Wood reportable segment. The need for such test was triggered by operating losses sustained by the segment in 2007, 2008 and 2009, as well as short-term forecasted operating losses.
The Company completed the Step I impairment test during each period and concluded that the recognition of an impairment loss for the former Wood reportable segment’s long-lived assets was not required as the aggregate estimated undiscounted cash flows exceeded the carrying value of the Asset Group of $161 million by a significant amount.
NOTES TO CONSOLIDATED FINANCIAL STATEMENTS
DECEMBER 31, 2010
(IN MILLIONS OF DOLLARS, UNLESS OTHERWISE NOTED)
NOTE 3. IMPAIRMENT AND WRITE-DOWN OF GOODWILL AND LONG-LIVED ASSETS (CONTINUED)
Estimates of undiscounted future cash flows used to test the recoverability of the Asset Group included key assumptions related to trend prices, inflation-adjusted cost projections, the forecasted exchange rate for the U.S. dollar and the estimated useful life of the Asset Group. The Company believes such assumptions to be reasonable and to reflect forecasted market conditions at the valuation date. They involve a high degree of judgment and complexity and reflect the best estimates with the information available at the time the Company’s forecasts were developed. To this end, the Company evaluates the appropriateness of the assumptions as well as the overall forecasts by comparing projected results of upcoming years with actual results of preceding years and validating that differences therein are reasonable. Key assumptions were related to trend prices (based on data from Resource Information Systems Inc. (RISI), an authoritative independent source in the global forest products industry), material and energy costs and foreign exchange rates. A number of benchmarks from independent industry and other economic publications were used in order to develop projections for the forecast period.
The following table summarizes the approximate impact that a change in certain key assumptions would have on the estimated undiscounted future cash flows at December 31, 2009, while holding all other assumptions constant:
Key Assumptions | Increase of | Approximate impact on the undiscounted cash flows | ||||||
| (in millions of dollars) | ||||||||
Foreign exchange rates ($US to $CDN) | $ | 0.01 | $ (30) | |||||
Lumber pricing | $ | 5/MFBM | (1) | 32 | ||||
Changes in the assumptions and estimates may affect the forecasts and may lead to an outcome where impairment charges would be required. In addition, actual results may vary from the forecasts and such variations may be material and unfavorable, thereby triggering the need for future impairment tests where the conclusions may differ in reflection of prevailing market conditions.
Lebel-sur-Quévillon Pulp Mill and Sawmill
Pursuant to the decision in the fourth quarter of 2008 to permanently shut down the Lebel-sur-Quévillon pulp mill and sawmill of the Papers and former Wood segments, respectively, the Company recorded a non-cash write-down of $4 million related to fixed assets at both locations consisting mainly of a turbine, a recovery system and saw lines. The write-down represented the difference between the estimated liquidation or salvage values of the fixed assets and their carrying values.
White River Sawmill
In the fourth quarter of 2008, the net assets of the White River sawmill of the former Wood segment were held for sale and measured at the lower of the sawmill’s carrying value or estimated fair value less cost to sell. The fair value was determined by analyzing values assigned to it in a current potential sale transaction together with conditions prevailing in the markets where the sawmill operated. Pursuant to such analysis, non-cash write-downs amounting to $8 million related to fixed assets and $4 million related to intangible assets were recorded in
NOTES TO CONSOLIDATED FINANCIAL STATEMENTS
DECEMBER 31, 2010
(IN MILLIONS OF DOLLARS, UNLESS OTHERWISE NOTED)
NOTE 3. IMPAIRMENT AND WRITE-DOWN OF GOODWILL AND LONG-LIVED ASSETS (CONTINUED)
the fourth quarter of 2008 to reflect the difference between their respective estimated fair values less cost to sell and their carrying values. The sawmill was sold in June 2009 and the Company recorded a gain of $1 million related to the transaction.
IMPAIRMENT OF GOODWILL
Goodwill is not amortized and is subject to an annual goodwill impairment test. This test is carried out more frequently if events or changes in circumstances indicate that goodwill might be impaired. A Step I goodwill impairment test determines whether the fair value of a reporting unit exceeds the net carrying amount of that reporting unit, including goodwill, as of the assessment date in order to assess if goodwill is impaired. If the fair value is greater than the net carrying amount, no impairment is necessary. In the event that the net carrying amount exceeds the fair value, a Step II goodwill impairment test must be performed in order to determine the amount of the impairment charge. The implied fair value of goodwill in this test is estimated in the same way as goodwill was determined at the date of the acquisition in a business combination. That is, the excess of the fair value of the reporting unit over the fair value of the identifiable net assets of the reporting unit represents the implied value of goodwill. To accomplish this Step II test, the fair value of the reporting unit’s goodwill must be estimated and compared to its carrying value. The excess of the carrying value over the fair value is taken as an impairment charge in the period.
For purposes of impairment testing, goodwill must be assigned to one or more of the Company’s reporting units. The Company tests goodwill at the reporting unit level. All goodwill as of December 30, 2007 resided in the Papers segment and based upon the impairment test conducted in the fourth quarter of 2008, as described below, was determined to be impaired and written-off.
Step I Impairment Test
The Company determined that the discounted cash flow method (“DCF”) was the most appropriate approach to determine fair value of the reporting unit. The Company developed a projection of estimated future cash flows for the period from 2009 to 2013 (the “Forecast Period”) to serve as the basis of the DCF as well as a terminal value. In doing so, the Company used a number of key assumptions and benchmarks that are discussed under “Key Assumptions” below. The discounted future cash flow analysis resulted in a fair value of the reporting unit below the carrying value of the Papers reporting units net asset.
In order to evaluate the appropriateness of the conclusions of the Step I impairment test, the estimated fair value of the Company as a whole was reconciled to its market capitalization and compared to selected transactions involving the sale of comparable companies.
Step II Impairment Test
In Step II of the impairment test, the estimated fair value of the Papers reporting unit, determined in Step I, was allocated to its tangible and identified intangible assets, based on their relative fair values, in order to arrive at the fair value of goodwill. To this end, different valuation techniques were used to determine the fair values of individual tangible and intangible assets. A depreciated replacement cost method was mainly used to determine the fair value of fixed assets to the extent such values did not have economic obsolescence. Economic
NOTES TO CONSOLIDATED FINANCIAL STATEMENTS
DECEMBER 31, 2010
(IN MILLIONS OF DOLLARS, UNLESS OTHERWISE NOTED)
NOTE 3. IMPAIRMENT AND WRITE-DOWN OF GOODWILL AND LONG-LIVED ASSETS (CONTINUED)
obsolescence was based on cash flow projections. For idled mills of the Papers reporting unit, liquidation or salvage values were largely used as an indication of the fair values of their assets. The fair value of identified intangible assets, mainly consisting of marketing, customer and contract-related assets, were determined using an income approach.
The impairment test concluded that goodwill was impaired and the Company recorded a non-cash impairment charge of $321 million in the fourth quarter of 2008 to reflect the complete write-off of the Company’s goodwill.
Key Assumptions
The various valuation techniques used in Steps I and II incorporated a number of assumptions that the Company believed to be reasonable and to reflect forecasted market conditions at the valuation date. Assumptions in estimating future cash flows were subject to a high degree of judgement. The Company made all efforts to forecast future cash flows as accurately as possible with the information available at the time a forecast was made. To this end, the Company evaluated the appropriateness of the assumptions as well as the overall forecasts by comparing projected results of upcoming years with actual results of preceding years and validating those differences therein were reasonable. Key assumptions related to: price trends, material and energy costs, the discount rate, rate of decline of demand, the terminal growth rate, and foreign exchange rates. A number of benchmarks from independent industry and other economic publications were used in order to develop projections for the forecast period. Examples of such benchmarks and other assumptions included:
Revenues—the evolution of pulp and paper pricing over the forecast period was based on data from RISI.
Direct costs mainly consisted of fiber, wood, chemical and energy costs. The evolution of these direct costs over the forecast period was based on data from a number of benchmarks related to: selling prices of pulp, oil prices, housing starts, US producer price index, mixed chemical index, corn, natural gas, coal and electricity.
Foreign exchange rate estimates were based on a number of economic forecasts including those of Consensus Economics, Inc.
Discount rate—The discount rate used to determine the present value of the Papers reporting unit’s forecasted cash flows represented the weighted average cost of capital (“WACC”). The Company’s WACC was determined to be between 10.5% and 11%.
Rate of decline of demand and terminal growth rate – the Company assumed that a number of business and commercial papers would see demand declines in line with industry expectations. This was reflected in the assumptions in the rate of decline in demand over the forecast period as well as in the assumption of the terminal growth rate.
NOTES TO CONSOLIDATED FINANCIAL STATEMENTS
DECEMBER 31, 2010
(IN MILLIONS OF DOLLARS, UNLESS OTHERWISE NOTED)
STOCK-BASED COMPENSATION
2007 OMNIBUS INCENTIVE PLAN
Under the Omnibus Incentive Plan, (the “Omnibus Plan”), the Company may award to executiveskey employees and other key employeesnon-employee directors, at the discretion of the Human Resources Committee of the Board of Directors, non-qualified stock options, incentive stock options, stock appreciation rights, shares of restricted stock units, performance-conditioned restricted stock units, performance conditioned restricted stockshare units, performance shares, deferred share units and other stock-based awards. On December 31, 2010, 1,451,359 common shares were reserved for issuanceThe Company generally grant awards annually and uses, when available, treasury stock to fulfill awards settled in connection with awards granted under the Omnibus Plan. Awards may be subject to both performance and time-based vesting.
The exercise price of options and stock appreciation rights is equal to the closing price per share of the Company’s common stock on the New York Stock Exchange on the date of grant.and option exercises.
On May 10, 2010, a fourth grant under the Omnibus Incentive Plan was provided to executives and other key employees as described below.
DOMTAR CORPORATION
NOTES TO CONSOLIDATED FINANCIAL STATEMENTS
DECEMBER 31, 2012
(IN MILLIONS OF DOLLARS, UNLESS OTHERWISE NOTED)
NOTE 5. STOCK-BASED COMPENSATION (CONTINUED)
PERFORMANCE CONDITIONEDSHARE UNITS (“PSUs”) AND PERFORMANCE-CONDITIONED RESTRICTED STOCK UNITS (“PCRSUs”)
In 2010PSUs are granted to management and 2009,non-management committee members. These awards will be settled in shares for management committee members and in cash equivalent to the Company did not grant any new PCRSUs. As a result of previously granted PCRSUs having achieved their target, the Company issued 22,645 PCRSUs in 2010 (2009—86,555). On February 20, 2008, the Company granted 63,881 PCRSUs having a weighted average grant date fair value of $80.52 which at December 31, 2010 reached the end of its contractual life. Each PCRSU is equivalent in value to one common share price for non-management committee members, based on market conditions and/or performance and is subject to a service condition as well as a performance or market condition.conditions. These awards have an additional feature where the ultimate number of units that vest will be determined by the Company’s performance results or shareholder return in relation to a predetermined target over the period to vesting.vesting period. No awards vest when the minimum thresholds are not achieved. The performance measurement date will vary depending on the specific award. Upon vesting, the participantsThese awards will receive common sharescliff vest on December 31, 2014.
PSU/PCRSU | Number of units | Weighted average grant date fair value | ||||||
| $ | ||||||||
Vested and non-vested at December 31, 2011 | 140,499 | 101.69 | ||||||
Granted/issued | 87,314 | 101.06 | ||||||
Forfeited | (3,525 | ) | 96.28 | |||||
Cancelled | (23,417 | ) | 98.68 | |||||
Modified(1) | (18,627 | ) | 75.72 | |||||
Vested and settled | — | — | ||||||
|
|
|
| |||||
Vested and non-vested at December 31, 2012 | 182,244 | 104.54 | ||||||
|
|
|
| |||||
| (1) | In December 2012, the Human Resources Committee modified a performance condition that affected the vesting of awards; as such, 18,627 units of previously granted PSUs were modified to Restricted Stock Units (“RSUs”). This modification affected three employees; two non-management committee members and one management committee member. No significant incremental costs were incurred as a result of this modification. |
As a result of PSUs granted in 2011 that have performed under their target, the Company orcancelled 23,417 units in certain instances cash2012 with a weighted average grant date fair value of an equivalent value.$98.68 (2011—$89.02; 2010 PCRSUs—nil).
At December 31, 2010, one market condition2012, 45,700 PCRSUs remain outstanding and onewill be settled in 2013.
The fair value of performance condition for various measurement periods (2009—one market condition forshare units granted in 2012 and 2011 was estimated at the two first measurement periods; 2008—one market condition forgrant date using a Monte Carlo simulation methodology. The Monte Carlo simulation creates artificial futures by generating numerous sample paths of potential outcomes. The following assumptions were used in calculating the first measurement period), related to the 2008 grant, was achieved. As such these portionsfair value of the PCRSU grant as well as a portion issued in 2010 representing 79,421 (2009—15,890; 2008—3,985) units cliff vested on December 31, 2010.granted:
| 2012 | 2011 | |||||||
Dividend yield | 1.383 | % | 0.870 | % | ||||
Expected volatility 1 year | 38 | % | 36 | % | ||||
Expected volatility 3 years | 66 | % | 86 | % | ||||
Risk-free interest rate December 31, 2011 | — | 0.411 | % | |||||
Risk-free interest rate December 31, 2012 | 0.993 | % | 0.869 | % | ||||
Risk-free interest rate December 31, 2013 | 0.662 | % | 1.388 | % | ||||
Risk-free interest rate December 31, 2014 | 0.711 | % | — | |||||
|
|
|
| |||||
At December 31, 2009, one market condition and one performance condition for various measurement periods (2008—nil), related to the 2007 grant, were achieved. As such, these portions2012, of the PCRSU grant as well as a portion issuedtotal non-vested PSUs, 97,335 will be settled in 2009 representing 51,642 (2008—nil) units, cliff vested on December 31, 2009.shares and 84,909 will be settled in cash.
On March 31, 2009, PCRSUs granted in 2007 as well as a portion issued in 2009 representing 88,082 units, vested based on the attainment of a variety of business integration and synergy achievement goals.
DOMTAR CORPORATION
NOTES TO CONSOLIDATED FINANCIAL STATEMENTS
DECEMBER 31, 20102012
(IN MILLIONS OF DOLLARS, UNLESS OTHERWISE NOTED)
NOTE 4.5. STOCK-BASED COMPENSATION (CONTINUED)
RESTRICTED STOCK UNITS (“RSUs”)
On May 10, 2010,RSUs are granted to management and non-management committee members. These awards will be settled in shares for management committee members and in cash equivalent to the Company granted 110,965 (2009—436,575; 2008—49,198) RSUs having a weighted average grant date fair value of $66.81 (2009—$12.60; 2008—$80.52) and a weighted average remaining contractual life of approximately 28 months (2009—27 months; 2008—26 months). The Company will deliver one share of common stock in settlement of each outstanding RSU that has vested in accordance with the stipulatedprice for non-management committee members, upon completing service conditions. The awards cliff vest at various dates up to May 10, 2013 (2009—April 8, 2012; 2008—February 20, 2011).after approximately a three year service period. As a result of quarterly dividends, on July 15 and October 15, 2010, the Company granted a total of 5,372 RSUs to participants of the Omnibus Plan. Additionally, as part of the long-term incentive plan, the Company also granted 76,850bonus RSUs that vest in approximately equal installments over three years beginning on May 10, 2010.
DEFERRED STOCK UNITS (“DSUs”)
In 2010 the Company did not grant any new DSUs to its employees under the Omnibus Plan. As a result of quarterly dividends, on July 15 and October 15, 2010, the Company granted a total of 231 DSUs to participantsfirst anniversary of the Omnibus Plan. On April 8, 2009,grant. Additionally, the Company granted 26,667 (2008—nil) DSUs having a weighted averageRSUs are credited with dividend equivalents in the form of additional RSUs when cash dividends are paid on the Company’s stock. The grant date fair value of $12.60RSUs is equal to the market value of the Company’s stock on the date the awards are granted.
RSU | Number of units | Weighted average grant date fair value | ||||||
| $ | ||||||||
Non-vested at December 31, 2011 | 625,549 | 39.32 | ||||||
Granted/issued | 54,470 | 92.73 | ||||||
Forfeited | (9,802 | ) | 77.88 | |||||
Modified(1) | 18,627 | 78.94 | ||||||
Vested and settled | (405,786 | ) | 20.84 | |||||
|
|
|
| |||||
Non-vested at December 31, 2012 | 283,058 | 77.36 | ||||||
|
|
|
| |||||
| (1) | In December 2012, the Human Resources Committee modified a performance condition that affected the vesting of awards; as such, 18,627 units of previously granted PSUs were modified to RSUs. This modification affected three employees; two non-management committee members and one management committee member. No significant incremental costs were incurred as a result of this modification. |
At December 31, 2012, of the total non-vested RSUs, 85,640 will vestbe settled in three equal annual instalments beginning on April 8, 2009.shares and 197,418 will be settled in cash.
The Company delivers, on a quarterly basis, DEFERRED SHARE UNITS (“DSUs”)
DSUs are granted to its Directors thatand to management committee members. The DSUs granted to the Directors vest immediately on the grant date. The DSUs are credited with dividend equivalents in the form of additional DSUs when cash dividends are paid on the Company’s stock. For Directors DSUs, the Company will deliver at the option of the holder either one share of common stock or the cash equivalent of the fair market value on settlement of each outstanding DSU (including dividend equivalents accumulated) upon termination of service. In 2010, the Company granted 15,365 (2009—47,156; 2008—23,848) DSUs to its Directors.
NON-QUALIFIED STOCK OPTIONS
On May 10, 2010, the Company granted 2,100 (2009—120,646; 2008—nil) stock options, having an exercise price of $66.81 (2009—$12.60) andThe grant date fair value of $41.84 (2009—$9.05). DSU awards is equal to the market value of the Company’s stock on the date the awards were granted.
DOMTAR CORPORATION
NOTES TO CONSOLIDATED FINANCIAL STATEMENTS
DECEMBER 31, 2012
(IN MILLIONS OF DOLLARS, UNLESS OTHERWISE NOTED)
NOTE 5. STOCK-BASED COMPENSATION (CONTINUED)
Management Committee members may elect to defer awards earned under another program into DSUs. In 2012, 3,758 vested awards were deferred to DSUs, and those DSUs will be settled in share of common stock in February 2019.
DSU | Number of units | Weighted-average grant date fair value | ||||||
| $ | ||||||||
Vested at December 31, 2011 | 137,565 | 44.52 | ||||||
Granted/issued | 19,253 | 79.79 | ||||||
Settled | (17,991 | ) | 53.24 | |||||
|
|
|
| |||||
Vested at December 31, 2012 | 138,827 | 48.28 | ||||||
|
|
|
| |||||
NON-QUALIFIED AND PERFORMANCE STOCK OPTIONS
The stock options vest at various dates up to May 10, 2013 subject to service conditions. Upon exercise,conditions for non-qualified stock options and, for performance stock options, if certain market conditions are met in addition to the option holders may elect to proceed with a cashless exercise and receive common shares net of the deduction for cashless exercise.service period. The options expire at various dates no later than seven years from the date of grant.
OPTIONS (including Performance options) | Number of options | Weighted average exercise price | Weighted average remaining life (in years) | Aggregate intrinsic value (in millions) | ||||||||||||
| $ | $ | |||||||||||||||
Outstanding at December 31, 2009 | 658,583 | 58.15 | 3.3 | — | ||||||||||||
Granted | 48,880 | 66.81 | �� | 6.4 | 0.4 | |||||||||||
Exercised | (86,573 | ) | 20.37 | — | — | |||||||||||
Forfeited/expired | (29,574 | ) | 62.36 | — | — | |||||||||||
|
| |||||||||||||||
Outstanding at December 31, 2010 | 591,316 | 64.19 | 4.0 | 12.1 | ||||||||||||
|
|
|
|
|
|
|
| |||||||||
Options exercisable at December 31, 2010 | 272,799 | 81.78 | 2.9 | 0.9 | ||||||||||||
|
|
|
|
|
|
|
| |||||||||
Outstanding at December 31, 2010 | 591,316 | 64.19 | 4.0 | 12.1 | ||||||||||||
Exercised | (182,480 | ) | 45.63 | — | — | |||||||||||
Forfeited/expired | (55,175 | ) | 95.36 | — | — | |||||||||||
|
| |||||||||||||||
Outstanding at December 31, 2011 | 353,661 | 68.90 | 3.1 | 7.0 | ||||||||||||
|
|
|
|
|
|
|
| |||||||||
Options exercisable at December 31, 2011 | 160,590 | 80.79 | 2.4 | 0.7 | ||||||||||||
|
|
|
|
|
|
|
| |||||||||
Outstanding at December 31, 2011 | 353,661 | 68.90 | 3.1 | 7.0 | ||||||||||||
Exercised | (66,416 | ) | 30.59 | — | — | |||||||||||
Forfeited/expired | (51,654 | ) | 60.30 | — | — | |||||||||||
|
| |||||||||||||||
Outstanding at December 31, 2012 | 235,591 | 81.56 | 2.2 | 4.2 | ||||||||||||
|
|
|
|
|
|
|
| |||||||||
Options exercisable at December 31, 2012 | 136,028 | 61.36 | 2.4 | 2.8 | ||||||||||||
|
|
|
|
|
|
|
| |||||||||
PERFORMANCE STOCK OPTIONSDOMTAR CORPORATION
On May 10, 2010, the Company granted 46,780 (2009—151,831; 2008—28,375) performance stock options having an exercise price of $66.81 (2009—$12.60; 2008—$80.52) and grant date fair value of $43.03 (2009—$9.05; 2008—$24.36). The stock options vest at various dates up to May 10, 2013 if certain market conditions are met in addition to a service period. Upon exercise, the option holders may elect to proceed with a cashless exercise and receive common shares net of the deduction for cashless exercise. The options expire at various dates no later than seven years from the date of grant.
GENERAL TERMS OF AWARDS UNDER THE OMNIBUS PLAN
TERMINATION OF EMPLOYMENT
Upon a termination due to death, time-based awards vest in full, performance-based awards vest at target levels, and options and stock appreciation rights remain exercisable for one year. Upon a termination due to
NOTES TO CONSOLIDATED FINANCIAL STATEMENTS
DECEMBER 31, 20102012
(IN MILLIONS OF DOLLARS, UNLESS OTHERWISE NOTED)
NOTE 4.5. STOCK-BASED COMPENSATION (CONTINUED)
disability, time-based awards vest in full, performance-based awards continueIn addition to vest in accordance with the original vesting schedule,above noted outstanding options, the Company has 3,738 outstanding and options andexercisable stock appreciation rights remainat December 31, 2012 with a weighted average exercise price of $78.95.
The total intrinsic value of options exercised in 2012 was $4 million. Based on the Company’s closing year-end stock price of $83.52, the aggregate intrinsic value of options outstanding and options exercisable for one year. Upon retirement, a pro-rated portion of time-based awards vest and a pro-rated portion of performance-based awards continue to vest based on actual performance during the applicable performance period, and all awards remain outstanding for five years. Upon a termination for cause or a voluntary termination by a plan participant, all awards, including vested but unexercised awards, are forfeited without payment. Upon an involuntary termination for any reason other than cause, vested awards remain outstanding for 90 days and unvested awards are forfeited.is $3 million, respectively.
CHANGE IN CONTROL
Upon a change in control, unless otherwise determined by the Human Resources Committee of the Board of Directors, a participant’s awards will be replaced with awards of the acquiring company having the same or better terms. If there is a change in control and a participant’s employment is terminated for business reasons in the three months prior to or twenty-four months after the change in control, his or her time-based awards will fully vest and performance-based awards will vest to the extent the applicable performance goals have been achieved as of the date of the change in control or the end of the fiscal quarter immediately prior to the date of termination, whichever is greater.
If replacement awards are not available, unless the Human Resources Committee of the Board of Directors determines otherwise, all time-based awards fully vest and performance-based awards vest to the extent the performance goals related to the award have been achieved as of the date of the change in control. Alternatively, the Human Resources Committee of the Board of Directors may determine that vested awards will be cancelled in exchange for a cash payment (or other form of change in control consideration) based on theThe fair value of the changestock options granted in control payment2010 was estimated at the grant date using a Black-Scholes based option pricing model or an option pricing model that incorporated the market conditions when applicable. The following assumptions were used in calculating the fair value of the options granted:
| 2010 | ||||
Dividend yield | 0 | % | ||
Expected volatility | 75 | % | ||
Risk-free interest rate | 3 | % | ||
Expected life | 7 years | |||
For the year ended December 31, 2012, compensation expense recognized in the Company’s results of operations was approximately $20 million (2011—$23 million; 2010—$25 million) for all of the outstanding awards. Compensation costs not yet recognized amounted to approximately $11 million (2011—$16 million; 2010—$22 million) and that unvested awards will be forfeited.recognized over the remaining service period of approximately 25 months. The Company’s Boardaggregate value of Directors may also accelerateliability awards settled in 2012 was $35 million. The total fair value of shares vested in 2012 was $6 million. Compensation costs for performance awards are based on management’s best estimate of the vestingfinal performance measurement. As a result of any or allstock-based compensation awards uponexercised during the period, the Company recognized a change$1 million tax benefit, which is included in control.Additional paid-in capital in the Consolidated Balance Sheets.
CLAWBACK FOR FINANCIAL REPORTING MISCONDUCT
If a participant in the Omnibus Plan knowingly or grossly negligently engages in financial reporting misconduct, then all awards and gains from the exercise of options or stock appreciation rights in the 12 months prior to the date the misleading financial statements were issued as well as any awards that vested based on the misleading financial statements will be disgorged to the Company.
For In addition, the year ended December 31, 2010, compensation expense recognized in the Company’s results of operations was approximately $25 million (2009—$27 million; 2008—$16 million) for all of the outstanding awards. Compensation costs not yet recognized amountCompany may cancel or reduce, or require a participant to approximately $22 million (2009—$21 million; 2008—$11 million)forfeit and will be recognized over the remaining service period. Compensation costs for performance awards are based on management’s best estimate of the final performance measurement.
REPLACEMENT PLANS FOR AWARDS TO FORMER EMPLOYEES OF WEYERHAEUSER
Prior to the consummation of the Transaction, employees of Weyerhaeuser who were being transferreddisgorge to the Company were given the opportunity to exchange their outstanding Weyerhaeuser equity awards for awards ofor reimburse the Company havingfor, any awards granted or vested, and bonus granted or paid, and any gains earned or accrued, due to the same terms and conditionsexercise, vesting or settlement of awards or sale of any common stock, to the extent permitted or required by, or pursuant to any Corporation policy implemented as their prior Weyerhaeuser awards. The Company has adopted three plansrequired by applicable law, regulation or stock exchange rule as may from time to provide for the grant of the Company’s equity awardstime be in exchange for the prior planeffect.
DOMTAR CORPORATION
NOTES TO CONSOLIDATED FINANCIAL STATEMENTS
DECEMBER 31, 2010
(IN MILLIONS OF DOLLARS, UNLESS OTHERWISE NOTED)
NOTE 4. STOCK-BASED COMPENSATION (CONTINUED)
awards. The Restricted Share Units (“RSUs”), Stock Appreciation Rights (“SARs”) and Stock Options mirror the three Weyerhaeuser plans under which the prior plan awards were initially granted.
Awards were made under these plans in connection with the consummation of the Transaction only to those employees who elected to exchange their prior plan awards for the Company’s equity awards.
REPLACEMENT PLANS FOR FORMER DOMTAR INC. AWARDS
Options granted to Domtar Inc. employees, whether vested or unvested, were exchanged on the same terms and conditions for an option to purchase a number of shares of common stock of Domtar Corporation equal to the number of the Company’s common shares of equivalent value determined using the Black-Scholes option-pricing model, depending if the exercise price was higher, equal or less than the market value at the time of the exchange.
Each outstanding award of restricted Domtar Inc. common shares was exchanged on a one-for-one basis, and on the same terms and conditions as applied to Domtar Inc. restricted share awards, for awards of restricted shares of the Company’s common shares (“RSAs”). On March 7, 2007, 54,578 common shares were acquired and are held in trust in exchange for the former Domtar Inc. restricted awards.
Each outstanding grant of DSUs with respect to Domtar Inc. common shares was exchanged on a one-for-one basis, on the same terms and conditions as applied to the Domtar Inc. DSUs, for DSUs with respect to shares of the Company’s common stock. On March 7, 2007, 29,310 DSUs and 4,568 DSUs were issued to outside directors and executives, respectively, in exchange for Domtar Inc. DSUs. DSUs granted after March 7, 2007 are granted under the Omnibus Incentive plan.
SUMMARY OF OUTSTANDING AWARDS
Details regarding Domtar Corporation outstanding awards are presented in the following tables:
NUMBER OF AWARDS | PCRSU | RSU/RSA | DSU | |||||||||
Outstanding at December 30, 2007 | 115,092 | 141,067 | 31,508 | |||||||||
Granted | 63,881 | 49,198 | 23,848 | |||||||||
Forfeited/expired | (4,503 | ) | (6,900 | ) | — | |||||||
Exercised/settled | — | (25,848 | ) | (4,671 | ) | |||||||
Total outstanding at December 31, 2008 | 174,470 | 157,517 | 50,685 | |||||||||
Granted/issued | 86,555 | 436,575 | 73,823 | |||||||||
Forfeited/expired | (823 | ) | (37,493 | ) | — | |||||||
Exercised/settled | (88,082 | ) | (31,131 | ) | — | |||||||
Total outstanding at December 31, 2009 | 172,120 | 525,468 | 124,508 | |||||||||
Granted/issued | 22,645 | 193,187 | 15,596 | |||||||||
Forfeited/expired | (5,660 | ) | (10,528 | ) | — | |||||||
Exercised/settled | (58,067 | ) | (89,745 | ) | — | |||||||
Total outstanding at December 31, 2010 | 131,038 | 618,382 | 140,104 | |||||||||
NOTES TO CONSOLIDATED FINANCIAL STATEMENTS
DECEMBER 31, 2010
(IN MILLIONS OF DOLLARS, UNLESS OTHERWISE NOTED)
NOTE 4. STOCK-BASED COMPENSATION (CONTINUED)
OPTIONS (including Performance Options) | Number of options | Weighted average exercise price | Weighted average remaining life (in years) | Aggregate intrinsic value (in millions) | ||||||||||||
| $ | $ | |||||||||||||||
Outstanding at December 30, 2007 | 426,739 | 92.28 | 5.4 | 2.5 | ||||||||||||
Granted | 28,375 | 80.52 | 6.1 | — | ||||||||||||
Exercised | (928 | ) | 78.48 | — | — | |||||||||||
Forfeited/expired | (22,022 | ) | 100.56 | — | — | |||||||||||
Outstanding at December 31, 2008 | 432,164 | 91.08 | 4.7 | — | ||||||||||||
Options exercisable at December 31, 2008 | 237,631 | 86.77 | 4.1 | — | ||||||||||||
Outstanding at December 31, 2008 | 432,164 | 91.08 | 4.7 | — | ||||||||||||
Granted | 272,477 | 12.60 | 2.3 | 11.0 | ||||||||||||
Forfeited/expired | (46,058 | ) | 97.67 | — | — | |||||||||||
Outstanding at December 31, 2009 | 658,583 | 58.15 | 3.3 | — | ||||||||||||
Options exercisable at December 31, 2009 | 325,736 | 92.64 | 3.1 | — | ||||||||||||
Outstanding at December 31, 2009 | 658,583 | 58.15 | 3.3 | — | ||||||||||||
Granted | 48,880 | 66.81 | 6.4 | 0.4 | ||||||||||||
Exercised | (86,573 | ) | 20.37 | — | — | |||||||||||
Forfeited/expired | (29,574 | ) | 62.36 | — | — | |||||||||||
Outstanding at December 31, 2010 | 591,316 | 64.19 | 4.0 | 12.1 | ||||||||||||
Options exercisable at December 31, 2010 | 272,799 | 81.78 | 2.9 | 0.9 | ||||||||||||
SARs | Number of SARs | Weighted average exercise price | Weighted average remaining life (in years) | Aggregate intrinsic value (in millions) | ||||||||||||
| $ | $ | |||||||||||||||
Outstanding at December 30, 2007 | 16,283 | 78.99 | 7.5 | 0.2 | ||||||||||||
Forfeited | (568 | ) | 79.65 | — | — | |||||||||||
Outstanding at December 31, 2008 | 15,715 | 78.97 | 6.5 | — | ||||||||||||
SARs exercisable at December 31, 2008 | 8,303 | 78.02 | 6.2 | — | ||||||||||||
Outstanding at December 31, 2008 | 15,715 | 78.97 | 6.5 | — | ||||||||||||
Forfeited | (331 | ) | 82.67 | — | — | |||||||||||
Outstanding at December 31, 2009 | 15,384 | 78.89 | 5.4 | — | ||||||||||||
SARs exercisable at December 31, 2009 | 12,995 | 78.75 | 5.4 | — | ||||||||||||
Outstanding at December 31, 2009 | 15,384 | 78.89 | 5.4 | — | ||||||||||||
Exercised | (1,577 | ) | 75.25 | — | — | |||||||||||
Outstanding at December 31, 2010 | 13,807 | 79.31 | 4.5 | — | ||||||||||||
SARs exercisable at December 31, 2010 | 13,807 | 79.31 | 4.5 | — | ||||||||||||
NOTES TO CONSOLIDATED FINANCIAL STATEMENTS
DECEMBER 31, 2010
(IN MILLIONS OF DOLLARS, UNLESS OTHERWISE NOTED)
NOTE 4. STOCK-BASED COMPENSATION (CONTINUED)
The fair value of the stock options granted in 2010 was estimated at the grant date using a Black-Scholes based option pricing model or an option pricing model that incorporated the market conditions when applicable. The following assumptions were used in calculating the fair value of the options granted.
| 2010 | 2009 | 2008 | ||||||||||
Dividend yield | 0 | % | 0 | % | 0 | % | ||||||
Expected volatility | 75 | % | 77 | % | 39 | % | ||||||
Risk-free interest rate | 3 | % | 3 | % | 3 | % | ||||||
Expected life | 7 years | 7 years | 4 years | |||||||||
EARNINGS (LOSS) PER SHARE
The following table provides the reconciliation between basic and diluted earnings (loss) per share:
| Year ended December 31, 2010 | Year ended December 31, 2009 | Year ended December 31, 2008 | ||||||||||
Net earnings (loss) | $ | 605 | $ | 310 | $ | (573 | ) | |||||
Weighted average number of common and exchangeable shares outstanding (millions) | 42.8 | 43.0 | 43.0 | |||||||||
Effect of dilutive securities (millions) | 0.4 | 0.2 | — | |||||||||
Weighted average number of diluted common and exchangeable shares outstanding (millions) | 43.2 | 43.2 | 43.0 | |||||||||
Basic net earnings (loss) per share (in dollars) | $ | 14.14 | $ | 7.21 | $ | (13.33 | ) | |||||
Diluted net earnings (loss) per share (in dollars) | $ | 14.00 | $ | 7.18 | $ | (13.33 | ) | |||||
The following table provides the securities that could potentially dilute basic earnings (loss) per share in the future, but were not included in the computation of diluted earnings (loss) per share because to do so would have been anti-dilutive:
| December 31, 2010 | December 31, 2009 | December 31, 2008 | ||||||||||
Restricted stock units | — | 6,586 | 58,550 | |||||||||
Options | 380,214 | 386,106 | 432,164 | |||||||||
Performance-based awards | — | 33,764 | 103,550 | |||||||||
The calculation of basic earnings per common share for the year ended December 31, 2010 is based on the weighted average number of Domtar common stock outstanding during the year. The calculation for diluted earnings per common share recognizes the effect of all potential dilutive common stock. A portion of the stock options to purchase common shares is excluded in the computation of diluted net earnings (loss) per share in periods because to do so would have been anti-dilutive.
NOTES TO CONSOLIDATED FINANCIAL STATEMENTS
DECEMBER 31, 20102012
(IN MILLIONS OF DOLLARS, UNLESS OTHERWISE NOTED)
EARNINGS PER SHARE
The calculation of basic earnings per common share for the year ended December 31, 2012 is based on the weighted average number of Domtar common shares outstanding during the year. The calculation for diluted earnings per common share recognizes the effect of all potential dilutive common securities.
The following table provides the reconciliation between basic and diluted earnings per share:
| Year ended December 31, 2012 | Year ended December 31, 2011 | Year ended December 31, 2010 | ||||||||||
Net earnings | $ | 172 | $ | 365 | $ | 605 | ||||||
|
|
|
|
|
| |||||||
Weighted average number of common and exchangeable shares outstanding (millions) | 36.0 | 39.9 | 42.8 | |||||||||
Effect of dilutive securities (millions) | 0.1 | 0.3 | 0.4 | |||||||||
|
|
|
|
|
| |||||||
Weighted average number of diluted common and exchangeable shares outstanding (millions) | 36.1 | 40.2 | 43.2 | |||||||||
|
|
|
|
|
| |||||||
Basic net earnings per share (in dollars) | $ | 4.78 | $ | 9.15 | $ | 14.14 | ||||||
Diluted net earnings per share (in dollars) | $ | 4.76 | $ | 9.08 | $ | 14.00 | ||||||
|
|
|
|
|
| |||||||
The following table provides the securities that could potentially dilute basic earnings per share in the future, but were not included in the computation of diluted earnings per share because to do so would have been anti-dilutive:
| December 31, 2012 | December 31, 2011 | December 31, 2010 | ||||||||||
Options | 105,205 | 168,692 | 380,214 | |||||||||
|
|
|
|
|
| |||||||
DOMTAR CORPORATION
NOTES TO CONSOLIDATED FINANCIAL STATEMENTS
DECEMBER 31, 2012
(IN MILLIONS OF DOLLARS, UNLESS OTHERWISE NOTED)
PENSION PLANS AND OTHER POST-RETIREMENT BENEFIT PLANS
DEFINED CONTRIBUTION PLANS
The Company has several defined contribution plans and multi-employermultiemployer plans. The pension expense under these plans is equal to the Company’s contribution. For the year ended December 31, 2010,2012, the related pension expense was $25$24 million (2009—(2011—$24 million; 2008—2010—$2125 million).
DEFINED BENEFIT PLANS AND OTHER POST-RETIREMENT BENEFIT PLANS
The Company has severalsponsors both contributory and non-contributory U.S. and non-U.S. defined benefit pension plans covering athat cover the majority of allits employees. Non-unionized employees in Canada joining the Company after June 1, 2000 participate in defined contribution pension plans. TheSalaried employees in the U.S. joining the Company after January 1, 2008 participate in a defined contribution pension plan. Also, starting on January 1, 2013, all unionized employees covered under the agreement with the United Steel Workers, not grandfathered under the existing defined benefit pension plans, are generally contributory in Canada and non-contributory in the United States.will transition to a defined contribution pension plan for future service. The Company also providessponsors a number of other post-retirement benefit plans tofor eligible CanadianU.S. and U.S.non-U.S. employees; the plans are unfunded and include life insurance programs and medical and dental benefits and short-term and long-term disability programs.benefits. The Company also provides supplemental unfunded defined benefit pension plans to certain senior management employees.
Related pension and other post-retirement plan expenses and the corresponding obligations are actuarially determined using management’s most probable assumptions.
The Company’s pension plan funding policy is to contribute annually the amount required to provide for benefits earned in the year, and to fund both solvency deficiencies, funding shortfalls and past service obligations over periods not exceeding those permitted by the applicable regulatory authorities. Past service obligations primarily arise from improvements to plan benefits. The other post-retirement benefit plans are not funded and contributions are made annually to cover benefits payments.
The Company expects to contribute a minimum total amount of $53$25 million in 20112013 compared to $161$86 million in 2010 (2009—2012 (2011—$13095 million; 2010—$161 million) to the pension plans. The payments made in 20102012 to the other post-retirement benefit plans amounted to $8$7 million (2009—(2011—$8 million; 2010—$8 million).
DOMTAR CORPORATION
NOTES TO CONSOLIDATED FINANCIAL STATEMENTS
DECEMBER 31, 20102012
(IN MILLIONS OF DOLLARS, UNLESS OTHERWISE NOTED)
NOTE 6.7. PENSION PLANS AND OTHER POST-RETIREMENT BENEFIT PLANS (CONTINUED)
CHANGE IN ACCRUED BENEFIT OBLIGATION
The following table represents the change in the accrued benefit obligation as of December 31, 20102012 and December 31, 2009,2011, the measurement date for each year:
| December 31, 2010 | December 31, 2009 | December 31, 2012 | December 31, 2011 | |||||||||||||||||||||||||||||
| Pension plans | Other post-retirement benefit plans | Pension plans | Other post-retirement benefit plans | Pension plans | Other post-retirement benefit plans | Pension plans | Other post-retirement benefit plans | |||||||||||||||||||||||||
| $ | $ | $ | $ | $ | $ | $ | $ | |||||||||||||||||||||||||
Accrued benefit obligation at beginning of year | 1,442 | 122 | 1,121 | 99 | 1,755 | 113 | 1,636 | 114 | ||||||||||||||||||||||||
Service cost for the year | 32 | 3 | 35 | 4 | 40 | 3 | 35 | 3 | ||||||||||||||||||||||||
Interest expense | 87 | 7 | 84 | 7 | 85 | 6 | 87 | 6 | ||||||||||||||||||||||||
Plan participants’ contributions | 7 | — | 7 | — | 7 | — | 7 | — | ||||||||||||||||||||||||
Actuarial loss | 152 | 12 | 141 | 19 | 200 | 13 | 99 | 3 | ||||||||||||||||||||||||
Plan amendments | 1 | — | — | (11 | ) | (3 | ) | — | 17 | (3 | ) | |||||||||||||||||||||
Acquisition of business | 9 | — | — | — | ||||||||||||||||||||||||||||
Benefits paid | (96 | ) | — | (91 | ) | — | (93 | ) | (1 | ) | (98 | ) | (1 | ) | ||||||||||||||||||
Direct benefit payments | (4 | ) | (8 | ) | (3 | ) | (8 | ) | (4 | ) | (6 | ) | (4 | ) | (7 | ) | ||||||||||||||||
Settlement | (64 | ) | — | (28 | ) | — | (115 | ) | — | (4 | ) | — | ||||||||||||||||||||
Curtailment | 9 | (27 | ) | 1 | — | — | (6 | ) | 13 | — | ||||||||||||||||||||||
Effect of foreign currency exchange rate change | 70 | 5 | 174 | 12 | 33 | 2 | (33 | ) | (2 | ) | ||||||||||||||||||||||
Special termination benefits | — | — | 1 | — | ||||||||||||||||||||||||||||
|
|
|
| |||||||||||||||||||||||||||||
Accrued benefit obligation at end of year | 1,636 | 114 | 1,442 | 122 | 1,914 | 124 | 1,755 | 113 | ||||||||||||||||||||||||
|
|
|
| |||||||||||||||||||||||||||||
CHANGE IN FAIR VALUE OF ASSETS
The following table represents the change in the fair value of assets reflecting the actual return on plan assets, the contributions and the benefits paid during the year:
| December 31, 2010 Pension plans | December 31, 2009 Pension plans | |||||||
| $ | $ | |||||||
Fair value of assets at beginning of year | 1,362 | 1,045 | ||||||
Actual return on plan assets | 143 | 145 | ||||||
Employer contributions | 161 | 130 | ||||||
Plan participants’ contributions | 7 | 7 | ||||||
Benefits paid | (100 | ) | (94 | ) | ||||
Settlement | (64 | ) | (28 | ) | ||||
Effect of foreign currency exchange rate change | 63 | 157 | ||||||
Fair value of assets at end of year | 1,572 | 1,362 | ||||||
NOTES TO CONSOLIDATED FINANCIAL STATEMENTS
DECEMBER 31, 2010
(IN MILLIONS OF DOLLARS, UNLESS OTHERWISE NOTED)
NOTE 6. PENSION PLANS AND OTHER POST-RETIREMENT BENEFIT PLANS (CONTINUED)
| December 31, 2012 | December 31, 2011 | |||||||
| Pension plans | Pension plans | |||||||
| $ | $ | |||||||
Fair value of assets at beginning of year | 1,665 | 1,572 | ||||||
Actual return on plan assets | 182 | 130 | ||||||
Employer contributions | 86 | 95 | ||||||
Plan participants’ contributions | 7 | 7 | ||||||
Benefits paid | (97 | ) | (102 | ) | ||||
Acquisition of business | 7 | — | ||||||
Settlement | (115 | ) | (4 | ) | ||||
Effect of foreign currency exchange rate change | 32 | (33 | ) | |||||
|
|
|
| |||||
Fair value of assets at end of year | 1,767 | 1,665 | ||||||
|
|
|
| |||||
INVESTMENT POLICIES AND STRATEGIES OF THE PLAN ASSETS
The assets of the pension plans are held by a number of independent trustees and are accounted for separately in the Company’s pension funds. The investment strategy for the assets in the pension plans is to maintain a diversified portfolio of assets, invested in a prudent manner to maintain the security of funds while
DOMTAR CORPORATION
NOTES TO CONSOLIDATED FINANCIAL STATEMENTS
DECEMBER 31, 2012
(IN MILLIONS OF DOLLARS, UNLESS OTHERWISE NOTED)
NOTE 7. PENSION PLANS AND OTHER POST-RETIREMENT BENEFIT PLANS (CONTINUED)
maximizing returns within the guidelines provided in the investment policy. Diversification of the pension plans’ holdings is maintained in order to reduce the pension plans’ annual return variability, reduce market exposure and credit exposure to any single issuer and to any single component of the capital markets, to reduce exposure to unexpected inflation, to enhance the long-term risk-adjusted return potential of the pension plans and to reduce funding risk.
InOver the long run,long-term, the performance of the pension plans is primarily determined by the long-term asset mix decisions. To manage the long-term risk of not having sufficient funds to match the obligations of the pension plans, the Company conducts asset/liability studies. These studies lead to the recommendation and adoption of a long-term asset mix target that sets the expected rate of return and reduces the risk of adverse consequences to the planplans from increases in liabilities and decreases in assets. In identifying the asset mix target that would best meet the investment objectives, consideration is given to various factors, including (a) each plan’s characteristics, (b) the duration of each plan’s liabilities, (c) the solvency and going concern financial position of each plan and their sensitivity to changes in interest rates and inflation, and (d) the long-term return and risk expectations for key asset classes.
The investments of each plan can be done directly through cash investments in equities or bonds or indirectly through derivatives or pooled funds. The use of derivatives must be in accordance with an approved mandate and cannot be used for speculative purposes.
The Company’s pension funds are not permitted to own any of the Company’s shares or debt instruments.
The following table shows the allocation of the plan assets, based on the fair value of the assets held and the target allocation for 2010:2012:
| Target allocation | Percentage of plan assets at December 31, 2010 | Percentage of plan assets at December 31, 2009 | Target allocation | Percentage of plan assets at December 31, 2012 | Percentage of plan assets at December 31, 2011 | |||||||||||||||||||
Fixed income | ||||||||||||||||||||||||
Cash and cash equivalents | 0% - 10% | 3 | % | 8 | % | 0% - 10% | 4 | % | 5 | % | ||||||||||||||
Bonds | 53% - 63% | 58 | % | 51 | % | 51% - 61% | 55 | % | 58 | % | ||||||||||||||
Equity | ||||||||||||||||||||||||
Canadian Equity | 7% - 15% | 11 | % | 13 | % | 7% - 15% | 11 | % | 10 | % | ||||||||||||||
US Equity | 7% - 17% | 14 | % | 17 | % | 8% - 18% | 12 | % | 12 | % | ||||||||||||||
International Equity | 13% - 23% | 14 | % | 11 | % | 14% - 24% | 18 | % | 15 | % | ||||||||||||||
|
| |||||||||||||||||||||||
Total (1) | 100 | % | 100 | % | 100 | % | 100 | % | ||||||||||||||||
|
| |||||||||||||||||||||||
| (1) | Approximately |
DOMTAR CORPORATION
NOTES TO CONSOLIDATED FINANCIAL STATEMENTS
DECEMBER 31, 20102012
(IN MILLIONS OF DOLLARS, UNLESS OTHERWISE NOTED)
NOTE 6.7. PENSION PLANS AND OTHER POST-RETIREMENT BENEFIT PLANS (CONTINUED)
RECONCILIATION OF FUNDED STATUS TO AMOUNTS RECOGNIZED IN THE CONSOLIDATED BALANCE SHEETS
The following table presents the difference between the fair value of assets and the actuarially determined accrued benefit obligation. This difference is also referred to as either the deficit or surplus, as the case may be, or the funded status of the plans. The table further reconciles the amount of the surplus or deficit (funded status) to the net amount recognized in the Consolidated Balance Sheets.
| December 31, 2010 | December 31, 2009 | December 31, 2012 | December 31, 2011 | |||||||||||||||||||||||||||||
| Pension plans | Other post-retirement benefit plans | Pension plans | Other post-retirement benefit plans | Pension plans | Other post-retirement benefit plans | Pension plans | Other post-retirement benefit plans | |||||||||||||||||||||||||
| $ | $ | $ | $ | $ | $ | $ | $ | |||||||||||||||||||||||||
Accrued benefit obligation at end of year | (1,636 | ) | (114 | ) | (1,442 | ) | (122 | ) | (1,914 | ) | (124 | ) | (1,755 | ) | (113 | ) | ||||||||||||||||
Fair value of assets at end of year | 1,572 | — | 1,362 | — | 1,767 | — | 1,665 | — | ||||||||||||||||||||||||
|
|
|
| |||||||||||||||||||||||||||||
Funded status | (64 | ) | (114 | ) | (80 | ) | (122 | ) | (147 | ) | (124 | ) | (90 | ) | (113 | ) | ||||||||||||||||
|
|
|
| |||||||||||||||||||||||||||||
The funded status includes $46$56 million of accrued benefit obligation ($4147 million at December 31, 2009)2011) related to supplemental unfunded defined benefit and defined contribution plans.
| December 31, 2010 | December 31, 2009 | |||||||||||||||
| Pension plans | Other post-retirement benefit plans | Pension plans | Other post-retirement benefit plans | |||||||||||||
| $ | $ | $ | $ | |||||||||||||
Trade and other payables (Note 16) | — | (4 | ) | — | (4 | ) | ||||||||||
Other liabilities and deferred credits (Note 18) | (100 | ) | (110 | ) | (112 | ) | (118 | ) | ||||||||
Other assets (Note 13) | 36 | — | 32 | — | ||||||||||||
Net amount recognized in the Consolidated Balance Sheets | (64 | ) | (114 | ) | (80 | ) | (122 | ) | ||||||||
| December 31, 2012 | December 31, 2011 | |||||||||||||||
| Pension plans | Other post-retirement benefit plans | Pension plans | Other post-retirement benefit plans | |||||||||||||
| $ | $ | $ | $ | |||||||||||||
Trade and other payables (Note 17) | — | (5 | ) | — | (2 | ) | ||||||||||
Other liabilities and deferred credits (Note 19) | (188 | ) | (119 | ) | (143 | ) | (111 | ) | ||||||||
Other assets (Note 15) | 41 | — | 53 | — | ||||||||||||
|
|
|
|
|
|
|
| |||||||||
Net amount recognized in the Consolidated Balance Sheets | (147 | ) | (124 | ) | (90 | ) | (113 | ) | ||||||||
|
|
|
|
|
|
|
| |||||||||
The following table presents the amount not yet recognized in net periodic benefit cost and included in Accumulated other comprehensive loss.loss:
| December 31, 2010 | December 31, 2009 | December 31, 2012 | December 31, 2011 | |||||||||||||||||||||||||||||
| Pension plans | Other post-retirement benefit plans | Pension plans | Other post-retirement benefit plans | Pension plans | Other post-retirement benefit plans | Pension plans | Other post-retirement benefit plans | |||||||||||||||||||||||||
| $ | $ | $ | $ | $ | $ | $ | $ | |||||||||||||||||||||||||
Prior year service cost | (22 | ) | 9 | (25 | ) | 10 | ||||||||||||||||||||||||||
Prior service (cost) credit | (21 | ) | 2 | (28 | ) | 11 | ||||||||||||||||||||||||||
Accumulated loss | (264 | ) | (9 | ) | (188 | ) | (10 | ) | (401 | ) | (21 | ) | (298 | ) | (11 | ) | ||||||||||||||||
|
|
|
| |||||||||||||||||||||||||||||
Accumulated other comprehensive loss | (286 | ) | — | (213 | ) | — | (422 | ) | (19 | ) | (326 | ) | — | |||||||||||||||||||
|
|
|
| |||||||||||||||||||||||||||||
DOMTAR CORPORATION
NOTES TO CONSOLIDATED FINANCIAL STATEMENTS
DECEMBER 31, 20102012
(IN MILLIONS OF DOLLARS, UNLESS OTHERWISE NOTED)
NOTE 6.7. PENSION PLANS AND OTHER POST-RETIREMENT BENEFIT PLANS (CONTINUED)
The following table presents the pre-tax amounts included in otherOther comprehensive income (loss).:
| Year ended December 31, 2010 | Year ended December 31, 2009 | Year ended December 31, 2008 | ||||||||||||||||||||||
| Pension plans | Other post-retirement benefit plans | Pension plans | Other post-retirement benefit plans | Pension plans | Other post-retirement benefit plans | |||||||||||||||||||
| $ | $ | $ | $ | $ | $ | |||||||||||||||||||
Prior year service cost | (1 | ) | — | — | 10 | (30 | ) | — | ||||||||||||||||
Amortization of prior year service cost | 4 | (1 | ) | 10 | — | 4 | — | |||||||||||||||||
Net gain (loss) | (100 | ) | 1 | (79 | ) | (19 | ) | (68 | ) | 6 | ||||||||||||||
Amortization of net actuarial loss | 24 | — | 10 | — | 9 | — | ||||||||||||||||||
Net amount recognized in other comprehensive income (loss) (pre-tax) (Note 15) | (73 | ) | — | (59 | ) | (9 | ) | (85 | ) | 6 | ||||||||||||||
| Year ended December 31, 2012 | Year ended December 31, 2011 | Year ended December 31, 2010 | ||||||||||||||||||||||
| Pension plans | Other post-retirement benefit plans | Pension plans | Other post-retirement benefit plans | Pension plans | Other post-retirement benefit plans | |||||||||||||||||||
| $ | $ | $ | $ | $ | $ | |||||||||||||||||||
Prior service (cost) credit | 3 | — | (17 | ) | 3 | (1 | ) | — | ||||||||||||||||
Amortization of prior year service cost (credit) | 4 | (9 | ) | 11 | (1 | ) | 4 | (1 | ) | |||||||||||||||
Net gain (loss) | (122 | ) | (11 | ) | (48 | ) | (2 | ) | (100 | ) | 1 | |||||||||||||
Amortization of net actuarial loss | 19 | 1 | 14 | — | 24 | — | ||||||||||||||||||
|
|
|
|
|
|
|
|
|
|
|
| |||||||||||||
Net amount recognized in other comprehensive income (loss) (pre-tax) | (96 | ) | (19 | ) | (40 | ) | — | (73 | ) | — | ||||||||||||||
|
|
|
|
|
|
|
|
|
|
|
| |||||||||||||
An estimated amount of $17$44 million for pension plans and $1 million for other post-retirement benefit plans will be amortized from accumulatedAccumulated other comprehensive loss into net periodic benefit cost in 2011.2013.
At December 31, 2010,2012, the accrued benefit obligation and the fair value of defined benefit plan assets with an accrued benefit obligation in excess of fair value of plan assets were $1,020$1,222 million and $921$1,039 million, respectively (2009—(2011—$8541,160 million and $740$1,020 million, respectively).
Components of net periodic benefit cost for pension plans | Year ended December 31, 2010 | Year ended December 31, 2009 | Year ended December 31, 2008 | Year ended December 31, 2012 | Year ended December 31, 2011 | Year ended December 31, 2010 | ||||||||||||||||||
| $ | $ | $ | $ | $ | $ | |||||||||||||||||||
Service cost for the year | 32 | 35 | 36 | 40 | 35 | 32 | ||||||||||||||||||
Interest expense | 87 | 84 | 78 | 85 | 87 | 87 | ||||||||||||||||||
Expected return on plan assets | (92 | ) | (74 | ) | (80 | ) | (97 | ) | (103 | ) | (92 | ) | ||||||||||||
Amortization of net actuarial loss | 10 | 4 | — | 18 | 14 | 10 | ||||||||||||||||||
Curtailment loss (a) | 12 | 6 | 4 | 1 | 22 | 12 | ||||||||||||||||||
Settlement loss (b) | 16 | 6 | 7 | 1 | 23 | 16 | ||||||||||||||||||
Amortization of prior year service costs | 3 | 3 | 1 | 3 | 2 | 3 | ||||||||||||||||||
Special termination benefits | — | 1 | 6 | |||||||||||||||||||||
|
|
| ||||||||||||||||||||||
Net periodic benefit cost | 68 | 65 | 52 | 51 | 80 | 68 | ||||||||||||||||||
|
|
| ||||||||||||||||||||||
Components of net periodic benefit cost for other post-retirement benefit plans | Year ended December 31, 2010 | Year ended December 31, 2009 | Year ended December 31, 2008 | Year ended December 31, 2012 | Year ended December 31, 2011 | Year ended December 31, 2010 | ||||||||||||||||||
| $ | $ | $ | $ | $ | $ | |||||||||||||||||||
Service cost for the year | 3 | 4 | 4 | 3 | 3 | 3 | ||||||||||||||||||
Interest expense | 7 | 7 | 6 | 6 | 6 | 7 | ||||||||||||||||||
Amortization of net actuarial loss | 1 | — | — | 1 | — | 1 | ||||||||||||||||||
Curtailment gain (c) | (13 | ) | — | (2 | ) | (12 | ) | — | (13 | ) | ||||||||||||||
Amortization of prior year service costs | (1 | ) | — | — | (1 | ) | (1 | ) | (1 | ) | ||||||||||||||
Settlement gain | (1 | ) | — | — | — | — | (1 | ) | ||||||||||||||||
|
|
| ||||||||||||||||||||||
Net periodic benefit cost | (4 | ) | 11 | 8 | (3 | ) | 8 | (4 | ) | |||||||||||||||
|
|
| ||||||||||||||||||||||
| (a) | The curtailment loss for the year ended December 31, 2012 of $1 million is related to certain U.S. employees who elected to convert from defined benefit to defined contribution plans. The curtailment loss |
DOMTAR CORPORATION
NOTES TO CONSOLIDATED FINANCIAL STATEMENTS
DECEMBER 31, 20102012
(IN MILLIONS OF DOLLARS, UNLESS OTHERWISE NOTED)
NOTE 6.7. PENSION PLANS AND OTHER POST-RETIREMENT BENEFIT PLANS (CONTINUED)
| for the year ended December 31, 2011 of $22 million represents $13 million related to the sale of the Prince Albert, Saskatchewan facility and $9 million related to certain U.S. plans being converted from defined benefit to defined contribution plans during the fourth quarter of 2011. The curtailment loss for the year ended December 31, 2010 of $12 million |
| (b) | The settlement loss for the year ended December 31, 2012 of $1 million is related to the sale of hydro assets in Ottawa, Ontario and Gatineau, Quebec. The settlement loss for the year ended December 31, 2011 of $23 million is related to the sale of assets of the Prince Albert facility. The settlement loss for the year ended December 31, 2010 of $16 million |
| (c) | The curtailment gain of $12 million for the year ended December 31, 2012 is a result of the curtailment of benefits related to the majority of employees covered by the plan. The curtailment gain for the year ended December 31, 2010 of $13 million |
WEIGHTED-AVERAGE ASSUMPTIONS
The Company used the following key assumptions to measure the accrued benefit obligation and the net periodic benefit cost. These assumptions are long-term, which is consistent with the nature of employee future benefits.
Pension plans | December 31, 2010 | December 31, 2009 | December 31, 2008 | December 31, 2012 | December 31, 2011 | December 31, 2010 | ||||||||||||||||||
Accrued benefit obligation | ||||||||||||||||||||||||
Discount rate | 5.5 | % | 6.4 | % | 7.3 | % | 4.1 | % | 4.9 | % | 5.5 | % | ||||||||||||
Rate of compensation increase | 2.7 | % | 2.7 | % | 3.0 | % | 2.7 | % | 2.7 | % | 2.7 | % | ||||||||||||
Net periodic benefit cost | ||||||||||||||||||||||||
Discount rate | 6.3 | % | 6.8 | % | 5.5 | % | 4.8 | % | 5.3 | % | 6.3 | % | ||||||||||||
Rate of compensation increase | 2.9 | % | 2.8 | % | 2.9 | % | 2.8 | % | 2.9 | % | 2.9 | % | ||||||||||||
Expected long-term rate of return on plan assets | 7.0 | % | 6.8 | % | 6.3 | % | 6.0 | % | 6.7 | % | 7.0 | % | ||||||||||||
Discount rate for Canadian plans: 5.5 %4.2% based on a model whereby cash flows are projected for hypothetical plans and are discounted using a spot rate yield curve developed from bond yield data for AA corporate bonds provided by PC Bond Analytics with an adjustment to thebonds. Specifically, short-term yields to disregard yields provided for 25-yearmaturity are derived from actual AA rated corporate bond yield data. For longer terms, extrapolated data is used. The extrapolated data are created by adding a term-based spread over long provincial bond yields. The spread is based on the observed spreads between AA rated corporate bonds and 30-year maturities, a constant spot rate was assumed from 20 years onward.AA rated provincial bonds in three sections of the yield curve.
Discount rate for USU.S. plans: 5.45% based on Domtar’s3.8% obtained by incorporating Domtar qualified plans’ expected cash flows in the Mercer Yield Curve which is based on bonds rated AA or better by Moody’s or Standard & Poor’s, excluding callable bonds, bonds of less than a minimum issue size, and certain other bonds. Effective December 2012, the
DOMTAR CORPORATION
Other post-retirement benefit plans | December 31, 2010 | December 31, 2009 | December 31, 2008 | |||||||||
Accrued benefit obligation | ||||||||||||
Discount rate | 5.5 | % | 6.3 | % | 6.9 | % | ||||||
Rate of compensation increase | 2.8 | % | 2.8 | % | 3.0 | % | ||||||
Net periodic benefit cost | ||||||||||||
Discount rate | 6.4 | % | 6.0 | % | 5.6 | % | ||||||
Rate of compensation increase | 2.8 | % | 3.0 | % | 3.0 | % | ||||||
NOTES TO CONSOLIDATED FINANCIAL STATEMENTS
DECEMBER 31, 20102012
(IN MILLIONS OF DOLLARS, UNLESS OTHERWISE NOTED)
NOTE 6.7. PENSION PLANS AND OTHER POST-RETIREMENT BENEFIT PLANS (CONTINUED)
universe of bonds also includes private placement (traded in reliance on Rule 144A and with at least two years to maturity), make whole, and foreign corporation (denominated in US dollars) bonds.
Other post-retirement benefit plans | December 31, 2012 | December 31, 2011 | December 31, 2010 | |||||||||
Accrued benefit obligation | ||||||||||||
Discount rate | 4.2 | % | 5.0 | % | 5.5 | % | ||||||
Rate of compensation increase | 2.8 | % | 2.8 | % | 2.8 | % | ||||||
Net periodic benefit cost | ||||||||||||
Discount rate | 2.9 | % | 5.5 | % | 6.4 | % | ||||||
Rate of compensation increase | 2.8 | % | 2.8 | % | 2.8 | % | ||||||
Effective January 1, 2011,2013, the Company will use 6.75% (2010—7.0%5.8% (2012—6.0%; 2009—6.8%2011—6.7%) as the expected return on plan assets, which reflects the current view of long-term investment returns. The overall expected long-term rate of return on plan assets is based on management’s best estimate of the long-term returns of the major asset classes (cash and cash equivalents, equities, and bonds) weighted by the actual allocation of assets at the measurement date, net of expenses. This rate includes an equity risk premium over government bond returns for equity investments and a value-added premium for the contribution to returns from active management. The sources used to determine management’s best estimate of long termlong-term returns are numerous and include country specific bond yields, which may be derived from the market using local bond indices or by analysis of the local bond market, and country-specific inflation and investment market expectations derived from market data and analysts’ or governments’ expectations as applicable.
For measurement purposes, a 6.2%5.4% weighted-average annual rate of increase in the per capita cost of covered health care benefits was assumed for 2011.2013. The rate was assumed to decrease gradually to 4.1% by 20282033 and remain at that level thereafter. An increase or decrease of 1% of this rate would have the following impact:
| Increase of 1% | Decrease of 1% | Increase of 1% | Decrease of 1% | |||||||||||||
| $ | $ | $ | $ | |||||||||||||
Impact on net periodic benefit cost for other post-retirement benefit plans | — | (1 | ) | 1 | (1 | ) | ||||||||||
Impact on accrued benefit obligation | 4 | (8 | ) | 10 | (9 | ) | ||||||||||
FAIR VALUE MEASUREMENT
Fair Value Measurements and Disclosures Topic of FASB ASC 820 establishes a fair value hierarchy, which prioritizes the inputs to valuation techniques used to measure fair value into three levels. A financial instrument’s categorization within the fair value hierarchy is based upon the lowest level of input that is available and significant to the fair value measurement. Fair Value Measurements and Disclosures Topic of FASB ASC 820 establishes and prioritizes three levels of inputs that may be used to measure fair value:
Level 1—Quoted prices in active markets for identical assets or liabilities.
Level 2—Observable inputs other than quoted prices in active markets for identical assets and liabilities, quoted prices for identical or similar assets or liabilities in inactive markets, or other inputs that are observable or can be corroborated by observable market data for substantially the full term of the assets or liabilities.
Level 3—Inputs that are generally unobservable and typically reflect management’s estimates of assumptions that market participants would use in pricing the assetassets or liability.liabilities.
DOMTAR CORPORATION
NOTES TO CONSOLIDATED FINANCIAL STATEMENTS
DECEMBER 31, 20102012
(IN MILLIONS OF DOLLARS, UNLESS OTHERWISE NOTED)
NOTE 6.7. PENSION PLANS AND OTHER POST-RETIREMENT BENEFIT PLANS (CONTINUED)
The following table presents the fair value of the plan assets at December 31, 2010,2012, by asset category:
| Fair Value Measurements at December 31, 2010 | Fair Value Measurements at December 31, 2012 | |||||||||||||||||||||||||||||||
Asset Category | Total | Quoted Prices in Active Markets for Identical Assets (Level 1) | Significant Observable Inputs (Level 2) | Significant Unobservable Inputs (Level 3) | Total | Quoted Prices in Active Markets for Identical Assets (Level 1) | Significant Observable Inputs (Level 2) | Significant Unobservable Inputs (Level 3) | ||||||||||||||||||||||||
| $ | $ | $ | $ | $ | $ | $ | $ | |||||||||||||||||||||||||
Cash and short term investments | 75 | 75 | — | — | ||||||||||||||||||||||||||||
ABCP(1) | 214 | — | — | 214 | ||||||||||||||||||||||||||||
Cash and short-term investments | 75 | 75 | — | — | ||||||||||||||||||||||||||||
Money market fund | 25 | — | 25 | — | ||||||||||||||||||||||||||||
Asset backed notes (1) | 213 | — | 177 | 36 | ||||||||||||||||||||||||||||
Canadian government bonds | 430 | 429 | 1 | — | 163 | 163 | — | — | ||||||||||||||||||||||||
Canadian and U.S. corporate debt securities | 77 | 72 | 5 | — | ||||||||||||||||||||||||||||
Canadian corporate debt securities | 5 | — | 5 | — | ||||||||||||||||||||||||||||
Bond index funds(2 & 3) | 181 | — | 181 | — | 581 | — | 581 | — | ||||||||||||||||||||||||
Canadian equities(4) | 168 | 168 | — | — | 192 | 192 | — | — | ||||||||||||||||||||||||
U.S. equities(5) | 18 | 18 | — | — | 31 | 31 | — | — | ||||||||||||||||||||||||
International equities(6) | 194 | 194 | — | — | 266 | 266 | — | — | ||||||||||||||||||||||||
U.S. stock index funds(3 & 7) | 210 | — | 210 | — | 208 | — | 208 | — | ||||||||||||||||||||||||
Asset backed securities (3) | 3 | — | 3 | — | ||||||||||||||||||||||||||||
Derivative contracts (8) | 2 | — | 2 | — | ||||||||||||||||||||||||||||
Insurance contracts (8) | 7 | — | — | 7 | ||||||||||||||||||||||||||||
Derivative contracts (9) | 1 | — | 1 | — | ||||||||||||||||||||||||||||
|
|
|
| |||||||||||||||||||||||||||||
Total | 1,572 | 956 | 402 | 214 | 1,767 | 727 | 997 | 43 | ||||||||||||||||||||||||
|
|
|
| |||||||||||||||||||||||||||||
| (1) | This category is described in the section “Asset Backed |
| (2) | This category represents a Canadian bond index fund not actively managed that tracks the DEX Long-term |
| (3) | The fair value of these plan assets are classified as Level 2 (inputs that are |
| (4) | This category represents active segregated, large capitalization Canadian equity portfolios with the ability to purchase small and medium capitalized |
This category represents U.S. equities held within an active segregated global equity portfolio. |
| (6) | This category represents an active segregated non-North American multi-capitalization equity portfolio and the non-North American portion of an active segregated global equity portfolio. |
| (7) | This category represents equity index funds, not actively managed, that track the Standard & Poor’s 500 (“S&P 500”). |
| (8) | This category represents insurance contracts with a minimum guarantee rate. |
| (9) | The fair value of the derivative contracts are classified as Level 2 (inputs that are observable, directly or indirectly) as they are measured using long-term bond indices. |
DOMTAR CORPORATION
NOTES TO CONSOLIDATED FINANCIAL STATEMENTS
DECEMBER 31, 2012
(IN MILLIONS OF DOLLARS, UNLESS OTHERWISE NOTED)
NOTE 7. PENSION PLANS AND OTHER POST-RETIREMENT BENEFIT PLANS (CONTINUED)
The following table presents the fair value of the plan assets at December 31, 2011, by asset category:
| Fair Value Measurements at December 31, 2011 | ||||||||||||||||
Asset Category | Total | Quoted Prices in Active Markets for Identical Assets (Level 1) | Significant Observable Inputs (Level 2) | Significant Unobservable Inputs (Level 3) | ||||||||||||
| $ | $ | $ | $ | |||||||||||||
Cash and short-term investments | 89 | 89 | — | — | ||||||||||||
Asset backed notes (1) | 205 | — | — | 205 | ||||||||||||
Canadian government bonds | 383 | 378 | 5 | — | ||||||||||||
Canadian and U.S. corporate debt securities | 96 | 73 | 23 | — | ||||||||||||
Bond index funds(2 & 3) | 265 | — | 265 | — | ||||||||||||
Canadian equities(4) | 172 | 172 | — | — | ||||||||||||
U.S. equities(5) | 28 | 28 | — | — | ||||||||||||
International equities(6) | 216 | 216 | — | — | ||||||||||||
U.S. stock index funds(3 & 7) | 205 | — | 205 | — | ||||||||||||
Asset backed securities (3) | 2 | — | 2 | — | ||||||||||||
Derivative contracts (8) | 4 | — | 4 | — | ||||||||||||
|
|
|
|
|
|
|
| |||||||||
Total | 1,665 | 956 | 504 | 205 | ||||||||||||
|
|
|
|
|
|
|
| |||||||||
| (1) | This category is described in the section “Asset Backed Notes.” |
| (2) | This category represents a Canadian bond index fund not actively managed that tracks the DEX Long-term bond index and a U.S. actively managed bond fund that is benchmarked to the Barclays Capital Long-term Government/Credit index. |
| (3) | The fair value of these plan assets are classified as Level 2 (inputs that are observable, directly or indirectly) as they are measured based on quoted prices in active markets and can be redeemed at the measurement date or in the near term. |
| (4) | This category represents active segregated, large capitalization Canadian equity portfolios with the ability to purchase small and medium capitalized companies and $2 million of Canadian equities held within an active segregated global equity portfolio. |
| (5) | This category represents U.S. equities held within an active segregated global equity portfolio. |
| (6) | This category represents an active segregated non-North American multi-capitalization equity portfolio and the non-North American portion of an active segregated global equity portfolio. |
| (7) | This category represents equity index funds, not actively managed, that track the S&P 500. |
| (8) | The fair value of the derivative contracts are classified as Level 2 (inputs that are observable, directly or indirectly) as they are measured using |
DOMTAR CORPORATION
NOTES TO CONSOLIDATED FINANCIAL STATEMENTS
DECEMBER 31, 20102012
(IN MILLIONS OF DOLLARS, UNLESS OTHERWISE NOTED)
NOTE 6. PENSION PLANS AND OTHER POST-RETIREMENT BENEFIT PLANS (CONTINUED)
The following table presents the fair value of the plan assets at December 31, 2009, by asset category:
| Fair Value Measurements at December 31, 2009 | ||||||||||||||||
Asset Category | Total | Quoted Prices in Active Markets for Identical Assets (Level 1) | Significant Observable Inputs (Level 2) | Significant Unobservable Inputs (Level 3) | ||||||||||||
| $ | $ | $ | $ | |||||||||||||
Cash and short term investments(1) | 449 | 449 | — | — | ||||||||||||
ABCP(2) | 205 | — | — | 205 | ||||||||||||
Canadian government bonds | 250 | 250 | — | — | ||||||||||||
Canadian and U.S. debt securities | 74 | 74 | — | — | ||||||||||||
U.S. government bonds | 6 | 6 | — | — | ||||||||||||
Bond index funds(3 & 4) | 58 | — | 31 | 27 | ||||||||||||
Canadian equity securities(5) | 80 | 80 | — | — | ||||||||||||
International equities(6) | 108 | 108 | — | — | ||||||||||||
U.S. stock index fund(3 & 7) | 91 | — | 91 | — | ||||||||||||
International stock index fund(3 & 8) | 34 | — | 34 | — | ||||||||||||
Asset backed securities (3) | 5 | — | 5 | — | ||||||||||||
Derivative contracts (9) | 2 | — | 2 | — | ||||||||||||
Total | 1,362 | 967 | 163 | 232 | ||||||||||||
|
NOTES TO CONSOLIDATED FINANCIAL STATEMENTS
DECEMBER 31, 2010
(IN MILLIONS OF DOLLARS, UNLESS OTHERWISE NOTED)
NOTE 6.7. PENSION PLANS AND OTHER POST-RETIREMENT BENEFIT PLANS (CONTINUED)
ASSET BACKED COMMERCIAL PAPERNOTES
At December 31, 2010,2012, Domtar Corporation’s Canadian defined benefit pension funds held restructured asset backed notes (“ABN”) (formerly asset backed commercial paper (“ABCP”)) valued at $214$213 million (CDN$213(CDN $211 million). At December 31, 2009,2011, the plans held ABCP investmentsABN valued at $205 million (CDN$214208 million). During 2010,2012, the total value of the notesABN benefited from an increase in value of $41 million (CDN$40 million). For the same period, the total value of ABN was reduced by repayments and sales totalling $37 million (CDN$37 million), partially offset by the $4 million impact of an increase in the value of the Canadian dollar of $9 million, and an increase in market value of $20 million (CDN$21 million). Repayments and sales in 2010 totalled $20 million (CDN$21 million).dollar.
Most of these investments (90%ABN, with a current value of the market value (2009—91% of the market value))$193 million (2011—$178 million; 2010—$193 million), were subject to restructuring under the court order governing the Montreal Accord that was completed in January 2009, while2009. About $177 million of these notes (nominal value $213 million) are expected to mature in four years. These notes are valued based upon current market quotes. The market values are supported by the remainder are in conduits restructured outsidevalue of the Montreal Accord or subject to litigation between the sponsor and the credit counterparty.
There is no active, liquid quoted market for the ABCPunderlying investments held by the Company’s pension plans.issuing conduit. The fair value of the ABCP notes is mainly based on a financial model incorporating uncertainties regarding return, credit spreads, the nature and credit risk of underlying assets, the amounts and timing of cash inflows and the limited marketvalues for the new notes as at December 31, 2010.
The largest conduit owned by the pension plans in the Montreal Accord contains mainly collateral investments$16 million (nominal value $39 million) of remaining ABN, that back credit default derivatives that protect counterparties against credit defaults above a specified threshold on different portfolios of corporate credits. The valuation methodology was based upon determining an appropriate credit spread for each class of notes based upon the implied protection level provided by each class against potential credit defaults. This was done by comparison to spreads for an investment grade credit default index and the comparable tranches within the index for equivalent credit protection. In addition, a liquidity premium of 1.75% was added to this spread. The resulting spread was used to calculate the present value of all such notes, based upon the anticipated maturity date. An additional discount of 2.5% was applied to reflect uncertainty over collateral values held to support the derivative transactions. An increase in the discount rate of 1% would reduce the value by $7 million (CDN$7 million) for these notes.
The value of the remaining notes thatalso were subject to the Montreal Accord, were sourced either from the asset manager of these notes,the ABN, or from trading values for similar securities of similar credit quality. The conduits outside
An additional $20 million of ABN (nominal value $38 million) were restructured separately from the Montreal Accord, which also provide protection to counterparties against credit defaults through derivatives, wereAccord. They are valued based upon the value of the collateral valueinvestments held in the conduit net ofissuer, reduced by the marketnegative value of the credit default derivatives, as provided by the sponsor of the conduit, with an additional discount (equivalent to 1.75% per annum) applied for illiquidity. One conduit stillApproximately $11 million of these notes (nominal value $11 million) are expected to mature at par in late 2013 with the remaining $9 million of notes (nominal value $12 million) maturing in 2016. The outcome for a zero-value note (nominal value $15 million), remains subject to litigation was valued at zero.the outcome of ongoing litigation.
Possible changes that could have a material effect onimpact the future value of the ABCP includeABN include: (1) changes in the value of the underlying assets and the related derivative transactions, (2) developments related to the liquidity of the ABCPABN market, and (3) a severe and prolonged economic slowdown in North America and the bankruptcy of referenced corporate credits.credits, and (4) the passage of time, as most of the notes will mature by early 2017.
DOMTAR CORPORATION
NOTES TO CONSOLIDATED FINANCIAL STATEMENTS
DECEMBER 31, 20102012
(IN MILLIONS OF DOLLARS, UNLESS OTHERWISE NOTED)
NOTE 6.7. PENSION PLANS AND OTHER POST-RETIREMENT BENEFIT PLANS (CONTINUED)
The following table presents changes during the period for Level 3 fair value measurements of plan assets:
| Fair Value Measurements Using Significant Unobservable Inputs (Level 3) | Fair Value Measurements Using Significant Unobservable Inputs (Level 3) | |||||||||||||||||||||||||||||||
| ABCP Montreal Accord | ABCP Outside Montreal Accord | Restricted Bond index fund | TOTAL | |||||||||||||||||||||||||||||
| $ | $ | $ | $ | ABN Montreal Accord | ABN Outside Montreal Accord | Insurance contracts | TOTAL | |||||||||||||||||||||||||
Balance at beginning of year | 186 | 19 | 27 | 232 | ||||||||||||||||||||||||||||
| $ | $ | $ | $ | |||||||||||||||||||||||||||||
Balance at December 31, 2010 | 193 | 21 | — | 214 | ||||||||||||||||||||||||||||
Settlements | (20 | ) | — | (29 | ) | (49 | ) | (8 | ) | — | — | (8 | ) | |||||||||||||||||||
Return on plan assets | 20 | — | 2 | 22 | (3 | ) | 6 | — | 3 | |||||||||||||||||||||||
Effect of foreign currency exchange rate change | 7 | 2 | — | 9 | (4 | ) | — | — | (4 | ) | ||||||||||||||||||||||
|
|
|
| |||||||||||||||||||||||||||||
Balance at end of year | 193 | 21 | — | 214 | ||||||||||||||||||||||||||||
Balance at December 31, 2011 | 178 | 27 | — | 205 | ||||||||||||||||||||||||||||
Purchases/Settlements | (29 | ) | (8 | ) | 7 | (30 | ) | |||||||||||||||||||||||||
Transfers out of Level 3(a) | (177 | ) | — | — | (177 | ) | ||||||||||||||||||||||||||
Return on plan assets | 40 | 1 | — | 41 | ||||||||||||||||||||||||||||
Effect of foreign currency exchange rate change | 4 | — | — | 4 | ||||||||||||||||||||||||||||
|
|
|
| |||||||||||||||||||||||||||||
Balance at December 31, 2012 | 16 | 20 | 7 | 43 | ||||||||||||||||||||||||||||
|
|
|
| |||||||||||||||||||||||||||||
| (a) | Transfers out of Level 3 are considered to occur at the end of the period. ABN were reclassified to Level 2 from Level 3 as a result of increased trading activity and the presence of observable market quotes for these assets. |
ESTIMATED FUTURE BENEFIT PAYMENTS FROM THE PLANS
Estimated future benefit payments from the plans for the next 10 years at December 31, 20102012 are as follows:
| Pension plans | Other post-retirement benefit plans | Pension plans | Other post-retirement benefit plans | |||||||||||||
| $ | $ | $ | $ | |||||||||||||
2011 | 101 | 7 | ||||||||||||||
2012 | 101 | 7 | ||||||||||||||
2013 | 130 | 7 | 152 | 5 | ||||||||||||
2014 | 106 | 8 | 102 | 7 | ||||||||||||
2015 | 108 | 7 | 105 | 7 | ||||||||||||
2016—2020 | 596 | 37 | ||||||||||||||
2016 | 108 | 7 | ||||||||||||||
2017 | 111 | 6 | ||||||||||||||
2018—2022 | 600 | 34 | ||||||||||||||
MULTIEMPLOYER PLANS
Domtar contributes to seven multiemployer defined benefit pension plans under the terms of collective agreements that cover certain Canadian union-represented employees (Canadian multiemployer plans) and certain U.S. union-represented employees (U.S. multiemployer plans). The risks of participating in these multiemployer plans are different from single-employer plans in the following aspects:
| (a) | assets contributed to the multiemployer plan by one employer may be used to provide benefits to employees of other participating employers; |
DOMTAR CORPORATION
NOTES TO CONSOLIDATED FINANCIAL STATEMENTS
DECEMBER 31, 2012
(IN MILLIONS OF DOLLARS, UNLESS OTHERWISE NOTED)
NOTE 7. PENSION PLANS AND OTHER POST-RETIREMENT BENEFIT PLANS (CONTINUED)
| (b) | for the U.S. multiemployer plans, if a participating employer stops contributing to the plan, the unfunded obligations of the plan are borne by the remaining participating employers; and |
| (c) | for the U.S. multiemployer plans, if Domtar chooses to stop participating in some of its multiemployer plans, Domtar may be required to pay those plans an amount based on the underfunded status of the plan, referred to as a withdrawal liability. |
Domtar’s participation in these plans for the annual periods ended December 31 is outlined in the table below. The plan’s 2012 and 2011 actuarial status certification was completed as of January 1, 2012 and January 1, 2011, respectively, and is based on the plan’s actuarial valuation as of December 31, 2011 and December 31, 2010, respectively. This represents the most recent Pension Protection Act (“PPA”) zone status available. The zone status is based on information received from the plan and is certified by the plan’s actuary. The Company’s significant plan is in the red zone, which means it is less than 65% funded and requires a financial improvement plan (“FIP”) or a rehabilitation plan (“RP”).
| EIN / Pension Plan Number | Pension Protection Act Zone Status | FIP /RP Status Pending / Implemented | Contributions from Domtar to Multiemployer (c) | Surcharge imposed | Expiration date of collective bargaining agreement | |||||||||||||||||||||||||||||||
Pension Fund | 2012 | 2011 | 2012 | 2011 | 2010 | |||||||||||||||||||||||||||||||
| $ | $ | $ | ||||||||||||||||||||||||||||||||||
U.S. | ||||||||||||||||||||||||||||||||||||
PACE Industry Union- | 11-6166763-001 | Red | Red | Yes—Implemented | 3 | 3 | 3 | Yes | January 27, 2015 | |||||||||||||||||||||||||||
Canadian Multiemployer Plans | ||||||||||||||||||||||||||||||||||||
Pulp and Paper Industry Pension Plan(b) | N/A | N/A | N/A | N/A | 2 | 3 | 2 | N/A | April 30, 2017 | |||||||||||||||||||||||||||
|
|
|
|
|
| |||||||||||||||||||||||||||||||
| Total | 5 | 6 | 5 | |||||||||||||||||||||||||||||||||
| | Total contributions made to all plans that are not individually significant | | 1 | 1 | 1 | |||||||||||||||||||||||||||||||
|
|
|
|
|
| |||||||||||||||||||||||||||||||
| Total contributions made to all plans | 6 | 7 | 6 | |||||||||||||||||||||||||||||||||
|
|
|
|
|
| |||||||||||||||||||||||||||||||
| (a) | Domtar withdrew from PACE Industry Union-Management Pension Fund effective December 31, 2012. |
| (b) | In the event that the Canadian multiemployer plan is underfunded, the monthly benefit amount can be reduced by the trustees of the plan. Moreover, Domtar is not responsible for the underfunded status of the plan because the Canadian multiemployer plans do not require participating employers to pay a withdrawal liability or penalty upon withdrawal. |
| (c) | For each of the three years presented, Domtar’s contributions to each multiemployer plan do not represent more than 5% of total contributions to each plan as indicated in the plan’s most recently available annual report. |
DOMTAR CORPORATION
NOTES TO CONSOLIDATED FINANCIAL STATEMENTS
DECEMBER 31, 2012
(IN MILLIONS OF DOLLARS, UNLESS OTHERWISE NOTED)
NOTE 7. PENSION PLANS AND OTHER POST-RETIREMENT BENEFIT PLANS (CONTINUED)
In 2011, the Company decided to withdraw from one of its multiemployer pension plans and recorded a withdrawal liability and a charge to earnings of $32 million. In 2012, as a result of a revision in the estimated withdrawal liability, the Company recorded a further charge to earnings of $14 million. Also in 2012, the Company withdrew from a second multiemployer pension plan and recorded a withdrawal liability and a charge to earnings of $1 million. While this is the Company’s best estimate of the ultimate cost of the withdrawal from these plans at December 31, 2012, additional withdrawal liabilities may be incurred based on the final fund assessment expected to occur in the second quarter of 2013. Further, the Company remains liable for potential additional withdrawal liabilities to the fund in the event of a mass withdrawal, as defined by statute, occurring anytime within the next three years (see Note 16).
OTHER OPERATING LOSS (INCOME), NET
Other operating loss (income) is an aggregate of both recurring and occasional loss or income items and, as a result, can fluctuate from year to year. The Company’s other operating loss (income) includes the following:
| Year ended December 31, 2010 | Year ended December 31, 2009 | Year ended December 31, 2008 | Year ended December 31, 2012 | Year ended December 31, 2011 | Year ended December 31, 2010 | |||||||||||||||||||
| $ | $ | $ | $ | $ | $ | |||||||||||||||||||
Alternative fuel tax credits (Note 9) | (25 | ) | (498 | ) | — | |||||||||||||||||||
Loss on sale of Wood business (Note 24) | 50 | — | — | |||||||||||||||||||||
Gain on sale of Woodland mill (Note 24) | (10 | ) | — | — | ||||||||||||||||||||
Gain on sale of trademarks | — | (1 | ) | (6 | ) | |||||||||||||||||||
Loss on sale of Ottawa/Gatineau Hydro assets(1) | 3 | — | — | |||||||||||||||||||||
Alternative fuel tax credits (Note 10) | — | — | (25 | ) | ||||||||||||||||||||
Loss (gain) on sale of businesses (Note 25) | — | (3 | ) | 40 | ||||||||||||||||||||
Gain on sale of property, plant and equipment | (7 | ) | (6 | ) | (3 | ) | (1 | ) | (3 | ) | (7 | ) | ||||||||||||
Environmental provision | 4 | 4 | 1 | 2 | 7 | 4 | ||||||||||||||||||
Foreign exchange loss (gain) | 6 | 6 | (5 | ) | 3 | (3 | ) | 6 | ||||||||||||||||
Other | 2 | (2 | ) | 5 | — | (2 | ) | 2 | ||||||||||||||||
|
|
| ||||||||||||||||||||||
Other operating loss (income), net | 20 | (497 | ) | (8 | ) | 7 | (4 | ) | 20 | |||||||||||||||
|
|
| ||||||||||||||||||||||
| (1) | On November 20, 2012 the Company sold hydro its assets in Ottawa, Ontario and Gatineau, Quebec. The transaction of approximately $46 million (CDN $46 million), includes three power stations (21M megawatts of installed capacity), water rights in the area, as well as Domtar Inc.’s equity stake in the Chaudière Water Power Inc. a ring dam consortium. As a result, the Company incurred a loss relating to the curtailment of the pension plan of $2 million and legal fees of $1 million. |
DOMTAR CORPORATION
NOTES TO CONSOLIDATED FINANCIAL STATEMENTS
DECEMBER 31, 20102012
(IN MILLIONS OF DOLLARS, UNLESS OTHERWISE NOTED)
INTEREST EXPENSE, NET
The following table presents the components of interest expense:
| Year ended December 31, 2010 | Year ended December 31, 2009 | Year ended December 31, 2008 | Year ended December 31, 2012 | Year ended December 31, 2011 | Year ended December 31, 2010 | |||||||||||||||||||
| $ | $ | $ | $ | $ | $ | |||||||||||||||||||
Interest on long-term debt(1) | 97 | 121 | 132 | 76 | 76 | 97 | ||||||||||||||||||
Premium and fees on debt-for-debt exchange | — | — | 1 | |||||||||||||||||||||
Loss (gain) on repurchase of long-term debt | 35 | 3 | (8 | ) | ||||||||||||||||||||
Loss on repurchase of long-term debt | 47 | 4 | 35 | |||||||||||||||||||||
Reversal of fair value decrement (increment) on debentures | 12 | (12 | ) | (3 | ) | (2 | ) | — | 12 | |||||||||||||||
Receivables securitization | 2 | 2 | 5 | 1 | 1 | 2 | ||||||||||||||||||
Amortization of debt issue costs and other | 10 | 11 | 6 | 9 | 7 | 10 | ||||||||||||||||||
|
|
| ||||||||||||||||||||||
| 156 | 125 | 133 | 131 | 88 | 156 | |||||||||||||||||||
Less: Interest income | 1 | — | — | — | 1 | 1 | ||||||||||||||||||
|
|
| ||||||||||||||||||||||
| 155 | 125 | 133 | 131 | 87 | 155 | |||||||||||||||||||
|
|
| ||||||||||||||||||||||
| (1) | The Company capitalized |
INCOME TAXES
The components of Domtar Corporation’sCompany’s earnings (loss) before income taxes by taxing jurisdiction were:
| December 31, 2010 | December 31, 2009 | December 31, 2008 | ||||||||||
| $ | $ | $ | ||||||||||
U.S. earnings | 177 | 560 | 15 | |||||||||
Foreign earnings (loss) | 271 | (70 | ) | (585 | ) | |||||||
Earnings (loss) before income taxes | 448 | 490 | (570 | ) | ||||||||
| December 31, 2012 | December 31, 2011 | December 31, 2010 | ||||||||||
| $ | $ | $ | ||||||||||
U.S. earnings | 116 | 220 | 177 | |||||||||
Foreign earnings | 120 | 285 | 271 | |||||||||
|
|
|
|
|
| |||||||
Earnings before income taxes | 236 | 505 | 448 | |||||||||
|
|
|
|
|
| |||||||
Provisions for income taxes include the following:
| Year ended December 31, 2012 | Year ended December 31, 2011 | Year ended December 31, 2010 | ||||||||||
| $ | $ | $ | ||||||||||
U.S. Federal and State: | ||||||||||||
Current | 68 | 93 | 17 | |||||||||
Deferred | (34 | ) | (19 | ) | (74 | ) | ||||||
Foreign: | ||||||||||||
Current | 1 | — | — | |||||||||
Deferred | 23 | 59 | (100 | ) | ||||||||
|
|
|
|
|
| |||||||
Income tax expense (benefit) | 58 | 133 | (157 | ) | ||||||||
|
|
|
|
|
| |||||||
DOMTAR CORPORATION
NOTES TO CONSOLIDATED FINANCIAL STATEMENTS
DECEMBER 31, 20102012
(IN MILLIONS OF DOLLARS, UNLESS OTHERWISE NOTED)
NOTE 9.10. INCOME TAXES (CONTINUED)
Provisions for income taxes include the following:
| Year ended December 31, 2010 | Year ended December 31, 2009 | Year ended December 31, 2008 | ||||||||||
| $ | $ | $ | ||||||||||
U.S. Federal and State: | ||||||||||||
Current | 17 | 101 | 45 | |||||||||
Deferred | (74 | ) | 79 | (11 | ) | |||||||
Foreign: | ||||||||||||
Current | — | — | — | |||||||||
Deferred | (100 | ) | — | (31 | ) | |||||||
Income tax (benefit) expense | (157 | ) | 180 | 3 | ||||||||
The Company’s provision for income taxes of Domtar Corporation differs from the amounts computed by applying the statutory income tax rate of 35% to earnings (loss) before income taxes due to the following:
| Year ended December 31, 2010 | Year ended December 31, 2009 | Year ended December 31, 2008 | Year ended December 31, 2012 | Year ended December 31, 2011 | Year ended December 31, 2010 | |||||||||||||||||||
| $ | $ | $ | $ | $ | $ | |||||||||||||||||||
U.S. federal statutory income tax | 157 | 172 | (199 | ) | 83 | 177 | 157 | |||||||||||||||||
Reconcilling items: | ||||||||||||||||||||||||
Reconciling Items: | ||||||||||||||||||||||||
State and local income taxes, net of federal income tax benefit | 15 | 4 | 4 | 1 | 5 | 15 | ||||||||||||||||||
Foreign income tax rate differential | (14 | ) | 6 | 25 | (8 | ) | (20 | ) | (14 | ) | ||||||||||||||
Tax credits | (148 | ) | (13 | ) | (6 | ) | ||||||||||||||||||
Goodwill impairment | — | — | 113 | |||||||||||||||||||||
Tax credits and special deductions | (8 | ) | (16 | ) | (148 | ) | ||||||||||||||||||
Alternative fuel tax credit income | (9 | ) | (176 | ) | — | — | — | (9 | ) | |||||||||||||||
Tax rate changes | — | (2 | ) | 1 | (3 | ) | — | — | ||||||||||||||||
Uncertain tax positions | 15 | 168 | 8 | 6 | 5 | 15 | ||||||||||||||||||
U.S. manufacturing deduction | (2 | ) | (2 | ) | (2 | ) | (10 | ) | (12 | ) | (2 | ) | ||||||||||||
Valuation allowance on deferred tax assets | (164 | ) | 29 | 52 | 1 | — | (164 | ) | ||||||||||||||||
Other | (7 | ) | (6 | ) | 7 | (4 | ) | (6 | ) | (7 | ) | |||||||||||||
|
|
| ||||||||||||||||||||||
Income tax expense (benefit) | (157 | ) | 180 | 3 | 58 | 133 | (157 | ) | ||||||||||||||||
|
|
| ||||||||||||||||||||||
The Company recognized a tax benefit of $10 million for the manufacturing deduction in the U.S. in 2012 which impacts the effective tax rate for 2012. Additionally, the Company recorded an $8 million tax benefit related to federal, state, and provincial credits and special deductions which reduced the effective rate. The effective tax rate for 2012 was also impacted by an increase in the Company’s unrecognized tax benefits of $6 million, mainly accrued interest, and a $3 million benefit related to enacted tax law changes, mainly a tax rate reduction in Sweden, which is partially offset by U.S. tax law changes in several states.
For 2011, the Company had a significantly larger manufacturing deduction in the U.S. than in prior years since the Company utilized its remaining federal net operating loss carryforward in 2010. This deduction resulted in a tax benefit of $12 million which impacted the effective tax rate for 2011. The Company also recorded a $16 million tax benefit related to federal, state, and provincial credits and special deductions which reduced the effective tax rate for 2011. Additionally, the Company recognized a state tax benefit of $3 million due to U.S. restructuring that impacted the 2011 effective tax rate by reducing state income tax expense.
During 2010, the Company recognized $25 million of income related to alternative fuel tax credits in Other operating (income) loss, (income)net on the Consolidated Statement of Earnings (Loss).and Comprehensive Income. The $25 million represented an adjustment to amounts recordedpresented as deferred revenue at December 31, 2009 and was released to income following guidance issued by the IRSU.S. Internal Revenue Service (“IRS”) in March 2010. This income resulted in an income tax benefit of $9 million and an additional liability for uncertain income tax positions of $7 million, both of which impacted the U.S. effective tax rate for 2010. Additionally, the Company recorded a net tax benefit of $127 million from claiming a Cellulosic Biofuel Producer Credit (“CBPC”) in 2010 ($209 million of CBPC net of tax expense of $82 million), which also impacted the U.S. effective tax rate. Finally, the Company released the valuation allowance on the Canadian net deferred tax assets during the fourth quarter of 2010. The full $164 million valuation allowance balance that existed at January 1st, 2010 was either utilized during 2010 or reversed at the end of 2010 based on future projected income, which impacted the Canadian and overall consolidated effective tax rate.
DOMTAR CORPORATION
NOTES TO CONSOLIDATED FINANCIAL STATEMENTS
DECEMBER 31, 20102012
(IN MILLIONS OF DOLLARS, UNLESS OTHERWISE NOTED)
NOTE 9.10. INCOME TAXES (CONTINUED)
Deferred tax assets and liabilities are based on tax rates that are expected to be in effect in future periods when deferred items reverse. Change in tax rates or tax laws affect the expected future benefit or expense. The effect of such changes that occurred during each of the last three fiscal years is included in “Tax rate changes” disclosed under the effective income tax rate reconciliation shown above.
ALTERNATIVE FUEL TAX CREDITS
The U.S. Internal Revenue Code of 1986, as amended (the “Code”) permitted a refundable excise tax credit, until the end of 2009, for the production and use of alternative fuel mixtures derived from biomass. The Company submitted an application with the IRS to be registered as an alternative fuel mixer and received notification that its registration had been accepted in March 2009. The Company began producing and consuming alternative fuel mixtures in February 2009 at its eligible mills.
The Company recorded nil for such credits in 2012 (2011—nil; 2010—$25 million) in Other operating (income) loss on the Consolidated Statements of Earnings and Comprehensive Income based on the volume of alternative mixtures produced and burned during 2009. The $25 million recorded in 2010 represented an adjustment to amounts presented as deferred revenue at December 31, 2009. The $25 million was released to income following guidance issued by the IRS in March 2010. The Company did not record any income tax expense in 2012 (2011—nil; 2010—$7 million) related to the alternative fuel mixture income. According to the Code, the tax credit expired at the end of 2009. In 2010, the Company also received a $368 million refund, net of federal income tax offsets.
In July 2010, the U.S. Internal Revenue Service (“IRS”)IRS Office of Chief Counsel released an Advice Memorandum concluding that qualifying cellulosecellulosic biofuel sold or used before January 1, 2010, qualifiesis eligible for the cellulosic biofuel producer credit (“CBPC”)CBPC and willwould not be required to be registered by the Environmental Protection Agency. Each gallon of qualifying cellulose biofuel produced by any taxpayer operating a pulp and paper mill and used as a fuel in the taxpayer’s trade or business during calendar year 2009 willwould qualify for the $1.01 non-refundable CBPC. A taxpayer will be able to claim the credit on its federal income tax return for the 2009 tax year upon the receipt of a letter of registration from the IRS and any unused CBPC may be carried forward until 20152016 to offset a portion of federal taxes otherwise payable.
The Company hashad approximately 207 million gallons of cellulose biofuel that qualifiesqualified for this CBPC for which we havehad not previously made claimsbeen claimed under the Alternative Fuel MixtureTax Credit (“AFMC”AFTC”) that representsrepresented approximately $209 million of CBPC or approximately $127 million of after tax benefit to the Corporation. In July 2010, the Company submitted an application with the IRS to be registered for the CBPC and on September 28, 2010, wea notification was received our notification from the IRS that we arethe Company was successfully registered. On October 15, 2010 the IRS Office of Chief Counsel issued an Advice Memorandum concluding that the AFMCAFTC and CBPC could be claimed in the same year for different volumes of black liquor.biofuel. In November 2010, the Company filed an amended 2009 tax return with the IRS claiming a cellulosic biofuel producer credit of $209 million and recorded a net tax benefit of $127 million in Income tax expense (benefit) on the Consolidated Statement of Earnings (Loss). As ofand Comprehensive Income for the year ended December 31, 2010, approximately $170 million of this credit remains to offset future U.S. federal income tax liability.
During 2009, the2010. The Company recognized $503 million of income, before $5 million of related costs, from alternative fuel tax credits with no related tax expense, resulting in a benefit of $176 million and an additional liability for uncertain income tax positions of $162 million, with both items impacting the U.S. effective tax rate. If the Company’s income tax positions with respect to the alternative fuel mixture tax credits are sustained, eitherhas utilized all or in part, the Company would recognize a tax benefit in the future equal to the amount of the benefits sustained. Additionally, the Canadian effective tax rate for 2009 was impacted by the additional valuation allowance recorded against new Canadian deferred tax assets in the amount of $29 million.remaining credit during 2012.
During 2008, the Company recorded a goodwill impairment charge of $321 million with no tax benefit and both the Canadian and U.S. effective tax rates being impacted as a result. The Canadian effective tax rate for 2008 was also impacted by the valuation allowance taken on net Canadian deferred tax assets in the amount of $52 million.
DOMTAR CORPORATION
Deferred tax assets and liabilities are based on tax rates that are expected to be in effect in future periods when deferred items reverse. Changes in tax rates or tax laws affect the expected future benefit or expense. The effect of such changes that occurred during each of the last three fiscal years is included in “Tax rate changes” disclosed in the effective income tax rate reconciliation shown above.
NOTES TO CONSOLIDATED FINANCIAL STATEMENTS
DECEMBER 31, 20102012
(IN MILLIONS OF DOLLARS, UNLESS OTHERWISE NOTED)
NOTE 9.10. INCOME TAXES (CONTINUED)
DEFERRED TAX ASSETS AND LIABILITIES
The tax effects of significant temporary differences representing deferred tax assets and liabilities at December 31, 20102012 and December 31, 20092011 are comprised of the following:
| December 31, 2010 | December 31, 2009 | December 31, 2012 | December 31, 2011 | |||||||||||||
| $ | $ | $ | $ | |||||||||||||
Accounting provisions | 91 | 93 | 70 | 82 | ||||||||||||
Net operating loss carryforwards and other deductions | 114 | 179 | 109 | 104 | ||||||||||||
Pension and other employee future benefit plans | 52 | 64 | 100 | 76 | ||||||||||||
Inventory | 1 | 3 | 1 | 1 | ||||||||||||
Tax credits | 234 | 44 | 48 | 101 | ||||||||||||
Other | 12 | 2 | 22 | 33 | ||||||||||||
|
| |||||||||||||||
Gross deferred tax assets | 504 | 385 | 350 | 397 | ||||||||||||
Valuation allowance | — | (164 | ) | (14 | ) | (4 | ) | |||||||||
|
| |||||||||||||||
Net deferred tax assets | 504 | 221 | 336 | 393 | ||||||||||||
|
| |||||||||||||||
Property, plant and equipment | (820 | ) | (824 | ) | (761 | ) | (801 | ) | ||||||||
Deferred income | (83 | ) | — | (1 | ) | (19 | ) | |||||||||
Impact of foreign exchange on long-term debt and investments | (30 | ) | (27 | ) | (13 | ) | (13 | ) | ||||||||
Intangible assets | (96 | ) | (73 | ) | ||||||||||||
|
| |||||||||||||||
Total deferred tax liabilities | (933 | ) | (851 | ) | (871 | ) | (906 | ) | ||||||||
|
| |||||||||||||||
Net deferred tax liabilities | (429 | ) | (630 | ) | (535 | ) | (513 | ) | ||||||||
|
| |||||||||||||||
Included in: | ||||||||||||||||
Deferred income tax assets | 115 | 137 | 45 | 125 | ||||||||||||
Other assets (Note 13) | 140 | 32 | ||||||||||||||
Income and other taxes payable | (2 | ) | (6 | ) | ||||||||||||
Other assets (Note 15) | 69 | 36 | ||||||||||||||
Deferred income taxes and other | (682 | ) | (793 | ) | (649 | ) | (674 | ) | ||||||||
|
| |||||||||||||||
Total | (429 | ) | (630 | ) | (535 | ) | (513 | ) | ||||||||
|
| |||||||||||||||
DOMTAR CORPORATION
NOTES TO CONSOLIDATED FINANCIAL STATEMENTS
DECEMBER 31, 20102012
(IN MILLIONS OF DOLLARS, UNLESS OTHERWISE NOTED)
NOTE 9.10. INCOME TAXES (CONTINUED)
At December 31, 2010, Domtar Corporation had utilized all of its remaining U.S. federal net operating loss carryforwards ($227 million as of December 31, 2009) and hashad no carryforward into future years. With the acquisition of Attends US on September 1, 2011, the Company acquired additional federal net operating loss carryforwards of $2 million. These U.S. federal net operating losses are subject to annual limitations under Section 382 of the Internal Revenue Code of 1986, as amended (the “Code”), that can vary from year to year. At December 31, 2012, the Company had $2 million of federal net operating loss carryforward remaining which expires in 2028. Canadian federal losses and scientific research and experimental development expenditures not previously deducted represent an amount of $394$280 million, (CDN $397 million), out of which losses in the amount of $13$69 million (CDN $13 million) will begin to expire in 2025.2029. The Company also has other foreign net operating loss carryforwards of $5 million, which expire in 2017, and $61 million, which may be carried forward indefinitely.
In assessing the realizationrealizability of deferred tax assets, management considers whether it is more likely than not that some portion or all of the deferred tax assets will not be realized. The ultimate realization of deferred tax assets is dependent upon the generation of future taxable income during periods in which temporary differences become deductible. Management considers the scheduled reversal of deferred tax liabilities, projected future taxable income, and tax planning strategies in making this assessment. Management believes that it is more likely than not that the results of future operations will generate sufficient taxable income to realize the deferred tax assets.
The Company had previously established a valuation allowance against the net deferred tax assets of the Canadian subsidiaries resulting in a valuation allowance of $164 million as of December 31, 2009. Domtar Corporation’s Canadian subsidiaries incurred substantial book losses over 2007, 2008, and 2009 (including the impairment and closure costs related to the Dryden facility). Forecasted results for the Canadian operations did not previously provide sufficient positive evidence to overcome the negative evidence related to the accumulated book losses and the Company concluded that the realization of the net deferred tax assets was not “more likely than not” in accordance with ASC 740. Consequently, in 2008 the Company recorded a charge in the amount of $52 million to establish a valuation allowance against all of its remaining net Canadian deferred tax assets that arose during 2008 and all prior years. The net deferred tax assets in Canada primarily consist of net operating losses, scientific research and experimental development expenditures not previously deducted and tax depreciable assets.
The Company evaluates the realization of deferred tax assets on a quarterly basis. Evaluating the need for an amount of a valuation allowance for deferred tax assets often requires significant judgment. All available evidence, both positive and negative, areis considered when determining whether, based on the weight of that evidence, a valuation allowance is needed. Specifically, the Companywe evaluated the following items:
Historical income / (losses) –— particularly the most recent three-year period
Reversals of future taxable temporary differences
Projected future income / (losses)
Tax planning strategies
Divestitures
Management believes that it is more likely than not that the results of future operations will generate sufficient taxable income to realize the deferred tax assets in the U.S., with the exception of certain state credits for which a valuation allowance of $4 million exists at December 31, 2012, and certain foreign loss carryforwards for which a valuation allowance of $10 million exists at December 31, 2012. Of this amount, only $1 million impacted tax expense and the effective tax rate for 2012.
During the fourth quarter of 2010, the Company determined based on analysis of both positive and negative evidence that the realizeability of all such assets was “more likely than not” based on current and projected future taxable income and other accumulated positive evidence. Accordingly, the Company removed the valuation allowance from its deferred tax assets resulting in a benefit to deferred tax expense along with current utilization of $164 million in its statements of operations for 2010.
DOMTAR CORPORATION
NOTES TO CONSOLIDATED FINANCIAL STATEMENTS
DECEMBER 31, 2012
(IN MILLIONS OF DOLLARS, UNLESS OTHERWISE NOTED)
NOTE 10. INCOME TAXES (CONTINUED)
In its evaluation process, the Company gives the most weight to historical income or losses. During the fourth quarter of 2010, after evaluating all available positive and negative evidence, although realization is not assured, the Company determined that it is more likely than not that the Canadian net deferred tax assets will be fully realized in the future prior to expiration. Key factors contributing to this conclusion that the positive evidence ultimately outweighed the existing negative evidence during the fourth quarter of 2010 included the fact
NOTES TO CONSOLIDATED FINANCIAL STATEMENTS
DECEMBER 31, 2010
(IN MILLIONS OF DOLLARS, UNLESS OTHERWISE NOTED)
NOTE 9. INCOME TAXES (CONTINUED)
that the Canadian operations, excluding the loss-generating Wood business (sold to a third party on June 30, 2010) and elements of other comprehensive income, went from a three-year cumulative loss position to a three-year cumulative income position during the fourth quarter of 2010; they have been able to demonstrate continual profitability throughout 2010; and are projected to continue to be profitable in the coming years. Accordingly, the Company released the valuation allowance from its deferred tax assets resulting in a deferred tax benefit of $164 million in its Consolidated Statements of Earnings (Loss)and Comprehensive Income in 2010.
The Company does not provide for a U.S. income tax liability on undistributed earnings of its Canadianour foreign subsidiaries. The earnings of the Canadianforeign subsidiaries, which reflect full provision for Canadian income taxes, are currently indefinitely reinvested in Canadianforeign operations. Temporary differences related to its investment inNo provision is made for income taxes that would be payable upon the Canadiandistribution of earnings from foreign subsidiaries doas computation of these amounts is not result in any unrecognized deferred tax liability.practicable.
ACCOUNTING FOR UNCERTAINTY IN INCOME TAXES
At December 31, 2010,2012, the Company had gross unrecognized tax benefits of approximately $254 million ($253 million and $242 million ($226 millionfor 2011 and $45 million at December 31, 2009 and 2008,2010 respectively). If recognized in 2011,2013, these tax benefits would impact the effective tax rate. These amounts represent the gross amount of exposure in individual jurisdictions and do not reflect any additional benefits expected to be realized if such positions were sustained, such as federal deduction that could be realized if an unrecognized state deduction was not sustained.
| December 31, 2010 | December 31, 2009 | December 31, 2008 | December 31, 2012 | December 31, 2011 | December 31, 2010 | |||||||||||||||||||
| $ | $ | $ | $ | $ | $ | |||||||||||||||||||
Balance at beginning of year | 226 | 45 | 40 | 253 | 242 | 226 | ||||||||||||||||||
Additions based on tax positions related to current year | 14 | 179 | 7 | 1 | 4 | 14 | ||||||||||||||||||
Additions for tax positions of prior years | — | — | 6 | 1 | 4 | — | ||||||||||||||||||
Reductions for tax positions of prior years | (5 | ) | — | (6 | ) | — | (1 | ) | — | |||||||||||||||
Reductions related to settlements with taxing authorities | (10 | ) | — | — | ||||||||||||||||||||
Expirations of statutes of limitations | — | (4 | ) | (5 | ) | |||||||||||||||||||
Interest | 6 | — | 1 | 9 | 9 | 6 | ||||||||||||||||||
Foreign exchange impact | 1 | 2 | (3 | ) | — | (1 | ) | 1 | ||||||||||||||||
|
|
| ||||||||||||||||||||||
Balance at end of year | 242 | 226 | 45 | 254 | 253 | 242 | ||||||||||||||||||
|
|
| ||||||||||||||||||||||
As a result of the acquisition of Attends US, the Company recorded unrecognized tax benefits during 2011 which are shown as additions for tax positions of prior years in the table above.
DOMTAR CORPORATION
NOTES TO CONSOLIDATED FINANCIAL STATEMENTS
DECEMBER 31, 2012
(IN MILLIONS OF DOLLARS, UNLESS OTHERWISE NOTED)
NOTE 10. INCOME TAXES (CONTINUED)
The Company recorded $6$9 million of accrued interest associated with unrecognized tax benefits for the period ending December 31, 2010 (nil2012 ($9 million and $1$6 million for 20092011 and 2008,2010, respectively). The Company recognizes accrued interest and penalties, if any, related to unrecognized tax benefits as a component of tax expense.
The major jurisdictions where the Company and its subsidiaries will file returns in 2012, in addition to filing one consolidated U.S. federal income tax return, for 2010are Canada, Sweden, and China. The Company and its subsidiaries will also file returns in various other countries in Europe and Asia as well as returns in Canada, Hong Kong, various states and provinces. At December 31, 2010,2012, the Company’s subsidiaries are subject to U.S. and Canadianforeign federal income tax as well as various state or provincial income tax examinations for the tax years 2006 through 2010,2011, with U.S. federal years prior to 20072008 being closed from a cash tax liability standpoint howeverin the U.S., but the loss carryforwards can be adjusted in any open year where the loss has been utilized. The Company does not anticipate that adjustments stemming from these audits wouldcould result in a significant change to the results of its operations and financial condition, except as mentioned below.
During the second quarter of 2012, the IRS began an audit of the Company’s 2009 U.S. income tax return. The completion of the audit by the IRS or financial condition.the issuance of authoritative guidance will result in the release of the provision or settlement of the liability in cash of some or all of these previously unrecognized tax benefits. As of December 31, 2012, the Company has gross unrecognized tax benefits and interest of $198 million and related deferred tax assets of $17 million associated with the alternative fuel tax credits claimed on the Company’s 2009 tax return. The recognition of these benefits, $181 million net of deferred taxes, would impact the effective tax rate. The Company does not expectreasonably expects the audit to be settled within the next 12 months which would result in a significant change to the amount of unrecognized tax benefits over the next 12 months.benefits. However, audit outcomes and the timing of audit settlements are subject to significant uncertainty.
NOTES TO CONSOLIDATED FINANCIAL STATEMENTS
DECEMBER 31, 2010
(IN MILLIONS OF DOLLARS, UNLESS OTHERWISE NOTED)
NOTE 9. INCOME TAXES (CONTINUED)
TAX SHARING AGREEMENT
In conjunction with the Transaction, the Company signed a Tax Sharing Agreement that governs both Weyerhaeuser and the Company’s rights and obligations after the Transaction with respect to taxes for both pre and post-Distribution periods in regards to ordinary course taxes, and also covers related administrative matters. The Distribution refers to the distribution of shares of the Company to Weyerhaeuser shareholders. The Company will generally be required to indemnify Weyerhaeuser and Weyerhaeuser shareholders against any tax resulting from the Distribution if that tax results from an act or omission to act by the Company after the Distribution. If Weyerhaeuser, however, should recognize a gain on the Distribution for reasons not related to an act or omission to act by the Company after the Distribution, Weyerhaeuser would be responsible for such taxes and would not be entitled to indemnification by the Company under the Tax Sharing Agreement.
INVENTORIES
The following table presents the components of inventories:
| December 31, 2010 | December 31, 2009 | December 31, 2012 | December 31, 2011 | |||||||||||||
| $ | $ | $ | $ | |||||||||||||
Work in process and finished goods | 361 | 430 | 381 | 363 | ||||||||||||
Raw materials | 105 | 114 | 112 | 105 | ||||||||||||
Operating and maintenance supplies | 182 | 201 | 182 | 184 | ||||||||||||
|
| |||||||||||||||
| 648 | 745 | 675 | 652 | |||||||||||||
|
| |||||||||||||||
DOMTAR CORPORATION
NOTES TO CONSOLIDATED FINANCIAL STATEMENTS
DECEMBER 31, 2012
(IN MILLIONS OF DOLLARS, UNLESS OTHERWISE NOTED)
GOODWILL
The carrying value and any changes in the carrying value of goodwill are as follows:
| December 31, 2012 | December 31, 2011 | |||||||
| $ | $ | |||||||
Balance at beginning of year | 163 | — | ||||||
Acquisition of Attends Healthcare Inc. | — | 163 | ||||||
Acquisition of Attends Healthcare Limited | 71 | — | ||||||
Acquisition of EAM Corporation | 31 | — | ||||||
Effect of foreign currency exchange rate change | (2 | ) | — | |||||
|
|
|
| |||||
Balance at end of year | 263 | 163 | ||||||
|
|
|
| |||||
The goodwill at December 31, 2012 is entirely related to the Personal Care segment. (See Note 3 “Acquisition of Businesses” for further information on the increase in 2012).
At the beginning of the fourth quarter of 2012, the Company assessed qualitative factors to determine whether it was more likely than not that the fair value of the three reporting units was less than its carrying amount. After assessing the totality of events and circumstances, the Company determined that it was more likely than not that the fair value of the reporting unit was greater than its carrying amount. Thus, performing the two-step impairment test was unnecessary and no impairment charge was recorded for goodwill.
At December 31, 2012, the accumulated impairment loss amounted to $321 million (2011—$321 million). The impairment of goodwill was done in 2008, and was related to the Pulp and Paper segment.
PROPERTY, PLANT AND EQUIPMENT
The following table presents the components of property, plant and equipment:
| Range of useful lives | December 31, 2010 | December 31, 2009 | ||||||||||||||||||||||
| $ | $ | Range of useful lives | December 31, 2012 | December 31, 2011 | ||||||||||||||||||||
| $ | $ | |||||||||||||||||||||||
Machinery and equipment | 3-20 | 7,808 | 8,048 | 3-20 | 7,392 | 7,164 | ||||||||||||||||||
Buildings and improvements | 10-40 | 1,122 | 1,168 | 10-40 | 992 | 934 | ||||||||||||||||||
Timber limits and land | 284 | 286 | 270 | 264 | ||||||||||||||||||||
Assets under construction | 41 | 73 | 139 | 86 | ||||||||||||||||||||
|
| |||||||||||||||||||||||
| 9,255 | 9,575 | 8,793 | 8,448 | |||||||||||||||||||||
Less: Allowance for depreciation and amortization | (5,488 | ) | (5,446 | ) | (5,392 | ) | (4,989 | ) | ||||||||||||||||
|
| |||||||||||||||||||||||
| 3,767 | 4,129 | 3,401 | 3,459 | |||||||||||||||||||||
|
| |||||||||||||||||||||||
Depreciation and amortization expense related to property, plant and equipment for the year ended December 31, 2012 was $377 million (2011—$371 million; 2010—$391 million).
DOMTAR CORPORATION
NOTES TO CONSOLIDATED FINANCIAL STATEMENTS
DECEMBER 31, 20102012
(IN MILLIONS OF DOLLARS, UNLESS OTHERWISE NOTED)
INTANGIBLE ASSETS
The following table presents the components of intangible assets:
Weighted average useful lives | December 31, 2010 | December 31, 2009 | Estimated useful lives (in years) | December 31, 2012 | December 31, 2011 | |||||||||||||||||||||||
| $ | $ | Gross carrying amount | Accumulated amortization | Gross carrying amount | Accumulated amortization | |||||||||||||||||||||||
| $ | $ | $ | $ | |||||||||||||||||||||||||
Intangible assets subject to amortization | ||||||||||||||||||||||||||||
Water rights | 40 | 8 | 15 | 40 | 8 | (1 | ) | 8 | (1 | ) | ||||||||||||||||||
Power purchase agreements | 25 | 33 | 31 | 25 | — | — | 32 | — | ||||||||||||||||||||
Customer relationships | 17 | 11 | 11 | 20-40 | 186 | (7 | ) | 104 | (4 | ) | ||||||||||||||||||
Trade names | 7 | 7 | 7 | 7 | 7 | (7 | ) | 7 | (4 | ) | ||||||||||||||||||
Supplier agreement | 5 | 6 | 6 | 5 | 6 | (6 | ) | 6 | (5 | ) | ||||||||||||||||||
Cutting rights | Units of production method | — | 23 | |||||||||||||||||||||||||
Technology(2) | 7-20 | 8 | — | — | — | |||||||||||||||||||||||
Non-Compete(2) | 9 | 1 | — | — | — | |||||||||||||||||||||||
|
|
|
| |||||||||||||||||||||||||
| 216 | (21 | ) | 157 | (14 | ) | |||||||||||||||||||||||
Intangible assets not subject to amortization | ||||||||||||||||||||||||||||
Trade names(3) | 114 | — | 61 | — | ||||||||||||||||||||||||
| 65 | 93 |
|
|
|
| |||||||||||||||||||||||
Allowance for amortization | (9 | ) | (8 | ) | ||||||||||||||||||||||||
Total | 330 | (21 | ) | 218 | (14 | ) | ||||||||||||||||||||||
|
|
|
| |||||||||||||||||||||||||
Total intangible assets | 56 | 85 | ||||||||||||||||||||||||||
Amortization expense related to intangible assets for the year ended December 31, 20102012 was $4$8 million (2009—(2011—$85 million; 2008—2010—$104 million).
Amortization expense for the next five years related to intangible assets is expected to be as follows:
| 2011 | 2012 | 2013 | 2014 | 2015 | ||||||||||||||||
| $ | $ | $ | $ | $ | ||||||||||||||||
Amortization expense related to intangible assets | 5 | 5 | 3 | 3 | 2 | |||||||||||||||
| 2013 | 2014 | 2015 | 2016 | 2017 | ||||||||||||||||
| $ | $ | $ | $ | $ | ||||||||||||||||
Amortization expense related to intangible assets | 8 | 8 | 6 | 6 | 6 | |||||||||||||||
|
|
|
|
|
|
|
|
|
| |||||||||||
| (1) | Increase relates to the acquisitions of Attends Healthcare Limited on March 1, 2012 ($71 million) and EAM Corporation on May 10, 2012 ($19 million). |
| (2) | Increase relates to the acquisition of EAM Corporation on May 10, 2012. |
| (3) | Increase relates to the acquisition of Attends Healthcare Limited on March 1, 2012. |
At the beginning of the fourth quarter of 2012, the Company assessed qualitative factors to determine whether it was more likely than not that the fair value of each indefinite-lived intangible assets was less than its carrying amount. After assessing the totality of events and circumstances, the Company determined that it was more likely than not that the fair value of indefinite-lived intangible assets was greater than their carrying amount. Thus, performing the quantitative impairment test was unnecessary and no impairment charge was recorded for these assets.
DOMTAR CORPORATION
NOTES TO CONSOLIDATED FINANCIAL STATEMENTS
DECEMBER 31, 2012
(IN MILLIONS OF DOLLARS, UNLESS OTHERWISE NOTED)
OTHER ASSETS
The following table presents the components of other assets:
| December 31, 2010 | December 31, 2009 | |||||||
| $ | $ | |||||||
Pension asset—defined benefit pension plans (Note 6) | 36 | 32 | ||||||
Unamortized debt issue costs | 13 | 19 | ||||||
Deferred income tax assets (Note 9) | 140 | 32 | ||||||
Investments and advances | 7 | 14 | ||||||
Other | 7 | 6 | ||||||
| 203 | 103 | |||||||
NOTES TO CONSOLIDATED FINANCIAL STATEMENTS
DECEMBER 31, 2010
(IN MILLIONS OF DOLLARS, UNLESS OTHERWISE NOTED)
| December 31, 2012 | December 31, 2011 | |||||||
| $ | $ | |||||||
Pension asset—defined benefit pension plans (Note 7) | 41 | 53 | ||||||
Unamortized debt issue costs | 14 | 11 | ||||||
Deferred income tax assets (Note 10) | 69 | 36 | ||||||
Investments and advances | 7 | 5 | ||||||
Other | 4 | 4 | ||||||
|
|
|
| |||||
| 135 | 109 | |||||||
|
|
|
| |||||
CLOSURE AND RESTRUCTURING COSTS AND LIABILITY
The Company regularly reviews its overall production capacity with the objective of adjustingaligning its production capacity with anticipated long-term demand.
In 2011, the Company decided to withdraw from one of its multiemployer pension plans and recorded a withdrawal liability and a charge to earnings of $32 million. In 2012, as a result of a revision in the estimated withdrawal liability, the Company recorded a further charge to earnings of $14 million. Also in 2012, the Company withdrew from a second multiemployer pension plan and recorded a withdrawal liability and a charge to earnings of $1 million. While this is Company’s best estimate of the ultimate cost of the withdrawal from these plans at December 31, 2012, additional withdrawal liabilities may be incurred based on the final fund assessment expected to occur in the second quarter of 2013. Further, the Company remains liable for potential additional withdrawal liabilities to the fund in the event of a mass withdrawal, as defined by statute, occurring anytime within the next three years.
In the fourth quarter of 2011, the Company incurred a $9 million loss from an estimated pension curtailment associated with the conversion of certain of its U.S. defined benefit pension plans to defined contribution pension plans recorded as a component of closure and restructuring costs.
Kamloops, British Columbia pulp facility
On December 13, 2012, the Company announced the permanent shut down of one pulp machine at its Kamloops, British Columbia mill. This decision will result in a permanent curtailment of Domtar’s annual pulp production by approximately 120,000 air dried metric tons of sawdust softwood pulp and will affect approximately 125 employees.
As a result, the Company recorded $7 million of impairment on property, plant and equipment, a component of Impairment and write-down of property, plant and equipment and intangible assets on the Consolidated
DOMTAR CORPORATION
NOTES TO CONSOLIDATED FINANCIAL STATEMENTS
DECEMBER 31, 2012
(IN MILLIONS OF DOLLARS, UNLESS OTHERWISE NOTED)
NOTE 16. CLOSURE AND RESTRUCTURING COSTS AND LIABILITY (CONTINUED)
Statement of Earnings and Comprehensive Income, $5 million of severance and termination costs and a $4 million write-down of inventory. The pulp machine, known at the mill as the “A-Line”, is expected to be closed by the end of March 2013.
Mira Loma, California converting plant
During the first quarter of 2012, the Company recorded a $2 million write-down of property, plant and equipment at its Mira Loma location in California, in Impairment and write-down of property, plant and equipment and intangible assets on the Consolidated Statement of Earnings and Comprehensive Income.
Lebel-sur-Quévillon pulp mill and sawmill
Operations at the pulp mill were indefinitely idled in November 2005 due to unfavorable economic conditions and the sawmill was indefinitely idled since 2006 and then permanently closed in 2008. At the time, the pulp mill and sawmill employed approximately 425 and 140 employees, respectively. The Lebel-sur-Quévillon pulp mill had an annual production capacity of 300,000 metric tons. During 2011, the Company reversed $2 million of severance and termination costs related to our Lebel-sur-Quévillon pulp mill and sawmill and following the signing of a definitive agreement for the sale of its Lebel-sur-Quévillon assets, the Company recorded a $12 million write-down for the remaining fixed assets net book value, a component of Impairment and write-down of property, plant and equipment and intangible assets on the Consolidated Statement of Earnings and Comprehensive Income. During the second quarter of 2012, the Company concluded the sale of its pulp and sawmill assets to Fortress Paper Ltd, and its land related to those assets to a subsidiary of the Government of Quebec, for net proceeds of $1, respectively.
Ashdown pulp and paper mill
On March 29, 2011, the Company announced that it would permanently shut down one of four paper machines at its Ashdown, Arkansas pulp and paper mill. This measure reduced the Company’s annual uncoated freesheet paper production capacity by approximately 125,000 short tons. The mill’s workforce was reduced by approximately 110 employees. The Company recorded $1 million write-down of inventory and $1 million of severance and termination costs as well as $73 million of accelerated depreciation, a component of Impairment and write-down of property, plant and equipment and intangible assets. Operations ceased on August 1, 2011.
Plymouth pulp and paper mill
On February 5, 2009, the Company announced a permanent shut down of a paper machine at its Plymouth, North Carolina pulp and paper mill effective at the end of February 2009. The Company further announced in 2009 that the Plymouth mill would be converted to a 100% fluff pulp mill. This measure resulted in the permanent curtailment of 293,000 tons of paper production capacity and the shut down affected approximately 185 employees. During 2011, the Company reversed $2 million of severance and termination costs.
On November 17, 2010, the Company announced the start up of its new fluff pulp machine which will havebrought the mill to an annual production capacity of approximately 444,000 metric tons.tons of fluff pulp. The mill will exclusively produceproduces fluff pulp and operateoperates two fiber lines and one fluff pulp machine. During the year,2010, the Company recorded $39 million of accelerated depreciation and a $1 million write-down of inventory obsolescence related to the reconfiguration of the Plymouth, North Carolina mill to 100% fluff pulp production, announced on October 20, 2009. The Company recorded a $1 million write-down for the related paper machine in 2010.2010 (under
DOMTAR CORPORATION
NOTES TO CONSOLIDATED FINANCIAL STATEMENTS
DECEMBER 31, 2012
(IN MILLIONS OF DOLLARS, UNLESS OTHERWISE NOTED)
NOTE 16. CLOSURE AND RESTRUCTURING COSTS AND LIABILITY (CONTINUED)
Impairment and write-down of property, plant and equipment and intangible assets on the Consolidated Statement of Earnings and Comprehensive Income).
Langhorne forms plant
On February 1, 2011, the Company announced the closure of its forms plant in Langhorne, Pennsylvania, and recorded $4 million in severance and termination costs.
Cerritos forms converting plant
During the second quarter of 2010, the Company decided to closeannounced the closure of the Cerritos, California forms converting plant, and recorded a $1 million write-down for the related assets, as a component of Impairment and write-down of property, plant and equipment and intangible assets on the Consolidated Statement of Earnings and Comprehensive Income, and $1 million in severance and termination costs. Operations ceased on July 16, 2010.
Columbus paper mill
On March 16, 2010, the Company announced that it would permanently close its coated groundwood paper mill in Columbus, Mississippi. This measure resulted in the permanent curtailment of 238,000 tons of coated groundwood and 70,000 metric tons of thermo-mechanical pulp, as well as affected 219 employees. The Company recorded a $9 million write-down for the related fixed assets (a component of Impairment and write-down of property, plant and equipment and intangible assets on the Consolidated Statement of Earnings and Comprehensive Income), $8 million of severance and termination costs and an $8 million write-down of inventory obsolescence.inventory. Operations ceased in April 2010.
Other costs
During 2012, other costs related to previous and ongoing closures include $1 million in severance and termination costs, a $1 million write-down of inventory, $2 million in pension and $3 million in other costs.
During 2011, other costs related to previous closures include $4 million in severance and termination costs, a $1 million write-down of inventory and $4 million in other costs.
During 2010, other costs related to previous closures include $3 million in severance and termination costs and $6 million of other costs.
On December 21, 2009, the Company decided to dismantle the Prince Albert facility. The Company removed machinery and equipment from the site and may take further steps to engage the services of demolition contractors and file for a demolition permit but in the meantime, the Company is evaluating other options for the site. The Prince Albert pulp and paper mill was closed in the first quarter of 2006 and has not been operated since. The Company recorded a $14 million impairment charge for the related machinery and equipment, $2 million of inventory obsolescence, $4 million of environmental costs and $1 million of other costs. In 2008, the dismantling of the paper machine and converting equipment was completed and the Company recorded $10 million in dismantling expenses.
On October 20, 2009, the Company announced that it would convert its Plymouth mill to 100% fluff pulp production. The aggregate pre-tax earnings charge in connection with this conversion was $26 million which included $13 million in non-cash charges relating to accelerated depreciation of the carrying amounts of the manufacturing equipment as well as $3 million in write-down of related spare parts and $10 million in severance and termination costs.
On February 5, 2009, the Company announced a permanent shut down of a paper machine in its Plymouth pulp and paper mill effective at the end of February 2009. This measure resulted in the permanent curtailment of 293,000 tons of paper production capacity and the shut down affected approximately 185 employees. The Company recorded a $35 million accelerated depreciation charge for the related write-down on plant and equipment, $7 million of severance and termination costs and $5 million of inventory obsolescence. Given the
NOTES TO CONSOLIDATED FINANCIAL STATEMENTS
DECEMBER 31, 2010
(IN MILLIONS OF DOLLARS, UNLESS OTHERWISE NOTED)
NOTE 14. CLOSURE AND RESTRUCTURING LIABILITY (CONTINUED)
closure of the paper machine, the Company conducted a Step I impairment test on the remaining Plymouth mill operation’s fixed assets and concluded that the undiscounted estimated future cash flows associated with the long-lived assets exceeded their carrying value and, as such, no additional impairment charge was required.
During 2009, other costs related to previous closures include $5 million of severance and termination costs, $4 million loss of pension curtailment and $10 million of other costs.
Following the permanent closure announced on December 18, 2008 of its Lebel-sur-Quévillon pulp mill and sawmill, the Company recorded $4 million loss of pension curtailment in 2009 and recorded $8 million of severance and termination costs in 2008. Operations at the pulp mill had been indefinitely idled in November 2005 due to unfavorable economic conditions and the sawmill had been indefinitely idled since 2006. At the time, the pulp mill and sawmill employed 425 and 140 employees, respectively. The Lebel-sur-Quévillon pulp mill had an annual production capacity of 300,000 metric tons.
Following the permanent shutdown of the paper machine and the converting operations at the Dryden mill announced on November 4, 2008, the Company recorded $3 million and $6 million of severance and termination costs, $5 million and $1 million of inventory obsolescence and nil and $8 million loss of pension curtailment, respectively in 2009 and 2008. These measures resulted in the permanent curtailment of Domtar’s annual paper production capacity by approximately 151,000 tons and affected approximately 195 employees.
During 2008, other costs related to previous closures include $9 million in severance and termination costs and $1 million of other costs.
The following tables provide the components of closure and restructuring costs by segment:
| Year ended December 31, 2010 | Year ended December 31, 2012 | |||||||||||||||||||||||||||||||
| Papers | Paper Merchants | Wood | Total | Pulp and Paper | Distribution | Personal Care | Total | |||||||||||||||||||||||||
| $ | $ | $ | $ | $ | $ | $ | ||||||||||||||||||||||||||
Severance and termination costs | 11 | 1 | — | 12 | 5 | 1 | — | 6 | ||||||||||||||||||||||||
Inventory obsolescence(1) | 9 | — | — | 9 | ||||||||||||||||||||||||||||
Inventory write-down(1) | 5 | — | — | 5 | ||||||||||||||||||||||||||||
Loss on curtailment of pension benefits and pension withdrawal liability | 15 | 1 | — | 16 | ||||||||||||||||||||||||||||
Other | 6 | — | — | 6 | 2 | — | 1 | 3 | ||||||||||||||||||||||||
|
|
|
| |||||||||||||||||||||||||||||
Closure and restructuring costs | 26 | 1 | — | 27 | 27 | 2 | 1 | 30 | ||||||||||||||||||||||||
|
|
|
| |||||||||||||||||||||||||||||
DOMTAR CORPORATION
| Year ended December 31, 2009 | ||||||||||||||||
| Papers | Paper Merchants | Wood | Total | |||||||||||||
| $ | $ | $ | $ | |||||||||||||
Severance and termination costs | 20 | 2 | 3 | 25 | ||||||||||||
Inventory obsolescence(1) | 15 | — | — | 15 | ||||||||||||
Loss on curtailment of pension benefits | 4 | — | 4 | 8 | ||||||||||||
Environmental provision | 4 | — | — | 4 | ||||||||||||
Other | 9 | — | 2 | 11 | ||||||||||||
Closure and restructuring costs | 52 | 2 | 9 | 63 | ||||||||||||
NOTES TO CONSOLIDATED FINANCIAL STATEMENTS
DECEMBER 31, 20102012
(IN MILLIONS OF DOLLARS, UNLESS OTHERWISE NOTED)
NOTE 14.16. CLOSURE AND RESTRUCTURING COSTS AND LIABILITY (CONTINUED)
| Year ended December 31, 2008 | Year ended December 31, 2011 | |||||||||||||||||||||||||||
| Papers | Paper Merchants | Wood | Total | Pulp and Paper | Distribution | Total | ||||||||||||||||||||||
| $ | $ | $ | $ | $ | $ | $ | ||||||||||||||||||||||
Severance and termination costs | 19 | — | 4 | 23 | 4 | 1 | 5 | |||||||||||||||||||||
Dismantling expense | 10 | — | — | 10 | ||||||||||||||||||||||||
Inventory obsolescence(1) | 1 | — | — | 1 | ||||||||||||||||||||||||
Loss on curtailment of pension benefits | 8 | — | — | 8 | ||||||||||||||||||||||||
Inventory write-down(1) | 2 | — | 2 | |||||||||||||||||||||||||
Loss on curtailment of pension benefits and pension withdrawal liability | 41 | — | 41 | |||||||||||||||||||||||||
Other | — | — | 1 | 1 | 4 | — | 4 | |||||||||||||||||||||
|
|
| ||||||||||||||||||||||||||
Closure and restructuring costs | 38 | — | 5 | 43 | 51 | 1 | 52 | |||||||||||||||||||||
|
|
| ||||||||||||||||||||||||||
| Year ended December 31, 2010 | ||||||||||||
| Pulp and Paper | Distribution | Total | ||||||||||
| $ | $ | $ | ||||||||||
Severance and termination costs | 11 | 1 | 12 | |||||||||
Inventory write-down(1) | 9 | — | 9 | |||||||||
Other | 6 | — | 6 | |||||||||
|
|
|
|
|
| |||||||
Closure and restructuring costs | 26 | 1 | 27 | |||||||||
|
|
|
|
|
| |||||||
| (1) | Inventory |
The following table provides the activity in the closure and restructuring liability:
| December 31, 2010 | December 31, 2009 | December 31, 2012 | December 31, 2011 | |||||||||||||
| $ | $ | $ | $ | |||||||||||||
Balance at beginning of year | 24 | 47 | 6 | 17 | ||||||||||||
Environmental provision reflected in Note 20 | — | (17 | ) | |||||||||||||
Additions | 13 | 29 | 7 | 7 | ||||||||||||
Severance payments | (18 | ) | (32 | ) | (2 | ) | (10 | ) | ||||||||
Change in estimates | (2 | ) | (8 | ) | ||||||||||||
Other | (1 | ) | — | |||||||||||||
Effect of foreign currency exchange rate change | 1 | 5 | ||||||||||||||
Changes in estimates | (1 | ) | (8 | ) | ||||||||||||
|
| |||||||||||||||
Balance at end of year | 17 | 24 | 10 | 6 | ||||||||||||
|
| |||||||||||||||
Other costs related to the above 2010 closures expected to be incurred over 2011 include approximately $5The $10 million for demolition, $1provision is comprised of $7 million for securityof severance and termination costs and $3 million of other costs. These costs will be expensed as incurred and are related to the Papers segment.
Closure and restructuring costs are based on management’s best estimates at December 31, 2010. Although2012. Other costs related to the Company does not anticipate significant changes,above 2012 closures expected to be incurred over 2013 include approximately $13 million of accelerated depreciation and $3 million of severance and termination costs related to the actualPulp and Paper segment. Actual costs may differ from these estimates due to subsequent developments such as the results of environmental studies, the ability to find a buyer for assets set to be dismantled and demolished and other business developments. As such, additional costs and further write-downs may be required in future periods.
DOMTAR CORPORATION
NOTES TO CONSOLIDATED FINANCIAL STATEMENTS
DECEMBER 31, 20102012
(IN MILLIONS OF DOLLARS, UNLESS OTHERWISE NOTED)
CONSOLIDATED STATEMENTS OF COMPREHENSIVE INCOME (LOSS)
COMPREHENSIVE INCOME (LOSS) | Year ended December 31, 2010 | Year ended December 31, 2009 | Year ended December 31, 2008 | |||||||||
| $ | $ | $ | ||||||||||
Net earnings (loss) | 605 | 310 | (573 | ) | ||||||||
Other comprehensive income (loss) | ||||||||||||
Net derivative gains (losses) on cash flow hedges: | ||||||||||||
Net gain (loss) arising during the period, net of tax of $3 (2009—$2; 2008—$3) | (4 | ) | 51 | (77 | ) | |||||||
Less: Reclassification adjustment for (gains) losses included in net earnings (loss), net of tax of $(1) | (2 | ) | 18 | 25 | ||||||||
Foreign currency translation adjustments | 66 | 206 | (392 | ) | ||||||||
Change in unrecognized losses and prior service cost related to pension and post retirement benefit plans, net of tax of $19 (2009—$(6); 2008—$26) | (54 | ) | (74 | ) | (53 | ) | ||||||
Amortization of prior service costs | — | — | 1 | |||||||||
Comprehensive income (loss) | 611 | 511 | (1,069 | ) | ||||||||
TRADE AND OTHER PAYABLES
The following table presents the components of trade and other payables:
| December 31, 2010 | December 31, 2009 | |||||||
| $ | $ | |||||||
Trade payables | 409 | 395 | ||||||
Payroll-related accruals | 168 | 168 | ||||||
Accrued interest | 15 | 24 | ||||||
Payables on capital projects | 3 | 5 | ||||||
Rebate accruals | 13 | 17 | ||||||
Liability—other post-retirement benefit plans (Note 6) | 4 | 4 | ||||||
Provision for environment and other asset retirement obligations (Note 20) | 28 | 15 | ||||||
Closure and restructuring costs liability (Note 14) | 17 | 26 | ||||||
Derivative financial instruments | 10 | 12 | ||||||
Dividend payable | 11 | — | ||||||
Other | — | 20 | ||||||
| 678 | 686 | |||||||
NOTES TO CONSOLIDATED FINANCIAL STATEMENTS
DECEMBER 31, 2010
(IN MILLIONS OF DOLLARS, UNLESS OTHERWISE NOTED)
| December 31, 2012 | December 31, 2011 | |||||||
| $ | $ | |||||||
Trade payables | 358 | 383 | ||||||
Payroll-related accruals | 147 | 168 | ||||||
Accrued interest | 20 | 15 | ||||||
Payables on capital projects | 6 | 11 | ||||||
Rebate accruals | 56 | 45 | ||||||
Liability—pension and other post-retirement benefit plans (Note 7) | 5 | 2 | ||||||
Provision for environment and other asset retirement obligations (Note 21) | 19 | 24 | ||||||
Closure and restructuring costs liability (Note 16) | 10 | 6 | ||||||
Derivative financial instruments (Note 22) | 9 | 19 | ||||||
Dividend payable (Note 20) | 16 | 13 | ||||||
Other | — | 2 | ||||||
|
|
|
| |||||
| 646 | 688 | |||||||
|
|
|
| |||||
LONG-TERM DEBT
| Maturity | Notional Amount | Currency | December 31, 2010 | December 31, 2009 | Maturity | Notional Amount | Currency | December 31, 2012 | December 31, 2011 | |||||||||||||||||||||||||||||||||||
| $ | $ | $ | $ | $ | $ | |||||||||||||||||||||||||||||||||||||||
Unsecured notes | ||||||||||||||||||||||||||||||||||||||||||||
7.875% Notes | 2011 | — | US | — | 138 | |||||||||||||||||||||||||||||||||||||||
5.375% Notes | 2013 | 74 | US | 70 | 293 | 2013 | 72 | US | 72 | 72 | ||||||||||||||||||||||||||||||||||
7.125% Notes | 2015 | 213 | US | 213 | 399 | 2015 | 167 | US | 166 | 213 | ||||||||||||||||||||||||||||||||||
9.5% Notes | 2016 | 125 | US | 135 | 137 | 2016 | 94 | US | 99 | 133 | ||||||||||||||||||||||||||||||||||
10.75% Notes | 2017 | 400 | US | 388 | 386 | 2017 | 278 | US | 272 | 375 | ||||||||||||||||||||||||||||||||||
Secured term loan facility | 2014 | — | US | — | 336 | |||||||||||||||||||||||||||||||||||||||
Capital lease obligations | 2011 – 2028 | 21 | 23 | |||||||||||||||||||||||||||||||||||||||||
4.4% Notes | 2022 | 300 | US | 299 | — | |||||||||||||||||||||||||||||||||||||||
6.25% Notes | 2042 | 250 | US | 249 | — | |||||||||||||||||||||||||||||||||||||||
Capital lease obligations and other | 2012 –2028 | 50 | 48 | |||||||||||||||||||||||||||||||||||||||||
|
| |||||||||||||||||||||||||||||||||||||||||||
| 827 | 1,712 | 1,207 | 841 | |||||||||||||||||||||||||||||||||||||||||
Less: Due within one year | 2 | 11 | 79 | 4 | ||||||||||||||||||||||||||||||||||||||||
|
| |||||||||||||||||||||||||||||||||||||||||||
| 825 | 1,701 | 1,128 | 837 | |||||||||||||||||||||||||||||||||||||||||
|
| |||||||||||||||||||||||||||||||||||||||||||
DOMTAR CORPORATION
NOTES TO CONSOLIDATED FINANCIAL STATEMENTS
DECEMBER 31, 2012
(IN MILLIONS OF DOLLARS, UNLESS OTHERWISE NOTED)
NOTE 18. LONG-TERM DEBT (CONTINUED)
Principal long-term debt repayments, including capital lease obligations, in each of the next five years amountedwill amount to:
| Long-term debt | Capital leases | Long-term debt | Capital leases | |||||||||||||
| $ | $ | $ | $ | |||||||||||||
2011 | — | 3 | ||||||||||||||
2012 | — | 4 | ||||||||||||||
2013 | 74 | 3 | 72 | 9 | ||||||||||||
2014 | — | 4 | — | 8 | ||||||||||||
2015 | 213 | 3 | 167 | 6 | ||||||||||||
2016 | 94 | 6 | ||||||||||||||
2017 | 278 | 4 | ||||||||||||||
Thereafter | 525 | 15 | 550 | 37 | ||||||||||||
|
| |||||||||||||||
| 812 | 32 | 1,161 | 70 | |||||||||||||
Less: Amounts representing interest | — | (11 | ) | — | 21 | |||||||||||
|
| |||||||||||||||
Total payments, excluding fair value increment of $6 million and debt discount of $12 million | 812 | 21 | ||||||||||||||
Total payments, excluding debt discount of $2 million | 1,161 | 49 | ||||||||||||||
|
| |||||||||||||||
UNSECURED NOTES
On February 25, 2013, the Company announced that it will redeem approximately $70.9 million in aggregate principal amount of its 5.375% Notes due 2013, representing the majority of the Notes outstanding.
The Notes will be redeemed at a redemption price of 100% of the principal amount, plus accrued and unpaid interest, as well as a make-whole premium.
As a result of a cash tender offer during the first quarter of 2012, the Company repurchased $1 million of the 5.375% Notes due 2013, $47 million of the 7.125% Notes due 2015, $31 million of the 9.5% Notes due 2016 and $107 million of the 10.75% Notes due 2017. The Company incurred tender premiums of $47 million and additional charges of $3 million as a result of this extinguishment, both of which are included in Interest expense in the Consolidated Statements of Earnings and Comprehensive Income.
During the third quarter of 2011, the Company repurchased $15 million of the 10.75% debt and recorded a charge of $4 million on repurchase of the Notes.
On October 19, 2010, the Company redeemed $135 million of the 7.875% NoteNotes due in 2011 and recorded a charge of $7 million related to the repruchaserepurchase of the notes.Notes.
As a result of the cash tender offer during the second quarter of 2010, the Company repurchased $238 million of the 5.375% Notes due 2013 and $187 million of the 7.125% Notes due 2015. The Company recorded a charge of $40 million related to the repurchase of the notes.Notes.
SENIOR NOTES OFFERING
On August 20, 2012, the Company issued $250 million 6.25% Notes due 2042 for net proceeds of $247 million. The net proceeds from the offering of the Notes were placed in short-term investment vehicles
DOMTAR CORPORATION
NOTES TO CONSOLIDATED FINANCIAL STATEMENTS
DECEMBER 31, 20102012
(IN MILLIONS OF DOLLARS, UNLESS OTHERWISE NOTED)
NOTE 17.18. LONG-TERM DEBT (CONTINUED)
On June 9, 2009, the Company issued $400 million 10.75% Notes due 2017 (“Notes”) at an issue price of $385 million.pending being used for general corporate purposes. The net proceeds from the offering of the Notes were used to fund the portion of the purchase price of the 7.875%5.375% Notes due 20112013, 7.125% Notes due 2015, 9.5% Notes due 2016 and 10.75% Notes due 2017 tendered and accepted by the Company pursuant to a tender offer, including the payment of accrued interest and applicable early tender premiums, not funded with cash on hand. Thehand, as well as for general corporate purposes.
On March 7, 2012, the Company recorded a gainissued $300 million 4.4% Notes due 2022 for net proceeds of $15 million related to the fair value increment associated with the portion of the 7.875% Notes repurchased, and recorded an expense of $4 million for the premium paid, and $1 million for other costs. Issuance expenses for the Notes of $8 million were deferred and are being amortized over the duration of the Notes.$297 million.
The Notes are redeemable, in whole or in part, at the Company’s option at any time. In the event of a change in control, unless the Company has exercised the right to redeem all of the Notes, each holder will have the right to require the Company to repurchase all or any part of such holder’s Notes at a purchase price in cash equal to 101% of the principal amount of the Notes, plus any accrued and unpaid interest.
The Notes are general unsecured obligations and rank equally with existing and future unsecured and unsubordinated obligations.indebtedness. The Notes are fully and unconditionally guaranteed on an unsecured basis by direct and indirect, existing and future, U.S. 100% owned subsidiaries, which currently guarantee indebtedness under the Credit Agreement.
In December 2008,Agreement as well as the Company repurchased a portion of the 7.875% Notes, which had a book value of $63 million, at a cash cost totalling $51 million. A gain of $12 million was recorded in the Consolidated Statements of Earnings (Loss).Company’s other unsecured unsubordinated indebtedness.
BANK FACILITY
During 2010,On June 15, 2012, the Company repaid the outstanding amount on the secured term loan due in 2014 in the amount of $336 million.
The Company’samended and restated its existing Credit Agreement consists of a $750(the “Credit Agreement”), among the Company, certain subsidiary borrowers, certain subsidiary guarantors and the lenders and agents party thereto. The Credit Agreement amended the Company’s existing $600 million senior secured revolving credit facility which matures on March 7, 2012. No amounts were borrowed on this facility at December 31, 2010 (2009—$6 million recorded in Bank indebtedness). At December 31, 2010, the Company had outstanding letters of credit amountingthat was scheduled to $50 million under this credit facility (2009—$53 million). mature June 23, 2015.
The Credit Agreement provides for a revolving credit facility (including a letter of credit sub-facility and a swingline sub-facility) that matures on June 15, 2017. The maximum aggregate amount of availability under the revolving Credit Agreement is $600 million, which may be usedborrowed in US Dollars, Canadian Dollars (in an amount up to the Canadian Dollar equivalent of $150 million) and Euros (in an amount up to the Euro equivalent of $200 million). Borrowings may be made by the Company, by its U.S. subsidiary Domtar Paper Company, LLC, andby its Canadian subsidiary Domtar Inc. for general corporate purposes and a portion is available for letters of credit. Borrowingsby any additional borrower designated by the Company and Domtar Paperin accordance with the Credit Agreement. The Company LLCmay increase the maximum aggregate amount of availability under the revolving credit facilityCredit Agreement by up to $400 million, and the Borrowers may extend the final maturity of the Credit Agreement by one year, if, in each case, certain conditions are available in U.S. dollars, and borrowings by Domtar Inc.satisfied, including (i) the absence of any event of default or default under the revolving credit facility are availableCredit Agreement and (ii) the consent of the lenders participating in U.S. dollars and/each such increase or Canadian dollars and are limited to $150 million (or the Canadian dollar equivalent thereof).extension, as applicable.
Any amounts drawnBorrowings under the revolving credit facilityCredit Agreement will bear annual interest at either a Eurodollar rate plus a margin of between 1.25% and 2.25%, or an alternate base rate plus a margin of between 0.25% and 1.25%. Amounts drawn under the revolving credit facility by Domtar Inc. in U.S. dollars bear annual interest at either a Eurodollar rate plus a margin of between 1.25% and 2.25%, or a U.S. base rate plus a margin of between 0.25% and 1.25%. Amounts drawn under the revolving credit facility by Domtar Inc. in Canadian dollars bear annual interest at the Canadian prime rate plus a margin of between 0.25% and 1.25%. Domtar Inc. may also issue bankers’ acceptances denominated in Canadian dollars which are subject to an acceptance fee, payable on the date of acceptance, which is calculated at a rate per annum equal to between 1.25% and 2.25%. The interest rate margins and the acceptance fee, in each case, with respect to the revolving credit facility are subject to adjustments baseddependent on the Company’s consolidated leverage ratio.credit ratings at the time of such borrowing and will be calculated at the Borrowers’ option according to a base rate, prime rate, LIBO rate, EURIBO rate or the Canadian bankers’ acceptance rate plus an applicable margin, as the case may be. In addition, the Company must pay facility fees quarterly at rates dependent on the Company’s credit ratings.
The Credit Agreement contains customary covenants, including two financial covenants: (i) an interest coverage ratio, as defined in the Credit Agreement, that must be maintained at a level of not less than 3 to 1 and
DOMTAR CORPORATION
NOTES TO CONSOLIDATED FINANCIAL STATEMENTS
DECEMBER 31, 20102012
(IN MILLIONS OF DOLLARS, UNLESS OTHERWISE NOTED)
NOTE 17.18. LONG-TERM DEBT (CONTINUED)
The(ii) a leverage ratio, as defined in the Credit Agreement, containsthat must be maintained at a numberlevel of covenants that, among other things, limit the ability of the Company and its subsidiaries to make capital expenditures and place restrictions on other matters customarily restricted in senior secured credit facilities, including restrictions on indebtedness (including guarantee obligations), liens (including sale and leasebacks), fundamental changes, sales or disposition of property or assets, investments (including loans, advances, guarantees and acquisitions), transactions with affiliates, hedge agreements, changes in fiscal periods, environmental activity, optional payments and modifications of other material debt instruments, negative pledges and agreements restricting subsidiary distributions or changes in lines of business. As long as the revolving credit commitments are outstanding, the Company is required to comply with a consolidated EBITDA (as defined under the Credit Agreement) to consolidated cash interest coverage ratio ofnot greater than 2.5x and a consolidated debt3.75 to consolidated EBITDA (as defined under the Credit Agreement) ratio of less than 4.5x.1. At December 31, 2010,2012, the Company was in compliance with these covenants.
The Company’s directthe covenants, and indirect, existing and future, U.S. 100% owned subsidiaries serve as guarantors of the senior secured credit facilities for any obligations thereunder of the U.S. borrowers, subject to agreed exceptions. Domtar Inc.’s direct and indirect, existing and future, 100% owned subsidiaries, as well asno amounts were borrowed (December 31, 2011—nil). At December 31, 2012, the Company and its subsidiaries, serve as guarantorshad outstanding letters of Domtar Inc.’s obligations as a borrowercredit amounting to $12 million under the senior securedthis credit facilities, subject to agreed exceptions. Domtar Inc. does not guarantee Domtar Corporation’s obligationfacility (December 31, 2011—$29 million).
All borrowings under the Credit Agreement.
The obligationsAgreement are unsecured. However, certain domestic subsidiaries of the Company in respectwill unconditionally guarantee any obligations from time to time arising under the Credit Agreement, and certain subsidiaries of the senior secured credit facilitiesCompany that are secured by all ofnot organized in the equity interests of the Company’s direct and indirect U.S. subsidiaries, other than 65% of the equity interests of the Company’s direct and indirect “first-tier” foreign subsidiaries, subject to agreed exceptions, and a perfected first priority security interest in substantially all of the Company’s and its direct and indirect U.S. subsidiaries’ tangible and intangible assets. TheUnited States will unconditionally guarantee any obligations of Domtar Inc., and the obligationsCanadian subsidiary borrower, or of additional borrowers that are not organized in the United States, under the Credit Agreement, in each case, subject to the provisions of the non-U.S. guarantors, in respect of the senior secured credit facilities also are secured by all of the equity interests of the Company’s direct and indirect subsidiaries, subject to agreed exceptions, and a perfected first priority security interest, lien and hypothec in the inventory of Domtar Inc., its immediate parent, and its direct and indirect subsidiaries.Credit Agreement.
RECEIVABLES SECURITIZATION
The Company uses securitization of certain receivables to provide additional liquidity to fund its operations, particularly when it is cost effective to do so. The costs under the program may vary based on changes in interest rates. The Company’s securitization program consists of the sale of most of the receivables of its domestic receivablessubsidiaries to a bankruptcy remote consolidated subsidiary which, in turn, transfers a senior beneficial interest in them to a special purpose entity managed by a financial institution for multiple sellers of receivables. The program normally allows the daily sale of new receivables to replace those that have been collected. The Company retains a subordinated interest which is included in Receivables on the Consolidated Balance Sheets and will be collected only after the senior beneficial interest has been settled. The book value of the retained subordinated interest approximates fair value. Fair value is determined on a discounted cash flow basis. The Company retains responsibility for servicing the receivables sold but does not record a servicing asset or liability as the fees received by the Company for this service approximate the fair value of the services rendered.
The program contains provisions restricting its availability if certain termination events, occurwhich include, but are not limited to, matters related to receivable performance, or if a default occurscertain defaults occurring under the credit facility.
NOTES TO CONSOLIDATED FINANCIAL STATEMENTS
DECEMBER 31, 2010
(IN MILLIONS OF DOLLARS, UNLESS OTHERWISE NOTED)
NOTE 17. LONG-TERM DEBT (CONTINUED)
facility, and certain judgments being entered against the Company or the Company’s subsidiaries that remain outstanding for 60 consecutive days.
In November 2010, the agreement governing this receivables securitization program was amended and extended to mature in November 2013. The available proceeds that may be received under the program are limited to $150 million. The agreement was subsequently amended in November 2011 to add a letter of credit sub-facility.
At December 31, 20102012 the Company had no amounts wereborrowings and $38 million of letters of credit outstanding under the program (2009—$20 million). The accounting treatment with respect to the transfers of such receivables has changed in January 2010 with the amendment of the “Transfer(2011—nil and Servicing” Topic issued by the FASB, please refer to Note 2 “Recent Accounting Pronouncements” for additional information.$28 million, respectively). Sales of receivables under this program are accounted for as secured borrowings in 2010 and were accounted for as off balance sheet financing in 2009. Before 2010, gains and losses on securitization of receivables were calculated as the difference between the carrying amount of the receivables sold and the sum of the cash proceeds upon sale and the fair value of the retained subordinated interest in such receivables on the date of the transfer.borrowings.
In 2010,2012, a net charge of $2$1 million (2009—(2011—$1 million; 2010—$2 million; 2008—$5 million) resulted from the programsprogram described above and was included in Interest expense in the Consolidated Statements of Earnings (Loss). The net cash outflow in 2010, from the reduction of senior beneficial interest under the program was $20 million (2009—$90 million).and Comprehensive Income.
DOMTAR CORPORATION
NOTES TO CONSOLIDATED FINANCIAL STATEMENTS
DECEMBER 31, 2012
(IN MILLIONS OF DOLLARS, UNLESS OTHERWISE NOTED)
OTHER LIABILITIES AND DEFERRED CREDITS
The following table presents the components of other liabilities and deferred credits:
| December 31, 2010 | December 31, 2009 | December 31, 2012 | December 31, 2011 | |||||||||||||
| $ | $ | $ | $ | |||||||||||||
Liability—other post-retirement benefit plans (Note 6) | 110 | 118 | ||||||||||||||
Pension liability—defined benefit pension plans (Note 6) | 100 | 112 | ||||||||||||||
Provision for environment and other asset retirement obligations (Note 20) | 79 | 96 | ||||||||||||||
Liability—other post-retirement benefit plans (Note 7) | 119 | 111 | ||||||||||||||
Pension liability—defined benefit pension plans (Note 7) | 188 | 143 | ||||||||||||||
Pension liability—multiemployer plan withdrawal (Note 7) | 47 | 32 | ||||||||||||||
Provision for environmental and asset retirement obligations (Note 21) | 64 | 68 | ||||||||||||||
Worker’s compensation | 3 | 3 | 2 | 2 | ||||||||||||
Stock-based compensation—liability awards | 38 | 16 | 27 | 49 | ||||||||||||
Other | 20 | 21 | 10 | 12 | ||||||||||||
|
| |||||||||||||||
| 350 | 366 | 457 | 417 | |||||||||||||
|
| |||||||||||||||
ASSET RETIREMENT OBLIGATIONS
The asset retirement obligations are principally linked to landfill capping obligations, asbestos removal obligations and demolition of certain abandoned buildings. At December 31, 2010,2012, Domtar estimated the net present value of its asset retirement obligations to be $43$33 million (2009—(2011—$4632 million); the present value is based on probability weighted undiscounted cash outflows of $92$79 million (2009—(2011—$10980 million). The majority of the asset retirement obligations are estimated to be settled prior to December 31, 2033. However, some settlement scenarios call for obligations to be settled as late as December 31, 2050.2051. Domtar’s credit adjusted risk-free rates were used to calculate the net present value of the asset retirement obligations. The rates used vary between 5.50%5.5% and 12.00%12.0%, based on the prevailing rate at the moment of recognition of the liability and on its settlement period.
The following table reconciles Domtar’s asset retirement obligations:
| December 31, 2012 | December 31, 2011 | |||||||
| $ | $ | |||||||
Asset retirement obligations, beginning of year | 32 | 43 | ||||||
Revisions to estimated cash flows | — | (1 | ) | |||||
Sale of closed facility(1) | — | (10 | ) | |||||
Settlements | — | (1 | ) | |||||
Accretion expense | 1 | 2 | ||||||
Effect of foreign currency exchange rate change | — | (1 | ) | |||||
|
|
|
| |||||
Asset retirement obligations, end of year | 33 | 32 | ||||||
|
|
|
| |||||
| (1) | The sale of facility relates to the sale of Prince Albert in 2011. |
DOMTAR CORPORATION
NOTES TO CONSOLIDATED FINANCIAL STATEMENTS
DECEMBER 31, 20102012
(IN MILLIONS OF DOLLARS, UNLESS OTHERWISE NOTED)
NOTE 18. OTHER LIABILITIES AND DEFERRED CREDITS (CONTINUED)
The following table reconciles Domtar’s asset retirement obligations:
| December 31, 2010 | December 31, 2009 | |||||||
| $ | $ | |||||||
Asset retirement obligations, beginning of year | 46 | 34 | ||||||
Additions | — | 3 | ||||||
Revisions to estimated cash flows | — | 3 | ||||||
Sale of businesses | (7 | ) | — | |||||
Settlements | (1 | ) | — | |||||
Accretion expense | 4 | 3 | ||||||
Effect of foreign currency exchange rate change | 1 | 3 | ||||||
Asset retirement obligations, end of year | 43 | 46 | ||||||
SHAREHOLDERS’ EQUITY
During the year,2012, the Company declared one quarterly dividend of $0.35 per share and three quarterly dividends of $0.25$0.45 per share to holders of the Company’s common stock, as well as holders of exchangeable shares of Domtar (Canada) Paper Inc., a subsidiary of Domtar Corporation. The total dividends of approximately $11$13 million, $10$16 million, $16 million and $11$16 million were paid on April 16, 2012, July 15, 2010,16, 2012, October 15, 20102012 and January 17, 2011,15, 2013, respectively, to shareholders of record as of March 15, 2012, June 15, 2010,2012, September 17, 2012 and December 14, 2012, respectively.
During 2011, the Company declared one quarterly dividend of $0.25 per share and three quarterly dividends of $0.35 per share to holders of the Company’s common stock, as well as holders of exchangeable shares of Domtar (Canada) Paper Inc. The total dividends of approximately $10 million, $15 million, $13 million and $13 million were paid on April 15, 2011, July 15, 2011, October 17, 2011 and January 17, 2012, respectively, to shareholders of record as of March 15, 2011, June 15, 2011, September 15, 20102011 and December 15, 2010,2011, respectively.
On February 23, 2011,20, 2013, the Company’s Board of Directors approved a quarterly dividend of $0.25$0.45 per share to be paid to holders of the Company’s common stock, as well as holders of exchangeable shares of Domtar (Canada) Paper Inc. This dividend is to be paid on April 15, 20112013 to shareholders of record on March 15, 2011.2013.
STOCK REPURCHASE PROGRAM
On May 4, 2010, the Company’s Board of Directors authorized a stock repurchase program (“the Program”) of up to $150 million of Domtar Corporation’s common stock. On May 4, 2011, the Company’s Board of Directors approved an increase to the Program from $150 million to $600 million. On December 15, 2011, the Company’s Board of Directors approved another increase to the Program from $600 million to $1 billion. Under the Program, the Company is authorized to repurchase from time to time shares of its outstanding common stock on the open market or in privately negotiated transactions in the United States. The timing and amount of stock repurchases will depend on a variety of factors, including the market conditions as well as corporate and regulatory considerations. The Program may be suspended, modified or discontinued at any time and the Company has no obligation to repurchase any amount of its common stock under the Program. The Program has no set expiration date. The Company repurchases its common stock, from time to time, in part to reduce the dilutive effects of its stock options, awards, and employee stock purchase plan and to improve shareholders’ returns.
During 2010,2012 and 2011, the Company made open market purchases of its common stock using general corporate funds. Additionally, the Company entered into structured stock repurchase agreements with large financial institutions using general corporate funds in order to lower the average cost to acquire shares. The agreements required the Company to make up-front payments to the counterparty financial institutions which resulted in either the receipt
NOTES TO CONSOLIDATED FINANCIAL STATEMENTS
DECEMBER 31, 2010
(IN MILLIONS OF DOLLARS, UNLESS OTHERWISE NOTED)
NOTE 19. SHAREHOLDERS’ EQUITY (CONTINUED)
of stock at the beginning of the term of the agreements followed by a share adjustment at the maturity of the agreements, or the receipt of either stock or cash at the maturity of the agreements, depending upon the price of the stock.
DOMTAR CORPORATION
NOTES TO CONSOLIDATED FINANCIAL STATEMENTS
DECEMBER 31, 2012
(IN MILLIONS OF DOLLARS, UNLESS OTHERWISE NOTED)
NOTE 20. SHAREHOLDERS’ EQUITY (CONTINUED)
During 2010,2012, the Company repurchased 738,0472,000,925 shares (2011—5,921,732 shares) at an average price of $78.32 (2011—$83.52) for a total cost of $157 million (2011—$494 million).
Since the inception of the Program, the Company repurchased 8,660,703 shares at an average price of $59.96$80.31 for a total cost of $44$695 million. Also, the Company entered into structured stock repurchase agreements that did not result in the repurchase of shares but resulted in net gains of $2 million which are recorded as a component of Shareholder’s equity. All shares repurchased are recorded as Treasury stock on the Consolidated Balance Sheets under the par value method at $0.01 per share.
Subsequent to December 31, 2010, the Company repurchased 244,938 shares for $22 million and took delivery of 394,791 shares upfront with respect to structured share repurchase agreements of $40 million.
The authorized stated capital consists of the following:
PREFERRED SHARES
The Company is authorized to issue twenty million preferred shares, par value $0.01 per share. The Board of Directors of the Company will determine the voting powers (if any) of the shares, and the preferences and relative, participating, optional or other special rights, if any, and any qualifications, limitations or restrictions thereof, of the shares at the time of issuance. No preferred shares were outstanding at December 31, 20102012 or December 31, 2009.2011.
COMMON STOCK
On March 7, 2007, the certification of incorporation of theThe Company was amendedis authorized to authorize the issuance ofissue two billion shares of common stock, par value $0.01 per share. Holders of the Company’s common stock are entitled to one vote per share.
On May 29, 2009, the Company’s Board of Directors authorized a reverse stock split at a 1-for-12 ratio of its outstanding common stock. Shareholder approval for the reverse stock split was obtained at the Company’s Annual General Meeting held on May 29, 2009 and the reverse stock split became effective June 10, 2009 at 6:01 PM (ET). At the effective time, every 12 shares of the Company’s common stock that was issued and outstanding was automatically combined into one issued and outstanding share, without any change in par value of such shares.
As a result of the reverse stock split, the Company reclassified $5 million from Common stock to Additional paid-in capital.
SPECIAL VOTING STOCK
One share of special voting stock, par value $0.01 per share was issued on March 7, 2007. The share of special voting stock is held by Computershare Trust Company of Canada (the “Trustee”) for the benefit of the holders of exchangeable shares of Domtar (Canada) Paper Inc. in accordance with the voting and exchange trust agreement. The Trustee holder of the share of special voting stock is entitled to vote on each matter which
NOTES TO CONSOLIDATED FINANCIAL STATEMENTS
DECEMBER 31, 2010
(IN MILLIONS OF DOLLARS, UNLESS OTHERWISE NOTED)
NOTE 19. SHAREHOLDERS’ EQUITY (CONTINUED)
shareholders generally are entitled to vote, and the Trustee holder of the share of special voting stock will be entitled to cast on each such matter a number of votes equal to the number of outstanding exchangeable shares of Domtar (Canada) Paper Inc. for which the Trustee holder has received voting instructions. The Trustee holder will not be entitled to receive dividends or distributions in its capacity as holder or owner thereof.
The changes in the number of outstanding common stock and their aggregate stated value during the years ended December 31, 20102012 and December 31, 2009,2011, were as follows:
| December 31, 2010 | December 31, 2009 | December 31, 2012 | December 31, 2011 | |||||||||||||||||||||||||||||
Common stock | Number of shares | $ | Number of shares | $ | Number of shares | $ | Number of shares | $ | ||||||||||||||||||||||||
Balance at beginning of year | 42,062,408 | — | 41,219,727 | 5 | 36,131,200 | — | 41,635,174 | — | ||||||||||||||||||||||||
Shares issued | ||||||||||||||||||||||||||||||||
Stock options | 15,932 | — | 13,740 | — | 5,870 | — | 13,115 | — | ||||||||||||||||||||||||
RSU and PCRSU conversions | 52,064 | — | 78,000 | — | ||||||||||||||||||||||||||||
Conversion of exchangeable shares | 169,627 | — | 750,941 | — | 11,294 | — | 193,586 | — | ||||||||||||||||||||||||
Reverse stock split (12:1) | — | — | — | (5 | ) | |||||||||||||||||||||||||||
Treasury stock(1) | (664,857 | ) | — | — | — | (1,909,760 | ) | — | (5,710,675 | ) | — | |||||||||||||||||||||
|
|
|
| |||||||||||||||||||||||||||||
Balance at end of year | 41,635,174 | — | 42,062,408 | — | 34,238,604 | — | 36,131,200 | — | ||||||||||||||||||||||||
|
|
|
| |||||||||||||||||||||||||||||
DOMTAR CORPORATION
NOTES TO CONSOLIDATED FINANCIAL STATEMENTS
DECEMBER 31, 2012
(IN MILLIONS OF DOLLARS, UNLESS OTHERWISE NOTED)
NOTE 20. SHAREHOLDERS’ EQUITY (CONTINUED)
| (1) |
|
EXCHANGEABLE SHARES
The Company is authorized to issue unlimited exchangeable shares at no par value. On May 29, 2009, an equivalent reverse stock split was also authorized for the outstanding exchangeable shares of Domtar (Canada) Paper Inc. on the same terms and conditions as the Company’s common stock. The reverse stock split became effective June 10, 2009 at 6:01 PM (ET). As such, aA total of 812,694607,814 common stock remains reserved for future issuance for the exchangeable shares of Domtar (Canada) Paper Inc. outstanding at December 31, 2010 (2009—982,321)2012 (2011 – 619,108). The exchangeable shares of Domtar (Canada) Paper Inc. are intended to be substantially economic equivalent to shares of the Company’s common stock. The rights, privileges, restrictions and conditions attaching to the exchangeable shares include the following:
The exchangeable shares are exchangeable at any time, at the option of the holder on a one-for-one basis for shares of common stock of the Company;
In the event the Company declares a dividend on the common stock, the holders of exchangeable shares are entitled to receive from Domtar (Canada) Paper Inc. the same dividend, or an economically equivalent dividend, on their exchangeable shares;
The holders of the exchangeable shares of Domtar (Canada) Paper Inc. are not entitled to receive notice of or to attend any meeting of the shareholders of Domtar (Canada) Paper Inc. or to vote at any such meeting, except as required by law or as specifically provided in the exchangeable share conditions;
The exchangeable shares of Domtar (Canada) Paper Inc. may be redeemed by Domtar (Canada) Paper Inc. on a redemption date to be set by the boardBoard of directorsDirectors of Domtar (Canada) Paper Inc., which date cannot be prior to July 31, 2023 (or earlier upon the occurrence of certain specified events) in exchange for one share of Company common stock for each exchangeable share presented and surrendered by the holder thereof, together with all declared but unpaid dividends on each exchangeable share. The Board of Directors of Domtar (Canada) Inc. is permitted to accelerate the July 31, 2023 redemption date upon the occurrence of certain events, including, upon at least 60 days prior written notice to the holders, in the event less than 416,667 exchangeable shares (excluding any exchangeable shares held directly or indirectly by the Company) are outstanding at any time.
NOTES TO CONSOLIDATED FINANCIAL STATEMENTS
DECEMBER 31, 2010
(IN MILLIONS OF DOLLARS, UNLESS OTHERWISE NOTED)
NOTE 19. SHAREHOLDERS’ EQUITY (CONTINUED)
|
The holders of exchangeable shares of Domtar (Canada) Paper Inc. are entitled to instruct the Trustee to vote the special voting stock as described above.
COMMITMENTS AND CONTINGENCIES
ENVIRONMENT
The Company is subject to environmental laws and regulations enacted by federal, provincial, state and local authorities.
DOMTAR CORPORATION
NOTES TO CONSOLIDATED FINANCIAL STATEMENTS
DECEMBER 31, 2012
(IN MILLIONS OF DOLLARS, UNLESS OTHERWISE NOTED)
NOTE 21. COMMITMENTS AND CONTINGENCIES (CONTINUED)
In 2010,2012, the Company’s operating expenses for environmental matters, as described in Note 1, amounted to $62$64 million (2009—$71 million; 2008—$81 million)($62 million in 2011 and 2010, respectively).
The Company made capital expenditures for environmental matters of $3$4 million in 2010, excluding the $512012 (2011—$8 million; 2010—$3 million). This excludes $6 million spent under the Pulp and Paper Green Transformation Program, which was reimbursed by the Government of Canada (2009—(2011—$283 million; 2008—2010—$451 million), for the improvement of air emissions and energy efficiency, effluent treatment and remedial actions to address environmental compliance. At this time, management does not expect any additional required expenditure that would have a material adverse effect on the Company’s financial position, results of operations or cash flows.
During the first quarter of 2006, the pulp and paper mill in Prince Albert, Saskatchewan was closed due to poor market conditions. The Company’s management determined that the Prince Albert facility was no longer a strategic fit for the Company and will not be reopened. The Province of Saskatchewan may require active decommissioning and reclamation at the Prince Albert facility. In the event decommissioning and reclamation is required at the facility, the work is likely to include investigation and remedial action for areas of significant environmental impacts. The Company has recorded a reserve for the estimated environmental remediation of the site.
An action was commenced by Seaspan International Ltd. (“Seaspan”) in the Supreme Court of British Columbia, on March 31, 1999 against Domtar Inc. and others with respect to alleged contamination of Seaspan’s site bordering Burrard Inlet in North Vancouver, British Columbia, including contamination of sediments in Burrard Inlet, due to the presence of creosote and heavy metals. Beyond the filing of preliminary pleadings, no steps have been taken by the parties in this action. On February 16, 2010, the government of British Columbia issued a Remediation Order to Seaspan and Domtar Inc. (“responsible persons”) in order to define and implement an action plan to address soil, sediment and groundwater issues. This Order was appealed to the Environmental Appeal Board
NOTES TO CONSOLIDATED FINANCIAL STATEMENTS
DECEMBER 31, 2010
(IN MILLIONS OF DOLLARS, UNLESS OTHERWISE NOTED)
NOTE 20. COMMITMENTS AND CONTINGENCIES (CONTINUED)
(“Board”) on March 17, 2010 but there is no suspension in the execution of this Order unless the Board orders otherwise. The appeal hearing scheduledhas been adjourned and has been preliminarily re-scheduled for January 2011 was cancelled and no alternative date was scheduled asthe fall of yet.2013. The relevant government authorities are reviewing severalselected a remediation plansplan on July 15, 2011, and on January 8, 2013, the same authorities decided that each responsible persons’ implementation plan is satisfactory and that the responsible persons decide which plan is to be used. On February 6, 2013, the responsible persons appealed the January 8, 2013 decision and Seaspan applied for a decision is expected instay of execution. On February 18, 2013, the first quarterBoard granted an interim stay of 2011.the January 8, 2013 decision. The Company has recorded an environmental reserve to address its estimated exposure and the estimated exposure.reasonably possible loss in excess of the reserve is not considered to be material for this matter.
The following table reflects changes in the reserve for environmental remediation and asset retirement obligations:
| December 31, 2010 | December 31, 2009 | December 31, 2012 | December 31, 2011 | |||||||||||||
| $ | $ | $ | $ | |||||||||||||
Balance at beginning of year | 111 | 99 | 92 | 107 | ||||||||||||
Additions | 4 | 4 | 2 | 7 | ||||||||||||
Sale of businesses | (9 | ) | — | |||||||||||||
Sale of business and closed facility | (2 | ) | (11 | ) | ||||||||||||
Environmental spending | (7 | ) | (5 | ) | (11 | ) | (13 | ) | ||||||||
Accretion | 4 | 3 | 1 | 3 | ||||||||||||
Effect of foreign currency exchange rate change | 4 | 10 | 1 | (1 | ) | |||||||||||
|
| |||||||||||||||
Balance at end of year | 107 | 111 | 83 | 92 | ||||||||||||
|
| |||||||||||||||
DOMTAR CORPORATION
NOTES TO CONSOLIDATED FINANCIAL STATEMENTS
DECEMBER 31, 2012
(IN MILLIONS OF DOLLARS, UNLESS OTHERWISE NOTED)
NOTE 21. COMMITMENTS AND CONTINGENCIES (CONTINUED)
At December 31, 2010,2012, anticipated undiscounted payments in each of the next five years wereare as follows:
| 2011 | 2012 | 2013 | 2014 | 2015 | Thereafter | Total | ||||||||||||||||||||||
| $ | $ | $ | $ | $ | $ | $ | ||||||||||||||||||||||
Environmental provision and other asset retirement obligations | 28 | 42 | 4 | 5 | 2 | 75 | 156 | |||||||||||||||||||||
| 2013 | 2014 | 2015 | 2016 | 2017 | Thereafter | Total | ||||||||||||||||||||||
| $ | $ | $ | $ | $ | $ | $ | ||||||||||||||||||||||
Environmental provision and other asset retirement obligations | 19 | 26 | 5 | 2 | 1 | 76 | 129 | |||||||||||||||||||||
|
|
|
|
|
|
|
|
|
|
|
|
|
| |||||||||||||||
Climate change regulation
Since 1997, when an international conference on global warming concluded an agreement known as the Kyoto Protocol, which called for reductions of certain emissions that may contribute to increases in atmospheric greenhouse gas (“GHG”) concentrations, various international, national and local laws have been proposed or implemented focusing on reducing GHG emissions. These actual or proposed laws do or may apply in the countries where the Company currently has, or may have in the future, manufacturing facilities or investments.
In the United States, both the Senate and Congress have been consideringhas considered legislation to reduce emissions of GHGs. In addition, several states are already requiringGHGs, although it appears that the reduction offederal government will continue to consider methods to reduce GHG emissions by certain companies andfrom public utilities and certain other emitters. Several states already are regulating GHG emissions from public utilities and certain other significant emitters, primarily through the planned development of GHG emission inventories and/or stateregional GHG cap-and-trade programs. Furthermore, the U.S. Environmental Protection Agency (“EPA”) has begunadopted and implemented GHG permitting requirements for new sources and modifications of existing industrial facilities and has recently proposed GHG performance standards for electric utilities under the process of regulating GHG via theagency’s existing Clean Air Act.Act authority. Passage of climate controlGHG legislation or other regulatory initiatives by the Senate, Congress or various U.S.individual states, or the adoption of regulations by the EPA or analogous state agencies, that restrict emissions of GHGs in areas in which the Company conducts business maycould have a material effect onvariety of impacts upon the Company, including requiring it to implement GHG containment and reduction programs or to pay taxes or other fees with respect to any failure to achieve the mandated results. This, in turn, will increase the Company’s operations. Theoperating costs. However, the Company expectsdoes not expect to be disproportionately affected by these measures compared with other pulp and paper operationsproducers in the United States. There
The province of Quebec initiated, as part of its commitment to the Western Climate Initiative (“WCI”), a GHG cap-and-trade system on January 1, 2012. Reduction targets for Quebec have been promulgated and are effective January 1, 2013. The Company does not expect the cost of compliance will have a material impact on the Company’s financial position, results of operations or cash flows. With the exception of the British Columbia carbon tax, which applies to the purchase of fossil fuels within the province and which was implemented in 2008, there are presently no federal or provincial legislationslegislation on regulatory obligations to reduce GHGthat affect the emission of GHGs for the Company’s pulp and paper operations elsewhere in Canada.
Under the Copenhagen Accord, the Government of Canada has committed to reducing greenhouse gases by 17 percent from 2005 levels by 2020. A sector by sector approach is being used to set performance standards to reduce greenhouse gases. On September 5, 2012 final regulations were published for the coal-fired electrical generators which will go in force July 1, 2015. The industry sector, which includes pulp and paper, is the next sector to undergo this review. The Company does not expect the performance standards to be disproportionately affected by these future measures compared with other pulp and paper producers in Canada.
DOMTAR CORPORATION
NOTES TO CONSOLIDATED FINANCIAL STATEMENTS
DECEMBER 31, 20102012
(IN MILLIONS OF DOLLARS, UNLESS OTHERWISE NOTED)
NOTE 20.21. COMMITMENTS AND CONTINGENCIES (CONTINUED)
While it is likely that there will be increased regulation relating to GHG and climate change,emissions in the future, at this stagetime it is not possible to estimate either a timetable for the promulgation or implementation of any new regulations or the Company’s cost of compliance to said regulations. The impact could, however, be material.
The Company is also a party to various proceedings relating to the cleanup of hazardous waste sites under the Comprehensive Environmental Response Compensation and Liability Act, commonly known as “Superfund,” and similar state laws. The EPA and/or various state agencies have notified the Company that it may be a potentially responsible party with respect to other hazardous waste sites as to which no proceedings have been instituted against the Company. The Company continues to take remedial action under its Care and Control Program, at its former wood preserving sites, and at a number of operating sites due to possible soil, sediment or groundwater contamination. The investigation and remediation process is lengthy and subject to the uncertainties of changes in legal requirements, technological developments and, if and when applicable, the allocation of liability among potentially responsible parties.
At December 31, 2010,2012, the Company had a provision of $107$83 million for environmental matters and other asset retirement obligations (2009—(2011—$11192 million). Additional costs, not known or identifiable, could be incurred for remediation efforts. Based on policies and procedures in place to monitor environmental exposure, management believes that such additional remediation costs would not have a material adverse effect on the Company’s financial position, results of operations or cash flows.
Industrial Boiler Maximum Achievable ControlledControl Technology Standard (“MACT”)
TheOn December 2, 2011, the EPA has proposed severala new set of standards related to emissions from boilers and process heaters included in ourthe Company’s manufacturing processes. These standards are generally referred to as Boiler MACT. A final rule was releasedMACT and seek to require reductions in late February 2011, however, the emission of certain hazardous air pollutants or surrogates of hazardous air pollutants. The EPA has provided for a process referred to as “reconsideration” for certain portions ofannounced the final rule thus delaying enactmenton December 12, 2012 and making uncertain what actionsit was subsequently published in the agency will take with those portions of the rule subject to reconsideration.Federal Register on January 31, 2013. Compliance with Boiler MACT will be required three years after a final rule is enacted.
It is apparentby the end of 2015 or early 2016 for existing emission units or upon startup for any new emission units. The Company expects that owners and operators of boilers will bethe capital cost required to address multiple industrial boilers and process heaters in order to comply with the final rule. Until a final ruleBoiler MACT rules is enacted, itbetween $25 million and $35 million. The Company is not possible to provide an estimated cost ofcurrently assessing the associated increase in operating costs as well as alternate compliance but compliance may have a significant impact on our results of operations, financial position or cash flows.strategies.
CONTINGENCIES
In the normal course of operations, the Company becomes involved in various legal actions mostly related to contract disputes, patent infringements, environmental and product warranty claims, and labor issues. While the final outcome with respect to actions outstanding or pending at December 31, 2010,2012, cannot be predicted with certainty, it is management’s opinion that, except as noted below, their resolution will not have a material adverse effect on the Company’s financial position, results of operations or cash flows.
In September 2010, Kleen Products LLC (“Kleen”) filed a class action suit in the United States District Court for the Northern district of Illinois, Kleen Products LLC v. Packaging Corporation of America, et al, naming among others the Company, Norampac Inc. (“Norampac”) and Cascades Inc. (“Cascades”), as defendants. Kleen alleged that the defendants conspired to fix prices and reduce output of containerboard in the United States between August 2005 and October 2010 (“Class Action Period”). Four additional suits with essentially the same allegations have been filed in the same court since Kleen (collectively, “Containerboard Litigation”), the last of them not including Domtar as a defendant. In 1997, Domtar Inc. (a now wholly-owned subsidiary of Domtar Corporation), transferred all of its containerboard assets to Norampac, a corporation which was a joint venture with Cascades, and in which Domtar Inc. and Cascades were each 50-percent shareholders. Domtar Inc. sold its 50 percent share of Norampac to Cascades in December 2006. Since the Company and Domtar Inc. did not sell any containerboard in the United States during the Class Action Period, the Company intends to vigorously contest the allegations made against it on that basis and on other grounds, and the Company will seek a prompt dismissal from this litigation. On November 8, 2010, plaintiffs filed a consolidated amended complaint in the Containerboard Litigation without naming the Company or Domtar Inc. as defendants.
NOTES TO CONSOLIDATED FINANCIAL STATEMENTS
DECEMBER 31, 2010
(IN MILLIONS OF DOLLARS, UNLESS OTHERWISE NOTED)
NOTE 20. COMMITMENTS AND CONTINGENCIES (CONTINUED)
Accordingly, the Company considers the Containerboard Litigation to have been terminated with respect to itself and Domtar Inc.
The pulp and paper mill in Prince Albert was closed in the first quarter of 2006 and has not been operated since. In December 2009, the Company decided to dismantle the Prince Albert facility. In a grievance relating to the closure of the Prince Albert facility, the union claimed that it is entitled to the accumulated pension benefits during the actual layoff period because, according to the union, a majority of employees still had recall rights during the layoff. Arbitration in this matter was held in February 2010, and the arbitrator ruled in favor of the Company on August 24, 2010. The arbitrator’s decision is subject to the union’s right to apply for judicial review.
On July 31, 1998, Domtar Inc. (now a 100% owned subsidiary of Domtar Corporation) acquired all of the issued and outstanding shares of E.B. Eddy Limited and E.B. Eddy Paper, Inc. (“E.B. Eddy”), an integrated producer of specialty paper and wood products. The purchase agreement included a purchase price adjustment whereby, in the event of the acquisition by a third party of more than 50% of the shares of Domtar Inc. in specified circumstances, Domtar Inc. may be required to pay an increase in consideration of up to a maximum of $121
DOMTAR CORPORATION
NOTES TO CONSOLIDATED FINANCIAL STATEMENTS
DECEMBER 31, 2012
(IN MILLIONS OF DOLLARS, UNLESS OTHERWISE NOTED)
NOTE 21. COMMITMENTS AND CONTINGENCIES (CONTINUED)
$121 million (CDN$120(CDN $120 million), an amount gradually declining over a 25-year period. At March 7, 2007, the maximum amount of the purchase price adjustment was approximately $111 million (CDN$110(CDN $110 million).
On March 14, 2007, the Company received a letter from George Weston Limited (the previous owner of E.B. Eddy and a party to the purchase agreement) demanding payment of $111 million (CDN$110(CDN $110 million) as a result of the consummation of the Transaction.series of transactions whereby the Fine Paper Business of Weyerhaeuser Company was transferred to the Company and the Company acquired Domtar Inc. (the “Transaction”). On June 12, 2007, an action was commenced by George Weston Limited against Domtar Inc. in the Superior Court of Justice of the Province of Ontario, Canada, claiming that the consummation of the Transaction triggered the purchase price adjustment and sought a purchase price adjustment of $111 million (CDN$110(CDN $110 million) as well as additional compensatory damages. On March 31, 2011, George Weston Limited filed a motion for summary judgment. On September 3, 2012, the Court directed that this matter proceed to examinations for discovery and trial, rather than proceed by way of summary judgment. The trial is expected to commence on October 21, 2013. The Company does not believe that the consummation of the Transaction triggers an obligation to pay an increase in consideration under the purchase price adjustment and intends to defend itself vigorously against any claims with respect thereto. However, the Company may not be successful in the defense of such claims, and if the Company is ultimately required to pay an increase in consideration, such payment may have a material adverse effect on the Company’s financial position, results of operations or cash flows. No provision is recorded for this potential purchase price adjustment.matter.
LEASE AND OTHER COMMERCIAL COMMITMENTS
The Company has entered into operating leases for property, plant and equipment. The Company also has commitments to purchase property, plant and equipment, roundwood, wood chips, gas and certain chemicals. Purchase orders in the normal course of business are excluded from the table below. Any amounts for which the Company is liable under purchase orders are reflected in the Consolidated Balance Sheets as Trade and other payables. Minimum future payments under these operating leases and other commercial commitments, determined at December 31, 2010,2012, were as follows:
| 2011 | 2012 | 2013 | 2014 | 2015 | Thereafter | Total | ||||||||||||||||||||||
| $ | $ | $ | $ | $ | $ | $ | ||||||||||||||||||||||
Operating leases | 25 | 17 | 11 | 9 | 4 | 5 | 71 | |||||||||||||||||||||
Other commercial commitments | 83 | 24 | 4 | 3 | 3 | 4 | 121 | |||||||||||||||||||||
NOTES TO CONSOLIDATED FINANCIAL STATEMENTS
DECEMBER 31, 2010
(IN MILLIONS OF DOLLARS, UNLESS OTHERWISE NOTED)
NOTE 20. COMMITMENTS AND CONTINGENCIES (CONTINUED)
| 2013 | 2014 | 2015 | 2016 | 2017 | Thereafter | Total | ||||||||||||||||||||||
| $ | $ | $ | $ | $ | $ | $ | ||||||||||||||||||||||
Operating leases | 30 | 23 | 14 | 8 | 5 | 14 | 94 | |||||||||||||||||||||
Other commercial commitments | 112 | 7 | 5 | 3 | 3 | 1 | 131 | |||||||||||||||||||||
|
|
|
|
|
|
|
|
|
|
|
|
|
| |||||||||||||||
Total operating lease expense amounted to $32$34 million in 2012 ($32 million in 2011 and 2010, (2009—$36 million; 2008—$39 million)respectively).
INDEMNIFICATIONS
In the normal course of business, the Company offers indemnifications relating to the sale of its businesses and real estate. In general, these indemnifications may relate to claims from past business operations, the failure to abide by covenants and the breach of representations and warranties included in the sales agreements. Typically, such representations and warranties relate to taxation, environmental, product and employee matters. The terms of these indemnification agreements are generally for an unlimited period of time. At December 31, 2010,2012, the Company is unable to estimate the potential maximum liabilities for these types of indemnification guarantees as the amounts are contingent upon the outcome of future events, the nature and likelihood of which cannot be reasonably estimated at this time. Accordingly, no provision has been recorded. These indemnifications have not yielded a significant expense in the past.
DOMTAR CORPORATION
NOTES TO CONSOLIDATED FINANCIAL STATEMENTS
DECEMBER 31, 2012
(IN MILLIONS OF DOLLARS, UNLESS OTHERWISE NOTED)
DERIVATIVES AND HEDGING ACTIVITIES AND FAIR VALUE MEASUREMENT
INTEREST RATE RISK
The Company is exposed to interest rate risk arising from fluctuations in interest rates on its cash and cash equivalents, its bank indebtedness, its bank credit facility and its long-term debt. The Company may manage this interest rate exposure through the use of derivative instruments such as interest rate swap contracts.
CREDIT RISK
The Company is exposed to credit risk on the accounts receivable from its customers. In order to reduce this risk, the Company reviews new customers’ credit history before granting credit and conducts regular reviews of existing customers’ credit performance. As at December 31, 2010 and December 31, 2009,2012, one of Domtar’s Paper segment customers located in the Company did not have any customers thatUnited States represented more than 10%11% ($64 million) ((2011—9% ($58 million)) of the receivables, prior to the effect of receivables securitization.Company’s receivables.
The Company is also exposed to credit risk in the event of non-performance by counterparties to its financial instruments. The Company minimizes this exposure by entering into contracts with counterparties that are believed to be of high credit quality. Collateral or other security to support financial instruments subject to credit risk is usually not obtained. The credit standing of counterparties is regularly monitored. Additionally, the Company is exposed to credit risk in the event of non-performance by its insurers. The Company minimizes this exposure by doing business only with large reputable insurance companies.
COST RISK
Cash flow hedges:
The Company purchases natural gas and oil at the prevailing market price at the time of delivery. In order to manage the cash flow risk associated with purchases of natural gas, and oil, the Company may utilize derivative financial instruments or physical purchases to fix the price of forecasted natural gas and oil purchases. The
NOTES TO CONSOLIDATED FINANCIAL STATEMENTS
DECEMBER 31, 2010
(IN MILLIONS OF DOLLARS, UNLESS OTHERWISE NOTED)
NOTE 21. DERIVATIVES AND HEDGING ACTIVITIES AND FAIR VALUE MEASUREMENT (CONTINUED)
Company formally documents the hedge relationships, including identification of the hedging instruments and the hedged items, the risk management objectives and strategies for undertaking the hedge transactions, and the methodologies used to assess effectiveness and measure ineffectiveness. Current contracts are used to hedge forecasted purchases over the next threefive years. The effective portion of changes in the fair value of derivative contracts designated as cash flow hedges is recorded as a component of Accumulated other comprehensive loss within Shareholders’ equity, and is recognized in Cost of sales in the period in which the hedged transaction occurs.
The following table presents the volumes under derivative financial instruments for natural gas contracts outstanding as of December 31, 20102012 to hedge forecasted purchases:
Commodity | Notional contractual quantity under derivative contracts | Notional contractual value under derivative contracts (in millions of dollars) | Percentage of forecasted purchases under derivative contracts for | Notional contractual quantity under derivative contracts | Notional contractual value under derivative contracts (in millions of dollars) | Percentage of forecasted purchases under derivative contracts for | ||||||||||||||||||||||||||||||||||||||||||||||
| 2011 | 2012 | 2013 | 2013 | 2014 | 2015 | 2016 | ||||||||||||||||||||||||||||||||||||||||||||||
Natural gas | 6,690,000 | MMBTU | (1) | $ | 40 | 29 | % | 11 | % | 3 | % | 13,320,000 | MMBTU | (1) | $ | 56 | 31 | % | 34 | % | 15 | % | 12 | % | ||||||||||||||||||||||||||||
| (1) | MMBTU: Millions of British thermal units |
DOMTAR CORPORATION
NOTES TO CONSOLIDATED FINANCIAL STATEMENTS
DECEMBER 31, 2012
(IN MILLIONS OF DOLLARS, UNLESS OTHERWISE NOTED)
NOTE 22. DERIVATIVES AND HEDGING ACTIVITIES AND FAIR VALUE MEASUREMENT (CONTINUED)
The natural gas derivative contracts were fully effective for accounting purposes as of December 31, 2010.2012. The critical terms of the hedging instruments and the hedged items match. As a result, there were no amounts reflected in the Consolidated Statements of Earnings (Loss)and Comprehensive Income for the year ended December 31, 20102012 resulting from hedge ineffectiveness (2009(2011 and 2008—2010—nil).
FOREIGN CURRENCY RISK
Cash flow hedges:
The Company has manufacturing operations in the United States, Canada, Sweden and Canada.China. As a result, it is exposed to movements in the foreign currency exchange raterates in Canada. Also,Canada, Europe and Asia. Moreover, certain assets and liabilities are denominated in Canadian dollarscurrencies other than the U.S. dollar and are exposed to foreign currency movements. As a result, the Company’s earnings are affected by increases or decreases in the value of the Canadian dollar and of other European and Asian currencies relative to the U.S. dollar. The Company’s Swedish subsidiary is exposed to movements in foreign currency exchange rates on transactions denominated in a different currency than its Euro functional currency. The Company’s risk management policy allows it to hedge a significant portion of its exposure to fluctuations in foreign currency exchange rates for periods up to three years. The Company may use derivative instruments (currency options and foreign exchange forward contracts) to mitigate its exposure to fluctuations in foreign currency exchange rates. Foreign exchange forward contracts are contracts wherebyrates or to designate them as hedging instruments in order to hedge the Company hassubsidiary’s cash flow risk for purposes of the obligation to buy Canadian dollars at a specific rate. Currency options purchased are contracts whereby the Company has the right, but not the obligation, to buy Canadian dollars at the strike rate if the Canadian dollar trades above that rate. Currency options sold are contracts whereby the Company has the obligation to buy Canadian dollars at the strike rate if the Canadian dollar trades below that rate.consolidated financial statements.
The Company formally documents the relationship between hedging instruments and hedged items, as well as its risk management objectives and strategies for undertaking the hedge transactions. Foreign exchange forward contracts and currency options contracts used to hedge forecasted purchases in Canadian dollars by the Canadian subsidiary and forecasted sales in British Pound Sterling and forecasted purchases in U.S. dollars by the Swedish subsidiary are designated as cash flow hedges. Current contracts are used to hedge forecasted sales or purchases over the next 12
NOTES TO CONSOLIDATED FINANCIAL STATEMENTS
DECEMBER 31, 2010
(IN MILLIONS OF DOLLARS, UNLESS OTHERWISE NOTED)
NOTE 21. DERIVATIVES AND HEDGING ACTIVITIES AND FAIR VALUE MEASUREMENT (CONTINUED)
months. The effective portion of changes in the fair value of derivative contracts designated as cash flow hedges is recorded as a component of Accumulated otherOther comprehensive loss within Shareholders’ equity,income (loss) and is recognized in Cost of sales or in Sales in the period in which the hedged transaction occurs.
Net investment hedge:
The Company uses foreign exchange currency option contracts maturing in February 2013 to hedge the net assets of Attends Europe to offset the foreign currency translation and economic exposures related to its investment in the subsidiary. The Company is exposed to movements in foreign currency exchange rates of the Euro versus the U.S. dollar as Attends Europe has a Euro functional currency whereas the Company has a U.S. dollar functional and reporting currency. The effective portion of changes in the fair value of derivative contracts designated as net investment hedges is recorded in Other comprehensive income (loss) as part of the Foreign currency translation adjustments.
DOMTAR CORPORATION
NOTES TO CONSOLIDATED FINANCIAL STATEMENTS
DECEMBER 31, 2012
(IN MILLIONS OF DOLLARS, UNLESS OTHERWISE NOTED)
NOTE 22. DERIVATIVES AND HEDGING ACTIVITIES AND FAIR VALUE MEASUREMENT (CONTINUED)
The following table presents the currency values under contracts pursuant to currency options outstanding as of December 31, 20102012 to hedge forecasted purchases:purchases, forecasted sales and the net investment:
Contract | Notional contractual value | Percentage of CDN denominated forecasted expenses, net of revenues under contracts for | Notional contractual value | Percentage of forecasted net exposures under contracts for | ||||||||||||||||||||
| 2011 | 2013 | |||||||||||||||||||||||
Currency options purchased | CDN | $ | 400 | 50 | % | CDN | $ | 425 | 50 | % | ||||||||||||||
| EUR | € | 176 | 92 | % | ||||||||||||||||||||
| USD | $ | 34 | 100 | % | ||||||||||||||||||||
| GBP | £ | 19 | 93 | % | ||||||||||||||||||||
Currency options sold | CDN | $ | 400 | 50 | % | CDN | $ | 425 | 50 | % | ||||||||||||||
| EUR | € | 76 | 40 | % | ||||||||||||||||||||
| USD | $ | 34 | 100 | % | ||||||||||||||||||||
| GBP | £ | 19 | 93 | % | ||||||||||||||||||||
The currency options are fully effective as at December 31, 2010.2012. The critical terms of the hedging instruments and the hedged items match. As a result, there were no amounts reflected in the Consolidated Statements of Earnings (Loss)and Comprehensive Income for the year ended December 31, 20102012 resulting from hedge ineffectiveness (2009(2011 and 2008—2010—nil).
The Effect of Derivative Instruments on the Consolidated Statements of Earnings (Loss)and Comprehensive Income and Consolidated StatementsStatement of Shareholders’ Equity, Net of Tax
Derivatives Designated as Cash Flow | Gain (Loss) Recognized in Accumulated Other Comprehensive Loss on Derivatives (Effective Portion) | Gain (Loss) Reclassified from Accumulated Other Comprehensive Loss into Income (Effective Portion) | ||||||||||||||||||||||
| For the year ended | For the year ended | |||||||||||||||||||||||
| December 31, 2010 | December 31, 2009 | December 31, 2008 | December 31, 2010 | December 31, 2009 | December 31, 2008 | |||||||||||||||||||
| $ | $ | $ | $ | $ | $ | |||||||||||||||||||
Natural gas swap contracts(a) | (8 | ) | (4 | ) | (5 | ) | (9 | ) | (2 | ) | — | |||||||||||||
Oil swap contracts(a) | — | 2 | — | — | 1 | — | ||||||||||||||||||
Currency options(a) | 4 | 53 | (72 | ) | 11 | (17 | ) | (25 | ) | |||||||||||||||
Total | (4 | ) | 51 | (77 | ) | 2 | (18 | ) | (25 | ) | ||||||||||||||
Derivatives Designated as Cash Flow | Gain (Loss) Recognized in Other comprehensive income (loss) on Derivatives (Effective Portion) | Gain (Loss) Reclassified from Other comprehensive income (loss) into Income (Effective Portion) | ||||||||||||||||||||||
| For the year ended | For the year ended | |||||||||||||||||||||||
| December 31, 2012 | December 31, 2011 | December 31, 2010 | December 31, 2012 | December 31, 2011 | December 31, 2010 | |||||||||||||||||||
| $ | $ | $ | $ | $ | $ | |||||||||||||||||||
Natural gas swap contracts (a) | (2 | ) | (7 | ) | (8 | ) | (6 | ) | (6 | ) | (9 | ) | ||||||||||||
Currency options (b) | 4 | (6 | ) | 4 | (2 | ) | 7 | 11 | ||||||||||||||||
Net investment hedge (c) | (2 | ) | — | — | — | — | — | |||||||||||||||||
|
|
|
|
|
|
|
|
|
|
|
| |||||||||||||
Total | — | (13 | ) | (4 | ) | (8 | ) | 1 | 2 | |||||||||||||||
|
|
|
|
|
|
|
|
|
|
|
| |||||||||||||
| (a) | The Gain (Loss) reclassified from |
The gain (loss) recorded in Accumulated other comprehensive loss relating to natural gas contracts will be recognized in Cost of sales upon maturity of the derivatives over the next three years at the then prevailing values, which may be different from those at December 31, 2010.
| (b) | The Gain (Loss) reclassified from Other comprehensive income (loss) into Income (Effective Portion) is recorded in Cost of Sales or Sales. |
The gain (loss) recorded in Accumulated other comprehensive loss relating to currency options will be recognized in Cost of sales upon maturity of the derivatives over the next 12 months at the then prevailing values, which may be different from those at December 31, 2010.
| (c) | Gains and losses from the settlements of the Company’s net investment hedge remain in Other comprehensive income (loss) until partial or complete liquidation of the net investment. |
DOMTAR CORPORATION
NOTES TO CONSOLIDATED FINANCIAL STATEMENTS
DECEMBER 31, 20102012
(IN MILLIONS OF DOLLARS, UNLESS OTHERWISE NOTED)
NOTE 21.22. DERIVATIVES AND HEDGING ACTIVITIES AND FAIR VALUE MEASUREMENT (CONTINUED)
FAIR VALUE MEASUREMENT
The accounting standards dealing withfor fair value measurementmeasurements and disclosures, establishes a fair value hierarchy, which prioritizes the inputs to valuation techniques used to measure fair value into three levels. A financial instrument’s categorization within the fair value hierarchy is based upon the lowest level of input that is available and significant to the fair value measurement. The accounting standards dealing with fair value measurement and disclosures establishes and prioritizes three levels of inputs that may be used to measure fair value:
Level 1 | Quoted prices in active markets for identical assets or liabilities. | |||
Level 2 | Observable inputs other than quoted prices in active markets for identical assets and liabilities, quoted prices for identical or similar assets or liabilities in inactive markets, or other inputs that are observable or can be corroborated by observable market data for substantially the full term of the assets or liabilities. | |||
Level 3 | Inputs that are generally unobservable and typically reflect management’s estimates of assumptions that market participants would use in pricing the asset or liability. | |||
The following tables present information about the Company’s financial assets and financial liabilities measured at fair value on a recurring basis (except Long-term debt, see (b)(c) below) for the years ended December 31, 20102012 and December 31, 2009,2011, in accordance with the accounting standards dealing withfor fair value measurementmeasurements and disclosures and indicates the fair value hierarchy of the valuation techniques utilized by the Company to determine such fair value.
Fair Value of financial instruments at: | December 31, 2010 | Quoted prices in active markets for identical assets (Level 1) | Significant observable inputs (Level 2) | Significant unobservable inputs (Level 3) | Balance sheet classification | December 31, 2012 | Quoted prices in active markets for identical assets (Level 1) | Significant observable inputs (Level 2) | Significant unobservable inputs (Level 3) | Balance sheet classification | ||||||||||||||||||||||||||||||
| $ | $ | $ | $ | $ | $ | $ | $ | |||||||||||||||||||||||||||||||||
Derivatives designated as cash flow hedging instruments under the Derivatives and Hedging Topic of FASB ASC: | ||||||||||||||||||||||||||||||||||||||||
Derivatives designated as cash flow and net investment hedging instruments under the Derivatives and Hedging Topic of FASB ASC: | ||||||||||||||||||||||||||||||||||||||||
Asset derivatives | ||||||||||||||||||||||||||||||||||||||||
Currency options | 14 | — | 14 | — | (a) | Prepaid expenses | 6 | — | 6 | — | (a) | Prepaid expenses | ||||||||||||||||||||||||||||
Natural gas swap contracts | 1 | — | 1 | — | (a) | Intangible assets and Deferred Charges | ||||||||||||||||||||||||||||||||||
|
|
|
| |||||||||||||||||||||||||||||||||||||
Total Assets | 14 | — | 14 | — | 7 | — | 7 | — | ||||||||||||||||||||||||||||||||
|
|
|
| |||||||||||||||||||||||||||||||||||||
Liabilities derivatives | ||||||||||||||||||||||||||||||||||||||||
Currency options | 3 | — | 3 | — | (a) | Trade and other payables | 5 | — | 5 | — | (a) | Trade and other payables | ||||||||||||||||||||||||||||
Natural gas swap contracts | 7 | — | 7 | — | (a) | Trade and other payables | 4 | — | 4 | — | (a) | Trade and other payables | ||||||||||||||||||||||||||||
Natural gas swap contracts | 2 | — | 2 | — | (a) | Other liabilities and deferred credits | 1 | — | 1 | — | (a) | Other liabilities and deferred credits | ||||||||||||||||||||||||||||
|
|
|
| |||||||||||||||||||||||||||||||||||||
Total Liabilities | 12 | — | 12 | — | 10 | — | 10 | — | ||||||||||||||||||||||||||||||||
|
|
|
| |||||||||||||||||||||||||||||||||||||
Other Instruments: | ||||||||||||||||||||||||||||||||||||||||
Asset backed commercial paper investments | 6 | — | — | 6 | (b) | Other assets | ||||||||||||||||||||||||||||||||||
Other Instruments | ||||||||||||||||||||||||||||||||||||||||
Asset backed notes | 6 | — | 5 | 1 | (b) | Other assets | ||||||||||||||||||||||||||||||||||
Long-term debt | 979 | 979 | — | — | (c) | Long-term debt | 1,360 | 1,360 | — | — | (c) | Long-term debt | ||||||||||||||||||||||||||||
|
|
|
| |||||||||||||||||||||||||||||||||||||
DOMTAR CORPORATION
NOTES TO CONSOLIDATED FINANCIAL STATEMENTS
DECEMBER 31, 20102012
(IN MILLIONS OF DOLLARS, UNLESS OTHERWISE NOTED)
NOTE 21.22. DERIVATIVES AND HEDGING ACTIVITIES AND FAIR VALUE MEASUREMENT (CONTINUED)
Fair Value of financial instruments at: | December 31, 2009 | Quoted prices in active markets for identical assets (Level 1) | Significant observable inputs (Level 2) | Significant unobservable inputs (Level 3) | Balance sheet classification | |||||||||||||||||
| $ | $ | $ | $ | |||||||||||||||||||
Derivatives designated as cash flow hedging instruments under the Derivatives and Hedging Topic of FASB ASC: | ||||||||||||||||||||||
Asset derivatives | ||||||||||||||||||||||
Currency options | 25 | — | 25 | — | (a) | Prepaid expenses | ||||||||||||||||
Total Assets | 25 | — | 25 | — | ||||||||||||||||||
Liabilities derivatives | ||||||||||||||||||||||
Currency options | 3 | — | 3 | — | (a) | Trade and other payables | ||||||||||||||||
Natural gas swap contracts | 9 | — | 9 | — | (a) | Trade and other payables | ||||||||||||||||
Natural gas swap contracts | 2 | — | 2 | — | (a) | Other liabilities and deferred credits | ||||||||||||||||
Total Liabilities | 14 | — | 14 | — | ||||||||||||||||||
Other Instruments: | ||||||||||||||||||||||
Long-term debt | 1,805 | 1,805 | — | — | (c) | Long-term debt | ||||||||||||||||
The cumulative loss recorded in Other comprehensive income (loss) relating to natural gas contracts of $4 million at December 31, 2012, will be recognized in Cost of sales upon maturity of the derivatives over the next 12 months at the then prevailing values, which may be different from those at December 31, 2012.
The cumulative gain recorded in Other comprehensive income (loss) relating to currency options hedging forecasted purchases of $1 million at December 31, 2012, will be recognized in Cost of sales or Sales upon maturity of the derivatives over the next 12 months at the then prevailing values, which may be different from those at December 31, 2012.
Fair Value of financial instruments at: | December 31, 2011 | Quoted prices in active markets for identical assets (Level 1) | Significant observable inputs (Level 2) | Significant unobservable inputs (Level 3) | Balance sheet classification | |||||||||||||||||
| $ | $ | $ | $ | |||||||||||||||||||
Derivatives designated as cash flow and net investment hedging instruments under the Derivatives and Hedging Topic of FASB ASC: | ||||||||||||||||||||||
Asset derivatives | ||||||||||||||||||||||
Currency options | 7 | — | 7 | — | (a) | Prepaid expenses | ||||||||||||||||
|
|
|
|
|
|
|
| |||||||||||||||
Total Assets | 7 | — | 7 | — | ||||||||||||||||||
|
|
|
|
|
|
|
| |||||||||||||||
Liabilities derivatives | ||||||||||||||||||||||
Currency options | 11 | — | 11 | — | (a | ) | Trade and other payables | |||||||||||||||
Natural gas swap contracts | 8 | — | 8 | — | (a | ) | Trade and other payables | |||||||||||||||
Natural gas swap contracts | 3 | — | 3 | — | (a | ) | Other liabilities and deferred credits | |||||||||||||||
|
|
|
|
|
|
|
| |||||||||||||||
Total Liabilities | 22 | — | 22 | — | ||||||||||||||||||
|
|
|
|
|
|
|
| |||||||||||||||
Other Instruments: | ||||||||||||||||||||||
Asset backed notes | 5 | — | — | 5 | (d | ) | Other assets | |||||||||||||||
Long-term debt | 992 | 992 | — | — | (c | ) | Long-term debt | |||||||||||||||
|
|
|
|
|
|
|
| |||||||||||||||
| (a) | Fair value of the Company’s derivatives is classified under Level 2 (inputs that are observable; directly or indirectly) as it is measured as follows: |
For currency options: Fair value is measured using techniques derived from the Black-Scholes pricing model. Interest rates, forward market rates and volatility are used as inputs for such valuation techniques.
For natural gas contracts: Fair value is measured using the discounted difference between contractual rates and quoted market future rates.
| (b) | ABN is reported at fair value utilizing Level 2 or Level 3 inputs. Fair value of |
DOMTAR CORPORATION
NOTES TO CONSOLIDATED FINANCIAL STATEMENTS
DECEMBER 31, 2012
(IN MILLIONS OF DOLLARS, UNLESS OTHERWISE NOTED)
NOTE 22. DERIVATIVES AND HEDGING ACTIVITIES AND FAIR VALUE MEASUREMENT (CONTINUED)
| (c) | Fair value of the Company’s long-term debt is measured by comparison to market prices of its debt. In accordance with US GAAP, the Company’s long-term debt is not carried at fair value on the Consolidated Balance Sheets at December 31, |
| (d) | Fair value of ABN is classified under Level 3 and is mainly based on a financial model incorporating uncertainties regarding return, credit spreads, the nature and credit risk of underlying assets, the amounts and timing of cash inflows and the limited market for the notes at December 31, 2011. |
Due to their short-term maturity, the carrying amounts of cash and cash equivalents, receivables, bank indebtedness, trade and other payables and income and other taxes approximate their fair values.
NOTES TO CONSOLIDATED FINANCIAL STATEMENTS
DECEMBER 31, 2010
(IN MILLIONS OF DOLLARS, UNLESS OTHERWISE NOTED)
| Asset backed notes | ||||
Balance at January 1, 2011 | 6 | |||
Settlements | (1 | ) | ||
Balance at December 31, 2011 | 5 | |||
Balance at January 1, 2012 | 5 | |||
Net unrealized gains included in earnings (a) | 1 | |||
Transfer out of Level 3 (b) | (5 | ) | ||
Balance at December 31, 2012 | 1 | |||
| (a) | Earnings effect is primarily included in Other operating loss (income), net in the Consolidated Statement of Earnings and Comprehensive Income. |
| (b) | Transfers out of Level 3 are considered to occur at the end of the period. ABN were reclassified to Level 2 from Level 3 as a result of increased trading activity and the presence of observable market quotes for these assets. |
SEGMENT DISCLOSURES
Following the sale of the Wood business on June 30, 2010, the Company’s reporting segments correspond to the following business activities: Papers and Paper Merchants. Prior to June 30, 2010,On September 1, 2011, the Company operated inpurchased Attends Healthcare, Inc. As a result, an additional reportable segment, Personal Care, was added. On March 1, 2012 and May 10, 2012, the three reportable segments described below. Company grew its Personal Care segment with the purchase of Attends Healthcare Limited and EAM Corporation, respectively. (See Note 3 “Acquisition of Businesses” for further information).
DOMTAR CORPORATION
NOTES TO CONSOLIDATED FINANCIAL STATEMENTS
DECEMBER 31, 2012
(IN MILLIONS OF DOLLARS, UNLESS OTHERWISE NOTED)
NOTE 23. SEGMENT DISCLOSURES (CONTINUED)
Each reportable segment offers different products and services and requires different manufacturing processes, technology andand/or marketing strategies. The following summary briefly describes the operations included in each of the Company’s reportable segments:
PapersPulp and Paper Segment—represents the aggregation ofcomprises the manufacturing, sale and distribution business, commercial printingof communication, specialty and publishing, and converting and specialtypackaging papers, as well as market softwood, fluff and hardwood market pulp.
Paper MerchantsDistribution Segment—involvescomprises the purchasing, warehousing, sale and distribution of variousthe Company’s paper products made by the Company and bythose of other manufacturers. These products include business and printing papers, and certain industrial products.products and printing supplies.
WoodPersonal Care Segment—consists of the manufacturing, sale and distribution of adult incontinence products and high quality absorbent cores.
Wood—comprises the manufacturing and marketing of lumber and wood-based value-added products and the management of forest resources.
The Company’sCompany sold its Wood segment was sold on June 30, 2010 as described in Note 24 “Salethe second quarter of Wood business and Woodland Mill”.2010.
The accounting policies of the reportable segments are the same as described in Note 1. The Company evaluates performance based on operating income, which represents sales, reflecting transfer prices between segments at fair value, less allocable expenses before interest expense and income taxes. Segment assets are those directly used in segment operations.
The Company attributes sales to customers in different geographical areas on the basis of the location of the customer.
Long-lived assets consist of property, plant and equipment, intangible assets and goodwill used in the generation of sales in the different geographical areas.
DOMTAR CORPORATION
NOTES TO CONSOLIDATED FINANCIAL STATEMENTS
DECEMBER 31, 20102012
(IN MILLIONS OF DOLLARS, UNLESS OTHERWISE NOTED)
NOTE 22.23. SEGMENT DISCLOSURES (CONTINUED)
An analysis and reconciliation of the Company’s business segment information to the respective information in the financial statements is as follows:
SEGMENT DATA | Year ended December 31, 2010 | Year ended December 31, 2009 | Year ended December 31, 2008 | |||||||||
| $ | $ | $ | ||||||||||
Sales | ||||||||||||
Papers | 5,070 | 4,632 | 5,440 | |||||||||
Paper Merchants | 870 | 873 | 990 | |||||||||
Wood | 150 | 211 | 268 | |||||||||
Total for reportable segments | 6,090 | 5,716 | 6,698 | |||||||||
Intersegment sales—Papers | (229 | ) | (231 | ) | (276 | ) | ||||||
Intersegment sales—Wood | (11 | ) | (20 | ) | (28 | ) | ||||||
Consolidated sales | 5,850 | 5,465 | 6,394 | |||||||||
Depreciation and amortization | ||||||||||||
Papers | 381 | 382 | 435 | |||||||||
Paper Merchants | 4 | 3 | 3 | |||||||||
Wood | 10 | 20 | 25 | |||||||||
Consolidated depreciation and amortization | 395 | 405 | 463 | |||||||||
Impairments and write-downs | ||||||||||||
Papers | 50 | 62 | 694 | |||||||||
Wood | — | — | 14 | |||||||||
Consolidated impairments and write-downs | 50 | 62 | 708 | |||||||||
Operating income (loss) | ||||||||||||
Papers | 667 | 650 | (369 | ) | ||||||||
Paper Merchants | (3 | ) | 7 | 8 | ||||||||
Wood | (54 | ) | (42 | ) | (73 | ) | ||||||
Corporate | (7 | ) | — | (3 | ) | |||||||
Consolidated operating income (loss) | 603 | 615 | (437 | ) | ||||||||
Interest expense | 155 | 125 | 133 | |||||||||
Earnings (loss) before income taxes | 448 | 490 | (570 | ) | ||||||||
Income tax expense (benefit) | (157 | ) | 180 | 3 | ||||||||
Net earnings (loss) | 605 | 310 | (573 | ) | ||||||||
SEGMENT DATA | Year ended December 31, 2012 | Year ended December 31, 2011 | Year ended December 31, 2010 | |||||||||
| $ | $ | $ | ||||||||||
Sales | ||||||||||||
Pulp and Paper(1) | 4,575 | 4,953 | 5,070 | |||||||||
Distribution | 685 | 781 | 870 | |||||||||
Personal Care | 399 | 71 | — | |||||||||
Wood(2) | — | — | 150 | |||||||||
|
|
|
|
|
| |||||||
Total for reportable segments | 5,659 | 5,805 | 6,090 | |||||||||
Intersegment sales—Pulp and Paper | (177 | ) | (193 | ) | (229 | ) | ||||||
Intersegment sales—Wood | — | — | (11 | ) | ||||||||
|
|
|
|
|
| |||||||
Consolidated sales | 5,482 | 5,612 | 5,850 | |||||||||
|
|
|
|
|
| |||||||
Depreciation and amortization and impairment and write-down of property, plant and equipment and intangible assets | ||||||||||||
Pulp and Paper | 361 | 368 | 381 | |||||||||
Distribution | 4 | 4 | 4 | |||||||||
Personal Care | 20 | 4 | — | |||||||||
Wood(2) | — | — | 10 | |||||||||
|
|
|
|
|
| |||||||
Total for reportable segments | 385 | 376 | 395 | |||||||||
Impairment and write-down of property, plant and equipment—Pulp and Paper | 9 | 85 | 50 | |||||||||
Impairment and write-down of intangible assets—Distribution | 5 | — | — | |||||||||
|
|
|
|
|
| |||||||
Consolidated depreciation and amortization and impairment and write-down of property, plant and equipment and intangible assets | 399 | 461 | 445 | |||||||||
|
|
|
|
|
| |||||||
Operating income (loss) | ||||||||||||
Pulp and Paper | 346 | 581 | 667 | |||||||||
Distribution | (16 | ) | — | (3 | ) | |||||||
Personal Care | 45 | 7 | — | |||||||||
Wood(2) | — | — | (54 | ) | ||||||||
Corporate | (8 | ) | 4 | (7 | ) | |||||||
|
|
|
|
|
| |||||||
Consolidated operating income | 367 | 592 | 603 | |||||||||
Interest expense, net | 131 | 87 | 155 | |||||||||
|
|
|
|
|
| |||||||
Earnings before income taxes and equity earnings | 236 | 505 | 448 | |||||||||
Income tax expense (benefit) | 58 | 133 | (157 | ) | ||||||||
Equity loss, net of taxes | 6 | 7 | — | |||||||||
|
|
|
|
|
| |||||||
Net earnings | 172 | 365 | 605 | |||||||||
|
|
|
|
|
| |||||||
DOMTAR CORPORATION
NOTES TO CONSOLIDATED FINANCIAL STATEMENTS
DECEMBER 31, 20102012
(IN MILLIONS OF DOLLARS, UNLESS OTHERWISE NOTED)
NOTE 22.23. SEGMENT DISCLOSURES (CONTINUED)
SEGMENT DATA (CONTINUED) | December 31, 2010 | December 31, 2009 | December 31, 2012 | December 31, 2011 | ||||||||||||
| $ | $ | $ | $ | |||||||||||||
Segment assets | ||||||||||||||||
Papers | 5,088 | 5,538 | ||||||||||||||
Paper Merchants | 99 | 101 | ||||||||||||||
Wood | — | 250 | ||||||||||||||
Pulp and Paper | 4,564 | 4,874 | ||||||||||||||
Distribution | 73 | 84 | ||||||||||||||
Personal Care | 841 | 458 | ||||||||||||||
|
| |||||||||||||||
Total for reportable segments | 5,187 | 5,889 | 5,478 | 5,416 | ||||||||||||
Corporate | 839 | 630 | 645 | 453 | ||||||||||||
|
| |||||||||||||||
Consolidated assets | 6,026 | 6,519 | 6,123 | 5,869 | ||||||||||||
|
| |||||||||||||||
| Year ended December 31, 2010 | Year ended December 31, 2009 | Year ended December 31, 2008 | Year ended December 31, 2012 | Year ended December 31, 2011 | Year ended December 31, 2010 | |||||||||||||||||||
| $ | $ | $ | $ | $ | $ | |||||||||||||||||||
Additions to property, plant and equipment | ||||||||||||||||||||||||
Papers | 142 | 93 | 130 | |||||||||||||||||||||
Paper Merchants | 2 | 1 | 2 | |||||||||||||||||||||
Wood | 1 | 4 | 7 | |||||||||||||||||||||
Pulp and Paper | 181 | 133 | 142 | |||||||||||||||||||||
Distribution | 2 | 2 | 2 | |||||||||||||||||||||
Personal Care | 44 | — | — | |||||||||||||||||||||
Wood(2) | — | — | 1 | |||||||||||||||||||||
|
|
| ||||||||||||||||||||||
Total for reportable segments | 145 | 98 | 139 | 227 | 135 | 145 | ||||||||||||||||||
Corporate | 5 | 8 | 18 | 12 | 10 | 5 | ||||||||||||||||||
|
|
| ||||||||||||||||||||||
Consolidated additions to property, plant and equipment | 150 | 106 | 157 | 239 | 145 | 150 | ||||||||||||||||||
Add: Change in payables on capital projects | 3 | — | 6 | (3 | ) | (1 | ) | 3 | ||||||||||||||||
|
|
| ||||||||||||||||||||||
Consolidated additions to property, plant and equipment per Consolidated Statements of Cash Flows | 153 | 106 | 163 | 236 | 144 | 153 | ||||||||||||||||||
|
|
| ||||||||||||||||||||||
| Year ended December 31, 2010 | Year ended December 31, 2009 | Year ended December 31, 2008 | ||||||||||
| $ | $ | $ | ||||||||||
Geographic information | ||||||||||||
Sales | ||||||||||||
United States | 4,245 | 4,139 | 5,012 | |||||||||
Canada | 837 | 789 | 832 | |||||||||
Other foreign countries | 768 | 537 | 550 | |||||||||
| 5,850 | 5,465 | 6,394 | ||||||||||
| (1) | In 2012 and 2011, Staples, one of the Company’s largest customers in the Pulp and Paper segment, represented approximately 11% of the total sales. |
| December 31, 2010 | December 31, 2009 | |||||||
| $ | $ | |||||||
Property, plant and equipment, net | ||||||||
United States | 2,543 | 2,799 | ||||||
Canada | 1,224 | 1,330 | ||||||
| 3,767 | 4,129 | |||||||
| (2) | The Wood segment was sold in the second quarter of 2010. |
| Year ended December 31, 2012 | Year ended December 31, 2011 | Year ended December 31, 2010 | ||||||||||
| $ | $ | $ | ||||||||||
Geographic information | ||||||||||||
Sales | ||||||||||||
United States | 4,086 | 4,200 | 4,245 | |||||||||
Canada | 716 | 756 | 837 | |||||||||
China | 155 | 229 | 375 | |||||||||
Europe | 250 | 161 | 160 | |||||||||
Other foreign countries | 275 | 266 | 233 | |||||||||
|
|
|
|
|
| |||||||
| 5,482 | 5,612 | 5,850 | ||||||||||
|
|
|
|
|
| |||||||
DOMTAR CORPORATION
NOTES TO CONSOLIDATED FINANCIAL STATEMENTS
DECEMBER 31, 20102012
(IN MILLIONS OF DOLLARS, UNLESS OTHERWISE NOTED)
NOTE 23. SEGMENT DISCLOSURES (CONTINUED)
SEGMENT DATA (CONTINUED) | December 31, 2012 | December 31, 2011 | ||||||
| $ | $ | |||||||
Long-lived assets | ||||||||
United States | 2,629 | 2,675 | ||||||
Canada | 1,069 | 1,148 | ||||||
Other foreign countries | 275 | 3 | ||||||
|
|
|
| |||||
| 3,973 | 3,826 | |||||||
|
|
|
| |||||
CONDENSED CONSOLIDATINGSUPPLEMENTAL GUARANTOR FINANCIAL INFORMATION
The following information is presented as required under Rule 3-10 of Regulation S-X, in connection with the Company’s issuance of debt securities that are fully and unconditionally guaranteed by Domtar Paper Company, LLC, a 100% owned subsidiary of the Company and the successor to the Weyerhaeuser Fine Paper Business U.S. Operations, Domtar Industries Inc.LLC (and subsidiaries, excluding Domtar Funding LLC), Ris Paper CompanyAriva Distribution Inc. and, Domtar Delaware Investments Inc., Domtar Delaware Holdings, LLC, Domtar A.W., LLC (and subsidiary), Domtar AI Inc., Attends Healthcare Inc., and EAM Corporation, all 100% owned subsidiaries of the Company (“Guarantor Subsidiaries”), on a joint and several basis. The Guaranteed Debt will not be guaranteed by certain of Domtar Paper Company, LLC’s own 100% owned subsidiaries; including Domtar Delaware Investments Inc., Domtar Delaware Holdings Inc., Domtar Delaware Holdings LLC,Attends Healthcare Limited and Domtar Inc. and Domtar Pulp & Paper Products Inc., (collectively the “Non-Guarantor Subsidiaries”). The subsidiary’s guarantee may be released in certain customary circumstances, such as if the subsidiary is sold or sells all of its assets, if the subsidiary’s guarantee of the Credit Agreement is terminated or released and if the requirements for legal defeasance to discharge the indenture have been satisfied.
The following supplemental condensed consolidating financial information sets forth, on an unconsolidated basis, the Balance Sheets at December 31, 20102012 and December 31, 20092011 and the Statements of Earnings (Loss),and Comprehensive Income and Cash Flows for the years ended December 31, 2010,2012, December 31, 20092011 and December 31, 20082010 for Domtar Corporation (the “Parent”), and on a combined basis for the Guarantor Subsidiaries and, on a combined basis, the Non-Guarantor Subsidiaries. The supplemental condensed consolidating financial information reflects the investments of the Parent in the Guarantor Subsidiaries, as well as the investments of the Guarantor Subsidiaries in the Non-Guarantor Subsidiaries, using the equity method. The 2010 comparative figures have been retrospectively adjusted to reflect the fact that Domtar Delaware Investments Inc. and Domtar Delaware Holdings, LLC both became Guarantor subsidiaries in June 2011.
DOMTAR CORPORATION
| Year ended December 31, 2010 | ||||||||||||||||||||
CONDENSED CONSOLIDATING | Parent | Guarantor Subsidiaries | Non- Guarantor Subsidiaries | Consolidating Adjustments | Consolidated | |||||||||||||||
| $ | $ | $ | $ | $ | ||||||||||||||||
Sales | — | 4,826 | 1,962 | (938 | ) | 5,850 | ||||||||||||||
Operating expenses | ||||||||||||||||||||
Cost of sales, excluding depreciation and amortization | — | 3,805 | 1,550 | (938 | ) | 4,417 | ||||||||||||||
Depreciation and amortization | — | 287 | 108 | — | 395 | |||||||||||||||
Selling, general and administrative | 28 | 333 | (23 | ) | — | 338 | ||||||||||||||
Impairment and write-down of property, plant and equipment | — | 50 | — | — | 50 | |||||||||||||||
Closure and restructuring costs | — | 19 | 8 | — | 27 | |||||||||||||||
Other operating loss (income), net | 7 | (14 | ) | 27 | — | 20 | ||||||||||||||
| 35 | 4,480 | 1,670 | (938 | ) | 5,247 | |||||||||||||||
Operating income (loss) | (35 | ) | 346 | 292 | — | 603 | ||||||||||||||
Interest expense (income), net | 153 | 59 | (57 | ) | — | 155 | ||||||||||||||
Earnings (loss) before income taxes | (188 | ) | 287 | 349 | — | 448 | ||||||||||||||
Income tax (benefit) expense | (164 | ) | 79 | (72 | ) | — | (157 | ) | ||||||||||||
Share in earnings of equity accounted investees | 629 | 421 | — | (1,050 | ) | — | ||||||||||||||
Net earnings | 605 | 629 | 421 | (1,050 | ) | 605 | ||||||||||||||
NOTES TO CONSOLIDATED FINANCIAL STATEMENTS
DECEMBER 31, 20102012
(IN MILLIONS OF DOLLARS, UNLESS OTHERWISE NOTED)
NOTE 23. CONDENSED CONSOLIDATING24. SUPPLEMENTAL GUARANTOR FINANCIAL INFORMATION (CONTINUED)
| Year ended December 31, 2009 | ||||||||||||||||||||||||||||||||||||||||
CONDENSED CONSOLIDATING | Parent | Guarantor Subsidiaries | Non- Guarantor Subsidiaries | Consolidating Adjustments | Consolidated | |||||||||||||||||||||||||||||||||||
CONDENSED CONSOLIDATING STATEMENT OF | Year ended December 31, 2012 | |||||||||||||||||||||||||||||||||||||||
| Parent | Guarantor Subsidiaries | Non- Guarantor Subsidiaries | Consolidating Adjustments | Consolidated | ||||||||||||||||||||||||||||||||||||
| $ | $ | $ | $ | $ | $ | $ | $ | $ | $ | |||||||||||||||||||||||||||||||
Sales | — | 4,504 | 1,684 | (723 | ) | 5,465 | — | 4,550 | 1,918 | (986 | ) | 5,482 | ||||||||||||||||||||||||||||
Operating expenses | ||||||||||||||||||||||||||||||||||||||||
Cost of sales, excluding depreciation and amortization | — | 3,659 | 1,536 | (723 | ) | 4,472 | — | 3,682 | 1,625 | (986 | ) | 4,321 | ||||||||||||||||||||||||||||
Depreciation and amortization | — | 299 | 106 | — | 405 | — | 298 | 87 | — | 385 | ||||||||||||||||||||||||||||||
Selling, general and administrative | 30 | 241 | 74 | — | 345 | 29 | 285 | 44 | — | 358 | ||||||||||||||||||||||||||||||
Impairment and write-down of property, plant and equipment | — | 48 | 14 | — | 62 | |||||||||||||||||||||||||||||||||||
Impairment and write-down of property, plant and equipment and intangible assets | — | 7 | 7 | — | 14 | |||||||||||||||||||||||||||||||||||
Closure and restructuring costs | — | 31 | 32 | — | 63 | — | 19 | 11 | — | 30 | ||||||||||||||||||||||||||||||
Other operating loss (income), net | (143 | ) | (487 | ) | (11 | ) | 144 | (497 | ) | — | (16 | ) | 23 | — | 7 | |||||||||||||||||||||||||
|
|
|
|
| ||||||||||||||||||||||||||||||||||||
| (113 | ) | 3,791 | 1,751 | (579 | ) | 4,850 | 29 | 4,275 | 1,797 | (986 | ) | 5,115 | ||||||||||||||||||||||||||||
|
|
|
|
| ||||||||||||||||||||||||||||||||||||
Operating income (loss) | 113 | 713 | (67 | ) | (144 | ) | 615 | (29 | ) | 275 | 121 | — | 367 | |||||||||||||||||||||||||||
Interest expense (income), net | 122 | 47 | (44 | ) | — | 125 | 137 | 19 | (25 | ) | — | 131 | ||||||||||||||||||||||||||||
|
|
|
|
| ||||||||||||||||||||||||||||||||||||
Earnings (loss) before income taxes | (9 | ) | 666 | (23 | ) | (144 | ) | 490 | ||||||||||||||||||||||||||||||||
Income tax expense | 28 | 152 | — | — | 180 | |||||||||||||||||||||||||||||||||||
Share in earnings (loss) of equity accounted investees | 491 | (23 | ) | — | (468 | ) | — | |||||||||||||||||||||||||||||||||
Earnings (loss) before income taxes and equity earnings | (166 | ) | 256 | 146 | — | 236 | ||||||||||||||||||||||||||||||||||
Income tax expense (benefit) | (65 | ) | 90 | 33 | — | 58 | ||||||||||||||||||||||||||||||||||
Equity loss, net of taxes | — | — | 6 | — | 6 | |||||||||||||||||||||||||||||||||||
Share in earnings of equity accounted investees | 273 | 107 | — | (380 | ) | — | ||||||||||||||||||||||||||||||||||
|
|
|
|
| ||||||||||||||||||||||||||||||||||||
Net earnings (loss) | 454 | 491 | (23 | ) | (612 | ) | 310 | |||||||||||||||||||||||||||||||||
Net earnings | 172 | 273 | 107 | (380 | ) | 172 | ||||||||||||||||||||||||||||||||||
|
|
|
|
| ||||||||||||||||||||||||||||||||||||
Other comprehensive income (loss) | 2 | (2 | ) | (54 | ) | — | (54 | ) | ||||||||||||||||||||||||||||||||
|
|
|
|
| ||||||||||||||||||||||||||||||||||||
Comprehensive income | 174 | 271 | 53 | (380 | ) | 118 | ||||||||||||||||||||||||||||||||||
|
|
|
|
| ||||||||||||||||||||||||||||||||||||
DOMTAR CORPORATION
NOTES TO CONSOLIDATED FINANCIAL STATEMENTS
DECEMBER 31, 20102012
(IN MILLIONS OF DOLLARS, UNLESS OTHERWISE NOTED)
NOTE 23. CONDENSED CONSOLIDATING24. SUPPLEMENTAL GUARANTOR FINANCIAL INFORMATION (CONTINUED)
| Year ended December 31, 2008 | ||||||||||||||||||||||||||||||||||||||||
CONDENSED CONSOLIDATING | Parent | Guarantor Subsidiaries | Non- Guarantor Subsidiaries | Consolidating Adjustments | Consolidated | |||||||||||||||||||||||||||||||||||
CONDENSED CONSOLIDATING STATEMENT OF | Year ended December 31, 2011 | |||||||||||||||||||||||||||||||||||||||
| Parent | Guarantor Subsidiaries | Non- Guarantor Subsidiaries | Consolidating Adjustments | Consolidated | ||||||||||||||||||||||||||||||||||||
| $ | $ | $ | $ | $ | $ | $ | $ | $ | $ | |||||||||||||||||||||||||||||||
Sales | — | 5,138 | 2,421 | (1,165 | ) | 6,394 | — | 4,719 | 1,824 | (931 | ) | 5,612 | ||||||||||||||||||||||||||||
Operating expenses | ||||||||||||||||||||||||||||||||||||||||
Cost of sales, excluding depreciation and amortization | — | 4,175 | 2,215 | (1,165 | ) | 5,225 | — | 3,672 | 1,430 | (931 | ) | 4,171 | ||||||||||||||||||||||||||||
Depreciation and amortization | — | 311 | 152 | — | 463 | — | 274 | 102 | — | 376 | ||||||||||||||||||||||||||||||
Selling, general and administrative | 57 | 289 | 54 | — | 400 | 28 | 330 | (18 | ) | — | 340 | |||||||||||||||||||||||||||||
Impairment and write-down of property, plant and equipment | — | 96 | 287 | — | 383 | — | 73 | 12 | — | 85 | ||||||||||||||||||||||||||||||
Impairment of goodwill and intangible assets | — | 85 | 240 | — | 325 | |||||||||||||||||||||||||||||||||||
Closure and restructuring costs | — | 2 | 41 | — | 43 | — | 51 | 1 | — | 52 | ||||||||||||||||||||||||||||||
Other operating income, net | — | (4 | ) | (4 | ) | — | (8 | ) | ||||||||||||||||||||||||||||||||
Other operating loss (income), net | — | (9 | ) | 5 | — | (4 | ) | |||||||||||||||||||||||||||||||||
|
|
|
|
| ||||||||||||||||||||||||||||||||||||
| 57 | 4,954 | 2,985 | (1,165 | ) | 6,831 | 28 | 4,391 | 1,532 | (931 | ) | 5,020 | |||||||||||||||||||||||||||||
|
|
|
|
| ||||||||||||||||||||||||||||||||||||
Operating income (loss) | (57 | ) | 184 | (564 | ) | — | (437 | ) | (28 | ) | 328 | 292 | — | 592 | ||||||||||||||||||||||||||
Interest expense (income), net | 126 | (194 | ) | 201 | — | 133 | 98 | 14 | (25 | ) | — | 87 | ||||||||||||||||||||||||||||
|
|
|
|
| ||||||||||||||||||||||||||||||||||||
Earnings (loss) before income taxes | (183 | ) | 378 | (765 | ) | — | (570 | ) | ||||||||||||||||||||||||||||||||
Income tax (benefit) expense | (59 | ) | 77 | (15 | ) | — | 3 | |||||||||||||||||||||||||||||||||
Share in earnings (loss) of equity accounted investees | (449 | ) | (750 | ) | — | 1,199 | — | |||||||||||||||||||||||||||||||||
Earnings (loss) before income taxes and equity earnings | (126 | ) | 314 | 317 | — | 505 | ||||||||||||||||||||||||||||||||||
Income tax expense (benefit) | (56 | ) | 118 | 71 | — | 133 | ||||||||||||||||||||||||||||||||||
Equity loss, net of taxes | — | — | 7 | — | 7 | |||||||||||||||||||||||||||||||||||
Share in earnings of equity accounted investees | 435 | 239 | — | (674 | ) | — | ||||||||||||||||||||||||||||||||||
|
|
|
|
| ||||||||||||||||||||||||||||||||||||
Net earnings (loss) | (573 | ) | (449 | ) | (750 | ) | 1,199 | (573 | ) | |||||||||||||||||||||||||||||||
Net earnings | 365 | 435 | 239 | (674 | ) | 365 | ||||||||||||||||||||||||||||||||||
Other comprehensive income (loss) | (1 | ) | (25 | ) | (38 | ) | — | (64 | ) | |||||||||||||||||||||||||||||||
|
|
|
|
| ||||||||||||||||||||||||||||||||||||
Comprehensive income | 364 | 410 | 201 | (674 | ) | 301 | ||||||||||||||||||||||||||||||||||
|
|
|
|
| ||||||||||||||||||||||||||||||||||||
DOMTAR CORPORATION
NOTES TO CONSOLIDATED FINANCIAL STATEMENTS
DECEMBER 31, 20102012
(IN MILLIONS OF DOLLARS, UNLESS OTHERWISE NOTED)
NOTE 23. CONDENSED CONSOLIDATING24. SUPPLEMENTAL GUARANTOR FINANCIAL INFORMATION (CONTINUED)
| December 31, 2010 | ||||||||||||||||||||
CONDENSED CONSOLIDATING BALANCE SHEET | Parent | Guarantor Subsidiaries | Non- Guarantor Subsidiaries | Consolidating Adjustments | Consolidated | |||||||||||||||
| $ | $ | $ | $ | $ | ||||||||||||||||
Assets | ||||||||||||||||||||
Current assets | ||||||||||||||||||||
Cash and cash equivalents | 311 | 50 | 169 | — | 530 | |||||||||||||||
Receivables | 4 | 416 | 181 | — | 601 | |||||||||||||||
Inventories | — | 477 | 171 | — | 648 | |||||||||||||||
Prepaid expenses | 5 | 6 | 17 | — | 28 | |||||||||||||||
Income and other taxes receivable | 47 | — | 33 | (2 | ) | 78 | ||||||||||||||
Intercompany accounts | 367 | 2,797 | 291 | (3,455 | ) | — | ||||||||||||||
Deferred income taxes | 1 | 104 | 10 | — | 115 | |||||||||||||||
Total current assets | 735 | 3,850 | 872 | (3,457 | ) | 2,000 | ||||||||||||||
Property, plant and equipment, at cost | — | 5,537 | 3,718 | — | 9,255 | |||||||||||||||
Accumulated depreciation | — | (2,993 | ) | (2,495 | ) | — | (5,488 | ) | ||||||||||||
Net property, plant and equipment | — | 2,544 | 1,223 | — | 3,767 | |||||||||||||||
Intangible assets, net of amortization | — | 10 | 46 | — | 56 | |||||||||||||||
Investments in affiliates | 6,421 | 1,742 | — | (8,163 | ) | — | ||||||||||||||
Intercompany long-term advances | 6 | 80 | 871 | (957 | ) | — | ||||||||||||||
Other assets | 27 | 1 | 189 | (14 | ) | 203 | ||||||||||||||
Total assets | 7,189 | 8,227 | 3,201 | (12,591 | ) | 6,026 | ||||||||||||||
Liabilities and shareholders’ equity | ||||||||||||||||||||
Current liabilities | ||||||||||||||||||||
Bank indebtedness | — | 19 | 4 | — | 23 | |||||||||||||||
Trade and other payables | 33 | 375 | 270 | — | 678 | |||||||||||||||
Intercompany accounts | 2,825 | 399 | 231 | (3,455 | ) | — | ||||||||||||||
Income and other taxes payable | — | 2 | 22 | (2 | ) | 22 | ||||||||||||||
Long-term debt due within one year | — | 2 | — | — | 2 | |||||||||||||||
Total current liabilities | 2,858 | 797 | 527 | (3,457 | ) | 725 | ||||||||||||||
Long-term debt | 803 | 10 | 12 | — | 825 | |||||||||||||||
Intercompany long-term loans | 351 | 606 | — | (957 | ) | — | ||||||||||||||
Deferred income taxes and other | — | 920 | 18 | (14 | ) | 924 | ||||||||||||||
Other liabilities and deferred credits | 39 | 66 | 245 | — | 350 | |||||||||||||||
Shareholders’ equity | 3,138 | 5,828 | 2,399 | (8,163 | ) | 3,202 | ||||||||||||||
Total liabilities and shareholders’ equity | 7,189 | 8,227 | 3,201 | (12,591 | ) | 6,026 | ||||||||||||||
| Year ended December 31, 2010 | ||||||||||||||||||||
CONDENSED CONSOLIDATING STATEMENT OF | Parent | Guarantor Subsidiaries | Non- Guarantor Subsidiaries | Consolidating Adjustments | Consolidated | |||||||||||||||
| $ | $ | $ | $ | $ | ||||||||||||||||
Sales | — | 4,826 | 1,962 | (938 | ) | 5,850 | ||||||||||||||
Operating expenses | ||||||||||||||||||||
Cost of sales, excluding depreciation and amortization | — | 3,805 | 1,550 | (938 | ) | 4,417 | ||||||||||||||
Depreciation and amortization | — | 287 | 108 | — | 395 | |||||||||||||||
Selling, general and administrative | 28 | 333 | (23 | ) | — | 338 | ||||||||||||||
Impairment and write-down of property, plant and equipment | — | 50 | — | — | 50 | |||||||||||||||
Closure and restructuring costs | — | 19 | 8 | — | 27 | |||||||||||||||
Other operating loss (income), net | 7 | (14 | ) | 27 | — | 20 | ||||||||||||||
|
|
|
|
|
|
|
|
|
| |||||||||||
| 35 | 4,480 | 1,670 | (938 | ) | 5,247 | |||||||||||||||
|
|
|
|
|
|
|
|
|
| |||||||||||
Operating income (loss) | (35 | ) | 346 | 292 | — | 603 | ||||||||||||||
Interest expense (income), net | 153 | 11 | (9 | ) | — | 155 | ||||||||||||||
|
|
|
|
|
|
|
|
|
| |||||||||||
Earnings (loss) before income taxes | (188 | ) | 335 | 301 | — | 448 | ||||||||||||||
Income tax expense (benefit) | (164 | ) | 98 | (91 | ) | — | (157 | ) | ||||||||||||
Share in earnings of equity accounted investees | 629 | 392 | — | (1,021 | ) | — | ||||||||||||||
|
|
|
|
|
|
|
|
|
| |||||||||||
Net earnings | 605 | 629 | 392 | (1,021 | ) | 605 | ||||||||||||||
Other comprehensive income | 1 | 31 | (26 | ) | — | 6 | ||||||||||||||
|
|
|
|
|
|
|
|
|
| |||||||||||
Comprehensive income | 606 | 660 | 366 | (1,021 | ) | 611 | ||||||||||||||
|
|
|
|
|
|
|
|
|
| |||||||||||
DOMTAR CORPORATION
NOTES TO CONSOLIDATED FINANCIAL STATEMENTS
DECEMBER 31, 20102012
(IN MILLIONS OF DOLLARS, UNLESS OTHERWISE NOTED)
NOTE 23. CONDENSED CONSOLIDATING24. SUPPLEMENTAL GUARANTOR FINANCIAL INFORMATION (CONTINUED)
| December 31, 2009 | December 31, 2012 | |||||||||||||||||||||||||||||||||||||||
CONDENSED CONSOLIDATING BALANCE SHEET | Parent | Guarantor Subsidiaries | Non- Guarantor Subsidiaries | Consolidating Adjustments | Consolidated | Parent | Guarantor Subsidiaries | Non- Guarantor Subsidiaries | Consolidating Adjustments | Consolidated | ||||||||||||||||||||||||||||||
| $ | $ | $ | $ | $ | $ | $ | $ | $ | $ | |||||||||||||||||||||||||||||||
Assets | ||||||||||||||||||||||||||||||||||||||||
Current assets | ||||||||||||||||||||||||||||||||||||||||
Cash and cash equivalents | 237 | 83 | 4 | — | 324 | 275 | 72 | 314 | — | 661 | ||||||||||||||||||||||||||||||
Receivables | — | 469 | 67 | — | 536 | — | 393 | 169 | — | 562 | ||||||||||||||||||||||||||||||
Inventories | — | 446 | 299 | — | 745 | — | 472 | 203 | — | 675 | ||||||||||||||||||||||||||||||
Prepaid expenses | 5 | 8 | 33 | — | 46 | 7 | 7 | 10 | — | 24 | ||||||||||||||||||||||||||||||
Income and other taxes receivable | — | 453 | 23 | (62 | ) | 414 | 34 | — | 14 | — | 48 | |||||||||||||||||||||||||||||
Intercompany accounts | 205 | 1,808 | 179 | (2,192 | ) | — | 433 | 3,501 | 12 | (3,946 | ) | — | ||||||||||||||||||||||||||||
Deferred income taxes | 1 | 136 | — | — | 137 | — | 30 | 17 | (2 | ) | 45 | |||||||||||||||||||||||||||||
|
|
|
|
| ||||||||||||||||||||||||||||||||||||
Total current assets | 448 | 3,403 | 605 | (2,254 | ) | 2,202 | 749 | 4,475 | 739 | (3,948 | ) | 2,015 | ||||||||||||||||||||||||||||
Property, plant and equipment, at cost | — | 5,733 | 3,842 | — | 9,575 | — | 5,755 | 3,038 | — | 8,793 | ||||||||||||||||||||||||||||||
Accumulated depreciation | — | (2,932 | ) | (2,514 | ) | — | (5,446 | ) | — | (3,500 | ) | (1,892 | ) | — | (5,392 | ) | ||||||||||||||||||||||||
|
|
|
|
| ||||||||||||||||||||||||||||||||||||
Net property, plant and equipment | — | 2,801 | 1,328 | — | 4,129 | — | 2,255 | 1,146 | — | 3,401 | ||||||||||||||||||||||||||||||
Goodwill | — | 194 | 69 | — | 263 | |||||||||||||||||||||||||||||||||||
Intangible assets, net of amortization | — | 4 | 81 | — | 85 | — | 180 | 129 | — | 309 | ||||||||||||||||||||||||||||||
Investments in affiliates | 5,753 | 1,321 | 25 | (7,099 | ) | — | 7,208 | 2,018 | — | (9,226 | ) | — | ||||||||||||||||||||||||||||
Intercompany long-term advances | 7 | 80 | 600 | (687 | ) | — | 6 | 85 | 489 | (580 | ) | — | ||||||||||||||||||||||||||||
Other assets | 24 | 24 | 55 | — | 103 | 30 | — | 119 | (14 | ) | 135 | |||||||||||||||||||||||||||||
|
|
|
|
| ||||||||||||||||||||||||||||||||||||
Total assets | 6,232 | 7,633 | 2,694 | (10,040 | ) | 6,519 | 7,993 | 9,207 | 2,691 | (13,768 | ) | 6,123 | ||||||||||||||||||||||||||||
|
|
|
|
| ||||||||||||||||||||||||||||||||||||
Liabilities and shareholders’ equity | ||||||||||||||||||||||||||||||||||||||||
Current liabilities | ||||||||||||||||||||||||||||||||||||||||
Bank indebtedness | — | 27 | 16 | — | 43 | — | 18 | — | — | 18 | ||||||||||||||||||||||||||||||
Trade and other payables | 33 | 393 | 260 | — | 686 | 43 | 380 | 223 | — | 646 | ||||||||||||||||||||||||||||||
Intercompany accounts | 1,806 | 266 | 120 | (2,192 | ) | — | 3,492 | 398 | 56 | (3,946 | ) | — | ||||||||||||||||||||||||||||
Income and other taxes payable | 43 | 31 | 19 | (62 | ) | 31 | 4 | 9 | 4 | (2 | ) | 15 | ||||||||||||||||||||||||||||
Long-term debt due within one year | 8 | 3 | — | — | 11 | 47 | 27 | 5 | — | 79 | ||||||||||||||||||||||||||||||
|
|
|
|
| ||||||||||||||||||||||||||||||||||||
Total current liabilities | 1,890 | 720 | 415 | (2,254 | ) | 771 | 3,586 | 832 | 288 | (3,948 | ) | 758 | ||||||||||||||||||||||||||||
Long-term debt | 1,678 | 11 | 12 | — | 1,701 | 1,107 | 8 | 13 | — | 1,128 | ||||||||||||||||||||||||||||||
Intercompany long-term loans | 80 | 606 | 1 | (687 | ) | — | 444 | 130 | 6 | (580 | ) | — | ||||||||||||||||||||||||||||
Deferred income taxes and other | — | 999 | 20 | — | 1,019 | — | 873 | 44 | (14 | ) | 903 | |||||||||||||||||||||||||||||
Other liabilities and deferred credits | — | 111 | 255 | — | 366 | 27 | 156 | 274 | — | 457 | ||||||||||||||||||||||||||||||
Shareholders’ equity | 2,584 | 5,186 | 1,991 | (7,099 | ) | 2,662 | 2,829 | 7,208 | 2,066 | (9,226 | ) | 2,877 | ||||||||||||||||||||||||||||
|
|
|
|
| ||||||||||||||||||||||||||||||||||||
Total liabilities and shareholders’ equity | 6,232 | 7,633 | 2,694 | (10,040 | ) | 6,519 | 7,993 | 9,207 | 2,691 | (13,768 | ) | 6,123 | ||||||||||||||||||||||||||||
|
|
|
|
| ||||||||||||||||||||||||||||||||||||
DOMTAR CORPORATION
NOTES TO CONSOLIDATED FINANCIAL STATEMENTS
DECEMBER 31, 20102012
(IN MILLIONS OF DOLLARS, UNLESS OTHERWISE NOTED)
NOTE 23. CONDENSED CONSOLIDATING24. SUPPLEMENTAL GUARANTOR FINANCIAL INFORMATION (CONTINUED)
| Year ended December 31, 2010 | ||||||||||||||||||||
CONDENSED CONSOLIDATING STATEMENT OF | Parent | Guarantor Subsidiaries | Non- Guarantor Subsidiaries | Consolidating Adjustments | Consolidated | |||||||||||||||
| $ | $ | $ | $ | $ | ||||||||||||||||
Operating activities | ||||||||||||||||||||
Net earnings (loss) | 605 | 629 | 421 | (1,050 | ) | 605 | ||||||||||||||
Changes in operating and intercompany assets and liabilities and non cash items, included in net earnings (loss) | 205 | (589 | ) | (105 | ) | 1,050 | 561 | |||||||||||||
Cash flows provided from operating activities | 810 | 40 | 316 | — | 1,166 | |||||||||||||||
Investing activities | ||||||||||||||||||||
Additions to property, plant and equipment | — | (134 | ) | (19 | ) | — | (153 | ) | ||||||||||||
Proceeds from disposals of property, plant and equipment | — | 6 | 20 | — | 26 | |||||||||||||||
Proceeds from sale of businesses and investments | — | 44 | 141 | — | 185 | |||||||||||||||
Cash flows provided from (used for) investing activities | — | (84 | ) | 142 | — | 58 | ||||||||||||||
Financing activities | ||||||||||||||||||||
Dividend payments | (21 | ) | — | — | — | (21 | ) | |||||||||||||
Net change in bank indebtedness | — | (8 | ) | (11 | ) | — | (19 | ) | ||||||||||||
Repayment of long-term debt | (896 | ) | (2 | ) | — | — | (898 | ) | ||||||||||||
Debt issue and tender offer costs | (35 | ) | — | — | — | (35 | ) | |||||||||||||
Stock repurchase | (44 | ) | — | — | — | (44 | ) | |||||||||||||
Prepaid and premium on structured stock repurchase, net | 2 | — | — | — | 2 | |||||||||||||||
Increase in long-term advances to related parties | — | — | (282 | ) | 282 | — | ||||||||||||||
Decrease in long-term advances to related parties | 261 | 21 | — | (282 | ) | — | ||||||||||||||
Other | (3 | ) | — | — | — | (3 | ) | |||||||||||||
Cash flows provided from (used for) financing activities | (736 | ) | 11 | (293 | ) | — | (1,018 | ) | ||||||||||||
Net increase (decrease) in cash and cash equivalents | 74 | (33 | ) | 165 | — | 206 | ||||||||||||||
Cash and cash equivalents at beginning of year | 237 | 83 | 4 | — | 324 | |||||||||||||||
Cash and cash equivalents at end of year | 311 | 50 | 169 | — | 530 | |||||||||||||||
| December 31, 2011 | ||||||||||||||||||||
CONDENSED CONSOLIDATING BALANCE SHEET | Parent | Guarantor Subsidiaries | Non- Guarantor Subsidiaries | Consolidating Adjustments | Consolidated | |||||||||||||||
| $ | $ | $ | $ | $ | ||||||||||||||||
Assets | ||||||||||||||||||||
Current assets | ||||||||||||||||||||
Cash and cash equivalents | 91 | 2 | 351 | — | 444 | |||||||||||||||
Receivables | — | 456 | 188 | — | 644 | |||||||||||||||
Inventories | — | 475 | 177 | — | 652 | |||||||||||||||
Prepaid expenses | 6 | 5 | 11 | — | 22 | |||||||||||||||
Income and other taxes receivable | 20 | 1 | 26 | — | 47 | |||||||||||||||
Intercompany accounts | 349 | 3,198 | 53 | (3,600 | ) | — | ||||||||||||||
Deferred income taxes | 5 | 61 | 59 | — | 125 | |||||||||||||||
|
|
|
|
|
|
|
|
|
| |||||||||||
Total current assets | 471 | 4,198 | 865 | (3,600 | ) | 1,934 | ||||||||||||||
Property, plant and equipment, at cost | — | 5,581 | 2,867 | — | 8,448 | |||||||||||||||
Accumulated depreciation | — | (3,230 | ) | (1,759 | ) | — | (4,989 | ) | ||||||||||||
|
|
|
|
|
|
|
|
|
| |||||||||||
Net property, plant and equipment | — | 2,351 | 1,108 | — | 3,459 | |||||||||||||||
Goodwill | — | 163 | — | — | 163 | |||||||||||||||
Intangible assets, net of amortization | — | 162 | 42 | — | 204 | |||||||||||||||
Investments in affiliates | 6,933 | 1,952 | — | (8,885 | ) | — | ||||||||||||||
Intercompany long-term advances | 6 | 79 | 431 | (516 | ) | — | ||||||||||||||
Other assets | 21 | 1 | 97 | (10 | ) | 109 | ||||||||||||||
|
|
|
|
|
|
|
|
|
| |||||||||||
Total assets | 7,431 | 8,906 | 2,543 | (13,011 | ) | 5,869 | ||||||||||||||
|
|
|
|
|
|
|
|
|
| |||||||||||
Liabilities and shareholders’ equity | ||||||||||||||||||||
Current liabilities | ||||||||||||||||||||
Bank indebtedness | — | 7 | — | — | 7 | |||||||||||||||
Trade and other payables | 37 | 425 | 226 | — | 688 | |||||||||||||||
Intercompany accounts | 3,196 | 370 | 34 | (3,600 | ) | — | ||||||||||||||
Income and other taxes payable | 4 | 10 | 3 | — | 17 | |||||||||||||||
Long-term debt due within one year | — | 4 | — | — | 4 | |||||||||||||||
|
|
|
|
|
|
|
|
|
| |||||||||||
Total current liabilities | 3,237 | 816 | 263 | (3,600 | ) | 716 | ||||||||||||||
Long-term debt | 790 | 35 | 12 | — | 837 | |||||||||||||||
Intercompany long-term loans | 431 | 85 | — | (516 | ) | — | ||||||||||||||
Deferred income taxes and other | — | 916 | 21 | (10 | ) | 927 | ||||||||||||||
Other liabilities and deferred credits | 50 | 133 | 234 | — | 417 | |||||||||||||||
Shareholders’ equity | 2,923 | 6,921 | 2,013 | (8,885 | ) | 2,972 | ||||||||||||||
|
|
|
|
|
|
|
|
|
| |||||||||||
Total liabilities and shareholders’ equity | 7,431 | 8,906 | 2,543 | (13,011 | ) | 5,869 | ||||||||||||||
|
|
|
|
|
|
|
|
|
| |||||||||||
DOMTAR CORPORATION
NOTES TO CONSOLIDATED FINANCIAL STATEMENTS
DECEMBER 31, 20102012
(IN MILLIONS OF DOLLARS, UNLESS OTHERWISE NOTED)
NOTE 23. CONDENSED CONSOLIDATING24. SUPPLEMENTAL GUARANTOR FINANCIAL INFORMATION (CONTINUED)
| Year ended December 31, 2009 | Year ended December 31, 2012 | |||||||||||||||||||||||||||||||||||||||
CONDENSED CONSOLIDATING STATEMENT OF | Parent | Guarantor Subsidiaries | Non- Guarantor Subsidiaries | Consolidating Adjustments | Consolidated | Parent | Guarantor Subsidiaries | Non- Guarantor Subsidiaries | Consolidating Adjustments | Consolidated | ||||||||||||||||||||||||||||||
| $ | $ | $ | $ | $ | $ | $ | $ | $ | $ | |||||||||||||||||||||||||||||||
Operating activities | ||||||||||||||||||||||||||||||||||||||||
Net earnings (loss) | 454 | 491 | (23 | ) | (612 | ) | 310 | |||||||||||||||||||||||||||||||||
Changes in operating and intercompany assets and liabilities and non cash items, included in net earnings (loss) | 503 | (730 | ) | 97 | 612 | 482 | ||||||||||||||||||||||||||||||||||
Net earnings | 172 | 273 | 107 | (380 | ) | 172 | ||||||||||||||||||||||||||||||||||
Changes in operating and intercompany assets and liabilities and non-cash items, included in net earnings | (87 | ) | (67 | ) | 153 | 380 | 379 | |||||||||||||||||||||||||||||||||
|
|
|
|
| ||||||||||||||||||||||||||||||||||||
Cash flows provided from (used for) operating activities | 957 | (239 | ) | 74 | — | 792 | ||||||||||||||||||||||||||||||||||
Cash flows provided from operating activities | 85 | 206 | 260 | — | 551 | |||||||||||||||||||||||||||||||||||
|
|
|
|
| ||||||||||||||||||||||||||||||||||||
Investing activities | ||||||||||||||||||||||||||||||||||||||||
Additions to property, plant and equipment | — | (83 | ) | (23 | ) | — | (106 | ) | — | (182 | ) | (54 | ) | — | (236 | ) | ||||||||||||||||||||||||
Proceeds from disposals of property, plant and equipment | — | 5 | 16 | — | 21 | — | 1 | 48 | — | 49 | ||||||||||||||||||||||||||||||
Acquisition of businesses, net of cash acquired | — | (61 | ) | (232 | ) | — | (293 | ) | ||||||||||||||||||||||||||||||||
Investment in joint venture | — | — | (6 | ) | — | (6 | ) | |||||||||||||||||||||||||||||||||
|
|
|
|
| ||||||||||||||||||||||||||||||||||||
Cash flows used for investing activities | — | (78 | ) | (7 | ) | — | (85 | ) | — | (242 | ) | (244 | ) | — | (486 | ) | ||||||||||||||||||||||||
|
|
|
|
| ||||||||||||||||||||||||||||||||||||
Financing activities | ||||||||||||||||||||||||||||||||||||||||
Dividend payments | (58 | ) | — | — | — | (58 | ) | |||||||||||||||||||||||||||||||||
Net change in bank indebtedness | — | 2 | (2 | ) | — | — | — | 11 | — | — | 11 | |||||||||||||||||||||||||||||
Change of revolving bank credit facility | (60 | ) | — | — | — | (60 | ) | |||||||||||||||||||||||||||||||||
Issuance of long-term debt | 385 | — | — | — | 385 | 548 | — | — | — | 548 | ||||||||||||||||||||||||||||||
Repayment of long-term debt | (717 | ) | (6 | ) | (2 | ) | — | (725 | ) | (186 | ) | (5 | ) | (1 | ) | — | (192 | ) | ||||||||||||||||||||||
Debt issue and tender offer costs | (14 | ) | — | — | — | (14 | ) | |||||||||||||||||||||||||||||||||
Stock repurchase | (157 | ) | — | — | — | (157 | ) | |||||||||||||||||||||||||||||||||
Increase in long-term advances to related parties | (314 | ) | — | (76 | ) | 390 | — | (47 | ) | — | (52 | ) | 99 | — | ||||||||||||||||||||||||||
Decrease in long-term advances to related parties | — | 390 | — | (390 | ) | — | — | 99 | — | (99 | ) | — | ||||||||||||||||||||||||||||
Other | (1 | ) | 1 | — | — | — | ||||||||||||||||||||||||||||||||||
|
|
|
|
| ||||||||||||||||||||||||||||||||||||
Cash flows provided from (used for) financing activities | (720 | ) | 386 | (80 | ) | — | (414 | ) | 99 | 106 | (53 | ) | — | 152 | ||||||||||||||||||||||||||
|
|
|
|
| ||||||||||||||||||||||||||||||||||||
Net increase (decrease) in cash and cash equivalents | 237 | 69 | (13 | ) | — | 293 | 184 | 70 | (37 | ) | — | 217 | ||||||||||||||||||||||||||||
Translation adjustments related to cash and cash equivalents | — | — | 15 | — | 15 | |||||||||||||||||||||||||||||||||||
Cash and cash equivalents at beginning of year | — | 14 | 2 | — | 16 | 91 | 2 | 351 | — | 444 | ||||||||||||||||||||||||||||||
|
|
|
|
| ||||||||||||||||||||||||||||||||||||
Cash and cash equivalents at end of year | 237 | 83 | 4 | — | 324 | 275 | 72 | 314 | — | 661 | ||||||||||||||||||||||||||||||
|
|
|
|
| ||||||||||||||||||||||||||||||||||||
DOMTAR CORPORATION
NOTES TO CONSOLIDATED FINANCIAL STATEMENTS
DECEMBER 31, 20102012
(IN MILLIONS OF DOLLARS, UNLESS OTHERWISE NOTED)
NOTE 23. CONDENSED CONSOLIDATING24. SUPPLEMENTAL GUARANTOR FINANCIAL INFORMATION (CONTINUED)
| Year ended December 31, 2008 | Year ended December 31, 2011 | |||||||||||||||||||||||||||||||||||||||
CONDENSED CONSOLIDATING STATEMENT OF | Parent | Guarantor Subsidiaries | Non- Guarantor Subsidiaries | Consolidating Adjustments | Consolidated | Parent | Guarantor Subsidiaries | Non- Guarantor Subsidiaries | Consolidating Adjustments | Consolidated | ||||||||||||||||||||||||||||||
| $ | $ | $ | $ | $ | $ | $ | $ | $ | $ | |||||||||||||||||||||||||||||||
Operating activities | ||||||||||||||||||||||||||||||||||||||||
Net earnings (loss) | (573 | ) | (449 | ) | (750 | ) | 1,199 | (573 | ) | |||||||||||||||||||||||||||||||
Changes in operating and intercompany assets and liabilities and non cash items, included in net earnings (loss) | 594 | 1,008 | 367 | (1,199 | ) | 770 | ||||||||||||||||||||||||||||||||||
Net earnings | 365 | 435 | 239 | (674 | ) | 365 | ||||||||||||||||||||||||||||||||||
Changes in operating and intercompany assets and liabilities and non-cash items, included in net earnings | 10 | (330 | ) | 164 | 674 | 518 | ||||||||||||||||||||||||||||||||||
|
|
|
|
| ||||||||||||||||||||||||||||||||||||
Cash flows provided from (used for) operating activities | 21 | 559 | (383 | ) | — | 197 | ||||||||||||||||||||||||||||||||||
Cash flows provided from operating activities | 375 | 105 | 403 | — | 883 | |||||||||||||||||||||||||||||||||||
|
|
|
|
| ||||||||||||||||||||||||||||||||||||
Investing activities | ||||||||||||||||||||||||||||||||||||||||
Additions to property, plant and equipment | — | (99 | ) | (64 | ) | — | (163 | ) | — | (103 | ) | (41 | ) | — | (144 | ) | ||||||||||||||||||||||||
Proceeds from disposals of property, plant and equipment and sale of trademarks | — | 5 | 30 | — | 35 | |||||||||||||||||||||||||||||||||||
Business acquisition—Joint venture | — | — | (12 | ) | — | (12 | ) | |||||||||||||||||||||||||||||||||
Proceeds from disposals of property, plant and equipment | — | 16 | 18 | — | 34 | |||||||||||||||||||||||||||||||||||
Proceeds from sale of business | — | 10 | — | — | 10 | |||||||||||||||||||||||||||||||||||
Acquisition of business, net of cash acquired | — | (288 | ) | — | — | (288 | ) | |||||||||||||||||||||||||||||||||
Investment in joint venture | — | — | (7 | ) | — | (7 | ) | |||||||||||||||||||||||||||||||||
|
|
|
|
| ||||||||||||||||||||||||||||||||||||
Cash flows used for investing activities | — | (94 | ) | (46 | ) | — | (140 | ) | — | (365 | ) | (30 | ) | — | (395 | ) | ||||||||||||||||||||||||
|
|
|
|
| ||||||||||||||||||||||||||||||||||||
Financing activities | ||||||||||||||||||||||||||||||||||||||||
Dividend payments | (49 | ) | — | — | — | (49 | ) | |||||||||||||||||||||||||||||||||
Net change in bank indebtedness | — | (33 | ) | 9 | — | (24 | ) | — | (12 | ) | (4 | ) | — | (16 | ) | |||||||||||||||||||||||||
Change of revolving bank credit facility | 10 | — | — | — | 10 | |||||||||||||||||||||||||||||||||||
Repayment of long-term debt | (75 | ) | (18 | ) | (2 | ) | — | (95 | ) | (15 | ) | (3 | ) | — | — | (18 | ) | |||||||||||||||||||||||
Premium paid on debt repurchases and tender offer costs | (7 | ) | — | — | — | (7 | ) | |||||||||||||||||||||||||||||||||
Stock repurchase | (494 | ) | — | — | — | (494 | ) | |||||||||||||||||||||||||||||||||
Increase in long-term advances to related parties | — | (453 | ) | — | 453 | — | (40 | ) | — | (187 | ) | 227 | — | |||||||||||||||||||||||||||
Decrease in long-term advances to related parties | 35 | — | 418 | (453 | ) | — | — | 227 | — | (227 | ) | — | ||||||||||||||||||||||||||||
Other | 10 | — | — | — | 10 | |||||||||||||||||||||||||||||||||||
|
|
|
|
| ||||||||||||||||||||||||||||||||||||
Cash flows provided from (used for) financing activities | (30 | ) | (504 | ) | 425 | — | (109 | ) | (595 | ) | 212 | (191 | ) | — | (574 | ) | ||||||||||||||||||||||||
|
|
|
|
| ||||||||||||||||||||||||||||||||||||
Net decrease in cash and cash equivalents | (9 | ) | (39 | ) | (4 | ) | — | (52 | ) | |||||||||||||||||||||||||||||||
Translation adjustments related to cash and cash equivalents | — | — | (3 | ) | — | (3 | ) | |||||||||||||||||||||||||||||||||
Net increase (decrease) in cash and cash equivalents | (220 | ) | (48 | ) | 182 | — | (86 | ) | ||||||||||||||||||||||||||||||||
Cash and cash equivalents at beginning of year | 9 | 53 | 9 | — | 71 | 311 | 50 | 169 | — | 530 | ||||||||||||||||||||||||||||||
|
|
|
|
| ||||||||||||||||||||||||||||||||||||
Cash and cash equivalents at end of year | — | 14 | 2 | — | 16 | 91 | 2 | 351 | — | 444 | ||||||||||||||||||||||||||||||
|
|
|
|
| ||||||||||||||||||||||||||||||||||||
DOMTAR CORPORATION
NOTES TO CONSOLIDATED FINANCIAL STATEMENTS
DECEMBER 31, 20102012
(IN MILLIONS OF DOLLARS, UNLESS OTHERWISE NOTED)
NOTE 24. SUPPLEMENTAL GUARANTOR FINANCIAL INFORMATION (CONTINUED)
| Year ended December 31, 2010 | ||||||||||||||||||||
CONDENSED CONSOLIDATING STATEMENT OF | Parent | Guarantor Subsidiaries | Non- Guarantor Subsidiaries | Consolidating Adjustments | Consolidated | |||||||||||||||
| $ | $ | $ | $ | $ | ||||||||||||||||
Operating activities | ||||||||||||||||||||
Net earnings | 605 | 629 | 392 | (1,021 | ) | 605 | ||||||||||||||
Changes in operating and intercompany assets and liabilities and non-cash items, included in net earnings | 205 | (560 | ) | (105 | ) | 1,021 | 561 | |||||||||||||
|
|
|
|
|
|
|
|
|
| |||||||||||
Cash flows provided from operating activities | 810 | 69 | 287 | — | 1,166 | |||||||||||||||
|
|
|
|
|
|
|
|
|
| |||||||||||
Investing activities | ||||||||||||||||||||
Additions to property, plant and equipment | — | (134 | ) | (19 | ) | — | (153 | ) | ||||||||||||
Proceeds from disposals of property, plant and equipment | — | 6 | 20 | — | 26 | |||||||||||||||
Proceeds from sale of businesses and investments | — | 44 | 141 | — | 185 | |||||||||||||||
|
|
|
|
|
|
|
|
|
| |||||||||||
Cash flows provided from (used for) investing activities | — | (84 | ) | 142 | — | 58 | ||||||||||||||
|
|
|
|
|
|
|
|
|
| |||||||||||
Financing activities | ||||||||||||||||||||
Dividend payments | (21 | ) | — | — | — | (21 | ) | |||||||||||||
Net change in bank indebtedness | — | (8 | ) | (11 | ) | — | (19 | ) | ||||||||||||
Repayment of long-term debt | (896 | ) | (2 | ) | — | — | (898 | ) | ||||||||||||
Debt issue and tender offer costs | (35 | ) | — | — | — | (35 | ) | |||||||||||||
Stock repurchase | (44 | ) | — | — | — | (44 | ) | |||||||||||||
Prepaid and premium on structured stock repurchase, net | 2 | — | — | — | 2 | |||||||||||||||
Increase in long-term advances to related parties | — | (8 | ) | (253 | ) | 261 | — | |||||||||||||
Decrease in long-term advances to related parties | 261 | — | — | (261 | ) | — | ||||||||||||||
Other | (3 | ) | — | — | — | (3 | ) | |||||||||||||
|
|
|
|
|
|
|
|
|
| |||||||||||
Cash flows used for financing activities | (736 | ) | (18 | ) | (264 | ) | — | (1,018 | ) | |||||||||||
|
|
|
|
|
|
|
|
|
| |||||||||||
Net increase (decrease) in cash and cash equivalents | 74 | (33 | ) | 165 | — | 206 | ||||||||||||||
Cash and cash equivalents at beginning of year | 237 | 83 | 4 | — | 324 | |||||||||||||||
|
|
|
|
|
|
|
|
|
| |||||||||||
Cash and cash equivalents at end of year | 311 | 50 | 169 | — | 530 | |||||||||||||||
|
|
|
|
|
|
|
|
|
| |||||||||||
DOMTAR CORPORATION
NOTES TO CONSOLIDATED FINANCIAL STATEMENTS
DECEMBER 31, 2012
(IN MILLIONS OF DOLLARS, UNLESS OTHERWISE NOTED)
SALE OF WOOD BUSINESS AND WOODLAND MILL
Sale of Wood business
On June 30, 2010, the Company sold its Wood business to EACOM Timber Corporation (“EACOM”), following the receiptobtainment of various third party consents and customary closing conditions, which included approvals of the transfers of cutting rights in Quebec and Ontario, for proceeds of $75 million (CDN$80 million) plus elements of working capital of approximately $42 million (CDN$45 million). Domtar received 19% of the proceeds in shares of EACOM representing an approximate 12% ownership interest in EACOM. The sale resulted in a loss on disposal of the Wood business and related pension and other post-retirement benefit plan curtailments and settlements of $50 million. The loss on disposalmillion, which was recorded in the second quarter of the Wood business is recorded as a component of2010 in Other operating loss (income), net on the Consolidated StatementStatements of Earnings (Loss).and Comprehensive Income. The investment of the Company in EACOM was then accounted for under the equity method.
The transaction included the sale of five operating sawmills: Timmins, Nairn Centre and Gogama in Ontario, and Val-d’Or and Matagami in Quebec; as well as two non-operating sawmills: Ear Falls in Ontario and Ste-Marie in Quebec. The sawmills had approximately 3.5 million cubic meters of annual harvesting rights and a production capacity of close to 900 million board feet. Also included in the transaction was the Sullivan remanufacturing facility in Quebec and interests in two investments: Anthony-Domtar Inc. and Elk Lake Planning Mill Limited.
In December 2010, in an unrelated transaction, the Company sold its investment in EACOM Timber Corporation for CDN$0.51 per common share for net proceeds of $24 million (CDN$24 million) resulting in no further gain or loss. Domtar has fiber supply agreements in place with its former wood division at its Dryden and Espanola facilities.facility. Since these continuing cash outflows are expected to be significant to the former Wood business, the sale of the Wood business did not qualify as a discontinued operation under ASC 205-20.
Sale of Woodland, Maine market pulp mill
On September 30, 2010, the Company sold its Woodland hardwood market pulp mill, hydro electric assets and related assets, located in Baileyville, Maine and New Brunswick, Canada. The purchase price was for an aggregate value of $60 million plus net working capital of $8 million. The sale resulted in a net gain on disposal of the Woodland, Maine mill of $10 million including pension curtailment expense of $2 million and has been recorded as a component of Other operating loss (income), net on the Consolidated StatementStatements of Earnings (Loss).and Comprehensive Income.
DOMTAR CORPORATIONDomtar Corporation
Interim Financial Results (Unaudited)
(in millions of dollars, unless otherwise noted)
2010 | 1st Quarter | 2nd Quarter | 3rd Quarter | 4th Quarter | Year | |||||||||||||||
Sales | $ | 1,457 | $ | 1,547 | $ | 1,473 | $ | 1,373 | $ | 5,850 | ||||||||||
Operating income | 116 | (a)(b) | 96 | (a) | 236 | (a) | 155 | 603 | ||||||||||||
Earnings before income taxes | 84 | 26 | 212 | 126 | 448 | |||||||||||||||
Net earnings | 58 | 31 | 191 | 325 | (e) | 605 | ||||||||||||||
Basic net earnings per share | 1.35 | 0.72 | 4.47 | 7.67 | 14.14 | |||||||||||||||
Diluted net earnings per share | 1.34 | 0.71 | 4.44 | 7.59 | 14.00 | |||||||||||||||
2009 | 1st Quarter | 2nd Quarter | 3rd Quarter | 4th Quarter | Year | |||||||||||||||
Sales | $ | 1,302 | $ | 1,319 | $ | 1,440 | $ | 1,404 | $ | 5,465 | ||||||||||
Operating income (loss) | (22 | )(c) | 139 | 295 | 203 | (d) | 615 | |||||||||||||
Earnings (loss) before income taxes | (53 | ) | 116 | 261 | 166 | 490 | ||||||||||||||
Net earnings (loss) | (45 | ) | 48 | 183 | 124 | 310 | ||||||||||||||
Basic net earnings (loss) per share | (1.05 | ) | 1.12 | 4.26 | 2.88 | 7.21 | ||||||||||||||
Diluted net earnings (loss) per share | (1.05 | ) | 1.12 | 4.24 | 2.86 | 7.18 | ||||||||||||||
2012 | 1st Quarter | 2nd Quarter | 3rd Quarter | 4th Quarter | Year | |||||||||||||||
Sales | $ | 1,398 | $ | 1,368 | $ | 1,389 | $ | 1,327 | $ | 5,482 | ||||||||||
Operating income | 109 | (a) | 106 | 109 | 43 | (b) | 367 | |||||||||||||
Earnings before income taxes and equity earnings | 38 | 88 | 89 | 21 | 236 | |||||||||||||||
Net earnings | 28 | 59 | 66 | 19 | 172 | |||||||||||||||
Basic net earnings per share | 0.76 | 1.62 | 1.85 | 0.54 | 4.78 | |||||||||||||||
Diluted net earnings per share | 0.76 | 1.61 | 1.84 | 0.54 | 4.76 | |||||||||||||||
2011 | 1st Quarter | 2nd Quarter | 3rd Quarter | 4th Quarter | Year | |||||||||||||||
Sales | $ | 1,423 | $ | 1,403 | $ | 1,417 | $ | 1,369 | $ | 5,612 | ||||||||||
Operating income | 211 | (c) | 95 | (c) | 187 | (c) | 99 | (d) | 592 | |||||||||||
Earnings before income taxes and equity earnings | 190 | 74 | 162 | 79 | 505 | |||||||||||||||
Net earnings | 133 | 54 | 117 | 61 | 365 | |||||||||||||||
Basic net earnings per share | 3.16 | 1.31 | 2.96 | 1.64 | 9.15 | |||||||||||||||
Diluted net earnings per share | 3.14 | 1.30 | 2.95 | 1.63 | 9.08 | |||||||||||||||
| (a) | The operating income for the first Quarter of |
| (b) | The operating income for the |
| (c) | The operating income for the |
| (d) | The operating income for the |
| ITEM 9. | CHANGES IN AND DISAGREEMENTS WITH ACCOUNTANTS ON ACCOUNTING AND FINANCIAL DISCLOSURE |
The Company has nothing to report under this item.
| ITEM 9A. | CONTROLS AND PROCEDURES |
Evaluation of Disclosure Controls and Procedures
We maintain disclosure controls and procedures that are designed to provide reasonable assurance that information required to be disclosed in our reports under the Securities and Exchange Act of 1934, as amended (“Exchange Act”), is recorded, processed, summarized and reported within the time periods specified in the SEC’s rules and forms, and that such information is accumulated and communicated to management, including our Chief Executive Officer and Chief Financial Officer, as appropriate, to allow timely decisions regarding required disclosure. As of December 31, 2010,2012, an evaluation was performed by members of management, at the direction and with the participation of our Chief Executive Officer and Chief Financial Officer, of the effectiveness of the design and operation of our disclosure controls and procedures (as defined in Rule 13a-15(e) or 15d-15(e) under the Exchange Act). Based upon this evaluation, our Chief Executive Officer and Chief Financial Officer concluded that, as of December 31, 2010,2012, our disclosure controls and procedures were effective.
Management’s Report on Internal Control over Financial Reporting
Management is responsible for establishing and maintaining adequate internal control over financial reporting for the Company. In order to evaluate the effectiveness of internal control over financial reporting, management has conducted an assessment, including testing, using the criteria established in Internal Control —IntegratedControl—Integrated Framework, issued by the Committee of Sponsoring Organizations of the Treadway Commission (COSO). The Company’s system of internal control over financial reporting is designed to provide reasonable assurance regarding the reliability of financial reporting and the preparation of financial statements for external purposes in accordance with generally accepted accounting principles. The Company’s internal control over financial reporting includes those policies and procedures that (i) pertain to the maintenance of records that, in reasonable detail, accurately and fairly reflect the transactions and dispositions of the assets of the Company; (ii) provide reasonable assurance that transactions are recorded as necessary to permit preparation of financial statements in accordance with generally accepted accounting principles, and that receipts and expenditures of the Company are being made only in accordance with authorizations of management and directors of the Company; and (iii) provide reasonable assurance regarding prevention or timely detection of unauthorized acquisition, use, or disposition of the Company’s assets that could have a material effect on the financial statements.
Because of its inherent limitations, internal control over financial reporting may not prevent or detect misstatements. Also, projections of any evaluation of effectiveness to future periods are subject to the risk that controls may become inadequate because of changes in conditions, or that the degree of compliance with the policies or procedures may deteriorate.
Based on its assessment, management has concluded that the Company maintained effective internal control over financial reporting as of December 31, 2010,2012, based on criteria established inInternal Control—Integrated Frameworkissued by the COSO.
The effectiveness of the Company’s internal control over financial reporting as of December 31, 20102012 has been audited by PricewaterhouseCoopers LLP, an independent registered public accounting firm, as stated in their report, which is included under Part II, Item 8, Financial Statements and Supplementary Data.
Change in Internal Control over Financial Reporting
There were no changes in our internal control over financial reporting that have materially affected or are reasonably likely to materially affect our internal control over financial reporting during the period covered by this report.
| ITEM 9B. | OTHER INFORMATION |
On February 22, 2011, the Human Resources Committee of the Board of Directors adopted amendmentsThe Company has nothing to the Severance Program for Management Committee Members (the “Severance Plan”) and the Omnibus Incentive Plan (the “Omnibus Plan” and together with the Severance Plan, the “Plans”).
The Severance Plan was amended to better align with current market practices in the event of a change in control transaction. The amended Severance Plan provides that, if in the three months prior to or 24 months following a change in control of the Corporation, a Severance Plan participant is involuntarily terminated by the Corporation without Cause (as defined in the Severance Plan) or the participant terminates employment due to Good Reason (as defined in the Severance Plan), the participant will be entitled to receive (1) severance in an amount equal to the sum of (A) 24 months of base salary and (B) two times the participant’s target bonus awardreport under the Domtar Corporation Annual Incentive Plan as of the date of the participant’s termination of employment and (2) a pro-rated bonus under the Domtar Corporation Annual Incentive Plan for the year in which the termination of employment occurs. In the absence of a change in control transaction, the Severance Plan provides that members of its Management Committee would be entitled to up to 24 months’ salary payable in a lump sum upon a termination of employment by the Corporation for reasons other than Cause (as defined in the Severance Plan). The participants would also be entitled to continued health benefits for the severance period, except if the participant’s benefits are subject to taxation in the United States, in which case the health insurance policies maintained by the Corporation will remain in effect until the earlier to occur of the last day of the severance period and the 18-month anniversary of the date of the participant’s separation from service. The participants will also be entitled to outplacement services.
The Omnibus Plan was amended to make certain technical changes to the plan, including (1) reflecting the adjustments to the Omnibus Plan’s share limitations to reflect the reverse stock split (at a split ratio of 1-for-12) of the Corporation’s common stock, effective June 10, 2009, in the plan document, (2) removing provisions that permitted reuse of shares delivered to pay the exercise price of options or to fund withholding taxes due on exercise under the Omnibus Plan share limit and (3) prohibiting dividend equivalents on unearned/unvested performance-based awards. The description of the other terms and conditions of the Omnibus Plan contained in the Corporation’s Schedule 14A filed with the Securities and Exchange Commission on April 4, 2008 under Item 7 is hereby incorporated by reference.
The foregoing descriptions of the Plans, as amended, are qualified in their entirety by reference to the Plans, copies of which are attached hereto as Exhibits 10.43 and 10.24 and are incorporated herein by reference.this item.
| ITEM 10. | DIRECTORS, EXECUTIVE OFFICERS AND CORPORATE GOVERNANCE |
The information included under the captions “Governance of the Corporation,” “Election of Directors” and “Section 16(a) Beneficial Ownership Reporting Compliance” in our Proxy Statement for the 20112013 Annual Meeting of Stockholders is incorporated herein by reference.
Information regarding our executive officers is presented in Part I, Item 1, Business, of this Form 10-K under the caption “Our Executive Officers.”
| ITEM 11. | EXECUTIVE COMPENSATION |
The information appearing under the caption “Compensation Discussion and Analysis,” “Executive Compensation” and “Director Compensation” in our Proxy Statement for the 20112013 Annual Meeting of Stockholders is incorporated herein by reference.
| ITEM 12. | SECURITY OWNERSHIP OF CERTAIN BENEFICIAL OWNERS AND MANAGEMENT AND RELATED STOCKHOLDER MATTERS |
The information appearing under the caption “Security Ownership of Certain Beneficial Owners, Directors and Officers” in our Proxy Statement for the 20112013 Annual Meeting of Stockholders is incorporated herein by reference.
The following table sets forth the number of shares of our stock reserved for issuance under our equity compensation plans as of December 31, 2012:
Plan Category | Number of securities to be issued upon exercise of outstanding options, warrants and rights (#) | Weighted average exercise price of outstanding options, warrants and rights ($) | Number of securities remaining available for future issuance under equity compensation plans (excluding securities reflected in column (a)(#) | |||||||||
| (a) | (b) | (c) | ||||||||||
Equity compensation plans approved by security holders | 538,719(1) | $81.56(2) | 1,422,214(3) | |||||||||
|
|
|
|
|
| |||||||
Equity compensation plans not approved by security holders | N/A | N/A | N/A | |||||||||
|
|
|
|
|
| |||||||
Total | 538,719 | $ | 81.56 | 1,422,214 | ||||||||
|
|
|
|
|
| |||||||
| (1) | Represents the number of shares associated with options, restricted stock units (“RSUs”), performance share units (“PSUs”), deferred share units (“DSUs”) and dividends equivalent units (“DEUs”) outstanding as of December 31, 2012. This number assumes that PSUs will vest at the “maximum” performance level, and that any performance requirements applicable to options will be satisfied. |
| (2) | Represents the weighted average exercise price of options disclosed in column (a). |
| (3) | Represents the number of shares remaining available for issuance in settlement of future awards under the Omnibus Incentive Plan. |
| ITEM 13. | CERTAIN RELATIONSHIPS AND RELATED TRANSACTIONS, AND DIRECTOR INDEPENDENCE |
The information appearing under the captions “Governance of the Corporation—Board Independence and Other Determinations” in our Proxy Statement for the 20112013 Annual Meeting of Stockholders is incorporated herein by reference.
| ITEM 14. | PRINCIPLE ACCOUNTANT FEES AND SERVICES |
The information appearing under the caption “Ratification of Appointment of Independent Registered Public Accounting Firm” and “Independent Registered Public Accounting Firm Fees” in our Proxy Statement for the 20112013 Annual Meeting of Stockholders is incorporated herein by reference.
| ITEM 15. | EXHIBITS AND FINANCIAL STATEMENT SCHEDULES |
| (a) | 1. Financial |
2. Schedule II – II—Valuation and Qualifying Accounts
All other schedules are omitted as the information required is either included elsewhere in the consolidated financial statements in Part II, Item 8 – 8—or is not applicable.
3. Exhibits:
Exhibit | Exhibit Description | |
| 3.1 | Amended and Restated Certificate of Incorporation (incorporated by reference to Exhibit 3.1 to the Company’s Quarterly Report on Form 10-Q filed with the SEC on August 8, 2008) | |
| 3.2 | Certificate of Amendment of the Amended and Restated Certificate of Incorporation (incorporated by reference to Exhibit 3.1 to the Company’s Current Report on Form 8-K filed with the SEC on June 8, 2009) | |
| 3.3 | Amended and Restated By-Laws (incorporated by reference to Exhibit 3.2 to the Company’s Annual Report on Form 10-K filed with the SEC on February 27, 2009) | |
| 4.1 | Form of Rights Agreement between the Company and Computershare Trust Company, N.A. (incorporated by reference to Exhibit 4.2 to the Company’s Registration Statement on Form 10, Amendment No. 2 filed with the SEC on January 26, 2007) | |
| 4.3 | Supplemental Indenture, dated February 15, 2008, among Domtar Corp., Domtar Paper Company, LLC, The Bank of New York, as Trustee, and the new subsidiary guarantors parties thereto, relating to Domtar Corp.’s (i) 7.125% Notes due 2015, (ii) 5.375% Notes due 2013, (iii) 7.875% Notes due 2011, (iv) 9.5% Notes due 2016 (incorporated by reference to Exhibit 4.1 to the Company’s Form 8-K filed with the SEC on February 21, 2008) | |
| 4.4 | Second Supplemental Indenture, dated February 20, 2008, among Domtar Corp., Domtar Paper Company, LLC, The Bank of New York, as Trustee, and the new subsidiary guarantor party thereto, relating to Domtar Corp.’s (i) 7.125% Notes due 2015, (ii) 5.375% Notes due 2013, (iii) 7.875% Notes due 2011, (iv) 9.5% Notes due 2016 (incorporated by reference to Exhibit 4.2 to the Company’s Form 8-K filed with the SEC on February 21, 2008) | |
| 4.5 | Third Supplement Indenture, dated June 9, 2009, among Domtar Corp., The Bank of New York Mellon, as Trustee, and the subsidiary guarantors party thereto, relating to Domtar Corp.’s 10.75% Senior Notes due 2017 (incorporated by reference to Exhibit 4.1 to the Company’s Current Report on Form 8-K filed with the SEC on June 9, 2009) | |
| 4.6 | Fourth Supplemental Indenture, dated June 23, 2011, among Domtar Corporation, Domtar Delaware Investments Inc., and Domtar Delaware Holdings, LLC and The Bank of New York Melon, as trustee, relating to the Company’s 7.125% Notes due 2015, 5.375% Notes due 2013, 9.5% Notes due 2016 and 10.75% Notes due 2017 (incorporated by reference to Exhibit 4.1 to the Company’s Form 10-Q filed with the SEC on August 4, 2011) | |
| 4.7 | Fifth Supplemental Indenture, dated September 7, 2011, among Domtar Corporation, Domtar Delaware Investments Inc. and Domtar Delaware Holdings, LLC, and The Bank of New York Melon, as trustee, relating to the Company’s 7.125% Notes due 2015, 5.375% Notes due 2013, 9.5% Notes due 2016 and 10.75% Notes due 2017 (incorporated by reference to Exhibit 4.1 to the Company’s Form 10-Q filed with the SEC on November 4, 2011) | |
Exhibit | Exhibit Description | |
| 9.1 | Form of Voting and Exchange Trust Agreement (incorporated by reference to Exhibit 9.1 to the Company’s Registration Statement on Form 10, Amendment No. 2 filed with the SEC on January 26, 2007) | |
| 10.1 | Form of Tax Sharing Agreement (incorporated by reference to Exhibit 10.1 to the Company’s Registration Statement on Form 10, Amendment No. 2 filed with the SEC on January 26, 2007) | |
| 10.2 | Form of Transition Services Agreement (incorporated by reference to Exhibit 10.2 to the Company’s Registration Statement on Form 10, Amendment No. 2 filed with the SEC on January 26, 2007) | |
| 10.3 | Form of | |
| Form of Fiber Supply Agreement (Princeton, British Columbia) (incorporated by reference to Exhibit 10.10 to the Company’s Registration Statement on Form 10, Amendment No. 2 filed with the SEC on January 26, 2007) | ||
| Form of Site Services Agreement (Utilities) (Plymouth, North Carolina) (incorporated by reference to Exhibit 10.17 to the Company’s Registration Statement on Form 10, Amendment No. 2 filed with the SEC on January 26, 2007) | ||
| OSB Supply Agreement (Hudson Bay, Saskatchewan) (incorporated by reference to Exhibit 10.24 to the Company’s Registration Statement on Form S-1 filed with the SEC on May 9, 2007) | ||
| Hog Fuel Supply Agreement (Kenora, Ontario) (incorporated by reference to Exhibit 10.25 to the Company’s Registration Statement on Form S-1 filed with the SEC on May 9, 2007) | ||
| Fiber Supply Agreement (Trout Lake and Wabigoon, Ontario) (incorporated by reference to Exhibit 10.26 to the Company’s Registration Statement on Form S-1 filed with the SEC on May 9, 2007) | ||
| Form of Intellectual Property License Agreement (incorporated by reference to Exhibit 10.18 to the Company’s Registration Statement on Form 10, Amendment No. 2 filed with the SEC on January 26, 2007) | ||
| Form of Indemnification Agreement (incorporated by reference to Exhibit 10.28 to the Company’s Registration Statement on Form S-1 filed with the SEC on May 9, 2007) | ||
| Domtar Corporation 2007 Omnibus Incentive Plan (incorporated by reference to Exhibit 10.24 to the Company’s Annual Report on Form 10-K filed with the SEC on February 25, 2011)* | ||
| Domtar Corporation 2004 Replacement Long-Term Incentive Plan for Former Employees of Weyerhaeuser Company (incorporated by reference to Exhibit 10.30 to the Company’s Registration Statement on Form S-1 filed with the SEC on May 9, 2007)* | ||
| Domtar Corporation 1998 Replacement Long-Term Incentive Compensation Plan for Former Employees of Weyerhaeuser Company (incorporated by reference to Exhibit 10.31 to the Company’s Registration Statement on Form S-1 filed with the SEC on May 9, 2007)* | ||
| Domtar Corporation Replacement Long-Term Incentive Compensation Plan for Former Employees of Weyerhaeuser Company (incorporated by reference to Exhibit 10.32 to the Company’s Registration Statement on Form S-1 filed with the SEC on May 9, 2007)* | ||
| Domtar Corporation Executive Stock Option and Share Purchase Plan (applicable to eligible employees of Domtar Inc. for grants prior to March 7, 2007) (incorporated by reference to Exhibit 10.33 to the Company’s Registration Statement on Form S-1 filed with the SEC on May 9, 2007)* | ||
Exhibit | Exhibit Description | |
| Domtar Corporation Executive Deferred Share Unit Plan (applicable to members of the Management Committee of Domtar Inc. prior to March 7, 2007) (incorporated by reference to Exhibit 10.29 to the Company’s Annual Report on Form 10-K filed with the SEC on February 27, 2009)* | ||
| Domtar Corporation Deferred Share Unit Plan for Outside Directors (for former directors of Domtar Inc.) (incorporated by reference to Exhibit 10.30 to the Company’s Annual Report on Form 10-K filed with the SEC on February 27, 2009)* | ||
| Supplementary Pension Plan for Senior Executives of Domtar Corporation (for certain designated senior executives) (incorporated by reference to Exhibit 10.36 to the Company’s Registration Statement on Form S-1 filed with the SEC on May 9, 2007)* | ||
| Supplementary Pension Plan for Designated Managers of Domtar Corporation (for certain designated management employees) (incorporated by reference to Exhibit 10.32 to the Company’s Annual Report on Form 10-K filed with the SEC on February 27, 2009)* | ||
| Domtar Retention Plan (incorporated by reference to Exhibit 10.38 to the Company’s Registration Statement on Form S-1 filed with the SEC on May 9, 2007)* | ||
| Domtar Corporation Restricted Stock Plan (applicable to eligible employees of Domtar Inc. for grants prior to March 7, 2007) (incorporated by reference to Exhibit 10.39 to the Company’s Registration Statement on Form S-1 filed with the SEC on May 9, 2007)* | ||
| Director Deferred Stock Unit Agreement (incorporated by reference to Exhibit 10.1 to the Company’s Current Report on Form 8-K filed with the SEC on May 24, 2007)* | ||
| Non-Qualified Stock Option Agreement (incorporated by reference to Exhibit 10.2 to the Company’s Current Report on Form 8-K filed with the SEC on May 24, 2007)* | ||
| Restricted Stock Unit Agreement (incorporated by reference to Exhibit 10.3 to the Company’s Current Report on Form 8-K filed with the SEC on May 24, 2007)* | ||
| Senior Executive Restricted Stock Unit Agreement (incorporated by reference to Exhibit 10.4 to the Company’s Current Report on Form 8-K filed with the SEC on May 24, 2007)* | ||
| Credit Agreement among the Company, Domtar, JPMorgan Chase Bank, N.A., as administrative agent, Morgan Stanley Senior Funding, Inc., as syndication agent, Bank of America, N.A., Royal Bank of Canada and The Bank of Nova Scotia, as co-documentation agents, and the lenders from time to time parties thereto | ||
| Indenture between Domtar Inc. and the Bank of New York dated as of July 31, 1996 relating to Domtar’s $125,000,000 9.5% debentures due 2016 (incorporated by reference to Exhibit 10.20 to the Company’s registration statement on Form 10, Amendment No. 2 filed with the SEC on January 26, 2007) | ||
| Employment Agreement of Mr. John D. Williams (incorporated by reference to Exhibit 10.1 to the Company’s Current Report on Form 8-K filed with the SEC on October 2, 2008)* | ||
| Employment Agreement of Mr. Marvin Cooper (incorporated by reference to Exhibit 10.2 to the Company’s Current Report on Form 8-K filed with the SEC on August 15, 2007)* | ||
| Severance Program for Management Committee Members (incorporated by reference to Exhibit 10.43 to the Company’s Annual Report on Form 10-K filed with the SEC on February 25, 2011)* | ||
| First Amendment, dated August 13, 2008, to Credit Agreement among the Company, Domtar, JPMorgan Chase Bank, N.A., as administrative agent, Morgan Stanley Senior Funding, Inc., as syndication agent, Bank of America, N.A., Royal Bank of Canada and The Bank of Nova Scotia, as co-documentation agents, and the lenders from time to time parties | ||
Exhibit | Exhibit Description | |
| DB SERP for Management Committee Members of Domtar (incorporated by reference to Exhibit 10.46 to the Company’s Annual Report on Form 10-K filed with the SEC on February 27, 2009)* | ||
| DC SERP for Designated Executives of Domtar (incorporated by reference to Exhibit 10.47 to the Company’s Annual Report on Form 10-K filed with the SEC on February 27, 2009)* | ||
| Supplementary Pension Plan for Steven Barker (incorporated by reference to Exhibit 10.48 to the Company’s Annual Report on Form 10-K filed with the SEC on February 27, 2009)* | ||
| Form of Indemnification Agreement for members of Pension Administration Committee of Domtar Corporation (incorporated by reference to Exhibit 10.50 to the Company’s Annual Report on Form 10-K | ||
| Consulting Agreement of Mr. Marvin Cooper* | ||
| Retirement Agreement of Mr. Steven A. Barker* | ||
| Retirement Agreement of Mr. Gilles Pharand* | ||
| Retirement Agreement of Mr. Michel Dagenais* | ||
| 10.40 | Credit Agreement among the Company, Domtar Paper Company, LLC, Domtar Inc., JPMorgan Chase Bank, N.A., as administrative agent, The Bank of Nova Scotia and Bank of America, N.A. as syndication agents, CIBC Inc., Goldman Sachs Lending Partners LLC and Royal Bank of Canada, as co-documentation agents and the lenders from time to time parties thereto (incorporated by reference to Exhibit 10.1 to the Company’s Form 10-Q filed with the SEC on August 4, 2011) | |
| 10.41 | Stock Purchase Agreement by and among Attends Healthcare Holdings, LLC, Attends Healthcare, Inc. and Domtar Corporation dated as of August 12, 2011 (incorporated by reference to Exhibit 2.1 to the Company’s Form 10-Q filed with the SEC on November 4, 2011) | |
| 10.42 | Sixth Supplemental Indenture, dated as of March 16, 2012, among Domtar Corporation, the subsidiary guarantors party thereto, and The Bank of New York Mellon (formerly known as The Bank of New York), as trustee, providing for Domtar Corporation’s 4.40% Notes due 2022 (incorporated by reference to Exhibit 4.1 to the Company’s Form 8-K filed with the SEC on March 16, 2012) | |
| 10.43 | Seventh Supplemental Indenture, dated May 21, 2012, among Domtar Corporation, EAM Corporation, and The Bank of New York Mellon, as trustee, relating to EAM Corporation’s guarantee of the obligations under the Indenture (incorporated by reference to Exhibit 4.8 to the Company’s Form S-3 filed with the SEC on August 20, 2012) | |
| 10.44 | Eighth Supplemental Indenture, dated as of August 23, 2012, among Domtar Corporation, the subsidiary guarantors party thereto, and The Bank of New York Mellon (formerly the Bank of New York), as trustee, providing for Domtar Corporation’s 6.25% Notes due 2042 (incorporated by reference to Exhibit 4.1 to the Company’s Form 8-K files with the SEC on August 23, 2012) | |
| 10.45 | Amended and Restated Credit Agreement, dated as of June 15, 2012, among the Company, Domtar Paper Company, LLC, Domtar Inc., Canadian Imperial Bank of Commerce, Goldman Sachs Lending Partners LLC and Royal Bank of Canada, as co-documentation agents, The Bank of Nova Scotia and Bank of America, N.A., as syndication agents and JPMorgan Chase Bank, N.A., as administrative agent (incorporated by reference to Exhibit 10.1 to the Company Form 10-Q files with the SEC on August 3, 2012) | |
Exhibit | Exhibit Description | |
| 10.46 | Amended and Restated Domtar Corporation 2007 Omnibus Incentive Plan (incorporated by reference to Annex A to the Corporation’s definitive proxy statement filed on Schedule 14A filed with the SEC on March 30, 2012) | |
| 10.47 | Domtar Corporation Annual Incentive Plan (incorporated by reference to Annex B to the Corporation’s definitive proxy statement filed on Schedule 14A filed with the SEC on March 30, 2012) | |
| 10.48 | Employment agreement of Mr. Michael Fagan* | |
| 12.1 | Computation of Ratio of Earnings to Fixed Charges | |
| 21.1 | Subsidiaries of Domtar Corporation | |
| 23 | Consent of Independent Registered Public Accounting Firm | |
| 24.1 | Powers of Attorney (included in signature page) | |
| 31.1 | Certification of the Chief Executive Officer Pursuant to Section 302 of the Sarbanes-Oxley Act of 2002 | |
| 31.2 | Certification of the Chief Financial Officer Pursuant to Section 302 of the Sarbanes-Oxley Act of 2002 | |
| 32.1 | Certification of the Chief Executive Officer Pursuant to Section 906 of the Sarbanes-Oxley Act of 2002 | |
| 32.2 | Certification of the Chief Financial Officer Pursuant to Section 906 of the Sarbanes-Oxley Act of 2002 | |
| 101.INS | XBRL Instance Document | |
| 101.SCH | XBRL Taxonomy Extension Schema | |
| 101.CAL | XBRL Taxonomy Extension Calculation Linkbase | |
| 101.DEF | XBRL Taxonomy Extension Definition Linkbase | |
| 101.LAB | XBRL Taxonomy Extension Label Linkbase | |
| 101.PRE | XBRL Extension Presentation Linkbase | |
* Indicates management contract or compensatory arrangement
FINANCIAL STATEMENT SCHEDULE
(IN MILLIONS OF DOLLARS, UNLESS OTHERWISE NOTED)
SCHEDULE II – VALUATION AND QUALIFYING ACCOUNTS
For the three years ended:
| Balance at beginning of year | Charged to income | (Deductions) from / Additions to reserve | Balance at end of year | Balance at beginning of year | Charged to income | Deductions from | Balance at end of year | |||||||||||||||||||||||||
| $ | $ | $ | $ | $ | $ | $ | $ | |||||||||||||||||||||||||
Allowances deducted from related asset accounts: | ||||||||||||||||||||||||||||||||
Doubtful accounts—Accounts receivable | ||||||||||||||||||||||||||||||||
2012 | 5 | 1 | (2 | ) | 4 | |||||||||||||||||||||||||||
2011 | 7 | 2 | (4 | ) | 5 | |||||||||||||||||||||||||||
2010 | 8 | 4 | (5 | ) | 7 | 8 | 4 | (5 | ) | 7 | ||||||||||||||||||||||
2009 | 11 | 4 | (7 | ) | 8 | |||||||||||||||||||||||||||
2008 | 9 | 6 | (4 | ) | 11 | |||||||||||||||||||||||||||
Pursuant to the requirements of Section 13 or 15(d) of the Securities Exchange Act of 1934, as amended, the registrant has duly caused this registration statementreport to be signed on its behalf by the undersigned, thereunto duly authorized in the City of Montreal, Quebec, Canada, on February 25, 2011.28, 2013.
| DOMTAR CORPORATION | ||
| by | /s/ John D. Williams | |
Name: | John D. Williams | |
Title: | President and Chief Executive Officer | |
We, the undersigned directors and officers of Domtar Corporation, hereby severally constitute Zygmunt Jablonski and Razvan L. Theodoru, and each of them singly, our true and lawful attorneys with full power to them and each of them to sign for us, in our names in the capacities indicated below, any and all amendments to this Annual Report on Form 10-K filed with the Securities and Exchange Commission.
Pursuant to the requirements of the Securities Exchange Act of 1934, as amended, this registration statementreport has been signed below by the following persons on behalf of the registrant and in the capacities and on the dates indicated.
Signature | Title | Date | ||
/s/ John D. Williams John D. Williams | President and Chief Executive Officer (Principal Executive Officer) and Director | February | ||
/s/ Daniel Buron Daniel Buron | Senior Vice-President and Chief Financial Officer (Principal Financial Officer and Principal Accounting Officer) | February | ||
/s/ Giannella Alvarez Giannella Alvarez | Director | February 28, 2013 | ||
/s/ Robert E. Apple Robert E. Apple | Director | February 28, 2013 | ||
/s/ Harold H. MacKay Harold H. MacKay | Director | February | ||
/s/ Jack C. Bingleman Jack C. Bingleman | Director | February | ||
/s/ Louis P. Gignac Louis P. Gignac | Director | February | ||
/s/ Brian M. Levitt Brian M. Levitt | Director | February | ||
/s/
| Director | February | ||
| ||||
Signature | Title | Date | ||
/s/ Robert J. Steacy Robert J. Steacy | Director | February | ||
| ||||
/s/ Pamela B. Strobel Pamela B. Strobel | Director | February | ||
| ||||
/s/ Denis Turcotte Denis Turcotte | Director | February | ||
162168