UNITED STATES
SECURITIES AND EXCHANGE COMMISSION
Washington, DCD.C. 20549
FORM 10-K
| x | ANNUAL REPORT PURSUANT TO SECTION 13 OR 15(d) OF THE SECURITIES EXCHANGE ACT OF 1934 |
For the fiscal year ended December 31, 20102012
OR
| ¨ | TRANSITION REPORT PURSUANT TO SECTION 13 OR 15(d) OF THE SECURITIES EXCHANGE ACT OF 1934 |
For the transition period from to
Commission file numberFile Number: 1-13087
BOSTON PROPERTIES, INC.
(Exact name of registrantRegistrant as specified in its charter)
| Delaware | 04-2473675 | |
(State or other jurisdiction of incorporation or organization) | (I.R.S. Employer Identification Number) | |
Prudential Center, 800 Boylston Street, Suite 1900 Boston, Massachusetts | 02199-8103 | |
| (Address of principal executive offices) | (Zip Code) | |
Registrant’s telephone number, including area code: (617) 236-3300
Securities registered pursuant to Section 12(b) of the Act:
Title of each class | Name of exchange on which registered | |
Common Stock, par value $.01 per share Preferred Stock Purchase Rights | New York Stock Exchange |
Securities registered pursuant to Section 12(g) of the Act: None
Indicate by check mark if the registrant is a well-known seasoned issuer, as defined in Rule 405 of the Securities Act. Yes x No ¨
Indicate by check mark if the registrant is not required to file reports pursuant to Section 13 or Section 15(d) of the Act. Yes ¨ No x
Indicate by check mark whether the registrant (1) has filed all reports required to be filed by Section 13 or 15(d) of the Securities Exchange Act of 1934 during the preceding 12 months (or for such shorter period that the registrant was required to file such reports), and (2) has been subject to such filing requirements for the past 90 days. Yes x No ¨
Indicate by check mark whether the registrant has submitted electronically and posted on its corporate Web site, if any, every Interactive Data File required to be submitted and posted pursuant to Rule 405 of Regulation S-T (§232.405 of this chapter) during the preceding 12 months (or for such shorter period that the registrant was required to submit and post such files). Yes x No ¨
Indicate by check mark if disclosure of delinquent filers pursuant to Item 405 of Regulation S-K is not contained herein, and will not be contained, to the best of registrant’s knowledge, in definitive proxy or information statements incorporated by reference in Part III of this Form 10-K or any amendment to this Form 10-K.x
Indicate by check mark whether the registrant is a large accelerated filer, an accelerated filer, a non-accelerated filer, or a smaller reporting company. See definitions of “large accelerated filer,” “accelerated filer” and “smaller reporting company” in Rule 12b-2 of the Exchange Act. (Check one):
Large accelerated filer x Accelerated filer ¨ Non-accelerated filer ¨ Smaller reporting company ¨
Indicate by check mark whether the registrant is a shell company (as defined in Rule 12b-2 of the Act). Yes ¨ No x
As of June 30, 2010,29, 2012, the aggregate market value of the 136,327,099149,019,383 shares of common stock held by non-affiliates of the Registrant was $9,725,575,243$16,149,230,581 based upon the last reported sale price of $71.34$108.37 per share on the New York Stock Exchange on June 30, 2010.29, 2012. (For this computation, the Registrant has excluded the market value of all shares of Common Stock reported as beneficially owned by executive officers and directors of the Registrant; such exclusion shall not be deemed to constitute an admission that any such person is an affiliate of the Registrant.)
As of February 18, 2011,21, 2013, there were 141,864,497151,639,342 shares of Common Stock outstanding.
Certain information contained in the Registrant’s Proxy Statement relating to its Annual Meeting of Stockholders to be held May 17, 201121, 2013 is incorporated by reference in Items 10, 11, 12, 13 and 14 of Part III. The Registrant intends to file such Proxy Statement with the Securities and Exchange Commission not later than 120 days after the end of its fiscal year ended December 31, 2010.
2012.
ITEM NO. | DESCRIPTION | PAGE NO. | DESCRIPTION | PAGE NO. | ||||||||
| 1 | 1 | |||||||||||
1. | 1 | |||||||||||
1 | 1 | |||||||||||
1A. | 18 | 16 | ||||||||||
1B. | 36 | 36 | ||||||||||
2. | 37 | 37 | ||||||||||
3. | 43 | 43 | ||||||||||
4. | 43 | 43 | ||||||||||
| 44 | 44 | |||||||||||
5. | 44 | 44 | ||||||||||
6. | 46 | 46 | ||||||||||
7. | MANAGEMENT’S DISCUSSION AND ANALYSIS OF FINANCIAL CONDITION AND RESULTS OF OPERATIONS | 48 | MANAGEMENT’S DISCUSSION AND ANALYSIS OF FINANCIAL CONDITION AND RESULTS OF OPERATIONS | 48 | ||||||||
7A. | 96 | 100 | ||||||||||
8. | 97 | 101 | ||||||||||
9. | CHANGES IN AND DISAGREEMENTS WITH ACCOUNTANTS ON ACCOUNTING AND FINANCIAL DISCLOSURE | 146 | CHANGES IN AND DISAGREEMENTS WITH ACCOUNTANTS ON ACCOUNTING AND FINANCIAL DISCLOSURE | 154 | ||||||||
9A. | 146 | 154 | ||||||||||
9B. | 146 | 154 | ||||||||||
| 147 | 155 | |||||||||||
10. | 147 | 155 | ||||||||||
11. | 147 | 155 | ||||||||||
12. | SECURITY OWNERSHIP OF CERTAIN BENEFICIAL OWNERS AND MANAGEMENT AND RELATED STOCKHOLDER MATTERS | 147 | SECURITY OWNERSHIP OF CERTAIN BENEFICIAL OWNERS AND MANAGEMENT AND RELATED STOCKHOLDER MATTERS | 155 | ||||||||
13. | CERTAIN RELATIONSHIPS AND RELATED TRANSACTIONS, AND DIRECTOR INDEPENDENCE | 148 | CERTAIN RELATIONSHIPS AND RELATED TRANSACTIONS, AND DIRECTOR INDEPENDENCE | 156 | ||||||||
14. | 148 | 156 | ||||||||||
| 149 | 157 | |||||||||||
15. | 149 | 157 | ||||||||||
| Item 1. | Business |
General
As used herein, the terms “we,” “us,” “our” and the “Company” refer to Boston Properties, Inc., a Delaware corporation organized in 1997, individually or together with its subsidiaries, including Boston Properties Limited Partnership, a Delaware limited partnership, and our predecessors. We are a fully integrated, self-administered and self-managed real estate investment trust, or “REIT,” and one of the largest owners and developers of office properties in the United States.
Our properties are concentrated in five markets—Boston, Washington, DC, midtown Manhattan,New York, Princeton, San Francisco and Princeton, NJ.Washington, DC. We conduct substantially all of our business through our subsidiary, Boston Properties Limited Partnership. At December 31, 2010,2012, we owned or had interests in 146157 properties, totaling approximately 39.944.4 million net rentable square feet, including fivenine properties under construction totaling approximately 2.02.8 million net rentable square feet. In addition, we had structured parking for approximately 40,66446,833 vehicles containing approximately 13.715.9 million square feet. Our properties consisted of:
140149 office properties including 121132 Class A office properties (including threeeight properties under construction) and 1917 Office/Technical properties;
one hotel;
threefour retail properties; and
twothree residential properties (both(one of which areis under construction).
We own or control undeveloped land totaling approximately 513.3509.3 acres, which could support approximately 12.812.5 million square feet of additional development. In addition, we have a noncontrolling interest in the Boston Properties Office Value-Added Fund, L.P., which we refer to as the “Value-Added Fund,” which is a strategic partnership with two institutional investors through which we have pursued the acquisition of assets within our existing markets that havehad deficiencies in property characteristics that provideprovided an opportunity to create value through repositioning, refurbishment or renovation. Our investments through the Value-Added Fund are not included in our portfolio information tables or any other portfolio level statistics. At December 31, 2010,2012, the Value-Added Fund had investments in an23 buildings comprised of two office property in Chelmsford, Massachusetts and complexes in Mountain View, California.
We consider Class A office properties to be centrally-located buildings that are professionally managed and maintained, attract high-quality tenants and command upper-tier rental rates, and that are modern structures or have been modernized to compete with newer buildings. We consider Office/Technical properties to be properties that support office, research and development, laboratory and other technical uses. Our definitions of Class A office and Office/Technical properties may be different than those used by other companies.
We are a full-service real estate company, with substantial in-house expertise and resources in acquisitions, development, financing, capital markets, construction management, property management, marketing, leasing, accounting, tax and legal services. As of December 31, 2010,2012, we had approximately 680730 employees. Our thirty-fourthirty-three senior officers have an average of twenty-sixtwenty-eight years experience in the real estate industry, including an average of sixteeneighteen years of experience with us. Our principal executive office and Boston regional office isare located at The Prudential Center, 800 Boylston Street, Suite 1900, Boston, Massachusetts 02199 and our telephone number is (617) 236-3300. In addition, we have regional offices at 505 9th Street, NW, Washington, DC 20004; 599 Lexington Avenue, New York, New York 10022; 302 Carnegie Center, Princeton, New Jersey 08540; Four Embarcadero Center, San Francisco, California 94111; and 302 Carnegie Center, Princeton, New Jersey 08540.2200 Pennsylvania Avenue NW, Washington, DC 20037.
Our Web site is located at http://www.bostonproperties.com. On our Web site, you can obtain a free copy of our annual report on Form 10-K, quarterly reports on Form 10-Q, current reports on Form 8-K, and amendments
to those reports filed or furnished pursuant to Section 13(a) or 15(d) of the Securities Exchange Act of 1934, as amended, as soon as reasonably practicable after we electronically file such material with, or furnish it to, the Securities and Exchange Commission, or the SEC. You may also obtain our reports by accessing the EDGAR database at the SEC’s website at http://www.sec.gov, or we will furnish an electronic or paper copy of these reports free of charge upon written request to: Investor Relations, Boston Properties, Inc., The Prudential Center, 800 Boylston Street, Suite 1900, Boston, Massachusetts 02199. The name “Boston Properties” and our logo (consisting of a stylized “b”) are registered service marks of Boston Properties Limited Partnership.
Boston Properties Limited Partnership
Boston Properties Limited Partnership, or BPLP or our Operating Partnership, is a Delaware limited partnership, and the entity through which we conduct substantially all of our business and own, either directly or through subsidiaries, substantially all of our assets. We are the sole general partner and, as of February 18, 2011,21, 2013, the owner of approximately 86.3%89.0% of the economic interests in BPLP. Economic interest was calculated as the number of common partnership units of BPLP owned by the Company as a percentage of the sum of (1) the actual aggregate number of outstanding common partnership units of BPLP, (2) the number of common partnership units issuable upon conversion of outstanding preferred partnership units of BPLP and (3) the number of common units issuable upon conversion of all outstanding long term incentive plan units of BPLP, or LTIP Units, other than LTIP Units issued in the form of 2011 Outperformance Awards (“2011 OPP Awards”) and 2013 Multi-Year Long-Term Incentive Plan Awards (“MYLTIP Awards”), assuming all conditions have been met for the conversion of the LTIP Units. Refer to Note 20 to the Consolidated Financial Statements. An LTIP Unit is generally the economic equivalent of a share of our restricted common stock, although LTIP Units issued in the form of 2011 OPP Awards or MYLTIP Awards are only entitled to receive one-tenth (1/10th) of the regular quarterly distributions (and no special distributions) prior to being earned. Our general and limited partnership interests in BPLP entitle us to share in cash distributions from, and in the profits and losses of, BPLP in proportion to our percentage interest and entitle us to vote on all matters requiring a vote of the limited partners. The other limited partners of BPLP are persons who contributed their direct or indirect interests in properties to BPLP in exchange for common units or preferred units of limited partnership interest in BPLP or recipients of LTIP Units pursuant to the Second Amendment and Restatement of our 1997 Stock Option and Incentive Plan (the “1997 Plan”).Plan. Under the limited partnership agreement of BPLP, unitholders may present their common units of BPLP for redemption at any time (subject to restrictions agreed upon at the time of issuance of the units that may restrict such right for a period of time, generally one year from issuance). Upon presentation of a unit for redemption, BPLP must redeem the unit for cash equal to the then value of a share of our common stock. In lieu of cash redemption by BPLP, however, we may elect to acquire any common units so tendered by issuing shares of our common stock in exchange for the common units. If we so elect, our common stock will be exchanged for common units on a one-for-one basis. This one-for-one exchange ratio is subject to specified adjustments to prevent dilution. We generally expect that we will elect to issue our common stock in connection with each such presentation for redemption rather than having BPLP pay cash. With each such exchange or redemption, our percentage ownership in BPLP will increase. In addition, whenever we issue shares of our common stock other than to acquire common units of BPLP, we must contribute any net proceeds we receive to BPLP and BPLP must issue to us an equivalent number of common units of BPLP. This structure is commonly referred to as an umbrella partnership REIT, or “UPREIT.”UPREIT.
Preferred units of BPLP have the rights, preferences and other privileges including the right to convert into common units of BPLP, as are set forth in an amendment to the limited partnership agreement of BPLP. As of December 31, 20102012 and February 18, 2011,21, 2013, BPLP had onetwo series of its preferred units outstanding.Preferred Units outstanding (i.e., Series Two Preferred Units and Series Four Preferred Units). The Series Two Preferred Units have a liquidation preference of $50.00 per unit (or an aggregate of approximately $55.7$49.8 million at December 31, 20102012 and February 18, 2011)21, 2013). The Series Two Preferred Units are convertible, at the holder’s election, into common units at a conversion price of $38.10 per common unit (equivalent to a ratio of 1.312336 common units per Series Two Preferred Unit). Distributions on the Series Two Preferred Units are payable quarterly and, unless the greater rate described in the next sentence applies, accrue at 6.0% per annum. If
distributions on the number of common units of limited partnership interest, or OP Units, into which the Series Two Preferred Units are convertible are greater than distributions calculated using the rate described in the preceding sentence for the applicable quarterly period, then the greater distributions are payable instead. The holders of Series Two Preferred Units have the right to require BPLP to redeem their units for cash at the redemption price of $50.00 per unit on May 12, 2011, May 14, 2012, May 14, 2013 and May 12, 2014. The maximum number of units that may be required to be redeemed from all holders on each of these dates is 1,007,662, which is one-sixth of the number of Series Two
Preferred Units that were originally issued. The holders also had the right to have their Series Two Preferred Units redeemed for cash as of May 12, 2009, and May 12, 2010, May 12, 2011 and May 14, 2012, although no holder exercised such right. On May 14, 2013 and May 12, 2014, BPLP also has the right, undersubject to certain conditions, and at certain times, to redeem Series Two Preferred Units for cash andor to convert into OP Units any Series Two Preferred Units that are not redeemed when they are eligible for redemption.
The Series Four Preferred Units have a liquidation preference of $50.00 per unit (or an aggregate of approximately $61.1 million at December 31, 2012 and February 21, 2013). The Series Four Preferred Units, which bear a preferred distribution equal to 2.00% per annum on a liquidation preference of $50.00 per unit, are not convertible into or exchangeable for any common equity of BPLP or us. We also have the right, subject to certain conditions, to redeem Series Four Preferred Units for cash at the redemption price of $50.00 per unit. Due to the holders’ redemption option existing outside the control of the Company, the Series Four Preferred Units are presented outside of permanent equity in our Consolidated Balance Sheets.
Transactions During 20102012
Acquisitions
On JulyMarch 1, 2010,2012, we acquired the mortgage loan collateralized by a land parcel zoned for residential use453 Ravendale Drive located in Reston, Virginia for approximately $20.3 million. In connection with the acquisition of the loan, we entered into a forbearance agreement pursuant to which we obtained the fee interest in the land by deed in lieu of foreclosure.
On September 24, 2010, we acquired fee title to 510 Madison Avenue in New York CityMountain View, California for a purchase price of approximately $287.0 million.$6.7 million in cash. 453 Ravendale Drive is an approximately 30,000 net rentable square foot Office/Technical property.
On March 13, 2012, we acquired 100 Federal Street in Boston, Massachusetts for an aggregate investment of approximately $615.0 million in cash. In connection with the acquisition,transaction, we also incurredentered into a long-term lease with an affiliate of Bank of America for approximately $1.5 million of acquisition costs that were expensed during the year ended December 31, 2010. Previously, on August 10, 2010, we had acquired the junior mezzanine loan that was secured by a pledge of a subordinate ownership interest in the property for a purchase price of approximately $22.5 million. 510 Madison Avenue732,000 square feet. 100 Federal Street is an approximately 347,0001,265,000 net rentable square foot, 37-story Class A office tower which is currently under development. In connection with the acquisition, we assumed the mortgage loan totaling approximately $202.6 million and, at closing, we caused the assignment of the mortgage to a new lender and subsequently increased the amount borrowed to $267.5 million. This amount is fully secured by cash deposits included within “Cash Heldlocated in Escrows” in our Consolidated Balance Sheets. The mortgage financing bears interest at a variable rate equal to LIBOR plus 0.30% per annum and matures on February 24, 2012.Boston, Massachusetts.
On September 27, 2010, we entered into an agreement to acquire Bay Colony Corporate Center in Waltham, Massachusetts. On February 1, 2011,October 4, 2012, we completed the acquisition forformation of a joint venture which owns and operates Fountain Square located in Reston, Virginia, adjacent to our other Reston properties. Fountain Square is an aggregate purchase priceoffice and retail complex aggregating approximately 758,000 net rentable square feet, comprised of approximately $185.0 million.521,000 net rentable square feet of Class A office space and approximately 237,000 net rentable square feet of retail space. The purchase price consisted ofjoint venture partner contributed the property valued at approximately $41.1$385.0 million ofand related mortgage indebtedness totaling approximately $211.3 million for a 50% interest in the joint venture. We contributed cash andtotaling approximately $87.0 million for our 50% interest, which cash was distributed to the assumption of approximately $143.9 million of indebtedness.joint venture partner. We are consolidating this joint venture. The assumed debt is a securitized senior mortgage loan that bears interest at a fixed rate of 6.53%5.71% per annum and matures on JuneOctober 11, 2012. The loan requires interest-only payments with a balloon payment due at maturity. Bay Colony Corporate Center is an approximately 1,000,000 net rentable square foot, four-building Class A office park situated2016. Pursuant to the joint venture agreement (i) we have rights to acquire the partner’s 50% interest and (ii) the partner has the right to cause us to acquire the partner’s interest on a 58-acre siteJanuary 4, 2016, in Waltham, Massachusetts.
On December 29, 2010, we completed the acquisition of the John Hancock Tower and Garage in Boston, Massachusetts for an aggregate purchase price of approximately $930.0 million. The purchase price consisted of approximately $289.5 million of cash and the assumption of approximately $640.5 million of indebtedness. The assumed debt is a securitized senior mortgage loan that bears interesteach case at a fixed rate of 5.68% per annum and maturesprice totaling approximately $102.0 million in cash. The fixed price option rights expire on January 6, 2017. The loan requires interest-only payments with a balloon payment due at maturity. In connection with the acquisition, we incurred an aggregate of approximately $0.9 million of acquisition costs that were expensed during the year ended December 31, 2010. The John Hancock Tower is an iconic 62-story, approximately 1,700,000 rentable square foot office tower located in the heart of Boston’s Back Bay neighborhood. The garage is an eight-level, 2,013 space parking facility. The seller has agreed to (1) fund the cost of and complete certain capital projects and (2) fund the cost of certain tenant improvements, both of which are currently underway, totaling approximately $46.0 million. Refer to Note 3 to the Consolidated Financial Statements.
Dispositions
On April 14, 2008,May 17, 2012, we sold a parcelcompleted the sale of landour Bedford Business Park properties located in Washington, DCBedford, Massachusetts for approximately $33.7$62.8 million in cash. Net cash proceeds totaled approximately $62.0 million, resulting in a gain on sale of approximately $36.9 million. We had previously entered into a development management agreement with the buyer to develop aBedford Business Park is comprised of two Office/Technical buildings and one Class A office property on the parcel totalingbuilding aggregating approximately 165,000470,000 net rentable square feet.
The servicer of the non-recourse mortgage loan on our Montvale Center property located in Gaithersburg, Maryland foreclosed on the property on January 31, 2012. As a result of the foreclosure, we recognized a gain on forgiveness of debt during the first quarter of 2012 totaling approximately $15.8 million, net of noncontrolling interests’ share of approximately $2.0 million. Due to a procedural error by the trustee, the foreclosure sale was subsequently dismissed by the applicable court prior to ratification. As a result, we have revised our involvement infinancial statements to properly reflect the construction of the project,property and related mortgage debt on our Consolidated Balance Sheet at December 31, 2012 and have reversed the gain on sale was deferredforgiveness of debt and has been recognized over the project construction period generally based onoperating activity from the percentageproperty within our consolidated statement of total project costs incurred to estimated total project costs. Duringoperations for the year ended December 31, 2010,2012. A subsequent foreclosure sale occurred on December 21, 2012 and ratification by the applicable court is pending. Once ratified, we completed construction of the project and recognized the remainingwill recognize a gain on sale totaling approximately $1.8 million. Weforgiveness of debt. These events have recognized a cumulative gainno impact on sale of approximately $23.4 million.
On May 5, 2010, we satisfied the requirements of our master lease agreement related to the 2006 sale of 280 Park Avenue in New York City, resulting in the recognition of the remaining deferred gain on sale of real estate totaling approximately $1.0 million. Following the satisfaction of the master lease agreement, the buyer terminated the property management and leasing agreement entered into at the time of the sale, resulting in the recognition of non-cash deferred management fees totaling approximately $12.2 million.cash flows.
Developments
On February 6, 2009, we announced that we were suspending construction on our 1,000,000 square foot project at 250 West 55th Street in New York City. During the year ended December 31, 2009, we recognized costs aggregating approximately $27.8 million related to the suspension of development, which amount included a $20.0 million contractual amount due pursuant to a lease agreement. During December 2009, we completed the construction of foundations and steel/deck to grade to facilitate a restart of construction in the future and as a result ceased interest capitalization on the project. On January 19, 2010, we paid $12.8 million related to the termination of the lease agreement. As a result, we recognized approximately $7.2 million of income during the year ended December 31, 2010.
On June 1, 2010, we placed in-service Weston Corporate Center, an approximately 356,000 net rentable square foot Class A office property located in Weston, Massachusetts. The property is 100% leased.
On October 20, 2010, we closed a transaction with a financial institution (the “HTC Investor”) related to the historic rehabilitation of the residential component of our Atlantic Wharf development in Boston, Massachusetts (the “residential project”). The residential project is expected to result in the development of approximately 86 units of residential rental apartments and approximately 10,000 square feet of retail space. Because, as a REIT, we may not take full advantage of available historic tax credits, we admitted the HTC Investor as a partner in the residential project. The HTC Investor has agreed to contribute an aggregate of approximately $14 million to the project in three installments in 2010 and 2011, subject to our achievement of certain conditions that include construction milestones and our compliance with the federal rehabilitation regulations. In exchange for its contribution, the HTC Investor will receive substantially all of the benefits derived from the tax credits.
As of December 31, 2010,2012, we had fivenine projects under construction comprised of threeeight office properties and twoone residential properties,property, which aggregate approximately 2.02.8 million square feet. We estimate the total investment to complete these projects, in the aggregate, to beis approximately $1.4$1.8 billion of which we had already invested approximately $1.1 billion as of December 31, 2010.2012. The investment through December 31, 20102012 and estimated total investment for our properties under construction as of December 31, 20102012 are detailed below (in thousands):
Construction Properties | Estimated Stabilization Date | Location | Investment to Date(1) | Estimated Total Investment(1) | ||||||||||||
Office | ||||||||||||||||
Atlantic Wharf | First Quarter, 2012 | Boston, MA | $ | 503,799 | $ | 552,900 | ||||||||||
2200 Pennsylvania Avenue | Second Quarter, 2012 | Washington, DC | 137,291 | 230,000 | ||||||||||||
510 Madison Avenue | Fourth Quarter, 2012 | New York, NY | 319,071 | 375,000 | ||||||||||||
Total Office Properties under Construction | $ | 960,161 | $ | 1,157,900 | ||||||||||||
Residential | ||||||||||||||||
Atlantic Wharf – Residential (86 units) | Second Quarter, 2012 | Boston, MA | $ | 35,495 | $ | 47,100 | ||||||||||
Atlantic Wharf – Retail(2) | ||||||||||||||||
2221 I Street, NW—Residential (335 units) | Third Quarter, 2012 | Washington, DC | 81,874 | 150,000 | ||||||||||||
2221 Street, NW—Retail | ||||||||||||||||
Total Residential Properties under Construction | $ | 117,369 | $ | 197,100 | ||||||||||||
Total Properties under Construction | $ | 1,077,530 | $ | 1,355,000 | ||||||||||||
Construction Properties | Estimated Stabilization Date | Location | Investment to Date(1) | Estimated Total Investment(1) | ||||||||
Office | ||||||||||||
Annapolis Junction Building Six (50% ownership) | Third Quarter, 2013 | Annapolis, MD | $ | 11,167 | $ | 14,000 | ||||||
500 North Capitol (30% ownership) | Fourth Quarter, 2013 | Washington, DC | 30,033 | 36,540 | ||||||||
Two Patriots Park (formerly12300 Sunrise Valley Drive) | Second Quarter, 2013 | Reston, VA | 52,558 | 64,000 | ||||||||
Seventeen Cambridge Center | Third Quarter, 2013 | Cambridge, MA | 59,102 | 86,300 | ||||||||
Cambridge Center Connector | Third Quarter, 2013 | Cambridge, MA | 6,892 | 24,600 | ||||||||
Annapolis Junction Building Seven (50% ownership) | Fourth Quarter, 2014 | Annapolis, MD | 3,995 | 16,050 | ||||||||
680 Folsom Street | Third Quarter, 2015 | San Francisco, CA | 185,848 | 340,000 | ||||||||
250 West 55th Street | Fourth Quarter, 2015 | New York, NY | 730,812 | 1,050,000 | ||||||||
|
|
|
| |||||||||
Total Office Properties under Construction | $ | 1,080,407 | $ | 1,631,490 | ||||||||
|
|
|
| |||||||||
Residential | ||||||||||||
The Avant at Reston Town Center (359 units) | Fourth Quarter, 2015 | Reston, VA | $ | 67,620 | $ | 137,250 | ||||||
|
|
|
| |||||||||
Total Properties under Construction | $ | 1,148,027 | $ | 1,768,740 | ||||||||
|
|
|
| |||||||||
| (1) | Represents our share. Includes net revenue during lease up period and approximately |
On January 3, 2012, we commenced the redevelopment of Two Patriots Park, a Class A office project with approximately 256,000 net rentable square feet located in Reston, Virginia. We will capitalize incremental costs during the redevelopment.
On April 30, 2012, we completed and fully placed in-service 510 Madison Avenue, a Class A office project with approximately 356,000 net rentable square feet located in New York City. As of December 31, 2012, the total investment was approximately $370.7 million with an estimated total investment upon completion of approximately $375.0 million.
On May 4, 2012, we completed and fully placed in-service One Patriots Park, a Class A office redevelopment project with approximately 268,000 net rentable square feet located in Reston, Virginia. As of December 31, 2012, the total investment was approximately $60.5 million with an estimated total investment upon completion of approximately $67.0 million.
On August 29, 2012, we acquired the development project located at 680 Folsom Street and 50 Hawthorne Street (which we refer to herein collectively as 680 Folsom Street) in San Francisco, California. When completed, the project will comprise approximately 522,000 net rentable square feet of Class A office and retail space. The project is approximately 85% pre-leased and as a result we have accounted for the acquisition as a business combination. The estimated project cost upon completion is approximately $340 million with initial occupancy expected in the first quarter of 2014. As part of the transaction, we also acquired the corner site of 690 Folsom Street, which is an adjacent parcel with a vacant 22,000 square foot, two-story structure that may be redeveloped in the future. The consideration paid by us to the seller consisted of approximately $62.2 million in cash and the issuance of 1,588,100 Series Four Preferred Units of limited partnership interest in our Operating Partnership. The Series Four Preferred Units are not convertible into or exchangeable for any common equity of our Operating Partnership or us, have a per unit liquidation preference of $50.00 and are entitled to receive quarterly distributions of $0.25 per unit (or an annual rate of 2.0%). In connection with the acquisition, we assumed a $170.0 million construction loan commitment and subsequently terminated the loan without ever drawing any amounts thereunder.
On December 14, 2012, we signed a 20-year lease with a law firm for approximately 246,000 net rentable square feet at 250 West 55thStreet. 250 West 55thStreet is an approximately 989,000 net rentable square foot office building under construction in midtown Manhattan. The development property is currently approximately 46% pre-leased with the remaining available office space in the upper portion of the tower.
On December 21, 2012, we signed a 20-year lease with a law firm for approximately 376,000 net rentable square feet at 601 Massachusetts Avenue, our planned approximately 478,000 net rentable square foot development project located in Washington, DC. Construction of the project, which is currently 100% leased and included in our in-service portfolio, is scheduled to commence in the second quarter of 2013, and building completion is expected to occur in the fourth quarter of 2015. The development property is currently approximately 79% pre-leased.
Secured Debt Transactions
On June 15, 2010,March 12, 2012, we used available cash to repay the mortgage loan collateralized by our Eight CambridgeBay Colony Corporate Center property located in Cambridge,Waltham, Massachusetts totaling approximately $22.6$143.9 million. The mortgage loanfinancing bore interest at a fixed rate of 7.73%6.53% per annum and was scheduled to mature on July 15, 2010.June 11, 2012. There was no prepayment penalty. We recognized a gain on early extinguishment of debt totaling approximately $0.9 million related to the acceleration of the remaining balance of the historical fair value adjustment, which was the result of purchase accounting.
On July 1, 2010, we used available cash to repay the mortgage loans collateralized by our 202, 206 & 214 Carnegie Center properties located in Princeton, New Jersey totaling approximately $55.8 million. The mortgage loans bore interest at a fixed rate of 8.13% per annum and were scheduled to mature on October 1, 2010. There were no prepayment penalties.
On August 1, 2010, we modified the mortgage loan collateralized by our Reservoir Place property located in Waltham, Massachusetts. The mortgage loan totaling $50.0 million bore interest at a variable rate equal to LIBOR plus 3.85% per annum and matures on July 30, 2014. The modification reduced the interest rate to a variable rate equal to Eurodollar plus 2.20% per annum. All other terms of the mortgage loan remain unchanged.
On September 24, 2010, in connection with the acquisition of 510 Madison Avenue in New York City, we assumed the mortgage loan totaling approximately $202.6 million and at closing caused the assignment of the mortgage to a new lender and subsequently increased the amount borrowed to $267.5 million. This amount is
fully secured by cash deposits included within “Cash Held in Escrows” in our Consolidated Balance Sheets. The mortgage financing bears interest at a variable rate equal to LIBOR plus 0.30% per annum and matures on February 24, 2012.
On October 1, 2010, we modified our construction loan facility collateralized by our Atlantic Wharf development project in Boston, Massachusetts. The construction loan facility bears interest at a variable rate equal to LIBOR plus 3.00% per annum and matures on April 21,2, 2012, with two, one-year extension options, subject to certain conditions. The modification consisted of releasing from collateral the residential component and ground floor retail included in the “Russia Building” and reducing the loan commitment from $215.0 million to $192.5 million. All other terms of the mortgage loan remain unchanged. We have not drawn any amounts under the facility.
On October 20, 2010, we used available cash to repay the mortgage loan collateralized by our South of MarketOne Freedom Square property located in Reston, Virginia totaling approximately $188.0$65.1 million. The mortgage financing bore interest at a fixed rate of 7.75% per annum and was scheduled to mature on June 30, 2012. There was no prepayment penalty. We recognized a gain on early extinguishment of debt totaling approximately $0.3 million related to the acceleration of the remaining balance of the historical fair value debt adjustment, which was the result of purchase accounting.
On August 29, 2012, in connection with our acquisition of the development project located at 680 Folsom Street in San Francisco, California, we assumed the construction loan commitment collateralized by the project (Refer to Note 3 of the Consolidated Financial Statements). The assumed construction loan commitment totaling $170.0 million bore interest at a variable rate equal to LIBOR plus 1.00%3.70% per annum and was scheduled to
mature on November 21, 2010. There was no prepayment penalty.May 30, 2015 with two, one-year extension options, subject to certain conditions. In addition, we assumed an interest rate derivative which capped the one-month LIBOR index rate at a maximum of 3.00% per annum on a notional amount up to $170.0 million and with an expiration date of May 30, 2015. On December 18, 2012, we terminated the construction loan commitment. On January 8, 2013, we terminated the interest rate derivative. We had not drawn any amounts under the facility.
On October 20, 2010,September 4, 2012, we used available cash to repay the mortgage loan collateralized by our Democracy TowerSumner Square property located in Reston, VirginiaWashington, DC totaling approximately $59.8$23.2 million. The mortgage loanfinancing bore interest at a variablefixed rate equal to LIBOR plus 1.75%of 7.35% per annum and was scheduled to mature on December 19, 2010. There was no prepayment penalty.
On NovemberSeptember 1, 2010, we used available cash to repay the mortgage loan collateralized by our 10 & 20 Burlington Mall Road property located in Burlington, Massachusetts and 91 Hartwell Avenue property located in Lexington, Massachusetts2013. We recognized a loss on early extinguishment of debt totaling approximately $32.8 million. The mortgage loan bore interest at a fixed rate of 7.25% per annum and was scheduled to mature on October 1, 2011. We paid$0.3 million, which included a prepayment penalty totaling approximately $0.3$0.2 million associated with the early repayment.
On November 1, 2010, we used available cash to repay the mortgage loan collateralized by our 1330 Connecticut Avenue property located in Washington, DC totaling approximately $45.0 million. The mortgage loan bore interest at a fixed rate of 7.58% per annum and was scheduled to mature on February 26, 2011. There was no prepayment penalty.
On December 23, 2010, we used available cash to repay the mortgage loan collateralized by our Wisconsin Place Office property totaling approximately $97.2 million. The mortgage loan bore interest at a variable rate equal to LIBOR plus 1.10% per annum and was scheduled to mature on January 29, 2011. There was no prepayment penalty.
On December 29, 2010,October 4, 2012, in connection with our acquisitionthe formation of a consolidated joint venture which owns and operates Fountain Square located in Reston, Virginia, the John Hancock Tower and Garage in Boston, Massachusetts, wejoint venture assumed the mortgage loan collateralized by the property totaling approximately $640.5 million.$211.3 million (Refer to Note 3 of the Consolidated Financial Statements). The assumed debt is a securitized senior mortgage loan that requires interest-only payments with a balloon payment due at maturity. Pursuant to the provisions of Accounting Standards Codification (“ASC”) 805, the assumed mortgage loan, which bears contractual interest at a fixed rate of 5.68%5.71% per annum and matures on January 6, 2017,October 11, 2016, was recorded at its fair value of approximately $663.4$234.4 million using an effective interest rate of 5.00%2.56% per annum. We have a 50% interest in the consolidated joint venture.
Unsecured Senior Notes
On April 19, 2010,June 11, 2012, our Operating Partnership completed a public offering of $700.0 million$1.0 billion in aggregate principal amount of its 5.625%3.850% senior unsecured notes due 2020.2023. The notes were priced at 99.891%99.779% of the principal amount to yield 5.708%an effective rate (including financing fees) of 3.954% to maturity. The notes will mature on February 1, 2023, unless earlier redeemed. The aggregate net proceeds tofrom the offering were approximately $989.4 million after deducting underwriting discounts and transaction expenses.
On August 24, 2012, our Operating Partnership after deducting underwriter discounts and offering expenses, were approximately $693.5 million. The notes mature on November 15, 2020, unless earlier redeemed. On April 7, 2010, in connection withused available cash to redeem the offering, we entered into
two treasury lock agreements to fix the 10-year U.S. Treasury rate (which was used as a reference security in pricing) at 3.873% per annum on notional amounts aggregating $350.0 million. We subsequently cash-settled the treasury lock agreements and received approximately $0.4 million, which amount will be recognized as a reduction to our interest expense over the term of the notes.
On November 18, 2010, our Operating Partnership completed a public offering of $850.0 million in aggregate principal amount of its 4.125% senior notes due 2021. The notes were priced at 99.26% of the principal amount to yield 4.289% to maturity. The aggregate net proceeds to our Operating Partnership, after deducting underwriter discounts and offering expenses, were approximately $836.9 million. The notes mature on May 15, 2021, unless earlier redeemed.
On December 12, 2010, our Operating Partnership completed the redemption of $700.0remaining $225.0 million in aggregate principal amount of its 6.25% senior notes due 2013. The redemption price was determined in accordance with the applicable indenture and wastotaled approximately $793.1$231.6 million. The redemption price included approximately $17.9$1.5 million of accrued and unpaid interest to, but not including, the redemption date. Excluding such accrued and unpaid interest, the redemption price was approximately 110.75%102.25% of the principal amount being redeemed. In addition,We recognized a loss on November 29, 2010, we entered into two treasury lock agreements to fix the yield on the U.S. Treasury issue used in determining the redemption price on notional amounts aggregating $700.0 million. On December 9, 2010, we cash-settled the treasury lock agreements and paidearly extinguishment of debt totaling approximately $2.1 million. As a result of$5.2 million, which amount included the payment of the redemption premium the settlement of the treasury locks and the write-off of deferred financing costs, we recognized an aggregate loss on early extinguishment of debt oftotaling approximately $79.3$5.1 million. Following the partial redemption, there is an aggregate of $225.0 million of these notes outstanding.
Unsecured Exchangeable Senior Notes
DuringOn January 10, 2012, we announced that holders of the year ended December 31, 2010,2.875% Exchangeable Senior Notes due 2037 (the “Notes”) issued by our Operating Partnership had the right to surrender their Notes for purchase by our Operating Partnership (the “Put Right”) on February 15, 2012. The opportunity to exercise the Put Right expired on February 8, 2012. On January 10, 2012, we also announced that our Operating Partnership issued a notice of redemption to the holders of the Notes to redeem, on February 20, 2012 (the “Redemption Date”), all of the Notes outstanding on the Redemption Date. In connection with the redemption, holders of the Notes had the right to exchange their Notes on or prior to February 16, 2012. Notes with respect to which the Put Right was not exercised (or with respect to which the Put Right was exercised and subsequently withdrawn prior to the withdrawal deadline) and that were not surrendered for exchange on or prior to February 16, 2012, were redeemed by our Operating Partnership on the Redemption Date at a redemption price equal to 100% of the principal amount of the Notes plus accrued and unpaid interest thereon to, but excluding, the Redemption Date. Holders of an aggregate of $242,735,000 of the Notes exercised the Put Right and our Operating Partnership repurchased approximately $236.3 million aggregatesuch Notes on February 15, 2012. On February 20, 2012, our Operating Partnership redeemed the remaining $333,459,000 of outstanding Notes at a redemption price equal to 100% of the principal amount of its 2.875% exchangeable senior notes due 2037, which the holders may require our Operating Partnership to repurchase in February 2012, for approximately $236.6 million. The repurchased notes had an aggregate allocated liabilityNotes plus accrued and equity value of approximately $225.7 million and $0.4 million, respectively, at the time of repurchase resulting in the recognition of a loss on early extinguishment of debt of approximately $10.5 million during the year ended December 31, 2010. There remains an aggregate of approximately $626.2 million of these notes outstanding.unpaid interest thereon.
Unsecured Line of Credit
Effective as of August 3, 2010, the maturity date under our Operating Partnership’s $1.0 billion unsecured line of credit was extended to August 3, 2011. All other terms of the unsecured line of credit remain unchanged.
Equity Transactions
On June 2, 2011, we established a new “at the market” (“ATM”) stock offering program through which we may sell from time to time up to an aggregate of $600.0 million of our common stock through sales agents over a three-year period. During the year ended December 31, 2012, we issued an aggregate of 2,347,500 shares of common stock under this ATM stock offering program for gross proceeds of approximately $249.8 million and net proceeds of approximately $247.0 million. As of December 31, 2012, approximately $305.3 million remained available for issuance under this ATM program.
During the year ended December 31, 2010,2012, we acquired an aggregate of 591,9001,110,660 common units of limited partnership interest, including 99,139544,729 common units issued upon the conversion of LTIP units and 153,604 issued upon the conversion of Series Two preferred units, presented by the holders for redemption, in exchange for an equal number of shares of common stock. During the year ended December 31, 2010,2012, we issued 638,95722,823 shares of common stock as a result of stock options being exercised.
Noncontrolling interests in property partnerships
On December 23, 2010, we acquired the outside member’s 33.3% equity interest in our consolidated joint venture entity that owns the Wisconsin Place Office property located in Chevy Chase, Maryland for cash of approximately $25.5 million. The acquisition was accounted for as an equity transaction. The difference between the purchase price and the carrying value of the outside member’s equity interest, totaling approximately $19.1 million, reduced additional paid-in capital in our Consolidated Balance Sheets.
Investments in Unconsolidated Joint Ventures
On March 1, 2010, a joint venture in which we have a 60% interest refinanced at maturity its mortgage loan collateralized by 125 West 55th Street located in New York City. The mortgage loan totaling $200.0 million bore interest at a fixed rate of 5.75% per annum. The new mortgage loan totaling $207.0 million bears interest at a fixed rate of 6.09% per annum and was scheduled to mature on March 10, 2015. On July 23, 2010, the joint venture modified the mortgage loan by extending the maturity date of the loan to March 10, 2020. All other terms of the mortgage loan remain unchanged. In connection with the new mortgage loan, we have guaranteed the joint venture’s obligation to fund an escrow related to certain lease rollover costs in lieu of an initial cash deposit for the full amount. The maximum funding obligation under the guarantee was $21.3 million. At closing, the joint venture funded a $10.0 million cash deposit into the escrow account and the remaining $11.3 million will be further reduced with scheduled monthly deposits into the escrow account from operating cash flows. As of December 31, 2010, the maximum funding obligation under the guarantee was approximately $7.2 million. We earn a fee from the joint venture for providing the guarantee and have an agreement with the outside partners to reimburse the joint venture for their share of any payments made under the guarantee. In addition, on February 25, 2010, the joint venture repaid outstanding mezzanine loans totaling $63.5 million utilizing available cash and cash contributions from the joint venture’s partners on a pro rata basis. The mezzanine loans bore interest at a weighted-average fixed rate of approximately 7.81% per annum and were scheduled to mature on March 1, 2010.
On April 1, 2010, we acquired a 30% interest in a joint venture entity that owns 500 North Capitol Street, NW located in Washington, DC. 500 North Capitol Street is an approximately 176,000 net rentable square foot office property that is fully-leased to a single tenant through March 25, 2011. The joint venture currently intends to remove the property from service and redevelop the property following the lease expiration. On April 1, 2010, the joint venture entity refinanced at maturity the mortgage loan collateralized by the property totaling approximately $26.8 million. The new mortgage loan totaling $22.0 million bears interest at a variable rate equal to the greater of (1) the prime rate, as defined in the loan agreement, or (2) 5.75% per annum. The loan currently bears interest at 5.75% per annum and matures on March 31, 2013. Our investment in the joint venture totaling approximately $1.9 million was financed with cash contributions to the venture totaling approximately $1.4 million and the issuance to the seller of 5,906 OP Units.
On April 9, 2010, a joint venture in which we have a 60% interest refinanced its mortgage loan collateralized by Two Grand Central Tower located in New York City. The previous mortgage loan totaling $190.0 million bore interest at a fixed rate of 5.10% per annum and was scheduled to mature on July 11, 2010. The new mortgage loan totaling $180.0 million bears interest at a fixed rate of 6.00% per annum and matures on April 10, 2015. In connection with the refinancing, the joint venture repaid $10.0 million of the previous mortgage loan utilizing cash contributions from the joint venture’s partners on a pro rata basis.
On April 16, 2010, a joint venture in which we have a 51% interest refinanced its mortgage loan collateralized by Metropolitan Square located in Washington, DC. The previous mortgage loan totaling approximately $123.6 million bore interest at a fixed rate of 8.23% per annum and was scheduled to mature on May 1, 2010. The new mortgage loan totaling $175.0 million bears interest at a fixed rate of 5.75% per annum and matures on May 5, 2020. On April 26, 2010, the joint venture distributed excess loan proceeds to the partners totaling approximately $49.0 million, of which our share was approximately $25.0 million.
On June 15, 2010,2012, a joint venture in which we have a 50% interest repaidpartially placed in-service Annapolis Junction Building Six, a Class A office property with approximately 120,000 net rentable square feet located in Annapolis, Maryland.
On September 27, 2012, our Value-Added Fund completed the sale of its 300 Billerica Road property located in Chelmsford, Massachusetts for approximately $12.2 million, including the assumption by the buyer of $7.5 million of mortgage loan collateralized by land parcels at its site at Eighth Avenue and 46th Street in New York City utilizingindebtedness. 300 Billerica Road is an approximately 111,000 net rentable square foot office building. Net cash contributionsproceeds totaled approximately $4.3 million, of which our share was approximately $2.8 million, after the payment of transaction costs. Our share of the net proceeds included approximately $2.4 million resulting from the joint venture’s partnersValue-Added Fund’s repayment of a loan from our Operating Partnership. The Value-Added Fund recognized a gain on a pro rata basis. In addition, the joint venture completed an exchangesale of land parcels with a third party and received land parcels and development rights valued atreal estate totaling approximately $6.4$1.0 million, in exchange for a land parcel valued atof which our share totaled approximately $5.4$0.2 million and cashis included within income from unconsolidated joint ventures in our consolidated statements of approximately $1.0 million.operations.
On September 12, 2010,October 1, 2012, a joint venture in which we have a 50%30% interest exercised its right to extend the maturity date of its mortgage loan collateralized by Annapolis Junction located in Annapolis, Maryland. The mortgage loan totaling $42.7 million now matures on September 12, 2011 and bears interest atpartially placed in-service 500 North Capitol Street, NW, a variable rate equal to LIBOR plus 1.00% per annum. The mortgage loan includes an additional one-year extension option, subject to certain conditions. All other terms of the mortgage loan remain unchanged.
On September 20, 2010, a joint venture in which we have a 50% interest refinanced its mortgage loan collateralized by Market Square NorthClass A office redevelopment project with approximately 232,000 net rentable square feet located in Washington, DC. The previous mortgage loan totaling approximately $81.1 million bore interest at a fixed rate of 7.70% per annum and was scheduled to mature on December 19, 2010. The new mortgage loan totaling $130.0 million bears interest at a fixed rate of 4.85% per annum and matures on October 1, 2020. property is currently 82% leased.
��
On October 22, 2010,19, 2012, we formed a joint venture with an affiliate of Hines to pursue the acquisition of land in San Francisco, California which could support a 61-story, 1.4 million square foot office tower known as Transbay Tower. The purchase price is approximately $190.0 million, and the acquisition is expected to close in the first quarter of 2013. We have a 50% interest in the joint venture. We have provided a non-refundable deposit for the land purchase in the form of a letter of credit totaling $5.0 million. There can be no assurance that the acquisition of the land will be consummated on the terms currently contemplated or at all. On February 7, 2013, the affiliate of Hines issued a notice that it has elected under the joint venture distributed excess loan proceedsagreement to reduce its nominal ownership interest in the venture from 50% to 5%. On February 26, 2013, we issued a notice electing to proceed with the venture on that basis. As a result, we have a 95% nominal interest in, and expect to consolidate, the joint venture. Refer to Note 20 to the partners totaling approximately $40.8 million, of which our share was approximately $20.4 million.Consolidated Financial Statements.
On OctoberNovember 21, 2010,2012, our Value-Added Fund conveyed the fee simple title to its Onepartner in our Annapolis Junction joint venture contributed a parcel of land and Two Circle Star Way propertiesimprovements and paid $3.8 million to the lender in satisfactionwe contributed cash of its outstanding obligations under the existing mortgage loan and guarantee. Our Value-Added Fund recognized a net gain on early extinguishment of debt totaling approximately $17.9$5.4 million. We had previously recognized impairment losses on our investmenthave a 50% interest in the Value-Added Fund.this joint venture. The mortgage loan had an outstanding principal amountventure has commenced construction of $42.0 million, bore interest atAnnapolis Junction Building Seven, which when completed will consist of a fixed rate of 6.57% per annumClass A office property with approximately 125,000 net rentable square feet located in Annapolis, Maryland.
Stock Option and was scheduled to mature on September 1, 2013. The Value-Added Fund had guaranteed the payment of (1) an aggregate of approximately $5.0 million of unfunded tenant improvement costs and leasing commissions and (2) one year of real estate taxes. We had an effective ownership interest of 25% in the One and Two Circle Star Way properties.Incentive Plan
On December 23, 2010, we soldJanuary 25, 2012, our 5.0% equity interest inCompensation Committee approved outperformance awards under our unconsolidated joint venture entity that owned the retail portion of the Wisconsin Place mixed-use property for approximately $1.4 million of cash, resulting in the recognitionStock Option and Incentive Plan to our officers and employees. These awards (the “2012 OPP Awards”) are part of a gainbroad-based, long-term incentive compensation program designed to provide our management team with the potential to earn equity awards subject to us “outperforming” and creating shareholder value in a pay-for-performance structure. Recipients of 2012 OPP Awards will share in a maximum outperformance pool of $40.0 million if the total return to shareholders, including both share appreciation and dividends, exceeds absolute and relative hurdles over a three-year measurement period from February 7, 2012 to February 6, 2015. Earned awards are subject to two-years of time-based vesting after the performance measurement date. Under the Financial Accounting Standards Board’s Accounting Standards Codification (“ASC”) 718 “Compensation—Stock Compensation,” the 2012 OPP Awards have an aggregate value of approximately $0.6$7.7 million, which amount is included within income (loss) from unconsolidated joint ventures withinwill be amortized into earnings over the five-year plan period under the graded vesting method.
Executive Resignation
On February 29, 2012, E. Mitchell Norville resigned as our Consolidated StatementsExecutive Vice President, Chief Operating Officer. In connection with his resignation, Mr. Norville entered into a separation agreement with us. We recognized approximately $4.5 million of Operations.
Business and Growth Strategies
Business Strategy
Our primary business objective is to maximize return on investment so as to provide our investors with the greatest possible total return. Our strategy to achieve this objective is:
to concentrate on a few carefully selected geographic markets, including Boston, Washington, DC, midtown Manhattan,New York, Princeton, San Francisco and Princeton, NJ,Washington, DC, and to be one of the leading, if not the leading, owners and developers in each of those markets. We select markets and submarkets with a diverse economic base and a deep pool of prospective tenants in various industries and where tenants have demonstrated a preference for high-quality office buildings and other facilities;
to emphasize markets and submarkets within those markets where the lack of available sites and the difficulty of receiving the necessary approvals for development and the necessary financing constitute high barriers to the creation of new supply, and where skill, financial strength and diligence are required to successfully develop, finance and manage high-quality office, research and development space, as well as selected retail and residential space;
to take on complex, technically challenging projects, leveraging the skills of our management team to successfully develop, acquire or reposition properties that other organizations may not have the capacity or resources to pursue;
to concentrate on high-quality real estate designed to meet the demands of today’s tenants who require sophisticated telecommunications and related infrastructure, and support services and amenities, and to manage those facilities so as to become the landlord of choice for both existing and prospective clients;
to opportunistically acquire assets which increase our penetration in the markets in which we have chosen to concentrate, andas well as potential new markets, which exhibit an opportunity to improve or preserve returns through repositioning (through a combination of capital improvements and shift in marketing strategy), changes in management focus and re-leasing as existing leases terminate;
to explore joint venture opportunities primarily with existing property owners located in desirable locations, who seek to benefit from the depth of development and management expertise we are able to provide and our access to capital, and/or to explore joint venture opportunities with strategic institutional partners, leveraging our skills as owners, operators and developers of Class A office space as well as partners with expertise inand mixed-use opportunities;complexes;
to pursue on a selective basis the sale of properties, including core properties, to take advantage of our value creation and the demand for our premier properties;
to seek third-party development contracts, which can be a significant source of revenue and enable us to retain and utilize our existing development and construction management staff, especially when our internal development is less active or when new development is less-warranted due to market conditions; and
to enhance our capital structure through our access to a variety of sources of capital and proactively manage our debt expirations.
Growth Strategies
External Growth
We believe that our development experience and our organizational depth position us to continue to selectively develop a range of property types, including low-rise suburban office properties, high-rise urban developments, mixed-use developments (including residential) and research and laboratory space, within budget and on schedule. We believe we are also well positioned to achieve external growth through acquisitions. Other factors that contribute to our competitive position include:
our control of sites (including sites under contract or option to acquire) in our markets that could support approximately 12.812.5 million additional square feet of new office, retail, hotel and residential development;
our reputation gained through 4143 years of successful operations and the stability and strength of our existing portfolio of properties;
our relationships with leading national corporations, universities and public institutions seeking new facilities and development services;
our relationships with nationally recognized financial institutions that provide capital to the real estate industry;
our track record and reputation for executing acquisitions efficiently provides comfort to domestic and foreign institutions, private investors and corporations who seek to sell commercial real estate in our market areas;
our ability to act quickly on due diligence and financing; and
our relationships with institutional buyers and sellers of high-quality real estate assets.
Opportunities to execute our external growth strategy fall into three categories:
| • | Development in selected submarkets.We believe the additional development of well-positioned office buildings and mixed use complexes could be justified in many of our submarkets. We believe in acquiring land after taking into consideration timing factors relating to economic cycles and in response to market conditions that allow for its development at the appropriate time. While we purposely concentrate in markets with high barriers-to-entry, we have demonstrated throughout our |
In the past, we have been particularly successful at acquiring sites or options to purchase sites that need governmental approvals for development. Because of our development expertise, knowledge of the governmental approval process and reputation for quality development with local government regulatory bodies, we generally have been able to secure the permits necessary to allow development and to profit from the resulting increase in land value. We seek complex projects where we can add value through the efforts of our experienced and skilled management team leading to attractive returns on investment.
Our strong regional relationships and recognized development expertise have enabled us to capitalize on unique build-to-suit opportunities. We intend to seek and expect to continue to be presented with such opportunities in the near term allowing us to earn relatively significant returns on these development opportunities through multiple business cycles.
| • | Acquisition of assets and portfolios of assets from institutions or individuals.We believe that due to our size, management strength and reputation, we are well positioned to acquire portfolios of assets or individual properties from institutions or individuals if valuations meet our criteria. In addition, we believe that our |
| • | Acquisition of underperforming assets and portfolios of assets. We believe that because of our in-depth market knowledge and development experience in each of our markets, our national reputation with brokers, financial institutions and others involved in the real estate market and our access to competitively-priced capital, we are well-positioned to identify and acquire existing, underperforming properties for competitive prices and to add significant additional value to such properties through our effective marketing strategies, repositioning/redevelopment expertise and a responsive property management program. We have developed this strategy and program for our existing portfolio, where we provide high-quality property management services using our own employees in order to encourage tenants to renew, expand and relocate in our properties. We are able to achieve speed and transaction cost efficiency in replacing departing tenants through the use of in-house and third-party vendors’ services for marketing, including calls and presentations to prospective tenants, print advertisements, lease negotiation and construction of tenant improvements. Our tenants benefit from cost efficiencies produced by our experienced work force, which is attentive to preventive maintenance and energy management. |
Internal Growth
We believe that opportunities will exist to increase cash flow from our existing properties because they are of high quality and in desirable locations within markets where, in general, the creation of new supply is limited by the lack of available sites and the difficulty of obtaining the necessary approvals for development on vacant land and financing. Our strategy for maximizing the benefits from these opportunities is three-fold: (1) to provide high-quality property management services using our employees in order to encourage tenants to renew, expand and relocate in our properties, (2) to achieve speed and transaction cost efficiency in replacing departing tenants through the use of in-house services for marketing, lease negotiation and construction of tenant improvements and (3) to work with new or existing tenants with space expansion or contraction needs maximizing the cash flow from our assets. We expect to continue our internal growth as a result of our ability to:
| • | Cultivate existing submarkets and long-term relationships with credit tenants. In choosing locations for our properties, we have paid particular attention to transportation and commuting patterns, physical environment, adjacency to established business centers, proximity to sources of business growth and other local factors. |
We had an
The average lease term of 7.1our in-place leases, including unconsolidated joint ventures, was approximately 6.9 years at December 31, 20102012 and we continue to cultivate long-term leasing relationships with a diverse base of high-quality, financially stable tenants. Based on leases in place at December 31, 2010,2012, leases with respect to 6.9%approximately 4.0% of the total square feet in our portfolio (excluding 601 Massachusetts Avenue, which will be removed from service for redevelopment in 2013), including unconsolidated joint ventures, will expire in calendar year 2011.2013.
| • | Directly manage properties to maximize the potential for tenant retention. We provide property management services ourselves, rather than contracting for this service, to maintain awareness of and responsiveness to tenant needs. We and our properties also benefit from cost efficiencies produced by an experienced work force attentive to preventive maintenance and energy management and from our continuing programs to assure that our property management personnel at all levels remain aware of their important role in tenant relations. |
| • | Replace tenants quickly at best available market terms and lowest possible transaction costs. We believe that we are well-positioned to attract new tenants and achieve relatively high rental rates as a result of our well-located, well-designed and well-maintained properties, our reputation for high-quality building services and responsiveness to tenants, and our ability to offer expansion and relocation alternatives within our submarkets. |
| • | Extend terms of existing leases to existing tenants prior to expiration. We have also successfully structured early tenant renewals, which have reduced the cost associated with lease downtime while securing the tenancy of our highest quality credit-worthy tenants on a long-term basis and enhancing relationships. |
Policies with Respect to Certain Activities
The discussion below sets forth certain additional information regarding our investment, financing and other policies. These policies have been determined by our Board of Directors and, in general, may be amended or revised from time to time by our Board of Directors.
Investment Policies
Investments in Real Estate or Interests in Real Estate
Our investment objectives are to provide quarterly cash dividends to our securityholders and to achieve long-term capital appreciation through increases in the value of Boston Properties, Inc. We have not established a specific policy regarding the relative priority of these investment objectives.
We expect to continue to pursue our investment objectives primarily through the ownership of our current properties, development projects and other acquired properties. We currently intend to continue to invest primarily in developments of properties and acquisitions of existing improved properties or properties in need of redevelopment, and acquisitions of land that we believe have development potential, primarily in our markets—existing markets of Boston, Washington, DC, midtown Manhattan,New York, Princeton, San Francisco and Princeton, NJ.Washington, DC, but also potentially in new markets. Future investment or development activities will not be limited to a specified percentage of our assets. We intend to engage in such future investment or development activities in a manner that is consistent with the maintenance of our status as a REIT for federal income tax purposes. In addition, we may purchase or lease income-producing commercial and other types of properties for long-term investment, expand and improve the real estate presently owned or other properties purchased, or sell such real estate properties, in whole or in part, when circumstances warrant. We do not have a policy that restricts the amount or percentage of assets that will be invested in any specific property, however, our investments may be restricted by our debt covenants.
We may also continue to participate with third parties in property ownership, through joint ventures or other types of co-ownership, including third parties with expertise in mixed-use opportunities. These investments may permit us to own interests in larger assets without unduly restricting diversification and, therefore, add flexibility in structuring our portfolio.
Equity investments may be subject to existing mortgage financing and other indebtedness or such financing or indebtedness as may be incurred in connection with acquiring or refinancing these investments. Debt service on such financing or indebtedness will have a priority over any distributions with respect to our common stock. Investments are also subject to our policy not to be treated as an investment company under the Investment Company Act of 1940, as amended (the “1940 Act”).
Investments in Real Estate Mortgages
While our current portfolio consists primarily of, and our business objectives emphasize, equity investments in commercial real estate, we may, at the discretion of the Board of Directors, invest in mortgages and other types of real estate interests consistent with our qualification as a REIT. Investments in real estate mortgages run the risk that one or more borrowers may default under such mortgages and that the collateral securing such mortgages may not be sufficient to enable us to recoup our full investment. Although we currently do not have any investments in mortgages or deeds of trust, weWe may invest in participating, convertible or traditional mortgages if we conclude that we may benefit from the cash flow, or any appreciation in value of the property or as an entrance to the fee ownership.
Securities of or Interests in Entities Primarily Engaged in Real Estate Activities
Subject to the percentage of ownership limitations and gross income and asset tests necessary for our REIT qualification, we also may invest in securities of other REITs, other entities engaged in real estate activities or securities of other issuers, including for the purpose of exercising control over such entities.
Dispositions
Our decision to dispose of properties areis based upon the periodic review of our portfolio and the determination by the Board of Directors that such action would be in our best interests. Any decision to dispose of a property will be authorized by the Board of Directors or a committee thereof. Some holders of limited partnership interests in BPLP, including Mortimer B. Zuckerman, and the estate of Edward H. Linde, could incur adverse tax consequences upon the sale of certain of our properties that differ from the tax consequences to us. Consequently, holders of limited partnership interests in BPLP may have different objectives regarding the appropriate pricing and timing of any such sale. Such different tax treatment derives in most cases from the fact that we acquired these properties in exchange for partnership interests in contribution transactions structured to allow the prior owners to defer taxable gain. Generally this deferral continues so long as we do not dispose of the properties in a taxable transaction. Unless a sale by us of these properties is structured as a like-kind exchange under Section 1031 of the Internal Revenue Code or in a manner that otherwise allows deferral to continue, recognition of the deferred tax gain allocable to these prior owners is generally triggered by a sale. Some of our assets are subject to tax protection agreements, which may limit our ability to dispose of the assets or require us to pay damages to the prior owners in the event of a taxable sale.
Financing Policies
The agreement of limited partnership of BPLP and our certificate of incorporation and bylaws do not limit the amount or percentage of indebtedness that we may incur. We do not have a policy limiting the amount of indebtedness that we may incur. However, our mortgages, credit facilities and unsecured debt securities contain customary restrictions, requirements and other limitations on our ability to incur indebtedness. We have not established any limit on the number or amount of mortgages that may be placed on any single property or on our portfolio as a whole.
Our Board of Directors will consider a number of factors when evaluating our level of indebtedness and when making decisions regarding the incurrence of indebtedness, including the purchase price of properties to be acquired with debt financing, the estimated market value of our properties upon refinancing, the entering into agreements such as interest rate swaps, caps, floors and other interest rate hedging contracts and the ability of particular properties and BPLP as a whole to generate cash flow to cover expected debt service.
Policies with Respect to Other Activities
As the sole general partner of BPLP, we have the authority to issue additional common and preferred units of limited partnership interest of BPLP. We have in the past, and may in the future, issue common or preferred units of limited partnership interest of BPLP to persons who contribute their direct or indirect interests in properties to us in exchange for such common or preferred units of limited partnership interest in BPLP. We have not engaged in trading, underwriting or agency distribution or sale of securities of issuers other than BPLP and we do not intend to do so. At all times, we intend to make investments in such a manner as to maintain our qualification as a REIT, unless because of circumstances or changes in the Internal Revenue Code of 1986, as amended (or the Treasury Regulations), our Board of Directors determines that it is no longer in our best interest to qualify as a REIT. We may make loans to third parties, including, without limitation, to joint ventures in which we participate or in connection with the disposition of a property. We intend to make investments in such a way that we will not be treated as an investment company under the 1940 Act. Our policies with respect to these and other activities may be reviewed and modified or amended from time to time by the Board of Directors.
Sustainability
As one of the largest owners and developers of office properties in the United States, we actively work to promote our growth and operations in a sustainable and responsible manner across our five regions. We focus our sustainability initiatives on the design and construction of our new developments, the operation of our existing
buildings and our internal corporate practices. Our sustainability initiatives are centered on energy efficiency, waste reduction and water preservation, as well as making a positive impact on the communities in which we conduct business. Through these efforts we demonstrate that operating and developing commercial real estate can be conducted with a conscious regard for the environment while mutually benefiting our tenants, investors, employees and the communities in which we operate. In November 2010, we launched a new pageWe provide disclosure on our website to increase the transparency of our sustainability program.program, which we periodically update with current or additional information. You may access our sustainability report on our website at http://www.bostonproperties.com under the heading “Sustainability.”
Competition
We compete in the leasing of office, retail and residential space with a considerable number of other real estate companies, some of which may have greater marketing and financial resources than are available to us. In addition, our hotel property competes for guests with other hotels, some of which may have greater marketing and financial resources than are available to us and to the manager of our one hotel, Marriott International, Inc.
Principal factors of competition in our primary business of owning, acquiring and developing office properties are the quality of properties, leasing terms (including rent and other charges and allowances for tenant improvements), attractiveness and convenience of location, the quality and breadth of tenant services provided, and reputation as an owner and operator of quality office properties in the relevant market. Additionally, our ability to compete depends upon, among other factors, trends of the national and local economies, investment alternatives, financial condition and operating results of current and prospective tenants, availability and cost of capital, construction and renovation costs, taxes, utilities, governmental regulations, legislation and population trends.
In addition, although not part of our core strategy, we are currently developing one residential property and operate two residential properties that are incidental to our office developments and may in the future decide to acquire or develop additional residential properties. As an owner and operator of apartments, we will also face competition for prospective residents from other operators whose properties may be perceived to offer a better location or better amenities or whose rent may be perceived as a better value given the quality, location and amenities that the resident seeks. We will also compete against condominiums and single-family homes that are for sale or rent. Because we have limited experience with residential properties, we expect to retain third parties to manage our residential properties.
Our Hotel Property
We operate our hotel property through a taxable REIT subsidiary. The taxable REIT subsidiary, a wholly-owned subsidiary of BPLP, is the lessee pursuant to a lease for the hotel property. As lessor, BPLP is entitled to a percentage of gross receipts from the hotel property. The hotel lease allows all the economic benefits of ownership to flow to us. Marriott International, Inc. continues to manage the hotel property under the Marriott name and under terms of the existing management agreements. Marriott has been engaged under a separate long-term incentive management agreement to operate and manage the hotel on behalf of the taxable REIT subsidiary. In connection with these arrangements, Marriott has agreed to operate and maintain our hotel in accordance with its system-wide standard for comparable hotels and to provide the hotel with the benefits of its central reservation system and other chain-wide programs and services. Under a management agreement for the hotel, Marriott acts as the taxable REIT subsidiary’s agent to supervise, direct and control the management and operation of the hotel and receives as compensation base management fees that are calculated as a percentage of the hotel’s gross revenues, and supplemental incentive fees if the hotel exceeds negotiated profitability breakpoints. In addition, the taxable REIT subsidiary compensates Marriott, on the basis of a formula applied to the hotel’s gross revenues, for certain system-wide services provided by Marriott, including central reservations, marketing and training. During 2010, 20092012, 2011 and 2008,2010, Marriott received an aggregate of approximately $2.2$2.0 million, $1.5$2.5 million and $3.0$2.2 million, respectively, from our taxable REIT subsidiary.
Seasonality
Our hotel property traditionally has experienced significant seasonality in its operating income, with the percentage of net operating income by quarter over the year ended December 31, 20102012 shown below.
First Quarter | Second Quarter | Third Quarter | Fourth Quarter | Second Quarter | Third Quarter | Fourth Quarter | ||||||
8% | 30% | 24% | 38% | |||||||||
7% | 35% | 25% | 33% | |||||||||
Corporate Governance
Boston Properties is currently governed by a ten member Board of Directors, which is divided into three classes (Class I, Class II and Class III). OurDirectors. The current members of our Board of Directors is currently comprised of three Class I directors (Mortimerare Mortimer B. Zuckerman, Zoë Baird Budinger, Carol B. Einiger, and Dr. Jacob A. Frenkel), four Class II directors (Lawrence S. Bacow, Zoë Baird, Alan J. Patricof and Martin Turchin) and three Class III directors (DouglasFrenkel, Joel I. Klein, Douglas T. Linde, Matthew J. Lustig, Alan J. Patricof, Martin Turchin and David A. Twardock). The terms of our current Class I, Class II and Class III directors expire at the annual meetings of stockholders to be held in 2013, 2011 and 2012, respectively.Twardock.
At the 2010 annual meeting of stockholders, our stockholders approved an amendment to our Amended and Restated Certificate of Incorporation (the “Charter”) that will, among other things, destagger the Board of Directors and provideprovides for the annual election of directors. As a result, commencing with the class ofall directors standing for election at the 2011 annual meeting of stockholders our directors whose terms expire willnow stand for election for one-year terms expiring at the next succeeding annual meeting of stockholders.
On September 11, 2012, Lawrence S. Bacow resigned as our Director to devote more time to his other interests. Mr. Bacow has confirmed to our Board of Directors elected priorthat his resignation was not due to the 2011 annual meeting of stockholders will continuea disagreement with us on any matter relating to serve their full three-year terms.our operations, policies or practices.
On January 20, 2011, Matthew J. Lustig24, 2013, Joel I. Klein was appointed as a Class III director to serve until the 20122013 annual meeting of stockholders. The Board of Directors also appointed Mr. Klein to its Nominating and Corporate Governance Committee.
Our Board of Directors has Audit, Compensation and Nominating and Corporate Governance Committees. The membership of each of these committees is described below.
Name of Director | Audit | Compensation | Governance | ||||||||||
| |||||||||||||
Zoë Baird Budinger | |||||||||||||
Carol B. Einiger | X | ||||||||||||
Dr. Jacob A. Frenkel | X | ||||||||||||
Joel I. Klein | X | ||||||||||||
Alan J. Patricof | X | ||||||||||||
David A. Twardock | X | X* | X | ||||||||||
X=Committee member, *=Chair
Our Board of Directors has adopted charters for each of its Audit, Compensation and Nominating and Corporate Governance Committees. EachThe Audit Committee is comprised of three (3) independent directors. The Compensation Committee is comprised of two (2) independent directors. The Nominating and Corporate Governance Committee is comprised of four (4) independent directors. A copy of each of these charters is available on our website at http://www.bostonproperties.com under the heading “Corporate Governance” and subheading “Committees and Charters.”
Our Board of Directors has adopted Corporate Governance Guidelines, a copy of which is available on our website at http://www.bostonproperties.com under the heading “Corporate Governance” and subheading “Governance Guidelines.”
Our Board of Directors has adopted a Code of Business Conduct and Ethics, which governs business decisions made and actions taken by our directors, officers and employees. A copy of this code is available on our website at http://www.bostonproperties.com under the heading “Corporate Governance” and subheading “Code of Conduct and Ethics.” We intend to disclose on this website any amendment to, or waiver of, any provisions of this Code applicable to our directors and executive officers that would otherwise be required to be disclosed under the rules of the SEC or the New York Stock Exchange.
|
Our Board of Directors has established an ethics reporting system that employees may use to anonymously report possible violations of the Code of Business Conduct and Ethics, including concerns regarding questionable accounting, internal accounting controls or auditing matters, by telephone or over the internet.
New U.S. Income Tax Legislation
Pursuant to recently enacted legislation, as of January 1, 2013, (1) the maximum tax rate on “qualified dividend income” for individuals is 20%, (2) the maximum tax rate on long-term capital gain for individuals is 20%, (3) the highest marginal individual income tax rate is 39.6%, and (4) the backup withholding rate remains at 28%. Such legislation also temporarily (through 2013) reduces to five years the ten-year recognition period applicable to gain recognized on the disposition of an asset acquired from a C corporation in a carryover basis transaction, as well as makes permanent certain federal income tax provisions that were scheduled to expire on December 31, 2012.
In addition, the effective date for U.S. withholding taxes that may apply, in certain circumstances, under the Foreign Account Tax Compliance Act, on the gross proceeds from the sale of our stock or notes or the Operating Partnership’s notes has been extended from payments after December 31, 2014 to payments after December 31, 2016.
| Item 1A. | Risk Factors. |
Set forth below are the risks that we believe are material to our investors. We refer to the shares of our common stock and the units of limited partnership interest in BPLP together as our “securities,” and the investors who own shares or units, or both, as our “securityholders.” This section contains forward-looking statements. You should refer to the explanation of the qualifications and limitations on forward-looking statements beginning on page 48.
Our performance and value are subject to risks associated with our real estate assets and with the real estate industry.
Our economic performance and the value of our real estate assets, and consequently the value of our securities, are subject to the risk that if our office and hotel properties do not generate revenues sufficient to meet our operating expenses, including debt service and capital expenditures, our cash flow and ability to pay distributions to our securityholders will be adversely affected. The following factors, among others, may adversely affect the income generated by our office and hotel properties:
downturns in the national, regional and local economic conditions (particularly increases in unemployment);
competition from other office, hotel, commercial and commercialresidential buildings;
local real estate market conditions, such as oversupply or reduction in demand for office, hotel, commercial or other commercialresidential space;
changes in interest rates and availability of financing;
vacancies, changes in market rental rates and the need to periodically repair, renovate and re-let space;
changes in space utilization by our tenants due to technology, economic conditions and business culture;
increased operating costs, including insurance expense, utilities, real estate taxes, state and local taxes and heightened security costs;
civil disturbances, earthquakes and other natural disasters, or terrorist acts or acts of war which may result in uninsured or underinsured losses;
significant expenditures associated with each investment, such as debt service payments, real estate taxes, insurance and maintenance costs which are generally not reduced when circumstances cause a reduction in revenues from a property;
declines in the financial condition of our tenants and our ability to collect rents from our tenants; and
decreases in the underlying value of our real estate.
We are dependent upon the economic climates of our markets—Boston, Washington, DC, midtown Manhattan,New York, Princeton, San Francisco and Princeton, NJ.Washington, DC.
Substantially all of our revenue is derived from properties located in five markets: Boston, Washington, DC, midtown Manhattan,New York, Princeton, San Francisco and Princeton, NJ.Washington, DC. A downturn in the economies of these markets, or the impact that a downturn in the overall national economy may have upon these economies, could result in reduced demand for office space. Because our portfolio consists primarily of office buildings (as compared to a more diversified real estate portfolio), a decrease in demand for office space in turn could adversely affect our results of operations. Additionally, there are submarkets within our markets that are dependent upon a limited number of industries. For example, in our Washington, DC market we focus on leasing office properties to governmental agencies and contractors, as well as legal firms. A reduction in spending by the federal government, either resulting from sequestration or the annual budgetary process, could result in reduced demand for office space and adversely effect our results of operations, In addition, in our midtown ManhattanNew York market we have historically leased properties to financial, legal and other professional firms. A significant downturn in one or more of these sectors could adversely affect our results of operations.
In addition, a significant economic downturn over a period of time could result in an event or change in circumstances that results in an impairment in the value of our properties.properties or our investments in unconsolidated joint ventures. An impairment loss is recognized if the carrying amount of the asset (1) is not recoverable over its expected holding period and (2) exceeds its fair value. There can be no assurance that we will not take charges in the future related to the impairment of our assets.assets or investments. Any future impairment could have a material adverse effect on our results of operations in the period in which the charge is taken.
Our investment in property development may be more costly than anticipated.
We intend to continue to develop and substantially renovate office and residential properties. Our current and future development and construction activities may be exposed to the following risks:
we may be unable to proceed with the development of properties because we cannot obtain financing on favorable terms or at all;
we may incur construction costs for a development project whichthat exceed our original estimates due to increases in interest rates and increased materials, labor, leasing or other costs, which could make completion of the project less profitable because market rents may not increase sufficiently to compensate for the increase in construction costs;
we may be unable to obtain, or face delays in obtaining, required zoning, land-use, building, occupancy, and other governmental permits and authorizations, which could result in increased costs and could require us to abandon our activities entirely with respect to a project;
we may abandon development opportunities after we begin to explore them and as a result we may lose deposits or fail to recover expenses already incurred;
we may expend funds on and devote management’s time to projects which we do not complete;
we may be unable to complete construction and/or leasing of a property on schedule; and
we may suspend development projects after construction has begun due to changes in economic conditions or other factors, and this may result in the write-off of costs, payment of additional costs or increases in overall costs when the development project is restarted.
Investment returns from our developed properties may be lowerless than anticipated.
Our developed properties may be exposed to the following risks:
we may lease developed properties at rental rates that are less than the rates projected at the time we decide to undertake the development;
operating expenses may be greater than projected at the time of development, resulting in our investment being less profitable than we expected; and
occupancy rates and rents at newly developed properties may fluctuate depending on a number of factors, including market and economic conditions, and may result in our investments being less profitable than we expected or not profitable at all.
We face risks associated with the development of mixed-use commercial properties.
We operate, are currently developing, and may in the future develop, properties either alone or through joint ventures with other persons that are known as “mixed-use” developments. This means that in addition to the development of office space, the project may also include space for residential, retail, hotel or other commercial purposes. We have limited experience in developing and managing non-office and non-retail real estate. As a result, if a development project includes a non-office or non-retail use, we may seek to develop that component ourselves, sell the rights to that component to a third-party developer with experience in that use or we may seek
to partner with such a developer. If we do not sell the rights or partner with such a developer, or if we choose to develop the other component ourselves, we would be exposed not only to those risks typically associated with the development of
commercial real estate generally, but also to specific risks associated with the development and ownership of non-office and non-retail real estate. In addition, even if we sell the rights to develop the other component or elect to participate in the development through a joint venture, we may be exposed to the risks associated with the failure of the other party to complete the development as expected. These include the risk that the other party would default on its obligations necessitating that we complete the other component ourselves (including providing any necessary financing). In the case of residential properties, these risks include competition for prospective residents from other operators whose properties may be perceived to offer a better location or better amenities or whose rent may be perceived as a better value given the quality, location and amenities that the resident seeks. We will also compete against condominiums and single-family homes that are for sale or rent. Because we have limited experience with residential properties, we expect to retain third parties to manage our residential properties. If we decide to not sell or participate in a joint venture and instead hire a third party manager, we would be dependent on them and their key personnel who provide services to us and we may not find a suitable replacement if the management agreement is terminated, or if key personnel leave or otherwise become unavailable to us.
We face risks associated with the use of debt to fund acquisitions and developments, including refinancing risk.
We are subject to the risks normally associated with debt financing, including the risk that our cash flow will be insufficient to meet required payments of principal and interest. We anticipate that only a small portion of the principal of our debt will be repaid prior to maturity. Therefore, we are likely to need to refinance at least a portion of our outstanding debt as it matures. There is a risk that we may not be able to refinance existing debt or that the terms of any refinancing will not be as favorable as the terms of our existing debt. If principal payments due at maturity cannot be refinanced, extended or repaid with proceeds from other sources, such as new equity capital, our cash flow may not be sufficient to repay all maturing debt in years when significant “balloon” payments come due. In addition, we may rely on debt to fund a portion of our new investments such as our acquisition and development activity. There is a risk that we may be unable to finance these activities on favorable terms or at all. This risk is currently heightened because of tightened underwriting standards and increased credit risk premiums. These conditions, which increase the cost and reduce the availability of debt, may continue or worsen in the future.
We have agreements with a number of limited partners of BPLP who contributed properties in exchange for partnership interests that require BPLP to maintain for specified periods of time secured debt on certain of our assets and/or allocate partnership debt to such limited partners to enable them to continue to defer recognition of their taxable gain with respect to the contributed property. These tax protection and debt allocation agreements may restrict our ability to repay or refinance debt.
Adverse economic and geopolitical conditions and dislocations in the credit markets could have a material adverse effect on our results of operations, financial condition and ability to pay distributions to you.
Our business may be affected by market and economic challenges experienced by the U.S. economy or real estate industry as a whole, or by the local economic conditions in the markets in which our properties are located, including the continuing impact of high unemployment, and constrained credit.by international economic conditions. These current conditions, or similar conditions existing in the future, may adversely affect our results of operations, financial condition and ability to pay distributions as a result of the following, among other potential consequences:
the financial condition of our tenants, many of which are financial, legal and other professional firms, may be adversely affected, which may result in tenant defaults under leases due to bankruptcy, lack of liquidity, operational failures or for other reasons;
significant job losses in the financial and professional services industries may occur, which may decrease demand for our office space, causing market rental rates and property values to be negatively impacted;
our ability to borrow on terms and conditions that we find acceptable, or at all, may be limited, which could reduce our ability to pursue acquisition and development opportunities and refinance existing debt, reduce our returns from our acquisition and development activities and increase our future interest expense;
reduced values of our properties may limit our ability to dispose of assets at attractive prices or to obtain debt financing secured by our properties and may reduce the availability of unsecured loans;
the value and liquidity of our short-term investments and cash deposits could be reduced as a result of a deterioration of the financial condition of the institutions that hold our cash deposits or the institutions or assets in which we have made short-term investments, a dislocation of the markets for our short-term investments, increased volatility in market rates for such investments or other factors;
one or more lenders under our line of credit could refuse to fund their financing commitment to us or could fail and we may not be able to replace the financing commitment of any such lenders on favorable terms, or at all; and
one or more counterparties to our derivative financial instruments could default on their obligations to us, including the capped call transactions we entered into in connection with our offering of our 3.625% exchangeable senior notes due 2014 and any interest hedging contracts we may enter into from time to time, or could fail, increasing the risk that we may not realize the benefits of these instruments.
An increase in interest rates would increase our interest costs on variable rate debt and could adversely impact our ability to refinance existing debt or sell assets on favorable terms or at all.
As of February 18, 2011,21, 2013, we had approximately $317.5 million ofno indebtedness, excluding our unconsolidated joint ventures, that bears interest at variable rates, andbut we may incur more of such indebtedness in the future. If interest rates increase, then so willwould the interest costs on our unhedged variable rate debt, which could adversely affect our cash flow and our ability to pay principal and interest on our debt and our ability to make distributions to our securityholders. Further, rising interest rates could limit our ability to refinance existing debt when it matures or significantly increase our future interest expense. From time to time, we enter into interest rate swap agreements and other interest rate hedging contracts, including swaps, caps and floors. While these agreements are intended to lessen the impact of rising interest rates on us, they also expose us to the risk that the other parties to the agreements will not perform, we could incur significant costs associated with the settlement of the agreements, the agreements will be unenforceable and the underlying transactions will fail to qualify as highly-effective cash flow hedges under guidance included in ASC 815 “Derivatives and Hedging” (formerly known as SFAS No. 133, “Accounting for Derivative Instruments and Hedging Activities, as amended”). In addition, an increase in interest rates could decrease the amounts third-parties are willing to pay for our assets, thereby limiting our ability to change our portfolio promptly in response to changes in economic or other conditions.
Covenants in our debt agreements could adversely affect our financial condition.
The mortgages on our properties contain customary covenants such as those that limit our ability, without the prior consent of the lender, to further mortgage the applicable property or to discontinue insurance coverage. Our unsecured credit facility, unsecured debt securities and certain secured loans contain customary restrictions, requirements and other limitations on our ability to incur indebtedness, including total debt to asset ratios, secured debt to total asset ratios, debt service coverage ratios and minimum ratios of unencumbered assets to unsecured debt, which we must maintain. Our continued ability to borrow under our credit facilities is subject to compliance with our financial and other covenants. In addition, our failure to comply with such covenants could cause a default under the applicable debt agreement, and we may then be required to repay such debt with capital from other sources. Under those circumstances, other sources of capital may not be available to us, or be available only on unattractive terms. Additionally, in the future our ability to satisfy current or prospective lenders’ insurance requirements may be adversely affected if lenders generally insist upon greater insurance coverage against acts of terrorism or losses resulting from earthquakes than is available to us in the marketplace or on commercially reasonable terms.
We rely on debt financing, including borrowings under our unsecured credit facility, issuances of unsecured debt securities and debt secured by individual properties, to finance our existing portfolio, our acquisition and development activities and for working capital. If we are unable to obtain debt financing from these or other sources, or to refinance existing indebtedness upon maturity, our financial condition and results of operations would likely be adversely affected. If we breach covenants in our debt agreements, the lenders can declare a default and, if the debt is secured, can take possession of the property securing the defaulted loan. In addition, our unsecured debt agreements contain specific cross-default provisions with respect to specified other indebtedness, giving the unsecured lenders the right to declare a default if we are in default under other loans in some circumstances. Defaults under our debt agreements could materially and adversely affect our financial condition and results of operations.
Our degree of leverage could limit our ability to obtain additional financing or affect the market price of our common stock or debt securities.
On February 18, 2011,21, 2013, our total consolidated debt was approximately $8.0$8.9 billion (i.e., excluding unconsolidated joint venture debt). Consolidated debt to total consolidated market capitalization ratio, defined as total consolidated debt as a percentage of the market value of our outstanding equity securities plus our total consolidated debt, is a measure of leverage commonly used by analysts in the REIT sector. Our total consolidated market capitalization was approximately $23.6$26.9 billion at February 18, 2011.21, 2013. Total consolidated market capitalization was calculated using the closing stock price of $94.99$105.46 per common share and the following: (1) 141,864,497151,639,342 shares of our common stock, (2) 19,387,31116,050,062 outstanding common units of limited partnership interest in Boston Properties Limited Partnership (excluding common units held by Boston Properties, Inc.)us), (3) an aggregate of 1,460,6881,307,083 common units issuable upon conversion of all outstanding Series Two Preferred Units of partnership interest in Boston Properties Limited Partnership, (4) an aggregate of 1,682,0951,451,534 common units issuable upon conversion of all outstanding LTIP Units, assuming all conditions have been met for the conversion of the LTIP Units, (5) 1,221,527 Series Four Preferred Units of partnership interest multiplied by the fixed liquidation preference of $50 per unit and (5)(6) our consolidated debt totaling approximately $8.0$8.9 billion. The calculation of total consolidated market capitalization does not include 400,000 2011 OPP Units, 400,000 2012 OPP Units and 280,000 MYLTIP Units because, unlike other LTIP Units, they are not earned until certain return thresholds are achieved. Our total consolidated debt, which excludes debt collateralized by our unconsolidated joint ventures, at February 18, 201121, 2013 represented approximately 33.74%33.03% of our total consolidated market capitalization. This percentage will fluctuate with changes in the market price of our common stock and does not necessarily reflect our capacity to incur additional debt to finance our activities or our ability to manage our existing debt obligations. However, for a company like ours, whose assets are primarily income-producing real estate, the consolidated debt to total consolidated market capitalization ratio may provide investors with an alternate indication of leverage, so long as it is evaluated along with other financial ratios and the various components of our outstanding indebtedness.
Our degree of leverage could affect our ability to obtain additional financing for working capital, capital expenditures, acquisitions, development or other general corporate purposes. Our senior unsecured debt is currently rated investment grade by the three major rating agencies. However, there can be no assurance that we will be able to maintain this rating, and in the event our senior debt is downgraded from its current rating, we would likely incur higher borrowing costs and/or difficulty in obtaining additional financing. Our degree of leverage could also make us more vulnerable to a downturn in business or the economy generally. There is a risk that changes in our debt to market capitalization ratio, which is in part a function of our stock price, or our ratio of indebtedness to other measures of asset value used by financial analysts may have an adverse effect on the market price of our equity or debt securities.
We face risks associated with property acquisitions.
We have acquired in the past and intend to continue to pursue the acquisition of properties and portfolios of properties, including large portfolios that could increase our size and result in alterations to our capital structure. Our acquisition activities and their success are subject to the following risks:
even if we enter into an acquisition agreement for a property, we may be unable to complete that acquisition after making a non-refundable deposit and incurring certain other acquisition-related costs;
we may be unable to obtain or assume financing for acquisitions on favorable terms or at all;
acquired properties may fail to perform as expected;
the actual costs of repositioning or redeveloping acquired properties may be greater than our estimates;
the acquisition agreement will likely contain conditions to closing, including completion of due diligence investigations to our satisfaction or other conditions that are not within our control, which may not be satisfied;
acquired properties may be located in new markets, either within or outside the United States, where we may face risks associated with a lack of market knowledge or understanding of the local economy, lack of business relationships in the area and unfamiliarity with local governmental and permitting procedures;
we may acquire real estate through the acquisition of the ownership entity subjecting us to the risks of that entity; and
we may be unable to quickly and efficiently integrate new acquisitions, particularly acquisitions of portfolios of properties, into our existing operations, and this could have an adverse effect on our results of operations and financial condition.
We have acquired in the past and in the future may acquire properties through the acquisition of first mortgage or mezzanine debt. Investments in these loans must be carefully structured to ensure that we satisfy the various asset and income requirements applicable to REITs. If we fail to structure any such acquisition properly, we could fail to qualify as a REIT. In addition, acquisitions of first mortgage or mezzanine loans subject us to the risks associated with the borrower’s default, including potential bankruptcy, and there may be significant delays and costs associated with the process of foreclosure on collateral securing or supporting these investments. There can be no assurance that we would recover any or all of our investment in the event of such a default or bankruptcy.
We have acquired in the past and in the future may acquire properties or portfolios of properties through tax deferred contribution transactions in exchange for partnership interests in BPLP. This acquisition structure has the effect, among others, of reducing the amount of tax depreciation we can deduct over the tax life of the acquired properties, and typically requires that we agree to protect the contributors’ ability to defer recognition of taxable gain through restrictions on our ability to dispose of the acquired properties and/or the allocation of partnership debt to the contributors to maintain their tax bases. These restrictions could limit our ability to sell an asset at a time, or on terms, that would be favorable absent such restrictions.
Any future international activities will be subject to special risks and we may not be able to effectively manage our international business.
We have underwritten, and in the future may acquire, properties, portfolios of properties or interests in real-estate related entities on a strategic or selective basis in international markets that are new to us. If we acquire properties or platforms located in these markets, we will face risks associated with a lack of market knowledge and understanding of the local economy, forging new business relationships in the area and unfamiliarity with local laws and government and permitting procedures. In addition, our international operations will be subject to the usual risks of doing business abroad such as possible revisions in tax treaties or other laws and regulations,
including those governing the taxation of our international income, restrictions on the transfer of funds and uncertainty over terrorist activities. We cannot predict the likelihood that any of these developments may occur. Further, we may in the future enter into agreements with non-U.S. entities that are governed by the laws of, and are subject to dispute resolution in the courts of, another country or region. We cannot accurately predict whether such a forum would provide us with an effective and efficient means of resolving disputes that may arise.
Investments in international markets may also subject us to risks associated with funding increasing headcount, integrating new offices, and establishing effective controls and procedures to regulate the operations of new offices and to monitor compliance with U.S. laws and regulations such as the Foreign Corrupt Practices Act and similar foreign laws and regulations.
We may be subject to risks from potential fluctuations in exchange rates between the U.S. dollar and the currencies of the other countries in which we invest.
If we invest in countries where the U.S. dollar is not the national currency, we will be subject to international currency risks from the potential fluctuations in exchange rates between the U.S. dollar and the currencies of those other countries. A significant depreciation in the value of the currency of one or more countries where we have a significant investment may materially affect our results of operations. We may attempt to mitigate any such effects by borrowing in the currency of the country in which we are investing and, under certain circumstances, by hedging exchange rate fluctuations; however, access to capital may be more restricted, or unavailable on favorable terms or at all, in certain locations. For leases denominated in international currencies, we may use derivative financial instruments to manage the international currency exchange risk. We cannot assure you, however, that our efforts will successfully neutralize all international currency risks.
Acquired properties may expose us to unknown liability.
We may acquire properties subject to liabilities and without any recourse, or with only limited recourse, against the prior owners or other third parties with respect to unknown liabilities. As a result, if a liability were asserted against us based upon ownership of those properties, we might have to pay substantial sums to settle or contest it, which could adversely affect our results of operations and cash flow. Unknown liabilities with respect to acquired properties might include:
liabilities for clean-up of undisclosed environmental contamination;
claims by tenants, vendors or other persons against the former owners of the properties;
liabilities incurred in the ordinary course of business; and
claims for indemnification by general partners, directors, officers and others indemnified by the former owners of the properties.
Competition for acquisitions may result in increased prices for properties.
We plan to continue to acquire properties as we are presented with attractive opportunities. We may face competition for acquisition opportunities with other investors, and this competition may adversely affect us by subjecting us to the following risks:
we may be unable to acquire a desired property because of competition from other well-capitalized real estate investors, including publicly traded and private REITs, institutional investment funds and other real estate investors; and
even if we are able to acquire a desired property, competition from other real estate investors may significantly increase the purchase price.
Our use of joint ventures may limit our flexibility with jointly owned investments.
In appropriate circumstances, we intend to develop and acquire properties in joint ventures with other persons or entities when circumstances warrant the use of these structures. We currently have twelvethirteen joint ventures that are not consolidated with our financial statements. Our share of the aggregate revenue of these joint ventures represented approximately 17.9%14.3% of our total revenue (the sum of our total consolidated revenue and our share of such joint venture revenue) for the year ended December 31, 2010.2012. Our participation in joint ventures is subject to the risks that:
we could become engaged in a dispute with any of our joint venture partners that might affect our ability to develop or operate a property;
our joint ventures are subject to debt and in the current credit markets the refinancing of such debt may require equity capital calls;
our joint venture partners may default on their obligations necessitating that we fulfill their obligation ourselves;
our joint venture partners may have different objectives than we have regarding the appropriate timing and terms of any sale or refinancing of properties;
our joint venture partners may be structured differently than us for tax purposes and this could create conflicts of interest;
our joint venture partners may have competing interests in our markets that could create conflictconflicts of interest issues.interest; and
our joint ventures may be unable to repay any amounts that we may loan to it.
Our properties face significant competition.
We face significant competition from developers, owners and operators of office and residential properties and other commercial real estate, including sublease space available from our tenants. Substantially all of our properties face competition from similar properties in the same market. This competition may affect our ability to attract and retain tenants and may reduce the rents we are able to charge. These competing properties may have vacancy rates higher than our properties, which may result in their owners being willing to lease available space at lower rates than the space in our properties.
We face potential difficulties or delays renewing leases or re-leasing space.
We derive most of our income from rent received from our tenants. If a tenant experiences a downturn in its business or other types of financial distress, it may be unable to make timely rental payments. Also, when our tenants decide not to renew their leases or terminate early, we may not be able to re-let the space. Even if tenants decide to renew or lease new space, the terms of renewals or new leases, including the cost of required renovations or concessions to tenants, may be less favorable to us than current lease terms. As a result, our cash flow could decrease and our ability to make distributions to our securityholders could be adversely affected.
We face potential adverse effects from major tenants’ bankruptcies or insolvencies.
The bankruptcy or insolvency of a major tenant may adversely affect the income produced by our properties. Our tenants could file for bankruptcy protection or become insolvent in the future. We cannot evict a tenant solely because of its bankruptcy. On the other hand, a bankrupt tenant may reject and terminate its lease with us. In such case, our claim against the bankrupt tenant for unpaid and future rent would be subject to a statutory cap that might be substantially less than the remaining rent actually owed under the lease, and, even so, our claim for unpaid rent would likely not be paid in full. This shortfall could adversely affect our cash flow and results of operations.
We may have difficulty selling our properties, which may limit our flexibility.
Large and high-quality office and hotel propertiesProperties like the ones that we own could be difficult to sell. This may limit our ability to change our portfolio promptly in response to changes in economic or other conditions. In addition, federal tax laws limit our ability to sell properties and this may affect our ability to sell properties without adversely affecting returns to our securityholders. These restrictions reduce our ability to respond to changes in the performance of our investments and could adversely affect our financial condition and results of operations.
Our ability to dispose of some of our properties is constrained by their tax attributes. Properties which we developed and have owned for a significant period of time or which we acquired through tax deferred contribution transactions in exchange for partnership interests in BPLP often have low tax bases. Furthermore, as a REIT, we may be subject to a 100% “prohibited transactions” tax on the gain from dispositions of property if we are deemed to hold the property primarily for sale to customers in the ordinary course of business, unless the disposition qualifies under a safe harbor exception for properties that have been held for at least two years and with respect to which certain other requirements are met. The potential application of the prohibited transactions tax could cause us to forego potential dispositions of property or other opportunities that might otherwise be attractive to us, or to undertake such dispositions or other opportunities through a taxable REIT subsidiary, which would generally result in income taxes being incurred. If we dispose of these properties outright in taxable transactions, we may be required to distribute a significant amount of the taxable gain to our securityholders under the requirements of the Internal Revenue Code for REITs, which in turn would impact our cash flow and increase our leverage. In some cases, without incurring additional costs we may be restricted from disposing of properties contributed in exchange for our partnership interests under tax protection agreements with contributors. To dispose of low basis or tax-protected properties efficiently we from time to time use like-kind exchanges, which qualify for non-recognition of taxable gain, but can be difficult to consummate and result in the property for which the disposed assets are exchanged inheriting their low tax bases and other tax attributes (including tax protection covenants).
Because we own a hotel property, we face the risks associated with the hospitality industry.
Because the lease payments we receive under our hotel lease are based on a participation in the gross receipts of the hotel, if the hotel does not generate sufficient receipts, our cash flow would be decreased, which could reduce the amount of cash available for distribution to our securityholders. The following factors, among others, are common to the hotel industry, and may reduce the receipts generated by our hotel property:
our hotel property competes for guests with other hotels, a number of which have greater marketing and financial resources than our hotel-operating business partners;
if there is an increase in operating costs resulting from inflation and other factors, our hotel-operating business partners may not be able to offset such increase by increasing room rates;
our hotel property is subject to the fluctuating and seasonal demands of business travelers and tourism; and
our hotel property is subject to general and local economic and social conditions that may affect demand for travel in general, including war and terrorism.
In addition, because our hotel property is located in Cambridge, Massachusetts, it is subject to the Cambridge market’s fluctuations in demand, increases in operating costs and increased competition from additions in supply.
We face risks associated with short-term liquid investments.
We continue to have significant cash balances that we invest in a variety of short-term investments that are intended to preserve principal value and maintain a high degree of liquidity while providing current income. From time to time, these investments may include (either directly or indirectly):
direct obligations issued by the U.S. Treasury;
obligations issued or guaranteed by the U.S. government or its agencies;
taxable municipal securities;
obligations (including certificates of deposit) of banks and thrifts;
commercial paper and other instruments consisting of short-term U.S. dollar denominated obligations issued by corporations and banks;
repurchase agreements collateralized by corporate and asset-backed obligations;
both registered and unregistered money market funds; and
other highly rated short-term securities.
Investments in these securities and funds are not insured against loss of principal. Under certain circumstances we may be required to redeem all or part of our investment, and our right to redeem some or all of our investment may be delayed or suspended. In addition, there is no guarantee that our investments in these securities or funds will be redeemable at par value. A decline in the value of our investment or a delay or suspension of our right to redeem may have a material adverse effect on our results of operations or financial condition.
Failure to qualify as a real estate investment trust would cause us to be taxed as a corporation, which would substantially reduce funds available for payment of dividends.
If we fail to qualify as a real estate investment trust, or REIT for federal income tax purposes, we will be taxed as a corporation unless certain relief provisions apply. We believe that we are organized and qualified as a REIT and intend to operate in a manner that will allow us to continue to qualify as a REIT. However, we cannot assure you that we are qualified as such, or that we will remain qualified as such in the future. This is because qualification as a REIT involves the application of highly technical and complex provisions of the Internal Revenue Code as to which there are only limited judicial and administrative interpretations and involves the determination of facts and circumstances not entirely within our control. Future legislation, new regulations, administrative interpretations or court decisions may significantly change the tax laws or the application of the tax laws with respect to qualification as a REIT for federal income tax purposes or the federal income tax consequences of such qualification.
In addition, we currently hold certain of our properties and the Value-Added Fund holds its properties, through a subsidiarysubsidiaries that hashave elected to be taxed as a REITREITs and we may in the future determine that it is in our best interests to hold one or more of our other properties through one or more subsidiaries that elect to be taxed as REITs. If any of these subsidiaries fails to qualify as a REIT for federal income tax purposes, then we may also fail to qualify as a REIT for federal income tax purposes.
If we fail to qualify as a REIT then, unless certain relief provisions apply, we will face serious tax consequences that will substantially reduce the funds available for payment of dividends for each of the years involved because:
we would not be allowed a deduction for dividends paid to stockholders in computing our taxable income and would be subject to federal income tax at regular corporate rates;
we also could be subject to the federal alternative minimum tax and possibly increased state and local taxes; and
unless we are entitled to relief under statutory provisions, we could not elect to be subject to tax as a REIT for four taxable years following the year during which we were disqualified; anddisqualified.
all dividends will be subject to tax as ordinary income to the extent of our current and accumulated earnings and profits.
In addition, if we fail to qualify as a REIT and the relief provisions do not apply, we will no longer be required to pay dividends. As a result of all these factors, our failure to qualify as a REIT could impair our ability to expand our business and raise capital, and it would adversely affect the value of our common stock. If we fail to qualify as a REIT but are eligible for certain relief provisions, then we may retain our status as a REIT but may be required to pay a penalty tax, which could be substantial.
In order to maintain our REIT status, we may be forced to borrow funds during unfavorable market conditions or to pay taxable dividends of our common stock.conditions.
In order to maintain our REIT status, we may need to borrow funds on a short-term basis to meet the REIT distribution requirements, even if the then-prevailing market conditions are not favorable for these borrowings or, alternatively, for 2011, we could pay a taxable stock dividend.borrowings. To qualify as REIT, we generally must distribute to our stockholders at least 90% of our net taxable income each year, excluding capital gains. In addition, we will be subject to a 4% nondeductible excise tax on the amount, if any, by which dividends paid by us in any calendar year are less than the sum of 85% of our ordinary income, 95% of our capital gain net income and 100% of our undistributed income from prior years. We may need short-term debt or long-term debt or proceeds from asset sales, creation of joint ventures or sales of common stock to fund required distributions as a result of differences in timing between the actual receipt of income and the recognition of income for federal income tax purposes, or the effect of non-deductible capital expenditures, the creation of reserves or required debt or amortization payments. The inability of our cash flows to cover our distribution requirements could have an adverse impact on our ability to raise short—short - and long-term debt or sell equity securities in order to fund distributions required to maintain our REIT status. Alternatively, under recent IRS guidance that is effective through 2011, we may elect to distribute taxable dividends that are payable up to 90% in the form of our common stock (with the remainder payable in cash). In this event, shareholders will be required to include the full amount of the dividend in income, and shareholder’s tax liability could exceed the cash portion of their dividend.
Limits on changes in control may discourage takeover attempts beneficial to stockholders.
Provisions in our certificate of incorporationCharter and bylaws, our shareholder rights agreement and the limited partnership agreement of BPLP, as well as provisions of the Internal Revenue Code and Delaware corporate law, may:
delay or prevent a change of control over us or a tender offer, even if such action might be beneficial to our stockholders; and
limit our stockholders’ opportunity to receive a potential premium for their shares of common stock over then-prevailing market prices.
Stock Ownership Limit
To facilitate maintenance of our qualification as a REIT and to otherwise address concerns relating to concentration of capital stock ownership, our certificate of incorporationCharter generally prohibits ownership, directly, indirectly or beneficially, by any single stockholder of more than 6.6% of the number of outstanding shares of any class or series of our common stock. We refer to this limitation as the “ownership limit.” Our Board of Directors may waive, in its sole discretion, or modify the ownership limit with respect to one or more persons if it is satisfied that ownership in excess of this limit will not jeopardize our status as a REIT for federal income tax purposes. In addition, under our certificate of incorporationCharter each of Mortimer B. Zuckerman and the respective families and affiliates of Mortimer B. Zuckerman and Edward H. Linde, as well as, in general, pension plans and mutual funds, may actually and beneficially own up to 15% of the number of outstanding shares of any class or series of our equity common stock. Shares owned in violation of the ownership limit will be subject to the loss of rights to distributions and voting and other penalties. The ownership limit may have the effect of inhibiting or impeding a change in control.
BPLP’s Partnership Agreement
We have agreed in the limited partnership agreement of BPLP not to engage in specified extraordinary transactions, including, among others, business combinations, unless limited partners of BPLP other than Boston Properties, Inc.us receive, or have the opportunity to receive, either (1) the same consideration for their partnership interests as
holders of our common stock in the transaction or (2) limited partnership units that, among other things, would entitle the holders, upon redemption of these units, to receive shares of common equity of a publicly traded company or the same consideration as holders of our common stock received in the transaction. If these limited partners would not receive such consideration, we cannot engage in the transaction unless limited partners holding at least 75% of the common units of limited partnership interest, other than those held by Boston Properties, Inc. or its affiliates, consent to the transaction. In addition, we have agreed in the limited partnership agreement of BPLP that we will not complete specified extraordinary transactions, including among others, business combinations, in which we receive the approval of our common stockholders unless (1) limited partners holding at least 75% of the common units of limited partnership interest, other than those held by Boston Properties, Inc. or its affiliates, consent to the transaction or (2) the limited partners of BPLP are also allowed to vote and the transaction would have been approved had these limited partners been able to vote as common stockholders on the transaction. Therefore, if our common stockholders approve a specified extraordinary transaction, the partnership agreement requires the following before we can complete the transaction:
holders of partnership interests in BPLP, including Boston Properties, Inc., must vote on the matter;
Boston Properties, Inc. must vote its partnership interests in the same proportion as our stockholders voted on the transaction; and
the result of the vote of holders of partnership interests in BPLP must be such that had such vote been a vote of stockholders, the business combination would have been approved.
As a result of these provisions, a potential acquirer may be deterred from making an acquisition proposal, and we may be prohibited by contract from engaging in a proposed extraordinary transaction, including a proposed business combination, even though our stockholders approve of the transaction.
Shareholder Rights Plan
We have a shareholder rights plan. Under the terms of this plan, we can in effect prevent a person or group from acquiring more than 15% of the outstanding shares of our common stock because, unless we approve of the acquisition, after the person acquires more than 15% of our outstanding common stock, all other stockholders will have the right to purchase securities from us at a price that is less than their then fair market value. This would substantially reduce the value and influence of the stock owned by the acquiring person. Our Board of Directors can prevent the plan from operating by approving the transaction in advance, which gives us significant power to approve or disapprove of the efforts of a person or group to acquire a large interest in our company.
Changes in market conditions could adversely affect the market price of our common stock.
As with other publicly traded equity securities, the value of our common stock depends on various market conditions that may change from time to time. Among the market conditions that may affect the value of our common stock are the following:
the extent of investor interest in our securities;
the general reputation of REITs and the attractiveness of our equity securities in comparison to other equity securities, including securities issued by other real estate-based companies;
our underlying asset value;
investor confidence in the stock and bond markets, generally;
national economic conditions;
changes in tax laws;
our financial performance;
changes in our credit ratings; and
general stock and bond market conditions.
The market value of our common stock is based primarily upon the market’s perception of our growth potential and our current and potential future earnings and cash dividends. Consequently, our common stock may trade at prices that are greater or less than our net asset value per share of common stock. If our future earnings or cash dividends are less than expected, it is likely that the market price of our common stock will diminish.
Further issuances of equity securities may be dilutive to current securityholders.
The interests of our existing securityholders could be diluted if additional equity securities are issued to finance future developments, acquisitions, or repay indebtedness. Our ability to execute our business strategy depends on our access to an appropriate blend of debt financing, including unsecured lines of credit and other forms of secured and unsecured debt, and equity financing, including common and preferred equity.
The number of shares available for future sale could adversely affect the market price of our stock.
In connection with and subsequent to our initial public offering, we have completed many private placement transactions in which shares of capital stock of Boston Properties, Inc. or partnership interests in BPLP were issued to owners of properties we acquired or to institutional investors. This common stock, or common stock issuable in exchange for such partnership interests in BPLP, may be sold in the public securities markets over time under registration rights we granted to these investors. Additional common stock issuable under our employee benefit and other incentive plans, including as a result of the grant of stock options and restricted equity securities, may also be sold in the market at some time in the future. Future sales of our common stock in the market could adversely affect the price of our common stock. We cannot predict the effect the perception in the market that such sales may occur will have on the market price of our common stock.
We may change our policies without obtaining the approval of our stockholders.
Our operating and financial policies, including our policies with respect to acquisitions of real estate, growth, operations, indebtedness, capitalization and dividends, are exclusively determined by our Board of Directors. Accordingly, our securityholders do not control these policies.
Our success depends on key personnel whose continued service is not guaranteed.
We depend on the efforts of key personnel, particularly Mortimer B. Zuckerman, Chairman of our Board and Chief Executive Officer, and Douglas T. Linde, our President.President, and Raymond A. Ritchey, Executive Vice President, National Director of Acquisition and Development. Among the reasons that Messrs. Zuckerman, and D. Linde and Ritchey are important to our success is that each has a national reputation, which attracts business and investment opportunities and assists us in negotiations with lenders, joint venture partners and other investors. If we lost their services, our relationships with lenders, potential tenants and industry personnel could diminish. Mr. Zuckerman has substantial outside business interests that could interfere with his ability to devote his full time to our business and affairs.
Our two Executive Vice Presidents, our Chief Financial Officer and five Regional Managers also have strong reputations. Their reputations aid us in identifying opportunities, having opportunities brought to us, and negotiating with tenants and build-to-suit prospects. While we believe that we could find replacements for these key personnel, the loss of their services could materially and adversely affect our operations because of diminished relationships with lenders, prospective tenants and industry personnel.
Conflicts of interest exist with holders of interests in BPLP.
Sales of properties and repayment of related indebtedness will have different effects on holders of interests in BPLP than on our stockholders.
Some holders of interests in BPLP, including Mr. Zuckerman, and the estate of Mr. E. Linde, could incur adverse tax consequences upon the sale of certain of our properties and on the repayment of related debt which differ from the tax consequences to us and our stockholders. Consequently, these holders of partnership interests in BPLP may have different objectives regarding the appropriate pricing and timing of any such sale or repayment of debt. While we have exclusive authority under the limited partnership agreement of BPLP to determine when to refinance or repay debt or whether, when, and on what terms to sell a property, subject, in the case of certain properties, to the contractual commitments described below, any such decision would require the approval of our Board of Directors. While the Board of Directors has a policy with respect to these matters, as directors and executive officers, Messrs. Zuckerman and D. Linde could exercise their influence in a manner inconsistent with the interests of some, or a majority, of our stockholders, including in a manner which could prevent completion of a sale of a property or the repayment of indebtedness.
Agreement not to sell some properties.
We have entered into agreements with respect to some properties that we have acquired in exchange for partnership interests in BPLP. Pursuant to those agreements, we have agreed not to sell or otherwise transfer some of our properties, prior to specified dates, in any transaction that would trigger taxable income and we are responsible for the reimbursement of certain tax-related costs to the prior owners if the subject properties are sold in a taxable sale. In general, our obligations to the prior owners are limited in time and only apply to actual damages suffered. As of December 31, 20102012 there were a total of sixseven properties subject to these restrictions. In the aggregate, all properties subject to the restrictions accounted for approximately 24%17% of our total revenue (the sum of our total consolidated revenue and our share of joint venture revenue) for the year ended December 31, 2010.2012.
BPLP has also entered into agreements providing prior owners of properties with the right to guarantee specific amounts of indebtedness and, in the event that the specific indebtedness they guarantee is repaid or reduced, additional and/or substitute indebtedness. These agreements may hinder actions that we may otherwise desire to take to repay or refinance guaranteed indebtedness because we would be required to make payments to the beneficiaries of such agreements if we violate these agreements.
Mr. Zuckerman will continue to engage in other activities.
Mr. Zuckerman has a broad and varied range of investment interests. He could acquire an interest in a company which is not currently involved in real estate investment activities but which may acquire real property in the future. However, pursuant to his employment agreement, Mr. Zuckerman will not, in general, have management control over such companies and, therefore, he may not be able to prevent one or more of such companies from engaging in activities that are in competition with our activities.
Compliance or failure to comply with the Americans with Disabilities Act or other safety regulations and requirements could result in substantial costs.
The Americans with Disabilities Act generally requires that public buildings, including office buildings and hotels, be made accessible to disabled persons. Noncompliance could result in the imposition of fines by the federal government or the award of damages to private litigants. If, under the Americans with Disabilities Act, we are required to make substantial alterations and capital expenditures in one or more of our properties, including the removal of access barriers, it could adversely affect our financial condition and results of operations, as well as the amount of cash available for distribution to our securityholders.
Our properties are subject to various federal, state and local regulatory requirements, such as state and local fire and life safety requirements. If we fail to comply with these requirements, we could incur fines or private damage awards. We do not know whether existing requirements will change or whether compliance with future requirements will require significant unanticipated expenditures that will affect our cash flow and results of operations.
Failure to comply with Federal government contractor requirements could result in substantial costs and loss of substantial revenue.
We are subject to compliance with a wide variety of complex legal requirements because we are a Federal government contractor. These laws regulate how we conduct business, require us to administer various compliance programs and require us to impose compliance responsibilities on some of our contractors. Our failure to comply with these laws could subject us to fines and penalties, cause us to be in default of our leases and other contracts with the Federal government and bar us from entering into future leases and other contracts with the Federal government. There can be no assurance that these costs and loss of revenue will not have a material adverse effect on our properties, operations or business.
Some potential losses are not covered by insurance.
We carry insurance coverage on our properties of types and in amounts and with deductibles that we believe are in line with coverage customarily obtained by owners of similar properties. In response to the uncertainty in the insurance market following the terrorist attacks of September 11, 2001, the Federal Terrorism Risk Insurance Act (as amended, “TRIA”) was enacted in November 2002 to require regulated insurers to make available coverage for “certified” acts of terrorism (as defined by the statute). The expiration date of TRIA was extended to December 31, 2014 by the Terrorism Risk Insurance Program Reauthorization Act of 2007 (“TRIPRA”). and we can provide no assurance that it will be extended further. Currently, the per occurrence limits of our portfolio property insurance program are $1.0 billion, including coverage for acts of terrorism certified under TRIA other than nuclear, biological, chemical or radiological terrorism (“Terrorism Coverage”). We currently insure certainalso carry $250 million of Terrorism Coverage for 601 Lexington Avenue, New York, New York (“601 Lexington Avenue”) in excess of the $1.0 billion of Terrorism Coverage in our property insurance program which is provided by IXP, LLC (“IXP”) as a direct insurer. Certain properties, including the General Motors Building located at 767 Fifth Avenue in New York, New York (“767 Fifth Avenue”), are currently insured in a separate stand alone insurance program.programs. The property insurance program per occurrence limits for 767 Fifth Avenue are $1.625 billion, including Terrorism Coverage, with $1.375 billion of Terrorism Coverage in excess of $250 million being provided by NYXP, LLC, (“NYXP”) as a direct insurer. We also currently carry nuclear, biological, chemical and radiological terrorism insurance coverage for acts of terrorism certified under TRIA (“NBCR Coverage”), which is provided by IXP, LLC (“IXP”) as a direct insurer, for the properties in our portfolio, including 767 Fifth Avenue, but excluding the properties owned by our Value-Added Fund and certain other properties owned in joint ventures with third parties or which we manage. The per occurrence limit for NBCR Coverage is $1 billion. Under TRIA, after the payment of the required deductible and coinsurance, the additional Terrorism Coverage provided by IXP for 601 Lexington Avenue, the NBCR Coverage provided by IXP and the Terrorism Coverage provided by NYXP are backstopped by the Federal Government if the aggregate industry insured losses resulting from a certified act of terrorism exceed a “program trigger.” The program trigger is $100 million and the coinsurance is 15%. Under TRIPRA, if the Federal Government pays out for a loss under TRIA, it is mandatory that the Federal Government recoup the full amount of the loss from insurers offering TRIA coverage after the payment of the loss pursuant to a formula in TRIPRA. We may elect to terminate the NBCR Coverage if the Federal Government seeks recoupment for losses paid under TRIA, if there is a change in our portfolio or for any other reason. In the event TRIPRA is not extended beyond December 31, 2014, (i) we may pursue alternative approaches to secure coverage for acts of terrorism thereby potentially increasing our overall cost of insurance, (ii) if such insurance is not available at commercially reasonable rates with limits equal to our current coverage or at all, we may not continue to have full occurrence limit coverage for acts of terrorism, (iii) we may not satisfy the insurance requirements under existing or future debt financings secured by individual properties and (iv) we
may not be able to obtain future debt financings secured by individual properties. We intend to continue to monitor the scope, nature and cost of available terrorism insurance and maintain terrorism insurance in amounts and on terms that are commercially reasonable.
We also currently carry earthquake insurance on our properties located in areas known to be subject to earthquakes in an amount and subject to self-insurance that we believe are commercially reasonable. In addition, this insurance is subject to a deductible in the amount of 5% of the value of the affected property. Specifically, we currently carry earthquake insurance which covers our San Francisco region (excluding 680 Folsom Street) with a $120 million per occurrence limit and a $120 million annual aggregate limit, $20 million of which is provided by IXP, as a direct
insurer. In addition, the builders risk policy maintained for the development of 680 Folsom Street in San Francisco includes a $20 million per occurrence and annual aggregate limit of earthquake coverage. The amount of our earthquake insurance coverage may not be sufficient to cover losses from earthquakes. In addition, the amount of earthquake coverage could impact our ability to finance properties subject to earthquake risk. We may discontinue earthquake insurance on some or all of our properties in the future if the premiums exceed our estimation of the value of the coverage.
IXP, a captive insurance company which is a wholly-owned subsidiary, acts as a direct insurer with respect to a portion of our earthquake insurance coverage for our Greater San Francisco properties, the additional Terrorism Coverage for 601 Lexington Avenue and our NBCR Coverage. The additional Terrorism Coverage provided by IXP for 601 Lexington Avenue only applies to losses which exceed the program trigger under TRIA. NYXP, a captive insurance company which is a wholly-owned subsidiary, acts as a direct insurer with respect to a portion of our Terrorism Coverage for 767 Fifth Avenue. Currently, NYXP only insures losses which exceed the program trigger under TRIA and NYXP reinsures with a third-party insurance company any coinsurance payable under TRIA. Insofar as we own IXP and NYXP, we are responsible for their liquidity and capital resources, and the accounts of IXP and NYXP are part of our consolidated financial statements. In particular, if a loss occurs which is covered by our NBCR Coverage but is less than the applicable program trigger under TRIA, IXP would be responsible for the full amount of the loss without any backstop by the Federal Government. IXP and NYXP would also be responsible for any recoupment charges by the Federal Government in the event losses are paid out and their insurance policies are maintained after the payout by the Federal Government. If we experience a loss and IXP or NYXP are required to pay under their insurance policies, we would ultimately record the loss to the extent of the required payment. Therefore, insurance coverage provided by IXP and NYXP should not be considered as the equivalent of third-party insurance, but rather as a modified form of self-insurance. In addition, our Operating Partnership has issued a guarantee to cover liabilities of IXP in the amount of $20.0 million.
The mortgages on our properties typically contain requirements concerning the financial ratings of the insurers who provide policies covering the property. We provide the lenders on a regular basis with the identity of the insurance companies in our insurance programs. The ratings of some of our insurers are below the rating requirements in some of our loan agreements and the lenders for these loans could attempt to claim an event of default has occurred under the loan. We believe we could obtain insurance with insurers which satisfy the rating requirements. Additionally, in the future our ability to obtain debt financing secured by individual properties, or the terms of such financing, may be adversely affected if lenders generally insist on ratings for insurers or amounts of insurance which are difficult to obtain or which result in a commercially unreasonable premium. There can be no assurance that a deficiency in the financial ratings of one or more of our insurers will not have a material adverse effect on us.
We continue to monitor the state of the insurance market in general, and the scope and costs of coverage for acts of terrorism and California earthquake risk in particular, but we cannot anticipate what coverage will be available on commercially reasonable terms in future policy years. There are other types of losses, such as from wars, or the presence of mold at our properties, for which we cannot obtain insurance at all or at a reasonable cost. With respect to such losses and losses from acts of terrorism, earthquakes or other catastrophic events, if we experience a loss that is uninsured or that exceeds policy limits, we could lose the capital invested in the damaged properties, as well as the anticipated
future revenues from those properties. Depending on the specific circumstances of each affected property, it is possible that we could be liable for mortgage indebtedness or other obligations related to the property. Any such loss could materially and adversely affect our business and financial condition and results of operations.
Actual or threatened terrorist attacks may adversely affect our ability to generate revenues and the value of our properties.
We have significant investments in large metropolitan markets that have been or may be in the future the targets of actual or threatened terrorism attacks, including midtown Manhattan,Boston, New York, San Francisco and Washington, DC, Boston and San Francisco.DC. As a result, some tenants in these markets may choose to relocate their businesses to other markets or to lower-profile office buildings within these markets that may be perceived to be less likely targets of future terrorist activity. This could result in an overall decrease in the demand for office space in these markets generally or in our properties in particular, which could increase vacancies in our properties or necessitate that we lease our properties on less favorable terms or both. In addition, future terrorist attacks in these markets could
directly or indirectly damage our properties, both physically and financially, or cause losses that materially exceed our insurance coverage. As a result of the foregoing, our ability to generate revenues and the value of our properties could decline materially. See also “—Some potential losses are not covered by insurance.”
We face risks associated with our tenants being designated “Prohibited Persons” by the Office of Foreign Assets Control.
Pursuant to Executive Order 13224 and other laws, the Office of Foreign Assets Control of the United States Department of the Treasury (“OFAC”) maintains a list of persons designated as terrorists or who are otherwise blocked or banned (“Prohibited Persons”). OFAC regulations and other laws prohibit conducting business or engaging in transactions with Prohibited Persons (the “OFAC Requirements”). Certain of our loan and other agreements require us to comply with OFAC Requirements. We have established a compliance program whereby tenants and others with whom we conduct business are checked against the OFAC list of Prohibited Persons prior to entering into any agreement and on a periodic basis thereafter. Our leases and other agreements, in general, require the other party to comply with OFAC Requirements. If a tenant or other party with whom we contract is placed on the OFAC list we may be required by the OFAC Requirements to terminate the lease or other agreement. Any such termination could result in a loss of revenue or a damage claim by the other party that the termination was wrongful.
We face possible risks associated with the physical effects of climate change.
We cannot predictassert with certainty whether climate change is occurring and, if so, at what rate. However, the physical effects of climate change could have a material adverse effect on our properties, operations and business. For example, many of our properties are located along the East and West coasts, particularly those in the Central Business Districts of midtown Manhattan, Boston, New York, and San Francisco. To the extent climate change causes changes in weather patterns, our markets could experience increases in storm intensity and rising sea-levels. Over time, these conditions could result in declining demand for office space in our buildings or theour inability of us to operate the buildings at all. Climate change may also have indirect effects on our business by increasing the cost of (or making unavailable) property insurance on terms we find acceptable, increasing the cost of energy and increasing the cost of snow removal at our properties. There can be no assurance that climate change will not have a material adverse effect on our properties, operations or business.
Potential liability for environmental contamination could result in substantial costs.
Under federal, state and local environmental laws, ordinances and regulations, we may be required to investigate and clean up the effects of releases of hazardous or toxic substances or petroleum products at our properties simply because of our current or past ownership or operation of the real estate. If unidentified environmental problems arise, we may have to make substantial payments, which could adversely affect our cash
flow and our ability to make distributions to our securityholders, because:
as owner or operator we may have to pay for property damage and for investigation and clean-up costs incurred in connection with the contamination;
the law typically imposes clean-up responsibility and liability regardless of whether the owner or operator knew of or caused the contamination;
even if more than one person may be responsible for the contamination, each person who shares legal liability under the environmental laws may be held responsible for all of the clean-up costs; and
governmental entities and third parties may sue the owner or operator of a contaminated site for damages and costs.
These costs could be substantial and in extreme cases could exceed the amount of our insurance or the value of the contaminated property. We currently carry environmental insurance in an amount and subject to deductibles that we believe are commercially reasonable. Specifically, we carry a pollution legal liability policy with a $10 million limit per incident and a policy aggregate limit of $30 million. The presence of hazardous or toxic substances or petroleum products or the failure to properly remediate contamination may materially and adversely affect our ability to borrow against, sell or rent an affected property. In addition, applicable environmental laws create liens on contaminated sites in favor of the government for damages and costs it incurs in connection with a contamination. Changes in laws, regulations and practices and their implementation increasing the potential liability for environmental conditions existing at our properties, or increasing the restrictions on the handling, storage or discharge of hazardous or toxic substances or petroleum products or other actions may result in significant unanticipated expenditures.
Environmental laws also govern the presence, maintenance and removal of asbestos. Suchasbestos and other building materials. For example, laws require that owners or operators of buildings containing asbestos:
properly manage and maintain the asbestos;
notify and train those who may come into contact with asbestos; and
undertake special precautions, including removal or other abatement, if asbestos would be disturbed during renovation or demolition of a building.
Such laws may impose fines and penalties on building owners or operators who fail to comply with these requirements and may allow third parties to seek recovery from owners or operators for personal injury associated with exposure to asbestos fibers.
Some of our properties are located in urban and previously developed areas where fill or current or historic industrial uses of the areas have caused site contamination. It is our policy to retain independent environmental consultants to conduct or update Phase I environmental site assessments and asbestos surveys with respect to our acquisition of properties. These assessments generally include a visual inspection of the properties and the surrounding areas, an examination of current and historical uses of the properties and the surrounding areas and a review of relevant state, federal and historical documents, but do not involve invasive techniques such as soil and ground water sampling. Where appropriate, on a property-by-property basis, our practice is to have these consultants conduct additional testing, including sampling for asbestos, for lead in drinking water and, for soil and/or groundwater contamination where underground storage tanks are or were located or where other past site usage creates a potential environmental problem. Even though these environmental assessments are conducted, there is still the risk that:
the environmental assessments and updates did not identify all potential environmental liabilities;
a prior owner created a material environmental condition that is not known to us or the independent consultants preparing the assessments;
new environmental liabilities have developed since the environmental assessments were conducted; and
future uses or conditions such as changes in applicable environmental laws and regulations could result in environmental liability for us.
Inquiries about indoor air quality may necessitate special investigation and, depending on the results, remediation beyond our regular indoor air quality testing and maintenance programs. Indoor air quality issues can stem from inadequate ventilation, chemical contaminants from indoor or outdoor sources, and biological contaminants such as molds, pollen, viruses and bacteria. Indoor exposure to chemical or biological contaminants above certain levels can be alleged to be connected to allergic reactions or other health effects and symptoms in susceptible individuals. If these conditions were to occur at one of our properties, we may be subject to third-party claims for personal injury, or may need to undertake a targeted remediation program, including without limitation, steps to increase indoor ventilation rates and
eliminate sources of contaminants. Such remediation programs could be costly, necessitate the temporary relocation of some or all of the property’s tenants or require rehabilitation of the affected property.
We face risks associated with security breaches through cyber attacks, cyber intrusions or otherwise, as well as other significant disruptions of our information technology (IT) networks and related systems.
We face risks associated with security breaches, whether through cyber attacks or cyber intrusions over the Internet, malware, computer viruses, attachments to e-mails, persons inside our organization or persons with access to systems inside our organization, and other significant disruptions of our IT networks and related systems. The risk of a security breach or disruption, particularly through cyber attack or cyber intrusion, including by computer hackers, foreign governments and cyber terrorists, has generally increased as the number, intensity and sophistication of attempted attacks and intrusions from around the world have increased. Our IT networks and related systems are essential to the operation of our business and our ability to perform day-to-day operations (including managing our building systems) and, in some cases, may be critical to the operations of certain of our tenants. Although we make efforts to maintain the security and integrity of these types of IT networks and related systems, and we have implemented various measures to manage the risk of a security breach or disruption, there can be no assurance that our security efforts and measures will be effective or that attempted security breaches or disruptions would not be successful or damaging. Even the most well protected information, networks, systems and facilities remain potentially vulnerable because the techniques used in such attempted security breaches evolve and generally are not recognized until launched against a target, and in some cases are designed not be detected and, in fact, may not be detected. Accordingly, we may be unable to anticipate these techniques or to implement adequate security barriers or other preventative measures, and thus it is impossible for us to entirely mitigate this risk.
A security breach or other significant disruption involving our IT networks and related systems could:
disrupt the proper functioning of our networks and systems and therefore our operations and/or those of certain of our tenants;
result in misstated financial reports, violations of loan covenants, missed reporting deadlines and/or missed permitting deadlines;
result in our inability to properly monitor our compliance with the rules and regulations regarding our qualification as a REIT;
result in the unauthorized access to, and destruction, loss, theft, misappropriation or release of proprietary, confidential, sensitive or otherwise valuable information of ours or others, which others could use to compete against us or for disruptive, destructive or otherwise harmful purposes and outcomes;
result in our inability to maintain the building systems relied upon by our tenants for the efficient use of their leased space;
require significant management attention and resources to remedy any damages that result;
subject us to claims for breach of contract, damages, credits, penalties or termination of leases or other agreements; or
damage our reputation among our tenants and investors generally.
Any or all of the foregoing could have a material adverse effect on our results of operations, financial condition and cash flows.
We did not obtain new owner’s title insurance policies in connection with properties acquired during our initial public offering.
We acquired many of our properties from our predecessors at the completion of our initial public offering in June 1997. Before we acquired these properties, each of them was insured by a title insurance policy. We did not obtain new owner’s title insurance policies in connection with the acquisition of these properties. To the extent we have financed properties after acquiring them in connection with the initial public offering, we have obtained new title insurance policies, however, the amount of these policies may be less than the current or future value of the applicable properties. Nevertheless, because in many instances we acquired these properties indirectly by acquiring ownership of the entity that owned the property and those owners remain in existence as our subsidiaries, some of these title insurance policies may continue to benefit us. Many of these title insurance policies may be for amounts less than the current or future values of the applicable properties. If there was a title defect related to any of these properties, or to any of the properties acquired at the time of our initial public offering, that is no longer covered by a title insurance policy, we could lose both our capital invested in and our anticipated profits from such property. We have obtained title insurance policies for all properties that we have acquired after our initial public offering, however, these policies may be for amounts less than the current or future values of the applicable properties.
Because of the ownership structure of our hotel property, we face potential adverse effects from changes to the applicable tax laws.
We own one hotel property. However, under the Internal Revenue Code, REITs like us are not allowed to operate hotels directly or indirectly. Accordingly, we lease our hotel property to one of our taxable REIT subsidiaries. As lessor, we are entitled to a percentage of the gross receipts from the operation of the hotel property. Marriott International, Inc. manages the hotel under the Marriott name pursuant to a management contract with the taxable REIT subsidiary as lessee. While the taxable REIT subsidiary structure allows the economic benefits of ownership to flow to us, the taxable REIT subsidiary is subject to tax on its income from the operations of the hotel at the federal and state level. In addition, the taxable REIT subsidiary is subject to detailed tax regulations that affect how it may be capitalized and operated. If the tax laws applicable to taxable REIT subsidiaries are modified, we may be forced to modify the structure for owning our hotel property, and such changes may adversely affect the cash flows from our hotel. In addition, the Internal Revenue Service, the United States Treasury Department and Congress frequently review federal income tax legislation, and we cannot predict whether, when or to what extent new federal tax laws, regulations, interpretations or rulings will be adopted. Any of such actions may prospectively or retroactively modify the tax treatment of the taxable REIT subsidiary and, therefore, may adversely affect our after-tax returns from our hotel property.
We face possible adverse changes in tax laws.
From time to time changes in state and local tax laws or regulations are enacted, which may result in an increase in our tax liability. A shortfall in tax revenues for states and municipalities in which we operate may lead to an increase in the frequency and size of such changes. If such changes occur, we may be required to pay additional taxes on our assets or income. These increased tax costs could adversely affect our financial condition and results of operations and the amount of cash available for the payment of dividends.
We face possible state and local tax audits.
Because we are organized and qualify as a REIT, we are generally not subject to federal income taxes, but areis subject to certain state and local taxes. In the normal course of business, certain entities through which we own real estate either have undergone, or are currently undergoing, tax audits. Although we believe that we have
substantial arguments in favor of our positions in the ongoing audits, in some instances there is no controlling precedent or interpretive guidance on the specific point at issue. Collectively, tax deficiency notices received to date from the jurisdictions conducting the ongoing audits have not been material. However, there can be no assurance that future audits will not occur with increased frequency or that the ultimate result of such audits will not have a material adverse effect on our results of operations.
Changes in accounting pronouncements could adversely affect our operating results, in addition to the reported financial performance of our tenants.
Accounting policies and methods are fundamental to how we record and report our financial condition and results of operations. Uncertainties posed by various initiatives of accounting standard-setting by the Financial Accounting Standards Board and the Securities and Exchange Commission, which create and interpret applicable accounting standards for U.S. companies, may change the financial accounting and reporting standards or their interpretation and application of these standards that govern the preparation of our financial statements. Proposed changes include, but are not limited to, changes in lease accounting and the adoption of accounting standards likely to require the increased use of “fair-value” measures.
These changes could have a material impact on our reported financial condition and results of operations. In some cases, we could be required to apply a new or revised standard retroactively, resulting in potentially material restatements of prior period financial statements. Similarly, these changes could have a material impact on our tenants’ reported financial condition or results of operations or could affect our tenants’ preferences regarding leasing real estate.
| Item 1B. | Unresolved Staff |
None.
| Item 2. |
At December 31, 2010,2012, we owned or had interests in 146157 properties, totaling approximately 39.944.4 million net rentable square feet, including fivenine properties under construction totaling approximately 2.02.8 million net rentable square feet. In addition, we had structured parking for approximately 40,66446,833 vehicles containing approximately 13.715.9 million square feet. Our properties consisted of (1) 140149 office properties, including 121132 Class A office buildings, including threeeight properties under construction, and 1917 properties that support both office and technical uses, (2) threefour retail properties, (3) one hotel and (4) twothree residential properties (both(one of which areis under construction). In addition, we own or control 513.3509.3 acres of land for future development. The table set forth below shows information relating to the properties we owned, or in which we had an ownership interest, at December 31, 2010.2012. Information relating to properties owned by the Value-Added Fund is not included in our portfolio information tables or any other portfolio level statistics because the Value-Added Fund invests in assets within our existing markets that havehad deficiencies in property characteristics which provideprovided an opportunity to create value through repositioning, refurbishment or renovation. We therefore believe including such information in our portfolio tables and statistics would render the portfolio information less useful to investors. Information relating to the Value-Added Fund is set forth separately below.
Properties | Location | % Leased as of December 31, 2010 | Number of Buildings | Net Rentable Square Feet | Location | % Leased as of December 31, 2012 | Number of Buildings | Net Rentable Square Feet | ||||||||||||||||||||
Class A Office | ||||||||||||||||||||||||||||
General Motors Building (60% ownership) | New York, NY | 98.4 | % | 1 | 1,803,465 | |||||||||||||||||||||||
767 Fifth Avenue (The GM Building) (60% ownership) | New York, NY | 95.1 | % | 1 | 1,817,438 | |||||||||||||||||||||||
John Hancock Tower | Boston, MA | 97.4 | % | 1 | 1,721,633 | |||||||||||||||||||||||
399 Park Avenue | New York, NY | 98.8 | % | 1 | 1,707,476 | New York, NY | 94.0 | % | 1 | 1,708,250 | ||||||||||||||||||
John Hancock Tower | Boston, MA | 96.6 | % | 1 | 1,693,553 | |||||||||||||||||||||||
601 Lexington Avenue | New York, NY | 96.0 | % | 1 | 1,629,685 | New York, NY | 98.4 | % | 1 | 1,629,868 | ||||||||||||||||||
100 Federal Street | Boston, MA | 95.6 | % | 1 | 1,265,399 | |||||||||||||||||||||||
Times Square Tower | New York, NY | 99.1 | % | 1 | 1,243,958 | New York, NY | 99.1 | % | 1 | 1,245,817 | ||||||||||||||||||
800 Boylston Street—The Prudential Center | Boston, MA | 90.9 | % | 1 | 1,226,475 | Boston, MA | 97.8 | % | 1 | 1,228,651 | ||||||||||||||||||
599 Lexington Avenue | New York, NY | 98.3 | % | 1 | 1,043,649 | New York, NY | 98.3 | % | 1 | 1,045,128 | ||||||||||||||||||
Bay Colony Corporate Center | Waltham, MA | 60.5 | % | 4 | 985,334 | |||||||||||||||||||||||
Embarcadero Center Four | San Francisco, CA | 93.6 | % | 1 | 936,791 | San Francisco, CA | 90.0 | % | 1 | 936,850 | ||||||||||||||||||
111 Huntington Avenue—The Prudential Center | Boston, MA | 94.2 | % | 1 | 859,641 | Boston, MA | 97.2 | % | 1 | 857,975 | ||||||||||||||||||
Embarcadero Center One | San Francisco, CA | 84.1 | % | 1 | 833,723 | San Francisco, CA | 96.8 | % | 1 | 833,594 | ||||||||||||||||||
Atlantic Wharf Office | Boston, MA | 93.1 | % | 1 | 797,877 | |||||||||||||||||||||||
Embarcadero Center Two | San Francisco, CA | 97.2 | % | 1 | 779,583 | San Francisco, CA | 98.0 | % | 1 | 779,768 | ||||||||||||||||||
Embarcadero Center Three | San Francisco, CA | 92.7 | % | 1 | 775,086 | San Francisco, CA | 98.5 | % | 1 | 775,086 | ||||||||||||||||||
Capital Gallery | Washington, DC | 90.6 | % | 1 | 631,033 | |||||||||||||||||||||||
South of Market | Reston, VA | 99.7 | % | 3 | 647,682 | Reston, VA | 100.0 | % | 3 | 623,665 | ||||||||||||||||||
Two Grand Central Tower (60% ownership) | New York, NY | 80.6 | % | 1 | 646,227 | |||||||||||||||||||||||
Capital Gallery | Washington, DC | 100.0 | % | 1 | 621,009 | |||||||||||||||||||||||
Metropolitan Square (51% ownership) | Washington, DC | 96.2 | % | 1 | 586,950 | Washington, DC | 97.8 | % | 1 | 588,917 | ||||||||||||||||||
125 West 55th Street (60% ownership) | New York, NY | 100.0 | % | 1 | 581,267 | |||||||||||||||||||||||
125 West 55th Street (60% ownership) | New York, NY | 93.4 | % | 1 | 585,316 | |||||||||||||||||||||||
3200 Zanker Road | San Jose, CA | 100.0 | % | 4 | 543,900 | San Jose, CA | 49.9 | % | 4 | 543,900 | ||||||||||||||||||
901 New York Avenue (25% ownership) | Washington, DC | 99.8 | % | 1 | 539,229 | Washington, DC | 99.8 | % | 1 | 539,229 | ||||||||||||||||||
Reservoir Place | Waltham, MA | 79.5 | % | 1 | 526,080 | Waltham, MA | 80.3 | % | 1 | 527,980 | ||||||||||||||||||
Fountain Square (50% ownership) | Reston, VA | 93.3 | % | 2 | 521,536 | |||||||||||||||||||||||
601 and 651 Gateway | South San Francisco, CA | 96.2 | % | 2 | 506,224 | South San Francisco, CA | 98.8 | % | 2 | 506,271 | ||||||||||||||||||
101 Huntington Avenue—The Prudential Center | Boston, MA | 100.0 | % | 1 | 505,939 | Boston, MA | 100.0 | % | 1 | 505,389 | ||||||||||||||||||
2200 Pennsylvania Avenue | Washington, DC | 95.0 | % | 1 | 458,761 | |||||||||||||||||||||||
One Freedom Square | Reston, VA | 95.6 | % | 1 | 423,922 | Reston, VA | 87.4 | % | 1 | 436,083 | ||||||||||||||||||
Two Freedom Square | Reston, VA | 96.7 | % | 1 | 421,142 | Reston, VA | 92.3 | % | 1 | 421,142 | ||||||||||||||||||
One Tower Center | East Brunswick, NJ | 47.2 | % | 1 | 414,648 | |||||||||||||||||||||||
Market Square North (50% ownership) | Washington, DC | 90.9 | % | 1 | 402,740 | |||||||||||||||||||||||
Properties | Location | % Leased as of December 31, 2010 | Number of Buildings | Net Rentable Square Feet | Location | % Leased as of December 31, 2012 | Number of Buildings | Net Rentable Square Feet | ||||||||||||||||||||
One Tower Center | East Brunswick, NJ | 47.2 | % | 1 | 414,648 | |||||||||||||||||||||||
Market Square North (50% ownership) | Washington, DC | 83.7 | % | 1 | 409,890 | |||||||||||||||||||||||
140 Kendrick Street | Needham, MA | 100.0 | % | 3 | 380,987 | Needham, MA | 84.2 | % | 3 | 380,987 | ||||||||||||||||||
One and Two Discovery Square | Reston, VA | 95.3 | % | 2 | 366,990 | Reston, VA | 100.0 | % | 2 | 366,990 | ||||||||||||||||||
Weston Corporate Center | Weston, MA | 100.0 | % | 1 | 356,367 | Weston, MA | 100.0 | % | 1 | 356,995 | ||||||||||||||||||
505 9th Street, NW (50% ownership) | Washington, DC | 96.0 | % | 1 | 321,943 | |||||||||||||||||||||||
510 Madison Avenue | New York, NY | 54.6 | % | 1 | 355,598 | |||||||||||||||||||||||
505 9th Street, N.W. (50% ownership) | Washington, DC | 100.0 | % | 1 | 321,943 | |||||||||||||||||||||||
One Reston Overlook | Reston, VA | 100.0 | % | 1 | 319,519 | |||||||||||||||||||||||
1333 New Hampshire Avenue | Washington, DC | 100.0 | % | 1 | 315,371 | Washington, DC | 99.5 | % | 1 | 315,371 | ||||||||||||||||||
One Reston Overlook | Reston, VA | 100.0 | % | 1 | 312,685 | |||||||||||||||||||||||
Waltham Weston Corporate Center | Waltham, MA | 76.3 | % | 1 | 306,789 | Waltham, MA | 93.2 | % | 1 | 306,687 | ||||||||||||||||||
230 CityPoint | Waltham, MA | 95.8 | % | 1 | 299,944 | Waltham, MA | 68.9 | % | 1 | 300,993 | ||||||||||||||||||
Wisconsin Place Office | Chevy Chase, MD | 96.5 | % | 1 | 299,186 | Chevy Chase, MD | 100.0 | % | 1 | 299,186 | ||||||||||||||||||
540 Madison Avenue (60% ownership) | New York, NY | 95.6 | % | 1 | 288,580 | New York, NY | 66.0 | % | 1 | 293,628 | ||||||||||||||||||
12310 Sunrise Valley(1) | Reston, VA | 100.0 | % | 1 | 263,870 | |||||||||||||||||||||||
One Patriots Park (formerly 12310 Sunrise Valley) | Reston, VA | 100.0 | % | 1 | 267,531 | |||||||||||||||||||||||
Quorum Office Park | Chelmsford, MA | 82.5 | % | 2 | 267,527 | |||||||||||||||||||||||
Reston Corporate Center | Reston, VA | 100.0 | % | 2 | 261,046 | Reston, VA | 100.0 | % | 2 | 261,046 | ||||||||||||||||||
Quorum Office Park | Chelmsford, MA | 100.0 | % | 2 | 259,918 | |||||||||||||||||||||||
Democracy Tower | Reston, VA | 100.0 | % | 1 | 259,441 | |||||||||||||||||||||||
611 Gateway | South San Francisco, CA | 81.0 | % | 1 | 257,664 | |||||||||||||||||||||||
New Dominion Technology Park—Building Two | Herndon, VA | 100.0 | % | 1 | 257,400 | Herndon, VA | 100.0 | % | 1 | 257,400 | ||||||||||||||||||
611 Gateway | South San Francisco, CA | 100.0 | % | 1 | 256,302 | |||||||||||||||||||||||
200 West Street | Waltham, MA | 29.0 | % | 1 | 255,378 | Waltham, MA | 80.5 | % | 1 | 256,245 | ||||||||||||||||||
12300 Sunrise Valley(1) | Reston, VA | 100.0 | % | 1 | 255,244 | |||||||||||||||||||||||
1330 Connecticut Avenue | Washington, DC | 98.3 | % | 1 | 252,136 | Washington, DC | 100.0 | % | 1 | 252,136 | ||||||||||||||||||
500 E Street, SW | Washington, DC | 100.0 | % | 1 | 248,336 | |||||||||||||||||||||||
500 E Street, S. W. | Washington, DC | 100.0 | % | 1 | 248,336 | |||||||||||||||||||||||
Five Cambridge Center | Cambridge, MA | 100.0 | % | 1 | 240,480 | Cambridge, MA | 100.0 | % | 1 | 240,480 | ||||||||||||||||||
Democracy Tower | Reston, VA | 100.0 | % | 1 | 235,436 | |||||||||||||||||||||||
New Dominion Technology Park—Building One | Herndon, VA | 100.0 | % | 1 | 235,201 | Herndon, VA | 100.0 | % | 1 | 235,201 | ||||||||||||||||||
510 Carnegie Center | Princeton, NJ | 100.0 | % | 1 | 234,160 | Princeton, NJ | 100.0 | % | 1 | 234,160 | ||||||||||||||||||
One Cambridge Center | Cambridge, MA | 90.4 | % | 1 | 215,573 | Cambridge, MA | 95.8 | % | 1 | 215,629 | ||||||||||||||||||
635 Massachusetts Avenue(1) | Washington, DC | 100.0 | % | 1 | 211,000 | |||||||||||||||||||||||
601 Massachusetts Avenue (1) | Washington, DC | 100.0 | % | 1 | 211,000 | |||||||||||||||||||||||
77 CityPoint | Waltham, MA | 100.0 | % | 1 | 209,707 | Waltham, MA | 100.0 | % | 1 | 209,707 | ||||||||||||||||||
Sumner Square | Washington, DC | 93.7 | % | 1 | 208,665 | Washington, DC | 100.0 | % | 1 | 208,892 | ||||||||||||||||||
1301 New York Avenue | Washington, DC | 100.0 | % | 1 | 201,281 | |||||||||||||||||||||||
Four Cambridge Center | Cambridge, MA | 58.6 | % | 1 | 199,131 | Cambridge, MA | 100.0 | % | 1 | 200,567 | ||||||||||||||||||
University Place | Cambridge, MA | 100.0 | % | 1 | 195,282 | Cambridge, MA | 100.0 | % | 1 | 195,282 | ||||||||||||||||||
North First Business Park(1) | San Jose, CA | 75.8 | % | 5 | 190,636 | |||||||||||||||||||||||
1301 New York Avenue | Washington, DC | 100.0 | % | 1 | 188,357 | |||||||||||||||||||||||
North First Business Park (1) | San Jose, CA | 87.2 | % | 5 | 190,636 | |||||||||||||||||||||||
One Preserve Parkway | Rockville, MD | 76.7 | % | 1 | 183,734 | Rockville, MD | 92.7 | % | 1 | 183,612 | ||||||||||||||||||
12290 Sunrise Valley | Reston, VA | 100.0 | % | 1 | 182,424 | |||||||||||||||||||||||
Three Patriots Park (formerly 12290 Sunrise Valley) | Reston, VA | 0.0 | % | 1 | 182,424 | |||||||||||||||||||||||
2600 Tower Oaks Boulevard | Rockville, MD | 87.8 | % | 1 | 178,865 | Rockville, MD | 67.9 | % | 1 | 178,906 | ||||||||||||||||||
Eight Cambridge Center | Cambridge, MA | 100.0 | % | 1 | 177,226 | Cambridge, MA | 100.0 | % | 1 | 177,226 | ||||||||||||||||||
500 North Capitol (30% ownership)(1) | Washington, DC | 100.0 | % | 1 | 175,698 | |||||||||||||||||||||||
Lexington Office Park | Lexington, MA | 77.3 | % | 2 | 166,745 | Lexington, MA | 82.7 | % | 2 | 166,759 | ||||||||||||||||||
210 Carnegie Center | Princeton, NJ | 92.8 | % | 1 | 162,368 | Princeton, NJ | 94.4 | % | 1 | 162,372 | ||||||||||||||||||
206 Carnegie Center | Princeton, NJ | 100.0 | % | 1 | 161,763 | Princeton, NJ | 100.0 | % | 1 | 161,763 | ||||||||||||||||||
191 Spring Street | Lexington, MA | 100.0 | % | 1 | 158,900 | Lexington, MA | 100.0 | % | 1 | 158,900 | ||||||||||||||||||
303 Almaden | San Jose, CA | 90.8 | % | 1 | 158,499 | San Jose, CA | 91.5 | % | 1 | 158,499 | ||||||||||||||||||
Kingstowne Two | Alexandria, VA | 98.2 | % | 1 | 156,251 | Alexandria, VA | 96.9 | % | 1 | 156,251 | ||||||||||||||||||
Ten Cambridge Center | Cambridge, MA | 100.0 | % | 1 | 152,664 | Cambridge, MA | 100.0 | % | 1 | 152,664 | ||||||||||||||||||
10 & 20 Burlington Mall Road | Burlington, MA | 88.9 | % | 2 | 152,097 | Burlington, MA | 75.9 | % | 2 | 152,229 | ||||||||||||||||||
Kingstowne One | Alexandria, VA | 90.6 | % | 1 | 150,838 | Alexandria, VA | 83.5 | % | 1 | 151,195 | ||||||||||||||||||
214 Carnegie Center | Princeton, NJ | 75.1 | % | 1 | 150,774 | Princeton, NJ | 65.1 | % | 1 | 150,774 | ||||||||||||||||||
212 Carnegie Center | Princeton, NJ | 82.0 | % | 1 | 149,354 | Princeton, NJ | 57.8 | % | 1 | 150,395 | ||||||||||||||||||
506 Carnegie Center | Princeton, NJ | 100.0 | % | 1 | 145,213 | Princeton, NJ | 74.8 | % | 1 | 145,213 | ||||||||||||||||||
Two Reston Overlook | Reston, VA | 91.8 | % | 1 | 134,615 | |||||||||||||||||||||||
Properties | Location | % Leased as of December 31, 2010 | Number of Buildings | Net Rentable Square Feet | Location | % Leased as of December 31, 2012 | Number of Buildings | Net Rentable Square Feet | ||||||||||||||||||||
2440 West El Camino Real | Mountain View, CA | 100.0 | % | 1 | 140,042 | |||||||||||||||||||||||
Two Reston Overlook | Reston, VA | 100.0 | % | 1 | 134,615 | |||||||||||||||||||||||
202 Carnegie Center | Princeton, NJ | 78.4 | % | 1 | 130,582 | Princeton, NJ | 100.0 | % | 1 | 130,582 | ||||||||||||||||||
508 Carnegie Center | Princeton, NJ | 57.8 | % | 1 | 128,662 | Princeton, NJ | 24.4 | % | 1 | 128,684 | ||||||||||||||||||
101 Carnegie Center | Princeton, NJ | 87.7 | % | 1 | 123,659 | Princeton, NJ | 87.7 | % | 1 | 123,659 | ||||||||||||||||||
Montvale Center | Gaithersburg, MD | 79.3 | % | 1 | 123,392 | |||||||||||||||||||||||
Montvale Center (2) | Gaithersburg, MD | 74.0 | % | 1 | 123,630 | |||||||||||||||||||||||
502 Carnegie Center | Princeton, NJ | 83.3 | % | 1 | 122,460 | |||||||||||||||||||||||
504 Carnegie Center | Princeton, NJ | 100.0 | % | 1 | 121,990 | Princeton, NJ | 100.0 | % | 1 | 121,990 | ||||||||||||||||||
40 Shattuck Road | Andover, MA | 87.7 | % | 1 | 121,216 | |||||||||||||||||||||||
91 Hartwell Avenue | Lexington, MA | 77.3 | % | 1 | 121,425 | Lexington, MA | 60.9 | % | 1 | 120,458 | ||||||||||||||||||
40 Shattuck Road | Andover, MA | 75.9 | % | 1 | 121,216 | |||||||||||||||||||||||
701 Carnegie Center | Princeton, NJ | 100.0 | % | 1 | 120,000 | Princeton, NJ | 100.0 | % | 1 | 120,000 | ||||||||||||||||||
502 Carnegie Center | Princeton NJ | 82.1 | % | 1 | 118,120 | |||||||||||||||||||||||
Annapolis Junction (50% ownership) | Annapolis, MD | 100.0 | % | 1 | 117,599 | Annapolis, MD | 100.0 | % | 1 | 117,599 | ||||||||||||||||||
Three Cambridge Center | Cambridge, MA | 43.0 | % | 1 | 108,152 | Cambridge, MA | 100.0 | % | 1 | 109,358 | ||||||||||||||||||
201 Spring Street | Lexington, MA | 100.0 | % | 1 | 106,300 | Lexington, MA | 100.0 | % | 1 | 106,300 | ||||||||||||||||||
104 Carnegie Center | Princeton, NJ | 97.2 | % | 1 | 102,830 | Princeton, NJ | 87.9 | % | 1 | 102,886 | ||||||||||||||||||
Bedford Business Park | Bedford, MA | 100.0 | % | 1 | 92,207 | |||||||||||||||||||||||
33 Hayden Avenue | Lexington, MA | 100.0 | % | 1 | 80,128 | Lexington, MA | 0.0 | % | 1 | 80,128 | ||||||||||||||||||
Eleven Cambridge Center | Cambridge, MA | 100.0 | % | 1 | 79,616 | Cambridge, MA | 100.0 | % | 1 | 79,616 | ||||||||||||||||||
Reservoir Place North | Waltham, MA | 100.0 | % | 1 | 73,258 | Waltham, MA | 100.0 | % | 1 | 73,258 | ||||||||||||||||||
105 Carnegie Center | Princeton, NJ | 55.3 | % | 1 | 69,955 | Princeton, NJ | 100.0 | % | 1 | 69,955 | ||||||||||||||||||
32 Hartwell Avenue | Lexington, MA | 100.0 | % | 1 | 69,154 | Lexington, MA | 100.0 | % | 1 | 69,154 | ||||||||||||||||||
Waltham Office Center(1) | Waltham, MA | 38.3 | % | 1 | 67,005 | |||||||||||||||||||||||
302 Carnegie Center | Princeton, NJ | 65.1 | % | 1 | 64,926 | Princeton, NJ | 85.4 | % | 1 | 64,926 | ||||||||||||||||||
195 West Street | Waltham, MA | 100.0 | % | 1 | 63,500 | Waltham, MA | 100.0 | % | 1 | 63,500 | ||||||||||||||||||
100 Hayden Avenue | Lexington, MA | 100.0 | % | 1 | 55,924 | Lexington, MA | 100.0 | % | 1 | 55,924 | ||||||||||||||||||
181 Spring Street | Lexington, MA | 60.4 | % | 1 | 55,793 | Lexington, MA | 100.0 | % | 1 | 55,792 | ||||||||||||||||||
211 Carnegie Center | Princeton, NJ | 100.0 | % | 1 | 47,025 | Princeton, NJ | 100.0 | % | 1 | 47,025 | ||||||||||||||||||
92 Hayden Avenue | Lexington, MA | 100.0 | % | 1 | 31,100 | Lexington, MA | 100.0 | % | 1 | 31,100 | ||||||||||||||||||
201 Carnegie Center | Princeton, NJ | 100.0 | % | — | 6,500 | Princeton, NJ | 100.0 | % | — | 6,500 | ||||||||||||||||||
|
|
| ||||||||||||||||||||||||||
Subtotal for Class A Office Properties | 93.5 | % | 118 | 35,320,190 | 91.3 | % | 124 | 38,740,025 | ||||||||||||||||||||
Retail | ||||||||||||||||||||||||||||
Shops at The Prudential Center | Boston, MA | 98.5 | % | 1 | 510,405 | Boston, MA | 99.4 | % | 1 | 501,246 | ||||||||||||||||||
Fountain Square Retail (50% ownership) | Reston, VA | 98.9 | % | 1 | 236,676 | |||||||||||||||||||||||
Kingstowne Retail | Alexandria, VA | 100.0 | % | 1 | 88,288 | Alexandria, VA | 100.0 | % | 1 | 88,288 | ||||||||||||||||||
Shaws Supermarket at The Prudential Center | Boston, MA | 100.0 | % | 1 | 57,235 | Boston, MA | 100.0 | % | 1 | 57,235 | ||||||||||||||||||
|
|
| ||||||||||||||||||||||||||
Subtotal for Retail Properties | 99.2 | % | 3 | 655,928 | 99.4 | % | 4 | 883,445 | ||||||||||||||||||||
|
|
| ||||||||||||||||||||||||||
Office/Technical Properties | ||||||||||||||||||||||||||||
Bedford Business Park | Bedford, MA | 62.7 | % | 2 | 379,056 | |||||||||||||||||||||||
Seven Cambridge Center | Cambridge, MA | 100.0 | % | 1 | 231,028 | Cambridge, MA | 100.0 | % | 1 | 231,028 | ||||||||||||||||||
7601 Boston Boulevard | Springfield, VA | 100.0 | % | 1 | 103,750 | Springfield, VA | 100.0 | % | 1 | 103,750 | ||||||||||||||||||
7435 Boston Boulevard | Springfield, VA | 100.0 | % | 1 | 103,557 | Springfield, VA | 100.0 | % | 1 | 103,557 | ||||||||||||||||||
8000 Grainger Court | Springfield, VA | 100.0 | % | 1 | 88,775 | Springfield, VA | 100.0 | % | 1 | 88,775 | ||||||||||||||||||
7500 Boston Boulevard | Springfield, VA | 100.0 | % | 1 | 79,971 | Springfield, VA | 100.0 | % | 1 | 79,971 | ||||||||||||||||||
7501 Boston Boulevard | Springfield, VA | 100.0 | % | 1 | 75,756 | Springfield, VA | 100.0 | % | 1 | 75,756 | ||||||||||||||||||
Fourteen Cambridge Center | Cambridge, MA | 100.0 | % | 1 | 67,362 | Cambridge, MA | 100.0 | % | 1 | 67,362 | ||||||||||||||||||
164 Lexington Road | Billerica, MA | 0.0 | % | 1 | 64,140 | Billerica, MA | 0.0 | % | 1 | 64,140 | ||||||||||||||||||
103 Fourth Avenue(1) | Waltham, MA | 58.5 | % | 1 | 62,476 | |||||||||||||||||||||||
7450 Boston Boulevard | Springfield, VA | 100.0 | % | 1 | 62,402 | Springfield, VA | 100.0 | % | 1 | 62,402 | ||||||||||||||||||
7374 Boston Boulevard | Springfield, VA | 100.0 | % | 1 | 57,321 | Springfield, VA | 100.0 | % | 1 | 57,321 | ||||||||||||||||||
8000 Corporate Court | Springfield, VA | 100.0 | % | 1 | 52,539 | Springfield, VA | 100.0 | % | 1 | 52,539 | ||||||||||||||||||
7451 Boston Boulevard | Springfield, VA | 100.0 | % | 1 | 47,001 | Springfield, VA | 100.0 | % | 1 | 47,001 | ||||||||||||||||||
7300 Boston Boulevard | Springfield, VA | 100.0 | % | 1 | 32,000 | |||||||||||||||||||||||
Properties 7300 Boston Boulevard 17 Hartwell Avenue 7375 Boston Boulevard 6601 Springfield Center Drive(1) Subtotal for Office/Technical Properties Hotel Property Cambridge Center Marriott Subtotal for Hotel Property Subtotal for In-Service Properties Structured Parking Properties Under Construction(3) Office: Atlantic Wharf 2200 Pennsylvania Avenue 510 Madison Avenue Residential: Atlantic Wharf-Residential (86 units) Atlantic Wharf—Retail 2221 I Street, NW—Residential (335 units) 2221 I Street, NW—Retail Subtotal for Properties Under Construction Total Portfolio Properties 17 Hartwell Avenue 453 Ravendale Avenue 7375 Boston Boulevard 6601 Springfield Center Drive (1) Subtotal for Office/Technical Properties Residential Properties Residences on The Avenue (335 units) The Lofts at Atlantic Wharf (86 units) Subtotal for Residential Properties Hotel Property Cambridge Center Marriott (433 rooms) Subtotal for Hotel Property Subtotal for In-Service Properties Structured Parking (46,833 spaces) Properties Under Construction (7) Office: Annapolis Junction Building Six (50% ownership) 500 North Capitol (30% ownership) Two Patriots Park (formerly12300 Sunrise Valley Drive) Seventeen Cambridge Center Cambridge Center Connector Annapolis Junction Building Seven (50% ownership) 680 Folsom Street 250 West 55th Street Residential: The Avant at Reston Town Center (359 units) Subtotal for Properties Under Construction Total Portfolio Location %
Leased as of
December 31, 2010 Number
of
Buildings Net Rentable
Square Feet Springfield, VA 100.0 % 1 32,000 Lexington, MA 100.0 % 1 30,000 Springfield, VA 100.0 % 1 26,865 Springfield, VA 100.0 % 1 26,388 85.5 % 19 1,590,387 Cambridge, MA 77.9 %(2) 1 330,400 77.9 % 1 330,400 93.2 % 141 37,896,905 13,650,302 Boston, MA 79 % 1 790,000 Washington, DC 85 % 1 460,000 New York, NY 13 % 1 347,000 Boston, MA N/A 1 78,000 0 % 10,000 Washington, DC N/A 1 275,000 100.0 % 50,000 67 % 5 2,010,000 146 53,557,207 Location %
Leased as of
December 31, 2012 Number
of
Buildings Net
Rentable
Square
Feet Lexington, MA 0.0 % 1 30,000 Mountain View, CA 100.0 % 1 29,620 Springfield, VA 100.0 % 1 26,865 Springfield, VA 37.2 % 1 26,388 90.6 % 17 1,178,475 Washington, DC 93.9 %(3) 1 323,050 (4) Boston, MA 97.7 %(3) 1 87,097 (5) 94.5 % 2 410,147 Cambridge, MA 78.8 %(6) 1 334,260 78.8 % 1 334,260 91.4 % 148 41,546,352 15,891,074 Annapolis, MD 49 % 1 120,000 Washington, DC 82 % 1 232,000 Reston, VA 100 % 1 255,951 Cambridge, MA 100 % 1 195,191 Cambridge, MA 100 % — 42,500 Annapolis, MD 0 % 1 125,000 San Francisco, CA 85 % 2 522,000 New York, NY 46 % 1 989,000 Reston, VA N/A 1 355,668 66 % 9 2,837,310 157 60,274,736
| (1) | Property held for redevelopment as of December 31, |
| (2) | See Note 3, 6 and 19 to the Consolidated Financial Statements. |
| (3) | Represents the |
| (4) | Includes 49,528 square feet of retail space which is 100% leased as of December 31, 2012. Note that this amount is not included in the calculation of the Total Portfolio occupancy rate for In-Service Properties as of December 31, |
| Includes 9,617 square feet of retail space which is 57% leased as of December 31, 2012. Note that this amount is not included in the calculation of the Total Portfolio occupancy rate for In-Service Properties as of December 31, 2012. |
| (6) | Represents the weighted-average room occupancy for the year ended December 31, 2012. Note that this amount is not included in the calculation of the Total Portfolio occupancy rate for In-Service Properties as of December 31, 2012. |
| (7) | Represents percentage leased as of February |
The following table shows information relating to properties owned through the Value-Added Fund at December 31, 2010:2012:
Property | Location | % Leased as of December 31, 2010 | Number of Buildings | Net Rentable Square Feet | Location | % Leased as of December 31, 2012 | Number of Buildings | Net Rentable Square Feet | ||||||||||||||||||||||||
Mountain View Research Park | Mountain View, CA | 78.1 | % | 16 | 600,449 | Mountain View, CA | 87.5 | % | 16 | 602,199 | ||||||||||||||||||||||
Mountain View Technology Park | Mountain View, CA | 61.1 | % | 7 | 135,279 | Mountain View, CA | 100.0 | % | 7 | 135,279 | ||||||||||||||||||||||
300 Billerica Road | Chelmsford, MA | 100.0 | % | 1 | 110,882 | |||||||||||||||||||||||||||
|
|
| ||||||||||||||||||||||||||||||
Total Value-Added Fund | 78.3 | % | 24 | 845,610 | 89.8 | % | 23 | 737,478 | ||||||||||||||||||||||||
|
|
| ||||||||||||||||||||||||||||||
Percentage Leased and Average Annualized Revenue per Square Foot for In-Service Properties
The following table sets forth our percentage leased and average annualized revenue per square foot on a historical basis for our In-Service Properties.
| December 31, 2006 | December 31, 2007 | December 31, 2008 | December 31, 2009 | December 31, 2010 | December 31, 2008 | December 31, 2009 | December 31, 2010 | December 31, 2011 | December 31, 2012 | |||||||||||||||||||||||||||||||
Percentage leased | 94.2 | % | 94.9 | % | 94.5 | % | 92.4 | % | 93.2 | % | 94.5 | % | 92.4 | % | 93.2 | % | 91.3 | % | 91.4 | % | ||||||||||||||||||||
Average annualized revenue per square foot(1) | $ | 43.73 | $ | 45.57 | $ | 51.50 | $ | 52.84 | $ | 53.21 | $ | 51.50 | $ | 52.84 | $ | 53.21 | $ | 53.58 | $ | 55.43 | ||||||||||||||||||||
| (1) |
Top 20 Tenants by Square Feet
Our 20 largest tenants by square feet as of December 31, 20102012 were as follows:
Tenant | Square Feet | % of In-Service Portfolio | Tenant | Square Feet | % of In-Service Portfolio | |||||||||||||||
| 1 | U.S. Government | 1,974,528 | (1) | 5.26 | % | U.S. Government | 2,194,298 | (1) | 5.38 | % | ||||||||||
| 2 | Citibank | 1,047,695 | (2) | 2.79 | % | Citibank | 1,018,432 | (2) | 2.50 | % | ||||||||||
| 3 | Lockheed Martin | 1,029,935 | 2.74 | % | Bank of America | 875,718 | (3) | 2.15 | % | |||||||||||
| 4 | Kirkland & Ellis | 648,566 | (3) | 1.73 | % | Wellington Management | 707,568 | 1.73 | % | |||||||||||
| 5 | Genentech | 640,271 | 1.70 | % | Kirkland & Ellis | 639,683 | (4) | 1.57 | % | |||||||||||
| 6 | Biogen | 576,393 | 1.53 | % | Biogen | 577,021 | 1.41 | % | ||||||||||||
| 7 | Ropes & Gray | 528,931 | 1.41 | % | Genentech | 568,097 | 1.39 | % | ||||||||||||
| 8 | O’Melveny & Myers | 511,659 | 1.36 | % | Ropes & Gray | 528,931 | 1.30 | % | ||||||||||||
| 9 | Bain Capital | 476,653 | 1.27 | % | O’Melveny & Myers | 504,902 | 1.24 | % | ||||||||||||
| 10 | Shearman & Sterling | 472,808 | 1.26 | % | Weil Gotshal Manges | 490,065 | (5) | 1.20 | % | |||||||||||
| 11 | Manulife | 467,178 | 1.24 | % | Shearman & Sterling | 472,808 | 1.16 | % | ||||||||||||
| 12 | Weil Gotshal Manges | 444,982 | (4) | 1.18 | % | Manufacturers Investment (ManuLife) | 440,974 | 1.08 | % | |||||||||||
| 13 | State Street Bank and Trust | 408,552 | 1.09 | % | State Street Bank and Trust | 408,552 | 1.00 | % | ||||||||||||
| 14 | Parametric Technology | 380,987 | 1.01 | % | Microsoft | 387,753 | 0.95 | % | ||||||||||||
| 15 | Microsoft | 342,478 | 0.91 | % | Finnegan Henderson Farabow | 362,405 | (6) | 0.89 | % | |||||||||||
| 16 | Ann Taylor | 338,942 | 0.90 | % | Ann Inc. (fka Ann Taylor Corp.) | 351,026 | 0.86 | % | ||||||||||||
| 17 | Finnegan Henderson Farabow | 336,396 | (5) | 0.90 | % | Parametric Technology | 320,655 | 0.79 | % | |||||||||||
| 18 | Northrop Grumman | 323,097 | 0.86 | % | Lockheed Martin | 316,918 | 0.78 | % | ||||||||||||
| 19 | Accenture | 310,312 | 0.83 | % | Mass Financial Services | 301,668 | 0.74 | % | ||||||||||||
| 20 | Bingham McCutchen | 301,385 | 0.80 | % | Bingham McCutchen | 301,385 | 0.74 | % | ||||||||||||
| (1) | Includes |
| (2) | Includes 10,080 and 2,761 square feet of space in properties in which we have a 60% and 51% interest, respectively. |
| (3) | Includes |
| (4) |
| (5) | Includes 449,871 square feet of space in a property in we have a 60% interest. |
| Includes |
Tenant Diversification (Gross Rent)*
Our tenant diversification as of December 31, 20102012 was as follows:
Sector | Percentage of Gross Rent | |||
Legal Services | ||||
Financial | 15% | |||
Financial Services—commercial and investment banking | ||||
Technical and Scientific Services | 11% | |||
Other Professional Services | ||||
Retail | 7% | |||
Government / Public Administration | 5% | |||
Manufacturing / Consumer Products | ||||
| ||||
| ||||
| ||||
Other | ||||
Real Estate and Insurance | ||||
Media / Telecommunications |
| * | The classification of our tenants is based on the U.S. Government’s North American Industry Classification System (NAICS), which has replaced the Standard Industrial Classification (SIC) system. |
Lease Expirations(1)Expirations (1)(2)
Year of Lease Expiration | Rentable Square Feet Subject to Expiring Leases | Current Annualized Contractual Rent Under Expiring Leases Without Future Step-Ups(2) | Current Annualized Contractual Rent Under Expiring Leases Without Future Step-Ups p.s.f.(2) | Current Annualized Contractual Rent Under Expiring Leases With Future Step-Ups(3) | Current Annualized Contractual Rent Under Expiring Leases With Future Step-Ups p.s.f.(3) | Percentage of Total Square Feet | Rentable Square Feet Subject to Expiring Leases | Current Annualized Contractual Rent Under Expiring Leases Without Future Step-Ups(3) | Current Annualized Contractual Rent Under Expiring Leases Without Future Step-Ups p.s.f.(3) | Current Annualized Contractual Rent Under Expiring Leases With Future Step-Ups(4) | Current Annualized Contractual Rent Under Expiring Leases With Future Step-Ups p.s.f.(4) | Percentage of Total Square Feet | ||||||||||||||||||||||||||||||||||
2011(4) | 2,580,850 | $ | 118,426,863 | $ | 45.89 | $ | 118,301,963 | $ | 45.84 | 6.9 | % | |||||||||||||||||||||||||||||||||||
2012 | 2,866,666 | 148,104,547 | 51.66 | 145,699,635 | 50.83 | 7.6 | % | |||||||||||||||||||||||||||||||||||||||
2013 | 1,776,914 | 77,640,644 | 43.69 | 79,499,084 | 44.74 | 4.7 | % | 1,857,129 | $ | 75,577,333 | $ | 40.70 | $ | 75,930,363 | $ | 40.89 | 4.6%(5) | |||||||||||||||||||||||||||||
2014 | 3,684,200 | 144,574,970 | 39.24 | 156,047,706 | 42.36 | 9.8 | % | 3,235,225 | 144,772,253 | 44.75 | 147,222,014 | 45.51 | 7.9% | |||||||||||||||||||||||||||||||||
2015 | 3,309,033 | 165,197,728 | 49.92 | 178,829,358 | 54.04 | 8.8 | % | 3,064,207 | 152,890,700 | 49.90 | 157,416,998 | 51.37 | 7.5% | |||||||||||||||||||||||||||||||||
2016 | 3,108,195 | 174,251,791 | 56.06 | 186,654,369 | 60.05 | 8.3 | % | 3,444,083 | 170,843,738 | 49.61 | 176,877,558 | 51.36 | 8.4% | |||||||||||||||||||||||||||||||||
2017 | 3,305,887 | 217,783,647 | 65.88 | 234,083,494 | 70.81 | 8.8 | % | 4,037,373 | 267,922,500 | 66.36 | 277,171,518 | 68.65 | 9.9% | |||||||||||||||||||||||||||||||||
2018 | 935,573 | 60,086,681 | 64.22 | 66,038,776 | 70.59 | 2.5 | % | 1,338,577 | 81,907,519 | 61.19 | 87,827,388 | 65.61 | 3.3% | |||||||||||||||||||||||||||||||||
2019 | 3,028,222 | 173,963,593 | 57.45 | 194,286,312 | 64.16 | 8.1 | % | 3,325,267 | 188,940,517 | 56.82 | 202,934,145 | 61.03 | 8.2% | |||||||||||||||||||||||||||||||||
2020 | 2,959,954 | 166,525,270 | 56.26 | 186,840,846 | 63.12 | 7.9 | % | 3,395,989 | 201,203,231 | 59.25 | 219,443,405 | 64.62 | 8.3% | |||||||||||||||||||||||||||||||||
2021 | 2,579,190 | 142,877,775 | 55.40 | 169,715,802 | 65.80 | 6.3% | ||||||||||||||||||||||||||||||||||||||||
Thereafter | 6,878,696 | 401,330,296 | 58.34 | 473,003,494 | 68.76 | 18.3 | % | 10,932,359 | 624,482,061 | 57.12 | 729,463,590 | 66.73 | 26.8% | |||||||||||||||||||||||||||||||||
| (1) | Includes 100% of unconsolidated joint venture properties |
| (2) | Does not include data for leases expiring in a particular year when leases for the same space have already been signed with replacement tenants with future commencement dates. In those cases, the data is included in the year in which the future lease expires. |
| Represents the monthly contractual base rent and recoveries from tenants under existing leases as of December 31, |
| (4) |
| (5) | Includes 211,000 square feet |
| Item 3. | Legal Proceedings |
We are subject to various legal proceedings and claims that arise in the ordinary course of business. These matters are generally covered by insurance. Management believes that the final outcome of such matters will not have a material adverse effect on our financial position, results of operations or liquidity.
| Item 4. |
Not Applicable.
| Item 5. | Market for Registrant’s Common Equity, Related Stockholder Matters and Issuer Purchases of Equity Securities |
(a) Our common stock is listed on the New York Stock Exchange under the symbol “BXP.” The high and low sales prices and dividends for the periods indicated in the table below were:
Quarter Ended | High | Low | Dividends per common share | |||||||||
December 31, 2010 | $ | 91.45 | $ | 81.02 | $ | .50 | ||||||
September 30, 2010 | 89.26 | 68.47 | .50 | |||||||||
June 30, 2010 | 83.42 | 70.91 | .50 | |||||||||
March 31, 2010 | 78.22 | 61.50 | .50 | |||||||||
December 31, 2009 | 71.73 | 57.19 | .50 | |||||||||
September 30, 2009 | 72.23 | 42.62 | .50 | |||||||||
June 30, 2009 | 53.19 | 33.79 | .50 | |||||||||
March 31, 2009 | 56.78 | 29.30 | .68 | |||||||||
| Quarter Ended | High | Low | Dividends per common share | |||||||||
December 31, 2012 | $ | 111.56 | $ | 99.23 | $ | 0.65 | ||||||
September 30, 2012 | 117.00 | 107.52 | 0.55 | |||||||||
June 30, 2012 | 110.17 | 98.92 | 0.55 | |||||||||
March 31, 2012 | 107.87 | 96.73 | 0.55 | |||||||||
December 31, 2011 | 102.32 | 81.52 | 0.55 | |||||||||
September 30, 2011 | 112.84 | 89.02 | 0.50 | |||||||||
June 30, 2011 | 108.35 | 93.29 | 0.50 | |||||||||
March 31, 2011 | 96.59 | 83.90 | 0.50 | |||||||||
At February 18, 2011,21, 2013, we had approximately 1,5581,469 stockholders of record.
In order to maintain our qualification as a REIT, we must make annual distributions to our stockholders of at least 90% of our taxable income (not including net capital gains). We have adopted a policy of paying regular quarterly distributions on our common stock, and we have adopted a policy of paying regular quarterly distributions on the common units of BPLP. Cash distributions have been paid on our common stock and BPLP’s common units since our initial public offering. Distributions are declared at the discretion of the Board of Directors and depend on actual and anticipated cash from operations, our financial condition, capital requirements, the annual distribution requirements under the REIT provisions of the Internal Revenue Code and other factors the Board of Directors may consider relevant.
During the three months ended December 31, 2010,2012, we issued an aggregate of 66,833744,972 shares of common stock in connection with the redemption of 66,833744,972 common units of limited partnership held by certain limited partners of BPLP. TheseOf these shares, 93,242 were issued in reliance on an exemption from registration under Section 4(2). We relied on the exception under Section 4(2) based upon factual representations received from the limited partners who received the shares of common stock.
Stock Performance Graph
The following graph provides a comparison of cumulative total stockholder return for the period from December 31, 20052007 through December 31, 2010,2012, among Boston Properties, the Standard & Poor’s (“S&P”) 500 Index, the National Association of Real Estate Investment Trusts, Inc. (“NAREIT”) Equity REIT Total Return Index (the “Equity REIT Index”) and the NAREIT Office REIT Index (the “Office REIT Index”). The Equity REIT Index includes all tax-qualified equity REITs listed on the New York Stock Exchange, the American Stock Exchange and the NASDAQ Stock Market. Equity REITs are defined as those with 75% or more of their gross invested book value of assets invested directly or indirectly in the equity ownership of real estate. The Office REIT Index includes all office REITs included in the Equity REIT Index. Data for Boston Properties, the S&P 500 Index, the Equity REIT Index and the Office REIT Index was provided to us by NAREIT. Upon written request, Boston Properties will provide any stockholder with a list of the REITs included in the Equity REIT Index and the Office REIT Index. The stock performance graph assumes an investment of $100 in each of Boston Properties and the three indices, and the reinvestment of any dividends. The historical information set forth
below is not necessarily indicative of future performance. The data shown is based on the share prices or index values, as applicable, at the end of each month shown.
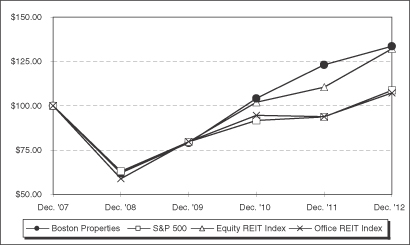
| As of the year ended December 31, | As of the year ended December 31, | |||||||||||||||||||||||||||||||||||||||||||||||
| 2005 | 2006 | 2007 | 2008 | 2009 | 2010 | 2007 | 2008 | 2009 | 2010 | 2011 | 2012 | |||||||||||||||||||||||||||||||||||||
Boston Properties | $ | 100.00 | $ | 162.70 | $ | 145.84 | $ | 90.50 | $ | 115.41 | $ | 151.88 | $ | 100.00 | $ | 62.06 | $ | 79.14 | $ | 104.15 | $ | 123.05 | $ | 133.58 | ||||||||||||||||||||||||
S&P 500 | $ | 100.00 | $ | 115.79 | $ | 122.16 | $ | 76.96 | $ | 97.33 | $ | 111.99 | $ | 100.00 | $ | 63.00 | $ | 79.68 | $ | 91.68 | $ | 93.61 | $ | 108.59 | ||||||||||||||||||||||||
Equity REIT Index | $ | 100.00 | $ | 135.06 | $ | 113.87 | $ | 70.91 | $ | 90.76 | $ | 116.12 | $ | 100.00 | $ | 62.27 | $ | 79.70 | $ | 101.98 | $ | 110.42 | $ | 132.18 | ||||||||||||||||||||||||
Office REIT Index | $ | 100.00 | $ | 145.22 | $ | 117.69 | $ | 69.36 | $ | 94.01 | $ | 111.32 | $ | 100.00 | $ | 58.93 | $ | 79.88 | $ | 94.59 | $ | 93.87 | $ | 107.15 | ||||||||||||||||||||||||
(b) None.
(c) Issuer Purchases of Equity Securities. None.No repurchases during the fourth quarter.
| Item 6. | Selected Financial Data |
The following table sets forth our selected financial and operating data on a historical basis. Certain prior year amounts have been reclassified to conform to the current year presentation. In addition, certain prior year amounts have been revised as a result of the adoption on January 1, 2009 of (1) ASC 470-20 “Debt with Conversion and Other Options” (“ASC 470-20”) (formerly known as FASB Staff Position (“FSP”) No. APB 14-1 “Accounting for Convertible Debt Instruments That May Be Settled in Cash upon Conversion (Including Partial Cash Settlement)” (“FSP No. APB 14-1”)) (Refer to(See Note 8 of the Consolidated Financial Statements), (2) the guidance included in ASC 810 “Consolidation” (“ASC 810”) (formerly known as SFAS No. 160, “Noncontrolling Interests in Consolidated Financial Statements—an amendment of ARB No. 51” (“SFAS No. 160”)) and ASC 480-10-S99 “Distinguishing Liabilities from Equity” (“ASC 480-10-S99”) (formerly known as EITF Topic No. D-98 “Classification and Measurement of Redeemable Securities” (Amended)) (Refer to Note 11 of the Consolidated Financial Statements), (3) the guidance included in ASC 260-10 “Earnings Per Share” (“ASC 260-10”) (formerly known as FSP EITF 03-06-1, “Determining Whether Instruments Granted in Share-Based Payment Transactions are Participating Securities” (“FSP EITF 03-06-1”)) (Refer to(See Note 15 of the Consolidated Financial Statements), and which has been revised for the reclassifications related to the disposition of qualifying properties during 2007 and 20062012 which have been reclassified as discontinued operations, for the periods presented, in accordance with the guidance in ASC 360 “Property, Plant and Equipment” (“ASC 360”) (formerly known as SFAS No. 144 “Accounting for the Impairment or Disposal of Long Lived Assets” (“SFAS No. 144”)). The following data should be read in conjunction with our financial statements and notes thereto and Management’s Discussion and Analysis of Financial Condition and Results of Operations included elsewhere in this Form 10-K.
Our historical operating results may not be comparable to our future operating results.
| For the year ended December 31, | For the year ended December 31, | |||||||||||||||||||||||||||||||||||||||
| 2010 | 2009 | 2008 | 2007 | 2006 | 2012 | 2011 | 2010 | 2009 | 2008 | |||||||||||||||||||||||||||||||
| (in thousands, except per share data) | (in thousands, except per share data) | |||||||||||||||||||||||||||||||||||||||
Statement of Operations Information: | ||||||||||||||||||||||||||||||||||||||||
Total revenue | $ | 1,550,804 | $ | 1,518,190 | $ | 1,469,442 | $ | 1,392,583 | $ | 1,380,950 | $ | 1,876,267 | $ | 1,751,320 | $ | 1,543,310 | $ | 1,510,637 | $ | 1,462,852 | ||||||||||||||||||||
|
|
|
|
| ||||||||||||||||||||||||||||||||||||
Expenses: | ||||||||||||||||||||||||||||||||||||||||
Rental operating | 501,694 | 501,799 | 488,030 | 455,840 | 437,705 | 657,363 | 590,224 | 498,154 | 498,061 | 484,488 | ||||||||||||||||||||||||||||||
Hotel operating | 25,153 | 23,966 | 27,510 | 27,765 | 24,966 | 28,120 | 26,128 | 25,153 | 23,966 | 27,510 | ||||||||||||||||||||||||||||||
General and administrative | 79,658 | 75,447 | 72,365 | 69,882 | 59,375 | 82,382 | 79,610 | 79,396 | 75,447 | 72,365 | ||||||||||||||||||||||||||||||
Acquisition costs | 2,614 | — | — | — | — | |||||||||||||||||||||||||||||||||||
Loss (gain) from suspension of development | (7,200 | ) | 27,766 | — | — | — | ||||||||||||||||||||||||||||||||||
Transaction costs | 3,653 | 1,987 | 2,876 | — | — | |||||||||||||||||||||||||||||||||||
Suspension of development | — | — | (7,200 | ) | 27,766 | — | ||||||||||||||||||||||||||||||||||
Depreciation and amortization | 338,371 | 321,681 | 304,147 | 286,030 | 270,562 | 453,068 | 436,612 | 335,859 | 319,171 | 301,812 | ||||||||||||||||||||||||||||||
|
|
|
|
| ||||||||||||||||||||||||||||||||||||
Total expenses | 940,290 | 950,659 | 892,052 | 839,517 | 792,608 | 1,224,586 | 1,134,561 | 934,238 | 944,411 | 886,175 | ||||||||||||||||||||||||||||||
Operating income | 610,514 | 567,531 | 577,390 | 553,066 | 588,342 | 651,681 | 616,759 | 609,072 | 566,226 | 576,677 | ||||||||||||||||||||||||||||||
Other income (expense): | ||||||||||||||||||||||||||||||||||||||||
Income (loss) from unconsolidated joint ventures | 36,774 | 12,058 | (182,018 | ) | 20,428 | 24,507 | 49,078 | 85,896 | 36,774 | 12,058 | (182,018 | ) | ||||||||||||||||||||||||||||
Interest and other income | 7,332 | 4,059 | 18,958 | 89,706 | 36,677 | 10,091 | 5,358 | 7,332 | 4,059 | 18,958 | ||||||||||||||||||||||||||||||
Gains (losses) from investments in securities | 935 | 2,434 | (4,604 | ) | — | — | 1,389 | (443 | ) | 935 | 2,434 | (4,604 | ) | |||||||||||||||||||||||||||
Interest expense | (378,079 | ) | (322,833 | ) | (295,322 | ) | (302,980 | ) | (302,221 | ) | (413,564 | ) | (394,131 | ) | (378,079 | ) | (322,833 | ) | (294,126 | ) | ||||||||||||||||||||
Losses from early extinguishments of debt | (89,883 | ) | (510 | ) | — | (3,417 | ) | (32,143 | ) | (4,453 | ) | (1,494 | ) | (89,883 | ) | (510 | ) | — | ||||||||||||||||||||||
Net derivative losses | — | — | (17,021 | ) | — | — | — | — | — | — | (17,021 | ) | ||||||||||||||||||||||||||||
|
|
|
|
| ||||||||||||||||||||||||||||||||||||
Income from continuing operations | 187,593 | 262,739 | 97,383 | 356,803 | 315,162 | 294,222 | 311,945 | 186,151 | 261,434 | 97,866 | ||||||||||||||||||||||||||||||
Discontinued operations | — | — | — | 266,793 | 19,081 | 37,917 | 1,881 | 1,442 | 1,305 | (483 | ) | |||||||||||||||||||||||||||||
Gains on sales of real estate | 2,734 | 11,760 | 33,340 | 929,785 | 719,826 | — | — | 2,734 | 11,760 | 33,340 | ||||||||||||||||||||||||||||||
|
|
|
|
| ||||||||||||||||||||||||||||||||||||
Net income | 190,327 | 274,499 | 130,723 | 1,553,381 | 1,054,069 | 332,139 | 313,826 | 190,327 | 274,499 | 130,723 | ||||||||||||||||||||||||||||||
Net income attributable to noncontrolling interests | (31,255 | ) | (43,485 | ) | (25,453 | ) | (243,275 | ) | (183,778 | ) | (42,489 | ) | (41,147 | ) | (31,255 | ) | (43,485 | ) | (25,453 | ) | ||||||||||||||||||||
|
|
|
|
| ||||||||||||||||||||||||||||||||||||
Net income attributable to Boston Properties, Inc. | $ | 159,072 | $ | 231,014 | $ | 105,270 | $ | 1,310,106 | $ | 870,291 | $ | 289,650 | $ | 272,679 | $ | 159,072 | $ | 231,014 | $ | 105,270 | ||||||||||||||||||||
|
|
|
|
| ||||||||||||||||||||||||||||||||||||
Basic earnings per common share attributable to Boston Properties, Inc.: | ||||||||||||||||||||||||||||||||||||||||
Income from continuing operations | $ | 1.14 | $ | 1.76 | $ | 0.88 | $ | 9.07 | $ | 7.45 | $ | 1.71 | $ | 1.86 | $ | 1.13 | $ | 1.75 | $ | 0.88 | ||||||||||||||||||||
Discontinued operations | — | — | — | 1.91 | 0.14 | 0.22 | 0.01 | 0.01 | 0.01 | — | ||||||||||||||||||||||||||||||
|
|
|
|
| ||||||||||||||||||||||||||||||||||||
Net income | $ | 1.14 | $ | 1.76 | $ | 0.88 | $ | 10.98 | $ | 7.59 | $ | 1.93 | $ | 1.87 | $ | 1.14 | $ | 1.76 | $ | 0.88 | ||||||||||||||||||||
|
|
|
|
| ||||||||||||||||||||||||||||||||||||
Weighted average number of common shares outstanding | 139,440 | 131,050 | 119,980 | 118,839 | 114,721 | 150,120 | 145,693 | 139,440 | 131,050 | 119,980 | ||||||||||||||||||||||||||||||
|
|
|
|
| ||||||||||||||||||||||||||||||||||||
Diluted earnings per common share attributable to Boston Properties, Inc.: | ||||||||||||||||||||||||||||||||||||||||
Income from continuing operations | $ | 1.14 | $ | 1.76 | $ | 0.87 | $ | 8.92 | $ | 7.29 | $ | 1.70 | $ | 1.85 | $ | 1.13 | $ | 1.75 | $ | 0.87 | ||||||||||||||||||||
Discontinued operations | — | — | — | 1.88 | 0.14 | 0.22 | 0.01 | 0.01 | 0.01 | — | ||||||||||||||||||||||||||||||
|
|
|
|
| ||||||||||||||||||||||||||||||||||||
Net income | $ | 1.14 | $ | 1.76 | $ | 0.87 | $ | 10.80 | $ | 7.43 | $ | 1.92 | $ | 1.86 | $ | 1.14 | $ | 1.76 | $ | 0.87 | ||||||||||||||||||||
|
|
|
|
| ||||||||||||||||||||||||||||||||||||
Weighted average number of common and common equivalent shares outstanding | 140,057 | 131,512 | 121,299 | 120,780 | 117,077 | 150,711 | 146,218 | 140,057 | 131,512 | 121,299 | ||||||||||||||||||||||||||||||
|
|
|
|
| ||||||||||||||||||||||||||||||||||||
| December 31, | December 31, | |||||||||||||||||||||||||||||||||||||||
| 2010 | 2009 | 2008 | 2007 | 2006 | 2012 | 2011 | 2010 | 2009 | 2008 | |||||||||||||||||||||||||||||||
| (in thousands) | (in thousands) | |||||||||||||||||||||||||||||||||||||||
Balance Sheet information: | ||||||||||||||||||||||||||||||||||||||||
Real estate, gross | $ | 12,764,935 | $ | 11,099,558 | $ | 10,625,207 | $ | 10,252,355 | $ | 9,552,642 | $ | 14,893,328 | $ | 13,389,472 | $ | 12,764,935 | $ | 11,099,558 | $ | 10,625,207 | ||||||||||||||||||||
Real estate, net | 10,441,117 | 9,065,881 | 8,856,422 | 8,720,648 | 8,160,587 | 11,959,168 | 10,746,486 | 10,441,117 | 9,065,881 | 8,856,422 | ||||||||||||||||||||||||||||||
Cash and cash equivalents | 478,948 | 1,448,933 | 241,510 | 1,506,921 | 725,788 | 1,041,978 | 1,823,208 | 478,948 | 1,448,933 | 241,510 | ||||||||||||||||||||||||||||||
Total assets | 13,348,263 | 12,348,703 | 10,917,476 | 11,195,097 | 9,695,206 | 15,462,321 | 14,782,966 | 13,348,263 | 12,348,703 | 10,917,476 | ||||||||||||||||||||||||||||||
Total indebtedness | 7,786,001 | 6,719,771 | 6,092,884 | 5,378,360 | 4,548,550 | 8,912,369 | 8,704,138 | 7,786,001 | 6,719,771 | 6,092,884 | ||||||||||||||||||||||||||||||
Noncontrolling interest—redeemable preferred units of the Operating Partnership | 55,652 | 55,652 | 55,652 | 55,652 | 85,962 | |||||||||||||||||||||||||||||||||||
Noncontrolling interests | 208,434 | 55,652 | 55,652 | 55,652 | 55,652 | |||||||||||||||||||||||||||||||||||
Stockholders’ equity attributable to Boston Properties, Inc. | 4,372,643 | 4,446,002 | 3,688,993 | 3,767,756 | 3,267,717 | 5,097,065 | 4,865,998 | 4,372,643 | 4,446,002 | 3,688,993 | ||||||||||||||||||||||||||||||
Noncontrolling interests | 591,550 | 623,057 | 570,112 | 615,575 | 545,626 | |||||||||||||||||||||||||||||||||||
Equity noncontrolling interests | 537,789 | 547,518 | 591,550 | 623,057 | 570,112 | |||||||||||||||||||||||||||||||||||
| For the year ended December 31, | For the year ended December 31, | |||||||||||||||||||||||||||||||||||||||
| 2010 | 2009 | 2008 | 2007 | 2006 | 2012 | 2011 | 2010 | 2009 | 2008 | |||||||||||||||||||||||||||||||
| (in thousands, except per share and percentage data) | (in thousands, except per share and percentage data) | |||||||||||||||||||||||||||||||||||||||
Other Information: | ||||||||||||||||||||||||||||||||||||||||
Funds from Operations attributable to Boston Properties, Inc.(1) | $ | 547,356 | $ | 606,272 | $ | 403,788 | $ | 545,650 | $ | 497,782 | ||||||||||||||||||||||||||||||
Funds from Operations attributable to Boston Properties, Inc., as adjusted(1) | 547,356 | 606,272 | 403,788 | 547,933 | 524,321 | |||||||||||||||||||||||||||||||||||
Funds from Operations attributable to Boston Properties, Inc. (1) | $ | 741,419 | $ | 710,991 | $ | 547,356 | $ | 618,006 | $ | 544,989 | ||||||||||||||||||||||||||||||
Dividends declared per share | 2.00 | 2.18 | 2.72 | 8.70 | 8.12 | 2.30 | 2.05 | 2.00 | 2.18 | 2.72 | ||||||||||||||||||||||||||||||
Cash flows provided by operating activities | 375,893 | 617,376 | 565,311 | 631,654 | 528,163 | 642,949 | 606,328 | 375,893 | 617,376 | 565,311 | ||||||||||||||||||||||||||||||
Cash flows provided by (used in) investing activities | (1,161,274 | ) | (446,601 | ) | (1,320,079 | ) | 574,655 | 229,572 | ||||||||||||||||||||||||||||||||
Cash flows used in investing activities | (1,278,032 | ) | (90,096 | ) | (1,161,274 | ) | (446,601 | ) | (1,320,079 | ) | ||||||||||||||||||||||||||||||
Cash flows provided by (used in) financing activities | (184,604 | ) | 1,036,648 | (510,643 | ) | (425,176 | ) | (293,443 | ) | (146,147 | ) | 828,028 | (184,604 | ) | 1,036,648 | (510,643 | ) | |||||||||||||||||||||||
Total square feet at end of year (including development projects and parking) | 53,557 | 50,468 | 49,761 | 43,814 | 43,389 | 60,275 | 57,259 | 53,557 | 50,468 | 49,761 | ||||||||||||||||||||||||||||||
In-service percentage leased at end of year | 93.2 | % | 92.4 | % | 94.5 | % | 94.9 | % | 94.2 | % | 91.4 | % | 91.3 | % | 93.2 | % | 92.4 | % | 94.5 | % | ||||||||||||||||||||
| (1) | Pursuant to the revised definition of Funds from Operations adopted by the Board of Governors of NAREIT, we calculate Funds from Operations, or |
In addition to presenting FFO in accordance with the NAREIT definition, we also disclose FFO, as adjusted, which excludes the effects of the losses from early extinguishments of debt associated with the sales of real estate. Losses from early extinguishments of debt result when the sale of real estate encumbered by debt requires us to pay the extinguishment costs prior to the debt’s stated maturity and to write-off unamortized loan costs at the date of the extinguishment. Such costs are excluded from the gains on sales of real estate reported in accordance with GAAP. However, we view the losses from early extinguishments of debt associated with the sales of real estate as an incremental cost of the sale transactions because we extinguished the debt in connection with the consummation of the sale transactions and we had no intent to extinguish the debt absent such transactions. We believe that adjusting FFO to exclude these losses more appropriately reflects the results of our operations exclusive of the impact of our sale transactions.
Although our FFO, as adjusted, clearly differs from NAREIT’s definition of FFO, and mayshould not be comparable to that of other REITs and real estate companies, we believe it provides a meaningful supplemental measure of our operating performance because we believe that by excluding the effects of the losses from early extinguishments of debt associated with the sales of real estate, management and investors are presented with an indicator of our operating performance that more closely achieves the objectives of the real estate industry in presenting FFO.
Neither FFO, nor FFO, as adjusted, should be considered as an alternative to net income attributable to Boston Properties, Inc. (determined in accordance with GAAP) as an indication of our performance. Neither FFO nor FFO, as adjusted,does not represent cash generated from operating activities determined in accordance with GAAP and neither of these measures is not a measure of liquidity or an indicator of our ability to make cash distributions. We believe that to further understand our performance, FFO and FFO, as adjusted, should be compared with our reported net income attributable to Boston Properties, Inc. and considered in addition to cash flows in accordance with GAAP, as presented in our Consolidated Financial Statements.
A reconciliation of FFO and FFO, as adjusted, to net income attributable to Boston Properties, Inc. computed in accordance with GAAP is provided under the heading of “Management’s Discussion and Analysis of Financial Condition and Results of Operations—Funds from Operations.”
| Item |
The following discussion should be read in conjunction with the financial statements and notes thereto appearing elsewhere in this report.
Forward-Looking Statements
This Annual Report on Form 10-K contains forward-looking statements within the meaning of the federal securities laws, principally, but not only, under the captions “Business-Business“Business—Business and Growth Strategies,” “Risk Factors” and “Management’s Discussion and Analysis of Financial Condition and Results of Operations.” We caution investors that any forward-looking statements in this report, or which management may make orally or in writing from time to time, are based on management’s beliefs and on assumptions made by, and information currently available to, management. When used, the words “anticipate,” “believe,” “estimate,” “expect,” “intend,” “may,” “might,” “plan,” “project,” “result” “should,” “will,” and similar expressions which do not relate solely to historical matters are intended to identify forward-looking statements. Such statements are subject to risks, uncertainties and assumptions and are not guarantees of future performance, which may be affected by known and unknown risks, trends, uncertainties and factors that are beyond our control. Should one or more of these risks or uncertainties materialize, or should underlying assumptions prove incorrect, actual results may differ materially from those anticipated, estimated or projected by the forward-looking statements. We caution you that, while forward-looking statements reflect our good faith beliefs when we make them, they are not guarantees of future performance and are impacted by actual events when they occur after we make such statements. We expressly disclaim any responsibility to update our forward-looking statements, whether as a result of new information, future events or otherwise. Accordingly, investors should use caution in relying on past forward-looking statements, which are based on results and trends at the time they are made, to anticipate future results or trends.
Some of the risks and uncertainties that may cause our actual results, performance or achievements to differ materially from those expressed or implied by forward-looking statements include, among others, the following:
the continuing impactimpacts of high unemployment and constrained credit,other macroeconomic trends, which isare having and may continue to have a negative effect on the following, among other things:
the fundamentals of our business, including overall market occupancy, tenant space utilization, and rental rates;
the financial condition of our tenants, many of which are financial, legal and other professional firms, our lenders, counterparties to our derivative financial instruments and institutions that hold our cash balances and short-term investments, which may expose us to increased risks of default by these parties; and
the value of our real estate assets, which may limit our ability to dispose of assets at attractive prices or obtain or maintain debt financing secured by our properties or on an unsecured basis;
general risks affecting the real estate industry (including, without limitation, the inability to enter into or renew leases, tenant space utilization, dependence on tenants’ financial condition, and competition from other developers, owners and operators of real estate);
failure to manage effectively our growth and expansion into new markets and sub-markets or to integrate acquisitions and developments successfully;
the ability of our joint venture partners to satisfy their obligations;
risks and uncertainties affecting property development and construction (including, without limitation, construction delays, cost overruns, inability to obtain necessary permits and public opposition to such activities);
risks associated with the availability and terms of financing and the use of debt to fund acquisitions and developments, including the risk associated withimpact of higher interest rates impactingon the cost and/or availability of financing;
risks associated with forward interest rate contracts and the effectiveness of such arrangements;
risks associated with downturns in the national and local economies, increases in interest rates, and volatility in the securities markets;
risks associated with actual or threatened terrorist attacks;
costs of compliance with the Americans with Disabilities Act and other similar laws;
potential liability for uninsured losses and environmental contamination;
risks associated with our potential failure to qualify as a REIT under the Internal Revenue Code of 1986, as amended;
possible adverse changes in tax and environmental laws;
the impact of newly adopted accounting principles on our accounting policies and on period-to-period comparisons of financial results;
risks associated with possible state and local tax audits; and
risks associated with our dependence on key personnel whose continued service is not guaranteed.
The risks set forth above are not exhaustive. Other sections of this report, including “Part I, Item 1A- 1A—Risk Factors,” include additional factors that could adversely affect our business and financial performance. Moreover, we operate in a very competitive and rapidly changing environment. New risk factors emerge from time to time and it is not possible for management to predict all such risk factors, nor can we assess the impact of all such risk factors on our business or the extent to which any factor, or combination of factors, may cause actual results to differ materially from those contained in any forward-looking statements. Given these risks and uncertainties, investors should not place undue reliance on forward-looking statements as a prediction of actual results. Investors should also refer to our quarterly reports on Form 10-Q for future periods and current reports on Form 8-K as we file them with the SEC, and to other materials we may furnish to the public from time to time through Formscurrent reports on Form 8-K or otherwise, for a discussion of risks and uncertainties that may cause actual results, performance or achievements to differ materially from those expressed or implied by forward-looking statements. We expressly disclaim any responsibility to update any forward-looking statements to reflect changes in underlying assumptions or factors, new information, future events, or otherwise, and you should not rely upon these forward-looking statements after the date of this report.
Overview
We are a fully integrated self-administered and self-managed REIT and one of the largest owners and developers of Class A office properties in the United States. Our properties are concentrated in five markets—markets—Boston, midtown Manhattan, Washington, DC,New York, Princeton, San Francisco and Princeton, NJ.Washington, DC. We generate revenue and cash primarily by leasing our Class A office space to our tenants. Factors we consider when we lease space include the creditworthiness of the tenant, the length of the lease, the rental rate to be paid, the costs of tenant improvements and other landlord concessions, current and anticipated operating costs and real estate taxes, our current and anticipated vacancy, current and anticipated future demand for office space and general economic factors. From time to time, we also generate cash through the sale of assets.
Our core strategy has always been to own, operate and develop properties in supply-constrained markets with high barriers to entry and to focus on executing long-term leases with financially strong tenants. Historically, this combination has tended to reduce our exposure in down cycles and enhance revenues as market conditions improve. While the high rate
of unemployment continues to negatively impact the fundamentals of our business in many of our markets, we believe that rental rates in all of our markets have stabilized and we are seeing gradual improvement in select submarkets.
To be successful in the current leasing environment, we believe all aspects of the tenant-landlord relationship must be considered. In this regard, we believe that our understanding of tenants’ short- and long-term space utilization and amenity needs in the local markets in which we operate, our relationships with local brokers, our reputation as a premier owner and operator of Class A office properties, our financial strength
and our ability to maintain high building standards provide us with a competitive advantage in an increasingly fragmented office market. Additionally, the premier locations and high caliber of our assets are resulting in increased leasing activity as we are seeing a flight to quality by office tenants. In 2010 we signed leases for more than 6.5 million square feet of space, which exceeds by approximately 2.2 million square feet our annual average over the past five years, and we are seeing improvements in market economics in New York City and other isolated submarkets. Nevertheless, we continue to believe that general office market conditions are dependent on the impact of a recovery in the labor markets, and we are therefore not predicting significant rental rate growth or markedly fewer landlord concessions in the near-term.
As of December 31, 2010, leases representing approximately 6.9% of the space at our properties expire during 2011. While rental rates in our markets appear to have stabilized, as leases expire, assuming no change in current market rental rates, we expect the rental rates we are likely to achieve on any new leases will generally be less than the rates currently being paid, thereby generally resulting in less revenue from the same space. For example, we estimate that the average rent currently paid by our office tenants for leases that expire during 2011 is approximately 3% greater than current market rates for comparable space. Because the individual labor and industry markets may recover at different paces, we may see varying degrees of strength or softness in our core markets.advantage. We expect tenants in our markets to continue to take advantage of the ability to upgrade to high-quality space like ours, particularly those who value our operational expertise and financial stability when making their leasing decisions.
Current market conditions, characterized by overleveraged real estate assetsLeasing activity in our portfolio during 2012 was strong with approximately 5.6 million square feet of leases signed covering vacant space, extensions and property owners with insufficient capital resources, have provided opportunitiesexpansions and pre-leasing for our development projects. With leases covering just 4.0% (excluding 601 Massachusetts Avenue, which will be removed from service for redevelopment) of the space in our portfolio expiring in 2013, we are well capitalized companiespositioned to cover our maturing leases and seasoned operators, such as us, to acquire high-quality assets. Over the past six months, we acquired three Class A office properties that we had been monitoring and evaluating for some time, which are 510 Madison Avenue in New York City, the John Hancock Tower in Boston and Bay Colony Corporate Center in Waltham, Massachusetts.improve our occupancy. Each of these properties wasthe markets in which we operate has varying degrees of opportunities and challenges as described below:
| • | In the midtown Manhattan market, leasing activity is steady with 12% availability and no visible signs of increasing demand by office space users, resulting in a competitive leasing environment. Activity in our portfolio is stable with occupancy of 93.7% and little near-term lease expirations. During 2012, we made leasing progress at our 1.0 million square foot development project at 250 West 55th Street with the signing of a 246,000 square foot lease, bringing the project to approximately 46% pre-leased with virtually all of the lower floors of the tower leased. We expect the building to open in late 2013. |
In our Washington, DC region, the overall leasing activity continues to be slow and public sector and defense contractor demand has been adversely impacted by continued federal budgetary uncertainty, potential sequestration and the reductions in discretionary spending programs. Our portfolio, however, continues to have stable occupancy at 94.3% with modest rollover /exposure through 2013 of approximately 4.3% (excluding 601 Massachusetts Avenue, which will be removed from service for sale becauseredevelopment). In addition, we recently signed a lease for the remaining 182,000 square feet at Three Patriots Park in Reston, Virginia and a 376,000 square foot lease with the anchor tenant for the aforementioned 601 Massachusetts Avenue redevelopment project.
In the Boston region, the expansion of the aggressive capital structures usedlife sciences and technology industry is positively impacting each of the submarkets in which we operate. Our assets in the Boston Central Business District (“CBD”) continue to develop or purchase them duringexperience demand with tenants committing to space two to three years in advance of their rental needs, while the last economic cycle when high-leverage debt capital was readily available. We believe these acquisitions present attractive opportunities for long-term value creation throughoverall CBD market has a vacancy percentage rate in the usemid-teens, most of which is in low-rise space. The East Cambridge submarket remains healthy with vacancy rates below 10% and rising rental rents. Our Cambridge portfolio is 99% leased with no material expirations until 2014. The suburbs of Boston along Route 128, where the majority of our operational, managerialsuburban assets are located remain stable. Many mid-size and financial strength. The acquisition oflarger users are contemplating leasing more space to handle their organic growth, however, the approximately 1,700,000 square foot iconic John Hancock Tower will strengthen our foothold in Boston’s Back Bay office market. In addition, Bay Colony Corporate Center, an approximately 1,000,000 square foot, four-building office park that has undergone four ownership changes over the past few years, has experienced deteriorating occupancydecision-making process is prolonged and has recently received minimal capital investment. These factors combined with its strong location and historical reputation as one of the premier suburban Boston office addresses present an attractive repositioning and leasing opportunity for a developer and manager such as us. Finally, 510 Madison Avenue, an approximately 347,000 square foot office building that is under development,corporate consolidations have had been largely ignored by the leasing community due to its uncertain ownership status. Our initial leasing activity has been stronger than expected and we continue to generate positive interest in the building.
We believe other acquisition opportunities like those discussed above will continue to present themselves in 2011. However, potential buyers have also become more aggressive about expectations for a recovery as evidenced by the high level of interest we are seeing in marketed assets. The combination of relatively low interest rates and the abundance of capital seeking high-quality assets may have a dampening effect on return expectations. Whilethe market. Our suburban portfolio is 78% leased with approximately 1.1 million square feet of availability providing an opportunity for us as these users conclude their decision-making processes.
The San Francisco CBD and Silicon Valley submarkets continue to benefit from business expansion and job growth, particularly in the technology sector, and are among the strongest in our management teamportfolio. This is actively seeking opportunities,evidenced by positive absorption, lower vacancy and increasing rental rents. In mid—October, we will maintain our disciplined investment strategy, which focuses on high-quality assets in supply-constrained markets that have historically
provided long-term value creation. As we seekformed a joint venture to deploy capital in 2011, we also expect to actively market some selected assets for sale. We structuredpursue the acquisition of land in San Francisco, California that can support the John Hancockdevelopment of Transbay Tower, as a reverse like-kind exchange, which61-story, 1.4 million square foot office tower. In addition, during the first quarter of 2013 we acquired and commenced the development of 535 Mission Street, an approximately 307,000 square foot first class office building in San Francisco, California, estimated to be completed in 2014.
During 2012, leases for approximately 4.0 million square feet of space commenced revenue recognition, including leases for approximately 3.6 million square feet of second generation space and leases for approximately 433,000 square feet of first generation space, stemming mostly from completion of development projects. Of the approximately 3.6 million square feet, leases for approximately 648,000 square feet were signed during 2012 and leases for the remainder of this space were signed in prior periods. The second generation leases
that commenced revenue recognition during 2012 had an average lease term of approximately 96 months and included an average of approximately 115 days of free rent and total transaction costs, including tenant improvements and leasing commissions, of approximately $45 per square foot. The starting gross rents for the approximately 3.0 million square feet of second generation leases that had been occupied within the prior 12 months increased on average by approximately 6.95% compared to the ending gross rents from the previous leases for this space. Lease terms are highly dependent on location (i.e., whether the property is intended to provide us the flexibility to sell certain assets and retain capital for future investments or the reduction of debt. We are currently evaluating market interest in a saleCBD or suburban location), whether the lease is a new or renewal lease, and the length of all or a significant interest in our Carnegie Center portfolio and may identify other assets for potential sale in 2011.the lease term. Of the approximately 3.6 million square feet of second generation space, approximately 58% of the leases that commenced during 2012 were with new tenants, which tend to have greater lease transaction costs.
Given the recent low interest rate environment and the opportunity to further enhance our capital position and elongate our debt maturity schedule, we have also been active in the capital markets. SinceFrom January 1, 2010, five of our joint ventures have refinanced2013 to December 31, 2013, leases representing approximately $714 million in secured financings. In April 2010, our Operating Partnership completed a public offering of $700 million aggregate principal amount of 5.625% senior notes due 2020 that raised aggregate net proceeds of approximately $694 million, and in November 2010, our Operating Partnership completed a public offering of $850 million aggregate principal amount of 4.125% senior notes due 2021 that raised aggregate net proceeds of approximately $837 million. We used the proceeds4.0% of the November offering to reduce a significant portion ofspace at our near-term debt maturities. Specifically,properties expire (excluding 601 Massachusetts Avenue, which will be removed from service for redevelopment). As these leases expire, assuming no further change in current market rental rates, we redeemed $700 million of our Operating Partnership’s 6.25% senior notes due 2013 and we repurchased $50 million of our Operating Partnership’s 2.875% exchangeable senior notes due 2037expect that the holders may require our Operating Partnershiprental rates we are likely to repurchase in February 2012. Our remaining liquidity, including available cash as of February 18, 2011 ofachieve on new leases will generally be approximately $327 million and full availability under our Operating Partnership’s $1.0 billion line of credit, is expectedequal to provide sufficient capacity to fund the completion of our development pipeline and provide capital for future investments. We believe the quality of our assets and our strong balance sheet are attractive to lenders’ and equity investors’ current investment selectivity and should enable us to continue to access multiple sources of capital.rates currently being paid.
We believe the successful lease-up and completion of our development pipeline will enhance our long-term return on equity and earnings growth as these developments are placed in-service through 2012.2015. In 2013, we expect to fully place in-service Two Patriots Park in Reston, Virginia, 500 North Capitol Street in Washington, DC, Annapolis Junction Building Six in Annapolis, Maryland, and Seventeen Cambridge Center and the Cambridge Center Connector in Cambridge, Massachusetts, with an aggregate estimated investment of approximately $225 million, which represents our share. In aggregate, these assets are currently 88% leased.
During 2012, we were active and completed four acquisitions with a total anticipated investment of $1.4 billion. In addition, we formed a joint venture to pursue the acquisition of land in San Francisco, California to build the approximately 1.4 million square foot Transbay Tower. We also continue to actively explore acquisition opportunities in each of our markets and in February 2013 acquired 535 Mission Street in San Francisco, California, an office development project with a total anticipated investment of approximately $215 million. Also in February 2013, we entered into an agreement to purchase the last remaining parcel of land in the urban core of Reston Town Center in Reston, Virginia for approximately $27 million. The closing is expected to occur in the first quarter of 2013 and is subject to customary closing conditions. The land parcel is commercially zoned for 250,000 square feet of office space.
We believe the development of well-positioned office buildings is justified in many of our submarkets where tenants have shown demand for high-quality construction, modern design, efficient floor plates and sustainable features. Each of our development projects underway is pre-certified USGB LEED Silver or higher. Our current development pipeline, including 535 Mission Street and 601 Massachusetts Avenue, totals approximately 3.6 million square feet with a total projected investment of approximately $2.3 billion.
We maintain substantial liquidity with approximately $800 million in cash balances and approximately $735 million available under our Operating Partnership’s $750 million unsecured line of credit. However, given the funding requirements of our current development pipeline, including 535 Mission Street and 601 Massachusetts Avenue, with $1.0 billion remaining to be funded through 2015, combined with our share of remaining 2013 expiring debt of approximately $575 million (including the $450 million of 3.75% exchangeable senior notes due 2036, which are redeemable in May 2013 and excluding the $25.0 million mortgage loan collateralized by Montvale Center, see Note 6), we anticipate accessing the capital markets during 2013 to at a minimum refinance our expiring debt. We are working towardsalso reviewing our portfolio and currently expect to raise a significant amount of capital through the commencementsale of two new developmentsselect core and two redevelopments in the Washington, DCnon-core assets. The actual amount of capital that we may raise through asset sales will be dependent on market in 2011. We have also had discussions with potential tenants for our 250 West 55th Street development project in New York City. Although these discussions are in the preliminary stagesconditions and we have not yet made a decision to commence construction, we are encouraged that the market in midtown Manhattan has recovered to the point that these discussions are taking place.variety of other factors.
For descriptions of significant transactions that we entered intocompleted during 2010,2012, see “Item 1. Business—Transactions During 20102012.”
Critical Accounting Policies
The preparation of financial statements in conformity with accounting principles generally accepted in the United States of America, or GAAP, requires management to use judgment in the application of accounting policies, including making estimates and assumptions. We base our estimates on historical experience and on various other assumptions believed to be reasonable under the circumstances. These judgments affect the reported amounts of assets and liabilities and disclosure of contingent assets and liabilities at the dates of the financial statements and the reported amounts of revenue and expenses during the reporting periods. If our judgment or interpretation of the facts and circumstances relating to various transactions had been different, it is possible that different accounting policies would have been applied resulting in a different presentation of our financial statements. From time to time, we evaluate our estimates and assumptions. In the event estimates or assumptions prove to be different from actual results, adjustments are made in subsequent periods to reflect more current information. Below is a discussion of accounting policies that we consider critical in that they may require complex judgment in their application or require estimates about matters that are inherently uncertain.
Real Estate
Upon acquisitions of real estate, we assess the fair value of acquired tangible and intangible assets including(including land, buildings, tenant improvements, “above-” and “below-market” leases, leasing and assumed
financing origination costs, acquired in-place leases, other identified intangible assets and assumed liabilities, and allocateallocates the purchase price to the acquired assets and assumed liabilities, including land at appraised value and buildings as if vacant. We assess and considerconsiders fair value based on estimated cash flow projections that utilize discount and/or capitalization rates that we deemit deems appropriate, as well as available market information. Estimates of future cash flows are based on a number of factors including the historical operating results, known and anticipated trends, and market and economic conditions.
The fair value of the tangible assets of an acquired property considers the value of the property as if it were vacant. We also considerconsiders an allocation of purchase price of other acquired intangibles, including acquired in-place leases that may have a customer relationship intangible value, including (but not limited to) the nature and extent of the existing relationship with the tenants, the tenant’s credit quality and expectations of lease renewals. Based on ourits acquisitions to date, our allocation to customer relationship intangible assets has been immaterial.
We record acquired “above-” and “below-market” leases at their fair values (using a discount rate which reflects the risks associated with the leases acquired) equal to the difference between (1) the contractual amounts to be paid pursuant to each in-place lease and (2) management’s estimate of fair market lease rates for each corresponding in-place lease, measured over a period equal to the remaining term of the lease for above-market leases and the initial term plus the term of any below-market fixed rate renewal options for below-marketbelow—market leases. Other intangible assets acquired include amounts for in-place lease values that are based on our evaluation of the specific characteristics of each tenant’s lease. Factors to be considered include estimates of carrying costs during hypothetical expected lease-up periods considering current market conditions, and costs to execute similar leases. In estimating carrying costs, we include real estate taxes, insurance and other operating expenses and estimates of lost rentals at market rates during the expected lease-up periods, depending on local market conditions. In estimating costs to execute similar leases, we consider leasing commissions, legal and other related expenses.
Management reviews its long-lived assets used in operations for impairment following the end of each quarter and when there is an event or change in circumstances that indicates an impairment in value. An impairment loss is recognized if the carrying amount of its assets is not recoverable and exceeds its fair value. If such criteria are present, an impairment loss is recognized based on the excess of the carrying amount of the asset over its fair value. The evaluation of anticipated cash flows is highly subjective and is based in part on assumptions regarding future occupancy, rental rates and capital requirements that could differ materially from actual results in future periods. Since cash flows on properties considered to be “long-lived assets to be held and used” are considered on an
undiscounted basis to determine whether an asset has been impaired, our established strategy of holding properties over the long term directly decreases the likelihood of recording an impairment loss. If our strategy changes or market conditions otherwise dictate an earlier sale date, an impairment loss may be recognized and such loss could be material. If we determine that impairment has occurred, the affected assets must be reduced to their fair value.
Guidance in Accounting Standards Codification (“ASC”) 360 “Property Plant and Equipment” (“ASC 360360”) requires that qualifying assets and liabilities and the results of operations that have been sold, or otherwise qualify as “held for sale,” be presented as discontinued operations in all periods presented if the property operations are expected to be eliminated and we will not have significant continuing involvement following the sale. The components of the property’s net income that is reflected as discontinued operations include the net gain (or loss) upon the disposition of the property held for sale, operating results, depreciation and interest expense (if the property is subject to a secured loan). We generally consider assets to be “held for sale” when the transaction has been approved by our Board of Directors, or a committee thereof, and there are no known significant contingencies relating to the sale, such that a sale of the property sale within one year is considered probable. Following the classification of a property as “held for sale,” no further depreciation is recorded on the assets, and the asset is written down to the lower of carrying value or fair market value.
Real estate is stated at depreciated cost. A variety of costs are incurred in the acquisition, development and leasing of properties. The cost of buildings and improvements includes the purchase price of property, legal fees and other acquisition costs. Effective January 1, 2009, we are required toWe expense costs that an acquirer incurswe incur to effect a business combination such as legal, due diligence and other closing related costs. Costs directly related to the development of properties are capitalized. Capitalized development costs include interest, internal wages,
property taxes, insurance, and other project costs incurred during the period of development. After the determination is made to capitalize a cost, it is allocated to the specific component of a project that is benefited. Determination of when a development project commences and capitalization begins, and when a development project is substantially complete and held available for occupancy and capitalization must cease, involves a degree of judgment. Our capitalization policy on development properties is guided by guidance in ASC 835-20 “Capitalization of Interest” and ASC 970 “Real Estate—General” (formerly known as SFAS No. 34 “Capitalization of Interest Cost” and SFAS No. 67 “Accounting for Costs and the Initial Rental Operations of Real Estate Projects”).General.” The costs of land and buildings under development include specifically identifiable costs.
The capitalized costs include pre-construction costs necessary to the development of the property, development costs, construction costs, interest costs, real estate taxes, salaries and related costs and other costs incurred during the period of development. We begin the capitalization of costs during the pre-construction period which we define as activities that are necessary to the development of the property. We consider a construction project as substantially completed and held available for occupancy upon the completion of tenant improvements, but no later than one year from cessation of major construction activity. We cease capitalization on the portion (1) substantially completed, (2) occupied or held available for occupancy, and we capitalize only those costs associated with the portion under construction or (3) if activities necessary for the development of the property have been suspended.
Investments in Unconsolidated Joint Ventures
Except for ownership interestsWe consolidate variable interest entities (VIE) in which it is considered to be the primary beneficiary. VIEs are entities in which the equity investors do not have sufficient equity at risk to finance their endeavors without additional financial support or that the holders of the equity investment at risk do not have a controlling financial interest. The primary beneficiary is defined by the entity having both of the following characteristics: (1) the power to direct the activities that, when taken together, most significantly impact the variable interest entity’s performance, and (2) the obligation to absorb losses and right to receive the returns from the variable interest entity that would be significant to the variable interest entity. For ventures that are not VIEs we consolidate entities for which we arehave significant decision making control over the primary beneficiary, we account for our investments in joint ventures under the equity method of accounting because we exercise significant influence over, but do not control, these entities.ventures’ operations. Our judgment with respect to our level of influence or control of an entity and whether we are the primary beneficiary of a variable interest entity involves the consideration of various factors including the form of our ownership interest, our representation in the entity’s governance, the size of our investment (including loans), estimates of future cash flows, our ability to participate in policy making decisions and the
rights of the other investors to participate in the decision making process and to replace the us as manager and/or liquidate the venture, if applicable. Our assessment of our influence or control over an entity affects the presentation of these investments in our Consolidated Financial Statements.consolidated financial statements. In addition to evaluating control rights, we consolidate entities in which the outside partner has no substantive kick-out rights to remove the us as the managing member.
These investmentsAccounts of the consolidated entity are included in the our accounts and the non-controlling interest is reflected on the Consolidated Balance Sheets as a component of equity or in temporary equity between liabilities and equity. Investments in Unconsolidated Joint Ventures are recorded initially at cost, as Investments in Unconsolidated Joint Ventures, and subsequently adjusted for equity in earnings and cash contributions and distributions. Any difference between the carrying amount of these investments on ourthe balance sheet and the underlying equity in net assets is amortized as an adjustment to equity in earnings of unconsolidated joint ventures over the life of the related asset. Under the equity method of accounting, our net equity investment is reflected within the Consolidated Balance Sheets, and our share of net income or loss from the joint ventures is included within the Consolidated Statements of Operations. The joint venture agreements may designate different percentage allocations among investors for profits and losses,losses; however, our recognition of joint venture income or loss generally follows the joint venture’s distribution priorities, which may change upon the achievement of certain investment return thresholds. We may account for cash distributions in excess of ourits investment in an unconsolidated joint venture as income when we are not the general partner in a limited partnership and when we have neither the requirement nor the intent to provide financial support to the joint venture. For ownership interests in variable interest entities, we consolidate those in which we are the primary beneficiary. Our investments in unconsolidated joint ventures are reviewed for impairment periodically and we record impairment charges when events or circumstances change indicating that a decline in the fair valuevalues below the carrying values havehas occurred and such decline is other-than-temporary. The ultimate realization of ourthe investment in unconsolidated joint ventures is dependent on a number of factors, including the performance of each investment and market conditions. We will record an impairment charge if we determineit determines that a decline in the value below the carrying value of an investment in an unconsolidated joint venture is other than temporary.
To the extent that we contribute assets to a joint venture, our investment in the joint venture is recorded at our cost basis in the assets that were contributed to the joint venture. To the extent that our cost basis is different
than the basis reflected at the joint venture level, the basis difference is amortized over the life of the related asset and included in our share of equity in net income of the joint venture. WeIn accordance with the provisions of ASC 970-323 “Investments-Equity Method and Joint Ventures” (“ASC 970-323”) (formerly Statement of Position 78-9 “Accounting for Investments in Real Estate Ventures” (“SOP 78-9”)), we will recognize gains on the contribution of real estate to joint ventures, relating solely to the outside partner’s interest, to the extent the economic substance of the transaction is a sale.
The combined summarized financial information of the unconsolidated joint ventures is disclosed in Note 5 ofto the Consolidated Financial Statements.
Revenue Recognition
Contractual rental revenue is reported on a straight-line basis over the terms of our respective leases. We recognize rental revenue of acquired in-place “above-” and “below-market” leases at their fair values over the terms of the respective leases. Accrued rental income as reported on the Consolidated Balance Sheets represents rental income recognized in excess of rent payments actually received pursuant to the terms of the individual lease agreements.
For the year ended December 31, 2010, we recorded approximately $2.4 million2012, the impact of rental revenue representing the net adjustments of rents from “above-” and “below-market” leases.leases increased rental revenue by approximately $14.6 million. For the year ended December 31, 2010,2012, the impact of the straight-line rent adjustment increased rental revenue by approximately $85.1$77.6 million. TheseThose amounts exclude the adjustment of rents from “above-” and “below-market” leases and straight-line income from unconsolidated joint ventures, which are disclosed in Note 5 ofto the Consolidated Financial Statements.
Our leasing strategy is generally to secure creditworthy tenants that meet our underwriting guidelines. Furthermore, following the initiation of a lease, we continue to actively monitor the tenant’s creditworthiness to ensure that all tenant related assets are recorded at their realizable value. When assessing tenant credit quality, we:
review relevant financial information, including:
financial ratios;
net worth;
revenue;
cash flows;
leverage:leverage; and
liquidity;
evaluate the depth and experience of the tenant’s management team; and
assess the strength/growth of the tenant’s industry.
As a result of the underwriting process, tenants are then categorized into one of three categories:
| (1) | low risk tenants; |
| (2) | the tenant’s credit is such that we require collateral, in which case we: |
require a security deposit; and/or
reduce upfront tenant improvement investments; or
| (3) | the tenant’s credit is below our acceptable parameters. |
We consistently monitor the credit quality of our tenant base. We provide an allowance for doubtful accounts arising from estimated losses that could result from the tenant’s inability to make required current rent payments and an allowance against accrued rental income for future potential losses that we deem to be unrecoverable over the term of the lease.
Tenant receivables are assigned a credit rating of 1 through 4. A rating of 1 represents the highest possible rating and no allowance is recorded. A rating of 4 represents the lowest credit rating, in which case we record a full reserve against the receivable balance. Among the factors considered in determining the credit rating include:
payment history;
credit status and change in status (credit ratings for public companies and company financial statements are used as a primary metric);
change in tenant space utilizationneeds (i.e., expansion/downsize/sublease activity)downsize);
tenant financial performance;
economic conditions in a specific geographic region; and
industry specific credit considerations.
If our estimates of collectability differ from the cash received, then the timing and amount of our reported revenue could be impacted. The average remaining term of our in-place tenant leases, including unconsolidated joint ventures, was approximately 7.16.9 years as of December 31, 2010.2012. The credit risk is mitigated by the high quality of our existing tenant base, reviews of prospective tenants’ risk profiles prior to lease execution and consistent monitoring of our portfolio to identify potential problem tenants.
Recoveries from tenants, consisting of amounts due from tenants for common area maintenance, real estate taxes and other recoverable costs, are recognized as revenue in the period during which the expenses are incurred. Tenant reimbursements are recognized and presented in accordance with guidance in ASC 605-45 “Principal Agent Considerations” (“ASC 605-45”) (formerly known as Emerging Issues Task Force, or EITF, Issue 99-19 “Reporting Revenue Gross as a Principal versus Net as an Agent,” or (“Issue 99-19”)). ASC 605-45 requires that these reimbursements be recorded on a gross basis, as we are generally the primary obligor with respect to purchasing goods and services from third-party suppliers, have discretion in selecting the supplier and have credit risk. We also receive reimbursement of payroll and payroll related costs from third parties which we reflect on a net basis.
Our parking revenues are derived from leases, monthly parking and transient parking. We recognize parking revenue as earned.
Our hotel revenues are derived from room rentals and other sources such as charges to guests for long-distance telephone service, fax machine use, movie and vending commissions, meeting and banquet room revenue and laundry services. Hotel revenues are recognized as earned.
We receive management and development fees from third parties. Property managementManagement fees are recorded and earned based on a percentage of collected rents at the properties under management, and not on a straight-line basis, because such fees are contingent upon the collection of rents. We review each development agreement and record development fees as earned depending on the risk associated with each project. Profit on development fees earned from joint venture projects is recognized as revenue to the extent of the third partythird-party partners’ ownership interest.
Gains on sales of real estate are recognized pursuant to the provisions included in ASC 360-20 “Real Estate Sales” (“ASC 360-20”) (formerly known as SFAS No. 66, “Accounting for Sales of Real Estate”). The specific timing of the sale is measured against various criteria in ASC 360-20 related to the terms of the transaction and any continuing involvement in the form of management or financial assistance associated with the properties. If the criteria for the full accrual method are not met, we defer some or all of the gain recognition and account for the continued operations of the property by applying the finance, leasing, profit sharing, deposit, installment or cost recovery methods, as appropriate, until the sales criteria are met.
Depreciation and Amortization
We compute depreciation and amortization on our properties using the straight-line method based on estimated useful asset lives. We allocate the acquisition cost of real estate to land, building, tenant improvements, acquired “above-” and “below-market” leases, origination costs and acquired in-place leases based on an
assessment of their fair valueits components and depreciate or amortize these assets over their useful lives. The amortization of acquired “above-” and “below-market” leases and acquired in-place leases is recorded as an adjustment to revenue and depreciation and amortization, respectively, in the Consolidated Statements of Operations.
Fair Value of Financial Instruments
For purposes of disclosure, we calculate the fair value of our mortgage notes payable and unsecured senior notes. We discountdetermine the fair value of our unsecured senior notes and unsecured exchangeable senior notes using market prices. We determine the fair value of our mortgage notes payable using discounted cash flow analyses by discounting the spread between the future contractual interest payments and hypothetical future interest payments on our mortgage debt and unsecured notes based on a current market rate.rates for similar securities. In determining the current market rate,rates, we add our estimateestimates of a market spreadspreads to the quoted yields on federal government treasury securities with similar maturity dates to our ownits debt. Because our valuations of our financial instruments are based on these types of estimates, the actual fair value of our financial instruments may differ materially if our estimates do not prove to be accurate.
Derivative Instruments and Hedging Activities
Derivative instruments and hedging activities require management to make judgments on the nature of its derivatives and their effectiveness as hedges. These judgments determine if the changes in fair value of the derivative instruments are reported in the Consolidated Statements of Operations as a component of net income or as a component of comprehensive income and as a component of equity on the Consolidated Balance Sheets. While management believes its judgments are reasonable, a change in a derivative’s effectiveness as a hedge could materially affect expenses, net income and equity. We account for the effective portion of changes in the fair value of a derivative in other comprehensive income (loss) and subsequently reclassify the effective portion to earnings over the term that the hedged transaction affects earnings. We account for the ineffective portion of changes in the fair value of a derivative directly in earnings.
Results of Operations
The following discussion is based on our Consolidated Financial StatementsStatement of Operations for the years ended December 31, 2010, 20092012, 2011 and 2008.2010.
At December 31, 2010, 20092012, 2011 and 2008,2010, we owned or had interests in a portfolio of 146, 146157, 153 and 147146 properties, respectively (the(in each case, the “Total Property Portfolio”). As a result of changes within our Total Property Portfolio, the financial data presented below shows significant changes in revenue and expenses from period-to-period. Accordingly, we do not believe that our period-to-period financial data with respect to the Total Property Portfolio are necessarily meaningful. Therefore, the comparisonscomparison of operating results for the years ended 2010, 2009December 31, 2012, 2011 and 20082010 show separately the changes attributable to the properties that were owned by us and in service throughout each period compared (the “Same Property Portfolio”) and the changes attributable to the properties included in Propertiesthe Placed In-Service, Acquired Sold, Repositioned and Placed-in Service.or Development or Redevelopment Portfolios.
In our analysis of operating results, particularly to make comparisons of net operating income between periods meaningful, it is important to provide information for properties that were in-service and owned by us throughout each period presented. We refer to properties acquired or placed in-service prior to the beginning of the earliest period presented and owned by us and in service through the end of the latest period presented as our Same Property Portfolio. The Same Property Portfolio therefore excludes properties placed in-service, acquired, repositioned or repositionedin development or redevelopment after the beginning of the earliest period presented or disposed of prior to the end of the latest period presented.
Net operating income, or “NOI,”NOI, is a non-GAAP financial measure equal to net income attributable to Boston Properties, Inc., the most directly comparable GAAP financial measure, plus income attributable to noncontrolling interests, discontinued operations, depreciation and amortization, interest expense, losses from early extinguishments of debt, (losses) gains from investments in securities, net derivative losses, loss (gain) from suspension of development, depreciation and amortization, interest expense, acquisitiontransaction costs, and general and administrative expense, less gains on sales of real estate, gains (losses) from investments in securities, income (loss)
from unconsolidated joint ventures, interest and other income and development and management services revenue. We use NOI internally as a performance measure and believe NOI provides useful information to investors regarding our financial condition and results of operations because it reflects only those income and expense items that are incurred at the property level. Therefore, we believe NOI is a useful measure for evaluating the operating performance of our real estate assets.
Our management also uses NOI to evaluate regional property level performance and to make decisions about resource allocations. Further, we believe NOI is useful to investors as a performance measure because, when compared across periods, NOI reflects the impact on operations from trends in occupancy rates, rental rates, operating costs and acquisition and development activity on an unleveraged basis, providing perspectiveperspectives not immediately apparent from net income attributable to Boston Properties, Inc. NOI excludes certain components from net income attributable to Boston Properties, Inc. in order to provide results that are more closely related to our properties’a property’s results of operations. For example, interest expense is not necessarily linked to the operating performance of a real estate asset and is often incurred at the corporate level as opposed to the property level. In addition, depreciation and amortization, because of historical cost accounting and useful life estimates, may distort operating performance at the property level. NOI presented by us may not be comparable to NOI
reported by other REITs that define NOI differently. We believe that in order to facilitate a clear understanding of our operating results, NOI should be examined in conjunction with net income attributable to Boston Properties, Inc. as presented in our Consolidated Financial Statements. NOI should not be considered as an alternative to net income attributable to Boston Properties, Inc. as an indication of our performance or to cash flows as a measure of liquidity or ability to make distributions. For a reconciliation of NOI to net income attributable to Boston Properties, Inc., see Note 14 to the Consolidated Financial Statements.
Comparison of the year ended December 31, 20102012 to the year ended December 31, 20092011
The table below shows selected operating information for the Same Property Portfolio and the Total Property Portfolio. The Same Property Portfolio consists of 134125 properties includingtotaling approximately 31.7 million net rentable square feet of space, excluding unconsolidated joint ventures. The Same Property Portfolio includes properties acquired or placed in-service on or prior to January 1, 20092011 and owned and in service through December 31, 2010, totaling approximately 34.8 million net rentable square feet of space (excluding square feet of structured parking).2012. The Total Property Portfolio includes the effects of the other properties either placed in-service, acquired or repositionedin development or redevelopment after January 1, 20092011 or disposed of on or prior to December 31, 2010. There were no properties that were sold or repositioned after January 1, 2009.2012. This table includes a reconciliation from the Same Property Portfolio to the Total Property Portfolio by also providing information for the year ended December 31, 20102012 and 20092011 with respect to the properties which were placed in-service, acquired and placed in-service.or in development or redevelopment.
| Same Property Portfolio | Properties Acquired Portfolio | Properties Placed In-Service Portfolio | Total Property Portfolio | Same Property Portfolio | Properties Acquired Portfolio | Properties Placed In-Service Portfolio | Properties in Development or Redevelopment Portfolio | Total Property Portfolio | ||||||||||||||||||||||||||||||||||||||||||||||||||||||||||||||||||||||||||||||||||||||||||||||||
(dollars in thousands) | 2010 | 2009 | Increase/ (Decrease) | % Change | 2010 | 2009 | 2010 | 2009 | 2010 | 2009 | Increase/ (Decrease) | % Change | 2012 | 2011 | Increase/ (Decrease) | % Change | 2012 | 2011 | 2012 | 2011 | 2012 | 2011 | 2012 | 2011 | Increase/ (Decrease) | % Change | ||||||||||||||||||||||||||||||||||||||||||||||||||||||||||||||||||||||||||||||
Rental Revenue: | ||||||||||||||||||||||||||||||||||||||||||||||||||||||||||||||||||||||||||||||||||||||||||||||||||||||||
Rental Revenue | $ | 1,420,325 | $ | 1,423,459 | $ | (3,134 | ) | (0.22 | )% | $ | 857 | $ | — | $ | 46,426 | $ | 15,058 | $ | 1,467,608 | $ | 1,438,517 | $ | 29,091 | 2.02 | % | $ | 1,577,821 | $ | 1,562,599 | $ | 15,222 | 0.97 | % | $ | 90,015 | $ | 19,883 | $ | 126,031 | $ | 73,792 | $ | (34 | ) | $ | 10,228 | $ | 1,793,833 | $ | 1,666,502 | $ | 127,331 | 7.64 | % | ||||||||||||||||||||||||||||||||||||||||||||||||||
Termination Income | 9,165 | 14,410 | (5,245 | ) | (36.40 | )% | — | — | — | — | 9,165 | 14,410 | (5,245 | ) | (36.40 | )% | 7,294 | 3,758 | 3,536 | 94.09 | % | 577 | (20 | ) | — | 2,591 | 2,571 | 10,535 | 10,442 | 16,864 | (6,422 | ) | (38.08 | )% | ||||||||||||||||||||||||||||||||||||||||||||||||||||||||||||||||||||||
|
|
|
|
|
|
|
|
|
|
|
|
|
| |||||||||||||||||||||||||||||||||||||||||||||||||||||||||||||||||||||||||||||||||||||||||||
Total Rental Revenue | 1,429,490 | 1,437,869 | (8,379 | ) | (0.58 | )% | 857 | — | 46,426 | 15,058 | 1,476,773 | 1,452,927 | 23,846 | 1.64 | % | 1,585,115 | 1,566,357 | 18,758 | 1.20 | % | 90,592 | 19,863 | 126,031 | 76,383 | 2,537 | 20,763 | 1,804,275 | 1,683,366 | 120,909 | 7.18 | % | |||||||||||||||||||||||||||||||||||||||||||||||||||||||||||||||||||||||||
|
|
|
|
|
|
|
|
|
|
|
|
|
| |||||||||||||||||||||||||||||||||||||||||||||||||||||||||||||||||||||||||||||||||||||||||||
Real Estate Operating Expenses | 491,598 | 497,720 | (6,122 | ) | (1.23 | )% | 358 | — | 9,738 | 4,079 | 501,694 | 501,799 | (105 | ) | (0.02 | )% | 565,211 | 543,639 | 21,572 | 3.97 | % | 40,241 | 12,313 | 51,891 | 31,561 | 20 | 2,711 | 657,363 | 590,224 | 67,139 | 11.38 | % | ||||||||||||||||||||||||||||||||||||||||||||||||||||||||||||||||||||||||
|
|
|
|
|
|
|
|
|
|
|
|
|
| |||||||||||||||||||||||||||||||||||||||||||||||||||||||||||||||||||||||||||||||||||||||||||
Net Operating Income, excluding hotel | 937,892 | 940,149 | (2,257 | ) | (0.24 | )% | 499 | — | 36,688 | 10,979 | 975,079 | 951,128 | 23,951 | 2.52 | % | 1,019,904 | 1,022,718 | (2,814 | ) | (0.28 | )% | 50,351 | 7,550 | 74,140 | 44,822 | 2,517 | 18,052 | 1,146,912 | 1,093,142 | 53,770 | 4.92 | % | ||||||||||||||||||||||||||||||||||||||||||||||||||||||||||||||||||||||||
|
|
|
|
|
|
|
|
|
|
|
|
|
| |||||||||||||||||||||||||||||||||||||||||||||||||||||||||||||||||||||||||||||||||||||||||||
Hotel Net Operating Income(1) | 7,647 | 6,419 | 1,228 | 19.13 | % | — | — | — | — | 7,647 | 6,419 | 1,228 | 19.13 | % | 9,795 | 8,401 | 1,394 | 16.59 | % | — | — | — | — | — | — | 9,795 | 8,401 | 1,394 | 16.59 | % | ||||||||||||||||||||||||||||||||||||||||||||||||||||||||||||||||||||||||||
|
|
|
|
|
|
|
|
|
|
|
|
|
| |||||||||||||||||||||||||||||||||||||||||||||||||||||||||||||||||||||||||||||||||||||||||||
Consolidated Net Operating Income(1) | 945,539 | 946,568 | (1,029 | ) | (0.11 | )% | 499 | — | 36,688 | 10,979 | 982,726 | 957,547 | 25,179 | 2.63 | % | 1,029,699 | 1,031,119 | (1,420 | ) | (0.14 | )% | 50,351 | 7,550 | 74,140 | 44,822 | 2,517 | 18,052 | 1,156,707 | 1,101,543 | 55,164 | 5.01 | % | ||||||||||||||||||||||||||||||||||||||||||||||||||||||||||||||||||||||||
|
|
|
|
|
|
|
|
|
|
|
|
|
| |||||||||||||||||||||||||||||||||||||||||||||||||||||||||||||||||||||||||||||||||||||||||||
Other Revenue: | ||||||||||||||||||||||||||||||||||||||||||||||||||||||||||||||||||||||||||||||||||||||||||||||||||||||||
Development and management services | — | — | — | — | — | — | — | — | 41,231 | 34,878 | 6,353 | 18.21 | % | — | — | — | — | — | — | — | — | — | — | 34,077 | 33,425 | 652 | 1.95 | % | ||||||||||||||||||||||||||||||||||||||||||||||||||||||||||||||||||||||||||||
Other Expenses: | ||||||||||||||||||||||||||||||||||||||||||||||||||||||||||||||||||||||||||||||||||||||||||||||||||||||||
General and administrative expense | — | — | — | — | — | — | — | — | 79,658 | 75,447 | 4,211 | 5.58 | % | — | — | — | — | — | — | — | — | — | — | 82,382 | 79,610 | 2,772 | 3.48 | % | ||||||||||||||||||||||||||||||||||||||||||||||||||||||||||||||||||||||||||||
Acquisition costs | — | — | — | — | — | — | — | — | 2,614 | — | 2,614 | 100.00 | % | |||||||||||||||||||||||||||||||||||||||||||||||||||||||||||||||||||||||||||||||||||||||||||
Loss (gain) from suspension of development | — | — | — | — | — | — | — | — | (7,200 | ) | 27,766 | (34,966 | ) | (125.93 | )% | |||||||||||||||||||||||||||||||||||||||||||||||||||||||||||||||||||||||||||||||||||||||||
Transaction costs | — | — | — | — | — | — | — | — | — | — | 3,653 | 1,987 | 1,666 | 83.84 | % | |||||||||||||||||||||||||||||||||||||||||||||||||||||||||||||||||||||||||||||||||||||||||
Depreciation and amortization | 327,221 | 317,933 | 9,288 | 2.92 | % | 394 | — | 10,756 | 3,748 | 338,371 | 321,681 | 16,690 | 5.19 | % | 370,430 | 365,827 | 4,603 | 1.26 | % | 43,729 | 13,516 | 36,973 | 38,592 | 1,936 | 18,677 | 453,068 | 436,612 | 16,456 | 3.77 | % | ||||||||||||||||||||||||||||||||||||||||||||||||||||||||||||||||||||||||||
|
|
|
|
|
|
|
|
|
|
|
|
|
| |||||||||||||||||||||||||||||||||||||||||||||||||||||||||||||||||||||||||||||||||||||||||||
Total Other Expenses | 327,221 | 317,933 | 9,288 | 2.92 | % | 394 | — | 10,756 | 3,748 | 413,443 | 424,894 | (11,451 | ) | (2.70 | )% | 370,430 | 365,827 | 4,603 | 1.26 | % | 43,729 | 13,516 | 36,973 | 38,592 | 1,936 | 18,677 | 539,103 | 518,209 | 20,894 | 4.03 | % | |||||||||||||||||||||||||||||||||||||||||||||||||||||||||||||||||||||||||
|
|
|
|
|
|
|
|
|
|
|
|
|
| |||||||||||||||||||||||||||||||||||||||||||||||||||||||||||||||||||||||||||||||||||||||||||
Operating Income | 618,318 | 628,635 | (10,317 | ) | (1.64 | )% | 105 | — | 25,932 | 7,231 | 610,514 | 567,531 | 42,983 | 7.57 | % | 659,269 | 665,292 | (6,023 | ) | (0.91 | )% | 6,622 | (5,966 | ) | 37,167 | 6,230 | 581 | (625 | ) | 651,681 | 616,759 | 34,922 | 5.66 | % | ||||||||||||||||||||||||||||||||||||||||||||||||||||||||||||||||||||||
Other Income: | ||||||||||||||||||||||||||||||||||||||||||||||||||||||||||||||||||||||||||||||||||||||||||||||||||||||||
Income from unconsolidated joint ventures | — | — | — | — | — | — | — | — | 36,774 | 12,058 | 24,716 | 204.98 | % | 49,078 | 85,896 | (36,818 | ) | (42.86 | )% | |||||||||||||||||||||||||||||||||||||||||||||||||||||||||||||||||||||||||||||||||||||
Interest and other income | — | — | — | — | — | — | — | — | 7,332 | 4,059 | 3,273 | 80.64 | % | 10,091 | 5,358 | 4,733 | 88.34 | % | ||||||||||||||||||||||||||||||||||||||||||||||||||||||||||||||||||||||||||||||||||||||
Gains from investments in securities | — | — | — | — | — | — | — | — | 935 | 2,434 | (1,499 | ) | (61.59 | )% | ||||||||||||||||||||||||||||||||||||||||||||||||||||||||||||||||||||||||||||||||||||||||||
Gains (losses) from investments in securities | 1,389 | (443 | ) | 1,832 | 413.54 | % | ||||||||||||||||||||||||||||||||||||||||||||||||||||||||||||||||||||||||||||||||||||||||||||||||||
Other Expenses: | ||||||||||||||||||||||||||||||||||||||||||||||||||||||||||||||||||||||||||||||||||||||||||||||||||||||||
Losses from early extinguishments of debt | 4,453 | 1,494 | 2,959 | 198.06 | % | |||||||||||||||||||||||||||||||||||||||||||||||||||||||||||||||||||||||||||||||||||||||||||||||||||
Interest expense | — | — | — | — | — | — | — | — | 378,079 | 322,833 | 55,246 | 17.11 | % | 413,564 | 394,131 | 19,433 | 4.93 | % | ||||||||||||||||||||||||||||||||||||||||||||||||||||||||||||||||||||||||||||||||||||||
Losses from early extinguishments of debt | — | — | — | — | — | — | — | — | 89,883 | 510 | 89,373 | 17524.12 | % | |||||||||||||||||||||||||||||||||||||||||||||||||||||||||||||||||||||||||||||||||||||||||||
|
|
|
| |||||||||||||||||||||||||||||||||||||||||||||||||||||||||||||||||||||||||||||||||||||||||||||||||||||
Income from continuing operations | 187,593 | 262,739 | (75,146 | ) | (28.60 | )% | 294,222 | 311,945 | (17,723 | ) | (5.68 | )% | ||||||||||||||||||||||||||||||||||||||||||||||||||||||||||||||||||||||||||||||||||||||||||||
Gains on sales of real estate | 2,734 | 11,760 | (9,026 | ) | (76.75 | )% | ||||||||||||||||||||||||||||||||||||||||||||||||||||||||||||||||||||||||||||||||||||||||||||||||||
Discontinued operations: | ||||||||||||||||||||||||||||||||||||||||||||||||||||||||||||||||||||||||||||||||||||||||||||||||||||||||
Income from discontinued operations | 1,040 | 1,881 | (841 | ) | (44.71 | )% | ||||||||||||||||||||||||||||||||||||||||||||||||||||||||||||||||||||||||||||||||||||||||||||||||||
Gain on sale of real estate from discontinued operations | 36,877 | — | 36,877 | 100.00 | % | |||||||||||||||||||||||||||||||||||||||||||||||||||||||||||||||||||||||||||||||||||||||||||||||||||
|
|
|
| |||||||||||||||||||||||||||||||||||||||||||||||||||||||||||||||||||||||||||||||||||||||||||||||||||||
Net income | 190,327 | 274,499 | (84,172 | ) | (30.66 | )% | 332,139 | 313,826 | 18,313 | 5.84 | % | |||||||||||||||||||||||||||||||||||||||||||||||||||||||||||||||||||||||||||||||||||||||||||||
Net income attributable to noncontrolling interests: | ||||||||||||||||||||||||||||||||||||||||||||||||||||||||||||||||||||||||||||||||||||||||||||||||||||||||
Noncontrolling interests in property partnerships | (3,464 | ) | (2,778 | ) | (686 | ) | (24.69 | )% | (3,792 | ) | (1,558 | ) | (2,234 | ) | (143.39 | )% | ||||||||||||||||||||||||||||||||||||||||||||||||||||||||||||||||||||||||||||||||||||||||
Noncontrolling interest–redeemable preferred units of the Operating Partnership | (3,343 | ) | (3,594 | ) | 251 | 6.98 | % | |||||||||||||||||||||||||||||||||||||||||||||||||||||||||||||||||||||||||||||||||||||||||||||||||
Noncontrolling interest—redeemable preferred units of the Operating Partnership | (3,497 | ) | (3,339 | ) | (158 | ) | (4.73 | )% | ||||||||||||||||||||||||||||||||||||||||||||||||||||||||||||||||||||||||||||||||||||||||||||||||
Noncontrolling interest—common units of the Operating Partnership | (24,099 | ) | (35,534 | ) | 11,435 | 32.18 | % | (31,046 | ) | (36,035 | ) | 4,989 | 13.84 | % | ||||||||||||||||||||||||||||||||||||||||||||||||||||||||||||||||||||||||||||||||||||||||||
Noncontrolling interest in gains on sales of real estate—common units of the Operating Partnership | (349 | ) | (1,579 | ) | 1,230 | 77.90 | % | |||||||||||||||||||||||||||||||||||||||||||||||||||||||||||||||||||||||||||||||||||||||||||||||||
Noncontrolling interest in discontinued operations—common units of the Operating Partnership | (4,154 | ) | (215 | ) | (3,939 | ) | 1,832.09 | % | ||||||||||||||||||||||||||||||||||||||||||||||||||||||||||||||||||||||||||||||||||||||||||||||||
|
|
|
| |||||||||||||||||||||||||||||||||||||||||||||||||||||||||||||||||||||||||||||||||||||||||||||||||||||
Net Income attributable to Boston Properties, Inc. | $ | 159,072 | $ | 231,014 | $ | (71,942 | ) | (31.14 | )% | $ | 289,650 | $ | 272,679 | $ | 16,971 | 6.22 | % | |||||||||||||||||||||||||||||||||||||||||||||||||||||||||||||||||||||||||||||||||||||||
|
|
|
| |||||||||||||||||||||||||||||||||||||||||||||||||||||||||||||||||||||||||||||||||||||||||||||||||||||
| (1) | For a detailed discussion of NOI, including the reasons management believes NOI is useful to investors, see page |
Same Property Portfolio
Rental Revenue
Rental revenue from the Same Property Portfolio decreasedincreased approximately $3.1$15.2 million for the year ended December 31, 20102012 compared to 2009. Included2011. The increase was primarily the result of an increase of approximately $10.0 million in Same Property Portfolio rental revenue are decreasesfrom our leases, increases in (1) contractual rental revenue of approximately $10.9 million, (2) recoveries from tenants of approximately $23.9 million and (3) parking and other income of approximately $1.9$3.3 million and $2.1 million, respectively, partially offset by a decrease in other recoveries of approximately $0.2 million. These decreases were partiallyThe increase in rental revenue from our leases of approximately $10.0 million was the result of our average revenue increasing by approximately $0.42 per square foot, contributing approximately $12.0 million, offset by an approximately $33.6$2.0 million increase in straight-line rent. The decrease in contractual rental revenue and increase in straight-line rents are primarily due to (1) new leases ata decline in average occupancy from 92.4% to 92.1%.
During 2013, we expect recent leasing gains primarily in Cambridge Center, Embarcadero Center and 399 Park Avenue and 601 Lexington Avenueto result in New York Cityan increase of Same Property Portfolio net operating income of approximately 1.5% to 2.5% compared to 2012 and (2) a major law firm lease (approximately 480,000 square feet) in Boston being in free rent periods. The free rent periods for the new leases in New York City ranged from six to twelve months, while the law firm’s lease in Boston had twelve months of free rent, and these periods expired during 2010 or will expire during 2011.
Generally, under each of our leases, we are entitled to recover from the tenant increasesprojecting a modest improvement in specific operating expenses associated with the leased property above the amount incurred for these operating expenses in the first year of the lease. The decrease in recoveries from tenants is primarily due to the terminations by tenants in New York Cityour occupancy averaging between 92% and a large lease expiration in Boston. Although the majority of the space was re-leased, the new leases are in their first year during which, generally, no tenant recoveries are earned.93%.
Termination Income
Termination income decreasedincreased by approximately $5.2$3.5 million for the year ended December 31, 20102012 compared to 2009.2011.
Termination income for the year ended December 31, 2012 related to twenty-four tenants across the Same Property Portfolio and totaled approximately $7.3 million of which approximately $3.6 million was from the settlement of a bankruptcy claim against a former tenant that rejected our lease in 2009 and approximately $0.9 million was a negotiated termination from one of our Reston, Virginia properties in order to accommodate growth of an existing tenant.
Termination income for the year ended December 31, 2011 related to fifteen tenants across the Same Property Portfolio and totaled approximately $3.8 million, which included approximately $1.8 million of termination income related to a default by a 30,000 square foot law firm tenant in one of our New York City properties.
Real Estate Operating Expenses
Operating expenses from the Same Property Portfolio increased approximately $21.6 million for the year ended December 31, 2012 compared to 2011. This increase was primarily due to (1) an increase of approximately $13.8 million, or 5.8% in real estate taxes, which was primarily in our Boston, New York and Washington, DC regions, (2) an approximately $3.2 million cumulative non-cash straight-line adjustment for ground rent expense (refer to Note 2 to the Consolidated Financial Statements) and (3) an approximately $4.6 million, or 1.5%, increase in other property operating expenses.
Depreciation and Amortization Expense
Depreciation and amortization expense for the Same Property Portfolio increased approximately $4.6 million, or 1.3%, for the year ended December 31, 2012 compared to 2011.
Properties Acquired Portfolio
On February 1, 2011, we completed the acquisition of Bay Colony Corporate Center in Waltham, Massachusetts for an aggregate purchase price of approximately $185.0 million. Bay Colony Corporate Center is an approximately 985,000 net rentable square foot, four-building Class A office park situated on a 58-acre site in Waltham, Massachusetts.
On November 22, 2011, we acquired 2440 West El Camino Real located in Mountain View, California for a net purchase price of approximately $71.1 million. 2440 West El Camino Real is an approximately 140,000 net rentable square foot Class A office property.
On March 1, 2012, we acquired 453 Ravendale Drive located in Mountain View, California for a purchase price of approximately $6.7 million in cash. 453 Ravendale Drive is an approximately 30,000 net rentable square foot Office/Technical property.
On March 13, 2012, we acquired 100 Federal Street in Boston, Massachusetts for an aggregate investment of approximately $615.0 million in cash. In connection with the transaction, we entered into a long-term lease with an affiliate of Bank of America for approximately 732,000 square feet. 100 Federal Street is an approximately 1,265,000 net rentable square foot, 37-story Class A office tower.
On October 4, 2012, we completed the formation of a joint venture which owns and operates Fountain Square located in Reston, Virginia, adjacent to our other Reston properties. Fountain Square is an office and retail complex aggregating approximately 758,000 net rentable square feet, comprised of approximately 521,000 net rentable square feet of Class A office space and approximately 237,000 net rentable square feet of retail space. We own 50% of, and are consolidating, the joint venture. See Note 3 of the Consolidated Financial Statements.
Rental Revenue
Rental revenue from our Properties Acquired Portfolio increased approximately $70.7 million for the year ended December 31, 2012 compared to 2011, as detailed below:
Property | Date Acquired | Rental Revenue for the year ended December 31, | ||||||||||||
| 2012 | 2011 | Change | ||||||||||||
| (in thousands) | ||||||||||||||
Bay Colony Corporate Center | February 1, 2011 | $ | 20,778 | $ | 19,047 | $ | 1,731 | |||||||
2440 West El Camino Real | November 22, 2011 | 8,122 | 816 | 7,306 | ||||||||||
453 Ravendale Drive | March 1, 2012 | 494 | — | 494 | ||||||||||
100 Federal Street | March 13, 2012 | 52,529 | — | 52,529 | ||||||||||
Fountain Square | October 4, 2012 | 8,669 | — | 8,669 | ||||||||||
|
|
|
|
|
| |||||||||
Total | $ | 90,592 | $ | 19,863 | $ | 70,729 | ||||||||
|
|
|
|
|
| |||||||||
Real Estate Operating Expenses
Real estate operating expenses from our Properties Acquired Portfolio increased approximately $27.9 million for the year ended December 31, 2012 compared to 2011, as detailed below:
Property | Date Acquired | Real Estate Operating Expenses for the year ended December 31, | ||||||||||||
| 2012 | 2011 | Change | ||||||||||||
| (in thousands) | ||||||||||||||
Bay Colony Corporate Center | February 1, 2011 | $ | 12,410 | $ | 12,008 | $ | 402 | |||||||
2440 West El Camino Real | November 22, 2011 | 2,453 | 305 | 2,148 | ||||||||||
453 Ravendale Drive | March 1, 2012 | 149 | — | 149 | ||||||||||
100 Federal Street | March 13, 2012 | 22,141 | — | 22,141 | ||||||||||
Fountain Square | October 4, 2012 | 3,088 | — | 3,088 | ||||||||||
|
|
|
|
|
| |||||||||
Total | $ | 40,241 | $ | 12,313 | $ | 27,928 | ||||||||
|
|
|
|
|
| |||||||||
Depreciation and Amortization Expense
Depreciation and amortization expense for our Properties Acquired Portfolio increased by approximately $30.2 million for the year ended December 31, 2012 compared to 2011 as a result of the acquisition of properties after December 31, 2011, as well as the additional depreciation expense incurred for the year ended December 31, 2012 associated with Bay Colony Corporate Center and 2440 West El Camino Real, which were acquired on February 1, 2011 and November 22, 2011, respectively, and, as a result, were not recognizing depreciation expense for the full year ended December 31, 2011.
Properties Placed In-Service Portfolio
At December 31, 2012, we had six properties totaling approximately 2.3 million square feet that were placed in-service or partially placed in-service between January 1, 2011 and December 31, 2012.
Rental Revenue
Rental revenue from our Properties Placed In-Service Portfolio increased approximately $49.6 million for the year ended December 31, 2012 compared to 2011, as detailed below:
Property | Quarter Initially Placed In-Service | Quarter Fully Placed In-Service | Rental Revenue for the year ended December 31, | |||||||||||||
| 2012 | 2011 | Change | ||||||||||||||
| (in thousands) | ||||||||||||||||
2200 Pennsylvania Avenue | First Quarter, 2011 | Third Quarter, 2011 | $ | 31,052 | $ | 17,656 | $ | 13,396 | ||||||||
Residences on The Avenue | Second Quarter, 2011 | Third Quarter, 2011 | 16,632 | 5,632 | 11,000 | |||||||||||
The Lofts at Atlantic Wharf | Third Quarter, 2011 | Third Quarter, 2011 | 3,936 | 985 | 2,951 | |||||||||||
Atlantic Wharf—Office | First Quarter, 2011 | Fourth Quarter, 2011 | 49,235 | 36,775 | 12,460 | |||||||||||
510 Madison Avenue | Second Quarter, 2011 | Second Quarter, 2012 | 19,577 | 7,270 | 12,307 | |||||||||||
One Patriots Park (formerly known as 12310 Sunrise Valley Drive) | Second Quarter, 2012 | Second Quarter, 2012 | 5,599 | 8,065 | (2,466 | ) | ||||||||||
|
|
|
|
|
| |||||||||||
Total | $ | 126,031 | $ | 76,383 | $ | 49,648 | ||||||||||
|
|
|
|
|
| |||||||||||
Termination Income
Included in rental revenue above is approximately $2.6 million of termination income for the year ended December 31, 2011 related to lease amendments we signed on July 1, 2011 with the existing tenant at our three-building complex on Sunrise Valley Drive in Reston, Virginia. Under the agreements, the existing tenant terminated early its leases for approximately 523,000 square feet at the complex and was responsible for certain payments to us aggregating approximately $15.7 million. During the year ended December 31, 2011, we recognized approximately $13.1 million of termination income related to these agreements, of which approximately $10.5 million is included within the Development or Redevelopment Portfolio. One of the three buildings, One Patriots Park (formerly known as 12310 Sunrise Valley Drive) has been redeveloped and placed back in-service and is now occupied by a new tenant.
Real Estate Operating Expenses
Real estate operating expenses from our Properties Placed In-Service Portfolio increased approximately $20.3 million for the year ended December 31, 2012 compared to 2011, as detailed below:
Property | Quarter Initially Placed In-Service | Quarter Fully Placed In-Service | Real Estate Operating Expenses for the year ended December 31, | |||||||||||||
| 2012 | 2011 | Change | ||||||||||||||
| (in thousands) | ||||||||||||||||
2200 Pennsylvania Avenue | First Quarter, 2011 | Third Quarter, 2011 | $ | 18,307 | $ | 11,326 | $ | 6,981 | ||||||||
Residences on The Avenue | Second Quarter, 2011 | Third Quarter, 2011 | 9,317 | 4,958 | 4,359 | |||||||||||
The Lofts at Atlantic Wharf | Third Quarter, 2011 | Third Quarter, 2011 | 1,675 | 521 | 1,154 | |||||||||||
Atlantic Wharf—Office | First Quarter, 2011 | Fourth Quarter, 2011 | 15,005 | 10,804 | 4,201 | |||||||||||
510 Madison Avenue | Second Quarter, 2011 | Second Quarter, 2012 | 6,223 | 2,995 | 3,228 | |||||||||||
One Patriots Park (formerly known as 12310 Sunrise Valley Drive) | Second Quarter, 2012 | Second Quarter, 2012 | 1,364 | 957 | 407 | |||||||||||
|
|
|
|
|
| |||||||||||
Total | $ | 51,891 | $ | 31,561 | $ | 20,330 | ||||||||||
|
|
|
|
|
| |||||||||||
Real estate operating expenses for 2200 Pennsylvania Avenue and the Residences on The Avenue include ground rent expense, which includes the non-cash straight-lining of the ground rent expense of approximately $11.1 million and $5.1 million, respectively, for the year ended December 31, 2012 and $6.7 million and $2.8 million, respectively, for the year ended December 31, 2011.
Depreciation and Amortization Expense
Depreciation and amortization expense for our Properties Placed In-Service Portfolio decreased by approximately $1.6 million for the year ended December 31, 2012 compared to 2011. Approximately $17.6 million of the decrease in depreciation expense for One Patriots Park was the result of the acceleration of depreciation expense during the year ended December 31, 2011 in conjunction with the building being taken out of service for redevelopment. This decrease was partially offset by an increase of approximately $16.0 million in depreciation expense at the other buildings that were placed in-service.
Properties in Development or Redevelopment Portfolio
At December 31, 2012 and 2011, the Properties in Development or Redevelopment Portfolio consisted primarily of our 250 West 55th Street development project located in New York City and our Two Patriots Park (formerly known as 12300 Sunrise Valley Drive) property located in Reston, Virginia.
On February 6, 2009, we announced that we were suspending construction on our 989,000 square foot office project at 250 West 55th Street in New York City. During December 2009, we completed the construction of foundations and steel/deck to grade to facilitate a restart of construction in the future and as a result ceased interest capitalization on the project. During the year ended December 31, 2011, we recognized approximately $0.8 million of additional costs associated with the suspension and ongoing maintenance of the development project. On May 24, 2011, we signed a lease with the law firm of Morrison & Foerster LLP for approximately 184,000 square feet at 250 West 55th Street and resumed construction of the project. As a result of our decision to resume development, in May 2011 we began interest capitalization and are no longer expensing costs associated with this project.
On July 1, 2011, we entered into lease amendments with the existing tenant at our three-building complex on Sunrise Valley Drive in Reston, Virginia, which will be redeveloped as the headquarters for the Defense Intelligence Agency. Under the agreements, the existing tenant terminated early its leases for approximately 523,000 square feet at the complex and was responsible for certain payments to us aggregating approximately $15.7 million. We recognized approximately $13.1 million of such termination income during 2011 of which approximately $2.6 million is included within the Placed In-Service Portfolio. We recognized the remaining approximately $2.6 million during the year ended December 31, 2012. On January 3, 2012, we commenced the redevelopment of our Two Patriots Park property at the complex, which is expected to be completed during the second quarter of 2013. During the year ended December 31, 2011, this building had revenue, excluding the $10.5 million of termination income, of approximately $10.2 million and operating expenses of approximately $1.7 million. During the year ended December 31, 2012, excluding termination income, this building had de minimis revenue and operating expenses. In addition, the decrease in depreciation of approximately $16.7 million is the result of the acceleration of depreciation expense during the year ended December 31, 2011 in conjunction with the redevelopment of this building.
Other Operating Income and Expense Items
Hotel Net Operating Income
Net operating income for the Cambridge Center Marriott hotel property increased by approximately $1.4 million for the year ended December 31, 2012 compared to 2011 due primarily to improvements in revenue per available room (“REVPAR”) and occupancy. We expect our hotel net operating income for fiscal 2013 to be between $10 million and $11 million.
The following reflects our occupancy and rate information for the Cambridge Center Marriott hotel for the year ended December 31, 2012 and 2011.
| 2012 | 2011 | Percentage Change | ||||||||||
Occupancy | 78.8 | % | 78.2 | % | 0.8 | % | ||||||
Average daily rate | $ | 226.58 | $ | 210.45 | 7.7 | % | ||||||
REVPAR | $ | 178.66 | $ | 164.15 | 8.8 | % | ||||||
Development and Management Services
Development and management services income increased approximately $0.7 million for the year ended December 31, 2012 compared to 2011. The increase was primarily due to an increase in development fee income of approximately $2.5 million partially offset by a decrease in management fee income of approximately $1.8 million. The increase in development fees is primarily due to an increase in fees associated with tenant improvement project management. The decrease in management fees is due to a decrease in leasing fees and management fees earned from our joint venture and third-party managed properties, as a result of decreases in leasing activity and third-party properties that we managed. We expect fee income for fiscal 2013 to be between $26 million and $30 million.
General and Administrative
General and administrative expenses increased approximately $2.8 million for the year ended December 31, 2012 compared to 2011. We recognized approximately $4.5 million of expense during the first quarter of 2012 in connection with the resignation or E. Mitchell Norville, our Chief Operating Officer, on February 29, 2012. This increase was partially offset by the acceleration of the remaining unrecognized compensation expense totaling approximately $4.3 million associated with the termination of the 2008 OPP Awards during the first quarter of 2011, which did not recur in 2012. The remaining increase was primarily due to (1) an approximately $3.0 million increase related to the issuance of the 2012 OPP Awards and non-qualified stock options and (2) an approximately $1.5 million increase in the value of our deferred compensation plan, partially offset by an approximately $1.9 million decrease in other general and administrative expenses, which includes a decrease in compensation expense. Refer to Note 17 of the Consolidated Financial Statements for additional information regarding Mr. Norville’s resignation and the issuance of the 2012 OPP Awards and non-qualified stock options.
Wages directly related to the development of rental properties are not included in our operating results. These costs are capitalized and included in real estate assets on our Consolidated Balance Sheets and amortized over the useful lives of the real estate. Capitalized wages for the year ended December 31, 2012 and 2011 were approximately $12.7 million and $11.0 million, respectively. These costs are not included in the general and administrative expenses discussed above.
Transaction Costs
During the year ended December 31, 2012 we incurred approximately $3.7 million of transaction costs of which approximately $0.6 million related to the acquisition of 680 Folsom Street in San Francisco, California, approximately $0.5 million related to the acquisition of Fountain Square in Reston, Virginia, approximately $0.3 million related to the forming of a joint venture to pursue the acquisition of land in San Francisco, California to construct the Transbay Tower, approximately $0.6 million related to the acquisition of 100 Federal Street in Boston, Massachusetts and approximately $1.7 million related to the pursuit of other transactions. During the year ended December 31, 2011, we incurred approximately $2.0 million of transaction pursuit costs.
Other Income and Expense Items
Income from Unconsolidated Joint Ventures
For the year ended December 31, 2012 compared to 2011, income from unconsolidated joint ventures decreased by approximately $36.8 million. This decrease was primarily due to the sale of Two Grand Central Tower during the year ended December 31, 2011, in which we recognized a gain of approximately $46.2 million, partially offset by an increase of approximately $2.0 million in our share of the net income from 767 Fifth Avenue (The GM Building) and an increase of approximately $7.4 million in our share of net income from our other unconsolidated joint ventures. The increase at 767 Fifth Avenue (The GM Building) was primarily due to a lease termination agreement with an existing tenant and lower amortization expense of approximately $6.7 million due to expiring leases. Under that agreement, the tenant terminated early its lease for approximately 36,000 square feet at the building and is responsible for certain payments aggregating approximately $28.4 million through May 1, 2014 (of which our share is approximately $17.0 million). As a result of the termination, we recognized termination income totaling approximately $11.8 million (which is net of the write-off of the accrued straight-line rent balance) during the year ended December 31, 2012. This increase was partially offset by a decrease in “above-” and “below-market” lease income of approximately $13.8 million and accrued straight—line rent of approximately $2.7 million at 767 Fifth Avenue (The GM Building). Refer to Note 5 of the Consolidated Financial Statements for additional details regarding the operating results of our unconsolidated joint ventures.
On October 25, 2011, an unconsolidated joint venture in which we have a 60% interest completed the sale of Two Grand Central Tower located in New York City for approximately $401.0 million, including the assumption by the buyer of approximately $176.6 million of mortgage indebtedness. Net cash proceeds totaled approximately $210.0 million, of which our share was approximately $126.0 million, after the payment of transaction costs of approximately $14.4 million. Two Grand Central Tower is an approximately 650,000 net rentable square foot Class A office tower. The unconsolidated joint venture’s carrying value of the net assets of the property aggregated approximately $427.1 million. As a result, pursuant to the provisions of Accounting Standards Codification (“ASC”) 360 “Property, Plant and Equipment” (“ASC 360”) (formerly known as SFAS No. 144 “Accounting for the Impairment or Disposal of Long Lived Assets”), the unconsolidated joint venture recognized a non-cash impairment loss and loss on sale of real estate aggregating approximately $40.5 million during the year ended December 31, 2011, which is equal to the difference between (1) the sale price less cost to sell and (2) the carrying value of the net assets of the property. Separately, in 2008 we had recognized an impairment loss on our investment in the unconsolidated joint venture totaling approximately $74.3 million under the provisions of ASC 323 “Investments-Equity Method and Joint Ventures” (“ASC 323”) (formerly known as Accounting Principles Board Opinion No. 18 “The Equity Method of Accounting for Investments in Common Stock” (“APB No. 18”)). As a result, we recognized a gain on sale of real estate totaling approximately $46.2 million, which is included within income from unconsolidated joint ventures on our Consolidated Statements of Operations.
For fiscal 2013 we expect a decrease in income from unconsolidated joint ventures of $18 million to $23 million (our share) compared to fiscal 2012 due to $15 million to $17 million of termination income and rental income from a retail tenant at 767 Fifth Avenue (The GM Building) in New York City where we project no income during 2013 and a $5 million to $7 million (our share) decline in revenues from 540 Madison Avenue due to lease expirations. These decreases will be partially offset by the completion of 500 North Capitol Street in Washington, DC, which should contribute approximately $2 million (our share).
Interest and Other Income
Interest and other income increased approximately $4.7 million for the year ended December 31, 2012 compared to 2011. Interest income for the year ended December 31, 2012 compared to 2011 increased approximately $1.3 million due primarily to the approximately $0.9 million of interest income that we recognized related to the loans that we made to our Value-Added Fund and an increase in the average cash
balance that was partially offset by overall lower interest rates. The loans to the Value-Added Fund have been reflected in Related Party Note Receivable on our Consolidated Financial Statements. The average daily cash balances for the year ended December 31, 2012 and December 31, 2011 were approximately $1.2 billion and $1.1 billion, respectively.
Other income for the year ended December 31, 2012 compared to 2011 increased by approximately $3.4 million of which (1) approximately $2.9 million related to the sale of historic tax credits at our Lofts at Atlantic Wharf, (2) approximately $1.1 million was related to an insurance claim that we received during 2012 and (3) approximately $0.2 million related to a sales deposit we retained due to a prospective buyer of 164 Lexington Road canceling the contract, partially offset by the approximately $0.8 million recognized during 2011 related to 280 Park Avenue (as detailed below). On October 20, 2010, we closed a transaction with a financial institution (the “HTC Investor”) related to the historic rehabilitation of the residential component of our Atlantic Wharf development in Boston, Massachusetts (the “residential project”). The HTC Investor has contributed an aggregate of approximately $15 million to the project. As part of its contribution, the HTC Investor will receive substantially all of the benefits derived from the tax credits. Beginning in July 2012 to July 2016, we recognized and will recognize the cash received as revenue over the five-year tax credit recapture period as defined in the Internal Revenue Code. During the year ended December 31, 2012, we recognized approximately $2.9 million of the $15 million that the HTC Investor had contributed to us.
On June 6, 2006, we sold 280 Park Avenue in New York City. In connection with the sale, in lieu of a closing adjustment in favor of the buyer for certain unfunded tenant improvements, we retained the obligation to pay for the improvements, subject to the tenant initiating the request for reimbursement. The total amount of unfunded tenant improvements at closing was approximately $1.0 million and has yet to be requested by the tenants. During the year ended December 31, 2011, a tenant’s lease expired for which we had unfunded tenant improvement liabilities of approximately $0.8 million, resulting in the recognition of other income in that amount.
Gains (Losses) from Investments in Securities
Gains (losses) from investments in securities for the year ended December 31, 2012 and 2011 related to investments that we have made to reduce our market risk relating to a deferred compensation plan that we maintain for our officers. Under this deferred compensation plan, each officer who is eligible to participate is permitted to defer a portion of the officer’s current income on a pre-tax basis and receive a tax-deferred return on these deferrals based on the performance of specific investments selected by the officer. In order to reduce our market risk relating to this plan, we typically acquire, in a separate account that is not restricted as to its use, similar or identical investments as those selected by each officer. This enables us to generally match our liabilities to our officers under the deferred compensation plan with equivalent assets and thereby limit our market risk. The performance of these investments is recorded as gains (losses) from investments in securities. During the year ended December 31, 2012 and 2011, we recognized gains (losses) of approximately $1.4 million and $(0.4) million, respectively, on these investments. By comparison, our general and administrative expense increased (decreased) by approximately $1.3 million and $(0.3) million during the year ended December 31, 2012 and 2011, respectively, as a result of increases (decreases) in our liability under our deferred compensation plan that were associated with the performance of the specific investments selected by our officers participating in the plan.
Losses from Early Extinguishments of Debt
Losses from early extinguishments of debt increased by approximately $3.0 million for the year ended December 31, 2012 compared to 2011. This increase is related to the following transactions that occurred during the years ended December 31, 2012 and 2011.
On September 4, 2012, we used available cash to repay the mortgage loan collateralized by our Sumner Square property located in Washington, DC totaling approximately $23.2 million. The mortgage financing bore
interest at a fixed rate of 7.35% per annum and was scheduled to mature on September 1, 2013. We recognized a loss on early extinguishment of debt totaling approximately $0.3 million, which included a prepayment penalty totaling approximately $0.2 million associated with the early repayment.
On August 24, 2012, our Operating Partnership used available cash to redeem the remaining $225.0 million in aggregate principal amount of its 6.25% senior notes due 2013. The redemption price was determined in accordance with the applicable indenture and totaled approximately $231.6 million. The redemption price included approximately $1.5 million of accrued and unpaid interest to, but not including, the redemption date. Excluding such accrued and unpaid interest, the redemption price was approximately 102.25% of the principal amount being redeemed. We recognized a loss on early extinguishment of debt totaling approximately $5.2 million, which amount included the payment of the redemption premium totaling approximately $5.1 million.
On April 2, 2012, we used available cash to repay the mortgage loan collateralized by our One Freedom Square property located in Reston, Virginia totaling $65.1 million. The mortgage financing bore interest at a fixed rate of 7.75% per annum and was scheduled to mature on June 30, 2012. There was no prepayment penalty. We recognized a gain on early extinguishment of debt totaling approximately $0.3 million related to the acceleration of the remaining balance of the historical fair value debt adjustment, which was the result of purchase accounting.
On March 12, 2012, we used available cash to repay the mortgage loan collateralized by our Bay Colony Corporate Center property located in Waltham, Massachusetts totaling $143.9 million. The mortgage financing bore interest at a fixed rate of 6.53% per annum and was scheduled to mature on June 11, 2012. There was no prepayment penalty. We recognized a gain on early extinguishment of debt totaling approximately $0.9 million related to the acceleration of the remaining balance of the historical fair value debt adjustment, which was the result of purchase accounting.
In connection with the repurchase and redemption in February 2012 of our Operating Partnership’s 2.875% Exchangeable Senior Notes due 2037, we recognized a loss on early extinguishment of debt of approximately $0.1 million related to the expensing of transaction related costs.
On November 9, 2011, our Operating Partnership repurchased $50.0 million aggregate principal amount of its 2.875% exchangeable senior notes due 2037 for approximately $50.2 million. The repurchased notes had an aggregate carrying value of approximately $49.6 million at the time of repurchase resulting in the recognition of a loss on early extinguishment of debt of approximately $0.6 million.
On November 9, 2011, we used available cash to repay the mortgage loan collateralized by our Reservoir Place property located in Waltham, Massachusetts totaling $50.0 million. The mortgage financing bore interest at a variable rate equal to Eurodollar plus 2.20% per annum and was scheduled to mature on July 30, 2014. There was no prepayment penalty. We recognized a loss from early extinguishment of debt totaling approximately $0.5 million consisting of the write-off of unamortized deferred financing costs.
On November 16, 2011, we terminated the construction loan facility collateralized by our Atlantic Wharf property, located in Boston, Massachusetts, totaling $192.5 million. The construction loan facility bore interest at a variable rate equal to LIBOR plus 3.00% per annum and was scheduled to mature on April 21, 2012 with two, one-year extension options, subject to certain conditions. We did not draw any amounts under the facility. We recognized a loss from early extinguishment of debt totaling approximately $0.4 million consisting of the write-off of unamortized deferred financing costs.
Interest Expense
Interest expense for the Total Property Portfolio increased approximately $19.4 million for the year ended December 31, 2012 compared to 2011 as detailed below:
Component | Change in interest expense for the year ended December 31, 2012 compared to December 31, 2011 | |||
| (in thousands) | ||||
Increases to interest expense due to: | ||||
Issuance by our Operating Partnership of $850 million in aggregate principal of 3.700% senior notes due 2018 on November 10, 2011 | $ | 27,213 | ||
New mortgages/properties placed in-service/acquisition financings | 23,490 | |||
Issuance by our Operating Partnership of $1.0 billion in aggregate principal of 3.850% senior notes due 2023 on June 11, 2012 | 21,501 | |||
Decrease in capitalized interest due to properties being placed in-service | 3,890 | |||
Other interest expense (excluding senior notes) partially offset by principal amortization of continuing debt | 849 | |||
|
| |||
Total increases to interest expense | $ | 76,943 | ||
|
| |||
Decreases to interest expense due to: | ||||
Repayment of mortgage financings | $ | (22,468 | ) | |
Repurchases/redemption of $576.2 million in aggregate principal of 2.875% exchangeable senior notes due 2037 | (17,912 | ) | ||
Interest expense associated with the adjustment for the equity component allocation of our unsecured exchangeable debt | (9,734 | ) | ||
Redemption of $225.0 million in aggregate principal of 6.25% unsecured senior notes due 2013 | (6,136 | ) | ||
Interest on our Operating Partnership’s Unsecured Line of Credit | (1,260 | ) | ||
|
| |||
Total decreases to interest expense | $ | (57,510 | ) | |
|
| |||
Total change in interest expense | $ | 19,433 | ||
|
| |||
The following properties are included in the new mortgages/properties placed in-service/acquisition financings line item: 601 Lexington Avenue and Fountain Square. The following properties are included in the repayment of mortgage financings line item: 601 Lexington Avenue, Reservoir Place, Atlantic Wharf, 510 Madison Avenue, Bay Colony Corporate Center, One Freedom Square and Sumner Square. Included within the interest on our Operating Partnership’s Unsecured Line of Credit line item is the interest expense associated with our borrowing that had been secured by 601 Lexington Avenue. As properties are placed in-service, we cease capitalizing interest and interest is then expensed.
Interest expense directly related to the development of rental properties is not included in our operating results. These costs are capitalized and included in real estate assets on our Consolidated Balance Sheets and amortized over the useful lives of the real estate. Interest capitalized for the year ended December 31, 2012 and 2011 was approximately $44.3 million and $48.2 million, respectively. These costs are not included in the interest expense referenced above.
We anticipate net interest expense for 2013 will be $385 million to $392 million. This estimate assumes $58 million to $65 million of capitalized interest. We project that debts maturing in 2013 will be refinanced for their maturing principal amount at current long-term interest rates. This estimate assumes that we will not incur any additional indebtedness, make additional prepayments or repurchase of existing indebtedness, and that there will not be any fluctuations in interest rates or any changes in our development activity.
At December 31, 2012, our variable rate debt consisted of our Operating Partnership’s $750.0 million Unsecured Line of Credit, of which no amount was outstanding at December 31, 2012. For a summary of our consolidated debt as of December 31, 2012 and December 31, 2011 refer to the heading “Liquidity and Capital Resources—Capitalization—Debt Financing” within “Item 7—Management’s Discussion and Analysis of Financial Condition and Results of Operations.”
Discontinued Operations
On May 17, 2012, we completed the sale of our Bedford Business Park properties located in Bedford, Massachusetts for approximately $62.8 million in cash. Net cash proceeds totaled approximately $62.0 million, resulting in a gain on sale of approximately $36.9 million. Bedford Business Park is comprised of two Office/Technical buildings and one Class A office building aggregating approximately 470,000 net rentable square feet. The operating results of the property through the date of sale have been classified as discontinued operations on a historical basis for all periods presented. Refer to Note 3 of the Consolidated Financial Statements for additional details regarding the sale and operating results.
Noncontrolling interests in property partnerships
Noncontrolling interests in property partnerships increased by approximately $2.2 million for the year ended December 31, 2012 compared to 2011. Noncontrolling interests in property partnerships consisted of the outside owner’s equity interest in the income from our 505 9th Street and Fountain Square properties as of December 31, 2012 and only 505 9th Street as of December 31, 2011.
On October 4, 2012, we completed the formation of a joint venture which owns and operates Fountain Square located in Reston, Virginia, adjacent to our other Reston properties. Fountain Square is an office and retail complex aggregating approximately 758,000 net rentable square feet, comprised of approximately 521,000 net rentable square feet of Class A office space and approximately 237,000 net rentable square feet of retail space. The joint venture partner contributed the property valued at approximately $385.0 million and related mortgage indebtedness totaling approximately $211.3 million for a 50% interest in the joint venture. We contributed cash totaling approximately $87.0 million for our 50% interest, which cash was distributed to the joint venture partner. We are consolidating this joint venture. The mortgage loan bears interest at a fixed rate of 5.71% per annum and matures on October 11, 2016. Pursuant to the joint venture agreement (i) we have rights to acquire the partner’s 50% interest and (ii) the partner has the right to cause us to acquire the partner’s interest on January 4, 2016, in each case at a fixed price totaling approximately $102.0 million in cash. The fixed price option rights expire on January 31, 2016.
Noncontrolling Interest—Common Units of the Operating Partnership
Noncontrolling interest—common units of the Operating Partnership decreased by approximately $5.0 million for the year ended December 31, 2012 compared to 2011 due to a decrease in allocable income and a decrease in the noncontrolling interest’s ownership percentage.
Comparison of the year ended December 31, 2011 to the year ended December 31, 2010
The table below shows selected operating information for the Same Property Portfolio and the Total Property Portfolio. The Same Property Portfolio consists of 125 properties totaling approximately 30.0 million net rentable square feet of space, excluding unconsolidated joint ventures. The Same Property Portfolio includes properties acquired or placed in-service on or prior to January 1, 2010 and owned and in service through December 31, 2011. The Total Property Portfolio includes the effects of the other properties either placed in-service, acquired or in development or redevelopment after January 1, 2010 or disposed of on or prior to December 31, 2011. This table includes a reconciliation from the Same Property Portfolio to the Total Property Portfolio by also providing information for the year ended December 31, 2011 and 2010 with respect to the properties which were placed in-service, acquired or in development or redevelopment.
(dollars in thousands) Rental Revenue: Rental Revenue Termination Income Total Rental Revenue Real Estate Operating Expenses Net Operating Income, excluding hotel Hotel Net Operating Income (1) Consolidated Net Operating Income(1) Other Revenue: Development and management services Other Expenses: General and administrative expense Transaction costs Suspension of development Depreciation and amortization Total Other Expenses Operating Income Other Income: Income from unconsolidated joint ventures Interest and other income Gains (losses) from investments in securities Other Expenses: Interest expense Losses from early extinguishments of debt Income from continuing operations Gains on sales of real estate Income before discontinued operations Discontinued operations: Income from discontinued operations Net income Net income attributable to noncontrolling interests: Noncontrolling interests in property partnerships Noncontrolling interest—redeemable preferred units of the Operating Partnership Noncontrolling interest—common units of the Operating Partnership Noncontrolling interest in gains on sales of real estate—common units of the Operating Partnership Noncontrolling interest in discontinued operations—common units of the Operating Partnership Net Income attributable to Boston Properties, Inc. Same Property Portfolio Properties
Acquired
Portfolio Properties
Placed
In-Service
Portfolio Properties
in Development
or
Redevelopment
Portfolio Total Property Portfolio 2011 2010 Increase/
(Decrease) %
Change 2011 2010 2011 2010 2011 2010 2011 2010 Increase/
(Decrease) %
Change $ 1,446,184 $ 1,438,198 $ 7,986 0.56 % $ 128,885 $ 857 $ 85,893 $ 10,046 $ 5,540 $ 11,029 $ 1,666,502 $ 1,460,130 $ 206,372 14.13 % 14,293 9,165 5,128 55.95 % (20 ) — — — 2,591 — 16,864 9,165 7,699 84.00 % 1,460,477 1,447,363 13,114 0.91 % 128,865 857 85,893 10,046 8,131 11,029 1,683,366 1,469,295 214,071 14.57 % 497,060 492,288 4,772 0.97 % 57,857 358 33,358 1,145 1,949 4,363 590,224 498,154 92,070 18.48 % 963,417 955,075 8,342 0.87 % 71,008 499 52,535 8,901 6,182 6,666 1,093,142 971,141 122,001 12.56 % 8,401 7,647 754 9.86 % — — — — — — 8,401 7,647 754 9.86 % 971,818 962,722 9,096 0.94 % 71,008 499 52,535 8,901 6,182 6,666 1,101,543 978,788 122,755 12.54 % — — — — — — — — — — 33,425 41,215 (7,790 ) (18.90 )% — — — — — — — — — — 79,610 79,396 214 0.27 % — — — — — — — — — — 1,987 2,876 (889 ) (30.91 )% — — — — — — — — — — — (7,200 ) 7,200 100.00 % 332,371 323,684 8,687 2.68 % 62,182 394 22,900 2,038 19,159 9,743 436,612 335,859 100,753 30.00 % 332,371 323,684 8,687 2.68 % 62,182 394 22,900 2,038 19,159 9,743 518,209 410,931 107,278 26.11 % 639,447 639,038 409 0.06 % 8,826 105 29,635 6,863 (12,977 ) (3,077 ) 616,759 609,072 7,687 1.26 % 85,896 36,774 49,122 133.58 % 5,358 7,332 (1,974 ) (26.92 )% (443 ) 935 (1,378 ) (147.38 )% 394,131 378,079 16,052 4.25 % 1,494 89,883 (88,389 ) (98.34 )% 311,945 186,151 125,794 67.58 % — 2,734 (2,734 ) (100.00 )% 311,945 188,885 123,060 65.15 % 1,881 1,442 439 30.44 % 313,826 190,327 123,499 64.89 % (1,558 ) (3,464 ) 1,906 55.02 % (3,339 ) (3,343 ) 4 0.12 % (36,035 ) (23,915 ) (12,120 ) (50.68 )% — (349 ) 349 (100.00 )% (215 ) (184 ) (31 ) (16.85 )% $ 272,679 $ 159,072 $ 113,607 71.42 %
| (1) | For a detailed discussion of NOI, including the reasons management believes NOI is useful to investors, see page 57. Hotel Net Operating Income for the years ended December 31, 2011 and 2010 are comprised of Hotel Revenue of $34,529 and $32,800 less Hotel Expenses of $26,128 and $25,153, respectively, per the Consolidated Statements of Operations. |
Same Property Portfolio
Rental Revenue
Rental revenue from the Same Property Portfolio increased approximately $8.0 million for the year ended December 31, 2011 compared to 2010. The increase was primarily the result of an increase of approximately $0.7 million in rental revenue from our leases, coupled with increases in parking and other revenue and other recoveries of approximately $3.6 million and $3.7 million, respectively. The increase in rental revenue from our leases of approximately $0.7 million is the result of our average revenue increasing by approximately $0.43 per square foot, contributing approximately $11.7 million, offset by an approximately $11.0 million decrease due to a decline in occupancy from 92.7% to 91.8%.
Termination Income
Termination income increased by approximately $5.1 million for the year ended December 31, 2011 compared to 2010.
Termination income for the year ended December 31, 2011 related to sixteen tenants across the Same Property Portfolio and totaled approximately $14.3 million, which included approximately $1.8 million of termination income related to a default by a 30,000 square foot law firm tenant in one of our New York City properties and approximately $10.5 million related to us entering into lease amendments we signed on July 1, 2011 with the existing tenant at our three-building complex in Reston, Virginia, which will be redeveloped as the headquarters for the Defense Intelligence Agency. Under the agreements, the existing tenant will terminate early its leases for approximately 523,000 square feet at the complex and be responsible for certain payments to us aggregating approximately $15.7 million. One of the buildings had already been taken out of service and therefore the operating results of that property, including any termination income received, is shown under the Properties in Development or Redevelopment Portfolio. We recognized the remaining approximately $2.6 million in the first quarter of 2012. Once Two Patriots Park (formerly known as 12300 Sunrise Valley Drive) is placed in redevelopment, it will no longer be considered part of the Same Property Portfolio and any operating results will be shown under the Properties in Development or Redevelopment Portfolio.
Termination income for the year ended December 31, 2010 related to twenty-three tenants across the Same Property Portfolio and totaled approximately $9.2 million, which included (1) approximately $1.6 million from a small retail tenant in New York City, (2) approximately $4.1 million of negotiated termination income from our Reston, Virginia properties in order to accommodate growth of an existing tenant and to provide space early to a new tenant, (3) approximately $1.3 million from a tenant at 599 Lexington Avenue in New York City to accommodate growth of an existing tenant and (4) approximately $2.2 million spread across nineteen tenant terminations.
Termination income for the year ended December 31, 2009 related to sixteen tenants across the Same Property Portfolio and totaled approximately $14.4 million, which included (1) approximately $7.5 million of termination income related to a termination agreement with a tenant at 601 Lexington Avenue and (2) approximately $3.6 million was non-cash income consisting of the estimated value of furniture and fixtures that two tenants transferred to us in connection with the terminations of their leases.
Real Estate Operating Expenses
Real estate operatingOperating expenses from the Same Property Portfolio decreasedincreased approximately $6.1$4.8 million, or 1%, for the year ended December 31, 20102011 compared to 2009. Included2010 due to a net increase in Same Property Portfolio real estategeneral property operating expenses is a decrease in property general and administrative expenses of approximately $3.5 million, of which approximately $1.3 million is related to the write-off in 2009 of a leasing commission associated with a tenant that did not take occupancy that did not recur in 2010. In addition, we had overall savings in repairs and maintenance and other property-related expenses of approximately $2.2 million and $1.4 million, respectively. The savings in operating expenses were partially offset by an increase of approximately $1.0 million in insurance expense.expenses.
Depreciation and Amortization Expense
Depreciation and amortization expense for the Same Property Portfolio increased approximately $9.3$8.7 million for the year ended December 31, 20102011 compared to 2009.2010. The increase consisted of (1) an approximately
$11.7 million increase in the Washington, DC region that was primarily due to acceleratedthe result of the acceleration of depreciation associated withexpense during the futureyear ended December 31, 2011 totaling approximately $13.7 million in anticipation of the planned redevelopment of two of our buildings, (2) an increaseTwo Patriots Park (formerly known as 12300 Sunrise Valley Drive) property located in Reston, Virginia, partially offset by a decrease in depreciation of approximately $3.9$3.7 million at a building outside San Francisco, California that had a significant lease expiration and therefore no longer has depreciation and amortization related to that tenant and a decrease in depreciation of
approximately $1.8 million resulting from the acceleration of depreciation expense in 2010 related to our decision in 2010 to reclassify three in-service properties to land held for future development that did not recur in the Boston region, a portion of which was related to the amortization of tenant improvements costs2011. These three properties totaled approximately 131,000 square feet, are currently planned for redevelopment and (3) an aggregate increase in the other regions of approximately $1.1 million. These increases were partially offset by an approximately $7.4 million decrease due to accelerated depreciation related to a lease termination in New York City that occurred during the second quarter of 2009.are no longer held available for lease.
Properties Acquired Portfolio
On December 29, 2010, we completed the acquisition of the John Hancock Tower and Garage in Boston, Massachusetts for an aggregate purchase price of approximately $930.0 million. The John Hancock Tower is a 62-story, approximately 1,700,000 rentable square foot office tower located in the heart of Boston’s Back Bay neighborhood. The garage is an eight-level, 2,013 space parking facility. Refer to Note 3 of the Consolidated Financial Statements.
ForOn February 1, 2011, we completed the acquisition of Bay Colony Corporate Center in Waltham, Massachusetts for an aggregate purchase price of approximately $185.0 million. Bay Colony Corporate Center is an approximately 985,000 net rentable square foot, four-building Class A office park situated on a 58-acre site in Waltham, Massachusetts.
On November 22, 2011, we acquired 2440 West El Camino Real located in Mountain View, California for a net purchase price of approximately $71.1 million. 2440 West El Camino Real is an approximately 140,000 net rentable square foot Class A office property.
Rental Revenue
Rental revenue from our Properties Acquired Portfolio increased approximately $128.0 million for the year ended December 31, 2011 compared to 2010, as detailed below:
| Property | Date Acquired | Rental Revenue for the year ended December 31, | ||||||||||||
| 2011 | 2010 | Change | ||||||||||||
| (in thousands) | ||||||||||||||
John Hancock Tower and Garage | December 29, 2010 | $ | 109,002 | $ | 857 | $ | 108,145 | |||||||
Bay Colony Corporate Center | February 1, 2011 | 19,047 | — | 19,047 | ||||||||||
2440 West El Camino Real | November 22, 2011 | 816 | — | 816 | ||||||||||
|
|
|
|
|
| |||||||||
Total | $ | 128,865 | $ | 857 | $ | 128,008 | ||||||||
|
|
|
|
|
| |||||||||
Real Estate Operating Expenses
Real estate operating expenses from our Properties Acquired Portfolio increased approximately $57.5 million for the year ended December 31, 2011 compared to 2010, as detailed below:
| Property | Date Acquired | Real Estate Operating Expenses for the year ended December 31, | ||||||||||||
| 2011 | 2010 | Change | ||||||||||||
| (in thousands) | ||||||||||||||
John Hancock Tower and Garage | December 29, 2010 | $ | 45,544 | $ | 358 | $ | 45,186 | |||||||
Bay Colony Corporate Center | February 1, 2011 | 12,008 | — | 12,008 | ||||||||||
2440 West El Camino Real | November 22, 2011 | 305 | — | 305 | ||||||||||
|
|
|
|
|
| |||||||||
Total | $ | 57,857 | $ | 358 | $ | 57,499 | ||||||||
|
|
|
|
|
| |||||||||
Depreciation and Amortization Expense
Depreciation and amortization expense for our Properties Acquired Portfolio increased by approximately $61.8 million for the year ended December 31, 2011 compared to 2010 as a result of the depreciation expense
associated with our properties that were acquired after December 31, 2010, as well as the additional depreciation expense incurred for the year ended December 31, 2011 associated with John Hancock Tower and Garage increased our revenue, real estate operating expensesthat was acquired on December 29, 2010 and, as a result, was not recognizing depreciation by approximately $0.9 million, $0.4 million and $0.4 million, respectively.expense for the full year ended December 31, 2010.
Properties Placed In-Service Portfolio
At December 31, 2010, weWe had fivesix properties totaling approximately 1.22.4 million square feet that were placed in-service or partially place in-service between January 1, 20092010 and December 31, 2010.2011.
Rental Revenue
Rental revenue from our Properties Placed In-Service Portfolio increased approximately $31.4$76.0 million, as detailed below:
Property | Quarter Placed In-Service | Rental Revenue for the year ended December 31, | ||||||||||||
| 2010 | 2009 | Change | ||||||||||||
| (in thousands) | ||||||||||||||
One Preserve Parkway | Second Quarter, 2009 | $ | 5,309 | $ | 1,516 | $ | 3,793 | |||||||
Wisconsin Place Office | Second Quarter, 2009 | 14,318 | 7,753 | 6,565 | ||||||||||
Democracy Tower | Third Quarter, 2009 | 12,224 | 4,738 | 7,486 | ||||||||||
701 Carnegie Center | Fourth Quarter, 2009 | 4,529 | 1,051 | 3,478 | ||||||||||
Weston Corporate Center | Second Quarter, 2010 | 10,046 | — | 10,046 | ||||||||||
Total | $ | 46,426 | $ | 15,058 | $ | 31,368 | ||||||||
Property | Quarter Initially Placed In-Service | Quarter Fully Placed In-Service | Rental Revenue for the year ended December 31, | |||||||||||||
| 2011 | 2010 | Change | ||||||||||||||
| (in thousands) | ||||||||||||||||
Weston Corporate Center | Second Quarter, 2010 | Second Quarter, 2010 | $ | 17,575 | $ | 10,046 | $ | 7,529 | ||||||||
510 Madison Avenue | Second Quarter, 2011 | N/A | 7,270 | — | 7,270 | |||||||||||
2200 Pennsylvania Avenue | First Quarter, 2011 | Third Quarter, 2011 | 17,656 | — | 17,656 | |||||||||||
Residences on The Avenue—Residential | Second Quarter, 2011 | Third Quarter, 2011 | 5,632 | — | 5,632 | |||||||||||
The Lofts at Atlantic Wharf—Residential | Third Quarter, 2011 | Third Quarter, 2011 | 985 | — | 985 | |||||||||||
Atlantic Wharf—Office | First Quarter, 2011 | Fourth Quarter, 2011 | 36,775 | — | 36,775 | |||||||||||
|
|
|
|
|
| |||||||||||
Total | $ | 85,893 | $ | 10,046 | $ | 75,847 | ||||||||||
|
|
|
|
|
| |||||||||||
Real Estate Operating Expenses
Real estate operating expenses from our Properties Placed In-Service Portfolio increased approximately $5.7$32.2 million, as detailed below:
Property | Quarter Placed In-Service | Real Estate Operating Expenses for the year ended December 31, | ||||||||||||
| 2010 | 2009 | Change | ||||||||||||
| (in thousands) | ||||||||||||||
One Preserve Parkway | Second Quarter, 2009 | $ | 1,519 | $ | 1,257 | $ | 262 | |||||||
Wisconsin Place Office | Second Quarter, 2009 | 3,453 | 1,777 | 1,676 | ||||||||||
Democracy Tower | Third Quarter, 2009 | 2,224 | 751 | 1,473 | ||||||||||
701 Carnegie Center | Fourth Quarter, 2009 | 1,397 | 294 | 1,103 | ||||||||||
Weston Corporate Center | Second Quarter, 2010 | 1,145 | — | 1,145 | ||||||||||
Total | $ | 9,738 | $ | 4,079 | $ | 5,659 | ||||||||
Property | Quarter Initially Placed In-Service | Quarter Fully Placed In-Service | Real Estate Operating Expenses for the year ended December 31, | |||||||||||||
| 2011 | 2010 | Change | ||||||||||||||
| (in thousands) | ||||||||||||||||
Weston Corporate Center | Second Quarter, 2010 | Second Quarter, 2010 | $ | 2,754 | $ | 1,145 | $ | 1,609 | ||||||||
510 Madison Avenue | Second Quarter, 2011 | N/A | 2,995 | — | 2,995 | |||||||||||
2200 Pennsylvania Avenue | First Quarter, 2011 | Third Quarter, 2011 | 11,326 | — | 11,326 | |||||||||||
Residences on The Avenue—Residential | Second Quarter, 2011 | Third Quarter, 2011 | 4,958 | — | 4,958 | |||||||||||
The Lofts at Atlantic Wharf—Residential | Third Quarter, 2011 | Third Quarter, 2011 | 521 | — | 521 | |||||||||||
Atlantic Wharf—Office | First Quarter, 2011 | Fourth Quarter, 2011 | 10,804 | — | 10,804 | |||||||||||
|
|
|
|
|
| |||||||||||
Total | $ | 33,358 | $ | 1,145 | $ | 32,213 | ||||||||||
|
|
|
|
|
| |||||||||||
Depreciation and Amortization Expense
Depreciation and amortization expense for our Properties Placed In-Service Portfolio increased by approximately $7.0$20.9 million for the year ended December 31, 20102011 compared to 2009.2010 as a result of the depreciation expense associated with our properties that were placed in-service or partially placed in-service after December 31, 2010 as well as the additional depreciation expense incurred for the year ended December 31, 2011 associated with Weston Corporate Center that was placed in-service in the second quarter of 2010 and, as a result, was not recognizing depreciation expense for the full year ended December 31, 2010.
Properties in Development or Redevelopment Portfolio
At December 31, 2011 and 2010, the Properties in Development or Redevelopment Portfolio consisted primarily of our One Patriots Park (formerly known as 12310 Sunrise Valley Drive) property located in Reston, Virginia and our 250 West 55th Street development project located in New York City.
On February 6, 2009, we announced that we were suspending construction on our 989,000 square foot office project at 250 West 55th Street in New York City. During December 2009, we completed the construction of foundations and steel/deck to grade to facilitate a restart of construction in the future and as a result ceased interest capitalization on the project. During the year ended December 31, 2011 and 2010, we recognized approximately $0.8 million and $2.3 million, respectively, of additional costs associated with the suspension and ongoing maintenance of the development project. On May 24, 2011, we signed a lease with the law firm of Morrison & Foerster LLP for approximately 184,000 square feet at 250 West 55th Street and resumed construction of the project. As a result of our decision to resume development, in May 2011 we began interest capitalization and are no longer expensing costs associated with this project.
On July 1, 2011, we entered into lease amendments with the existing tenant at our three-building complex in Reston, Virginia, which will be redeveloped as the headquarters for the Defense Intelligence Agency. Under the agreements, the tenant will terminate early its leases for approximately 523,000 square feet at the complex and be responsible for certain payments to us aggregating approximately $15.7 million, of which we recognized approximately $2.6 million related to our One Patriots Park (formerly known as 12310 Sunrise Valley Drive) property, which is the building that had been taken out of service. Although this building had been taken out of service, the remainder of the termination income that we received from the building that is still in-service is reflected under the Same Store Portfolio. On July 5, 2011, we commenced the redevelopment of the One Patriots Park property at the complex, which was completed during the second quarter of 2012. During the year ended December 31, 2011 and 2010, this building had revenue, excluding termination income, of approximately $5.5 million and $11.0 million, respectively, and operating expenses for the year ended December 31, 2011 and 2010 of approximately $1.0 million and $2.0 million, respectively. In addition, the increase in depreciation is the result of the acceleration of depreciation expense during the year ended December 31, 2011 totaling approximately $9.4 million in anticipation of the redevelopment of this building.
Other Operating Income and Expense Items
Hotel Net Operating Income
Net operating income for our hotel property increased approximately $1.2$0.8 million, a 19%10% increase for the year ended December 31, 20102011 as compared to 2009. We expect our hotel net operating income for fiscal 2011 to be between $8.0 million and $8.5 million.2010.
The following reflects our occupancy and rate information for our Cambridge Center Marriott hotel property for the year ended December 31, 20102011 and 2009:2010:
| 2010 | 2009 | Percentage Change | 2011 | 2010 | Percentage Change | |||||||||||||||||||
Occupancy | 77.9 | % | 75.1 | % | 3.7 | % | 78.2 | % | 77.9 | % | 0.4 | % | ||||||||||||
Average daily rate | $ | 197.29 | $ | 185.29 | 6.5 | % | $ | 210.45 | $ | 197.29 | 6.7 | % | ||||||||||||
Revenue per available room, REVPAR | $ | 153.65 | $ | 139.19 | 10.4 | % | $ | 164.15 | $ | 153.65 | 6.8 | % | ||||||||||||
Development and Management Services
Development and management services income increaseddecreased approximately $6.4$7.8 million for the year ended December 31, 20102011 compared to 2009. Management fees increased2010. The decrease was primarily due to a decrease in management fee income of approximately $12.1 million partially offset by an approximately $12.4$4.3 million for the year ended December 31, 2010 compared to 2009.increase in development income. On May 5, 2010, we satisfied the requirements of our master lease agreement related to the 2006 sale of 280 Park Avenue in New York City. Following the satisfaction of the master lease agreement, the buyer terminated the property management and leasing agreement entered into at the time of the sale, resulting in the recognition of non-cash deferred management fees totaling approximately $12.2 million. Development fees decreased by approximately $6.0 million forduring the year ended December 31, 2010 compared2010. The increase in development fees is due to 2009 due primarilyan increase in development fees related to the75 Ames Street in Cambridge, Massachusetts and George Washington University Science and Engineering Hall in Washington, DC, offset by a decrease in development fees as a result of our completion of ourthe 20 F Street third-party development project in the first quarter of 2010. We expect third-party fee income for fiscal 2011 to be between $20 million and $25 million.project.
General and Administrative Expense
General and administrative expenses increased approximately $4.2$0.2 million for the year ended December 31, 20102011 compared to 2009. The increase was2010 primarily due to (1)an increase in other general and administrative expenses and professional fees of approximately $4.0$1.7 million and $0.7 million, respectively. These increases were partially offset by a decrease in compensation expense of approximately $2.2 million. The decrease in compensation expense is primarily due to the accelerated
expense during the first quarter of 2010 of the remaining stock-based compensation granted between 2006 and 2009 to Edward H. Linde, our late Chief Executive Officer, as a result of his passing on January 10, 2010 (2) an increase oftotaling approximately $1.3$5.8 million of other payroll related expense and (3) an approximately $0.6$1.0 million increase in other non-compensatory general and administrative expenses. These increases were partially offset by a decrease of approximately $1.7 million in the value of our deferred compensation plan. We expect general and administrative expense for fiscal 2011 to be between $80 million and $83 million, which includes an approximately $4.3 million charge related to the conclusion of the three-year measurement period on February 5, 2011 for the 2008 Outperformance Plan Awards (the “2008 OPP Awards”). The 2008 OPP Awards were not earned, and therefore the program was terminated, which resulted inplan, offset by the acceleration of the remaining unrecognized compensation expense totaling approximately $4.3 million associated with the termination of the 2008 OPP Awards during the first quarter of 2011. Refer to Notes 15, 17 and 20 of the Consolidated Financial Statements.
On January 20, 2011, the Compensation Committee of our Board of Directors approved outperformance awards under our 1997 Plan to certain officers. These awards (the “2011 OPP Awards”) are part of a broad-based, long-term incentive compensation program designed to provide our management team with the potential to earn equity awards subject to our “outperforming” and creating shareholder value in a pay-for-performance structure. 2011 OPP Awards utilize total return to shareholders (“TRS”) over a three-year measurement period as the performance metric and include two years of time-based vesting after the end of the performance measurement period (subject to acceleration in certain events) as a retention tool. Recipients of 2011 OPP Awards will share in an outperformance pool if our TRS, including both share appreciation and dividends, exceeds absolute and relative hurdles over a three-year measurement period from February 1, 2011 to January 31, 2014, based on the average closing price of a share of our common stock of $93.38 for the five trading days prior to and including February 1, 2011. The aggregate reward that recipients of all 2011 OPP Awards can earn, as measured by the outperformance pool, is subject to a maximum cap of $40.0 million. We expect that in accordance with ASC 718 “Compensation—Stock Compensation” the 2011 OPP Awards will have an aggregate value of approximately $7.8 million, which amount will be amortized into earnings over the five-year plan period under the graded vesting method. We expect to expense approximately $2.1 million in fiscal 2011 associated with the amortization related to the 2011 OPP Awards. Refer to Note 20 of the Consolidated Financial Statements.
Wages directly related to the development of rental properties are not included in our operating results. These costs are capitalized and included in real estate assets on our Consolidated Balance Sheets and amortized over the useful lives of the real estate. Capitalized wages for the year ended December 31, 20102011 and 20092010 were approximately $11.6$11.0 million and $11.3$11.6 million, respectively. These costs are not included in the general and administrative expense discussed above.
AcquisitionTransaction Costs
Effective January 1, 2009,During the year ended December 31, 2011, we are required to expense costs that an acquirer incurs to effect a business combination such as legal, due diligence and other closing relatedincurred approximately $2.0 million of transaction pursuit costs. During the year ended December 31, 2010, we incurred approximately $1.5 million and $0.9 million of acquisition costs associated with our acquisitions of 510 Madison Avenue in New York City and the John Hancock Tower &and Garage in Boston, respectively. In addition for the year ended December 31, 2010, we incurred approximately $0.2 million of acquisition costs associated with our acquisition of Bay Colony Corporate Center in Waltham, Massachusetts.Massachusetts and approximately $0.3 million of other transaction pursuit costs.
Loss (Gain) from Suspension of Development
On February 6, 2009, we announced that we were suspending construction on our 1,000,000 square foot project at 250 West 55th Street in New York City. During December 2009, we completed the construction of foundations and steel/deck to grade to facilitate a restart of construction in the future and as a result ceased interest capitalization on the project. During the year ended December 31, 2009, we recognized a loss of approximately $27.8 million related to the suspension of development, which amount included a $20.0 million contractual amount due pursuant to a lease agreement. On January 19, 2010, we paid $12.8 million related to the termination of such lease. As a result, we recognized approximately $7.2 million of other income during the year ended December 31, 2010.
Other Income and Expense Items
Income from Unconsolidated Joint Ventures
For the year ended December 31, 20102011 compared to 2009,2010, income from unconsolidated joint ventures increased by approximately $24.7$49.1 million.
During This increase was primarily due to the year ended December 31, 2009 we incurred non-cash impairment losses onfollowing (1) our share of Two Grand Central Tower’s net income increased by approximately $40.2 million, which was primarily due to the Value-Added Fund,sale of the property, (2) our share of 767 Fifth Avenue’s (The GM Building) net income increased by approximately $6.0 million, which were not present during the year ended December 31, 2010,was primarily due to a decrease in deprecation expense related to tenant expirations and therefore(3) our share of the Value-Added Fund’s net income increased by approximately $14.9$0.9 million due to a decrease in interest expense as a result of the conveyance of fee simple title to its One and Two Circle Star Way properties on October 21, 2010.
On October 25, 2011, an unconsolidated joint venture in which we have a 60% interest completed the sale of Two Grand Central Tower located in New York City for approximately $401.0 million, including the assumption by the buyer of approximately $176.6 million of mortgage indebtedness. Net cash proceeds totaled approximately $210.0 million, of which our share was approximately $126.0 million, after the payment of transaction costs of approximately $14.4 million. In June 2009Two Grand Central Tower is an approximately 650,000 net rentable square foot Class A office tower. The unconsolidated joint venture’s carrying value of the net assets of the property aggregated approximately $427.1 million. As a result, pursuant to the provisions of Accounting Standards Codification (“ASC”) 360 “Property, Plant and December 2009, weEquipment” (“ASC 360”) (formerly known as SFAS No. 144 “Accounting for the Impairment or Disposal of Long Lived Assets”), the unconsolidated joint venture recognized a non-cash impairment chargesloss and loss on our investment insale of real estate aggregating approximately $40.5 million during the Value-Added Fund of approximately $7.4 millionyear ended December 31, 2011, which is equal to the difference between (1) the sale price less cost to sell and $2.0 million, respectively. These charges represented the other-than-temporary decline in the fair values below(2) the carrying value of the net assets of the property. Separately, in 2008 we had recognized an impairment loss on our investment in the unconsolidated joint venture. In accordance with guidance inventure totaling approximately $74.3 million under the provisions of ASC 323 “Investments—Equity“Investments-Equity Method and Joint Ventures” (“ASC 323”) (formerly known as Accounting Principles Board Opinion No. 18 “The Equity Method of Accounting for Investments in Common Stock” (APB(“APB No. 18)18”)). As a lossresult, we recognized a gain on sale of an investment under the equity method of accounting,real estate totaling approximately $46.2 million, which is other than a temporary decline, must be recognized. If the fair value of our investments deteriorate further, we could recognize additional impairment charges that may be material to our results of operations. In addition, during December 2009, our Value-Added Fund recognized a non-cash impairment charge in accordance with the guidance in ASC 360 (formerly known as SFAS No. 144) related to our One and Two Circle Star Way properties in San Carlos, California totaling approximately $24.6 million, of which our share was approximately $4.2 million, which amount reflects the reduction in our basis of approximately $2.0 millionincluded within income from previous impairment losses. The Value-Added Fund was in discussions with the lender to modify the loan and as a result believed that the carrying value of the properties was not recoverable. Accordingly, the Value-Added Fund recognized the non-cash impairment charge to reduce the net book value of the properties to their estimated fair market value at December 31, 2009. On October 21, 2010, our Value-Added Fund conveyed the fee simple title to its One and Two Circle Star Way properties and paid $3.8 million to the lender in satisfaction of its outstanding obligations under the existing mortgage loan and guarantee.
In addition, (1) our share of the General Motors Building’s net income increased by approximately $6.7 million, which was primarily due to a decrease in depreciation expense related to two major tenant lease expirations, and (2) our share of the 125 West 55th Street’s net income increased by approximately $2.9 million, which was primarily due to a decrease in interest expense associated with the refinancing of the property’s mortgage loan. The remaining increase of approximately $0.2 million related to the other unconsolidated joint venture properties.ventures on our Consolidated Statements of Operations.
Interest and Other Income
Interest and other income increaseddecreased approximately $3.3$2.0 million for the year ended December 31, 20102011 compared to 20092010.
Interest income decreased approximately $2.8 million for the year ended December 31, 2011 compared to 2010 as athe result of increaseda decrease in the average cash balances offset by the net effect ofbalance and lower overall interest rates. The average cash balances for the yearsyear ended December 31, 20102011 and December 31, 20092010 were approximately $1.5$1.1 billion and $0.6$1.5 billion, respectively.
On June 6, 2006, we sold 280 Park Avenue in New York City. In connection with the sale, in lieu of a closing adjustment in favor of the buyer for certain unfunded tenant improvements, we retained the obligation to pay for the improvements, subject to the tenant initiating the request for reimbursement. The total amount of unfunded tenant improvements at closing was approximately $1.0 million and has yet to be requested by the tenants. During the year ended December 31, 2011, a tenant’s lease expired for which we had unfunded tenant improvement liabilities of approximately $0.8 million, resulting in the recognition of other income in that amount.
Gains (Losses) from Investments in Securities
We account for investments in trading securities at fair value, with gains or losses resulting from changes in fair value recognized currently in earnings. The designation of trading securities is generally determined at acquisition. During the year ended December 31, 2009, investment in securities was comprised of an investment in an unregistered money market fund and investments in an account associated with our deferred compensation plan. In December 2007, the unregistered money market fund suspended cash redemptions by investors; investors could elect in-kind redemptions of the underlying securities or maintain their investment in the fund and receive distributions as the underlying securities matured or were liquidated by the fund sponsor. As a result, we retained this investment for a longer term than originally intended, and the valuation of our investment was subject to changes in market conditions. Because interests in this fund were previously valued at less than their
$1.00 par value, we recognized gains of approximately $0.2 million on our investment during the year ended December 31, 2009. As of December 31, 2009, we no longer had investments in this unregistered money market fund.
The remainder of the gainsGains (losses) from investments in securities for the years ended December 31, 20102011 and 20092010 related to investments that we have made to reduce our market risk relating to a deferred compensation plan that we
maintain for our officers. Under this deferred compensation plan, each officer who is eligible to participate is permitted to defer a portion of the officer’s current income on a pre-tax basis and receive a tax-deferred return on these deferrals based on the performance of specific investments selected by the officer. In order to reduce our market risk relating to this plan, we typically acquire, in a separate account that is not restricted as to its use, similar or identical investments as those selected by each officer. This enables us to generally match our liabilities to our officers under the deferred compensation plan with equivalent assets and thereby limit our market risk. The performance of these investments is recorded as gains or losses from investments in securities. During the years ended December 31, 20102011 and 20092010 we recognized gains (losses) of approximately $0.9$(0.4) million and $2.2$0.9 million, respectively, on these investments. By comparison, our general and administrative expense increased (decreased) by approximately $0.8$(0.3) million and $2.4$0.8 million during the years ended December 31, 20102011 and 2009,2010, respectively, as a result of increases (decreases) in our liability under our deferred compensation plan that were associated with the performance of the specific investments selected by our officers participating in the plan.
Interest Expense
Interest expense for the Total Property Portfolio increased approximately $55.2$16.1 million for the year ended December 31, 20102011 compared to 20092010 as detailed below:
Component | Change in interest expense for the year ended December 31, 2010 and December 31, 2009 | Change in interest expense for the year ended December 31, 2011 compared to December 31, 2010 | ||||||
| (in thousands) | (in thousands) | |||||||
Increases to interest expense due to: | ||||||||
Issuance by our Operating Partnership of $700 million in aggregate principal of 5.875% senior notes due 2019 on October 9, 2009 | $ | 31,786 | ||||||
Issuance by our Operating Partnership of $700 million in aggregate principal of 5.625% senior notes due 2020 on April 19, 2010 | 27,702 | $ | 11,697 | |||||
Issuance by our Operating Partnership of $850 million in aggregate principal of 4.125% senior notes due 2021 on November 18, 2010 | 4,345 | 31,210 | ||||||
Decrease in capitalized interest costs | 7,835 | |||||||
New mortgage / properties placed in-service financings | 1,983 | |||||||
Issuance by our Operating Partnership of $850 million in aggregate principal of 3.700% senior notes due 2018 on November 10, 2011 | 4,491 | |||||||
New mortgage/properties placed in-service/acquisition financings | 54,199 | |||||||
Interest on our Operating Partnership’s Unsecured Line of Credit | 1,844 | |||||||
Interest associated with the increased interest rate related to Montvale Center being in default | 1,055 | |||||||
| ||||||||
Total increases to interest expense | $ | 73,651 | $ | 104,496 | ||||
| ||||||||
Decreases to interest expense due to: | ||||||||
Repurchases by our Operating Partnership of $700 million in aggregate principal of 6.25% senior notes due 2013 | $ | (41,797 | ) | |||||
Repurchases by our Operating Partnership of $286.3 million in aggregate principal of 2.875% exchangeable senior notes | (2,734 | ) | ||||||
Repayment of mortgage financings | $ | (8,562 | ) | (33,998 | ) | |||
Repurchases by our Operating Partnership of $236.3 million in aggregate principal of 2.875% exchangeable senior notes | (5,507 | ) | ||||||
Repurchases by our Operating Partnership of $700 million in aggregate principal of 6.25% senior notes due 2013 | (2,190 | ) | ||||||
Increase in capitalized interest costs | (7,197 | ) | ||||||
Principal amortization of continuing debt and other (excluding senior notes) | (2,146 | ) | (2,718 | ) | ||||
| ||||||||
Total decreases to interest expense | $ | (18,405 | ) | $ | (88,444 | ) | ||
| ||||||||
Total change in interest expense | $ | 55,246 | $ | 16,052 | ||||
| ||||||||
The following properties are included in the repayment of mortgage financings line item: Reservoir Place, Eight Cambridge Center, Ten Cambridge Center, 1301 New York Avenue, 202, 206 & 214 Carnegie Center, South of Market, Democracy Tower, 10 and 20 Burlington Mall Road, 91 Hartwell Avenue, and 1330 Connecticut Avenue.Avenue, Wisconsin Place Office, 601 Lexington Avenue and Reservoir Place. The
following properties are included in the new mortgages/properties placed in-service in-service/acquisition
financings line item: Reservoir Place, DemocracyJohn Hancock Tower, Wisconsin Place Office,Bay Colony Corporate Center, 510 Madison Avenue, Atlantic Wharf and John Hancock Tower.601 Lexington Avenue. As properties are placed in-service, we cease capitalizing interest and interest is then expensed. Included within the interest on our Operating Partnership’s Unsecured Line of Credit line item is the interest expense associated with our borrowing that had been secured by 601 Lexington Avenue. For information on the Montvale Center mortgage loan see Notes 3, 6 and 19 of the Consolidated Financial Statements.
Interest expense directly related to the development of rental properties is not included in our operating results. These costs are capitalized and included in real estate assets on our Consolidated Balance Sheets and amortized over the useful lives of the real estate. Interest capitalized for the year ended December 31, 2011 and 2010 and 2009 werewas approximately $41.0$48.2 million and $48.8$41.0 million, respectively. These costs are not included in the interest expense referenced above.
We are evaluating refinancing alternatives on our $457 million mortgage loan on 601 Lexington Avenue and we believe we could raise approximately $700 million to $750 million through a new secured mortgage loan. Assuming such a refinancing, we anticipate our interest expense to be between approximately $410 million to $420 million for fiscal 2011. This amount reflects the impact of approximately $30 million to $35 million of capitalized interest. The actual amount of our net interest expense for fiscal 2011 will be impacted by, among other things, any additional indebtedness we incur, any pre-payments or repurchases of existing indebtedness, fluctuations in interest rates and any changes in our development activity.
At December 31, 2010,2011, our variable rate debt consisted of our construction loan at Atlantic Wharf, ourOperating Partnership’s Unsecured Line of Credit, our secured financing at Reservoir Place and our cash secured financing at 510 Madison Avenue. For a summary of our consolidated debt as of December 31, 2010 and December 31, 2009 refer to the heading “Liquidity and Capital Resources—Capitalization—Debt Financing” within “Item 7—Management’s Discussion and Analysis of Financial Condition and Results of Operations.”Credit.
Losses from Early Extinguishments of Debt
On November 9, 2011, our Operating Partnership repurchased $50.0 million aggregate principal amount of its 2.875% exchangeable senior notes due 2037 for approximately $50.2 million. The repurchased notes had an aggregate carrying value of approximately $49.6 million at the time of repurchase resulting in the recognition of a loss on early extinguishment of debt of approximately $0.6 million.
On November 9, 2011, we used available cash to repay the mortgage loan collateralized by our Reservoir Place property, located in Waltham, Massachusetts, totaling $50.0 million. The mortgage financing bore interest at a variable rate equal to Eurodollar plus 2.20% per annum and was scheduled to mature on July 30, 2014. There was no prepayment penalty. We recognized a loss from early extinguishment of debt totaling approximately $0.5 million consisting of the write-off of unamortized deferred financing costs.
On November 16, 2011, we terminated the construction loan facility collateralized by our Atlantic Wharf property, located in Boston, Massachusetts, totaling $192.5 million. The construction loan facility bore interest at a variable rate equal to LIBOR plus 3.00% per annum and was scheduled to mature on April 21, 2012 with two, one-year extension options, subject to certain conditions. We did not draw any amounts under the facility. We recognized a loss from early extinguishment of debt totaling approximately $0.4 million consisting of the write-off of unamortized deferred financing costs.
On December 12, 2010, our Operating Partnership completed the redemption of $700.0 million in aggregate principal amount of its 6.25% senior notes due 2013. The redemption price was determined in accordance with the applicable indenture and was approximately $793.1 million. The redemption price included approximately $17.9 million of accrued and unpaid interest to, but not including, the redemption date. Excluding such accrued and unpaid interest, the redemption price was approximately 110.75% of the principal amount being redeemed. In addition, on November 29, 2010, we entered into two treasury lock agreements to fix the yield on the U.S. Treasury issue used in determining the redemption price on notional amounts aggregating $700.0 million. On December 9, 2010, we cash-settled the treasury lock agreements and paid approximately $2.1 million. As a result of the payment of the redemption premium, the settlement of the treasury locks and the write-off of deferred financing costs, we recognized an aggregate loss on early extinguishment of debt of approximately $79.3 million. Following the partial redemption, there is an aggregate of $225.0 million of these notes outstanding.
During the year ended December 31, 2010, our Operating Partnership repurchased approximately $236.3 million aggregate principal amount of its 2.875% exchangeable senior notes due 2037 which the holders may require our Operating Partnership to repurchase in February 2012, for approximately $236.6 million. The repurchased notes had an aggregate allocated liability and equity value of approximately $225.7 million and $0.4 million, respectively, at the time of repurchase resulting in the recognition of a loss on early extinguishment of debt of approximately $10.5 million during the year ended December 31, 2010. There remains an aggregate of approximately $626.2 million of these notes outstanding.
During the year ended December 31, 2010, we used available cash to repay approximately $501.2 million of outstanding mortgage loans. Associated with the repayments, we paid a prepayment penalty totaling approximately $0.3 million, wrote off approximately $0.2 million of unamortized deferred financing costs and recognized a gain of approximately $0.4 million related to the write off of a remaining historical fair value balance.
During the year ended December 31, 2009, we used available cash to repay approximately $98.4 million of outstanding mortgage loans. Associated with the repayments, we paid a prepayment penalty totaling
approximately $0.5 million, wrote off approximately $42,000 of unamortized deferred financing costs and recognized a gain of approximately $32,000 related to the write off of a remaining historical fair value balance.
Gains on Sales of Real Estate
On April 14, 2008, we sold a parcel of land located in Washington, DC for approximately $33.7 million. We had previously entered into a development management agreement with the buyer to develop a Class A office property on the parcel totaling approximately 165,000 net rentable square feet. Due to our involvement in the construction of the project, the gain on sale was deferred and has been recognized over the project construction period generally based on the percentage of total project costs incurred to estimated total project costs. As a result, we recognized a gain on sale during the year ended December 31, 2009 of approximately $11.8 million. During the year ended December 31, 2010, we completed construction of the project and recognized the remaining gain on sale totaling approximately $1.8 million. We have recognized a cumulative gain on sale of approximately $23.4 million.
Pursuant to the purchase and sale agreement related to the 2006 sale of 280 Park Avenue, we entered into a master lease agreement with the buyer at closing. Under the master lease agreement, we guaranteed that the buyer will receive at least a minimum amount of base rent from approximately 74,340 square feet of space during the ten-year period following the expiration of the leases for this space. The leases for this space expired at various times between June 2006 and October 2007. The aggregate amount of base rent we guaranteed over the entire period from 2006 to 2017 was approximately $67.3 million. On May 5, 2010, we satisfied the requirements of our master lease agreement, resulting in the recognition of the remaining deferred gain on sale of real estate totaling approximately $1.0 million.
Noncontrolling Interests in Property Partnerships
Noncontrolling interests in property partnerships increaseddecreased by approximately $0.7$1.9 million for the year ended December 31, 20102011 compared to 2009. Noncontrolling2010.
For the year ended December 31, 2011, noncontrolling interests in property partnerships consisted of the outside owner’s equity interest in the income from our 505 9th Street property.
For the year ended December 31, 2010, noncontrolling interests in property partnerships consist of the outside equity owners’ interests in the income from our 505 9th Street and our Wisconsin Place Office properties.
On December 23, 2010, we acquired the outside member’s 33.3% equity interest in our consolidated joint venture entity that owns the Wisconsin Place Office property located in Chevy Chase, Maryland for cash of approximately $25.5 million. The acquisition was accounted for as an equity transaction in accordance with ASC 810. The difference between the purchase price and the carrying value of the outside member’s equity interest, totaling approximately $19.1 million, reduced additional paid-in capital in our Consolidated Balance Sheets.
Noncontrolling Interest—Common Units of the Operating Partnership
Noncontrolling interest—common units of the Operating Partnership decreased by approximately $11.4 million for the year ended December 31, 2010 compared to 2009 primarily due to a decrease in allocable income.
Comparison of the year ended December 31, 2009 to the year ended December 31, 2008
The table below shows selected operating information for the Same Property Portfolio and the Total Property Portfolio. The Same Property Portfolio consists of 126 properties, including properties acquired or placed in-service on or prior to January 1, 2008 and owned through December 31, 2009, totaling approximately 30.1 million net rentable square feet of space (excluding square feet of structured parking). The Total Property Portfolio includes the effects of the other properties either placed in-service, acquired or repositioned after January 1, 2008 or disposed of on or prior to December 31, 2009. This table includes a reconciliation from the Same Property Portfolio to the Total Property Portfolio by also providing information for the year ended December 31, 2009 and 2008 with respect to the properties which were acquired, placed in-service, repositioned or sold.
(dollars in thousands) Rental Revenue: Rental Revenue Termination Income Total Rental Revenue Real Estate Operating Expenses Net Operating Income, excluding hotel Hotel Net Operating Income(1) Consolidated Net Operating Income(1) Other Revenue: Development and management services Other Expenses: General and administrative expense Loss from suspension of development Depreciation and amortization Total Other Expenses Operating Income Other Income: Income (loss) from unconsolidated joint ventures Interest and other Gains (losses) from investments in securities Other Expenses: Interest expense Losses from early extinguishments of debt Net derivative loss Income from continuing operations Gains on sales of real estate Net income Net income attributable to noncontrolling interests: Noncontrolling interests in property partnerships Noncontrolling interest–redeemable preferred units of the Operating Partnership Noncontrolling interest—common units of the Operating Partnership Noncontrolling interest in gains on sales of real estate—common units of the Operating Partnership Net Income attributable to Boston Properties, Inc. Same Property Portfolio Properties
Sold
Portfolio Properties
Acquired
Portfolio Properties
Placed
In-Service
Portfolio Properties
Repositioned Total Property Portfolio 2009 2008 Increase/
(Decrease) %
Change 2009 2008 2009 2008 2009 2008 2009 2008 2009 2008 Increase/
(Decrease) %
Change $ 1,358,000 $ 1,344,408 $ 13,592 1.01 % $ — $ 90 $ 7,244 $ 1,828 $ 73,273 $ 43,283 $ — $ — $ 1,438,517 $ 1,389,609 $ 48,908 3.52 % 14,410 12,443 1,967 15.81 % — — — — — — — — 14,410 12,443 1,967 15.81 % 1,372,410 1,356,851 15,559 1.15 % — 90 7,244 1,828 73,273 43,283 — — 1,452,927 1,402,052 50,875 3.63 % 479,983 477,172 2,811 0.59 % — 46 1,274 274 20,542 10,538 — — 501,799 488,030 13,769 2.82 % 892,427 879,679 12,748 1.45 % — 44 5,970 1,554 52,731 32,745 — — 951,128 914,022 37,106 4.06 % 6,419 9,362 (2,943 ) (31.44 )% — — — — — — — — 6,419 9,362 (2,943 ) (31.44 )% 898,846 889,041 9,805 1.10 % — 44 5,970 1,554 52,731 32,745 — — 957,547 923,384 34,163 3.70 % — — — — — — — — — — — — 34,878 30,518 4,360 14.29 % — — — — — — — — — — — — 75,447 72,365 3,082 4.26 % — — — — — — — — — — — — 27,766 — 27,766 100.00 % 299,175 293,604 5,571 1.90 % — — 4,813 1,375 17,693 9,168 — — 321,681 304,147 17,534 5.76 % 299,175 293,604 5,571 1.90 % — — 4,813 1,375 17,693 9,168 — — 424,894 376,512 48,382 12.85 % 599,671 595,437 4,234 7.11 % — 44 1,157 179 35,038 23,577 — — 567,531 577,390 (9,859 ) (1.71 )% — — — — — — — — — — — — 12,058 (182,018 ) 194,076 106.62 % — — — — — — — — — — — — 4,059 18,958 (14,899 ) (78.59 )% — — — — — — — — — — — — 2,434 (4,604 ) 7,038 152.87 % — — — — — — — — — — — — 322,833 295,322 27,511 9.32 % — — — — — — — — — — — — 510 — 510 100.00 % — 17,021 (17,021 ) (100.00 )% 262,739 97,383 165,356 169.80 % 11,760 33,340 (21,580 ) (64.73 )% 274,499 130,723 143,776 109.99 % (2,778 ) (1,997 ) (781 ) (39.11 )% (3,594 ) (4,226 ) 632 14.96 % (35,534 ) (14,392 ) (21,142 ) (146.90 )% (1,579 ) (4,838 ) 3,259 67.36 % $ 231,014 $ 105,270 $ 125,744 119.45 %
Same Property Portfolio
Rental Revenue
Rental revenue from the Same Property Portfolio increased approximately $13.6 million for the year ended December 31, 2009 compared to 2008. Included in the Same Property Portfolio rental revenue is an overall increase in contractual rental revenue of approximately $2.0 million and an increase of approximately $24.3 million in straight-line rents. The increase in straight-line rent is primarily the result of us establishing in the third quarter of 2008 a $21.0 million reserve, which was reflected as a direct reduction of straight-line rent, for the full amount of the accrued straight-line rent balances associated with our leases in New York City with Lehman Brothers, Inc. and the law firm of Heller Ehrman LLP. The increases in contractual rental revenue and straight-line rent were offset by an approximately $10.4 million decrease in recoveries from tenants in 2009. Generally, under each of our leases, we are entitled to recover from the tenant increases in specific operating expenses associated with the leased property above the amount incurred for these operating expenses in the first year of the lease. The decrease in recoveries from tenants is primarily due to the terminations by tenants in New York City, which resulted in lesser tenant recoveries due to decreased occupancy and, to the extent space was re-leased, leases are in their first year during which, generally, no tenant recoveries are earned. We also had an approximately $2.3 million decrease in parking and other income.
Termination Income
We recognized termination income totaling approximately $14.4 million for the year ended December 31, 2009, which was related to sixteen tenants across the Same Property Portfolio that terminated their leases. Approximately $7.5 million of termination income for 2009 related to a termination agreement with a tenant at 601 Lexington Avenue. Approximately $3.6 million is non-cash income consisting of the estimated value of furniture and fixtures that two tenants transferred to us in connection with the terminations of their leases. Termination income totaling approximately $12.4 million for the year ended December 31, 2008 was related to multiple tenants across the Same Property Portfolio that terminated their leases, including $7.5 million of termination income related to a termination agreement with Heller Ehrman LLP.
Real Estate Operating Expenses
Real estate operating expenses from the Same Property Portfolio increased approximately $2.8 million for the year ended December 31, 2009 compared to 2008. Included in Same Property Portfolio real estate operating expenses is an increase in real estate taxes of approximately $18.0 million, or 9%, which was predominately due to an increase in real estate taxes in the central business districts in Boston and New York City. This was offset by overall decreases in utilities expense of approximately $7.9 million, or 9%, and other property-related expenses of approximately $7.3 million of which approximately $3.0 million relates to repairs and maintenance.
Depreciation and Amortization
Depreciation and amortization expense for the Same Property Portfolio increased by approximately $5.6 million for the year ended December 31, 2009 compared to 2008. This increase was predominately due to accelerated amortization related to tenant terminations in New York City.
Properties Sold Portfolio
Revenue and real estate operating expenses from the Properties Sold Portfolio decreased by approximately $0.1 million and $46,000, respectively due to the transfer of Mountain View Research Park and Mountain View Technology Park to the Value-Added Fund on January 7, 2008. These properties have not been classified as discontinued operations due to our continuing involvement as the property manager for the properties and our continued ownership interest through the Value-Added Fund.
Properties Acquired Portfolio
The acquisition of 635 Massachusetts Avenue on September 26, 2008 increased rental revenue, real estate operating expenses, and depreciation by approximately $5.4 million, $1.0 million and $3.4 million, respectively for the year ended December 31, 2009 compared to the year ended December 31, 2008.
Properties Placed In-Service Portfolio
At December 31, 2009, we had seven properties totaling approximately 2.0 million square feet that were placed in-service between January 1, 2008 and December 31, 2009.
Rental revenue from our Properties Placed In-Service Portfolio increased approximately $30.0 million, as detailed below:
Property | Quarter Placed In-Service | Rental Revenue for the year ended December 31, | ||||||||||||
| 2009 | 2008 | Change | ||||||||||||
| (in thousands) | ||||||||||||||
505 9th Street | First Quarter, 2008 | $ | 21,974 | $ | 20,090 | $ | 1,884 | |||||||
South of Market | Fourth Quarter, 2008 | 27,280 | 20,010 | 7,270 | ||||||||||
77 CityPoint | Fourth Quarter, 2008 | 8,961 | 2,098 | 6,863 | ||||||||||
One Preserve Parkway | Second Quarter, 2009 | 1,516 | 1,085 | 431 | ||||||||||
Wisconsin Place Office | Second Quarter, 2009 | 7,753 | — | 7,753 | ||||||||||
Democracy Tower | Third Quarter, 2009 | 4,738 | — | 4,738 | ||||||||||
701 Carnegie Center | Fourth Quarter, 2009 | 1,051 | — | 1,051 | ||||||||||
Total | $ | 73,273 | $ | 43,283 | $ | 29,990 | ||||||||
Real Estate Operating Expenses
Real estate operating expenses from our Properties Placed In-Service Portfolio increased approximately $10.0 million, as detailed below:
Property | Quarter Placed In-Service | Real Estate Operating Expenses for the year ended December 31, | ||||||||||||
| 2009 | 2008 | Change | ||||||||||||
| (in thousands) | ||||||||||||||
505 9th Street | First Quarter, 2008 | $ | 6,929 | $ | 5,672 | $ | 1,257 | |||||||
South of Market | Fourth Quarter, 2008 | 7,057 | 3,466 | 3,591 | ||||||||||
77 CityPoint | Fourth Quarter, 2008 | 2,477 | 883 | 1,594 | ||||||||||
One Preserve Parkway | Second Quarter, 2009 | 1,257 | 517 | 740 | ||||||||||
Wisconsin Place Office | Second Quarter, 2009 | 1,777 | — | 1,777 | ||||||||||
Democracy Tower | Third Quarter, 2009 | 751 | — | 751 | ||||||||||
701 Carnegie Center | Fourth Quarter, 2009 | 294 | — | 294 | ||||||||||
Total | $ | 20,542 | $ | 10,538 | $ | 10,004 | ||||||||
Depreciation and Amortization
Depreciation and amortization expense for our Properties Placed In-Service Portfolio increased by approximately $8.5 million for the year ended December 31, 2009 compared to 2008.
Other Operating Income and Expense Items
Hotel Net Operating Income
Net operating income for our hotel property decreased approximately $2.9 million, a 31.4% decrease for the year ended December 31, 2009 as compared to 2008.
The following reflects our occupancy and rate information for our Cambridge Center Marriott hotel property for the year ended December 31, 2009 and 2008:
| 2009 | 2008 | Percentage Change | ||||||||||
Occupancy | 75.1 | % | 77.7 | % | (3.3 | )% | ||||||
Average daily rate | $ | 185.29 | $ | 217.70 | (14.9 | )% | ||||||
Revenue per available room, REVPAR | $ | 139.19 | $ | 169.08 | (17.7 | )% | ||||||
Development and Management Services
Development and management services income increased approximately $4.4 million for the year ended December 31, 2009 compared to 2008. Development fees increased by approximately $4.6 million for the year ended December 31, 2009 compared to 2008 due primarily to development fees of approximately $6.1 million for our 20 F Street and 1111 North Capitol Street third-party development projects. This increase was offset by a decrease in other development fees of approximately $1.5 million, of which approximately $0.5 million is related to the completion and placing in-service of our Annapolis Junction joint venture development project. Management fees decreased by approximately $0.2 million for the year ended December 31, 2009 compared to 2008 due to the net effect of an approximately $1.0 million increase in management fee income offset by a decrease of approximately $1.2 million in service income of which approximately $1.0 million is attributable to a decrease in work orders and overtime usage of HVAC in New York City.
General and Administrative Expense
General and administrative expenses increased approximately $3.1 million for the year ended December 31, 2009 compared to 2008. The increase was the net result of an approximately $8.5 million increase in payroll expense, offset by a decrease in professional fees and other general and administrative expenses of approximately $1.8 million and $1.3 million, respectively, and a decrease of approximately $2.3 million related to abandoned projects in 2008. Approximately $5.6 million of the payroll expenses increase was related to an increase in the value of our deferred compensation plan and approximately $3.1 million was related to the amortization associated with restricted stock equity awards.
On January 24, 2008, our compensation committee approved outperformance awards under the 1997 Plan to our officers and employees. These 2008 OPP Awards were part of a broad-based long-term incentive compensation program designed to provide our management team at several levels within the organization with the potential to earn equity awards subject to “outperforming” and creating shareholder value in a pay-for-performance structure. 2008 OPP Awards utilized TRS over a three-year measurement period as the performance metric and include two years of time-based vesting after the end of the performance measurement period (subject to acceleration in certain events) as a retention tool. Recipients of 2008 OPP Awards were eligible to share in an outperformance pool if our TRS, including both share appreciation and dividends, exceeds absolute and relative hurdles over a three-year measurement period from February 5, 2008 to February 5, 2011, based on the average closing price of a share of our common stock of $92.8240 for the five trading days prior to and including February 5, 2008. The aggregate reward that recipients of all 2008 OPP Awards could earn, as measured by the outperformance pool, was subject to a maximum cap of $110 million, although only OPP awards for an aggregate of up to approximately $104.8 million were granted. Under guidance included in ASC 718 “Compensation—Stock Compensation” (formerly known as Statement of Financial Accounting Standards No. 123(R) “Share-Based Payment”) the 2008 OPP Awards had an aggregate value of approximately $19.7 million, which was generally being amortized into earnings over the five-year plan period (although awards for retirement-eligible employees will be amortized over a three-year period). Because the 2008 OPP Units required us to outperform absolute and relative return thresholds, unless such thresholds were met by the end of the applicable reporting period, we excluded the 2008 OPP Units from the diluted EPS calculation. The 2008 OPP Awards were not earned, and therefore the program was terminated, which resulted in the acceleration of the remaining unrecognized compensation expense during the first quarter of 2011. See Notes 15, 17 and 20 to the Consolidated Financial Statements.
Wages directly related to the development of rental properties are not included in our operating results. These costs are capitalized and included in real estate assets on our Consolidated Balance Sheets and amortized over the useful lives of the real estate. Capitalized wages for the year ended December 31, 2009 and 2008 were approximately $11.3 million and $12.2 million, respectively. These costs are not included in the general and administrative expense discussed above.
Loss from Suspension of Development
On February 6, 2009, we announced that we were suspending construction on our 1,000,000 square foot project at 250 West 55th Street in New York City. During December 2009, we completed the construction of foundations and steel/deck to grade to facilitate a restart of construction in the future and as a result ceased interest capitalization on the project. During the year ended December 31, 2009, we recognized a loss of approximately $27.8 million related to the suspension of development, which amount included a $20.0 million contractual amount due pursuant to a lease agreement. On January 19, 2010, we paid $12.8 million related to the termination of such lease. As a result, we recognized approximately $7.2 million of other income during the year ended December 31, 2010.
Between April 1, 2009 and December 31, 2009, we recognized approximately $1.1 million of additional costs associated with the suspension of development.
Other Income and Expense Items
Income (Loss) from Unconsolidated Joint Ventures
During December 2008, we recognized non-cash impairment charges which represented the other-than-temporary decline in the fair values below the carrying values of certain of our investments in unconsolidated joint ventures. In accordance with guidance in ASC 323 “Investments—Equity Method and Joint Ventures” (“ASC 323”) (formerly known as Accounting Principles Board Opinion No. 18 “The Equity Method of Accounting for Investments in Common Stock” (APB No. 18)), a loss in value of an investment under the equity method of accounting, which is other than a temporary decline, must be recognized. As a result, we recognized non-cash impairment charges of approximately $31.9 million, $74.3 million, $45.1 million and $13.8 million on our investments in 540 Madison Avenue, Two Grand Central Tower, 125 West 55th Street and the Value-Added Fund, respectively. In addition, in June 2009 and December 2009, we recognized additional non-cash impairment charges on our investment in the Value-Added Fund of approximately $7.4 million and $2.0 million, respectively. If the fair value of our investments deteriorates further, we could recognize additional impairment charges which may be material.
In addition, during December 2009, our Value-Added Fund recognized a non-cash impairment charge in accordance with the guidance in ASC 360 (formerly known as SFAS No. 144) related to our One and Two Circle Star Way properties in San Carlos, California totaling approximately $24.6 million, of which our share was approximately $4.2 million, which amount reflects the reduction in our basis of approximately $2.0 million from previous impairment losses. The Value-Added Fund was in discussions with the lender to modify the loan and as a result believed that the carrying value of the properties was not recoverable. Accordingly, the Value-Added Fund recognized the non-cash impairment charge to reduce the net book value of the properties to their estimated fair market value at December 31, 2009. On October 21, 2010, our Value-Added Fund conveyed the fee simple title to its One and Two Circle Star Way properties and paid $3.8 million to the lender in satisfaction of its outstanding obligations under the existing mortgage loan and guarantee.
During December 2008, an unconsolidated joint venture in which we have a 50% interest suspended development activity on its Eighth Avenue and 46th Street project located in New York City. The proposed project was comprised of an assemblage of land parcels and air-rights, including contracts to acquire land parcels and air-rights, on which the joint venture was to construct a Class A office property. As a result, we recognized a
charge totaling approximately $23.2 million (including $2.9 million of non-cash impairment charges in accordance with guidance in ASC 323), which represented our share of land and air-rights impairment losses, forfeited contract deposits and previously incurred planning and pre-development costs.
On June 9, 2008, we completed the acquisition of the General Motors Building for a purchase price of approximately $2.8 billion. On August 12, 2008, we completed the acquisitions of 540 Madison Avenue and Two Grand Central Tower located in New York City, New York for an aggregate purchase price of approximately $705.0 million. On August 13, 2008, we completed the acquisition of 125 West 55th Street located in New York City, New York for an aggregate price of $444.0 million. Each acquisition was completed through a joint venture with US Real Estate Opportunities I, L.P. and Meraas Capital LLC. We have a 60% interest in each venture and provide customary property management and leasing services for each venture. These acquisitions increased our income from unconsolidated joint ventures by approximately $19.7 million for the year ended December 31, 2009 compared to 2008.
Interest and Other Income
Interest and other income decreased approximately $14.9 million for the year ended December 31, 2009 compared to 2008 primarily as a result of lower overall interest rates. The average cash balances for the year ended December 31, 2009 and December 31, 2008 were approximately $602.6 million and $447.1 million, respectively. However, the average interest rate for the year ended December 31, 2009 compared to December 31, 2008 decreased by approximately 1.70%.
Gains (Losses) from Investments in Securities
We account for investments in trading securities at fair value, with gains or losses resulting from changes in fair value recognized currently in earnings. The designation of trading securities is generally determined at acquisition. During the year ended December 31, 2009 and 2008, investment in securities is comprised of an investment in an unregistered money market fund and investments in an account associated with our deferred compensation plan. In December 2007, the unregistered money market fund suspended cash redemptions by investors; investors could elect in-kind redemptions of the underlying securities or maintain their investment in the fund and receive distributions as the underlying securities matured or were liquidated by the fund sponsor. As a result, we retained this investment for a longer term than originally intended, and the valuation of our investment was subject to changes in market conditions. Because interests in this fund were valued at less than their $1.00 par value, we recognized gains (losses) of approximately $0.2 million and ($1.4) million on our investment during the years ended December 31, 2009 and 2008, respectively. As of December 31, 2009, we no longer had investments in this unregistered money market fund.
The remainder of the gains (losses) from investments in securities in 2009 and 2008 related to investments that we have made to reduce our market risk relating to a deferred compensation plan that we maintain for our officers. Under this deferred compensation plan, each officer who is eligible to participate is permitted to defer a portion of the officer’s current income on a pre-tax basis and receive a tax-deferred return on these deferrals based on the performance of specific investments selected by the officer. In order to reduce our market risk relating to this plan, we typically acquire, in a separate account that is not restricted as to its use, similar or identical investments as those selected by each officer. This enables us to generally match our liabilities to our officers under the deferred compensation plan with equivalent assets and thereby limit our market risk. The performance of these investments is recorded as gain (loss) from investments in securities. During the year ended December 31, 2009 and 2008, respectively, we recognized gains (losses) of $2.2 million and $(3.2) million on these investments. By comparison, our general and administrative expense increased (decreased) by $2.4 million and $(3.2) million during the year ended December 31, 2009 and 2008, respectively, as a result of increases and decreases in our liability under our deferred compensation plan that were associated with the performance of the specific investments selected by our officers participating in the plan.
Interest Expense
Interest expense for the Total Property Portfolio increased approximately $27.5 million for the year ended December 31, 2009 compared to 2008 as detailed below
Component | Change in interest expense for the year ended December 31, 2009 and December 31, 2008 | |||
| (in thousands) | ||||
Increases to interest expense due to: | ||||
New mortgages / properties placed in-service | $ | 22,664 | ||
Issuance by our Operating Partnership of $747.5 million in aggregate principal of 3.625% exchangeable senior notes due 2014 on August 19, 2008 (excluding the ASC 470-20 (formerly known as FSP No. APB 14-1) interest expense) | 17,736 | |||
Issuance by our Operating Partnership of $700 million in aggregate principal of 5.875% senior notes due 2019 on October 9, 2009 | 9,376 | |||
ASC 470-20 interest expense | 10,888 | |||
Total increases to interest expense | $ | 60,664 | ||
Decreases to interest expense due to: | ||||
Repayment of mortgages | $ | (22,308 | ) | |
Increase in capitalized interest costs | (2,530 | ) | ||
Reduction in borrowings under our Operating Partnership’s Unsecured Line of Credit | (4,852 | ) | ||
Principal amortization of continuing debt and other (excluding senior notes and exchangeable senior notes) | (3,463 | ) | ||
Total decreases to interest expense | $ | (33,153 | ) | |
Total change in interest expense | $ | 27,511 | ||
The following properties are included in the repayment of mortgages line item: Reston Corporate Center, Prudential Center, One and Two Embarcadero Center, Bedford Business Park, Reservoir Place, Ten Cambridge Center and 1301 New York Avenue. The following properties are included in the new mortgages/properties placed in-service line item: Four Embarcadero Center, South of Market, Democracy Tower, Wisconsin Office and Reservoir Place. As properties are placed in-service, we cease capitalizing interest and interest is then expensed.
Interest expense directly related to the development of rental properties is not included in our operating results. These costs are capitalized and included in real estate assets on our Consolidated Balance Sheets and amortized over the useful lives of the real estate. Interest capitalized for the year ended December 31, 2009 and 2008 were approximately $48.8 million and $46.3 million, respectively. These costs are not included in the interest expense referenced above.
At December 31, 2009, our variable rate debt consisted of construction loans at our South of Market, Democracy Tower, Wisconsin Place Office and Atlantic Wharf construction projects, as well as our borrowings under our Unsecured Line of Credit and our secured financing at Reservoir Place.
The following summarizes our outstanding debt as of December 31, 2009 compared with December 31, 2008:
| December 31, | ||||||||
| 2009 | 2008 | |||||||
| (dollars in thousands) | ||||||||
Debt Summary: | ||||||||
Balance | ||||||||
Fixed rate | $ | 6,326,350 | $ | 5,707,392 | ||||
Variable rate | 393,421 | 385,492 | ||||||
Total | $ | 6,719,771 | $ | 6,092,884 | ||||
Percent of total debt: | ||||||||
Fixed rate | 94.15 | % | 93.67 | % | ||||
Variable rate | 5.85 | % | 6.33 | % | ||||
Total | 100.00 | % | 100.00 | % | ||||
GAAP weighted average interest rate at end of period: | ||||||||
Fixed rate | 6.12 | % | 6.15 | % | ||||
Variable rate | 1.98 | % | 3.62 | % | ||||
Total | 5.87 | % | 5.99 | % | ||||
Coupon/Stated weighted-average interest rate at end of period: | ||||||||
Fixed rate | 5.43 | % | 5.43 | % | ||||
Variable rate | 1.75 | % | 3.07 | % | ||||
Total | 5.21 | % | 5.28 | % | ||||
Losses from Early Extinguishments of Debt
During the year ended December 31, 2009, we used available cash to repay approximately $98.4 million of outstanding mortgage loans. Associated with the repayments, we paid a prepayment penalty totaling approximately $0.5 million, wrote off approximately $42,000 of unamortized deferred financing costs and recognized a gain of approximately $32,000 related to the write off of a remaining historical fair value balance.
Net Derivative Losses
On September 9, 2008, we executed an interest rate lock agreement with lenders at an all-in fixed rate, inclusive of the credit spread, of 6.10% per annum for an eight-year, $375.0 million loan collateralized by our Four Embarcadero Center property located in San Francisco, California. Our interest rate hedging program contemplated a financing with a ten-year term and, as a result, under guidance included in ASC 815 “Derivatives and Hedging,” (formerly known as SFAS No. 133, “Accounting for Derivative Instruments and Hedging Activities”), during the third quarter of 2008 we recognized a net derivative loss of approximately $6.6 million representing the partial ineffectiveness of our interest rate contracts. On November 13, 2008, we closed on the Four Embarcadero Center mortgage. Under our interest rate hedging program, we will reclassify into earnings over the eight-year term of the loan as an increase in interest expense approximately $26.4 million (approximately $3.3 million per year) of the amounts recorded on our Consolidated Balance Sheets within Accumulated Other Comprehensive Loss, which amounts represent the effective portion of the applicable interest rate hedging contracts.
Our interest rate hedging program also contemplated obtaining additional financing of at least $150.0 million by the end of 2008. In accordance with guidance included in ASC 815 (formerly known as SFAS No. 133) as amended and interpreted, we determined that we would be unable to complete the financing by the
required date under our hedging program. As a result, during the fourth quarter of 2008, we recognized a net derivative loss of approximately $7.2 million representing the ineffectiveness of our remaining interest rate hedging contracts.
In addition, during the year ended December 31, 2008, we modified the estimated dates with respect to our anticipated financings under our interest rate hedging program. As a result, we recognized a net derivative loss of approximately $3.3 million representing the partial ineffectiveness of the interest rate contracts.
Gains on Sales of Real Estate
Pursuant to the purchase and sale agreement related to the sale of 280 Park Avenue in New York City in 2006, we entered into a master lease agreement with the buyer at closing. Under the master lease agreement, we guaranteed that the buyer will receive at least a minimum amount of base rent from approximately 74,340 square feet of space during the ten-year period following the expiration of the leases for this space. The leases for this space expired at various times between June 2006 and October 2007. The aggregate amount of base rent we guaranteed over the entire period from 2006 to 2017 is approximately $67.3 million. During the year ended December 31, 2008, we signed new qualifying leases for approximately 17,454 net rentable square feet of the remaining master lease obligation, resulting in the recognition of approximately $23.4 million. During the year ended December 31, 2009, we signed no new qualifying leases and our remaining master lease obligation totaled approximately $0.9 million.
On April 14, 2008, we sold a parcel of land located in Washington, DC for approximately $33.7 million. We had previously entered into a development management agreement with the buyer to develop a Class A office property on the parcel totaling approximately 165,000 net rentable square feet. Due to our involvement in the construction of the project, the gain on sale estimated to total $23.4 million was deferred and is being recognized over the project construction period generally based on the percentage of total project costs incurred to estimated total project costs. As a result, we recognized a gain on sale during the year ended December 31, 2009 and December 31, 2008 of approximately $11.8 million and $9.9 million, respectively.
Noncontrolling Interests in Property Partnerships
Noncontrolling interests in property partnerships increased by approximately $0.8 million for the year ended December 31, 2009 compared to 2008. Noncontrolling interests in property partnerships consist of the outside equity owners’ interests in the income from our 505 9th Street and our Wisconsin Place Office properties.
Noncontrolling Interest—Common Units of the Operating Partnership
Noncontrolling interest—common units of the Operating Partnership increased by approximately $21.1$12.2 million for the year ended December 31, 20092011 compared to 2008 primarily2010 due to an increase in allocable income.income partially offset by a decrease in the noncontrolling interest’s ownership percentage.
Liquidity and Capital Resources
General
Our principal liquidity needs for the next twelve months and beyond are to:
fund normal recurring expenses;
meet debt service and principal repayment obligations, including balloon payments on maturing debt;
redeem or meet repurchase obligations that may be elected in May 2013 by our Operating Partnership or holders, respectively, with respect to our Operating Partnership’s 3.750% exchangeable senior notes due 2036;
fund capital expenditures, including major renovations, tenant improvements and leasing costs;
fund development costs;
fund possible property acquisitions; and
make the minimum distribution required to maintain our REIT qualification under the Internal Revenue Code of 1986, as amended.
We expect to satisfy these needs using one or more of the following:
construction loans;
long-term secured and unsecured indebtedness (including unsecured exchangeable indebtedness);
cash flow from operations;
distribution of cash flows from joint ventures;
cash and cash equivalent balances;
sales of real estate;
issuances of our equity securities and/or additional preferred or common units of partnership interest in our Operating Partnership; and
our Operating Partnership’s Unsecured Line of Credit or other short-term bridge facilities.facilities;
construction loans;
long-term secured and unsecured indebtedness (including unsecured exchangeable indebtedness); and
sales of real estate.
We believe that our liquidity needs will be satisfied using our cash on hand, cash flows generated by operations, availability under our Unsecured Line of Credit and cash flows provided by other financing activities. We draw on multiple financing sources to fund our long-term capital needs. Our Operating Partnership’s Unsecured Line of Credit is utilized primarily as a bridge facility to fund acquisition opportunities, to refinance outstanding indebtedness and to meet short-term development and working capital needs. WeAlthough we generally seek to fund our development projects with construction loans, which may be guaranteed. However,guaranteed by our Operating Partnership, the financing for each particular project ultimately depends on several factors, including, among others, the project’s size and duration, the extent of pre-leasing and our available cash and access to cost effective capital at the given time.
The following table presents information on properties under construction as of December 31, 20102012 (dollars in thousands):
Construction Properties | Estimated Stabilization Date | Location | # of Buildings | Square feet | Investment to Date(1) | Estimated Total Investment(1) | Percentage Leased(2) | |||||||||||||||||
Office | ||||||||||||||||||||||||
Atlantic Wharf(3)(4) | First Quarter, 2012 | Boston, MA | 1 | 790,000 | $ | 503,799 | $ | 552,900 | 79 | %(4) | ||||||||||||||
2200 Pennsylvania Avenue(5) | Second Quarter, 2012 | Washington, DC | 1 | 460,000 | 137,291 | 230,000 | 85 | %(5) | ||||||||||||||||
510 Madison Avenue(6) | Fourth Quarter, 2012 | New York, NY | 1 | 347,000 | 319,071 | 375,000 | 13 | % | ||||||||||||||||
Total Office Properties under Construction | 3 | 1,597,000 | $ | 960,161 | $ | 1,157,900 | 66 | % | ||||||||||||||||
Residential | ||||||||||||||||||||||||
Atlantic Wharf—Residential (86 units)(7) | Second Quarter, 2012 | Boston, MA | 1 | 78,000 | $ | 35,495 | $ | 47,100 | N/A | |||||||||||||||
Atlantic Wharf—Retail | 10,000 | 0 | % | |||||||||||||||||||||
2221 I Street, NW—Residential (335 units)(8) | Third Quarter, 2012 | Washington, DC | 1 | 275,000 | 81,874 | 150,000 | N/A | |||||||||||||||||
2221 Street, NW—Retail | 50,000 | 100 | % | |||||||||||||||||||||
Total Residential Properties under Construction | 2 | 413,000 | $ | 117,369 | $ | 197,100 | 83 | % | ||||||||||||||||
Total Properties under Construction | 5 | 2,010,000 | $ | 1,077,530 | $ | 1,355,000 | 67 | % | ||||||||||||||||
Construction Properties | Estimated Stabilization Date | Location | # of Buildings | Square feet | Investment to Date(1) | Estimated Total Investment(1) | Percentage Leased(2) | |||||||||||||||||
Office | ||||||||||||||||||||||||
Annapolis Junction Building Six (50% ownership) (3) | Third Quarter, 2013 | Annapolis, MD | 1 | 120,000 | $ | 11,167 | $ | 14,000 | 49 | % | ||||||||||||||
500 North Capitol Street, NW (30% ownership)(3) | Fourth Quarter, 2013 | Washington, DC | 1 | 232,000 | 30,033 | 36,540 | 82 | % | ||||||||||||||||
Two Patriots Park (formerly known as 12300 Sunrise Valley Drive)(4) | Second Quarter, 2013 | Reston, VA | 1 | 255,951 | 52,558 | 64,000 | 100 | % | ||||||||||||||||
Seventeen Cambridge Center | Third Quarter, 2013 | Cambridge, MA | 1 | 195,191 | 59,102 | 86,300 | 100 | % | ||||||||||||||||
Cambridge Center Connector(5) | Third Quarter, 2013 | Cambridge, MA | — | 42,500 | 6,892 | 24,600 | 100 | % | ||||||||||||||||
Annapolis Junction Building Seven (50% ownership) | Fourth Quarter, 2014 | Annapolis, MD | 1 | 125,000 | 3,995 | 16,050 | — | |||||||||||||||||
680 Folsom Street | Third Quarter, 2015 | San Francisco, CA | 2 | 522,000 | 185,848 | 340,000 | 85 | % | ||||||||||||||||
250 West 55th Street(6) | Fourth Quarter, 2015 | New York, NY | 1 | 989,000 | 730,812 | 1,050,000 | 46 | % | ||||||||||||||||
|
|
|
|
|
|
|
|
|
| |||||||||||||||
Total Office Properties under Construction | 8 | 2,481,642 | $ | 1,080,407 | $ | 1,631,490 | 66 | % | ||||||||||||||||
|
|
|
|
|
|
|
|
|
| |||||||||||||||
Residential | ||||||||||||||||||||||||
The Avant at Reston Town Center (359 units) | Fourth Quarter, 2015 | Reston, VA | 1 | 355,668 | $ | 67,620 | $ | 137,250 | N/A | |||||||||||||||
|
|
|
|
|
|
|
|
|
| |||||||||||||||
Total Properties under Construction | 9 | 2,837,310 | $ | 1,148,027 | $ | 1,768,740 | 66 | % | ||||||||||||||||
|
|
|
|
|
|
|
|
|
| |||||||||||||||
| (1) | Represents our share. Includes net revenue during lease up period, acquisition expenses and approximately |
| (2) | Represents |
| (3) |
| (4) | Project |
| (5) |
| (6) |
Contractual rental revenue, recoveries from tenants, other income from operations, available cash balances and draws on our Operating Partnership’s Unsecured Line of Credit are our principal sources of capital used to pay operating expenses, debt service, recurring capital expenditures and the minimum distribution required to enable us to maintain our REIT qualification. We seek to maximize income from our existing properties by maintaining quality standards for our properties that promote high occupancy rates and permit increases in rental rates while reducing tenant turnover and controlling operating expenses. Our sources of revenue also include third-party fees generated by our property management, leasing, and development and construction businesses.businesses, as well as the sale of assets from time to time. We believe our revenue, together with our cash balances and proceeds from financing activities, will continue to provide the necessary funds for our short-term liquidity needs.
Material adverse changes in one or more sources of capital may adversely affect our net cash flows. Such changes, in turn, could adversely affect our ability to fund dividends and distributions, debt service payments and tenant improvements. In addition, a material adverse change in ourthe cash provided by our operations may affect our ability to comply with the financial performance covenants under our Operating Partnership’s Unsecured Line of Credit and unsecured senior notes.
Given the recent low interest rate environment and the opportunity to further enhance our capital position and elongate our debt maturity schedule, we have also been active in the capital markets.
Since January 1, 2010, five2012, we issued an aggregate of 2,347,500 shares of our joint ventures have refinancedcommon stock under our “at the market” (“ATM”) stock offering program for gross proceeds of approximately $714$249.8 million in secured financings. In April 2010, our Operating Partnership completed a public offering of $700 million aggregate principal amount of 5.625% senior notes due 2020 that raised aggregateand net proceeds of approximately $694 million, and in November 2010, we completed a public$247.0 million. Our ATM stock offering program provides us with the ability to sell from time to time up to an aggregate of $850 million aggregate principal amount of 4.125% senior notes due 2021 that raised aggregate net proceeds of approximately $837 million. We used the proceeds of the November offering to reduce a significant portion of our near-term debt maturities. Specifically, we redeemed $700$600.0 million of our 6.25% senior notes due 2013 and we repurchased $50 million of our 2.875% exchangeable senior notes due 2037 that the holders may require us to repurchase in February 2012. Our remaining liquidity ascommon stock through sales agents for a three-year period. As of February 18, 2011, including21, 2013, approximately $305.3 million remained available cash of approximately $327 millionfor issuance under this ATM stock offering program. We intend to use the net proceeds from the sales for general business purposes, which may include investment opportunities and full availability under our Operating Partnership’s $1.0 billion line of credit, is expected to provide sufficient capacity to funddebt reduction. Pending such uses, we may invest the completion of our development pipeline and provide capital for future investments.net proceeds in short-term, interest-bearing securities.
Our most significant capital commitmentsOn August 29, 2012, in 2011 are to fundconnection with our development program and repay or refinance expiring debt. We believe the qualityacquisition of our assets and our strong balance sheet are attractive to lenders’ and equity investors’ current investment selectivity and should enable us to continue to access multiple sources of capital. In 2010,680 Folsom Street, our Operating Partnership exercised its optionissued 1,588,100 Series Four Preferred Units of limited partnership interest having a per unit liquidation preference of $50.00 and the right to extend the maturity date under itsreceive quarterly distributions of $0.25 per unit for an aggregate value of approximately $79.4 million. An aggregate of 366,573 of such units were redeemed on August 31, 2012.
In June 2012, our Operating Partnership issued $1.0 billion Unsecured Line of Credit to August 3, 2011senior unsecured notes due 2023 at an effective yield of 3.954%. During 2012, we repaid, repurchased or redeemed an aggregate of $1.0 billion of indebtedness with an average GAAP interest rate of 5.58%. We have secured and we are currentlyunsecured debt maturities in discussions on a longer term renewal. We are evaluating refinancing alternatives on our $4572013 aggregating approximately $637 million, mortgage loan on 601 Lexington Avenue and we believe we could raise approximately $700 million to $750 million through a new secured mortgage loan. Our unconsolidated joint venture portfolio has three loans maturing in 2011, Mountain View Research Park, Annapolis Junction and Mountain View Technology Park which have balances of approximately $112 million, $43 million and $24 million, respectively (of which our share is $44approximately $593 million, $22which we expect to redeem, repay or refinance. The completion of our properties under construction through late 2015 has remaining costs to fund of approximately $1.0 billion, which includes the estimated acquisition and completion cost for 535 Mission Street in San Francisco, California (See Note 20) and 601 Massachusetts Avenue in Washington, DC. In addition, we anticipate that our Transbay Tower joint venture will acquire the land and incur predevelopment costs aggregating $225 million in 2013. We believe that our liquidity, including available cash as of February 21, 2013 of approximately $800 million, and $9the approximately $735 million respectively).
In addition toavailable under our Operating Partnership’s Unsecured Line of Credit, provide sufficient capacity to meet our debt obligations, fund our remaining equity capital requirements on existing development projects and property-specificpursue attractive additional investment opportunities. However, we may seek to enhance our liquidity in the future, through the issuances of debt asor equity securities, the possible sale of February 18, 2011,select assets or a combination of one or more of the foregoing, which may result in us carrying additional cash and cash equivalents pending our Operating Partnership also had approximately $4.8 billionPartnership’s use of unsecured senior notes outstanding (including approximately $1.8 billion of exchangeable senior notes). All of this debt either matures or is subject to repurchase at the holders’ option between 2012 and 2021. We are focused on our near—and medium-term debt maturities and, to date, our Operating Partnership has repurchased approximately $236.3 million of its 2.875% exchangeable senior notes due 2037, which the holders may require us to repurchase in 2012, for approximately $236.6 million, and have redeemed $700 million of its 6.25% senior notes due 2013 for approximately $793.1 million, which included approximately $17.9 million of accrued and unpaid interest to, but not including, the redemption date.proceeds. In order to reduce future cash interest payments, as well as future amounts due at maturity or upon redemption, we may, from time to time, purchase unsecured senior notes and unsecured
exchangeable senior notes for cash in open market purchases or privately negotiated transactions, or both. We will evaluate any such potential transactions in light of then-existing market conditions, taking into account the trading prices of the notes, our current liquidity and prospects for future access to capital.
During the first quarter of 2011 through February 25, 2011, we issued 2,304,994 shares of common stock for gross proceeds of approximately $219.0 million. These shares were issued under our $400 million “at the market” equity offering program. We intend to use the net proceeds from these issuances for general business purposes, which may include investment opportunities and debt reduction. Future potential sales under the program will depend on a variety of factors to be determined by us from time to time, including (among others) market conditions, the trading price of our common stock, our capital needs and our determinations as to the appropriate sources of funding for our activities.
In total, our remaining capital requirements, net of anticipated and potential funding from existing construction loans, to complete our ongoing developments and Weston Corporate Center is approximately $87.8 million, through late 2012. We are working towards the commencement of two new developments and two redevelopments in the Washington, DC market in 2011. With available cash, access to our Operating Partnership’s Unsecured Line of Credit and the anticipated cash flow generated by the operating portfolio, we believe we have sufficient capacity to fund our remaining capital requirements and pursue attractive investment opportunities.
REIT Tax Distribution Considerations
Dividend
As a REIT we are subject to a number of organizational and operational requirements, including a requirement that we currently distribute at least 90% of our annual taxable income. Our policy is to distribute at least 100% of our taxable income to avoid paying federal tax. With a view toward increasingOn November 8, 2012, our equity over time and preserving additional capital, we reducedBoard of Directors increased our quarterly dividend in the second quarter of 2009from $0.55 per common share to $0.50$0.65 per common share. Based onOur Board of Directors will continue to evaluate our current expectation fordividend rate in light of our actual and projected taxable income, for 2011,liquidity requirements and absent any unanticipatedother circumstances, we expect that our quarterly dividend will be approximately $0.50 per common share. Thereand there can be no assurance that the actualfuture dividends declared by our Board of Directors will not differ materially.
Sales
We structured the acquisition of the John Hancock Tower as a reverse like-kind exchange, which is intended to provide us the flexibility to sell certain assets within 180 days of the closing, defer any taxable gain and thereby retain capital for future investments or the reduction of debt. We are currently evaluating market interest in a sale of all or a significant interest in our Carnegie Center portfolio and may identify other assets for potential sale in 2011. To the extent that we sell assets at a gain and cannot efficiently use the proceeds in a tax deferred manner for either our development activities or attractive acquisitions, we would, at the appropriate time, decide whether it is better to declare a special dividend, adopt a stock repurchase program, reduce our indebtedness or retain the
cash for future investment opportunities. Such a decision will depend on many factors including, among others, the timing, availability and terms of development and acquisition opportunities, our then-current and anticipated leverage, the cost and availability of capital from other sources, the price of our common stock and REIT distribution requirements. At a minimum, we expect that we would distribute at least that amount of proceeds necessary for us to avoid paying corporate level tax on the applicable gains realized from any asset sales.
Cash Flow Summary
The following summary discussion of our cash flows is based on the Consolidated Statements of Cash Flows in “Item 8. Financial Statements and Supplementary Data” and is not meant to be an all-inclusive discussion of the changes in our cash flows for the periods presented below.
Cash and cash equivalents were $0.5approximately $1.0 billion and $1.4$1.8 billion at December 31, 20102012 and December 31, 2009,2011, respectively, representing aan decrease of $0.9approximately $0.8 billion. The decrease was a result of the following table sets forth changes in cash flows:
| Years ended December 31, | Year ended December 31, | |||||||||||||||||||||||
| 2010 | 2009 | Increase (Decrease) | 2012 | 2011 | Increase (Decrease) | |||||||||||||||||||
| (in thousands) | (in thousands) | |||||||||||||||||||||||
Net cash provided by operating activities | $ | 375,893 | $ | 617,376 | $ | (241,483 | ) | $ | 642,949 | $ | 606,328 | $ | 36,621 | |||||||||||
Net cash (used in) investing activities | $ | (1,161,274 | ) | $ | (446,601 | ) | $ | (714,673 | ) | |||||||||||||||
Net cash used in investing activities | (1,278,032 | ) | (90,096 | ) | (1,187,936 | ) | ||||||||||||||||||
Net cash provided by (used in) financing activities | $ | (184,604 | ) | $ | 1,036,648 | $ | (1,221,252 | ) | (146,147 | ) | 828,028 | (974,175 | ) | |||||||||||
Our principal source of cash flow is related to the operation of our office properties. The average term of our in-place tenant leases, including our unconsolidated joint ventures, is approximately 7.16.9 years with portfolio occupancy rates historically in the range of 92%91% to 95%94%. Our properties providegenerate a relatively consistent stream of cash flow that provides us with resources to pay operating expenses, debt service and fund quarterly dividend and distribution payment requirements. Items which contributed toIn addition, over the decrease in cash provided by operating activities forpast several years, we have raised capital through the year ended December 31, 2010 compared to the year ended December 31, 2009 were (1) the paymentsale of the redemption premium of approximately $75.2 million and the payment of an aggregate of approximately $20.0 million of accrued interest and hedge settlement costs in connection with the redemption of $700.0 million aggregate principal amountsome of our Operating Partnership’s 6.25% senior notes due 2013, (2) a net increase in the cash payments of interest expense of approximately $59.5 million, (3) the payment of approximately $17.6 million related to the payment of the accreted debt discount on the repurchase of our Operating Partnership’s 2.875% exchangeable senior notes, (4) an increase in cash payments of approximately $13.2 million related to tenant leasing costsproperties, secured and (5) the payment of approximately $12.8 million related to the termination of a lease agreement at our 250 West 55th Street project.unsecured borrowings and equity offerings.
Cash is used in investing activities to fund acquisitions, development, net investments in unconsolidated joint ventures and recurring and nonrecurring capital expenditures. We selectively invest in new projects that enable us to take advantage of our development, leasing, financing and property management skills and invest in building acquisitions that meet our investment criteria.existing buildings to enhance or maintain their market position. Cash used in investing activities for the year ended December 31, 20102012 and 2011 consisted primarily of funding our development projects theand our acquisition of the John Hancock Building, our investment in the unconsolidated joint venture that owns 125 West 55thBay Colony Corporate Center, 100 Federal Street, to repay the joint venture’s outstanding mezzanine loans680 Folsom Street and the proceeds from a mortgage loan being placed in escrow, and isFountain Square, as detailed below:
| (in thousands) | ||||
Acquisitions/additions to real estate | $ | (850,519 | ) | |
Proceeds from redemptions of investments in securities | 2,149 | |||
Capital contributions to unconsolidated joint ventures | (62,806 | ) | ||
Capital distributions from unconsolidated joint ventures | 49,902 | |||
Proceeds from mortgage loan placed in escrow | (267,500 | ) | ||
Deposits on real estate | (10,000 | ) | ||
Acquisition of note receivable | (22,500 | ) | ||
Net cash (used in) investing activities | $ | (1,161,274 | ) | |
| Year ended December 31, | ||||||||
| 2012 | 2011 | |||||||
| (in thousands) | ||||||||
Acquisitions of real estate | $ | (788,052 | ) | $ | (112,180 | ) | ||
Construction in progress | (356,397 | ) | (271,856 | ) | ||||
Building and other capital improvements | (49,943 | ) | (61,961 | ) | ||||
Tenant improvements | (139,662 | ) | (76,320 | ) | ||||
Proceeds from the sale of real estate | 61,963 | — | ||||||
Proceeds from mortgage loan released from escrow | — | 267,500 | ||||||
Proceeds from land transaction | — | 43,887 | ||||||
Deposits on real estate | — | 10,000 | ||||||
Issuance of notes receivable, net | (2,049 | ) | (10,442 | ) | ||||
Capital contributions to unconsolidated joint ventures | (6,214 | ) | (17,970 | ) | ||||
Capital distributions from unconsolidated joint ventures | 3,557 | 140,505 | ||||||
Investments in securities, net | (1,235 | ) | (1,259 | ) | ||||
|
|
|
| |||||
Net cash used in investing activities | $ | (1,278,032 | ) | $ | (90,096 | ) | ||
|
|
|
| |||||
Cash used in investing activities changed primarily due to the following:
On February 1, 2011, we completed the acquisition of Bay Colony Corporate Center in Waltham, Massachusetts for an aggregate purchase price of approximately $185.0 million. The purchase price consisted of approximately $41.1 million of cash and the assumption of approximately $143.9 million of indebtedness. In connection with this transaction, we deposited $10.0 million in escrow, which was returned to us at closing.
On November 22, 2011, we acquired 2440 West El Camino Real located in Mountain View, California for a net purchase price of approximately $71.1 million in cash. 2440 West El Camino Real is an approximately 140,000 net rentable square foot Class A office property.
On March 1, 2012, we acquired 453 Ravendale Drive located in Mountain View, California for a purchase price of approximately $6.7 million in cash.
On March 13, 2012, we acquired 100 Federal Street in Boston, Massachusetts for an aggregate investment of approximately $615.0 million in cash.
On August 29, 2012, we acquired the development project located at 680 Folsom Street in San Francisco, California. The consideration paid by us to the seller consisted of approximately $62.2 million in cash.
On October 4, 2012, we completed the formation of a consolidated joint venture which owns and operates Fountain Square located in Reston, Virginia for an aggregate cash investment from us of approximately $100.0 million.
| • | Construction in progress for the year ended December 31, 2011 includes ongoing expenditures associated with our Atlantic Wharf Office, 2200 Pennsylvania Avenue, the Residences on The Avenue, 510 Madison Avenue and The Lofts at Atlantic Wharf developments, which were fully or partially placed in-service during the year ended December 31, 2011. In addition, for the year ended December 31, 2011, we also incurred costs associated with the continued development and redevelopment of 250 West 55th Street, Seventeen Cambridge Center and One Patriots Park. Construction in progress for the year ended December 31, 2012 includes expenditures associated with our 510 Madison Avenue and One Patriots Park developments, which were fully placed in-service during the year ended December 31, 2012. In addition, we incurred costs associated with the continued development and redevelopment of Two Patriots Park, Seventeen Cambridge Center, The Avant at Reston Town Center, the Cambridge Center Connector, 250 West 55thStreet and 680 Folsom Street. The completion of our ongoing developments, including our share of our unconsolidated joint venture developments, through 2015 is expected to be fully funded by cash and available draws from construction loans. We estimate our future funding requirement to complete our developments, which includes our share of our unconsolidated joint venture developments and 535 Mission Street and 601 Massachusetts Avenue, to be approximately $1.0 billion. |
Tenant improvement costs increased by approximately $63.3 million due to the start of large tenant projects in 2012.
On May 17, 2012, we completed the sale of our Bedford Business Park properties located in Bedford, Massachusetts for approximately $62.8 million in cash. Net cash proceeds totaled approximately $62.0 million.
Proceeds from mortgage loan released from escrow related to the release of the mortgage loan for 510 Madison Avenue, located in New York City, which had been secured by cash deposits.
Proceeds from land transaction relates to the portion of the payment received by us for our 75 Ames Street land parcel from a third-party which we estimate will relate to the ultimate conveyance of a condominium interest to the third-party upon the anticipated completion of the development of the property and does not include the portion attributable to rental of the land during the period of development.
Cash used inby financing activities for the year ended December December��31, 20102012 totaled approximately $184.6$146.1 million. This consisted primarily of the repurchase/redemption of a portionall of our Operating Partnership’s outstanding 2.875% exchangeable senior notes due 2037, the redemption of our Operating Partnership’s outstanding 6.25% senior notes due 2013, the payments of dividends and distributions to our shareholders and the unitholders of our Operating Partnership the repurchase of a portion of our Operating Partnership’s 2.875% exchangeable senior notes due 2037 and the repayment of mortgage notes payable, partially offset by the issuance of $1.0 billion of our Operating Partnership’s 3.850% senior notes due 2023 and the net proceeds from the offerings in April and November 2010issuance of shares of our Operating Partnership’s 5.625% and 4.125% senior notes due 2020 and 2021, respectively, and the proceeds from mortgage notes payable.common stock under our ATM stock offering program. Future debt payments are discussed below under the heading ““CapitalizationCapitalization-Debt Financing—.Debt Financing.”
Capitalization
At December 31, 2010,2012, our total consolidated debt was approximately $7.8$8.9 billion. The GAAP weighted-average annual interest rate on our consolidated indebtedness was 5.56% per annum5.13% (with a coupon/stated rate of 4.89%) and the weighted-average maturity was approximately 5.45.7 years.
Consolidated debt to total consolidated market capitalization ratio, defined as total consolidated debt as a percentage of the market value of our outstanding equity securities plus our total consolidated debt, is a measure of leverage commonly used by analysts in the REIT sector. Our total consolidated market capitalization was approximately $21.8$27.0 billion at December 31, 2010. Total2012. Our total consolidated market capitalization was calculated using the December 31, 20102012 closing stock price of $86.10$105.81 per common share and the following: (1) 140,199,105151,601,209 shares of our common stock, (2) 19,387,78116,053,497 outstanding common units of limited partnership interest in Boston Properties Limitedour Operating Partnership (excluding common units held by Boston Properties, Inc.)us), (3) an aggregate of 1,460,6881,307,083 common units issuable upon conversion of all outstanding Series Two Preferred Units of partnership interest in Boston Properties Limitedour Operating Partnership, (4) an aggregate of 1,507,1641,303,296 common units issuable upon conversion of all outstanding LTIP Units, assuming all conditions have been met for the conversion of the LTIP Units, and (5) 1,221,527 Series Four Preferred Units of partnership interest in our Operating Partnership multiplied by the fixed liquidation preference of $50 per unitand (6) our consolidated debt totaling approximately $7.8$8.9 billion. The calculation of total consolidated market capitalization does not include 1,080,938 2008400,000 2011 OPP Units and 400,000 2012 OPP Units because, unlike other LTIP Units, they are not earned until certain return thresholds are achieved. Our total consolidated debt, which excludes debt collateralized by our unconsolidated joint ventures, at December 31, 20102012, represented approximately 35.75%33.02% of our total consolidated market capitalization. This percentage will fluctuate with changes in the market pricevalue of our common stock and does not necessarily reflect our capacity to incur additional debt to finance our activities or our ability to manage our existing debt obligations. However, for a company like ours, whose assets are primarily income-producing real estate, the consolidated debt to total consolidated market capitalization ratio may provide investors with an alternate indication of leverage, so long as it is evaluated along with other financial ratios and the various components of our outstanding indebtedness.
For a discussion of our unconsolidated joint venture indebtedness, see “Off Balance“Liquidity and Capital Resources—Capitalization—Off-Balance Sheet Arrangements—Joint Venture Indebtedness.Indebtedness” within“Item 7—Management’s Discussion and Analysis of Financial Condition and Results of Operations.”
Debt Financing
As of December 31, 2010,2012, we had approximately $7.8$8.9 billion of outstanding consolidated indebtedness, representing approximately 35.75%33.02% of our total consolidated market capitalization as calculated above consisting of approximately (1) $3.017$4.640 billion (net of discount) in publicly traded unsecured senior notes (excluding exchangeable senior notes) having a weighted-average interest rate of 5.38%4.74% per annum and maturities in 2013, 2015, 2018, 2019, 2020, 2021 and 2021;2023; (2) $428.1$446.3 million (net of adjustment for the equity component allocation) of exchangeable senior notes having a GAAP interest rate of 5.958% per annum (an effective rate of 3.787% per annum, excluding the effect of the adjustment for the equity component allocation), an initial optional redemption date in 2013 and maturity in 2036; (3) $607.5$724.0 million (net of discount and the adjustment for the equity component allocation) of exchangeable senior notes having a GAAP interest rate of 5.630% per annum (an effective rate of 3.462% per annum, excluding the effect of the adjustment for the equity component allocation), an initial optional redemption date in 2012 and maturing in 2037; (4) $686.1 million (net of discount and the adjustment for the equity component allocation ) of exchangeable senior notes having a GAAP interest rate of 6.555% per annum (an
(an effective rate of 4.037%, excluding the effect of the adjustment for the equity component allocation) and maturing in 2014; (5) $267.5 million of debt fully secured by cash deposits having a GAAP interest rate of LIBOR plus 0.30% per annum and maturing February 24, 2012 and (6) $2.8(4) $3.1 billion of property-specific mortgage debt having a GAAP weighted-average interest rate of 5.90%5.27% per annum and weighted-average term of 4.95.2 years. The table below summarizes our mortgage notes payable, our unsecured senior notes and our Unsecured Line of Credit at December 31, 20102012 and December 31, 2009:2011:
| December 31, | 2012 | 2011 | ||||||||||||||
| 2010 | 2009 | (Dollars in thousands) | ||||||||||||||
| (dollars in thousands) | ||||||||||||||||
DEBT SUMMARY: | ||||||||||||||||
Debt Summary: | ||||||||||||||||
Balance | ||||||||||||||||
Fixed rate mortgage notes payable | $ | 2,730,086 | $ | 2,249,880 | $ | 3,102,485 | $ | 3,123,267 | ||||||||
Variable rate mortgage notes payable | 317,500 | 393,421 | — | — | ||||||||||||
Unsecured senior notes, net of discount | 3,016,598 | 2,172,389 | 4,639,528 | 3,865,186 | ||||||||||||
Unsecured exchangeable senior notes, net of discount and adjustment for the equity component allocation | 1,721,817 | 1,904,081 | 1,170,356 | 1,715,685 | ||||||||||||
Unsecured Line of Credit | — | — | — | — | ||||||||||||
|
| |||||||||||||||
Total | $ | 7,786,001 | $ | 6,719,771 | $ | 8,912,369 | $ | 8,704,138 | ||||||||
|
| |||||||||||||||
Percent of total debt: | ||||||||||||||||
Fixed rate | 95.92 | % | 94.15 | % | 100.00 | % | 100.00 | % | ||||||||
Variable rate | 4.08 | % | 5.85 | % | — | — | ||||||||||
|
| |||||||||||||||
Total | 100.00 | % | 100.00 | % | 100.00 | % | 100.00 | % | ||||||||
|
| |||||||||||||||
GAAP weighted average interest rate at end of period: | ||||||||||||||||
GAAP Weighted-average interest rate at end of period: | ||||||||||||||||
Fixed rate | 5.75 | % | 6.12 | % | 5.13 | % | 5.39 | % | ||||||||
Variable rate | 0.99 | % | 1.98 | % | — | — | ||||||||||
|
| |||||||||||||||
Total | 5.56 | % | 5.87 | % | 5.13 | % | 5.39 | % | ||||||||
|
| |||||||||||||||
Coupon/Stated weighted-average interest rate at end of period: | ||||||||||||||||
Coupon/Stated Weighted-average interest rate at end of period: | ||||||||||||||||
Fixed rate | 5.25 | % | 5.43 | % | 4.89 | % | 4.99 | % | ||||||||
Variable rate | 0.86 | % | 1.75 | % | — | — | ||||||||||
|
| |||||||||||||||
Total | 5.07 | % | 5.21 | % | 4.89 | % | 4.99 | % | ||||||||
|
| |||||||||||||||
The variable rate debt shown above bears interest based on various spreads over the London Interbank Offered Rate (“LIBOR”) or Eurodollar rates. As of December 31, 2010, the weighted average interest rate on our variable rate debt was LIBOR/Eurodollar plus 0.60% per annum.
Unsecured Line of Credit
The lenders’ total commitment underOn June 24, 2011, our Operating Partnership amended and restated the revolving credit agreement governing our Operating Partnership’s Unsecured Line of Credit, iswhich (1) reduced the total commitment from $1.0 billion. Thebillion to $750.0 million, (2) extended the maturity date from August 3, 2011 to June 24, 2014, with a provision for a one-year extension at the Operating Partnership’s option, subject to certain conditions and the payment of an extension fee equal to 0.20% of the total commitment then in effect, and (3) increased the per annum variable interest rates available, which resulted in an increase of the per annum variable interest rate on outstanding balances from Eurodollar plus 0.475% per annum to Eurodollar plus 1.225% per annum. Under the amended Unsecured Line of Credit, bears interest at a variable interest rate equalthe Operating Partnership may increase the total commitment to Eurodollar plus 0.475% per annum. Effective as of August 3, 2010, the maturity date was extended$1.0 billion, subject to August 3, 2011. All other termssyndication of the Unsecured Line of Credit remain unchanged. There can be no assurance that we will be able to renew or replace the Unsecured Line of Credit upon maturity on favorable terms (including the lenders’ total commitment) or at all. The Unsecured Line of Credit is a recourse obligation of our Operating Partnership. Under the Unsecured Line of Credit,increase. In addition, a facility fee currently equal to 0.125%an aggregate of 0.225% per annum of the total commitment is payable in equal quarterly installments. The interest rate and facility fee are subject to adjustment in the event of a change in ourthe Operating Partnership’s unsecured debt ratings. The amended Unsecured Line of Credit involves a syndicate of lenders. The Unsecured Line of Creditalso contains a competitive bid option that allows banks that are part of the lender consortium to bid to make loan advances to ourthe Operating Partnership at a negotiated LIBOR-basedreduced interest rate.
Our ability to borrow under our Unsecured Line of Credit is subject to our compliance with a number of customary financial and other covenants on an ongoing basis, including:
a leverage ratio not to exceed 60%, however the leverage ratio may increase to no greater than 65% provided that it is reduced back to 60% within 180 days;one year;
a secured debt leverage ratio not to exceed 55%;
a fixed charge coverage ratio of at least 1.40;
an unsecured leverage ratio not to exceed 60%, however the leverage ratio may increase to no greater than 65% provided that it is reduced back to 60% within 180 days;one year;
a minimum net worth requirement;requirement of $3.5 billion;
an unsecured debt interest coverage ratio of at least 1.75; and
limitations on permitted investments.
We believe we are in compliance with the financial and other covenants listed above.
As of December 31, 2010,2012, we had no borrowings and outstanding letters of credit totaling $24.6approximately $14.8 million outstanding under the Unsecured Line of Credit, with the ability to borrow $975.4approximately $735.2 million. As of February 18, 2011,21, 2013, we had no borrowings and outstanding letters of credit totaling approximately $15.0 million outstanding under the Unsecured Line of Credit.Credit, with the ability to borrow approximately $735.0 million.
Unsecured Senior Notes
The following summarizes the unsecured senior notes outstanding as of December 31, 20102012 (dollars in thousands):
| Coupon/ Stated Rate | Effective Rate(1) | Principal Amount | Maturity Date(2) | Coupon/ Stated Rate | Effective Rate(1) | Principal Amount | Maturity Date(2) | |||||||||||||||||||||||||
10 Year Unsecured Senior Notes | 6.250 | % | 6.381 | % | $ | 182,432 | January 15, 2013 | |||||||||||||||||||||||||
10 Year Unsecured Senior Notes | 6.250 | % | 6.291 | % | 42,568 | January 15, 2013 | ||||||||||||||||||||||||||
12 Year Unsecured Senior Notes | 5.625 | % | 5.693 | % | 300,000 | April 15, 2015 | 5.625 | % | 5.693 | % | $ | 300,000 | April 15, 2015 | |||||||||||||||||||
12 Year Unsecured Senior Notes | 5.000 | % | 5.194 | % | 250,000 | June 1, 2015 | 5.000 | % | 5.194 | % | 250,000 | June 1, 2015 | ||||||||||||||||||||
10 Year Unsecured Senior Notes | 5.875 | % | 5.967 | % | 700,000 | October 15, 2019 | 5.875 | % | 5.967 | % | 700,000 | October 15, 2019 | ||||||||||||||||||||
10 Year Unsecured Senior Notes | 5.625 | % | 5.708 | % | 700,000 | November 15, 2020 | 5.625 | % | 5.708 | % | 700,000 | November 15, 2020 | ||||||||||||||||||||
10 Year Unsecured Senior Notes | 4.125 | % | 4.289 | % | 850,000 | May 15, 2021 | 4.125 | % | 4.289 | % | 850,000 | May 15, 2021 | ||||||||||||||||||||
7 Year Unsecured Senior Notes | 3.700 | % | 3.853 | % | 850,000 | November 15, 2018 | ||||||||||||||||||||||||||
11 Year Unsecured Senior Notes | 3.850 | % | 3.954 | % | 1,000,000 | February 1, 2023 | ||||||||||||||||||||||||||
| ||||||||||||||||||||||||||||||||
Total principal | 3,025,000 | 4,650,000 | ||||||||||||||||||||||||||||||
Net discount | (8,402 | ) | ||||||||||||||||||||||||||||||
Net unamortized discount | (10,472 | ) | ||||||||||||||||||||||||||||||
| ||||||||||||||||||||||||||||||||
Total | $ | 3,016,598 | $ | 4,639,528 | ||||||||||||||||||||||||||||
| ||||||||||||||||||||||||||||||||
| (1) | Yield on issuance date including the effects of discounts on the notes. |
| (2) | No principal amounts are due prior to maturity. |
On April 19, 2010, our Operating Partnership completed a public offering of $700.0 million in aggregate principal amount of its 5.625% senior notes due 2020. The notes were priced at 99.891% of the principal amount to yield 5.708% to maturity. The aggregate net proceeds to our Operating Partnership, after deducting underwriter discounts and offering expenses, were approximately $693.5 million. The notes mature on November 15, 2020, unless earlier redeemed. On April 7, 2010, in connection with the offering, we entered into two treasury lock agreements to fix the 10-year U.S Treasury rate (which was used as a reference security in pricing) at 3.873% per annum on notional amounts aggregating $350.0 million. We subsequently cash-settled the treasury lock agreements and received approximately $0.4 million, which amount will be recognized as a reduction to our interest expense over the term of the notes.
On November 18, 2010, our Operating Partnership completed a public offering of $850.0 million in aggregate principal amount of its 4.125% senior notes due 2021. The notes were priced at 99.26% of the principal amount to yield 4.289% to maturity. The aggregate net proceeds to our Operating Partnership, after deducting underwriter discounts and offering expenses, were approximately $836.9 million. The notes mature on May 15, 2021, unless earlier redeemed.
On December 12, 2010, our Operating Partnership completed the redemption of $700.0 million in aggregate principal amount of its 6.25% senior notes due 2013. The redemption price was determined in accordance with the applicable indenture and was approximately $793.1 million. The redemption price included approximately $17.9 million of accrued and unpaid interest to, but not including, the redemption date. Excluding such accrued and unpaid interest, the redemption price was approximately 110.75% of the principal amount being redeemed. In addition, on November 29, 2010, we entered into two treasury lock agreements to fix the yield on the U.S. Treasury issue used in determining the redemption price on notional amounts aggregating $700.0 million. On December 9, 2010, we cash-settled the treasury lock agreements and paid approximately $2.1 million. As a result of the payment of the redemption premium, the settlement of the treasury locks and the write-off of deferred financing costs, we recognized an aggregate loss on early extinguishment of debt of approximately $79.3 million. Following the partial redemption, there is an aggregate of $225.0 million of these notes outstanding.
Our unsecured senior notes are redeemable at our option, in whole or in part, at a redemption price equal to the greater of (i)(1) 100% of their principal amount or (ii)(2) the sum of the present value of the remaining scheduled payments of principal and interest discounted at a rate equal to the yield on U.S. Treasury securities with a comparable maturity plus 35 basis points (or 25 basis points in the case of the $250 million of notes that mature on June 1, 2015, 40 basis points in the case of the $700 million of notes that mature on October 15, 2019 and 30 basis points in the case of the $700 million and $850 million of notes that mature on November 15, 2020 and May 15, 2021, respectively), in each case plus accrued and unpaid interest to the redemption date. The indenturesindenture under which our unsecured senior notes were issued containcontains restrictions on incurring debt and using our assets as security in other financing transactions and other customary financial and other covenants, including (1) a leverage ratio not to exceed 60%, (2) a secured debt leverage ratio not to exceed 50%, (3) an interest coverage ratio of greater than 1.50, and (4) unencumbered asset value to be no less than 150% of our unsecured debt. As of December 31, 2010,2012, we believe we were in compliance with each of these financial restrictions and requirements.
Unsecured Exchangeable Senior Notes
The following summarizes the unsecured exchangeable senior notes outstanding as of December 31, 20102012 (dollars in thousands):
| Coupon/ Stated Rate | Effective Rate(1) | Exchange Rate | Principal Amount | First Optional Redemption Date by BPLP | Maturity Date | Coupon/ Stated Rate | Effective Rate(1) | Exchange Rate | Principal Amount | First Optional Redemption Date by Company | Maturity Date | |||||||||||||||||||||||||||||
3.625% Exchangeable Senior Notes | 3.625 | % | 4.037 | % | 8.5051 | (2) | $ | 747,500 | N/A | February 15, 2014 | 3.625 | % | 4.037 | % | 8.5051 | (2) | $ | 747,500 | N/A | February 15, 2014 | ||||||||||||||||||||
2.875% Exchangeable Senior Notes | 2.875 | % | 3.462 | % | 7.0430 | (3) | 626,194 | February 20, 2012(4) | February 15, 2037 | |||||||||||||||||||||||||||||||
3.750% Exchangeable Senior Notes | 3.750 | % | 3.787 | % | 10.0066 | (5) | 450,000 | May 18, 2013(6) | May 15, 2036 | 3.750 | % | 3.787 | % | 10.0066 | (3) | 450,000 | May 18, 2013(4) | May 15, 2036 | ||||||||||||||||||||||
Total principal | 1,823,694 | 1,197,500 | ||||||||||||||||||||||||||||||||||||||
Net discount | (8,249 | ) | ||||||||||||||||||||||||||||||||||||||
Net unamortized discount | (1,653 | ) | ||||||||||||||||||||||||||||||||||||||
Adjustment for the equity component allocation, net of accumulated amortization | (93,628 | ) | (25,491 | ) | ||||||||||||||||||||||||||||||||||||
| ||||||||||||||||||||||||||||||||||||||||
Total | $ | 1,721,817 | $ | 1,170,356 | ||||||||||||||||||||||||||||||||||||
| ||||||||||||||||||||||||||||||||||||||||
| (1) | Yield on issuance date including the effects of discounts on the notes but excluding the effects of the adjustment for the equity component allocation. |
| (2) | The initial exchange rate is 8.5051 shares per $1,000 principal amount of the notes (or an initial exchange price of approximately $117.58 per share of our common stock). In addition, we entered into capped call transactions with affiliates of certain of the initial purchasers, which are intended to reduce the potential dilution upon future exchange of the notes. The capped call transactions |
| (3) |
| In connection with the special dividend of $5.98 per share of common stock declared on December 17, 2007, the exchange rate was adjusted from 9.3900 to 10.0066 shares per $1,000 principal amount of notes effective as of December 31, 2007, resulting in an exchange price of approximately $99.93 per share of our common stock. |
| Holders may require our Operating Partnership to repurchase the notes for cash on May 18, 2013 and on May 15 of 2016, 2021, 2026 and 2031 and at any time prior to their maturity upon a fundamental change, in each case at a price equal to 100% of the principal amount of the notes being repurchased plus any accrued and unpaid interest up to, but excluding, the repurchase date. |
During the year ended December 31, 2010, our Operating Partnership repurchased approximately $236.3 million aggregate principal amount of its 2.875% exchangeable senior notes due 2037, which the holders may require our Operating Partnership to repurchase in February 2012, for approximately $236.6 million. The repurchased notes had an aggregate allocated liability and equity value of approximately $225.7 million and $0.4 million, respectively, at the time of repurchase resulting in the recognition of a loss on early extinguishment of debt of approximately $10.5 million during the year ended December 31, 2010. There remains an aggregate of approximately $626.2 million of these notes outstanding.
Mortgage DebtNotes Payable
The following represents the outstanding principal balances due under the mortgage notes payable at December 31, 2010:2012:
Properties | Stated Interest Rate | GAAP Interest Rate(1) | Stated Principal Amount | Historical Fair Value Adjustment | Carrying Amount | Maturity Date | Stated Interest Rate | GAAP Interest Rate(1) | Stated Principal Amount | Historical Fair Value Adjustment | Carrying Amount | Maturity Date | ||||||||||||||||||||||||||||||||
| (Dollars in thousands) | (Dollars in thousands) | |||||||||||||||||||||||||||||||||||||||||||
599 Lexington Avenue | 5.57 | % | 5.41 | % | $ | 750,000 | $ | — | $ | 750,000 | (2)(3) | March 1, 2017 | 5.57 | % | 5.41 | % | $ | 750,000 | $ | — | $ | 750,000 | (2)(3) | March 1, 2017 | ||||||||||||||||||||
601 Lexington Avenue | 4.75 | % | 4.79 | % | 725,000 | — | 725,000 | April 10, 2022 | ||||||||||||||||||||||||||||||||||||
John Hancock Tower | 5.68 | % | 5.05 | % | 640,500 | 22,826 | 663,326 | (1)(3) | January 6, 2017 | 5.68 | % | 5.05 | % | 640,500 | 16,072 | 656,572 | (1)(3)(4) | January 6, 2017 | ||||||||||||||||||||||||||
601 Lexington Avenue | 7.19 | % | 7.24 | % | 456,633 | 265 | 456,898 | (1) | May 11, 2011 | |||||||||||||||||||||||||||||||||||
Embarcadero Center Four | 6.10 | % | 7.02 | % | 374,634 | — | 374,634 | (4) | December 1, 2016 | 6.10 | % | 7.02 | % | 365,263 | — | 365,263 | (5) | December 1, 2016 | ||||||||||||||||||||||||||
510 Madison Avenue | 0.56 | % | 0.64 | % | 267,500 | — | 267,500 | (3)(5) | February 24, 2012 | |||||||||||||||||||||||||||||||||||
Fountain Square | 5.71 | % | 2.56 | % | 211,250 | 21,666 | 232,916 | (1)(3)(6) | October 11, 2016 | |||||||||||||||||||||||||||||||||||
505 9th Street | 5.73 | % | 5.87 | % | 127,901 | — | 127,901 | (6) | November 1, 2017 | 5.73 | % | 5.87 | % | 123,666 | — | 123,666 | (6) | November 1, 2017 | ||||||||||||||||||||||||||
One Freedom Square | 7.75 | % | 5.34 | % | 67,031 | 1,721 | 68,752 | (1)(7) | June 30, 2012 | |||||||||||||||||||||||||||||||||||
New Dominion Tech Park, Bldg. Two | 5.55 | % | 5.58 | % | 63,000 | — | 63,000 | (3) | October 1, 2014 | 5.55 | % | 5.58 | % | 63,000 | — | 63,000 | (3) | October 1, 2014 | ||||||||||||||||||||||||||
140 Kendrick Street | 7.51 | % | 5.25 | % | 50,093 | 2,027 | 52,120 | (1) | July 1, 2013 | 7.51 | % | 5.25 | % | 47,888 | 470 | 48,358 | (1) | July 1, 2013 | ||||||||||||||||||||||||||
Reservoir Place | 2.46 | % | 2.83 | % | 50,000 | — | 50,000 | (8) | July 30, 2014 | |||||||||||||||||||||||||||||||||||
New Dominion Tech. Park, Bldg. One | 7.69 | % | 7.84 | % | 49,252 | — | 49,252 | January 15, 2021 | ||||||||||||||||||||||||||||||||||||
New Dominion Tech Park, Bldg. One | 7.69 | % | 7.84 | % | 45,418 | — | 45,418 | January 15, 2021 | ||||||||||||||||||||||||||||||||||||
Kingstowne Two and Retail | 5.99 | % | 5.61 | % | 37,959 | 679 | 38,638 | (1) | January 1, 2016 | 5.99 | % | 5.61 | % | 34,794 | 410 | 35,204 | (1) | January 1, 2016 | ||||||||||||||||||||||||||
Montvale Center | 5.93 | % | 6.07 | % | 25,000 | — | 25,000 | (3)(9) | June 6, 2012 | 9.93 | % | 10.07 | % | 25,000 | — | 25,000 | (7) | |||||||||||||||||||||||||||
Sumner Square | 7.35 | % | 7.54 | % | 24,692 | — | 24,692 | September 1, 2013 | ||||||||||||||||||||||||||||||||||||
Kingstowne One | 5.96 | % | 5.68 | % | 18,336 | 178 | 18,514 | (1) | May 5, 2013 | 5.96 | % | 5.68 | % | 17,062 | 26 | 17,088 | (1)(8) | May 5, 2013 | ||||||||||||||||||||||||||
University Place | 6.94 | % | 6.99 | % | 17,359 | — | 17,359 | August 1, 2021 | 6.94 | % | 6.99 | % | 15,000 | — | 15,000 | August 1, 2021 | ||||||||||||||||||||||||||||
Atlantic Wharf | N/A | N/A | — | — | — | (10) | April 21, 2012 | |||||||||||||||||||||||||||||||||||||
|
|
| ||||||||||||||||||||||||||||||||||||||||||
Total | $ | 3,019,890 | $ | 27,696 | $ | 3,047,586 | $ | 3,063,841 | $ | 38,644 | $ | 3,102,485 | ||||||||||||||||||||||||||||||||
|
|
| ||||||||||||||||||||||||||||||||||||||||||
| (1) | GAAP interest rate differs from the stated interest rate due to the inclusion of the amortization of financing charges, effects of hedging transactions and adjustments required to reflect loans at their fair values upon acquisition. All adjustments to reflect loans at their fair value upon acquisition are noted above. |
| (2) | On December 19, 2006, we terminated the forward-starting interest rate swap contracts related to this financing and received approximately $10.9 million, which amount |
| (3) | The mortgage loan requires interest only payments with a balloon payment due at maturity. |
| (4) | In connection with the mortgage financing we have agreed to guarantee approximately $0.8 million related to our obligation to provide funds for certain tenant re-leasing costs. |
| (5) | On November 13, 2008, we closed on an eight-year, $375.0 million mortgage loan collateralized by this property. The mortgage loan bears interest at a fixed rate of 6.10% per annum. Under our interest rate hedging program, we |
| (6) | This property is owned by a consolidated joint venture in which we have a 50% interest. |
| (7) |
| The |
Contractual aggregate principal payments of mortgage notes payable at December 31, 20102012 are as follows:
Year | Principal Payments | Principal Payments | ||||||
| (in thousands) | (in thousands) | |||||||
2011 | $ | 471,818 | ||||||
2012 | 372,929 | |||||||
2013 | 101,289 | $ | 105,313 | |||||
2014 | 125,264 | 87,757 | ||||||
2015 | 14,312 | 26,182 | ||||||
2016 | 608,879 | |||||||
2017 | 1,521,750 | |||||||
Thereafter | 1,934,278 | 713,960 | ||||||
Market Risk
Market risk is the risk of loss from adverse changes in market prices and interest rates. Our future earnings, cash flows and fair values relevant to financial instruments are dependent upon prevalent market interest rates. Our primary market risk results from our indebtedness, which bears interest at fixed and variable rates. The fair value of our debt obligations are affected by changes in the market interest rates. We manage our market risk by matching long-term leases with long-term, fixed-rate, non-recourse debt of similar duration. We continue to follow a conservative strategy of generally pre-leasing development projects on a long-term basis to creditworthy tenants in order to achieve the most favorable construction and permanent financing terms. Approximately 96%100% of our outstanding debt has fixed interest rates, which minimizes the interest rate risk through the maturity of such outstanding debt. We also manage our market risk by entering into hedging arrangements with financial institutions. Our primary objectives when undertaking hedging transactions and derivative positions is to reduce our floating rate exposure and to fix a portion of the interest rate for anticipated financing and refinancing transactions. This in turn, reduces the risks that the variability of cash flows imposes on variable rate debt. Our strategy mitigates us against future increases in our interest rates.
At December 31, 2010, our outstanding variable rate debt based on LIBOR totaled approximately $317.5 million. At December 31, 2010, the interest rate on our variable rate debt was approximately 0.99% per annum. If market interest rates on our variable rate debt had been 100 basis points greater, total interest expense would have increased approximately $3.2 million for the year ended December 31, 2010.
At December 31, 20102012 our weighted-average coupon/stated rate on all of our outstanding debt, all of which had a fixed andinterest rate, was 4.89% per annum. At December 31, 2012 we had no outstanding variable rate debt was 5.25% and 0.86%, respectively.debt. The weighted-average coupon/stated rate for our senior notes and unsecured exchangeable debt was 5.30%4.66% and 3.67%3.80%, respectively.
Funds from Operations
Pursuant to the revised definition of Funds from Operations adopted by the Board of Governors of NAREIT, we calculate Funds from Operations, or “FFO,”FFO, by adjusting net income (loss) attributable to Boston Properties, Inc. (computed in accordance with GAAP, including non-recurring items) for gains (or losses) from sales of properties, impairment losses on depreciable real estate of consolidated real estate, impairment losses on investments in unconsolidated joint ventures driven by a measurable decrease in the fair value of depreciable real estate held by the unconsolidated joint ventures, real estate related depreciation and amortization, and after adjustment for unconsolidated partnerships, joint ventures and preferred distributions. FFO is a non-GAAP financial measure. The use of FFO, combined with the required primary GAAP presentations, has been fundamentally beneficial in improving the understanding of operating results of REITs among the investing public and making comparisons of REIT operating results more meaningful. Management generally considers FFO to be a useful measure for reviewing our comparative operating and financial performance because, by excluding gains and losses related to sales of previously depreciated operating real estate assets, impairment losses on depreciable real estate of consolidated real estate, impairment losses on investments in unconsolidated joint ventures driven by a measurable decrease in the fair value of depreciable real estate held by the unconsolidated joint ventures and excluding real estate asset depreciation and amortization (which can vary among owners of identical assets in similar condition based on historical cost accounting and useful life estimates), FFO can help one compare the operating performance of a company’s real estate between periods or as compared to different companies. Our computation of FFO may not be comparable to FFO reported by other REITs or real estate companies that do not define the term in accordance with the current NAREIT definition or
definition or that interpret the current NAREIT definition differently. Amount represents our share, which was 89.48%, 88.57%, 87.25%, 86.57%, and 85.49%, 85.32% and 84.40% for the years ended December 31, 2012, 2011, 2010, 2009 2008, 2007 and 2006,2008, respectively, after allocation to the noncontrolling interests in the Operating Partnership.
In addition to presenting FFO in accordance with the NAREIT definition, we also disclose FFO, as adjusted, which excludes the effects of the losses from early extinguishments of debt associated with the sales of real estate. Losses from early extinguishments of debt result when the sale of real estate encumbered by debt requires us to pay the extinguishment costs prior to the debt’s stated maturity and to write-off unamortized loan costs at the date of the extinguishment. Such costs are excluded from the gains on sales of real estate reported in accordance with GAAP. However, we view the losses from early extinguishments of debt associated with the sales of real estate as an incremental cost of the sale transactions because we extinguished the debt in connection with the consummation of the sale transactions and we had no intent to extinguish the debt absent such transactions. We believe that adjusting FFO to exclude these losses more appropriately reflects the results of our operations exclusive of the impact of our sale transactions.
Although our FFO, as adjusted, clearly differs from NAREIT’s definition of FFO, and mayshould not be comparable to that of other REITs and real estate companies, we believe it provides a meaningful supplemental measure of our operating performance because we believe that by excluding the effects of the losses from early extinguishments of debt associated with the sales of real estate, management and investors are presented with an indicator of our operating performance that more closely achieves the objectives of the real estate industry in presenting FFO.
Neither FFO, nor FFO, as adjusted, should be considered as an alternative to net income attributable to Boston Properties, Inc. (determined in accordance with GAAP) as an indication of our performance. Neither FFO nor FFO, as adjusted,does not represent cash generated from operating activities determined in accordance with GAAP and neither of these measures is not a measure of liquidity or an indicator of our ability to make cash distributions. We believe that to further understand our performance, FFO and FFO, as adjusted, should be compared with our reported net income attributable to Boston Properties, Inc. and considered in addition to cash flows in accordance with GAAP, as presented in our Consolidated Financial Statements.
The following table presents a reconciliation of net income attributable to Boston Properties, Inc. to FFO and FFO, as adjusted, for the years ended December 31, 2012, 2011, 2010, 2009 2008, 2007 and 2006:2008:
| Year ended December 31, | Year ended December 31, | |||||||||||||||||||||||||||||||||||||||
| 2010 | 2009 | 2008 | 2007 | 2006 | 2012 | 2011 | 2010 | 2009 | 2008 | |||||||||||||||||||||||||||||||
| (in thousands) | (in thousands) | |||||||||||||||||||||||||||||||||||||||
Net income attributable to Boston Properties, Inc. | $ | 159,072 | $ | 231,014 | $ | 105,270 | $ | 1,310,106 | $ | 870,291 | $ | 289,650 | $ | 272,679 | $ | 159,072 | $ | 231,014 | $ | 105,270 | ||||||||||||||||||||
Add: | ||||||||||||||||||||||||||||||||||||||||
Noncontrolling interest in gains on sales of real estate—common units of the Operating Partnership | 349 | 1,579 | 4,838 | 140,547 | 113,432 | — | — | 349 | 1,579 | 4,838 | ||||||||||||||||||||||||||||||
Noncontrolling interest in discontinued operations—common units of the Operating Partnership | — | — | — | 40,237 | 2,977 | 4,154 | 215 | 184 | 175 | (70 | ) | |||||||||||||||||||||||||||||
Noncontrolling interest—common units of the Operating Partnership | 24,099 | 35,534 | 14,392 | 51,978 | 46,568 | 31,046 | 36,035 | 23,915 | 35,359 | 14,462 | ||||||||||||||||||||||||||||||
Noncontrolling interest—redeemable preferred units of the Operating Partnership | 3,343 | 3,594 | 4,226 | 10,429 | 22,814 | 3,497 | 3,339 | 3,343 | 3,594 | 4,226 | ||||||||||||||||||||||||||||||
Noncontrolling interests in property partnerships | 3,464 | 2,778 | 1,997 | 84 | (2,013 | ) | 3,792 | 1,558 | 3,464 | 2,778 | 1,997 | |||||||||||||||||||||||||||||
Less: | ||||||||||||||||||||||||||||||||||||||||
Gains on sales of real estate from discontinued operations | — | — | — | 259,519 | — | 36,877 | — | — | — | — | ||||||||||||||||||||||||||||||
Income from discontinued operations | — | — | — | 7,274 | 19,081 | |||||||||||||||||||||||||||||||||||
Income (loss) from discontinued operations | 1,040 | 1,881 | 1,442 | 1,305 | (483 | ) | ||||||||||||||||||||||||||||||||||
Gains on sales of real estate | 2,734 | 11,760 | 33,340 | 929,785 | 719,826 | — | — | 2,734 | 11,760 | 33,340 | ||||||||||||||||||||||||||||||
|
|
|
|
| ||||||||||||||||||||||||||||||||||||
Income from continuing operations | 187,593 | 262,739 | 97,383 | 356,803 | 315,162 | 294,222 | 311,945 | 186,151 | 261,434 | 97,866 | ||||||||||||||||||||||||||||||
Add: | ||||||||||||||||||||||||||||||||||||||||
Real estate depreciation and amortization(1) | 450,546 | 446,718 | 382,600 | 295,635 | 283,350 | |||||||||||||||||||||||||||||||||||
Income from discontinued operations | — | — | — | 7,274 | 19,081 | |||||||||||||||||||||||||||||||||||
Real estate depreciation and amortization (1) | 542,753 | 541,791 | 450,546 | 446,718 | 382,600 | |||||||||||||||||||||||||||||||||||
Impairment losses on investments in unconsolidated joint ventures driven by a measurable decrease in the fair value of depreciable real estate held by the unconsolidated joint ventures (2) | — | — | — | 13,555 | 165,158 | |||||||||||||||||||||||||||||||||||
Income (loss) from discontinued operations | 1,040 | 1,881 | 1,442 | 1,305 | (483 | ) | ||||||||||||||||||||||||||||||||||
Less: | ||||||||||||||||||||||||||||||||||||||||
Gains on sales of real estate included within income (loss) from unconsolidated joint ventures(2) | 572 | — | — | 15,453 | 17,917 | |||||||||||||||||||||||||||||||||||
Gains on sales of real estate included within income (loss) from unconsolidated joint ventures (3) | 248 | 46,166 | 572 | — | — | |||||||||||||||||||||||||||||||||||
Noncontrolling interests in property partnerships’ share of Funds from Operations | 6,862 | 5,513 | 3,949 | 437 | 479 | 5,684 | 3,412 | 6,862 | 5,513 | 3,949 | ||||||||||||||||||||||||||||||
Noncontrolling interest—redeemable preferred units of the Operating Partnership(3) | 3,343 | 3,594 | 3,738 | 4,266 | 9,418 | |||||||||||||||||||||||||||||||||||
Noncontrolling interest—redeemable preferred units of the Operating Partnership | 3,497 | 3,339 | 3,343 | 3,594 | 3,738 | |||||||||||||||||||||||||||||||||||
|
|
|
|
| ||||||||||||||||||||||||||||||||||||
Funds from Operations attributable to the Operating Partnership | 627,362 | 700,350 | 472,296 | 639,556 | 589,779 | 828,586 | 802,700 | 627,362 | 713,905 | 637,454 | ||||||||||||||||||||||||||||||
Less: | ||||||||||||||||||||||||||||||||||||||||
Noncontrolling interest—common units of the Operating Partnership’s share of Funds from Operations | 80,006 | 94,078 | 68,508 | 93,906 | 91,997 | 87,167 | 91,709 | 80,006 | 95,899 | 92,465 | ||||||||||||||||||||||||||||||
|
|
|
|
| ||||||||||||||||||||||||||||||||||||
Funds from Operations attributable to Boston Properties, Inc. | $ | 547,356 | $ | 606,272 | $ | 403,788 | $ | 545,650 | $ | 497,782 | $ | 741,419 | $ | 710,991 | $ | 547,356 | $ | 618,006 | $ | 544,989 | ||||||||||||||||||||
Add: | ||||||||||||||||||||||||||||||||||||||||
Losses from early extinguishments of debt associated with the sales of real estate | — | — | — | 2,675 | 31,444 | |||||||||||||||||||||||||||||||||||
Less: | ||||||||||||||||||||||||||||||||||||||||
Noncontrolling interest—common units of the Operating Partnership’s share of losses from early extinguishments of debt associated with the sales of real estate | — | — | — | 392 | 4,905 | |||||||||||||||||||||||||||||||||||
Funds from Operations attributable to Boston Properties, Inc. after supplemental adjustment to exclude losses from early extinguishments of debt associated with the sales of real estate | $ | 547,356 | $ | 606,272 | $ | 403,788 | $ | 547,933 | $ | 524,321 | ||||||||||||||||||||||||||||||
|
|
|
|
| ||||||||||||||||||||||||||||||||||||
Our percentage share of Funds from Operations—basic | 87.25 | % | 86.57 | % | 85.49 | % | 85.32 | % | 84.40 | % | 89.48 | % | 88.57 | % | 87.25 | % | 86.57 | % | 85.49 | % | ||||||||||||||||||||
Weighted average shares outstanding—basic | 139,440 | 131,050 | 119,980 | 118,839 | 114,721 | 150,120 | 145,693 | 139,440 | 131,050 | 119,980 | ||||||||||||||||||||||||||||||
|
|
|
|
| ||||||||||||||||||||||||||||||||||||
| (1) | Real estate depreciation and amortization consists of depreciation and amortization from the Consolidated Statements of Operations of |
| (2) | Consists of non-cash impairment losses on the Company’s investment in its Value-Added Fund totaling approximately $13.6 million for the year ended December 31, 2009. Consists of non-cash impairment losses of approximately $31.9 million, $74.3 million, $45.1 million and |
| Consists of approximately $0.2 million related to the gain on sale of real estate associated with the sale of 300 Billerica Road for the year ended December 31, 2012. Consists of approximately $46.2 million related to the gain on sale of real estate associated with the sale of Two Grand Central Tower for the year ended December 31, 2011. Consists of approximately $0.6 million related to our share of the gain on sale associated with the sale of our 5.0% equity interest in the unconsolidated joint venture entity that owns the retail portion of the Wisconsin Place mixed-use property for the year ended December 31, 2010. |
Reconciliation to Diluted Funds from Operations:
| For the years ended December 31, | ||||||||||||||||||||||||||||||||||||||||
| 2010 | 2009 | 2008 | 2007 | 2006 | ||||||||||||||||||||||||||||||||||||
Income (Numerator) | Shares/Units (Denominator) | Income (Numerator) | Shares/Units (Denominator) | Income (Numerator) | Shares/Units (Denominator) | Income (Numerator) | Shares/Units (Denominator) | Income (Numerator) | Shares/Units (Denominator) | |||||||||||||||||||||||||||||||
Basic Funds from Operations after supplemental adjustment to exclude losses from early extinguishments of debt associated with the sales of real estate | $ | 627,362 | 159,821 | $ | 700,350 | 151,386 | $ | 472,296 | 140,336 | $ | 642,231 | 139,290 | $ | 621,223 | 135,923 | |||||||||||||||||||||||||
Effect of Dilutive Securities: | ||||||||||||||||||||||||||||||||||||||||
Convertible Preferred Units(1) | 3,343 | 1,461 | 3,594 | 1,461 | 3,738 | 1,461 | 4,266 | 1,674 | 9,418 | 3,629 | ||||||||||||||||||||||||||||||
Stock Options and other | — | 618 | — | 462 | — | 1,319 | — | 1,941 | — | 2,356 | ||||||||||||||||||||||||||||||
Diluted Funds from Operations after supplemental adjustment to exclude losses from early extinguishments of debt associated with the sales of real estate | $ | 630,705 | 161,900 | $ | 703,944 | 153,309 | $ | 476,034 | 143,116 | $ | 646,497 | 142,905 | $ | 630,641 | 141,908 | |||||||||||||||||||||||||
Less: Noncontrolling interest—common units of the Operating Partnership’s share of diluted Funds from Operations | 79,400 | 20,382 | 93,376 | 20,336 | 67,710 | 20,357 | 92,523 | 20,451 | 94,222 | 21,202 | ||||||||||||||||||||||||||||||
Diluted Funds from Operations attributable to Boston Properties, Inc. after supplemental adjustment to exclude losses from early extinguishments of debt associated with the sales of real estate(2) | $ | 551,305 | 141,518 | $ | 610,568 | 132,973 | $ | 408,324 | 122,759 | $ | 553,974 | 122,454 | $ | 536,419 | 120,706 | |||||||||||||||||||||||||
| For the years ended December 31, | ||||||||||||||||||||||||||||||||||||||||
| 2012 | 2011 | 2010 | 2009 | 2008 | ||||||||||||||||||||||||||||||||||||
Income (Numerator) | Shares/Units (Denominator) | Income (Numerator) | Shares/Units (Denominator) | Income (Numerator) | Shares/Units (Denominator) | Income (Numerator) | Shares/Units (Denominator) | Income (Numerator) | Shares/Units (Denominator) | |||||||||||||||||||||||||||||||
Basic Funds from Operations | $ | 828,586 | 167,769 | $ | 802,700 | 164,486 | $ | 627,362 | 159,821 | $ | 713,905 | 151,386 | $ | 637,454 | 140,336 | |||||||||||||||||||||||||
Effect of Dilutive Securities: | ||||||||||||||||||||||||||||||||||||||||
Convertible Preferred Units | 3,079 | 1,345 | 3,339 | 1,461 | 3,343 | 1,461 | 3,594 | 1,461 | 3,738 | 1,461 | ||||||||||||||||||||||||||||||
Stock based compensation and exchangeable senior notes | — | 591 | — | 525 | — | 618 | — | 462 | — | 1,319 | ||||||||||||||||||||||||||||||
|
|
|
|
|
|
|
|
|
|
|
|
|
|
|
|
|
|
|
| |||||||||||||||||||||
Diluted Funds from Operations | $ | 831,665 | 169,705 | $ | 806,039 | 166,472 | $ | 630,705 | 161,900 | $ | 717,499 | 153,309 | $ | 641,192 | 143,116 | |||||||||||||||||||||||||
Less: Noncontrolling interest—common units of the Operating Partnership’s share of diluted Funds from Operations | 86,493 | 17,649 | 90,992 | 18,793 | 79,400 | 20,382 | 95,174 | 20,336 | 91,201 | 20,357 | ||||||||||||||||||||||||||||||
|
|
|
|
|
|
|
|
|
|
|
|
|
|
|
|
|
|
|
| |||||||||||||||||||||
Diluted Funds from Operations attributable to Boston Properties, Inc. (1) | $ | 745,172 | 152,056 | $ | 715,047 | 147,679 | $ | 551,305 | 141,518 | $ | 622,325 | 132,973 | $ | 549,991 | 122,759 | |||||||||||||||||||||||||
|
|
|
|
|
|
|
|
|
|
|
|
|
|
|
|
|
|
|
| |||||||||||||||||||||
| (1) |
| Our share of diluted Funds from Operations was 89.60%, 88.71%, 87.41%, 86.74% |
Net Operating Income
Net operating income, or “NOI,” is a non-GAAP financial measure equal to net income attributable to Boston Properties, Inc., the most directly comparable GAAP financial measure, plus net income attributable to noncontrolling interests, losses from early extinguishments of debt, losses (gains) from investments in securities, net derivative losses, loss (gain) from suspension of development, depreciation and amortization, interest expense, acquisitionstransaction costs and general and administrative expense, less gains on sales of real estate from discontinued operations, income from discontinued operations, gains on sales of real estate, income (loss) from unconsolidated joint ventures, interest and other income and development and management services revenue. We use NOI internally as a performance measure and believe NOI provides useful information to investors regarding our financial condition and results of operations because it reflects only those income and expense items that are incurred at the property level. Therefore, we believe NOI is a useful measure for evaluating the operating performance of our real estate assets.
Our management also uses NOI to evaluate regional property level performance and to make decisions about resource allocations. Further, we believe NOI is useful to investors as a performance measure because, when compared across periods, NOI reflects the impact on operations from trends in occupancy rates, rental rates, operating costs and acquisition and development activity on an unleveraged basis, providing perspective not immediately apparent from net income attributable to Boston Properties, Inc. NOI excludes certain components from net income attributable to Boston Properties, Inc. in order to provide results that are more closely related to our properties’ results of operations. For example, interest expense is not necessarily linked to the operating performance of a real estate asset and is often incurred at the corporate level as opposed to the property level. In addition, depreciation and amortization, because of historical cost accounting and useful life estimates, may distort operating performance at the property level. NOI presented by us may not be comparable to NOI reported by other REITs and real estate companies that define NOI differently. We believe that in order to facilitate a clear understanding of our operating results, NOI should be examined in conjunction with net income attributable to Boston Properties, Inc. as presented in our Consolidated Financial Statements. NOI should not be considered as an alternative to net income attributable to Boston Properties, Inc. as an indication of our performance or to cash flows as a measure of liquidity or ability to make distributions.
The following sets forth a reconciliation of NOI to net income attributable to Boston Properties, Inc. for the fiscal years 20062008 through 2010.2012.
| Years ended December 31, | Years ended December 31, | |||||||||||||||||||||||||||||||||||||||
| 2010 | 2009 | 2008 | 2007 | 2006 | 2012 | 2011 | 2010 | 2009 | 2008 | |||||||||||||||||||||||||||||||
Net operating income | $ | 982,726 | $ | 957,547 | $ | 923,384 | $ | 888,425 | $ | 898,459 | $ | 1,156,707 | $ | 1,101,543 | $ | 978,788 | $ | 953,747 | $ | 920,360 | ||||||||||||||||||||
Add: | ||||||||||||||||||||||||||||||||||||||||
Development and management services | 41,231 | 34,878 | 30,518 | 20,553 | 19,820 | |||||||||||||||||||||||||||||||||||
Interest and other | 7,332 | 4,059 | 18,958 | 89,706 | 36,677 | |||||||||||||||||||||||||||||||||||
Development and management services income | 34,077 | 33,425 | 41,215 | 34,863 | 30,494 | |||||||||||||||||||||||||||||||||||
Income (loss) from unconsolidated joint ventures | 36,774 | 12,058 | (182,018 | ) | 20,428 | 24,507 | 49,078 | 85,896 | 36,774 | 12,058 | (182,018 | ) | ||||||||||||||||||||||||||||
Interest and other income | 10,091 | 5,358 | 7,332 | 4,059 | 18,958 | |||||||||||||||||||||||||||||||||||
Gains (losses) from investments in securities | 1,389 | (443 | ) | 935 | 2,434 | (4,604 | ) | |||||||||||||||||||||||||||||||||
Gains on sales of real estate | 2,734 | 11,760 | 33,340 | 929,785 | 719,826 | — | — | 2,734 | 11,760 | 33,340 | ||||||||||||||||||||||||||||||
Income from discontinued operations | — | — | — | 7,274 | 19,081 | |||||||||||||||||||||||||||||||||||
Income (loss) from discontinued operations | 1,040 | 1,881 | 1,442 | 1,305 | (483 | ) | ||||||||||||||||||||||||||||||||||
Gains on sales of real estate from discontinued operations | — | — | — | 259,519 | — | 36,877 | — | — | — | — | ||||||||||||||||||||||||||||||
Less: | ||||||||||||||||||||||||||||||||||||||||
General and administrative | 79,658 | 75,447 | 72,365 | 69,882 | 59,375 | 82,382 | 79,610 | 79,396 | 75,447 | 72,365 | ||||||||||||||||||||||||||||||
Acquisition costs | 2,614 | — | — | — | — | |||||||||||||||||||||||||||||||||||
Transactions costs | 3,653 | 1,987 | 2,876 | — | — | |||||||||||||||||||||||||||||||||||
Suspension of development | — | — | (7,200 | ) | 27,766 | — | ||||||||||||||||||||||||||||||||||
Depreciation and amortization | 453,068 | 436,612 | 335,859 | 319,171 | 301,812 | |||||||||||||||||||||||||||||||||||
Interest expense | 378,079 | 322,833 | 295,322 | 302,980 | 302,221 | 413,564 | 394,131 | 378,079 | 322,833 | 294,126 | ||||||||||||||||||||||||||||||
Depreciation and amortization | 338,371 | 321,681 | 304,147 | 286,030 | 270,562 | |||||||||||||||||||||||||||||||||||
Loss (gain) from suspension of development | (7,200 | ) | 27,766 | — | — | — | ||||||||||||||||||||||||||||||||||
Losses from early extinguishments of debt | 4,453 | 1,494 | 89,883 | 510 | — | |||||||||||||||||||||||||||||||||||
Net derivative losses | — | — | 17,021 | — | — | — | — | — | — | 17,021 | ||||||||||||||||||||||||||||||
Losses (gains) from investments in securities | (935 | ) | (2,434 | ) | 4,604 | — | — | |||||||||||||||||||||||||||||||||
Losses from early extinguishments of debt | 89,883 | 510 | — | 3,417 | 32,143 | |||||||||||||||||||||||||||||||||||
Noncontrolling interests in property partnerships | 3,464 | 2,778 | 1,997 | 84 | (2,013 | ) | 3,792 | 1,558 | 3,464 | 2,778 | 1,997 | |||||||||||||||||||||||||||||
Noncontrolling interest—redeemable preferred units of the Operating Partnership | 3,497 | 3,339 | 3,343 | 3,594 | 4,226 | |||||||||||||||||||||||||||||||||||
Noncontrolling interests—common units of the Operating Partnership | 24,099 | 35,534 | 14,392 | 51,978 | 46,568 | 31,046 | 36,035 | 23,915 | 35,359 | 14,462 | ||||||||||||||||||||||||||||||
Noncontrolling interest in gains on sales of real estate and other assets—common units of the Operating Partnership | 349 | 1,579 | 4,838 | 140,547 | 113,432 | — | — | 349 | 1,579 | 4,838 | ||||||||||||||||||||||||||||||
Noncontrolling interest in discontinued operations—common units of the Operating Partnership | — | — | — | 40,237 | 2,977 | 4,154 | 215 | 184 | 175 | (70 | ) | |||||||||||||||||||||||||||||
Noncontrolling interest—redeemable preferred units of the Operating Partnership | 3,343 | 3,594 | 4,226 | 10,429 | 22,814 | |||||||||||||||||||||||||||||||||||
|
|
|
|
| ||||||||||||||||||||||||||||||||||||
Net income attributable to Boston Properties, Inc. | $ | 159,072 | $ | 231,014 | $ | 105,270 | $ | 1,310,106 | $ | 870,291 | $ | 289,650 | $ | 272,679 | $ | 159,072 | $ | 231,014 | $ | 105,270 | ||||||||||||||||||||
|
|
|
|
| ||||||||||||||||||||||||||||||||||||
Contractual Obligations
As of December 31, 2010,2012, we were subject to contractual payment obligations as described in the table below.
| Payments Due by Period | Payments Due by Period | |||||||||||||||||||||||||||||||||||||||||||||||||||||||
| Total | 2011 | 2012 | 2013 | 2014 | 2015 | Thereafter | Total | 2013 | 2014 | 2015 | 2016 | 2017 | Thereafter | |||||||||||||||||||||||||||||||||||||||||||
| (Dollars in thousands) | (Dollars in thousands) | |||||||||||||||||||||||||||||||||||||||||||||||||||||||
Contractual Obligations: | ||||||||||||||||||||||||||||||||||||||||||||||||||||||||
Long-term debt | ||||||||||||||||||||||||||||||||||||||||||||||||||||||||
Mortgage debt(1) | $ | 3,783,251 | $ | 619,654 | $ | 501,388 | $ | 223,032 | $ | 241,328 | $ | 125,847 | $ | 2,072,002 | $ | 3,893,677 | $ | 271,725 | $ | 249,263 | $ | 183,307 | $ | 760,279 | $ | 1,574,181 | $ | 854,922 | ||||||||||||||||||||||||||||
Unsecured senior notes(1) | 4,324,084 | 158,708 | 159,000 | 376,969 | 144,938 | 680,250 | 2,804,219 | 6,207,671 | 214,888 | 214,888 | 750,200 | 185,513 | 185,513 | 4,656,669 | ||||||||||||||||||||||||||||||||||||||||||
Exchangeable senior notes(1)(2) | 1,974,393 | 61,975 | 674,667 | 483,477 | 754,274 | — | — | 1,237,751 | 483,477 | 754,274 | — | — | — | — | ||||||||||||||||||||||||||||||||||||||||||
Unsecured line of credit(1) | — | — | — | — | — | — | — | — | — | — | — | — | — | — | ||||||||||||||||||||||||||||||||||||||||||
Ground leases | 1,006,229 | 12,496 | 12,704 | 12,916 | 13,257 | 13,603 | 941,253 | 980,861 | 12,820 | 13,184 | 13,507 | 13,732 | 13,963 | 913,655 | ||||||||||||||||||||||||||||||||||||||||||
Tenant obligations(3) | 145,557 | 111,366 | 32,617 | 373 | 1,201 | — | — | 159,704 | 106,021 | 33,284 | 16,560 | 2,763 | 1,059 | 17 | ||||||||||||||||||||||||||||||||||||||||||
Construction contracts on development projects | 376,143 | 262,638 | 90,749 | 22,756 | �� | — | — | — | 720,560 | 380,285 | 204,296 | 109,479 | 25,091 | 1,409 | — | |||||||||||||||||||||||||||||||||||||||||
Other Obligations | 1,489 | 516 | 116 | 116 | 116 | 116 | 509 | |||||||||||||||||||||||||||||||||||||||||||||||||
Other obligations | 2,294 | 473 | 73 | 73 | 1,363 | 73 | 239 | |||||||||||||||||||||||||||||||||||||||||||||||||
|
|
|
|
|
|
| ||||||||||||||||||||||||||||||||||||||||||||||||||
Total Contractual Obligations | $ | 11,611,146 | $ | 1,227,353 | $ | 1,471,241 | $ | 1,119,639 | $ | 1,155,114 | $ | 819,816 | $ | 5,817,983 | $ | 13,202,518 | $ | 1,469,689 | $ | 1,469,262 | $ | 1,073,126 | $ | 988,741 | $ | 1,776,198 | $ | 6,425,502 | ||||||||||||||||||||||||||||
|
|
|
|
|
|
| ||||||||||||||||||||||||||||||||||||||||||||||||||
| (1) | Amounts include principal and interest payments. |
| (2) | Amounts for the 3.750% exchangeable senior notes due 2036 are included in 2013, which is the year in which the first optional redemption date |
| (3) | Committed tenant-related obligations based on executed leases as of December 31, |
We have various standing or renewable service contracts with vendors related to our property management. In addition, we have certain other utility contracts we enter into in the ordinary course of business that may extend beyond one year and that vary based on usage. These contracts are not included as part of our contractual obligations because they include terms that provide for cancellation with insignificant or no cancellation penalties. Contract terms are generally one year or less.
During 2012, we paid approximately $216 million to fund tenant-related obligations, including tenant improvements and leasing commissions, and incurred approximately $260 million of new tenant-related obligations associated with approximately 4.9 million square feet of second generation leases, or approximately $53 per square foot. In addition, we signed leases for approximately 631,000 square feet at our development properties. The tenant-related obligations for the development properties are included within the projects’ “Estimated Total Investment” referred to in “Item 7—Management’s Discussion and Analysis of Financial Condition and Results of Operations—Liquidity and Capital Resources.” In the aggregate, during 2012, we signed leases for approximately 5.5 million square feet of space and incurred aggregate tenant-related obligations of approximately $289 million, or approximately $52 per square foot.
Off-Balance Sheet Arrangements—Joint Venture Indebtedness
We have investments in twelvethirteen unconsolidated joint ventures (including our investment in the Value-Added Fund) with our effective ownership interests ranging from 25% to 60%. TenNine of these joint ventures have mortgage indebtedness. We exercise significant influence over, but do not control, these entities and therefore they are presently accounted for using the equity method of accounting. See also Note 5 to the Consolidated Financial Statements. At December 31, 2010,2012, the aggregate carrying amount of debt, including both our and our partners’ share, incurred by these ventures was approximately $3.2 billion.$3.0 billion (of which our proportionate share is approximately $1.4 billion). The table below summarizes the outstanding debt of these joint venture properties at December 31, 2010.2012. In addition to other guarantees specifically noted in the table, we have agreed to customary environmental indemnifications and nonrecourse carve-outs (e.g., guarantees against fraud, misrepresentation and bankruptcy) on certain of the loans.
Properties | Venture Ownership % | Stated Interest Rate | GAAP Interest Rate(1) | Stated Principal Amount | Historical Fair Value Adjustment | Carrying Amount | Maturity Date | Venture Ownership % | Stated Interest Rate | GAAP Interest Rate(1) | Stated Principal Amount | Historical Fair Value Adjustment | Carrying Amount | Maturity Date | ||||||||||||||||||||||||||||||||||||||||||
| (Dollars in thousands) | (Dollars in thousands) | |||||||||||||||||||||||||||||||||||||||||||||||||||||||
General Motors Building: | ||||||||||||||||||||||||||||||||||||||||||||||||||||||||
Secured 1st Mortgage | 60 | % | 5.95 | % | 6.50 | % | $ | 1,300,000 | $ | (44,072 | ) | $ | 1,255,928 | (1)(2)(3) | October 7, 2017 | |||||||||||||||||||||||||||||||||||||||||
767 Fifth Avenue (The GM Building): | ||||||||||||||||||||||||||||||||||||||||||||||||||||||||
Secured 1st Mortgage | 60 | % | 5.95 | % | 6.50 | % | $ | 1,300,000 | $ | (32,958 | ) | $ | 1,267,042 | (1)(2)(3) | October 7, 2017 | |||||||||||||||||||||||||||||||||||||||||
Mezzanine Loan | 60 | % | 6.02 | % | 8.00 | % | 306,000 | (35,702 | ) | 270,298 | (1)(2)(4) | October 7, 2017 | 60 | % | 6.02 | % | 8.00 | % | 306,000 | (27,044 | ) | 278,956 | (1)(2)(4) | October 7, 2017 | ||||||||||||||||||||||||||||||||
Partner Loans | 60 | % | 11.00 | % | 11.00 | % | 450,000 | — | 450,000 | (5) | June 9, 2017 | 60 | % | 11.00 | % | 11.00 | % | 450,000 | — | 450,000 | (5) | June 9, 2017 | ||||||||||||||||||||||||||||||||||
125 West 55th Street | 60 | % | 6.09 | % | 6.15 | % | 205,351 | — | 205,351 | (6) | March 10, 2020 | 60 | % | 6.09 | % | 6.15 | % | 199,982 | — | 199,982 | March 10, 2020 | |||||||||||||||||||||||||||||||||||
Two Grand Central Tower | 60 | % | 6.00 | % | 6.07 | % | 178,541 | — | 178,541 | April 10, 2015 | ||||||||||||||||||||||||||||||||||||||||||||||
540 Madison Avenue | 60 | % | 5.20 | % | 6.75 | % | 119,000 | (4,079 | ) | 114,921 | (1)(7) | July 11, 2013 | 60 | % | 5.20 | % | 6.75 | % | 118,200 | (980 | ) | 117,220 | (1)(6) | July 11, 2013 | ||||||||||||||||||||||||||||||||
Metropolitan Square | 51 | % | 5.75 | % | 5.81 | % | 175,000 | — | 175,000 | May 5, 2020 | 51 | % | 5.75 | % | 5.81 | % | 175,000 | — | 175,000 | May 5, 2020 | ||||||||||||||||||||||||||||||||||||
Market Square North | 50 | % | 4.85 | % | 4.90 | % | 130,000 | — | 130,000 | October 1, 2020 | 50 | % | 4.85 | % | 4.91 | % | 130,000 | — | 130,000 | October 1, 2020 | ||||||||||||||||||||||||||||||||||||
Annapolis Junction | 50 | % | 1.26 | % | 1.36 | % | 42,698 | — | 42,698 | (2)(8) | September 12, 2011 | |||||||||||||||||||||||||||||||||||||||||||||
Mountain View Tech. Park | 39.5 | % | 5.52 | % | 5.85 | % | 24,462 | — | 24,462 | (2)(9)(10) | March 31, 2011 | |||||||||||||||||||||||||||||||||||||||||||||
Mountain View Research Park | 39.5 | % | 5.11 | % | 5.36 | % | 111,955 | — | 111,955 | (2)(9)(11) | May 31, 2011 | |||||||||||||||||||||||||||||||||||||||||||||
500 North Capitol | 30 | % | 5.75 | % | 6.32 | % | 22,000 | — | 22,000 | (2)(12) | March 31, 2013 | |||||||||||||||||||||||||||||||||||||||||||||
Annapolis Junction Building One | 50 | % | 1.96 | % | 2.12 | % | 41,831 | — | 41,831 | (7) | March 31, 2018 | |||||||||||||||||||||||||||||||||||||||||||||
Annapolis Junction Building Six | 50 | % | 1.86 | % | 2.53 | % | 13,923 | — | 13,923 | (2)(8) | November 17, 2013 | |||||||||||||||||||||||||||||||||||||||||||||
Mountain View Tech. Park: | ||||||||||||||||||||||||||||||||||||||||||||||||||||||||
Secured 1st Mortgage | 39.5 | % | 2.75 | % | 3.33 | % | 20,000 | — | 20,000 | (2)(9)(10) | November 22, 2014 | |||||||||||||||||||||||||||||||||||||||||||||
BPLP loan | 39.5 | % | 10.00 | % | 10.00 | % | 3,961 | — | 3,961 | (2)(11) | November 22, 2014 | |||||||||||||||||||||||||||||||||||||||||||||
Mountain View Research Park: | ||||||||||||||||||||||||||||||||||||||||||||||||||||||||
Secured 1st Mortgage | 39.5 | % | 2.22 | % | 2.42 | % | 90,350 | — | 90,350 | (9)(12) | May 31, 2014 | |||||||||||||||||||||||||||||||||||||||||||||
BPLP loan | 39.5 | % | 10.00 | % | 10.00 | % | 8,530 | 8,530 | (2)(13) | May 31, 2014 | ||||||||||||||||||||||||||||||||||||||||||||||
500 North Capitol Street | 30 | % | 1.86 | % | 2.55 | % | 86,348 | — | 86,348 | (2)(14) | October 14, 2014 | |||||||||||||||||||||||||||||||||||||||||||||
901 New York Avenue | 25 | % | 5.19 | % | 5.27 | % | 162,566 | — | 162,566 | January 1, 2015 | 25 | % | 5.19 | % | 5.27 | % | 156,779 | — | 156,779 | January 1, 2015 | ||||||||||||||||||||||||||||||||||||
300 Billerica Road | 25 | % | 5.69 | % | 6.04 | % | 7,500 | — | 7,500 | (2)(9) | January 1, 2016 | |||||||||||||||||||||||||||||||||||||||||||||
|
|
| ||||||||||||||||||||||||||||||||||||||||||||||||||||||
Total | $ | 3,235,073 | $ | (83,853 | ) | $ | 3,151,220 | $ | 3,100,904 | $ | (60,982 | ) | $ | 3,039,922 | ||||||||||||||||||||||||||||||||||||||||||
|
|
| ||||||||||||||||||||||||||||||||||||||||||||||||||||||
| (1) | GAAP interest rate differs from the stated interest rate due to the inclusion of the amortization of financing charges, effects of hedging transactions and adjustments required to reflect loans at their fair values upon acquisition. All adjustments to reflect loans at their fair value upon acquisition are noted above. |
| (2) | The loan requires interest only payments with a balloon payment due at maturity. |
| (3) | In connection with the assumption of the loan, we guaranteed the joint venture’s obligation to fund various escrows, including tenant improvements, taxes and insurance in lieu of cash deposits. As of December 31, |
| (4) | Principal amount does not include the assumed mezzanine loan with an aggregate principal amount of $294.0 million and a stated interest rate of 6.02% per annum, as the venture acquired the lenders’ interest in this loan for a purchase price of approximately $263.1 million in cash. |
| (5) | In connection with the capitalization of the joint venture, loans |
| (6) |
| In connection with the assumption of the loan, we guaranteed the joint venture’s obligation to fund tenant improvements and leasing commissions. |
| (7) | Mortgage loan bears interest at a variable rate equal to LIBOR plus 1.75% per annum and matures on March 31, 2018 with one, three-year extension option, subject to certain conditions. |
| (8) | The construction financing bears interest at a variable rate equal to LIBOR plus |
| (9) | This property is owned by the Value-Added Fund. |
| (10) |
| (11) | In conjunction with the mortgage loan modification our Operating Partnership agreed to lend up to $6.0 million to the Value-Added Fund, of which approximately $4.0 million had been advanced as of December 31, 2012. The loan from our Operating Partnership bears interest at a fixed rate of 10.0% per annum and matures on |
| (12) | The mortgage loan bears interest at a variable rate equal to LIBOR plus 2.00% per annum. |
| (13) | In conjunction with the mortgage loan modification, our Operating Partnership agreed to lend up to $12.0 million to our Value-Added Fund, of which approximately $8.5 million has been advanced as of December 31, |
| (14) | The construction financing bears interest at a variable rate equal to LIBOR plus 1.65% per annum and matures on October 14, 2014 with two, one-year extension options, subject to certain conditions. |
Environmental Matters
It is our policy to retain independent environmental consultants to conduct or update Phase I environmental assessments (which generally do not involve invasive techniques such as soil or ground water sampling) and asbestos surveys in connection with our acquisition of properties. These pre-purchase environmental assessments have not revealed environmental conditions that we believe will have a material adverse effect on our business, assets, financial condition, results of operations or liquidity, and we are not otherwise aware of environmental conditions with respect to our properties that we believe would have such a material adverse effect. However, from time to time environmental conditions at our properties have required and may in the future require environmental testing and/or regulatory filings, as well as remedial action.
In February 1999, we (through a joint venture) acquired from Exxon Corporation a property in Massachusetts that was formerly used as a petroleum bulk storage and distribution facility and was known by the state regulatory authority to contain soil and groundwater contamination. We developed an office park on the property. We engaged a specially licensed environmental consultant to oversee the management of contaminated soil and groundwater that was disturbed in the course of construction. Under the property acquisition agreement, Exxon agreed to (1) bear the liability arising from releases or discharges of oil and hazardous substances which occurred at the site prior to our ownership, (2) continue monitoring and/or remediating such releases and discharges as necessary and appropriate to comply with applicable requirements, and (3) indemnify us for certain losses arising from preexisting site conditions. Any indemnity claim may be subject to various defenses, and there can be no assurance that the amounts paid under the indemnity, if any, would be sufficient to cover the liabilities arising from any such releases and discharges.
Environmental investigations at some of our properties and certain properties owned by our affiliates have identified groundwater contamination migrating from off-site source properties. In each case we engaged a licensed environmental consultant to perform the necessary investigations and assessments, and to prepare any required submittals to the regulatory authorities. In each case the environmental consultant concluded that the properties qualify under the regulatory program or the regulatory practice for a status which eliminates certain deadlines for conducting response actions at a site. We also believe that these properties qualify for liability relief under certain statutory provisions or regulatory practices regarding upgradient releases. Although we believe that the current or former owners of the upgradient source properties may bear responsibility for some or all of the costs of addressing the identified groundwater contamination, we will take such further response actions (if any) that we deem necessary or advisable. Other than periodic testing at some of these properties, no such additional response actions are anticipated at this time.
Some of our properties and certain properties owned by our affiliates are located in urban, industrial and other previously developed areas where fill or current or historical usesuse of the areas have caused site contamination. Accordingly, it is sometimes necessary to institute special soil and/or groundwater handling procedures and/or include particular building design features in connection with development, construction and other property operations in order to achieve regulatory closure and/or ensure that contaminated materials are addressed in an appropriate manner. In these situations it is our practice to investigate the nature and extent of detected contamination and estimate the costs of required response actions and special handling procedures. We then use this information as part of our decision-making process with respect to the acquisition and/or development of the property. For example, we own a parcel in Massachusetts which was formerly used as a quarry/asphalt batching facility. Pre-purchase testing indicated that the site contained relatively low levels of
certain contaminants. We have developed an office park on this Property.property. Prior to and during redevelopment activities, we engaged a specially licensed environmental consultant to monitor environmental conditions at the site and prepare necessary regulatory submittals based on the results of an environmental risk characterization. A submittal has been made to the regulatory authorities in order to achieve regulatory closure at this site. The submittal included an environmental deed restriction that mandates compliance with certain protective measures in a portion of the site where low levels of residual soil contamination have been left in place in accordance with applicable laws.
We expect that resolution of the environmental matters relating to thedescribed above will not have a material impact on our business, assets, financial condition, results of operations or liquidity. However, we cannot assure you that we have identified all environmental liabilities at our properties, that all necessary remediation actions have been or will be undertaken at our properties, or that we will be indemnified, in full or at all, or that we will have insurance coverage in the event that such environmental liabilities arise.
Reclassifications and Adoption of New Accounting Pronouncements
Certain prior year amounts have been reclassified to conform to the current year presentation. In addition, certain prior year amounts have been revised as a result of the adoption on January 1, 2009 of (1) ASC 470-20 (formerly known as FSP No. APB 14-1) (See Note 8 of the Consolidated Financial Statements), (2) the guidance included in ASC 810 “Consolidation” (formerly known as SFAS No. 160, “Noncontrolling Interests in Consolidated Financial Statements—an amendment of ARB No. 51” (“SFAS No. 160”)) and ASC 480-10-S99 “Distinguishing Liabilities from Equity” (formerly known as EITF Topic No. D-98 “Classification and Measurement of Redeemable Securities” (Amended)) (See Note 11 of the Consolidated Financial Statements) and (3) the guidance included in ASC 260-10 “Earnings Per Share” (formerly known as FSP EITF 03-06-1, “Determining Whether Instruments Granted in Share-Based Payment Transactions are Participating Securities” ) (See Note 15 of the Consolidated Financial Statements).
Inflation
Substantially all of our leases provide for separate real estate tax and operating expense escalations over a base amount. In addition, many of our leases provide for fixed base rent increases or indexed increases. We believe that inflationary increases in costs may be at least partially offset by the contractual rent increases and operating expense escalations.
| Item 7A. | Quantitative and Qualitative Disclosures about Market |
As of December 31, 2010,2012, approximately $7.5$8.9 billion of our consolidated borrowings bore interest at fixed rates and approximately $317.5 millionnone of our consolidated borrowings bore interest at variable rates, and therefore therates. The fair value of these instruments is affected by changes in the market interest rates. As of December 31, 2010, the weighted-average interest rate on our variable rate debt was LIBOR/Eurodollar plus 0.60% (for an all in rate as of December 31, 2009 of 0.86%) per annum. The GAAP weighted average interest rate on the variable rate debt as of December 31, 2010 was 0.99% per annum. The table below does not include our unconsolidated joint venture debt. For a discussion concerning our unconsolidated joint venture debt, refer to Note 5 to the Consolidated Financial Statements and “Item 7.“Item 7—Management’s Discussion and Analysis of Financial Condition and Results of Operations—Capitalization—Off-Balance Sheet Arrangements—Joint Venture Indebtedness.”
| 2011 | 2012 | 2013 | 2014 | 2015 | 2016+ | Total | Fair Value | |||||||||||||||||||||||||||||||||||||||||||||||||||||||||
| (dollars in thousands) | 2013 | 2014 | 2015 | 2016 | 2017 | 2018+ | Total | Estimated Fair Value | ||||||||||||||||||||||||||||||||||||||||||||||||||||||||
| Secured debt | (Dollars in thousands) Secured debt | |||||||||||||||||||||||||||||||||||||||||||||||||||||||||||||||
Fixed Rate | $ | 477,493 | $ | 110,127 | $ | 104,732 | $ | 80,398 | $ | 18,469 | $ | 1,938,867 | $ | 2,730,086 | $ | 2,802,906 | $ | 115,895 | $ | 98,190 | $ | 36,974 | $ | 615,354 | $ | 1,522,112 | $ | 713,960 | $ | 3,102,485 | $ | 3,256,940 | ||||||||||||||||||||||||||||||||
Average Interest Rate | 7.21 | % | 5.69 | % | 6.03 | % | 5.79 | % | 6.75 | % | 5.66 | % | 5.95 | % | 6.62 | % | 5.66 | % | 5.87 | % | 5.26 | % | 5.29 | % | 4.96 | % | 5.27 | % | ||||||||||||||||||||||||||||||||||||
Variable Rate | — | 267,845 | 827 | 48,828 | — | — | 317,500 | 318,287 | — | — | — | — | — | — | — | — | ||||||||||||||||||||||||||||||||||||||||||||||||
| Unsecured debt | Unsecured debt | |||||||||||||||||||||||||||||||||||||||||||||||||||||||||||||||
Fixed Rate | $ | — | $ | — | $ | 224,870 | $ | — | $ | 549,132 | $ | 2,242,596 | $ | 3,016,598 | $ | 3,241,542 | $ | — | $ | — | $ | 549,501 | $ | — | $ | — | $ | 4,090,027 | $ | 4,639,528 | $ | 5,162,486 | ||||||||||||||||||||||||||||||||
Average Interest Rate | — | — | 6.36 | % | — | 5.47 | % | 5.26 | % | 5.38 | % | — | — | 5.47 | % | — | — | 4.65 | % | 4.74 | % | |||||||||||||||||||||||||||||||||||||||||||
Variable Rate | — | — | — | — | — | — | — | — | — | — | — | — | — | — | — | — | ||||||||||||||||||||||||||||||||||||||||||||||||
| Unsecured exchangeable debt | Unsecured exchangeable debt | |||||||||||||||||||||||||||||||||||||||||||||||||||||||||||||||
Fixed Rate(1) | $ | — | $ | 622,378 | $ | 450,000 | $ | 743,067 | $ | — | $ | — | $ | 1,815,445 | $ | 1,929,291 | $ | 450,000 | $ | 745,847 | $ | — | $ | — | $ | — | $ | — | $ | 1,195,847 | $ | 1,278,554 | ||||||||||||||||||||||||||||||||
Adjustment for the equity component allocation | (38,946 | ) | (29,192 | ) | (23,052 | ) | (2,438 | ) | — | — | ($ | 93,628 | ) | (23,053 | ) | (2,438 | ) | — | — | — | — | (25,491 | ) | — | ||||||||||||||||||||||||||||||||||||||||
|
|
|
|
|
|
|
| |||||||||||||||||||||||||||||||||||||||||||||||||||||||||
Total Fixed Rate | (38,946 | ) | 593,186 | 426,948 | 740,629 | — | — | 1,721,817 | 426,947 | 743,409 | — | — | — | — | 1,170,356 | — | ||||||||||||||||||||||||||||||||||||||||||||||||
Average Interest Rate | — | 5.63 | % | 5.96 | % | 6.56 | % | — | — | 6.08 | % | 5.96 | % | 6.56 | % | — | — | — | — | 6.33 | % | |||||||||||||||||||||||||||||||||||||||||||
Variable Rate | — | — | — | — | — | — | — | — | — | — | — | — | — | — | — | — | ||||||||||||||||||||||||||||||||||||||||||||||||
|
|
|
|
|
|
|
| |||||||||||||||||||||||||||||||||||||||||||||||||||||||||
Total Debt | $ | 438,547 | $ | 971,158 | $ | 757,377 | $ | 869,855 | $ | 567,601 | $ | 4,181,463 | $ | 7,786,001 | $ | 8,292,026 | $ | 542,842 | $ | 841,599 | $ | 586,475 | $ | 615,354 | $ | 1,522,112 | $ | 4,803,987 | $ | 8,912,369 | $ | 9,697,980 | ||||||||||||||||||||||||||||||||
|
|
|
|
|
|
|
| |||||||||||||||||||||||||||||||||||||||||||||||||||||||||
| (1) | Amounts are included in the year in which the first optional redemption date occurs (or, in the case of the exchangeable notes due 2014, the year of maturity). |
At December 31, 2012, the weighted-average coupon/stated rates on all of our outstanding debt, all of which had a fixed interest rate, was 4.89% per annum. At December 31, 2012 we had no outstanding variable rate debt. The weighted-average coupon/stated rates for our unsecured debt and unsecured exchangeable debt were 4.66% per annum and 3.80% per annum, respectively.
The fair value amounts were determined solely by considering the impact of hypothetical interest rates on our financial instruments. Due to the uncertainty of specific actions we may undertake to minimize possible effects of market interest rate increases, this analysis assumes no changes in our financial structure.
Additional disclosure about market risk is incorporated herein by reference from “Management’s“Management’s Discussion and Analysis of Financial Condition and Results of Operations—Liquidity and Capital Resources—Market Risk.”
| Item 8. | Financial Statements and Supplementary Data |
INDEX TO CONSOLIDATED FINANCIAL STATEMENTS
All other schedules for which a provision is made in the applicable accounting regulations of the Securities and Exchange CommissionSEC are not required under the related instructions or are inapplicable, and therefore have been omitted.
Management’s Report on Internal Control over
Financial Reporting
Management of Boston Properties, Inc. (“the Company”) is responsible for establishing and maintaining adequate internal control over financial reporting for the Company. The Company’s internal control over financial reporting is a process designed under the supervision of the Company’s principal executive officer and principal financial officer to provide reasonable assurance regarding the reliability of financial reporting and the preparation of the Company’s financial statements for external reporting purposes in accordance with U.S. generally accepted accounting principles.
As of the end of the Company’s 20102012 fiscal year, management conducted assessments of the effectiveness of the Company’s internal control over financial reporting based on the framework established in Internal Control—Integrated Framework issued by the Committee of Sponsoring Organizations of the Treadway Commission (COSO). Based on these assessments, management has determined that the Company’s internal control over financial reporting as of December 31, 20102012 was effective.
Our internal control over financial reporting includes policies and procedures that (1) pertain to the maintenance of records that, in reasonable detail, accurately and fairly reflect transactions and dispositions of our assets; (2) provide reasonable assurance that transactions are recorded as necessary to permit preparation of financial statements in accordance with U.S. generally accepted accounting principles, and that receipts and expenditures are being made only in accordance with authorizations of management and the directors of the Company; and (3) provide reasonable assurance regarding prevention or timely detection of unauthorized acquisition, use or disposition of the Company’s assets that could have a material effect on our financial statements.
The effectiveness of the Company’s internal control over financial reporting as of December 31, 20102012 has been audited by PricewaterhouseCoopers LLP, an independent registered public accounting firm, as stated in their report appearing on page 99,103, which expresses an unqualified opinion on the effectiveness of the Company’s internal control over financial reporting as of December 31, 2010.2012.
Report of Independent Registered Public Accounting Firm
To the Board of Directors and Shareholders
of Boston Properties, Inc.:
In our opinion, the consolidated financial statements listed in the accompanying index present fairly, in all material respects, the financial position of Boston Properties, Inc. and its subsidiaries at December 31, 20102012 and December 31, 2009,2011, and the results of their operations and their cash flows for each of the three years in the period ended December 31, 20102012 in conformity with accounting principles generally accepted in the United States of America. In addition, in our opinion, the financial statement schedule listed in the accompanying index presents fairly, in all material respects, the information set forth therein when read in conjunction with the related consolidated financial statements. Also in our opinion, the Company maintained, in all material respects, effective internal control over financial reporting as of December 31, 2010,2012, based on criteria established in Internal Control—Integrated Framework issued by the Committee of Sponsoring Organizations of the Treadway Commission (COSO). The Company’s management is responsible for these financial statements and financial statement schedule, for maintaining effective internal control over financial reporting and for its assessment of the effectiveness of internal control over financial reporting, included in the accompanying Management’s Report on Internal Control over Financial Reporting. Our responsibility is to express opinions on these financial statements, on the financial statement schedule, and on the Company’s internal control over financial reporting based on our integrated audits. We conducted our audits in accordance with the standards of the Public Company Accounting Oversight Board (United States). Those standards require that we plan and perform the audits to obtain reasonable assurance about whether the financial statements are free of material misstatement and whether effective internal control over financial reporting was maintained in all material respects. Our audits of the financial statements included examining, on a test basis, evidence supporting the amounts and disclosures in the financial statements, assessing the accounting principles used and significant estimates made by management, and evaluating the overall financial statement presentation. Our audit of internal control over financial reporting included obtaining an understanding of internal control over financial reporting, assessing the risk that a material weakness exists, and testing and evaluating the design and operating effectiveness of internal control based on the assessed risk. Our audits also included performing such other procedures as we considered necessary in the circumstances. We believe that our audits provide a reasonable basis for our opinions.
A company’s internal control over financial reporting is a process designed to provide reasonable assurance regarding the reliability of financial reporting and the preparation of financial statements for external purposes in accordance with generally accepted accounting principles. A company’s internal control over financial reporting includes those policies and procedures that (i) pertain to the maintenance of records that, in reasonable detail, accurately and fairly reflect the transactions and dispositions of the assets of the company; (ii) provide reasonable assurance that transactions are recorded as necessary to permit preparation of financial statements in accordance with generally accepted accounting principles, and that receipts and expenditures of the company are being made only in accordance with authorizations of management and directors of the company; and (iii) provide reasonable assurance regarding prevention or timely detection of unauthorized acquisition, use, or disposition of the company’s assets that could have a material effect on the financial statements.
Because of its inherent limitations, internal control over financial reporting may not prevent or detect misstatements. Also, projections of any evaluation of effectiveness to future periods are subject to the risk that controls may become inadequate because of changes in conditions, or that the degree of compliance with the policies or procedures may deteriorate.
/s/ PricewaterhouseCoopers LLP
Boston, Massachusetts
February 25, 201128, 2013
BOSTON PROPERTIES, INC.
(in thousands, except for share and par value amounts)
| December 31, 2010 | December 31, 2009 | December 31, 2012 | December 31, 2011 | |||||||||||||
| ASSETS | ||||||||||||||||
Real estate, at cost: | $ | 12,764,935 | $ | 11,099,558 | ||||||||||||
Real estate, at cost | $ | 14,893,328 | $ | 13,389,472 | ||||||||||||
Less: accumulated depreciation | (2,323,818 | ) | (2,033,677 | ) | (2,934,160 | ) | (2,642,986 | ) | ||||||||
|
| |||||||||||||||
Total real estate | 10,441,117 | 9,065,881 | 11,959,168 | 10,746,486 | ||||||||||||
Cash and cash equivalents | 478,948 | 1,448,933 | 1,041,978 | 1,823,208 | ||||||||||||
Cash held in escrows | 308,031 | 21,867 | 55,181 | 40,332 | ||||||||||||
Investment in securities | 8,732 | 9,946 | ||||||||||||||
Tenant and other receivables (net of allowance for doubtful accounts of $2,081 and $4,125, respectively) | 129,818 | 93,240 | ||||||||||||||
Related party note receivable | 270,000 | 270,000 | ||||||||||||||
Accrued rental income (net of allowance of $3,116 and $2,645, respectively) | 442,683 | 363,121 | ||||||||||||||
Investments in securities | 12,172 | 9,548 | ||||||||||||||
Tenant and other receivables (net of allowance for doubtful accounts of $1,960 and $1,766, respectively) | 69,555 | 79,838 | ||||||||||||||
Related party notes receivable | 282,491 | 280,442 | ||||||||||||||
Interest receivable from related party notes receivable | 104,816 | 89,854 | ||||||||||||||
Accrued rental income (net of allowance of $1,571 and $2,515, respectively) | 598,199 | 522,675 | ||||||||||||||
Deferred charges, net | 436,019 | 294,395 | 588,235 | 445,403 | ||||||||||||
Prepaid expenses and other assets | 65,663 | 17,684 | 90,610 | 75,458 | ||||||||||||
Investments in unconsolidated joint ventures | 767,252 | 763,636 | 659,916 | 669,722 | ||||||||||||
|
| |||||||||||||||
Total assets | $ | 13,348,263 | $ | 12,348,703 | $ | 15,462,321 | $ | 14,782,966 | ||||||||
|
| |||||||||||||||
| LIABILITIES AND EQUITY | ||||||||||||||||
Liabilities: | ||||||||||||||||
Mortgage notes payable, net | $ | 3,047,586 | $ | 2,643,301 | ||||||||||||
Unsecured senior notes (net of discount of $8,402 and $2,611, respectively) | 3,016,598 | 2,172,389 | ||||||||||||||
Unsecured exchangeable senior notes (net of discount of $8,249 and $15,529, respectively) | 1,721,817 | 1,904,081 | ||||||||||||||
Mortgage notes payable | $ | 3,102,485 | $ | 3,123,267 | ||||||||||||
Unsecured senior notes (net of discount of $10,472 and $9,814, respectively) | 4,639,528 | 3,865,186 | ||||||||||||||
Unsecured exchangeable senior notes (net of discount of $1,653 and $3,462, respectively) | 1,170,356 | 1,715,685 | ||||||||||||||
Unsecured line of credit | — | — | — | — | ||||||||||||
Accounts payable and accrued expenses | 186,059 | 220,089 | 199,102 | 155,139 | ||||||||||||
Dividends and distributions payable | 81,031 | 80,536 | 110,488 | 91,901 | ||||||||||||
Accrued interest payable | 62,327 | 76,058 | 72,461 | 69,105 | ||||||||||||
Other liabilities | 213,000 | 127,538 | 324,613 | 293,515 | ||||||||||||
|
| |||||||||||||||
Total liabilities | 8,328,418 | 7,223,992 | 9,619,033 | 9,313,798 | ||||||||||||
|
| |||||||||||||||
Commitments and contingencies | — | — | — | — | ||||||||||||
|
| |||||||||||||||
Noncontrolling interest: | ||||||||||||||||
Noncontrolling interests: | ||||||||||||||||
Redeemable preferred units of the Operating Partnership | 55,652 | 55,652 | 110,876 | 55,652 | ||||||||||||
|
| |||||||||||||||
Redeemable interest in property partnership | 97,558 | — | ||||||||||||||
|
| |||||||||||||||
Equity: | ||||||||||||||||
Stockholders’ equity attributable to Boston Properties, Inc. | ||||||||||||||||
Stockholders’ equity attributable to Boston Properties, Inc.: | ||||||||||||||||
Excess stock, $.01 par value, 150,000,000 shares authorized, none issued or outstanding | — | — | — | — | ||||||||||||
Preferred stock, $.01 par value, 50,000,000 shares authorized, none issued or outstanding | — | — | — | — | ||||||||||||
Common stock, $.01 par value, 250,000,000 shares authorized, 140,278,005 and 138,958,910 issued and 140,199,105 and 138,880,010 outstanding in 2010 and 2009, respectively | 1,402 | 1,389 | ||||||||||||||
Common stock, $.01 par value, 250,000,000 shares authorized, 151,680,109 and 148,186,511 issued and 151,601,209 and 148,107,611 outstanding at December 31, 2012 and December 31, 2011, respectively | 1,516 | 1,481 | ||||||||||||||
Additional paid-in capital | 4,417,162 | 4,373,679 | 5,222,073 | 4,936,457 | ||||||||||||
Earnings (dividends) in excess of dividends (earnings) | (24,763 | ) | 95,433 | |||||||||||||
Treasury common stock at cost, 78,900 shares in 2010 and 2009 | (2,722 | ) | (2,722 | ) | ||||||||||||
Dividends in excess of earnings | (109,985 | ) | (53,080 | ) | ||||||||||||
Treasury common stock at cost, 78,900 shares at December 31, 2012 and December 31, 2011 | (2,722 | ) | (2,722 | ) | ||||||||||||
Accumulated other comprehensive loss | (18,436 | ) | (21,777 | ) | (13,817 | ) | (16,138 | ) | ||||||||
|
| |||||||||||||||
Total stockholders’ equity attributable to Boston Properties, Inc. | 4,372,643 | 4,446,002 | 5,097,065 | 4,865,998 | ||||||||||||
Noncontrolling interests: | ||||||||||||||||
Common units of the Operating Partnership | 592,164 | 617,386 | 539,753 | 548,581 | ||||||||||||
Property partnerships | (614 | ) | 5,671 | (1,964 | ) | (1,063 | ) | |||||||||
|
| |||||||||||||||
Total equity | 4,964,193 | 5,069,059 | 5,634,854 | 5,413,516 | ||||||||||||
|
| |||||||||||||||
Total liabilities and equity | $ | 13,348,263 | $ | 12,348,703 | $ | 15,462,321 | $ | 14,782,966 | ||||||||
|
| |||||||||||||||
The accompanying notes are an integral part of these consolidated financial statements.
BOSTON PROPERTIES, INC.
CONSOLIDATED STATEMENTS OF OPERATIONS
| For the Year Ended December 31, | For the year ended December 31, | |||||||||||||||||||||||
| 2010 | 2009 | 2008 | 2012 | 2011 | 2010 | |||||||||||||||||||
| (In thousands, except for per share amounts) | (in thousands, except for per share amounts) | |||||||||||||||||||||||
Revenue | ||||||||||||||||||||||||
Rental | ||||||||||||||||||||||||
Base rent | $ | 1,231,564 | $ | 1,185,431 | $ | 1,129,215 | $ | 1,483,533 | $ | 1,401,594 | $ | 1,226,454 | ||||||||||||
Recoveries from tenants | 180,719 | 200,899 | 204,732 | 229,107 | 198,703 | 178,377 | ||||||||||||||||||
Parking and other | 64,490 | 66,597 | 68,105 | 91,635 | 83,069 | 64,464 | ||||||||||||||||||
|
|
| ||||||||||||||||||||||
Total rental revenue | 1,476,773 | 1,452,927 | 1,402,052 | 1,804,275 | 1,683,366 | 1,469,295 | ||||||||||||||||||
Hotel revenue | 32,800 | 30,385 | 36,872 | 37,915 | 34,529 | 32,800 | ||||||||||||||||||
Development and management services | 41,231 | 34,878 | 30,518 | 34,077 | 33,425 | 41,215 | ||||||||||||||||||
|
|
| ||||||||||||||||||||||
Total revenue | 1,550,804 | 1,518,190 | 1,469,442 | 1,876,267 | 1,751,320 | 1,543,310 | ||||||||||||||||||
|
|
| ||||||||||||||||||||||
Expenses | ||||||||||||||||||||||||
Operating | ||||||||||||||||||||||||
Rental | 501,694 | 501,799 | 488,030 | 657,363 | 590,224 | 498,154 | ||||||||||||||||||
Hotel | 25,153 | 23,966 | 27,510 | 28,120 | 26,128 | 25,153 | ||||||||||||||||||
General and administrative | 79,658 | 75,447 | 72,365 | 82,382 | 79,610 | 79,396 | ||||||||||||||||||
Acquisition costs | 2,614 | — | — | |||||||||||||||||||||
Loss (gain) from suspension of development | (7,200 | ) | 27,766 | — | ||||||||||||||||||||
Transaction costs | 3,653 | 1,987 | 2,876 | |||||||||||||||||||||
Suspension of development | — | — | (7,200 | ) | ||||||||||||||||||||
Depreciation and amortization | 338,371 | 321,681 | 304,147 | 453,068 | 436,612 | 335,859 | ||||||||||||||||||
|
|
| ||||||||||||||||||||||
Total expenses | 940,290 | 950,659 | 892,052 | 1,224,586 | 1,134,561 | 934,238 | ||||||||||||||||||
|
|
| ||||||||||||||||||||||
Operating income | 610,514 | 567,531 | 577,390 | 651,681 | 616,759 | 609,072 | ||||||||||||||||||
Other income (expense) | ||||||||||||||||||||||||
Income (loss) from unconsolidated joint ventures | 36,774 | 12,058 | (182,018 | ) | ||||||||||||||||||||
Income from unconsolidated joint ventures | 49,078 | 85,896 | 36,774 | |||||||||||||||||||||
Interest and other income | 7,332 | 4,059 | 18,958 | 10,091 | 5,358 | 7,332 | ||||||||||||||||||
Gains (losses) from investments in securities | 935 | 2,434 | (4,604 | ) | 1,389 | (443 | ) | 935 | ||||||||||||||||
Interest expense | (378,079 | ) | (322,833 | ) | (295,322 | ) | (413,564 | ) | (394,131 | ) | (378,079 | ) | ||||||||||||
Losses from early extinguishments of debt | (89,883 | ) | (510 | ) | — | (4,453 | ) | (1,494 | ) | (89,883 | ) | |||||||||||||
Net derivative losses | — | — | (17,021 | ) | ||||||||||||||||||||
|
|
| ||||||||||||||||||||||
Income from continuing operations | 187,593 | 262,739 | 97,383 | 294,222 | 311,945 | 186,151 | ||||||||||||||||||
Gains on sales of real estate | 2,734 | 11,760 | 33,340 | — | — | 2,734 | ||||||||||||||||||
|
|
| ||||||||||||||||||||||
Income before discontinued operations | 294,222 | 311,945 | 188,885 | |||||||||||||||||||||
Discontinued operations | ||||||||||||||||||||||||
Income from discontinued operations | 1,040 | 1,881 | 1,442 | |||||||||||||||||||||
Gain on sale of real estate from discontinued operations | 36,877 | — | — | |||||||||||||||||||||
|
|
| ||||||||||||||||||||||
Net income | 190,327 | 274,499 | 130,723 | 332,139 | 313,826 | 190,327 | ||||||||||||||||||
Net income attributable to noncontrolling interests | ||||||||||||||||||||||||
Noncontrolling interests in property partnerships | (3,464 | ) | (2,778 | ) | (1,997 | ) | (3,792 | ) | (1,558 | ) | (3,464 | ) | ||||||||||||
Noncontrolling interest—redeemable preferred units of the Operating Partnership | (3,343 | ) | (3,594 | ) | (4,226 | ) | (3,497 | ) | (3,339 | ) | (3,343 | ) | ||||||||||||
Noncontrolling interest—common units of the Operating Partnership | (24,099 | ) | (35,534 | ) | (14,392 | ) | (31,046 | ) | (36,035 | ) | (23,915 | ) | ||||||||||||
Noncontrolling interest in gains on sales of real estate—common units of the Operating Partnership | (349 | ) | (1,579 | ) | (4,838 | ) | — | — | (349 | ) | ||||||||||||||
Noncontrolling interest in discontinued operations—common units of the Operating Partnership | (4,154 | ) | (215 | ) | (184 | ) | ||||||||||||||||||
|
|
| ||||||||||||||||||||||
Net income attributable to Boston Properties, Inc. | $ | 159,072 | $ | 231,014 | $ | 105,270 | $ | 289,650 | $ | 272,679 | $ | 159,072 | ||||||||||||
|
|
| ||||||||||||||||||||||
Basic earnings per common share attributable to Boston Properties, Inc.: | ||||||||||||||||||||||||
Income from continuing operations | $ | 1.71 | $ | 1.86 | $ | 1.13 | ||||||||||||||||||
Discontinued operations | 0.22 | 0.01 | 0.01 | |||||||||||||||||||||
|
|
| ||||||||||||||||||||||
Net income | $ | 1.14 | $ | 1.76 | $ | 0.88 | $ | 1.93 | $ | 1.87 | $ | 1.14 | ||||||||||||
|
|
| ||||||||||||||||||||||
Weighted average number of common shares outstanding | 139,440 | 131,050 | 119,980 | 150,120 | 145,693 | 139,440 | ||||||||||||||||||
|
|
| ||||||||||||||||||||||
Diluted earnings per common share attributable to Boston Properties, Inc.: | ||||||||||||||||||||||||
Income from continuing operations | $ | 1.70 | $ | 1.85 | $ | 1.13 | ||||||||||||||||||
Discontinued operations | 0.22 | 0.01 | 0.01 | |||||||||||||||||||||
|
|
| ||||||||||||||||||||||
Net income | $ | 1.14 | $ | 1.76 | $ | 0.87 | $ | 1.92 | $ | 1.86 | $ | 1.14 | ||||||||||||
|
|
| ||||||||||||||||||||||
Weighted average number of common and common equivalent shares outstanding | 140,057 | 131,512 | 121,299 | 150,711 | 146,218 | 140,057 | ||||||||||||||||||
|
|
| ||||||||||||||||||||||
The accompanying notes are an integral part of these consolidated financial statements.
BOSTON PROPERTIES, INC.
CONSOLIDATED STATEMENTS OF COMPREHENSIVE INCOME
| For the Year Ended December 31, | ||||||||||||
| 2012 | 2011 | 2010 | ||||||||||
| (in thousands) | ||||||||||||
Net income | $ | 332,139 | $ | 313,826 | $ | 190,327 | ||||||
Other comprehensive income: | ||||||||||||
Net effective portion of interest rate contracts | — | — | 421 | |||||||||
Amortization of interest rate contracts | 2,594 | 2,595 | 3,408 | |||||||||
|
|
|
|
|
| |||||||
Other comprehensive income | 2,594 | 2,595 | 3,829 | |||||||||
|
|
|
|
|
| |||||||
Comprehensive income | 334,733 | 316,421 | 194,156 | |||||||||
Net income attributable to noncontrolling interests | (42,489 | ) | (41,147 | ) | (31,255 | ) | ||||||
Other comprehensive income attributable to noncontrolling interests | (273 | ) | (297 | ) | (487 | ) | ||||||
|
|
|
|
|
| |||||||
Comprehensive income attributable to Boston Properties, Inc. | $ | 291,971 | $ | 274,977 | $ | 162,414 | ||||||
|
|
|
|
|
| |||||||
The accompanying notes are an integral part of these consolidated financial statements.
BOSTON PROPERTIES, INC.
CONSOLIDATED STATEMENTS OF STOCKHOLDERS’ EQUITY
(in thousands)
| Common Stock | Additional Paid-in Capital | Earnings (Dividends) in Excess of Dividends (Earnings) | Treasury Stock, at cost | Accumulated Other Comprehensive Loss | Noncontrolling Interests | Total | Common Stock | Additional Paid-in Capital | Dividends in Excess of Earnings | Treasury Stock, at cost | Accumulated Other Comprehensive Loss | Noncontrolling Interests | Total | |||||||||||||||||||||||||||||||||||||||||||||||||||
| Shares | Amount | Shares | Amount | |||||||||||||||||||||||||||||||||||||||||||||||||||||||||||||
Equity, December 31, 2007 | 119,502 | $ | 1,195 | $ | 3,416,558 | $ | 376,396 | $ | (2,722 | ) | $ | (23,671 | ) | $ | 615,575 | $ | 4,383,331 | |||||||||||||||||||||||||||||||||||||||||||||||
Conversion of operating partnership units to Common Stock | 630 | 7 | 32,540 | — | — | — | (10,906 | ) | 21,641 | |||||||||||||||||||||||||||||||||||||||||||||||||||||||
Rebalancing of noncontrolling interest | — | — | 24,287 | — | — | — | (24,287 | ) | — | |||||||||||||||||||||||||||||||||||||||||||||||||||||||
Rebalancing of noncontrolling interest—redeemable preferred units | — | — | — | — | — | — | 488 | 488 | ||||||||||||||||||||||||||||||||||||||||||||||||||||||||
Allocated net income for the year | — | — | — | 105,270 | — | — | 21,227 | 126,497 | ||||||||||||||||||||||||||||||||||||||||||||||||||||||||
Dividends/distributions declared | — | — | — | (326,713 | ) | — | — | (57,608 | ) | (384,321 | ) | |||||||||||||||||||||||||||||||||||||||||||||||||||||
Shares issued pursuant to stock purchase plan | 8 | — | 713 | — | — | — | — | 713 | ||||||||||||||||||||||||||||||||||||||||||||||||||||||||
Net activity from stock option and incentive plan | 1,041 | 10 | 38,156 | — | — | — | 21,630 | 59,796 | ||||||||||||||||||||||||||||||||||||||||||||||||||||||||
Equity component of unsecured exchangeable senior notes | — | — | 91,947 | — | — | — | — | 91,947 | ||||||||||||||||||||||||||||||||||||||||||||||||||||||||
Issuances of noncontrolling interest—common units | — | — | — | — | — | — | 25,000 | 25,000 | ||||||||||||||||||||||||||||||||||||||||||||||||||||||||
Distributions to noncontrolling interests in property partnerships | — | — | — | — | — | — | (20,902 | ) | (20,902 | ) | ||||||||||||||||||||||||||||||||||||||||||||||||||||||
Capped call transaction costs | — | — | (44,360 | ) | — | — | — | — | (44,360 | ) | ||||||||||||||||||||||||||||||||||||||||||||||||||||||
Effective portion of interest rate contracts | — | — | — | — | — | (622 | ) | (105 | ) | (727 | ) | |||||||||||||||||||||||||||||||||||||||||||||||||||||
Amortization of interest rate contracts | — | — | — | — | — | 2 | — | 2 | ||||||||||||||||||||||||||||||||||||||||||||||||||||||||
Equity, December 31, 2008 | 121,181 | 1,212 | 3,559,841 | 154,953 | (2,722 | ) | (24,291 | ) | 570,112 | 4,259,105 | ||||||||||||||||||||||||||||||||||||||||||||||||||||||
Conversion of operating partnership units to Common Stock | 139 | 1 | 3,969 | — | — | — | (3,970 | ) | — | |||||||||||||||||||||||||||||||||||||||||||||||||||||||
Rebalancing of noncontrolling interest | — | — | (42,490 | ) | — | — | — | 42,490 | — | |||||||||||||||||||||||||||||||||||||||||||||||||||||||
Allocated net income for the year | — | — | — | 231,014 | — | — | 39,891 | 270,905 | ||||||||||||||||||||||||||||||||||||||||||||||||||||||||
Dividends/distributions declared | — | — | — | (290,534 | ) | — | — | (46,574 | ) | (337,108 | ) | |||||||||||||||||||||||||||||||||||||||||||||||||||||
Sale of Common Stock, net of offering costs | 17,250 | 173 | 841,737 | — | — | — | — | 841,910 | ||||||||||||||||||||||||||||||||||||||||||||||||||||||||
Shares issued pursuant to stock purchase plan | 12 | — | 620 | — | — | — | — | 620 | ||||||||||||||||||||||||||||||||||||||||||||||||||||||||
Net activity from stock option and incentive plan | 298 | 3 | 10,002 | — | — | — | 24,725 | 34,730 | ||||||||||||||||||||||||||||||||||||||||||||||||||||||||
Distributions to noncontrolling interests in property partnerships | — | — | — | — | — | — | (4,007 | ) | (4,007 | ) | ||||||||||||||||||||||||||||||||||||||||||||||||||||||
Amortization of interest rate contracts | — | — | — | — | — | 2,514 | 390 | 2,904 | ||||||||||||||||||||||||||||||||||||||||||||||||||||||||
Equity, December 31, 2009 | 138,880 | 1,389 | 4,373,679 | 95,433 | (2,722 | ) | (21,777 | ) | 623,057 | 5,069,059 | 138,880 | $ | 1,389 | $ | 4,373,679 | $ | 95,433 | $ | (2,722 | ) | $ | (21,777 | ) | $ | 623,057 | $ | 5,069,059 | |||||||||||||||||||||||||||||||||||||
Conversion of operating partnership units to Common Stock | 592 | 6 | 17,176 | — | — | — | (17,182 | ) | — | 592 | 6 | 17,176 | — | — | — | (17,182 | ) | — | ||||||||||||||||||||||||||||||||||||||||||||||
Rebalancing of noncontrolling interest | — | — | 20,176 | — | — | — | (20,176 | ) | — | |||||||||||||||||||||||||||||||||||||||||||||||||||||||
Reallocation of noncontrolling interest | — | — | 20,176 | — | — | — | (20,176 | ) | — | |||||||||||||||||||||||||||||||||||||||||||||||||||||||
Allocated net income for the year | — | — | — | 159,072 | — | — | 27,912 | 186,984 | — | — | — | 159,072 | — | — | 27,912 | 186,984 | ||||||||||||||||||||||||||||||||||||||||||||||||
Dividends/distributions declared | — | — | — | (279,268 | ) | — | — | (42,570 | ) | (321,838 | ) | — | — | — | (279,268 | ) | — | — | (42,570 | ) | (321,838 | ) | ||||||||||||||||||||||||||||||||||||||||||
Shares issued pursuant to stock purchase plan | 9 | — | 630 | — | — | — | — | 630 | 9 | — | 630 | — | — | — | — | 630 | ||||||||||||||||||||||||||||||||||||||||||||||||
Net activity from stock option and incentive plan | 718 | 7 | 25,038 | — | — | — | 29,770 | 54,815 | 718 | 7 | 25,038 | — | — | — | 29,770 | 54,815 | ||||||||||||||||||||||||||||||||||||||||||||||||
Acquisition of noncontrolling interest in property partnership | — | — | (19,098 | ) | — | — | — | (6,384 | ) | (25,482 | ) | — | — | (19,098 | ) | — | — | — | (6,384 | ) | (25,482 | ) | ||||||||||||||||||||||||||||||||||||||||||
Acquisition of equity component of exchangeable senior notes | — | — | (439 | ) | — | — | — | — | (439 | ) | — | — | (439 | ) | — | — | — | — | (439 | ) | ||||||||||||||||||||||||||||||||||||||||||||
Distributions to noncontrolling interests in property partnerships | — | — | — | — | — | — | (3,365 | ) | (3,365 | ) | — | — | — | — | — | — | (3,365 | ) | (3,365 | ) | ||||||||||||||||||||||||||||||||||||||||||||
Effective portion of interest rate contracts | — | — | — | — | — | 367 | 54 | 421 | — | — | — | — | — | 367 | 54 | 421 | ||||||||||||||||||||||||||||||||||||||||||||||||
Amortization of interest rate contracts | — | — | — | — | — | 2,974 | 434 | 3,408 | — | — | — | — | — | 2,974 | 434 | 3,408 | ||||||||||||||||||||||||||||||||||||||||||||||||
|
|
|
|
|
|
|
| |||||||||||||||||||||||||||||||||||||||||||||||||||||||||
Equity, December 31, 2010 | 140,199 | $ | 1,402 | $ | 4,417,162 | $ | (24,763 | ) | $ | (2,722 | ) | $ | (18,436 | ) | $ | 591,550 | $ | 4,964,193 | 140,199 | 1,402 | 4,417,162 | (24,763 | ) | (2,722 | ) | (18,436 | ) | 591,550 | 4,964,193 | |||||||||||||||||||||||||||||||||||
Conversion of operating partnership units to common stock | 2,919 | 29 | 85,469 | — | — | — | (85,498 | ) | — | |||||||||||||||||||||||||||||||||||||||||||||||||||||||
Reallocation of noncontrolling interest | — | — | (23,073 | ) | — | — | — | 23,073 | — | |||||||||||||||||||||||||||||||||||||||||||||||||||||||
Allocated net income for the year | — | — | — | 272,679 | — | — | 37,808 | 310,487 | ||||||||||||||||||||||||||||||||||||||||||||||||||||||||
Dividends/distributions declared | — | — | — | (300,996 | ) | — | — | (39,132 | ) | (340,128 | ) | |||||||||||||||||||||||||||||||||||||||||||||||||||||
Sale of common stock, net of offering costs | 4,660 | 47 | 438,990 | — | — | — | — | 439,037 | ||||||||||||||||||||||||||||||||||||||||||||||||||||||||
Shares issued pursuant to stock purchase plan | 6 | — | 620 | — | — | — | — | 620 | ||||||||||||||||||||||||||||||||||||||||||||||||||||||||
Net activity from stock option and incentive plan | 324 | 3 | 17,289 | — | — | — | 21,427 | 38,719 | ||||||||||||||||||||||||||||||||||||||||||||||||||||||||
Distributions to noncontrolling interests in property partnerships | — | — | — | — | — | — | (2,007 | ) | (2,007 | ) | ||||||||||||||||||||||||||||||||||||||||||||||||||||||
Amortization of interest rate contracts | — | — | — | — | — | 2,298 | 297 | 2,595 | ||||||||||||||||||||||||||||||||||||||||||||||||||||||||
|
|
|
|
|
|
|
| |||||||||||||||||||||||||||||||||||||||||||||||||||||||||
Equity, December 31, 2011 | 148,108 | 1,481 | 4,936,457 | (53,080 | ) | (2,722 | ) | (16,138 | ) | 547,518 | 5,413,516 | |||||||||||||||||||||||||||||||||||||||||||||||||||||
Conversion of operating partnership units to common stock | 1,111 | 11 | 34,610 | — | — | — | (34,621 | ) | — | |||||||||||||||||||||||||||||||||||||||||||||||||||||||
Conversion of redeemable preferred units to common units | — | — | — | — | — | — | 5,852 | 5,852 | ||||||||||||||||||||||||||||||||||||||||||||||||||||||||
Allocated net income for the year | — | — | — | 289,650 | — | — | 37,189 | 326,839 | ||||||||||||||||||||||||||||||||||||||||||||||||||||||||
Dividends/distributions declared | — | — | — | (346,555 | ) | — | — | (41,434 | ) | (387,989 | ) | |||||||||||||||||||||||||||||||||||||||||||||||||||||
Sale of common stock, net of offering costs | 2,348 | 24 | 247,003 | — | — | — | — | 247,027 | ||||||||||||||||||||||||||||||||||||||||||||||||||||||||
Shares issued pursuant to stock purchase plan | 7 | — | �� | 781 | — | — | — | — | 781 | |||||||||||||||||||||||||||||||||||||||||||||||||||||||
Net activity from stock option and incentive plan | 27 | — | 5,419 | — | — | — | 23,705 | 29,124 | ||||||||||||||||||||||||||||||||||||||||||||||||||||||||
Distributions to noncontrolling interests in property partnerships | — | — | — | — | — | — | (2,890 | ) | (2,890 | ) | ||||||||||||||||||||||||||||||||||||||||||||||||||||||
Amortization of interest rate contracts | — | — | — | — | — | 2,321 | 273 | 2,594 | ||||||||||||||||||||||||||||||||||||||||||||||||||||||||
Reallocation of noncontrolling interest | — | — | (2,197 | ) | — | — | — | 2,197 | — | |||||||||||||||||||||||||||||||||||||||||||||||||||||||
|
|
|
|
|
|
|
| |||||||||||||||||||||||||||||||||||||||||||||||||||||||||
Equity, December 31, 2012 | 151,601 | $ | 1,516 | $ | 5,222,073 | $ | (109,985 | ) | $ | (2,722 | ) | $ | (13,817 | ) | $ | 537,789 | $ | 5,634,854 | ||||||||||||||||||||||||||||||||||||||||||||||
|
|
|
|
|
|
|
| |||||||||||||||||||||||||||||||||||||||||||||||||||||||||
The accompanying notes are an integral part of these financial statements.
BOSTON PROPERTIES, INC.
COMPREHENSIVE INCOME
| For the year ended December 31, | ||||||||||||
| 2010 | 2009 | 2008 | ||||||||||
| (in thousands) | ||||||||||||
Net income | $ | 190,327 | $ | 274,499 | $ | 130,723 | ||||||
Other comprehensive income (loss): | ||||||||||||
Net effective portion of interest rate contracts | 421 | — | (727 | ) | ||||||||
Amortization of interest rate contracts | 3,408 | 2,904 | 2 | |||||||||
Other comprehensive income (loss) | 3,829 | 2,904 | (725 | ) | ||||||||
Comprehensive income | 194,156 | 277,403 | 129,998 | |||||||||
Comprehensive income attributable to noncontrolling interests | (31,742 | ) | (43,875 | ) | (25,348 | ) | ||||||
Comprehensive income attributable to Boston Properties, Inc. | $ | 162,414 | $ | 233,528 | $ | 104,650 | ||||||
The accompanying notes are an integral part of theseconsolidated financial statements.
BOSTON PROPERTIES, INC.
CONSOLIDATED STATEMENTS OF CASH FLOWS
| For the year ended December 31, | ||||||||||||
| 2010 | 2009 | 2008 | ||||||||||
| (in thousands) | ||||||||||||
Cash flows from operating activities: | ||||||||||||
Net income | $ | 190,327 | $ | 274,499 | $ | 130,723 | ||||||
Adjustments to reconcile net income to net cash provided by operating activities: | ||||||||||||
Depreciation and amortization | 338,371 | 321,681 | 304,147 | |||||||||
Non-cash portion of interest expense | 56,174 | 55,664 | 39,323 | |||||||||
Settlement of accreted debt discount on repurchases of unsecured exchangeable senior notes | (17,555 | ) | — | — | ||||||||
Non-cash compensation expense | 32,852 | 26,636 | 23,106 | |||||||||
Non-cash rental revenue | — | (3,600 | ) | (2,023 | ) | |||||||
Losses (gains) on investments in securities | (935 | ) | (2,434 | ) | 4,604 | |||||||
Net derivative losses | — | — | 17,021 | |||||||||
Losses from early extinguishments of debt | 12,211 | 10 | — | |||||||||
Loss (gain) from suspension of development | (7,200 | ) | 27,766 | — | ||||||||
(Income) loss from unconsolidated joint ventures | (36,774 | ) | (12,058 | ) | 182,018 | |||||||
Distributions of net cash flow from operations of unconsolidated joint ventures | 16,734 | 12,676 | 9,589 | |||||||||
Gains on sales of real estate | (2,734 | ) | (11,760 | ) | (33,340 | ) | ||||||
Change in assets and liabilities: | ||||||||||||
Cash held in escrows | (8,664 | ) | 103 | 3,548 | ||||||||
Tenant and other receivables, net | (5,115 | ) | 1,844 | 2,663 | ||||||||
Accrued rental income, net | (79,562 | ) | (46,410 | ) | (20,001 | ) | ||||||
Prepaid expenses and other assets | 3,239 | 4,717 | (2,642 | ) | ||||||||
Accounts payable and accrued expenses | (32,839 | ) | 14,848 | 5,762 | ||||||||
Accrued interest payable | (13,731 | ) | 8,926 | 12,645 | ||||||||
Other liabilities | (9,393 | ) | (9,452 | ) | (54,023 | ) | ||||||
Tenant leasing costs | (59,513 | ) | (46,280 | ) | (57,809 | ) | ||||||
Total adjustments | 185,566 | 342,877 | 434,588 | |||||||||
Net cash provided by operating activities | 375,893 | 617,376 | 565,311 | |||||||||
Cash flows from investing activities: | ||||||||||||
Acquisitions/additions to real estate | (850,519 | ) | (442,844 | ) | (580,377 | ) | ||||||
Proceeds from redemptions of investments in securities | 2,149 | 4,078 | 14,697 | |||||||||
Capital contributions to unconsolidated joint ventures | (62,806 | ) | (11,015 | ) | (901,524 | ) | ||||||
Capital distributions from unconsolidated joint ventures | 49,902 | 3,180 | 5,497 | |||||||||
Mortgage loan proceeds placed in escrow | (267,500 | ) | — | — | ||||||||
Deposits on real estate | (10,000 | ) | — | — | ||||||||
Acquisition of note receivable | (22,500 | ) | — | — | ||||||||
Net proceeds from the sale/financing of real estate released from escrow | — | — | 161,321 | |||||||||
Issuance of note receivable | — | — | (270,000 | ) | ||||||||
Proceeds from note receivable | — | — | 123,000 | |||||||||
Net proceeds from the sales of real estate | — | — | 127,307 | |||||||||
Net cash used in investing activities | (1,161,274 | ) | (446,601 | ) | (1,320,079 | ) | ||||||
Cash flows from operating activities: Net income Adjustments to reconcile net income to net cash provided by operating activities: Depreciation and amortization Non-cash compensation expense Income from unconsolidated joint ventures Distributions of net cash flow from operations of unconsolidated joint ventures Losses (gains) from investments in securities Non-cash portion of interest expense Settlement of accreted debt discount on repurchases of senior notes Losses (gains) from early extinguishments of debt Suspension of development Gains on sales of real estate Gain on sale of real estate from discontinued operations Change in assets and liabilities: Cash held in escrows Tenant and other receivables, net Accrued rental income, net Prepaid expenses and other assets Accounts payable and accrued expenses Accrued interest payable Other liabilities Tenant leasing costs Total adjustments Net cash provided by operating activities Cash flows from investing activities: Acquisitions of real estate Construction in progress Building and other capital improvements Tenant improvements Proceeds from the sale of real estate Proceeds from land transaction Proceeds from mortgage loan released from (placed in) escrow Deposits on real estate Acquisition of note receivable Issuance of notes receivable, net Capital contributions to unconsolidated joint ventures Capital distributions from unconsolidated joint ventures Investments in securities, net Net cash used in investing activities For the year ended December 31, 2012 2011 2010 (in thousands) $ 332,139 $ 313,826 $ 190,327 454,044 439,184 338,371 29,679 29,672 32,852 (49,078 ) (85,896 ) (36,774 ) 47,002 39,851 16,734 (1,389 ) 443 (935 ) 43,131 54,962 56,174 (69,499 ) (5,601 ) (17,555 ) (1,000 ) 1,494 12,211 — — (7,200 ) — — (2,734 ) (36,877 ) — — 10,272 (9,801 ) (8,664 ) 23,155 (19,396 ) (5,115 ) (77,363 ) (79,992 ) (79,562 ) 6,990 (39,213 ) 3,239 3,854 6,660 (32,839 ) 3,356 6,778 (13,731 ) 1,354 6,569 (9,393 ) (76,821 ) (53,212 ) (59,513 ) 310,810 292,502 185,566 642,949 606,328 375,893 (788,052 ) (112,180 ) (394,363 ) (356,397 ) (271,856 ) (321,978 ) (49,943 ) (61,961 ) (20,683 ) (139,662 ) (76,320 ) (113,495 ) 61,963 — — — 43,887 — — 267,500 (267,500 ) — 10,000 (10,000 ) — — (22,500 ) (2,049 ) (10,442 ) — (6,214 ) (17,970 ) (62,806 ) 3,557 140,505 49,902 (1,235 ) (1,259 ) 2,149 (1,278,032 ) (90,096 ) (1,161,274 )
The accompanying notes are an integral part of these consolidated financial statements.
BOSTON PROPERTIES, INC.
CONSOLIDATED STATEMENTS OF CASH FLOWS
| For the year ended December 31, | ||||||||||||
| 2010 | 2009 | 2008 | ||||||||||
| (in thousands) | ||||||||||||
Cash flows from financing activities: | ||||||||||||
Borrowings on unsecured line of credit | — | — | 1,391,000 | |||||||||
Repayments of unsecured line of credit | — | (100,000 | ) | (1,291,000 | ) | |||||||
Repayments of mortgage notes payable | (730,191 | ) | (125,238 | ) | (603,054 | ) | ||||||
Proceeds from mortgage notes payable | 268,964 | 107,929 | 537,569 | |||||||||
Proceeds from unsecured exchangeable senior notes | — | — | 647,046 | |||||||||
Proceeds from unsecured senior notes | 1,542,947 | 699,517 | — | |||||||||
Repurchases of unsecured exchangeable senior notes | (218,592 | ) | — | — | ||||||||
Repurchase of equity component of unsecured exchangeable senior notes | (439 | ) | — | — | ||||||||
Repurchases of unsecured senior notes | (700,000 | ) | — | — | ||||||||
Payments on real estate financing transactions | — | — | (6,208 | ) | ||||||||
Advance from joint venture partners | — | — | 30,000 | |||||||||
Repayment of advance from joint venture partners | — | — | (30,000 | ) | ||||||||
Dividends and distributions | (324,686 | ) | (357,328 | ) | (1,235,767 | ) | ||||||
Proceeds from equity transactions | 22,593 | 850,624 | 37,410 | |||||||||
Equity component of unsecured exchangeable senior notes | — | — | 91,947 | |||||||||
Capped call transaction costs | — | — | (44,360 | ) | ||||||||
Distributions to noncontrolling interests in property partnerships | (3,365 | ) | (4,007 | ) | (20,909 | ) | ||||||
Acquisition of noncontrolling interest in property partnership | (25,482 | ) | — | — | ||||||||
Repayment of note payable | — | (25,000 | ) | — | ||||||||
Deferred financing costs | (16,353 | ) | (9,849 | ) | (14,317 | ) | ||||||
Net cash provided by (used in) financing activities | (184,604 | ) | 1,036,648 | (510,643 | ) | |||||||
Net increase (decrease) in cash and cash equivalents | (969,985 | ) | 1,207,423 | (1,265,411 | ) | |||||||
Cash and cash equivalents, beginning of the year | 1,448,933 | 241,510 | 1,506,921 | |||||||||
Cash and cash equivalents, end of the year | $ | 478,948 | $ | 1,448,933 | $ | 241,510 | ||||||
Supplemental disclosures: | ||||||||||||
Cash paid for interest | $ | 394,172 | $ | 307,059 | $ | 289,640 | ||||||
Interest capitalized | $ | 40,981 | $ | 48,816 | $ | 46,286 | ||||||
Non-cash investing and financing activities: | ||||||||||||
Additions to real estate included in accounts payable | $ | 3,693 | $ | 36,789 | $ | 18,075 | ||||||
Mortgage notes payable assumed in connection with acquisitions of real estate | $ | 843,104 | $ | — | $ | — | ||||||
Note receivable converted to real estate | $ | 22,500 | $ | — | $ | — | ||||||
Dividends and distributions declared but not paid | $ | 81,031 | $ | 80,536 | $ | 97,162 | ||||||
Issuance of OP Units in connection with the acquisition of real estate | $ | — | $ | — | $ | 15,000 | ||||||
Issuance of OP Units in connection with an investment in an unconsolidated joint venture | $ | — | $ | — | $ | 10,000 | ||||||
Conversions of noncontrolling interests to Stockholders’ Equity | $ | 17,182 | $ | 3,970 | $ | 10,906 | ||||||
Basis adjustment in connection with conversions of noncontrolling interests to Stockholders’ Equity | $ | — | $ | — | $ | 21,641 | ||||||
Note receivable issued in connection with the transfer of real estate | $ | — | $ | — | $ | 123,000 | ||||||
Issuance of restricted securities to employees and directors | $ | 19,222 | $ | 22,964 | $ | 43,536 | ||||||
| For the year ended December 31, | ||||||||||||
| 2012 | 2011 | 2010 | ||||||||||
| (in thousands) | ||||||||||||
Cash flows from financing activities: | ||||||||||||
Proceeds from mortgage notes payable | — | 1,178,306 | 268,964 | |||||||||
Repayments of mortgage notes payable | (253,877 | ) | (1,251,841 | ) | (730,191 | ) | ||||||
Proceeds from unsecured senior notes | 997,790 | 848,019 | 1,542,947 | |||||||||
Redemption/repurchase of unsecured senior notes | (224,261 | ) | — | (700,000 | ) | |||||||
Redemption/repurchase of unsecured exchangeable senior notes | (507,434 | ) | (44,586 | ) | (218,592 | ) | ||||||
Repurchase of equity component of unsecured exchangeable senior notes | — | — | (439 | ) | ||||||||
Deferred financing costs | (8,468 | ) | (15,970 | ) | (16,353 | ) | ||||||
Deposit on mortgage loan financing | — | (14,500 | ) | — | ||||||||
Returned deposit on mortgage loan financing | — | 14,500 | — | |||||||||
Net proceeds from ATM stock issuances | 247,027 | 439,037 | — | |||||||||
Net proceeds from equity transactions | 226 | 9,667 | 22,593 | |||||||||
Redemption of preferred units | (18,329 | ) | — | — | ||||||||
Dividends and distributions | (372,899 | ) | (332,597 | ) | (324,686 | ) | ||||||
Acquisition of noncontrolling interest in property partnerships | — | — | (25,482 | ) | ||||||||
Distributions to noncontrolling interest in property partnerships | (5,922 | ) | (2,007 | ) | (3,365 | ) | ||||||
|
|
|
|
|
| |||||||
Net cash provided by (used in) financing activities | (146,147 | ) | 828,028 | (184,604 | ) | |||||||
|
|
|
|
|
| |||||||
Net increase (decrease) in cash and cash equivalents | (781,230 | ) | 1,344,260 | (969,985 | ) | |||||||
Cash and cash equivalents, beginning of year | 1,823,208 | 478,948 | 1,448,933 | |||||||||
|
|
|
|
|
| |||||||
Cash and cash equivalents, end of year | $ | 1,041,978 | $ | 1,823,208 | $ | 478,948 | ||||||
|
|
|
|
|
| |||||||
Supplemental disclosures: | ||||||||||||
Cash paid for interest | $ | 480,866 | $ | 386,170 | $ | 394,172 | ||||||
|
|
|
|
|
| |||||||
Interest capitalized | $ | 44,278 | $ | 48,178 | $ | 40,981 | ||||||
|
|
|
|
|
| |||||||
Non-cash investing and financing activities: | ||||||||||||
Additions to real estate included in accounts payable and accrued expenses | $ | 14,059 | $ | 10,767 | $ | 3,693 | ||||||
|
|
|
|
|
| |||||||
Mortgage note payable assumed in connection with the acquisition of real estate | $ | 211,250 | $ | 143,900 | $ | 843,104 | ||||||
|
|
|
|
|
| |||||||
Redeemable noncontrolling interest in property partnership | $ | 98,787 | $ | — | $ | — | ||||||
|
|
|
|
|
| |||||||
Preferred units issued in connection with the acquisition of real estate | $ | 79,405 | $ | — | $ | — | ||||||
|
|
|
|
|
| |||||||
Note receivable converted to real estate | $ | — | $ | — | $ | 22,500 | ||||||
|
|
|
|
|
| |||||||
Dividends and distributions declared but not paid | $ | 110,488 | $ | 91,901 | $ | 81,031 | ||||||
|
|
|
|
|
| |||||||
Conversions of noncontrolling interests to stockholders’ equity | $ | 34,621 | $ | 85,498 | $ | 17,182 | ||||||
|
|
|
|
|
| |||||||
Conversion of redeemable preferred units to common units | $ | 5,852 | $ | — | $ | — | ||||||
|
|
|
|
|
| |||||||
Issuance of restricted securities to employees and directors | $ | 26,198 | $ | 25,087 | $ | 19,222 | ||||||
|
|
|
|
|
| |||||||
The accompanying notes are an integral part of these consolidated financial statements.
BOSTON PROPERTIES, INC.
NOTES TO THE CONSOLIDATED FINANCIAL STATEMENTS
1. Organization and Basis of Presentation
Organization
Boston Properties, Inc. (the “Company”), a Delaware corporation, is a self-administered and self-managed real estate investment trust (“REIT”). The Company is the sole general partner of Boston Properties Limited Partnership (the “Operating Partnership”) and at December 31, 20102012 owned an approximate 86.2% (86.0%89.0% (88.3% at December 31, 2009)2011) general and limited partnership interest in the Operating Partnership. Partnership interests in the Operating Partnership are denominated as “common units of partnership interest” (also referred to as “OP Units”), “long term incentive units of partnership interest” (also referred to as “LTIP Units”) or “preferred units of partnership interest” (also referred to as “Preferred Units”). In addition, in February 2008, February 2011 and February 2012, the Company issued LTIP Units in connection with the granting to employees of 2008 outperformance awards (also referred to as “2008 OPP Units,” “2011 OPP Units” and “2012 OPP Units,” respectively, and collectively as “OPP Units”). Because the rights, preferences and privileges of 2008 OPP Units differ from other LTIP Units granted to employees as part of the annual compensation process, unless specifically noted otherwise, all references to LTIP Units exclude OPP Units. On February 5, 2011, the measurement period for the Company’s 2008 OPP Units. For a complete description ofUnit awards expired and the termsCompany’s total return to shareholders was not sufficient for employees to earn and therefore become eligible to vest in any of the 2008 OPP Units, see Note 17 (Also see Note 20)Unit awards. Accordingly, all 2008 OPP Unit awards were automatically forfeited (See Notes 11 and 17).
Unless specifically noted otherwise, all references to OP Units exclude units held by the Company. A holder of an OP Unit may present such OP Unit to the Operating Partnership for redemption at any time (subject to restrictions agreed upon at the time of issuance of OP Units to particular holders that may restrict such redemption right for a period of time, generally one year from issuance). Upon presentation of an OP Unit for redemption, the Operating Partnership mustis obligated to redeem such OP Unit for cash equal to the then value of a share of common stock of the Company (“Common Stock”). at such time. In lieu of a cash redemption, the Company may elect to acquire such OP Unit for one share of Common Stock. Because the number of shares of Common Stock outstanding at all times equals the number of OP Units that the Company owns, one share of Common Stock is generally the economic equivalent of one OP Unit, and the quarterly distribution that may be paid to the holder of an OP Unit equals the quarterly dividend that may be paid to the holder of a share of Common Stock. An LTIP Unit is generally the economic equivalent of a share of restricted common stock of the Company. LTIP Units, whether vested or not, will receive the same quarterly per unit distributions as OP Units, which equal per share dividends on Common Stock (See Note 17).
At December 31, 2010,2012, there was onewere two series of Preferred Units outstanding (i.e., Series Two Preferred Units and Series Four Preferred Units). The Series Two Preferred Units bear a distribution that is set in accordance with an amendment to the partnership agreement of the Operating Partnership. Each Series Two Preferred UnitsUnit may also be converted into approximately 1.312336 OP Units or redeemed for $50.00 of cash at the election of the holder thereof or the Operating Partnership in accordance with the terms and conditions set forth in the applicable amendment to the partnership agreementagreement. The Series Four Preferred Units are not convertible into or exchangeable for any common equity of the Operating Partnership or the Company, have a per unit liquidation preference of $50.00 and are entitled to receive quarterly distributions of $0.25 per unit (or an annual rate of 2.00%) (See Note 11).
All references herein to the Company refer to Boston Properties, Inc. and its consolidated subsidiaries, including the Operating Partnership, collectively, unless the context otherwise requires.
Properties
At December 31, 2010,2012, the Company owned or had interests in a portfolio of 146157 commercial real estate properties (the “Properties”) aggregating approximately 39.944.4 million net rentable square feet, including five nine
properties under construction totaling approximately 2.02.8 million net rentable square feet. In addition, the Company hadhas structured parking for approximately 40,66446,833 vehicles containing approximately 13.715.9 million square feet. At December 31, 2010,2012, the Properties consist of:
140149 office properties, including 121132 Class A office properties (including threeeight properties under construction) and 1917 Office/Technical properties;
one hotel;
threefour retail properties; and
twothree residential properties (both of which are(including one property under construction).
The Company owns or controls undeveloped land parcels totaling approximately 513.3509.3 acres. In addition, the Company has a noncontrolling interest in the Boston Properties Office Value-Added Fund, L.P. (the “Value-Added Fund”), which is a strategic partnership with two institutional investors through which the Company has pursued the acquisition of value-added investments in assets within its existing markets. The Company’s investments through the Value-Added Fund are not included in its portfolio information or any other portfolio level statistics. At December 31, 2010,2012, the Value-Added Fund had investments in 2423 buildings comprised of an office property in Chelmsford, Massachusetts andtwo office complexes in Mountain View, California.
The Company considers Class A office properties to be centrally located buildings that are professionally managed and maintained, that attract high-quality tenants and command upper-tier rental rates, and that are modern structures or have been modernized to compete with newer buildings. The Company considers Office/Technical properties to be properties that support office, research and development, laboratory and other technical uses. The Company’s definitions of Class A Office and Office/Technical properties may be different than those used by other companies. Net rentable square feet amounts are unaudited.
Basis of Presentation
Boston Properties, Inc. does not have any other significant assets, liabilities or operations, other than its investment in the Operating Partnership, nor does it have employees of its own. The Operating Partnership, not Boston Properties, Inc., executes all significant business relationships. All majority-owned subsidiaries and affiliates over which the Company has financial and operating control and variable interest entities (“VIE”s) in which the Company has determined it is the primary beneficiary are included in the consolidated financial statements. All significant intercompany balances and transactions have been eliminated in consolidation. The Company accounts for all other unconsolidated joint ventures using the equity method of accounting. Accordingly, the Company’s share of the earnings of these joint ventures and companies is included in consolidated net income.
2. Summary of Significant Accounting Policies
Reclassifications and Adoption of New Accounting Pronouncements
Certain prior year amounts have been reclassified to conform to the current year presentation. In addition, certain prior year amounts have been revised as a result of the adoption on January 1, 2009 of (1) Accounting Standards Codification (“ASC”) 470-20 “Debt with Conversion and Other Options” (“ASC 470-20”) (formerly known as FASB Staff Position (“FSP”) No. APB 14-1 “Accounting for Convertible Debt Instruments That May Be Settled in Cash upon Conversion (Including Partial Cash Settlement)” (“FSP No. APB 14-1”)) (See Note 8), (2) the guidance included in ASC 810 “Consolidation” (“ASC 810”) (formerly known as SFAS No. 160, “Noncontrolling Interests in Consolidated Financial Statements—an amendment of ARB No. 51” (“SFAS No. 160”)) and ASC 480-10-S99 “Distinguishing Liabilities from Equity” (“ASC 480-10-S99”) (formerly known as EITF Topic No. D-98 “Classification and Measurement of Redeemable Securities” (Amended)) (See Note 11) and (3) the guidance included in ASC 260-10 “Earnings Per Share” (“ASC 260-10”) (formerly known as FSP EITF 03-06-1, “Determining Whether Instruments Granted in Share-Based Payment Transactions are Participating Securities” (“FSP EITF 03-06-1”)) (See Note 15).
Real Estate
Upon acquisitions of real estate, the Company assesses the fair value of acquired tangible and intangible assets (including land, buildings, tenant improvements, “above-” and “below-market” leases, leasing and assumed financing origination costs, acquired in-place leases, other identified intangible assets and assumed
liabilities, and allocates the purchase price to the acquired assets and assumed liabilities, including land at appraised value and buildings as if vacant. The Company assesses and considers fair value based on estimated cash flow projections that utilize discount and/or capitalization rates that it deems appropriate, as well as available market information. Estimates of future cash flows are based on a number of factors including the historical operating results, known and anticipated trends, and market and economic conditions. The fair value of the tangible assets of an acquired property considers the value of the property as if it were vacant. The Company also considers an allocation of purchase price of other acquired intangibles, including acquired in-place leases that may have a customer
relationship intangible value, including (but not limited to) the nature and extent of the existing relationship with the tenants, the tenant’s credit quality and expectations of lease renewals. Based on its acquisitions to date, the Company’s allocation to customer relationship intangible assets has been immaterial.
The Company records acquired “above-” and “below-market” leases at their fair values (using a discount rate which reflects the risks associated with the leases acquired) equal to the difference between (1) the contractual amounts to be paid pursuant to each in-place lease and (2) management’s estimate of fair market lease rates for each corresponding in-place lease, measured over a period equal to the remaining term of the lease for above-market leases and the initial term plus the term of any below-market fixed rate renewal options for below- below—market leases. Other intangible assets acquired include amounts for in-place lease values that are based on the Company’s evaluation of the specific characteristics of each tenant’s lease. Factors to be considered include estimates of carrying costs during hypothetical expected lease-up periods considering current market conditions, and costs to execute similar leases. In estimating carrying costs, the Company includes real estate taxes, insurance and other operating expenses and estimates of lost rentals at market rates during the expected lease-up periods, depending on local market conditions. In estimating costs to execute similar leases, the Company considers leasing commissions, legal and other related expenses.
Management reviews its long-lived assets used in operations for impairment following the end of each quarter and when there is an event or change in circumstances that indicates an impairment in value. An impairment loss is recognized if the carrying amount of its assets is not recoverable and exceeds its fair value. If such criteria are present, an impairment loss is recognized based on the excess of the carrying amount of the asset over its fair value. The evaluation of anticipated cash flows is highly subjective and is based in part on assumptions regarding future occupancy, rental rates and capital requirements that could differ materially from actual results in future periods. Since cash flows on properties considered to be “long-lived assets to be held and used” are considered on an undiscounted basis to determine whether an asset has been impaired, the Company’s established strategy of holding properties over the long term directly decreases the likelihood of recording an impairment loss. If the Company’s strategy changes or market conditions otherwise dictate an earlier sale date, an impairment loss may be recognized and such loss could be material. If the Company determines that impairment has occurred, the affected assets must be reduced to their fair value.
ASC 360 (formerly known as SFAS No. 144) requires that qualifying assets and liabilities and the results of operations that have been sold, or otherwise qualify as “held for sale,” be presented as discontinued operations in all periods presented if the property operations are expected to be eliminated and the Company will not have significant continuing involvement following the sale. The components of the property’s net income that is reflected as discontinued operations include the net gain (or loss) upon the disposition of the property held for sale, operating results, depreciation and interest expense (if the property is subject to a secured loan). The Company generally considers assets to be “held for sale” when the transaction has been approved by the Board of Directors, or a committee thereof, and there are no known significant contingencies relating to the sale, such that the property sale within one year is considered probable. Following the classification of a property as “held for sale,” no further depreciation is recorded on the assets, and the asset is written down to the lower of carrying value or fair market value.
Real estate is stated at depreciated cost. A variety of costs are incurred in the acquisition, development and leasing of properties. The cost of buildings and improvements includes the purchase price of property, legal fees and other acquisition costs. Effective January 1, 2009, theThe Company was required to expenseexpenses costs that an
acquirerit incurs to effect a business combination such as legal, due diligence and other closing related costs. Costs directly related to the development of properties are capitalized. Capitalized development costs include interest, internal wages, property taxes, insurance, and other project costs incurred during the period of development. After the determination is made to capitalize a cost, it is allocated to the specific component of a project that is benefited. Determinations of when a development project commences and capitalization begins, and when a development project is substantially complete and held available for occupancy and capitalization must cease, involve a degree of judgment. The Company’s capitalization policy on development properties is guided by guidance in ASC 835-20 “Capitalization of Interest”
and ASC 970 “Real Estate – General” (formerly known as SFAS No. 34 “Capitalization of Interest Cost” and SFAS No. 67 “Accounting for Costs and the Initial Rental Operations of Real Estate Projects”). The costs of land and buildings under development include specifically identifiable costs. The capitalized costs include pre-construction costs necessary to the development of the property, development costs, construction costs, interest costs, real estate taxes, salaries and related costs and other costs incurred during the period of development. The Company begins the capitalization of costs during the pre-construction period, which it defines as activities that are necessary to the development of the property. The Company considers a construction project as substantially completed and held available for occupancy upon the completion of tenant improvements, but no later than one year from cessation of major construction activity. The Company ceases capitalization on the portion (1) substantially completed and (2) occupied or held available for occupancy, and capitalizes only those costs associated with the portion under construction, or if activities necessary for the development of the property have been suspended. Interest costs capitalized for the years ended December 31, 2012, 2011 and 2010 2009 and 2008 were $41.0$44.3 million, $48.8$48.2 million and $46.3$41.0 million, respectively. Salaries and related costs capitalized for the years ended December 31, 2012, 2011 and 2010 2009 and 2008 were $6.2$7.1 million, $7.9$6.5 million and $7.8$6.2 million, respectively.
Expenditures for repairs and maintenance are charged to operations as incurred. Significant betterments are capitalized. When assets are sold or retired, their costs and related accumulated depreciation are removed from the accounts with the resulting gains or losses reflected in net income or loss for the period.
The Company computes depreciation and amortization on properties using the straight-line method based on estimated useful asset lives. In accordance with ASC 805 (formerly known as SFAS No. 141(R)), the Company allocates the acquisition cost of real estate to land, building, tenant improvements, acquired “above-” and “below-market” leases, origination costs and acquired in-place leases based on an assessment of their fair valueits components and depreciates or amortizes these assets (or liabilities) over their useful lives. The amortization of acquired “above-” and “below-market” leases and acquired in-place leases is recorded as an adjustment to revenue and depreciation and amortization, respectively, in the Consolidated Statements of Operations.
Depreciation is computed on a straight-line basis over the estimated useful lives of the assets as follows:
Land improvements | 25 to 40 years | |
Buildings and improvements | 10 to 40 years | |
Tenant improvements | Shorter of useful life or terms of related lease | |
Furniture, fixtures, and equipment | 3 to 7 years |
Cash and Cash Equivalents
Cash and cash equivalents consist of cash on hand and investments with maturities of three months or less from the date of purchase. The majority of the Company’s cash and cash equivalents are held at major commercial banks which may at times exceed the Federal Deposit Insurance Corporation limit of $250,000. The Company has not experienced any losses to date on its invested cash.
Cash Held in Escrows
Escrows include amounts established pursuant to various agreements for security deposits, property taxes, insurance and other costs.
InvestmentInvestments in Securities
The Company accounts for investments in trading securities at fair value, with gains or losses resulting from changes in fair value recognized currently in earnings. The designation of trading securities is generally determined at acquisition. The Company maintains a deferred compensation plan that is designed to allow officers of the Company to defer a portion of their current income on a pre-tax basis and receive a tax-deferred return on these deferrals. The Company’s obligation under the plan is that of an unsecured promise to pay the
deferred compensation to the plan participants in the future. At December 31, 20102012 and 2009,2011, the Company has fundedhad maintained approximately $8.7$12.2 million and $9.9$9.5 million, respectively, intoin a separate account, which is not restricted as to its use. The Company recognized gains (losses) of approximately $0.9$1.4 million, $2.2$(0.4) million and $(3.2)$0.9 million on its investments in the account associated with the Company’s deferred compensation plan during the years ended December 31, 2012, 2011 and 2010, 2009 and 2008, respectively.
During the years ended December 31, 2009 and 2008, investment in securities is comprised of an investment in an unregistered money market fund and investments in an account associated with the Company’s deferred compensation plan (See Note 16). In December 2007, the unregistered money market fund suspended cash redemptions by investors; investors could elect in-kind redemptions of the underlying securities or maintain their investment in the fund and receive distributions as the underlying securities matured or were liquidated by the fund sponsor. As a result, the Company retained this investment for a longer term than originally intended, and the valuation of the Company’s investment was subject to changes in market conditions. Because interests in this fund were valued at less than their $1.00 par value, the Company recognized gains (losses) of approximately $0.2 million and $(1.4) million on its investment during the years ended December 31, 2009 and 2008, respectively. As of December 31, 2009, the Company no longer had investments in this unregistered money market fund.
Tenant and other receivablesOther Receivables
Tenant and other accounts receivable, other than accrued rents receivable, are expected to be collected within one year.
Deferred Charges
Deferred charges include leasing costs and financing fees. Leasing costs include an allocation for acquired intangible in-place lease values and direct and incremental fees and costs incurred in the successful negotiation of leases, including brokerage, legal, internal leasing employee salaries and other costs which have been deferred and are being amortized on a straight-line basis over the terms of the respective leases. Internal leasing salaries and related costs capitalized for the years ended December 31, 2012, 2011 and 2010 2009 and 2008 were $5.4$5.6 million, $3.3$4.4 million and $4.4$5.4 million, respectively. External fees and costs incurred to obtain long-term financing have been deferred and are being amortized over the terms of the respective loans on a basis that approximates the effective interest method and are included with interest expense. Unamortized financing and leasing costs are charged to expense upon the early repayment or significant modification of the financing or upon the early termination of the lease, respectively. Fully amortized deferred charges are removed from the books upon the expiration of the lease or maturity of the debt.
Investments in Unconsolidated Joint Ventures
Except for ownership interests inThe Company consolidates variable interest entities (VIEs) in which it is considered to be the primary beneficiary. VIEs are entities in which the equity investors do not have sufficient equity at risk to finance their endeavors without additional financial support or that the holders of the equity investment at risk do not have a controlling financial interest. The primary beneficiary is defined by the entity having both of the following characteristics: (1) the power to direct the activities that, when taken together, most significantly impact the variable interest entity’s performance, and (2) the obligation to absorb losses and right to receive the returns from the variable interest entity that would be significant to the variable interest entity. For ventures that are not VIEs the Company consolidates entities for which it has significant decision making control over the Company is the primary beneficiary, the Company accounts for its investments in joint ventures under the equity method of accounting because it exercises significant influence over, but does not control, these entities.ventures’ operations. The Company’s judgment with respect to its level of influence or control of an entity and whether it is the primary beneficiary of a variable interest entity involves the consideration of various factors including the form of the Company’s ownership interest, its representation in the entity’s governance, the size of its investment (including loans), estimates of
future cash flows, its ability to participate in policy making decisions and the rights of the other investors to participate in the decision making process and to replace the Company as manager and/or liquidate the venture, if applicable. The Company’s assessment of its influence or control over an entity affects the presentation of these investments in the Company’s consolidated financial statements. In addition to evaluating control rights, the Company consolidates entities in which the outside partner has no substantive kick-out rights to remove the Company as the managing member.
These investmentsAccounts of the consolidated entity are included in the accounts of the Company and the non-controlling interest is reflected on the Consolidated Balance Sheets as a component of equity or in temporary equity between liabilities and equity. Investments in Unconsolidated Joint Ventures are recorded initially at cost, as Investments in Unconsolidated Joint Ventures, and subsequently adjusted for equity in earnings and cash contributions and distributions. Any difference between the carrying amount of these investments on the balance sheet and the underlying equity in net assets is amortized as an adjustment to equity in earnings of unconsolidated joint ventures over the life of the related asset. Under the equity method of accounting, the net equity investment of the Company is reflected within the Consolidated
Balance Sheets, and the Company’s share of net income or loss from the joint ventures is included within the Consolidated Statements of Operations. The joint venture agreements may designate different percentage allocations among investors for profits and losses,losses; however, the Company’s recognition of joint venture income or loss generally follows the joint venture’s distribution priorities, which may change upon the achievement of certain investment return thresholds. The Company may account for cash distributions in excess of its investment in an unconsolidated joint venture as income when the Company is not the general partner in a limited partnership and when the Company has neither the requirement nor the intent to provide financial support to the joint venture. For ownership interests in variable interest entities, the Company consolidates those in which it is the primary beneficiary. The Company’s investments in unconsolidated joint ventures are reviewed for impairment periodically and the Company records impairment charges when events or circumstances change indicating that a decline in the fair values below the carrying values has occurred and such decline is other-than-temporary. The ultimate realization of the investment in unconsolidated joint ventures is dependent on a number of factors, including the performance of each investment and market conditions. The Company will record an impairment charge if it determines that a decline in the value below the carrying value of an investment in an unconsolidated joint venture is other than temporary.
To the extent that the Company contributes assets to a joint venture, the Company’s investment in the joint venture is recorded at the Company’s cost basis in the assets that were contributed to the joint venture. To the extent that the Company’s cost basis is different than the basis reflected at the joint venture level, the basis difference is amortized over the life of the related asset and included in the Company’s share of equity in net income of the joint venture. In accordance with the provisions of ASC 970-323 “Investments—Equity Method and Joint Ventures” (“ASC 970-323”) (formerly Statement of Position 78-9 “Accounting for Investments in Real Estate Ventures” (“SOP 78-9”)), the Company will recognize gains on the contribution of real estate to joint ventures, relating solely to the outside partner’s interest, to the extent the economic substance of the transaction is a sale.
Equity Offering Costs
Underwriting commissions and offering costs have been reflected as a reduction of additional paid-in capital.
Treasury Stock
The Company’s share repurchases are reflected as treasury stock utilizing the cost method of accounting and are presented as a reduction to consolidated stockholders’ equity.
Dividends
Earnings and profits, which determine the taxability of dividends to stockholders, will differ from income reported for financial reporting purposes due to the differences for federal income tax purposes in the treatment of gainsgains/losses on the sale of real property, revenue and expense recognition, compensation expense, and in the estimated useful lives and basis used to compute depreciation.
The tax treatment of common dividends per share for federal income tax purposes is as follows:
| For the year ended December 31, | For the year ended December 31, | |||||||||||||||||||||||||||||||||||||||||||||||
| 2010 | 2009 | 2008 | 2012 | 2011 | 2010 | |||||||||||||||||||||||||||||||||||||||||||
| Per Share | % | Per Share | % | Per Share | % | Per Share | % | Per Share | % | Per Share | % | |||||||||||||||||||||||||||||||||||||
Ordinary income | $ | 1.17 | 58.39 | % | $ | 2.15 | 90.93 | % | $ | 2.55 | 51.83 | % | $ | 2.29 | 96.45 | % | $ | 2.06 | 97.39 | % | $ | 1.17 | 58.39 | % | ||||||||||||||||||||||||
Capital gain income | 0.08 | 3.55 | % | 0.05 | 2.61 | % | — | — | ||||||||||||||||||||||||||||||||||||||||
Return of capital | 0.83 | 41.61 | % | 0.21 | 9.07 | % | 2.37 | 48.17 | % | — | — | — | — | 0.83 | 41.61 | % | ||||||||||||||||||||||||||||||||
|
|
|
|
|
| |||||||||||||||||||||||||||||||||||||||||||
Total | $ | 2.00 | 100.00 | % | $ | 2.36 | 100.00 | % | $ | 4.92 | (1) | 100.00 | % | $ | 2.37 | 100.00 | % | $ | 2.11 | 100.00 | % | $ | 2.00 | 100.00 | % | |||||||||||||||||||||||
|
|
|
|
|
| |||||||||||||||||||||||||||||||||||||||||||
Revenue Recognition
Contractual rental revenue is reported on a straight-line basis over the terms of the respective leases. The impact of the straight-line rent adjustment increased revenue by approximately $85.1$77.6 million, $42.2$77.0 million and $24.5$85.1 million for the years ended December 31, 2010, 20092012, 2011 and 2008,2010, respectively, as the revenue recorded exceeded amounts billed. The straight-line rent adjustment for the year ended December 31, 2008 includes an approximately $21.0 million decrease due to the establishment of reserves for the full amount of the accrued straight-line rent balances associated with two of the Company’s leases in New York City. In accordance with ASC 805 (formerly SFAS No. 141(R)), the Company recognizes rental revenue of acquired in-place “above-” and “below-market” leases at their fair values over the terms of the respective leases. The impact of the acquired in-place “above-” and “below-market” leases increased revenue by approximately $2.4 million, $4.2 million and $5.4 million for the years ended December 31, 2010, 2009 and 2008, respectively. Accrued rental income, as reported on the Consolidated Balance Sheets, represents cumulative rental income earned in excess of rent payments received pursuant to the terms of the individual lease agreements. The Company maintains an allowance against accrued rental income for future potential tenant credit losses. The credit assessment is based on the estimated accrued rental income that is recoverable over the term of the lease. The Company also maintains an allowance for doubtful accounts for estimated losses resulting from the inability of tenants to make required rent payments. The computation of this allowance is based on the tenants’ payment history and current credit status, as well as certain industry or geographic specific credit considerations. If the Company’s estimates of collectability differ from the cash received, then the timing and amount of the Company’s reported revenue could be impacted. The credit risk is mitigated by the high quality of the Company’s existing tenant base, reviews of prospective tenants’ risk profiles prior to lease execution and consistent monitoring of the Company’s portfolio to identify potential problem tenants.
In accordance with ASC 805 (formerly SFAS No. 141(R)), the Company recognizes rental revenue of acquired in-place “above-” and “below-market” leases at their fair values over the terms of the respective leases. The impact of the acquired in-place “above-” and “below-market” leases increased revenue by approximately $14.6 million, $10.8 million and $2.4 million for the years ended December 31, 2012, 2011 and 2010, respectively. The following table summarizes the scheduled amortization of the Company’s acquired “above-” and “below-market” lease intangibles for each of the five succeeding years (in thousands).
| Acquired Above-Market Lease Intangibles | Acquired Below-Market Lease Intangibles | |||||||
2013 | $ | 5,179 | $ | 20,190 | ||||
2014 | 4,220 | 19,095 | ||||||
2015 | 3,295 | 13,633 | ||||||
2016 | 2,550 | 11,823 | ||||||
2017 | 2,036 | 9,107 | ||||||
Recoveries from tenants, consisting of amounts due from tenants for common area maintenance, real estate taxes and other recoverable costs are recognized as revenue in the period during which the expenses are incurred. Tenant reimbursements are recognized and presented in accordance with guidance in ASC 605-45 “Principal Agent Considerations” (“ASC 605-45”) (formerly known as Emerging Issues Task Force, or EITF, Issue 99-19 “Reporting Revenue Gross as a Principal versus Net as an Agent,” or (“Issue 99-19”)). ASC 605-45 requires that these reimbursements be recorded on a gross basis, as the Company is generally the primary obligor with respect to purchasing goods and services from third-party suppliers, has discretion in selecting the supplier and has credit risk. The Company also receives reimbursement of payroll and payroll related costs from third parties which the Company reflects on a net basis in accordance with ASC 605-45.
The Company’s parking revenues are derived from leases, monthly parking and transient parking. The Company recognizes parking revenue as earned.
The Company’s hotel revenues are derived from room rentals and other sources such as charges to guests for long-distance telephone service, fax machine use, movie and vending commissions, meeting and banquet room revenue and laundry services. Hotel revenues are recognized as earned.
The Company receives management and development fees from third parties. Property management fees are recorded and earned based on a percentage of collected rents at the properties under management, and not on a straight-line basis, because such fees are contingent upon the collection of rents. The Company reviews each
development agreement and records development fees as earned depending on the risk associated with each project. Profit on development fees earned from joint venture projects is recognized as revenue to the extent of the third party partners’ ownership interest.
Gains on sales of real estate are recognized pursuant to the provisions included in ASC 360-20 “Real Estate Sales” (“ASC 360-20”) (formerly known as SFAS No. 66, “Accounting for Sales of Real Estate” (“SFAS No. 66”)). The specific timing of a sale is measured against various criteria in ASC 360-20 related to the terms of the transaction and any continuing involvement in the form of management or financial assistance associated with the properties. If the sales criteria for the full accrual method are not met, the Company defers some or all of the gain recognition and accounts for the continued operations of the property by applying the finance, leasing, profit sharing, deposit, installment or cost recovery methods, as appropriate, until the sales criteria are met.
Ground Leases
The Company has non-cancelable ground lease obligations with various initial term expiration dates through 2068. The Company recognizes ground rent expense on a straight-line basis over the terms of the respective ground lease agreements. The future contractual minimum lease payments to be made by the Company as of December 31, 2012, under non-cancelable ground leases which expire on various dates through 2068, are as follows:
| Years Ending December 31, | (in thousands) | |||
2013 | $ | 12,820 | ||
2014 | 13,184 | |||
2015 | 13,507 | |||
2016 | 13,732 | |||
2017 | 13,963 | |||
Thereafter | 913,655 | |||
Earnings Per Share
Basic earnings per share (“EPS”) is computed by dividing net income available to common shareholders, as adjusted for unallocated earnings (if any) of certain securities issued by the Operating Partnership, by the weighted average number of shares of Common Stock outstanding during the year. Diluted EPS reflects the potential dilution that could occur from shares issuable in connection with awards under stock-based compensation plans, including upon the exercise of stock options, and conversion of the noncontrolling interests in the Operating Partnership.
Fair Value of Financial Instruments
The carrying values of cash and cash equivalents, marketable securities, escrows, receivables, accounts payable, accrued expenses and other assets and liabilities are reasonable estimates of their fair values because of the short maturities of these instruments.
In April 2009,The Company follows the FASB issued ASC 825-10-65 “Transition Related to FSP FAS 107-1 and APB 28-1, Interim Disclosures about Fair Value of Financial Instruments” (“ASC 825-10-65”) (formerly known as FSP No. FAS 107-1 and APB 28-1, “Interim Disclosures about Fair Value of Financial Instruments” (“FSP No. FAS 107-1”)). ASC 825-10-65 requires disclosures about fair-value ofauthoritative guidance for fair value measurements when valuing its financial instruments for interim reporting periods of publicly-traded companies as well as in annual financial statements. ASC 825-10-65 requires those disclosures in summarized financial information at interim reporting periods. ASC 825-10-65 was effective for interim reporting periods ending after June 15, 2009, with early adoption permitted for periods ending after March 15, 2009. For purposes of financial reporting disclosures, thedisclosure purposes. The Company calculatesdetermines the fair value of mortgage notes payable,its unsecured senior notes and unsecured exchangeable senior notes.notes using market prices. The inputs used in determining the fair value of the Company’s unsecured senior notes and unsecured exchangeable senior notes is categorized at a level 1 basis (as defined in the accounting standards for Fair Value Measurements and Disclosures) due to the fact that the Company uses quoted market rates to value these instruments. However, the inputs used in determining the fair value could be categorized at a level 2 basis if trading volumes are low. The Company discountsdetermines the fair value of its mortgage notes payable using discounted cash flow analyses by discounting the spread between the future contractual interest payments and hypothetical future interest payments on mortgage debt and unsecured notes based on a current market rate.rates for similar securities. In determining the current market rate,rates, the Company adds its estimationestimates of a market spreadspreads to the quoted yields on federal government treasury securities with similar maturity dates to its debt. The inputs used in determining the fair value of the Company’s mortgage notes payable are categorized at a level 3 basis (as defined in the accounting standards for Fair Value Measurements and Disclosures) due to the fact that the Company considers the rates used in the valuation techniques to be unobservable inputs.
Because the Company’s valuations of its financial instruments are based on these types of estimates, the actual fair valuevalues of its financial instruments may differ materially if the Company’s estimates do not prove to be accurate. The following table presents the aggregate carrying value of the Company’s indebtedness and the Company’s corresponding estimate of fair value as of December 31, 20102012 and 2009December 31, 2011 (in thousands):
| December 31, 2010 | December 31, 2009 | December 31, 2012 | December 31, 2011 | |||||||||||||||||||||||||||||
| Carrying Amount | Estimated Fair Value | Carrying Amount | Estimated Fair Value | Carrying Amount | Estimated Fair Value | Carrying Amount | Estimated Fair Value | |||||||||||||||||||||||||
Mortgage notes payable | $ | 3,047,586 | $ | 3,121,193 | $ | 2,643,301 | $ | 2,615,099 | $ | 3,102,485 | $ | 3,256,940 | $ | 3,123,267 | $ | 3,297,903 | ||||||||||||||||
Unsecured senior notes | 3,016,598 | 3,241,542 | 2,172,389 | 2,318,868 | 4,639,528 | 5,162,486 | 3,865,186 | 4,148,461 | ||||||||||||||||||||||||
Unsecured exchangeable senior notes | 1,721,817 | (1) | 1,929,291 | 1,904,081 | (1) | 2,059,796 | 1,170,356 | (1) | 1,278,554 | 1,715,685 | (1) | 1,904,115 | ||||||||||||||||||||
|
|
|
| |||||||||||||||||||||||||||||
Total | $ | 7,786,001 | $ | 8,292,026 | $ | 6,719,771 | $ | 6,993,763 | $ | 8,912,369 | $ | 9,697,980 | $ | 8,704,138 | $ | 9,350,479 | ||||||||||||||||
|
|
|
| |||||||||||||||||||||||||||||
| (1) | Includes the net impact of Accounting Standards Codification (“ASC”) ASC 470-20 |
Derivative Instruments and Hedging Activities
Derivative instruments and hedging activities require management to make judgments on the nature of its derivatives and their effectiveness as hedges. These judgments determine if the changes in fair value of the derivative instruments are reported in the consolidated statements of operations as a component of net income or as a component of comprehensive income and as a component of equity on the consolidated balance sheets. While management believes its judgments are reasonable, a change in a derivative’s effectiveness as a hedge could materially affect expenses, net income and equity. The Company accounts for the effective portion of changes in the fair value of a derivative in other comprehensive income (loss) and subsequently reclassifies the effective portion to earnings over the term that the hedged transaction affects earnings. The Company accounts for the ineffective portion of changes in the fair value of a derivative directly in earnings. The Company recognized net derivative losses of approximately $17.0 million for the year ended December 31, 2008 within the caption Net Derivative Losses in the Consolidated Statements of Operations.
Income Taxes
The Company has elected to be treated as a REIT under Sections 856 through 860 of the Internal Revenue Code of 1986, as amended (the “Code”), commencing with its taxable year ended December 31, 1997. As a result, the Company generally will not be subject to federal corporate income tax on its taxable income that is distributed to its stockholders. A REIT is subject to a number of organizational and operational requirements, including a requirement that it currently distribute at least 90% of its annual taxable income. The Company’s policy is to distribute at least 100% of its taxable income. Accordingly, the only provision for federal income taxes in the accompanying consolidated financial statements relates to the Company’s consolidated taxable REIT subsidiaries. The Company’s taxable REIT subsidiaries did not have significant tax provisions or deferred income tax items.
The Company owns a hotel property which is managed through a taxable REIT subsidiary. The hotel taxable REIT subsidiary, a wholly owned subsidiary of the Operating Partnership, is the lessee pursuant to the lease for the hotel property. As lessor, the Operating Partnership is entitled to a percentage of gross receipts from the hotel property. Marriott International, Inc. continues to manage the hotel property under the Marriott name and under terms of the existing management agreements. In connection with the restructuring, the revenue and expenses of the hotel property are being reflected in the Company’s Consolidated Statements of Operations. The hotel taxable REIT subsidiary is subject to tax at the federal and state level and, accordingly, the Company has recorded a tax provision in the Company’s Consolidated Statements of Operations for the years ended December 31, 2010, 20092012, 2011 and 2008.2010.
The net difference between the tax basis and the reported amounts of the Company’s assets and liabilities is approximately $1.2$0.8 billion and $1.4$0.9 billion as of December 31, 20102012 and 2009,2011, respectively, which is primarily related to the difference in basis of contributed property and accrued rental income.
Certain entities included in the Company’s consolidated financial statements are subject to certain state and local taxes. These taxes are recorded as operating expenses in the accompanying consolidated financial statements.
The following table reconciles GAAP net income attributable to Boston Properties, Inc. to taxable income:
| For the year ended December 31, | For the year ended December 31, | |||||||||||||||||||||||
| 2010 | 2009 | 2008 | 2012 | 2011 | 2010 | |||||||||||||||||||
| (in thousands) | (in thousands) | |||||||||||||||||||||||
Net income attributable to Boston Properties, Inc. | $ | 159,072 | $ | 231,014 | $ | 105,270 | $ | 289,650 | $ | 272,679 | $ | 159,072 | ||||||||||||
Straight-line rent adjustments | (75,943 | ) | (38,287 | ) | (20,432 | ) | (80,281 | ) | (77,422 | ) | (75,943 | ) | ||||||||||||
Book/Tax differences from depreciation and amortization | 67,362 | 61,366 | 78,047 | 105,599 | 117,675 | 67,362 | ||||||||||||||||||
Book/Tax differences on gains/losses from capital transactions | (2,373 | ) | (10,111 | ) | (28,502 | ) | (22,408 | ) | (38,443 | ) | (2,373 | ) | ||||||||||||
Book/Tax differences from stock-based compensation | (1,957 | ) | 15,966 | (19,300 | ) | 19,660 | 827 | (1,957 | ) | |||||||||||||||
Book/Tax differences on losses from early extinguishments of debt | 6,448 | — | — | — | 40 | 6,448 | ||||||||||||||||||
Impairment loss on investments in unconsolidated joint ventures | — | 6,374 | 161,000 | |||||||||||||||||||||
Other book/tax differences, net | 3,921 | 492 | 33,410 | 35,461 | 29,349 | 3,921 | ||||||||||||||||||
|
|
| ||||||||||||||||||||||
Taxable income | $ | 156,530 | $ | 266,814 | $ | 309,493 | $ | 347,681 | $ | 304,705 | $ | 156,530 | ||||||||||||
|
|
| ||||||||||||||||||||||
Stock-based employee compensation plansStock-Based Employee Compensation Plans
At December 31, 2010,2011, the Company has a stock-based employee compensation plan. Effective January 1, 2005, the Company adopted early ASC 718 “Compensation – Stock Compensation” (“ASC 718”) (formerly SFAS No. 123 (revised) (“SFAS No. 123R”), “Share-Based Payment”), which revised the fair value based method of accounting for share-based payment liabilities, forfeitures and modifications of stock-based awards and clarified previous guidance in several areas, including measuring fair value, classifying an award as equity or as a liability and attributing compensation cost to reporting periods.
Use of Estimates in the Preparation of Financial Statements
The preparation of financial statements in conformity with accounting principles generally accepted in the United States of America requires management to make estimates and assumptions that affect the reported amounts of assets and liabilities and disclosure of contingent assets and liabilities at the date of the financial statements and the reported amounts of revenue and expenses during the reporting period. These estimates include such items as depreciation and allowances for doubtful accounts. Actual results could differ from those estimates.
Out-of-Period Adjustment
During the year ended December 31, 2012, the Company recorded additional real estate operating expenses totaling approximately $3.2 million related to the cumulative non-cash straight-line adjustment to the ground rent expense of certain ground leases that were not previously recognized on a straight-line basis. This resulted in the overstatement of real estate operating expenses by approximately $3.2 million during the year ended December 31, 2012 and in the understatement of real estate operating expenses in the aggregate amount of approximately $3.2 million in previous periods. Because this adjustment was not material to the prior years’ consolidated financial statements and the impact of recording the adjustment in the current period is not material to the Company’s consolidated financial statements, the Company recorded the related adjustment during the year ended December 31, 2012.
3. Real Estate
Real estate consisted of the following at December 31 (in thousands):
| 2010 | 2009 | 2012 | 2011 | |||||||||||||
Land | $ | 2,216,768 | $ | 1,983,064 | $ | 2,605,162 | $ | 2,356,522 | ||||||||
Land held for future development | 757,556 | 718,525 | 275,094 | 266,822 | ||||||||||||
Buildings and improvements | 7,602,704 | 6,888,421 | 9,517,343 | 8,658,468 | ||||||||||||
Tenant improvements | 1,090,462 | 922,224 | 1,435,508 | 1,262,616 | ||||||||||||
Furniture, fixtures and equipment | 24,043 | 23,679 | 23,441 | 26,359 | ||||||||||||
Construction in progress | 1,073,402 | 563,645 | 1,036,780 | 818,685 | ||||||||||||
|
| |||||||||||||||
Total | 12,764,935 | 11,099,558 | 14,893,328 | 13,389,472 | ||||||||||||
Less: Accumulated depreciation | (2,323,818 | ) | (2,033,677 | ) | (2,934,160 | ) | (2,642,986 | ) | ||||||||
|
| |||||||||||||||
| $ | 10,441,117 | $ | 9,065,881 | $ | 11,959,168 | $ | 10,746,486 | |||||||||
|
| |||||||||||||||
Acquisitions
On JulyMarch 1, 2010,2012, the Company acquired the mortgage loan collateralized by a land parcel zoned for residential use453 Ravendale Drive located in Reston, Virginia for approximately $20.3 million. In connection with the acquisition of the loan, the Company entered into a forbearance agreement pursuant to which it obtained the fee interest in the land by deed in lieu of foreclosure.
On September 24, 2010, the Company acquired fee title to 510 Madison Avenue in New York CityMountain View, California for a purchase price of approximately $287.0 million. In connection with the acquisition, the Company also incurred approximately $1.5$6.7 million of acquisition costs that were expensed during the year ended December 31, 2010. Previously, on August 10, 2010, the Company had acquired the junior mezzanine loan that was secured by a pledge of a subordinate ownership interest in the property for a purchase price of approximately $22.5 million. 510 Madison Avenuecash. 453 Ravendale Drive is an approximately 347,000 square foot Class A office tower. The Company has not included any pro forma information as the property is under development. In connection with the acquisition, the Company assumed the mortgage loan totaling approximately $202.6 million and, at closing, the Company caused the assignment of the mortgage to a new lender and subsequently increased the amount borrowed to $267.5 million. This amount is fully secured by cash deposits included within “Cash Held in Escrows” in the Company’s Consolidated Balance Sheets. The mortgage financing bears interest at a variable rate equal to LIBOR plus 0.30% per annum and matures on February 24, 2012.
On December 29, 2010, the Company completed the acquisition of the John Hancock Tower and Garage in Boston, Massachusetts for an aggregate purchase price of approximately $930.0 million. The purchase price consisted of approximately $289.5 million of cash and the assumption of approximately $640.5 million of indebtedness. The assumed debt is a securitized senior mortgage loan that bears interest at a fixed rate of 5.68% per annum and matures on January 6, 2017. The loan requires interest-only payments with a balloon payment due at maturity. In connection with the acquisition, the Company incurred an aggregate of approximately $0.9 million of acquisition costs that were expensed during the year ended December 31, 2010. The John Hancock Tower is a 62-story, approximately 1,700,00030,000 net rentable square foot office tower located in Boston’s Back Bay neighborhood. The garage is an eight-level, 2,013 space parking facility. The seller has agreed to (1) fund the cost of and complete certain capital projects and (2) fund the cost of certain tenant improvements, both of which are currently underway, totaling approximately $46.0 million, of which approximately $35.3 million represents the aggregate cost to complete the projects and is included with prepaid expenses and other assets within the Company’s consolidated balance sheets.Office/Technical property. The following table summarizes the allocation of the aggregate purchase price of the John Hancock Tower and Garage,453 Ravendale Drive at the date of acquisition (in thousands).
Land | $ | 219,543 | ||
Building and improvements | 627,074 | |||
Tenant improvements | 40,810 | |||
Tenant leasing costs | 114,494 | |||
Other assets/liabilities, net | 33,045 | |||
Above market rents | 15,368 | |||
Below market rents | (97,481 | ) | ||
Above market assumed debt adjustment | (22,853 | ) | ||
Total aggregate purchase price | $ | 930,000 | ||
Less: Indebtedness assumed | (640,500 | ) | ||
Net assets acquired | $ | 289,500 | ||
Land | $ | 5,477 | ||
Building and improvements | 974 | |||
Tenant improvements | 116 | |||
In-place lease intangibles | 223 | |||
Below-market rents | (140 | ) | ||
|
| |||
Net assets acquired | $ | 6,650 | ||
|
|
On March 13, 2012, the Company acquired 100 Federal Street in Boston, Massachusetts for an aggregate investment of approximately $615.0 million in cash. In connection with the transaction, the Company entered into a long-term lease with an affiliate of Bank of America for approximately 732,000 square feet. 100 Federal Street is an approximately 1,265,000 net rentable square foot, 37-story Class A office tower located in Boston, Massachusetts. The following table summarizes the estimated annual amortizationallocation of the acquired below market leases (netaggregate purchase price of acquired above market leases) and100 Federal Street at the acquired in-place lease intangibles for the John Hancock Tower and Garage for eachdate of the five succeeding yearsacquisition (in thousands).
| Acquired In-Place Lease Intangible | Acquired Net Below Market Lease Intangible | |||||||
2011 | $ | 20,659 | $ | (9,313 | ) | |||
2012 | 19,305 | (9,389 | ) | |||||
2013 | 17,792 | (9,332 | ) | |||||
2014 | 15,890 | (9,171 | ) | |||||
2015 | 5,607 | (5,124 | ) | |||||
Land | $ | 131,067 | ||
Building and improvements | 387,321 | |||
Tenant improvements | 48,633 | |||
In-place lease intangibles | 69,530 | |||
Above-market rents | 81 | |||
Other assets | 4,800 | |||
Below-market rents | (22,515 | ) | ||
Accounts payable and accrued expenses | (3,917 | ) | ||
|
| |||
Net assets acquired | $ | 615,000 | ||
|
|
On October 4, 2012, the Company completed the formation of a joint venture, which owns and operates Fountain Square located in Reston, Virginia, adjacent to the Company’s other Reston properties. Fountain Square is an office and retail complex aggregating approximately 758,000 net rentable square feet, comprised of approximately 521,000 net rentable square feet of Class A office space and approximately 237,000 net rentable square feet of retail space. The joint venture partner contributed the property valued at approximately $385.0 million and related mortgage indebtedness totaling approximately $211.3 million for a nominal 50% interest in the joint venture. The Company contributed cash totaling approximately $87.0 million for its nominal 50% interest, which cash was distributed to the joint venture partner. The Company is consolidating this joint venture. The mortgage loan bears interest at fixed rate of 5.71% per annum and matures on October 11, 2016. Pursuant to the joint venture agreement (i) the Company has rights to acquire the partner’s nominal 50% interest and (ii) the partner has the right to cause the Company to acquire the partner’s interest on January 4, 2016, in each case at a fixed price totaling approximately $102.0 million in cash (See Note 11). The fixed price option rights expire on January 31, 2016. The following table summarizes the allocation of the aggregate purchase price of Fountain Square at the date of acquisition (in thousands).
Land | $ | 56,853 | ||
Building and improvements | 274,735 | |||
Tenant improvements | 31,563 | |||
In-place lease intangibles | 41,256 | |||
Other assets | 35,774 | |||
Above market rents | 6,240 | |||
Below market rents | (7,089 | ) | ||
Above market assumed debt adjustment | (23,122 | ) | ||
Other liabilities | (6,194 | ) | ||
|
| |||
Total aggregate consideration | $ | 410,016 | ||
Less: Indebtedness assumed | (211,250 | ) | ||
Redeemable noncontrolling interest | (98,787 | ) | ||
|
| |||
Net assets acquired | $ | 99,979 | ||
|
|
100 Federal Street contributed approximately $52.6 million of revenue and approximately $8.5 million of earnings to the Company for the period from March 13, 2012 through December 31, 2012. Fountain Square contributed approximately $8.7 million of revenue and approximately $(3.2) million of earnings to the Company for the period from October 4, 2012 through December 31, 2012. 453 Ravendale Drive contributed approximately $0.5 million of revenue and approximately $0.2 million of earnings to the Company for the period from March 1, 2012 through December 31, 2012.
The accompanying unaudited pro forma information for the years ended December 31, 20102012 and 20092011 is presented as if the acquisitionoperating property acquisitions of the John Hancock Tower(1) 453 Ravendale Drive on March 1, 2012, (2) 100 Federal Street on March 13, 2012 and Garage(3) Fountain Square on December 29, 2010October 4, 2012, had occurred on January 1, 2009.2011. This unaudited pro forma information is based upon the historical consolidated financial statements and should be read in conjunction with the consolidated financial statements and notes thereto. This unaudited pro forma information does not purport to represent what the actual results of operations of the Company would have been had the above occurred, nor do they purport to predict the results of operations of future periods.
| Pro Forma | Year Ended December 31, | |||||||||||||||
(in thousands, except per share data) | 2010 | 2009 | ||||||||||||||
Pro Forma (Unaudited) (in thousands, except per share data) | Year ended December 31, | |||||||||||||||
| 2012 | 2011 | |||||||||||||||
Total revenue | $ | 1,657,995 | $ | 1,625,309 | $ | 1,917,292 | $ | 1,852,446 | ||||||||
Income from continuing operations | $ | 169,404 | $ | 243,412 | $ | 292,089 | $ | 315,753 | ||||||||
Net income attributable to Boston Properties, Inc. | $ | 143,202 | $ | 214,282 | $ | 282,737 | $ | 269,501 | ||||||||
Basic earnings per share: | ||||||||||||||||
Net income per share attributable to Boston Properties, Inc. | $ | 1.03 | $ | 1.64 | $ | 1.88 | $ | 1.85 | ||||||||
Diluted earnings per share: | ||||||||||||||||
Net income per share attributable to Boston Properties, Inc. | $ | 1.02 | $ | 1.63 | $ | 1.88 | $ | 1.84 | ||||||||
Developments
On February 6, 2009,January 3, 2012, the Company announced that it was suspending construction on its 1,000,000commenced the redevelopment of Two Patriots Park, a Class A office project with approximately 256,000 net rentable square foot project at 250 West 55th Streetfeet located in New York City. DuringReston, Virginia. The Company will capitalize incremental costs during the year ended December 31, 2009, the Company recognized costs aggregating approximately $27.8 million related to the suspension of development, which amount included a $20.0 million contractual amount due pursuant to a lease agreement. During December 2009,redevelopment.
On April 30, 2012, the Company completed the construction of foundations and steel/deck to grade to facilitate a restart of construction in the future and as a result ceased interest capitalization on the project. On January 19, 2010, the Company paid $12.8 million related to the termination of the lease agreement. As a result, the Company recognized approximately $7.2 million of income during the year ended December 31, 2010.
On June 1, 2010, the Companyfully placed in-service Weston Corporate Center, an510 Madison Avenue, a Class A office project with approximately 356,000 net rentable square footfeet located in New York City.
On May 4, 2012, the Company completed and fully placed in-service One Patriots Park, a Class A office propertyredevelopment project with approximately 268,000 net rentable square feet located in Weston, Massachusetts. The property is 100% leased.Reston, Virginia.
On October 20, 2010,August 29, 2012, the Company closed a transaction with a financial institution (the “HTC Investor”) related to the historic rehabilitation of the residential component of the Company’s Atlantic Wharf development in Boston, Massachusetts (the “residential project”). The residential project is expected to result inacquired the development ofproject located at 680 Folsom Street and 50 Hawthorne Street (which we refer to collectively herein as 680 Folsom Street) in San Francisco, California. When completed, the project will comprise approximately 86 units of residential rental apartments and approximately 10,000522,000 net rentable square feet of Class A office and retail space. Because,The project is approximately 85% pre-leased and as a REIT,result the Company may not take full advantagehas accounted for the acquisition as a business combination. The estimated project cost upon completion is approximately $340 million. As part of available historic tax credits,the transaction, the Company admittedalso acquired the HTC Investor ascorner site of 690 Folsom Street, which is an adjacent parcel with a partnervacant 22,000 square foot, two-story structure that may be redeveloped in the residential project.future. The HTC Investor has agreedconsideration paid by the Company to contribute an aggregatethe seller consisted of approximately $14$62.2 million toin cash and the projectissuance of 1,588,100 Series Four Preferred Units of limited partnership interest in three installments in 2010 and 2011, subject to the Company’s achievementOperating Partnership. The Series Four Preferred Units are not convertible into or exchangeable for any common equity of certain conditions that include construction milestonesthe Operating Partnership or the Company, have a per unit liquidation preference of $50.00 and its complianceare entitled to receive quarterly distributions of $0.25 per unit (or an annual rate of 2.0%) (See Note 11). In connection with the federal rehabilitation regulations. In exchange for its contribution,acquisition, the HTC Investor will receive substantially allCompany also assumed a $170.0 million construction loan commitment (See Note 6). The following table summarizes the allocation of the benefits derived fromaggregate purchase price of 680 Folsom Street at the tax credits.date of acquisition (in thousands).
Construction in progress | $ | 117,046 | ||
Land held for future development | 3,058 | |||
In-place lease intangibles | 32,799 | |||
Deferred financing costs | 245 | |||
Prepaid expenses and other assets | 7,473 | |||
Accounts payable and accrued expenses | (14,502 | ) | ||
|
| |||
Net assets acquired | $ | 146,119 | ||
|
|
Dispositions
On April 14, 2008,January 31, 2012, the servicer of the non-recourse mortgage loan collateralized by the Company’s Montvale Center property located in Gaithersburg, Maryland foreclosed on the property. During 2011, the Company sold a parcelhad notified the master servicer of land located in Washington, DC for approximately $33.7 million.the non-recourse mortgage loan that the cash flows generated from the property were insufficient to fund debt service payments and capital improvements necessary to lease and operate the property and that the Company was not prepared to fund any cash shortfalls. The Company had previously entered intowas not current on making debt service payments and began accruing interest at the default interest rate of 9.93% per annum. The loan was originally scheduled to mature on June 6, 2012. As a development management agreement withresult of the buyer to developforeclosure, the Company recognized a Class A office propertygain on forgiveness of debt of approximately $17.8 million during the parcel totaling approximately 165,000 net rentable square feet.quarter ended March 31, 2012. Due to a procedural error by the Company’s involvement intrustee, the construction offoreclosure sale was subsequently dismissed by the project,applicable court prior to ratification. As a result, the Company has revised its financial statements to properly reflect the property and related mortgage debt on its consolidated balance sheet at December 31, 2012 and has reversed the gain on sale was deferredforgiveness of debt and has been recognized over the project construction period generally based onoperating activity from the percentageproperty within its consolidated statement of total project costs incurred to estimated total project costs. Duringoperations for the year ended December 31, 2010,2012. A subsequent foreclosure sale occurred on December 21, 2012 and ratification by the applicable court is pending (See Notes 6 and 19).
On May 17, 2012, the Company completed constructionthe sale of the project and recognized the remaining gain on sale totalingits Bedford Business Park properties located in Bedford, Massachusetts for approximately $1.8 million. The Company has recognized$62.8 million in cash. Net cash proceeds totaled approximately $62.0 million, resulting in a cumulative gain on sale of approximately $23.4$36.9 million.
On May 5, 2010,The following table summarizes the Company satisfied the requirements of its master lease agreementincome from discontinued operations related to Bedford Business Park and the 2006 sale of 280 Park Avenue in New York City, resulting in the recognition of the remaining deferredrelated gain on sale of real estate totaling approximately $1.0 million. Followingfor the satisfaction of the master lease agreement, the buyer terminated the property managementyears ended December 31, 2012, 2011 and leasing agreement entered into at the time of the sale, resulting in the recognition of non-cash deferred management fees totaling approximately $12.2 million.2010:
| For the year ended December 31, | ||||||||||||
| 2012 | 2011 | 2010 | ||||||||||
| (in thousands) | ||||||||||||
Total revenue | $ | 3,526 | $ | 8,206 | $ | 7,494 | ||||||
Expenses | ||||||||||||
Operating | 1,510 | 3,753 | 3,540 | |||||||||
Depreciation and amortization | 976 | 2,572 | 2,512 | |||||||||
|
|
|
|
|
| |||||||
Total expenses | 2,486 | 6,325 | 6,052 | |||||||||
Income from discontinued operations | $ | 1,040 | $ | 1,881 | $ | 1,442 | ||||||
Noncontrolling interest in income from discontinued operations – common units of the Operating Partnership | (109 | ) | (215 | ) | (184 | ) | ||||||
|
|
|
|
|
| |||||||
Income from discontinued operations attributable to Boston Properties, Inc. | $ | 931 | $ | 1,666 | $ | 1,258 | ||||||
|
|
|
|
|
| |||||||
Gain on sale of real estate from discontinued operations | $ | 36,877 | $ | — | $ | — | ||||||
Noncontrolling interest in gain on sale of real estate from discontinued operations – common units of the Operating Partnership | (4,045 | ) | — | — | ||||||||
|
|
|
|
|
| |||||||
Gain on sale of real estate from discontinued operations attributable to Boston Properties, Inc. | $ | 32,832 | $ | — | $ | — | ||||||
|
|
|
|
|
| |||||||
4. Deferred Charges
Deferred charges consisted of the following at December 31, (in thousands):
| 2010 | 2009 | 2012 | 2011 | |||||||||||||
Leasing costs (and lease related intangibles) | $ | 558,620 | $ | 399,302 | ||||||||||||
Leasing costs, including lease related intangibles | $ | 790,740 | $ | 598,352 | ||||||||||||
Financing costs | 89,680 | 76,915 | 90,682 | 85,554 | ||||||||||||
|
| |||||||||||||||
| 648,300 | 476,217 | 881,422 | 683,906 | |||||||||||||
Less: Accumulated amortization | (212,281 | ) | (181,822 | ) | (293,187 | ) | (238,503 | ) | ||||||||
|
| |||||||||||||||
| $ | 436,019 | $ | 294,395 | $ | 588,235 | $ | 445,403 | |||||||||
|
| |||||||||||||||
The following table summarizes the scheduled amortization of the Company’s acquired in-place lease intangibles for each of the five succeeding years (in thousands).
| Acquired In-Place Lease Intangibles | ||||
2013 | $ | 43,077 | ||
2014 | 35,861 | |||
2015 | 20,242 | |||
2016 | 15,041 | |||
2017 | 11,215 | |||
5. Investments in Unconsolidated Joint Ventures
The investments in unconsolidated joint ventures consistsconsist of the following at December 31, 2010:2012:
Entity | Properties | Nominal % Ownership | ||
Square 407 Limited Partnership | Market Square North | 50.0% | ||
The Metropolitan Square Associates LLC | Metropolitan Square | 51.0% | ||
BP/CRF 901 New York Avenue LLC | 901 New York Avenue | 25.0%(1) | ||
WP Project Developer LLC | Wisconsin Place Land and Infrastructure | 33.3%(2) | ||
RBP Joint VentureLLC | Eighth Avenue and 46thStreet | 50.0%(3) | ||
Boston Properties Office Value-Added Fund, L.P. | Mountain View Research and Technology Parks | |||
Annapolis Junction NFM, LLC | Annapolis Junction | 50.0% | ||
767 Venture, LLC | 60.0% | |||
2 GCT Venture LLC | Two Grand Central Tower | 60.0%(5) | ||
540 Madison Venture LLC | 540 Madison Avenue | 60.0% | ||
125 West 55thStreet Venture LLC | 125 West 55thStreet | 60.0% | ||
500 North CapitolLLC | 500 North Capitol Street, NW | 30.0%(6) | ||
Transit Tower Site LLC | Transbay Tower | 50.0%(7) |
| (1) | The Company’s economic ownership can increase based on the achievement of certain return thresholds. |
| (2) | The Company’s wholly-owned entity that owns the office component of the project also owns a 33.3% interest in the entity owning the land, parking and infrastructure of the project. |
| (3) | This property is not in operation and consists of assembled land. |
| (4) |
| (5) |
| (6) | This property has been partially placed in-service. |
| (7) | See Note 20. |
Certain of the Company’s joint venture agreements include provisions whereby, at certain specified times, each partner has the right to initiate a purchase or sale of its interest in the joint ventures at an agreed upon fair value. Under these provisions, the Company is not compelled to purchase the interest of its outside joint venture partners.
The combined summarized financial informationbalance sheets of the unconsolidated joint ventures isare as follows (in thousands):follows:
| December 31, | December 31, 2012 | December 31, 2011 | ||||||||||||||
Balance Sheets | 2010 | 2009 | ||||||||||||||
| (in thousands) | ||||||||||||||||
| ASSETS | ||||||||||||||||
Real estate and development in process, net | $ | 5,028,851 | $ | 5,149,868 | $ | 4,494,971 | $ | 4,542,594 | ||||||||
Other assets | 749,308 | 760,001 | 673,716 | 668,113 | ||||||||||||
|
| |||||||||||||||
Total assets | $ | 5,778,159 | $ | 5,909,869 | $ | 5,168,687 | $ | 5,210,707 | ||||||||
|
| |||||||||||||||
Mortgage and Notes payable | $ | 3,151,220 | $ | 3,217,893 | ||||||||||||
| LIABILITIES AND MEMBERS’/PARTNERS’ EQUITY | ||||||||||||||||
Mortgage and notes payable | $ | 3,039,922 | $ | 2,988,894 | ||||||||||||
Other liabilities | 969,082 | 1,071,904 | 792,888 | 854,257 | ||||||||||||
Members’/Partners’ equity | 1,657,857 | 1,620,072 | 1,335,877 | 1,367,556 | ||||||||||||
|
| |||||||||||||||
Total liabilities and members’/partners’ equity | $ | 5,778,159 | $ | 5,909,869 | $ | 5,168,687 | $ | 5,210,707 | ||||||||
|
| |||||||||||||||
Company’s share of equity | $ | 924,235 | $ | 927,184 | $ | 787,941 | $ | 799,479 | ||||||||
Basis differential(1) | (156,983 | ) | (163,548 | ) | ||||||||||||
Basis differentials (1) | (128,025 | ) | (129,757 | ) | ||||||||||||
|
| |||||||||||||||
Carrying value of the Company’s investments in unconsolidated joint ventures | $ | 767,252 | $ | 763,636 | $ | 659,916 | $ | 669,722 | ||||||||
|
| |||||||||||||||
| (1) | This amount represents the aggregate difference between the Company’s historical cost basis and the basis reflected at the joint venture level, which is typically amortized over the life of the related assets and liabilities. Basis differentials occur from impairment of investments and upon the transfer of assets that were previously owned by the Company into a joint venture. In addition, certain acquisition, transaction and other costs may not be reflected in the net assets at the joint venture level. |
The combined summarized statements of operations of the joint ventures are as follows:
Statements of Operations | Year Ended December 31, | |||||||||||||||||||||||
| 2010 | 2009 | 2008 | ||||||||||||||||||||||
| (in thousands) | For the year ended December 31, | |||||||||||||||||||||||
Total revenue(1) | $ | 607,915 | $ | 595,533 | $ | 363,168 | ||||||||||||||||||
| 2012 | 2011 | 2010 | ||||||||||||||||||||||
| (in thousands) | ||||||||||||||||||||||||
Total revenue (1) | $ | 564,205 | $ | 589,294 | $ | 607,915 | ||||||||||||||||||
Expenses | ||||||||||||||||||||||||
Operating | 175,309 | 163,209 | 101,670 | 162,665 | 170,404 | 175,309 | ||||||||||||||||||
Depreciation and amortization | 215,533 | 232,047 | 144,712 | 163,134 | 190,437 | 215,533 | ||||||||||||||||||
Impairment losses | — | 40,468 | — | |||||||||||||||||||||
|
|
| ||||||||||||||||||||||
Total expenses | 390,842 | 395,256 | 246,382 | 325,799 | 401,309 | 390,842 | ||||||||||||||||||
Operating income | 217,073 | 200,277 | 116,786 | 238,406 | 187,985 | 217,073 | ||||||||||||||||||
Other income (expense) | ||||||||||||||||||||||||
Interest expense | (235,723 | ) | (232,978 | ) | (139,154 | ) | (224,645 | ) | (228,494 | ) | (235,723 | ) | ||||||||||||
Gains (losses) from early extinguishments of debt | 17,920 | — | (152 | ) | ||||||||||||||||||||
Loss on guarantee obligation | (3,800 | ) | — | — | — | — | (3,800 | ) | ||||||||||||||||
Impairment losses | — | (24,568 | ) | (40,570 | ) | |||||||||||||||||||
Gains from early extinguishments of debt | — | — | 17,920 | |||||||||||||||||||||
|
|
| ||||||||||||||||||||||
Net loss | $ | (4,530 | ) | $ | (57,269 | ) | $ | (63,090 | ) | |||||||||||||||
Income (loss) from continuing operations | 13,761 | (40,509 | ) | (4,530 | ) | |||||||||||||||||||
Gain on sale of real estate | 990 | — | — | |||||||||||||||||||||
|
|
| ||||||||||||||||||||||
Company’s share of net loss | $ | (5,691 | ) | $ | (22,197 | ) | $ | (30,910 | ) | |||||||||||||||
Impairment losses on investments | — | (9,385 | ) | (168,040 | ) | |||||||||||||||||||
Gain on sale of investment | 572 | — | — | |||||||||||||||||||||
Net income (loss) | $ | 14,751 | $ | (40,509 | ) | $ | (4,530 | ) | ||||||||||||||||
|
|
| ||||||||||||||||||||||
Company’s share of net income (loss) | $ | 6,863 | $ | (25,374 | ) | $ | (5,691 | ) | ||||||||||||||||
Gain on sale of real estate | — | 46,166 | 572 | |||||||||||||||||||||
Basis differential | 6,565 | 11,299 | — | 1,732 | 27,226 | 6,565 | ||||||||||||||||||
Elimination of inter-entity interest on partner loan | 35,328 | 32,341 | 16,932 | 40,483 | 37,878 | 35,328 | ||||||||||||||||||
|
|
| ||||||||||||||||||||||
Income (loss) from unconsolidated joint ventures | $ | 36,774 | $ | 12,058 | $ | (182,018 | ) | |||||||||||||||||
Income from unconsolidated joint ventures | $ | 49,078 | $ | 85,896 | $ | 36,774 | ||||||||||||||||||
|
|
| ||||||||||||||||||||||
| (1) | Includes straight-line rent adjustments of |
On March 1, 2010, a joint venture in which the Company has a 60% interest refinanced at maturity its mortgage loan collateralized by 125 West 55th Street located in New York City. The mortgage loan totaling $200.0 million bore interest at a fixed rate of 5.75% per annum. The new mortgage loan totaling $207.0 million bears interest at a fixed rate of 6.09% per annum and was scheduled to mature on March 10, 2015. On July 23, 2010, the joint venture modified the mortgage loan by extending the maturity date of the loan to March 10, 2020. All other terms of the mortgage loan remain unchanged. In connection with the new mortgage loan, the Company has guaranteed the joint venture’s obligation to fund an escrow related to certain lease rollover costs in lieu of an initial cash deposit for the full amount. The maximum funding obligation under the guarantee was $21.3 million. At closing, the joint venture funded a $10.0 million cash deposit into the escrow account and the remaining $11.3 million will be further reduced with scheduled monthly deposits into the escrow account from operating cash flows. As of December 31, 2010, the maximum funding obligation under the guarantee was approximately $7.2 million. The Company earns a fee from the joint venture for providing the guarantee and has an agreement with the outside partners to reimburse the joint venture for their share of any payments made under the guarantee. In addition, on February 25, 2010, the joint venture repaid outstanding mezzanine loans totaling $63.5 million utilizing available cash and cash contributions from the joint venture’s partners on a pro rata basis. The mezzanine loans bore interest at a weighted-average fixed rate of approximately 7.81% per annum and were scheduled to mature on March 1, 2010.
On April 1, 2010, the Company acquired a 30% interest in a joint venture entity that owns 500 North Capitol Street, NW located in Washington, DC. 500 North Capitol Street is an approximately 176,000 net rentable square foot office property that is fully-leased to a single tenant through MarchJuly 25, 2011. On April 1, 2010, the joint venture entity refinanced at maturity the mortgage loan collateralized by the property totaling approximately $26.8 million. The new mortgage loan totaling $22.0 million bears interest at a variable rate equal to the greater of (1) the prime rate, as defined in the loan agreement, or (2) 5.75% per annum. The loan currently bears interest at 5.75% per annum and matures on March 31, 2013. The Company’s investment in the joint venture totaling approximately $1.9 million was financed with cash contributions to the venture totaling approximately $1.4 million and the issuance to the seller of 5,906 OP Units.
On April 9, 2010, a joint venture in which the Company has a 60% interest refinanced its mortgage loan collateralized by Two Grand Central Tower located in New York City. The previous mortgage loan totaling $190.0 million bore interest at a fixed rate of 5.10% per annum and was scheduled to mature on July 11, 2010. The new mortgage loan totaling $180.0 million bears interest at a fixed rate of 6.00% per annum and matures on April 10, 2015. In connection with the refinancing, the joint venture repaid $10.0 million of the previous mortgage loan utilizing cash contributions from the joint venture’s partners on a pro rata basis.
On April 16, 2010, a joint venture in which the Company has a 51% interest refinanced its mortgage loan collateralized by Metropolitan Square located in Washington, DC. The previous mortgage loan totaling approximately $123.6 million bore interest at a fixed rate of 8.23% per annum and was scheduled to mature on May 1, 2010. The new mortgage loan totaling $175.0 million bears interest at a fixed rate of 5.75% per annum and matures on May 5, 2020. On April 26, 2010, the joint venture distributed excess loan proceeds to the partners totaling approximately $49.0 million, of which the Company’s share was approximately $25.0 million.
On June 15, 2010,2012, a joint venture in which the Company has a 50% interest repaid the mortgage loan collateralized by land parcels at its site at Eighth Avenue and 46th Streetpartially placed in-service Annapolis Junction Building Six, a Class A office property with approximately 120,000 net rentable square feet located in New York City utilizing cash contributions from the joint venture’s partners on a pro rata basis. In addition, the joint venture completed an exchange of land parcels with a third party and received land parcels and development rights valued at approximately $6.4 million in exchange for a land parcel valued at approximately $5.4 million and cash of approximately $1.0 million.Annapolis, Maryland.
On September 12, 2010,27, 2012, the Company’s Value-Added Fund completed the sale of its 300 Billerica Road property located in Chelmsford, Massachusetts for approximately $12.2 million, including the assumption by the buyer of $7.5 million of mortgage indebtedness. 300 Billerica Road is an approximately 111,000 net rentable square foot office building. Net cash proceeds totaled approximately $4.3 million, of which the Company’s share was approximately $2.8 million, after the payment of transaction costs. The Company’s share of the net proceeds included approximately $2.4 million resulting from the Value-Added Fund’s repayment of a loan from the Company’s Operating Partnership. The Value-Added Fund recognized a gain on sale of real estate totaling approximately $1.0 million, of which the Company’s share totaled approximately $0.2 million and is included within income from unconsolidated joint ventures in the Company’s consolidated statements of operations.
On October 1, 2012, a joint venture in which the Company has a 50%30% interest exercised its right to extend the maturity date of its mortgage loan collateralized by Annapolis Junctionpartially placed in-service 500 North Capitol Street, NW, a Class A office redevelopment project with approximately 232,000 net rentable square feet located in Annapolis,Washington, DC.
Maryland. The mortgage loan totaling $42.7 million now matures on September 12, 2011 and bears interest at a variable rate equal to LIBOR plus 1.00% per annum. The mortgage loan includes an additional one-year extension option, subject to certain conditions. All other terms ofOn October 19, 2012, the mortgage loan remain unchanged.
On September 20, 2010,Company formed a joint venture to pursue the acquisition of land in San Francisco, California which could support a 61-story, 1.4 million square foot office tower known as Transbay Tower. The purchase price for the land is approximately $190.0 million. The Company has a 50% interest refinanced its mortgage loan collateralized by Market Square North located in Washington, DC. The previous mortgage loan totaling approximately $81.1 million bore interest at a fixed rate of 7.70% per annum and was scheduled to mature on December 19, 2010. The new mortgage loan totaling $130.0 million bears interest at a fixed rate of 4.85% per annum and matures on October 1, 2020. On October 22, 2010, the joint venture distributed excess loan proceeds toventure. The Company has provided a non-refundable deposit for the partnersland purchase in the form of a letter of credit totaling approximately $40.8 million, of which$5.0 million. There can be no assurance that the Company’s share was approximately $20.4 million.acquisition will be consummated on the terms currently contemplated or at all (See Note 20).
On OctoberNovember 21, 2010,2012, the Company’s Value-Added Fund conveyedpartner in its Annapolis Junction joint venture contributed a parcel of land and improvements and the fee simple title to its One and Two Circle Star Way properties and paid $3.8 million to the lender in satisfactionCompany contributed cash of its outstanding obligations under the existing mortgage loan and guarantee. The Company’s Value-Added Fund recognized a net gain on early extinguishment of debt totaling approximately $17.9$5.4 million. The Company had previously recognized impairment losses on its investment in the Value-Added Fund. The mortgage loan had an outstanding principal amount of $42.0 million, bore interest athas a fixed rate of 6.57% per annum and was scheduled to mature on September 1, 2013.
On December 23, 2010, the Company sold its 5.0% equity50% interest in its unconsolidatedthis joint venture. The venture entity that owned the retail portionhas commenced construction of the Wisconsin Place mixed-use property for approximately $1.4 million of cash, resulting in the recognitionAnnapolis Junction Building Seven, which when completed will consist of a gain ofClass A office property with approximately $0.6 million, which amount is included within income (loss) from unconsolidated joint ventures within the Company’s Consolidated Statements of Operations.125,000 net rentable square feet located in Annapolis, Maryland.
6. Mortgage Notes Payable
The Company had outstanding mortgage notes payable totaling approximately $3.0$3.1 billion and $2.6$3.1 billion as of December 31, 20102012 and 2009,2011, respectively, each collateralized by one or more buildings and related land included in real estate assets. The mortgage notes payable are generally due in monthly installments and mature at various dates through August 1, 2021.April 10, 2022.
Fixed rate mortgage notes payable totaled approximately $2.7$3.1 billion and $2.2$3.1 billion at December 31, 20102012 and 2009,2011, respectively, with contractual interest rates ranging from 5.55%4.75% to 7.75%9.93% per annum at December 31, 20102012 and 5.55% to 8.13% per annum2011 (with weighted-averages of 5.65% and 5.75% at December 31, 2009 (with weighted-averages of 6.18%2012 and 6.45%2011, respectively).
There were no variable rate mortgage loans at December 31, 20102012 and 2009, respectively).
Variable rate mortgage notes payable (including construction loans payable) totaled approximately $317.5 million and $393.4 million at December 31, 2010 and 2009, respectively, with interest rates ranging from 0.30% to 2.20% above the London Interbank Offered Rate (“LIBOR”)/Eurodollar at December 31, 2010 and ranging from 1.00% to 3.85% above LIBOR at December 31, 2009.2011. As of December 31, 20102012 and 2009,2011, the LIBOR rate was 0.26%0.21% and 0.23%0.30%, respectively.
On January 31, 2012, the servicer of the non-recourse mortgage loan collateralized by the Company’s Montvale Center property located in Gaithersburg, Maryland foreclosed on the property. During 2011, the Company had notified the master servicer of the non-recourse mortgage loan that the cash flows generated from the property were insufficient to fund debt service payments and capital improvements necessary to lease and operate the property and that the Company was not prepared to fund any cash shortfalls. The Company was not current on making debt service payments and began accruing interest at the default interest rate of 9.93% per annum. The loan was originally scheduled to mature on June 15, 2010,6, 2012. As a result of the foreclosure, the Company recognized a gain on forgiveness of debt of approximately $17.8 million during the quarter ended March 31, 2012. Due to a procedural error by the trustee, the foreclosure sale was subsequently dismissed by the applicable court prior to ratification. As a result, the Company has revised its financial statements to properly reflect the property and related mortgage debt on its consolidated balance sheet at December 31, 2012 and has reversed the gain on forgiveness of debt and recognized the operating activity from the property within its consolidated statement of operations for the year ended December 31, 2012. A subsequent foreclosure sale occurred on December 21, 2012, and ratification by the applicable court is pending. (See Notes 3 and 19).
On March 12, 2012, the Company used available cash to repay the mortgage loan collateralized by its Eight CambridgeBay Colony Corporate Center property located in Cambridge,Waltham, Massachusetts totaling approximately $22.6$143.9 million. The mortgage loanfinancing bore interest at a fixed rate of 7.73%6.53% per annum and was scheduled to mature on July 15, 2010.June 11, 2012. There was no prepayment penalty. The Company recognized a gain on early extinguishment of debt totaling approximately $0.9 million related to the acceleration of the remaining balance of the historical fair value adjustment, which was the result of purchase accounting.
On July 1, 2010, the Company used available cash to repay the mortgage loans collateralized by its 202, 206 & 214 Carnegie Center properties located in Princeton, New Jersey totaling approximately $55.8 million. The mortgage loans bore interest at a fixed rate of 8.13% per annum and were scheduled to mature on October 1, 2010. There were no prepayment penalties.
On August 1, 2010, the Company modified the mortgage loan collateralized by its Reservoir Place property located in Waltham, Massachusetts. The mortgage loan totaling $50.0 million bore interest at a variable rate equal to LIBOR plus 3.85% per annum and matures on July 30, 2014. The modification reduced the interest rate to a variable rate equal to Eurodollar plus 2.20% per annum. All other terms of the mortgage loan remain unchanged.
On September 24, 2010, in connection with the acquisition of 510 Madison Avenue in New York City, the Company assumed the mortgage loan totaling approximately $202.6 million and at closing caused the assignment of the mortgage to a new lender and subsequently increased the amount borrowed to $267.5 million. This amount is fully secured by cash deposits included within “Cash Held in Escrows” in the Company’s Consolidated Balance Sheets. The mortgage financing bears interest at a variable rate equal to LIBOR plus 0.30% per annum and matures on February 24, 2012.
On October 1, 2010, the Company modified its construction loan facility collateralized by its Atlantic Wharf development project in Boston, Massachusetts. The construction loan facility bears interest at a variable rate equal to LIBOR plus 3.00% per annum and matures on April 21,2, 2012, with two, one-year extension options, subject to certain conditions. The modification consisted of releasing from collateral the residential component and ground floor retail included in the “Russia Building” and reducing the loan commitment from $215.0 million to $192.5 million. All other terms of the mortgage loan remain unchanged. The Company has not drawn any amounts under the facility.
On October 20, 2010, the Company used available cash to repay the mortgage loan collateralized by its South of MarketOne Freedom Square property located in Reston, Virginia totaling approximately $188.0$65.1 million. The mortgage financing bore interest at a fixed rate of 7.75% per annum and was scheduled to mature on June 30, 2012. There was no
prepayment penalty. The Company recognized a gain on early extinguishment of debt totaling approximately $0.3 million related to the acceleration of the remaining balance of the historical fair value debt adjustment, which was the result of purchase accounting.
On August 29, 2012, in connection with the Company’s acquisition of the development project located at 680 Folsom Street in San Francisco, California, the Company assumed the construction loan commitment collateralized by the project (See Note 3). The assumed construction loan commitment totaling $170.0 million bore interest at a variable rate equal to LIBOR plus 1.00%3.70% per annum and was scheduled to mature on November 21, 2010. There was no prepayment penalty.May 30, 2015 with two, one-year extension options, subject to certain conditions. On December 18, 2012, the Company terminated the construction loan facility. The Company had not drawn any amounts under the facility.
On October 20, 2010,September 4, 2012, the Company used available cash to repay the mortgage loan collateralized by its Democracy TowerSumner Square property located in Reston, VirginiaWashington, DC totaling approximately $59.8$23.2 million. The mortgage loanfinancing bore interest at a variablefixed rate equal to LIBOR plus 1.75%of 7.35% per annum and was scheduled to mature on December 19, 2010. There was no prepayment penalty.
On NovemberSeptember 1, 2010, the2013. The Company used available cash to repay the mortgage loan collateralized by its 10 & 20 Burlington Mall Road property located in Burlington, Massachusetts and 91 Hartwell Avenue property located in Lexington, Massachusettsrecognized a loss on early extinguishment of debt totaling approximately $32.8 million. The mortgage loan bore interest at a fixed rate of 7.25% per annum and was scheduled to mature on October 1, 2011. The Company paid$0.3 million, which included a prepayment penalty totaling approximately $0.3$0.2 million associated with the early repayment.
On November 1, 2010, the Company used available cash to repay the mortgage loan collateralized by its 1330 Connecticut Avenue property located in Washington, DC totaling approximately $45.0 million. The mortgage loan bore interest at a fixed rate of 7.58% per annum and was scheduled to mature on February 26, 2011. There was no prepayment penalty.
On December 23, 2010, the Company used available cash to repay the mortgage loan collateralized by its Wisconsin Place Office property totaling approximately $97.2 million. The mortgage loan bore interest at a variable rate equal to LIBOR plus 1.10% per annum and was scheduled to mature on January 29, 2011. There was no prepayment penalty.
On December 29, 2010,October 4, 2012, in connection with the Company’s acquisitionformation of the John Hancock Towera consolidated joint venture which owns and Garageoperates Fountain Square located in Boston, Massachusetts,Reston, Virginia, the Company assumed the mortgage loan collateralized by the property totaling approximately $640.5$211.3 million. The assumed debt is a securitized senior mortgage loan that requires interest-only payments with a balloon payment due at maturity. Pursuant to the provisions of ASC 805, the assumed mortgage loan, which bears contractual interest at a fixed rate of 5.68%5.71% per annum and matures on January 6, 2017,October 11, 2016, was recorded at its fair value of approximately $663.4$234.4 million using an effective interest rate of 5.00%2.56% per annum.
SixFive mortgage loans totaling approximately $883.4$951.5 million at December 31, 20102012 and six mortgage loans totaling approximately $295.0$953.1 million at December 31, 20092011 have been accounted for at their fair values on the datedates the mortgage loans were assumed. The impact of recording the mortgage loans at fair value resulted in a decrease to interest expense of $3.8approximately $7.0 million, $4.1$9.2 million and $4.3$3.8 million for the years ended December 31, 2010, 20092012, 2011 and 2008,2010, respectively. The cumulative liability related to the fair value adjustments was $27.7$38.6 million and $9.1$23.8 million at December 31, 20102012 and 2009,2011, respectively, and is included in mortgage notes payable in the Consolidated Balance Sheets.
Contractual aggregate principal payments of mortgage notes payable at December 31, 20102012 are as follows:
| Principal Payments | Principal Payments | |||||||
| (in thousands) | (in thousands) | |||||||
2011 | $ | 471,818 | ||||||
2012 | 372,929 | |||||||
2013 | 101,289 | $ | 105,313 | |||||
2014 | 125,264 | 87,757 | ||||||
2015 | 14,312 | 26,182 | ||||||
2016 | 608,879 | |||||||
2017 | 1,521,750 | |||||||
Thereafter | 1,934,278 | 713,960 | ||||||
| ||||||||
Total aggregate principal payments | 3,019,890 | 3,063,841 | ||||||
Unamortized balance of historical fair value adjustments | 27,696 | 38,644 | ||||||
| ||||||||
Total carrying value of mortgage notes payable | $ | 3,047,586 | $ | 3,102,485 | ||||
| ||||||||
7. Unsecured Senior Notes
The following summarizes the unsecured senior notes outstanding as of December 31, 20102012 (dollars in thousands):
| Coupon/ Stated Rate | Effective Rate(1) | Principal Amount | Maturity Date(2) | Coupon/ Stated Rate | Effective Rate(1) | Principal Amount | Maturity Date(2) | |||||||||||||||||||||||
10 Year Unsecured Senior Notes | 6.250 | % | 6.381 | % | $ | 182,432 | January 15, 2013 | |||||||||||||||||||||||
10 Year Unsecured Senior Notes | 6.250 | % | 6.291 | % | 42,568 | January 15, 2013 | ||||||||||||||||||||||||
12 Year Unsecured Senior Notes | 5.625 | % | 5.693 | % | 300,000 | April 15, 2015 | 5.625 | % | 5.693 | % | $ | 300,000 | April 15, 2015 | |||||||||||||||||
12 Year Unsecured Senior Notes | 5.000 | % | 5.194 | % | 250,000 | June 1, 2015 | 5.000 | % | 5.194 | % | 250,000 | June 1, 2015 | ||||||||||||||||||
10 Year Unsecured Senior Notes | 5.875 | % | 5.967 | % | 700,000 | October 15, 2019 | 5.875 | % | 5.967 | % | 700,000 | October 15, 2019 | ||||||||||||||||||
10 Year Unsecured Senior Notes | 5.625 | % | 5.708 | % | 700,000 | November 15, 2020 | 5.625 | % | 5.708 | % | 700,000 | November 15, 2020 | ||||||||||||||||||
10 Year Unsecured Senior Notes | 4.125 | % | 4.289 | % | 850,000 | May 15, 2021 | 4.125 | % | 4.289 | % | 850,000 | May 15, 2021 | ||||||||||||||||||
7 Year Unsecured Senior Notes | 3.700 | % | 3.853 | % | 850,000 | November 15, 2018 | ||||||||||||||||||||||||
11 Year Unsecured Senior Notes | 3.850 | % | 3.954 | % | 1,000,000 | February 1, 2023 | ||||||||||||||||||||||||
| ||||||||||||||||||||||||||||||
Total principal | 3,025,000 | 4,650,000 | ||||||||||||||||||||||||||||
Net unamortized discount | (8,402 | ) | (10,472 | ) | ||||||||||||||||||||||||||
| ||||||||||||||||||||||||||||||
Total | $ | 3,016,598 | $ | 4,639,528 | ||||||||||||||||||||||||||
| ||||||||||||||||||||||||||||||
| (1) | Yield on issuance date including the effects of discounts on the notes. |
| (2) | No principal amounts are due prior to maturity. |
On April 19, 2010,June 11, 2012, the Company’s Operating Partnership completed a public offering of $700.0 million$1.0 billion in aggregate principal amount of its 5.625%3.850% senior unsecured notes due 2020.2023. The notes were priced at 99.891%99.779% of the principal amount to yield 5.708%an effective rate (including financing fees) of 3.954% to maturity. The notes will mature on February 1, 2023, unless earlier redeemed. The aggregate net proceeds tofrom the Operating Partnership,offering were approximately $989.4 million after deducting underwriterunderwriting discounts and offering expenses, were approximately $693.5 million. The notes mature on November 15, 2020, unless earlier redeemed. On April 7, 2010, in connection with the offering, the Company entered into two treasury lock agreements to fix the 10-year U.S. Treasury rate (which was used as a reference security in pricing) at 3.873% per annum on notional amounts aggregating $350.0 million. The Company subsequently cash-settled the treasury lock agreements and received approximately $0.4 million, which amount will be recognized as a reduction to the Company’s interest expense over the term of the notes.
On November 18, 2010,August 24, 2012, the Company’s Operating Partnership completed a public offering of $850.0 million in aggregate principal amount of its 4.125% senior notes due 2021. The notes were priced at 99.26% ofused available cash to redeem the principal amount to yield 4.289% to maturity. The aggregate net proceeds to the Operating Partnership, after deducting underwriter discounts and offering expenses, were approximately $836.9 million. The notes mature on May 15, 2021, unless earlier redeemed.
On December 12, 2010, the Company’s Operating Partnership completed the redemption of $700.0remaining $225.0 million in aggregate principal amount of its 6.25% senior notes due 2013. The redemption price was determined in accordance with the applicable indenture and wastotaled approximately $793.1$231.6 million. The redemption price included approximately $17.9$1.5 million of accrued and unpaid interest to, but not including, the redemption date. Excluding such accrued and unpaid interest, the redemption price was approximately 110.75%102.25% of the principal amount being redeemed. In addition,The Company recognized a loss on November 29, 2010, the Company entered into two treasury lock agreements to fix the yield on the U.S. Treasury issue used in determining the redemption price on notional amounts aggregating $700.0 million. On December 9, 2010, the Company cash-settled the treasury lock agreements and paidearly extinguishment of debt totaling approximately $2.1 million. As a result of$5.2 million, which amount included the payment of the redemption premium the settlement of the treasury locks and the write-off of deferred financing costs, the Company recognized an aggregate loss on early extinguishment of debt oftotaling approximately $79.3$5.1 million. Following the partial redemption, there is an aggregate of $225.0 million of the notes outstanding.
The indenture relating to the unsecured senior notes contains certain financial restrictions and requirements, including (1) a leverage ratio not to exceed 60%, (2) a secured debt leverage ratio not to exceed 50%, (3) an interest coverage ratio of greater than 1.50, and (4) an unencumbered asset value of not less than 150% of unsecured debt. At December 31, 2010 and 2009,2012, the Company was in compliance with each of these financial restrictions and requirements.
8. Unsecured Exchangeable Senior Notes
The following summarizes the unsecured exchangeable senior notes outstanding as of December 31, 20102012 (dollars in thousands):
| Coupon/ Stated Rate | Effective Rate(1) | Exchange Rate | Principal Amount | First Optional Redemption Date by Company | Maturity Date | Coupon/ Stated Rate | Effective Rate(1) | Exchange Rate | Principal Amount | First Optional Redemption Date by the Company | Maturity Date | |||||||||||||||||||||||||||||||||
3.625% Exchangeable Senior Notes | 3.625 | % | 4.037 | % | 8.5051 | (2) | $ | 747,500 | N/A | February 15, 2014 | 3.625 | % | 4.037 | % | 8.5051 | (2) | $ | 747,500 | N/A | February 15, 2014 | ||||||||||||||||||||||||
2.875% Exchangeable Senior Notes | 2.875 | % | 3.462 | % | 7.0430 | (3) | 626,194 | February 20, 2012(4) | February 15, 2037 | |||||||||||||||||||||||||||||||||||
3.750% Exchangeable Senior Notes | 3.750 | % | 3.787 | % | 10.0066 | (5) | 450,000 | May 18, 2013(6) | May 15, 2036 | 3.750 | % | 3.787 | % | 10.0066 | (3) | 450,000 | May 18, 2013(4) | May 15, 2036 | ||||||||||||||||||||||||||
| ||||||||||||||||||||||||||||||||||||||||||||
Total principal | 1,823,694 | 1,197,500 | ||||||||||||||||||||||||||||||||||||||||||
Net unamortized discount | (8,249 | ) | (1,653 | ) | ||||||||||||||||||||||||||||||||||||||||
Adjustment for the equity component allocation, net of accumulated amortization | (93,628 | ) | (25,491 | ) | ||||||||||||||||||||||||||||||||||||||||
| ||||||||||||||||||||||||||||||||||||||||||||
Total | $ | 1,721,817 | $ | 1,170,356 | ||||||||||||||||||||||||||||||||||||||||
| ||||||||||||||||||||||||||||||||||||||||||||
| (1) | Yield on issuance date including the effects of discounts on the notes but excluding the effects of the adjustment for the equity component allocation. |
| (2) | The initial exchange rate is 8.5051 shares per $1,000 principal amount of the notes (or an initial exchange price of approximately $117.58 per share of Boston Properties, Inc.’s common stock). In addition, the Company entered into capped call transactions with affiliates of certain of the initial purchasers, which are |
intended to reduce the potential dilution upon future exchange of the notes. The capped call transactions were intended to increase the effective exchange price to the Company of the notes from $117.58 to approximately $137.17 per share (subject to adjustment), representing an overall effective premium of approximately 40% over the closing price on August 13, 2008 of $97.98 per share of Boston Properties, Inc.’s common stock. The net cost of the capped call transactions was approximately $44.4 million. As of December 31, |
| (3) |
| In connection with the special distribution of $5.98 per share of Boston Properties, Inc.’s common stock declared on December 17, 2007, the exchange rate was adjusted from 9.3900 to 10.0066 shares per $1,000 principal amount of notes effective as of December 31, 2007, resulting in an exchange price of approximately $99.93 per share of Boston Properties, Inc.’s common stock. |
| Holders may require the Operating Partnership to repurchase the notes for cash on May 18, 2013 and on May 15 of 2016, 2021, 2026 and 2031 and at any time prior to their maturity upon a fundamental change, in each case at a price equal to 100% of the principal amount of the notes being repurchased plus any accrued and unpaid interest up to, but excluding, the repurchase date. |
ASC 470-20 (formerly known as FSP No. APB 14-1) requires the liability and equity components of convertible debt instruments that may be settled in cash upon conversion (including partial cash settlement) to be separately accounted for in a manner that reflects the issuer’s nonconvertible debt borrowing rate. ASC 470-20 requires that the initial proceeds from the sale of the Operating Partnership’s $862.5 million of 2.875% exchangeable senior notes due 2037 (all of which have been redeemed/repurchased as of December 31, 2012), $450.0 million of 3.75% exchangeable senior notes due 2036 and $747.5 million of 3.625% exchangeable senior notes due 2014 be allocated between a liability component and an equity component in a manner that reflects interest expense at the interest rate of similar nonconvertible debt that could have been issued by the Operating Partnership at such time. The Company measured the fair value of the debt components of the 2.875%, 3.75% and 3.625% exchangeable senior notes for the periods presented based on effective interest rates of 5.630%, 5.958% and 6.555%, respectively. The aggregate carrying amount of the debt component was approximately $1.72
$1.17 billion and $1.901.72 billion (net of the ASC 470-20 adjustment of approximately $93.6$25.5 million and $140.4$54.5 million) at December 31, 20102012 and December 31, 2009,2011, respectively. As a result, the Company attributed an aggregate of approximately $230.3 million of the proceeds to the equity component of the notes, which represents the excess proceeds received over the fair value of the notes at the date of issuance. The equity component of the notes has been reflected within Additional Paid-in Capital in the Consolidated Balance Sheets. The Company reclassified approximately $1.0 million of deferred financing costs to Additional Paid-in Capital, which represented the costs attributable to the equity components of the notes. The carrying amount of the equity component was approximately $228.8$148.5 million and $229.3$202.5 million at December 31, 20102012 and December 31, 2009,2011, respectively. The resulting debt discount will be amortized over the period during which the debt is expected to be outstanding (i.e., through the first optional redemption dates or, in the case of the 2014 notes, the maturity date) as additional non-cash interest expense. The additional non-cash interest expense attributable to each debt security will increase in subsequent reporting periods through the first optional redemption date (or, in the case of the 2014 notes, the maturity date) as the debt accretes to its par value over the same period. The aggregate contractual interest expense was approximately $69.0$48.4 million, $74.4$66.3 million and $56.4$69.0 million for the years ended December 31, 2010, 20092012, 2011 and 2008,2010, respectively. As a result of applying ASC 470-20, the Company reported additional non-cash interest expense of approximately $38.3$29.1 million, $38.6$38.8 million and $27.8$38.3 million for the years ended December 31, 2010, 20092012, 2011 and 2008,2010, respectively. ASC 470-20 requires companies to retrospectively apply the requirements of the pronouncement to all periods presented. As
On January 10, 2012, the Company announced that holders of the 2.875% Exchangeable Senior Notes due 2037 (the “Notes”) issued by its Operating Partnership had the right to surrender their Notes for purchase by the Operating Partnership (the “Put Right”) on February 15, 2012. The opportunity to exercise the Put Right expired on February 8, 2012. On January 10, 2012, the Company also announced that the Operating Partnership issued a result,notice of redemption to the revised diluted earnings per share reflectholders of the Notes to redeem, on February 20, 2012 (the “Redemption Date”), all of the Notes outstanding on the Redemption Date. In connection with the redemption, holders of the Notes had the right to exchange their Notes on or prior to February 16, 2012. Notes with respect to which the Put Right was not exercised (or with respect to which the Put Right was exercised and subsequently withdrawn prior to the withdrawal deadline) and that were not surrendered for exchange on or prior to February 16, 2012, were redeemed by the Operating Partnership on the Redemption Date at a reductionredemption price equal to 100% of $0.16 for the year ended December 31, 2008.
Duringprincipal amount of the year ended December 31, 2010,Notes plus accrued and unpaid interest thereon to, but excluding, the Company’sRedemption Date. Holders of an aggregate of $242,735,000 of the Notes exercised the Put Right and the Operating Partnership repurchased approximately $236.3 million aggregatesuch Notes on February 15, 2012. On February 20, 2012, the Operating Partnership redeemed the remaining $333,459,000 of outstanding Notes at a redemption price equal to 100% of the principal amount of its 2.875% exchangeable senior notes due 2037, which the holders may require the Operating Partnership to repurchase in February 2012, for approximately $236.6 million. The repurchased notes had an aggregate allocated liabilityNotes plus accrued and equity value of approximately $225.7 million and $0.4 million, respectively, at the time of repurchase resulting in the recognition of a loss on early extinguishment of debt of approximately $10.5 million during the year ended December 31, 2010. There remains an aggregate of approximately $626.2 million of these notes outstanding.unpaid interest thereon.
9. Unsecured Line of Credit
On June 6, 2008,24, 2011, the Company’s Operating Partnership utilized an accordion feature under its unsecuredamended and restated the revolving credit facility (the “Unsecured Line of Credit”) with a consortium of lenders to increaseagreement governing the current lenders’ total commitment under the Unsecured Line of Credit from $605.0 million to $923.3 million. On July 21, 2008, the Company’s Operating Partnership further increased the total commitment from $923.3 million to $1.0 billion. All other material terms under the facility remain unchanged. The Company’s Unsecured Line of Credit, bears interest at a variable interest rate equalwhich (1) reduced the total commitment from $1.0 billion to Eurodollar plus 0.475% per annum and matured on$750.0 million, (2) extended the maturity date from August 3, 2010,2011 to June 24, 2014, with a provision for a one-year extension at the Company’s option, of the Company, subject to certain conditions. Effective asconditions and the payment of August 3, 2010,an extension fee equal to 0.20% of the maturity date undertotal commitment then in effect, and (3) increased the per annum variable interest rates available, which resulted in an increase of the per annum variable interest rate on outstanding balances from Eurodollar plus 0.475% per annum to Eurodollar plus 1.225% per annum. Under the amended Unsecured Line of Credit, was extendedthe Company may increase the total commitment to August 3, 2011. All other terms$1.0 billion, subject to syndication of the unsecured revolving credit facility remain unchanged. The Unsecured Line of Credit is a recourse obligation of the Company’s Operating Partnership. Under the Unsecured Line of Credit,increase. In addition, a facility fee currently equal to 0.125%an aggregate of 0.225% per annum of the total commitment is payable by the Company in equal quarterly installments. The interest rate and facility fee are subject to adjustment in the event of a change in the Operating Partnership’s unsecured debt ratings. The Unsecured Line of Credit involvesis a syndicaterecourse obligation of lenders.the Company’s Operating Partnership. The Unsecured Line of Credit contains a competitive bid option that allows banks that are part of the lender consortium to bid to make loan advances to the Company at a negotiated LIBOR-basedreduced interest rate. ThereAt December 31, 2012 and 2011, there were no amounts outstanding on the Unsecured Line of Credit at December 31, 2010 and 2009. There were no amounts drawn on the Unsecured Line of Credit during the year ended December 31, 2010. The weighted-average balance outstanding was approximately $45.2 million during the year ended December 31, 2009 with a weighted-average interest rate on amounts outstanding of approximately 0.95% per annum during the year ended December 31, 2009.Credit.
The terms of the Unsecured Line of Credit require that the Company maintain a number of customary financial and other covenants on an ongoing basis, including: (1) a leverage ratio not to exceed 60%, however, the leverage ratio may increase to no greater than 65% provided that it is reduced back to 60% within 180 days,one year, (2) a secured debt leverage ratio not to exceed 55%, (3) a fixed charge coverage ratio of at least 1.40, (4) an unsecured debt leverage ratio not to exceed 60%, however, the unsecured debt leverage ratio may increase to no greater than 65% provided that it is reduced back to 60% within 180 days,one year, (5) a minimum net worth requirement of $3.5 billion, (6) an unsecured debt interest coverage ratio of at least 1.75 and (7) limitations on permitted investments, development, partially owned entities, business outside of commercial real estate and commercial non-office properties. At December 31, 2010 and 2009,2012, the Company was in compliance with each of these financial and other covenant requirements.
10. Commitments and Contingencies
General
In the normal course of business, the Company guarantees its performance of services or indemnifies third parties against its negligence. In addition, in the normal course of business, the Company guarantees to certain tenants the obligations of its subsidiaries for the payment of tenant improvement allowances and brokerage commissions in connection with their leases and limited costs arising from delays in delivery of their premises.
The Company has letter of credit and performance obligations of approximately $27.0$13.1 million related to lender and development requirements.
In connection with the formation of a joint venture to pursue the acquisition of land in San Francisco, California which could support a 61-story, 1.4 million square foot office tower known as Transbay Tower, the Company provided a non-refundable deposit for the land purchase in the form of a letter of credit totaling $5.0 million. The purchase price of the land is approximately $190.0 million. The Company has a 50% interest in the joint venture (See Notes 5 and 20).
Certain of the Company’s joint venture agreements include provisions whereby, at certain specified times, each partner has the right to initiate a purchase or sale of its interest in the joint ventures. Under these provisions, the Company is not compelled to purchase the interest of its outside joint venture partners.
In connection with the assumption of the General Motors Building’s767 Fifth Avenue’s (The GM Building) secured loan by the Company’s unconsolidated joint venture, 767 Venture, LLC, the Company guaranteed the unconsolidated joint venture’s obligation to fund various escrows, including tenant improvements, taxes and insurance in lieu of cash deposits. As of December 31, 2010,2012, the maximum funding obligation under the guarantee was approximately $24.0$23.7 million. The Company earns a fee from the joint venture for providing the guarantee and has an agreement with the outside partners to reimburse the joint venture for their share of any payments made under the guarantee. In connection with the refinancing of the 125 West 55thStreet property’s secured loan by the Company’s unconsolidated joint venture, 125 West 55thStreet Venture LLC, the Company has guaranteed the unconsolidated joint venture’s obligation to fund an escrow related to certain lease rollover costs in lieu of an initial cash deposit for the full amount. The maximum funding obligation under the guarantee was $21.3 million. At closing, the joint venture funded a $10.0 million cash deposit into the escrow account and the remaining $11.3 million will be further reduced with scheduled monthly deposits into the escrow account from operating cash flows. As of December 31, 2010, the maximum funding obligation under the guarantee was approximately $7.2 million. The Company earns a fee from the joint venture for providing the guarantee and has an agreement with the outside partners to reimburse the joint venture for their share of any payments made under the guarantee.
In connection with the mortgage financing collateralized by the Company’s One Freedom SquareJohn Hancock Tower property located in Reston, Virginia,Boston, Massachusetts, the CompanyCompany has agreed to guarantee approximately $7.9$0.8 million related to its obligation to provide funds for certain tenant re-leasing costs. The mortgage financing matures on January 6, 2017.
From time to time, the Company (or the applicable joint venture) has also agreed to guarantee portions of the principal, interest or other amounts in connection with other unconsolidated joint venture borrowings. In addition to the financial guarantees referenced above, the Company has agreed to customary environmental indemnifications and nonrecourse carve-outs (e.g., guarantees against fraud, misrepresentation and bankruptcy) on certain of its unconsolidated joint venture loans.
Concentrations of Credit Risk
Management of the Company performs ongoing credit evaluations of tenants and may require tenants to provide some form of credit support such as corporate guarantees and/or other financial guarantees. Although the Company’s properties are geographically diverse and the tenants operate in a variety of industries, to the extent the Company has a significant concentration of rental revenue from any single tenant, the inability of that tenant to make its lease payments could have an adverse effect on the Company.
Some potential losses are not covered by insurance.
The Company carries insurance coverage on its properties of types and in amounts and with deductibles that it believes are in line with coverage customarily obtained by owners of similar properties. In response to the uncertainty in the insurance market following the terrorist attacks of September 11, 2001, the Federal Terrorism Risk Insurance Act (as amended, “TRIA”) was enacted in November 2002 to require regulated insurers to make available coverage for “certified” acts of terrorism (as defined by the statute). The expiration date of TRIA was extended to December 31, 2014 by the Terrorism Risk Insurance Program Reauthorization Act of 2007 (“TRIPRA”). and the Company can provide no assurance that it will be extended further. Currently, the Company’s property insurance program per occurrence limits are $1.0 billion for its portfolio insurance program, including coverage for acts of terrorism certified under TRIA other than nuclear, biological, chemical or radiological terrorism (“Terrorism Coverage”). The Company currently insures certainalso carries $250 million of Terrorism Coverage for 601 Lexington Avenue, New York, New York (“601 Lexington Avenue”) in excess of the $1.0 billion of coverage in the Company’s property insurance program which is provided by IXP, LLC (“IXP”) as a direct insurer. Certain properties, including the General Motors Building located at 767 Fifth Avenue in New York, New York (“767 Fifth Avenue”), are currently insured in separate stand alone insurance programs. The property insurance program per occurrence limits for 767 Fifth Avenue are $1.625 billion, including Terrorism Coverage, with $1.375 billion of Terrorism Coverage in excess of $250 million being provided by NYXP, LLC (“NYXP”), as a direct insurer. The Company also currently carries nuclear, biological, chemical and radiological terrorism insurance coverage for acts of terrorism certified under TRIA (“NBCR Coverage”), which is provided by IXP LLC (“IXP”) as a direct insurer, for the properties in our portfolio, including 767 Fifth Avenue, but excluding the properties owned by the Company’s Value-Added Fund and certain other properties owned in joint ventures with third parties or which we manage.the Company manages. The per occurrence limit for NBCR Coverage is $1.0 billion. Under TRIA, after the payment of the required deductible and coinsurance, the additional Terrorism Coverage provided by IXP for 601 Lexington Avenue, the NBCR Coverage provided by IXP and the Terrorism Coverage provided
by NYXP are backstopped by the Federal Government if the aggregate industry insured losses resulting from a certified act of terrorism exceed a “program trigger.” The program trigger is $100$100.0 million and the coinsurance is 15%. Under TRIPRA, if the Federal Government pays out for a loss under TRIA, it is mandatory that the Federal Government recoup the full amount of the loss from insurers offering TRIA coverage after the payment of the loss pursuant to a formula in TRIPRA. The Company may elect to terminate the NBCR Coverage if the Federal Government seeks recoupment for losses paid under TRIA, if there is a change in its portfolio or for any other reason. In the event TRIPRA is not extended beyond December 31, 2014, (i) the Company may pursue alternative approaches to secure coverage for acts of terrorism thereby potentially increasing its overall cost of insurance, (ii) if such insurance is not available at commercially reasonable rates with limits equal to its current coverage or at all, the Company may not continue to have full occurrence limit coverage for acts of terrorism, (iii) the Company may not satisfy the insurance requirements under existing or future debt financings secured by individual properties and (iv) we may not be able to obtain future debt financings secured by individual properties. The Company intends to continue to monitor the scope, nature and cost of available terrorism insurance and maintain terrorism insurance in amounts and on terms that are commercially reasonable.
The Company also currently carries earthquake insurance on its properties located in areas known to be subject to earthquakes in an amount and subject to self-insurance that the Company believes are commercially reasonable. In addition, this insurance is subject to a deductible in the amount of 5% of the value of the affected property. Specifically, the Company currently carries earthquake insurance which covers its San Francisco region (excluding 680 Folsom Street) with a $120 million per occurrence limit and a $120 million annual aggregate
limit, $20 million of which is provided by IXP, as a direct insurer. In addition, the builders risk policy maintained for the development of 680 Folsom Street in San Francisco includes a $20 million per occurrence and annual aggregate limit of earthquake coverage. The amount of the Company’s earthquake insurance coverage may not be sufficient to cover losses from earthquakes. In addition, the amount of earthquake coverage could impact the Company’s ability to finance properties subject to earthquake risk. The Company may discontinue earthquake insurance on some or all of its properties in the future if the premiums exceed the Company’s estimation of the value of the coverage.
IXP, a captive insurance company which is a wholly-owned subsidiary of the Company, acts as a direct insurer with respect to a portion of the Company’s earthquake insurance coverage for its Greater San Francisco properties, the additional Terrorism Coverage for 601 Lexington Avenue and the Company’s NBCR Coverage. The additional Terrorism Coverage provided by IXP for 601 Lexington Avenue only applies to losses which exceed the program trigger under TRIA. NYXP, a captive insurance company which is a wholly-owned subsidiary of the Company, acts as a direct insurer with respect to a portion of the Company’s Terrorism Coverage for 767 Fifth Avenue. Currently, NYXP only insures losses which exceed the program trigger under TRIA and NYXP reinsures with a third-party insurance company any coinsurance payable under TRIA. Insofar as the Company owns IXP and NYXP, it is responsible for their liquidity and capital resources, and the accounts of IXP and NYXP are part of the Company’s consolidated financial statements. In particular, if a loss occurs which is covered by the Company’s NBCR Coverage but is less than the applicable program trigger under TRIA, IXP would be responsible for the full amount of the loss without any backstop by the Federal Government. IXP and NYXP would also be responsible for any recoupment charges by the Federal Government in the event losses are paid out and their insurance policies are maintained after the payout by the Federal Government. If the Company experiences a loss and IXP or NYXP are required to pay under their insurance policies, the Company would ultimately record the loss to the extent of the required payment. Therefore, insurance coverage provided by IXP and NYXP should not be considered as the equivalent of third-party insurance, but rather as a modified form of self-insurance. In addition, the Operating Partnership has issued a guarantee to cover liabilities of IXP in the amount of $20.0 million.
The mortgages on the Company’s properties typically contain requirements concerning the financial ratings of the insurers who provide policies covering the property. The Company provides the lenders on a regular basis with the identity of the insurance companies in the Company’s insurance programs. The ratings of some of the Company’s insurers are below the rating requirements in some of the Company’s loan agreements and the lenders for these loans could attempt to claim that an event of default has occurred under the loan. The Company believes it could obtain insurance with insurers which satisfy the rating requirements. Additionally, in the future, the Company’s ability to obtain debt financing secured by individual properties, or the terms of such financing, may be adversely affected if lenders generally insist on ratings for insurers or amounts of insurance which are difficult to obtain or which result in a commercially unreasonable premium. There can be no assurance that a deficiency in the financial ratings of one or more of the Company’s insurers will not have a material adverse effect on the Company.
The Company continues to monitor the state of the insurance market in general, and the scope and costs of coverage for acts of terrorism and California earthquake risk in particular, but the Company cannot anticipate what coverage will be available on commercially reasonable terms in future policy years. There are other types of losses, such as from wars, or the presence of mold at the Company’s properties, for which the Company cannot obtain insurance at all or at a reasonable cost. With respect to such losses and losses from acts of terrorism,
earthquakes or other catastrophic events, if the Company experiences a loss that is uninsured or that exceeds policy limits, the Company could lose the capital invested in the damaged properties, as well as the anticipated future revenues from those properties. Depending on the specific circumstances of each affected property, it is possible that the Company could be liable for mortgage indebtedness or other obligations related to the property. Any such loss could materially and adversely affect the Company’s business and financial condition and results of operations.
Legal Matters
The Company is subject to various legal proceedings and claims that arise in the ordinary course of business. These matters are generally covered by insurance. Management believes that the final outcome of such matters will not have a material adverse effect on the financial position, results of operations or liquidity of the Company.
State and Local Tax Matters
Because the Company is organized and qualifies as a REIT, it is generally not subject to federal income taxes, but is subject to certain state and local taxes. In the normal course of business, certain entities through which the Company owns real estate either have undergone, or are currently undergoing, tax audits. Although the Company believes that it has substantial arguments in favor of its positions in the ongoing audits, in some instances there is no controlling precedent or interpretive guidance on the specific point at issue. Collectively, tax deficiency notices received to date from the jurisdictions conducting the ongoing audits have not been material. However, there can be no assurance that future audits will not occur with increased frequency or that the ultimate result of such audits will not have a material adverse effect on the Company’s results of operations.
Environmental Matters
It is the Company’s policy to retain independent environmental consultants to conduct or update Phase I environmental assessments (which generally do not involve invasive techniques such as soil or ground water sampling) and asbestos surveys in connection with the Company’s acquisition of properties. These pre-purchase environmental assessments have not revealed environmental conditions that the Company believes will have a material adverse effect on its business, assets, financial condition, results of operations or liquidity, and the Company is not otherwise aware of environmental conditions with respect to its properties that the Company believes would have such a material adverse effect. However, from time to time environmental conditions at the Company’s properties have required and may in the future require environmental testing and/or regulatory filings, as well as remedial action.
In February 1999, the Company (through a joint venture) acquired from Exxon Corporation a property in Massachusetts that was formerly used as a petroleum bulk storage and distribution facility and was known by the state regulatory authority to contain soil and groundwater contamination. The Company developed an office park on the property. The Company engaged a specially licensed environmental consultant to oversee the management of contaminated soil and groundwater that was disturbed in the course of construction. Under the property acquisition agreement, Exxon agreed to (1) bear the liability arising from releases or discharges of oil and hazardous substances which occurred at the site prior to the Company’s ownership, (2) continue monitoring and/or remediating such releases and discharges as necessary and appropriate to comply with applicable requirements, and (3) indemnify the Company for certain losses arising from preexisting site conditions. Any indemnity claim may be subject to various defenses, and there can be no assurance that the amounts paid under the indemnity, if any, would be sufficient to cover the liabilities arising from any such releases and discharges.
Environmental investigations at some of the Company’s properties and certain properties owned by affiliates of the Company have identified groundwater contamination migrating from off-site source properties. In each case the Company engaged a licensed environmental consultant to perform the necessary investigations and assessments and to prepare any required submittals to the regulatory authorities. In each case the
environmental consultant concluded that the properties qualify under the regulatory program or the regulatory practice for a status which eliminates certain deadlines for conducting response actions at a site. The Company also believes that these properties qualify for liability relief under certain statutory provisions or regulatory practices regarding upgradient releases. Although the Company believes that the current or former owners of the upgradient source properties may bear responsibility for some or all of the costs of addressing the identified
groundwater contamination, the Company will take such further response actions (if any) that it deems necessary or advisable. Other than periodic testing at some of these properties, no such additional response actions are anticipated at this time.
Some of the Company’s properties and certain properties owned by the Company’s affiliates are located in urban, industrial and other previously developed areas where fill or current or historical uses of the areas have caused site contamination. Accordingly, it is sometimes necessary to institute special soil and/or groundwater handling procedures and/or include particular building design features in connection with development, construction and other property operations in order to achieve regulatory closure and/or ensure that contaminated materials are addressed in an appropriate manner. In these situations it is the Company’s practice to investigate the nature and extent of detected contamination and estimate the costs of required response actions and special handling procedures. The Company then uses this information as part of its decision-making process with respect to the acquisition and/or development of the property. For example, the Company owns a parcel in Massachusetts which was formerly used as a quarry/asphalt batching facility. Pre-purchase testing indicated that the site contained relatively low levels of certain contaminants. The Company has developed an office park on this property. Prior to and during redevelopment activities, the Company engaged a specially licensed environmental consultant to monitor environmental conditions at the site and prepare necessary regulatory submittals based on the results of an environmental risk characterization. A submittal has been made to the regulatory authorities in order to achieve regulatory closure at this site. The submittal included an environmental deed restriction that mandates compliance with certain protective measures in a portion of the site where low levels of residual soil contamination have been left in place in accordance with applicable laws.
The Company expects that resolution of the environmental matters relating to the above will not have a material impact on its business, assets, financial condition, results of operations or liquidity. However, the Company cannot assure you that it has identified all environmental liabilities at its properties, that all necessary remediation actions have been or will be undertaken at the Company’s properties or that the Company will be indemnified, in full or at all, in the event that such environmental liabilities arise.
Tax Protection Obligations
In connection with the acquisition or contribution of sixseven properties, the Company entered into agreements for the benefit of the selling or contributing parties which specifically state that until such time as the contributors do not hold at least a specified percentage of the OP Units owned by such person following the contribution of the properties, or until June 9, 2017 for one of the properties,767 Fifth Avenue (The GM Building), the Operating Partnership will not sell or otherwise transfer the properties in a taxable transaction. If the Company does sell or transfer the properties in a taxable transaction, it would be liable to the contributors for contractual damages.
11. Noncontrolling Interests
Effective January 1, 2009, the Company adopted the guidance included in ASC 810 “Consolidation” (“ASC 810”) (formerly known as SFAS No. 160, “Noncontrolling Interests in Consolidated Financial Statements—an amendment of ARB No. 51” (“SFAS No. 160”)) and ASC 480-10-S99 “Distinguishing Liabilities from Equity” (“ASC 480-10-S99”) (formerly known as EITF Topic No. D-98 “Classification and Measurement of Redeemable Securities” (Amended)), under which noncontrolling interests of the Company (previously known as “minority interests”) are classified either as a component of equity or in the mezzanine section of the balance sheet as temporary equity depending on the terms of such noncontrolling interests. As a result of the adoption of the guidance included in ASC 810, the Company reclassified the noncontrolling interests
in consolidated property partnerships from the mezzanine section of its Consolidated Balance Sheets to equity. The reclassification totaled approximately $6.9 million as of December 31, 2008. In addition, the Company reclassified the noncontrolling interests related to the common units of the Operating Partnership not owned by the Company from the mezzanine section of its Consolidated Balance Sheets to equity. The reclassification totaled approximately $563.2 million as of December 31, 2008. Noncontrolling interests related to redeemable preferred units of the Operating Partnership continue to be classified in the mezzanine section of the Consolidated Balance Sheets.
Under the guidance included in ASC 810, net income encompasses the total income of all consolidated subsidiaries and there is a separate disclosure of the attribution of that income between controlling and noncontrolling interests. The implementation of this standard had no effect on the Company’s results of operations. As a result of the adoption of the guidance included in ASC 810, net income attributable to noncontrolling interests is now deducted from net income in the determination of net income attributable to the Company for all periods presented. In addition, other comprehensive income (loss) attributable to noncontrolling interests is now deducted from comprehensive income in the determination of comprehensive income attributable to the Company for all periods presented.
Noncontrolling interests relate to the interests in the Operating Partnership not owned by the Company and interests in consolidated property partnerships not wholly-owned by the Company. As of December 31, 2010,2012, the noncontrolling interests consisted of 19,387,87116,053,497 OP Units, 1,507,1641,303,296 LTIP Units, 1,080,938 2008400,000 2011 OPP Units, and 1,113,044400,000 2012 OPP Units, 995,997 Series Two Preferred Units (or 1,460,6881,307,083 OP Units on an as converted basis) and 1,221,527 Series Four Preferred Units (not convertible into OP Units) held by parties other than the Company.
Noncontrolling Interest—Redeemable Preferred Units of the Operating Partnership
The Preferred Units at December 31, 2010 and 20092012 consisted solely of 1,113,044995,997 Series Two Preferred Units, which bear a preferred distribution equal to the greater of (1) the distribution which would have been paid in respect of the Series Two Preferred Unit had such Series Two Preferred Unit been converted into an OP Unit (including both regular and special distributions) or (2) a rate ranging from 5.00% to 7.00%6.00% per annum on a liquidation preference of $50.00 per unit, and are
convertible into OP Units at a rate of $38.10 per Preferred Unit (1.312336 OP Units for each Preferred Unit). Distributions on the Series Two Preferred Units are payable quarterly and, unless the greater rate described in the next sentence applies, accrue at 7.0% until May 12, 2009 and 6.0% thereafter. If distributions on the number of OP Units into which the Series Two Preferred Units are convertible are greater than distributions calculated using the rates described in the preceding sentence for the applicable quarterly period, then the greater distributions are payable instead. The holders of Series Two Preferred Units have the right to require the Operating Partnership to redeem their units for cash at the redemption price of $50.00 per unit on May 12, 2011, May 14, 2012, May 14, 2013 and May 12, 2014. The maximum number of units that may be required to be redeemed from all holders on each of these dates is 1,007,662, which is one-sixth of the number of Series Two Preferred Units that were originally issued. The holders also had the right to have their Series Two Preferred Units redeemed for cash on May 12, 2009, and May 12, 2010, May 12, 2011 and May 14, 2012, although no holder exercised such right. The Company also has the right, undersubject to certain conditions, and at certain times, to redeem Series Two Preferred Units for cash andor to convert into OP Units any Series Two Preferred Units that are not redeemed when they are eligible for redemption.
During the year ended December 31, 2012, 117,047 Series Two Preferred Units of the Operating Partnership were converted by the holders into 153,605 OP Units. In addition, the Company paid the accrued preferred distributions due to the holders of Preferred Units that were converted.
On February 16, 2010,15, 2012, the Operating Partnership paid a distribution on its outstanding Series Two Preferred Units of $0.75616 per unit. On May 17, 2010,15, 2012, the Operating Partnership paid a distribution on its outstanding Series Two Preferred Units of $0.73151 per unit. On August 16, 2010,15, 2012, the Operating Partnership paid a distribution on its outstanding Series Two Preferred Units of $0.75616 per unit. On November 15, 2010,2012, the Operating Partnership paid a distribution on its outstanding Series Two Preferred Units of $0.75616 per unit.
The Preferred Units at December 31, 2012 also included 1,221,527 Series Four Preferred Units, which bear a preferred distribution equal to 2.00% per annum on a liquidation preference of $50.00 per unit and are not convertible into OP Units. In connection with the acquisition of 680 Folsom Street in San Francisco, California, the consideration paid by the Company to the seller included the issuance of 1,588,100 Series Four Preferred Units of limited partnership interest in the Company’s Operating Partnership. The holders of Series Four Preferred Units have the right, subject to certain conditions, to require the Operating Partnership to redeem their units for cash at the redemption price of $50.00 per unit. On August 31, 2012, a holder redeemed 366,573 Series Four Preferred Units for cash totaling approximately $18.3 million. The Company also has the right, subject to certain conditions, to redeem Series Four Preferred Units for cash at the redemption price of $50.00 per unit. Due to the holders’ redemption option existing outside the control of the Company, the Series Four Preferred Units are presented outside of permanent equity in the Company’s Consolidated Balance Sheets.
On November 15, 2012, the Operating Partnership paid a distribution on its outstanding Series Four Preferred Units of $0.21111 per unit.
The following table reflects the activity forof the noncontrolling interests—redeemable preferred units of the Operating Partnership for the years ended December 31, 2012, 2011 and 2010 2009 and 2008:(in thousands):
Balance at December 31, 2007 | $ | 55,652 | ||||||
Net income | 4,226 | |||||||
Distributions | (3,738 | ) | ||||||
Adjustments to reflect redeemable preferred units at redemption value | (488 | ) | ||||||
Balance at December 31, 2008 | 55,652 | |||||||
Net income | 3,594 | |||||||
Distributions | (3,594 | ) | ||||||
Balance at December 31, 2009 | 55,652 | $ | 55,652 | |||||
Net income | 3,343 | 3,343 | ||||||
Distributions | (3,343 | ) | (3,343 | ) | ||||
| ||||||||
Balance at December 31, 2010 | $ | 55,652 | $ | 55,652 | ||||
Net income | 3,339 | |||||||
Distributions | (3,339 | ) | ||||||
| ||||||||
Balance at December 31, 2011 | $ | 55,652 | ||||||
Issuance of redeemable preferred units (Series Four Preferred Units) | 79,405 | |||||||
Net income | 3,497 | |||||||
Distributions | (3,497 | ) | ||||||
Redemption of redeemable preferred units (Series Four Preferred Units) | (18,329 | ) | ||||||
Conversion of redeemable preferred units (Series Two Preferred Units) to common units | (5,852 | ) | ||||||
| ||||||||
Balance at December 31, 2012 | $ | 110,876 | ||||||
| ||||||||
Noncontrolling Interest—Redeemable Interest in Property Partnership
On October 4, 2012, the Company completed the formation of a joint venture, which owns and operates Fountain Square located in Reston, Virginia (See Note 3). The joint venture partner contributed the property valued at approximately $385.0 million and related mortgage indebtedness totaling approximately $211.3 million for a nominal 50% interest in the joint venture. The Company contributed cash totaling approximately $87.0 million for its nominal 50% interest, which cash was distributed to the joint venture partner. Pursuant to the joint venture agreement (i) the Company has rights to acquire the partner’s nominal 50% interest and (ii) the partner has the right to cause the Company to acquire the partner’s interest on January 4, 2016, in each case at a fixed price totaling approximately $102.0 million in cash. The fixed price option rights expire on January 31, 2016. The Company is consolidating this joint venture due to the Company’s right to acquire the partner’s nominal 50% interest. The Company initially recorded the noncontrolling interest at its acquisition-date fair value as temporary equity, due to the redemption option existing outside the control of the Company. The Company will accrete the changes in the redemption value quarterly over the period from the acquisition date to the earliest redemption date using the effective interest method. The Company will record the accretion after the allocation of net income and distributions of cash flow to the noncontrolling interest account balance.
The following table reflects the activity of the noncontrolling interest—redeemable interest in property partnership for the year ended December 31, 2012 (in thousands):
Balance at December 31, 2011 | $ | — | ||
Acquisition-date fair value of redeemable interest | 98,787 | |||
Net loss | (719 | ) | ||
Distributions | (3,032 | ) | ||
Adjustment to reflect redeemable interest at redemption value | 2,522 | |||
|
| |||
Balance at December 31, 2012 | $ | 97,558 | ||
|
|
Noncontrolling Interest—Common Units of the Operating Partnership
During the yearsyear ended December 31, 2010 and 2009, 591,900 and 138,8562012, 1,110,660 OP Units respectively, were presented by the holders for redemption (including 153,605 OP Units issued upon conversion of Series Two Preferred Units and 544,729 OP Units issued upon conversion of LTIP Units) and were redeemed by the Company in exchange for an equal number of shares of Common Stock.
At December 31, 2010,2012, the Company had outstanding 1,080,938 2008400,000 2011 OPP Units.Units and 400,000 2012 OPP Units (See Note 17). Prior to the measurement date on(January 31, 2014 for 2011 OPP Units and February 5, 2011, 20086, 2015 for 2012 OPP Units), holders of OPP Units will be entitled to receive per unit distributions equal to one-tenth (10%) of the regular quarterly distributions payable on an OP Unit, but will not be entitled to receive any special distributions. After the measurement date, the number of 2008 OPP Units, both vested and unvested, which 2008that OPP award recipients have earned, if any, based on the establishment of an outperformance pool, will be entitled to receive distributions in an amount per unit equal to distributions, both regular and special, payable on an OP Unit.
On January 29, 2010,27, 2012, the Operating Partnership paid a distribution on the OP Units and LTIP Units in the amount of $0.50$0.55 per unit, and a distribution on the 20082011 OPP Units in the amount of $0.05$0.055 per unit, to holders of record as of the close of business on December 31, 2009.2011. On April 30, 2010,2012, the Operating Partnership paid a distribution on the OP Units and LTIP Units in the amount of $0.50$0.55 per unit, and a distribution on the 20082011 OPP Units and 2012 OPP Units in the amount of $0.05$0.055 per unit, to holders of record as of the close of business on March 31, 2010.30, 2012. On July 30, 2010,31, 2012, the Operating Partnership paid a distribution on the OP Units and LTIP Units in the amount of $0.50$0.55 per unit, and a distribution on the 20082011 OPP Units and 2012 OPP Units in the amount of $0.05$0.055 per unit, to holders of record as of the close of business on June 30, 2010.29, 2012. On October 29, 2010,31, 2012, the Operating Partnership paid a distribution on the OP Units and LTIP Units in the amount of $0.50$0.55 per unit, and a distribution on the 20082011 OPP Units and 2012 OPP Units in the amount of $0.05$0.055 per unit, to holders ofor record as
of the close of business on September 30, 2010.28, 2012. On December 20, 2010, Boston Properties, Inc.,November 8, 2012, the Company, as general partner of the Operating Partnership, declared a distribution on the OP Units and LTIP Units in the amount of $0.50$0.65 per unit and a distribution on the 20082011 OPP Units and 2012 OPP Units in the amount of $0.05$0.065 per unit, in each case payable on January 28, 201129, 2013 to holders of record as of the close of business on December 31, 2010.2012.
The Series Two Preferred Units may be converted into OP Units at the election of the holder thereof at any time. A holder of an OP Unit may present such OP Unit to the Operating Partnership for redemption at any time (subject to restrictions agreed upon at the time of issuance of OP Units to particular holders that may restrict such redemption right for a period of time, generally one year from issuance). Upon presentation of an OP Unit for redemption, the Operating Partnership must redeem such OP Unit for cash equal to the then value of a share of common stock of the Company. The Company may, in its sole discretion, elect to assume and satisfy the redemption obligation by paying either cash or issuing one share of Common Stock. The value of the OP Units
(not (not owned by the Company and including LTIP Units assuming that all conditions havehad been met for the conversion thereof) and Series Two Preferred Units (on an as converted basis) had all of such units been redeemed at December 31, 20102012 was approximately $1.80$1.8 billion and $125.8$138.3 million, respectively, based on the closing price of the Company’s common stock of $86.10$105.81 per share on December 31, 2010.2012.
Noncontrolling Interest—Property Partnerships
The noncontrolling interests in property partnerships consist of the outside equity interests in joint ventures that are consolidated with the financial results of the Company because the Company exercises control over the entities that own the properties. The equity interests in these ventures that are not owned by the Company, totaling approximately $(0.6) million and $5.7$(2.0) million at December 31, 20102012 and approximately $(1.1) million at December 31, 2009, respectively.
On December 23, 2010,2011, are included in Noncontrolling Interests—Property Partnerships on the Company acquired the outside member’s 33.3% equity interest in its consolidated joint venture entity that owns the Wisconsin Place Office property located in Chevy Chase, Maryland for cash of approximately $25.5 million. The acquisition was accounted for as an equity transaction in accordance with ASC 810. The difference between the purchase price and the carrying value of the outside member’s equity interest, totaling approximately $19.1 million, reduced additional paid-in capital in the Company’saccompanying Consolidated Balance Sheets.
12. Stockholders’ Equity
As of December 31, 2010,2012, the Company had 140,199,105151,601,209 shares of Common Stock outstanding.
During the year ended December 31, 2012, the Company utilized its $600 million “at the market” (“ATM”) stock offering program to issue an aggregate of 2,347,500 shares of Common Stock for gross proceeds of approximately $249.8 million and net proceeds of approximately $247.0 million. As of December 31, 2012, approximately $305.3 million remained available for issuance under this ATM stock offering program.
During the years ended December 31, 2012 and 2011, the Company issued 22,823 and 316,159 shares of Common Stock, respectively, upon the exercise of options to purchase Common Stock by certain employees.
During the years ended December 31, 2012 and 2011, the Company issued 1,110,660 and 2,919,323 shares of Common Stock, respectively, in connection with the redemption of an equal number of OP Units.
On January 29, 2010,27, 2012, the Company paid a dividend in the amount of $0.50$0.55 per share of Common Stock to shareholders of record as of the close of business on December 31, 2009.2011. On April 30, 2010,2012, the Company paid a dividend in the amount of $0.50$0.55 per share of Common Stock to shareholders of record as of the close of business on March 31, 2010.30, 2012. On July 30, 2010,31, 2012, the Company paid a dividend in the amount of $0.50$0.55 per share of Common Stock to shareholders of record as of the close of business on June 30, 2010.29, 2012. On October 29, 2010,31, 2012, the Company paid a dividend in the amount of $0.50$0.55 per share of Common Stock to shareholders of record as of the close of business on September 30, 2010.28, 2012. On December 20, 2010,November 8, 2012, the Company’s Board of Directors declared a dividend in the amount of $0.50$0.65 per share of Common Stock payable on January 28, 201129, 2013 to shareholders of record as of the close of business on December 31, 2010.
On April 21, 2010, the Company announced that it had established an “at the market” (ATM) stock offering program through which it may sell from time to time up to an aggregate of $400.0 million of its common stock through sales agents for a three-year period (See Note 20).
During the years ended December 31, 2010 and 2009, the Company issued 591,900 and 138,856 shares of its Common Stock, respectively, in connection with the redemption of an equal number of OP Units.
During the years ended December 31, 2010 and 2009, the Company issued 638,957 and 242,507 shares of its Common Stock, respectively, upon the exercise of options to purchase Common Stock by certain employees.2012.
13. Future Minimum Rents
The properties are leased to tenants under net operating leases with initial term expiration dates ranging from 20112013 to 2049.2048. The future contractual minimum lease payments to be received (excluding operating expense reimbursements) by the Company as of December 31, 2010,2012, under non-cancelable operating leases which expire on various dates through 2049,2048, are as follows:
Years Ending December 31, | (in thousands) | (in thousands) | ||||||
2011 | $ | 1,254,752 | ||||||
2012 | 1,228,751 | |||||||
2013 | 1,206,567 | $ | 1,388,064 | |||||
2014 | 1,160,446 | 1,411,267 | ||||||
2015 | 1,050,280 | 1,376,772 | ||||||
2016 | 1,306,648 | |||||||
2017 | 1,179,722 | |||||||
Thereafter | 5,242,678 | 6,241,627 | ||||||
No single tenant represented more than 10.0% of the Company’s total rental revenue for the years ended December 31, 2010, 20092012, 2011 and 2008.2010.
14. Segment ReportingInformation
The Company’s segments are based on the Company’s method of internal reporting which classifies its operations by both geographic area and property type. The Company’s segments by geographic area are Greater Boston, Greater Washington, DC, Midtown Manhattan, GreaterNew York, Princeton, San Francisco and New Jersey.Washington, DC. Segments by property type include: Class A Office, Office/Technical, Residential and Hotels.Hotel.
Asset information by segment is not reported because the Company does not use this measure to assess performance. Therefore, depreciation and amortization expense is not allocated among segments. Interest and other income, development and management services, acquisition costs, general and administrative expenses, transaction costs, interest expense, depreciation and amortization expense, loss (gain) from suspension of development, net derivative losses, gains (losses) from investments in securities, losses from early extinguishments of debt, income (loss) from unconsolidated joint ventures, gains on sales of real estate, discontinued operations and noncontrolling interests are not included in Net Operating Income as internal reporting addresses these items on a corporate level.
Net Operating Income is not a measure of operating results or cash flows from operating activities as measured by accounting principles generally accepted in the United States of America, and it is not indicative of cash available to fund cash needs and should not be considered an alternative to cash flows as a measure of liquidity. All companies may not calculate Net Operating Income in the same manner. The Company considers Net Operating Income to be an appropriate supplemental measure to net income because it helps both investors and management to understand the core operations of the Company’s properties.
Information by geographic area and property type (dollars in thousands):
For the year ended December 31, 2010:2012:
| Greater Boston | Greater Washington, DC | Midtown Manhattan | Greater San Francisco | New Jersey | Total | Boston | New York | Princeton | San Francisco | Washington, DC | Total | |||||||||||||||||||||||||||||||||||||
Rental Revenue: | ||||||||||||||||||||||||||||||||||||||||||||||||
Class A Office | $ | 368,841 | $ | 335,508 | $ | 445,296 | $ | 215,468 | $ | 65,475 | $ | 1,430,588 | $ | 620,586 | $ | 481,844 | $ | 61,350 | $ | 214,316 | $ | 366,393 | $ | 1,744,489 | ||||||||||||||||||||||||
Office/Technical | 30,336 | 15,849 | — | — | — | 46,185 | 22,460 | — | — | 494 | 16,264 | 39,218 | ||||||||||||||||||||||||||||||||||||
Hotels | 32,800 | — | — | — | — | 32,800 | ||||||||||||||||||||||||||||||||||||||||||
Residential | 3,936 | — | — | — | 16,632 | 20,568 | ||||||||||||||||||||||||||||||||||||||||||
Hotel | 37,915 | — | — | — | — | 37,915 | ||||||||||||||||||||||||||||||||||||||||||
|
|
|
|
|
| |||||||||||||||||||||||||||||||||||||||||||
Total | 431,977 | 351,357 | 445,296 | 215,468 | 65,475 | 1,509,573 | 684,897 | 481,844 | 61,350 | 214,810 | 399,289 | 1,842,190 | ||||||||||||||||||||||||||||||||||||
|
|
|
|
|
| |||||||||||||||||||||||||||||||||||||||||||
% of Grand Totals | 28.62 | % | 23.27 | % | 29.50 | % | 14.27 | % | 4.34 | % | 100.0 | % | 37.18 | % | 26.16 | % | 3.33 | % | 11.66 | % | 21.67 | % | 100.00 | % | ||||||||||||||||||||||||
Rental Expenses: | ||||||||||||||||||||||||||||||||||||||||||||||||
Class A Office | 138,722 | 92,892 | 146,381 | 78,978 | 31,486 | 488,459 | 244,753 | 160,386 | 29,218 | 84,262 | 117,138 | 635,757 | ||||||||||||||||||||||||||||||||||||
Office/Technical | 9,067 | 4,168 | — | — | — | 13,235 | 6,499 | — | — | 149 | 3,966 | 10,614 | ||||||||||||||||||||||||||||||||||||
Hotels | 25,153 | — | — | — | — | 25,153 | ||||||||||||||||||||||||||||||||||||||||||
Residential | 1,675 | — | — | — | 9,317 | 10,992 | ||||||||||||||||||||||||||||||||||||||||||
Hotel | 28,120 | — | — | — | — | 28,120 | ||||||||||||||||||||||||||||||||||||||||||
|
|
|
|
|
| |||||||||||||||||||||||||||||||||||||||||||
Total | 172,942 | 97,060 | 146,381 | 78,978 | 31,486 | 526,847 | 281,047 | 160,386 | 29,218 | 84,411 | 130,421 | 685,483 | ||||||||||||||||||||||||||||||||||||
|
|
|
|
|
| |||||||||||||||||||||||||||||||||||||||||||
% of Grand Totals | 32.83 | % | 18.42 | % | 27.78 | % | 14.99 | % | 5.98 | % | 100.0 | % | 41.00 | % | 23.40 | % | 4.26 | % | 12.31 | % | 19.03 | % | 100.00 | % | ||||||||||||||||||||||||
|
|
|
|
|
| |||||||||||||||||||||||||||||||||||||||||||
Net operating income | $ | 259,035 | $ | 254,297 | $ | 298,915 | $ | 136,490 | $ | 33,989 | $ | 982,726 | $ | 403,850 | $ | 321,458 | $ | 32,132 | $ | 130,399 | $ | 268,868 | $ | 1,156,707 | ||||||||||||||||||||||||
|
|
|
|
|
| |||||||||||||||||||||||||||||||||||||||||||
% of Grand Totals | 26.36 | % | 25.88 | % | 30.42 | % | 13.89 | % | 3.45 | % | 100.0 | % | 34.91 | % | 27.79 | % | 2.78 | % | 11.27 | % | 23.25 | % | 100.00 | % | ||||||||||||||||||||||||
For the year ended December 31, 2009:2011:
| Greater Boston | Greater Washington, DC | Midtown Manhattan | Greater San Francisco | New Jersey | Total | Boston | New York | Princeton | San Francisco | Washington, DC | Total | |||||||||||||||||||||||||||||||||||||
Rental Revenue: | ||||||||||||||||||||||||||||||||||||||||||||||||
Class A Office | $ | 364,064 | $ | 318,786 | $ | 441,571 | $ | 218,432 | $ | 63,189 | $ | 1,406,042 | $ | 540,924 | $ | 458,791 | $ | 62,648 | $ | 213,257 | $ | 359,544 | $ | 1,635,164 | ||||||||||||||||||||||||
Office/Technical | 30,655 | 16,230 | — | — | — | 46,885 | 25,349 | — | — | — | 16,236 | 41,585 | ||||||||||||||||||||||||||||||||||||
Hotels | 30,385 | — | — | — | — | 30,385 | ||||||||||||||||||||||||||||||||||||||||||
Residential | 985 | — | — | — | 5,632 | 6,617 | ||||||||||||||||||||||||||||||||||||||||||
Hotel | 34,529 | — | — | — | — | 34,529 | ||||||||||||||||||||||||||||||||||||||||||
|
|
|
|
|
| |||||||||||||||||||||||||||||||||||||||||||
Total | 425,104 | 335,016 | 441,571 | 218,432 | 63,189 | 1,483,312 | 601,787 | 458,791 | 62,648 | 213,257 | 381,412 | 1,717,895 | ||||||||||||||||||||||||||||||||||||
|
|
|
|
|
| |||||||||||||||||||||||||||||||||||||||||||
% of Grand Totals | 28.66 | % | 22.58 | % | 29.77 | % | 14.73 | % | 4.26 | % | 100.0 | % | 35.03 | % | 26.71 | % | 3.65 | % | 12.41 | % | 22.20 | % | 100.00 | % | ||||||||||||||||||||||||
Rental Expenses: | ||||||||||||||||||||||||||||||||||||||||||||||||
Class A Office | 137,785 | 93,799 | 146,398 | 80,269 | 29,751 | 488,002 | 208,133 | 152,649 | 30,150 | 80,729 | 101,559 | 573,220 | ||||||||||||||||||||||||||||||||||||
Office/Technical | 9,475 | 4,322 | — | — | — | 13,797 | 7,245 | — | — | — | 4,280 | 11,525 | ||||||||||||||||||||||||||||||||||||
Hotels | 23,966 | — | — | — | — | 23,966 | ||||||||||||||||||||||||||||||||||||||||||
Residential | 521 | — | — | — | 4,958 | 5,479 | ||||||||||||||||||||||||||||||||||||||||||
Hotel | 26,128 | — | — | — | — | 26,128 | ||||||||||||||||||||||||||||||||||||||||||
|
|
|
|
|
| |||||||||||||||||||||||||||||||||||||||||||
Total | 171,226 | 98,121 | 146,398 | 80,269 | 29,751 | 525,765 | 242,027 | 152,649 | 30,150 | 80,729 | 110,797 | 616,352 | ||||||||||||||||||||||||||||||||||||
|
|
|
|
|
| |||||||||||||||||||||||||||||||||||||||||||
% of Grand Totals | 32.57 | % | 18.66 | % | 27.84 | % | 15.27 | % | 5.66 | % | 100.0 | % | 39.27 | % | 24.77 | % | 4.89 | % | 13.10 | % | 17.97 | % | 100.00 | % | ||||||||||||||||||||||||
|
|
|
|
|
| |||||||||||||||||||||||||||||||||||||||||||
Net operating income | $ | 253,878 | $ | 236,895 | $ | 295,173 | $ | 138,163 | $ | 33,438 | $ | 957,547 | $ | 359,760 | $ | 306,142 | $ | 32,498 | $ | 132,528 | $ | 270,615 | $ | 1,101,543 | ||||||||||||||||||||||||
|
|
|
|
|
| |||||||||||||||||||||||||||||||||||||||||||
% of Grand Totals | 26.51 | % | 24.74 | % | 30.83 | % | 14.43 | % | 3.49 | % | 100.0 | % | 32.66 | % | 27.79 | % | 2.95 | % | 12.03 | % | 24.57 | % | 100.00 | % | ||||||||||||||||||||||||
For the year ended December 31, 2008:2010:
| Greater Boston | Greater Washington, DC | Midtown Manhattan | Greater San Francisco | New Jersey | Total | Boston | New York | Princeton | San Francisco | Washington, DC | Total | |||||||||||||||||||||||||||||||||||||
Rental Revenue: | ||||||||||||||||||||||||||||||||||||||||||||||||
Class A Office | $ | 360,468 | $ | 282,166 | $ | 435,219 | $ | 214,202 | $ | 63,908 | $ | 1,355,963 | $ | 366,200 | $ | 445,296 | $ | 65,475 | $ | 215,468 | $ | 335,508 | $ | 1,427,947 | ||||||||||||||||||||||||
Office/Technical | 30,634 | 15,455 | — | — | — | 46,089 | 25,499 | — | — | — | 15,849 | 41,348 | ||||||||||||||||||||||||||||||||||||
Hotels | 36,872 | — | — | — | — | 36,872 | ||||||||||||||||||||||||||||||||||||||||||
Residential | — | — | — | — | — | — | ||||||||||||||||||||||||||||||||||||||||||
Hotel | 32,800 | — | — | — | — | 32,800 | ||||||||||||||||||||||||||||||||||||||||||
|
|
|
|
|
| |||||||||||||||||||||||||||||||||||||||||||
Total | 427,974 | 297,621 | 435,219 | 214,202 | 63,908 | 1,438,924 | 424,499 | 445,296 | 65,475 | 215,468 | 351,357 | 1,502,095 | ||||||||||||||||||||||||||||||||||||
|
|
|
|
|
| |||||||||||||||||||||||||||||||||||||||||||
% of Grand Totals | 29.74 | % | 20.68 | % | 30.25 | % | 14.89 | % | 4.44 | % | 100.0 | % | 28.26 | % | 29.65 | % | 4.36 | % | 14.34 | % | 23.39 | % | 100.00 | % | ||||||||||||||||||||||||
Rental Expenses: | ||||||||||||||||||||||||||||||||||||||||||||||||
Class A Office | 139,448 | 82,227 | 142,764 | 79,553 | 30,705 | 474,697 | 137,361 | 146,381 | 31,486 | 78,978 | 92,892 | 487,098 | ||||||||||||||||||||||||||||||||||||
Office/Technical | 9,650 | 3,683 | — | — | — | 13,333 | 6,888 | — | — | — | 4,168 | 11,056 | ||||||||||||||||||||||||||||||||||||
Hotels | 27,510 | — | — | — | — | 27,510 | ||||||||||||||||||||||||||||||||||||||||||
Residential | — | — | — | — | — | — | ||||||||||||||||||||||||||||||||||||||||||
Hotel | 25,153 | — | — | — | — | 25,153 | ||||||||||||||||||||||||||||||||||||||||||
|
|
|
|
|
| |||||||||||||||||||||||||||||||||||||||||||
Total | 176,608 | 85,910 | 142,764 | 79,553 | 30,705 | 515,540 | 169,402 | 146,381 | 31,486 | 78,978 | 97,060 | 523,307 | ||||||||||||||||||||||||||||||||||||
|
|
|
|
|
| |||||||||||||||||||||||||||||||||||||||||||
% of Grand Totals | 34.26 | % | 16.66 | % | 27.69 | % | 15.43 | % | 5.96 | % | 100.0 | % | 32.37 | % | 27.97 | % | 6.02 | % | 15.09 | % | 18.55 | % | 100.00 | % | ||||||||||||||||||||||||
|
|
|
|
|
| |||||||||||||||||||||||||||||||||||||||||||
Net operating income | $ | 251,366 | $ | 211,711 | $ | 292,455 | $ | 134,649 | $ | 33,203 | $ | 923,384 | $ | 255,097 | $ | 298,915 | $ | 33,989 | $ | 136,490 | $ | 254,297 | $ | 978,788 | ||||||||||||||||||||||||
|
|
|
|
|
| |||||||||||||||||||||||||||||||||||||||||||
% of Grand Totals | 27.22 | % | 22.93 | % | 31.67 | % | 14.58 | % | 3.60 | % | 100.0 | % | 26.06 | % | 30.54 | % | 3.47 | % | 13.95 | % | 25.98 | % | 100.00 | % | ||||||||||||||||||||||||
The following is a reconciliation of Net Operating Income to net income attributable to Boston Properties, Inc. (in thousands):
| Years ended December 31, | ||||||||||||
| 2010 | 2009 | 2008 | ||||||||||
Net operating income | $ | 982,726 | $ | 957,547 | $ | 923,384 | ||||||
Add: | ||||||||||||
Development and management services | 41,231 | 34,878 | 30,518 | |||||||||
Income (loss) from unconsolidated joint ventures | 36,774 | 12,058 | (182,018 | ) | ||||||||
Interest and other | 7,332 | 4,059 | 18,958 | |||||||||
Gains (losses) from investments in securities | 935 | 2,434 | (4,604 | ) | ||||||||
Gains on sales of real estate | 2,734 | 11,760 | 33,340 | |||||||||
Less: | ||||||||||||
General and administrative | 79,658 | 75,447 | 72,365 | |||||||||
Acquisition costs | 2,614 | — | — | |||||||||
Loss (gain) from suspension of development | (7,200 | ) | 27,766 | — | ||||||||
Depreciation and amortization | 338,371 | 321,681 | 304,147 | |||||||||
Interest expense | 378,079 | 322,833 | 295,322 | |||||||||
Losses from early extinguishments of debt | 89,883 | 510 | — | |||||||||
Net derivative losses | — | — | 17,021 | |||||||||
Noncontrolling interests in property partnerships | 3,464 | 2,778 | 1,997 | |||||||||
Noncontrolling interest—redeemable preferred units of the Operating Partnership. | 3,343 | 3,594 | 4,226 | |||||||||
Noncontrolling interest—common units of the Operating Partnership | 24,099 | 35,534 | 14,392 | |||||||||
Noncontrolling interest in gains on sales of real estate—common units of the Operating Partnership | 349 | 1,579 | 4,838 | |||||||||
Net income attributable to Boston Properties, Inc. | $ | 159,072 | $ | 231,014 | $ | 105,270 | ||||||
| Year ended December 31, | ||||||||||||
| 2012 | 2011 | 2010 | ||||||||||
Net Operating Income | $ | 1,156,707 | $ | 1,101,543 | $ | 978,788 | ||||||
Add: | ||||||||||||
Development and management services income | 34,077 | 33,425 | 41,215 | |||||||||
Income from unconsolidated joint ventures | 49,078 | 85,896 | 36,774 | |||||||||
Interest and other income | 10,091 | 5,358 | 7,332 | |||||||||
Gains (losses) from investments in securities | 1,389 | (443 | ) | 935 | ||||||||
Gains on sales of real estate | — | — | 2,734 | |||||||||
Income from discontinued operations | 1,040 | 1,881 | 1,442 | |||||||||
Gain on sale of real estate from discontinued operations | 36,877 | — | — | |||||||||
Less: | ||||||||||||
General and administrative expense | 82,382 | 79,610 | 79,396 | |||||||||
Transaction costs | 3,653 | 1,987 | 2,876 | |||||||||
Suspension of development | — | — | (7,200 | ) | ||||||||
Depreciation and amortization expense | 453,068 | 436,612 | 335,859 | |||||||||
Interest expense | 413,564 | 394,131 | 378,079 | |||||||||
Losses from early extinguishments of debt | 4,453 | 1,494 | 89,883 | |||||||||
Noncontrolling interest in property partnerships | 3,792 | 1,558 | 3,464 | |||||||||
Noncontrolling interest—redeemable preferred units of the Operating Partnership | 3,497 | 3,339 | 3,343 | |||||||||
Noncontrolling interest—common units of the Operating Partnership | 31,046 | 36,035 | 23,915 | |||||||||
Noncontrolling interest in gains on sales of real estate—common units of the Operating Partnership | — | — | 349 | |||||||||
Noncontrolling interest in discontinued operations—common units of the Operating Partnership | 4,154 | 215 | 184 | |||||||||
|
|
|
|
|
| |||||||
Net income attributable to Boston Properties, Inc. | $ | 289,650 | $ | 272,679 | $ | 159,072 | ||||||
|
|
|
|
|
| |||||||
15. Earnings Per Share
EarningsThe following table provides a reconciliation of both the net income attributable to Boston Properties, Inc. and the number of common shares used in the computation of basic earnings per share (“EPS”) has been computed pursuant to the provisions of ASC 260-10 “Earnings Per Share” (“ASC 260-10”). During 2004, the Company adopted the guidance included in ASC 260-10 (formerly known as EITF 03-6 “Participating Securities and the Two-Class Method under FASB 128” (“EITF 03-6”)), which provides further guidance onis calculated by dividing net income attributable to Boston Properties, Inc. by the definitionweighted-average number of participating securities. Pursuant tocommon shares outstanding during the guidance included in ASC 260-10,period. The terms of the Operating Partnership’s Series Two Preferred Units which are reflected as Noncontrolling Interests—Redeemable Preferredenable the holders to obtain OP Units of the Operating Partnership, inas well as Common Stock of the Company’s Consolidated Balance Sheets,Company. As a result, the Series Two Preferred Units are considered participating securities and are included in the computation of basic and diluted earnings per share of the Company if the effect of applying the if-converted method is dilutive. The terms of the Series Two Preferred Units enable the holders to obtain OP Units of the Operating Partnership, as well as Common Stock of the Company. In June 2008, the FASB issued guidance included in ASC 260-10 (formerly known as FSP EITF 03-6-1, “Determining Whether Instruments Granted in Share-Based Payment Transactions are Participating Securities” (“FSP EITF 03-6-1”)). The guidance included in ASC 260-10 clarifies that unvestedUnvested share-based payment awards that contain non-forfeitable rights to dividends or dividend equivalents (whether paid or unpaid) are participating securities and shall be included in the computation of EPS pursuant to the two-class method. The guidance included in ASC 260-10 requires the retrospective adjustment of all prior-period EPS data presented (including interim financial statements, summaries of earnings, and selected financial data) to conform with the provisions of the guidance. Early application was not permitted. As a result, the Company’s unvested restricted common stock of the Company’s LTIP Units and 2008 OPP Units are considered participating securities and are included in the computation of basic and diluted earnings per share of the Company if the effect of applying the if-converted method is dilutive. The adoption of the guidance included in ASC 260-10 on January 1, 2009 did not have a material impact on the Company’s computation of EPS. Because the 2008 OPP Units require the Company to outperform absolute and relative return thresholds, unless such thresholds have been met by the end of the applicable reporting period, the Company excludes the 2008 OPP Unitssuch units from the diluted EPS calculation. For the years ended December 31, 2010, 2009 and 2008, the absolute and relative return thresholds for the 2008 OPP Units were not met and as a result the 2008 OPP Units have been excluded from the diluted EPS calculation (See Note 20). Other potentially dilutive common shares, including stock options, restricted stock and other securities of the Operating Partnership that are exchangeable for the Company’s Common Stock, and the related impact on earnings, are considered when calculating diluted EPS. The following table provides a reconciliation of both the net income attributable to Boston Properties, Inc. and the number of common shares used in the computation of basic EPS, which is calculated by dividing net income attributable to Boston Properties, Inc. by the weighted-average number of common shares outstanding during the period.
| For the year ended December 31, 2010 | For the Year Ended December 31, 2012 | |||||||||||||||||||||||
| Income (Numerator) | Shares (Denominator) | Per Share Amount | Income (Numerator) | Shares (Denominator) | Per Share Amount | |||||||||||||||||||
| (in thousands, except for per share amounts) | (in thousands, except for per share amounts) | |||||||||||||||||||||||
Basic Earnings: | ||||||||||||||||||||||||
Income from continuing operations attributable to Boston Properties, Inc. | $ | 255,887 | 150,120 | $ | 1.71 | |||||||||||||||||||
Discontinued operations attributable to Boston Properties, Inc. | 33,763 | — | 0.22 | |||||||||||||||||||||
|
|
| ||||||||||||||||||||||
Net income attributable to Boston Properties, Inc. | $ | 159,072 | 139,440 | $ | 1.14 | $ | 289,650 | 150,120 | $ | 1.93 | ||||||||||||||
Effect of Dilutive Securities: | ||||||||||||||||||||||||
Stock Based Compensation | — | 617 | (0.00 | ) | ||||||||||||||||||||
Stock Based Compensation and Exchangeable Senior Notes | — | 591 | (0.01 | ) | ||||||||||||||||||||
|
|
| ||||||||||||||||||||||
Diluted Earnings: | ||||||||||||||||||||||||
Net income attributable to Boston Properties, Inc. | $ | 289,650 | 150,711 | $ | 1.92 | |||||||||||||||||||
|
|
| ||||||||||||||||||||||
Net income | $ | 159,072 | 140,057 | $ | 1.14 | |||||||||||||||||||
| For the Year Ended December 31, 2011 | ||||||||||||||||||||||||
| Income (Numerator) | Shares (Denominator) | Per Share Amount | ||||||||||||||||||||||
| (in thousands, except for per share amounts) | ||||||||||||||||||||||||
Basic Earnings: | ||||||||||||||||||||||||
Income from continuing operations attributable to Boston Properties, Inc. | $ | 271,013 | 145,693 | $ | 1.86 | |||||||||||||||||||
Discontinued operations attributable to Boston Properties, Inc. | 1,666 | — | 0.01 | |||||||||||||||||||||
|
|
| ||||||||||||||||||||||
Net income attributable to Boston Properties, Inc. | $ | 272,679 | 145,693 | $ | 1.87 | |||||||||||||||||||
Effect of Dilutive Securities: | ||||||||||||||||||||||||
Stock Based Compensation and Exchangeable Senior Notes | — | 525 | (0.01 | ) | ||||||||||||||||||||
|
|
| ||||||||||||||||||||||
Diluted Earnings: | ||||||||||||||||||||||||
Net income attributable to Boston Properties, Inc. | $ | 272,679 | 146,218 | $ | 1.86 | |||||||||||||||||||
|
|
| ||||||||||||||||||||||
Basic Earnings: Net income attributable to Boston Properties, Inc. Effect of Dilutive Securities: Stock Based Compensation Diluted Earnings: Net income For the year ended December 31, 2009 Income
(Numerator) Shares
(Denominator) Per
Share
Amount (in thousands, except for per share amounts) $ 231,014 131,050 $ 1.76 — 462 (0.00 ) $ 231,014 131,512 $ 1.76
| For the year ended December 31, 2008 | For the Year Ended December 31, 2010 | |||||||||||||||||||||||
| Income (Numerator) | Shares (Denominator) | Per Share Amount | Income (Numerator) | Shares (Denominator) | Per Share Amount | |||||||||||||||||||
| (in thousands, except for per share amounts) | (in thousands, except for per share amounts) | |||||||||||||||||||||||
Basic Earnings: | ||||||||||||||||||||||||
Income from continuing operations attributable to Boston Properties, Inc. | $ | 157,814 | 139,440 | $ | 1.13 | |||||||||||||||||||
Discontinued operations attributable to Boston Properties, Inc. | 1,258 | — | 0.01 | |||||||||||||||||||||
|
|
| ||||||||||||||||||||||
Net income attributable to Boston Properties, Inc. | $ | 105,270 | 119,980 | $ | 0.88 | $ | 159,072 | 139,440 | $ | 1.14 | ||||||||||||||
Effect of Dilutive Securities: | ||||||||||||||||||||||||
Stock Based Compensation | — | 1,319 | (0.01 | ) | ||||||||||||||||||||
Stock Based Compensation and Exchangeable Senior Notes | — | 617 | — | |||||||||||||||||||||
|
|
| ||||||||||||||||||||||
Diluted Earnings: | ||||||||||||||||||||||||
Net income attributable to Boston Properties, Inc. | $ | 159,072 | 140,057 | $ | 1.14 | |||||||||||||||||||
|
|
| ||||||||||||||||||||||
Net income | $ | 105,270 | 121,299 | $ | 0.87 | |||||||||||||||||||
16. Employee Benefit Plans
Effective January 1, 1985, the predecessor of the Company adopted a 401(k) Savings Plan (the “Plan”) for its employees. Under the Plan, as amended, employees, as defined, are eligible to participate in the Plan after they have completed three months of service. Upon formation, the Company adopted the Plan and the terms of the Plan.
Effective January 1, 2000, the Company amended the Plan by increasing the Company’s matching contribution to 200% of the first 3% from 200% of the first 2% of participant’s eligible earnings contributed (utilizing earnings that are not in excess of an amount established by the IRS ($245,000,250,000, $245,000 and $230,000$245,000 in 2010, 20092012, 2011 and 2008,2010, respectively), indexed for inflation) and by eliminating the vesting requirement. The Company’s aggregate matching contribution for the years ended December 31, 2012, 2011 and 2010 2009 and 2008 was $2.9$3.2 million, $3.0$3.1 million and $2.7$2.9 million, respectively.
Effective January 1, 2001, the Company amended the Plan to provide a supplemental retirement contribution to certain employees who have at least ten years of service on January 1, 2001, and who are 40 years of age or older as of January 1, 2001. The maximum supplemental retirement contribution will not exceed the annual limit on contributions established by the Internal Revenue Service. The Company will record an annual supplemental retirement credit for the benefit of each participant. The Company’s supplemental retirement contribution and credit for the years ended December 31, 2012, 2011 and 2010 2009was $78,000, $62,000 and 2008 was $48,000, $122,000 and $210,000, respectively.
The Company also maintains a deferred compensation plan that is designed to allow officers of the Company to defer a portion of their current income on a pre-tax basis and receive a tax-deferred return on these deferrals. The Company’s obligation under the plan is that of an unsecured promise to pay the deferred compensation to the plan participants in the future. At December 31, 20102012 and 2009,2011, the Company has fundedhad maintained approximately $8.7$12.2 million and $9.9$9.5 million, respectively, intoin a separate account, which is not restricted as to its use. The Company’s liability under the plan is equal to the total amount of compensation deferred by the plan
participants and earnings on the deferred compensation pursuant to investments elected by the plan participants. The Company’s liability as of December 31, 20102012 and 20092011 was $8.7$12.2 million and $9.8$9.5 million, respectively, which are included in the accompanying Consolidated Balance Sheets.
17. Stock Option and Incentive Plan and Stock Purchase Plan
TheOn January 25, 2012, the Compensation Committee of the Board of Directors of the Company has established a stock option and incentive plan for the purpose of attracting and retaining qualified employees and rewarding them for superior performance in achieving the Company’s business goals and enhancing stockholder value.
Underapproved outperformance awards under the Company’s 1997 Stock Option and Incentive Plan (the “1997 Plan”), the number of shares of Common Stock available for issuance was 4,019,174 shares. At December 31, 2010, the number of shares available for issuance under the plan was 1,575,669, of which a maximum of 1,122,204 shares may be granted as awards other than stock options. The 1997 Plan expires on May 15, 2017.
On January 24, 2008, the Compensation Committee (the “Committee”) of the Board of Directors (the “Board”) of the Company approved outperformance awards under the 1997 Plan to certain officers and key employees of the Company. These awards (the “2008“2012 OPP Awards”) wereare part of a broad-based, long-term incentive compensation program designed to provide the Company’s management team at several levels within the organization with the potential to earn equity awards subject to the Company “outperforming” and creating shareholder value in a pay-for-performance structure. 20082012 OPP Awards utilize total return to shareholders (“TRS”) over a three-year measurement period as the performance metric and include two years of time-based vesting after the end of the performance measurement period (subject to acceleration in certain events) as a retention tool. Recipients of 20082012 OPP Awards were eligible towill share in an outperformance pool if the Company’s TRS, including both share appreciation and dividends, exceeds absolute and relative hurdles over a three-year measurement period from February 5, 20087, 2012 to February 5, 2011,6, 2015, based on the average closing price of a share of the Company’s common stock (a “REIT Share”) of $92.8240$106.69 for the five trading days prior to and including February 5, 2008.7, 2012. The aggregate reward that recipients of all 20082012 OPP Awards couldcan earn, as measured by the outperformance pool, wasis subject to a maximum cap of $110 million,$40.0 million.
The outperformance pool will consist of (i) two percent (2%) of the excess total return above a cumulative absolute TRS hurdle of 24% over the full three-year measurement period (equivalent to 8% per annum) (the “Absolute TRS Component”) and (ii) two percent (2%) of the excess or deficient excess total return above or below a relative TRS hurdle equal to the total return of the SNL Equity REIT Index over the three-year measurement period (the “Relative TRS Component”). In the event that the Relative TRS Component is potentially positive because the Company’s TRS is greater than the total return of the SNL Equity REIT Index, but the Company achieves a cumulative absolute TRS below 24% over the three-year measurement period (equivalent to 8% per annum), the actual contribution to the outperformance pool from the Relative TRS Component will be subject to a sliding scale factor as follows: (i) 100% of the potential Relative TRS Component will be earned if the Company’s TRS is equal to or greater than a cumulative 24% over three years, (ii) 0% will be earned if the Company’s TRS is 0% or less, and (iii) a percentage from 0% to 100% calculated by linear interpolation will be earned if the Company’s cumulative TRS over three years is between 0% and 24%. For example, if the Company achieves a cumulative absolute TRS of 18% over the full three-year measurement period (equivalent to a 6% absolute annual TRS), the potential Relative TRS Component would be prorated by 75%. The potential Relative TRS Component before application of the sliding scale factor will be capped at $40.0 million. In the event that the Relative TRS Component is negative because the Company’s TRS is less than the total return of the SNL Equity REIT Index, any outperformance reward potentially earned under the Absolute TRS Component will be reduced dollar for dollar, provided that the potential Absolute TRS Component before reduction for any negative Relative TRS Component will be capped at $40.0 million. The algebraic sum of the Absolute TRS Component and the Relative TRS Component determined as described above will never exceed $40.0 million.
Each employee’s 2012 OPP Award was designated as a specified percentage of the aggregate outperformance pool. Assuming the applicable absolute and/or relative TRS thresholds are achieved at the end of the measurement period, the algebraic sum of the Absolute TRS Component and the Relative TRS Component will be calculated and then allocated among the 2012 OPP Award recipients in accordance with each individual’s percentage. If there is a change of control prior to February 6, 2015, the measurement period will end on the change of control date and both the Absolute TRS Component (using a prorated absolute TRS hurdle) and the Relative TRS Component will be calculated and, assuming the applicable absolute and/or relative TRS thresholds are achieved over the shorter measurement period, allocated among the 2012 OPP Award recipients as of that date.
Rewards earned with respect to 2012 OPP Awards (if any) will vest 25% on February 7, 2015, 25% on February 7, 2016 and 50% on February 7, 2017, based on continued employment. Vesting will be accelerated in the event of a change in control of the Company, termination of employment without cause, termination of employment by the award recipient for good reason, death, disability or retirement, although only awardsrestrictions on transfer will continue to apply in certain of these situations. All determinations, interpretations and assumptions
relating to the calculation of performance and vesting relating to 2012 OPP Awards will be made by the Compensation Committee. 2012 OPP Awards were issued in the form of LTIP Units prior to the determination of the outperformance pool, but will remain subject to forfeiture depending on the extent of rewards earned with respect to 2012 OPP Awards. The number of LTIP Units issued initially to recipients of the 2012 OPP Awards is an estimate of the maximum number of LTIP Units that they could earn, based on certain assumptions. The number of LTIP Units actually earned by each award recipient will be determined at the end of the performance measurement period by dividing his or her share of the outperformance pool by the average closing price of a REIT Share for an aggregatethe 15 trading days immediately preceding the measurement date. Total return for the Company and for the SNL Equity REIT Index over the three-year measurement period and other circumstances will determine how many LTIP Units are earned by each recipient; if they are fewer than the number issued initially, the balance will be forfeited as of up to approximately $104.8 million were granted.the performance measurement date. Prior to the measurement date, 2008LTIP units issued on account of 2012 OPP Units wereAwards are entitled to receive per unit distributions equal to one-tenth (10%) of the regular quarterly distributions payable on an OP Unit, but werewill not be entitled to receive any special distributions (See Note 20).
The Company issued 69,499, 62,876 and 4,723 sharesdistributions. After the measurement date, the number of restricted stock and 252,597, 515,007 and 288,507 LTIP Units, both vested and unvested, which 2012 OPP Award recipients have earned based on the establishment of an outperformance pool, will be entitled to employeesreceive distributions in an amount per unit equal to distributions, both regular and directors under the 1997 Plan during the years ended December 31, 2010, 2009 and 2008, respectively. The Company issued 1,085,861 2008 OPPspecial, payable on an OP Unit. LTIP Units under the 1997 Plan during the year ended December 31, 2008. Employees paid $0.01 per share of restricted common stock and $0.25 per LTIP and 2008 OPP Unit. An LTIP Unit is generally the economic equivalent of a share of restricted stockare designed to qualify as “profits interests” in the Company. The aggregate valueOperating Partnership for federal income tax purposes. As a general matter, the profits interests characteristics of the LTIP Units is includedmean that initially they will not be economically equivalent in Noncontrolling Interests in the Consolidated Balance Sheets. The restricted stockvalue to an OP Unit. If and when events specified by applicable tax regulations occur, LTIP Units grantedcan over time increase in value up to employees between January 1, 2004 and October 2006 vest overthe point where they are equivalent to OP Units on a five-year term. Grants of restricted stock and LTIP Units made on and after November 2006 vest in four equal annual installments. Restricted stock andone-for-one basis. After LTIP Units are measuredfully vested, and to the extent the special tax rules applicable to profits interests have allowed them to become equivalent in value to OP Units, LTIP Units may be converted on a one-for-one basis into OP Units. OP Units in turn have a one-for-one relationship in value with Boston Properties, Inc. common stock, and are exchangeable on such one-for-one basis for cash or, at fair value on the date of grant based on the number of shares or units granted, as adjusted for forfeitures, and the priceelection of the Company’s Common Stock on the date of grant as quoted on the New York Stock Exchange. Such value is recognized as an expense ratably over the corresponding employee service period. As the 2008 OPP Awards are subject to both a service condition and a market condition, the Company, recognizes the compensation expense related to the 2008 OPP Awards under the graded vesting attribution method. Under the graded vesting attribution method, each portion of the award that vests at a different date is accounted for as a separate award and recognized over the period appropriate to that portion so that the compensation cost for each portion should be recognized in full by the time that portion vests. Dividends paid on both vested and unvested shares of restricted stock are charged directly to Earnings in Excess of Dividends in the Consolidated Balance Sheets. Stock-based compensation expense associated with restricted stock, LTIP Units and 2008Boston Properties, Inc. common stock.
The 2012 OPP Units was approximately $31.9 million, $25.6 million
and $22.1 million for the years ended December 31, 2010, 2009 and 2008, respectively. For the year ended December 31, 2010, stock-based compensation expense includeswere valued, in accordance with ASC 718 “Compensation—Stock Compensation,” at an aggregate of approximately $5.8 million of remaining previously unvested stock-based compensation granted between 2006 and 2009 to Edward H. Linde, the Company’s former Chief Executive Officer, which expense was accelerated as a result of his passing on January 10, 2010. At December 31, 2010, there was $27.7 million of unrecognized compensation expense related to unvested restricted stock and LTIP Units and $4.4 million of unrecognized compensation expense related to unvested 2008 OPP Units that is expected to be recognized over a weighted-average period of approximately 2.0 years. Upon the conclusion of the three-year measurement period on February 5, 2011, the 2008 OPP Awards were not earned, and therefore the program was terminated, which resulted in the Company accelerating the remaining unrecognized compensation expense totaling approximately $4.3 million during the first quarter of 2011.
The shares of restricted stock were valued at approximately $4.5 million ($65.31 per share weighted-average), $2.8 million ($43.89 per share weighted-average) and $0.5 million ($96.09 per share weighted-average) for the years ended December 31, 2010, 2009 and 2008, respectively.
LTIP Units were valued using a Monte Carlo simulation method model in accordance with the provisions of ASC 718 “Compensation—Stock Compensation” (“ASC 718”) (formerly SFAS No. 123R). LTIP Units issued during the years ended December 31, 2010, 2009 and 2008 were valued at approximately $15.3 million, $21.1 million and $25.4 million, respectively. The weighted-average per unit fair value of LTIP Unit grants in 2010, 2009 and 2008 was $60.49, $41.05 and $88.08, respectively. The per unit fair value of each LTIP Unit granted in 2010, 2009 and 2008 was estimated on the date of grant using the following assumptions; an expected life of 5.7 years, 5.6 years and 5.6 years, a risk-free interest rate of 2.60%, 1.87% and 2.75% and an expected price volatility of 36.0%, 40.0% and 25.0%, respectively.
The 2008 OPP Units were valued at approximately $19.7$7.7 million utilizing a Monte Carlo simulation to estimate the probability of the performance vesting conditions being satisfied. The Monte Carlo simulation used a statistical formula underlying the Black-Scholes and binomial formulas and such simulation was run approximately 100,000 times. For each simulation, the payoff is calculated at the settlement date, which is then discounted to the award date at a risk-free interest rate. The average of the values over all simulations is the expected value of the unit on the award date. Assumptions used in the valuations included (1) factors associated with the underlying performance of the Company’s stock price and total shareholder return over the term of the performance awards including total stock return volatility and risk-free interest and (2) factors associated with the relative performance of the Company’s stock price and total shareholder return when compared to the SNL Equity REIT Index. The valuation was performed in a risk-neutral framework, so no assumption was made with respect to an equity risk premium. The fair value of the 20082012 OPP Units is based on the sum of: (1) the present value of the expected payoff to the OPP Award on the measurement date, if the TRS over the applicable measurement period exceeds performance hurdles of the Absolute and the Relative Components; and (2) the present value of the distributions payable on the 20082012 OPP Units. The ultimate reward realized on account of the OPP Award by the holders of the 20082012 OPP Units is contingent on the TRS achieved on the measurement date, both in absolute terms and relative to the TRS of the SNL Equity REIT Index. The per unit fair value of each 20082012 OPP Unit was estimated on the date of grant using the following assumptions in the Monte-CarloMonte Carlo valuation: expected price volatility for the Company and the SNL Equity REIT index of 25%31% and 20%30%, respectively; a risk free rate of 2.08%0.35%; and estimated total dividend payments over the measurement period of $8.23$7.28 per share.
On February 29, 2012, E. Mitchell Norville resigned as Executive Vice President, Chief Operating Officer of the Company. In connection with his resignation, Mr. Norville entered into a separation agreement (the “Separation Agreement”) with the Company. Under the Separation Agreement, the Company agreed to pay Mr. Norville cash payments totaling approximately $1,533,333 (less applicable deductions) in addition to his cash bonus for 2011, which was $950,000. In addition, Mr. Norville agreed to provide consulting services to the
Company for at least two months following the effective date of his resignation for which he received $20,000 per month. Under the Separation Agreement, Mr. Norville is entitled to accelerated vesting with respect to 23,502 LTIP units in the Operating Partnership and stock options to purchase 4,464 shares of common stock at an exercise price of $92.71 and 5,117 shares of common stock at an exercise price of $104.47. Mr. Norville will also retain approximately 36% of his 2011 outperformance award, which will remain subject to the performance-based vesting criteria originally established for the 2011 outperformance awards. Mr. Norville agreed to one-year non-competition, non-solicitation and non-interference provisions, and provided the Company with a general release of claims. The Company recognized approximately $4.5 million of expense during the year ended December 31, 2012 in connection with Mr. Norville’s resignation.
At the Company’s 2012 annual meeting of stockholders held on May 15, 2012, the stockholders of the Company approved the Boston Properties, Inc. 2012 Stock Option and Incentive Plan (the “2012 Plan”). The 2012 Plan replaces the 1997 Plan. The material terms of the 2012 Plan include, among other things: (1) the maximum number of shares of common stock reserved and available for issuance under the 2012 Plan is the sum of (i) 13,000,000 newly authorized shares, plus (ii) the number of shares available for grant under the 1997 Stock Plan immediately prior to the effective date of the 2012 Plan, plus (iii) any shares underlying grants under the 1997 Plan that are forfeited, cancelled or terminated (other than by exercise) in the future; (2) “full-value” awards (i.e., awards other than stock options) are multiplied by a 2.32 conversion ratio to calculate the number of shares available under the 2012 Plan that are used for each full-value award, as opposed to a 1.0 conversion ratio for each stock option awarded under the 2012 Plan; (3) shares tendered or held back for taxes will not be added back to the reserved pool under the 2012 Plan; (4) stock options may not be re-priced without stockholder approval; and (5) the term of the 2012 Plan is for ten years from the date of stockholder approval.
The Company issued 20,756, 19,030 and 69,499 shares of restricted common stock and 174,650, 190,067, and 252,597 LTIP Units to employees and non-employee directors under the 1997 Plan and 2012 Plan during the years ended December 31, 2012, 2011 and 2010. The Company issued 186,007 and 146,844 non-qualified stock options under the 1997 Plan during the years ended December 31, 2012 and 2011, The Company issued 400,000 2011 OPP Units under the 1997 Plan during the year ended December 31, 2011. The Company issued 400,000 2012 OPP Units to employees and non-employee directors under the 1997 Plan during the year ended December 31, 2012. Employees and directors paid $0.01 per share of restricted common stock and $0.25 per LTIP Unit and OPP Unit. An LTIP Unit is generally the economic equivalent of a share of restricted stock in the Company. The aggregate value of the LTIP Units is included in noncontrolling interests in the Consolidated Balance Sheets. Grants of restricted stock and LTIP Units to employees vest in four equal annual installments. Restricted stock is measured at fair value on the date of grant based on the number of shares granted, as adjusted for forfeitures, and the closing price of the Company’s Common Stock on the date of grant as quoted on the New York Stock Exchange. Such value is recognized as an expense ratably over the corresponding employee service period. As the 2011 OPP Awards and 2012 OPP Awards are subject to both a service condition and a market condition, the Company recognizes the compensation expense related to the 2011 OPP Awards and 2012 OPP Awards under the graded vesting attribution method. Under the graded vesting attribution method, each portion of the award that vests at a different date is accounted for as a separate award and recognized over the period appropriate to that portion so that the compensation cost for each portion should be recognized in full by the time that portion vests. Dividends paid on both vested and unvested shares of restricted stock are charged directly to Dividends in Excess of Earnings in the Consolidated Balance Sheets. Aggregate stock-based compensation expense associated with restricted stock, non-qualified stock options, LTIP Units, 2008 OPP Units, 2011 OPP Units and 2012 OPP Units was approximately $28.3 million, $28.3 million and $31.9 million for the years ended December 31, 2012, 2011 and 2010, respectively. For the year ended December 31, 2012, stock-based compensation expense includes approximately $2.7 million consisting of the acceleration of vesting of the Company’s Chief Operating Officer’s stock-based compensation awards associated with his resignation. Upon the conclusion of the three-year measurement period in February 2011, the 2008 OPP Awards were not earned, the program was terminated and the Company accelerated the then remaining unrecognized compensation expense totaling approximately $4.3 million during the year ended December 31, 2011. For the year ended December 31, 2010, stock-based compensation expense includes an aggregate of approximately $5.8 million of
remaining previously unvested stock-based compensation granted between 2006 and 2009 to Edward H. Linde, the Company’s late Chief Executive Officer, which expense was accelerated as a result of his passing on January 10, 2010. At December 31, 2012, there was $21.1 million of unrecognized compensation expense related to unvested restricted stock and LTIP Units and $8.4 million of unrecognized compensation expense related to unvested 2011 OPP Units and 2012 OPP Units that is expected to be recognized over a weighted-average period of approximately 2.5 years.
The shares of restricted stock were valued at approximately $2.2 million ($107.31 per share weighted-average), $1.8 million ($93.40 per share weighted-average) and $4.5 million ($65.31 per share weighted-average) for the years ended December 31, 2012, 2011 and 2010, respectively.
LTIP Units were valued using a Monte Carlo simulation method model in accordance with the provisions of ASC 718 “Compensation—Stock Compensation” (“ASC 718”) (formerly SFAS No. 123R). LTIP Units issued during the years ended December 31, 2012, 2011 and 2010 were valued at approximately $17.3 million, $16.5 million and $15.3 million, respectively. The weighted-average per unit fair value of LTIP Unit grants in 2012, 2011 and 2010 was $98.83, $86.74 and $60.49, respectively. The per unit fair value of each LTIP Unit granted in 2012, 2011 and 2010 was estimated on the date of grant using the following assumptions; an expected life of 5.8 years, 5.8 years and 5.7 years, a risk-free interest rate of 0.94%, 2.22% and 2.60% and an expected price volatility of 29.1%, 30.0% and 36.0%, respectively.
The non-qualified stock options granted during the years ended December 31, 2012 and 2011 had a weighted-average fair value on the date of grant of $19.50 and $24.67 per option, respectively , which was computed using the Black-Scholes option-pricing model utilizing the following assumptions: an expected life of 5.4 years and 6.0 years, a risk-free interest rate of 0.92% and 2.37%, an expected price volatility of 28.4% and 35.0% and an expected dividend yield of 2.9% and 3.0%, respectively. The exercise price of the options granted during the years ended December 31, 2012 and 2011 where $107.23 and $92.71, respectively, which was the closing price of the Company’s common stock on the date of grant.
A summary of the status of the Company’s stock options as of December 31, 2010, 20092012, 2011 and 20082010 and changes during the years then ended December 31, 2010, 2009 and 2008 are presented below:
| Shares | Weighted Average Exercise Price | |||||||||||||||
Outstanding at December 31, 2007 | 2,264,535 | $ | 35.22 | |||||||||||||
Granted | — | — | ||||||||||||||
Exercised | (1,058,133 | ) | $ | 36.36 | ||||||||||||
Canceled | — | — | ||||||||||||||
Outstanding at December 31, 2008 | 1,206,402 | $ | 34.23 | |||||||||||||
Granted | — | — | ||||||||||||||
Exercised | (242,507 | ) | $ | 33.41 | ||||||||||||
Canceled | — | — | ||||||||||||||
| Shares | Weighted Average Exercise Price | |||||||||||||||
Outstanding at December 31, 2009 | 963,895 | $ | 34.44 | 963,895 | $ | 34.44 | ||||||||||
Granted | — | — | — | $ | — | |||||||||||
Exercised | (638,957 | ) | $ | 35.35 | (638,957 | ) | $ | 35.35 | ||||||||
Canceled | — | — | — | $ | — | |||||||||||
|
| |||||||||||||||
Outstanding at December 31, 2010 | 324,938 | $ | 32.65 | 324,938 | $ | 32.65 | ||||||||||
Granted | 146,844 | $ | 92.71 | |||||||||||||
Exercised | (316,159 | ) | $ | 32.63 | ||||||||||||
Canceled | — | $ | — | |||||||||||||
|
| |||||||||||||||
Outstanding at December 31, 2011 | 155,623 | $ | 89.35 | |||||||||||||
Granted | 186,007 | $ | 107.23 | |||||||||||||
Exercised | (22,823 | ) | $ | 72.42 | ||||||||||||
Canceled | (24,280 | ) | $ | 100.15 | ||||||||||||
|
| |||||||||||||||
Outstanding at December 31, 2012 | 294,527 | $ | 101.06 | |||||||||||||
|
| |||||||||||||||
The following table summarizes information about stock options outstanding at December 31, 2010:2012:
Options Outstanding | Options Exercisable | |||||||||||||||||||
Range of Exercise Prices | Number Outstanding at 12/31/10 | Weighted-Average Remaining Contractual Life | Weighted-Average Exercise Price | Number Exercisable at 12/31/10 | Weighted-Average Exercise Price | |||||||||||||||
| $32.62-$34.14 | 324,938 | 1.1 Years | $ | 32.65 | 324,938 | $ | 32.65 | |||||||||||||
Options Outstanding | Options Exercisable | |||||||||||||||||||
Exercise Prices | Number Outstanding at 12/31/12 | Weighted-Average Remaining Contractual Life | Weighted-Average Exercise Price | Number Exercisable at 12/31/12 | Weighted-Average Exercise Price | |||||||||||||||
| $92.71 | 128,989 | 8.1 Years | $ | 92.71 | 53,266 | $ | 92.71 | |||||||||||||
$107.57 | 165,538 | 9.1 Years | $ | 107.57 | 38,230 | $ | 107.57 | |||||||||||||
The total intrinsic value of the outstanding and exercisable stock options as of December 31, 20102012 was approximately $17.4$0.7 million. In addition, the Company had 963,89513,633 and 1,206,402324,938 options exercisable at a weighted-average exercise pricesprice of $34.44$54.32 and $34.23$32.65 at December 31, 20092011 and 2008,2010, respectively.
The Company adopted the 1999 Non-Qualified Employee Stock Purchase Plan (the “Stock Purchase Plan”) to encourage the ownership of Common Stock by eligible employees. The Stock Purchase Plan became effective on January 1, 1999 with an aggregate maximum of 250,000 shares of Common Stock available for issuance. The Stock Purchase Plan provides for eligible employees to purchase on the business day immediately following the end of the biannual purchase periods (i.e., January 1-June 30 and July 1-December 31) shares of Common Stock at a purchase price equal to 85% of the average closing prices of the Common Stock during the last ten business days of the purchase period. The Company issued 9,131, 12,1057,406, 6,356 and 7,7559,131 shares with the weighted average purchase price equal to $61.61$86.52 per share, $42.65$80.13 per share and $80.80$61.61 per share under the Stock Purchase Plan during the years ended December 31, 2010, 20092012, 2011 and 2008,2010, respectively.
18. Related Party Transactions
A firm controlled by Mr. Raymond A. Ritchey’s brother was paid aggregate leasing commissions of approximately $960,000, $257,000$1,306,000, $671,000 and $2,219,000$960,000 for the years ended December 31, 2010, 20092012, 2011 and 2008,2010, respectively, related to certain exclusive leasing arrangements for certain Northern Virginia properties. Mr. Ritchey is an Executive Vice President of Boston Properties, Inc.
Mr. Martin Turchin, a member of the Company’s Board of Directors, is a non-executive/non-director Vice Chairman of CB Richard Ellis (“CBRE”). Through an arrangement with CBRE and its predecessor, Insignia/ESG, Inc. that has been in place since 1985, Mr. Turchin and Turchin & Associates, an entity owned by
Mr. Turchin (95%) and his son (5%), participate in brokerage activities for which CBRE is retained as leasing agent, some of which involve leases for space within buildings owned by the Company. Additionally, Mr. Turchin’s son is employed by CBRE and works on transactions for which CBRE earns commission income from the Company. Mr. Turchin’s son’s compensation from CBRE is in the form of salary and bonus, neither of which is directly tied to CBRE’s transactions with the Company. For the years ended December 31, 2010, 20092012, 2011 and 2008,2010, Mr. Turchin, directly and through Turchin & Associates, received commission income of $93,000, $29,000$199,000, $24,000 and $138,000,$93,000, respectively, from commissions earned by CBRE and its predecessor, Insignia/ESG, Inc., from the Company. Pursuant to its arrangement with CBRE, Turchin & Associates has confirmed to the Company that it is paid on the same basis with respect to properties owned by the Company as it is with respect to properties owned by other clients of CBRE. Mr. Turchin does not participate in any discussions or other activities relating to the Company’s contractual arrangements with CBRE either in his capacity as a member of the Company’s Board of Directors or as a Vice Chairman of CBRE.
On June 30, 1998, the Company acquired from entities controlled by Mr. Alan B. Landis, a former director, a portfolio of properties known as the Carnegie Center Portfolio and Tower Center One and related operations and development rights (collectively, the “Carnegie Center Portfolio”). In connection with the acquisition of the Carnegie Center Portfolio, the Operating Partnership entered into a development agreement (the “Development Agreement”) with affiliates of Mr. Landis providing for up to approximately 2,000,000 square feet of development in or adjacent to the Carnegie Center office complex. An affiliate of Mr. Landis was entitled to a purchase price for each parcel developed under the Development Agreement calculated on the basis of $20 per
rentable square foot of property developed. Another affiliate of Mr. Landis was eligible to earn a contingent payment for each developed property that achieves a stabilized return in excess of a target annual return ranging between 10.5% and 11%. The Development Agreement also provided that upon negotiated terms and conditions, the Company and Mr. Landis would form a development company to provide development services for these development projects and would share the expenses and profits, if any, of this new company. In addition, in connection with the acquisition of the Carnegie Center Portfolio, Mr. Landis became a director of the Company pursuant to an Agreement Regarding Directorship, dated as of June 30, 1998, with the Company (the “Directorship Agreement”). Under the Directorship Agreement, the Company agreed to nominate Mr. Landis for re-election as a director at each annual meeting of stockholders of the Company in a year in which his term expires, provided that specified conditions are met.
On October 21, 2004, the Company entered into an agreement (the “2004 Agreement”) to modify several provisions of the Development Agreement. Under the terms of the 2004 Agreement, the Operating Partnership and affiliates of Mr. Landis amended the Development Agreement to limit the rights of Mr. Landis and his affiliates to participate in the development of properties under the Development Agreement. Among other things, Mr. Landis agreed that (1) Mr. Landis and his affiliates will have no right to participate in any entity formed to acquire land parcels or the development company formed by the Operating Partnership to provide development services under the Development Agreement, (2) Mr. Landis will have no right or obligation to play a role in development activities engaged in by the development company formed by the Operating Partnership under the Development Agreement or receive compensation from the development company and (3) the affiliate of Mr. Landis will have no right to receive a contingent payment for developed properties based on stabilized returns. In exchange, the Company (together with the Operating Partnership) agreed to:
effective as of June 30, 1998, pay Mr. Landis $125,000 on January 1 of each year until the earlier of (A) January 1, 2018, (B) the termination of the Development Agreement or (C) the date on which all development properties under the Development Agreement have been conveyed pursuant to the Development Agreement, with $750,000, representing payments of this annual amount from 1998 to 2004, being paid upon execution of the 2004 Agreement; and
pay an affiliate of Mr. Landis, in connection with the development of land parcels acquired under the Development Agreement, an aggregate fixed amount of $10.50 per rentable square foot of property developed (with a portion of this amount (i.e., $5.50) being subject to adjustment, in specified circumstances, based on future increases in the Consumer Price Index) in lieu of a contingent payment based on stabilized returns, which payment could have been greater or less than $10.50 per rentable square foot of property developed.
|
The Operating Partnership also continues to be obligated to pay an affiliate of Mr. Landis the purchase price of $20 per rentable square foot of property developed for each land parcel acquired as provided in the original Development Agreement. During the 20-year term of the Development Agreement, until such time, if any, as the Operating Partnership elects to acquire a land parcel, an affiliate of Mr. Landis will remain responsible for all carrying costs associated with such land parcel. On July 24, 2007, the Company acquired from Mr. Landis 701 Carnegie Center, a land parcel located in Princeton, New Jersey for a purchase price of approximately $3.1 million.
In addition, in connection with entering into the 2004 Agreement, Mr. Landis resigned as a director of the Company effective as of May 11, 2005 and agreed that the Company had no future obligation to nominate Mr. Landis as a director of the Company under the Directorship Agreement or otherwise. Mr. Landis did not resign because of a disagreement with the Company on any matter relating to its operations, policies or practices. Mitchell S. Landis, the Senior Vice President and Regional Manager of the Company’s Princeton, New Jersey region, is the brother of Alan B. Landis.
In accordance with the Company’s 19972012 Plan, and as approved by the Board of Directors, threefive non-employee directors made an election to receive deferred stock units in lieu of cash fees for 2010.2012. The deferred stock units will be settled in shares of common stock upon the cessation of such director’s service on the Board
of Directors. As a result of these elections, the aggregate cash fees otherwise payable to a non-employee director during a fiscal quarter are converted into a number of deferred stock units equal to the aggregate cash fees divided by the last reported sales price of a share of the Company’s common stock on the last trading of the applicable fiscal quarter. The deferred stock units are also credited with dividend equivalents as dividends are paid by the Company. At December 31, 20102012 and 2009,2011, the Company had outstanding 73,21876,682 and 87,30279,856 deferred stock units, respectively.
19. Selected Interim Financial Information (unaudited)
The tables below reflect the Company’s selected quarterly information for the years ended December 31, 20102012 and 2009. Certain2011. The servicer of the non-recourse mortgage loan in the amount of $25.0 million collateralized by the Company’s Montvale Center property located in Gaithersburg, Maryland foreclosed on the property on January 31, 2012. As a result of the foreclosure, the Company recognized a gain on forgiveness of debt during the first quarter of 2012 totaling approximately $15.8 million, net of noncontrolling interests’ share of approximately $2.0 million. Due to a procedural error of the trustee, the foreclosure sale was subsequently dismissed by the applicable court prior period amountsto ratification. As a result, the Company has revised its financial statements to properly reflect the property and related mortgage debt on its consolidated balance sheet at December 31, 2012 and has reversed the gain on forgiveness of debt during the quarter ended March 31, 2012 and has recognized the operating activity from the property within its consolidated statement of operations for each of the impacted quarters in the year ended December 31, 2012 (See Notes 3 and 6). In addition, total revenue and income from continuing operations have been reclassified to conform toin the currentquarter ended March 31, 2012 and the quarters in the year presentation.ended December 31, 2011 as a result of the discontinued operations presentation of the Company’s Bedford Business Park properties which were sold on May 17, 2012 (See Note 3).
| 2010 Quarter Ended | ||||||||||||||||
| March 31, | June 30, | September 30, | December 31, | |||||||||||||
| (in thousands, except for per share amounts) | ||||||||||||||||
Total revenue | $ | 378,071 | $ | 393,841 | $ | 386,410 | $ | 392,482 | ||||||||
Income (loss) from continuing operations | $ | 60,742 | $ | 71,518 | $ | 68,089 | $ | (12,756 | ) | |||||||
Net income (loss) attributable to Boston Properties, Inc. | $ | 52,714 | $ | 61,412 | $ | 57,668 | $ | (12,903 | ) | |||||||
Income (loss) attributable to Boston Properties, Inc. per share—basic | $ | 0.38 | $ | 0.44 | $ | 0.41 | $ | (0.09 | ) | |||||||
Income (loss) attributable to Boston Properties, Inc. per share—diluted | $ | 0.38 | $ | 0.44 | $ | 0.41 | $ | (0.09 | ) | |||||||
The quarter ended December 31, 2011 includes the gain on sale of Two Grand Central Tower totaling approximately $46.2 million, which is included within income from unconsolidated joint ventures on the Company’s consolidated statements of operations.
| 2012 Quarter Ended | ||||||||||||||||||||||||||||||||||||||||||||
| 2009 Quarter Ended | March 31, | June 30, | September 30, | December 31, | ||||||||||||||||||||||||||||||||||||||||
| March 31, | June 30, | September 30, | December 31, | As Reported | As Revised | As Reported | As Revised | As Reported | As Revised | As Reported | ||||||||||||||||||||||||||||||||||
| (in thousands, except for per share amounts) | (in thousands, except for per share amounts) | |||||||||||||||||||||||||||||||||||||||||||
Total revenue | $ | 377,224 | $ | 389,048 | $ | 375,790 | $ | 376,128 | $ | 447,662 | $ | 445,779 | $ | 472,897 | $ | 473,521 | $ | 470,904 | $ | 471,562 | $ | 485,405 | ||||||||||||||||||||||
Income from continuing operations | $ | 51,235 | $ | 75,580 | $ | 75,256 | $ | 60,668 | $ | 56,359 | $ | 55,193 | $ | 97,471 | $ | 96,899 | $ | 66,103 | $ | 65,522 | $ | 76,608 | ||||||||||||||||||||||
Net income attributable to Boston Properties, Inc. | $ | 44,598 | $ | 67,152 | $ | 65,795 | $ | 53,317 | $ | 64,632 | $ | 48,454 | $ | 119,070 | $ | 118,559 | $ | 57,769 | $ | 57,249 | $ | 65,400 | ||||||||||||||||||||||
Income attributable to Boston Properties, Inc. per share—basic | $ | 0.37 | $ | 0.54 | $ | 0.47 | $ | 0.38 | $ | 0.44 | $ | 0.33 | $ | 0.79 | $ | 0.79 | $ | 0.38 | $ | 0.38 | $ | 0.43 | ||||||||||||||||||||||
Income attributable to Boston Properties, Inc. per share—diluted | $ | 0.37 | $ | 0.53 | $ | 0.47 | $ | 0.38 | $ | 0.43 | $ | 0.33 | $ | 0.79 | $ | 0.78 | $ | 0.38 | $ | 0.38 | $ | 0.43 | ||||||||||||||||||||||
Total revenue Income from continuing operations Net income attributable to Boston Properties, Inc. Income attributable to Boston Properties, Inc. per share—basic Income attributable to Boston Properties, Inc. per share—diluted 2011 Quarter Ended March 31, June 30, September 30, December 31, As Reported As Revised As Reported As Revised As Reported As Revised As Reported As Revised (in thousands, except for per share amounts) $ 417,875 $ 415,943 $ 436,451 $ 434,505 $ 452,413 $ 450,344 $ 452,787 $ 450,528 $ 48,194 $ 47,644 $ 69,738 $ 69,353 $ 80,451 $ 79,942 $ 115,443 $ 115,006 $ 40,813 $ 40,813 $ 60,214 $ 60,214 $ 70,542 $ 70,542 $ 101,644 $ 101,644 $ 0.29 $ 0.29 $ 0.41 $ 0.41 $ 0.48 $ 0.48 $ 0.69 $ 0.69 $ 0.29 $ 0.29 $ 0.41 $ 0.41 $ 0.48 $ 0.48 $ 0.69 $ 0.69
20. Subsequent Events
On January 14, 2011,28, 2013, the Company placed in-service approximately 57% of the office component of its Atlantic Wharf development project located in Boston, Massachusetts. The office component, which is comprised of approximately 790,000 net rentable square feet, is currently 79% leased.
On January 20, 2011, theCompany’s Compensation Committee of the Board of Directors of the Company approved outperformancemulti-year long-term incentive program (MYLTIP) awards under the Company’s 1997 Stock Option and Incentive2012 Plan to certain officers and employees of the Company. TheseMYLTIP awards (the “2011 OPP Awards”) are part of a broad-based, long-term incentive compensation program designed to provide the Company’s management team with the potential to earn equity awards subject to the Company “outperforming” and creating shareholder value in a pay-for-performance structure. 2011 OPP Awards utilize TRS over a three-year measurement period, on an annualized, compounded basis, as the performance metricmetric. Earned awards will be based on the Company’s TRS relative to (i) the Cohen & Steers Realty Majors Portfolio Index (50% weight) and include(ii) the NAREIT Office Index adjusted to exclude the Company (50% weight). Earned awards will range from zero to a maximum of approximately $30.7 million depending on the Company’s TRS relative to the two yearsindices, with four tiers (threshold: approximately $5.1 million; target: approximately $10.2 million; high: approximately $20.5 million; exceptional: approximately $30.7 million) and linear interpolation between tiers. Earned awards measured on the basis of time-based vesting afterrelative TRS performance are subject to an absolute TRS component in the endform of relatively simple modifiers that (A) reduce the level of earned awards in the event the Company’s annualized TRS is less than 2% and (B) cause some awards to be earned in the event the Company’s annualized TRS is more than 10% even though on a relative basis alone the Company’s TRS would not result in any earned awards.
Earned awards (if any) will vest 25% on February 4, 2016, 25% on February 4, 2017 and 50% on February 4, 2018, based on continued employment. Vesting will be accelerated in the event of a change in control, termination of employment by the Company without cause, termination of employment by the award recipient for good reason, death, disability or retirement. If there is a change of control prior to February 4, 2016, earned awards will be calculated based on TRS performance up to the date of the change of control. MYLTIP awards are in the form of LTIP Units issued on the grant date which (i) are subject to forfeiture to the extent awards are not earned and (ii) prior to the performance measurement period (subjectdate are only entitled to acceleration in certain events) as a retention tool. Recipients of 2011 OPP Awards will share in an outperformance pool if the Company’s TRS, including both share appreciation and dividends, exceeds absolute and relative hurdles over a three-year measurement period from February 1, 2011 to January 31, 2014, based on the average closing price of a shareone-tenth (10%) of the Company’sregular quarterly distributions payable on common stock of $93.38 forpartnership units.
Under the five trading days prior to and including February 1, 2011. The aggregate reward that recipients of all 2011 OPP Awards can earn, as measured by the outperformance pool, is subject to a maximum cap of $40.0 million. The Company expects that in accordance with ASCFinancial Accounting Standards Board’s Accounting Standards Codification (“ASC”) 718 “Compensation – Stock“Compensation-Stock Compensation” the 2011 OPP Awards willMYLTIP awards have an aggregate value of approximately $7.8$8.1 million, which amount will generally be amortized into earnings over the five-year plan period under the graded vesting method.
The outperformance pool will consistOn January 29, 2013, the Company entered into an agreement to acquire a parcel of (i) two percent (2%)land located in Reston, Virginia for a purchase price of the excess total return above a cumulative absolute TRS hurdle of 27% over the full three-year measurement period (equivalent to 9% per annum) (the “Absolute TRS Component”) and (ii) two percent (2%) of the excess or deficient excess total return above or below a relative TRS hurdle equal to the total return of the SNL Equity REIT Index over the three-year measurement period (the “Relative TRS Component”). In the eventapproximately $27.0 million in cash. There can be no assurance that the Relative TRS Component is potentially positive because the Company’s TRS is greater than the total return of the SNL Equity REIT Index, but the Company achieves a cumulative absolute TRS below 27% over the three-year measurement period (equivalent to 9% per annum), the actual contribution to the outperformance pool from the Relative TRS Componentacquisition will be subject to a sliding scale factor as follows: (i) 100% of the potential Relative TRS Component will be earned if the Company’s TRS is equal to or greater than a cumulative 27% over three years, (ii) 0% will be earned if the Company’s TRS is 0% or less, and (iii) a percentage from 0% to 100% calculated by linear interpolation will be earned if the Company’s cumulative TRS over three years is between 0% and 27%. For example, if the Company achieves a cumulative absolute TRS of 18% over the full three-year measurement period (equivalent to a 6% absolute annual TRS), the potential Relative TRS Component would be prorated by 66.67%. The potential Relative TRS Component before application of the sliding scale factor will be capped at $40.0 million. In the event that the Relative TRS Component is negative because the Company’s TRS is less than the total return of the SNL Equity REIT Index, any outperformance reward potentially earned under the Absolute TRS Component will be reduced dollar for dollar, provided that the potential Absolute TRS Component before reduction for any negative Relative TRS Component will be capped at $40.0 million. The algebraic sum of the Absolute TRS Component and the Relative TRS Component determined as described above will never exceed $40.0 million.
Each employee’s 2011 OPP Award was designated as a specified percentage of the aggregate outperformance pool. Assuming the applicable absolute and/or relative TRS thresholds are achieved at the end of the measurement period, the algebraic sum of the Absolute TRS Component and the Relative TRS Component will be calculated and then allocated among the 2011 OPP Award recipients in accordance with each individual’s percentage. Rewards earned with respect to 2011 OPP Awards will vest 25% on February 1, 2014, 25% on February 1, 2015, and 50% on February 1, 2016, based on continued employment. Vesting will be accelerated in the event of a change of control of the Company, termination of employment without cause, termination of employment by the award recipient for good reason, death, disability or retirement, although restrictions on
transfer will continue to apply in certain of these situations. All determinations, interpretations and assumptions relating to the calculation of performance and vesting relating to 2011 OPP Awards will be made by the Compensation Committee. 2011 OPP Awards will be in the form of LTIP units of limited partnership interest (“LTIP Units”) of Boston Properties Limited Partnership (the “Operating Partnership”). LTIP Units will be issued prior to the determination of the outperformance pool, but will remain subject to forfeiture dependingcompleted on the extent of rewards earned with respect to 2011 OPP Awards. The number of LTIP Units issued initially to recipients of the 2011 OPP Awards is an estimate of the maximum number of LTIP Units that they could earn, based on certain assumptions. The number of LTIP Units actually earned by each award recipient will be determined at the end of the performance measurement period by dividing his or her share of the outperformance pool by the average closing price of a REIT Share for the 15 trading days immediately preceding the measurement date. Total return for the Company and for the SNL Equity REIT Index over the three-year measurement period and other circumstances will determine how many LTIP Units are earned by each recipient; if they are fewer than the number issued initially, the balance will be forfeited as of the performance measurement date. Prior to the measurement date, LTIP units issued on account of 2011 OPP Awards will be entitled to receive per unit distributions equal to one-tenth (10%) of the regular quarterly distributions payable on a common unit of limited partnership interest in the Operating Partnership (a “Common Unit”), but will not be entitled to receive any special distributions. After the measurement date, the number of LTIP Units, both vested and unvested, which 2011 OPP Award recipients have earned based on the establishment of an outperformance pool, will be entitled to receive distributions in an amount per unit equal to distributions, both regular and special, payable on a Common Unit. LTIP Units are designed to qualify as “profits interests” in the Operating Partnership for federal income tax purposes. As a general matter, the profits interests characteristics of the LTIP Units mean that initially they will not be economically equivalent in value to a Common Unit. If and when events specified by applicable tax regulations occur, LTIP Units can over time increase in value up to the point where they are equivalent to Common Units on a one-for-one basis. After LTIP Units are fully vested, and to the extent the special tax rules applicable to profits interests have allowed them to become equivalent in value to Common Units, LTIP Units may be converted on a one-for-one basis into Common Units. Common Units in turn have a one-for-one relationship in value with Boston Properties, Inc. common stock, and are exchangeable on such one-for-one basis for cashterms currently contemplated or at the election of the Company, Boston Properties, Inc. common stock.all.
On January 28, 2011,February 1, 2013, the Company issued 17,79535,087 shares of restricted common stock, 184,416153,006 LTIP units and 146,844201,373 non-qualified stock options under the 19972012 Plan to certain employees of the Company.
On February 5, 2013, the Company used available cash to repay the mortgage loan collateralized by its Kingstowne One property located in Alexandria, Virginia totaling approximately $17.0 million. The mortgage loan bore interest at a fixed rate of 5.96% per annum and was scheduled to mature on May 5, 2013. There was no prepayment penalty.
On February 1, 2011,6, 2013, the Company completed the acquisition of Bay Colony Corporate Center535 Mission Street, a development site, in Waltham, MassachusettsSan Francisco, California for an aggregate purchase price of approximately $185.0 million. The purchase price consisted$71.0 million in cash, including work completed and materials purchased to date. When completed, 535 Mission Street will consist of a 27-story, Class A office tower with approximately $41.1 million of cash and the assumption of approximately $143.9 million of indebtedness. The assumed debt is a securitized senior mortgage loan that bears interest at a fixed rate of 6.53% per annum and matures on June 11, 2012. The loan requires interest-only payments with a balloon payment due at maturity. Bay Colony Corporate Center is an approximately 1,000,000307,000 net rentable square foot, four-building Class Afeet of office park situated on a 58-acre site in Waltham, Massachusetts.and retail space. The Company has commenced development of the project.
On February 5, 2011,7, 2013, the measurement period forpartner in the Company’s 2008 OPP Awards expired andjoint venture that is pursuing the Company’s TRS performance was not sufficient for employeesacquisition of land in San Francisco, California which could support the office tower known as Transbay Tower, issued a notice that it has elected under the joint venture agreement to earn and therefore become eligiblereduce its nominal ownership interest in the venture from 50% to vest in any of the 2008 OPP Awards. Accordingly, all 2008 OPP Awards were automatically forfeited and the Operating Partnership repaid employees an amount equal to $0.25 (which is equal to what they paid upon acceptance of the award) multiplied by the number of 2008 OPP Awards they received.
During the first quarter of 2011 through5%. On February 25, 2011,26, 2013, the Company utilized its “atissued a notice to such partner electing to proceed with the market” (ATM) stock offering program to issue an aggregate of approximately 2,304,994 shares of its common stock for gross proceeds of approximately $219.0 million. The Company’s ATM stock offering program providesventure on that basis. As a result, the Company withhas a 95% nominal interest in, and expects to consolidate, the ability to sell from time to time up to an aggregate of $400.0 million of its common stock through sales agents for a three-year period.joint venture.
| Item 9. | Changes in and Disagreements with Accountants on Accounting and Financial |
None.
| Item 9A. | Controls and Procedures |
As of the end of the period covered by this report, an evaluation was carried out by our management, with the participation of our Chief Executive Officer and Chief Financial Officer, of the effectiveness of our disclosure controls and procedures (as defined in Rule 13a-15(e) under the Securities Exchange Act of 1934). Based upon that evaluation, our Chief Executive Officer and Chief Financial Officer concluded that these disclosure controls and procedures were effective as of the end of the period covered by this report. In addition, no change in our internal control over financial reporting (as defined in Rule 13a-15(f) under the Securities Exchange Act of 1934) occurred during the fourth quarter of our fiscal year ended December 31, 20102012 that has materially affected, or is reasonably likely to materially affect, our internal control over financial reporting.
Management’s Report on Internal Control over Financial Reporting is set forth on page 98102 of this Annual Report on Form 10-K and is incorporated herein by reference.
| Item 9B. | Other Information |
None.
| Item 10. | Directors, Executive Officers and Corporate Governance |
The information required by Item 10 will be included in the Proxy Statement to be filed relating to our 20112013 Annual Meeting of Stockholders and is incorporated herein by reference.
| Item 11. | Executive Compensation |
The information required by Item 11 will be included in the Proxy Statement to be filed relating to our 20112013 Annual Meeting of Stockholders and is incorporated herein by reference.
| Item 12. | Security Ownership of Certain Beneficial Owners and Management and Related Stockholder Matters |
The following table summarizes our equity compensation plans as of December 31, 2010.2012.
Equity Compensation Plan Information
Plan category | Number of securities to be issued upon exercise of outstanding options, warrants and rights | Weighted-average exercise price of outstanding options, warrants and rights | Number of securities remaining available for future issuance under equity compensation plans (excluding securities reflected in column (a)) | Number of securities to be issued upon exercise of outstanding options, warrants and rights | Weighted-average exercise price of outstanding options, warrants and rights | Number of securities remaining available for future issuance under equity compensation plans (excluding securities reflected in column (a)) | ||||||||||||||||||
| (a) | (b) | (c) | (a) | (b) | (c) | |||||||||||||||||||
Equity compensation plans approved by security holders(1) | 2,986,257 | (2) | $ | 32.65 | (2) | 1,575,669 | 2,486,493 | (2) | $ | 101.06 | (2) | 14,147,122 | (3) | |||||||||||
Equity compensation plans not approved by security holders | N/A | N/A | 142,856 | N/A | N/A | 129,094 | ||||||||||||||||||
|
|
| ||||||||||||||||||||||
Total | 2,986,257 | $ | 32.65 | 1,718,525 | 2,486,493 | $ | 101.06 | 14,276,216 | ||||||||||||||||
|
|
| ||||||||||||||||||||||
| (1) | Includes information related to our |
| (2) | Includes (a) |
| (3) | “Full-value” awards (i.e., awards other than stock options) are multiplied by a 2.32 conversion ratio to calculate the number of shares available under the 2012 Plan that are used for each full-value award, as opposed to a 1.0 conversion ratio for each stock option awarded under the 2012 Plan. |
| (4) | Includes information related to the 1999 Non-Qualified Employee Stock Purchase |
The 1999 Non-Qualified Employee Stock Purchase Plan (the “ESPP”)
The ESPP was adopted by the Board of Directors on October 29, 1998. The ESPP has not been approved by our shareholders. The ESPP is available to all employees that are employed on the first day of the purchase period. Under the ESPP, each eligible employee may purchase shares of Boston Properties, Inc.’s common stock
at semi-annual intervals each year at a purchase price equal to 85% of the average closing prices of Boston Properties, Inc.’s common stock on the New York Stock Exchange during the last ten business days of the purchase period. Each eligible employee may contribute no more than $10,000 per year to purchase Boston Properties, Inc. common stock under the ESPP.
Additional information concerning security ownership of certain beneficial owners and management required by Item 12 will be included in the Proxy Statement to be filed relating to our 20112013 Annual Meeting of Stockholders and is incorporated herein by reference.
| Item 13. | Certain Relationships and Related Transactions, and Director Independence |
The information required by Item 13 will be included in the Proxy Statement to be filed relating to our 20112013 Annual Meeting of Stockholders and is incorporated herein by reference.
Item 14.Principal Accountant Fees and Services
The information required by Item 14 will be included in the Proxy Statement to be filed relating to our 20112013 Annual Meeting of Stockholders and is incorporated herein by reference.
| Item 15. | Exhibits and Financial Statement Schedules |
(a) Financial Statement Schedule
Boston Properties, Inc.
Schedule 3—Real Estate and Accumulated Depreciation
December 31, 20102012
(dollars in thousands)
Property Name | Type | Location | Encumbrances | Original | Costs Capitalized Subsequent to Acquisition | Land and Improvements | Building and Improvements | Land Held for Development | Development and Construction in Progress | Total | Accumulated Depreciation | Year(s) Built/ Renovated | Depreciable Lives (Years) | Type | Location | Encumbrances | Original | Costs Capitalized Subsequent to Acquisition | Land and Improvements | Building and Improvements | Land Held for Development | Development and Construction in Progress | Total | Accumulated Depreciation | Year(s) Built/ Renovated | Depreciable Lives (Years) | ||||||||||||||||||||||||||||||||||||||||||||||||||||||||||||||||||||||||||||||||||
| Land | Building | Land | Building | |||||||||||||||||||||||||||||||||||||||||||||||||||||||||||||||||||||||||||||||||||||||||||||||||||||||||
Embarcadero Center | Office | San Francisco, CA | $ | 374,634 | $ | 179,697 | $ | 847,410 | $ | 271,734 | $ | 195,984 | $ | 1,102,857 | $ | — | $ | — | $ | 1,298,841 | $ | 362,278 | 1970/1989 | (1 | ) | Office | San Francisco, CA | $ | 365,263 | $ | 179,697 | $ | 847,410 | $ | 299,360 | $ | 195,984 | $ | 1,130,483 | $ | — | $ | — | $ | 1,326,467 | $ | 431,933 | 1970/1989 | (1 | ) | ||||||||||||||||||||||||||||||||||||||||||||||||||||||||||
Prudential Center | Office | Boston, MA | — | 92,077 | 734,594 | 311,570 | 107,426 | 1,015,328 | 15,487 | — | 1,138,241 | 312,586 | 1965/1993/2002 | (1 | ) | Office | Boston, MA | — | 92,077 | 734,594 | 339,363 | 107,426 | 1,042,589 | 16,019 | — | 1,166,034 | 363,098 | 1965/1993/2002 | (1 | ) | ||||||||||||||||||||||||||||||||||||||||||||||||||||||||||||||||||||||||||||||
399 Park Avenue | Office | New York, NY | — | 339,200 | 700,358 | 86,582 | 354,107 | 772,033 | — | — | 1,126,140 | 155,194 | 1961 | (1 | ) | Office | New York, NY | — | 339,200 | 700,358 | 91,986 | 354,107 | 777,437 | — | — | 1,131,544 | 197,783 | 1961 | (1 | ) | ||||||||||||||||||||||||||||||||||||||||||||||||||||||||||||||||||||||||||||||
601 Lexington Avenue | Office | New York, NY | 456,898 | 241,600 | 494,782 | 198,014 | 289,639 | 644,757 | — | — | 934,396 | 144,609 | 1977/1997 | (1 | ) | Office | New York, NY | 725,000 | 241,600 | 494,782 | 216,384 | 289,639 | 663,127 | — | — | 952,766 | 184,225 | 1977/1997 | (1 | ) | ||||||||||||||||||||||||||||||||||||||||||||||||||||||||||||||||||||||||||||||
The John Hancock Tower and Garage | Office | Boston, MA | 663,326 | 219,543 | 667,884 | — | 219,543 | 667,884 | — | — | 887,427 | 202 | 1976 | (1 | ) | Office | Boston, MA | 656,572 | 219,543 | 667,884 | 43,528 | 219,616 | 711,339 | — | — | 930,955 | 51,483 | 1976 | (1 | ) | ||||||||||||||||||||||||||||||||||||||||||||||||||||||||||||||||||||||||||||||
Times Square Tower | Office | New York, NY | — | 165,413 | 380,438 | 82,174 | 169,193 | 458,832 | — | — | 628,025 | 96,544 | 2004 | (1 | ) | Office | New York, NY | — | 165,413 | 380,438 | 84,227 | 169,193 | 460,885 | — | — | 630,078 | 124,896 | 2004 | (1 | ) | ||||||||||||||||||||||||||||||||||||||||||||||||||||||||||||||||||||||||||||||
100 Federal Street | Office | Boston, MA | — | 131,067 | 435,954 | 566 | 131,067 | 436,520 | — | — | 567,587 | 12,712 | 1971-1975 | (1 | ) | |||||||||||||||||||||||||||||||||||||||||||||||||||||||||||||||||||||||||||||||||||||||||||||
Carnegie Center | Office | Princeton, NJ | — | 105,107 | 377,259 | 56,964 | 103,062 | 434,473 | 1,795 | — | 539,330 | 135,929 | 1983-1999 | (1 | ) | Office | Princeton, NJ | — | 105,107 | 377,259 | 59,196 | 103,062 | 436,434 | 2,066 | — | 541,562 | 155,643 | 1983-1999/2009 | (1 | ) | ||||||||||||||||||||||||||||||||||||||||||||||||||||||||||||||||||||||||||||||
Atlantic Wharf | Office | Boston, MA | — | 63,988 | 454,537 | 8,735 | 63,988 | 463,272 | — | — | 527,260 | 24,700 | 2011 | (1 | ) | |||||||||||||||||||||||||||||||||||||||||||||||||||||||||||||||||||||||||||||||||||||||||||||
Fountain Square | Office | Reston, VA | 232,916 | 56,853 | 306,298 | 825 | 56,853 | 307,123 | — | — | 363,976 | 3,088 | 1986-1990 | (1 | ) | |||||||||||||||||||||||||||||||||||||||||||||||||||||||||||||||||||||||||||||||||||||||||||||
510 Madison Avenue | Office | New York, NY | — | 103,000 | 253,665 | — | 103,000 | 253,665 | — | — | 356,665 | 7,485 | 2012 | (1 | ) | |||||||||||||||||||||||||||||||||||||||||||||||||||||||||||||||||||||||||||||||||||||||||||||
599 Lexington Avenue | Office | New York, NY | 750,000 | 81,040 | 100,507 | 117,812 | 87,852 | 211,507 | — | — | 299,359 | 126,918 | 1986 | (1 | ) | Office | New York, NY | 750,000 | 81,040 | 100,507 | 120,936 | 87,852 | 214,631 | — | — | 302,483 | 138,001 | 1986 | (1 | ) | ||||||||||||||||||||||||||||||||||||||||||||||||||||||||||||||||||||||||||||||
Gateway Center | Office | San Francisco, CA | — | 28,255 | 139,245 | 48,191 | 30,627 | 185,064 | — | — | 215,691 | 57,306 | 1984/1986/2002 | (1 | ) | Office | San Francisco, CA | — | 28,255 | 139,245 | 50,792 | 30,627 | 187,665 | — | — | 218,292 | 72,672 | 1984/1986/2002 | (1 | ) | ||||||||||||||||||||||||||||||||||||||||||||||||||||||||||||||||||||||||||||||
Bay Colony Corporate Center | Office | Waltham, MA | — | 18,789 | 148,451 | 25,031 | 18,789 | 173,482 | — | — | 192,271 | 13,499 | 1985-1989 | (1 | ) | |||||||||||||||||||||||||||||||||||||||||||||||||||||||||||||||||||||||||||||||||||||||||||||
South of Market | Office | Reston, VA | — | 13,603 | 164,144 | 7,583 | 13,687 | 171,643 | — | — | 185,330 | 17,496 | 2008 | (1 | ) | Office | Reston, VA | — | 13,603 | 164,144 | 9,359 | 13,687 | 173,419 | — | — | 187,106 | 31,984 | 2008 | (1 | ) | ||||||||||||||||||||||||||||||||||||||||||||||||||||||||||||||||||||||||||||||
2200 Pennsylvania Avenue | Office | Washington, DC | — | — | 183,541 | 2,274 | — | 185,815 | — | — | 185,815 | 11,068 | 2011 | (1 | ) | |||||||||||||||||||||||||||||||||||||||||||||||||||||||||||||||||||||||||||||||||||||||||||||
One Patriots Park (formerly known as 12310 Sunrise Valley Drive) | Office | Reston, VA | — | 9,367 | 67,431 | 63,039 | 11,343 | 128,494 | — | — | 139,837 | 50,376 | 1987/1988/2012 | (1 | ) | |||||||||||||||||||||||||||||||||||||||||||||||||||||||||||||||||||||||||||||||||||||||||||||
Reservoir Place | Office | Waltham, MA | 50,000 | 18,605 | 92,619 | 32,679 | 20,118 | 123,785 | — | — | 143,903 | 46,990 | 1955/1987 | (1 | ) | Office | Waltham, MA | — | 18,605 | 92,619 | 26,487 | 20,118 | 117,593 | — | — | 137,711 | 48,183 | 1955/1987 | (1 | ) | ||||||||||||||||||||||||||||||||||||||||||||||||||||||||||||||||||||||||||||||
3200 Zanker Road | Office | San Jose, CA | — | 36,705 | 82,863 | 15,492 | 36,997 | 94,320 | 3,743 | — | 135,060 | 20,684 | 1988 | (1 | ) | |||||||||||||||||||||||||||||||||||||||||||||||||||||||||||||||||||||||||||||||||||||||||||||
505 9th Street | Office | Washington, DC | 123,666 | 38,885 | 83,719 | 5,692 | 42,082 | 86,214 | — | — | 128,296 | 17,117 | 2007 | (1 | ) | |||||||||||||||||||||||||||||||||||||||||||||||||||||||||||||||||||||||||||||||||||||||||||||
1333 New Hampshire Avenue | Office | Washington, DC | — | 34,032 | 85,660 | 7,553 | 35,382 | 91,863 | — | — | 127,245 | 23,114 | 1996 | (1 | ) | Office | Washington, DC | — | 34,032 | 85,660 | 8,407 | 35,382 | 92,717 | — | — | 128,099 | 27,928 | 1996 | (1 | ) | ||||||||||||||||||||||||||||||||||||||||||||||||||||||||||||||||||||||||||||||
3200 Zanker Road | Office | San Jose, CA | — | 36,705 | 82,863 | 7,653 | 36,997 | 89,023 | 1,201 | — | 127,221 | 16,194 | 1988 | (1 | ) | |||||||||||||||||||||||||||||||||||||||||||||||||||||||||||||||||||||||||||||||||||||||||||||
Kingstowne Towne Center | Office | Alexandria, VA | 57,152 | 18,021 | 109,038 | (236 | ) | 18,062 | 108,761 | — | — | 126,823 | 16,002 | 2003-2006 | (1 | ) | Office | Alexandria, VA | 52,292 | 18,021 | 109,038 | 174 | 18,062 | 109,171 | — | — | 127,233 | 22,981 | 2003-2006 | (1 | ) | |||||||||||||||||||||||||||||||||||||||||||||||||||||||||||||||||||||||||||||
505 9th Street | Office | Washington, DC | 127,901 | 38,885 | 83,719 | 2,535 | 38,956 | 86,183 | — | — | 125,139 | 10,687 | 2007 | (1 | ) | |||||||||||||||||||||||||||||||||||||||||||||||||||||||||||||||||||||||||||||||||||||||||||||
Capital Gallery | Office | Washington, DC | — | 4,725 | 29,565 | 90,346 | 8,662 | 115,974 | — | — | 124,636 | 43,367 | 1981/2006 | (1 | ) | Office | Washington, DC | — | 4,725 | 29,565 | 90,761 | 8,662 | 116,389 | — | — | 125,051 | 50,572 | 1981/2006 | (1 | ) | ||||||||||||||||||||||||||||||||||||||||||||||||||||||||||||||||||||||||||||||
1330 Connecticut Avenue | Office | Washington, DC | — | 25,982 | 82,311 | 16,001 | 27,135 | 97,159 | — | — | 124,294 | 19,821 | 1984 | (1 | ) | Office | Washington, DC | — | 25,982 | 82,311 | 16,248 | 27,135 | 97,406 | — | — | 124,541 | 26,291 | 1984 | (1 | ) | ||||||||||||||||||||||||||||||||||||||||||||||||||||||||||||||||||||||||||||||
601 Massachusetts Avenue | Office | Washington, DC | — | 95,281 | 22,221 | 4,300 | 95,293 | 22,257 | 4,252 | — | 121,802 | 18,123 | 1968/1992 | (1 | ) | |||||||||||||||||||||||||||||||||||||||||||||||||||||||||||||||||||||||||||||||||||||||||||||
Weston Corporate Center | Office | Weston, MA | — | 25,753 | 92,312 | — | 25,753 | 92,312 | — | — | 118,065 | 1,786 | 2010 | (1 | ) | Office | Weston, MA | — | 25,753 | 92,312 | (149 | ) | 25,852 | 92,064 | — | — | 117,916 | 7,870 | 2010 | (1 | ) | |||||||||||||||||||||||||||||||||||||||||||||||||||||||||||||||||||||||||||||
635 Massachusetts Avenue | Office | Washington, DC | — | 95,281 | 22,221 | 63 | 95,293 | 22,257 | — | 15 | 117,565 | 9,074 | 1968/1992 | (1 | ) | |||||||||||||||||||||||||||||||||||||||||||||||||||||||||||||||||||||||||||||||||||||||||||||
One Freedom Square | Office | Reston, VA | 68,752 | 9,929 | 84,504 | 14,019 | 11,293 | 97,159 | — | — | 108,452 | 33,989 | 2000 | (1 | ) | Office | Reston, VA | — | 9,929 | 84,504 | 22,960 | 11,293 | 106,100 | — | — | �� | 117,393 | 39,586 | 2000 | (1 | ) | |||||||||||||||||||||||||||||||||||||||||||||||||||||||||||||||||||||||||||||
One and Two Reston Overlook | Office | Reston, VA | — | 16,456 | 66,192 | 23,463 | 17,561 | 88,550 | — | — | 106,111 | 26,959 | 1999 | (1 | ) | |||||||||||||||||||||||||||||||||||||||||||||||||||||||||||||||||||||||||||||||||||||||||||||
Two Freedom Square | Office | Reston, VA | — | 13,930 | 77,739 | 12,437 | 15,420 | 88,686 | — | — | 104,106 | 27,190 | 2001 | (1 | ) | Office | Reston, VA | — | 13,930 | 77,739 | 13,797 | 15,420 | 90,046 | — | — | 105,466 | 34,233 | 2001 | (1 | ) | ||||||||||||||||||||||||||||||||||||||||||||||||||||||||||||||||||||||||||||||
Seven Cambridge Center | Office | Cambridge, MA | — | 3,457 | 97,136 | 2,880 | 4,125 | 99,348 | — | — | 103,473 | 29,643 | 2006 | (1 | ) | Office | Cambridge, MA | — | 3,457 | 97,136 | 2,880 | 4,125 | 99,348 | — | — | 103,473 | 41,528 | 2006 | (1 | ) | ||||||||||||||||||||||||||||||||||||||||||||||||||||||||||||||||||||||||||||||
One and Two Reston Overlook | Office | Reston, VA | — | 16,456 | 66,192 | 9,323 | 17,561 | 74,410 | — | — | 91,971 | 25,166 | 1999 | (1 | ) | |||||||||||||||||||||||||||||||||||||||||||||||||||||||||||||||||||||||||||||||||||||||||||||
Discovery Square | Office | Reston, VA | — | 11,198 | 71,782 | 15,501 | 12,533 | 85,948 | — | — | 98,481 | 25,842 | 2001 | (1 | ) | |||||||||||||||||||||||||||||||||||||||||||||||||||||||||||||||||||||||||||||||||||||||||||||
140 Kendrick Street | Office | Needham, MA | 52,120 | 18,095 | 66,905 | 4,246 | 19,092 | 70,154 | — | — | 89,246 | 11,885 | 2000 | (1 | ) | Office | Needham, MA | 48,358 | 18,095 | 66,905 | 8,424 | 19,092 | 74,332 | — | — | 93,424 | 15,474 | 2000 | (1 | ) | ||||||||||||||||||||||||||||||||||||||||||||||||||||||||||||||||||||||||||||||
Discovery Square | Office | Reston, VA | — | 11,198 | 71,782 | 6,189 | 12,533 | 76,636 | — | — | 89,169 | 22,367 | 2001 | (1 | ) | |||||||||||||||||||||||||||||||||||||||||||||||||||||||||||||||||||||||||||||||||||||||||||||
12310 Sunrise Valley Drive | Office | Reston, VA | — | 9,367 | 67,431 | 8,887 | 11,343 | 74,052 | — | 290 | 85,685 | 30,227 | 1987/1988 | (1 | ) | |||||||||||||||||||||||||||||||||||||||||||||||||||||||||||||||||||||||||||||||||||||||||||||
Five Cambridge Center | Office | Cambridge, MA | — | 18,863 | 53,346 | 7,553 | 18,938 | 60,824 | — | — | 79,762 | 11,815 | 1981/1996 | (1 | ) | Office | Cambridge, MA | — | 18,863 | 53,346 | 19,288 | 18,938 | 63,619 | — | 8,940 | 91,497 | 17,480 | 1981/1996 | (1 | ) | ||||||||||||||||||||||||||||||||||||||||||||||||||||||||||||||||||||||||||||||
77 CityPoint | Office | Waltham, MA | — | 13,847 | 60,383 | 3,123 | 13,875 | 63,478 | — | — | 77,353 | 9,936 | 2008 | (1 | ) | |||||||||||||||||||||||||||||||||||||||||||||||||||||||||||||||||||||||||||||||||||||||||||||
North First Business Park | Office | San Jose, CA | — | 58,402 | 13,069 | 3,793 | 23,377 | 16,010 | 35,877 | — | 75,264 | 8,217 | 1981 | (1) | ||||||||||||||||||||||||||||||||||||||||||||||||||||||||||||||||||||||||||||||||||||||||||||||
230 CityPoint | Office | Waltham, MA | — | 13,189 | 49,823 | 11,694 | 13,593 | 61,113 | — | — | 74,706 | 15,128 | 1992 | (1) | ||||||||||||||||||||||||||||||||||||||||||||||||||||||||||||||||||||||||||||||||||||||||||||||
Four Cambridge Center | Office | Cambridge, MA | — | 19,104 | 52,078 | 3,514 | 19,148 | 55,548 | — | — | 74,696 | 9,118 | 1983/1998 | (1) | ||||||||||||||||||||||||||||||||||||||||||||||||||||||||||||||||||||||||||||||||||||||||||||||
Waltham Weston Corporate Center | Office | Waltham, MA | — | 10,385 | 60,694 | 8,382 | 11,097 | 68,364 | — | — | 79,461 | 22,616 | 2003 | (1 | ) | Office | Waltham, MA | — | 10,385 | 60,694 | 2,987 | 11,097 | 62,969 | — | — | 74,066 | 19,278 | 2003 | (1) | |||||||||||||||||||||||||||||||||||||||||||||||||||||||||||||||||||||||||||||||
12300 Sunrise Valley Drive | Office | Reston, VA | — | 9,062 | 58,884 | 9,628 | 11,009 | 65,426 | 1,139 | — | 77,574 | 23,126 | 1987/1988 | (1 | ) | |||||||||||||||||||||||||||||||||||||||||||||||||||||||||||||||||||||||||||||||||||||||||||||
77 CityPoint | Office | Waltham, MA | — | 13,847 | 60,383 | 3,115 | 13,873 | 63,472 | — | — | 77,345 | 5,202 | 2008 | (1 | ) | |||||||||||||||||||||||||||||||||||||||||||||||||||||||||||||||||||||||||||||||||||||||||||||
Four Cambridge Center | Office | Cambridge, MA | — | 19,104 | 52,078 | 3,269 | 19,148 | 55,303 | — | — | 74,451 | 7,034 | 1983/1998 | (1 | ) | |||||||||||||||||||||||||||||||||||||||||||||||||||||||||||||||||||||||||||||||||||||||||||||
Democracy Tower | Office | Reston, VA | — | — | 73,335 | 298 | — | 73,633 | — | — | 73,633 | 3,680 | 2009 | (1 | ) | Office | Reston, VA | — | — | 73,335 | 431 | — | 73,766 | — | — | 73,766 | 8,914 | 2009 | (1) | |||||||||||||||||||||||||||||||||||||||||||||||||||||||||||||||||||||||||||||||
230 CityPoint | Office | Waltham, MA | — | 13,189 | 49,823 | 10,443 | 13,593 | 59,862 | — | — | 73,455 | 11,833 | 1992 | (1 | ) | |||||||||||||||||||||||||||||||||||||||||||||||||||||||||||||||||||||||||||||||||||||||||||||
North First Business Park | Office | San Jose, CA | — | 58,402 | 13,069 | 1,787 | 23,377 | 14,171 | 35,710 | — | 73,258 | 4,865 | 1981 | (1 | ) | |||||||||||||||||||||||||||||||||||||||||||||||||||||||||||||||||||||||||||||||||||||||||||||
Reston Corporate Center | Office | Reston, VA | — | 9,135 | 50,857 | 5,334 | 10,148 | 55,178 | — | — | 65,326 | 16,500 | 1984 | (1 | ) | |||||||||||||||||||||||||||||||||||||||||||||||||||||||||||||||||||||||||||||||||||||||||||||
Wisconsin Place | Office | Chevy Chase, MD | — | — | 53,349 | 10,808 | — | 64,157 | — | — | 64,157 | 3,523 | 2009 | (1 | ) | |||||||||||||||||||||||||||||||||||||||||||||||||||||||||||||||||||||||||||||||||||||||||||||
New Dominion Technology Park, Bldg. Two | Office | Herndon, VA | 63,000 | 5,584 | 51,868 | 3,655 | 6,510 | 54,597 | — | — | 61,107 | 11,190 | 2004 | (1 | ) | |||||||||||||||||||||||||||||||||||||||||||||||||||||||||||||||||||||||||||||||||||||||||||||
One Preserve Parkway | Office | Rockville, MD | — | 5,357 | 42,186 | 5,531 | 5,357 | 47,717 | — | — | 53,074 | 2,650 | 2009 | (1 | ) | |||||||||||||||||||||||||||||||||||||||||||||||||||||||||||||||||||||||||||||||||||||||||||||
191 Spring Street | Office | Lexington, MA | — | 2,850 | 27,166 | 22,350 | 3,151 | 49,215 | — | — | 52,366 | 30,283 | 1971/1995 | (1 | ) | |||||||||||||||||||||||||||||||||||||||||||||||||||||||||||||||||||||||||||||||||||||||||||||
New Dominion Technology Park, Bldg. One | Office | Herndon, VA | 49,252 | 3,880 | 43,227 | 4,572 | 4,583 | 47,096 | — | — | 51,679 | 14,761 | 2001 | (1 | ) | |||||||||||||||||||||||||||||||||||||||||||||||||||||||||||||||||||||||||||||||||||||||||||||
Property Name Type Location 303 Almaden Boulevard 1301 New York Avenue Sumner Square 200 West Street University Place Bedford Business Park 2600 Tower Oaks Boulevard Quorum Office Park 12290 Sunrise Valley Drive One Cambridge Center 500 E Street Eight Cambridge Center 10 and 20 Burlington Mall Road Ten Cambridge Center Montvale Center 201 Spring Street 40 Shattuck Road Lexington Office Park Three Cambridge Center 6601 & 6605 Springfield Center Drive 103 4th Avenue 92-100 Hayden Avenue 181 Spring Street 195 West Street Waltham Office Center 91 Hartwell Avenue 7501 Boston Boulevard, Building Seven Eleven Cambridge Center 33 Hayden Avenue 7435 Boston Boulevard, Building One 7450 Boston Boulevard, Building Three 8000 Grainger Court, Building Five 7500 Boston Boulevard, Building Six 7601 Boston Boulevard, Building Eight Fourteen Cambridge Center 7300 Boston Boulevard, Building Thirteen 8000 Corporate Court, Building Eleven 7375 Boston Boulevard, Building Ten 7374 Boston Boulevard, Building Four Encumbrances Original Costs
Capitalized
Subsequent
to
Acquisition Land and
Improvements Building and
Improvements Land
Held for
Development Development
and
Construction
in Progress Total Accumulated
Depreciation Year(s) Built/
Renovated Depreciable
Lives (Years) Land Building Office San Jose, CA — 10,836 35,606 3,899 10,947 39,394 — — 50,341 6,113 1995 (1 ) Office Washington, DC — 9,250 18,750 20,688 9,867 38,821 — — 48,688 13,809 1983/1998 (1 ) Office Washington, DC 24,692 624 28,745 18,214 1,478 46,105 — — 47,583 18,068 1985 (1 ) Office Waltham, MA — 16,148 24,983 4,494 16,813 28,812 — — 45,625 11,009 1999 (1 ) Office Cambridge, MA 17,359 — 37,091 6,554 390 43,255 — — 43,645 16,304 1985 (1 ) Office Bedford, MA — 534 3,403 38,208 2,218 39,927 — — 42,145 22,540 1980 (1 ) Office Rockville, MD — 4,243 31,125 6,165 4,785 36,748 — — 41,533 12,842 2001 (1 ) Office Chelmsford, MA — 3,750 32,454 5,176 5,187 36,193 — — 41,380 10,035 2001 (1 ) Office Reston, VA — 3,594 32,977 1,374 4,009 33,936 — — 37,945 7,742 2006 (1 ) Office Cambridge, MA — 134 25,110 11,038 548 35,734 — — 36,282 21,515 1987 (1 ) Office Washington, DC — 109 22,420 12,033 2,379 32,183 — — 34,562 18,052 1987 (1 ) Office Cambridge, MA — 850 25,042 3,571 1,323 28,140 — — 29,463 7,484 1999 (1 ) Office Burlington, MA — 930 6,928 13,513 802 20,569 — — 21,371 12,859 1984-1989/95-96 (1 ) Office Cambridge, MA — 1,299 12,943 6,109 2,395 17,956 — — 20,351 9,505 1990 (1 ) Office Gaithersburg, MD 25,000 1,574 9,786 6,724 2,555 15,529 — — 18,084 9,296 1987 (1 ) Office Lexington, MA — 2,849 15,303 (146 ) 3,124 14,882 — — 18,006 4,599 1997 (1 ) Office Andover, MA — 709 14,740 2,520 893 17,076 — — 17,969 4,738 2001 (1 ) Office Lexington, MA — 998 1,426 15,303 1,264 16,463 — — 17,727 10,570 1982 (1 ) Office Cambridge, MA — 174 12,200 4,798 367 16,805 — — 17,172 9,481 1987 (1 ) Office Springfield, VA — 14,041 2,375 (175 ) 3,777 2,375 10,089 — 16,241 2,220 1990 (1 ) Office Waltham, MA — 11,911 2,507 8 11,913 2,513 — — 14,426 2,099 1961 (1 ) Office Lexington, MA — 594 6,748 6,817 802 13,357 — — 14,159 7,457 1985 (1 ) Office Lexington, MA — 1,066 9,520 3,168 1,160 12,594 — — 13,754 4,174 1999 (1 ) Office Waltham, MA — 1,611 6,652 4,175 1,858 10,580 — — 12,438 4,857 1990 (1 ) Office Waltham, MA — 422 2,719 8,329 384 8,445 2,641 — 11,470 7,396 1968-1970/87-88 (1 ) Office Lexington, MA — 784 6,464 3,949 941 10,256 — — 11,197 6,378 1985 (1 ) Office Springfield, VA — 665 9,273 544 791 9,691 — — 10,482 3,164 1997 (1 ) Office Cambridge, MA — 121 5,535 4,716 324 10,048 — — 10,372 6,668 1984 (1 ) Office Lexington, MA — 266 3,234 6,042 425 9,117 — — 9,542 6,396 1979 (1 ) Office Springfield, VA — 392 3,822 3,595 659 7,150 — — 7,809 4,461 1982 (1 ) Office Springfield, VA — 1,165 4,681 1,915 1,430 6,331 — — 7,761 2,374 1987 (1 ) Office Springfield, VA — 366 4,282 2,912 601 6,959 — — 7,560 4,417 1984 (1 ) Office Springfield, VA — 138 3,749 2,213 406 5,694 — — 6,100 3,541 1985 (1 ) Office Springfield, VA — 200 878 4,875 551 5,402 — — 5,953 3,080 1986 (1 ) Office Cambridge, MA — 110 4,483 1,223 273 5,543 — — 5,816 3,390 1983 (1 ) Office Springfield, VA — 608 4,773 230 661 4,950 — — 5,611 2,876 2002 (1 ) Office Springfield, VA — 136 3,071 1,483 775 3,915 — — 4,690 1,952 1989 (1 ) Office Springfield, VA — 23 2,685 1,136 93 3,751 — — 3,844 2,064 1988 (1 ) Office Springfield, VA — 241 1,605 1,705 398 3,153 — — 3,551 1,981 1984 (1 )
150
Boston Properties, Inc.
Schedule 3—3 - Real Estate and Accumulated Depreciation
December 31, 20102012
(dollars in thousands)
Property Name | Type | Location | Encumbrances | Original | Costs Capitalized Subsequent to Acquisition | Land and Improvements | Building and Improvements | Land Held for Development | Development and Construction in Progress | Total | Accumulated Depreciation | Year(s) Built/ Renovated | Depreciable Lives (Years) | |||||||||||||||||||||||||||||||||||||||
| Land | Building | |||||||||||||||||||||||||||||||||||||||||||||||||||
32 Hartwell Avenue | Office | Lexington, MA | — | 168 | 1,943 | 1,251 | 314 | 3,048 | — | — | 3,362 | 2,472 | | 1968- 1979/1987 | | (1 | ) | |||||||||||||||||||||||||||||||||||
7451 Boston Boulevard, Building Two | Office | Springfield, VA | — | 249 | 1,542 | 1,313 | 613 | 2,491 | — | — | 3,104 | 1,958 | 1982 | (1 | ) | |||||||||||||||||||||||||||||||||||||
164 Lexington Road | Office | Billerica, MA | — | 592 | 1,370 | 414 | 643 | 1,733 | — | — | 2,376 | 668 | 1982 | (1 | ) | |||||||||||||||||||||||||||||||||||||
17 Hartwell Avenue | Office | Lexington, MA | — | 26 | 150 | 1,397 | 65 | 1,508 | — | — | 1,573 | 975 | 1968 | (1 | ) | |||||||||||||||||||||||||||||||||||||
Cambridge Center Marriott | Hotel | Cambridge, MA | — | 478 | 37,918 | 28,331 | 1,201 | 65,526 | — | — | 66,727 | 36,549 | 1986 | (1 | ) | |||||||||||||||||||||||||||||||||||||
Cambridge Center East Garage | Garage | Cambridge, MA | — | — | 35,035 | 1,487 | 103 | 36,419 | — | — | 36,522 | 3,830 | 1984 | (1 | ) | |||||||||||||||||||||||||||||||||||||
Cambridge Center West Garage | Garage | Cambridge, MA | — | 1,256 | 15,697 | 781 | 1,434 | 16,300 | — | — | 17,734 | 2,140 | 2006 | (1 | ) | |||||||||||||||||||||||||||||||||||||
Cambridge Center North Garage | Garage | Cambridge, MA | — | 1,163 | 11,633 | 2,750 | 1,579 | 13,967 | — | — | 15,546 | 6,925 | 1990 | (1 | ) | |||||||||||||||||||||||||||||||||||||
Atlantic Wharf | Development | Boston, MA | — | — | — | 525,894 | — | — | — | 525,894 | 525,894 | — | Various | N/A | ||||||||||||||||||||||||||||||||||||||
510 Madison Avenue | Development | New York, NY | 267,500 | — | — | 317,055 | — | — | — | 317,055 | 317,055 | — | Various | N/A | ||||||||||||||||||||||||||||||||||||||
2200 Pennsylvania Avenue | Development | Washington, DC | — | — | — | 230,148 | — | — | — | 230,148 | 230,148 | — | Various | N/A | ||||||||||||||||||||||||||||||||||||||
250 West 55th Street | Land | New York, NY | — | — | — | 475,780 | — | — | 475,780 | — | 475,780 | — | Various | N/A | ||||||||||||||||||||||||||||||||||||||
Plaza at Almaden | Land | San Jose, CA | — | — | — | 37,306 | — | — | 37,306 | — | 37,306 | — | Various | N/A | ||||||||||||||||||||||||||||||||||||||
Springfield Metro Center | Land | Springfield, VA | — | — | — | 30,408 | — | — | 30,408 | — | 30,408 | — | Various | N/A | ||||||||||||||||||||||||||||||||||||||
Tower Oaks Master Plan | Land | Rockville, MD | — | — | — | 28,332 | — | — | 28,332 | — | 28,332 | — | Various | N/A | ||||||||||||||||||||||||||||||||||||||
Prospect Hill | Land | Waltham, MA | — | — | — | 23,971 | — | 667 | 23,304 | — | 23,971 | — | Various | N/A | ||||||||||||||||||||||||||||||||||||||
Reston Land | Land | Reston, VA | — | — | — | 20,949 | — | — | 20,949 | — | 20,949 | — | Various | N/A | ||||||||||||||||||||||||||||||||||||||
17 Cambridge Center | Land | Cambridge, MA | — | — | — | 17,954 | — | — | 17,954 | — | 17,954 | — | Various | N/A | ||||||||||||||||||||||||||||||||||||||
Washingtonian North | Land | Gaithersburg, MD | — | — | — | 17,644 | — | — | 17,644 | — | 17,644 | — | Various | N/A | ||||||||||||||||||||||||||||||||||||||
Reston Gateway | Land | Reston, VA | — | — | — | 9,382 | — | — | 9,382 | — | 9,382 | — | Various | N/A | ||||||||||||||||||||||||||||||||||||||
Reston Eastgate | Land | Reston, VA | — | — | — | 9,077 | — | — | 9,077 | — | 9,077 | — | Various | N/A | ||||||||||||||||||||||||||||||||||||||
Crane Meadow | Land | Marlborough, MA | — | — | — | 8,721 | — | — | 8,721 | — | 8,721 | — | Various | N/A | ||||||||||||||||||||||||||||||||||||||
Broad Run Business Park | Land | Loudon County, VA | — | — | — | 7,663 | 1,621 | — | 6,042 | — | 7,663 | — | Various | N/A | ||||||||||||||||||||||||||||||||||||||
Cambridge Master Plan | Land | Cambridge, MA | — | — | — | 3,450 | — | — | 3,450 | — | 3,450 | — | Various | N/A | ||||||||||||||||||||||||||||||||||||||
30 Shattuck Road | Land | Andover, MA | — | — | — | 1,145 | — | — | 1,145 | — | 1,145 | — | Various | N/A | ||||||||||||||||||||||||||||||||||||||
| $ | 3,047,586 | (2) | $ | 2,113,011 | $ | 7,094,259 | $ | 3,533,622 | $ | 2,216,768 | $ | 8,693,166 | $ | 757,556 | $ | 1,073,402 | $ | 12,740,892 | $ | 2,308,665 | ||||||||||||||||||||||||||||||||
Property Name | Type | Location | Encumbrances | Original | Costs Capitalized Subsequent to Acquisition | Land and Improvements | Building and Improvements | Land Held for Development | Development and Construction in Progress | Total | Accumulated Depreciation | Year(s) Built/ Renovated | Depreciable Lives (Years) | |||||||||||||||||||||||||||||||||||||||||
| Land | Building | |||||||||||||||||||||||||||||||||||||||||||||||||||||
2440 West El Camino Real | Office | Mountain View, CA | — | 16,741 | 51,285 | 491 | 16,741 | 51,776 | — | — | 68,517 | 2,268 | 1987/2003 | (1) | ||||||||||||||||||||||||||||||||||||||||
Wisconsin Place | Office | Chevy Chase, MD | — | — | 53,349 | 13,661 | — | 67,010 | — | — | 67,010 | 8,838 | 2009 | (1) | ||||||||||||||||||||||||||||||||||||||||
Reston Corporate Center | Office | Reston, VA | — | 9,135 | 50,857 | 5,334 | 10,148 | 55,178 | — | — | 65,326 | 19,527 | 1984 | (1) | ||||||||||||||||||||||||||||||||||||||||
New Dominion Technology Park, Bldg. Two | Office | Herndon, VA | 63,000 | 5,584 | 51,868 | 3,894 | 6,510 | 54,836 | — | — | 61,346 | 14,760 | 2004 | (1) | ||||||||||||||||||||||||||||||||||||||||
One Preserve Parkway | Office | Rockville, MD | — | 5,357 | 42,186 | 8,699 | 5,357 | 50,885 | — | — | 56,242 | 6,768 | 2009 | (1) | ||||||||||||||||||||||||||||||||||||||||
Sumner Square | Office | Washington, DC | — | 624 | 28,745 | 23,161 | 1,478 | 51,052 | — | — | 52,530 | 21,422 | 1985 | (1) | ||||||||||||||||||||||||||||||||||||||||
New Dominion Technology Park, Bldg. One | Office | Herndon, VA | 45,418 | 3,880 | 43,227 | 3,882 | 4,583 | 46,406 | — | — | 50,989 | 17,984 | 2001 | (1) | ||||||||||||||||||||||||||||||||||||||||
303 Almaden Boulevard | Office | San Jose, CA | — | 10,836 | 35,606 | 4,060 | 10,947 | 39,555 | — | — | 50,502 | 8,994 | 1995 | (1) | ||||||||||||||||||||||||||||||||||||||||
200 West Street | Office | Waltham, MA | — | 16,148 | 24,983 | 8,100 | 16,813 | 32,418 | — | — | 49,231 | 13,499 | 1999 | (1) | ||||||||||||||||||||||||||||||||||||||||
1301 New York Avenue | Office | Washington, DC | — | 9,250 | 18,750 | 20,590 | 9,867 | 38,723 | — | — | 48,590 | 15,486 | 1983/1998 | (1) | ||||||||||||||||||||||||||||||||||||||||
191 Spring Street | Office | Lexington, MA | — | 2,850 | 27,166 | 18,403 | 3,151 | 45,268 | — | — | 48,419 | 28,197 | 1971/1995 | (1) | ||||||||||||||||||||||||||||||||||||||||
University Place | Office | Cambridge, MA | 15,000 | — | 37,091 | 6,785 | 390 | 43,486 | — | — | 43,876 | 19,225 | 1985 | (1) | ||||||||||||||||||||||||||||||||||||||||
2600 Tower Oaks Boulevard | Office | Rockville, MD | — | 4,243 | 31,125 | 7,676 | 4,785 | 38,259 | — | — | 43,044 | 15,306 | 2001 | (1) | ||||||||||||||||||||||||||||||||||||||||
Quorum Office Park | Office | Chelmsford, MA | — | 3,750 | 32,454 | 5,273 | 5,187 | 36,290 | — | — | 41,477 | 11,890 | 2001 | (1) | ||||||||||||||||||||||||||||||||||||||||
One Cambridge Center | Office | Cambridge, MA | — | 134 | 25,110 | 14,982 | 548 | 39,678 | — | — | 40,226 | 22,594 | 1987 | (1) | ||||||||||||||||||||||||||||||||||||||||
Three Patriots Park (formerly known as 12290 Sunrise Valley Drive) | Office | Reston, VA | — | 3,594 | 32,977 | 1,374 | 4,009 | 33,936 | — | — | 37,945 | 11,798 | 2006 | (1) | ||||||||||||||||||||||||||||||||||||||||
500 E Street | Office | Washington, DC | — | 109 | 22,420 | 12,418 | 2,379 | 32,568 | — | — | 34,947 | 19,595 | 1987 | (1) | ||||||||||||||||||||||||||||||||||||||||
Eight Cambridge Center | Office | Cambridge, MA | — | 850 | 25,042 | 8,507 | 1,323 | 33,076 | — | — | 34,399 | 9,673 | 1999 | (1) | ||||||||||||||||||||||||||||||||||||||||
10 and 20 Burlington Mall Road | Office | Burlington, MA | — | 930 | 6,928 | 13,806 | 802 | 20,862 | — | — | 21,664 | 13,534 | 1984-1989/1996 | (1) | ||||||||||||||||||||||||||||||||||||||||
Ten Cambridge Center | Office | Cambridge, MA | — | 1,299 | 12,943 | 6,109 | 2,395 | 17,956 | — | — | 20,351 | 10,729 | 1990 | (1) | ||||||||||||||||||||||||||||||||||||||||
Three Cambridge Center | Office | Cambridge, MA | — | 174 | 12,200 | 5,855 | 367 | 17,862 | — | — | 18,229 | 9,315 | 1987 | (1) | ||||||||||||||||||||||||||||||||||||||||
201 Spring Street | Office | Lexington, MA | — | 2,849 | 15,303 | �� | (154 | ) | 3,124 | 14,874 | — | — | 17,998 | 5,558 | 1997 | (1) | ||||||||||||||||||||||||||||||||||||||
Montvale Center | Office | Gaithersburg, MD | 25,000 | 1,574 | 9,786 | 6,558 | 2,555 | 15,363 | — | — | 17,918 | 10,307 | 1987 | (1) | ||||||||||||||||||||||||||||||||||||||||
40 Shattuck Road | Office | Andover, MA | — | 709 | 14,740 | 2,268 | 893 | 16,824 | — | — | 17,717 | 4,928 | 2001 | (1) | ||||||||||||||||||||||||||||||||||||||||
Lexington Office Park | Office | Lexington, MA | — | 998 | 1,426 | 13,503 | 1,264 | 14,663 | — | — | 15,927 | 9,714 | 1982 | (1) | ||||||||||||||||||||||||||||||||||||||||
92-100 Hayden Avenue | Office | Lexington, MA | — | 594 | 6,748 | 7,819 | 802 | 14,359 | — | — | 15,161 | 9,160 | 1985 | (1) | ||||||||||||||||||||||||||||||||||||||||
6601 & 6605 Springfield Center Drive | Office | Springfield, VA | — | 14,041 | 2,375 | (1,836 | ) | 3,777 | 714 | 10,089 | — | 14,580 | 714 | 1990 | (1) | |||||||||||||||||||||||||||||||||||||||
181 Spring Street | Office | Lexington, MA | — | 1,066 | 9,520 | 1,950 | 1,160 | 11,376 | — | — | 12,536 | 3,704 | 1999 | (1) | ||||||||||||||||||||||||||||||||||||||||
195 West Street | Office | Waltham, MA | — | 1,611 | 6,652 | 4,175 | 1,858 | 10,580 | — | — | 12,438 | 5,749 | 1990 | (1) | ||||||||||||||||||||||||||||||||||||||||
Waltham Office Center | Office | Waltham, MA | — | 422 | 2,719 | 9,266 | 165 | 8,445 | 3,797 | — | 12,407 | 8,051 | 1968-1970/1988 | (1) | ||||||||||||||||||||||||||||||||||||||||
91 Hartwell Avenue | Office | Lexington, MA | — | 784 | 6,464 | 4,706 | 941 | 11,013 | — | — | 11,954 | 7,069 | 1985 | (1) | ||||||||||||||||||||||||||||||||||||||||
Eleven Cambridge Center | Office | Cambridge, MA | — | 121 | 5,535 | 4,975 | 324 | 10,307 | — | — | 10,631 | 6,961 | 1984 | (1) | ||||||||||||||||||||||||||||||||||||||||
7501 Boston Boulevard, Building Seven | Office | Springfield, VA | — | 665 | 9,273 | 544 | 791 | 9,691 | — | — | 10,482 | 3,653 | 1997 | (1) | ||||||||||||||||||||||||||||||||||||||||
33 Hayden Avenue | Office | Lexington, MA | — | 266 | 3,234 | 6,073 | 425 | 9,148 | — | — | 9,573 | 7,011 | 1979 | (1) | ||||||||||||||||||||||||||||||||||||||||
7435 Boston Boulevard, Building One | Office | Springfield, VA | — | 392 | 3,822 | 3,894 | 659 | 7,449 | — | — | 8,108 | 5,144 | 1982 | (1) | ||||||||||||||||||||||||||||||||||||||||
7450 Boston Boulevard, Building Three | Office | Springfield, VA | — | 1,165 | 4,681 | 1,915 | 1,430 | 6,331 | — | — | 7,761 | 2,743 | 1987 | (1) | ||||||||||||||||||||||||||||||||||||||||
8000 Grainger Court, Building Five | Office | Springfield, VA | — | 366 | 4,282 | 2,944 | 601 | 6,991 | — | — | 7,592 | 4,840 | 1984 | (1) | ||||||||||||||||||||||||||||||||||||||||
453 Ravendale Drive | Office | Mountain View, CA | — | 5,477 | 1,090 | 172 | 5,477 | 1,262 | — | — | 6,739 | 67 | 1977 | (1) | ||||||||||||||||||||||||||||||||||||||||
7500 Boston Boulevard, Building Six | Office | Springfield, VA | — | 138 | 3,749 | 2,597 | 406 | 6,078 | — | — | 6,484 | 3,945 | 1985 | (1) | ||||||||||||||||||||||||||||||||||||||||
7601 Boston Boulevard, Building Eight | Office | Springfield, VA | — | 200 | 878 | 4,875 | 551 | 5,402 | — | — | 5,953 | 3,415 | 1986 | (1) | ||||||||||||||||||||||||||||||||||||||||
Fourteen Cambridge Center | Office | Cambridge, MA | — | 110 | 4,483 | 1,223 | 273 | 5,543 | — | — | 5,816 | 3,667 | 1983 | (1) | ||||||||||||||||||||||||||||||||||||||||
7300 Boston Boulevard, Building Thirteen | Office | Springfield, VA | — | 608 | 4,773 | 230 | 661 | 4,950 | — | — | 5,611 | 3,580 | 2002 | (1) | ||||||||||||||||||||||||||||||||||||||||
8000 Corporate Court, Building Eleven | Office | Springfield, VA | — | 136 | 3,071 | 1,484 | 775 | 3,916 | — | — | 4,691 | 2,222 | 1989 | (1) | ||||||||||||||||||||||||||||||||||||||||
7374 Boston Boulevard, Building Four | Office | Springfield, VA | — | 241 | 1,605 | 1,899 | 398 | 3,347 | — | — | 3,745 | 2,220 | 1984 | (1) | ||||||||||||||||||||||||||||||||||||||||
7375 Boston Boulevard, Building Ten | Office | Springfield, VA | — | 23 | 2,685 | 1,007 | 93 | 3,622 | — | — | 3,715 | 2,156 | 1988 | (1) | ||||||||||||||||||||||||||||||||||||||||
7451 Boston Boulevard, Building Two | Office | Springfield, VA | — | 249 | 1,542 | 1,313 | 613 | 2,491 | — | — | 3,104 | 2,074 | 1982 | (1) | ||||||||||||||||||||||||||||||||||||||||
32 Hartwell Avenue | Office | Lexington, MA | — | 168 | 1,943 | 440 | 314 | 2,237 | — | — | 2,551 | 1,438 | 1968-1979/1987 | (1) | ||||||||||||||||||||||||||||||||||||||||
Note:
Boston Properties, Inc.
Schedule 3 - Real Estate and Accumulated Depreciation amounts do
December 31, 2012
(dollars in thousands)
Property Name | Type | Location | Encumbrances | Original | Costs Capitalized Subsequent to Acquisition | Land and Improvements | Building and Improvements | Land Held for Development | Development and Construction in Progress | Total | Accumulated Depreciation | Year(s) Built/ Renovated | Depreciable Lives (Years) | |||||||||||||||||||||||||||||||||||||||||
| Land | Building | |||||||||||||||||||||||||||||||||||||||||||||||||||||
164 Lexington Road | Office | Billerica, MA | — | 592 | 1,370 | 319 | 643 | 1,638 | — | — | 2,281 | 662 | 1982 | (1) | ||||||||||||||||||||||||||||||||||||||||
17 Hartwell Avenue | Office | Lexington, MA | — | 26 | 150 | 1,002 | 65 | 1,113 | — | — | 1,178 | 563 | 1968 | (1) | ||||||||||||||||||||||||||||||||||||||||
Residences on The Avenue, 2221 I St., NW | Residential | Washington, DC | — | — | 119,874 | (39 | ) | — | 119,835 | — | — | 119,835 | 4,857 | 2011 | (1) | |||||||||||||||||||||||||||||||||||||||
The Lofts at Atlantic Wharf | Residential | Boston, MA | — | 3,529 | 54,891 | 971 | 3,529 | 55,862 | — | — | 59,391 | 2,111 | 2011 | (1) | ||||||||||||||||||||||||||||||||||||||||
Cambridge Center Marriott | Hotel | Cambridge, MA | — | 478 | 37,918 | 34,595 | 1,201 | 71,790 | — | — | 72,991 | 44,011 | 1986 | (1) | ||||||||||||||||||||||||||||||||||||||||
Cambridge Center East Garage | Garage | Cambridge, MA | — | — | 35,035 | 1,487 | 103 | 36,419 | — | — | 36,522 | 5,721 | 1984 | (1) | ||||||||||||||||||||||||||||||||||||||||
Cambridge Center West Garage | Garage | Cambridge, MA | — | 1,256 | 15,697 | 1,221 | 1,434 | 16,740 | — | — | 18,174 | 2,951 | 2006 | (1) | ||||||||||||||||||||||||||||||||||||||||
Cambridge Center North Garage | Garage | Cambridge, MA | — | 1,163 | 11,633 | 2,750 | 1,579 | 13,967 | — | — | 15,546 | 7,745 | 1990 | (1) | ||||||||||||||||||||||||||||||||||||||||
250 West 55th Street | Development | New York, NY | — | — | — | 714,451 | — | — | — | 714,451 | 714,451 | — | N/A | N/A | ||||||||||||||||||||||||||||||||||||||||
680 Folsom Street | Development | San Francisco, CA | — | — | — | 147,815 | — | — | 3,058 | 144,757 | 147,815 | — | N/A | N/A | ||||||||||||||||||||||||||||||||||||||||
Two Patriots Park (formerly known as 12300 Sunrise Valley Drive) | Development | Reston, VA | — | 9,062 | 58,884 | 54,309 | 11,009 | 65,426 | — | 45,820 | 122,255 | 43,278 | 1987/1988 | N/A | ||||||||||||||||||||||||||||||||||||||||
The Avant at Reston Town Center Residential | Development | Reston, VA | — | — | — | 67,548 | — | — | — | 67,548 | 67,548 | — | N/A | N/A | ||||||||||||||||||||||||||||||||||||||||
17 Cambridge Center | Development | Cambridge, MA | — | — | — | 55,264 | — | — | — | 55,264 | 55,264 | — | N/A | N/A | ||||||||||||||||||||||||||||||||||||||||
Plaza at Almaden | Land | San Jose, CA | — | — | — | 37,306 | — | — | 37,306 | — | 37,306 | — | N/A | N/A | ||||||||||||||||||||||||||||||||||||||||
Springfield Metro Center | Land | Springfield, VA | — | — | — | 31,965 | — | — | 31,965 | — | 31,965 | — | N/A | N/A | ||||||||||||||||||||||||||||||||||||||||
Tower Oaks Master Plan | Land | Rockville, MD | — | — | — | 28,624 | — | — | 28,624 | — | 28,624 | — | N/A | N/A | ||||||||||||||||||||||||||||||||||||||||
Prospect Hill | Land | Waltham, MA | — | — | — | 23,800 | — | 667 | 23,133 | — | 23,800 | — | N/A | N/A | ||||||||||||||||||||||||||||||||||||||||
Washingtonian North | Land | Gaithersburg, MD | — | — | — | 17,891 | — | — | 17,891 | — | 17,891 | — | N/A | N/A | ||||||||||||||||||||||||||||||||||||||||
103 4th Avenue | Land | Waltham, MA | — | — | — | 11,911 | — | — | 11,911 | — | 11,911 | — | N/A | N/A | ||||||||||||||||||||||||||||||||||||||||
Cambridge Master Plan | Land | Cambridge, MA | — | — | — | 10,896 | — | — | 10,896 | — | 10,896 | — | N/A | N/A | ||||||||||||||||||||||||||||||||||||||||
Reston Gateway | Land | Reston, VA | — | — | — | 9,521 | — | — | 9,521 | — | 9,521 | — | N/A | N/A | ||||||||||||||||||||||||||||||||||||||||
Reston Eastgate | Land | Reston, VA | — | — | — | 8,801 | — | — | 8,801 | — | 8,801 | — | N/A | N/A | ||||||||||||||||||||||||||||||||||||||||
Crane Meadow | Land | Marlborough, MA | — | — | — | 8,725 | — | — | 8,725 | — | 8,725 | — | N/A | N/A | ||||||||||||||||||||||||||||||||||||||||
Broad Run Business Park | Land | Loudon County, VA | — | — | — | 7,851 | 1,621 | — | 6,230 | — | 7,851 | — | N/A | N/A | ||||||||||||||||||||||||||||||||||||||||
30 Shattuck Road | Land | Andover, MA | — | — | — | 1,190 | — | — | 1,190 | �� | — | 1,190 | — | N/A | N/A | |||||||||||||||||||||||||||||||||||||||
|
|
|
|
|
|
|
|
|
|
|
|
|
|
|
|
|
|
|
| |||||||||||||||||||||||||||||||||||
| $ | 3,102,485 | (2) | $ | 2,500,010 | $ | 9,097,935 | $ | 3,271,942 | $ | 2,605,162 | $ | 10,952,851 | $ | 275,094 | $ | 1,036,780 | $ | 14,869,887 | $ | 2,919,479 | ||||||||||||||||||||||||||||||||||
|
|
|
|
|
|
|
|
|
|
|
|
|
|
|
|
|
|
|
| |||||||||||||||||||||||||||||||||||
Note: Total Real Estate does not include Furniture, Fixtures and Equipment totaling approximately $23,441. Accumulated Depreciation does not include approximately $16,662 of accumulated depreciation related to Furniture, Fixtures and Equipment.
The aggregate cost and accumulated depreciation for tax purposes was approximately $10.4$12.2 billion and $2.0$2.2 billion, respectively.
| (1) | Depreciation of the buildings and improvements are calculated over lives ranging from the life of the lease to 40 years. |
| (2) | Includes the unamortized balance of the historical fair value adjustment totaling approximately |
Boston Properties, Inc.
Real Estate and Accumulated Depreciation
December 31, 20102012
(dollars in thousands)
A summary of activity for real estate and accumulated depreciation is as follows:
| 2010 | 2009 | 2008 | 2012 | 2011 | 2010 | |||||||||||||||||||
Real Estate: | ||||||||||||||||||||||||
Balance at the beginning of the year | $ | 11,075,879 | $ | 10,602,278 | $ | 10,231,881 | $ | 13,363,113 | $ | 12,740,892 | $ | 11,075,879 | ||||||||||||
Additions to/improvements of real estate | 1,669,926 | 481,237 | 620,633 | 1,602,583 | 668,084 | 1,669,926 | ||||||||||||||||||
Assets sold/written-off | (4,913 | ) | (7,636 | ) | (250,236 | ) | (95,809 | ) | (45,863 | ) | (4,913 | ) | ||||||||||||
|
|
| ||||||||||||||||||||||
Balance at the end of the year | $ | 12,740,892 | $ | 11,075,879 | $ | 10,602,278 | $ | 14,869,887 | $ | 13,363,113 | $ | 12,740,892 | ||||||||||||
|
|
| ||||||||||||||||||||||
Accumulated Depreciation: | ||||||||||||||||||||||||
Balance at the beginning of the year | $ | 2,020,056 | $ | 1,755,600 | $ | 1,519,795 | $ | 2,626,324 | $ | 2,308,665 | $ | 2,020,056 | ||||||||||||
Depreciation expense | 292,561 | 269,394 | 258,789 | 367,625 | 362,636 | 292,561 | ||||||||||||||||||
Assets sold/written-off | (3,952 | ) | (4,938 | ) | (22,984 | ) | (74,470 | ) | (44,977 | ) | (3,952 | ) | ||||||||||||
|
|
| ||||||||||||||||||||||
Balance at the end of the year | $ | 2,308,665 | $ | 2,020,056 | $ | 1,755,600 | $ | 2,919,479 | $ | 2,626,324 | $ | 2,308,665 | ||||||||||||
|
|
| ||||||||||||||||||||||
Note: Real Estate and Accumulated Depreciation amounts do not include Furniture, Fixtures and Equipment.
(b) Exhibits
| 3.1 | — | Form of Amended and Restated Certificate of Incorporation of Boston Properties, Inc. (Incorporated by reference to Exhibit 3.1 to Boston Properties, Inc.’s Registration Statement on Form S-11, File No. 333-25279.) | |||
| 3.2 | — | Amended and Restated Certificate of Designations of Series E Junior Participating Cumulative Preferred Stock of Boston Properties, Inc. (Incorporated by reference to Exhibit 3.1 to Boston Properties, Inc.’s Current Report on Form 8-K filed on June 18, 2007.) | |||
| 3.3 | — | Certificate of Amendment of Amended and Restated Certificate of Incorporation of Boston Properties, Inc. (Incorporated by reference to Exhibit 3.1 to Boston Properties, Inc.’s Current Report on Form 8-K filed on May 20, 2010.) | |||
| 3.4 | — | Second Amended and Restated Bylaws of Boston Properties, Inc. (Incorporated by reference to Exhibit 3.1 to Boston Properties, Inc.’s Current Report on Form 8-K filed on October 24, 2008.) | |||
| 3.5 | — | Amendment to Second Amended and Restated By-laws of Boston Properties, Inc. (Incorporated by reference to Exhibit 3.2 to Boston Properties, Inc.’s Current Report on Form 8-K filed on May 20, 2010.) | |||
| 4.1 | — | Shareholder Rights Agreement, dated as of June 18, 2007, between Boston Properties, Inc. and Computershare Trust Company, N.A., as Rights Agent. (Incorporated by reference to Exhibit 4.1 to Boston Properties, Inc.’s Current Report on Form 8-K filed on June 18, 2007.) | |||
| 4.2 | — | Form of Certificate of Designations for Series A Preferred Stock. (Incorporated by reference to Exhibit 99.26 to Boston Properties, Inc.’s Current Report on Form 8-K filed on November 25, 1998.) | |||
| 4.3 | — | Form of Common Stock Certificate. (Incorporated by reference to Exhibit 4.3 to Boston Properties, Inc.’s Registration Statement on Form S-11, File No. 333-25279.) | |||
| 4.4 | — | Indenture, dated as of December 13, 2002, by and between Boston Properties Limited Partnership and The Bank of New York, as Trustee. (Incorporated by reference to Exhibit 4.1 to Boston Properties, Inc.’s Current Report on Form 8-K/A filed on December 13, 2002.) | |||
| 4.5 |
| ||||
| |||||
| — | Supplemental Indenture No. 3, dated as of March 18, 2003, by and between Boston Properties Limited Partnership and The Bank of New York, as Trustee, including a form of the 5.625% Senior Note due 2015. (Incorporated by reference to Exhibit 4.6 to Boston Properties Limited Partnership’s Amendment No. 3 to Form 10 filed on May 13, 2003.) | ||||
| 4.6 | — | Supplemental Indenture No. 4, dated as of May 22, 2003, by and between Boston Properties Limited Partnership and The Bank of New York, as Trustee, including a form of the 5.00% Senior Note due 2015. (Incorporated by reference to Exhibit 4.2 to Boston Properties Limited Partnership’s Form S-4 filed on June 13, 2003, File No. 333-106127.) | |||
| 4.7 | — | Supplemental Indenture No. 5, dated as of April 6, 2006, by and between Boston Properties Limited Partnership and The Bank of New York Trust Company, N.A., as Trustee, including a form of the 3.75% Exchangeable Senior Note due 2036. (Incorporated by reference to Exhibit 4.1 to Boston Properties, Inc.’s Quarterly Report on Form 10-Q filed on May 10, 2006.) | |||
| ||||||
| — | Supplemental Indenture No. 7, dated as of August 19, 2008, between the Company and the Trustee, including a form of the 3.625% Exchangeable Senior Note due 2014. (Incorporated by reference to Exhibit 4.1 to the Current Report on Form 8-K of Boston Properties Limited Partnership filed on August 20, 2008.) | |||||
| 4.9 | — | Supplemental Indenture No. 8, dated as of October 9, 2009, between Boston Properties Limited Partnership and The Bank of New York Mellon Trust Company, N.A., as Trustee, including a form of the 5.875% Senior Note due 2019. (Incorporated by reference to Exhibit 4.1 to the Current Report on Form 8-K of Boston Properties Limited Partnership filed on October 9, 2009.) | |||
| 4.10 | — | Supplemental Indenture No. 9, dated as of April 19, 2010, between Boston Properties Limited Partnership and The Bank of New York Mellon Trust Company, N.A., as Trustee, including a form of the 5.625% Senior Note due 2020. (Incorporated by reference to Exhibit 4.1 to the Current Report on Form 8-K of Boston Properties Limited Partnership filed on April 19, 2010.) | |||
| 4.11 | — | Supplemental Indenture No. 10, dated as of November 18, 2010, between Boston Properties Limited Partnership and The Bank of New York Mellon Trust Company, N.A., as Trustee, including a form of the 4.125% Senior Note due 2021 (incorporated by reference to Exhibit 4.1 to the Current Report on Form 8-K of Boston Properties Limited Partnership filed on November 18, 2010). | |||
| 4.12 | — |
| |||
| 4.13 | Supplemental Indenture No. 12, dated as of June 11, 2012, between Boston Properties Limited Partnership and The Bank of New York Mellon Trust Company, N.A., as Trustee, including a form of the 3.85% Senior Note due 2023 (incorporated by reference to Exhibit 4.1 to the Current Report on Form 8-K of Boston Properties Limited Partnership filed on June 11, 2012). | ||||
| 4.14 | — | Registration Rights Agreement, dated as of August 19, 2008, among the Company, Boston Properties, Inc., JP Morgan Securities Inc., Morgan Stanley & Co. Incorporated, Banc of America Securities LLC, Deutsche Bank Securities Inc. and Citigroup Global Markets Inc., as the representatives of the initial purchasers of the Notes. (Incorporated by reference to Exhibit 4.3 to the Current Report on Form 8-K of Boston Properties Limited Partnership filed on August 20, 2008.) | |||
| 10.1 | — | Second Amended and Restated Agreement of Limited Partnership of Boston Properties Limited Partnership, dated as of June 29, 1998. (Incorporated by reference to Exhibit 99.1 to Boston Properties, Inc.’s Current Report on Form 8-K filed on July 15, 1998.) | |||
| 10.2 | — | Certificate of Designations for the Series Two Preferred Units, dated November 12, 1998, constituting an amendment to the Second Amended and Restated Agreement of Limited Partnership of Boston Properties Limited Partnership. (Incorporated by reference to Exhibit 99.24 to Boston Properties, Inc.’s Current Report on Form 8-K filed on November 25, 1998.) | |||
| 10.3 | Certificate of Designations for the Series Four Preferred Units, dated as of August 29, 2012, constituting an amendment to the Second Amended and Restated Agreement of Limited Partnership of Boston Properties Limited Partnership. (Incorporated by reference to Exhibit 10.1 to the Current Report on Form 10-Q of Boston Properties, Inc. filed on November 8, 2012.) | ||||
| 10.4* | — | Forty-Seventh Amendment to the Second Amended and Restated Agreement of Limited Partnership of Boston Properties Limited Partnership, dated as of April 11, 2003, by Boston Properties, Inc., as general partner. (Incorporated by reference to Exhibit 10.1 to Boston Properties, Inc.’s Quarterly Report on Form 10-Q filed on August 14, 2003.) | |||
| 10.5* | — | Seventy-Seventh Amendment to the Second Amended and Restated Agreement of Limited Partnership of Boston Properties Limited Partnership, dated as of January 24, 2008, by Boston Properties, Inc., as general partner. (Incorporated by reference to Exhibit 10.3 to Boston Properties, Inc.’s Current Report on Form 8-K filed on January 29, 2008.) | |||
| 10.6 | — | Ninety-Eighth Amendment to the Second Amended and Restated Agreement of Limited Partnership of Boston Properties Limited Partnership, dated as of October 21, 2010. (Incorporated by reference to Exhibit 10.1 to Boston Properties, Inc.’s Quarterly Report on Form 10-Q filed on November 5, 2010.) | |||
| — |
| |||||
| ||||||
| — | Form of 2011 Outperformance Award Agreement. (Incorporated by reference to Exhibit 10.1 to Boston Properties, Inc.’s Current Report on Form 8-K filed on January 21, 2011.) | |||||
| 10.9* | — | Form of 2012 Outperformance Award Agreement. (Incorporated by reference to Exhibit 10.1 to Boston Properties, Inc.’s Quarterly Report on Form 10-Q filed on May 8, 2012.) | ||||
| 10.10* | — | Boston Properties, Inc. 1999 Non-Qualified Employee Stock Purchase Plan. (Incorporated by reference to Exhibit 10.59 to Boston Properties, Inc.’s Annual Report on Form 10-K filed on March 15, 2005.) | ||||
| 10.11* | — | First Amendment to the Boston Properties, Inc. 1999 Non-Qualified Employee Stock Purchase Plan. (Incorporated by reference to Exhibit 10.60 to Boston Properties, Inc.’s Annual Report on Form 10-K filed on March 15, 2005.) | ||||
| 10.12* | — | Second Amendment to the Boston Properties, Inc. 1999 Non-Qualified Employee Stock Purchase Plan. (Incorporated by reference to Exhibit 10.61 to Boston Properties, Inc.’s Annual Report on Form 10-K filed on March 15, 2005.) | ||||
| 10.13* | — | Boston Properties Deferred Compensation Plan, Amended and Restated Effective as of January 1, 2009. (Incorporated by reference to Exhibit 10.10 to Boston Properties, Inc.’s Annual Report on Form 10-K filed on March 2, 2009.) | ||||
| 10.14* | — | Employment Agreement by and between Mortimer B. Zuckerman and Boston Properties, Inc. dated as of January 17, 2003. (Incorporated by reference to Exhibit 10.7 to Boston Properties, Inc.’s Annual Report on Form 10-K filed on February 27, 2003.) | ||||
| 10.15* | — | First Amendment to Employment Agreement, dated as of November 1, 2007, by and between Boston Properties, Inc. and Mortimer B. Zuckerman. (Incorporated by reference to Exhibit 10.1 to Boston Properties, Inc.’s Quarterly Report on Form 10-Q filed on November 9, 2007.) | ||||
| 10.16* | — | Second Amendment to Employment Agreement, dated as of December 15, 2008, by and between Boston Properties, Inc. and Mortimer B. Zuckerman. (Incorporated by reference to Exhibit 10.13 to Boston Properties, Inc.’s Annual Report on Form 10-K filed on March 2, 2009.) | ||||
| 10.17* | — | Employment Agreement by and between Douglas T. Linde and Boston Properties, Inc. dated as of November 29, 2002. (Incorporated by reference to Exhibit 10.12 to Boston Properties, Inc.’s Annual Report on Form 10-K filed on February 27, 2003.) | ||||
| 10.18* | — | First Amendment to Employment Agreement, dated as of November 1, 2007, by and between Boston Properties, Inc. and Douglas T. Linde. (Incorporated by reference to Exhibit 10.3 to Boston Properties, Inc.’s Quarterly Report on Form 10-Q filed on November 9, 2007.) | ||||
| 10.19* | — | Second Amendment to Employment Agreement, dated as of December 15, 2008, by and between Boston Properties, Inc. and Douglas T. Linde. (Incorporated by reference to Exhibit 10.19 to Boston Properties, Inc.’s Annual Report on Form 10-K filed on March 2, 2009.) | |||
| 10.20* | — | Amended and Restated Employment Agreement by and between Raymond A. Ritchey and Boston Properties, Inc. dated as of November 29, 2002. (Incorporated by reference to Exhibit 10.15 to Boston Properties, Inc.’s Annual Report on Form 10-K filed on February 27, 2003.) | |||
| 10.21* | — | First Amendment to Amended and Restated Employment Agreement, dated as of November 1, 2007, by and between Boston Properties, Inc. and Raymond A. Ritchey. (Incorporated by reference to Exhibit 10.4 to Boston Properties, Inc.’s Quarterly Report on Form 10-Q filed on November 9, 2007.) | |||
| 10.22* | ||||||
| — | Second Amendment to Amended and Restated Employment Agreement, dated as of December 15, 2008, by and between Boston Properties, Inc. and Raymond A. Ritchey. (Incorporated by reference to Exhibit 10.22 to Boston Properties, Inc.’s Annual Report on Form 10-K filed on March 2, 2009.) | |||||
| 10.23* | — |
| ||||
| ||||||
| ||||||
| 10.24* | — | Employment Agreement by and between Michael E. LaBelle and Boston Properties, Inc. dated as of January 24, 2008. (Incorporated by reference to Exhibit 10.2 to Boston Properties, Inc.’s Current Report on Form 8-K filed on January 29, 2008.) | ||||
| 10.25* | — | First Amendment to Employment Agreement, dated as of December 15, 2008, by and between Boston Properties, Inc. and Michael E. LaBelle. (Incorporated by reference to Exhibit 10.27 to Boston Properties, Inc.’s Annual Report on Form 10-K filed on March 2, 2009.) | ||||
| 10.26* | — | Employment Agreement by and between Peter D. Johnston and Boston Properties, Inc. dated as of August 25, 2005. (Incorporated by reference to Exhibit 10.2 to Boston Properties, Inc.’s Quarterly Report on Form 10-Q filed on November 9, 2005.) | ||||
| 10.27* | — | First Amendment to Employment Agreement, dated as of November 1, 2007, by and between Boston Properties, Inc. and Peter D. Johnston. (Incorporated by reference to Exhibit 10.6 to Boston Properties, Inc.’s Quarterly Report on Form 10-Q filed on November 9, 2007.) | ||||
| 10.28* | — | Second Amendment to Employment Agreement, dated as of December 15, 2008, by and between Boston Properties, Inc. and Peter D. Johnston. (Incorporated by reference to Exhibit 10.30 to Boston Properties, Inc.’s Annual Report on Form 10-K filed on March 2, 2009.) | ||||
| 10.29* | — | Employment Agreement by and between Bryan J. Koop and Boston Properties, Inc. dated as of November 29, 2002. (Incorporated by reference to Exhibit 10.10 to Boston Properties, Inc.’s Annual Report on Form 10-K filed on February 27, 2003.) | ||||
| 10.30* | — | First Amendment to Employment Agreement, dated as of November 1, 2007, by and between Boston Properties, Inc. and Bryan J. Koop. (Incorporated by reference to Exhibit 10.7 to Boston Properties, Inc.’s Quarterly Report on Form 10-Q filed on November 9, 2007.) | ||||
| 10.31* | — | Second Amendment to Employment Agreement, dated as of December 15, 2008, by and between Boston Properties, Inc. and Bryan J. Koop. (Incorporated by reference to Exhibit 10.33 to Boston Properties, Inc.’s Annual Report on Form 10-K filed on March 2, 2009.) | ||||
| 10.32* | — | Amended and Restated Employment Agreement by and between Robert E. Selsam and Boston Properties, Inc. dated as of November 29, 2002. (Incorporated by reference to Exhibit 10.16 to Boston Properties, Inc.’s Annual Report on Form 10-K filed on February 27, 2003.) | ||||
| 10.33* | — | First Amendment to Amended and Restated Employment Agreement, dated as of November 1, 2007, by and between Boston Properties, Inc. and Robert E. Selsam. (Incorporated by reference to Exhibit 10.8 to Boston Properties, Inc.’s Quarterly Report on Form 10-Q filed on November 9, 2007.) | ||
| 10.34* | ||||||
| — | Second Amendment to Amended and Restated Employment Agreement, dated as of December 15, 2008, by and between Boston Properties, Inc. and Robert E. Selsam. (Incorporated by reference to Exhibit 10.36 to Boston Properties, Inc.’s Annual Report on Form 10-K filed on March 2, 2009.) | |||||
| 10.35* | — | Compensation Agreement between Boston Properties, Inc. and Robert E. Selsam, dated as of August 10, 1995 relating to 90 Church Street. (Incorporated by reference to Exhibit 10.26 to Boston Properties, Inc.’s Registration Statement on Form S-11, File No. 333-25279.) | ||||
| 10.36* | — | Employment Agreement by and between Robert E. Pester and Boston Properties, Inc. dated as of December 16, 2002. (Incorporated by reference to Exhibit 10.14 to Boston Properties, Inc.’s Annual Report on Form 10-K filed on February 27, 2003.) | ||||
| 10.37* | — | First Amendment to Employment Agreement, dated as of November 1, 2007, by and between Boston Properties, Inc. and Robert E. Pester. (Incorporated by reference to Exhibit 10.9 to Boston Properties, Inc.’s Quarterly Report on Form 10-Q filed on November 9, 2007.) | ||||
| 10.38* | — | Second Amendment to Employment Agreement, dated as of December 15, 2008, by and between Boston Properties, Inc. and Robert E. Pester. (Incorporated by reference to Exhibit 10.40 to Boston Properties, Inc.’s Annual Report on Form 10-K filed on March 2, 2009.) | ||||
| 10.39* | — | Employment Agreement by and between Mitchell S. Landis and Boston Properties, Inc. dated as of November 26, 2002. (Incorporated by reference to Exhibit 10.11 to Boston Properties, Inc.’s Annual Report on Form 10-K filed on February 27, 2003.) | ||||
| 10.40* | — | First Amendment to Employment Agreement, dated as of November 1, 2007, by and between Boston Properties, Inc. and Mitchell S. Landis. (Incorporated by reference to Exhibit 10.10 to Boston Properties, Inc.’s Quarterly Report on Form 10-Q filed on November 9, 2007.) | ||||
| 10.41* | — | Second Amendment to Employment Agreement, dated as of December 15, 2008, by and between Boston Properties, Inc. and Mitchell S. Landis. (Incorporated by reference to Exhibit 10.43 to Boston Properties, Inc.’s Annual Report on Form 10-K filed on March 2, 2009.) | ||||
| 10.42* | — | Senior Executive Severance Agreement by and among Boston Properties, Inc., Boston Properties Limited Partnership and Mortimer B. Zuckerman. (Incorporated by reference to Exhibit 10.17 to Boston Properties, Inc.’s Annual Report on Form 10-K filed on February 27, 2003.) | ||||
| 10.43* | — | First Amendment to the Senior Executive Severance Agreement, dated as of November 1, 2007, by and among Boston Properties, Inc., Boston Properties Limited Partnership and Mortimer B. Zuckerman. (Incorporated by reference to Exhibit 10.11 to Boston Properties, Inc.’s Quarterly Report on Form 10-Q filed on November 9, 2007.) | ||||
| 10.44* | — | Second Amendment to the Senior Executive Severance Agreement, dated as of December 15, 2008, by and among Boston Properties, Inc., Boston Properties Limited Partnership and Mortimer B. Zuckerman. (Incorporated by reference to Exhibit 10.46 to Boston Properties, Inc.’s Annual Report on Form 10-K filed on March 2, 2009.) | ||||
| 10.45* | — | Boston Properties, Inc. Senior Executive Severance Plan. (Incorporated by reference to Exhibit 10.19 to Boston Properties, Inc.’s Annual Report on Form 10-K filed on February 27, 2003.) | ||||
| 10.46* | — | First Amendment to the Boston Properties, Inc. Senior Executive Severance Plan, dated as of October 18, 2007. (Incorporated by reference to Exhibit 10.13 to Boston Properties, Inc.’s Quarterly Report on Form 10-Q filed on November 9, 2007.) | |||
| 10.47* | — | Second Amendment to the Boston Properties, Inc. Senior Executive Severance Plan, dated as of December 15, 2008. (Incorporated by reference to Exhibit 10.52 to Boston Properties, Inc.’s Annual Report on Form 10-K filed on March 2, 2009.) | |||
| 10.48* | ||||||
| — | Boston Properties, Inc. Executive Severance Plan, dated as of July 30, 1998. (Incorporated by reference to Exhibit 10.20 to Boston Properties, Inc.’s Annual Report on Form 10-K filed on February 27, 2003.) | |||||
| 10.49* | — | First Amendment to the Boston Properties, Inc. Executive Severance Plan, dated as of October 18, 2007. (Incorporated by reference to Exhibit 10.14 to Boston Properties, Inc.’s Quarterly Report on Form 10-Q filed on November 9, 2007.) | ||||
| 10.50* | — | Boston Properties, Inc. Officer Severance Plan, dated as of July 30, 1998. (Incorporated by reference to Exhibit 10.15 to Boston Properties, Inc.’s Quarterly Report on Form 10-Q filed on November 9, 2007.) | ||||
| 10.51* | — | First Amendment to the Boston Properties, Inc. Officer Severance Plan, dated as of October 18, 2007. (Incorporated by reference to Exhibit 10.16 to Boston Properties, Inc.’s Quarterly Report on Form 10-Q filed on November 9, 2007.) | ||||
| 10.52* | — | Second Amendment to the Boston Properties, Inc. Officer Severance Plan, dated as of December 15, 2008. (Incorporated by reference to Exhibit 10.57 to Boston Properties, Inc.’s Annual Report on Form 10-K filed on March 2, 2009.) | ||||
| 10.53* | — | Form of Indemnification Agreement by and among Boston Properties, Inc., Boston Properties Limited Partnership and certain officers and directors of the Company. (Incorporated by reference to Exhibit 10.1 to Boston Properties, Inc.’s Quarterly Report on Form 10-Q filed on August 9, 2004.) | ||||
| 10.54* | — | Director Appointment Agreement, dated as of January 20, 2011, by and between Matthew J. Lustig and Boston Properties, Inc. | ||||
| 10.55* | — |
| ||||
| ||||||
| ||||||
| ||||||
| — | Statement re Computation of Ratios. (Filed herewith.) | |||||
| 21.1 | — | Subsidiaries of Boston Properties, | ||||
| 23.1 | — | Consent of PricewaterhouseCoopers LLP, Independent Registered Public Accounting firm. (Filed herewith.) | ||||
| 31.1 | ||||||
| — | Rule 13a-14(a)/15d-14(a) Certification of Chief Executive Officer pursuant to Section 302 of the Sarbanes-Oxley Act of 2002. (Filed herewith.) | |||||
| 31.2 | — | Rule 13a-14(a)/15d-14(a) Certification of Chief Financial Officer pursuant to Section 302 of the Sarbanes-Oxley Act of 2002. (Filed herewith.) | ||||
| 32.1 | — | Section 1350 Certification of Chief Executive Officer pursuant to Section 906 of the Sarbanes-Oxley Act of 2002. (Furnished herewith.) | ||||
| 32.2 | — | Section 1350 Certification of Chief Financial Officer pursuant to Section 906 of the Sarbanes-Oxley Act of 2002. (Furnished herewith.) | ||
| 101 | The following materials from Boston Properties, Inc.’s Annual Report on Form 10-K for the year ended December 31,
As provided in Rule 406T of Regulation S-T, this information is | |||
| * | Indicates management contract or compensatory plan or arrangement required to be filed or incorporated by reference as an exhibit to this Form 10-K pursuant to Item 15(b) of Form 10-K. |
SIGNATURES
Pursuant to the requirements of Section 13 or 15(d) of the Securities Exchange Act of 1934, the Registrant Boston Properties, Inc., has duly caused this report to be signed on its behalf by the undersigned thereunto duly authorized.
| ||||
| /s/ MICHAEL E. LABELLE | |||
| Michael E. LaBelle | |||
(duly authorized officer and principal financial officer) | ||||
Pursuant to the requirements of the Securities Exchange Act of 1934, this report has been signed below by the following persons on behalf of the Registrant, and in the capacities and on the dates indicated.
| February | By: | /s/ MORTIMER B. ZUCKERMAN | ||
Mortimer B. Zuckerman Chairman of the Board and Chief Executive Officer | ||||
| By: | /s/ DOUGLAS T. LINDE | |||
Douglas T. Linde Director and President | ||||
| By: | /s/ | |||
| ||||
| ||||
Zoë Baird Budinger Director | ||||
| By: | /s/ CAROL B. EINIGER | |||
Carol B. Einiger Director | ||||
| By: | /s/ DR. JACOB A. FRENKEL | |||
Dr. Jacob A. Frenkel Director | ||||
| By: | /s/ JOEL I. KLEIN | |||
Joel I. Klein Director | ||||
| By: | /s/ MATTHEW J. LUSTIG | |||
Matthew J. Lustig Director | ||||
| By: | /s/ ALAN J. PATRICOF | |||
Alan J. Patricof Director | ||||
| By: | /s/ MARTIN TURCHIN | |||
Martin Turchin Director | ||||
| By: | /s/ DAVID A. TWARDOCK | |||
David A. Twardock Director | ||||
| By: | /s/ MICHAEL E. LABELLE | |||
Michael E. LaBelle Senior Vice President, Chief Financial Officer and Principal Financial Officer | ||||
| By: | /s/ ARTHUR S. FLASHMAN | |||
Arthur S. Flashman Vice President, Controller and Principal Accounting Officer | ||||
161169