
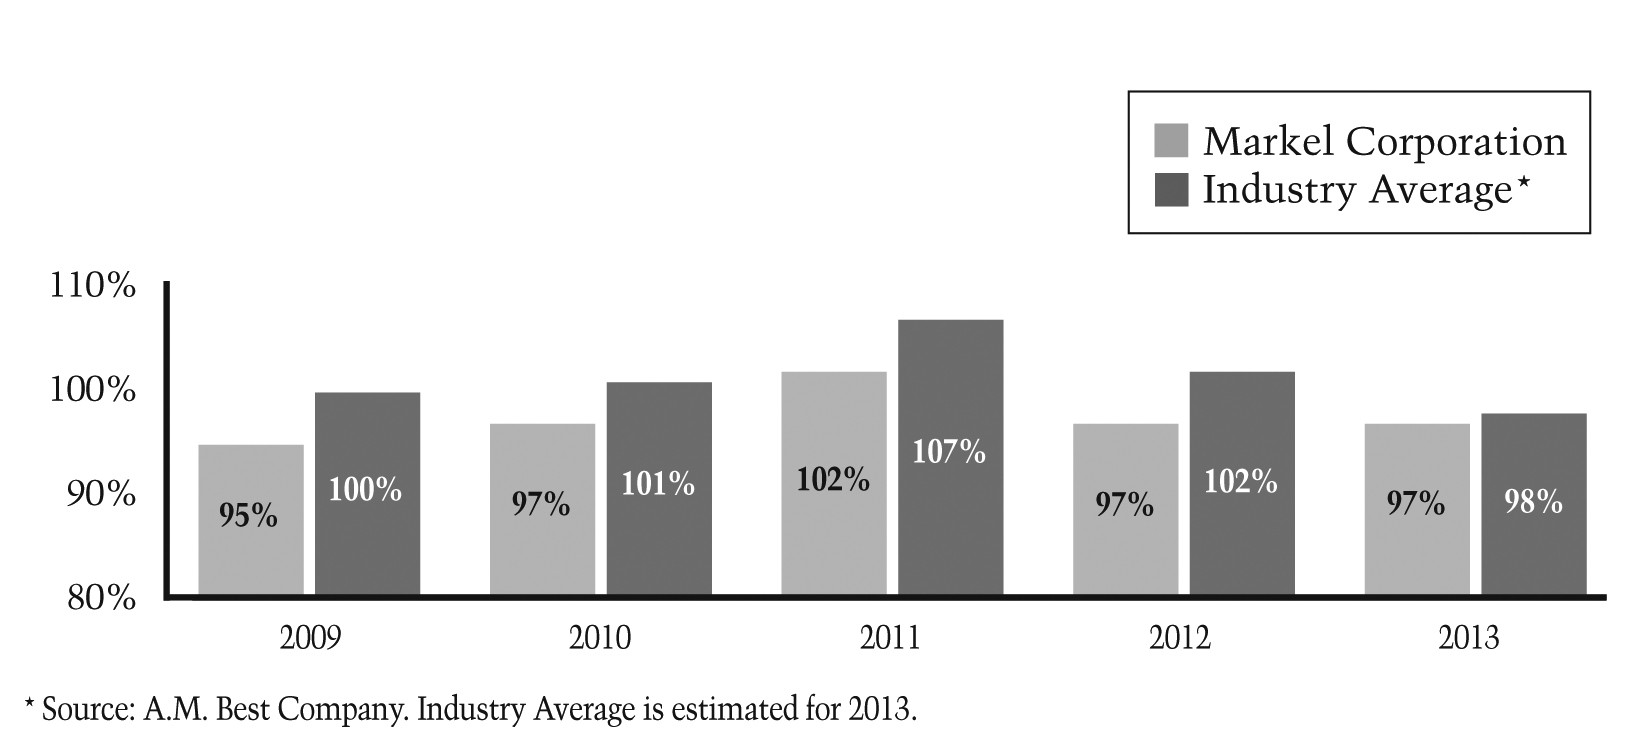
10, 2014 Item No. Part I 1. 1A. 1B. 2. 3. 4. 4A. Part II 5. 6. 7. 7A. 8. Financial Statements and Supplementary Data The response to this item is submitted in Item 15 and on page 83. 9. 9A. 9B. Part III 10. 11. 12. 13. 14. *Portions of Item 10 and Items 11, 12, 13 and 14 will be incorporated by reference from the Registrant’s 2011 Proxy Statement pursuant to instructions G(1) and G(3) of the General Instructions to Form 10-K. Part IV 15. Exhibits, Financial Statement Schedules a. Documents filed as part of this Form 10-K (1) Financial Statements Consolidated Statements of Changes in Equity for the Years Ended December 31, 2010, 2009 and 2008 Consolidated Statements of Cash Flows for the Years Ended December 31, 2010, 2009 and 2008 Notes to Consolidated Financial Statements for the Years Ended December 31, 2010, 2009 and 2008 (2) Schedules have been omitted since they either are not required or are not applicable, or the information called for is shown in the Consolidated Financial Statements and Notes thereto. (3) See Index to Exhibits for a list of Exhibits filed as part of this report b. See Index to Exhibits and Item 15a(3) c. See Index to Financial Statements and Item 15a(2) and Reinsurance form of treaty reinsurance contracts, which are contractual arrangements that provide for automatic reinsuring of a type or category of risk underwritten by cedents. Generally, we participate on reinsurance treaties with a number of other reinsurers, each with an allocated portion of the treaty, with the terms and conditions of the treaty being substantially the same for each participating reinsurer. With treaty reinsurance contracts, we do not separately evaluate each of the individual risks assumed under the contracts and are largely dependent on the individual underwriting decisions made by the cedent. Accordingly, we review and analyze the cedent's risk management and underwriting practices in deciding whether to provide treaty reinsurance and in pricing of treaty reinsurance contracts. Rio de Janeiro, Brazil, using Lloyd's admitted status, through Markel Europe using a representative office in Bogota, Colombia and a service company in Buenos Aires, Argentina, and through Markel Resseguradora do Brasil S.A. (Markel Brazil), a reinsurance company in Rio de Janeiro. Additionally, MIICL, Markel Syndicate 3000 and Lloyd's Syndicate 1400 are able to offer reinsurance in a number of other Latin American countries from their offices outside of Latin America. recent three years, we still consider the overall property and casualty insurance market to be soft. We routinely review the pricing of our major product lines and underwriting profitability.UNITED STATESSECURITIES AND EXCHANGE COMMISSIONWashington, D.C. 20549FORM 10-KAnnual report pursuant to Section 13 or 15(d) of theSecurities Exchange Act of 1934 for the fiscal year ended December 31, 20102013Commission File Number 001-15811MARKEL CORPORATION(Exact name of registrant as specified in its charter)A Virginia CorporationIRS Employer Identification No. 54-19592844521 Highwoods Parkway, Glen Allen, Virginia 23060-6148(Address of principal executive offices) (Zip code)Registrant’sRegistrant's telephone number, including area code: (804) 747-0136Securities registered pursuant to Section 12(b) of the Act:Common Stock, no par value7.50% Senior Debentures due 2046New York Stock Exchange, Inc.(title of each class and name of the exchange on which registered)Securities registered pursuant to Section 12(g) of the Act: NoneIndicate by check mark if the registrant is a well-known seasoned issuer, as defined in Rule 405 of the Securities Act. Yes x No ¨Indicate by check mark if the registrant is not required to file reports pursuant to Section 13 or Section 15(d) of the Act. Yes ¨ No xIndicate by check mark whether the registrant (1) has filed all reports required to be filed by Section 13 or 15(d) of the Securities Exchange Act of 1934 during the preceding 12 months (or for such shorter period that the registrant was required to file such reports), and (2) has been subject to such filing requirements for the past 90 days. Yes x No ¨Indicate by check mark whether the registrant has submitted electronically and posted on its corporate Website, if any, every Interactive Data File required to be submitted and posted pursuant to Rule 405 of Regulation S-T during the preceding 12 months (or for such shorter period that the registrant was required to submit and post such files). Yes x No ¨Indicate by check mark if disclosure of delinquent filers pursuant to Item 405 of Regulation S-K is not contained herein, and will not be contained, to the best of registrant’sregistrant's knowledge, in definitive proxy or information statements incorporated by reference in Part III of this Form 10-K or any amendment to this Form 10-K. ¨Indicate by check mark whether the registrant is a large accelerated filer, an accelerated filer, a non-accelerated filer or a smaller reporting company. See the definitions of “large"large accelerated filer,” “accelerated filer”" "accelerated filer" and “smaller"smaller reporting company”company" in Rule 12b-2 of the Exchange Act.Large accelerated filer x Accelerated filer ¨ Non-accelerated filer ¨ Smaller reporting company ¨Indicate by check mark whether the registrant is a shell company (as defined in Rule 12b-2 of the Act). Yes ¨ No xThe aggregate market value of the shares of the registrant’sregistrant's Common Stock held by non-affiliates as of June 30, 20102013 was approximately $3,020,713,353.$7,085,000,000.The number of shares of the registrant’sregistrant's Common Stock outstanding at February 16, 2011: 9,718,932.Documents Incorporated By ReferenceThe portions of the registrant’sregistrant's Proxy Statement for the Annual Meeting of Shareholders scheduled to be held on May 9, 2011,12, 2014, referred to in Part III.Index and Cross References-Form 10-K Annual Report Page Business 12-33, 129-131 Risk Factors 30-33 Unresolved Staff Comments NONE Properties (note 5) 53 Legal Proceedings (note 14) 69 [Reserved] Executive Officers of the Registrant 132 Market for Registrant’s Common Equity, Related Stockholder Matters and Issuer Purchases of Equity Securities 83, 129-130 Selected Financial Data 34-35 Management’s Discussion and Analysis of Financial Condition and Results of Operations 88-128 Quantitative and Qualitative Disclosures About Market Risk 120-125 Changes in and Disagreements With Accountants on Accounting and Financial Disclosure NONE Controls and Procedures 85-87, 126 Other Information NONE Directors, Executive Officers and Corporate Governance* 132 Code of Conduct 131 Executive Compensation* Security Ownership of Certain Beneficial Owners and Management and Related Stockholder Matters* Certain Relationships and Related Transactions, and Director Independence* Principal Accounting Fees and Services* 36 37 38 39 40-83 84-86 Item No. Page Part I 1. Business 2-25, 127-128 1A. Risk Factors 21-25 1B. Unresolved Staff Comments NONE 2. Properties (note 6) 49 3. Legal Proceedings (note 17) 68-69 4. Mine Safety Disclosures NONE Part II 5. Market for Registrant's Common Equity, Related Stockholder Matters and Issuer Purchases of Equity Securities 84, 127 6. Selected Financial Data 26-27 7. Management's Discussion and Analysis of Financial Condition and Results of Operations 88-126 7A. Quantitative and Qualitative Disclosures About Market Risk 120-124 8. Financial Statements and Supplementary DataThe response to this item is submitted in Item 15 and on page 84. 9. Changes in and Disagreements With Accountants on Accounting and Financial Disclosure NONE 9A. Controls and Procedures 86-87, 124 9B. Other Information NONE Part III 10. Directors, Executive Officers and Corporate Governance* 129 Code of Conduct 128 11. Executive Compensation* 12. Security Ownership of Certain Beneficial Owners and Management and Related Stockholder Matters* 13. Certain Relationships and Related Transactions, and Director Independence* 14. Principal Accounting Fees and Services* *Portions of Item 10 and Items 11, 12, 13 and 14 will be incorporated by reference from the Registrant's 2014 Proxy Statement pursuant to instructions G(1) and G(3) of the General Instructions to Form 10-K. Part IV 15. Exhibits, Financial Statement Schedules a. Documents filed as part of this Form 10-K (1) Financial Statements Consolidated Balance Sheets 28 Consolidated Statements of Income and Comprehensive Income 29 Consolidated Statements of Changes in Equity 30 Consolidated Statements of Cash Flows 31 Notes to Consolidated Financial Statements 32-84 Reports of Independent Registered Public Accounting Firm 85-86 (2) Schedules have been omitted since they either are not required or are not applicable, or the information called for is shown in the Consolidated Financial Statements and Notes thereto. (3) See Index to Exhibits for a list of Exhibits filed as part of this report b. See Index to Exhibits and Item 15a(3) c. See Index to Financial Statements and Item 15a(2) Markel Corporation & SubsidiariesBUSINESS OVERVIEWWe are a diverse financial holding company serving a variety of niche markets. Our principal business markets and underwrites specialty insurance products and programs.products. We believe that our specialty product focus and niche market strategy enable us to develop expertise and specialized market knowledge. We seek to differentiate ourselves from competitors by our expertise, service, continuity and other value-based considerations. We compete in three segments of the specialty insurance marketplace: the Excess and Surplus Lines, the Specialty Admitted and the London markets. We also own interests in various industrial and service businesses that operate outside of the specialty insurance marketplace. Our financial goals are to earn consistent underwriting and operating profits and superior investment returns to build shareholder value.On May 1, 2013, we completed the acquisition of Alterra Capital Holdings Limited (Alterra), a Bermuda-headquartered global enterprise providing diversified specialty property and casualty insurance and reinsurance products to corporations, public entities and other property and casualty insurers. Total purchase consideration was $3.3 billion. The acquisition of Alterra creates additional size and scale, providing us with additional insurance and investment opportunities.Specialty InsuranceThe specialty insurance market differs significantly from the standard market. In the standard market, insurance rates and forms are highly regulated, products and coverages are largely uniform with relatively predictable exposures and companies tend to compete for customers on the basis of price. In contrast, the specialty market provides coverage for hard-to-place risks that generally do not fit the underwriting criteria of standard carriers. For example, United States insurance regulations generally require an Excess and Surplus Lines (E&S) account to be declined by admitted carriers before an E&S company may write the business. Hard-to-place risks written in the Specialty Admitted market cover insureds engaged in similar, but highly specialized activities who require a total insurance program not otherwise available from standard insurers or insurance products that are overlooked by large admitted carriers. Hard-to-place risks in the London market are generally distinguishable from standard risks due to the complexity or significant size of the risk.Competition in the specialty insurance market tends to focus less on price than in the standard insurance market and more on other value-based considerations, such as availability, service and expertise. While specialty market exposures may have higher perceived insurance risks than their standard market counterparts, we seek to manage these risks to achieve higher financial returns. To reach our financial and operational goals, we must have extensive knowledge and expertise in our chosen markets. Many of our accounts are considered on an individual basis where customized forms and tailored solutions are employed.By focusing on the distinctive risk characteristics of our insureds, we have been able to identify a variety of niche markets where we can add value with our specialty product offerings. Examples of niche insurance markets that we have targeted include wind and earthquake exposedearthquake-exposed commercial properties, liability coverage for highly specialized professionals, equine-related risks, workers’workers' compensation insurance for small businesses, yachts and other watercraft, motorcyclesclassic cars and marine, energy and environmental-related activities. Our market strategy in each of these areas of specialization is tailored to the unique nature of the loss exposure, coverage and services required by insureds. In each of our niche markets, we assign teams of experienced underwriters and claims specialists who provide a full range of insurance services.MarketsThe E&S market focuses on hard-to-place risks and loss exposures that generally cannot be writtenWe also participate in the standard market. E&S eligibility allowsreinsurance market in certain classes of reinsurance product offerings, which were expanded in 2013 through the acquisition of Alterra. In the reinsurance market, our clients are other insurance subsidiaries to underwrite unique loss exposures with more flexible policy forms and unregulated premium rates. Thiscompanies, or cedents. We typically results in coverages that are more restrictive and more expensive than coverageswrite our reinsurance products in the standard market.12 |Our reinsurance products are written on both a quota share and excess of loss basis. Quota share contracts require us to share the losses and expenses in an agreed proportion with the cedent. Excess of loss contracts require us to indemnify the cedent against all or a specified portion of losses and expenses in excess of a specified dollar or percentage amount. In both types of contracts, we may provide a ceding commission to the cedent.We distinguish ourselves in the reinsurance market by the expertise of our underwriting teams, our access to global reinsurance markets, our ability to offer large lines and our ability to customize reinsurance solutions to fit our client's needs. Our specialty reinsurance product offerings include coverage for property, professional liability, automobile, general casualty and credit and surety risks.2MarketsIn 2009,the United States, we write business in the excess and surplus lines (E&S) and specialty admitted insurance and reinsurance markets. In 2012, the E&S market represented approximately $33$35 billion, or 7%, of the approximately $475$523 billion United States property and casualty (P&C) industry.(1) We areIn 2012, our legacy Markel operations were the sixtheighth largest E&S writer in the United States as measured by direct premium writings.writings and Alterra's legacy operations were the twenty-ninth.(1) In 2010, we wrote $898 millionOur E&S insurance operations are conducted through Essex Insurance Company (Essex), domiciled in Delaware, and Evanston Insurance Company (Evanston), domiciled in Illinois. The majority of business in our Excess and Surplus Lines segment.We also write business in the Specialty Admitted market. Most of these risks, although unique and hard-to-place in the standard market, must remain with anspecialty admitted insurance company for marketingoperations are conducted through Markel Insurance Company (MIC), domiciled in Illinois; Markel American Insurance Company (MAIC), domiciled in Virginia; FirstComp Insurance Company (FCIC), domiciled in Nebraska; and regulatory reasons. The Specialty Admitted market is subject to more state regulation than the E&S market, particularly with regard to rate and form filing requirements, restrictions on the ability to exit lines of business, premium tax payments and membershipEssentia Insurance Company (Essentia), domiciled in various state associations, such as state guaranty funds and assigned risk plans. In late 2010, we acquired Aspen Holdings, Inc. and began writing workers’ compensation insurance within the Specialty Admitted market. In 2010, we wrote $375 million of business in our Specialty Admitted segment.The London market, which produced approximately $50 billion of gross written premium in 2009, is the largest insurance market in Europe and third largest in the world.(2) The London market is known for its ability to provide innovative, tailored coverage and capacity for unique and hard-to-place risks. It is primarilyMissouri.As a broker market, which means that insurance brokers bring mostresult of the business to the market. The London market is also largelyacquisition of Alterra, we have expanded our United States insurance and reinsurance operations, effective May 1, 2013. Our E&S insurance operations include Alterra Excess & Surplus Insurance Company (AESIC) and our specialty admitted operations include Alterra America Insurance Company (AAIC), both domiciled in Delaware. Our United States reinsurance operations are conducted through Alterra Reinsurance USA Inc. (Alterra Re USA), a subscription market, which means that loss exposures brought into the market are typically insured by more than one insurance company or Lloyd’s syndicate, often due to the high limits of insurance coverage required. We write business on both a direct and subscription basisConnecticut-domiciled reinsurance company.In Europe, we participate in the London market. When we write business in the subscription market, we prefer to participate as lead underwriter in order to control underwriting terms, policy conditions and claims handling.In 2009, gross premium written through Lloyd’s syndicates generated approximately two-thirds of the London market’s international insurance business(2), making Lloyd’s the world’s second largest commercial surplus lines insurer(1) and fifth largest reinsurer.(3) Corporate capital providers often provide a majority of a syndicate’s capacity and also often own or control the syndicate’s managing agent. This structure permits the capital provider to exert greater influence on, and demand greater accountability for, underwriting results. In 2009, corporate capital providers accounted for approximately 95% of total underwriting capacity in Lloyd’s.(4)We participate in the London market through Markel International, which includes Markel Capital Limited (Markel Capital) and Markel International Insurance Company Limited (MIICL). Markel Capital is the corporate capital provider for our syndicate at Lloyd’s, Markel Syndicate 3000, through which our Lloyd's of London (Lloyd's) operations are conducted. Markel Syndicate 3000 is managed by Markel Syndicate Management Limited.Limited (MSM). As a result of the acquisition of Alterra, our Lloyd's operations also include Alterra Corporate Capital 2 Limited and Alterra Corporate Capital 3 Limited, corporate capital providers to Lloyd's Syndicate 1400. Since October 1, 2013, MSM has also managed Lloyd's Syndicate 1400. Markel International is headquartered in London, England. In 2010,addition to regional offices in the United Kingdom, Markel International has offices in Canada, Spain, Germany, Sweden, Switzerland, the Netherlands, Hong Kong, China, Malaysia and Singapore. The London insurance market, which produced approximately $69 billion of gross written premium in 2012,(2) is the largest insurance market in Europe and third largest in the world.(3) In 2012, gross premium written through Lloyd's syndicates generated approximately half of the London market's international insurance business,(2) making Lloyd's the world's largest commercial surplus lines insurer(1) and fourth largest reinsurer.(4) Corporate capital providers often provide a majority of a syndicate's capacity and also generally own or control the syndicate's managing agent. This structure permits the capital provider to exert greater influence on, and demand greater accountability for, underwriting results. In 2012, corporate capital providers accounted for approximately 89% of total underwriting capacity in Lloyd's.(5) Our other European operations acquired through Alterra are conducted through Markel Europe plc (Markel Europe), which is headquartered in Dublin, Ireland. Markel Europe also operates branches in London, England and Zurich, Switzerland.We also added insurance and reinsurance operations in Bermuda and Latin America through the acquisition of Alterra. In Bermuda, we wrote $709 millionconduct our insurance and reinsurance operations through Markel Bermuda Limited (Markel Bermuda), which is registered as a Class 4 insurer and a Class C long term insurer under the insurance laws of businessBermuda. In Latin America, we provide reinsurance through MSM in our London Insurance Market segment.(1) U.S. Surplus Lines Segment Review Special Report, A.M. Best (September 23, 2013).(2) London Company Market Statistics Report, International Underwriting Association (October 2013).(3) UK Insurance Key Facts, Association of British Insurers (September 2013).(4) Global Reinsurance Segment Review Special Report, A.M. Best (August 26, 2013).(5) Lloyd's Annual Report 2012.3In 2010, 28%2013, 25% of consolidated gross premium writings related to foreign risks (i.e., coverage for risks located outside of the United States), of which 25% were from the United Kingdom and 17%13% were from Canada. In 2009, 26%2012, 30% of our premium writings related to foreign risks, of which 28%20% were from the United Kingdom.Kingdom and 16% were from Canada. In 2008, 23%2011, 31% of our premium writings related to foreign risks, of which 32%20% were from the United Kingdom.Kingdom and 18% were from Canada. In each of these years, there were no other individual foreign countries from which premium writings were material. Premium writings are attributed to individual countries based upon location of risk.(1)U.S. Surplus Lines – 2010 Market Review Special Report,A.M. Best Research(September 2010).(2)Insurance 2010, TheCityUK(December 2010).(3)Top Ten Global Reinsurers by Net Reinsurance Premiums Written 2009, Business Insurance(September 2010).(4)Lloyd’s Highlights, Lloyd’s(April 2010).| 13Most of our business is placed through insurance and reinsurance brokers. Some of our insurance business is also placed through managing general agents. We seek to develop and capitalize on relationships with insurance and reinsurance brokers, insurance and reinsurance companies, large global corporations and financial intermediaries to develop and underwrite business. As a result of the acquisition of Alterra, a significant volume of premium for the property and casualty insurance and reinsurance industry is produced through a small number of large insurance and reinsurance brokers. During the year ended December 31, 2013, the top three independent brokers accounted for approximately 19% of our gross premiums written.CompetitionMarkel Corporation & SubsidiariesBUSINESS OVERVIEW (continued)CompetitionWe compete with numerous domestic and international insurance companies and reinsurers, Lloyd’sLloyd's syndicates, risk retention groups, insurance buying groups, risk securitization programs and alternative self-insurance mechanisms. Competition may take the form of lower prices, broader coverages, greater product flexibility, higher quality services or higher ratings by independent rating agencies. In all of our markets, we compete by developing specialty products to satisfy well-defined market needs and by maintaining relationships with agents, brokers and insureds who rely on our expertise. This expertise is our principal means of competing. We offer over 100 product lines. Eacha diverse portfolio of these products, haseach with its own distinct competitive environment.environment, which enables us to be responsive to changes in market conditions for individual product lines. With each of our products, we seek to compete with innovative ideas, appropriate pricing, expense control and quality service to policyholders, agents and brokers.Few barriers exist to prevent insurers and reinsurers from entering our segmentsmarkets of the P&Cproperty and casualty industry. Market conditions and capital capacity influence the degree of competition at any point in time. Periods of intense competition, which typically include broader coverage terms, lower prices and excess underwriting capacity, are referred to as a “soft"soft market.”" A favorable insurance market is commonly referred to as a “hard market”"hard market" and is characterized by stricter coverage terms, higher prices and lower underwriting capacity. During soft markets, unfavorable conditions exist due in part to what many perceive to beas excessive amounts of capital in the industry. In an attempt to use their capital, many insurance companies seek to write additional premiums without appropriate regard for ultimate profitability, and standard insurance companies are more willing to write specialty coverages. The opposite is typically true during hard markets.The Insurance Market CycleAfter a decade Historically, the performance of softthe property and casualty reinsurance and insurance industries has tended to fluctuate in cyclical periods of price competition and excess underwriting capacity, followed by periods of high premium rates and shortages of underwriting capacity. This cyclical market conditions,pattern can be more pronounced in the specialty insurance industryand reinsurance markets in which we compete than the standard insurance market.We have experienced favorable conditions beginning in late 2000, which continued through 2003 for most product lines. During 2004, the market began to soften and the industry began to show signs of increased competition. Since 2005, we have been in a soft insurance market and have experienced intense competition. During the current soft market cycle, we have experiencedconditions including price deterioration in virtually all of our product areas duelines since the mid-2000s. During 2011, unfavorable pricing trends continued for some of our product lines; however, price declines stabilized for most of our product lines, and we achieved moderate price increases in partseveral lines. During 2012 and 2013, we have generally seen low to an increased presence of standard insurance companiesmid-single digit favorable rate changes in our markets. During 2008, given the rapid deterioration in underwriting capacity as a result of the disruptions in the financial markets and losses from catastrophes, the rate of decline in prices began to slow. However, the effects of the economic environment contributed to further declines in gross premium volume in 2009 and 2010. Premiums for many of our product lines are based upon our insureds’as market conditions improved and revenues, gross receipts or payroll, which have been negativelyand payrolls of our insureds were favorably impacted by improving economic conditions; however, during the depressed levelsfourth quarter of business activity in recent years. In 2010,2013, we continuedbegan to experience pricing pressure due in part to intense competition, which resulted in further price deterioration across many ofsoftening prices on our catastrophe exposed property product lines most notablyand in our professional and products liability programs within the Excess and Surplus Lines segment. However, we experienced moderate price increases in severalreinsurance book. Despite stabilization of prices on certain product lines during 2010,the most notably those offered by Markel International.have pursuedwill continue to pursue price increases for most product lines in many product areas; however, as a result of continued soft insurance market conditions, our targeted price increases have been met with resistance in the marketplace, particularly within the Excess and Surplus Lines segment. In general, we believe prevailing rates within the property and casualty insurance marketplace are lower than our targeted pricing levels. When2014, when possible. However, when we believe the prevailing market price will not support our underwriting profit targets, the business is not written. As a result of our underwriting discipline, gross premium volume for many ofmay vary when we alter our product lines, most notably within the Excess and Surplus Lines segment, has declined and, if the competitive environment does notofferings to maintain or improve could decline further in the future.14 |4
To facilitate this strategy, we have a product line leadership group that has primary responsibility for both developing and maintaining underwriting and pricing guidelines on our existing products and new product development. The product line leadership group is under the direction of our Chief Underwriting Officer.
is comprised of all of the active property and casualty underwriting operations of the former Alterra companies.
| 15
Alterra previously offered life and annuity reinsurance products. In 2010, Alterra ceased writing life and annuity reinsurance contracts and placed this business into run-off. Results attributable to the run-off of life and annuity reinsurance business are included in our Other Insurance (Discontinued Lines) segment.
BUSINESS OVERVIEW (continued)
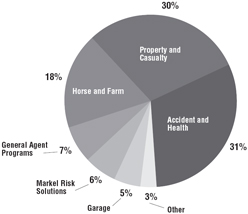
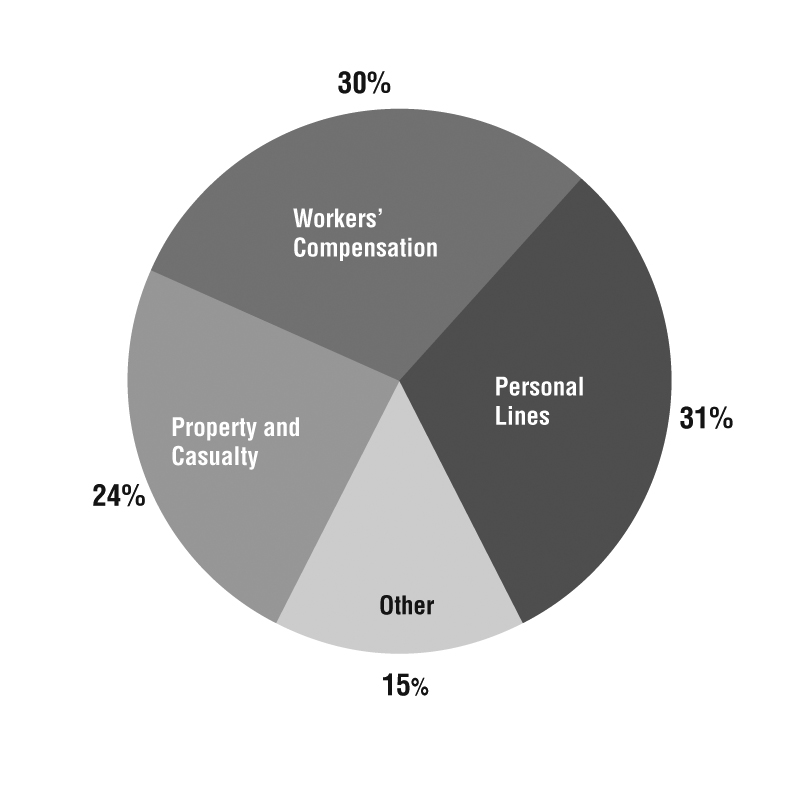
2010 CONSOLIDATED GROSS PREMIUM VOLUME ($2.0 billion) Consolidated Gross Premium Volume (

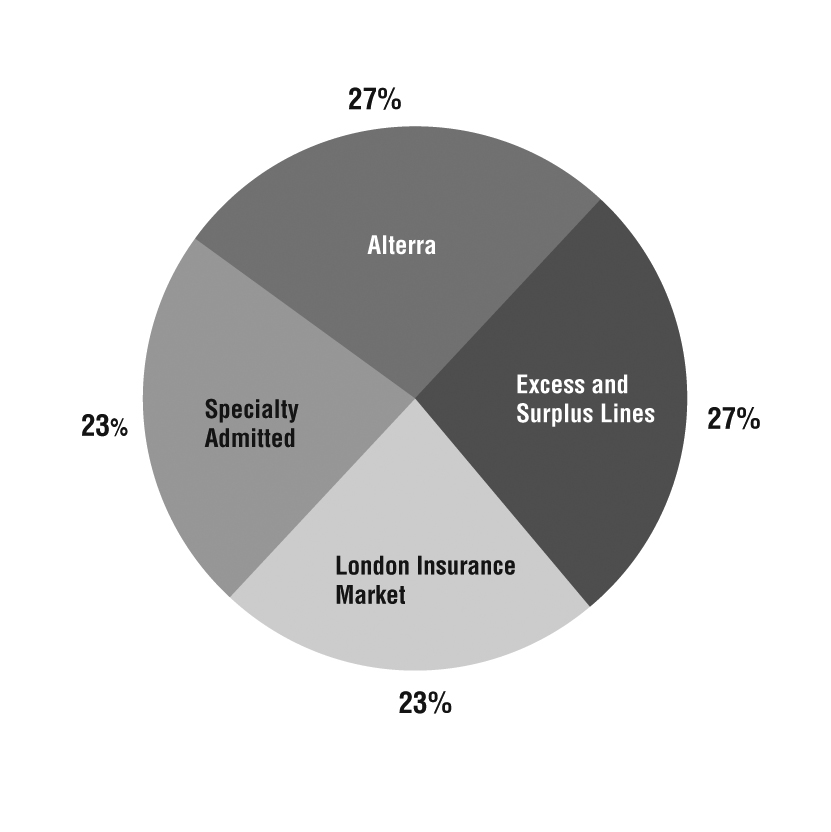
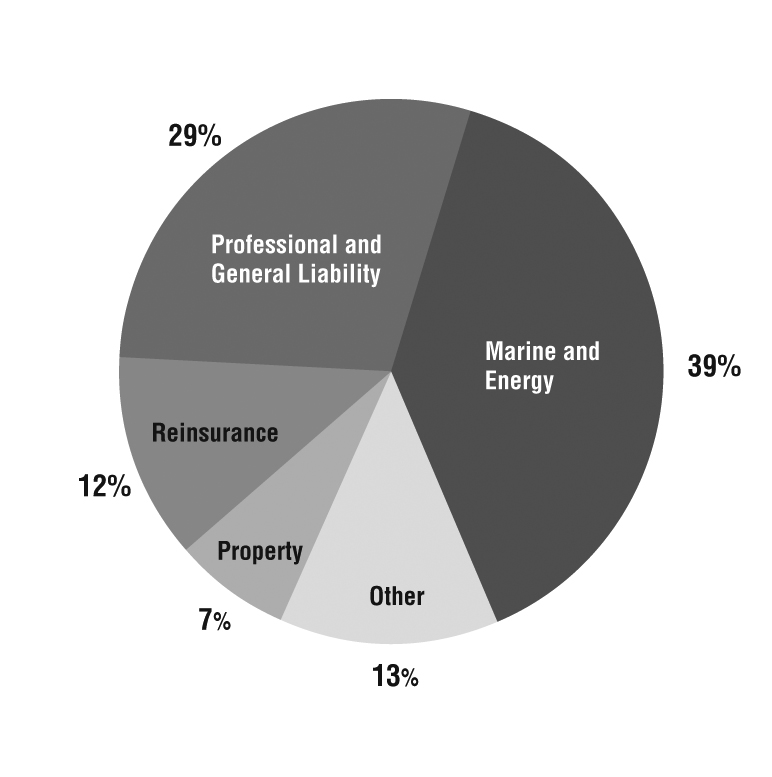
$3.9 billion)
Our Excess
the standard market.
TheEvanston.
Markel Northeast (Red Bank, NJ)
Markel Southeast (Glen Allen, VA)
Markel Midwest (Deerfield, IL)
Markel Mid South (Plano, TX)
Markel West (Woodland Hills, CA and Scottsdale, AZ)
We also have a product line leadership group that has primary responsibility both for developing and maintaining underwriting and pricing guidelines on our existing products and for new product development. The product line leadership group also delegates underwriting authority to the regional underwriters to ensure that the products needed by our customers are available through the regional offices and provides underwriting training and development so that our regional underwriting teams have the expertise to underwrite the risk or to refer risks to our product line experts as needed. The product line leadership group is under the direction of our Chief Underwriting Officer, who also is ultimately responsible for the underwriting activities of our Specialty Admitted and London Insurance Market segments.
16 |
Product offerings within the Excess and Surplus Lines segment include:
Property and Casualty
Professional Liability
Excess and Umbrella
Environmental
Transportation
Inland Marine
Ocean Marine
Miscellaneous Coverages
These product offerings are generally available in all of the regional offices included in the Excess and Surplus Lines segment.
EXCESSAND SURPLUS LINES SEGMENT
2010 GROSS PREMIUM VOLUME ($898MILLION)

Our property and casualty product offerings include a variety of liability coverages focusing on light-to-medium casualty exposures such as restaurants and bars, child and adult care facilities, vacant properties, builder’s risk, general or artisan contractors and office buildings. In addition, we offer third party protection on either an occurrence or claims-made basis to manufacturers, distributors, importers and re-packagers of manufactured products. We also provide property coverages for similar classes of business ranging from small, single-location accounts to large, multi-state, multi-location accounts. Property coverages consist principally of fire, allied lines (including windstorm, hail and water damage) and other specialized property coverages, including catastrophe-exposed property risks such as earthquake and wind on both a primary and excess basis. Catastrophe-exposed property risks are typically larger and are lower frequency and higher severity in nature than more standard property risks.
| 17
Markel Corporation & Subsidiaries
BUSINESS OVERVIEW (continued)
Our professional liabilityproperty risks range from small, single-location accounts to large, multi-state, multi-location accounts. Casualty product offerings include a variety of primary liability coverages targeting apartments and office buildings, retail stores, contractors and recreational and hospitality businesses. We also offer products liability coverages on either an occurrence or claims-made basis to manufacturers, distributors, importers and re-packagers of manufactured products.
We offer
Our environmental product offerings target small to mid-sized environmental contractors and provide a complete array of environmental coverages, including environmental consultants’consultants' professional liability, contractors’contractors' pollution liability and site specific environmental impairment liability. The professional liability cover is offered on a claims-made basis and targets risks inherent in the businesses of environmental consultants and engineers. The contractors’ pollution liability cover is offered on either a claims-made or occurrence basis and protects environmental contractors, trade contractors and general contractors. Thesite-specific environmental impairment liability cover is offered on a claims-made basis and protects commercial, industrial, environmental, habitational and institutional facilities against pollution to their premises.
Our transportation product offerings includecoverages;
Our industry;
18 |
Our builder's risk coverage;
Miscellaneous coverages offered include cargo;
In the Specialty Admitted market, we wrote business through the following underwriting units during 2010:
Markel Specialty (Glen Allen, VA)
Markel American Specialty Personal and Commercial Lines (Pewaukee, WI)
FirstComp (Omaha, NE)
SPECIALTY ADMITTED SEGMENT
2010 GROSS PREMIUM VOLUME ($375MILLION)

| 19
Markel Corporation & Subsidiaries
BUSINESS OVERVIEW (continued)
Markel Specialty.The Markel Specialty unit focuses on providing total insurance programs for businesses engaged in highly specialized activities. These activities typically do not fit the risk profiles of standard insurers and make complete coverage difficult to obtain from a single insurer.
The Markel Specialty unitsegment is organized into product areas that concentrate on particular markets and customer groups. The property and casualty division writes commercial coverages for youth and recreation oriented organizations, such as children’s camps, conference centers, YMCAs, YWCAs, Boys and Girls Clubs, child care centers, nursery schools, private and Montessori schools and gymnastics, martial arts and dance schools. This division also writes commercial coverages for social service organizations, museums and historic homes, performing arts organizations, bed and breakfast inns, outfitters and guides, hunting and fishing lodges, dude ranches and rod and gun clubs. The horse and farm operations specialize in insurance coverages for equine-related risks, such as horse mortality, theft, infertility, transit and specified perils. We also provide property and liability coverages for farms and boarding, breeding and training facilities. The accident and health division writes liability and accident insurance for amateur sports organizations, accident and medical insurance for colleges, universities, public schools and private schools, monoline accident and medical coverage for various niche markets, short-term medical insurance, pet health insurance, stop-loss insurance for self-insured medical plans and medical excess reinsurance coverage. The garage division provides commercial coverages for auto repair garages, gas stations and convenience stores and used car dealers. The general agent programs division develops partnerships with managing general agents to offer single source admitted and non-admitted programs for a specific class or line of business. We seek general agents who utilize retailers as their primary source of distribution. Underwriting, policy issuance and business development authority are delegated to the managing general agent. The Markel Risk Solutions facility works with select retail producers on a national basis to provide admitted market solutions to accounts having difficulty finding coverage in the standard marketplace. Accounts of various classes and sizes are written with emphasis placed on individual risk underwriting and pricing.
The majority of Markel Specialty business is produced by retail insurance agents. Management grantsagents who have very limited underwriting authority to a fewauthority. Agents are carefully selected agents and controls agency business is controlled through regular audits and pre-approvals.pre- approvals. Certain products and programs are also marketed directly to consumers or distributed through wholesale producers. Markel Specialty business is primarily written on Markel Insurance Company (MIC). MIC is domiciledPersonal lines coverages included in Illinois and is licensed to write P&C insurance in all 50 states and the District of Columbia.
MARKEL SPECIALTY
2010 GROSS PREMIUM VOLUME ($230MILLION)
20 |
Markel American Specialty Personal and Commercial Lines.The Markel American Specialty Personal and Commercial Lines unit offers its insurance products in niche markets and focuses its underwriting on marine, recreational vehicle, property and other personal and commercial line coverages. The marine division markets personal lines insurance coverage for watercraft, older boats, high performance boats and yachts. The marine division also provides coverage for small fishing ventures, charters, utility boats and boat rentals. The recreational vehicle division provides coverage for motorcycles, snowmobiles and ATVs. The property division provides coverage for mobile homes, dwellings and homeowners that do not qualify for standard homeowners coverage, as well as contents coverage for renters. Mobile home coverages include primary, seasonal and rental mobile homes. Coverage is offered for motor homes, as well as motor home rental operations. Commercial coverages include specialty insurance products, most notably professional liability coverages that we design and administer on behalf of other insurance carriers and ultimately assume on a reinsurance basis. Other products offered by this unit include special event protection, which provides for cancellation and/or liability coverage for weddings, anniversary celebrations and other personal events; supplemental natural disaster coverage, which offers additional living expense protection for loss due to specific named perils including flood; renters’ protection coverage, which provides tenant homeowner’s coverage on a broader form than the standard renter’s policy; excess flood coverage, which provides coverage above the National Flood Insurance Program limits; and collector vehicle coverage, which provides comprehensive coverage for a variety of collector vehicles including antique autos and motorcycles.
Markel American Specialty Personal and Commercial Lines products are characterized by high numbers of transactions, low average premiums and creative solutions for under-served and emerging markets. The unit distributes its marine, property and other products through wholesale or specialty retail producers. The recreational vehicle program and some marine productssegment are marketed directly to the consumer using direct mail, internet and telephone promotions, as well as relationships with various motorcycle and boat manufacturers, dealers and associations.
MARKEL AMERICAN SPECIALTY PERSONALAND COMMERCIAL LINES
2010 GROSS PREMIUM VOLUME ($104MILLION)

| 21
Markel Corporation & Subsidiaries
BUSINESS OVERVIEW (continued)
FirstComp.On October 15, 2010, we completed our acquisition of Aspen Holdings, Inc., a Nebraska-based privately held corporation whose FirstComp MAIC is also licensed to write property and casualty insurance group provides workers’in Puerto Rico. Essentia is also licensed in the U.S. Virgin Islands and specializes in coverage for classic cars and boats. FCIC is currently licensed in 28 states and specializes in workers' compensation insurance and related services, principally to small businesses, in 31 states. The majority of FirstComp business is produced by retail insurance agents. FirstComp business produced for our benefit is written on FirstComp Insurance Company, which is domiciled in Nebraska, or MIC. FirstComp also produces business for unaffiliated insurance companies through FirstComp Underwriters Group, Inc. and FirstComp Insurance Agency, Inc., which act as managing general agents. FirstComp has distribution relationships with more than 8,000 independent insurance agencies. These agencies are generally located in small towns and have been underserved by other market participants because of their size. For expense efficiency reasons, carriers often will not do business with agencies that do not have large books of business. Utilizing its proprietary technology platform, FirstComp is able to service these small agencies in a cost-efficient manner.
The FirstComp operations collectively produced approximately $290 million of gross written premiums in 2010. During 2010, thecoverage.
London Insurance Market Segment
Our London Insurance Market segment reported gross premium volume of $709.0
2010 GROSS PREMIUM VOLUME ($709MILLION.

This
22 |
Markel International.Markel International is comprised of the following underwriting divisions which, to better serve the needs of our customers, have the ability to write business through either MIICL or Markel Syndicate 3000:3000.
Non-Marine Property
Professional and Financial Risks
Retail
Specialty
Equine
Trade Credit
Elliott Special Risks (ESR)
The
The Non-Marine Property division writes
The Professional and Financial Risks division underwrites professional indemnity, directors’ and officers’ liability, intellectualWe also provide property some miscellaneous defense costs, incidental commercial crime and general liability coverages. The professional indemnity account offers unique solutions in four main professional classes including miscellaneous professionals and consultants, construction professionals, financial service professionals and professional practices. The miscellaneous professionals and consultants class includes coverages for a wide range of professionals including management consultants, publishers, broadcasters, pension trustees and public officials. The construction class includes coverages for surveyors, engineers, architects and estate agents. The financial services class includes coverages for insurance brokers, insurance agents, financial consultants, stockbrokers, fund managers, venture capitalists and bankers. The professional practices class includes coverages for accountants and solicitors. The directors’ and officers’ liability account offers coverage to public, private and non-profit companies of all sizes on either an individual or blanket basis. The Professional and Financial Risks division writes business on a worldwide basis, limiting exposure in the United States.
The Retail division offers a full range of professional liability products, including professional indemnity, directors’ and officers’ liability and employment practices liability, through six branch offices in England and one branch office in Scotland. In addition, coverage is provided for small to
| 23
Markel Corporation & Subsidiaries
BUSINESS OVERVIEW (continued)
medium-sized commercial property risks on both a stand-alone and package basis. Thebasis through our branch offices provide insureds and brokers with direct access to decision-making underwriters who possess specialized knowledge of their local markets. The division also underwrites certain niche liability products such as coverages for social welfare organizations.
The Specialty division provides property treaty reinsurance on an excess of loss and proportional basis for per risk and catastrophe exposures. A significant portion ofoffices.
The Equine division writes bloodstock, livestockindemnity;
The Trade Credit division writes parks;
ESR underwrites a diverse portfolio of property and casualty coverages for Canadian domiciled insureds. ESR provides primary general liability,
excess product recall insurance. These products are underwritten on an individual risk basis.
unit offers property and casualty quota share and excess of loss reinsurance through Alterra Re USA, Alterra at Lloyd's, Markel Europe, Markel Bermuda and Markel Brazil to insurance and reinsurance companies worldwide. Alterra Re USA is licensed or accredited to provide reinsurance in all 50 states and the District of Columbia. We typically write our reinsurance products in the Alterra segment in the form of treaty reinsurance contracts, on both a quota share and excess of loss basis. Our reinsurance products may include features such as contractual provisions that require our cedent to share in a portion of losses resulting from ceded risks, may require payment of additional premium amounts if we incur greater losses than those projected at the time of the execution of the contract, may require reinstatement premium to restore the coverage after there has been a loss occurrence or may provide for experience refunds if the losses we incur are less than those projected at the time the contract is executed. Reinsurance products offered include agriculture, auto, credit and surety, general casualty, marine and energy, professional liability, property and workers' compensation.
The ceding of insurance does
24 |
Standard & Poor’sPoor's (S&P) rating of “A”"A" (excellent) or better; (ii) maintain minimum capital and surplus of $500 million and (iii) provide collateral for recoverables in excess of an individually established amount. In addition, certain foreign reinsurers for our United States insurance operations must provide collateral equal to 100% of recoverables, with the exception of reinsurers who have been granted authorized status by an insurance company’scompany's state of domicile. Lloyd’sLloyd's syndicates generally must have a minimum of a “B”"B" rating from Moody’sMoody's Investors Service (Moody’s)(Moody's) to be our reinsurers.
Over time, we will attempt to bring the reinsurance programs used within the Alterra segment into compliance with our internal ceded reinsurance guidelines.
Reinsurers | A.M. Best Rating | Reinsurance Recoverable | ||||
| (dollars in thousands) | ||||||
Munich Re Group | A+ | $ | 167,148 | |||
Lloyd’s of London | A | 131,960 | ||||
Fairfax Financial Group | A | 89,166 | ||||
XL Capital Group | A | 60,484 | ||||
Swiss Re Group | A | 55,292 | ||||
Ace Group | A+ | 51,577 | ||||
W.R. Berkley Group | A+ | 36,669 | ||||
HDI Group | A | 35,299 | ||||
Aspen (Bermuda) Group | A | 33,301 | ||||
White Mountains Insurance Group | A- | 31,607 | ||||
Reinsurance recoverable on paid and unpaid losses for ten largest reinsurers | 692,503 | |||||
Total reinsurance recoverable on paid and unpaid losses | $ | 1,023,848 | ||||
| Reinsurers | A.M. Best Rating | Reinsurance Recoverable | |||
(dollars in thousands) | |||||
| Fairfax Financial Group | A | $ | 212,591 | ||
| Munich Re Group | A+ | 186,457 | |||
| Lloyd's of London | A | 159,342 | |||
| AXIS Capital Holdings Limited | A | 143,949 | |||
| Alleghany Corporation | A | 117,729 | |||
| Platinum Underwriters Holdings Ltd | A | 106,397 | |||
| Partner Re Group | A+ | 105,627 | |||
| Swiss Re Group | A+ | 83,562 | |||
| XL Capital Group | A | 81,844 | |||
| Arch Insurance Group | A+ | 72,320 | |||
| Reinsurance recoverable on paid and unpaid losses for ten largest reinsurers | 1,269,818 | ||||
| Total reinsurance recoverable on paid and unpaid losses | $ | 2,032,626 | |||
| 25
Markel Corporation & Subsidiaries
BUSINESS OVERVIEW (continued)
Investments
Total
ANNUAL TAXABLE EQUIVALENT TOTAL INVESTMENT RETURNS
| Years Ended December 31, | Weighted Average Five-Year Annual Return | Weighted Average Ten-Year Annual Return | ||||||||||||||||||||||||||
| 2006 | 2007 | 2008 | 2009 | 2010 | ||||||||||||||||||||||||
Equities | 25.9 | % | (0.4 | %) | (34.0 | %) | 25.7 | % | 20.8 | % | 6.2 | % | 7.6 | % | ||||||||||||||
Fixed maturities(1) | 5.2 | % | 5.6 | % | 0.2 | % | 9.8 | % | 5.4 | % | 5.3 | % | 5.5 | % | ||||||||||||||
Total portfolio, before foreign currency effect | 9.6 | % | 4.1 | % | (6.9 | %) | 11.7 | % | 8.1 | % | 5.3 | % | 5.7 | % | ||||||||||||||
Total portfolio | 11.2 | % | 4.8 | % | (9.6 | %) | 13.2 | % | 7.9 | % | 5.4 | % | 6.0 | % | ||||||||||||||
Invested assets, end of year (in millions) | $ | 7,524 | $ | 7,775 | $ | 6,893 | $ | 7,849 | $ | 8,224 | ||||||||||||||||||
|
Equivalent Total Investment Returns
Weighted Average Five-Year Annual Return | Weighted Average Ten-Year Annual Return | ||||||||||||||||||||||||
| Years Ended December 31, | |||||||||||||||||||||||||
| 2013 | 2012 | 2011 | 2010 | 2009 | |||||||||||||||||||||
| Equities | 33.3 | % | 19.6 | % | 3.8 | % | 20.8 | % | 25.7 | % | 21.6 | % | 12.4 | % | |||||||||||
| Fixed maturities | 0.0 | % | 5.1 | % | 7.6 | % | 5.4 | % | 9.8 | % | 4.9 | % | 4.4 | % | |||||||||||
| Total portfolio, before foreign currency effect | 6.9 | % | 8.6 | % | 6.7 | % | 8.1 | % | 11.7 | % | 8.2 | % | 6.0 | % | |||||||||||
| Total portfolio | 6.8 | % | 9.0 | % | 6.5 | % | 7.9 | % | 13.2 | % | 8.4 | % | 6.0 | % | |||||||||||
| Invested assets, end of year (in millions) | $ | 17,612 | $ | 9,333 | $ | 8,728 | $ | 8,224 | $ | 7,849 | |||||||||||||||
26 |
is regarded by S&P as having predominantly speculative characteristics with respect to capacity to pay interest and repay principal. Moody’sMoody's ratings range from “Aaa”"Aaa" to “C”"C" with ratings of “Baa”"Baa" or higher considered investment grade.
2013

Non-Insurance Operations (Markel Ventures)
| 27
Markel Corporation & Subsidiaries
BUSINESS OVERVIEW (continued)
In December 2010, we acquired controlling interests in RD Holdings, LLC (RetailData), a company that provides retail intelligence services,
Markel Ventures operations.

28 |
years as of December 31.
The jurisdictions of our principal insurance subsidiaries are the United States, the United Kingdom and Bermuda.
As an
Additional requirements include group-level reporting, submission of an annual enterprise risk report by a regulated insurance company's ultimate controlling person and information regarding an insurer's non-insurer's affiliates.
| 29
MIICL must also provide 14 days advance written notice to the PRA of any transaction or proposed transaction with a connected or related person.
BUSINESS OVERVIEW (continued)
Bermuda is regulated by the BMA under the Insurance Act 1978 of Bermuda and its related regulations (Bermuda Insurance Act). The Bermuda Insurance Act imposes solvency and liquidity standards and auditing and reporting requirements on Markel Bermuda and grants to the BMA powers to supervise, investigate and intervene in the affairs of Bermuda insurance and reinsurance companies.
Six
In addition to Best, seven
Our Lloyd's syndicates are part of a group rating for the Lloyd's overall market, which has been assigned an FSR of "A+" (strong) by Fitch.
30 |
changes in operations,
emerging economic and social trends,
uncertainties relating to asbestos and environmental exposures,
inflation or deflation, and
changes in the regulatory and litigation environments.
earnings, which may be material.
| 31
Markel Corporation & Subsidiaries
BUSINESS OVERVIEW (continued)
32 |
| 33
Markel Corporation & Subsidiaries
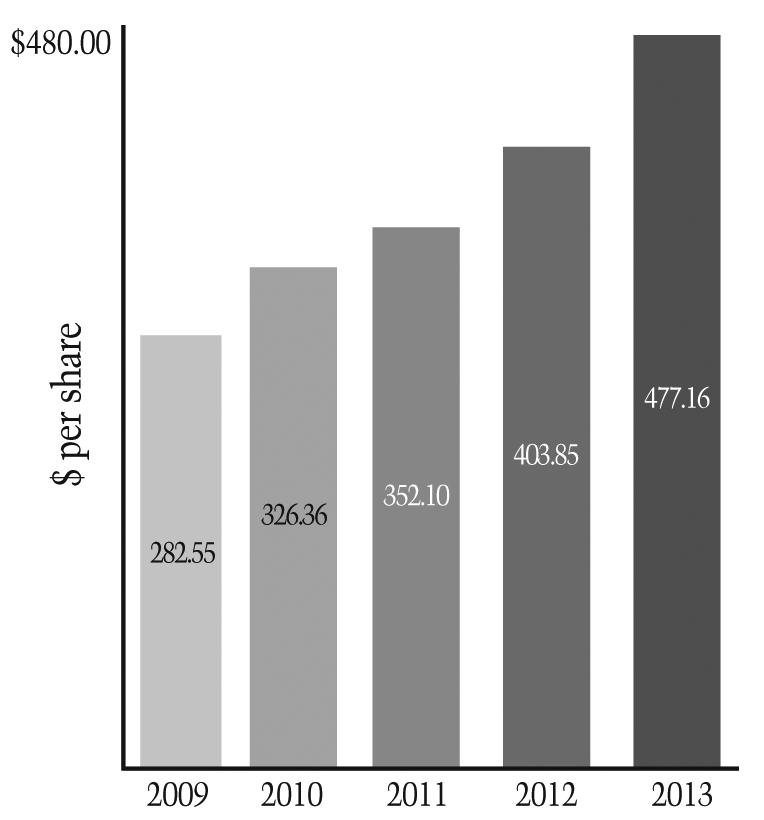
RESULTSOF OPERATIONS Earned premiums Net investment income Total operating revenues Net income (loss) to shareholders Comprehensive income (loss) to shareholders Diluted net income (loss) per share FINANCIAL POSITION Total investments and cash and cash equivalents Total assets Unpaid losses and loss adjustment expenses Convertible notes payable Senior long-term debt and other debt 8.71% Junior Subordinated Debentures Shareholders’ equity Common shares outstanding (at year end, in thousands) OPERATING DATA Book value per common share outstanding Growth (decline) in book value per share 5-Year CAGR in book value per share(2) Closing stock price RATIO ANALYSIS U.S. GAAP combined ratio(3) Investment yield(4) Taxable equivalent total investment return(5) Investment leverage(6) Debt to total capital Reflects the acquisition of Alterra Capital Holdings Limited effective May 1, 2013, which included the issuance of equity totaling $2.3 billion. CAGR—compound annual growth rate. The U.S. GAAP combined ratio measures the relationship of incurred losses, loss adjustment expenses and underwriting, acquisition and insurance expenses to earned premiums. Investment yield reflects net investment income as a percentage of monthly average invested Investment leverage represents total invested assets divided by SELECTED FINANCIAL DATA(dollars in millions, except per share data) 2010 2009 2008 $ 1,731 $ 1,816 $ 2,022 273 260 282 2,225 2,069 1,977 267 202 (59 ) 431 591 (403 ) $ 27.27 $ 20.52 $ (5.95 ) $ 8,224 $ 7,849 $ 6,893 10,826 10,242 9,512 5,398 5,427 5,492 — — — 1,016 964 694 — — — 3,172 2,774 2,181 9,718 9,819 9,814 OPERATING PERFORMANCE MEASURES(1) $ 326.36 $ 282.55 $ 222.20 16 % 27 % (16 %) 13 % 11 % 10 % $ 378.13 $ 340.00 $ 299.00 97 % 95 % 99 % 4 % 4 % 4 % 8 % 13 % (10 %) 2.6 2.8 3.2 24 % 26 % 24 % 2013 2012 2011 Results of Operations Earned premiums $ 3,232 $ 2,147 $ 1,979 Net investment income 317 282 264 Total operating revenues 4,323 3,000 2,630 Net income (loss) to shareholders 281 253 142 Comprehensive income (loss) to shareholders 459 504 252 Diluted net income (loss) per share $ 22.48 $ 25.89 $ 14.60 Financial Position Total investments, cash and cash equivalents and restricted cash and cash equivalents (invested assets) $ 17,612 $ 9,333 $ 8,728 Total assets 23,956 12,557 11,532 Unpaid losses and loss adjustment expenses 10,262 5,371 5,399 Senior long-term debt and other debt 2,256 1,493 1,294 Shareholders' equity 6,674 3,889 3,388 Common shares outstanding (at year end, in thousands) 13,986 9,629 9,621 OPERATING PERFORMANCE MEASURES (1, 2, 3) Operating Data Book value per common share outstanding $ 477.16 $ 403.85 $ 352.10 Growth (decline) in book value per share 18 % 15 % 8 % 5-Year CAGR in book value per share (4)17 % 9 % 9 % Closing stock price $ 580.35 $ 433.42 $ 414.67 Ratio Analysis U.S. GAAP combined ratio (5)97 % 97 % 102 % Investment yield (6)3 % 4 % 4 % Taxable equivalent total investment return (7)7 % 9 % 7 % Investment leverage (8)2.6 2.4 2.6 Debt to capital 25 % 28 % 28 % (1)(2)Effective January 1, 2012, we prospectively adopted Financial Accounting Standards Board Accounting Standards Update No. 2010-26, Accounting for Costs Associated with Acquiring or Renewing Insurance Contracts.(3)Operating Performance Measures provide a basis for management to evaluate our performance. The method we use to compute these measures may differ from the methods used by other companies. See further discussion of management’smanagement's evaluation of these measures in Management’sManagement's Discussion & Analysis of Financial Condition and Results of Operations.(2)(4)(3)(5)34 |2007 2006 2005 2004 2003 2002 2001 10-Year
CAGR (2) $ 2,117 $ 2,184 $ 1,938 $ 2,054 $ 1,864 $ 1,549 $ 1,207 6 % 305 269 242 204 183 170 171 6 % 2,551 2,576 2,200 2,262 2,092 1,770 1,397 7 % 406 393 148 165 123 75 (126 ) — 337 551 64 273 222 73 (77 ) — $ 40.64 $ 39.40 $ 14.80 $ 16.41 $ 12.31 $ 7.53 $ (14.73 ) — $ 7,775 $ 7,524 $ 6,588 $ 6,317 $ 5,350 $ 4,314 $ 3,591 10 % 10,164 10,117 9,814 9,398 8,532 7,409 6,441 7 % 5,526 5,584 5,864 5,482 4,930 4,367 3,700 6 % — — 99 95 91 86 116 — 691 760 609 610 522 404 265 — — 106 141 150 150 150 150 — 2,641 2,296 1,705 1,657 1,382 1,159 1,085 15 % 9,957 9,994 9,799 9,847 9,847 9,832 9,820 — $ 265.26 $ 229.78 $ 174.04 $ 168.22 $ 140.38 $ 117.89 $ 110.50 12 % 15 % 32 % 3 % 20 % 19 % 7 % 8 % — 18 % 16 % 11 % 20 % 13 % 13 % 18 % — $ 491.10 $ 480.10 $ 317.05 $ 364.00 $ 253.51 $ 205.50 $ 179.65 — 88 % 87 % 101 % 96 % 99 % 103 % 124 % — 4 % 4 % 4 % 4 % 4 % 4 % 5 % — 5 % 11 % 2 % 8 % 11 % 8 % 8 % — 2.9 3.3 3.9 3.8 3.9 3.7 3.3 — 21 % 27 % 33 % 34 % 36 % 36 % 33 % — (4)(6)assets.(5)(7)TaxableSee "Investing Results" in Management's Discussion & Analysis of Financial Condition and Results of Operations for detail regarding the calculation of taxable equivalent total investment return includes net investment income, realized investment gains or losses, the change in fair value of the investment portfolio and the effect of foreign currency exchange rate movements during the period as a percentage of average invested assets. Tax-exempt interest and dividend payments are grossed up using the U.S. corporate tax rate to reflect an equivalent taxable yield.(6)(8)shareholders’shareholders' equity.
| 35
Markel Corporation & Subsidiaries
ASSETS Investments, available-for-sale, at estimated fair value: Fixed maturities (amortized cost of $5,256,980 in 2010 and $4,961,745 in 2009) Equity securities (cost of $996,088 in 2010 and $843,841 in 2009) Short-term investments (estimated fair value approximates cost) Investments in affiliates TOTAL INVESTMENTS Cash and cash equivalents Receivables Reinsurance recoverable on unpaid losses Reinsurance recoverable on paid losses Deferred policy acquisition costs Prepaid reinsurance premiums Goodwill and intangible assets Other assets TOTAL ASSETS LIABILITIESAND EQUITY Unpaid losses and loss adjustment expenses Unearned premiums Payables to insurance companies Senior long-term debt and other debt (estimated fair value of $1,086,000 in 2010 and $1,011,000 in 2009) Other liabilities TOTAL LIABILITIES Commitments and contingencies Shareholders’ equity: Common stock Retained earnings Accumulated other comprehensive income TOTAL SHAREHOLDERS’ EQUITY Noncontrolling interests TOTAL EQUITY TOTAL LIABILITIES AND EQUITY2010 2009 2008 2007 2006 2005 2004 5-Year CAGR (3) 10-Year CAGR (3) $ 1,731 $ 1,816 $ 2,022 $ 2,117 $ 2,184 $ 1,938 $ 2,054 10 % 6 % 273 260 282 305 269 242 204 2 % 6 % 2,225 2,069 1,977 2,551 2,576 2,200 2,262 17 % 8 % 267 202 (59 ) 406 393 148 165 — — 431 591 (403 ) 337 551 64 273 — — $ 27.27 $ 20.52 $ (5.95 ) $ 40.64 $ 39.40 $ 14.80 $ 16.41 — — $ 8,224 $ 7,849 $ 6,893 $ 7,775 $ 7,524 $ 6,588 $ 6,317 21 % 13 % 10,826 10,242 9,512 10,164 10,117 9,814 9,398 20 % 11 % 5,398 5,427 5,492 5,526 5,584 5,864 5,482 13 % 8 % 1,016 964 694 691 866 849 855 — — 3,172 2,774 2,181 2,641 2,296 1,705 1,657 25 % 17 % 9,718 9,819 9,814 9,957 9,994 9,799 9,847 — — $ 326.36 $ 282.55 $ 222.20 $ 265.26 $ 229.78 $ 174.04 $ 168.22 17 % 13 % 16 % 27 % (16 )% 15 % 32 % 3 % 20 % — — 13 % 11 % 10 % 18 % 16 % 11 % 20 % — — $ 378.13 $ 340.00 $ 299.00 $ 491.10 $ 480.10 $ 317.05 $ 364.00 — — 97 % 95 % 99 % 88 % 87 % 101 % 96 % — — 4 % 4 % 4 % 4 % 4 % 4 % 4 % — — 8 % 13 % (10 )% 5 % 11 % 2 % 8 % — — 2.6 2.8 3.2 2.9 3.3 3.9 3.8 — — 24 % 26 % 24 % 21 % 27 % 33 % 34 % — — 27MARKEL CORPORATION AND SUBSIDIARIESCONSOLIDATED BALANCE SHEETS December 31, 2010 2009 (dollars in thousands) $ 5,431,226 $ 5,112,136 1,721,971 1,349,829 325,340 492,581 — 43,633 7,478,537 6,998,179 745,259 850,494 312,096 279,879 798,090 886,442 70,568 65,703 188,783 156,797 80,293 68,307 645,900 502,833 506,063 433,262 $ 10,825,589 $ 10,241,896 $ 5,398,406 $ 5,427,096 839,537 717,728 50,715 46,853 1,015,947 963,648 333,292 294,857 7,637,897 7,450,182 884,457 872,876 1,735,973 1,514,398 551,093 387,086 3,171,523 2,774,360 16,169 17,354 3,187,692 2,791,714 $ 10,825,589 $ 10,241,896 December 31, 2013 2012 (dollars in thousands) ASSETS Investments, available-for-sale, at estimated fair value: Fixed maturities (amortized cost of $10,129,141 in 2013 and $4,562,278 in 2012) $ 10,142,536 $ 4,979,283 Equity securities (cost of $1,566,553 in 2013 and $1,387,305 in 2012) 3,251,798 2,406,951 Short-term investments (estimated fair value approximates cost) 1,452,288 973,330 Total Investments 14,846,622 8,359,564 Cash and cash equivalents 1,978,526 863,766 Restricted cash and cash equivalents 786,926 109,415 Receivables 1,141,773 413,883 Reinsurance recoverable on unpaid losses 1,854,414 778,774 Reinsurance recoverable on paid losses 102,002 51,145 Deferred policy acquisition costs 260,967 157,465 Prepaid reinsurance premiums 383,559 110,332 Goodwill 967,717 674,930 Intangible assets 565,083 374,295 Other assets 1,067,922 663,019 Total Assets $ 23,955,511 $ 12,556,588 LIABILITIES AND EQUITY Unpaid losses and loss adjustment expenses $ 10,262,056 $ 5,371,426 Life and annuity benefits 1,486,574 — Unearned premiums 2,127,115 1,000,261 Payables to insurance and reinsurance companies 295,496 103,212 Senior long-term debt and other debt (estimated fair value of $2,372,000 in 2013 and $1,688,000 in 2012) 2,256,227 1,492,550 Other liabilities 777,850 613,897 Total Liabilities 17,205,318 8,581,346 Redeemable noncontrolling interests 72,183 86,225 Commitments and contingencies Shareholders' equity: Common stock 3,288,863 908,980 Retained earnings 2,294,909 2,068,340 Accumulated other comprehensive income 1,089,805 911,337 Total Shareholders' Equity 6,673,577 3,888,657 Noncontrolling interests 4,433 360 Total Equity 6,678,010 3,889,017 Total Liabilities and Equity $ 23,955,511 $ 12,556,588 See accompanying notes to consolidated financial statements.36 |28
Earned premiums Net investment income Net realized investment gains (losses): Other-than-temporary impairment losses Other-than-temporary impairment losses recognized in other comprehensive income (loss) Other-than-temporary impairment losses recognized in net income (loss) Net realized investment gains (losses), excluding other-than-temporary impairment losses Net realized investment gains (losses) Other revenues TOTAL OPERATING REVENUES OPERATING EXPENSES Losses and loss adjustment expenses Underwriting, acquisition and insurance expenses Amortization of intangible assets Other expenses TOTAL OPERATING EXPENSES OPERATING INCOME (LOSS) Interest expense INCOME (LOSS) BEFORE INCOME TAXES Income tax expense (benefit) NET INCOME (LOSS) Net income attributable to noncontrolling interests NET INCOME (LOSS)TO SHAREHOLDERS OTHER COMPREHENSIVE INCOME (LOSS) Change in net unrealized gains on investments, net of taxes: Net holding gains (losses) arising during the period Unrealized other-than-temporary impairment losses on fixed maturities arising during the period Reclassification adjustments for net gains (losses) included in net income (loss) Change in net unrealized gains on investments, net of taxes Change in foreign currency translation adjustments, net of taxes Change in net actuarial pension loss, net of taxes TOTAL OTHER COMPREHENSIVE INCOME (LOSS) COMPREHENSIVE INCOME (LOSS) Comprehensive income attributable to noncontrolling interests COMPREHENSIVE INCOME (LOSS)TO SHAREHOLDERS NET INCOME (LOSS) PER SHARE Basic DilutedMARKEL CORPORATION AND SUBSIDIARIESCONSOLIDATED STATEMENTS OF OPERATIONSINCOME AND COMPREHENSIVE INCOME (LOSS) Years Ended December 31, 2010 2009 2008 (dollars in thousands, except per share data) OPERATING REVENUES $ 1,730,921 $ 1,815,835 $ 2,022,184 272,530 259,809 282,148 (11,644 ) (95,570 ) (339,164 ) (563 ) 5,620 — (12,207 ) (89,950 ) (339,164 ) 48,569 (6,150 ) (68,430 ) 36,362 (96,100 ) (407,594 ) 185,580 89,782 79,845 2,225,393 2,069,326 1,976,583 946,229 992,863 1,269,025 724,876 736,660 738,546 16,824 6,698 5,742 168,290 80,499 74,889 1,856,219 1,816,720 2,088,202 369,174 252,606 (111,619 ) 73,663 53,969 48,210 295,511 198,637 (159,829 ) 27,782 (3,782 ) (101,395 ) $ 267,729 $ 202,419 $ (58,434 ) 936 781 333 $ 266,793 $ 201,638 $ (58,767 ) $ 195,648 $ 326,959 $ (594,767 ) 672 (5,405 ) — (32,831 ) 52,883 264,898 163,489 374,437 (329,869 ) (2,282 ) 19,239 (7,893 ) 2,749 (4,268 ) (6,740 ) 163,956 389,408 (344,502 ) $ 431,685 $ 591,827 $ (402,936 ) 1,122 832 333 $ 430,563 $ 590,995 $ (403,269 ) $ 27.31 $ 20.54 $ (5.95 ) $ 27.27 $ 20.52 $ (5.95 ) Years Ended December 31, 2013 2012 2011 (dollars in thousands, except per share data) OPERATING REVENUES Earned premiums $ 3,231,616 $ 2,147,128 $ 1,979,340 Net investment income 317,373 282,107 263,676 Net realized investment gains: Other-than-temporary impairment losses (4,706 ) (12,078 ) (14,250 ) Other-than-temporary impairment losses recognized in other comprehensive income — — (5,946 ) Other-than-temporary impairment losses recognized in net income (4,706 ) (12,078 ) (20,196 ) Net realized investment gains, excluding other-than-temporary impairment losses 67,858 43,671 56,053 Net realized investment gains 63,152 31,593 35,857 Other revenues 710,942 539,284 351,077 Total Operating Revenues 4,323,083 3,000,112 2,629,950 OPERATING EXPENSES Losses and loss adjustment expenses 1,816,273 1,154,068 1,209,986 Underwriting, acquisition and insurance expenses 1,312,312 929,472 810,179 Amortization of intangible assets 55,223 33,512 24,291 Other expenses 663,528 478,248 309,046 Total Operating Expenses 3,847,336 2,595,300 2,353,502 Operating Income 475,747 404,812 276,448 Interest expense 114,004 92,762 86,252 Income Before Income Taxes 361,743 312,050 190,196 Income tax expense 77,898 53,802 41,710 Net Income 283,845 258,248 148,486 Net income attributable to noncontrolling interests 2,824 4,863 6,460 Net Income to Shareholders $ 281,021 $ 253,385 $ 142,026 OTHER COMPREHENSIVE INCOME Change in net unrealized gains on investments, net of taxes: Net holding gains arising during the period $ 225,545 $ 266,425 $ 141,839 Change in unrealized other-than-temporary impairment losses on fixed maturities arising during the period (141 ) (160 ) 3,943 Reclassification adjustments for net gains included in net income (40,830 ) (24,051 ) (22,341 ) Change in net unrealized gains on investments, net of taxes 184,574 242,214 123,441 Change in foreign currency translation adjustments, net of taxes (10,143 ) 1,534 (4,191 ) Change in net actuarial pension loss, net of taxes 4,065 6,664 (9,459 ) Total Other Comprehensive Income 178,496 250,412 109,791 Comprehensive Income 462,341 508,660 258,277 Comprehensive income attributable to noncontrolling interests 2,852 4,858 6,424 Comprehensive Income to Shareholders $ 459,489 $ 503,802 $ 251,853 NET INCOME PER SHARE Basic $ 22.57 $ 25.96 $ 14.66 Diluted $ 22.48 $ 25.89 $ 14.60 See accompanying notes to consolidated financial statements.| 3729Markel Corporation & Subsidiaries
January 1, 2008 Net loss Change in net unrealized gains on investments, net of taxes Change in foreign currency translation adjustments, net of taxes Change in net actuarial pension loss, net of taxes Comprehensive loss Issuance of common stock Repurchase of common stock Restricted stock units expensed Other December 31, 2008 Net income Change in net unrealized gains on investments, net of taxes Cumulative effect of adoption of FASB ASC 320-10, net of taxes Change in foreign currency translation adjustments, net of taxes Change in net actuarial pension loss, net of taxes Comprehensive income Issuance of common stock Restricted stock units expensed Acquisitions Other December 31, 2009 Net income Change in net unrealized gains on investments, net of taxes Change in foreign currency translation adjustments, net of taxes Change in net actuarial pension loss, net of taxes Comprehensive income Issuance of common stock Repurchase of common stock Restricted stock units expensed Stock options issued Purchase of noncontrolling interest Other DECEMBER 31, 2010MARKEL CORPORATION AND SUBSIDIARIESCONSOLIDATED STATEMENTS OF CHANGES IN EQUITY Common
Shares Common
Stock Retained
Earnings Accumulated
Other
Comprehensive
Income Total
Shareholders’
Equity Noncontrolling
Interests Total Equity (in thousands) 9,957 $ 866,362 $ 1,417,269 $ 357,531 $ 2,641,162 $ (136 ) $ 2,641,026 — — (58,767 ) — (58,767 ) 333 (58,434 ) — — — (329,869 ) (329,869 ) — (329,869 ) — — — (7,893 ) (7,893 ) — (7,893 ) — — — (6,740 ) (6,740 ) — (6,740 ) (403,269 ) 333 (402,936 ) 10 — — — — — — (153 ) — (60,601 ) — (60,601 ) — (60,601 ) — 2,187 — — 2,187 — 2,187 — 1,195 — — 1,195 64 1,259 9,814 869,744 1,297,901 13,029 2,180,674 261 2,180,935 — — 201,638 — 201,638 781 202,419 — — — 374,437 374,437 — 374,437 — — 15,300 (15,300 ) — — — — — — 19,188 19,188 51 19,239 — — — (4,268 ) (4,268 ) — (4,268 ) 590,995 832 591,827 6 — — — — — — — 2,638 — — 2,638 — 2,638 — — — — — 16,204 16,204 (1 ) 494 (441 ) — 53 57 110 9,819 872,876 1,514,398 387,086 2,774,360 17,354 2,791,714 — — 266,793 — 266,793 936 267,729 — — — 163,489 163,489 — 163,489 — — — (2,468 ) (2,468 ) 186 (2,282 ) — — — 2,749 2,749 — 2,749 430,563 1,122 431,685 32 8,185 — — 8,185 — 8,185 (133 ) — (45,218 ) — (45,218 ) — (45,218 ) — 2,543 — — 2,543 — 2,543 — 9,133 — — 9,133 — 9,133 — (8,345 ) — 237 (8,108 ) (1,557 ) (9,665 ) — 65 — — 65 (750 ) (685 ) 9,718 $ 884,457 $ 1,735,973 $ 551,093 $ 3,171,523 $ 16,169 $ 3,187,692 (in thousands) CommonShares CommonStock RetainedEarnings AccumulatedOtherComprehensiveIncome TotalShareholders'Equity NoncontrollingInterests Total Equity Redeemable Noncontrolling Interests December 31, 2010 9,718 $ 884,457 $ 1,735,973 $ 551,093 $ 3,171,523 $ 871 $ 3,172,394 $ 15,298 Net income (loss) 142,026 — 142,026 (190 ) 141,836 6,650 Other comprehensive income (loss) — 109,827 109,827 — 109,827 (36 ) Comprehensive Income (Loss) 251,853 (190 ) 251,663 6,614 Issuance of common stock 16 1,182 — — 1,182 — 1,182 — Repurchase of common stock (113 ) — (42,913 ) — (42,913 ) — (42,913 ) — Restricted stock awards expensed — 5,818 — — 5,818 — 5,818 — Acquisitions — — — — — — — 62,189 Other — 50 — — 50 (79 ) (29 ) (9,870 ) December 31, 2011 9,621 891,507 1,835,086 660,920 3,387,513 602 3,388,115 74,231 Net income (loss) 253,385 — 253,385 (262 ) 253,123 5,125 Other comprehensive income (loss) — 250,417 250,417 — 250,417 (5 ) Comprehensive Income (Loss) 503,802 (262 ) 503,540 5,120 Issuance of common stock 47 9,145 — — 9,145 — 9,145 — Repurchase of common stock (39 ) — (16,873 ) — (16,873 ) — (16,873 ) — Restricted stock awards expensed — 6,462 — — 6,462 — 6,462 — Acquisitions — — — — — — — 15,055 Adjustment of redeemable noncontrolling interests — — (3,101 ) — (3,101 ) — (3,101 ) 3,101 Purchase of noncontrolling interest — 1,430 — — 1,430 — 1,430 (3,573 ) Other — 436 (157 ) — 279 20 299 (7,709 ) December 31, 2012 9,629 908,980 2,068,340 911,337 3,888,657 360 3,889,017 86,225 Net income (loss) 281,021 — 281,021 (958 ) 280,063 3,782 Other comprehensive income — 178,468 178,468 — 178,468 28 Comprehensive Income (Loss) 459,489 (958 ) 458,531 3,810 Issuance of common stock 71 24,518 — — 24,518 — 24,518 — Repurchase of common stock (109 ) — (57,388 ) — (57,388 ) — (57,388 ) — Restricted stock awards expensed (3 ) 25,239 — — 25,239 — 25,239 — Acquisition of Alterra 4,398 2,330,199 — — 2,330,199 — 2,330,199 — Adjustment of redeemable noncontrolling interests — — 1,963 — 1,963 — 1,963 (1,963 ) Purchase of noncontrolling interest — (136 ) — — (136 ) — (136 ) (11,716 ) Other — 63 973 — 1,036 5,031 6,067 (4,173 ) December 31, 2013 13,986 $ 3,288,863 $ 2,294,909 $ 1,089,805 $ 6,673,577 $ 4,433 $ 6,678,010 $ 72,183 See accompanying notes to consolidated financial statements.38 |30
OPERATING ACTIVITIES Net income (loss) Adjustments to reconcile net income (loss) to net cash provided by operating activities: Deferred income tax expense (benefit) Depreciation and amortization Net realized investment losses (gains) Decrease in receivables Decrease (increase) in deferred policy acquisition costs Increase (decrease) in unpaid losses and loss adjustment expenses, net Increase (decrease) in unearned premiums, net Increase (decrease) in payables to insurance companies Other NET CASH PROVIDEDBY OPERATING ACTIVITIES INVESTING ACTIVITIES Proceeds from sales of fixed maturities and equity securities Proceeds from maturities, calls and prepayments of fixed maturities Cost of fixed maturities and equity securities purchased Net change in short-term investments Cost of investments in affiliates Acquisitions, net of cash acquired Additions to property and equipment Other NET CASH USEDBY INVESTING ACTIVITIES FINANCING ACTIVITIES Additions to senior long-term debt and other debt Repayment and retirement of senior long-term debt and other debt Repurchases of common stock Purchase of noncontrolling interest Other NET CASH PROVIDED (USED)BY FINANCING ACTIVITIES Effect of foreign currency rate changes on cash and cash equivalents Increase (decrease) in cash and cash equivalents Cash and cash equivalents at beginning of year CASHAND CASH EQUIVALENTSAT ENDOF YEARMARKEL CORPORATION AND SUBSIDIARIESCONSOLIDATED STATEMENTS OF CASH FLOWS Years Ended December 31, 2010 2009 2008 (dollars in thousands) $ 267,729 $ 202,419 $ (58,434 ) 7,185 (9,144 ) (100,417 ) 53,587 31,172 31,191 (36,362 ) 96,100 407,594 7,647 21,035 24,829 (13,910 ) 26,958 18,536 (109,371 ) 6,213 235,045 37,799 (91,933 ) (84,244 ) 1,115 (8,260 ) 2,609 7,872 7,903 (79,709 ) 223,291 282,463 397,000 340,546 205,561 683,316 383,618 312,951 404,444 (957,193 ) (726,954 ) (702,292 ) 202,882 23,616 (467,026 ) — — (8,481 ) (214,156 ) (154,920 ) (10,070 ) (42,103 ) (21,906 ) (17,673 ) 3,063 27,943 (34,190 ) (283,343 ) (333,709 ) (151,972 ) 42,897 507,346 102,425 (30,021 ) (255,293 ) (100,190 ) (45,218 ) — (60,601 ) (3,001 ) — — (10,267 ) (441 ) 64 (45,610 ) 251,612 (58,302 ) 427 9,749 (24,387 ) (105,235 ) 210,115 162,339 850,494 640,379 478,040 $ 745,259 $ 850,494 $ 640,379 Years Ended December 31, 2013 2012 2011 (dollars in thousands) OPERATING ACTIVITIES Net income $ 283,845 $ 258,248 $ 148,486 Adjustments to reconcile net income to net cash provided by operating activities: Deferred income tax expense 4,050 37,648 5,649 Depreciation and amortization 190,066 87,326 70,572 Net realized investment gains (63,152 ) (31,593 ) (35,857 ) Decrease (increase) in receivables 142,065 (36,590 ) (10,745 ) Decrease (increase) in deferred policy acquisition costs (103,704 ) 37,209 (5,891 ) Increase (decrease) in unpaid losses and loss adjustment expenses, net 290,130 (28,052 ) 57,000 Decrease in life and annuity benefits (40,235 ) — — Increase in unearned premiums, net 97,249 71,073 59,612 Increase (decrease) in payables to insurance and reinsurance companies (150,764 ) 19,190 (3,665 ) Increase (decrease) in income taxes payable 81,995 (9,909 ) 28,036 Other 13,976 (12,017 ) (1,879 ) Net Cash Provided By Operating Activities 745,521 392,533 311,318 INVESTING ACTIVITIES Proceeds from sales of fixed maturities and equity securities 879,564 336,548 288,046 Proceeds from maturities, calls and prepayments of fixed maturities 1,475,938 510,697 343,502 Cost of fixed maturities and equity securities purchased (1,651,397 ) (426,439 ) (713,102 ) Net change in short-term investments (470,423 ) (428,292 ) (216,972 ) Proceeds from sales of equity method investments 313,557 — — Cost of equity method investments (38,018 ) (40,650 ) (9,880 ) Change in restricted cash and cash equivalents (263,014 ) (37,642 ) (16,795 ) Additions to property and equipment (47,725 ) (45,519 ) (60,132 ) Acquisitions, net of cash acquired (12,198 ) (243,675 ) (120,102 ) Other 1,103 (2,158 ) 14,329 Net Cash Provided (Used) By Investing Activities 187,387 (377,130 ) (491,106 ) FINANCING ACTIVITIES Additions to senior long-term debt and other debt 547,214 492,792 336,181 Repayment and retirement of senior long-term debt and other debt (321,978 ) (313,790 ) (90,557 ) Repurchases of common stock (57,388 ) (16,873 ) (42,913 ) Issuance of common stock 24,518 9,145 1,182 Purchase of redeemable noncontrolling interests (11,852 ) (2,143 ) — Distributions to noncontrolling interests (5,124 ) (7,684 ) (9,259 ) Other (23 ) (19,485 ) (45 ) Net Cash Provided By Financing Activities 175,367 141,962 194,589 Effect of foreign currency rate changes on cash and cash equivalents 6,485 3,142 (1,823 ) Increase in cash and cash equivalents 1,114,760 160,507 12,978 Cash and cash equivalents at beginning of year 863,766 703,259 690,281 CASH AND CASH EQUIVALENTS AT END OF YEAR $ 1,978,526 $ 863,766 $ 703,259 See accompanying notes to consolidated financial statements.| 3931Markel Corporation & Subsidiaries
income. The cumulative foreign currency translation adjustment, net of taxes, was a loss of NOTES TO CONSOLIDATED FINANCIAL STATEMENTS1. Summary of Significant Accounting PoliciesMarkel Corporation is a diverse financial holding company serving a variety of niche markets. Markel Corporation’sCorporation's principal business markets and underwrites specialty insurance products and programs and operates in three segments of the specialty insurance marketplace: the Excess and Surplus Lines, the Specialty Admitted and the London markets.products. Through its wholly-owned subsidiary, Markel Ventures, Inc. (Markel Ventures), Markel Corporation also owns interests in various industrial and service businesses that operate outside of the specialty insurance marketplace.On May 1, 2013 (the Acquisition Date), Markel Corporation completed the acquisition of 100% of the issued and outstanding common stock of Alterra Capital Holdings Limited (Alterra) pursuant to an agreement dated December 18, 2012 which provided for the merger of Alterra with one of Markel Corporation's subsidiaries. Total purchase consideration was $3.3 billion. Alterra was a Bermuda-headquartered global enterprise providing diversified specialty insurance and reinsurance products to corporations, public entities and other property and casualty insurers.a)Basis of Presentation.The accompanying consolidated financial statements have been prepared in accordance with U.S. generally accepted accounting principles (U.S. GAAP) and include the accounts of Markel Corporation and allits subsidiaries (the Company). All significant intercompany balances and transactions have been eliminated in consolidation. The consolidated financial statements include the results of operations and cash flows of Alterra from the Acquisition Date to December 31, 2013 and not in any prior periods, except with respect to the Supplemental Pro Forma Information included in note 2. The Company consolidates the results of its non-insuranceMarkel Ventures subsidiaries on a one-month lag. Certain prior year amounts have been reclassified to conform to the current presentation.presentation, including the separate presentation of restricted cash and cash equivalents on the consolidated balance sheets and corresponding change in cash flows from investing activities on the consolidated statements of cash flows.b)Use of Estimates.The preparation of financial statements in accordance with U.S. GAAP requires management to make estimates and assumptions that affect the reported amounts of assets, liabilities, revenues and expenses and the disclosure of contingent assets and liabilities. Management periodically reviews its estimates and assumptions. TheseQuarterly reviews include evaluating the adequacy of reserves for unpaid losses and loss adjustment expenses, life and annuity reinsurance benefit reserves, litigation contingencies, the reinsurance allowance for doubtful accounts and income tax liabilities, as well as analyzing the recoverability of deferred tax assets, assessing goodwill for impairmentestimating reinsurance premiums written and earned and evaluating the investment portfolio for other-than-temporary declines in estimated fair value. Estimates and assumptions for goodwill and intangible assets are reviewed in conjunction with an acquisition and goodwill and indefinite-lived intangible assets are reassessed at least annually for impairment. Actual results may differ materially from the estimates and assumptions used in preparing the consolidated financial statements.c)Investments.Available-for-sale investments are recorded at estimated fair value. Unrealized gains and losses on investments, net of deferred income taxes, are included in accumulated other comprehensive income in shareholders’shareholders' equity. The Company completes a detailed analysis each quarter to assess whether the decline in the fair value of any investment below its cost basis is deemed other-than-temporary.Premiums and discounts are amortized or accreted over the lives of the related fixed maturities as an adjustment to the yield using the effective interest method. Dividend and interest income are recognized when earned. Realized investment gains or losses are included in earnings. Realized gains or losses from sales of investments are derived using the first-in, first-out method.Investments accounted for under the equity method of accounting are recorded at cost within other assets on the consolidated balance sheets and subsequently increased or decreased by the Company's proportionate share of the net income or loss of the investee. The Company records its proportionate share of net income or loss of the investee in net investment income. The Company records its proportionate share of other comprehensive income or loss of the investee as a component of other comprehensive income. Dividends or other equity distributions are recorded as a reduction of the investment. The Company reviews equity method investments for impairment when events or circumstances indicate that a decline in the fair value of the investment below its carrying value is other-than-temporary.d)Cash and Cash Equivalents.The Company considers all investments with original maturities of 90 days or less to be cash equivalents. The carrying value of the Company’sCompany's cash and cash equivalents and restricted cash and cash equivalents approximates fair value.32e)Receivables. Receivables include amounts receivable from agents, brokers and insureds, which represent premiums that are both currently due and amounts not yet due on insurance and reinsurance policies. Premiums for insurance policies are generally due at inception. Premiums for reinsurance policies generally become due over the period of coverage based on the policy terms. The Company monitors the credit risk associated with premiums receivable, taking into consideration the fact that in certain instances credit risk may be reduced by the Company's right to offset loss obligations or unearned premiums against premiums receivable. Amounts deemed uncollectible are charged to net income in the period they are determined. Changes in the estimate of reinsurance premiums written will result in an adjustment to premiums receivable in the period they are determined.f)Reinsurance Recoverables.Amounts recoverable from reinsurers are estimated in a manner consistent with the claim liability associated with the reinsured business. Allowances are established for amounts deemed uncollectible and reinsurance recoverables are recorded net of these allowances. The Company evaluates the financial condition of its reinsurers and monitors concentration risk to minimize its exposure to significant losses from individual reinsurers.f) g)Deferred Policy Acquisition Costs.Costs directly related to the acquisition of insurance premiums such as commissions to agents and brokers, are deferred and amortized over the related policy period, generally one year.year. Concurrent with the adoption of Financial Accounting Standards Board (FASB) Accounting Standards Update (ASU) No. 2010-26, Accounting for Costs Associated with Acquiring or Renewing Insurance Contracts, effective January 1, 2012, the Company only defers acquisition costs incurred that are related directly to the successful acquisition of new or renewal insurance contracts, including commissions to agents and brokers and premium taxes. Commissions received related to reinsurance premiums ceded are netted against broker commissions and other acquisition costs in determining acquisition costs eligible for deferral. To the extent that future policy revenues on existing policies are not adequate to cover related costs and expenses, deferred policy acquisition costs are charged to earnings. The Company does not consider anticipated investment income in determining whether a premium deficiency exists.40 |1. Summary of Significant Accounting Policies (continued)h)g) Goodwill and Intangible Assets. Goodwill and intangible assets are recorded as a result of business acquisitions. Goodwill represents the excess of the amount paid to acquire a business over the net fair value of assets acquired and liabilities assumed at the date of acquisition. Indefinite-lived and other intangible assets are recorded at fair value as of the acquisition date. The determination of the fair value of certain assets acquired and liabilities assumed involves significant judgment and the use of valuation models and other estimates, which require assumptions that are inherently subjective. Goodwill and indefinite-lived intangible assets are tested for impairment at least annually. The Company completes itsan annual test during the fourth quarter of each year based upon the results of operations through September 30. Intangible assets with finitedefinite lives are amortized using the straight-line method over their estimated useful lives, generally threefive to 2520 years, and are reviewed for impairment when events or circumstances indicate that their carrying value may not be recoverable.h) i)Property and Equipment.Property and equipment are stated at cost less accumulated depreciation and amortization. Depreciation and amortization of property and equipment are calculated using the straight-line method over the estimated useful lives (generally, the life of the lease for leasehold improvements, 20ten to 40 years for buildings, threeseven to 1540 years for land improvements, three to ten years for furniture and equipment and three to 25 years for other property and equipment).i) j)Redeemable Noncontrolling Interests. The Company owns controlling interests in various companies through its Markel Ventures operations. Under the terms of certain of the acquisition and related agreements, the Company has the option to acquire the remaining equity interests and the remaining equity interests have the option to sell their interests to the Company in the future. The redemption value of the remaining equity interests is generally based on the respective company's earnings in specified periods preceding the redemption date. The redeemable noncontrolling interests generally become redeemable through 2018.The Company recognizes changes in the redemption value that exceed the carrying value of redeemable noncontrolling interests to retained earnings as if the balance sheet date were also the redemption date. Changes in the redemption value also result in an adjustment to net income to shareholders in the calculation of basic and diluted net income per share. The adjustment recorded to retained earnings during 2013 and 2012 was a decrease of $2.0 million and an increase of $3.1 million, respectively. There were no adjustments recorded to retained earnings in 2011 because the redemption values of the redeemable noncontrolling interests were less than or approximated their carrying values.33k)Income Taxes.The Company records deferred income taxes to reflect the net tax effect of temporary differences between the carrying amounts of assets and liabilities for financial reporting purposes and their tax bases. Deferred tax assets are reduced by a valuation allowance when management believes it is more likely than not that some, or all, of the deferred tax assets will not be realized. The Company recognizes the tax benefit from an uncertain tax position taken or expected to be taken in income tax returns only if it is more likely than not that the tax position will be sustained upon examination by tax authorities, based on the technical merits of the position. Tax positions that meet the more likely than not threshold are then measured using a probability weighted approach, whereby the largest amount of tax benefit that is greater than 50% likely of being realized upon ultimate settlement is recognized. The Company recognizes interest and penalties related to uncertain tax positions in income tax expense (benefit).expense.j) l)Unpaid Losses and Loss Adjustment Expenses.Unpaid losses and loss adjustment expenses on our property and casualty insurance business are based on evaluations of reported claims and estimates for losses and loss adjustment expenses incurred but not reported. Estimates for losses and loss adjustment expenses incurred but not reported are based on reserve development studies, among other things. The Company does not discount reserves for losses and loss adjustment expenses to reflect estimated present value. Thevalue, except for reserves assumed in connection with an acquisition, which are recorded at fair value at the acquisition date. Recorded reserves are estimates, and the ultimate liability may be greater than or less than the estimates.k) m)Life and Annuity Benefits. Prior to its acquisition by the Company, Alterra entered into long duration reinsurance contracts for life and annuity benefits which subject the Company to mortality, longevity and morbidity risks. The assumptions used to determine policy benefit reserves were determined at the Acquisition Date and are generally locked-in for the life of the contract unless an unlocking event occurs. To the extent existing policy reserves, together with the present value of future gross premiums and expected investment income earned thereon, are not adequate to cover the present value of future benefits, settlement and maintenance costs, the locked-in assumptions are revised to current best estimate assumptions and a charge to earnings for life and annuity benefits is recognized at that time. Because of the assumptions and estimates used in establishing reserves for life and annuity benefit obligations and the long-term nature of these reinsurance contracts, the ultimate liability may be greater or less than the estimates.Results attributable to the run-off of life and annuity reinsurance business are included in other revenues and other expenses in the Company's consolidated statements of income and comprehensive income and as part of the Company's Other Insurance (Discontinued Lines) segment.n)Revenue Recognition.Property and Casualty PremiumsInsurance premiums are generally earned on a pro rata basis over the policy period, generally typically one year.year. The cost of reinsurance ceded is initially recorded as prepaid reinsurance premiums and is amortized over the reinsurance contract period in proportion to the amount of insurance protection provided. Premiums ceded are netted against premiums written.Assumed reinsurance premiums are recorded at the inception of each contract based upon contract terms and information received from cedents and brokers and are earned on a pro rata basis over the coverage period, or for multi-year contracts, in proportion with the underlying risk exposure to the extent there is variability in the exposure through the coverage period. Changes in reinsurance premium estimates are expected and may result in significant adjustments in any period. These estimates change over time as additional information regarding changes in underlying exposures is obtained. Any subsequent differences arising on such estimates are recorded as premiums written in the period they are determined. The Company uses the periodic method to account for assumed reinsurance from foreign reinsurers. The Company’sCompany's foreign reinsurers provide sufficient information to record foreign assumed business in the same manner as the Company records assumed business from United States reinsurers.Certain contracts that the Company writes provide for reinstatement of coverage. Reinstatement premiums are the premiums for the restoration of the insurance or reinsurance limit of a contract to its full amount after a loss occurrence by the insured or reinsured. The Company accrues for reinstatement premiums resulting from losses recorded. Such accruals are based upon contractual terms and management judgment is involved with respect to the amount of losses recorded. Changes in estimates of losses recorded on contracts with reinstatement premium features will result in changes in reinstatement premiums based on contractual terms. Reinstatement premiums are recognized at the time losses are recorded and are earned on a pro-rata basis over the coverage period.34Other RevenuesOther revenues primarily relate to the Company's Markel Ventures operations and consist of salesrevenues from the sale of manufactured products manufactured by the Company’s non-insurance operations. Revenueand service revenues. Revenues from manufactured products isare generally recognized at the time title transfers to the customer, which occurs at the point of shipment or delivery to the customer, depending on the terms of the sales arrangement. Revenues from services are generally recognized as the services are performed. Services provided pursuant to a contract are recognized either over the contract period or upon completion of the elements specified in the contract, depending on the terms of the contract.o)l) Stock-based Compensation.Stock-based compensation expense is recognized as part of underwriting, acquisition and insurance expenses over the requisite service period. Stock-based compensation expense, net of taxes, was $2.1$18.4 million in 2010, $1.82013, $4.4 million in 20092012 and $1.3$4.0 million in 2008.| 41Markel Corporation & SubsidiariesNOTES TO CONSOLIDATED FINANCIAL STATEMENTS (continued)1. Summary of Significant Accounting Policies (continued)2011m) . See note 12.p)Foreign Currency Translation.The functional currencies of the Company’sCompany's foreign operations are the currencies in which the majority of their business is transacted. Assets and liabilities of foreign operations are translated into the United States Dollar using the exchange rates in effect at the balance sheet date. Revenues and expenses of foreign operations are translated using the average exchange rate for the period. Gains or losses from translating the financial statements of foreign operations are included, net of taxes, in shareholders’shareholders' equity as a component of accumulated other comprehensive income. Gains and losses arising from transactions denominated in a foreign currency, other than a functional currency, are included in net income (loss).income.The Company manages its exposure to foreign currency risk primarily by matching assets and liabilities denominated in the same currency. To the extent that assets and liabilities in foreign currencies are not matched, the Company is exposed to foreign currency risk. For functional currencies, the related exchange rate fluctuations are reflected in other comprehensive income (loss).n) $11.2 million and $1.1 million at December 31, 2013 and 2012, respectively.q)Derivative Financial Instruments.Derivative instruments, including derivative instruments resulting from hedging activities, are measured at fair value and recognized as either assets or liabilities on the consolidated balance sheets. The changes in fair value of derivatives are recognized in earnings unless the derivative is designated as a hedge and qualifies for hedge accounting.The Company’sCompany's foreign currency forward contracts are generally designated and qualified as hedges of a net investment in a foreign operation. The effective portion of the change in fair value resulting from these hedges is reported in currency translation adjustments as part of other comprehensive income (loss).income. The ineffective portion of the change in fair value is recognized in earnings.o) r)Comprehensive Income (Loss).Income.Comprehensive income (loss) represents all changes in equity that result from recognized transactions and other economic events during the period. Other comprehensive income (loss) refers to revenues, expenses, gains and losses that under U.S. GAAP are included in comprehensive income (loss) but excluded from net income, (loss), such as unrealized gains or losses on investments, foreign currency translation adjustments and changes in net actuarial pension loss.p) s)Net Income (Loss) Per Share.Basic net income (loss) per share is computed by dividing adjusted net income (loss) to shareholders by the weighted average number of common shares outstanding during the year. Unvested share-based compensation awards that contain non-forfeitable rights to dividends or dividend equivalents (whether paid or unpaid) are considered participating awards and are included in the computation of net income per share. Non-participating unvested share-based compensation awards are excluded from the computation of net income per share. Diluted net income (loss) per share is computed by dividing adjusted net income (loss) to shareholders by the weighted average number of common shares and dilutive potential common shares outstanding during the year. See note 12(b).35q) t)Recent Accounting Pronouncements.Effective in the first quarter of 2010,January 1, 2013, the Company adopted FinancialFASB ASU No. 2013-02, Reporting Amounts Reclassified Out of Accumulated Other Comprehensive Income, which amends FASB Accounting Standards Board (FASB) Accounting Standards Update (ASU) No. 2010-06,Improving Disclosures about Fair Value Measurements,which expands disclosure requirements relatedCodification (ASC) 220, Comprehensive Income, to fair value measurements.improve the reporting of reclassifications out of accumulated other comprehensive income. ASU No. 2010-062013-02 requires information about reclassifications out of accumulated other comprehensive income to be reported in one place, by component. The guidance also requires disclosure of the amountseffect of and reasons for significant transfers into andreclassifications out of Level 1 and Level 2 fair value measurements. This guidance also requires gross rather thanaccumulated other comprehensive income on the respective line items in net income if the amount being reclassified is required under U.S. GAAP to be reclassified in its entirety to net income. For other amounts that are not required to be reclassified in their entirety to net income, an entity is required to cross-reference to other disclosures required under U.S. GAAP that provide additional detail about purchases, sales, issuances and settlements relating to Level 3 fair value measurements. Disclosures about the valuation techniques and inputs used to measure fair value for Level 2 and Level 3 fair value measurements are required as well. Since ASU No. 2010-06 addresses financial statement disclosures only, thethose amounts. The adoption of this guidance did not have an impact on the Company’sCompany's financial position, results of operations or cash flows. The Company has included the additional disclosures required by ASU No. 2010-062013-02 in note 12.13.42 |1. Summary of Significant Accounting Policies (continued)In June 2009, the FASB issued Statement of Financial Accounting Standards (Statement) No. 167,Amendments to FASB Interpretation No. 46(R). In December 2009,July 2013, the FASB issued ASU No. 2009-17,Improvements to Financial Reporting by Enterprises Involved with Variable Interest Entities,to amend their codification for Statement No. 167. This guidance removes the scope exception for qualifying special-purpose entities, includes new criteria for determining the primary beneficiary2013-11, Presentation of an Unrecognized Tax Benefit When a variable interest entity and increases the frequency of required assessments to determine whether an entity is the primary beneficiary ofNet Operating Loss Carryforward, a variable interest entity. In January 2010, the FASB decided to indefinitely defer the consolidation requirements of Similar Tax Loss, or a Tax Credit Carryforward Exists. ASU No. 2009-172013-11 requires that a liability related to an unrecognized tax benefit be offset against a deferred tax asset for interestsa net operating loss carryforward, a similar tax loss or a tax credit carryforward if such settlement is required or expected in certain investment entities. The FASB also decidedthe event the uncertain tax position is disallowed. In that case, the liability associated with the unrecognized tax benefit is presented in the financial statements as a reduction to revise the provisions ofrelated deferred tax asset for a net operating loss carryforward, a similar tax loss or a tax credit carryforward. Otherwise, the unrecognized tax benefit should be presented in the financial statements as a liability and should not be combined with deferred tax assets. ASU No. 2009-17 for determining whether service-provider or decision-maker fee arrangements represent a variable interest. Both the provisions of ASU No. 2009-17 as issued and the subsequent revisions to this guidance became2013-11 becomes effective for the Company on January 1, 2010.during the first quarter of 2014. The adoption of this guidance didASU is not have anexpected to impact on the Company’sCompany's financial position, results of operations or cash flows.2. AcquisitionsAcquisition of AlterraEffective Julya)Overview. On May 1, 2010,2013, the Company adopted ASU No. 2010-11,Scope Exception Relatedcompleted the acquisition of 100% of the the issued and outstanding common stock of Alterra pursuant to Embedded Credit Derivatives,an agreement dated December 18, 2012 (the Merger Agreement) which clarifiesprovided for the merger of Alterra with one of the Company's subsidiaries. Alterra was a Bermuda-headquartered global enterprise providing diversified specialty property and casualty insurance and reinsurance products to corporations, public entities and other property and casualty insurers. The acquisition of Alterra creates additional size and scale, providing additional insurance and investment opportunities for the Company. As a result of the acquisition of Alterra, the Company formed a new operating segment, the Alterra segment. Results attributable to Alterra's property and casualty insurance and reinsurance business are included in the Alterra segment. Alterra also offered life and annuity reinsurance products. In 2010, Alterra ceased writing life and annuity reinsurance contracts and placed this business into run-off. Results attributable to the run-off of life and annuity reinsurance business are included in the Company's Other Insurance (Discontinued Lines) segment. See note 20 for further discussion of the Company's operating segments.Pursuant to the terms of the Merger Agreement, on the Acquisition Date, equity holders of Alterra received, in exchange for each share of Alterra common stock held (other than restricted shares that did not vest in connection with the only typetransaction), (1) 0.04315 shares of embedded credit derivativesthe Company's common stock and (2) $10.00 in cash. Equity holders of Alterra received total consideration of $3.3 billion, consisting of cash consideration of $964.3 million and stock consideration of 4.3 million shares of the Company's common stock.Following the acquisition, the Company's board of directors consists of all ten members from its pre-acquisition board of directors and two additional members who were designated by Alterra and approved by the Company's Nominating/Corporate Governance Committee.36b)Purchase Price. The Company's total purchase price for Alterra as of the Acquisition Date was calculated as follows:(in thousands, except per share amounts) Shares of Alterra common stock outstanding as of the Acquisition Date 96,433 Exchange ratio per the Merger Agreement 0.04315 Markel share issuance to Alterra shareholders 4,161 Shares of Alterra restricted stock outstanding as of the Acquisition Date 2,239 Incentive award ratio per the Merger Agreement 0.06252 Markel restricted stock issuance to Alterra restricted stock holders 140 Multiplied by Markel's weighted average stock price on April 30, 2013 (1)$ 529.59 Markel share and restricted stock issuance consideration, net of taxes $ 2,267,648 Alterra common shares outstanding as of the Acquisition Date that received cash consideration 96,433 Multiplied by cash price per share component per the Merger Agreement $ 10.00 Markel cash consideration $ 964,330 Fair value of Markel warrant issuance to Alterra warrant holders as of the Acquisition Date $ 73,685 Fair value of Markel stock option issuance to Alterra stock option holders as of the Acquisition Date, net of taxes $ 12,335 Fair value of partially vested Markel restricted stock unit issuance as of the Acquisition Date, net of taxes $ 6,867 Unrecognized compensation on unvested restricted stock and restricted stock units $ (20,572 ) Total acquisition consideration $ 3,304,293 (1)The fair value of the shares issued by the Company was calculated as the weighted average price of the Company's stock on April 30, 2013, the day preceding the Acquisition Date. As part of the consideration, the Company issued replacement warrants, options and restricted stock awards to holders of Alterra warrants, options and restricted stock awards. The acquisition consideration related to the options, restricted stock and restricted stock units issued was net of income taxes of $1.9 million, $10.1 million and $0.7 million, respectively. See note 12 for additional information about the equity awards issued in connection with the acquisition.c)Fair Value of Net Assets Acquired and Liabilities Assumed. The purchase price was allocated to the acquired assets and liabilities of Alterra based on estimated fair values at the Acquisition Date. The Company recognized goodwill of $295.7 million, all of which was recorded within the Alterra segment and is primarily attributable to Alterra's assembled workforce and synergies that are exempt from bifurcation requirements are thoseexpected to result upon integration of Alterra into the Company's insurance operations and investing activities. None of the goodwill that was recorded is deductible for income tax purposes. The Company also recognized indefinite lived intangible assets of $37.5 million and other intangible assets of $170.0 million, which will be amortized over a weighted average period of 17 years.37The following table summarizes the fair values of the assets acquired and liabilities assumed at the Acquisition Date.(dollars in thousands) ASSETS Investments $ 6,407,841 Cash and cash equivalents 1,036,274 Restricted cash and cash equivalents 414,497 Receivables 866,388 Reinsurance recoverable on unpaid losses 1,169,084 Reinsurance recoverable on paid losses 80,672 Prepaid reinsurance premiums 317,445 Other assets 859,884 LIABILITIES Unpaid losses and loss adjustment expenses 4,719,461 Life and annuity benefits 1,477,482 Unearned premiums 1,075,610 Payables to insurance and reinsurance companies 342,858 Senior long-term debt 512,463 Other liabilities 223,108 Net assets 2,801,103 Goodwill 295,690 Intangible assets 207,500 Acquisition date fair value $ 3,304,293 An explanation of the significant adjustments for fair value and the related impact on amortization is as follows:Investments - Fixed maturity investments acquired include a net increase of $223.1 million to adjust the historical carrying amount of Alterra's investments to their estimated fair value as of the Acquisition Date. The difference in the historical amortized cost of the fixed maturity investments acquired and their estimated fair value as of the Acquisition Date, $495.5 million, represents incremental premium that will be amortized to net investment income over the term of the underlying securities. The amount of the unamortized incremental premium as of December 31, 2013 was $398.1 million, which will be amortized over a weighted average remaining term of approximately five years. The decrease in the unamortized incremental premium is due to amortization expense of $58.3 million and sales of securities.Intangible assets - Establish the estimated fair value of intangible assets related to Alterra (see below for further detail).Unearned Premiums - Unearned premiums acquired include a decrease of $176.3 million to adjust the carrying value of Alterra's historical unearned premiums to fair value as of the Acquisition Date. The adjustment consists of the present value of the expected underwriting profit within the unearned premiums liability less costs to service the related policies and a risk premium. This adjustment will be amortized to underwriting, acquisition and insurance expenses over a weighted average period of approximately one year, as the contracts for business in-force as of the Acquisition Date expire.Unpaid losses and loss adjustment expenses - Unpaid losses and loss adjustment expenses acquired include an increase of $120.8 million to adjust the carrying value of Alterra's historical unpaid losses and loss adjustment expenses, net of related reinsurance recoverable, to fair value as of the Acquisition Date. The estimated fair value consists of the present value of the expected net loss and loss adjustment expense payments plus a risk premium. This adjustment, plus the $26.5 million unamortized fair value adjustment included in Alterra's historical unpaid losses and loss adjustment expenses, will be amortized to losses and loss adjustment expenses over a weighted average period of approximately five years, based on the estimated payout pattern of net reserves as of the Acquisition Date. As of December 31, 2013, the unamortized fair value adjustment included in unpaid losses and loss adjustment expenses was $136.5 million, which will be amortized over a weighted average remaining period of approximately four years.38Life and Annuity Benefits - Life and annuity benefits acquired include an increase of $329.6 million to adjust the carrying value of Alterra's historical life and annuity benefits to fair value as of the Acquisition Date. The estimated fair value consists of the present value of the expected net life and annuity benefit payments plus a risk premium. See note 10 for detail regarding accounting for life and annuity benefits.Senior long-term debt - Senior long-term debt acquired includes an increase of $71.9 million to adjust the carrying value of Alterra's senior long-term debt to its estimated fair value based on prevailing interest rates and other factors as of the Acquisition Date. This adjustment will be amortized to interest expense over the term of the notes. See note 11. As of December 31, 2013, the unamortized premium on the acquired senior long-term debt was $66.1 million.The following table summarizes the intangible assets recorded in connection with the acquisition, and as of December 31, 2013.(dollars in thousands) Amount EconomicUseful LifeCustomer relationships $ 132,000 18 years Broker relationships 19,000 18 years Technology 18,000 Ten years Trade names 1,000 One year Lloyd's syndicate capacity 12,000 Indefinite Insurance licenses 25,500 Indefinite Intangible assets, before amortization, as of the Acquisition Date 207,500 Amortization (from the Acquisition Date through December 31, 2013) 7,785 Net intangible assets as of December 31, 2013 $ 199,715 Customer relationships represent policyholder relationships and the network of insurance companies through which Alterra conducted its operations. The fair value of customer relationships and broker relationships was estimated using the income approach. Critical inputs into the valuation model for customer relationships and broker relationships include estimates of expected premium and attrition rates, and discounting at a weighted average cost of capital. Technology represents the intangible asset related to Alterra's internally developed software and was valued using the income approach.The fair value of Lloyd's syndicate capacity and insurance licenses was estimated using the market approach. Lloyd's syndicate capacity represents Alterra's authorized premium income limit to write insurance business in the Lloyd's of London (Lloyd's) insurance market. The Lloyd's capacity is renewed annually at no cost to the Company or may be freely purchased or sold, subject to Lloyd's approval. The ability to write insurance business within the syndicate capacity is indefinite with the premium income limit being set annually by the Company, subject to Lloyd's approval.d)Income Taxes. As a result of the acquisition, Alterra and its non-U.S. subsidiaries became controlled foreign corporations subject to U.S. income tax at a statutory rate of 35%. The acquisition was taxable to U.S. shareholders of Alterra, and Markel has elected to treat it as an asset acquisition under section 338(g) of the U.S. Internal Revenue Code of 1986 (IRC), as amended.Effective May 1, 2013, the Company made an IRC section 953(d) election with respect to Markel Bermuda Limited (Markel Bermuda, formerly known as Alterra Bermuda Limited), a wholly-owned subsidiary of Alterra. As a result of the 953(d) election, Markel Bermuda is treated as a domestic corporation for U.S. tax purposes and, accordingly, is required to record deferred taxes at the 35% statutory U.S. rate.As part of the allocation of the purchase price, the Company recorded net deferred tax assets of $310.1 million. Of this amount, $343.9 million represents deferred tax assets related to accrued losses and loss adjustment expenses and life and annuity benefits, which were partially offset by deferred tax liabilities of $64.6 million related to the estimated fair value of the intangible assets recorded. Other net deferred tax assets recorded primarily relate to differences between financial reporting and tax bases of the subordinationacquired assets and liabilities as of the Acquisition Date. At December 31, 2013, earnings of Alterra's foreign subsidiaries are considered reinvested indefinitely, consistent with the Company's other foreign subsidiaries, and no provision for deferred U.S. income tax has been recorded. As of December 31, 2013, the allocation of the purchase price reflects an increase of $54.3 million in the amount recorded for net deferred tax assets from the allocation initially reported at June 30, 2013 and a corresponding reduction in the amount recorded for goodwill.39e)Transaction and Acquisition-Related Costs. The following table summarizes transaction and acquisition-related costs incurred by the Company in connection with the acquisition, all of which were included in underwriting, acquisition and insurance expenses in the consolidated statements of income and comprehensive income.(dollars in thousands) Year EndedDecember 31, 2013Transaction costs $ 15,981 Acquisition-related costs: Severance costs 31,734 Stay bonuses 14,804 Acceleration of Alterra long-term incentive compensation awards and restricted stock awards 12,621 Total transaction and acquisition-related costs $ 75,140 Transaction costs primarily consist of due diligence, legal and investment banking costs. Per the terms of the Merger Agreement, transaction costs attributable to Alterra were recorded and paid by Alterra prior to the Acquisition Date ($23.0 million) and are not included within the Company's consolidated statements of income and comprehensive income.In connection with the acquisition, Alterra instituted a retention plan for certain employees under which Alterra committed to the payment of stay bonuses to such employees one year from the Acquisition Date, provided they remain employed with the Company through that date. Payments may be accelerated for certain qualifying employment terminations.Prior to its acquisition by the Company, Alterra granted long term incentive awards to certain employees to be paid in the form of cash on March 1, 2016, provided they remain employed with the Company on that date. Payments may be accelerated prior to March 1, 2016 for certain qualifying employment terminations. Additionally, as part of the purchase consideration, the Company issued replacement restricted stock awards to holders of Alterra restricted stock awards. As a result of separations made in connection with the acquisition, the Company recognized expense totaling $12.6 million related to the acceleration of certain of these awards during the year ended December 31, 2013.f)Financial Results. The following table summarizes the results of Alterra since the Acquisition Date that have been included within the Company's consolidated statements of income and comprehensive income.(dollars in thousands) Year Ended December 31, 2013Operating revenues $ 912,387 Net loss to shareholders $ (93,074 ) g)Supplemental Pro Forma Information (unaudited). Alterra's results have been included in the Company's Consolidated Financial Statements from the Acquisition Date to December 31, 2013. The following table presents unaudited pro forma consolidated information for the years ended December 31, 2013 and 2012 and assumes the Company's acquisition of Alterra occurred on January 1, 2012. The pro forma financial instrument to another. This guidance requires analysisinformation is presented for informational purposes only and does not necessarily reflect the results that would have occurred had the acquisition taken place on January 1, 2012, nor is it necessarily indicative of embedded credit derivative features other than subordinationfuture results. Significant adjustments used to determine if they require bifurcationpro forma results include amortization of intangible assets and separate accounting treatment.amortization of fair value adjustments discussed in c) above, and the corresponding income tax effects. The adoption of ASU No. 2010-11 did not have an impact onCompany also excluded certain charges from the Company’s financial position,pro forma results, of operations or cash flows.In October 2010,including transaction costs incurred by the FASB issued ASU No. 2010-26,AccountingCompany ($16.0 million) and Alterra ($23.0 million) totaling $39.0 million for Costs Associated with Acquiring or Renewing Insurance Contracts,to address diversity in practice within the insurance industry regarding the interpretation of whichyear ended December 31, 2013, severance costs relatingattributable to the acquisition totaling $31.7 million for the year ended December 31, 2013, and stay bonuses of new or renewal insurance contracts qualify$14.8 million for deferral. This guidance modifies the definitionyear ended December 31, 2013. The acceleration of compensation expense during the year ended December 31, 2013 related to Alterra's long-term incentive compensation awards and restricted stock awards was attributable to the acquisition; however, the incremental expense recognized during the period only represents a timing difference in the recognition of expense. Therefore, it was not excluded from the pro forma underwriting results.40 Unaudited Consolidated Pro Forma Years Ended December 31, (in thousands, except per share amounts) 2013 2012 Earned premiums $ 3,680,220 $ 3,509,834 Operating revenues 4,899,628 4,561,107 Net income to shareholders 422,829 308,496 U.S. GAAP combined ratio (1)95 % 99 % Basic net income per share $ 30.33 $ 21.79 Diluted net income per share $ 30.19 $ 21.71 Weighted average common shares outstanding: Basic 14,007 14,014 Diluted 14,069 14,065 (1)The U.S. GAAP combined ratio is a measure of underwriting performance and represents the relationship of incurred losses, loss adjustment expenses and underwriting, acquisition and insurance expenses to earned premiums. Acquisition of EssentiaOn January 1, 2013, the Company completed its acquisition of 100% of the typesoutstanding shares of costs incurred byEssentia Insurance Company (Essentia), a company that underwrites insurance companies that canexclusively for Hagerty Insurance Agency and Hagerty Classic Marine Insurance Agency (collectively, Hagerty) throughout the United States. Hagerty offers insurance for classic cars, vintage boats, motorcycles and related automotive collectibles. The Company recognized intangible assets of $35.4 million associated with this acquisition, which includes $25.0 million of customer relationships to be capitalizedamortized over a weighted average period of six years. Results attributable to this acquisition are included in the Specialty Admitted segment.On January 1, 2014, Hagerty exercised its option to purchase 9.9% of the outstanding shares of Essentia, which reduced the Company's ownership interest in Essentia to 90.1%.Acquisition of Abbey ProtectionOn January 17, 2014, the Company completed its acquisition of new100% of the issued and renewal contracts. This guidance specifies that a cost must be directly related to the successful acquisition of a new or renewal insurance contract in order to be capitalized. ASU No. 2010-26 becomes effectiveissued share capital of Abbey Protection plc (Abbey), an integrated specialty insurance and consultancy group headquartered in London. Abbey's business is focused on the underwriting and sale of insurance products to small and medium-sized enterprises and affinity groups in the United Kingdom providing protection against legal expenses and professional fees incurred as a result of legal actions or investigations by tax authorities, as well as providing a range of complementary legal, professional and reinsurance services.Total consideration for this acquisition was $190.0 million, all of which was cash consideration. The purchase price allocation for Abbey will be completed in the Company beginning January 1, 2012, and would allow, but not require, retrospective application. The Company is currently evaluating ASU No. 2010-26 to determine the potential impact that adopting this standard will have on its consolidated financial statements.first quarter of 2014.| 4341Markel Corporation & SubsidiariesNOTES TO CONSOLIDATED FINANCIAL STATEMENTS (continued)
a)The following tables summarize the Company’sCompany's available-for-sale investments.
| December 31, 2010 | ||||||||||||||||||||
(dollars in thousands) | Amortized Cost | Gross Unrealized Holding Gains | Gross Unrealized Holding Losses | Unrealized Other- Than-Temporary Impairment Losses | Estimated Fair Value | |||||||||||||||
Fixed maturities: | ||||||||||||||||||||
U.S. Treasury securities and obligations of U.S. government agencies | $ | 300,555 | $ | 20,832 | $ | (49 | ) | $ | — | $ | 321,338 | |||||||||
Obligations of states, municipalities and political subdivisions | 2,767,169 | 61,620 | (29,450 | ) | — | 2,799,339 | ||||||||||||||
Foreign governments | 550,755 | 24,662 | (2,599 | ) | — | 572,818 | ||||||||||||||
Residential mortgage-backed securities | 409,415 | 29,664 | (1,738 | ) | (11,778 | ) | 425,563 | |||||||||||||
Asset-backed securities | 21,704 | 1,052 | — | — | 22,756 | |||||||||||||||
Public utilities | 95,770 | 6,674 | — | — | 102,444 | |||||||||||||||
Convertible bonds | 16,725 | — | — | — | 16,725 | |||||||||||||||
All other corporate bonds | 1,094,887 | 83,752 | (603 | ) | (7,793 | ) | 1,170,243 | |||||||||||||
Total fixed maturities | 5,256,980 | 228,256 | (34,439 | ) | (19,571 | ) | 5,431,226 | |||||||||||||
Equity securities: | ||||||||||||||||||||
Insurance companies, banks and trusts | 388,848 | 323,634 | (1,496 | ) | — | 710,986 | ||||||||||||||
Industrial, consumer and all other | 607,240 | 404,444 | (699 | ) | — | 1,010,985 | ||||||||||||||
Total equity securities | 996,088 | 728,078 | (2,195 | ) | — | 1,721,971 | ||||||||||||||
Short-term investments | 325,336 | 4 | — | — | 325,340 | |||||||||||||||
INVESTMENTS, AVAILABLE-FOR-SALE | $ | 6,578,404 | $ | 956,338 | $ | (36,634 | ) | $ | (19,571 | ) | $ | 7,478,537 | ||||||||
| December 31, 2009 | ||||||||||||||||||||
(dollars in thousands) | Amortized Cost | Gross Unrealized Holding Gains | Gross Unrealized Holding Losses | Unrealized Other- Than-Temporary Impairment Losses | Estimated Fair Value | |||||||||||||||
Fixed maturities: | ||||||||||||||||||||
U.S. Treasury securities and obligations of U.S. government agencies | $ | 358,360 | $ | 18,053 | $ | (91 | ) | $ | — | $ | 376,322 | |||||||||
Obligations of states, municipalities and political subdivisions | 2,241,457 | 65,840 | (16,763 | ) | — | 2,290,534 | ||||||||||||||
Foreign governments | 410,435 | 14,912 | (2,335 | ) | — | 423,012 | ||||||||||||||
Residential mortgage-backed securities | 419,707 | 24,223 | (1,534 | ) | (12,342 | ) | 430,054 | |||||||||||||
Asset-backed securities | 27,052 | 244 | (1,001 | ) | — | 26,295 | ||||||||||||||
Public utilities | 136,302 | 7,317 | — | — | 143,619 | |||||||||||||||
Convertible bonds | 30,750 | — | — | — | 30,750 | |||||||||||||||
All other corporate bonds | 1,337,682 | 70,269 | (5,977 | ) | (10,424 | ) | 1,391,550 | |||||||||||||
Total fixed maturities | 4,961,745 | 200,858 | (27,701 | ) | (22,766 | ) | 5,112,136 | |||||||||||||
Equity securities: | ||||||||||||||||||||
Insurance companies, banks and trusts | 338,369 | 243,669 | (3,521 | ) | — | 578,517 | ||||||||||||||
Industrial, consumer and all other | 505,472 | 266,165 | (325 | ) | — | 771,312 | ||||||||||||||
Total equity securities | 843,841 | 509,834 | (3,846 | ) | — | 1,349,829 | ||||||||||||||
Short-term investments | 492,563 | 20 | (2 | ) | — | 492,581 | ||||||||||||||
INVESTMENTS, AVAILABLE-FOR-SALE | $ | 6,298,149 | $ | 710,712 | $ | (31,549 | ) | $ | (22,766 | ) | $ | 6,954,546 | ||||||||
44 |
| December 31, 2013 | |||||||||||||||||||
| (dollars in thousands) | Amortized Cost | Gross Unrealized Holding Gains | Gross Unrealized Holding Losses | Unrealized Other- Than-Temporary Impairment Losses | Estimated Fair Value | ||||||||||||||
| Fixed maturities: | |||||||||||||||||||
| U.S. Treasury securities and obligations of U.S. government agencies | $ | 1,215,522 | $ | 9,051 | $ | (30,342 | ) | $ | — | $ | 1,194,231 | ||||||||
| Obligations of states, municipalities and political subdivisions | 2,986,758 | 116,341 | (27,384 | ) | — | 3,075,715 | |||||||||||||
| Foreign governments | 1,484,818 | 30,647 | (54,411 | ) | — | 1,461,054 | |||||||||||||
| Commercial mortgage-backed securities | 379,555 | 62 | (11,796 | ) | — | 367,821 | |||||||||||||
| Residential mortgage-backed securities | 875,902 | 13,046 | (16,442 | ) | (2,258 | ) | 870,248 | ||||||||||||
| Asset-backed securities | 189,646 | 257 | (1,614 | ) | — | 188,289 | |||||||||||||
| Corporate bonds | 2,996,940 | 54,777 | (61,650 | ) | (4,889 | ) | 2,985,178 | ||||||||||||
| Total fixed maturities | 10,129,141 | 224,181 | (203,639 | ) | (7,147 | ) | 10,142,536 | ||||||||||||
| Equity securities: | |||||||||||||||||||
| Insurance, banks and other financial institutions | 422,975 | 592,112 | (4 | ) | — | 1,015,083 | |||||||||||||
| Industrial, consumer and all other | 1,143,578 | 1,094,251 | (1,114 | ) | — | 2,236,715 | |||||||||||||
| Total equity securities | 1,566,553 | 1,686,363 | (1,118 | ) | — | 3,251,798 | |||||||||||||
| Short-term investments | 1,452,270 | 18 | — | — | 1,452,288 | ||||||||||||||
| Investments, available-for-sale | $ | 13,147,964 | $ | 1,910,562 | $ | (204,757 | ) | $ | (7,147 | ) | $ | 14,846,622 | |||||||
| December 31, 2012 | |||||||||||||||||||
| (dollars in thousands) | Amortized Cost | Gross Unrealized Holding Gains | Gross Unrealized Holding Losses | Unrealized Other- Than-Temporary Impairment Losses | Estimated Fair Value | ||||||||||||||
| Fixed maturities: | |||||||||||||||||||
| U.S. Treasury securities and obligations of U.S. government agencies | $ | 297,663 | $ | 19,844 | $ | — | $ | — | $ | 317,507 | |||||||||
| Obligations of states, municipalities and political subdivisions | 2,586,867 | 245,057 | (362 | ) | — | 2,831,562 | |||||||||||||
| Foreign governments | 503,844 | 52,764 | — | — | 556,608 | ||||||||||||||
| Residential mortgage-backed securities | 202,644 | 14,996 | (5 | ) | (2,258 | ) | 215,377 | ||||||||||||
| Asset-backed securities | 13,828 | 517 | — | — | 14,345 | ||||||||||||||
| Corporate bonds | 957,432 | 93,395 | (121 | ) | (6,822 | ) | 1,043,884 | ||||||||||||
| Total fixed maturities | 4,562,278 | 426,573 | (488 | ) | (9,080 | ) | 4,979,283 | ||||||||||||
| Equity securities: | |||||||||||||||||||
| Insurance, banks and other financial institutions | 508,771 | 389,434 | (138 | ) | — | 898,067 | |||||||||||||
| Industrial, consumer and all other | 878,534 | 637,783 | (7,433 | ) | — | 1,508,884 | |||||||||||||
| Total equity securities | 1,387,305 | 1,027,217 | (7,571 | ) | — | 2,406,951 | |||||||||||||
| Short-term investments | 973,318 | 26 | (14 | ) | — | 973,330 | |||||||||||||
| Investments, available-for-sale | $ | 6,922,901 | $ | 1,453,816 | $ | (8,073 | ) | $ | (9,080 | ) | $ | 8,359,564 | |||||||
b)The following tables summarize gross unrealized investment losses by the length of time that securities have continuously been in an unrealized loss position.
| December 31, 2010 | ||||||||||||||||||||||||
| Less than 12 months | 12 months or longer | Total | ||||||||||||||||||||||
(dollars in thousands) | Estimated Fair Value | Gross Unrealized Holding and Other- Than-Temporary Impairment Losses | Estimated Fair Value | Gross Unrealized Holding and Other- Than-Temporary Impairment Losses | Estimated Fair Value | Gross Unrealized Holding and Other- Than-Temporary Impairment Losses | ||||||||||||||||||
Fixed maturities: | ||||||||||||||||||||||||
U.S. Treasury securities and obligations of U.S. government agencies | $ | 23,574 | $ | (49 | ) | $ | — | $ | — | $ | 23,574 | $ | (49 | ) | ||||||||||
Obligations of states, municipalities and political subdivisions | 942,935 | (27,463 | ) | 22,468 | (1,987 | ) | 965,403 | (29,450 | ) | |||||||||||||||
Foreign governments | 119,211 | (2,440 | ) | 4,955 | (159 | ) | 124,166 | (2,599 | ) | |||||||||||||||
Residential mortgage-backed securities | 20,972 | (10,822 | ) | 10,534 | (2,694 | ) | 31,506 | (13,516 | ) | |||||||||||||||
All other corporate bonds | 15,294 | (7,921 | ) | 15,966 | (475 | ) | 31,260 | (8,396 | ) | |||||||||||||||
Total fixed maturities | 1,121,986 | (48,695 | ) | 53,923 | (5,315 | ) | 1,175,909 | (54,010 | ) | |||||||||||||||
Equity securities: | ||||||||||||||||||||||||
Insurance companies, banks and trusts | 22,750 | (1,496 | ) | — | — | 22,750 | (1,496 | ) | ||||||||||||||||
Industrial, consumer and all other | 16,712 | (699 | ) | — | — | 16,712 | (699 | ) | ||||||||||||||||
Total equity securities | 39,462 | (2,195 | ) | — | — | 39,462 | (2,195 | ) | ||||||||||||||||
TOTAL | $ | 1,161,448 | $ | (50,890 | ) | $ | 53,923 | $ | (5,315 | ) | $ | 1,215,371 | $ | (56,205 | ) | |||||||||
| December 31, 2013 | |||||||||||||||||||||||
| Less than 12 months | 12 months or longer | Total | |||||||||||||||||||||
| (dollars in thousands) | Estimated Fair Value | Gross Unrealized Holding and Other-Than- Temporary Impairment Losses | Estimated Fair Value | Gross Unrealized Holding and Other-Than- Temporary Impairment Losses | Estimated Fair Value | Gross Unrealized Holding and Other-Than- Temporary Impairment Losses | |||||||||||||||||
| Fixed maturities: | |||||||||||||||||||||||
| U.S. Treasury securities and obligations of U.S. government agencies | $ | 587,929 | $ | (30,342 | ) | $ | — | $ | — | $ | 587,929 | $ | (30,342 | ) | |||||||||
| Obligations of states, municipalities and political subdivisions | 513,608 | (27,238 | ) | 3,512 | (146 | ) | 517,120 | (27,384 | ) | ||||||||||||||
| Foreign governments | 950,040 | (54,411 | ) | — | — | 950,040 | (54,411 | ) | |||||||||||||||
| Commercial mortgage-backed securities | 357,737 | (11,796 | ) | — | — | 357,737 | (11,796 | ) | |||||||||||||||
| Residential mortgage-backed securities | 437,675 | (18,700 | ) | — | — | 437,675 | (18,700 | ) | |||||||||||||||
| Asset-backed securities | 142,011 | (1,614 | ) | — | — | 142,011 | (1,614 | ) | |||||||||||||||
| Corporate bonds | 1,817,737 | (66,539 | ) | — | — | 1,817,737 | (66,539 | ) | |||||||||||||||
| Total fixed maturities | 4,806,737 | (210,640 | ) | 3,512 | (146 | ) | 4,810,249 | (210,786 | ) | ||||||||||||||
| Equity securities: | |||||||||||||||||||||||
| Insurance, banks and other financial institutions | 144 | (4 | ) | — | — | 144 | (4 | ) | |||||||||||||||
| Industrial, consumer and all other | 20,943 | (714 | ) | 27,735 | (400 | ) | 48,678 | (1,114 | ) | ||||||||||||||
| Total equity securities | 21,087 | (718 | ) | 27,735 | (400 | ) | 48,822 | (1,118 | ) | ||||||||||||||
| Total | $ | 4,827,824 | $ | (211,358 | ) | $ | 31,247 | $ | (546 | ) | $ | 4,859,071 | $ | (211,904 | ) | ||||||||
| 45
The Company has the ability and intent to hold the equity security for a period of time sufficient to allow for the anticipated recovery of its fair value.
Markel Corporation & Subsidiaries
NOTES TO CONSOLIDATED FINANCIAL STATEMENTS (continued)
| December 31, 2012 | |||||||||||||||||||||||
| Less than 12 months | 12 months or longer | Total | |||||||||||||||||||||
| (dollars in thousands) | Estimated Fair Value | Gross Unrealized Holding and Other-Than- Temporary Impairment Losses | Estimated Fair Value | Gross Unrealized Holding and Other-Than- Temporary Impairment Losses | Estimated Fair Value | Gross Unrealized Holding and Other-Than- Temporary Impairment Losses | |||||||||||||||||
| Fixed maturities: | |||||||||||||||||||||||
| Obligations of states, municipalities and political subdivisions | $ | 2,833 | $ | (46 | ) | $ | 3,616 | $ | (316 | ) | $ | 6,449 | $ | (362 | ) | ||||||||
| Residential mortgage-backed securities | 364 | (2,260 | ) | 201 | (3 | ) | 565 | (2,263 | ) | ||||||||||||||
| Corporate bonds | — | (6,822 | ) | 3,860 | (121 | ) | 3,860 | (6,943 | ) | ||||||||||||||
| Total fixed maturities | 3,197 | (9,128 | ) | 7,677 | (440 | ) | 10,874 | (9,568 | ) | ||||||||||||||
| Equity securities: | |||||||||||||||||||||||
| Insurance, banks and other financial institutions | 2,431 | (138 | ) | — | — | 2,431 | (138 | ) | |||||||||||||||
| Industrial, consumer and all other | 82,109 | (7,310 | ) | 1,983 | (123 | ) | 84,092 | (7,433 | ) | ||||||||||||||
| Total equity securities | 84,540 | (7,448 | ) | 1,983 | (123 | ) | 86,523 | (7,571 | ) | ||||||||||||||
| Short-term investments | 228,820 | (14 | ) | — | — | 228,820 | (14 | ) | |||||||||||||||
| Total | $ | 316,557 | $ | (16,590 | ) | $ | 9,660 | $ | (563 | ) | $ | 326,217 | $ | (17,153 | ) | ||||||||
| December 31, 2009 | ||||||||||||||||||||||||
| Less than 12 months | 12 months or longer | Total | ||||||||||||||||||||||
(dollars in thousands) | Estimated Fair Value | Gross Unrealized Holding and Other- Than-Temporary Impairment Losses | Estimated Fair Value | Gross Unrealized Holding and Other- Than-Temporary Impairment Losses | Estimated Fair Value | Gross Unrealized Holding and Other- Than-Temporary Impairment Losses | ||||||||||||||||||
Fixed maturities: | ||||||||||||||||||||||||
U.S. Treasury securities and obligations of U.S. government agencies | $ | 23,798 | $ | (91 | ) | $ | — | $ | — | $ | 23,798 | $ | (91 | ) | ||||||||||
Obligations of states, municipalities and political subdivisions | 373,382 | (9,946 | ) | 153,500 | (6,817 | ) | 526,882 | (16,763 | ) | |||||||||||||||
Foreign governments | 92,166 | (2,335 | ) | — | — | 92,166 | (2,335 | ) | ||||||||||||||||
Residential mortgage-backed securities | 33,223 | (12,748 | ) | 11,162 | (1,128 | ) | 44,385 | (13,876 | ) | |||||||||||||||
Asset-backed securities | — | — | 10,607 | (1,001 | ) | 10,607 | �� | (1,001 | ) | |||||||||||||||
All other corporate bonds | 58,482 | (11,332 | ) | 138,127 | (5,069 | ) | 196,609 | (16,401 | ) | |||||||||||||||
Total fixed maturities | 581,051 | (36,452 | ) | 313,396 | (14,015 | ) | 894,447 | (50,467 | ) | |||||||||||||||
Equity securities: | ||||||||||||||||||||||||
Insurance companies, banks and trusts | 45,917 | (3,521 | ) | — | — | 45,917 | (3,521 | ) | ||||||||||||||||
Industrial, consumer and all other | 10,943 | (325 | ) | — | — | 10,943 | (325 | ) | ||||||||||||||||
Total equity securities | 56,860 | (3,846 | ) | — | — | 56,860 | (3,846 | ) | ||||||||||||||||
Short-term investments | 4,298 | (2 | ) | — | — | 4,298 | (2 | ) | ||||||||||||||||
TOTAL | $ | 642,209 | $ | (40,300 | ) | $ | 313,396 | $ | (14,015 | ) | $ | 955,605 | $ | (54,315 | ) | |||||||||
At December 31, 2009,2012, the Company held 19035 securities with a total estimated fair value of $955.6$326.2 million and gross unrealized losses of $54.3 million.$17.2 million. Of these 19035 securities, 78ten securities had been in a continuous unrealized loss position for greater than one year or longer and had a total estimated fair value of $313.4$9.7 million and gross unrealized losses of $14.0 million. All 78$0.6 million. Of these securities, eight securities were fixed maturities.
maturities and two were equity securities.
46 |
2. Investments (continued)
fundamentals of the industry in which the issuer operates;
expectations of defaults and recovery rates;
changes in ratings by rating agencies;
other relevant market considerations; and
receipt of interest payments
| 47
Markel Corporation & Subsidiaries
NOTES TO CONSOLIDATED FINANCIAL STATEMENTS (continued)
c)The amortized cost and estimated fair value of fixed maturities at December 31, 20102013 are shown below by contractual maturity and investment type.maturity.
(dollars in thousands) | Amortized Cost | Estimated Fair Value | ||||||
U.S. Treasury securities and obligations of U.S. government agencies: | ||||||||
Due in one year or less | $ | 39,857 | $ | 40,540 | ||||
Due after one year through five years | 167,837 | 181,006 | ||||||
Due after five years through ten years | 89,465 | 96,319 | ||||||
Due after ten years | 3,396 | 3,473 | ||||||
TOTAL | 300,555 | 321,338 | ||||||
Obligations of states, municipalities and political subdivisions: | ||||||||
Due in one year or less | 6,943 | 7,011 | ||||||
Due after one year through five years | 104,991 | 106,993 | ||||||
Due after five years through ten years | 1,005,067 | 1,034,138 | ||||||
Due after ten years | 1,650,168 | 1,651,197 | ||||||
TOTAL | 2,767,169 | 2,799,339 | ||||||
Foreign governments: | ||||||||
Due in one year or less | 9,070 | 9,103 | ||||||
Due after one year through five years | 203,929 | 212,333 | ||||||
Due after five years through ten years | 301,776 | 316,951 | ||||||
Due after ten years | 35,980 | 34,431 | ||||||
TOTAL | 550,755 | 572,818 | ||||||
Residential mortgage-backed securities: | ||||||||
Due in one year or less | 4,811 | 4,890 | ||||||
Due after one year through five years | 7,236 | 7,571 | ||||||
Due after five years through ten years | 30,641 | 31,488 | ||||||
Due after ten years | 366,727 | 381,614 | ||||||
TOTAL | 409,415 | 425,563 | ||||||
Asset-backed securities: | ||||||||
Due in one year or less | — | — | ||||||
Due after one year through five years | 10,950 | 11,536 | ||||||
Due after five years through ten years | 1,000 | 1,117 | ||||||
Due after ten years | 9,754 | 10,103 | ||||||
TOTAL | 21,704 | 22,756 | ||||||
Public utilities: | ||||||||
Due in one year or less | 25,244 | 25,783 | ||||||
Due after one year through five years | 53,649 | 58,023 | ||||||
Due after five years through ten years | 16,877 | 18,638 | ||||||
Due after ten years | — | — | ||||||
TOTAL | 95,770 | 102,444 | ||||||
Convertible bonds and all other corporate bonds: | ||||||||
Due in one year or less | 101,538 | 106,388 | ||||||
Due after one year through five years | 695,381 | 739,661 | ||||||
Due after five years through ten years | 310,329 | 336,521 | ||||||
Due after ten years | 4,364 | 4,398 | ||||||
TOTAL | 1,111,612 | 1,186,968 | ||||||
Total fixed maturities: | ||||||||
Due in one year or less | 187,463 | 193,715 | ||||||
Due after one year through five years | 1,243,973 | 1,317,123 | ||||||
Due after five years through ten years | 1,755,155 | 1,835,172 | ||||||
Due after ten years | 2,070,389 | 2,085,216 | ||||||
TOTAL FIXED MATURITIES | $ | 5,256,980 | $ | 5,431,226 | ||||
48 |
| (dollars in thousands) | Amortized Cost | Estimated Fair Value | |||||
| Due in one year or less | $ | 885,726 | $ | 891,654 | |||
| Due after one year through five years | 2,891,314 | 2,947,173 | |||||
| Due after five years through ten years | 2,217,759 | 2,254,169 | |||||
| Due after ten years | 2,689,239 | 2,623,182 | |||||
| 8,684,038 | 8,716,178 | ||||||
| Commercial mortgage-backed securities | 379,555 | 367,821 | |||||
| Residential mortgage-backed securities | 875,902 | 870,248 | |||||
| Asset-backed securities | 189,646 | 188,289 | |||||
| Total fixed maturities | $ | 10,129,141 | $ | 10,142,536 | |||
Expected maturities may differ from contractual maturities because borrowers may have the right to call or prepay obligations with or without call or prepayment penalties, and the lenders may have the right to put the securities back to the borrower. Based on expected maturities, the estimated average duration of the fixed maturities was 4.34.8 years.
| Years Ended December 31, | ||||||||||||
(dollars in thousands) | 2010 | 2009 | 2008 | |||||||||
Interest: | ||||||||||||
Municipal bonds (tax-exempt) | $ | 92,168 | $ | 83,695 | $ | 80,975 | ||||||
Taxable bonds | 150,843 | 150,169 | 170,400 | |||||||||
Short-term investments, including overnight deposits | 2,850 | 5,597 | 18,979 | |||||||||
Dividends on equity securities | 33,128 | 24,883 | 35,048 | |||||||||
Income (loss) from investments in affiliates | — | (379 | ) | 1,136 | ||||||||
Change in fair value of credit default swap | 1,740 | 2,996 | (13,698 | ) | ||||||||
Other | 1,337 | (151 | ) | (1,903 | ) | |||||||
| 282,066 | 266,810 | 290,937 | ||||||||||
Investment expenses | (9,536 | ) | (7,001 | ) | (8,789 | ) | ||||||
NET INVESTMENT INCOME | $ | 272,530 | $ | 259,809 | $ | 282,148 | ||||||
| Years Ended December 31, | |||||||||||
| (dollars in thousands) | 2013 | 2012 | 2011 | ||||||||
| Interest: | |||||||||||
| Municipal bonds (tax-exempt) | $ | 82,308 | $ | 90,316 | $ | 94,457 | |||||
| Municipal bonds (taxable) | 28,041 | 22,663 | 23,277 | ||||||||
| Other taxable bonds | 134,377 | 107,270 | 117,242 | ||||||||
| Short-term investments, including overnight deposits | 3,573 | 2,755 | 2,484 | ||||||||
| Dividends on equity securities | 48,641 | 50,416 | 35,996 | ||||||||
| Change in fair value of credit default swap | 10,460 | 16,641 | (4,103 | ) | |||||||
| Income from equity method investments | 21,898 | 1,961 | 584 | ||||||||
| Other | 355 | (41 | ) | 1,551 | |||||||
| 329,653 | 291,981 | 271,488 | |||||||||
| Investment expenses | (12,280 | ) | (9,874 | ) | (7,812 | ) | |||||
| Net investment income | $ | 317,373 | $ | 282,107 | $ | 263,676 | |||||
| Years Ended December 31, | ||||||||
(dollars in thousands) | 2010 | 2009 | ||||||
Cumulative credit loss, beginning of year | $ | 9,141 | $ | — | ||||
Adoption of FASB ASC 320-10 | — | 237 | ||||||
Additions: | ||||||||
Other-than-temporary impairment losses not previously recognized | — | 7,019 | ||||||
Increases related to other-than-temporary impairment losses previously recognized | 1,185 | 2,062 | ||||||
Total additions | 1,185 | 9,318 | ||||||
Reductions: | ||||||||
Sales of fixed maturities on which credit losses were recognized | (19 | ) | (177 | ) | ||||
Cumulative credit loss, end of year | $ | 10,307 | $ | 9,141 | ||||
| 49
| Years Ended December 31, | |||||||||||
| (dollars in thousands) | 2013 | 2012 | 2011 | ||||||||
| Cumulative credit loss, beginning of year | $ | 21,370 | $ | 21,370 | $ | 10,307 | |||||
| Additions: | |||||||||||
| Other-than-temporary impairment losses not previously recognized | — | — | 875 | ||||||||
| Increases related to other-than-temporary impairment losses previously recognized | — | — | 10,203 | ||||||||
| Total additions | — | — | 11,078 | ||||||||
| Reductions: | |||||||||||
| Sales or maturities of fixed maturities on which credit losses were recognized | (8,622 | ) | — | (15 | ) | ||||||
| Cumulative credit loss, end of year | $ | 12,748 | $ | 21,370 | $ | 21,370 | |||||
Markel Corporation & Subsidiaries
NOTES TO CONSOLIDATED FINANCIAL STATEMENTS (continued)
f)The following table presents net realized investment gains (losses) and the change in net unrealized gains on investments.
| Years Ended December 31, | ||||||||||||
(dollars in thousands) | 2010 | 2009 | 2008 | |||||||||
Realized gains: | ||||||||||||
Sales of fixed maturities | $ | 20,848 | $ | 5,752 | $ | 9,647 | ||||||
Sales of equity securities | 35,150 | 7,605 | 64,709 | |||||||||
Other | 1,966 | 5,781 | 1,267 | |||||||||
Total realized gains | 57,964 | 19,138 | 75,623 | |||||||||
Realized losses: | ||||||||||||
Sales of fixed maturities | (1,470 | ) | (25,230 | ) | (102,925 | ) | ||||||
Sales of equity securities | — | (58 | ) | (39,827 | ) | |||||||
Other-than-temporary impairments | (12,207 | ) | (89,950 | ) | (339,164 | ) | ||||||
Other | (7,925 | ) | — | (1,301 | ) | |||||||
Total realized losses | (21,602 | ) | (115,238 | ) | (483,217 | ) | ||||||
NET REALIZED INVESTMENT GAINS (LOSSES) | $ | 36,362 | $ | (96,100 | ) | $ | (407,594 | ) | ||||
Change in net unrealized gains on investments: | ||||||||||||
Fixed maturities | $ | 23,855 | $ | 280,210 | $ | (135,455 | ) | |||||
Equity securities | 219,895 | 287,407 | (372,215 | ) | ||||||||
Short-term investments | (14 | ) | (4 | ) | 22 | |||||||
NET INCREASE (DECREASE) | $ | 243,736 | $ | 567,613 | $ | (507,648 | ) | |||||
Net realized investment losses for the year ended December 31, 2010 included $12.2 million of write downs for other-than-temporary declines in the estimated fair value of investments. The write downs for other-than-temporary declines in the estimated fair value of investments for 2010 related to eight equity securities, four fixed maturities and four real estate investments. Net realized investment losses for the year ended December 31, 2009 included $90.0 million of write downs for other-than-temporary declines in the estimated fair value of investments. Net realized investment gains for the year ended December 31, 2008 included $339.2 million of write downs for other-than-temporary declines in the estimated fair value of investments.
50 |
| Years Ended December 31, | |||||||||||
| (dollars in thousands) | 2013 | 2012 | 2011 | ||||||||
| Realized gains: | |||||||||||
| Sales of fixed maturities | $ | 13,772 | $ | 18,337 | $ | 17,035 | |||||
| Sales of equity securities | 73,592 | 29,578 | 36,863 | ||||||||
| Other | 5,940 | 749 | 2,626 | ||||||||
| Total realized gains | 93,304 | 48,664 | 56,524 | ||||||||
| Realized losses: | |||||||||||
| Sales of fixed maturities | (25,168 | ) | (563 | ) | (410 | ) | |||||
| Sales of equity securities | (278 | ) | (342 | ) | (61 | ) | |||||
| Other-than-temporary impairments | (4,706 | ) | (12,078 | ) | (20,196 | ) | |||||
| Other | — | (4,088 | ) | — | |||||||
| Total realized losses | (30,152 | ) | (17,071 | ) | (20,667 | ) | |||||
| Net realized investment gains | $ | 63,152 | $ | 31,593 | $ | 35,857 | |||||
| Change in net unrealized gains on investments: | |||||||||||
| Fixed maturities | $ | (403,610 | ) | $ | 51,783 | $ | 190,976 | ||||
| Equity securities | 665,599 | 302,013 | (8,250 | ) | |||||||
| Short-term investments | 6 | 12 | (4 | ) | |||||||
| Net increase | $ | 261,995 | $ | 353,808 | $ | 182,722 | |||||
g)The following table presents other-than-temporary impairment losses recognized in net income (loss) and included in net realized investment gains (losses) by investment type.
| Years Ended December 31, | ||||||||||||
(dollars in thousands) | 2010 | 2009 | 2008 | |||||||||
Fixed maturities: | ||||||||||||
Corporate bonds | $ | — | $ | (7,310 | ) | $ | (46,452 | ) | ||||
Residential mortgage-backed securities | (1,185 | ) | (3,541 | ) | (7,691 | ) | ||||||
Other | — | (1,487 | ) | — | ||||||||
Total fixed maturities | (1,185 | ) | (12,338 | ) | (54,143 | ) | ||||||
Equity securities: | ||||||||||||
Insurance companies, banks and trusts | (2,872 | ) | (15,978 | ) | (99,226 | ) | ||||||
Industrial, consumer and all other | (965 | ) | (38,548 | ) | (176,795 | ) | ||||||
Total equity securities | (3,837 | ) | (54,526 | ) | (276,021 | ) | ||||||
Nonredeemable preferred stocks | — | — | (9,000 | ) | ||||||||
Investments in affiliates | — | (23,086 | ) | — | ||||||||
Other | (7,185 | ) | — | — | ||||||||
TOTAL | $ | (12,207 | ) | $ | (89,950 | ) | $ | (339,164 | ) | |||
| Years Ended December 31, | |||||||||||
| (dollars in thousands) | 2013 | 2012 | 2011 | ||||||||
| Fixed maturities: | |||||||||||
| Obligations of states, municipalities and political subdivisions | $ | (1,242 | ) | $ | — | $ | — | ||||
| Residential mortgage-backed securities | (640 | ) | — | (11,078 | ) | ||||||
| Total fixed maturities | (1,882 | ) | — | (11,078 | ) | ||||||
| Equity securities: | |||||||||||
| Insurance, banks and other financial institutions | — | (10,336 | ) | (4,251 | ) | ||||||
| Industrial, consumer and all other | (2,824 | ) | (1,742 | ) | (4,867 | ) | |||||
| Total equity securities | (2,824 | ) | (12,078 | ) | (9,118 | ) | |||||
| Total | $ | (4,706 | ) | $ | (12,078 | ) | $ | (20,196 | ) | ||
i)The Company had $1.6restricted assets totaling $6.1 billion and $1.5$1.4 billion, of investments and cash and cash equivalents (invested assets)respectively. Restricted assets held in trust or on deposit for the benefit of policyholders reinsurers or banks in the eventceding companies or to support underwriting activities were $5.2 billion and $1.3 billion as of default by the Company on its obligationsDecember 31, 2013 and December 31, 2012, respectively, of which $3.7 billion at December 31, 20102013 was attributable to Alterra. Additionally, the Company has pledged investments and 2009, respectively. These investedcash and cash equivalents totaling $695.1 million and $23.2 million as of December 31, 2013 and December 31, 2012, respectively, as security for letters of credit that have been issued by various banks on behalf of the Company, of which $645.4 million at December 31, 2013 was attributable to Alterra.
| (dollars in thousands) | December 31, 2013 | December 31, 2012 | |||||
| Investments, available-for-sale | $ | 5,225,701 | $ | 1,262,755 | |||
| Restricted cash and cash equivalents | 786,926 | 109,415 | |||||
| Other assets | 76,752 | — | |||||
| Total | $ | 6,089,379 | $ | 1,372,170 | |||
The Company’s United States insurance companies had invested assets with a carrying value of $43.3 million and $39.1 million on deposit with state regulatory authorities at At December 31, 20102013 and 2009, respectively.
Invested assets with a carrying value of $67.3 million and $3.0 million at December 31, 2010 and 2009, respectively, were held in trust for the benefit of cedents of the Company’s United States insurance companies.
Invested assets with a carrying value of $60.3 million and $58.4 million at December 31, 2010 and 2009, respectively, were held in trust for the benefit of United States cedents of Markel International Insurance Company Limited (MIICL)2012, a wholly-owned subsidiary, and to facilitate MIICL’s accreditation as an alien reinsurer by certain states.
Invested assets with a carrying value of $33.7 million and $32.2 million at December 31, 2010 and 2009, respectively, were held in trust for the benefit of MIICL’s United States surplus lines policyholders.
| 51
Markel Corporation & Subsidiaries
NOTES TO CONSOLIDATED FINANCIAL STATEMENTS (continued)
2. Investments (continued)
Banks have issued irrevocable undrawn letters of credit supporting the Company’s contingent liabilities related to certain reinsurance business written in the United States by MIICL. The Company had deposited invested assets with a carrying value of $25.3 million and $27.5 million at December 31, 2010 and 2009, respectively, as collateral against these letters of credit.
The Company had deposited $351.6 million and $333.8 million of invested assets with Lloyd’s to support its underwriting activities at December 31, 2010 and 2009, respectively. In addition, the Company had invested assets with a carrying value of $1.0 billion at December 31, 2010 and 2009 held in trust for the benefit of syndicate policyholders.
In accordance with the terms of its credit default swap agreement, the Company had $33.3 million and $33.1 million of invested assets on deposit at December 31, 2010 and 2009, respectively.
j)At December 31, 2010 and December 31, 2009, investments in U.S. Treasury securities and obligations of U.S. government agencies were the only investments in any one issuer that exceeded 10% of shareholders’shareholders' equity.
3.
| December 31, | ||||||||
(dollars in thousands) | 2010 | 2009 | ||||||
Amounts receivable from agents, brokers and insureds | $ | 257,028 | $ | 206,514 | ||||
Employee stock loans receivable (see note 10) | 13,694 | 15,821 | ||||||
Loan participations | 14,410 | 27,326 | ||||||
Other | 39,860 | 36,578 | ||||||
| 324,992 | 286,239 | |||||||
Allowance for doubtful receivables | (12,896 | ) | (6,360 | ) | ||||
RECEIVABLES | $ | 312,096 | $ | 279,879 | ||||
4.
| December 31, | |||||||
| (dollars in thousands) | 2013 | 2012 | |||||
| Amounts receivable from agents, brokers and insureds | $ | 1,058,021 | $ | 332,570 | |||
| Trade accounts receivable | 85,203 | 73,512 | |||||
| Employee stock loans receivable (see note 12(c)) | 12,822 | 11,413 | |||||
| Other | 5,420 | 12,982 | |||||
| 1,161,466 | 430,477 | ||||||
| Allowance for doubtful receivables | (19,693 | ) | (16,594 | ) | |||
| Receivables | $ | 1,141,773 | $ | 413,883 | |||
| Years Ended December 31, | ||||||||||||
(dollars in thousands) | 2010 | 2009 | 2008 | |||||||||
Balance, beginning of year | $ | 156,797 | $ | 183,755 | $ | 202,291 | ||||||
Policy acquisition costs of acquired insurance companies | 18,076 | — | — | |||||||||
Policy acquisition costs deferred | 439,803 | 413,858 | 487,990 | |||||||||
Amortization of policy acquisition costs | (425,893 | ) | (440,816 | ) | (506,526 | ) | ||||||
DEFERRED POLICY ACQUISITION COSTS | $ | 188,783 | $ | 156,797 | $ | 183,755 | ||||||
52 |
| Years Ended December 31, | |||||||||||
| (dollars in thousands) | 2013 | 2012 | 2011 | ||||||||
| Balance, beginning of year | $ | 157,465 | $ | 194,674 | $ | 188,783 | |||||
| Policy acquisition costs deferred | 575,417 | 390,900 | 485,345 | ||||||||
| Amortization of policy acquisition costs | (471,915 | ) | (428,109 | ) | (479,454 | ) | |||||
| Deferred policy acquisition costs | $ | 260,967 | $ | 157,465 | $ | 194,674 | |||||
4. Deferred Policy Acquisition Costs (continued)
| Years Ended December 31, | ||||||||||||
(dollars in thousands) | 2010 | 2009 | 2008 | |||||||||
Amortization of policy acquisition costs | $ | 425,893 | $ | 440,816 | $ | 506,526 | ||||||
Other operating expenses | 298,983 | 295,844 | 232,020 | |||||||||
UNDERWRITING, ACQUISITIONAND INSURANCE EXPENSES | $ | 724,876 | $ | 736,660 | $ | 738,546 | ||||||
| Years Ended December 31, | |||||||||||
| (dollars in thousands) | 2013 | 2012 | 2011 | ||||||||
Transaction costs and other acquisition-related expenses (1) | $ | 75,140 | $ | — | $ | — | |||||
Prospective adoption of FASB ASU No. 2010-26 (2) | — | 43,093 | — | ||||||||
| Other amortization of policy acquisition costs | 471,915 | 385,016 | 479,454 | ||||||||
| Other operating expenses | 765,257 | 501,363 | 330,725 | ||||||||
| Underwriting, acquisition and insurance expenses | $ | 1,312,312 | $ | 929,472 | $ | 810,179 | |||||
(1) | In connection with the acquisition of Alterra, the Company incurred transaction costs of $16.0 million for the year ended December 31, 2013, which primarily consist of due diligence, legal and investment banking costs. Additionally, the Company incurred severance costs of $31.7 million, stay bonuses of $14.8 million and other compensation costs totaling $12.6 million related to the acceleration of certain long-term incentive compensation awards and restricted stock awards that were granted by Alterra prior to the acquisition. |
(2) | Effective January 1, 2012, the Company prospectively adopted FASB ASU No. 2010-26, Accounting for Costs Associated with Acquiring or Renewing Insurance Contracts. At December 31, 2011, deferred policy acquisition costs included $43.1 million of costs that no longer met the criteria for deferral as of January 1, 2012 and were recognized into income during 2012, consistent with policy terms. |
| December 31, | ||||||||
(dollars in thousands) | 2010 | 2009 | ||||||
Land | $ | 35,105 | $ | 28,453 | ||||
Buildings | 22,758 | 14,173 | ||||||
Leasehold improvements | 45,512 | 38,607 | ||||||
Furniture and equipment | 137,512 | 110,641 | ||||||
Other | 41,288 | 13,510 | ||||||
| 282,175 | 205,384 | |||||||
Accumulated depreciation and amortization | (122,608 | ) | (105,145 | ) | ||||
PROPERTYAND EQUIPMENT | $ | 159,567 | $ | 100,239 | ||||
| December 31, | |||||||
| (dollars in thousands) | 2013 | 2012 | |||||
| Land | $ | 48,036 | $ | 45,199 | |||
| Buildings | 59,307 | 53,767 | |||||
| Leasehold improvements | 68,363 | 55,626 | |||||
| Land improvements | 57,673 | 51,512 | |||||
| Furniture and equipment | 217,528 | 211,354 | |||||
| Other | 104,690 | 85,714 | |||||
| 555,597 | 503,172 | ||||||
| Accumulated depreciation and amortization | (207,688 | ) | (172,943 | ) | |||
| Property and equipment | $ | 347,909 | $ | 330,229 | |||
6.
(dollars in thousands) | Excess and Surplus Lines Segment | Specialty Admitted Segment | London Insurance Market Segment | Other(1) | Total | |||||||||||||||
January 1, 2009 | $ | 81,770 | $ | 1,888 | $ | 248,558 | $ | 6,163 | $ | 338,379 | ||||||||||
Acquisitions | — | — | 42,860 | 20,235 | 63,095 | |||||||||||||||
Foreign currency movements | — | — | 1,045 | — | 1,045 | |||||||||||||||
December 31, 2009 | $ | 81,770 | $ | 1,888 | $ | 292,463 | $ | 26,398 | $ | 402,519 | ||||||||||
Acquisitions (see note 21) | — | 67,193 | — | 2,569 | 69,762 | |||||||||||||||
Foreign currency movements | — | — | 2,466 | — | 2,466 | |||||||||||||||
DECEMBER 31, 2010 | $ | 81,770 | $ | 69,081 | $ | 294,929 | $ | 28,967 | $ | 474,747 | ||||||||||
| (dollars in thousands) | Excess and Surplus Lines Segment | Specialty Admitted Segment | London Insurance Market Segment | Alterra Segment | Other(1) | Total | |||||||||||||||||
| January 1, 2012 | $ | 81,770 | $ | 64,914 | $ | 309,064 | $ | — | $ | 151,813 | $ | 607,561 | |||||||||||
| Acquisitions | — | 26,140 | — | — | 40,888 | 67,028 | |||||||||||||||||
| Foreign currency movements and other adjustments | — | — | 596 | — | (255 | ) | 341 | ||||||||||||||||
| December 31, 2012 | $ | 81,770 | $ | 91,054 | $ | 309,660 | $ | — | $ | 192,446 | $ | 674,930 | |||||||||||
| Acquisitions (see note 2) | — | — | — | 295,690 | 1,185 | 296,875 | |||||||||||||||||
| Foreign currency movements and other adjustments | — | — | (2,088 | ) | — | (2,000 | ) | (4,088 | ) | ||||||||||||||
| December 31, 2013 | $ | 81,770 | $ | 91,054 | $ | 307,572 | $ | 295,690 | $ | 191,631 | $ | 967,717 | |||||||||||
(1) |
|
| 53
Markel Corporation & Subsidiaries
NOTES TO CONSOLIDATED FINANCIAL STATEMENTS (continued)
.
| December 31, | ||||||||||||||||
(dollars in thousands) | 2010 | 2009 | ||||||||||||||
| Gross Carrying Amount | Accumulated Amortization | Gross Carrying Amount | Accumulated Amortization | |||||||||||||
Customer relationships | $ | 132,110 | $ | (23,949 | ) | $ | 83,791 | $ | (12,391 | ) | ||||||
Trade names | 34,127 | (1,431 | ) | 18,988 | (215 | ) | ||||||||||
Technology | 25,753 | (2,324 | ) | 7,900 | (1,095 | ) | ||||||||||
Other | 7,646 | (779 | ) | 5,450 | (2,114 | ) | ||||||||||
TOTAL | $ | 199,636 | $ | (28,483 | ) | $ | 116,129 | $ | (15,815 | ) | ||||||
assets with a net carrying amount.
| December 31, | |||||||||||||||
| 2013 | 2012 | ||||||||||||||
| (dollars in thousands) | Gross Carrying Amount | Accumulated Amortization | Gross Carrying Amount | Accumulated Amortization | |||||||||||
| Customer relationships | $ | 298,886 | $ | (43,286 | ) | $ | 171,591 | $ | (29,955 | ) | |||||
| Broker relationships | 178,693 | (23,255 | ) | 135,867 | (12,317 | ) | |||||||||
| Trade names | 65,880 | (12,666 | ) | 75,781 | (9,075 | ) | |||||||||
| Technology | 56,429 | (16,222 | ) | 40,109 | (11,785 | ) | |||||||||
| Insurance licenses | 40,185 | (133 | ) | 4,300 | (67 | ) | |||||||||
| Lloyd's syndicate capacity | 12,000 | — | — | — | |||||||||||
| Other | 14,197 | (5,625 | ) | 14,558 | (4,712 | ) | |||||||||
| Total | $ | 666,270 | $ | (101,187 | ) | $ | 442,206 | $ | (67,911 | ) | |||||
7.
| Years Ended December 31, | ||||||||||||
(dollars in thousands) | 2010 | 2009 | 2008 | |||||||||
Domestic | $ | 174,543 | $ | 86,592 | $ | (100,512 | ) | |||||
Foreign | 120,968 | 112,045 | (59,317 | ) | ||||||||
INCOME (LOSS) BEFORE INCOME TAXES | $ | 295,511 | $ | 198,637 | $ | (159,829 | ) | |||||
| Years Ended December 31, | |||||||||||
| (dollars in thousands) | 2013 | 2012 | 2011 | ||||||||
| Domestic operations | $ | 325,133 | $ | 126,466 | $ | 200,446 | |||||
| Foreign operations | 36,610 | 185,584 | (10,250 | ) | |||||||
| Income before income taxes | $ | 361,743 | $ | 312,050 | $ | 190,196 | |||||
| Years Ended December 31, | ||||||||||||
(dollars in thousands) | 2010 | 2009 | 2008 | |||||||||
Current: | ||||||||||||
Domestic | $ | 22,875 | $ | 8,076 | $ | (1,041 | ) | |||||
Foreign | (2,278 | ) | (2,714 | ) | 63 | |||||||
Total current tax expense (benefit) | 20,597 | 5,362 | (978 | ) | ||||||||
Deferred: | ||||||||||||
Domestic | 1,050 | (6,763 | ) | (63,702 | ) | |||||||
Foreign | 6,135 | (2,381 | ) | (36,715 | ) | |||||||
Total deferred tax expense (benefit) | 7,185 | (9,144 | ) | (100,417 | ) | |||||||
INCOME TAX EXPENSE (BENEFIT) | $ | 27,782 | $ | (3,782 | ) | $ | (101,395 | ) | ||||
54 |
7. Income Taxes (continued)
| Years Ended December 31, | |||||||||||
| (dollars in thousands) | 2013 | 2012 | 2011 | ||||||||
| Current: | |||||||||||
| Domestic | $ | 50,683 | $ | 14,340 | $ | 35,721 | |||||
| Foreign | 23,165 | 1,814 | 340 | ||||||||
| Total current tax expense | 73,848 | 16,154 | 36,061 | ||||||||
| Deferred: | |||||||||||
| Domestic | 23,906 | (3,734 | ) | 436 | |||||||
| Foreign | (19,856 | ) | 41,382 | 5,213 | |||||||
| Total deferred tax expense | 4,050 | 37,648 | 5,649 | ||||||||
| Income tax expense | $ | 77,898 | $ | 53,802 | $ | 41,710 | |||||
In 2010, income tax expense included a benefit from a reduction in the provision for interest and penalties of $3.9 million. In 2009, income tax benefit included an increase in the provision for interest and penalties of $2.7 million. In 2008, income tax benefit included a benefit from a reduction in the provision for interest and penalties of $3.5 million. At December 31, 2010 and 2009, other liabilities on the consolidated balance sheets included $2.4 million and $6.3 million, respectively, for potential payment of interest and penalties.
| Years Ended December 31, | ||||||||||||
| 2010 | 2009 | 2008 | ||||||||||
United States corporate tax rate | 35 | % | 35 | % | 35 | % | ||||||
Tax-exempt investment income | (11 | ) | (14 | ) | 18 | |||||||
Uncertain tax positions | (1 | ) | 2 | (6 | ) | |||||||
Tax credits | 1 | (3 | ) | 19 | ||||||||
Foreign operations | (13 | ) | (21 | ) | (2 | ) | ||||||
Other | (2 | ) | (1 | ) | (1 | ) | ||||||
EFFECTIVE TAX RATE | 9 | % | (2 | %) | 63 | % | ||||||
The 2010 effective tax rate included a 13% income tax benefit related to foreign operations,
| Years Ended December 31, | ||||||||
| 2013 | 2012 | 2011 | ||||||
| United States corporate tax rate | 35 | % | 35 | % | 35 | % | ||
| Tax-exempt investment income | (9 | ) | (12 | ) | (18 | ) | ||
| Uncertain tax positions | — | — | (2 | ) | ||||
| Foreign operations | (4 | ) | (5 | ) | 6 | |||
| Other | — | (1 | ) | 1 | ||||
| Effective tax rate | 22 | % | 17 | % | 22 | % | ||
| December 31, | ||||||||
(dollars in thousands) | 2010 | 2009 | ||||||
Assets: | ||||||||
Differences between financial reporting and tax bases | $ | 101,419 | $ | 62,620 | ||||
Unpaid losses and loss adjustment expenses not yet deductible for income tax purposes | 105,183 | 102,999 | ||||||
Unearned premiums recognized for income tax purposes | 36,416 | 32,080 | ||||||
Other-than-temporary impairments not yet deductible for income tax purposes | 42,377 | 68,084 | ||||||
Net operating loss carryforwards | 93,864 | 154,406 | ||||||
Tax credit carryforwards | 25,582 | 22,185 | ||||||
Total gross deferred tax assets | 404,841 | 442,374 | ||||||
Liabilities: | ||||||||
Differences between financial reporting and tax bases | 36,004 | 18,708 | ||||||
Deferred policy acquisition costs | 44,813 | 37,597 | ||||||
Net unrealized gains on investments | 260,761 | 193,495 | ||||||
Undistributed investment in foreign subsidiaries | — | 31,418 | ||||||
Total gross deferred tax liabilities | 341,578 | 281,218 | ||||||
NET DEFERRED TAX ASSET | $ | 63,263 | $ | 161,156 | ||||
| December 31, | |||||||
| (dollars in thousands) | 2013 | 2012 | |||||
| Assets: | |||||||
| Differences between financial reporting and tax bases | $ | 139,357 | $ | 81,305 | |||
| Unpaid losses and loss adjustment expenses | 283,365 | 122,217 | |||||
| Life and annuity benefits | 161,209 | — | |||||
| Unearned premiums recognized for income tax purposes | 76,862 | 42,938 | |||||
| Other-than-temporary impairments not yet deductible for income tax purposes | 34,978 | 40,450 | |||||
| Net operating loss carryforwards | 43,010 | 7,388 | |||||
| Tax credit carryforwards | 33,773 | 41,387 | |||||
| Total gross deferred tax assets | 772,554 | 335,685 | |||||
| Liabilities: | |||||||
| Differences between financial reporting and tax bases | 46,699 | 33,323 | |||||
| Deferred policy acquisition costs | 65,543 | 36,039 | |||||
| Net unrealized gains on investments | 459,015 | 406,295 | |||||
| Amortization of goodwill and other intangible assets | 97,580 | 28,931 | |||||
| Total gross deferred tax liabilities | 668,837 | 504,588 | |||||
| Net deferred tax asset (liability) | $ | 103,717 | $ | (168,903 | ) | ||
sheet. The net deferred tax liability at
2019.
between the years 2027 and 2033.
56 |
7. Income Taxes (continued)
prudent and feasible tax planning strategies if future taxable income is not sufficient. While management believes that a valuation allowance at
At December 31, 2010,2013
| Years Ended December 31, | ||||||||
(dollars in thousands) | 2010 | 2009 | ||||||
Unrecognized Tax Benefits, Beginning of Year | $ | 24,940 | $ | 59,237 | ||||
Increases based upon tax positions taken during the current year | 863 | 1,140 | ||||||
Increases for tax positions taken in prior years | 342 | 9,022 | ||||||
Decreases for tax positions taken in prior years | (744 | ) | (42,601 | ) | ||||
Settlement with taxing authorities | — | (1,858 | ) | |||||
Lapse of statute of limitations | (816 | ) | — | |||||
UNRECOGNIZED TAX BENEFITS, ENDOF YEAR | $ | 24,585 | $ | 24,940 | ||||
The $42.6 million decrease in 2009 for tax positions taken in prior years represented future tax return benefits that the Company no longer anticipated recognizing in its consolidated financial statements.
Provisions for United States income taxes on undistributed earnings of foreign subsidiaries are made only on those amounts in excess of the amounts that are considered to be permanently reinvested. As of
| Years Ended December 31, | |||||||
| (dollars in thousands) | 2013 | 2012 | |||||
| Unrecognized tax benefits, beginning of year | $ | 18,870 | $ | 19,586 | |||
| Increases based upon tax positions taken during the current year | — | 888 | |||||
| Increases for tax positions taken in prior years | — | 218 | |||||
| Decreases for tax positions taken in prior years | — | (764 | ) | ||||
| Lapse of statute of limitations | (651 | ) | (1,058 | ) | |||
| Unrecognized tax benefits, end of year | $ | 18,219 | $ | 18,870 | |||
| 57
Markel Corporation & Subsidiaries
NOTES TO CONSOLIDATED FINANCIAL STATEMENTS (continued)
8.2010.
a)The following table presents a reconciliation of consolidated beginning and ending reserves for losses and loss adjustment expenses.
| Years Ended December 31, | ||||||||||||
(dollars in thousands) | 2010 | 2009 | 2008 | |||||||||
NET RESERVESFOR LOSSESAND LOSS ADJUSTMENT EXPENSES, BEGINNINGOF YEAR | $ | 4,540,654 | $ | 4,465,481 | $ | 4,452,655 | ||||||
Foreign currency movements, commutations and other | (5,070 | ) | 86,362 | (192,838 | ) | |||||||
ADJUSTED NET RESERVESFOR LOSSESAND LOSS ADJUSTMENT EXPENSES, BEGINNINGOF YEAR | 4,535,584 | 4,551,843 | 4,259,817 | |||||||||
Incurred losses and loss adjustment expenses: | ||||||||||||
Current year | 1,224,270 | 1,228,152 | 1,432,808 | |||||||||
Prior years | (278,041 | ) | (235,289 | ) | (163,783 | ) | ||||||
TOTAL INCURRED LOSSESAND LOSS ADJUSTMENT EXPENSES | 946,229 | 992,863 | 1,269,025 | |||||||||
Payments: | ||||||||||||
Current year | 269,469 | 247,814 | 310,953 | |||||||||
Prior years | 796,138 | 759,522 | 727,609 | |||||||||
TOTAL PAYMENTS | 1,065,607 | 1,007,336 | 1,038,562 | |||||||||
Effect of foreign currency rate changes | 1,773 | 3,284 | (20,080 | ) | ||||||||
Net reserves for losses and loss adjustment expenses of acquired insurance companies | 182,337 | — | — | |||||||||
Other | — | — | (4,719 | ) | ||||||||
NET RESERVESFOR LOSSESAND LOSS ADJUSTMENT EXPENSES, ENDOF YEAR | 4,600,316 | 4,540,654 | 4,465,481 | |||||||||
Reinsurance recoverable on unpaid losses | 798,090 | 886,442 | 1,026,858 | |||||||||
GROSS RESERVESFOR LOSSESAND LOSS ADJUSTMENT EXPENSES, ENDOF YEAR | $ | 5,398,406 | $ | 5,427,096 | $ | 5,492,339 | ||||||
| Years Ended December 31, | |||||||||||
| (dollars in thousands) | 2013 | 2012 | 2011 | ||||||||
| Net reserves for losses and loss adjustment expenses, beginning of year | $ | 4,592,652 | $ | 4,607,767 | $ | 4,600,316 | |||||
| Foreign currency movements, commutations and other | (780 | ) | 30,359 | (7,496 | ) | ||||||
| Adjusted net reserves for losses and loss adjustment expenses, beginning of year | 4,591,872 | 4,638,126 | 4,592,820 | ||||||||
| Incurred losses and loss adjustment expenses: | |||||||||||
| Current year | 2,227,402 | 1,553,070 | 1,563,993 | ||||||||
| Prior years | (411,129 | ) | (399,002 | ) | (354,007 | ) | |||||
| Total incurred losses and loss adjustment expenses | 1,816,273 | 1,154,068 | 1,209,986 | ||||||||
| Payments: | |||||||||||
| Current year | 670,928 | 268,745 | 291,837 | ||||||||
| Prior years | 906,302 | 931,955 | 898,318 | ||||||||
| Total payments | 1,577,230 | 1,200,700 | 1,190,155 | ||||||||
| Effect of foreign currency rate changes | (7,915 | ) | 1,158 | (4,884 | ) | ||||||
| Net reserves for losses and loss adjustment expenses of acquired insurance companies | 3,584,642 | — | — | ||||||||
| Net reserves for losses and loss adjustment expenses, end of year | 8,407,642 | 4,592,652 | 4,607,767 | ||||||||
| Reinsurance recoverable on unpaid losses | 1,854,414 | 778,774 | 791,102 | ||||||||
| Gross reserves for losses and loss adjustment expenses, end of year | $ | 10,262,056 | $ | 5,371,426 | $ | 5,398,869 | |||||
Alterra.
58 |
8. Unpaid Losses and Loss Adjustment Expenses (continued)
Excess and Surplus Lines segment as actual claims reporting patterns on prior accident years have been more favorable than the Company's actuarial analyses initially anticipated withinanticipated. The favorable development on prior years' loss reserves in
review of its A&E exposures. Over the past few years, the number of A&E claims reported each year across the property and casualty industry has been on the decline. However, at the same time, the likelihood of making an indemnity payment has risen, thus increasing the average cost per reported claim. During our 2012 annual review, we reduced our estimate of the ultimate claims count, while increasing our estimate of the number of claims that would ultimately be closed with an indemnity payment. During our 2013 annual review, our expectation of the severity of the outcome of known claims increased. As a result, prior years' loss reserves for A&E exposures were increased by $28.4 million in 2013 and
$31.1 million in 2012. During the 2011 review, the Company determined that no adjustment to loss reserves was necessary.Current year incurred losses and loss adjustment expenses for 2008 included $91.1 million of estimated net losses on Hurricanes Gustav and Ike (2008 Hurricanes). The estimated net losses on the 2008 Hurricanes were net of estimated reinsurance recoverables of $58.6 million.
In 2008, incurred losses and loss adjustment expenses included $163.8 million of favorable development on prior years’ loss reserves, which was primarily due to $149.6 million of loss reserve redundancies experienced at Markel International and on the professional and products liability programs within the Excess and Surplus Lines segment as actual claims reporting patterns on prior accident years were more favorable than initially anticipated within the Company’s actuarial analyses. The favorable development on prior years’ loss reserves in 2008 was partially offset by $24.9 million of adverse development on prior years’ loss reserves on asbestos and environmental exposures and related reinsurance bad debt.
During the third quarter of each of the past three years, the Company completed an in-depth, actuarial review of its asbestos and environmental exposures. During the 2010 review, the Company determined that no adjustment to loss reserves was necessary. During the 2009 review, the Company increased its estimate of the number of claims that will ultimately be closed with an indemnity payment. During the 2008 review, the Company noted that claims had been closed with total indemnity payments that were higher than had been anticipated, and as a result of this higher than expected average severity on closed claims, the Company’s actuaries updated their average severity assumptions for both open claims and claims incurred but not yet reported. In 2009 and 2008, the Company’s actuarial estimates of the ultimate liability for asbestos and environmental loss reserves were increased, and management increased prior years’ loss reserves for asbestos and environmental exposures accordingly.
anticipated.
| 59
Markel Corporation & Subsidiaries
NOTES TO CONSOLIDATED FINANCIAL STATEMENTS (continued)
8. Unpaid Losses and Loss Adjustment Expenses (continued)
| Years Ended December 31, | ||||||||||||
(dollars in thousands) | 2010 | 2009 | 2008 | |||||||||
NET RESERVESFOR A&E LOSSESAND LOSS ADJUSTMENT EXPENSES, BEGINNINGOF YEAR | $ | 229,030 | $ | 238,272 | $ | 221,654 | ||||||
Commutations and other | 111 | (500 | ) | (191 | ) | |||||||
ADJUSTED NET RESERVESFOR A&E LOSSESAND LOSS ADJUSTMENT EXPENSES, BEGINNINGOF YEAR | 229,141 | 237,772 | 221,463 | |||||||||
Incurred losses and loss adjustment expenses | (428 | ) | 2,657 | 22,106 | ||||||||
Payments | (12,679 | ) | (11,399 | ) | (5,297 | ) | ||||||
NET RESERVESFOR A&E LOSSESAND LOSS ADJUSTMENT EXPENSES, ENDOF YEAR | 216,034 | 229,030 | 238,272 | |||||||||
Reinsurance recoverable on unpaid losses | 132,021 | 153,078 | 154,901 | |||||||||
GROSS RESERVESFOR A&E LOSSESAND LOSS ADJUSTMENT EXPENSES, ENDOF YEAR | $ | 348,055 | $ | 382,108 | $ | 393,173 | ||||||
Incurred Amounts included in the following table are presented before consideration of reinsurance allowances.
| Years Ended December 31, | |||||||||||
| (dollars in thousands) | 2013 | 2012 | 2011 | ||||||||
| Net reserves for A&E losses and loss adjustment expenses, beginning of year | $ | 260,791 | $ | 244,772 | $ | 216,034 | |||||
| Commutations and other | (5,067 | ) | (897 | ) | 36,271 | ||||||
| Adjusted net reserves for A&E losses and loss adjustment expenses, beginning of year | 255,724 | 243,875 | 252,305 | ||||||||
| Incurred losses and loss adjustment expenses | 30,128 | 38,179 | (134 | ) | |||||||
| Payments | (13,658 | ) | (21,263 | ) | (7,399 | ) | |||||
| Net reserves for A&E losses and loss adjustment expenses, end of year | 272,194 | 260,791 | 244,772 | ||||||||
| Reinsurance recoverable on unpaid losses | 100,784 | 100,063 | 89,391 | ||||||||
| Gross reserves for A&E losses and loss adjustment expenses, end of year | $ | 372,978 | $ | 360,854 | $ | 334,163 | |||||
Net reserves for reported claims and net incurred but not reported reserves for A&E exposures were $131.6
60 |
The Company’sCompany's reserves for losses and loss adjustment expenses related to A&E exposures represent management’smanagement's best estimate of ultimate settlement values. A&E reserves are monitored by management, and the Company’sCompany's statistical analysis of these reserves is reviewed by the Company’sCompany's independent actuaries. A&E exposures are subject to significant uncertainty due to potential loss severity and frequency resulting from the uncertain and unfavorable legal climate. A&E reserves could be subject to increases in the future; however, management believes the Company’sCompany's gross and net A&E reserves at December 31, 20102013 are adequate.
9.
| (dollars in thousands) | |||
| Life | $ | 190,765 | |
| Annuities | 1,194,558 | ||
| Accident and health | 101,251 | ||
| $ | 1,486,574 | ||
| December 31, | ||||||||
(dollars in thousands) | 2010 | 2009 | ||||||
6.80% unsecured senior notes, due February 15, 2013, interest payable semi-annually, net of unamortized discount of $582 in 2010 and $851 in 2009 | $ | 246,083 | $ | 245,814 | ||||
7.125% unsecured senior notes, due September 30, 2019, interest payable semi-annually, net of unamortized discount of $2,474 in 2010 and $2,757 in 2009 | 347,526 | 347,243 | ||||||
7.35% unsecured senior notes, due August 15, 2034, interest payable semi-annually, net of unamortized discount of $2,503 in 2010 and $2,609 in 2009 | 197,497 | 197,391 | ||||||
7.50% unsecured senior debentures, due August 22, 2046, interest payable quarterly, net of unamortized discount of $4,091 in 2010 and $4,206 in 2009 | 145,909 | 145,794 | ||||||
Subsidiary debt, at various interest rates ranging from 2.7% to 8.8% | 78,932 | 27,406 | ||||||
SENIOR LONG-TERM DEBTAND OTHER DEBT | $ | 1,015,947 | $ | 963,648 | ||||
| December 31, | |||||||
| (dollars in thousands) | 2013 | 2012 | |||||
| 6.80% unsecured senior notes, due February 15, 2013, interest payable semi-annually, net of unamortized discount of $45 in 2012 | $ | — | $ | 246,619 | |||
| 7.20% unsecured senior notes, due April 14, 2017, interest payable semi-annually, net of unamortized premium of $4,822 in 2013 | 95,451 | — | |||||
| 7.125% unsecured senior notes, due September 30, 2019, interest payable semi-annually, net of unamortized discount of $1,626 in 2013 and $1,909 in 2012 | 348,374 | 348,091 | |||||
| 6.25% unsecured senior notes, due September 30, 2020, interest payable semi-annually, net of unamortized premium of $61,273 in 2013 | 411,273 | — | |||||
| 5.35% unsecured senior notes, due June 1, 2021, interest payable semi-annually, net of unamortized discount of $1,531 in 2013 and $1,738 in 2012 | 248,469 | 248,262 | |||||
| 4.90% unsecured senior notes, due July 1, 2022, interest payable semi-annually, net of unamortized discount of $2,374 in 2013 and $2,653 in 2012 | 347,626 | 347,347 | |||||
| 3.625% unsecured senior notes, due March 30, 2023, interest payable semi-annually, net of unamortized discount of $1,860 in 2013 | 248,140 | — | |||||
| 7.35% unsecured senior notes, due August 15, 2034, interest payable semi-annually, net of unamortized discount of $2,185 in 2013 and $2,291 in 2012 | 197,815 | 197,710 | |||||
| 5.0% unsecured senior notes, due March 30, 2043, interest payable semi-annually, net of unamortized discount of $6,551 in 2013 | 243,449 | — | |||||
| Other debt, at various interest rates ranging from 2.5% to 6.5% | 115,630 | 104,521 | |||||
| Senior long-term debt and other debt | $ | 2,256,227 | $ | 1,492,550 | |||
At December 31, 2010, the Company was in compliance with all covenants contained in its revolving credit facility. To the extent that the Company is not in compliance with its covenants, the Company’s access to the credit facility could be restricted. While the Company believes this to be unlikely, the inability to access the credit facility could adversely affect the Company’s liquidity.
2012).
| 61
Markel Corporation & Subsidiaries
NOTES TO CONSOLIDATED FINANCIAL STATEMENTS (continued)
6.25% unsecured senior notes.
ParkLand Ventures, Inc. (ParkLand), a subsidiary of the Company, has formed subsidiaries for the purpose of acquiring and financing real estate (the real estate subsidiaries). The assets of the real estate subsidiaries, which are not material to the Company, are consolidated in accordance with U.S. GAAP but are not available to satisfy the debt and other obligations of the Company or any affiliates other than the real estate subsidiaries.
Years Ending December 31, | (dollars in thousands) | |||
2011 | $ | 7,264 | ||
2012 | 2,919 | |||
2013 | 255,694 | |||
2014 | 7,976 | |||
2015 | 15,492 | |||
2016 and thereafter | 736,252 | |||
TOTAL PRINCIPAL PAYMENTS | $ | 1,025,597 | ||
Unamortized discount | (9,650 | ) | ||
SENIOR LONG-TERM DEBTAND OTHER DEBT | $ | 1,015,947 | ||
2013
.| Years Ending December 31, | (dollars in thousands) | ||
| 2014 | $ | 28,795 | |
| 2015 | 6,102 | ||
| 2016 | 11,822 | ||
| 2017 | 105,987 | ||
| 2018 | 2,278 | ||
| 2019 and thereafter | 2,051,275 | ||
| Total principal payments | $ | 2,206,259 | |
| Net unamortized premium | 49,968 | ||
| Senior long-term debt and other debt | $ | 2,256,227 | |
a)The Company had 50,000,000 shares of no par value common stock authorized of which 9,717,92813,985,620 shares and 9,819,1519,629,160 shares were issued and outstanding at December 31, 20102013 and 2009,2012, respectively. The Company also has 10,000,000 shares of no par value preferred stock authorized, none of which werewas issued or outstanding at December 31, 20102013 or 2009.
In November 2010,2012.
62 |
b)Net income (loss) per share iswas determined by dividing adjusted net income (loss) to shareholders by the applicable weighted average shares outstanding.
| Years Ended December 31, | ||||||||||||
(in thousands, except per share amounts) | 2010 | 2009 | 2008 | |||||||||
Net income (loss) to shareholders | $ | 266,793 | $ | 201,638 | $ | (58,767 | ) | |||||
Basic common shares outstanding | 9,768 | 9,815 | 9,876 | |||||||||
Dilutive potential common shares | 17 | 11 | — | |||||||||
Diluted shares outstanding | 9,785 | 9,826 | 9,876 | |||||||||
Basic net income (loss) per share | $ | 27.31 | $ | 20.54 | $ | (5.95 | ) | |||||
Diluted net income (loss) per share | $ | 27.27 | $ | 20.52 | $ | (5.95 | ) | |||||
Unvested share-based compensation awards that contain non-forfeitable rights to dividends or dividend equivalents (whether paid or unpaid) are considered participating awards and are included in the computation of net income per share. Non-participating unvested share-based compensation awards are excluded from the computation of net income per share. Diluted net income per share is computed by dividing adjusted net income to shareholders by the weighted average number of common shares and dilutive potential common shares outstanding during the year. Average closing common stock market prices are used to calculate the dilutive effect attributable to restricted stock.
Diluted shares outstanding for 2008 excluded 15,376 dilutive potential shares. These shares were excluded due to their antidilutive effect as a result
| Years Ended December 31, | |||||||||||
| (in thousands, except per share amounts) | 2013 | 2012 | 2011 | ||||||||
| Net income to shareholders | $ | 281,021 | $ | 253,385 | $ | 142,026 | |||||
| Adjustment of redeemable noncontrolling interests | 1,963 | (3,101 | ) | — | |||||||
| Adjusted net income to shareholders | $ | 282,984 | $ | 250,284 | $ | 142,026 | |||||
| Basic common shares outstanding | 12,538 | 9,640 | 9,686 | ||||||||
| Dilutive potential common shares from conversion of options | 12 | 6 | 20 | ||||||||
| Dilutive potential common shares from conversion of non-participating restricted stock | 36 | 20 | 20 | ||||||||
| Diluted shares outstanding | 12,586 | 9,666 | 9,726 | ||||||||
| Basic net income per share | $ | 22.57 | $ | 25.96 | $ | 14.66 | |||||
| Diluted net income per share | $ | 22.48 | $ | 25.89 | $ | 14.60 | |||||
During 2010,associates and executive officers to assist the Company awarded 1,561 sharesin securing or retaining the services of restricted stock to its non-employee directors. The shares awarded to non-employee directors will vest in 2011.
| 63
Markel Corporation & Subsidiaries
NOTES TO CONSOLIDATED FINANCIAL STATEMENTS (continued)
10. Shareholders’ Equity (continued)
key employees. In May 2010,2013, the Compensation Committee awarded 26,41031,669 restricted stock units to certain associates and executive officers to assist the Company in retaining the services of key employees. TheseThe restricted stock units had a grant-date fair value of $9.5$16.6 million. Each restricted stock unit will ultimately allowThe awards vest over a three year period and entitle the recipient to receive one share of the Company’sCompany's common stock. Twenty percent ofstock for each vested restricted stock unit. Also during
| Number of Awards | Weighted Average Grant-Date Fair Value | |||||||
Nonvested awards at January 1, 2010 | 23,855 | $ | 415.39 | |||||
Granted | 31,157 | 358.48 | ||||||
Vested | (4,579 | ) | 309.44 | |||||
Forfeited | (5,509 | ) | 433.00 | |||||
Nonvested awards at December 31, 2010 | 44,924 | $ | 384.54 | |||||
Number of Awards | Weighted Average Grant-Date Fair Value | |||||
| Nonvested awards at January 1, 2013 | 55,580 | $ | 388.58 | |||
| Granted | 48,860 | 517.24 | ||||
| Vested | (5,729 | ) | 428.78 | |||
| Nonvested awards at December 31, 2013 | 98,711 | $ | 449.93 | |||
Number of Shares | Weighted Average Exercise Price | Weighted Average Remaining Contractual Term (years) | Intrinsic Value (in millions) | |||||||||
| Outstanding and exercisable, January 1, 2013 | 5,678 | $ | 225.83 | |||||||||
| Exercised | 957 | $ | 204.83 | |||||||||
| Outstanding and exercisable, December 31, 2013 | 4,721 | $ | 230.08 | 4.4 | $ | 1.7 | ||||||
Number of Shares | Weighted Average Exercise Price | Weighted Average Remaining Contractual Term (years) | Intrinsic Value (in millions) | |||||||||
| Outstanding and exercisable, May 1, 2013 | 101,875 | $ | 398.96 | |||||||||
| Exercised | 65,934 | $ | 391.64 | |||||||||
| Outstanding and exercisable, December 31, 2013 | 35,941 | $ | 412.39 | 2.6 | $ | 6.0 | ||||||
During 2010, 7,595Acquisition Date through December 31, 2013, 65,934 options were exercised under the Aspen OptionAlterra Equity Award Plans, resulting in cash proceeds of $1.5$24.3 million and a current tax benefit of $0.4$0.8 million. The intrinsic value of options exercised in 20102013 was $1.3$9.4 million.
At December 31, 2010, there
Number of Awards | Weighted Average Grant-Date Fair Value | |||||
| Nonvested awards issued on May 1, 2013 | 154,103 | $ | 529.59 | |||
| Vested | (77,941 | ) | 529.59 | |||
| Forfeited | (7,751 | ) | 529.59 | |||
| Nonvested awards at December 31, 2013 | 68,411 | $ | 529.59 | |||
64 |
2013 related to these restricted stock awards. As of December 31, 2013, unrecognized compensation cost related to the nonvested restricted stock awards was $4.6 million, which is expected to be recognized over a weighted average period of less than one year. The fair value of the restricted stock awards that vested during 2013 was $41.3 million.
| (dollars in thousands) | Unrealized Holding Gains on Available-for- Sale Securities | Foreign Currency | Net Actuarial Pension Loss | Total | |||||||||||
| December 31, 2010 | $ | 581,278 | $ | 1,541 | $ | (31,726 | ) | $ | 551,093 | ||||||
| Other comprehensive income (loss) before reclassifications | 145,782 | (4,155 | ) | (10,890 | ) | 130,737 | |||||||||
| Amounts reclassified from accumulated other comprehensive income | (22,341 | ) | — | 1,431 | (20,910 | ) | |||||||||
| Total other comprehensive income (loss) | 123,441 | (4,155 | ) | (9,459 | ) | 109,827 | |||||||||
| December 31, 2011 | $ | 704,719 | $ | (2,614 | ) | $ | (41,185 | ) | $ | 660,920 | |||||
| Other comprehensive income before reclassifications | 266,265 | 1,539 | 4,670 | 272,474 | |||||||||||
| Amounts reclassified from accumulated other comprehensive income | (24,051 | ) | — | 1,994 | (22,057 | ) | |||||||||
| Total other comprehensive income | 242,214 | 1,539 | 6,664 | 250,417 | |||||||||||
| December 31, 2012 | $ | 946,933 | $ | (1,075 | ) | $ | (34,521 | ) | $ | 911,337 | |||||
| Other comprehensive income (loss) before reclassifications | 225,404 | (10,171 | ) | 2,517 | 217,750 | ||||||||||
| Amounts reclassified from accumulated other comprehensive income | (40,830 | ) | — | 1,548 | (39,282 | ) | |||||||||
| Total other comprehensive income (loss) | 184,574 | (10,171 | ) | 4,065 | 178,468 | ||||||||||
| December 31, 2013 | $ | 1,131,507 | $ | (11,246 | ) | $ | (30,456 | ) | $ | 1,089,805 | |||||
| Years Ended December 31, | |||||||||||
| (dollars in thousands) | 2013 | 2012 | 2011 | ||||||||
| Change in net unrealized gains on investments: | |||||||||||
| Net holding gains arising during the period | $ | 93,837 | $ | 122,524 | $ | 68,064 | |||||
| Change in unrealized other-than-temporary impairment losses on fixed maturities arising during the period | (34 | ) | (49 | ) | 2,107 | ||||||
| Reclassification adjustments for net gains included in net income | (16,382 | ) | (10,881 | ) | (10,890 | ) | |||||
| Change in net unrealized gains on investments | 77,421 | 111,594 | 59,281 | ||||||||
| Change in foreign currency translation adjustments | (1,619 | ) | (446 | ) | 250 | ||||||
| Change in net actuarial pension loss | 1,015 | 1,991 | (3,153 | ) | |||||||
| Total | $ | 76,817 | $ | 113,139 | $ | 56,378 | |||||
| Years Ended December 31, | |||||||||||
| (dollars in thousands) | 2013 | 2012 | 2011 | ||||||||
| Unrealized holding gains on available-for-sale securities: | |||||||||||
| Other-than-temporary impairment losses | $ | (4,706 | ) | $ | (12,078 | ) | $ | (20,196 | ) | ||
| Net realized investment gains, excluding other-than-temporary impairment losses | 61,918 | 47,010 | 53,427 | ||||||||
| Total before taxes | 57,212 | 34,932 | 33,231 | ||||||||
| Income taxes | (16,382 | ) | (10,881 | ) | (10,890 | ) | |||||
| Reclassification of unrealized holding gains, net of taxes | $ | 40,830 | $ | 24,051 | $ | 22,341 | |||||
| Net actuarial pension loss: | |||||||||||
| Underwriting, acquisition and insurance expenses | $ | (1,934 | ) | $ | (2,590 | ) | $ | (1,908 | ) | ||
| Income taxes | 386 | 596 | 477 | ||||||||
| Reclassification of net actuarial pension loss, net of taxes | $ | (1,548 | ) | $ | (1,994 | ) | $ | (1,431 | ) | ||
| Years Ended December 31, | ||||||||||||
(dollars in thousands) | 2010 | 2009 | 2008 | |||||||||
Change in net unrealized gains on investments: | ||||||||||||
Net holding gains (losses) arising during the period | $ | 96,555 | $ | 190,978 | $ | (320,314 | ) | |||||
Unrealized other-than-temporary impairment losses on fixed maturities arising during the period | 316 | (1,118 | ) | — | ||||||||
Reclassification adjustments for net gains (losses) included in net income (loss) | (16,624 | ) | 25,912 | 142,638 | ||||||||
Change in net unrealized gains on investments | 80,247 | 215,772 | (177,676 | ) | ||||||||
Change in foreign currency translation adjustments | 6,579 | 6,825 | (4,250 | ) | ||||||||
Change in net actuarial pension loss | 1,069 | 2,859 | (3,630 | ) | ||||||||
TOTAL | $ | 87,895 | $ | 225,456 | $ | (185,556 | ) | |||||
The credit default swap has a scheduled termination date of December 2014.
| 65
Markel Corporation & Subsidiaries
NOTES TO CONSOLIDATED FINANCIAL STATEMENTS (continued)
Investments available-for-sale.Investments available-for-sale are recorded at fair value on a recurring basis and include fixed maturities, equity securities and short-term investments. Short-term investments include certificates of deposit, commercial paper, discount notes and treasury bills with original maturities of one year or less. Fair value for investments available-for-sale is determined by the Company after considering various sources of information, including information provided by a third party pricing service. The pricing service provides prices for substantially all of the Company’sCompany's fixed maturities and equity securities. In determining fair value, the Company generally does not adjust the prices obtained from the pricing service. The Company obtains an understanding of the pricing service’sservice's valuation methodologies and related inputs, which include, but are not limited to, reported trades, benchmark yields, issuer spreads, bids, offers, duration, credit ratings, estimated cash flows and prepayment speeds. The Company validates prices provided by the pricing service by reviewing prices from other pricing sources and analyzing pricing data in certain instances.
The Company has evaluated the various types of securities in its investment portfolio Significant inputs used to determine an appropriatethe fair value hierarchy level based upon trading activityof obligations of states, municipalities and the observability of market inputs. Level 1 investments include those traded on an active exchange, such as the New York Stock Exchange. Level 2 investments include U.S. Treasury securitiespolitical subdivisions, corporate bonds and obligations of U.S. government agencies, municipal bonds, foreign government bonds,governments include reported trades, benchmark yields, issuer spreads, bids, offers, credit information and estimated cash flows. Significant inputs used to determine the fair value of commercial mortgage-backed securities, residential mortgage-backed securities and corporate debt securities.
asset-backed securities include the type of underlying assets, benchmark yields, prepayment speeds, collateral information, tranche type and volatility, estimated cash flows, credit information, default rates, recovery rates, issuer spreads and the year of issue.
66 |
(dollars in thousands) | Level 1 | Level 2 | Level 3 | Total | ||||||||||||
Assets: | ||||||||||||||||
Investments available-for-sale: | ||||||||||||||||
Fixed maturities: | ||||||||||||||||
U.S. Treasury securities and obligations of U.S. government agencies | $ | — | $ | 321,338 | $ | — | $ | 321,338 | ||||||||
Obligations of states, municipalities and political subdivisions | — | 2,799,339 | — | 2,799,339 | ||||||||||||
Foreign governments | — | 572,818 | — | 572,818 | ||||||||||||
Residential mortgage-backed securities | — | 425,563 | — | 425,563 | ||||||||||||
Asset-backed securities | — | 22,756 | — | 22,756 | ||||||||||||
Public utilities | — | 102,444 | — | 102,444 | ||||||||||||
Convertible bonds | — | 16,725 | — | 16,725 | ||||||||||||
All other corporate bonds | — | 1,170,243 | — | 1,170,243 | ||||||||||||
Total fixed maturities | — | 5,431,226 | — | 5,431,226 | ||||||||||||
Equity securities: | ||||||||||||||||
Insurance companies, banks and trusts | 710,986 | — | — | 710,986 | ||||||||||||
Industrial, consumer and all other | 1,010,985 | — | — | 1,010,985 | ||||||||||||
Total equity securities | 1,721,971 | — | — | 1,721,971 | ||||||||||||
Short-term investments | 269,466 | 55,874 | — | 325,340 | ||||||||||||
Total investments available-for-sale | 1,991,437 | 5,487,100 | — | 7,478,537 | ||||||||||||
Liabilities: | ||||||||||||||||
Derivative contracts | $ | — | $ | — | $ | 25,228 | $ | 25,228 | ||||||||
| December 31, 2013 | |||||||||||||||
| (dollars in thousands) | Level 1 | Level 2 | Level 3 | Total | |||||||||||
| Assets: | |||||||||||||||
| Investments available-for-sale: | |||||||||||||||
| Fixed maturities: | |||||||||||||||
| U.S. Treasury securities and obligations of U.S. government agencies | $ | — | $ | 1,194,231 | $ | — | $ | 1,194,231 | |||||||
| Obligations of states, municipalities and political subdivisions | — | 3,075,715 | — | 3,075,715 | |||||||||||
| Foreign governments | — | 1,461,054 | — | 1,461,054 | |||||||||||
| Commercial mortgage-backed securities | — | 367,821 | — | 367,821 | |||||||||||
| Residential mortgage-backed securities | — | 870,248 | — | 870,248 | |||||||||||
| Asset-backed securities | — | 188,289 | — | 188,289 | |||||||||||
| Corporate bonds | — | 2,985,178 | — | 2,985,178 | |||||||||||
| Total fixed maturities | — | 10,142,536 | — | 10,142,536 | |||||||||||
| Equity securities: | |||||||||||||||
| Insurance, banks and other financial institutions | 1,015,083 | — | — | 1,015,083 | |||||||||||
| Industrial, consumer and all other | 2,236,715 | — | — | 2,236,715 | |||||||||||
| Total equity securities | 3,251,798 | — | — | 3,251,798 | |||||||||||
| Short-term investments | 1,312,561 | 139,727 | — | 1,452,288 | |||||||||||
| Total investments available-for-sale | $ | 4,564,359 | $ | 10,282,263 | $ | — | $ | 14,846,622 | |||||||
| Liabilities: | |||||||||||||||
| Derivative contracts | $ | — | $ | — | $ | 2,230 | $ | 2,230 | |||||||
| December 31, 2012 | |||||||||||||||
| (dollars in thousands) | Level 1 | Level 2 | Level 3 | Total | |||||||||||
| Assets: | |||||||||||||||
| Investments available-for-sale: | |||||||||||||||
| Fixed maturities: | |||||||||||||||
| U.S. Treasury securities and obligations of U.S. government agencies | $ | — | $ | 317,507 | $ | — | $ | 317,507 | |||||||
| Obligations of states, municipalities and political subdivisions | — | 2,831,562 | — | 2,831,562 | |||||||||||
| Foreign governments | — | 556,608 | — | 556,608 | |||||||||||
| Residential mortgage-backed securities | — | 215,377 | — | 215,377 | |||||||||||
| Asset-backed securities | — | 14,345 | — | 14,345 | |||||||||||
| Corporate bonds | — | 1,043,884 | — | 1,043,884 | |||||||||||
| Total fixed maturities | — | 4,979,283 | — | 4,979,283 | |||||||||||
| Equity securities: | |||||||||||||||
| Insurance, banks and other financial institutions | 898,067 | — | — | 898,067 | |||||||||||
| Industrial, consumer and all other | 1,508,884 | — | — | 1,508,884 | |||||||||||
| Total equity securities | 2,406,951 | — | — | 2,406,951 | |||||||||||
| Short-term investments | 888,758 | 84,572 | — | 973,330 | |||||||||||
| Total investments available-for-sale | $ | 3,295,709 | $ | 5,063,855 | $ | — | $ | 8,359,564 | |||||||
| Liabilities: | |||||||||||||||
| Derivative contracts | $ | — | $ | — | $ | 12,690 | $ | 12,690 | |||||||
(dollars in thousands) | 2010 | 2009 | ||||||
Derivatives, Beginning of Period | $ | 26,968 | $ | 29,964 | ||||
Total gains included in: | ||||||||
Net income | (1,740 | ) | (2,996 | ) | ||||
Other comprehensive income | — | — | ||||||
Transfers into Level 3 | — | — | ||||||
Transfers out of Level 3 | — | — | ||||||
Derivatives, End of Period | $ | 25,228 | $ | 26,968 | ||||
Net unrealized gains included in net income relating to liabilities held at December 31, 2010 and 2009 | $ | 1,740 | (1) | $ | 2,996 | (1) | ||
| (dollars in thousands) | 2013 | 2012 | |||||
| Derivatives, beginning of period | $ | 12,690 | $ | 29,331 | |||
| Total gains included in: | |||||||
| Net income | (10,460 | ) | (16,641 | ) | |||
| Other comprehensive income | — | — | |||||
| Transfers into Level 3 | — | — | |||||
| Transfers out of Level 3 | — | — | |||||
| Derivatives, end of period | $ | 2,230 | $ | 12,690 | |||
Net unrealized gains included in net income relating to liabilities held at December 31, 2013 and 2012 (1) | $ | 10,460 | $ | 16,641 | |||
(1) | Included in net investment income in the consolidated statements of |
| 67
Markel Corporation & Subsidiaries
NOTES TO CONSOLIDATED FINANCIAL STATEMENTS (continued)
There were no transfers into or out of Level 1 and Level 2 during 2010 and 2009. The2013 or 2012. Except as disclosed in note 2, the Company did not have any assets or liabilities measured at fair value on a non-recurring basis during the yearyears ended December 31, 2010. At December 31, 2010, the Company did not hold material investments in auction rate securities, loans held for sale or mortgage-backed securities backed by subprime or Alt-A collateral.
201313. and 2012.
| Years Ended December 31, | ||||||||||||
(dollars in thousands) | 2010 | 2009 | 2008 | |||||||||
REINSURANCE ALLOWANCE, BEGINNINGOF YEAR | $ | 151,339 | $ | 155,882 | $ | 167,465 | ||||||
Additions: | ||||||||||||
Charged to expense | — | — | 2,634 | |||||||||
Charged to other accounts | 7,927 | 686 | 3,672 | |||||||||
TOTAL REINSURANCE ALLOWANCE ADDITIONS | 7,927 | 686 | 6,306 | |||||||||
Deductions | (4,076 | ) | (5,229 | ) | (17,889 | ) | ||||||
REINSURANCE ALLOWANCE, ENDOF YEAR | $ | 155,190 | $ | 151,339 | $ | 155,882 | ||||||
| Years Ended December 31, | |||||||||||
| (dollars in thousands) | 2013 | 2012 | 2011 | ||||||||
| Reinsurance allowance, beginning of year | $ | 71,148 | $ | 69,067 | $ | 155,190 | |||||
| Additions | 13,621 | 24,179 | 8,504 | ||||||||
| Deductions | (8,559 | ) | (22,098 | ) | (94,627 | ) | |||||
| Reinsurance allowance, end of year | $ | 76,210 | $ | 71,148 | $ | 69,067 | |||||
68 |
13. Reinsurance (continued)
| Years Ended December 31, | ||||||||||||||||||||||||
(dollars in thousands) | 2010 | 2009 | 2008 | |||||||||||||||||||||
| Written | Earned | Written | Earned | Written | Earned | |||||||||||||||||||
Direct | $ | 1,704,684 | $ | 1,681,027 | $ | 1,683,355 | $ | 1,808,471 | $ | 2,002,882 | $ | 2,088,824 | ||||||||||||
Assumed | 277,783 | 253,654 | 222,538 | 218,309 | 209,902 | 202,031 | ||||||||||||||||||
Ceded | (213,349 | ) | (203,760 | ) | (191,484 | ) | (210,945 | ) | (244,288 | ) | (268,671 | ) | ||||||||||||
NET PREMIUMS | $ | 1,769,118 | $ | 1,730,921 | $ | 1,714,409 | $ | 1,815,835 | $ | 1,968,496 | $ | 2,022,184 | ||||||||||||
| Years Ended December 31, | |||||||||||||||||||||||
| 2013 | 2012 | 2011 | |||||||||||||||||||||
| (dollars in thousands) | Written | Earned | Written | Earned | Written | Earned | |||||||||||||||||
| Direct | $ | 3,143,957 | $ | 2,947,812 | $ | 2,115,353 | $ | 2,057,735 | $ | 1,957,397 | $ | 1,873,512 | |||||||||||
| Assumed | 776,269 | 1,016,853 | 398,328 | 376,186 | 333,854 | 338,183 | |||||||||||||||||
| Ceded | (683,543 | ) | (733,049 | ) | (299,555 | ) | (286,793 | ) | (249,413 | ) | (232,355 | ) | |||||||||||
| Net premiums | $ | 3,236,683 | $ | 3,231,616 | $ | 2,214,126 | $ | 2,147,128 | $ | 2,041,838 | $ | 1,979,340 | |||||||||||
14.
a)The Company leases substantially all of its facilities and certain furniture and equipment under noncancelable operating leases with remaining terms up to ten21 years.
Years Ending December 31, | (dollars in thousands) | |||
2011 | $ | 17,689 | ||
2012 | 16,820 | |||
2013 | 16,761 | |||
2014 | 15,797 | |||
2015 | 14,414 | |||
2016 and thereafter | 34,353 | |||
TOTAL | $ | 115,834 | ||
2013
.| Years Ending December 31, | (dollars in thousands) | ||
| 2014 | $ | 32,783 | |
| 2015 | 29,114 | ||
| 2016 | 22,977 | ||
| 2017 | 27,955 | ||
| 2018 | 26,440 | ||
| 2019 and thereafter | 160,454 | ||
| Total | $ | 299,723 | |
15.
| 69
Markel Corporation & Subsidiaries
NOTES TO CONSOLIDATED FINANCIAL STATEMENTS (continued)
16.
a)The following table includes unaudited selected informationStatutory capital and surplus and statutory net income (loss) for the Company’sCompany's wholly-owned domestic insurance and reinsurance subsidiaries as filed with state insuranceof December 31, 2013 and 2012 and for the years ended December 31, 2013, 2012 and 2011, respectively, is summarized below.
| Statutory Capital and Surplus | |||||||
| (dollars in thousands) | 2013 | 2012 | |||||
| United States | $ | 2,399,356 | $ | 1,455,077 | |||
| United Kingdom | $ | 517,571 | $ | 485,043 | |||
| Bermuda | $ | 1,503,004 | N/A | ||||
| Other | $ | 171,410 | N/A | ||||
| Years Ended December 31, | ||||||||||||
(dollars in thousands) | 2010 | 2009 | 2008 | |||||||||
Net income (loss) | $ | 165,605 | $ | 129,035 | $ | (19,073 | ) | |||||
Statutory capital and surplus | $ | 1,503,165 | $ | 1,308,437 | $ | 985,675 | ||||||
| Statutory Net Income (Loss) | |||||||||||
| Years Ended December 31, | |||||||||||
| (dollars in thousands) | 2013 | 2012 | 2011 | ||||||||
| United States | $ | 235,009 | $ | 127,179 | $ | 180,744 | |||||
| United Kingdom | $ | 117,020 | $ | 82,573 | $ | 18,386 | |||||
| Bermuda | $ | 93,953 | N/A | N/A | |||||||
| Other | $ | (12,617 | ) | N/A | N/A | ||||||
practices which impact statutory capital and surplus.
various other requirements. The following table summarizes MIICL’s FSA Return net income (loss) and policyholders’ surplus.
| Years Ended December 31, | ||||||||||||
(dollars in thousands) | 2010(1) | 2009 | 2008 | |||||||||
Net income (loss) | $ | 82,984 | $ | 80,193 | $ | (40,946 | ) | |||||
Policyholders’ surplus | $ | 522,325 | $ | 382,741 | $ | 264,421 | ||||||
|
MIICL’s ability of Markel International Insurance Company Limited to pay dividends is limited by applicable FSAPRA requirements, which require MIICL to give 14 days advance notice to the FSAPRA of itsthe intention to declare and pay a dividend. Markel Syndicate Management Limited, the manager of the Company's syndicates at Lloyd's, is required to satisfy the solvency requirements of Lloyd's. In addition, MIICLthe Company's United Kingdom subsidiaries must comply with the United Kingdom Companies Act of 2006, which provides that dividends may only be paid out of profits available for that purpose.
As of 17.December 31, 2013, earnings of the Company's United Kingdom subsidiaries are considered reinvested indefinitely for U.S. income tax purposes and will not be made available for distributions to the holding company.
All investing activities related
70 |
17. Segment Reporting Disclosures (continued)
| Years Ended December 31, | ||||||||||||||||||||||||
(dollars in thousands) | 2010 | % of Total | 2009 | % of Total | 2008 | % of Total | ||||||||||||||||||
United States | $ | 1,433,185 | 72 | % | $ | 1,417,497 | 74 | % | $ | 1,701,677 | 77 | % | ||||||||||||
United Kingdom | 137,502 | 7 | 136,907 | 7 | 165,671 | 7 | ||||||||||||||||||
Canada | 92,017 | 5 | 35,685 | 2 | 42,379 | 2 | ||||||||||||||||||
Other countries | 319,763 | 16 | 315,804 | 17 | 303,057 | 14 | ||||||||||||||||||
Total | $ | 1,982,467 | 100 | % | $ | 1,905,893 | 100 | % | $ | 2,212,784 | 100 | % | ||||||||||||
| Years Ended December 31, | ||||||||||||||||||||
| (dollars in thousands) | 2013 | % of Total | 2012 | % of Total | 2011 | % of Total | ||||||||||||||
| United States | $ | 2,934,868 | 75 | % | $ | 1,768,011 | 70 | % | $ | 1,590,238 | 69 | % | ||||||||
| United Kingdom | 245,143 | 6 | 147,891 | 6 | 139,349 | 6 | ||||||||||||||
| Canada | 128,420 | 3 | 120,542 | 5 | 126,434 | 6 | ||||||||||||||
| Other countries | 611,795 | 16 | 477,237 | 19 | 435,230 | 19 | ||||||||||||||
| Total | $ | 3,920,226 | 100 | % | $ | 2,513,681 | 100 | % | $ | 2,291,251 | 100 | % | ||||||||
annuity reinsurance business.
| 71
Markel Corporation & Subsidiaries
NOTES TO CONSOLIDATED FINANCIAL STATEMENTS (continued)
17. Segment Reporting Disclosures (continued)
a)The following tables summarize the Company’s segment disclosures.
| Year Ended December 31, 2010 | ||||||||||||||||||||||||
(dollars in thousands) | Excess and Surplus Lines | Specialty Admitted | London Insurance Market | Other Insurance (Discontinued Lines) | Investing | Consolidated | ||||||||||||||||||
Gross premium volume | $ | 898,409 | $ | 375,036 | $ | 708,968 | $ | 54 | $ | — | $ | 1,982,467 | ||||||||||||
Net written premiums | 797,518 | 348,634 | 622,799 | 167 | — | 1,769,118 | ||||||||||||||||||
Earned premiums | 809,672 | 343,574 | 577,507 | 168 | — | 1,730,921 | ||||||||||||||||||
Losses and loss adjustment expenses | (413,998 | ) | (208,519 | ) | (320,350 | ) | (3,362 | ) | — | (946,229 | ) | |||||||||||||
Amortization of policy acquisition costs | (190,903 | ) | (85,521 | ) | (149,469 | ) | — | — | (425,893 | ) | ||||||||||||||
Other operating expenses | (169,221 | ) | (48,283 | ) | (81,553 | ) | 74 | — | (298,983 | ) | ||||||||||||||
Underwriting profit (loss) | 35,550 | 1,251 | 26,135 | (3,120 | ) | — | 59,816 | |||||||||||||||||
Net investment income | — | — | — | — | 272,530 | 272,530 | ||||||||||||||||||
Net realized investment gains | — | — | — | — | 36,362 | 36,362 | ||||||||||||||||||
Other revenues (insurance) | — | 12,354 | 6,753 | — | — | 19,107 | ||||||||||||||||||
Other expenses (insurance) | — | (16,055 | ) | (5,854 | ) | — | — | (21,909 | ) | |||||||||||||||
Segment profit (loss) | $ | 35,550 | $ | (2,450 | ) | $ | 27,034 | $ | (3,120 | ) | $ | 308,892 | $ | 365,906 | ||||||||||
Other revenues (non-insurance) | 166,473 | |||||||||||||||||||||||
Other expenses (non-insurance) | (146,381 | ) | ||||||||||||||||||||||
Amortization of intangible assets | (16,824 | ) | ||||||||||||||||||||||
Interest expense | (73,663 | ) | ||||||||||||||||||||||
INCOME BEFORE INCOME TAXES | $ | 295,511 | ||||||||||||||||||||||
U.S. GAAP combined ratio(1) | 96 | % | 100 | % | 95 | % | NM | (2) | 97 | % | ||||||||||||||
| Year Ended December 31, 2009 | ||||||||||||||||||||||||
(dollars in thousands) | Excess and Surplus Lines | Specialty Admitted | London Insurance Market | Other Insurance (Discontinued Lines) | Investing | Consolidated | ||||||||||||||||||
Gross premium volume | $ | 962,702 | $ | 301,827 | $ | 641,226 | $ | 138 | $ | — | $ | 1,905,893 | ||||||||||||
Net written premiums | 869,695 | 279,266 | 566,046 | (598 | ) | — | 1,714,409 | |||||||||||||||||
Earned premiums | 940,098 | 303,897 | 572,438 | (598 | ) | — | 1,815,835 | |||||||||||||||||
Losses and loss adjustment expenses | (504,631 | ) | (186,215 | ) | (298,741 | ) | (3,276 | ) | — | (992,863 | ) | |||||||||||||
Amortization of policy acquisition costs | (221,518 | ) | (72,306 | ) | (146,992 | ) | — | — | (440,816 | ) | ||||||||||||||
Other operating expenses | (177,707 | ) | (43,052 | ) | (74,243 | ) | (842 | ) | — | (295,844 | ) | |||||||||||||
Underwriting profit (loss) | 36,242 | 2,324 | 52,462 | (4,716 | ) | — | 86,312 | |||||||||||||||||
Net investment income | — | — | — | — | 259,809 | 259,809 | ||||||||||||||||||
Net realized investment losses | — | — | — | — | (96,100 | ) | (96,100 | ) | ||||||||||||||||
Other revenues (insurance) | — | — | 4,116 | — | — | 4,116 | ||||||||||||||||||
Other expenses (insurance) | — | — | (3,248 | ) | — | — | (3,248 | ) | ||||||||||||||||
Segment profit (loss) | $ | 36,242 | $ | 2,324 | $ | 53,330 | $ | (4,716 | ) | $ | 163,709 | $ | 250,889 | |||||||||||
Other revenues (non-insurance) | 85,666 | |||||||||||||||||||||||
Other expenses (non-insurance) | (77,251 | ) | ||||||||||||||||||||||
Amortization of intangible assets | (6,698 | ) | ||||||||||||||||||||||
Interest expense | (53,969 | ) | ||||||||||||||||||||||
INCOME BEFORE INCOME TAXES | $ | 198,637 | ||||||||||||||||||||||
U.S. GAAP combined ratio(1) | 96 | % | 99 | % | 91 | % | NM | (2) | — | 95 | % | |||||||||||||
| a) | The following tables summarize the Company's segment disclosures. |
| Year Ended December 31, 2013 | |||||||||||||||||||||||||||
| (dollars in thousands) | Excess and Surplus Lines | Specialty Admitted | London Insurance Market | Alterra | Other Insurance (Discontinued Lines) | Investing | Consolidated | ||||||||||||||||||||
| Gross premium volume | $ | 1,070,520 | $ | 899,996 | $ | 914,480 | $ | 1,035,190 | $ | 40 | $ | — | $ | 3,920,226 | |||||||||||||
| Net written premiums | 911,870 | 855,381 | 792,158 | 677,233 | 41 | — | 3,236,683 | ||||||||||||||||||||
| Earned premiums | 856,629 | 744,993 | 781,637 | 848,317 | 40 | — | 3,231,616 | ||||||||||||||||||||
| Losses and loss adjustment expenses | (341,661 | ) | (410,068 | ) | (386,416 | ) | (647,546 | ) | (30,582 | ) | — | (1,816,273 | ) | ||||||||||||||
Transaction costs and other acquisition-related expenses (1) | — | — | — | (75,140 | ) | — | — | (75,140 | ) | ||||||||||||||||||
| Amortization of policy acquisition costs | (147,996 | ) | (137,181 | ) | (149,191 | ) | (37,547 | ) | — | — | (471,915 | ) | |||||||||||||||
| Other operating expenses | (195,464 | ) | (176,346 | ) | (150,537 | ) | (243,022 | ) | 112 | — | (765,257 | ) | |||||||||||||||
| Underwriting profit (loss) | 171,508 | 21,398 | 95,493 | (154,938 | ) | (30,430 | ) | — | 103,031 | ||||||||||||||||||
| Net investment income | — | — | — | — | — | 317,373 | 317,373 | ||||||||||||||||||||
| Net realized investment gains | — | — | — | — | — | 63,152 | 63,152 | ||||||||||||||||||||
| Other revenues (insurance) | — | 13,648 | 5,002 | 4,714 | 1,130 | — | 24,494 | ||||||||||||||||||||
| Other expenses (insurance) | — | (17,087 | ) | (5,065 | ) | — | (28,126 | ) | — | (50,278 | ) | ||||||||||||||||
| Segment profit (loss) | $ | 171,508 | $ | 17,959 | $ | 95,430 | $ | (150,224 | ) | $ | (57,426 | ) | $ | 380,525 | $ | 457,772 | |||||||||||
| Other revenues (Markel Ventures) | 686,448 | ||||||||||||||||||||||||||
| Other expenses (Markel Ventures) | (613,250 | ) | |||||||||||||||||||||||||
| Amortization of intangible assets | (55,223 | ) | |||||||||||||||||||||||||
| Interest expense | (114,004 | ) | |||||||||||||||||||||||||
| Income before income taxes | $ | 361,743 | |||||||||||||||||||||||||
U.S. GAAP combined ratio (2) | 80 | % | 97 | % | 88 | % | 118 | % | NM | (3) | 97 | % | |||||||||||||||
(1) | In connection with the acquisition of Alterra, the Company incurred transaction costs of $16.0 million for the year ended December 31, 2013, which primarily consist of due diligence, legal and investment banking costs. Additionally, the Company incurred severance costs of $31.7 million, stay bonuses of $14.8 million and other compensation costs totaling $12.6 million related to the acceleration of certain long-term incentive compensation awards and restricted stock awards that were granted by Alterra prior to the acquisition. |
(2) | The U.S. GAAP combined ratio is a measure of underwriting performance and represents the relationship of incurred losses, loss adjustment expenses and underwriting, acquisition and insurance expenses to earned premiums. |
NM — Ratio is not meaningful. |
72 |
17. Segment Reporting Disclosures (continued)
| Year Ended December 31, 2008 | ||||||||||||||||||||||||
(dollars in thousands) | Excess and Surplus Lines | Specialty Admitted | London Insurance Market | Other Insurance (Discontinued Lines) | Investing | Consolidated | ||||||||||||||||||
Gross premium volume | $ | 1,163,992 | $ | 355,061 | $ | 693,138 | $ | 593 | $ | — | $ | 2,212,784 | ||||||||||||
Net written premiums | 1,028,816 | 321,109 | 617,946 | 625 | — | 1,968,496 | ||||||||||||||||||
Earned premiums | 1,089,967 | 315,764 | 615,828 | 625 | — | 2,022,184 | ||||||||||||||||||
Losses and loss adjustment expenses | (609,790 | ) | (209,022 | ) | (420,438 | ) | (29,775 | ) | — | (1,269,025 | ) | |||||||||||||
Amortization of policy acquisition costs | (263,348 | ) | (73,211 | ) | (169,967 | ) | — | — | (506,526 | ) | ||||||||||||||
Other operating expenses | (128,667 | ) | (51,766 | ) | (52,682 | ) | 1,095 | — | (232,020 | ) | ||||||||||||||
Underwriting profit (loss) | 88,162 | (18,235 | ) | (27,259 | ) | (28,055 | ) | — | 14,613 | |||||||||||||||
Net investment income | — | — | — | — | 282,148 | 282,148 | ||||||||||||||||||
Net realized investment losses | — | — | — | — | (407,594 | ) | (407,594 | ) | ||||||||||||||||
Segment profit (loss) | $ | 88,162 | $ | (18,235 | ) | $ | (27,259 | ) | $ | (28,055 | ) | $ | (125,446 | ) | $ | (110,833 | ) | |||||||
Other revenues (non-insurance) | 79,845 | |||||||||||||||||||||||
Other expenses (non-insurance) | (74,889 | ) | ||||||||||||||||||||||
Amortization of intangible assets | (5,742 | ) | ||||||||||||||||||||||
Interest expense | (48,210 | ) | ||||||||||||||||||||||
LOSS BEFORE INCOME TAXES | $ | (159,829 | ) | |||||||||||||||||||||
U.S. GAAP combined ratio(1) | 92 | % | 106 | % | 104 | % | NM | (2) | — | 99 | % | |||||||||||||
| Year Ended December 31, 2012 | |||||||||||||||||||||||
| (dollars in thousands) | Excess and Surplus Lines | Specialty Admitted | London Insurance Market | Other Insurance (Discontinued Lines) | Investing | Consolidated | |||||||||||||||||
| Gross premium volume | $ | 956,273 | $ | 669,692 | $ | 887,720 | $ | (4 | ) | $ | — | $ | 2,513,681 | ||||||||||
| Net written premiums | 811,601 | 628,147 | 774,383 | (5 | ) | — | 2,214,126 | ||||||||||||||||
| Earned premiums | 793,159 | 588,758 | 765,216 | (5 | ) | — | 2,147,128 | ||||||||||||||||
| Losses and loss adjustment expenses | (388,793 | ) | (381,870 | ) | (362,330 | ) | (21,075 | ) | — | (1,154,068 | ) | ||||||||||||
Prospective adoption of FASB ASU No. 2010-26 (1) | (17,456 | ) | (13,577 | ) | (12,060 | ) | — | — | (43,093 | ) | |||||||||||||
| Other amortization of policy acquisition costs | (135,573 | ) | (96,770 | ) | (152,673 | ) | — | — | (385,016 | ) | |||||||||||||
| Other operating expenses | (201,196 | ) | (143,377 | ) | (156,587 | ) | (203 | ) | — | (501,363 | ) | ||||||||||||
| Underwriting profit (loss) | 50,141 | (46,836 | ) | 81,566 | (21,283 | ) | — | 63,588 | |||||||||||||||
| Net investment income | — | — | — | — | 282,107 | 282,107 | |||||||||||||||||
| Net realized investment gains | — | — | — | — | 31,593 | 31,593 | |||||||||||||||||
| Other revenues (insurance) | — | 44,968 | 4,964 | — | — | 49,932 | |||||||||||||||||
| Other expenses (insurance) | — | (41,425 | ) | (3,867 | ) | — | — | (45,292 | ) | ||||||||||||||
| Segment profit (loss) | $ | 50,141 | $ | (43,293 | ) | $ | 82,663 | $ | (21,283 | ) | $ | 313,700 | $ | 381,928 | |||||||||
| Other revenues (Markel Ventures) | 489,352 | ||||||||||||||||||||||
| Other expenses (Markel Ventures) | (432,956 | ) | |||||||||||||||||||||
| Amortization of intangible assets | (33,512 | ) | |||||||||||||||||||||
| Interest expense | (92,762 | ) | |||||||||||||||||||||
| Income before income taxes | $ | 312,050 | |||||||||||||||||||||
U.S. GAAP combined ratio(2) | 94 | % | 108 | % | 89 | % | NM | (3) | 97 | % | |||||||||||||
(1) | Effective January 1, 2012, the Company prospectively adopted FASB ASU No. 2010-26, Accounting for Costs Associated with Acquiring or Renewing Insurance Contracts. At December 31, 2011, deferred policy acquisition costs included $43.1 million of costs that no longer met the criteria for deferral as of January 1, 2012 and were recognized into income during 2012, consistent with policy terms. |
(2) | The U.S. GAAP combined ratio is a measure of underwriting performance and represents the relationship of incurred losses, loss adjustment expenses and underwriting, acquisition and insurance expenses to earned premiums. |
NM — Ratio is not meaningful. |
| Year Ended December 31, 2011 | |||||||||||||||||||||||
| (dollars in thousands) | Excess and Surplus Lines | Specialty Admitted | London Insurance Market | Other Insurance (Discontinued Lines) | Investing | Consolidated | |||||||||||||||||
| Gross premium volume | $ | 893,427 | $ | 572,392 | $ | 825,301 | $ | 131 | $ | — | $ | 2,291,251 | |||||||||||
| Net written premiums | 772,279 | 543,213 | 726,359 | (13 | ) | — | 2,041,838 | ||||||||||||||||
| Earned premiums | 756,306 | 527,293 | 695,753 | (12 | ) | — | 1,979,340 | ||||||||||||||||
| Losses and loss adjustment expenses | (318,583 | ) | (364,144 | ) | (531,625 | ) | 4,366 | — | (1,209,986 | ) | |||||||||||||
| Amortization of policy acquisition costs | (172,269 | ) | (129,731 | ) | (177,454 | ) | — | — | (479,454 | ) | |||||||||||||
| Other operating expenses | (156,419 | ) | (78,509 | ) | (96,149 | ) | 352 | — | (330,725 | ) | |||||||||||||
| Underwriting profit (loss) | 109,035 | (45,091 | ) | (109,475 | ) | 4,706 | — | (40,825 | ) | ||||||||||||||
| Net investment income | — | — | — | — | 263,676 | 263,676 | |||||||||||||||||
| Net realized investment gains | — | — | — | — | 35,857 | 35,857 | |||||||||||||||||
| Other revenues (insurance) | — | 33,545 | — | — | — | 33,545 | |||||||||||||||||
| Other expenses (insurance) | — | (33,722 | ) | — | — | — | (33,722 | ) | |||||||||||||||
| Segment profit (loss) | $ | 109,035 | $ | (45,268 | ) | $ | (109,475 | ) | $ | 4,706 | $ | 299,533 | $ | 258,531 | |||||||||
| Other revenues (Markel Ventures) | 317,532 | ||||||||||||||||||||||
| Other expenses (Markel Ventures) | (275,324 | ) | |||||||||||||||||||||
| Amortization of intangible assets | (24,291 | ) | |||||||||||||||||||||
| Interest expense | (86,252 | ) | |||||||||||||||||||||
| Income before income taxes | $ | 190,196 | |||||||||||||||||||||
U.S. GAAP combined ratio(1) | 86 | % | 109 | % | 116 | % | NM | (2) | 102 | % | |||||||||||||
(1) | The U.S. GAAP combined ratio is a measure of underwriting performance and represents the relationship of incurred losses, loss adjustment expenses and underwriting, acquisition and insurance expenses to earned premiums. |
(2) | NM — Ratio is not meaningful. |
(dollars in thousands) | Deferred Policy Acquisition Costs | Unearned Premiums | Unpaid Losses and Loss Adjustment Expenses | |||||||||
December 31, 2010 | ||||||||||||
Excess and Surplus Lines | $ | 73,368 | $ | 356,277 | $ | 2,442,987 | ||||||
Specialty Admitted | 54,669 | 222,965 | 628,775 | |||||||||
London Insurance Market | 60,746 | 260,295 | 1,820,399 | |||||||||
Other Insurance (Discontinued Lines) | — | — | 506,245 | |||||||||
TOTAL | $ | 188,783 | $ | 839,537 | $ | 5,398,406 | ||||||
December 31, 2009 | ||||||||||||
Excess and Surplus Lines | $ | 75,835 | $ | 369,262 | $ | 2,620,119 | ||||||
Specialty Admitted | 31,585 | 134,979 | 383,820 | |||||||||
London Insurance Market | 49,377 | 213,487 | 1,855,014 | |||||||||
Other Insurance (Discontinued Lines) | — | — | 568,143 | |||||||||
TOTAL | $ | 156,797 | $ | 717,728 | $ | 5,427,096 | ||||||
| 73
Markel Corporation & Subsidiaries
NOTES TO CONSOLIDATED FINANCIAL STATEMENTS (continued)
| (dollars in thousands) | Deferred Policy Acquisition Costs | Unearned Premiums | Unpaid Losses and Loss Adjustment Expenses | ||||||||
| December 31, 2013 | |||||||||||
| Excess and Surplus Lines | $ | 69,849 | $ | 469,148 | $ | 1,998,359 | |||||
| Specialty Admitted | 77,118 | 391,606 | 878,564 | ||||||||
| London Insurance Market | 53,420 | 321,383 | 1,909,612 | ||||||||
| Alterra | 60,580 | 944,978 | 4,996,722 | ||||||||
| Other Insurance (Discontinued Lines) | — | — | 478,799 | ||||||||
| Total | $ | 260,967 | $ | 2,127,115 | $ | 10,262,056 | |||||
| December 31, 2012 | |||||||||||
| Excess and Surplus Lines | $ | 59,158 | $ | 410,731 | $ | 2,152,253 | |||||
| Specialty Admitted | 43,810 | 280,811 | 796,093 | ||||||||
| London Insurance Market | 54,497 | 308,719 | 1,958,249 | ||||||||
| Other Insurance (Discontinued Lines) | — | — | 464,831 | ||||||||
| Total | $ | 157,465 | $ | 1,000,261 | $ | 5,371,426 | |||||
c)The following table summarizes segment earned premiums by major product grouping.
(dollars in thousands) | Property | Casualty | Professional/ Products Liability | Workers’ Compensation | Other | Consolidated | ||||||||||||||||||
Year Ended December 31, 2010 | ||||||||||||||||||||||||
Excess and Surplus Lines | $ | 145,250 | $ | 191,770 | $ | 339,427 | $ | — | $ | 133,225 | $ | 809,672 | ||||||||||||
Specialty Admitted | 121,268 | 118,253 | 17,085 | 36,853 | 50,115 | 343,574 | ||||||||||||||||||
London Insurance Market | 201,796 | 50,244 | 176,767 | — | 148,700 | 577,507 | ||||||||||||||||||
Other Insurance (Discontinued Lines) | — | — | — | — | 168 | 168 | ||||||||||||||||||
EARNED PREMIUMS | $ | 468,314 | $ | 360,267 | $ | 533,279 | $ | 36,853 | $ | 332,208 | $ | 1,730,921 | ||||||||||||
Year Ended December 31, 2009 | ||||||||||||||||||||||||
Excess and Surplus Lines | $ | 174,046 | $ | 233,955 | $ | 322,822 | $ | — | $ | 209,275 | $ | 940,098 | ||||||||||||
Specialty Admitted | 131,362 | 130,566 | — | — | 41,969 | 303,897 | ||||||||||||||||||
London Insurance Market | 200,410 | 46,327 | 190,394 | — | 135,307 | 572,438 | ||||||||||||||||||
Other Insurance (Discontinued Lines) | — | — | — | — | (598 | ) | (598 | ) | ||||||||||||||||
EARNED PREMIUMS | $ | 505,818 | $ | 410,848 | $ | 513,216 | $ | — | $ | 385,953 | $ | 1,815,835 | ||||||||||||
Year Ended December 31, 2008 | ||||||||||||||||||||||||
Excess and Surplus Lines | $ | 182,114 | $ | 326,260 | $ | 354,053 | $ | — | $ | 227,540 | $ | 1,089,967 | ||||||||||||
Specialty Admitted | 140,650 | 131,716 | — | — | 43,398 | 315,764 | ||||||||||||||||||
London Insurance Market | 204,722 | 48,713 | 243,050 | — | 119,343 | 615,828 | ||||||||||||||||||
Other Insurance (Discontinued Lines) | — | — | — | — | 625 | 625 | ||||||||||||||||||
EARNED PREMIUMS | $ | 527,486 | $ | 506,689 | $ | 597,103 | $ | — | $ | 390,906 | $ | 2,022,184 | ||||||||||||
| (dollars in thousands) | Property | Casualty | Professional Liability | Workers' Compensation | Other | Consolidated | |||||||||||||||||
| Year Ended December 31, 2013 | |||||||||||||||||||||||
| Excess and Surplus Lines | $ | 115,773 | $ | 253,195 | $ | 208,732 | $ | — | $ | 278,929 | $ | 856,629 | |||||||||||
| Specialty Admitted | 230,068 | 232,868 | — | 253,347 | 28,710 | 744,993 | |||||||||||||||||
| London Insurance Market | 230,278 | 124,843 | 176,302 | — | 250,214 | 781,637 | |||||||||||||||||
| Alterra | 215,488 | 172,736 | 165,934 | 31,347 | 262,812 | 848,317 | |||||||||||||||||
| Other Insurance (Discontinued Lines) | — | — | — | — | 40 | 40 | |||||||||||||||||
| Earned premiums | $ | 791,607 | $ | 783,642 | $ | 550,968 | $ | 284,694 | $ | 820,705 | $ | 3,231,616 | |||||||||||
| Year Ended December 31, 2012 | |||||||||||||||||||||||
| Excess and Surplus Lines | $ | 109,607 | $ | 227,880 | $ | 189,199 | $ | — | $ | 266,473 | $ | 793,159 | |||||||||||
| Specialty Admitted | 148,311 | 163,955 | — | 242,021 | 34,471 | 588,758 | |||||||||||||||||
| London Insurance Market | 259,571 | 126,441 | 162,554 | — | 216,650 | 765,216 | |||||||||||||||||
| Other Insurance (Discontinued Lines) | — | — | — | — | (5 | ) | (5 | ) | |||||||||||||||
| Earned premiums | $ | 517,489 | $ | 518,276 | $ | 351,753 | $ | 242,021 | $ | 517,589 | $ | 2,147,128 | |||||||||||
| Year Ended December 31, 2011 | |||||||||||||||||||||||
| Excess and Surplus Lines | $ | 103,406 | $ | 214,565 | $ | 197,131 | $ | — | $ | 241,204 | $ | 756,306 | |||||||||||
| Specialty Admitted | 135,077 | 140,805 | — | 200,797 | 50,614 | 527,293 | |||||||||||||||||
| London Insurance Market | 231,798 | 117,062 | 173,101 | — | 173,792 | 695,753 | |||||||||||||||||
| Other Insurance (Discontinued Lines) | — | — | — | — | (12 | ) | (12 | ) | |||||||||||||||
| Earned premiums | $ | 470,281 | $ | 472,432 | $ | 370,232 | $ | 200,797 | $ | 465,598 | $ | 1,979,340 | |||||||||||
| December 31, | ||||||||||||
(dollars in thousands) | 2010 | 2009 | 2008 | |||||||||
Segment Assets: | ||||||||||||
Investing | $ | 8,198,401 | $ | 7,844,052 | $ | 6,892,005 | ||||||
Underwriting | 2,371,406 | 2,214,991 | 2,569,234 | |||||||||
TOTAL SEGMENT ASSETS | $ | 10,569,807 | $ | 10,059,043 | $ | 9,461,239 | ||||||
Non-insurance operations | 255,782 | 182,853 | 50,815 | |||||||||
TOTAL ASSETS | $ | 10,825,589 | $ | 10,241,896 | $ | 9,512,054 | ||||||
| December 31, | |||||||||||
| (dollars in thousands) | 2013 | 2012 | 2011 | ||||||||
| Segment assets: | |||||||||||
| Investing | $ | 17,550,332 | $ | 9,277,697 | $ | 8,692,391 | |||||
| Underwriting | 5,468,731 | 2,387,305 | 2,209,431 | ||||||||
| Total segment assets | 23,019,063 | 11,665,002 | 10,901,822 | ||||||||
| Markel Ventures operations | 936,448 | 891,586 | 630,281 | ||||||||
| Total assets | $ | 23,955,511 | $ | 12,556,588 | $ | 11,532,103 | |||||
| Years Ended December 31, | |||||||||||||||||||||||
| 2013 | 2012 | 2011 | |||||||||||||||||||||
| (dollars in thousands) | Other Revenues | Other Expenses | Other Revenues | Other Expenses | Other Revenues | Other Expenses | |||||||||||||||||
| Insurance: | |||||||||||||||||||||||
| Managing general agent operations | $ | 17,399 | $ | 20,382 | $ | 48,056 | $ | 43,069 | $ | 31,136 | $ | 30,728 | |||||||||||
| Life and annuity | 1,130 | 28,126 | — | — | — | — | |||||||||||||||||
| Other | 5,965 | 1,770 | 1,876 | 2,223 | 2,409 | 2,994 | |||||||||||||||||
| 24,494 | 50,278 | 49,932 | 45,292 | 33,545 | 33,722 | ||||||||||||||||||
| Markel Ventures: | |||||||||||||||||||||||
| Manufacturing | 495,138 | 437,712 | 366,886 | 328,484 | 214,668 | 192,503 | |||||||||||||||||
| Non-Manufacturing | 191,310 | 175,538 | 122,466 | 104,472 | 102,864 | 82,821 | |||||||||||||||||
| 686,448 | 613,250 | 489,352 | 432,956 | 317,532 | 275,324 | ||||||||||||||||||
| Total | $ | 710,942 | $ | 663,528 | $ | 539,284 | $ | 478,248 | $ | 351,077 | $ | 309,046 | |||||||||||
a)The Company maintains defined contribution plans for employees of its United States insurance operations in accordance with Section 401(k) of the Internal Revenue Code.IRC. Employees of the Company’s non-insuranceCompany's Markel Ventures subsidiaries are provided post-retirement benefits under separate plans. The Company also provides anothervarious defined contribution planplans for Markel International employees. This plan isemployees of its international insurance operations, which are in line with local market terms and conditions of employment. Expenses relating to the Company’sCompany's defined contribution plans, including the defined contribution plans of Alterra effective May 1, 2013, were $14.4$24.3 million $13.1, $19.1 million and $13.1$17.8 million in 2010, 20092013, 2012 and 2008,2011, respectively.
74 |
b)The Terra Nova Pension Plan is a defined benefit plan which covers Markel International employees who meet the eligibility conditions set out in the plan. The plan has been closed to new participants since 2001. The cost of providing pensions for employees is charged to earnings over the average working life of employees according to actuarial recommendations. Final benefits are based on the employee’semployee's years of credited service and the higher of pensionable compensation received in the calendar year preceding retirement or the best average pensionable compensation received in any three consecutive years in the ten years preceding retirement. Effective April 1, 2012, employees are no longer accruing benefits for future service in the Terra Nova Pension Plan. The Company uses December 31 as the measurement date for the Terra Nova Pension Plan.
| Years Ended December 31, | ||||||||
(dollars in thousands) | 2010 | 2009 | ||||||
Change in projected benefit obligation: | ||||||||
Projected benefit obligation at beginning of period | $ | 125,052 | $ | 93,442 | ||||
Service cost | 1,238 | 1,374 | ||||||
Interest cost | 6,812 | 5,881 | ||||||
Participant contributions | 271 | 148 | ||||||
Benefits paid | (4,004 | ) | (2,719 | ) | ||||
Actuarial loss | 5,499 | 17,210 | ||||||
Effect of foreign currency rate changes | (4,602 | ) | 9,716 | |||||
PROJECTED BENEFIT OBLIGATIONAT ENDOF YEAR | $ | 130,266 | $ | 125,052 | ||||
Change in plan assets: | ||||||||
Fair value of plan assets at beginning of period | $ | 120,092 | $ | 86,064 | ||||
Actual gain on plan assets | 16,099 | 20,823 | ||||||
Employer contributions | 6,560 | 6,829 | ||||||
Participant contributions | 271 | 148 | ||||||
Benefits paid | (4,004 | ) | (2,719 | ) | ||||
Effect of foreign currency rate changes | (4,429 | ) | 8,947 | |||||
FAIR VALUEOF PLAN ASSETSAT ENDOF YEAR | $ | 134,589 | $ | 120,092 | ||||
Funded status of the plan | $ | 4,323 | $ | (4,960 | ) | |||
Net actuarial pension loss | 44,064 | 47,882 | ||||||
TOTAL | $ | 48,387 | $ | 42,922 | ||||
| �� | ||||||||
| Years Ended December 31, | |||||||
| (dollars in thousands) | 2013 | 2012 | |||||
| Change in projected benefit obligation: | |||||||
| Projected benefit obligation at beginning of period | $ | 151,327 | $ | 141,163 | |||
| Service cost | — | 361 | |||||
| Interest cost | 6,533 | 6,815 | |||||
| Participant contributions | — | 81 | |||||
| Benefits paid | (3,542 | ) | (2,938 | ) | |||
| Actuarial loss (gain) | 5,459 | (601 | ) | ||||
| Effect of foreign currency rate changes | 3,233 | 6,446 | |||||
| Projected benefit obligation at end of year | $ | 163,010 | $ | 151,327 | |||
| Change in plan assets: | |||||||
| Fair value of plan assets at beginning of period | $ | 164,090 | $ | 139,325 | |||
| Actual gain on plan assets | 19,430 | 15,251 | |||||
| Employer contributions | 5,338 | 5,737 | |||||
| Participant contributions | — | 81 | |||||
| Benefits paid | (3,542 | ) | (2,938 | ) | |||
| Effect of foreign currency rate changes | 4,121 | 6,634 | |||||
| Fair value of plan assets at end of year | $ | 189,437 | $ | 164,090 | |||
| Funded status of the plan | $ | 26,427 | $ | 12,763 | |||
| Net actuarial pension loss | 42,941 | 48,021 | |||||
| Total | $ | 69,368 | $ | 60,784 | |||
| 75
Markel Corporation & Subsidiaries
NOTES TO CONSOLIDATED FINANCIAL STATEMENTS (continued)
18. Employee Benefit Plans (continued)
| Years Ended December 31, | ||||||||||||
(dollars in thousands) | 2010 | 2009 | 2008 | |||||||||
Components of net periodic benefit cost: | ||||||||||||
Service cost | $ | 1,238 | $ | 1,374 | $ | 1,940 | ||||||
Interest cost | 6,812 | 5,881 | 5,850 | |||||||||
Expected return on plan assets | (8,645 | ) | (6,877 | ) | (7,208 | ) | ||||||
Amortization of net actuarial pension loss | 1,931 | 1,990 | 1,602 | |||||||||
NET PERIODIC BENEFIT COST | $ | 1,336 | $ | 2,368 | $ | 2,184 | ||||||
Weighted average assumptions as of December 31: | ||||||||||||
Discount rate | 5.4 | % | 5.8 | % | 6.0 | % | ||||||
Expected return on plan assets | 6.8 | % | 7.2 | % | 7.2 | % | ||||||
Rate of compensation increase | 4.5 | % | 4.5 | % | 4.5 | % | ||||||
| Years Ended December 31, | |||||||||||
| (dollars in thousands) | 2013 | 2012 | 2011 | ||||||||
| Components of net periodic benefit cost (income): | |||||||||||
| Service cost | $ | — | $ | 361 | $ | 1,357 | |||||
| Interest cost | 6,533 | 6,815 | 7,115 | ||||||||
| Expected return on plan assets | (10,825 | ) | (9,788 | ) | (9,834 | ) | |||||
| Amortization of net actuarial pension loss | 1,934 | 2,590 | 1,908 | ||||||||
| Net periodic benefit cost (income) | $ | (2,358 | ) | $ | (22 | ) | $ | 546 | |||
| Weighted average assumptions as of December 31: | |||||||||||
| Discount rate | 4.7 | % | 4.5 | % | 4.8 | % | |||||
| Expected return on plan assets | 6.6 | % | 6.6 | % | 6.6 | % | |||||
| Rate of compensation increase | 3.2 | % | 3.1 | % | 3.2 | % | |||||
Management’s
2013
.| December 31, | ||||||||
(dollars in thousands) | 2010 | 2009 | ||||||
Plan assets: | ||||||||
Fixed maturity index funds | $ | 31,230 | $ | 24,535 | ||||
Equity security index funds | 103,273 | 95,538 | ||||||
Cash and cash equivalents | 86 | 19 | ||||||
TOTAL | $ | 134,589 | $ | 120,092 | ||||
76 |
.
| December 31, | |||||||
| (dollars in thousands) | 2013 | 2012 | |||||
| Plan assets: | |||||||
| Fixed maturity index funds | $ | 70,997 | $ | 64,357 | |||
| Equity security index funds | 118,431 | 99,727 | |||||
| Cash and cash equivalents | 9 | 6 | |||||
| Total | $ | 189,437 | $ | 164,090 | |||
| 77
NOTES TO CONSOLIDATED FINANCIAL STATEMENTS (continued)
Ventures subsidiaries, participated in a multiemployer defined benefit pension plan, Regime de retraite patronal-syndical (Quebec) de l'A.I.M. (Quebec pension plan no. 26467). The multiemployer plan covered approximately
| December 31, | ||||||||
| 2010 | 2009 | |||||||
| (dollars in thousands) | ||||||||
ASSETS | ||||||||
Investments, available-for-sale, at estimated fair value: | ||||||||
Fixed maturities (amortized cost of $194,441 in 2010 and $233,932 in 2009) | $ | 201,736 | $ | 249,640 | ||||
Equity securities (cost of $276,507 in 2010 and $218,103 in 2009) | 391,831 | 304,416 | ||||||
Short-term investments (estimated fair value approximates cost) | 109,994 | 179,986 | ||||||
Investments in affiliates | — | 43,633 | ||||||
TOTAL INVESTMENTS | 703,561 | 777,675 | ||||||
Cash and cash equivalents | 182,088 | 243,182 | ||||||
Receivables | 27,467 | 18,093 | ||||||
Investments in consolidated subsidiaries | 2,917,796 | 2,677,419 | ||||||
Notes receivable from subsidiaries | 296,694 | 66,517 | ||||||
Income taxes receivable | 6,087 | 21,899 | ||||||
Net deferred tax asset | 22,214 | — | ||||||
Other assets | 50,923 | 47,786 | ||||||
TOTAL ASSETS | $ | 4,206,830 | $ | 3,852,571 | ||||
LIABILITIESAND SHAREHOLDERS’ EQUITY | ||||||||
Senior long-term debt | $ | 937,015 | $ | 936,242 | ||||
Net deferred tax liability | — | 27,644 | ||||||
Other liabilities | 98,292 | 114,325 | ||||||
TOTAL LIABILITIES | 1,035,307 | 1,078,211 | ||||||
TOTAL SHAREHOLDERS’ EQUITY | 3,171,523 | 2,774,360 | ||||||
TOTAL LIABILITIESAND SHAREHOLDERS’ EQUITY | $ | 4,206,830 | $ | 3,852,571 | ||||
78 |
| December 31, | |||||||
| 2013 | 2012 | ||||||
| (dollars in thousands) | |||||||
| ASSETS | |||||||
| Investments, available-for-sale, at estimated fair value: | |||||||
| Fixed maturities (amortized cost of $66,154 in 2013 and $80,631 in 2012) | $ | 67,363 | $ | 84,158 | |||
| Equity securities (cost of $197,549 in 2013 and $270,157 in 2012) | 392,123 | 426,409 | |||||
| Short-term investments (estimated fair value approximates cost) | 654,971 | 664,986 | |||||
| Total Investments | 1,114,457 | 1,175,553 | |||||
| Cash and cash equivalents | 207,352 | 237,816 | |||||
| Restricted cash and cash equivalents | 1,010 | 662 | |||||
| Receivables | 14,326 | 13,994 | |||||
| Investments in consolidated subsidiaries | 6,826,790 | 3,656,577 | |||||
| Notes receivable from subsidiaries | 168,611 | 173,913 | |||||
| Income taxes receivable | 5,320 | 6,623 | |||||
| Net deferred tax asset | — | 6,595 | |||||
| Other assets | 102,193 | 99,107 | |||||
| Total Assets | $ | 8,440,059 | $ | 5,370,840 | |||
| LIABILITIES AND SHAREHOLDERS' EQUITY | |||||||
| Senior long-term debt | $ | 1,633,873 | $ | 1,388,029 | |||
| Net deferred tax liability | 40,443 | — | |||||
| Other liabilities | 92,166 | 94,154 | |||||
| Total Liabilities | 1,766,482 | 1,482,183 | |||||
| Total Shareholders' Equity | 6,673,577 | 3,888,657 | |||||
| Total Liabilities and Shareholders' Equity | $ | 8,440,059 | $ | 5,370,840 | |||
19. Markel Corporation (Parent Company Only) Financial Information (continued)
| Years Ended December 31, | ||||||||||||
| 2010 | 2009 | 2008 | ||||||||||
| (dollars in thousands) | ||||||||||||
REVENUES | ||||||||||||
Net investment income | $ | 21,070 | $ | 21,899 | $ | 5,432 | ||||||
Dividends on common stock of consolidated subsidiaries | 142,014 | 44,048 | 246,346 | |||||||||
Net realized investment gains (losses): | ||||||||||||
Other-than-temporary impairment losses | (8,087 | ) | (28,185 | ) | (63,043 | ) | ||||||
Net realized investment gains (losses), excluding other-than-temporary impairment losses | 21,496 | 4,201 | (62,281 | ) | ||||||||
Net realized investment gains (losses) | 13,409 | (23,984 | ) | (125,324 | ) | |||||||
Other | 5 | 4 | 2 | |||||||||
TOTAL REVENUES | 176,498 | 41,967 | 126,456 | |||||||||
EXPENSES | ||||||||||||
Interest | 69,107 | 52,286 | 47,357 | |||||||||
Other | 1,226 | 4,764 | 2,336 | |||||||||
TOTAL EXPENSES | 70,333 | 57,050 | 49,693 | |||||||||
INCOME (LOSS) BEFORE EQUITYIN UNDISTRIBUTED EARNINGSOF CONSOLIDATED SUBSIDIARIESAND INCOME TAXES | 106,165 | (15,083 | ) | 76,763 | ||||||||
Equity in undistributed earnings of consolidated subsidiaries | 113,892 | 203,822 | (218,823 | ) | ||||||||
Income tax benefit | 46,736 | 12,899 | 83,293 | |||||||||
NET INCOME (LOSS ) TO SHAREHOLDERS | $ | 266,793 | $ | 201,638 | $ | (58,767 | ) | |||||
OTHER COMPREHENSIVE INCOME (LOSS)TO SHAREHOLDERS | ||||||||||||
Change in net unrealized gains on investments, net of taxes: | ||||||||||||
Net holding gains (losses) arising during the period | $ | 28,646 | $ | 27,516 | $ | (92,656 | ) | |||||
Consolidated subsidiaries’ net holding gains (losses) arising during the period | 167,002 | 299,443 | (502,111 | ) | ||||||||
Consolidated subsidiaries’ unrealized other-than-temporary impairment losses on fixed maturities arising during the period | 672 | (5,405 | ) | — | ||||||||
Reclassification adjustments for net gains (losses) included in net income (loss) to shareholders | (15,257 | ) | 6,043 | 81,403 | ||||||||
Consolidated subsidiaries’ reclassification adjustments for net gains (losses) included in net income (loss) to shareholders | (17,574 | ) | 46,840 | 183,495 | ||||||||
Change in net unrealized gains on investments, net of taxes | 163,489 | 374,437 | (329,869 | ) | ||||||||
Change in foreign currency translation adjustments, net of taxes | 1,656 | (22,532 | ) | 19,558 | ||||||||
Consolidated subsidiaries’ change in foreign currency translation adjustments, net of taxes | (4,124 | ) | 41,720 | (27,451 | ) | |||||||
Change in net actuarial pension loss, net of taxes | — | 460 | 726 | |||||||||
Consolidated subsidiaries’ change in net actuarial pension loss, net of taxes | 2,749 | (4,728 | ) | (7,466 | ) | |||||||
TOTAL OTHER COMPREHENSIVE INCOME (LOSS)TO SHAREHOLDERS | 163,770 | 389,357 | (344,502 | ) | ||||||||
COMPREHENSIVE INCOME (LOSS )TO SHAREHOLDERS | $ | 430,563 | $ | 590,995 | $ | (403,269 | ) | |||||
| 79
| Years Ended December 31, | |||||||||||
| 2013 | 2012 | 2011 | |||||||||
| (dollars in thousands) | |||||||||||
| REVENUES | |||||||||||
| Net investment income | $ | 21,946 | $ | 30,619 | $ | 12,629 | |||||
| Dividends on common stock of consolidated subsidiaries | 806,233 | 337,585 | 330,462 | ||||||||
| Net realized investment gains (losses): | |||||||||||
| Other-than-temporary impairment losses | (15 | ) | (38 | ) | (7,676 | ) | |||||
| Net realized investment gains, excluding other-than-temporary impairment losses | 67,232 | 14,926 | 7,417 | ||||||||
| Net realized investment gains (losses) | 67,217 | 14,888 | (259 | ) | |||||||
| Other | 1 | 3 | 13 | ||||||||
| Total Revenues | 895,397 | 383,095 | 342,845 | ||||||||
| EXPENSES | |||||||||||
| Interest expense | 92,743 | 87,391 | 78,830 | ||||||||
| Other expenses | 2,617 | 1,166 | 4,572 | ||||||||
| Total Expenses | 95,360 | 88,557 | 83,402 | ||||||||
| Income Before Equity in Undistributed Earnings of Consolidated Subsidiaries and Income Taxes | 800,037 | 294,538 | 259,443 | ||||||||
| Equity in undistributed earnings of consolidated subsidiaries | (520,323 | ) | (61,663 | ) | (144,348 | ) | |||||
| Income tax benefit | (1,307 | ) | (20,510 | ) | (26,931 | ) | |||||
| Net Income to Shareholders | $ | 281,021 | $ | 253,385 | $ | 142,026 | |||||
| OTHER COMPREHENSIVE INCOME TO SHAREHOLDERS | |||||||||||
| Change in net unrealized gains on investments, net of taxes: | |||||||||||
| Net holding gains arising during the period | $ | 66,623 | $ | 10,897 | $ | 675 | |||||
| Consolidated subsidiaries' net holding gains arising during the period | 158,922 | 255,528 | 141,164 | ||||||||
| Consolidated subsidiaries' change in unrealized other-than-temporary impairment losses on fixed maturities arising during the period | (141 | ) | (160 | ) | 3,943 | ||||||
| Reclassification adjustments for net gains (losses) included in net income to shareholders | (43,220 | ) | 11,847 | 735 | |||||||
| Consolidated subsidiaries' reclassification adjustments for net gains (losses) included in net income to shareholders | 2,390 | (35,898 | ) | (23,076 | ) | ||||||
| Change in net unrealized gains on investments, net of taxes | 184,574 | 242,214 | 123,441 | ||||||||
| Change in foreign currency translation adjustments, net of taxes | (2,670 | ) | (242 | ) | 314 | ||||||
| Consolidated subsidiaries' change in foreign currency translation adjustments, net of taxes | (7,501 | ) | 1,781 | (4,469 | ) | ||||||
| Consolidated subsidiaries' change in net actuarial pension loss, net of taxes | 4,065 | 6,664 | (9,459 | ) | |||||||
| Total Other Comprehensive Income to Shareholders | 178,468 | 250,417 | 109,827 | ||||||||
| Comprehensive Income to Shareholders | $ | 459,489 | $ | 503,802 | $ | 251,853 | |||||
Markel Corporation & Subsidiaries
NOTES TO CONSOLIDATED FINANCIAL STATEMENTS (continued)
19. Markel Corporation (Parent Company Only) Financial Information (continued)
| Years Ended December 31, | ||||||||||||
| 2010 | 2009 | 2008 | ||||||||||
| (dollars in thousands) | ||||||||||||
OPERATING ACTIVITIES | ||||||||||||
Net income (loss) to shareholders | $ | 266,793 | $ | 201,638 | $ | (58,767 | ) | |||||
Adjustments to reconcile net income (loss) to shareholders to net cash provided by operating activities | (181,824 | ) | (124,388 | ) | 239,739 | |||||||
NET CASH PROVIDEDBY OPERATING ACTIVITIES | 84,969 | 77,250 | 180,972 | |||||||||
INVESTING ACTIVITIES | ||||||||||||
Proceeds from sales of fixed maturities and equity securities | 244,225 | 30,233 | 314,544 | |||||||||
Proceeds from maturities, calls and prepayments of fixed maturities | 43,530 | 10,597 | 19,253 | |||||||||
Cost of fixed maturities and equity securities purchased | (252,934 | ) | (59,410 | ) | (286,766 | ) | ||||||
Net change in short-term investments | 69,861 | (59,736 | ) | (119,698 | ) | |||||||
Decrease (increase) in notes receivable due from subsidiaries | 2,142 | (39,088 | ) | 5,700 | ||||||||
Capital contributions to subsidiaries | (53,409 | ) | (127,094 | ) | (138,406 | ) | ||||||
Return of capital from subsidiaries | 3,505 | 101,715 | 109,949 | |||||||||
Acquisitions | (128,884 | ) | — | — | ||||||||
Additions to property and equipment | (18,621 | ) | (12,360 | ) | (9,764 | ) | ||||||
Other | (757 | ) | 20,766 | (22,350 | ) | |||||||
NET CASH USEDBY INVESTING ACTIVITIES | (91,342 | ) | (134,377 | ) | (127,538 | ) | ||||||
FINANCING ACTIVITIES | ||||||||||||
Additions to senior long-term debt | — | 497,172 | 100,000 | |||||||||
Repayments and retirement of senior long-term debt | — | (250,000 | ) | (93,050 | ) | |||||||
Repurchases of common stock | (45,218 | ) | — | (60,601 | ) | |||||||
Other | (9,503 | ) | (441 | ) | — | |||||||
NET CASH PROVIDED (USED)BY FINANCING ACTIVITIES | (54,721 | ) | 246,731 | (53,651 | ) | |||||||
Increase (decrease) in cash and cash equivalents | (61,094 | ) | 189,604 | (217 | ) | |||||||
Cash and cash equivalents at beginning of year | 243,182 | 53,578 | 53,795 | |||||||||
CASHAND CASH EQUIVALENTSAT ENDOF YEAR | $ | 182,088 | $ | 243,182 | $ | 53,578 | ||||||
20. Derivatives
The Company is a party to a credit default swap agreement, under which third party credit risk is transferred from a counterparty to the Company. The Company entered into the credit default swap agreement for investment purposes. At both December 31, 2010 and 2009, the notional amount
| Years Ended December 31, | |||||||||||
| 2013 | 2012 | 2011 | |||||||||
| (dollars in thousands) | |||||||||||
| OPERATING ACTIVITIES | |||||||||||
| Net income to shareholders | $ | 281,021 | $ | 253,385 | $ | 142,026 | |||||
| Adjustments to reconcile net income to shareholders to net cash provided by operating activities | 186,574 | (153,773 | ) | 102,714 | |||||||
| Net Cash Provided By Operating Activities | 467,595 | 99,612 | 244,740 | ||||||||
| INVESTING ACTIVITIES | |||||||||||
| Proceeds from sales of fixed maturities and equity securities | 142,259 | 149,314 | 50,322 | ||||||||
| Proceeds from maturities, calls and prepayments of fixed maturities | 2,819 | 64,340 | 46,522 | ||||||||
| Cost of fixed maturities and equity securities purchased | (23,412 | ) | (89,569 | ) | (92,287 | ) | |||||
| Net change in short-term investments | 260,247 | (214,820 | ) | (179,823 | ) | ||||||
| Decrease in notes receivable due from subsidiaries | 5,302 | 116,797 | 7,401 | ||||||||
| Capital contributions to subsidiaries | (67,878 | ) | (198,349 | ) | (179,403 | ) | |||||
| Acquisitions | (1,017,988 | ) | (100,409 | ) | — | ||||||
| Cost of equity method investments | (5,291 | ) | (38,250 | ) | — | ||||||
| Change in restricted cash and cash equivalents | (348 | ) | (204 | ) | (326 | ) | |||||
| Additions to property and equipment | (3,653 | ) | (9,437 | ) | (16,927 | ) | |||||
| Other | 3,207 | (4,369 | ) | 12,175 | |||||||
| Net Cash Used By Investing Activities | (704,736 | ) | (324,956 | ) | (352,346 | ) | |||||
| FINANCING ACTIVITIES | |||||||||||
| Additions to senior long-term debt | 491,235 | 347,207 | 247,935 | ||||||||
| Repayment and retirement of senior long-term debt | (246,665 | ) | (157,359 | ) | — | ||||||
| Repurchases of common stock | (57,388 | ) | (16,873 | ) | (42,913 | ) | |||||
| Issuance of common stock | 24,518 | 9,145 | 1,182 | ||||||||
| Other | (5,023 | ) | 436 | 50 | |||||||
| Net Cash Provided By Financing Activities | 206,677 | 182,556 | 206,254 | ||||||||
| Increase (decrease) in cash and cash equivalents | (30,464 | ) | (42,788 | ) | 98,648 | ||||||
| Cash and cash equivalents at beginning of year | 237,816 | 280,604 | 181,956 | ||||||||
| CASH AND CASH EQUIVALENTS AT END OF YEAR | $ | 207,352 | $ | 237,816 | $ | 280,604 | |||||
| Quarters Ended | ||||||||||||||||
(dollars in thousands, except per share amounts) | Mar. 31 | June 30 | Sept. 30 | Dec. 31 | ||||||||||||
2010 | ||||||||||||||||
Operating revenues | $ | 536,719 | $ | 515,414 | $ | 561,354 | $ | 611,906 | ||||||||
Net income | 43,206 | 20,917 | 63,157 | 140,449 | ||||||||||||
Net income to shareholders | 42,569 | 20,831 | 63,250 | 140,143 | ||||||||||||
Comprehensive income (loss) to shareholders | 134,539 | (33,903 | ) | 225,328 | 104,599 | |||||||||||
Net income per share: | ||||||||||||||||
Basic | $ | 4.34 | $ | 2.13 | $ | 6.49 | $ | 14.42 | ||||||||
Diluted | 4.33 | 2.12 | 6.48 | 14.37 | ||||||||||||
Common stock price ranges: | ||||||||||||||||
High | $ | 379.05 | $ | 392.55 | $ | 354.34 | $ | 386.87 | ||||||||
Low | 325.00 | 326.90 | 320.71 | 332.77 | ||||||||||||
2009 | ||||||||||||||||
Operating revenues | $ | 495,177 | $ | 522,432 | $ | 500,349 | $ | 551,368 | ||||||||
Net income | 16,436 | 33,030 | 59,211 | 93,742 | ||||||||||||
Net income to shareholders | 16,358 | 32,798 | 59,126 | 93,356 | ||||||||||||
Comprehensive income (loss) to shareholders | (1,996 | ) | 171,869 | 339,859 | 81,263 | |||||||||||
Net income per share: | ||||||||||||||||
Basic | $ | 1.67 | $ | 3.34 | $ | 6.02 | $ | 9.51 | ||||||||
Diluted | 1.67 | 3.34 | 6.02 | 9.49 | ||||||||||||
Common stock price ranges: | ||||||||||||||||
High | $ | 317.75 | $ | 316.00 | $ | 363.00 | $ | 347.50 | ||||||||
Low | 208.77 | 255.37 | 266.91 | 316.85 | ||||||||||||
2008 | ||||||||||||||||
Operating revenues | $ | 520,222 | $ | 645,003 | $ | 434,204 | $ | 377,154 | ||||||||
Net income (loss) | 33,976 | 82,315 | (142,115 | ) | (32,610 | ) | ||||||||||
Net income (loss) to shareholders | 33,988 | 82,242 | (142,287 | ) | (32,710 | ) | ||||||||||
Comprehensive loss to shareholders | (19,889 | ) | (93,698 | ) | (158,822 | ) | (130,860 | ) | ||||||||
Net income (loss) per share: | ||||||||||||||||
Basic | $ | 3.42 | $ | 8.30 | $ | (14.46 | ) | $ | (3.33 | ) | ||||||
Diluted | 3.41 | 8.29 | (14.46 | ) | (3.33 | ) | ||||||||||
Common stock price ranges: | ||||||||||||||||
High | $ | 492.97 | $ | 458.31 | $ | 480.00 | $ | 392.38 | ||||||||
Low | 394.99 | 367.00 | 315.90 | 234.23 | ||||||||||||
| 83
| Quarters Ended | |||||||||||||||
| (dollars in thousands, except per share amounts) | Mar. 31 | June 30 | Sept. 30 | Dec. 31 | |||||||||||
| 2013 | |||||||||||||||
| Operating revenues | $ | 819,864 | $ | 1,031,769 | $ | 1,191,665 | $ | 1,279,785 | |||||||
| Net income | 89,263 | 28,676 | 66,967 | 98,939 | |||||||||||
| Net income to shareholders | 88,902 | 27,756 | 65,599 | 98,764 | |||||||||||
| Comprehensive income (loss) to shareholders | 257,684 | (149,054 | ) | 144,409 | 206,450 | ||||||||||
| Net income per share: | |||||||||||||||
| Basic | $ | 9.53 | $ | 2.24 | $ | 4.69 | $ | 6.98 | |||||||
| Diluted | 9.50 | 2.24 | 4.67 | 6.95 | |||||||||||
| Common stock price ranges: | |||||||||||||||
| High | $ | 510.05 | $ | 546.94 | $ | 549.09 | $ | 582.59 | |||||||
| Low | 434.98 | 501.76 | 506.64 | 511.06 | |||||||||||
| 2012 | |||||||||||||||
| Operating revenues | $ | 733,135 | $ | 693,247 | $ | 765,775 | $ | 807,955 | |||||||
| Net income | 57,713 | 90,768 | 51,674 | 58,093 | |||||||||||
| Net income to shareholders | 57,253 | 89,687 | 49,653 | 56,792 | |||||||||||
| Comprehensive income to shareholders | 205,945 | 73,416 | 147,454 | 76,987 | |||||||||||
| Net income per share: | |||||||||||||||
| Basic | $ | 5.94 | $ | 8.44 | $ | 5.33 | $ | 6.25 | |||||||
| Diluted | 5.92 | 8.42 | 5.32 | 6.23 | |||||||||||
| Common stock price ranges: | |||||||||||||||
| High | $ | 451.90 | $ | 453.50 | $ | 459.90 | $ | 502.20 | |||||||
| Low | 398.65 | 421.00 | 420.00 | 425.17 | |||||||||||
| 2011 | |||||||||||||||
| Operating revenues | $ | 621,594 | $ | 647,168 | $ | 676,088 | $ | 685,100 | |||||||
| Net income | 9,861 | 31,649 | 54,669 | 52,307 | |||||||||||
| Net income to shareholders | 8,272 | 30,314 | 53,264 | 50,176 | |||||||||||
| Comprehensive income (loss) to shareholders | 24,738 | 96,045 | (52,626 | ) | 183,696 | ||||||||||
| Net income per share: | |||||||||||||||
| Basic | $ | 0.85 | $ | 3.12 | $ | 5.50 | $ | 5.21 | |||||||
| Diluted | 0.85 | 3.11 | 5.48 | 5.19 | |||||||||||
| Common stock price ranges: | |||||||||||||||
| High | $ | 422.83 | $ | 430.26 | $ | 403.21 | $ | 419.10 | |||||||
| Low | 379.44 | 386.81 | 346.15 | 337.50 | |||||||||||
Markel Corporation & Subsidiaries
2012. 2014REPORT OF INDEPENDENT REGISTERED PUBLIC ACCOUNTING FIRM
 The Board of Directors and ShareholdersMarkel Corporation:We have audited the accompanying consolidated balance sheets of Markel Corporation and subsidiaries (the Company) as of December 31,
 20102013 and 2009,2012, and the related consolidated statements of operationsincome and comprehensive income, (loss), changes in equity, and cash flows for each of the years in the three-year period ended December 31, 2010.2013. These consolidated financial statements are the responsibility of the Company’sCompany's management. Our responsibility is to express an opinion on these consolidated financial statements based on our audits.We conducted our audits in accordance with the standards of the Public Company Accounting Oversight Board (United States). Those standards require that we plan and perform the audit to obtain reasonable assurance about whether the financial statements are free of material misstatement. An audit includes examining, on a test basis, evidence supporting the amounts and disclosures in the financial statements. An audit also includes assessing the accounting principles used and significant estimates made by management, as well as evaluating the overall financial statement presentation. We believe that our audits provide a reasonable basis for our opinion.In our opinion, the consolidated financial statements referred to above present fairly, in all material respects, the financial position of Markel Corporation and subsidiaries as of December 31, 20102013 and 2009,2012, and the results of their operations and their cash flows for each of the years in the three-year period ended December 31, 2010,2013, in conformity with U.S. generally accepted accounting principles.The Company prospectively adopted Financial Accounting Standards Board Accounting Standards Codification 320-10-65Update 2010-26 related to the recognition and presentationdeferral of other-than-temporary impairment of investmentsinsurance policy acquisition costs incurred on Aprilnew or renewal insurance contracts on January 1, 2009.We also have audited, in accordance with the standards of the Public Company Accounting Oversight Board (United States), Markel Corporation’sCorporation's internal control over financial reporting as of December 31, 2010,2013, based on criteria established inInternal Control—Integrated Framework (1992)issued by the Committee of Sponsoring Organizations of the Treadway Commission (COSO), and our report dated February 28, 20112014 expressed an unqualified opinion on the effectiveness of the Company’sCompany's internal control over financial reporting.
 Richmond, VirginiaFebruary 28,
 201184 |85
| 85
Markel Corporation & Subsidiaries
REPORT OF INDEPENDENT REGISTERED PUBLIC ACCOUNTING FIRM (continued)
2014


.
 |
 | |||
| Alan I. Kirshner | Anne G. Waleski | |||
| Chief Executive Officer | Chief Financial Officer | |||
| February 28, 2014 | ||||
February 28, 2011
|
Markel Corporation & Subsidiaries
OF FINANCIAL CONDITION AND RESULTS OF OPERATIONS value, except for reserves assumed in connection with an acquisition, which are recorded at fair value at the acquisition date. 2012MANAGEMENT’SMANAGEMENT'S DISCUSSION & ANALYSISCritical Accounting EstimatesThe accompanying consolidated financial statements and related notes have been prepared in accordance with U.S. generally accepted accounting principles (U.S. GAAP) and include the accounts of Markel Corporation and allits subsidiaries. For a discussion of our significant accounting policies, see note 1 of the notes to consolidated financial statements.Critical accounting estimates are those estimates that both are important to the portrayal of our financial condition and results of operations and require us to exercise significant judgment. The preparation of financial statements in accordance with U.S. GAAP requires us to make estimates and assumptions that affect the reported amounts of assets, liabilities, revenues and expenses and the disclosure of material contingent assets and liabilities, including litigation contingencies. These estimates, by necessity, are based on assumptions about numerous factors.We review ourthe following critical accounting estimates and assumptions quarterly. These reviews includequarterly: evaluating the adequacy of reserves for unpaid losses and loss adjustment expenses, life and annuity reinsurance benefit reserves, the reinsurance allowance for doubtful accounts and income tax liabilities, as well as analyzing the recoverability of deferred tax assets, assessing goodwill for impairmentestimating reinsurance premiums written and earned and evaluating the investment portfolio for other-than-temporary declines in estimated fair value. Critical accounting estimates and assumptions for goodwill and intangible assets are reviewed in conjunction with an acquisition and goodwill and indefinite-lived intangible assets are reassessed at least annually for impairment. Actual results may differ materially from the estimates and assumptions used in preparing the consolidated financial statements.Unpaid Losses and Loss Adjustment ExpensesOur consolidated balance sheet included estimated unpaid losses and loss adjustment expenses of $5.4$10.3 billion and reinsurance recoverable on unpaid losses of $0.8$1.9 billion at December 31, 20102013 compared to $5.4$5.4 billion and $0.9 billion,$778.8 million, respectively, at December 31, 2009.2012. We do not discount our reserves for losses and loss adjustment expenses to reflect estimated present value.We accrue liabilities for unpaid losses and loss adjustment expenses based upon estimates of the ultimate amounts payable. We maintain reserves for specific claims incurred and reported (case reserves) and reserves for claims incurred but not reported (IBNR reserves).Reported claims are in various stages of the settlement process, and the corresponding reserves for reported claims are based primarily on case-by-case evaluations of the individual claims.upon all information available to us. Case reserves consider our estimate of the ultimate cost to settle the claims, including investigation and defense of lawsuits resulting from the claims, and may be subject to adjustment for differences between costs originally estimated and costs subsequently re-estimated or incurred. Each claim isClaims are settled individually based upon itstheir merits, and some claims may take years to settle, especially if legal action is involved.For our insurance operations, we are generally notified of insured losses by our insureds or their brokers. Based on this information, we establish case reserves by estimating the expected ultimate losses from the claim (including any administrative costs associated with settling the claim). Our claims personnel use their knowledge of the specific claim along with internal and external experts, including underwriters, actuaries and legal counsel, to estimate the expected ultimate losses.For our reinsurance operations, case reserves are generally established based on reports received from ceding companies or their brokers. For excess of loss contracts, we are typically notified of insurance losses on specific contracts and record a case reserve for the estimated expected ultimate losses from the claim. For proportional contracts, we typically receive aggregated claims information and record a case reserve based on that information. As with insurance business, we evaluate this information and estimate the expected ultimate losses.As of any balance sheet date, all claims have not yet been reported, and some claims may not be reported for many years. As a result, the liability for unpaid losses and loss adjustment expenses includes significant estimates for incurred but not reported claims.88There is normally a time lag between when a loss event occurs and when it is actually reported to us. The actuarial methods that we use to estimate losses have been designed to address the lag in loss reporting as well as the delay in obtaining information that would allow us to more accurately estimate future payments. There is also often a time lag between cedents establishing case reserves and re-estimating their reserves, and notifying us of the new or revised case reserves. As a result, the reporting lag is more pronounced in our reinsurance contracts than in our insurance contracts due to the reliance on insurers to report their claims to us. On reinsurance transactions, the reporting lag will generally be 60 to 90 days after the end of a reporting period, but can be longer in some cases. Based on the experience of our actuaries and management, we select loss development factors and trending techniques to mitigate the problems caused by reporting lags. We regularly evaluate and update our loss development and trending factor selections using cedent specific and industry data.U.S. GAAP requires that IBNR reserves be based on the estimated ultimate cost of settling claims, including the effects of inflation and other social and economic factors, using past experience adjusted for current trends and any other factors that would modify past experience. IBNR reserves are generally calculated by subtracting paid losses and case reserves from estimated ultimate losses. IBNR reserves were 61%64% of total unpaid losses and loss adjustment expenses at December 31, 20102013 compared to 60%61% at December 31, 2009.88 |Our liabilities for unpaid losses and loss adjustment expenses can generally be categorized into two distinct groups, short-tail business and long-tail business. Short-tail business refers to lines of business, such as property, accident and health, motorcycle,automobile, watercraft and marine hull exposures for which losses are usually known and paid shortly after the loss actually occurs. Long-tail business describes lines of business for which specific losses may not be known and reported for some period and losses take much longer to emerge. Given the time frame over which long-tail exposures are ultimately settled, there is greater uncertainty and volatility in these lines than in short-tail lines of business. Our long-tail coverages consist of most casualty lines, including professional liability, directors’directors' and officers’officers' liability, products liability, general and excess liability and excess and umbrella exposures, as well as workers’workers' compensation insurance. Some factors that contribute to the uncertainty and volatility of long-tail casualty programs, and thus require a significant degree of judgment in the reserving process, include the inherent uncertainty as to the length of reporting and payment development patterns, the possibility of judicial interpretations or legislative changes, including changes in workers' compensation benefit laws, that might impact future loss experience relative to prior loss experience and the potential lack of comparability of the underlying data used in performing loss reserve analyses.Our ultimate liability may be greater or less than current reserves. Changes in our estimated ultimate liability for loss reserves generally occur as thea result of the emergence of unanticipated loss activity, the completion of specific actuarial or claims studies or changes in internal or external factors. We closely monitor new information on reported claims and use statistical analyses prepared by our actuaries to evaluate the adequacy of our recorded reserves. We are required to exercise considerable judgment when assessing the relative credibility of loss development trends. Our philosophy is to establish loss reserves that are more likely redundant than deficient. This means that we seek to establish loss reserves that will ultimately prove to be adequate. As a result, if new information or trends indicate an increase in frequency or severity of claims in excess of what we initially anticipated, we generally respond quickly and increase loss reserves. If, however, frequency or severity trends are more favorable than initially anticipated, we often wait to reduce our loss reserves until we can evaluate experience in additional periods to confirm the credibility of the trend. In addition, for long-tail lines of business, trends develop over longer periods of time, and as a result, we give credibility to these trends more slowly than for short-tail or less volatile lines of business.Each quarter, our actuaries prepare estimates of the ultimate liability for unpaid losses and loss adjustment expenses based on established actuarial methods. Management reviews these estimates, supplements the actuarial analyses with information provided by claims, underwriting and other operational personnel and determines its best estimate of loss reserves, which is recorded in our financial statements. Our procedures for determining the adequacy of loss reserves at the end of the year are substantially similar to the procedures applied at the end of each interim period.Additionally, once a year, generally during the third quarter, we conduct a detailed review of our liability for unpaid losses and loss adjustment expenses for asbestos and environmental (A&E) claims. If there is significant development on A&E claims in advance of the annual review, such development is considered by our actuaries and by management as part of our quarterly review process. We consider a detailed annual review appropriate because A&E claims develop slowly, are typically reported and paid many years after the loss event occurs and, historically, have exhibited a high degree of variability.Any adjustments resulting from our interim or year-end reviews, including changes in estimates, are recorded as a component of losses and loss adjustment expenses in the period of the change. Reserve changes that increase previous estimates of ultimate claims cost are referred to as unfavorable or adverse development, deficiencies or reserve strengthening. Reserve changes that decrease previous estimates of ultimate claims cost are referred to as favorable development or redundancies.| 89Markel Corporation & SubsidiariesMANAGEMENT’S DISCUSSION & ANALYSISOF FINANCIAL CONDITION AND RESULTS OF OPERATIONS (continued)
90 |
and explicit assumptions regarding the potential effects of external factors, including economic and social inflation, judicial decisions, changes in law, changes, general economic conditions and recent trends in these factors. Our actuarial analyses are based on statistical analysis but also consist of reviewing internal factors that are difficult to analyze statistically, including underwriting and claims handling changes. In some of our markets, and where we act as a reinsurer, the timing and amount of information reported about underlying claims are in the control of third parties. This can also affect estimates and require re-estimation as new information becomes available.
"
Management’s best estimate of net reserves for unpaid losses and loss adjustment expenses exceeded the actuarially calculated point estimate by $361 million, or 8.5%, at December 31, 2010, compared to $371 million, or 8.9%, at December 31, 2009.
| Management's best estimate of net reserves for unpaid losses and loss adjustment expenses exceeded the actuarially calculated point estimate by $591 million, or 7.7%, at
Markel Corporation & Subsidiaries
MANAGEMENT’S DISCUSSION & ANALYSIS
OF FINANCIAL CONDITION AND RESULTS OF OPERATIONS (continued)
As a result, management has attributed less credibility than our actuaries to favorable trends experienced on our long-tail business from the earlier soft
market period and has not incorporated these favorable trends into its best estimate to the same extent as the actuaries.(dollars in millions) | Net Loss Reserves Held | Low End of Actuarial Range(1) | High End of Actuarial Range(1) | |||||||||
Excess and Surplus Lines | $ | 2,113.2 | $ | 1,711.0 | $ | 2,373.3 | ||||||
Specialty Admitted | 550.0 | 451.0 | 603.3 | |||||||||
London Insurance Market | 1,513.0 | 1,136.7 | 1,552.6 | |||||||||
Other Insurance (Discontinued Lines) | 424.1 | 212.9 | 948.5 | |||||||||
| (dollars in millions) | Net Loss Reserves Held | Low End of Actuarial Range(1) | High End of Actuarial Range(1) | ||||||||
| Excess and Surplus Lines | $ | 1,747.8 | $ | 1,456.1 | $ | 1,929.2 | |||||
| Specialty Admitted | 811.4 | 703.0 | 854.8 | ||||||||
| London Insurance Market | 1,629.7 | 1,288.7 | 1,755.1 | ||||||||
Alterra (2) | 3,688.4 | 2,776.0 | 4,560.4 | ||||||||
| Other Insurance (Discontinued Lines) | 393.9 | 209.5 | 1,043.4 | ||||||||
(1) | Due to the actuarial methods used to determine the separate ranges for each segment of our business, it is not appropriate to aggregate the high or low ends of the separate ranges to determine the high and low ends of the actuarial range on a consolidated basis. |
(2) | As described in note 2 of the notes to consolidated financial statements, unpaid losses and loss adjustment expenses attributable to Alterra were recorded at fair value as of May 1, 2013 (the Acquisition Date), which consists of the present value of the expected net loss and loss adjustment expense payments plus a risk premium. The net loss reserves held in the Alterra segment as presented in this table represent our estimated future payments for losses and loss adjustment expenses, whereas the reserves for unpaid losses and loss adjustment expenses included in the consolidated balance sheet include the unamortized portion of the fair value adjustment recorded at the Acquisition Date. |
92 |
reserves of 37% for the 2000 and prior accident years. A significant portion of the cumulative deficiency that occurred during those periods included adverse loss reserve development at Markel International, which we acquired in 2000. Historically, we have experienced greater volatility on acquired books of business than on existing books of business. The increases in pre-acquisition loss reserves at Markel International were primarily associated with books of business that were not subject to our underwriting discipline and that subsequently experienced unfavorable loss development that exceeded our initial expectations. We believe that as a result of applying greater underwriting discipline, including improved risk selection and pricing, on the business written since acquisition, total recorded loss reserves at Markel International are unlikely to vary to the same degree as we have experienced on the 2000 and prior accident years.
|
Markel Corporation & Subsidiaries
MANAGEMENT’S DISCUSSION & ANALYSIS
OF FINANCIAL CONDITION AND RESULTS OF OPERATIONS (continued)
judgments could result in the need to record a valuation allowance through a charge to earnings. See note Intangible Assets Our consolidated balance sheet as of December 31, loss. operations in future periods. " products. fitness centers. reserves, none of which are related to the acquisition of Alterra. underwriting profitability.Certain contracts we write, particularly property catastrophe reinsurance contracts, provide for reinstatements of coverage. Reinstatement premiums are the premiums for the restoration of the reinsurance limit of a contract to its full amount after a loss occurrence by the reinsured. The purpose of optional and required reinstatements is to permit the reinsured to reinstate the reinsurance coverage at a pre-determined price level once a loss event has penetrated the reinsurance layer. In addition, required reinstatement premiums permit the reinsurer to obtain additional premiums to cover the additional loss limits provided.We accrue for reinstatement premiums resulting from losses recorded. Such accruals are based upon contractual terms and the only element of management judgment involved is with respect to the amount of losses recorded. Changes in estimates of losses recorded on contracts with reinstatement premium features will result in changes in reinstatement premiums based on contractual terms. Reinstatement premiums are recognized at the time we record losses and are earned on a pro-rata basis over the coverage period.Ceded Reinsurance Allowance for Doubtful AccountsWe evaluate and adjust reserves for uncollectible ceded reinsurance based upon our collection experience, the financial condition of our reinsurers, collateral held and the development of our gross loss reserves. Our consolidated balance sheets at December 31, 20102013 and 20092012 included a reinsurance allowance for doubtful accounts of $155.2$76.2 million and $151.3$71.1 million, respectively.Reinsurance recoverables recorded on insurance losses ceded under reinsurance contracts are subject to judgments and uncertainties similar to those involved in estimating gross loss reserves. In addition to these uncertainties, our reinsurance recoverables may prove uncollectible if the reinsurers are unable or unwilling to perform under the reinsurance contracts. In establishing our reinsurance allowance for amounts deemed uncollectible, we evaluate the financial condition of our reinsurers and monitor concentration of credit risk arising from our exposure to individual reinsurers. To determine if an allowance is necessary, we consider, among other factors, published financial information, reports from rating agencies, payment history, collateral held and our legal right to offset balances recoverable against balances we may owe. Our ceded reinsurance allowance for doubtful accounts is subject to uncertainty and volatility due to the time lag involved in collecting amounts recoverable from reinsurers. Over the period of time that losses occur, reinsurers are billed and amounts are ultimately collected, economic conditions, as well as the operational and financial performance of particular reinsurers, may change and these changes may affect the reinsurers’reinsurers' willingness and ability to meet their contractual obligation to us. It is also difficult to fully evaluate the impact of major catastrophic events on the financial stability of reinsurers, as well as the access to capital that reinsurers may have when such events occur. The ceding of insurance does not legally discharge us from our primary liability for the full amount of the policies, and we will be required to pay the loss and bear collection risk if the reinsurers fail to meet their obligations under the reinsurance contracts.Income Taxes and Uncertain Tax PositionsThe preparation of our consolidated income tax provision, including the evaluation of tax positions we have taken or expect to take on our income tax returns, requires significant judgment. In evaluating our tax positions, we recognize the tax benefit from an uncertain tax position only if, based on the technical merits of the position, it is more likely than not that the tax position will be sustained upon examination by the taxing authorities. Tax positions that meet the more likely than not threshold are then measured using a probability weighted approach, whereby the largest amount of tax benefit that is greater than 50% likely of being realized upon ultimate settlement is recognized. The tax positions that we have taken or expect to take are based upon the application of tax laws and regulations, which are subject to interpretation, judgment and uncertainty. As a result, our actual liability for income taxes may differ significantly from our estimates.We record deferred income taxes as assets or liabilities on our consolidated balance sheets to reflect the net tax effect of the temporary differences between the carrying amounts of assets and liabilities for financial reporting purposes and their respective tax bases. At December 31, 2013 our net deferred tax asset was $103.7 million compared to a net deferred tax liability of $168.9 million at December 31, 2012. The change in net deferred taxes in 2013 was largely due to a net deferred tax asset of $310.1 million recorded for Alterra as part of the initial purchase price allocation, partially offset by an increase in the deferred tax liability related to accumulated other comprehensive income resulting from an increase in net unrealized gains on investments. See note 2 of the notes to consolidated financial statements for a discussion of deferred taxes related to acquisition of Alterra.94Deferred tax assets are reduced by a valuation allowance when management believes it is more likely than not that some, or all, of the deferred tax assets will not be realized. At December 31, 2010 and 2009, our net deferred tax asset was $63.3 million and $161.2 million, respectively. We did not have a valuation allowance on our deferred tax assets at December 31, 20102013 or 2009. The decrease in the net deferred tax asset in 2010 was due in part to an increase in the deferred tax liability related to accumulated other comprehensive income items resulting from an increase in net unrealized gains on investments during 2010.2012. In evaluating our ability to realize the netour deferred tax assetassets and assessing the need for a valuation allowance at December 31, 2010,2013 and 2012, we have made estimates regarding the future taxable income of our foreign subsidiaries and judgments about our ability to pursue prudent and feasible tax planning strategies. A change in any of these estimates and94 |78 of the notes to consolidated financial statements for further discussion of our consolidated income tax provision, uncertain tax positions and net operating losseslosses.Goodwill and valuation allowance.Goodwill20102013 included goodwill fromand intangible assets of approximately $1.5 billion. Goodwill and intangible assets are recorded as a result of business acquisitions. Goodwill represents the excess of the amount paid to acquire a business over the net fair value of assets acquired businessesand liabilities assumed at the date of $474.7 million.acquisition. Indefinite-lived and other intangible assets are recorded at fair value as of the acquisition date. The determination of the fair value of certain assets acquired and liabilities assumed involves significant judgment and the use of valuation models and other estimates, which require assumptions that are inherently subjective. Goodwill isand indefinite-lived intangible assets are tested for impairment at least annually. Intangible assets with definite lives are reviewed for impairment when events or circumstances indicate that their carrying value may not be recoverable. We completed our annual test for impairment during the fourth quarter of 20102013 based upon results of operations through September 30, 2010.2013. There were no indicationsimpairment losses recorded during 2013.For some reporting units, we elected to assess qualitative factors (commonly referred to as "Step 0") to determine whether it is more likely than not that the fair value of a reporting unit is less than its carrying amount. This assessment serves as a basis for determining whether it is necessary to perform the two-step goodwill impairment test. For other reporting units, we elected to bypass Step 0 and perform Step 1 of the goodwill impairment test, which includes determining whether the carrying amount of a reporting unit, including goodwill, exceeds its estimated fair value. If the carrying amount exceeds its fair value, then Step 2 of the goodwill impairment test is performed by estimating the fair value of individual assets (including identifiable intangible assets) and liabilities of the reporting unit. The excess of the estimated fair value of the reporting unit over the estimated fair value of net assets would establish the implied value of goodwill. The excess of the recorded amount of goodwill over the implied value is charged to net income as an impairment during 2010.A significant amount of judgment is required in performing goodwill impairment tests. Such tests include estimatingWhen using the qualitative approach, we considered macroeconomic factors such as industry and market conditions. We also considered reporting unit-specific events, actual financial performance versus expectations and management's future business expectations. As part of our Step 0 evaluation of reporting units with material goodwill, we considered the fact that many of the businesses had been recently acquired in orderly transactions between market participants, and our purchase price represented fair value at acquisition. There were no events since acquisition which had a significant impact on the fair value of ourthese reporting units. We compare theFor reporting units which we tested quantitatively, we estimated fair value primarily using an income approach based on a discounted cash flow model. The cash flow projections used in the discounted cash flow model included management's best estimate of future growth and margins. The discount rates used to determine the fair value estimates were developed based on the capital asset pricing model using market-based inputs as well as an assessment of the inherent risk in projected future cash flows.With the exception of the Markel Ventures Diamond Healthcare reporting unit, we believe the fair value of each of our reporting units toexceeded their respective carrying amounts includingas of October 1, 2013 and December 31, 2013. Additionally, we do not believe we are at risk of failing Step 1 at any of our reporting units with the result being a material impairment of goodwill. The methodsHowever, as of October 1, 2013 and December 31, 2013, we use for estimatingbelieve that the carrying value of the Diamond Healthcare reporting unit approximates fair values may includevalue and we believe we are at risk of failing Step 1 at our Diamond Healthcare reporting unit in future periods. At December 31, 2013, goodwill associated with this reporting unit was approximately $29 million.The Diamond Healthcare reporting unit provides for the planning, development and operation of behavioral health services in partnership with healthcare organizations. Our assessment of the risks associated with the Diamond Healthcare reporting unit includes general market quotations, assetconditions as well as uncertainties surrounding the impact of the Patient Protection and liability fair valuesAffordable Care Act (the Act), particularly with regard to reimbursements from the Medicare and other valuation techniques, suchMedicaid programs, as discounted cash flows and multipleswell as the impact of earnings or revenues. With the exceptionAct on the decision of market quotations, allhealthcare providers to continue to offer behavioral healthcare services. We believe changes to these items could have an adverse impact on Diamond Healthcare's results of these methods involve significant estimates and assumptions.95InvestmentsWe complete a detailed analysis each quarter to assess whether the decline in the fair value of any investment below its cost basis is deemed other-than-temporary. All securities with unrealized losses are reviewed. For equity securities, a decline in fair value that is considered to be other-than-temporary is recognized in net income (loss) based on the fair value of the security at the time of assessment, resulting in a new cost basis for the security. For fixed maturities where we intend to sell the security or it is more likely than not that we will be required to sell the security before recovery of its amortized cost, a decline in fair value is considered to be other-than-temporary and is recognized in net income (loss) based on the fair value of the security at the time of assessment, resulting in a new cost basis for the security. If the decline in fair value of a fixed maturity below its amortized cost is considered to be other-than-temporary based upon other considerations, we compare the estimated present value of the cash flows expected to be collected to the amortized cost of the security. The extent to which the estimated present value of the cash flows expected to be collected is less than the amortized cost of the security represents the credit-related portion of the other-than-temporary impairment, which is recognized in net income, (loss), resulting in a new cost basis for the security. Any remaining decline in fair value represents the non-credit portion of the other-than-temporary impairment, which is recognized in other comprehensive income (loss).income. The discount rate used to calculate the estimated present value of the cash flows expected to be collected is the effective interest rate implicit for the security at the date of purchase.We consider many factors in completing our quarterly review of securities with unrealized losses for other-than-temporary impairment, including the length of time and the extent to which fair value has been below cost and the financial condition and near-term prospects of the issuer. For equity securities, the ability and intent to hold the security for a period of time sufficient to allow for any anticipated recovery is considered. For fixed maturities, we consider whether we intend to sell the security or if it is more likely than not that we will be required to sell the security before recovery, the implied yield-to-maturity, the credit quality of the issuer and the ability to recover all amounts outstanding when contractually due. When assessing whether we intend to sell a fixed maturity or if it is likely that we will be required to sell a fixed maturity before recovery of its amortized cost, we evaluate facts and circumstances including, but not limited to, decisions to reposition the investment portfolio, potential sales of investments to meet cash flow needs and potential sales of investments to capitalize on favorable pricing.| 95Markel Corporation & SubsidiariesMANAGEMENT’S DISCUSSION & ANALYSISOF FINANCIAL CONDITION AND RESULTS OF OPERATIONS (continued)Risks and uncertainties are inherent in our other-than-temporary decline in fair value assessment methodology. The risks and uncertainties include, but are not limited to, incorrect or overly optimistic assumptions about the financial condition, liquidity or near-term prospects of an issuer, inadequacy of any underlying collateral, unfavorable changes in economic or social conditions and unfavorable changes in interest rates or credit ratings. Changes in any of these assumptions could result in charges to earnings in future periods.Losses from write downs for other-than-temporary declines in the estimated fair value of investments, while potentially significant to net income, (loss), do not have an impact on our financial position. Since our investment securities are considered available-for-sale and are recorded at estimated fair value, unrealized losses on investments are already included in accumulated other comprehensive income. See note 2(b)3(b) of the notes to consolidated financial statements for further discussion of our assessment methodology for other-than-temporary declines in the estimated fair value of investments.Our BusinessThe following discussion and analysis should be read in conjunction with Selected Financial Data, the consolidated financial statements and related notes and the discussion under Risk Factors, “Critical"Critical Accounting Estimates”Estimates" and “Safe"Safe Harbor and Cautionary Statement.”We are a diverse financial holding company serving a variety of niche markets. Our principal business markets and underwrites specialty insurance products and programs.products. We believe that our specialty product focus and niche market strategy enable us to develop expertise and specialized market knowledge. We seek to differentiate ourselves from competitors by our expertise, service, continuity and other value-based considerations. We competehistorically competed in three segments of the specialty insurance marketplace: the Excess and Surplus Lines, the Specialty Admitted and the London markets.Insurance Market segments. As a result of the acquisition of Alterra, we formed a new operating segment during the second quarter of 2013. The Alterra segment comprises all of the active property and casualty underwriting operations of the former Alterra companies. We also own interests in various industrial and service businesses that operate outside of the specialty insurance marketplace. Our financial goals are to earn consistent underwriting and operating profits and superior investment returns to build shareholder value.96Our Excess and Surplus Lines segment writes property and casualty insurancehard-to-place risks outside of the standard market, for hard-to-place risks including catastrophe-exposed property, professional liability, products liability, general liability, commercial umbrella and other coverages tailored for unique exposures. At the beginning of 2008, ourOur Excess and Surplus Lines segment wasis comprised of five underwriting units,regions, and each with product-focused specialists servicing brokers, agents and insureds across the United States from their respective underwriting unit locations. In early 2008, we decided to close the Markel Re unit. Markel Re’s excess and umbrella program, casualty facultative placements and public entity business remained within the Excess and Surplus Lines segment, while the alternative risk transfer programs were combined with the Markel Specialty unit in the Specialty Admitted segment. In March 2009, we transitioned the four underwriting units included in our Excess and Surplus Lines segment to a customer-focused regional office model as part of our “One Markel” initiative. Each regional office is responsible for serving the wholesale producers located in its region. The underwriters atOur regional teams focus on customer service and marketing, underwriting and distributing our regional offices haveinsurance solutions and provide customers easy access to and expertise in all of our product offerings and are located closer to our producers.Our Specialty Admitted segment writes risks that, although unique and hard-to-place in the standard market, must remain with an admitted insurance company for marketing and regulatory reasons. Our underwriting units in this segment write specialty program insurance for well-defined niche markets, personal and commercial property and liability coverages and workers’workers' compensation insurance. Our Specialty Admitted segment is comprised of three underwriting units: Specialty Programs, Personal Lines and Workers' Compensation. In January 2013, we acquired Essentia Insurance Company, a company that underwrites insurance exclusively for Hagerty throughout the United States. In January 2012, we acquired Thompson Insurance Enterprises, LLC (Thomco), a privately held program administrator that underwrites multi-line, industry-focused insurance programs that complement the Markel Specialty product offerings. Examples include social service organizations, senior living, childcare and Markel American Specialty Personal and Commercial Lines units and, beginning in the fourth quarter of 2010, our FirstComp workers’ compensation insurance unit. Our Specialty Admitted segment included an additional underwriting unit, Markel Global Marine and Energy, until late 2008 when we decided to close that unit and place its programs into run-off.96 |On October 15, 2010, we completed our acquisition of 100% of the outstanding shares of Aspen Holdings, Inc. (Aspen), a Nebraska-based privately held corporation whose FirstComp insurance group provides workers’ compensation insurance and related services, principally to small businesses, in 31 states. This acquisition will provide us with the ability to expand our insurance operations to include workers’ compensation coverage.Our London Insurance Market segment writes specialty property, casualty, professional liability, equine, marine, energy and trade credit insurance and reinsurance on a worldwide basis. We participate in the London market in part through Markel International, which includes Markel Capital Limited and Markel International Insurance Company Limited (MIICL), wholly-owned subsidiaries. Markel Capital Limited is the corporate capital provider for Markel Syndicate 3000 at Lloyd’s,Lloyd's of London (Lloyd's), which is managed by Markel Syndicate Management Limited, a wholly-owned subsidiary.Our Alterra segment writes specialty insurance and reinsurance from offices worldwide. The Alterra segment's Lloyd's operations are conducted by Markel Syndicate Management through Lloyd's Syndicate 1400. Business written by the Alterra segment includes a wide range of commercial insurance and reinsurance products, including general and excess liability, property, accident and health, agriculture, auto, credit and surety, marine and energy, medical malpractice, professional liability and workers compensation coverages.For purposes of segment reporting, the Other Insurance (Discontinued Lines) segment includes lines of business that have been discontinued prior to, or in conjunction with, an acquisition.acquisitions. The lines were discontinued because we believed some aspect of the product, such as risk profile or competitive environment, would not allow us to earn consistent underwriting profits. Alterra previously offered life and annuity reinsurance products. In 2010, Alterra ceased writing life and annuity reinsurance contracts and placed this business into run-off. Results attributable to the run-off of life and annuity reinsurance business are included in the Other Insurance (Discontinued Lines) segment. This segment also includes development on asbestos and environmentalA&E loss reserves.A favorable insurance market is commonly referred to as a “hard market”"hard market" within the insurance industry and is characterized by stricter coverage terms, higher prices and lower underwriting capacity. Periods of intense competition, which typically include broader coverage terms, lower prices and excess underwriting capacity, are referred to as a “soft"soft market.” After a decade of soft market conditions, the insurance industry" We have experienced favorable conditions beginning in late 2000, which continued through 2003 for most product lines. During 2004, the market began to soften and the industry began to show signs of increased competition. Since 2005, we have been in a soft insurance market and have experienced intense competition. During the current soft market cycle, we have experiencedconditions including price deterioration in virtually all of our product areas duelines since the mid-2000s. During 2011, unfavorable pricing trends continued for some of our product lines; however, price declines stabilized for most of our product lines, and we achieved moderate price increases in partseveral lines. During 2012 and 2013, we have generally seen low to an increased presence of standard insurance companiesmid-single digit favorable rate changes in our markets. During 2008, given the rapid deterioration in underwriting capacity as a result of the disruptions in the financial markets and losses from catastrophes, the rate of decline in prices began to slow. However, the effects of the economic environment contributed to further declines in gross premium volume in 2009 and 2010. Premiums for many of our product lines are based upon our insureds’as market conditions improved and revenues, gross receipts or payroll, which have been negativelyand payrolls of our insureds were favorably impacted by improving economic conditions; however, during the depressed levelsfourth quarter of business activity in recent years. In 2010,2013, we continuedbegan to experience pricing pressure due in part to intense competition, which resulted in further price deterioration across many ofsoftening prices on our catastrophe exposed property product lines and in our reinsurance book. Despite stabilization of prices on certain product lines during the most notably our professionalrecent three years, we still consider the overall property and products liability programs within the Excess and Surplus Lines segment. However, we experienced moderatecasualty market to be soft. We will continue to pursue price increases in several product lines during 2010, most notably those offered by Markel International.We routinely review the pricing of our major product lines and have pursued price increases in many product areas;2014 when possible; however, as a result of continued soft insurance market conditions, our targeted price increases have been met with resistance in the marketplace, particularly within the Excess and Surplus Lines segment. In general, we believe prevailing rates within the property and casualty insurance marketplace are lower than our targeted pricing levels. Whenwhen we believe the prevailing market price will not support our underwriting profit targets, the business is not written. As a result of our underwriting discipline, gross premium volume for many ofmay vary when we alter our product lines, most notably within the Excess and Surplus Lines segment, has declined and, if the competitive environment does notofferings to maintain or improve could decline further in the future.Through our wholly-owned subsidiary Markel Ventures, Inc. (Markel Ventures), we own interests in various industrial and service businesses that operate outside of the specialty insurance marketplace. These businesses are viewed by management as separate and distinct from our insurance operations.operations and are comprised of a diverse portfolio of companies from different industries, including manufacturing, healthcare and business and financial services. Local management teams oversee the day-to-day operations of these companies, while strategic decisions are made in conjunction with members of our executive management team, principally our President and Chief Investment Officer. The financial results of those companies in which we own controlling interests have been consolidated in our financial statements. The financial results of those companies in which we hold a noncontrolling interest are accounted for under the equity method of accounting.| 97Markel Corporation & SubsidiariesMANAGEMENT’S DISCUSSION & ANALYSISOF FINANCIAL CONDITION AND RESULTS OF OPERATIONS (continued)
Our non-insurance operations, which are referred
Other Insurance (Discontinued Lines) segment.
Overview.
"
(dollars in thousands) | Years Ended December 31, | |||||||||||
| 2010 | 2009 | 2008 | ||||||||||
Underwriting profit | $ | 59,816 | $ | 86,312 | $ | 14,613 | ||||||
Net investment income | 272,530 | 259,809 | 282,148 | |||||||||
Net realized investment gains (losses) | 36,362 | (96,100 | ) | (407,594 | ) | |||||||
Other revenues | 185,580 | 89,782 | 79,845 | |||||||||
Amortization of intangible assets | (16,824 | ) | (6,698 | ) | (5,742 | ) | ||||||
Other expenses | (168,290 | ) | (80,499 | ) | (74,889 | ) | ||||||
Interest expense | (73,663 | ) | (53,969 | ) | (48,210 | ) | ||||||
Income tax benefit (expense) | (27,782 | ) | 3,782 | 101,395 | ||||||||
Net income attributable to noncontrolling interests | (936 | ) | (781 | ) | (333 | ) | ||||||
NET INCOME (LOSS) TO SHAREHOLDERS | $ | 266,793 | $ | 201,638 | $ | (58,767 | ) | |||||
| Years Ended December 31, | |||||||||||
| (dollars in thousands) | 2013 | 2012 | 2011 | ||||||||
| Underwriting profit (loss) | $ | 103,031 | $ | 63,588 | $ | (40,825 | ) | ||||
| Net investment income | 317,373 | 282,107 | 263,676 | ||||||||
| Net realized investment gains | 63,152 | 31,593 | 35,857 | ||||||||
| Other revenues | 710,942 | 539,284 | 351,077 | ||||||||
| Amortization of intangible assets | (55,223 | ) | (33,512 | ) | (24,291 | ) | |||||
| Other expenses | (663,528 | ) | (478,248 | ) | (309,046 | ) | |||||
| Interest expense | (114,004 | ) | (92,762 | ) | (86,252 | ) | |||||
| Income tax expense | (77,898 | ) | (53,802 | ) | (41,710 | ) | |||||
| Net income attributable to noncontrolling interests | (2,824 | ) | (4,863 | ) | (6,460 | ) | |||||
| Net income to shareholders | $ | 281,021 | $ | 253,385 | $ | 142,026 | |||||
98 |
lower write downs for other-than-temporary declines in the estimated fair value of investments contributed to improved investment returns. Net income to shareholders for 2010 included $12.2 million of write downs for other-than-temporary declines in the estimated fair value of investments compared to $90.0 million and $339.2 million in 2009 and 2008, respectively.2012. The components of net income (loss) to shareholders are discussed in further detail under “Underwriting"Underwriting Results,” “Investing" "Investing Results,” “Non-Insurance Operations”" "Markel Ventures Operations" and “Interest"Interest Expense and Income Taxes.”
"
| Years Ended December 31, | ||||||||||||
(dollars in thousands) | 2010 | 2009 | 2008 | |||||||||
Gross premium volume | $ | 1,982,467 | $ | 1,905,893 | $ | 2,212,784 | ||||||
Net written premiums | $ | 1,769,118 | $ | 1,714,409 | $ | 1,968,496 | ||||||
Net retention | 89 | % | 90 | % | 89 | % | ||||||
Earned premiums | $ | 1,730,921 | $ | 1,815,835 | $ | 2,022,184 | ||||||
Losses and loss adjustment expenses | $ | 946,229 | $ | 992,863 | $ | 1,269,025 | ||||||
Underwriting, acquisition and insurance expenses | $ | 724,876 | $ | 736,660 | $ | 738,546 | ||||||
Underwriting profit | $ | 59,816 | $ | 86,312 | $ | 14,613 | ||||||
U.S. GAAP Combined Ratios(1) | ||||||||||||
Excess and Surplus Lines | 96 | % | 96 | % | 92 | % | ||||||
Specialty Admitted | 100 | % | 99 | % | 106 | % | ||||||
London Insurance Market | 95 | % | 91 | % | 104 | % | ||||||
Other Insurance (Discontinued Lines) | NM | (2) | NM | (2) | NM | (2) | ||||||
Markel Corporation (Consolidated) | 97 | % | 95 | % | 99 | % | ||||||
| Years Ended December 31, | ||||||||||||
| (dollars in thousands) | 2013 | 2012 | 2011 | |||||||||
| Gross premium volume | $ | 3,920,226 | $ | 2,513,681 | $ | 2,291,251 | ||||||
| Net written premiums | $ | 3,236,683 | $ | 2,214,126 | $ | 2,041,838 | ||||||
| Net retention | 83 | % | 88 | % | 89 | % | ||||||
| Earned premiums | $ | 3,231,616 | $ | 2,147,128 | $ | 1,979,340 | ||||||
| Losses and loss adjustment expenses | $ | 1,816,273 | $ | 1,154,068 | $ | 1,209,986 | ||||||
| Underwriting, acquisition and insurance expenses | $ | 1,312,312 | $ | 929,472 | $ | 810,179 | ||||||
| Underwriting profit (loss) | $ | 103,031 | $ | 63,588 | $ | (40,825 | ) | |||||
U.S. GAAP Combined Ratios (1) | ||||||||||||
| Excess and Surplus Lines | 80 | % | 94 | % | 86 | % | ||||||
| Specialty Admitted | 97 | % | 108 | % | 109 | % | ||||||
| London Insurance Market | 88 | % | 89 | % | 116 | % | ||||||
| Alterra | 118 | % | — | % | — | % | ||||||
| Other Insurance (Discontinued Lines) | NM | (2) | NM | (2) | NM | (2) | ||||||
| Markel Corporation (Consolidated) | 97 | % | 97 | % | 102 | % | ||||||
(1) | The U.S. GAAP combined ratio is a measure of underwriting performance and represents the relationship of incurred losses, loss adjustment expenses and underwriting, acquisition and insurance expenses to earned premiums. A combined ratio less than 100% indicates an underwriting profit, while a combined ratio greater than 100% reflects an underwriting loss. |
(2) | NM—Ratio is not meaningful. Further discussion of Other Insurance (Discontinued Lines) underwriting loss follows. |
| 99
Markel Corporation & Subsidiaries
MANAGEMENT’S DISCUSSION & ANALYSIS
OF FINANCIAL CONDITION AND RESULTS OF OPERATIONS (continued)
The 2010 expense ratio included $46 million, or three points, of costs associated with the implementation of our Atlas system and business process initiative compared to $33 million, or two points, for 2009 and $20 million, or one point, for 2008. During the third quarter of 2010, in response to continuous assessments of cost, organizational effort, program complexity and enterprise risks associated with the Atlas initiative, we re-focused and simplified our implementation approach. While our ultimate objectives remain unchanged, we focused our attention on the successful delivery of the billing and collections system in October 2010 and the development and delivery of a data warehouse and agency internet functionality in 2011. We believe we can be more successful by completing these projects before proceeding with development of the remaining initiatives. Previously capitalized costs of $7.7 million were expensed during the third quarter of 2010.
The 2010 combined ratio included $74.7 million, or four points, of underwriting loss for two programs previously underwritten in the Excess and Surplus Lines segment that were exposed to losses associated with the adverse conditions in the residential mortgage market in recent years. and London Insurance Market segments.
The 2010 combined ratio included $278.0$411.1 million of favorable development on prior years’years' loss reserves compared to $235.3
Loss reserve redundancies on various long-tail casualty lines within the Excess and Surplus Lines segment in
2013 and 2012 were $115.8 million and $78.8 million, respectively.100 |
of the past three years, actual claims reporting patterns have been more favorable than we initially anticipated.
development.
| 101
Markel Corporation & Subsidiaries
MANAGEMENT’S DISCUSSION & ANALYSIS
OF FINANCIAL CONDITION AND RESULTS OF OPERATIONS (continued)
compared to 2011.
recent accident years.
The favorable development of prior years’ loss reserves during 2008 included $25.6 million of redundancies at the Markel Essex Excess and Surplus Lines unit, of which $21.6 million was on the 2005 to 2007 accident years. In 2008, the favorable development on prior years’ loss reserves at the Markel Essex Excess and Surplus Lines unit was primarily within the casualty programs and resulted from better than expected case loss activity.
The adverse loss experience at the Markel Re unit during 2008 primarily resulted from higher than expected average claim frequency and severity on two general liability programs that were cancelled in the first quarter of 2007. In 2008, the Markel Re unit experienced $30.9 million of adverse development on prior years’ loss reserves, of which $27.9 million related to these two programs. This adverse development was primarily on the 2005 to 2007 accident years.
102 |
write-off of previously capitalized software development costs.
Beginningunit was due in the fourth quarterpart to lower loss severity than was originally anticipated on various property lines of 2010, the Specialty Admitted segment’s results included our FirstComp workers’ compensation operations. The workers’ compensation insurance market continues to be adversely impacted by high ratesbusiness and lower loss frequency than was originally anticipated on various casualty programs.
segment.
| 103
Markel Corporation & Subsidiaries
MANAGEMENT’S DISCUSSION & ANALYSIS
OF FINANCIAL CONDITION AND RESULTS OF OPERATIONS (continued)
The favorable development of prior years’years' loss reserves experienced in 20102011 included $33.7$18.8 million of redundancies on the 2001 and prior accident years. These redundancies predominantly relatedAs we continued to marine and aviation liability and professional indemnity business written prior to our acquisition of Markel International in 2000. During 2010, we completed a comprehensive claims file review of all significant open claims for these older accident years. The claims file review highlightedexperience better than expected case loss activity due in part to favorable claims settlements experienced in 2010. Based on the results of the claims file review, there was less uncertainty with regard to the ultimate settlement amount of the remaining open claims, and we reduced prior years’years' loss reserves accordingly.
In 2010, the loss reserve redundancies in the London Insurance Market segment were partially offset by $35.0 million of adverse loss reserve development on prior years’ loss reserves in the Professional and Financial Risks division related to medical malpractice coverage for Italian hospitals. In 2005, we started writing medical malpractice coverage for Italian hospitals. This business was written until late 2008 when, as a result of higher than expected loss frequency and severity, we exited this class. During 2010, we completed a detailed review of all reported claims within the medical malpractice class, which highlighted that ultimate loss severity is expected to be greater than previously anticipated due in part to an increasingly adverse legal environment for medical malpractice insurers in Italy. As a result, our actuaries increased their estimates of ultimate losses, and management increased prior years’ loss reserves accordingly.
The London Insurance Market segment’s 2009 combined ratio included $108.1 million of favorable development on prior years’ loss reserves, of which $84.5 million related to the 2003 to 2007 accident years. This favorable development on prior years’ loss reserves occurred in a variety of programs across each of our divisions, most notably the professional liability programs in the Retail and the Professional and Financial Risks divisions. During 2009, actual incurred losses and loss adjustment expenses on reported claims for the 2003 to 2007 accident years were $39.9 million less than we expected in our actuarial analyses. As a result of this favorable experience, our actuarial estimates of the ultimate liability for unpaid losses and loss adjustment expenses were reduced, and management reduced prior years’ loss reserves accordingly.
The London Insurance Market segment’s 2008 combined ratio included $58.3 million of favorable development on prior years’ loss reserves of which $36.5 million was on the professional liability programs at the Professional and Financial Risks and the Retail divisions on the 2002 to 2005 accident years. This favorable development on prior years’ loss reserves was primarily due to the favorable rates and terms associated with the London market in those years. During 2008, actual incurred losses and loss adjustment expenses on reported claims for the 2002 to 2005 accident years at the Professional and Financial Risks and the Retail divisions were $26.4 million less than we expected in our actuarial analyses. As a result of this favorable experience, our actuarial estimates of the ultimate liability for unpaid losses and loss adjustment expenses were reduced, and management reduced prior years’ loss reserves accordingly.
In 2008, the London Insurance Market segment’s results included $28.9 million of adverse development on prior years’ loss reserves within the Professional and Financial Risks division on the 2006 and 2007 accident years related to our medical malpractice coverage for Italian hospitals. During 2008, losses on reported claims for this book of business were higher than expected. In addition to increased severity on reported claims, we experienced a higher than expected incidence of newly reported claims. As a result of the increase in loss frequency and severity experienced during 2008 for this class, our actuaries increased their estimates of ultimate losses, and management increased prior years’ loss reserves accordingly. This adverse experience on the 2006 and 2007 accident years was offset by favorable development on prior years’ loss reserves in other classes on the same accident years.
104 |
Resultsprior year periods is not meaningful. For this reason, we have included certain financial information for the London Insurance MarketAlterra segment on a pro forma basis as if the acquisition of Alterra had occurred on January 1, 2012. The pro forma financial information discussed herein is for informational purposes only and does not necessarily reflect the results that would have occurred had the acquisition taken place on January 1, 2012, nor is it necessarily indicative of future results. Adjustments used to determine pro forma results include amortization of the fair value adjustment recorded for the difference between the fair value and historical carrying amount of Alterra's unpaid losses and loss adjustment expenses. We have also excluded certain charges from the pro forma results, including transaction costs incurred by us ($16.0 million) and Alterra ($23.0 million) totaling $39.0 million for the year ended December 31, 2013, severance costs attributable to the acquisition totaling $31.7 million for the year ended December 31, 2013, and stay bonuses of $14.8 million for the year ended December 31, 2013. The acceleration of compensation expense during the year ended December 31, 2013 related to Alterra's long-term incentive compensation awards and restricted stock awards was attributable to the acquisition; however, the incremental expense recognized during 2013 only represents a timing difference in the recognition of expense. Therefore, it was not excluded from the pro forma underwriting results.
for the year ended December 31, 2013.
| May 1, 2013 to | |||
| (dollars in thousands) | December 31, 2013 | ||
| Earned premiums | $ | 848,317 | |
| Losses and loss adjustment expenses | (647,546 | ) | |
| Underwriting, acquisition and insurance expenses: | |||
Transaction and other acquisition-related expenses (1) | (75,140 | ) | |
| Other operating expenses | (280,569 | ) | |
| Underwriting loss | $ | (154,938 | ) |
U.S. GAAP combined ratio (2) | 118 | % | |
(1) | In connection with the acquisition of Alterra, we incurred transaction and other acquisition-related costs of $75.1 million for the year ended December 31, 2013. For the year ended December 31, 2013, these costs include transaction costs totaling $16.0 million, which primarily consist of due diligence, legal and investment banking costs. The year ended December 31, 2013 also include severance costs of $31.7 million, stay bonuses of $14.8 million, and other compensation costs totaling $12.6 million, related to the acceleration of certain long-term incentive compensation awards and restricted stock awards that were granted by Alterra prior to the acquisition. The acceleration of compensation expense during the year ended December 31, 2013 was attributable to the acquisition; however, the incremental expense recognized during 2013 only represents a timing difference in the recognition of expense. Therefore, it was not excluded from the pro forma underwriting results. |
(2) | The U.S. GAAP combined ratio is a measure of underwriting performance and represents the relationship of incurred losses, loss adjustment expenses and underwriting, acquisition and insurance expenses to earned premiums. |
| Pro Forma | |||||||
| Years Ended December 31, | |||||||
| (dollars in thousands) | 2013 | 2012 | |||||
| Earned premiums | $ | 1,296,921 | $ | 1,362,706 | |||
| Losses and loss adjustment expenses | (913,324 | ) | (928,333 | ) | |||
| Underwriting, acquisition and insurance expenses: | |||||||
Transaction and other acquisition-related expenses (1) | (12,621 | ) | — | ||||
| Other operating expenses | (436,724 | ) | (476,864 | ) | |||
| Underwriting loss | $ | (65,748 | ) | $ | (42,491 | ) | |
U.S. GAAP combined ratio (2) | 105 | % | 103 | % | |||
(1) | In connection with the acquisition of Alterra, we incurred compensation costs totaling $12.6 million, related to the acceleration of certain long-term incentive compensation awards and restricted stock awards that were granted by Alterra prior to the acquisition. The acceleration of compensation expense during the year ended December 31, 2013 was attributable to the acquisition; however, the incremental expense recognized during 2013 only represents a timing difference in the recognition of expense. Therefore, it was not excluded from the pro forma underwriting results. |
(2) | The U.S. GAAP combined ratio is a measure of underwriting performance and represents the relationship of incurred losses, loss adjustment expenses and underwriting, acquisition and insurance expenses to earned premiums. |
Duringduring the third quarter of the year unless circumstances suggest an earlier review is appropriate. Over the past few years, the number of A&E claims reported each year across the property and casualty industry has been on the decline. However, at the same time, the likelihood of making an indemnity payment has risen, thus increasing the average cost per reported claim. During our 2012 annual review, we reduced our estimate of the past three years, we completed an in-depth, actuarial review of our asbestos and environmental exposures. During our 2010 review, we determined that no adjustment to loss reserves was necessary. During our 2009 review, we increasedultimate claims count, while increasing our estimate of the number of claims that would ultimately be closed with an indemnity payment. During our 20082013 annual review, we noted thatour expectation of the severity of the outcome of known claims had been closed with total indemnity payments that were higher than had been anticipated, and asincreased. As a result, of this higher than expected average severity on closed claims, our actuaries updated their average severity assumptions for both open claims and claims incurred but not yet reported. In 2009 and 2008, our actuarial estimates of the ultimate liability for asbestos and environmental loss reserves were increased, and management increased prior years’years' loss reserves for asbestosA&E exposures were increased by $28.4 million in 2013 and environmental exposures accordingly.
Asbestos$31.1 million in 2012. Adverse development of A&E reserves in 2012 was partially offset by favorable movements in prior years' loss reserves and environmentalallowances for reinsurance bad debt related to discontinued lines of business originally written by Markel International. During our 2011 review, we determined that no adjustment to loss reserves was required.
|
Markel Corporation & Subsidiaries
MANAGEMENT’S DISCUSSION & ANALYSIS
OF FINANCIAL CONDITION AND RESULTS OF OPERATIONS (continued)
| Year Ended December 31, 2010 | ||||||||||||||||||||
(dollars in millions) | Excess & Surplus Lines | Specialty Admitted | London Insurance Market | Other Insurance (Discontinued Lines) | Total | |||||||||||||||
Professional/Products liability | $ | (96.7 | ) | $ | — | $ | — | $ | — | $ | (96.7 | ) | ||||||||
Brokerage casualty | (55.4 | ) | — | — | — | (55.4 | ) | |||||||||||||
Mortgage-related programs | 29.9 | — | — | — | 29.9 | |||||||||||||||
Markel International: medical malpractice | — | — | 35.0 | — | 35.0 | |||||||||||||||
Markel International: 2002 & post | — | — | (119.0 | ) | — | (119.0 | ) | |||||||||||||
Markel International: 2001 & prior | — | — | (33.7 | ) | — | (33.7 | ) | |||||||||||||
Net other prior years’ (redundancy) deficiency | (36.8 | ) | (4.7 | ) | — | 3.4 | (38.1 | ) | ||||||||||||
INCREASE (DECREASE) | $ | (159.0 | ) | $ | (4.7 | ) | $ | (117.7 | ) | $ | 3.4 | $ | (278.0 | ) | ||||||
| Year Ended December 31, 2009 | ||||||||||||||||||||
(dollars in millions) | Excess & Surplus Lines | Specialty Admitted | London Insurance Market | Other Insurance (Discontinued Lines) | Total | |||||||||||||||
Professional/Products liability | $ | (97.5 | ) | $ | — | $ | — | $ | — | $ | (97.5 | ) | ||||||||
Markel Re | 7.4 | — | — | — | 7.4 | |||||||||||||||
Markel International: | — | — | (108.1 | ) | — | (108.1 | ) | |||||||||||||
Asbestos exposures | — | — | — | 10.0 | 10.0 | |||||||||||||||
Net other prior years’ (redundancy) deficiency | (40.7 | ) | 0.3 | — | (6.7 | ) | (47.1 | ) | ||||||||||||
INCREASE (DECREASE) | $ | (130.8 | ) | $ | 0.3 | $ | (108.1 | ) | $ | 3.3 | $ | (235.3 | ) | |||||||
| Year Ended December 31, 2008 | ||||||||||||||||||||
(dollars in millions) | Excess & Surplus Lines | Specialty Admitted | London Insurance Market | Other Insurance (Discontinued Lines) | Total | |||||||||||||||
Professional/Products liability | $ | (91.3 | ) | $ | — | $ | — | $ | — | $ | (91.3 | ) | ||||||||
Markel Essex | (25.6 | ) | — | — | — | (25.6 | ) | |||||||||||||
Markel Re | 30.9 | — | — | — | 30.9 | |||||||||||||||
Markel Specialty | — | (8.1 | ) | — | — | (8.1 | ) | |||||||||||||
Markel International: medical malpractice | — | — | 28.9 | — | 28.9 | |||||||||||||||
Markel International: all other lines | — | — | (87.2 | ) | — | (87.2 | ) | |||||||||||||
Asbestos exposures(1) | — | — | — | 24.9 | 24.9 | |||||||||||||||
Net other prior years’ (redundancy) deficiency | (32.8 | ) | (8.4 | ) | — | 4.9 | (36.3 | ) | ||||||||||||
INCREASE (DECREASE) | $ | (118.8 | ) | $ | (16.5 | ) | $ | (58.3 | ) | $ | 29.8 | $ | (163.8 | ) | ||||||
|
| ||||||||||||||||||||||||||||||||||||||||||||||||||||||||||||||||||||||||||||||||||||||||||||||||||||||||||||||||||||||||||||||||||||||||||||||||||||||||||||||||||||||||||||||||||||||||||||||||||||||||||||||||||||||||||||||||||||||||||||||||||||||||||||||||||||||||||||||||||||||||||||||||||||||||||||||||||||||||||||||||||||||||||||||||||||||||||||||||||||||||||||||||||||||||||||||||||||||||||||||||||||||||||||||||||||||||||||||||||||||||||||||||||||||||||||||||||||||||||||||||||||||||||||||||||||||||||||||||||||||||||||||||||||||||||||||||||||||||||||||||||||||||||||||||||||||||||||||||||||||||||||||||||||||||||||||||||||||||||||||||||||||||||||||||||||||||||||||||||||||||||||||||||||||||||||||||||||||||||||||||||||||||||||||||||||||||||||||||||||||||||||||||||||||||||||||||||||||||
106 |
Over the past three years, we have experienced favorable development on prior years’years' loss reserves ranging from 4%8% to 6%9% of beginning of year net loss reserves. In 2010,2013, we experienced favorable development of $278.0$411.1 million or 6%9% of beginning of year net loss reserves, compared to $235.3$399.0 million, or 5%9% of beginning of year net loss reserves, in 20092012 and $163.8$354.0 million, or 4%8% of beginning of year net loss reserves, in 2008.
2011.
| GROSS PREMIUM VOLUME | Years Ended December 31, | |||||||||||
(dollars in thousands) | 2010 | 2009 | 2008 | |||||||||
Excess and Surplus Lines | $ | 898,409 | $ | 962,702 | $ | 1,163,992 | ||||||
Specialty Admitted | 375,036 | 301,827 | 355,061 | |||||||||
London Insurance Market | 708,968 | 641,226 | 693,138 | |||||||||
Other Insurance (Discontinued Lines) | 54 | 138 | 593 | |||||||||
TOTAL | $ | 1,982,467 | $ | 1,905,893 | $ | 2,212,784 | ||||||
| Gross Premium Volume | |||||||||||
| Years Ended December 31, | |||||||||||
| (dollars in thousands) | 2013 | 2012 | 2011 | ||||||||
| Excess and Surplus Lines | $ | 1,070,520 | $ | 956,273 | $ | 893,427 | |||||
| Specialty Admitted | 899,996 | 669,692 | 572,392 | ||||||||
| London Insurance Market | 914,480 | 887,720 | 825,301 | ||||||||
| Alterra | 1,035,190 | — | — | ||||||||
| Other Insurance (Discontinued Lines) | 40 | (4 | ) | 131 | |||||||
| Total | $ | 3,920,226 | $ | 2,513,681 | $ | 2,291,251 | |||||
In 2010, gross premium volume in both the Excessexcess and Surplus Linesumbrella and Specialty Admitted segments was impacted by the transfer of certain programs from the Excess and Surplus Lines segment to the Specialty Admitted segment. This transfer had no impact on total gross premium volume and was made to better align the reporting of these programs with their distribution strategy. In 2010, the Specialty Admitted segment included approximately $25 million of gross premium volume on these transferred programs.
| 107
Markel Corporation & Subsidiaries
MANAGEMENT’S DISCUSSION & ANALYSIS
OF FINANCIAL CONDITION AND RESULTS OF OPERATIONS (continued)
property lines.
London Insurance Market segment gross premium volume increased 11%
2013.
| NET WRITTEN PREMIUMS | Years Ended December 31, | |||||||||||
(dollars in thousands) | 2010 | 2009 | 2008 | |||||||||
Excess and Surplus Lines | $ | 797,518 | $ | 869,695 | $ | 1,028,816 | ||||||
Specialty Admitted | 348,634 | 279,266 | 321,109 | |||||||||
London Insurance Market | 622,799 | 566,046 | 617,946 | |||||||||
Other Insurance (Discontinued Lines) | 167 | (598 | ) | 625 | ||||||||
TOTAL | $ | 1,769,118 | $ | 1,714,409 | $ | 1,968,496 | ||||||
| Net Written Premiums | |||||||||||
| Years Ended December 31, | |||||||||||
| (dollars in thousands) | 2013 | 2012 | 2011 | ||||||||
| Excess and Surplus Lines | $ | 911,870 | $ | 811,601 | $ | 772,279 | |||||
| Specialty Admitted | 855,381 | 628,147 | 543,213 | ||||||||
| London Insurance Market | 792,158 | 774,383 | 726,359 | ||||||||
| Alterra | 677,233 | — | — | ||||||||
| Other Insurance (Discontinued Lines) | 41 | (5 | ) | (13 | ) | ||||||
| Total | $ | 3,236,683 | $ | 2,214,126 | $ | 2,041,838 | |||||
Excluding premiums written by the Alterra segment, our consolidated net retention of gross premium volume in 2013 would have been 89%, which is comparable with 2012 and 2011.
| EARNED PREMIUMS | Years Ended December 31, | |||||||||||
(dollars in thousands) | 2010 | 2009 | 2008 | |||||||||
Excess and Surplus Lines | $ | 809,672 | $ | 940,098 | $ | 1,089,967 | ||||||
Specialty Admitted | 343,574 | 303,897 | 315,764 | |||||||||
London Insurance Market | 577,507 | 572,438 | 615,828 | |||||||||
Other Insurance (Discontinued Lines) | 168 | (598 | ) | 625 | ||||||||
TOTAL | $ | 1,730,921 | $ | 1,815,835 | $ | 2,022,184 | ||||||
| Earned Premiums | |||||||||||
| Years Ended December 31, | |||||||||||
| (dollars in thousands) | 2013 | 2012 | 2011 | ||||||||
| Excess and Surplus Lines | $ | 856,629 | $ | 793,159 | $ | 756,306 | |||||
| Specialty Admitted | 744,993 | 588,758 | 527,293 | ||||||||
| London Insurance Market | 781,637 | 765,216 | 695,753 | ||||||||
| Alterra | 848,317 | — | — | ||||||||
| Other Insurance (Discontinued Lines) | 40 | (5 | ) | (12 | ) | ||||||
| Total | $ | 3,231,616 | $ | 2,147,128 | $ | 1,979,340 | |||||
108 |
volume.
earned premiums from Thomco.
the life and annuity business included in the Other Insurance (Discontinued Lines) segment represent ongoing premium adjustments on existing contracts.
| Years Ended December 31, | |||||||||||
| (dollars in thousands) | 2013 | 2012 | 2011 | ||||||||
| Net investment income | $ | 317,373 | $ | 282,107 | $ | 263,676 | |||||
| Net realized investment gains | $ | 63,152 | $ | 31,593 | $ | 35,857 | |||||
| Change in net unrealized gains on investments | $ | 261,995 | $ | 353,808 | $ | 182,722 | |||||
Investment yield (1) | 2.6 | % | 3.7 | % | 3.6 | % | |||||
| Taxable equivalent total investment return, before foreign currency effect | 6.9 | % | 8.6 | % | 6.7 | % | |||||
| Taxable equivalent total investment return | 6.8 | % | 9.0 | % | 6.5 | % | |||||
| Invested assets, end of year | $ | 17,612,074 | $ | 9,332,745 | $ | 8,728,147 | |||||
(1) | Investment yield reflects net investment income as a percentage of monthly average invested assets at amortized cost. |
| Years Ended December 31, | ||||||||
| (dollars in thousands) | 2013 | 2012 | 2011 | |||||
Investment yield (1) | 2.6 | % | 3.7 | % | 3.6 | % | ||
| Adjustment of investment yield from book value to market value | (0.3 | )% | (0.5 | )% | (0.5 | )% | ||
| Net amortization of net premium on fixed maturity securities | 0.7 | % | 0.2 | % | 0.2 | % | ||
| Net realized investment gains and change in net unrealized gains on investments | 2.3 | % | 4.3 | % | 2.6 | % | ||
Taxable equivalent effect for interest and dividends (2) | 0.4 | % | 0.6 | % | 0.7 | % | ||
Other (3) | 1.1 | % | 0.7 | % | (0.1 | )% | ||
| Taxable equivalent total investment return | 6.8 | % | 9.0 | % | 6.5 | % | ||
(1) | Investment yield reflects net investment income as a percentage of monthly average invested assets at amortized cost. |
(2) | Adjustment to tax-exempt interest and dividend income to reflect a taxable equivalent basis. |
(3) | Adjustment to reflect the impact of time-weighting the inputs to the calculation of taxable equivalent total investment return. |
Our investment results over the past three years were impacted by the considerable dislocation ofin the global financial markets that began in 2008, and included the worst declines in the U.S. equity markets since the Great Depression, which were followed byour investment portfolio experienced significant recoveries beginning in the latter half of 2009. During 2009 and 2008, we increased our holdings of short-term investments and cash and cash equivalents and also shifted the allocation of our fixed maturity portfolio from corporate bonds to government and municipal bonds. In addition, as bonds matured, we reinvested a portion of the proceeds in short-term investments. During 2010, givencontinuing into 2010. Given the improvement in the financial markets over the latter half of 2009 and continuing intoin 2010, we increased our purchases of fixed maturities and equity securities and have been gradually shiftingshifted our investment portfolio’sportfolio's allocation from short-term investments and cash and cash equivalents to higher yielding investment securities. During 2011 and 2012, we increased our holdings of equity securities to capitalize on opportunities in the equity markets. Also during this time, we increased our holdings of cash and cash equivalents and short-term investments and reduced our holdings of fixed maturities. During 2013, we have continued to limit our allocation of funds for purchases of fixed maturities. Due to the current low interest rate environment, we have chosen to take a more defensive posture, earning lower investment yields in order to maintain a high level of liquidity and have flexibility in how we allocate capital. We began repositioning the investment portfolio acquired through the Alterra acquisition to be more consistent with our historical investment portfolio allocation by replacing fixed maturity corporate and mortgage-backed securities with fixed maturity tax-exempt municipal securities and equity securities. At December 31, 2010,2013, equity securities represented 21%18% of our invested assets compared to 17%26% at December 31, 2009.2012. At
| 109
Markel Corporation & Subsidiaries
MANAGEMENT’S DISCUSSION & ANALYSIS
OF FINANCIAL CONDITION AND RESULTS OF OPERATIONS (continued)
The following table summarizes2012
| Years Ended December 31, | ||||||||||||
(dollars in thousands) | 2010 | 2009 | 2008 | |||||||||
Net investment income | $ | 272,530 | $ | 259,809 | $ | 282,148 | ||||||
Net realized investment gains (losses) | $ | 36,362 | $ | (96,100 | ) | $ | (407,594 | ) | ||||
Change in net unrealized gains on investments | $ | 243,736 | $ | 566,670 | $ | (507,545 | ) | |||||
Investment yield(1) | 3.8 | % | 3.8 | % | 3.8 | % | ||||||
Taxable equivalent total investment return, before foreign currency effect | 8.1 | % | 11.7 | % | (6.9 | %) | ||||||
Taxable equivalent total investment return(2) | 7.9 | % | 13.2 | % | (9.6 | %) | ||||||
Invested assets, end of year | $ | 8,223,796 | $ | 7,848,673 | $ | 6,892,806 | ||||||
|
|
Investments and cash and cash equivalents (invested assets) increased 5% in 2010. The increase in the investment portfolio in 2010 was primarily due to an increase in net unrealized gains on investments of $243.7 million and cash flows from operations of $223.3 million. Invested assets increased 14% in 2009. The increase in the investment portfolio in 2009 was primarily due to an increase in net unrealized gains on investments of $566.7 million and cash flows from operations of $282.5 million.
during 2013. Net investment income increased 5%
payments during 2012.
110 |
In 2010, net
maturities.
Write downs for other-than-temporary declines in the estimated fair value of investments for 2009 included write downs related to our equity holdings in General Electric Company and United Parcel Service, Inc. of $21.0 million and $9.5 million, respectively. Given the extent to which the fair value of these equity securities was below cost and management’s belief that these securities were unlikely to recover in the near term, the decline in fair value for these securities was deemed other-than-temporary and was recognized in net income. Write downs for other-than-temporary declines in the estimated fair value of investments for 2009 also included a $20.5 million write down related to our investment in First Market Bank due to an anticipated merger with Union Bankshares Corporation that was expected to reduce the value of our investment. In the first quarter of 2010, this merger was completed and did not result in a material adjustment to net income.
securities.
Gross realized losses in 2008 also included $339.2 million
The most significant write downs of equity securities during 2008 related to our investments in General Electric Company, Citigroup Inc., Bank of America Corporation and International Game Technology, for which we had write downs of $64.9 million, $37.6 million, $23.4 million and $21.7 million, respectively. The General Electric Company, Bank of America Corporation and International Game Technology securities had significant declines in fair value that we believed
| 111
Markel Corporation & Subsidiaries
MANAGEMENT’S DISCUSSION & ANALYSIS
OF FINANCIAL CONDITION AND RESULTS OF OPERATIONS (continued)
were unlikely to recover in the near term. As a result, the decline in fair value for these securities was deemed other-than-temporary and was charged to earnings. During 2008, we sold a portion of our holdings in Citigroup Inc. and, as a result, we determined that we no longer had the intent to hold this investment until it fully recovered its value. The two nonredeemable preferred stock write downs related to our holdings in Fannie Mae and Freddie Mac and totaled $9.0 million. The most significant write downs of fixed maturities related to our investments in Morgan Stanley and Kaupthing Bank, an Icelandic financial institution, for which we had write downs of $18.4 million and $12.1 million, respectively. During 2008, we sold a portion of our holdings in Morgan Stanley and, as a result, we determined that we no longer had the intent to hold this investment until it fully recovered its value. The write down on Kaupthing Bank was made because we believed we would not receive all interest and principal payments when due. The eight investments discussed above represent 55% of the total write down for other-than-temporary declinesincrease in the estimated fair value of investmentsour equity portfolio as a result of strong overall equity market performance, partially offset by a decline in the estimated fair value of fixed income securities as interest rates increased during 2008.
2013. The decline in the fair value of the fixed income portfolio was more significant for fixed income securities in the investment portfolio acquired through the Alterra acquisition, as their fixed income securities have a longer weighted average effective duration than our historical fixed income portfolio. In 2010 and 2009,
interest rates during 2011.
Non-Insurance Operations (Markel Ventures)
Our non-insurance operations, which are referred to collectively as
112 |
lag. Operating revenues and expenses associated with our non-insuranceMarkel Ventures operations are included in other revenues and other expenses in the consolidated statements of operationsincome and comprehensive income. See note 21 of the notes to consolidated financial statements for the components of other revenues and other expenses associated with Markel Ventures.
| December 31, | |||||||
| (dollars in thousands) | 2013 | 2012 | |||||
| ASSETS | |||||||
| Cash and cash equivalents | $ | 61,742 | $ | 55,048 | |||
| Receivables | 78,764 | 71,565 | |||||
| Goodwill | 191,629 | 192,444 | |||||
| Intangible assets | 182,599 | 199,307 | |||||
| Other assets | 421,714 | 373,222 | |||||
| Total Assets | $ | 936,448 | $ | 891,586 | |||
| LIABILITIES AND EQUITY | |||||||
Senior long-term debt and other debt (1) | $ | 217,119 | $ | 211,147 | |||
| Other liabilities | 146,343 | 149,819 | |||||
| Total Liabilities | 363,462 | 360,966 | |||||
| Redeemable noncontrolling interests | 72,183 | 86,225 | |||||
Shareholders' equity (2) | 501,370 | 444,035 | |||||
| Noncontrolling interests | (567 | ) | 360 | ||||
| Total Equity | 500,803 | 444,395 | |||||
| Total Liabilities and Equity | $ | 936,448 | $ | 891,586 | |||
(1) | Senior long-term debt and other debt as of December 31, 2013 and 2012 included $116.4 million and $121.7 million, respectively, of debt due to other subsidiaries of Markel Corporation, which is eliminated in consolidation. |
(2) | Shareholders' equity includes $444.1 million and $415.6 million as of December 31, 2013 and 2012, respectively, which represents Markel Corporation's investment in Markel Ventures and is eliminated in consolidation. |
| Years ended December 31, | |||||||||||
| (dollars in thousands) | 2013 | 2012 | 2011 | ||||||||
| OPERATING REVENUES | |||||||||||
| Net investment income | $ | 4 | $ | 4 | $ | — | |||||
| Other revenues | 686,448 | 489,352 | 317,532 | ||||||||
| Total Operating Revenues | 686,452 | 489,356 | 317,532 | ||||||||
| OPERATING EXPENSES | |||||||||||
| Amortization of intangible assets | 20,674 | 18,684 | 11,702 | ||||||||
| Other expenses | 613,250 | 432,956 | 275,324 | ||||||||
| Total Operating Expenses | 633,924 | 451,640 | 287,026 | ||||||||
| Operating Income | 52,528 | 37,716 | 30,506 | ||||||||
Interest expense (1) | 11,230 | 11,269 | 11,853 | ||||||||
| Income Before Income Taxes | 41,298 | 26,447 | 18,653 | ||||||||
| Income tax expense | 14,654 | 8,109 | 4,447 | ||||||||
| Net Income | 26,644 | 18,338 | 14,206 | ||||||||
| Net income attributable to noncontrolling interests | 2,824 | 4,863 | 6,460 | ||||||||
| Net Income to Shareholders | $ | 23,820 | $ | 13,475 | $ | 7,746 | |||||
(1) | Interest expense for the years ended December 31, 2013, 2012 and 2011 includes intercompany interest expense of $6.4 million, $6.4 million and $6.0 million, respectively, which is eliminated in consolidation. |
| Years ended December 31, | |||||||||||
| (dollars in thousands) | 2013 | 2012 | 2011 | ||||||||
| Cash and cash equivalents, beginning of year | $ | 55,048 | $ | 35,756 | $ | 25,395 | |||||
| Net cash provided by operating activities | 75,926 | 47,020 | 17,457 | ||||||||
| Net cash used by investing activities | (60,533 | ) | (190,060 | ) | (128,298 | ) | |||||
Net cash provided (used) by financing activities (1,2) | (8,699 | ) | 162,332 | 121,202 | |||||||
| Increase in cash and cash equivalents | 6,694 | 19,292 | 10,361 | ||||||||
| Cash and cash equivalents, end of year | $ | 61,742 | $ | 55,048 | $ | 35,756 | |||||
(1) | Net cash provided (used) by financing activities for the years ended December 31, 2013, 2012 and 2011 includes capital contributions from our holding company of $28.7 million, $193.4 million and $97.9 million, respectively, which are eliminated in consolidation. |
(2) | Net cash used by financing activities for the year ended December 31, 2013 includes repayments of debt totaling $5.3 million which are eliminated in consolidation. Net cash provided by financing activities for the years ended December 31, 2012 and 2011 includes additions to debt of $8.8 million and $15.4 million, respectively, which are eliminated in consolidation. |
| Years Ended December 31, | |||||||||||
| (dollars in thousands) | 2013 | 2012 | 2011 | ||||||||
| Markel Ventures EBITDA - Manufacturing | $ | 64,415 | $ | 44,963 | $ | 21,915 | |||||
| Markel Ventures EBITDA - Non-Manufacturing | 19,372 | 15,398 | 15,410 | ||||||||
| Markel Ventures EBITDA - Total | 83,787 | 60,361 | 37,325 | ||||||||
Interest expense (1) | (9,283 | ) | (9,782 | ) | (10,871 | ) | |||||
| Income tax expense | (13,988 | ) | (7,868 | ) | (4,335 | ) | |||||
| Depreciation expense | (19,313 | ) | (14,205 | ) | (5,106 | ) | |||||
| Amortization of intangible assets | (17,383 | ) | (15,031 | ) | (9,267 | ) | |||||
| Markel Ventures net income to shareholders | 23,820 | 13,475 | 7,746 | ||||||||
| Net income from other Markel operations | 257,201 | 239,910 | 134,280 | ||||||||
| Net income to shareholders | $ | 281,021 | $ | 253,385 | $ | 142,026 | |||||
(1) | Interest expense for the years ended December 31, 2013,2012 and 2011includes intercompany interest expense of $6.4 million, $6.4 million and $6.0 million, respectively. |
acquisition of Eagle.
July 2012.
both 2012 and 2011.
| 113
Reserves
Markel Corporation & Subsidiaries
MANAGEMENT’S DISCUSSION & ANALYSIS
OF FINANCIAL CONDITION AND RESULTS OF OPERATIONS (continued)
Claims And Reserves
value, except for reserves assumed in connection with an acquisition, which are recorded at fair value at the acquisition date.
2013
.(dollars in millions) | 2000 | 2001 | 2002 | 2003 | 2004 | 2005 | 2006 | 2007 | 2008 | 2009 | 2010 | |||||||||||||||||||||||||||||||||
Net reserves, end of year, adjusted for commutations, foreign currency movements and other | $ | 2,144.8 | 2,481.1 | 2,952.5 | 3,412.5 | 3,824.1 | 4,182.2 | 4,282.3 | 4,332.3 | 4,550.6 | 4,535.6 | 4,600.3 | ||||||||||||||||||||||||||||||||
Paid (cumulative) as of: | ||||||||||||||||||||||||||||||||||||||||||||
One year later | 607.7 | 647.7 | 702.1 | 679.6 | 717.2 | 799.5 | 783.8 | 727.6 | 759.5 | 796.1 | ||||||||||||||||||||||||||||||||||
Two years later | 1,030.3 | 1,169.7 | 1,214.1 | 1,194.1 | 1,256.5 | 1,375.4 | 1,312.1 | 1,270.8 | 1,364.8 | |||||||||||||||||||||||||||||||||||
Three years later | 1,410.8 | 1,536.2 | 1,615.7 | 1,597.8 | 1,667.4 | 1,752.4 | 1,689.6 | 1,686.3 | ||||||||||||||||||||||||||||||||||||
Four years later | 1,646.3 | 1,840.2 | 1,932.5 | 1,914.7 | 1,932.9 | 2,018.2 | 1,994.1 | |||||||||||||||||||||||||||||||||||||
Five years later | 1,867.7 | 2,065.6 | 2,171.6 | 2,105.6 | 2,114.0 | 2,243.3 | ||||||||||||||||||||||||||||||||||||||
Six years later | 2,027.2 | 2,252.0 | 2,317.7 | 2,235.8 | 2,293.2 | |||||||||||||||||||||||||||||||||||||||
Seven years later | 2,164.3 | 2,359.3 | 2,418.7 | 2,382.1 | ||||||||||||||||||||||||||||||||||||||||
Eight years later | 2,238.7 | 2,432.4 | 2,537.0 | |||||||||||||||||||||||||||||||||||||||||
Nine years later | 2,293.0 | 2,515.1 | ||||||||||||||||||||||||||||||||||||||||||
Ten years later | 2,362.7 | |||||||||||||||||||||||||||||||||||||||||||
Reserves re-estimated as of: | ||||||||||||||||||||||||||||||||||||||||||||
One year later | 2,282.3 | 2,612.7 | 3,081.1 | 3,446.4 | 3,773.5 | 4,049.9 | 4,085.0 | 4,168.5 | 4,315.2 | 4,257.6 | ||||||||||||||||||||||||||||||||||
Two years later | 2,396.2 | 2,793.9 | 3,265.4 | 3,467.0 | 3,618.8 | 3,899.5 | 3,946.0 | 3,933.1 | 4,078.4 | |||||||||||||||||||||||||||||||||||
Three years later | 2,573.5 | 3,037.3 | 3,340.6 | 3,402.5 | 3,534.3 | 3,795.7 | 3,758.7 | 3,718.7 | ||||||||||||||||||||||||||||||||||||
Four years later | 2,772.7 | 3,155.9 | 3,327.9 | 3,398.8 | 3,506.3 | 3,686.1 | 3,598.0 | |||||||||||||||||||||||||||||||||||||
Five years later | 2,861.5 | 3,163.6 | 3,360.6 | 3,419.1 | 3,460.0 | 3,574.1 | ||||||||||||||||||||||||||||||||||||||
Six years later | 2,871.6 | 3,199.0 | 3,401.8 | 3,394.9 | 3,377.9 | |||||||||||||||||||||||||||||||||||||||
Seven years later | 2,903.2 | 3,247.2 | 3,404.0 | 3,338.9 | ||||||||||||||||||||||||||||||||||||||||
Eight years later | 2,947.6 | 3,254.6 | 3,372.9 | |||||||||||||||||||||||||||||||||||||||||
Nine years later | 2,954.7 | 3,224.3 | ||||||||||||||||||||||||||||||||||||||||||
Ten years later | 2,940.9 | |||||||||||||||||||||||||||||||||||||||||||
Net cumulative redundancy (deficiency) | $ | (796.1 | ) | (743.2 | ) | (420.4 | ) | 73.6 | 446.2 | 608.1 | 684.3 | 613.6 | 472.2 | 278.0 | ||||||||||||||||||||||||||||||
Cumulative % | (37 | %) | (30 | %) | (14 | %) | 2 | % | 12 | % | 15 | % | 16 | % | 14 | % | 10 | % | 6 | % | ||||||||||||||||||||||||
Gross reserves, end of year, adjusted for commutations, foreign currency movements and other | $ | 2,991.4 | 3,717.3 | 4,350.3 | 4,796.7 | 5,222.9 | 5,987.3 | 5,420.7 | 5,310.0 | 5,553.2 | 5,393.3 | 5,398.4 | ||||||||||||||||||||||||||||||||
Reinsurance recoverable, adjusted for commutations, foreign currency movements and other | 846.6 | 1,236.2 | 1,397.8 | 1,384.2 | 1,398.8 | 1,805.1 | 1,138.4 | 977.7 | 1,002.6 | 857.7 | 798.1 | |||||||||||||||||||||||||||||||||
Net reserves, end of year, adjusted for commutations, foreign currency movements and other | $ | 2,144.8 | 2,481.1 | 2,952.5 | 3,412.5 | 3,824.1 | 4,182.2 | 4,282.3 | 4,332.3 | 4,550.6 | 4,535.6 | 4,600.3 | ||||||||||||||||||||||||||||||||
Gross re-estimated reserves | 4,463.8 | 4,908.4 | 4,858.3 | 4,661.2 | 4,605.8 | 5,194.4 | 4,608.9 | 4,601.7 | 4,998.9 | 5,081.9 | ||||||||||||||||||||||||||||||||||
Re-estimated recoverable | 1,522.9 | 1,684.1 | 1,485.4 | 1,322.3 | 1,227.9 | 1,620.3 | 1,010.9 | 883.0 | 920.5 | 824.3 | ||||||||||||||||||||||||||||||||||
Net re-estimated reserves | $ | 2,940.9 | 3,224.3 | 3,372.9 | 3,338.9 | 3,377.9 | 3,574.1 | 3,598.0 | 3,718.7 | 4,078.4 | 4,257.6 | |||||||||||||||||||||||||||||||||
Gross cumulative redundancy (deficiency) | $ | (1,472.4 | ) | (1,191.1 | ) | (508.0 | ) | 135.5 | 617.1 | 792.9 | 811.8 | 708.3 | 554.3 | 311.4 | ||||||||||||||||||||||||||||||
| 2013.
| (dollars in millions) | 2003 | 2004 | 2005 | 2006 | 2007 | 2008 | 2009 | 2010 | 2011 | 2012 | 2013 | ||||||||||||||||||||||
| Net reserves, end of year, adjusted for commutations, foreign currency movements and other | $ | 3,423.4 | 3,834.9 | 4,193.3 | 4,294.0 | 4,343.9 | 4,562.0 | 4,547.9 | 4,613.8 | 4,636.6 | 4,591.9 | 8,407.6 | |||||||||||||||||||||
| Paid (cumulative) as of: | |||||||||||||||||||||||||||||||||
| One year later | 679.6 | 717.2 | 799.5 | 783.8 | 727.6 | 759.5 | 796.1 | 898.3 | 932.0 | 906.3 | |||||||||||||||||||||||
| Two years later | 1,194.1 | 1,256.5 | 1,375.4 | 1,312.1 | 1,270.8 | 1,364.8 | 1,417.0 | 1,531.0 | 1,548.7 | ||||||||||||||||||||||||
| Three years later | 1,597.8 | 1,667.4 | 1,752.4 | 1,689.6 | 1,686.3 | 1,841.0 | 1,881.5 | 1,918.5 | |||||||||||||||||||||||||
| Four years later | 1,914.7 | 1,932.9 | 2,018.2 | 1,994.1 | 1,983.9 | 2,189.7 | 2,118.7 | ||||||||||||||||||||||||||
| Five years later | 2,105.6 | 2,114.0 | 2,243.3 | 2,201.5 | 2,245.4 | 2,350.9 | |||||||||||||||||||||||||||
| Six years later | 2,235.8 | 2,293.2 | 2,406.5 | 2,396.8 | 2,353.7 | ||||||||||||||||||||||||||||
| Seven years later | 2,382.1 | 2,418.4 | 2,581.1 | 2,473.2 | |||||||||||||||||||||||||||||
| Eight years later | 2,487.4 | 2,545.1 | 2,642.7 | ||||||||||||||||||||||||||||||
| Nine years later | 2,604.5 | 2,587.0 | |||||||||||||||||||||||||||||||
| Ten years later | 2,635.0 | ||||||||||||||||||||||||||||||||
| Reserves re-estimated as of: | |||||||||||||||||||||||||||||||||
| One year later | 3,457.4 | 3,784.3 | 4,061.0 | 4,096.6 | 4,180.2 | 4,326.6 | 4,269.8 | 4,260.0 | 4,237.6 | 4,180.8 | |||||||||||||||||||||||
| Two years later | 3,477.9 | 3,629.6 | 3,910.6 | 3,957.6 | 3,944.7 | 4,089.8 | 3,926.6 | 3,884.8 | 3,895.5 | ||||||||||||||||||||||||
| Three years later | 3,413.4 | 3,545.1 | 3,806.7 | 3,770.3 | 3,730.4 | 3,825.0 | 3,634.1 | 3,629.9 | |||||||||||||||||||||||||
| Four years later | 3,409.7 | 3,517.1 | 3,697.1 | 3,609.7 | 3,529.1 | 3,628.8 | 3,436.7 | ||||||||||||||||||||||||||
| Five years later | 3,430.0 | 3,470.8 | 3,585.2 | 3,455.3 | 3,380.2 | 3,475.1 | |||||||||||||||||||||||||||
| Six years later | 3,405.8 | 3,388.7 | 3,470.7 | 3,357.0 | 3,266.3 | ||||||||||||||||||||||||||||
| Seven years later | 3,349.9 | 3,305.5 | 3,405.2 | 3,285.9 | |||||||||||||||||||||||||||||
| Eight years later | 3,296.6 | 3,258.6 | 3,355.7 | ||||||||||||||||||||||||||||||
| Nine years later | 3,263.3 | 3,224.6 | |||||||||||||||||||||||||||||||
| Ten years later | 3,239.4 | ||||||||||||||||||||||||||||||||
| Net cumulative redundancy | $ | 184.0 | 610.3 | 837.6 | 1,008.1 | 1,077.6 | 1,086.9 | 1,111.2 | 983.9 | 741.1 | 411.1 | ||||||||||||||||||||||
| Cumulative % | 5 | % | 16 | % | 20 | % | 23 | % | 25 | % | 24 | % | 24 | % | 21 | % | 16 | % | 9 | % | |||||||||||||
| Gross reserves, end of year, adjusted for commutations, foreign currency movements and other | $ | 4,780.8 | 5,206.9 | 5,971.7 | 5,405.5 | 5,294.5 | 5,537.7 | 5,378.0 | 5,383.6 | 5,410.8 | 5,359.6 | 10,262.1 | |||||||||||||||||||||
| Reinsurance recoverable, adjusted for commutations, foreign currency movements and other | 1,357.4 | 1,372.0 | 1,778.4 | 1,111.5 | 950.6 | 975.7 | 830.1 | 769.8 | 774.2 | 767.7 | 1,854.4 | ||||||||||||||||||||||
| Net reserves, end of year, adjusted for commutations, foreign currency movements and other | $ | 3,423.4 | 3,834.9 | 4,193.3 | 4,294.0 | 4,343.9 | 4,562.0 | 4,547.9 | 4,613.8 | 4,636.6 | 4,591.9 | 8,407.6 | |||||||||||||||||||||
| Gross re-estimated reserves | 4,562.5 | 4,438.6 | 4,939.7 | 4,235.0 | 4,060.5 | 4,272.1 | 4,135.7 | 4,308.9 | 4,612.7 | 4,886.8 | |||||||||||||||||||||||
| Re-estimated recoverable | 1,323.1 | 1,214.0 | 1,584.0 | 949.1 | 794.2 | 797.0 | 699.0 | 679.0 | 717.2 | 706.0 | |||||||||||||||||||||||
| Net re-estimated reserves | $ | 3,239.4 | 3,224.6 | 3,355.7 | 3,285.9 | 3,266.3 | 3,475.1 | 3,436.7 | 3,629.9 | 3,895.5 | 4,180.8 | ||||||||||||||||||||||
| Gross cumulative redundancy | $ | 218.3 | 768.3 | 1,032.0 | 1,170.5 | 1,234.0 | 1,265.6 | 1,242.3 | 1,074.7 | 798.1 | 472.8 | ||||||||||||||||||||||
Markel Corporation & Subsidiaries
MANAGEMENT’S DISCUSSION & ANALYSIS
OF FINANCIAL CONDITION AND RESULTS OF OPERATIONS (continued)
rights would have a material impact on our liquidity.
116 |
This repurchase program replaced a previous repurchase program that had been approved by the Board of Directors in August 2005. As of December 31, 2010,2013, we had not repurchased 7,956any shares of our common stock at a cost of $2.8 million under the 2013 Program.
liquidity or capital resources.
net cash used by investing activities of
$377.1 million and $491.1 million in 2012 and 2011, respectively. During 2013, we used net cash of $12.2 million for acquisitions. The acquisition of Alterra resulted in net cash received as a result of Alterra's cash balance exceeding cash paid for the acquisition by $49.5 million. Net cash used by investing activitiesWe received cash of $236.9 million during 2013 for redemptions from our hedge fund portfolio acquired through the Alterra acquisition, which is included in other assets on the consolidated balance sheet. During 2011 and 2012, we increased our holdings of equity securities to capitalize on opportunities in the equity markets. Also during this time, we increased our holdings of cash and cash equivalents and short-term investments and reduced our holdings of fixed maturities. During 2013, we have continued to limit our allocation of funds for purchases of fixed maturities. Due to the current low interest rate environment, we have chosen to take a more defensive posture, earning lower investment yields in order to maintain a high level of liquidity and have flexibility in how we allocate capital. We began repositioning the investment portfolio acquired through the Alterra acquisition to be more consistent with our target investment portfolio allocation by replacing fixed maturity corporate and mortgage-backed securities with fixed maturity tax-exempt municipal securities and equity securities. Cash flow from investing activities is affected by various factors such as anticipated payment of claims, financing activity, acquisition opportunities and individual buy and sell decisions made in the normal course of our investment portfolio management.
|
Markel Corporation & Subsidiaries
MANAGEMENT’S DISCUSSION & ANALYSIS
OF FINANCIAL CONDITION AND RESULTS OF OPERATIONS (continued)
Reinsurance recoverable on paid and unpaid losses was $0.9 billion at December 31, 2010 compared to $1.0 billion at December 31, 2009. The decrease in 2010 was due in part to a reduction in the reinsurance recoverable on unpaid losses related to favorable development on prior years’ loss reserves. Reinsurance recoverable on paid and unpaid losses at December 31, 2010 included $41.3 million of estimated reinsurance recoverables related to the Deepwater Horizon drilling rig explosion in April 2010.
118 |
operations.
(dollars in thousands) | Excess & Surplus Lines | Specialty Admitted | London Insurance Market | Other Insurance (Discontinued Lines) | Consolidated | |||||||||||||||
December 31, 2010 | ||||||||||||||||||||
Case reserves | $ | 706,624 | 201,403 | 903,015 | 297,401 | $ | 2,108,443 | |||||||||||||
IBNR reserves | 1,736,363 | 427,372 | 917,384 | 208,844 | 3,289,963 | |||||||||||||||
TOTAL | $ | 2,442,987 | 628,775 | 1,820,399 | 506,245 | $ | 5,398,406 | |||||||||||||
December 31, 2009 | ||||||||||||||||||||
Case reserves | $ | 744,965 | 116,862 | 948,756 | 337,295 | $ | 2,147,878 | |||||||||||||
IBNR reserves | 1,875,154 | 266,958 | 906,258 | 230,848 | 3,279,218 | |||||||||||||||
TOTAL | $ | 2,620,119 | 383,820 | 1,855,014 | 568,143 | $ | 5,427,096 | |||||||||||||
attributable to Alterra were recorded at fair value as of the Acquisition Date, which consists of the present value of the expected net loss and loss adjustment expense payments plus a risk premium. Unpaid losses and loss adjustment expenses included in the consolidated balance sheet include the unamortized portion of the fair value adjustment recorded at the Acquisition Date; however, as this amount does not represent case or IBNR reserves, it is excluded from the table below.
| (dollars in thousands) | Excess & Surplus Lines | Specialty Admitted | London Insurance Market | Alterra | Other Insurance (Discontinued Lines) | Consolidated | |||||||||||||||||
| December 31, 2013 | |||||||||||||||||||||||
| Case reserves | $ | 529,391 | $ | 295,988 | $ | 889,425 | $ | 1,605,947 | $ | 278,383 | $ | 3,599,134 | |||||||||||
| IBNR reserves | 1,468,968 | 582,576 | 1,020,187 | 3,254,311 | 200,416 | 6,526,458 | |||||||||||||||||
| Total | $ | 1,998,359 | $ | 878,564 | $ | 1,909,612 | $ | 4,860,258 | $ | 478,799 | $ | 10,125,592 | |||||||||||
| December 31, 2012 | |||||||||||||||||||||||
| Case reserves | $ | 600,002 | $ | 269,163 | $ | 933,992 | $ | — | $ | 273,354 | $ | 2,076,511 | |||||||||||
| IBNR reserves | 1,552,251 | 526,930 | 1,024,257 | — | 191,477 | 3,294,915 | |||||||||||||||||
| Total | $ | 2,152,253 | $ | 796,093 | $ | 1,958,249 | $ | — | $ | 464,831 | $ | 5,371,426 | |||||||||||
| Payments Due by Period(1) | ||||||||||||||||||||
(dollars in thousands) | Total | Less than 1 year | 1-3 years | 4-5 years | More than 5 years | |||||||||||||||
Senior long-term debt and other debt | $ | 1,025,597 | 7,264 | 258,613 | 23,468 | 736,252 | ||||||||||||||
Operating leases | 115,834 | 17,689 | 33,581 | 30,211 | 34,353 | |||||||||||||||
Unpaid losses and loss adjustment expenses (estimated) | 5,398,406 | 1,267,253 | 1,702,948 | 968,163 | 1,460,042 | |||||||||||||||
TOTAL | $ | 6,539,837 | 1,292,206 | 1,995,142 | 1,021,842 | 2,230,647 | ||||||||||||||
Payments Due by Period (1) | |||||||||||||||||||
| (dollars in thousands) | Total | Less than 1 year | 1-3 years | 4-5 years | More than 5 years | ||||||||||||||
Senior long-term debt and other debt(2) | $ | 3,560,302 | $ | 157,186 | $ | 271,886 | $ | 348,073 | $ | 2,783,157 | |||||||||
| Operating leases | 299,723 | 32,783 | 52,091 | 54,395 | 160,454 | ||||||||||||||
| Abbey acquisition commitment | 190,000 | 190,000 | — | — | — | ||||||||||||||
| Unpaid losses and loss adjustment expenses (estimated) | 10,125,592 | 2,104,431 | 3,163,505 | 1,763,568 | 3,094,088 | ||||||||||||||
| Life and annuity benefits (estimated) | 2,072,013 | 105,971 | 201,227 | 187,320 | 1,577,495 | ||||||||||||||
| Total | $ | 16,247,630 | $ | 2,590,371 | $ | 3,688,709 | $ | 2,353,356 | $ | 7,615,194 | |||||||||
(1) | See notes |
(2) | Amounts include interest. |
that were issued and outstanding.
facilities.
| 119
Markel Corporation & Subsidiaries
MANAGEMENT’S DISCUSSION & ANALYSIS
OF FINANCIAL CONDITION AND RESULTS OF OPERATIONS (continued)
At The unpaid losses and loss adjustment expenses in the table above are our gross estimates of known liabilities as of December 31, 2010,2013. The expected payments by period are the estimated payments at a future time, whereas the reserves for unpaid losses and loss adjustment expenses included in the consolidated balance sheet include the unamortized portion of the fair value adjustment recorded at the Acquisition Date for unpaid losses and loss adjustment expenses assumed in the Alterra acquisition.
Capital adequacyamount of our international insurance subsidiaries is regulated by the Financial Services Authority. At December 31, 2010, thestatutory capital and surplus of each of our international insurance subsidiaries was above the minimumnecessary to satisfy regulatory thresholds.
requirements.
120 |
to the Company.
During the latter half of 2010, credit spreads on our municipal bond holdings widened, reflecting generalGeneral concern exists about the growing number of municipalities experiencing financial difficulties in light of the adverse economic conditions experienced over the past several years. We manage the exposure to credit risk in our municipal bond portfolio by investing in high quality securities and by diversifying our holdings, which are typically either general obligation or revenue bonds related to essential products and services.
| December 31, 2013 | |||||||||||||||
| (dollars in thousands) | Sovereign | Non-Sovereign Financial Institutions | Non-Sovereign Non-Financial Institutions | Total | |||||||||||
| European exposures: | |||||||||||||||
| Portugal, Ireland, Italy, Greece and Spain | $ | — | $ | 42,966 | $ | 2,684 | $ | 45,650 | |||||||
| Eurozone (excluding Portugal, Ireland, Italy, Greece and Spain) | 888,653 | 319,343 | 159,509 | 1,367,505 | |||||||||||
| Supranationals | — | 226,462 | — | 226,462 | |||||||||||
| Other | 85,478 | 184,681 | 183,646 | 453,805 | |||||||||||
| Total European exposures | 974,131 | 773,452 | 345,839 | 2,093,422 | |||||||||||
| All other foreign (non-European) exposures | 486,923 | 138,960 | 141,601 | 767,484 | |||||||||||
| Total foreign exposures | $ | 1,461,054 | $ | 912,412 | $ | 487,440 | $ | 2,860,906 | |||||||
| December 31, 2012 | |||||||||||||||
| (dollars in thousands) | Sovereign | Non-Sovereign Financial Institutions | Non-Sovereign Non-Financial Institutions | Total | |||||||||||
| European exposures: | |||||||||||||||
| Portugal, Ireland, Italy, Greece and Spain | $ | — | $ | 36,233 | $ | 2,641 | $ | 38,874 | |||||||
| Eurozone (excluding Portugal, Ireland, Italy, Greece and Spain) | 146,173 | 170,758 | 102,952 | 419,883 | |||||||||||
| Supranationals | — | 113,025 | — | 113,025 | |||||||||||
| Other | 6,442 | 19,803 | 71,132 | 97,377 | |||||||||||
| Total European exposures | 152,615 | 339,819 | 176,725 | 669,159 | |||||||||||
| All other foreign (non-European) exposures | 403,993 | 73,019 | 54,420 | 531,432 | |||||||||||
| Total foreign exposures | $ | 556,608 | $ | 412,838 | $ | 231,145 | $ | 1,200,591 | |||||||
securities.
| 121
Markel Corporation & Subsidiaries
MANAGEMENT’S DISCUSSION & ANALYSIS
OF FINANCIAL CONDITION AND RESULTS OF OPERATIONS (continued)
subsidiaries.
(dollars in millions) | Estimated Fair Value | Hypothetical Price Change | Estimated Fair Value after Hypothetical Change in Prices | Estimated Hypothetical Percentage Increase (Decrease) in Shareholders’ Equity | ||||||||||||
As of December 31, 2010 | ||||||||||||||||
Equity Securities | $ | 1,722 | 35% increase | $ | 2,325 | 12.5 | % | |||||||||
| 35% decrease | 1,119 | (12.5 | ) | |||||||||||||
As of December 31, 2009 | ||||||||||||||||
Equity Securities | $ | 1,350 | 35% increase | $ | 1,822 | 10.5 | % | |||||||||
| 35% decrease | 877 | (11.0 | ) | |||||||||||||
122 |
| (dollars in millions) | Estimated Fair Value | Hypothetical Price Change | Estimated Fair Value after Hypothetical Change in Prices | Estimated Hypothetical Percentage Increase (Decrease) in Shareholders' Equity | ||||||||
| As of December 31, 2013 | ||||||||||||
| Equity securities | $ | 3,252 | 35% increase | $ | 4,390 | 11.4 | % | |||||
| 35% decrease | 2,114 | (11.4 | )% | |||||||||
| As of December 31, 2012 | ||||||||||||
| Equity securities | $ | 2,407 | 35% increase | $ | 3,249 | 14.7 | % | |||||
| 35% decrease | 1,565 | (14.7 | )% | |||||||||
Approximately two-thirds
| 123
Markel Corporation & Subsidiaries
MANAGEMENT’S DISCUSSION & ANALYSIS
OF FINANCIAL CONDITION AND RESULTS OF OPERATIONS (continued)
(dollars in millions) | Estimated Fair Value | Hypothetical Change in Interest Rates (bp=basis points) | Estimated Fair Value after Hypothetical Change in Interest Rates | Hypothetical Percentage Increase (Decrease) in | ||||||||||||||||
| Fair Value of Fixed Maturities | Shareholders’ Equity | |||||||||||||||||||
FIXED MATURITY INVESTMENTS | ||||||||||||||||||||
As of December 31, 2010 | ||||||||||||||||||||
Total Fixed Maturity Investments(1) | $ | 6,502 | 200 bp decrease | $ | 7,077 | 8.8 | % | 12.1 | % | |||||||||||
| 100 bp decrease | 6,798 | 4.6 | 6.2 | |||||||||||||||||
| 100 bp increase | 6,197 | (4.7 | ) | (6.4 | ) | |||||||||||||||
| 200 bp increase | 5,905 | (9.2 | ) | (12.6 | ) | |||||||||||||||
As of December 31, 2009 | ||||||||||||||||||||
Total Fixed Maturity Investments(1) | $ | 6,455 | 200 bp decrease | $ | 6,982 | 8.2 | % | 11.3 | % | |||||||||||
| 100 bp decrease | 6,728 | 4.2 | 5.9 | |||||||||||||||||
| 100 bp increase | 6,172 | (4.4 | ) | (6.1 | ) | |||||||||||||||
| 200 bp increase | 5,898 | (8.6 | ) | (12.1 | ) | |||||||||||||||
LIABILITIES(2) | ||||||||||||||||||||
As of December 31, 2010 | ||||||||||||||||||||
Borrowings | $ | 1,086 | 200 bp decrease | $ | 1,214 | |||||||||||||||
| 100 bp decrease | 1,148 | |||||||||||||||||||
| 100 bp increase | 1,022 | |||||||||||||||||||
| 200 bp increase | 962 | |||||||||||||||||||
As of December 31, 2009 | ||||||||||||||||||||
Borrowings | $ | 1,011 | 200 bp decrease | $ | 1,148 | |||||||||||||||
| 100 bp decrease | 1,078 | |||||||||||||||||||
| 100 bp increase | 946 | |||||||||||||||||||
| 200 bp increase | 886 | |||||||||||||||||||
| (dollars in millions) | Estimated Fair Value | Hypothetical Change in Interest Rates (bp=basis points) | Estimated Fair Value after Hypothetical Change in Interest Rates | Hypothetical Percentage Increase (Decrease) in | |||||||||||
Fair Value of Fixed Maturities | Shareholders' Equity | ||||||||||||||
| Fixed Maturity Investments | |||||||||||||||
| As of December 31, 2013 | |||||||||||||||
| Total fixed maturity investments | $ | 10,143 | 200 bp decrease | $ | 11,231 | 10.7 | % | 10.9 | % | ||||||
| 100 bp decrease | 10,661 | 5.1 | % | 5.2 | % | ||||||||||
| 100 bp increase | 9,636 | (5.0 | )% | (5.1 | )% | ||||||||||
| 200 bp increase | 9,163 | (9.7 | )% | (9.8 | )% | ||||||||||
| As of December 31, 2012 | |||||||||||||||
| Total fixed maturity investments | $ | 4,979 | 200 bp decrease | $ | 5,376 | 8.0 | % | 7.1 | % | ||||||
| 100 bp decrease | 5,175 | 3.9 | % | 3.5 | % | ||||||||||
| 100 bp increase | 4,777 | (4.1 | )% | (3.6 | )% | ||||||||||
| 200 bp increase | 4,560 | (8.4 | )% | (7.4 | )% | ||||||||||
Liabilities (1) | |||||||||||||||
| As of December 31, 2013 | |||||||||||||||
| Borrowings | $ | 2,372 | 200 bp decrease | $ | 2,752 | ||||||||||
| 100 bp decrease | 2,550 | ||||||||||||||
| 100 bp increase | 2,213 | ||||||||||||||
| 200 bp increase | 2,072 | ||||||||||||||
| As of December 31, 2012 | |||||||||||||||
| Borrowings | $ | 1,688 | 200 bp decrease | $ | 1,916 | ||||||||||
| 100 bp decrease | 1,796 | ||||||||||||||
| 100 bp increase | 1,591 | ||||||||||||||
| 200 bp increase | 1,503 | ||||||||||||||
(1) |
|
Changes in estimated fair value have no impact on |
124 |
At As of
no material foreign currency exposure.
| 125
Markel Corporation & Subsidiaries
MANAGEMENT’S DISCUSSION & ANALYSIS
OF FINANCIAL CONDITION AND RESULTS OF OPERATIONS (continued)
the current investment environment.
reporting.
an enhanced control environment related to Markel Ventures financial reporting.
126 |
Such statements may use words such as "anticipate," "believe," "estimate," "expect," "intend," "predict," "project" and similar expressions as they relate to us or our management.
the effect of cyclical trends, including demand and pricing in the insurance and reinsurance markets;
the impact of the events of September 11, 2001 will depend on the resolution of on-going insurance coverage litigation and arbitrations;
the frequency and severity of catastrophic eventsman-made and natural catastrophes (including earthquakes and weather-related catastrophes) ismay exceed expectations, are unpredictable and, in the case of weather-related catastrophes, may be exacerbated if, as many forecast, conditions in the oceans and atmosphere result in increased hurricane or other adverse weather-related activity;
emerging claim and coverage issues, changing legal and social trends, and inherent uncertainties (including but not limited to those uncertainties associated with our asbestos and environmentalA&E reserves) in the loss estimation process can adversely impact the adequacy of loss reserves and the allowance for reinsurance recoverables;
we have exposurereinsurance reserves are subject to losses associated withgreater uncertainty than insurance reserves primarily because of reliance upon the adverse conditionsoriginal underwriting decisions made by ceding companies and the longer lapse of time from the occurrence of loss events to their reporting to the reinsurer for ultimate resolution;
adverse developments in insurance coverage litigation or other legal or administrative proceedings could result in material increases in our estimates of loss reserves;
the failure of any loss estimation process may become more uncertain if we experience a period of rising inflation;
changes in the availability, costs and availabilityquality of reinsurance coverage which may impact our ability to write certain lines of business;
industry and economic conditions can affect the ability and/or willingness of reinsurers to pay balances due;
after the commutation of ceded reinsurance contracts, any subsequent adverse development in the re-assumed loss reserves will result in a charge to earnings;
regulatory actions can impede our ability to charge adequate rates and efficiently allocate capital;
| 127
Markel Corporation & Subsidiaries
MANAGEMENT’S DISCUSSION & ANALYSIS
OF FINANCIAL CONDITION AND RESULTS OF OPERATIONS (continued)
economic conditions, actual or potential defaults in sovereign debt obligations, volatility in interest and foreign currency exchange rates and changes in market value of concentrated investments can have a significant impact on the fair value of fixed maturities and equity securities, as well as the carrying value of other assets and liabilities, and this impact may be heightened by market volatility;
economic conditions,conditions; changes in government support for education, healthcare and infrastructure projectsprojects; changes in capital spending levels; changes in the housing market; and volatility in interest and foreign currency exchange rates, among other factors, may adversely affect the markets served by our non-insuranceMarkel Ventures operations and negatively impact their revenues and profitability;
we cannot predict the extent and duration of the current period of slow economic slowdown;growth; the continuing effects of government intervention into the markets to address the financial crisis of 2008 and 2009 (including, among other things, financial stability and recovery initiatives; changes in tax policy; and the effects of the Dodd-Frank Wall Street Reform and Consumer Protection Act and regulations adopted thereunder); the outcome of economic and currency concerns in the Eurozone; material changes to the monetary policies of the U.S. Federal Reserve; and their combined impact on our industry, business and investment portfolio;
we cannot predict the impact of the implementation of U.S. health care reform legislation and regulations under that legislation on our business;
our Atlas systembusiness is dependent upon the successful functioning and security of our computer systems; if our information technology systems fail or suffer a security breach, our business process initiative may take longer to implement and cost more than we anticipate and may not achieve all of its objectives;
we have recently completed a number of acquisitions, the most significant of which was our 2013 acquisition of Alterra, and may engage in additional acquisition activity in the future, which may increase operational and control risks for a period of time;
the amount of the costs and charges related to our acquisition and integration of Alterra and related restructuring may exceed our expectations;
adverse changes in our assigned financial strength or debt ratings could impact our ability to attract and retain business or obtain capital.
128 |

| Years Ended December 31, | ||||||||||||||||||||||||
| 2005(1) | 2006 | 2007 | 2008 | 2009 | 2010 | |||||||||||||||||||
Markel Corporation | 100 | 151 | 155 | 94 | 107 | 119 | ||||||||||||||||||
S&P 500 | 100 | 116 | 122 | 77 | 97 | 112 | ||||||||||||||||||
Dow Jones Property & Casualty Insurance | 100 | 114 | 104 | 78 | 85 | 102 | ||||||||||||||||||
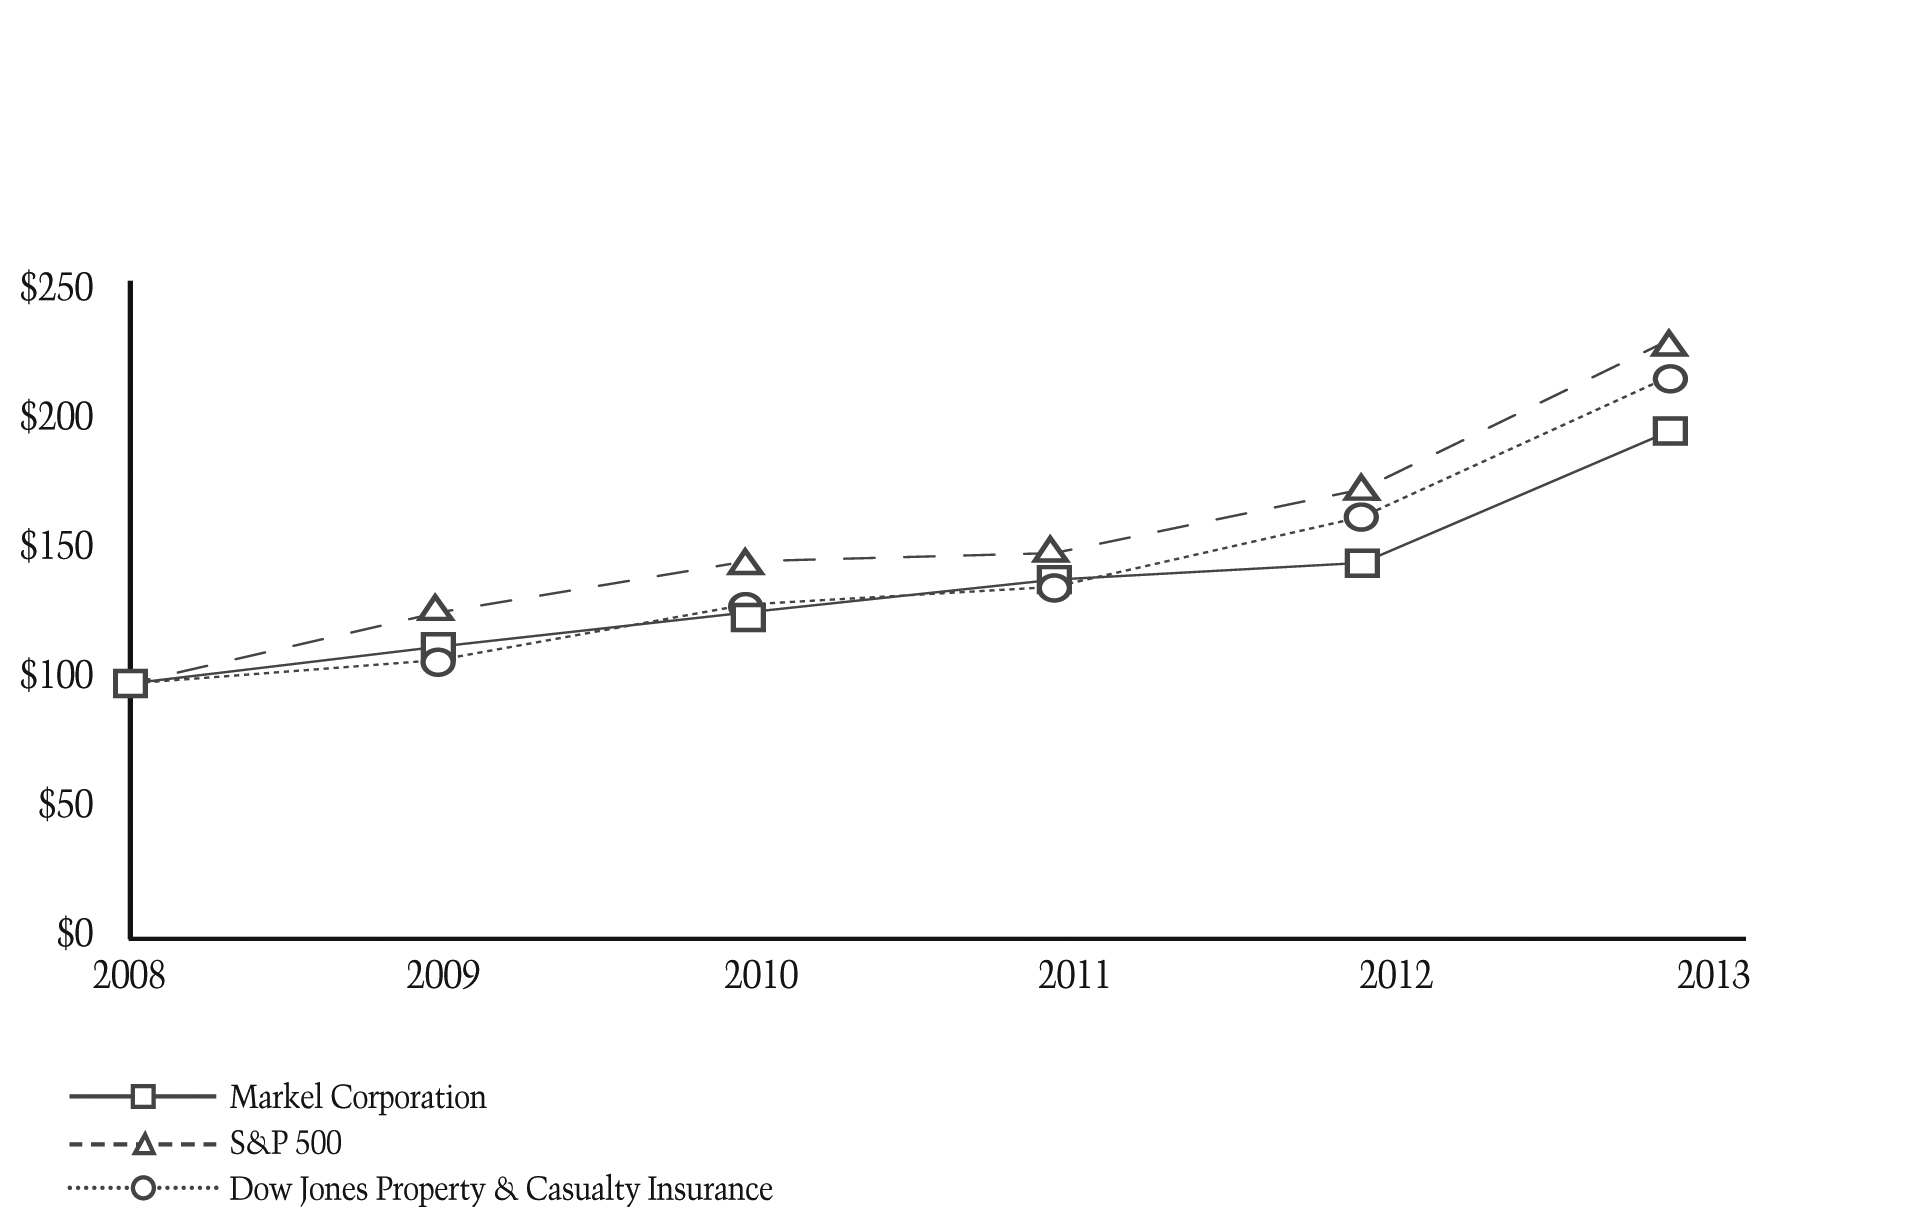
| Years Ended December 31, | |||||||||||||||||||||||
2008 (1) | 2009 | 2010 | 2011 | 2012 | 2013 | ||||||||||||||||||
| Markel Corporation | $ | 100 | $ | 114 | $ | 126 | $ | 139 | $ | 145 | $ | 194 | |||||||||||
| S&P 500 | 100 | 126 | 146 | 149 | 172 | 228 | |||||||||||||||||
| Dow Jones Property & Casualty Insurance | 100 | 109 | 129 | 136 | 162 | 215 | |||||||||||||||||
(1) | $100 invested on December 31, |
| 129
Markel Corporation & Subsidiaries
OTHER INFORMATION (continued)
Common Stock Repurchases
The following table summarizes our common stock repurchases for the quarter ended December 31, 2010.
Issuer Purchases
| (a) | (b) | (c) | (d) | |||||||||||||
Period | Total Number of Shares Purchased | Average Price Paid per Share | Total Numbers of Shares Purchased as Part of Publicly Announced Plans or Programs | Approximate Dollar Value of Shares that May Yet Be Purchased Under the Plans or Programs(1) (in thousands) | ||||||||||||
October 1, 2010 through October 31, 2010 | — | — | — | $ | 21,346 | |||||||||||
November 1, 2010 through November 30, 2010 | 2,225 | $ | 351.97 | 2,225 | $ | 199,217 | ||||||||||
December 1, 2010 through December 31, 2010 | 5,731 | $ | 351.03 | 5,731 | $ | 197,205 | ||||||||||
Total | 7,956 | $ | 351.30 | 7,956 | $ | 197,205 | ||||||||||
|
130 |
Contents
(718) 921-8124
12, 2014.
| 131
Markel Corporation & Subsidiaries
78. 72. 65. 52. 50. 61. 51. 47. Executive OfficersAlan I. KirshnerChairman of the Board and Chief Executive Officer since 1986. Director since 1978. Age 75.Anthony F. MarkelVice Chairman since May 2008. President and Chief Operating Officer from March 1992 to May 2008. Director since 1978. Age 69.Steven A. MarkelVice Chairman since March 1992. Director since 1978. Age 62.F. Michael CrowleyPresident and Co-Chief Operating Officer since May 2010. President, Markel Specialty from February 2009 to May 2010. President of Willis HRH North America from October 2008 to January 2009. President of Hilb Rogal &Hobbs Company from September 2005 to October 2008. Age 59.62.Thomas S. GaynerPresident and Chief Investment Officer since May 2010. Chief Investment Officer since January 2001. President, Markel-Gayner Asset Management Corporation, a subsidiary, since December 1990. Director from 1998 to 2004. Age 49.Richard R. Whitt, IIIPresident and Co-Chief Operating Officer since May 2010. Senior Vice President and Chief Financial Officer from May 2005 to May 2010. Age 47.Gerard Albanese, Jr.Executive Vice President and Chief Underwriting Officer since May 2010. Chief Underwriting Officer fromsince January 2009 to May 2010.2009. President and Chief Operating Officer, Markel International Limited, a subsidiary, from September 2003 to August 2008. Age 58.Britton L. GlissonChief Administrative Officer since February 2009. President, Markel Insurance Company, a subsidiary, from October 1996 to March 2009. Age 54.John K. LathamPresident, Wholesale Operations since November 2010. Managing Director, Wholesale Regional Operations from January 2010 to November 2010. President, Markel Southeast since November 2008. Senior57.Bradley J. KiscadenExecutive Vice President Business Development from January 2007 to May 2009.and Chief InformationActuarial Officer from February 2004 to January 2007.since July 2012. Chief Actuarial Officer since March 1999. Age 64.Anne G. WaleskiVice President and Chief Financial Officer and Treasurer since May 2010. Treasurer from August 2003 to May 2010.November 2011. Age 44.132 |129Index to ExhibitsEXHIBIT INDEXExhibit No. Document Description 2.1 Agreement and Plan of Merger, dated as of December 18, 2012, by and among Alterra Capital Holdings Limited, Markel Corporation and Commonwealth Merger Subsidiary Limited (2.1)a3(i) Amended and Restated Articles of Incorporation as amended (3(i))a(3.1)b3(ii) Bylaws, as amended (3.1)bc4(i)4.1 Form of Amended and Restated Credit Agreement dated as of June 9, 2010September 23, 2011 among Markel Corporation, the lenders party thereto and SunTrust Bank, as Administrative Agent (4(i))c(4.1)d4.2 Form of Consent dated as of June 25, 2012 regarding Amended and Restated Credit Agreement dated as of September 23, 2011 among Markel Corporation, the lenders party thereto and SunTrust Bank, as Administrative Agent (4.2)e4.3 Form of First Amendment to the Amended and Restated Credit Agreement dated as of February 28, 2013 among Markel Corporation, the lenders party thereto and SunTrust Bank, as Administrative Agent (4.3)f4.4 Form of Second Amendment to the Amended and Restated Credit Agreement dated as of July 12, 2013 among Markel Corporation, the lenders party thereto and SunTrust Bank, as Administrative Agent (10.2)g4.5 Credit agreement, dated as of December 16, 2011, among Alterra Capital Holdings Limited, Alterra Bermuda Limited (n/k/a Markel Bermuda Limited), the lenders parties thereto and Bank of America, N.A., as Administrative Agent (4.5)h4.6 Amendment No.1 dated as of February 7, 2013, to the Credit Agreement among Alterra Capital Holdings Limited, Alterra Bermuda Limited (n/k/a Markel Bermuda Limited), the lenders parties thereto and Bank of America, N.A., as Administrative Agent (4.6)h4.7 Indenture dated as of June 5, 2001 between Markel Corporation and The Chase Manhattan Bank, as Trustee (4.1)i4.8 Form of Third Supplemental Indenture dated as of August 13, 2004 between Markel Corporation and JPMorgan Chase Bank (formerly known as The Chase Manhattan Bank), as Trustee, including form of the securities as Exhibit A (4.2)j4.9 Form of Fifth Supplemental Indenture dated as of September 22, 2009 between Markel Corporation and The Bank of New York Mellon (as successor to The Chase Manhattan Bank), as Trustee, including form of the securities as Exhibit A (4.2)k4.10 Form of Sixth Supplemental Indenture dated as of June 1, 2011 between Markel Corporation and The Bank of New York Mellon (as successor to The Chase Manhattan Bank), as Trustee, including form of the securities as Exhibit A (4.2)l4.11 Form of Seventh Supplemental Indenture dated as of July 2, 2012 between Markel Corporation and The Bank of New York Mellon (as successor to The Chase Manhattan Bank), as Trustee, including form of the securities as Exhibit A (4.2)m4.12 Form of Eighth Supplemental Indenture dated as of March 8, 2013 between Markel Corporation and The Bank of New York Mellon (as successor to The Chase Manhattan Bank), as Trustee, including form of the securities as Exhibit A (4.2)n4.13 Form of Ninth Supplemental Indenture dated as of March 8, 2013 between Markel Corporation and The Bank of New York Mellon (as successor to The Chase Manhattan Bank), as Trustee, including form of the securities as Exhibit A (4.3)n4.14 Indenture dated as of September 1, 2010, among Alterra Finance LLC, Alterra Capital Holdings Limited and The Bank of New York Mellon, as Trustee (4.14)h4.15 Form of First Supplemental Indenture, dated as of September 27, 2010 between Alterra Finance LLC, Alterra Capital Holdings Limited and The Bank of New York Mellon, as Trustee, including the form of the securities as Exhibit A (4.15)hThe registrant hereby agrees to furnish to the Securities and Exchange Commission a copy of all instruments defining the rights of holders of long-term debt of the registrant andregistrant's subsidiaries shown on the Consolidated Balance Sheet of the registrant at December 31, 2010,2013, and the respective Notes thereto, included in this Annual Report on Form10-K.Management Contracts or Compensatory Plans required to be filed (Items 10.1–10.20)130Exhibit No. Document Description 10.1 Markel Corporation 2012 Equity Incentive Compensation Plan (Appendix A)o10.2 Form of Amended and Restated Employment Agreement with Alan I. Kirshner (10.2)dp10.2 10.3 Form of Amended and Restated Employment Agreement with Steven A. Markel (10.3)dp10.3 10.4 Form of Amended and Restated Employment Agreement with Anthony F. Markel (10.4)dp10.4 10.5 Form of Executive Employment Agreement with F. Michael Crowley, Thomas S. Gayner, Richard R. Whitt, III, Gerard Albanese, Jr., Britton L. Glisson, John K. Latham and Anne G. Waleski and Bradley J. Kiscaden (10.5)dp10.5 Schedule of Base Salaries for Executive Officers (10.1)e10.6 Schedule of Base Annual Salaries for Executive Officers effective May 1, 2013 and Restricted Stock Units awarded on May 13, 2013 (10.1)h10.7 Markel Corporation Executive Bonus Plan (10.3)fq10.7 10.8 Description of Awards Under Executive Bonus Plan**Plan and 2012 Equity Incentive Compensation Plan for 2013 (10.1)f10.8 10.9 Employee Stock Purchase and Bonus Plan (10.9)dp10.9 10.10 Markel Corporation Omnibus Incentive Plan (Appendix B)gr10.10 10.11 Form of Restricted Stock Award Agreement for Outside Directors (10.1)h(10.2)s10.11 10.12 Form of Restricted Stock Unit Award Agreement for Executive Officers (10.1)iunder the Markel Corporation Omnibus Incentive Plan(10.1)t10.12 Form of Restricted Stock Unit 2006 Supplemental Award for Executive Officers (10.1)j10.13 Form of Restricted Stock Unit Award Agreement for F. Michael CrowleyExecutive Officers under the Markel Corporation 2012 Equity Incentive Compensation Plan (10.1)ku10.14 Form of 2009 Restricted Stock Unit Award Agreement for Executive Officers (10.2)kv10.15 Form of 2010 Restricted Stock Unit Award Agreement for Executive Officers (revised 2010) (10.2)lw10.16 Form of Amended and Restated May 2010 Restricted Stock Unit Award Agreement for Executive Officers (10.1)mx10.17 May 2010 Restricted Stock Units Deferral Election Form (10.2)mx10.18 Description of Permitted Acceleration of Vesting Date of Restricted Stock Units by Up to Thirty Days (10.2)hy10.19 DescriptionForm of Non-Employee Director Compensation**May 2011 Restricted Stock Unit Award Agreement for Anne Waleski (10.1)b10.20 Description of Non-Employee Director Compensation z10.21 Aspen Holdings, Inc. Amended and Restated 2008 Stock Option Plan (99.1)naa10.22 Form of Time Based Restricted Stock Unit Award Agreement for Executive Officers for the 2012 Equity Incentive Compensation Plan (10.22)ab10.23 Form of Performance Based Restricted Stock Unit Award Agreement for Executive Officers for the 2012 Equity Incentive Compensation Plan (10.23)ab10.24 Restricted Stock Units Deferral Election Form for the 2012 Equity Incentive Compensation Plan (10.24)ab10.25 Alterra Capital Holdings Limited 2008 Stock Incentive Plan (99.1)ac10.26 Alterra Capital Holdings Limited 2006 Equity Incentive Plan (99.2)ac10.27 Alterra Capital Holdings Limited 2000 Stock Incentive Plan (99.3)ac10.28 Joinder Agreement, dated July 12, 2013, by and among Markel Corporation, JPMorgan Chase Bank, N.A. and SunTrust Bank, as Administrative Agent (10.1)g21 Certain Subsidiaries of Markel Corporation** 23 Consent of independent registered public accounting firm to incorporation by reference of certain reports into the Registrant’s Registration Statements on Forms S-8 and S-3*KPMG LLP**31.1 Certification of Principal Executive Officer Pursuant to Rule 13a-14(a)/ 15d-14(a)** 13131.2 Certification of Principal Financial Officer Pursuant to Rule 13a-14(a)/ 15d-14(a)** 32.1 Certification of Principal Executive Officer furnished Pursuant to 18 U.S.C. Section 1350** 32.2 Certification of Principal Financial Officer furnished Pursuant to 18 U.S.C. Section 1350** 101 The following consolidated financial statements from Markel Corporation’sCorporation's Annual Report on Form 10-K for the year ended December 31, 2010,2013, filed on February 28, 2011,2014, formatted in XBRL: (i) Consolidated Balance Sheets, (ii) Consolidated Statements of OperationsIncome and Comprehensive Income, (Loss), (iii) Consolidated Statements of Changes in Equity, (iv) Consolidated Statements of Cash Flows and (v) Notes to Consolidated Financial Statements, tagged as blocks of text.Statements.**# Markel agrees to furnish supplementally a copy of any omitted exhibits or schedules to the SEC upon request.** Filed with this report**filed with this reporta. Incorporated by reference from the Exhibit shown in parentheses filed with the Commission in the Registrant’sRegistrant's report on Form 10-Q for the quarter ended March 31, 2000.8-K filed on December 19, 2012.b. Incorporated by reference from the Exhibit shown in parentheses filed with the Commission in the Registrant’sRegistrant's report on Form 8-K filed on May 14, 2010.13, 2011.c. Incorporated by reference from the Exhibit shown in parentheses filed with the Commission in the Registrant’sRegistrant's report on Form 10-Q for the quarter ended June 30, 2010.8-K filed on November 18, 2011.d. Incorporated by reference from the Exhibit shown in parentheses filed with the Commission in the Registrant’sRegistrant's report on Form 10-K10-Q for the yearquarter ended December 31, 2008.September 30, 2011.e. Incorporated by reference from the Exhibit shown in parentheses filed with the Commission in the Registrant’sRegistrant's report on Form 10-Q for the quarter ended SeptemberJune 30, 2010.2012.f. Incorporated by reference from the Exhibit shown in parentheses filed with the Commission in the Registrant’sRegistrant's report on Form 8-K filed on May 27, 2005.10-Q for the quarter ended March 31, 2013.g. Incorporated by reference from the AppendixExhibit shown in parentheses filed with the Commission in the Registrant’s Proxy Statement and Definitive 14ARegistrant's report on Form 8-K filed April 2, 2003.on July 15, 2013.h. Incorporated by reference from the Exhibit shown in parentheses filed with the Commission in the Registrant’sRegistrant's report on Form 10-Q for the quarter ended SeptemberJune 30, 2008.2013.i. Incorporated by reference from the Exhibit shown in parentheses filed with the Commission in the Registrant’sRegistrant's report on Form 8-K filed on March 3, 2008.June 5, 2001.j. Incorporated by reference from the Exhibit shown in parentheses filed with the Commission in the Registrant’sRegistrant's report on Form 8-K filed on July 24, 2006.August 11, 2004.k. Incorporated by reference from the Exhibit shown in parentheses filed with the Commission in the Registrant’sRegistrant's report on Form 10-Q for the quarter ended March 31,8-K filed on September 21, 2009.l. Incorporated by reference from the Exhibit shown in parentheses filed with the Commission in the Registrant’sRegistrant's report on Form 10-Q for the quarter ended March8-K filed on May 31, 2010.2011.m. Incorporated by reference from the Exhibit shown in parentheses filed with the Commission in the Registrant’sRegistrant's report on Form 10-Q for the quarter ended8-K filed on June 30, 2010.29, 2012.n. Incorporated by reference from the Exhibit shown in parentheses filed with the Commission in the Registrant’sRegistrant's report on Form 8-K filed on March 7, 2013.o. Incorporated by reference from the Appendix shown in parentheses filed with the Commission in the Registrant's Proxy Statement and Definitive 14A filed March 16, 2012. p. Incorporated by reference from the Exhibit shown in parentheses filed with the Commission in the Registrant's report on Form 10-K for the year ended December 31, 2008. q. Incorporated by reference from the Exhibit shown in parentheses filed with the Commission in the Registrant's report on Form 8-K filed on May 27, 2005. r. Incorporated by reference from the Appendix shown in parentheses filed with the Commission in the Registrant's Proxy Statement and Definitive 14A filed April 2, 2003. s. Incorporated by reference from the Exhibit shown in parentheses filed with the Commission in the Registrant's report on Form 10-Q for the quarter ended June 30, 2012. t. Incorporated by reference from the Exhibit shown in parentheses filed with the Commission in the Registrant's report on Form 8-K filed on March 3, 2008. u. Incorporated by reference from the Exhibit shown in parentheses filed with the Commission in the Registrant's report on Form 8-K filed on May 17, 2013. v. Incorporated by reference from the Exhibit shown in parentheses filed with the Commission in the Registrant's report on Form 10-Q for the quarter ended March 31, 2009. 132w. Incorporated by reference from the Exhibit shown in parentheses filed with the Commission in the Registrant's report on Form 10-Q for the quarter ended March 31, 2010. x. Incorporated by reference from the Exhibit shown in parentheses filed with the Commission in the Registrant's report on Form 10-Q for the quarter ended June 30, 2010. y. Incorporated by reference from the Exhibit shown in parentheses filed with the Commission in the Registrant's report on Form 10-Q for the quarter ended September 30, 2008. z. Incorporated by reference from Item 5.02 filed with the Commission in the Registrant's report on Form 8-K filed on May 17, 2013. aa. Incorporated by reference from the Exhibit shown in parentheses filed with the Commission in the Registrant's Registration Statement on Form S-8 (Reg. No. 333-170047).
| ab. | Incorporated by reference from the Exhibit shown in parentheses filed with the Commission in the Registrant's report on Form 10-K for the year ended December 31, 2012. |
| ac. | Incorporated by reference from the Exhibit shown in parentheses filed with the Commission in the Registrant's Registration Statement on Form S-8 (Reg. No. 333-188294). |
/s/ Steven A. Markel Signatures Title /s/ Alan I. Kirshner /s/ Anthony F. Markel /s/ Steven A. Markel /s/ Anne G. Waleski /s/ Nora N. Crouch /s/ J. Alfred Broaddus, Jr. K. Bruce Connell /s/ Stewart M. Kasen /s/ Lemuel E. Lewis /s/ Darrell D. Martin Michael O'Reilly /s/ Debora J. WilsonSIGNATURESPursuant to the requirements of Section 13 or 15(d) of the Securities Exchange Act of 1934, the registrant has duly caused this report to be signed on its behalf by the undersigned, thereunto duly authorized.MARKEL CORPORATION By: Steven A. Markel Vice Chairman February 28, 20112014Pursuant to the requirements of the Securities Exchange Act of 1934, this report has been signed below by the following persons on behalf of the registrant and in the capacities and on the dates indicated. Date Date Chief Executive Officer and Chairman of the Board of Directors and February 28, 20112014Alan I. Kirshner Chief Executive Officer Director February 28, 20112014Anthony F. Markel Director February 28, 20112014Steven A. Markel Vice President and Chief Financial Officer and Treasurer (Principal Financial Officer)February 28, 20112014Anne G. Waleski (Principal Financial Officer) Controller and Chief Accounting Officer (Principal Accounting Officer)February 28, 20112014Nora N. Crouch (Principal Accounting Officer) Director February 28, 20112014J. Alfred Broaddus, Jr. /s/ K. Bruce Connell Director February 28, 2014 /s/ Douglas C. Eby Director February 28, 20112014Douglas C. Eby Director February 28, 20112014Stewart M. Kasen Director February 28, 20112014Lemuel E. Lewis Director February 28, 20112014Darrell D. Martin /s/ Michael O'Reilly Director February 28, 2014 /s/ Jay M. Weinberg Director February 28, 20112014Jay M. Weinberg Director February 28, 20112014Debora J. Wilson 134

