
UNITED STATES
SECURITIES AND EXCHANGE COMMISSION
WASHINGTON, DC 20549
FORM 10-K
| x | ANNUAL REPORT PURSUANT TO SECTION 13 OR 15(d) OF THE SECURITIES EXCHANGE ACT OF 1934 |
For the fiscal year ended December 31, 20102011
OR
| ¨ | TRANSITION REPORT PURSUANT TO SECTION 13 OR 15(d) OF THE SECURITIES EXCHANGE ACT OF 1934 |
For the transition period fromto
O’REILLY AUTOMOTIVE, INC.
(Exact name of registrant as specified in its charter)
| Missouri | 000-21318 | 27-4358837 | ||
(State or other jurisdiction of incorporation or organization) | Commission file number | (IRS Employer Identification No.) |
233 South Patterson
Springfield, Missouri 65802
(Address of principal executive offices, zip code)
(417) 862-6708
(Registrant’s telephone number, including area code)
Securities registered pursuant to Section 12(b) of the Act:
Title of Each Class | Name of Each Exchange on which Registered | |
| Common Stock, $0.01 par value | The NASDAQ Stock Market LLC | |
(NASDAQ Global Select Market) |
Securities registered pursuant to Section 12(g) of the Act:
None
Indicate by check mark if the registrant is a well-known seasoned issuer, as defined in Rule 405 of the Securities Act. Yes x No ¨
Indicate by check mark if the registrant is not required to file reports pursuant to Section 13 or Section 15(d) of the Act. Yes ¨ No x
Note – Checking the box above will not relieve any registrant required to file reports pursuant to Section 13 or 15(d) of the Exchange Act from their obligations under those Sections.
Indicate by check mark whether the registrant (1) has filed all reports required to be filed by Section 13 or 15(d) of the Securities Exchange Act of 1934 during the preceding 12 months (or for such shorter period that the registrant was required to file such reports), and (2) has been subject to such filing requirements for the past 90 days. Yes x No ¨
Indicate by check mark whether the registrant has submitted electronically and posted on its corporate Web site, if any, every Interactive Data File required to be submitted and posted pursuant to Rule 405 of Regulation S-T during the preceding 12 months (or for such shorter period that the registrant was required to submit and post such files). Yes x No ¨
Indicate by checkmark if disclosure of delinquent filers pursuant to Item 405 of Regulation S-K is not contained here, and will not be contained, to the best of the registrant’s knowledge, in definitive proxy or information statements incorporated by reference in Part III of this Form 10-K or any amendment to this Form 10-K. ¨
Indicate by checkmark whether the registrant is a large accelerated filer, an accelerated filer or a non-accelerated filer. See definition of “accelerated filer and large accelerated filer” in Rule 12b-2 of the Exchange Act.
| Large Accelerated Filer | x | Accelerated Filer | ¨ | |||
| Non-Accelerated Filer | ¨ | Smaller Reporting Company | ¨ | |||
Indicate by checkmark whether the registrant is a shell company (as defined in Rule 12b-2 of the Exchange Act). Yes ¨ No x
At February 21, 2011,20, 2012, an aggregate of 141,128,889127,315,291 shares of the common stock of the registrant was outstanding. As of that date, the aggregate market value of the voting stock held by non-affiliates of the Company was approximately $7,797,371,117$10,764,507,854 based on the last sale price of the common stock reported by The NASDAQ Global Select Market.
At June 30, 2010,2011, an aggregate of 138,670,036135,955,214 shares of the common stock of the registrant was outstanding. As of that date, the aggregate market value of the voting stock held by non-affiliates of the Company was approximately $6,595,146,912$8,906,426,069 based on the last sale price of the common stock reported by The NASDAQ Global Select Market.
DOCUMENTS INCORPORATED BY REFERENCE
As indicated below, portions of the registrant’s documents specified below are incorporated here by reference:
Document | Form 10-K Part | |
| Proxy Statement for | Part III | |
Form 10-K
For the Year Ended December 31, 20102011
| Page | ||||||
| PART I | ||||||
| Item 1. | 3 | |||||
| Item 1A. | 14 | |||||
| Item 1B. | 17 | |||||
| Item 2. | 18 | |||||
| Item 3. | 19 | |||||
| Item 4. | 20 | |||||
| PART II | ||||||
| Item 5. | 21 | |||||
| Item 6. | 22 | |||||
| Item 7. | Management’s Discussion and Analysis of Financial Condition and Results of Operations | |||||
| Item 7A. | 41 | |||||
| Item 8. | 42 | |||||
| Item 9. | Changes in and Disagreements with Accountants on Accounting and Financial Disclosure | |||||
| Item 9A. | ||||||
| Item 9B. | ||||||
| PART III | ||||||
| Item 10. | ||||||
| Item 11. | ||||||
| Item 12. | ||||||
| Item 13. | Certain Relationships and Related Transactions, and Director Independence | |||||
| Item 14. | ||||||
| PART IV | ||||||
| Item 15. | ||||||
Forward Looking InformationForward-Looking Statements
We claim the protection of the safe-harbor for forward-looking statements within the meaning of the Private Securities Litigation Reform Act of 1995. You can identify these statements by forward-looking words such as “expect,” “believe,” “anticipate,” “should,” “plan,” “intend,” “estimate,” “project,” “will” or similar words. In addition, statements contained within this annual report that are not historical facts are forward-looking statements, such as statements discussing among other things, expected growth, store development, CSK Auto Corporation (“CSK”) Department of Justice (“DOJ”) investigation resolution, integration and expansion strategy, business strategies, future revenues and future performance. These forward-looking statements are based on estimates, projections, beliefs and assumptions and are not guarantees of future events and results. Such statements are subject to risks, uncertainties and assumptions, including, but not limited to, competition, product demand, the market for auto parts, the economy in general, inflation, consumer debt levels, governmental approvals,regulations, our increased debt levels, credit ratings on public debt, our ability to hire and retain qualified employees, risks associated with the integrationperformance of acquired businesses including the acquisition and integration ofsuch as CSK Auto Corporation, weather, terrorist activities, war and the threat of war. Actual results may materially differ from anticipated results described or implied in these forward-looking statements. Please refer to the “Risk Factors” section of this annual report on Form 10-K for the year ended December 31, 2010,2011, for additional factors that could materially affect our financial performance. We undertake no obligation to publicly update any forward-looking statements, whether as a result of new information, future events or otherwise.
PART I
| Item 1. | Business |
IntroductionGENERAL INFORMATION
O’Reilly Automotive, Inc. and its subsidiaries, collectively “we”, “O’Reilly” or the “Company”, is one of the largest specialty retailers of automotive aftermarket parts, tools, supplies, equipment and accessories in the United States, selling our products to both do-it-yourself (“DIY”) customers and professional service providers.providers, our “dual market strategy”. O’Reilly Automotive, Inc. was incorporated in 1957 as a corporation, and was founded by Charles F. O’Reilly and his son, Charles H. “Chub” O’Reilly, Sr. and initially operated from a single store in Springfield, Missouri. The Company’sOur common stock has traded on The NASDAQ Global Select Market under the symbol “ORLY” since April 22, 1993.
On December 29, 2010, we completed a corporate reorganization creating a holding company structure, (the “Reorganization”). The Reorganizationwhich was implemented through an agreement and plan of merger under Section 351.448 of The General Corporation Law of the State of Missouri, which did not require a vote of the shareholders. As a result of the Reorganization,this reorganization, the previous parent company and registrant, O’Reilly Automotive, Inc., was renamed O’Reilly Automotive Stores, Inc. (“Old O’Reilly”) and is now a wholly ownedwholly-owned subsidiary of the new parent company and registrant, which was renamed O’Reilly Automotive, Inc. In the Reorganization, each issued and outstanding share of common stock of Old O’Reilly
On July 11, 2008, we completed our most recent acquisition, CSK Auto Corporation (“CSK”), which was converted into a share of common stockone of the Company, withlargest specialty retailers of auto parts and accessories in the same designations, rights, qualifications, powers, preferences, qualifications, limitationsWestern United States and restrictions, and without any action being required on the part of holders of shares of Old O’Reilly common stock or any exchange of stock certificates. Sharesone of the Company’s common stock were substituted forlargest such retailers in the sharesUnited States, based on store count at the date of common stockacquisition. At the date of Old O’Reilly listed onthe acquisition, CSK had 1,342 stores in 22 states, operating under four brand names: Checker Auto Parts, Schuck’s Auto Supply, Kragen Auto Parts and Murray’s Discount Auto Parts. The NASDAQ Global Select Market and continue to trade underresults of CSK’s operations have been included in our consolidated financial statements since the same “ORLY” symbol but with a new CUSIP Number (67103H 107).acquisition date.
At December 31, 2010,2011, we operated 3,5703,740 stores in 3839 states. Our stores carry an extensive product line, including the products bulletedidentified below:
new and remanufactured automotive hard parts, such as alternators, starters, fuel pumps, water pumps, brake system components, batteries, belts, hoses, temperature control, chassis parts and engine parts;
maintenance items, such as oil, antifreeze, fluids, filters, wiper blades, lighting, engine additives and appearance products; and
accessories, such as floor mats, seat covers and truck accessories.
Many of ourOur stores offer many enhanced services and programs to our customers, includingsuch as those bulletedidentified below:
used oil and battery recycling
battery diagnostic testing
electrical and module testing
loaner tool program
drum and rotor resurfacing
custom hydraulic hoses
professional paint shop mixing and related materials
machine shops
On July 11, 2008, the Company completed the acquisition of CSK Auto Corporation (“CSK”), which was one of the largest specialty retailers of auto parts and accessories in the Western United States and one of the largest such retailers in the United States, based on
store count at the date of acquisition. To fund the transaction, we entered into a Credit Agreement (“ABL Credit Agreement”) on the acquisition date for a $1.2 billion asset-based revolving credit facility (the “Credit Facility”) arranged by Bank of America, N.A. (“BA”), which we used to refinance debt, fund the cash portion of the acquisition, pay for other transaction-related expenses and provide liquidity for the combined company going forward. The results of CSK’s operations have been included in our consolidated financial statements since the acquisition date.
At the date of the acquisition, CSK had 1,342 stores in 22 states, operating under four brand names: Checker Auto Parts, Schuck’s Auto Supply, Kragen Auto Parts and Murray’s Discount Auto Parts. This acquisition added stores in twelve new states: Alaska, Arizona, California, Colorado, Hawaii, Idaho, Michigan, Nevada, New Mexico, Oregon, Utah and Washington, and a number of new markets in states where O’Reilly had a presence prior to the acquisition. The integration of CSK has focused on the implementation of our dual market strategy, the ability to effectively serve both DIY customers and professional service providers, which required conversion of store and distribution information systems, enhancements to the distribution infrastructure, inventory offerings and the infusion of the O’Reilly culture into the acquired CSK stores. Conversion of all CSK stores to the O’Reilly systems began in October of 2008 and concluded in November of 2010. Store décor and graphic package changeovers will be completed in all CSK stores by the end of the second quarter of 2011. In order to implement our proven dual market strategy throughout the CSK store network, we added distribution centers (“DC”) in Seattle, Washington, in November of 2009; Moreno Valley, California, in January of 2010; Denver, Colorado, in March of 2010; and Salt Lake City, Utah, in May of 2010. We also relocated an existing CSK DC in Dixon, California, to a larger DC in Stockton, California, and converted two existing CSK DCs, one in Detroit, Michigan, and one in Phoenix, Arizona, to the O’Reilly systems. As of December 31, 2010, we had converted all CSK stores to O’Reilly systems, merged 41 CSK stores with existing O’Reilly locations, closed 17 CSK stores and opened five new stores in CSK historical markets.
See “Risk Factors” beginning on page 14 for a description of certain risks relevant to our business. These risk factors include, among others, risks related to our growth strategy,deteriorating economic conditions, the integrationperformance of the acquired CSK stores, increased debt levels, our acquisition strategies, competition in the automotive aftermarket business, our dependence upon key and other personnel, future growth assurance, our sensitivity to regional economic and weather conditions, legal proceedings and related matters arising from CSK, the effect of sales of shares of our common stock eligible for future sale, unanticipated fluctuations in our quarterly results, the volatility of the market price of our common stock, our relationships with key vendors and availability of key products, a downgrade in our credit ratings, complications in our DCs, deteriorating economic conditions, downgrade in credit ratingdistribution centers (“DC”s), and environmental legislation and regulations.
Our BusinessOUR BUSINESS
Our goal is to continue to achieve growth in sales and profitability by capitalizing on our competitive advantages and executing our growth strategy. We remain confident in our ability to continue to gain market share in our existing markets and grow our business in new markets by focusing on our dual market strategy and the core O’Reilly values of customer service and expense control. Our intent is to be the dominant auto parts provider in all the markets we serve, by providing superior customer service and significant value to both DIY and professional service providers and DIYprovider customers.
Competitive Advantages
We believe our effective dual market strategy, superior customer service, strategic distribution systems and experienced management team make up our key competitive advantages that cannot be easily duplicated.
Proven Ability to Execute a Dual Market StrategyStrategy: - We
Over the past 30 years, we have an established a track record of effectively serving, at a high level, both DIY customers and professional service providers. We believe our proven ability to effectively execute a dual market strategy is a unique competitive advantage. The execution of this strategy enables us to better compete by targeting a larger base of consumers of automotive aftermarket parts, by capitalizing on our existing retail and distribution infrastructure, by operating profitably in both large markets and less densely populated geographic areas that typically attract fewer competitors, as well as byand enhancing service levels offered to DIY customers through the offering of a broad inventory and the extensive product knowledge required by professional service providers.
We have been committed to our dual market strategy for over 30 years. In 2010,2011, we derived approximately 62%59% of our sales from our DIY customers and approximately 38%41% of our sales from our professional service provider customers. We have historicallyPrior to the acquisition of CSK, we derived approximately 50% of our sales from both our DIY and professional service provider customers, and ascustomers. As we continue to grow our commercial business in the acquired CSK stores,markets, we would expect that over time our DIY and professional service provider sales mix to approximate historical averages. As a result of our historical success of executing our dual market strategy and our over 450460 full-time sales staff dedicated solely to calling upon and servicing the professional service provider, we believe we will continue to increase our sales to professional service providers and will continue to have a competitive advantage over our retail competitors who continue to derive a high concentration of their sales from the DIY market. We have a tremendous opportunity to build on the strong retail base at the acquired CSK stores by growing the commercial business through the implementation of our dual market strategy and capitalizing on our other competitive advantages.
Superior Customer ServiceService: -
We seek to attract new DIY and professional service provider customers and to retain existing customers by offering superior customer service, the key elements of which are bulletedidentified below:
superior in-store service through highly-motivated, technically-proficient store personnel (“Professional Parts People”) using an advanced point-of-sale system;system
an extensive selection and availability of products;products
attractive stores in convenient locations; andlocations
competitive pricing, supported by a good, better, best product assortment designed to meet all of our customers’ quality and value preferences.preferences
Technically Proficient Professional Parts PeoplePeople: -
Our highly proficienthighly-motivated, technically-proficient Professional Parts People provide us with a significant competitive advantage, particularly over less specialized retail operators. We require our Professional Parts People to undergo extensive and ongoing training and to be technically knowledgeable, particularly with respect to hard parts, in order to better serve the technically-oriented professional service providers with whom they interact on a daily basis. Such technical proficiency also enhances the customer service we provide to our DIY customers who value the expert assistance provided by our Professional Parts People.
Strategic Distribution SystemsSystems: -
We believe our commitment to a robust, regional DC network provides for superior replenishment and access to hard-to-find parts and enables us to optimize product availability and inventory levels throughout our store network. Our inventory management and distribution systems electronically link each of our stores to one or more DCs, providingwhich provides for efficient inventory control and management. Our distribution system provides each ofWe currently operate 23 regional DCs, which provide our stores with same-day or overnight access to an average of 118,000123,000 stock keeping units (“SKUs”)SKU”s), many of which are hard to findhard-to-find items not typically stocked by other auto parts retailers. We believe this timely access to a broad range of products is a key competitive advantage in satisfying customer demand and generating repeat business.
We currently operate 23 DCs, four of which opened in 2010. As these DCs opened, the surrounding CSK stores were converted to the O’Reilly systems and began receiving same-day or overnight access to O’Reilly’s broad range of hard part product offerings.
Experienced Management TeamTeam: -
Our Company philosophy is to “promote from with-in” and the vast majority of our senior management, district managers and store managers have been promoted from with-in the Company. We augment this promote from with-in philosophy by pursuing strategic hires with a strong emphasis on automotive aftermarket experience. We have a strong management team comprised of senior management with 148 professionals who average 17 years of service; 266 corporate managers who average 13 years of service; and 355 district managers who average 12 years of service. Our management team has demonstrated the consistent ability to successfully execute our business plan including the identification and integration of strategic acquisitions. We have experienced eighteengrowth strategy by generating nineteen consecutive years of record revenues and earnings and positive comparable store sales results since becoming a public company in April of 1993. We have a strong senior management team comprised of 146 professionals who average 18 years of service. In addition, our 260 corporate managers average 15 years of service and our 349 district managers average 13 years of service.
Growth Strategy
Aggressively Open New StoresStores: -
We intend to continue to consolidate the fragmented automotive aftermarket. We plan to open approximately 180 new stores to achieve greaterin 2012 increasing our penetration in existing markets and to expandexpanding into new, contiguous markets. We plan to open approximately 170 net new stores in 2011, and theThe sites for these new stores have been identified. Toidentified, and to date, we have not experienced significant difficulties in locating suitable sites for construction of new stores or identifying suitable acquisition targets for conversion to O’Reilly stores. We typically open new stores either by (i) constructing a new facility or renovating an existing one on property we purchase or lease and stocking the new store with fixtures and inventory, (ii) acquiring an independently owned auto parts store, typically by the purchase of substantially all of the inventory and other assets (other than realty) of such store, or (iii) purchasing multi-store chains. New store sites are strategically located in clusters within geographic areas that complement our distribution network in order to achieve economies of scale in management, advertising and distribution. Other key factors we consider in the site selection process include population density and growth patterns, demographic lifestyle segmentation, age and per capita income, vehicle traffic counts, number and type of existing automotive repair facilities, competing auto parts stores within a pre-determined radius, and the operational strength of such competitors.
We target both small and large markets for expansion of our store network. While we have faced, and expect to continue to face, aggressive competition in the more densely populated markets, we believe we have competed effectively, and are well positioned to continue to compete effectively, in such markets and to achieve our goal of continued sales/profit growth within these markets. We also believe that with our dual market strategy, we are better able to operate stores in less densely populated areas, which would not otherwise support a national chain store selling primarily to the retail automotive aftermarket. Consequently, we continue to pursue opening new stores in less densely populated market areas as part of our growth strategy.
Grow Sales in Existing Stores:
Profitable same store sales growth is also an important part of our growth strategy. To achieve improved sales and profitability at existing O’Reilly stores, we continually strive to improve the service provided to our customers. We believe that while competitive pricing is an essential component of successful growth in the automotive aftermarket business, it is customer satisfaction, whether of the DIY consumer or professional service provider, resulting from superior customer service that generates increased sales and profitability.
Selectively Pursue Strategic AcquisitionsAcquisitions: -
Although the automotive aftermarket industry is still highly fragmented, we believe the ability of national retail chains, such as ourselves, to operate more efficiently than smaller independent operators or mass merchandisers will result in continued industry consolidation. Thus, our intention is to continue to selectively pursue acquisition targets that will strengthen our position as a leading automotive aftermarket parts supplier.supplier in existing markets and provide a springboard into new markets.
Continually Enhance Store Design and LocationLocation: -
Our current prototype store design features enhancements such as optimized square footage, higher ceilings, more convenient interior store layouts, improved in-store signage, brighter lighting, increased parking availability and dedicated counters to serve professional service providers, each designed to increase sales and operating efficiencies and enhance customer service. We continually update the location and condition of our store network through systematic renovation and relocation of our existing stores to enhance store performance. We believe that our ability to consistently achieve growth in same store sales is due in part to our commitment to maintaining an attractive store network, which is strategically located to best serve our customers.
Grow Professional Relationships with Professional Service Providers in the Western United StatesStates: -
In order to implement our proven dual market strategy throughout the acquired CSK store network and grow our share of the professional service provider market in those areas, we have added four additional DCs to the Western markets since the CSK acquisition. Our strategically located DCs provide converted CSK stores with same-day or overnight delivery access to an average of 118,000123,000 SKUs and will give these stores an important tool to provide industry-leading customer service to the professional service provider, as well as the DIY customer. In addition, our Professional Parts People receive ongoing training on our product lines, customer service and O’Reilly policies and procedures aimed at building and improving relationships with professional service providers.
The steps we have taken to implement our dual market strategy in the acquired CSK stores have allowed us to begin to capture market share in the Western United States. However, we continue to see significant opportunities to grow our share of the professional service provider business. This growth will be driven by our ability to consistently provide superior customer service and parts availability, proving O’Reilly as a reliable partner and elevating our status as the preferred supplier on the call lists of professional service providers.
Team Members
As of January 31, 2012, we employed 49,148 Team Members (32,700 full-time Team Members and 16,448 part-time Team Members), of whom 41,693 were employed at our stores, 5,917 were employed at our DCs and 1,538 were employed at our corporate and regional offices. A union represents 49 stores (459 Team Members) in the Greater Bay Area in California, and has for many years. In addition, approximately 75 Team Members who drive over-the-road trucks in two of our DCs are represented by a labor union. Except for these Team Members, our Team Members are not represented by labor unions. Our tradition of 55 years has been to treat all of our Team Members with honesty and respect and to commit significant resources to instill in them our “Live Green” Culture, which emphasizes the importance of each Team Member’s contribution to the success of O’Reilly. This focus on professionalism and fairness has created an industry-leading team and we consider our relations with our Team Members to be excellent.
Store Network
Store Locations and Size:
As a result of our dual market strategy, we are able to profitably operate in both large, densely populated markets and small, less densely populated areas that would not otherwise support a national chain selling primarily to the retail automotive aftermarket. Our stores, on average, carry approximately 21,000 SKUs and average approximately 7,100 total square feet in size. At December 31, 2011, we had a total of approximately 27 million square feet in our 3,740 stores. Our stores are served primarily by the nearest DC, which averages 123,000 SKUs, but also have same-day access to the broad selection of inventory available at one of our 192 Hub stores, which, on average, carry approximately 39,000 SKUs and average approximately 10,000 square feet in size.
We believe that our stores are “destination stores” generating their own traffic rather than relying on traffic created by the presence of other stores in the immediate vicinity. Consequently, most of our stores are freestanding buildings and prominent end caps situated on or near major traffic thoroughfares, and offer ample parking, easy customer access and are generally located in close proximity to our professional service provider customers.
The following table sets forth the geographic distribution and activity of our stores as of December 31, 2011 and 2010:
| December 31, 2010 | 2011 Net, New Stores | December 31, 2011 | ||||||||||||||||||||||||||
State | Store Count | % of Total Store Count | Store Change | % of Total Store Change | Store Count | % of Total Store Count | Cumulative % of Total Store Count | |||||||||||||||||||||
Texas | 545 | 15.3 | % | 18 | 10.6 | % | 563 | 15.1 | % | 15.1 | % | |||||||||||||||||
California | 473 | 13.2 | % | 1 | 0.6 | % | 474 | 12.7 | % | 27.7 | % | |||||||||||||||||
Missouri | 180 | 5.0 | % | 1 | 0.6 | % | 181 | 4.8 | % | 32.6 | % | |||||||||||||||||
Georgia | 152 | 4.3 | % | 9 | 5.3 | % | 161 | 4.3 | % | 36.9 | % | |||||||||||||||||
Washington | 139 | 3.9 | % | 2 | 1.2 | % | 141 | 3.8 | % | 40.6 | % | |||||||||||||||||
Illinois | 128 | 3.6 | % | 13 | 7.6 | % | 141 | 3.8 | % | 44.4 | % | |||||||||||||||||
Tennessee | 135 | 3.8 | % | 3 | 1.8 | % | 138 | 3.7 | % | 48.1 | % | |||||||||||||||||
Arizona | 129 | 3.6 | % | (1 | ) | -0.6 | % | 128 | 3.4 | % | 51.5 | % | ||||||||||||||||
North Carolina | 97 | 2.7 | % | 23 | 13.5 | % | 120 | 3.2 | % | 54.7 | % | |||||||||||||||||
Oklahoma | 110 | 3.1 | % | 2 | 1.2 | % | 112 | 3.0 | % | 57.7 | % | |||||||||||||||||
Alabama | 108 | 3.0 | % | 4 | 2.4 | % | 112 | 3.0 | % | 60.7 | % | |||||||||||||||||
Minnesota | 104 | 2.9 | % | 2 | 1.2 | % | 106 | 2.8 | % | 63.6 | % | |||||||||||||||||
Ohio | 79 | 2.2 | % | 22 | 12.9 | % | 101 | 2.7 | % | 66.3 | % | |||||||||||||||||
Arkansas | 97 | 2.7 | % | 2 | 1.2 | % | 99 | 2.6 | % | 68.9 | % | |||||||||||||||||
Michigan | 76 | 2.1 | % | 18 | 10.6 | % | 94 | 2.5 | % | 71.4 | % | |||||||||||||||||
Indiana | 83 | 2.3 | % | 6 | 3.5 | % | 89 | 2.4 | % | 73.8 | % | |||||||||||||||||
Louisiana | 84 | 2.4 | % | 3 | 1.8 | % | 87 | 2.3 | % | 76.1 | % | |||||||||||||||||
Colorado | 87 | 2.4 | % | (3 | ) | -1.8 | % | 84 | 2.2 | % | 78.4 | % | ||||||||||||||||
Wisconsin | 67 | 1.9 | % | 11 | 6.5 | % | 78 | 2.1 | % | 80.5 | % | |||||||||||||||||
Mississippi | 71 | 2.0 | % | — | 0.0 | % | 71 | 1.9 | % | 82.4 | % | |||||||||||||||||
Kansas | 66 | 1.8 | % | 5 | 2.9 | % | 71 | 1.9 | % | 84.3 | % | |||||||||||||||||
Iowa | 66 | 1.8 | % | — | 0.0 | % | 66 | 1.8 | % | 86.0 | % | |||||||||||||||||
Kentucky | 57 | 1.6 | % | 5 | 2.9 | % | 62 | 1.7 | % | 87.7 | % | |||||||||||||||||
South Carolina | 58 | 1.6 | % | 3 | 1.8 | % | 61 | 1.6 | % | 89.3 | % | |||||||||||||||||
Utah | 54 | 1.5 | % | 1 | 0.6 | % | 55 | 1.5 | % | 90.8 | % | |||||||||||||||||
Florida | 42 | 1.2 | % | 4 | 2.4 | % | 46 | 1.2 | % | 92.0 | % | |||||||||||||||||
Nevada | 45 | 1.3 | % | (1 | ) | -0.6 | % | 44 | 1.2 | % | 93.2 | % | ||||||||||||||||
Oregon | 42 | 1.2 | % | 2 | 1.2 | % | 44 | 1.2 | % | 94.4 | % | |||||||||||||||||
New Mexico | 37 | 1.0 | % | 2 | 1.2 | % | 39 | 1.0 | % | 95.4 | % | |||||||||||||||||
Idaho | 31 | 0.9 | % | (1 | ) | -0.6 | % | 30 | 0.8 | % | 96.2 | % | ||||||||||||||||
Nebraska | 29 | 0.8 | % | 1 | 0.6 | % | 30 | 0.8 | % | 97.0 | % | |||||||||||||||||
Virginia | 14 | 0.4 | % | 11 | 6.5 | % | 25 | 0.7 | % | 97.7 | % | |||||||||||||||||
Montana | 23 | 0.6 | % | — | 0.0 | % | 23 | 0.6 | % | 98.3 | % | |||||||||||||||||
Wyoming | 16 | 0.4 | % | — | 0.0 | % | 16 | 0.4 | % | 98.7 | % | |||||||||||||||||
North Dakota | 13 | 0.4 | % | — | 0.0 | % | 13 | 0.3 | % | 99.1 | % | |||||||||||||||||
Alaska | 11 | 0.3 | % | 1 | 0.6 | % | 12 | 0.3 | % | 99.4 | % | |||||||||||||||||
Hawaii | 11 | 0.3 | % | — | 0.0 | % | 11 | 0.3 | % | 99.7 | % | |||||||||||||||||
South Dakota | 11 | 0.3 | % | — | 0.0 | % | 11 | 0.3 | % | 100.0 | % | |||||||||||||||||
West Virginia | — | 0.0 | % | 1 | 0.6 | % | 1 | 0.0 | % | 100.0 | % | |||||||||||||||||
|
|
|
|
|
|
|
|
|
|
|
| |||||||||||||||||
Total | 3,570 | 100.0 | % | 170 | 100.0 | % | 3,740 | 100.0 | % | |||||||||||||||||||
|
|
|
|
|
|
|
|
|
|
|
| |||||||||||||||||
Store Layout:
We utilize a computer-assisted store layout system to provide a uniform and consistent retail merchandise presentation and customize our hard-parts inventory assortment to meet the specific needs of a particular market area. Front room merchandise is arranged to provide easy customer access, maximum selling space and to prominently display high-turnover products and accessories to customers. To ensure the best customer experience possible, we have selectively implemented bilingual in-store signage based on the demographics in each store’s geographic area. Aisle displays and end caps are used to feature high-demand or seasonal merchandise, new items and advertised specials.
Store Automation:
To enhance store-level operations, customer service and reliability, we use Linux servers and IBM I-Series computer systems in our stores. These systems are linked with the I-Series computers located in each of our DCs. Our point-of-sale terminals provide immediate access to our electronic catalog to graphically display parts and pricing information by make, model and year of vehicle and use barcode scanning technology to price our merchandise. This system speeds transaction times, reduces the customer’s checkout time, ensures accuracy and provides enhanced customer service. Moreover, our store automation systems capture detailed sales information which assists in store management, strategic planning, inventory control and distribution efficiency.
New Store Site Selection:
In selecting sites for new stores, we seek to strategically locate store sites in clusters within geographic areas in order to achieve economies of scale in management, advertising and distribution. Other key factors we consider in the site selection process are identified below:
population density;
demographics including age, ethnicity, life style and per capita income;
market economic strength, retail draw and growth patterns;
number, age and percent of luxury makes of registered vehicles;
the number, type and sales potential of existing automotive repair facilities;
the number of auto parts stores and other competitors within a predetermined radius and the operational strength of such competitors;
physical location, traffic count, size, economics and presentation of the site;
financial review of adjacent existing locations; and
the type and size of store that should be developed.
When entering new, more densely populated markets, we generally seek to initially open several stores within a short span of time in order to maximize the effect of initial promotional programs and achieve economies of scale. After opening this initial cluster of new stores, we seek to begin penetrating the less densely populated surrounding areas. This strategy enables us to achieve additional distribution and advertising efficiencies in each market.
Management Structure
Each of our stores is staffed with a store manager and one or more assistant managers, in addition to parts specialists, retail and/or installer service specialists and other positions required to meet the specific needs of each store. Each of our 349355 district managers has general supervisory responsibility for an average of 10 stores, which provides our stores with the appropriate amount of operational support.
District managers complete a comprehensive training program to ensure each has a thorough understanding of customer service, leadership, inventory management and store profitability, as well as all other sales and operational aspects of our business model. Store managers are also required to complete a structured training program that is specific to their position, including attending a 40-hour manager development program at the corporate headquarters in Springfield, Missouri. District managers and store managers also receive continuous training through on-line assignments, field workshops and regional meetings.
We provide financial incentives to our district managers and all store team membersTeam Members through incentive compensation programs. Under our incentive compensation programs, base salary is augmented by incentive compensation based upon their individual and/or store’s sales and profitability. In addition, each of our district and store managers participates in the Company’sour stock option program. We believe that our incentive compensation programs significantly increase the motivation and overall performance of our district and store team membersTeam Members and enhance our ability to attract and retain qualified management and other personnel.
Most of our current senior management, district managers and store managers were promoted to their positions from within the Company. Our senior management team averages 18 years of service, corporate management team averages 15 years of service and our district management team has an average length of service of 13 years.
Team Members
As of January 31, 2011, we employed 47,142 total team members (31,070 full-time team members and 16,072 part-time team members), of whom 39,556 were employed at our stores, 6,053 were employed at our DCs and 1,533 were employed at our corporate and regional offices. A union represents 51 stores (435 team members) in the Greater Bay Area in California, and has for many years. In addition, approximately 66 team members who drive over-the-road trucks in two of our DCs have voted in favor of becoming represented by labor unions; however, no collective bargaining agreements have been negotiated. Except for these team members, our team members are not represented by labor unions. Our tradition of 54 years has been to treat all of our team members with honesty and respect and to commit significant resources to instill in them our “Live Green” Culture, which emphasizes the importance of every team member’s contribution to the success of O’Reilly. This focus on professionalism and fairness has created an industry-leading team and we consider our relations with our team members to be excellent.
Inflation and Seasonality
We have been successful, in many cases, in reducing the effects of merchandise cost increases principally by taking advantage of vendor incentive programs, economies of scale resulting from increased volume of purchases and selective forward buying. To the extent our acquisition cost increases due to base commodity price increases industry-wide, we have typically been able to pass along these increased costs through higher retail prices for the affected products. As a result, we do not believe our operations have been materially, adversely affected by inflation.
To some extent, our business is seasonal primarily as a result of the impact of weather conditions on customer buying patterns. Store sales and profits have historically been higher in the second and third quarters (April through September) than in the first and fourth quarters (October through March) of the year.
Regulations
We are subject to various federal, state and local laws and governmental regulations relating to our business, including those related to the handling, storage and disposal of hazardous substances, the recycling of batteries and used lubricants, and the ownership and operation of real property.
As part of our operations, we handle hazardous materials in the ordinary course of business and our customers may bring hazardous materials onto our property in connection with, for example, our oil and battery recycling programs. We currently provide a recycling program for batteries and the collection of used lubricants at certain stores of ours as a service to our customers pursuant to agreements with third-party vendors. The batteries and used lubricants are collected by our associates, deposited into vendor-supplied containers and pallets, and then disposed of by the third-party vendors. In general, our agreements with such vendors contain provisions that are designed to limit our potential liability under applicable environmental regulations for any damage or contamination, which may be caused by the batteries and lubricants to off-site properties (including as a result of waste disposal) and to our properties, when caused by the vendor.
Compliance with any such laws and regulations has not had a material adverse effect on our operations to date. We cannot give any assurance, however, that we will not incur significant expenses in the future in order to comply with any such law or regulation.
Available Information
Our Internet address is www.oreillyauto.com. Interested readers can access, free of charge, the Company’s annual reports on Form 10-K, quarterly reports on Form 10-Q, current reports on Form 8-K and any amendments to those reports filed or furnished pursuant to Section 13(a) or 15(d) of the Securities Exchange Act of 1934, as amended, through the Securities and Exchange Commission website atwww.sec.gov and searching with our ticker symbol “ORLY”. Such reports are generally available the day they are filed. Upon request, the Company will furnish interested readers a paper copy of such reports free of charge by contacting Thomas McFall, Executive Vice President of Finance and Chief Financial Officer, at 233 South Patterson, Springfield, Missouri, 65802.
Store Operations
Store Network
Store Locations - As a result of our dual market strategy, we are able to profitably operate in both large, densely populated markets and small, less densely populated areas that would not otherwise support a national chain selling primarily to the retail automotive aftermarket. The following table sets forth the geographic distribution of our stores:
| December 31, 2009 | 2010 Net New Stores | December 31, 2010 | ||||||||||||||||||||||||||
State | Store Count | % of Total Store Count | Store Count | % of Total Store Count | Store Count | % of Total Store Count | Cumulative % of Total Store Count | |||||||||||||||||||||
Texas | 521 | 15.2 | % | 24 | 16.1 | % | 545 | 15.3 | % | 15.3 | % | |||||||||||||||||
California | 477 | 13.9 | % | (4 | ) | (2.7 | %) | 473 | 13.3 | % | 28.6 | % | ||||||||||||||||
Missouri | 177 | 5.2 | % | 3 | 2.0 | % | 180 | 5.0 | % | 33.6 | % | |||||||||||||||||
Georgia | 143 | 4.2 | % | 9 | 6.0 | % | 152 | 4.3 | % | 37.9 | % | |||||||||||||||||
Washington | 139 | 4.1 | % | — | — | 139 | 3.9 | % | 41.8 | % | ||||||||||||||||||
Tennessee | 129 | 3.8 | % | 6 | 4.0 | % | 135 | 3.8 | % | 45.6 | % | |||||||||||||||||
Arizona | 129 | 3.8 | % | — | — | 129 | 3.6 | % | 49.2 | % | ||||||||||||||||||
Illinois | 125 | 3.7 | % | 3 | 2.0 | % | 128 | 3.6 | % | 52.8 | % | |||||||||||||||||
Oklahoma | 109 | 3.2 | % | 1 | 0.7 | % | 110 | 3.1 | % | 55.9 | % | |||||||||||||||||
Alabama | 105 | 3.1 | % | 3 | 2.0 | % | 108 | 3.0 | % | 58.9 | % | |||||||||||||||||
Minnesota | 100 | 2.9 | % | 4 | 2.7 | % | 104 | 2.9 | % | 61.8 | % | |||||||||||||||||
Arkansas | 96 | 2.8 | % | 1 | 0.7 | % | 97 | 2.7 | % | 64.5 | % | |||||||||||||||||
North Carolina | 77 | 2.3 | % | 20 | 13.4 | % | 97 | 2.7 | % | 67.2 | % | |||||||||||||||||
Colorado | 87 | 2.5 | % | — | — | 87 | 2.4 | % | 69.6 | % | ||||||||||||||||||
Louisiana | 80 | 2.3 | % | 4 | 2.7 | % | 84 | 2.4 | % | 72.0 | % | |||||||||||||||||
Indiana | 74 | 2.2 | % | 9 | 6.0 | % | 83 | 2.3 | % | 74.3 | % | |||||||||||||||||
Ohio | 63 | 1.8 | % | 16 | 10.7 | % | 79 | 2.2 | % | 76.5 | % | |||||||||||||||||
Michigan | 67 | 2.0 | % | 9 | 6.0 | % | 76 | 2.1 | % | 78.6 | % | |||||||||||||||||
Mississippi | 71 | 2.1 | % | — | — | 71 | 2.0 | % | 80.6 | % | ||||||||||||||||||
Wisconsin | 55 | 1.6 | % | 12 | 8.1 | % | 67 | 1.9 | % | 82.5 | % | |||||||||||||||||
Iowa | 65 | 1.9 | % | 1 | 0.7 | % | 66 | 1.8 | % | 84.3 | % | |||||||||||||||||
Kansas | 65 | 1.9 | % | 1 | 0.7 | % | 66 | 1.8 | % | 86.1 | % | |||||||||||||||||
South Carolina | 50 | 1.5 | % | 8 | 5.4 | % | 58 | 1.6 | % | 87.7 | % | |||||||||||||||||
Kentucky | 54 | 1.6 | % | 3 | 2.0 | % | 57 | 1.6 | % | 89.3 | % | |||||||||||||||||
Utah | 54 | 1.6 | % | — | — | 54 | 1.5 | % | 90.8 | % | ||||||||||||||||||
Nevada | 45 | 1.3 | % | — | — | 45 | 1.3 | % | 92.1 | % | ||||||||||||||||||
Florida | 32 | 0.9 | % | 10 | 6.7 | % | 42 | 1.2 | % | 93.3 | % | |||||||||||||||||
Oregon | 42 | 1.2 | % | — | — | 42 | 1.2 | % | 94.5 | % | ||||||||||||||||||
New Mexico | 38 | 1.1 | % | (1 | ) | (0.7 | %) | 37 | 1.0 | % | 95.5 | % | ||||||||||||||||
Idaho | 30 | 0.9 | % | 1 | 0.7 | % | 31 | 0.9 | % | 96.4 | % | |||||||||||||||||
Nebraska | 29 | 0.8 | % | — | — | 29 | 0.8 | % | 97.2 | % | ||||||||||||||||||
Montana | 23 | 0.7 | % | — | — | 23 | 0.6 | % | 97.8 | % | ||||||||||||||||||
Wyoming | 16 | 0.5 | % | — | — | 16 | 0.5 | % | 98.3 | % | ||||||||||||||||||
Virginia | 9 | 0.1 | % | 5 | 3.4 | % | 14 | 0.4 | % | 98.7 | % | |||||||||||||||||
North Dakota | 12 | 0.4 | % | 1 | 0.7 | % | 13 | 0.4 | % | 99.1 | % | |||||||||||||||||
Alaska | 11 | 0.3 | % | — | — | 11 | 0.3 | % | 99.4 | % | ||||||||||||||||||
Hawaii | 11 | 0.3 | % | — | — | 11 | 0.3 | % | 99.7 | % | ||||||||||||||||||
South Dakota | 11 | 0.3 | % | — | — | 11 | 0.3 | % | 100.0 | % | ||||||||||||||||||
Total | 3,421 | 100 | % | 149 | 100 | % | 3,570 | 100 | % | |||||||||||||||||||
Our stores, on average, carry approximately 22,000 SKUs and average approximately 7,100 total square feet in size. At December 31, 2010, we had a total of approximately 25.3 million square feet in our 3,570 stores. Our stores are served primarily by the nearest DC, which averages 118,000 SKUs, but also have same-day access to the broad selection of inventory available at one of our 184 Master Inventory Stores, which on average carry approximately 39,000 SKUs and average approximately 10,000 square feet in size. In addition to serving DIY and professional service provider customers in their markets, Master Inventory Stores also provide our other stores within the surrounding area access to a greater selection of SKUs on a same-day basis.
We believe that our stores are “destination stores” generating their own traffic rather than relying on traffic created by the presence of other stores in the immediate vicinity. Consequently, most of our stores are freestanding buildings and prominent end caps situated on or near major traffic thoroughfares, and offer ample parking, easy customer access and are generally located in close proximity to our professional service provider customers.
Store Layout - We utilize a computer-assisted “plan-o-grammed” store layout system to provide a uniform and consistent merchandise presentation; however, each store’s hard-parts inventory assortment is customized to meet the specific needs of a particular market area. Front room merchandise is arranged to provide easy customer access, maximum selling space and to prominently display high-turnover products and accessories to customers. To ensure the best customer experience possible, we have selectively implemented bilingual in-store signage based on the demographics in each store’s geographic area. Aisle displays and end caps are used to feature high-demand or seasonal merchandise, new items and advertised specials.
Store Automation - To enhance store-level operations, customer service and reliability, we use Linux servers and IBM I-Series computer systems in our stores. These systems are linked with the I-Series computers located in each of our DCs. Our point-of-sale terminals provide immediate access to our electronic catalog to graphically display parts and pricing information by make, model and year of vehicle and use bar code scanning technology to price our merchandise. This system speeds transaction times, reduces the customer’s checkout time, ensures accuracy and provides enhanced customer service. Moreover, our store automation systems capture detailed sales information which assists in store management, strategic planning, inventory control and distribution efficiency.
New Store Site Selection - In selecting sites for new stores, we seek to strategically locate store sites in clusters within geographic areas in order to achieve economies of scale in management, advertising and distribution. Other key factors we consider in the site selection process are bulleted below:
population density;
demographics including age, ethnicity and per capita income;
market economic strength, retail draw and growth patterns;
number of registered vehicles;
the number, type and sales potential of existing automotive repair facilities;
the number of auto parts stores and other competitors within a predetermined radius and the operational strength of such competitors; and
physical location, size, economics and presentation of the site.
When entering new, more densely populated markets, we generally seek to initially open several stores within a short span of time in order to maximize the effect of initial promotional programs and achieve economies of scale. After opening this initial cluster of new stores, we seek to begin penetrating the less densely populated surrounding areas. This strategy enables us to achieve additional distribution and advertising efficiencies in each market.
Products and Purchasing
Our stores offer DIY and professional service provider customers a wide selection of brand name and private label products for domestic and imported automobiles, vans and trucks. We do not sell tires or perform automotive repairs or installations. Our merchandise generally consists of nationally recognized, well-advertised, premium name brand products such as AC Delco, Armor All, Bosch, BWD, Cardone, Castrol, Gates Rubber, Monroe, Moog, Pennzoil, Prestone, Quaker State, STP, Turtle Wax, Valvoline, Wagner, and Wix. In addition to name brand products, our stores carry a wide variety of high-quality private label products under our BestTest®, BrakeBest®, Master Pro®, Micro-Gard®, Murray and Omnispark®, O’Reilly Auto Parts®, Power Torque®, Super Start®, and Ultima® proprietary name brands. Our private label products are produced by nationally recognized manufacturers and meet or exceed original equipment manufacturer specifications and provide a great combination of quality and value – a characteristic important to our DIY customers. We have added O’Reilly branded chemicals and commodities as well as proprietary private label products to all acquired CSK stores. These stores have also undergone hard-part resets, which significantly increased their hard-part SKU offering, giving our customers in all stores a good, better, and best product offering.
We purchase automotive products in substantial quantities from over 500 vendors, the five largest of which accounted for approximately 22% of our total purchases in 2010. Our largest vendor in 2010 accounted for approximately seven percent of our total purchases and the next four largest vendors each accounted for approximately three to five percent of such purchases. We have no
long-term contractual purchase commitments with any of our vendors, nor have we experienced difficulty in obtaining satisfactory alternative supply sources for automotive parts. We believe that alternative supply sources exist at substantially similar costs, for substantially all of the automotive products that we sell. It is our policy to take advantage of payment and seasonal purchasing discounts offered by our vendors and to utilize extended dating terms available from vendors. During 2010, we entered into various programs and arrangements with certain vendors that provided for extended dating and payment terms for inventory purchases. As a whole, we consider our relationships with our vendors to be very good.
Pricing
We believe that a competitive pricing policy is essential to successfully operate in the automotive aftermarket business. Product pricing is generally established to compete with the pricing policies of competitors in the market area served by each store. Most automotive products that we sell are priced based upon a combination of competitor price comparisons and internal gross margin targets and are generally sold at a discount to the manufacturer’s suggested retail price with additional savings offered through volume discounts and special promotional pricing. Consistent with our low price guarantee, each of our stores will match any verifiable price on any in-stock product of the same or comparable quality offered by our competitors in the same market area.
We have repositioned the product offering and pricing in all CSK stores to an every-day low price strategy to ensure we are competitive in every market. We believe competitive pricing is needed to grow our market share and maintain a customer’s repeat business, and we believe strongly that this strategy is more sustainable, requires less promotional spending and will produce better results than CSK’s historical promotional-based, high-low pricing strategy.
Professional Parts People
We believe our highly trained team of Professional Parts People is essential in providing superior customer service to both DIY and professional service provider customers. Because a significant portion of our business is from professional service providers, our Professional Parts People are required to be technically proficient in automotive products. In addition, we have found that the typical
DIY customer often seeks assistance from a Professional Parts Person, particularly when purchasing hard parts. The ability of our Professional Parts People to provide such assistance to the DIY customer creates a favorable impression and is a significant factor in generating repeat DIY business.
We screen prospective team membersTeam Members to identify highly motivated individuals who either have experience with automotive parts or repairs, or automotive aptitude. New store team membersTeam Members go through a comprehensive orientation about the culture of our companyCompany as well as the requirements for their specific job position. Additionally, during their first year of employment, our parts specialists go through extensive automotive systems and product knowledge training to ensure they are able to provide the highest level of service to our customers. Once all of the required training has been satisfied, our parts specialists become eligible to take the O’Reilly Certified Parts Professional test. Passing the O’Reilly test helps prepare them to become certified by the National Institute for Automotive Service Excellence (ASE).
All of our stores have the ability to service professional service provider customers. For this reason, select team membersTeam Members in each store complete extensive sales call training with their regional field sales manager. Afterward, these team membersTeam Members spend one day per week calling on existing and potential professional service provider customers. Additionally, each team memberTeam Member engaged in such sales activities participates in quarterly advanced training programs for sales and business development.
Customer Service
We seek to provide our customers with an efficient and pleasant in-store experience by maintaining attractive stores in convenient locations with a wide selection of automotive products. We believe that the satisfaction of DIY and professional service provider customers is substantially dependent upon our ability to provide, in a timely fashion, the specific automotive products requested. Accordingly, each O’Reilly store carries a broad selection of automotive products designed to cover a wide range of vehicle applications. We continuously refine the inventory levels and assortments carried in our stores, based in large part on the sales movement tracked by our inventory control system, market vehicle registration data, failure rates and management’s assessment of the changes and trends in the marketplace. We have no material backlog of orders for the products we sell.
Marketing
Marketing to the DIY Customer - We use an integrated marketing program, which includes television, radio, direct mail and newspaper distribution, in-store andOur online promotions, and sports and event sponsorships, to aggressively attract DIY customers. The marketing strategy we employ is highly effective and has led to an increase in awareness of the O’Reilly brand across our geographic footprint. We utilize a combination of brand and product/price messaging to drive retail traffic and purchases, which frequently coincide with key sales events. During 2010, we continued to co-brand all forms of advertising in the markets containing acquired CSK stores. This manner of advertising and marketing is essential to not only build awareness of the O’Reilly brand in those markets,
but to also allow for a smoother transition throughout the rebranding process. Store signage in substantially all acquired CSK stores is expected to be changed to the O’Reilly Brand by the end of the first quarter of 2011, and we expect to end the co-branding of all forms of advertising during 2011.
To stimulate sales among race enthusiasts, who we believe individually spend more on automotive products than the general public, during 2010 we sponsored multiple nationally-televised races and over 1,500 grassroots, local, and regional motorsports events throughout 38 states. We maintained our partnership with the National Association for Stock Car Racing (“NASCAR”) as the Official Auto Parts Store of NASCAR and were the title sponsor of five National Hot Rod Association (“NHRA”) races from Pomona, California to Charlotte, North Carolina.
During the fall and winter months, we strategically sponsor National Collegiate Athletic Association (“NCAA”) football and basketball and the National Football League (“NFL”). Our relationships with over 70 NCAA teams and tournaments have resulted in prominently-displayed O’Reilly logos on TV-visible scoring table signs throughout the season. In addition, O’Reilly Auto Parts radio advertising can be heard during more than 350 NFL games dueordering service provides enhanced customer service capabilities to our sponsorship of nearly 20 teams.
Through an expanded use of Spanish language radio, print, and outdoor, as well as sponsorships of over 45 local and regional festivals and events, we demonstrated our commitment to increasing marketing efforts that are targeted toward the Hispanic auto parts consumer.
In 2010, we continued our dedicated problem/solution communication strategy, which encourages vehicle owners to perform regular maintenance as a way to save money and protect their automotive investment over the long term. This highly relevant message resonates with consumers and establishes O’Reilly as their source for the parts they need and excellent customer service.
Marketing to the Professional Service Provider - We have over 450 full-time O’Reilly sales representatives strategically located across our market areas. Each sales representative is dedicated solely to calling upon, selling to and servicing our professional service provider customers. Targeted marketing materials such as flyers, quick reference guides and catalogs are produced and distributed on a regular basis to professional service providers, paint and body shops and fleet customers. Our industry leading First Call program enables our sales representatives, district managers, and store managers to provide excellent customer service to each of our professional service provider accounts by providing the products and services bulleted below:
broad selection of merchandise at competitive prices;
dedicated Installer Service Specialists in our stores;
multiple deliveries from our stores per day;
same-day or overnight access to an average of 118,000 SKUs through five-night-a-week store inventory replenishments;
a separate service counter and phone line in our stores dedicated exclusively to service professional service providers;
trade credit for qualified accounts;
First Call Online, a dedicated Internet based catalog and ordering system designed to connect professional service providers directly to our inventory system;
training and seminars covering topics of interest, such as technical updates, safety and general business management;
access to a comprehensive inventory of products and equipment needed to operate and maintain their shop; and
the Certified Auto Repair Center Program, a program that provides professional service providers with business tools they can utilize to profitably grow and market their shops.
Marketing to the Independently Owned Parts Store - Along with the daily operation and management of the DCs and the distribution of automotive products to our stores, Ozark Automotive Distributors, Inc., our wholly owned subsidiary (“Ozark”), also sells automotive products directly to independently owned parts stores (“jobber stores”) throughout our trade areas. These jobber stores are generally located in areas not directly serviced by an O’Reilly store. Ozark administers a dedicated and distinct marketing program specifically targeted to jobber stores.
Approximately 185 jobber stores currently purchase automotive products from Ozark and participate in our Parts City Auto Parts program, our proprietary jobber service program. As a participant in these programs, a jobber store, which meets certain financial and operational standards, is permitted to indicate its Parts City Auto Parts membership through the display of the respective logo that is owned by Ozark. In return for a commitment to purchase automotive products from Ozark, we provide computer software for business management, competitive pricing, advertising, marketing and sales assistance to Parts City Auto Parts affiliate stores.
Competition
We compete in both the DIY and professional service provider portions of the automotive aftermarket. We compete primarily with the stores bulleted below:
national retailcustomers. Our program allows customers to view available parts and wholesale automotiveprices online, purchase parts chains (such as AutoZone, Inc., Advance Auto Parts, NAPA, CARQUEST and the Pep Boys - Manny, Moe and Jack, Inc.);
regional retail and wholesale automotiveonline and/or either ship these purchases to their location or have these parts chains;
independently owned parts stores;
wholesalers or jobber stores (some of which are associated with national automotive parts distributors or associations such as NAPA, CARQUEST, Bumper to Bumper and Auto Value);
automobile dealers; and
mass merchandisers that carry automotive replacement parts, maintenance items and accessories (such as Wal-Mart Stores, Inc.).
We compete on the basis of customer service, which includes merchandise selection and availability, price, helpfulness of store personnel, store layout and convenient and accessible store locations.
Distribution System Support
We currently operate 23 DCs comprised of approximately 8.5 million operating square feet (see the “Properties” table in Item 2 of this Form 10-Kavailable for a detailed listing of DC operating square footages). Our DCs are equipped with highly automated material handling equipment, which efficiently expedite the movement of our products from the shelves to the loading areas for shipment to each of our stores on a nightly basis. The DCs utilize technology to electronically receive orders from computers located in each of our stores. In addition to the bar code system employedpick up in our stores, each of our stores is connected through secured data transmission technology to our DCs and corporate headquarters.local store.
Distribution Systems
We believe that our tiered distribution systemmodel provides industry-leading parts availability and store in-stock positions, while lowering our inventory carrying costs and controlling inventory. Moreover, we believe that our ongoing, significant capital investments made to expand the network of DCs allows us to efficiently service new stores that are planned to open in contiguous market areas as well as servicing our existing store network. Our DCdistribution expansion strategy complements our new store opening strategy by supporting newly established clusters of stores located in the regions surrounding each DC. We currently have a total growth capacity of approximately 650500 stores in our distribution network.
Distribution Centers:
We currently operate 23 DCs comprised of approximately 8.5 million operating square feet (see the “Properties” table in Item 2 of this Form 10-K for a detailed listing of DC operating square footages). Our DCs utilize technology to electronically receive orders from computers located in each of our stores. Our DCs stock an average of 123,000 SKUs and most DCs are linked to multiple other regional DCs’ inventory. Our DCs provide five-night-a-week delivery, primarily via a Company-owned fleet, to all of our stores in the continental United States. In addition, stores within a DC metropolitan area receive multiple daily deliveries from our DC “city counters”, many of which receive this service seven days per week.
As part of our continuing efforts to enhance our distribution network in 20112012 we plan to:
continue to implement a voice picking technology in additional DCs;
evaluate routing software to further enhance logistics efficiencies;
begin to implement labor management software to improve DC productivity and overall operating efficiency;
develop further automated paperless picking processes;
improve proof of delivery systems to further increase the accuracy of product movement to our stores;
continue to define and implement best practice procedures in all DCs; and
make proven, ROI based capital enhancements to material handling equipment in DCs including conveyor systems, picking modules and lift equipment.
Executive OfficersMaster Inventory “Hub” Stores:
We currently operate 192 strategically placed Master Inventory “Hub” stores. In addition to serving DIY and professional service provider customers in their markets, Hub stores also provide our other stores within the surrounding area access to an expanded selection of SKUs on a same-day basis. Our Hub stores average approximately 3,000 square feet more than our typical stores and carry an average of 18,000 SKUs more than our typical stores.
Products and Purchasing
Our stores offer DIY and professional service provider customers a wide selection of brand name and private label products for domestic and imported automobiles, vans and trucks. Our merchandise generally consists of nationally recognized, well-advertised, premium name brand products such as AC Delco, Armor All, Bosch, BWD, Cardone, Castrol, Gates Rubber, Monroe, Moog, Pennzoil, Prestone, Quaker State, STP, Turtle Wax, Valvoline, Wagner, and Wix. In addition to name brand products, our stores carry a wide variety of high-quality private label products under our BestTest®, BrakeBest®, Master Pro®, Micro-Gard®, Murray®, Omnispark®, O’Reilly Auto Parts®, Power Torque®, Super Start®, and Ultima® proprietary name brands. Our private label products are produced by nationally recognized manufacturers and meet or exceed original equipment manufacturer specifications and provide a great combination of quality and value – a characteristic important to our DIY customers. We have added O’Reilly branded chemicals and commodities as well as proprietary private label products to all acquired CSK stores. These stores have also undergone hard-part resets, which significantly increased their hard-part SKU offering, giving our customers in all stores a good, better, and best product offering.
We have no long-term contractual purchase commitments with any of our vendors, nor have we experienced difficulty in obtaining satisfactory alternative supply sources for automotive parts. We believe that alternative supply sources exist at substantially similar costs, for substantially all of the Registrantautomotive products that we sell. It is our policy to take advantage of payment and seasonal purchasing discounts offered by our vendors and to utilize extended dating terms available from vendors. During 2011, we entered into various programs and arrangements with certain vendors that provided for extended dating and payment terms for inventory purchases. As a whole, we consider our relationships with our vendors to be very good.
We purchase automotive products in substantial quantities from over 500 vendors, the five largest of which accounted for approximately 21% of our total purchases in 2011. Our largest vendor in 2011 accounted for approximately 6% of our total purchases and the next four largest vendors each accounted for approximately 3% to 6% of such purchases.
Marketing
Marketing to the DIY Customer:
We use an integrated marketing program, which includes television, radio, direct mail and newspaper distribution, in-store and online promotions, and sports and event sponsorships to aggressively attract DIY customers. The marketing strategy we employ is highly effective and has led to a measurable increase in awareness of the O’Reilly Brand across our geographic footprint. We utilize a combination of brand and product/price messaging to drive retail traffic and purchases, which frequently coincide with key sales events. We continued to co-brand all forms of advertising in the markets containing acquired CSK stores during the first half of 2011. This manner of advertising and marketing was essential to not only build awareness of the O’Reilly Brand in those markets, but to also allow for a smoother transition throughout the entire rebranding process. Store signage of all acquired CSK stores was changed to the O’Reilly Brand during 2011, at which time co-branding ended and all forms of advertising promoted the O’Reilly Brand in all our markets.
To stimulate sales among racing enthusiasts, who we believe individually spend more on automotive products than the general public, we sponsored multiple nationally-televised races and over 1,500 grassroots, local, and regional motorsports events throughout 38 states during 2011. We maintained our partnership with the National Association for Stock Car Racing (“NASCAR”) as the Official Auto Parts Store of NASCAR and were the title sponsor of five National Hot Rod Association (“NHRA”) races from Pomona, California to Charlotte, North Carolina.
During the fall and winter months, we strategically sponsor National Collegiate Athletic Association (“NCAA”) basketball and the National Football League (“NFL”). Our relationships with over 50 NCAA teams and tournaments have resulted in prominently-displayed O’Reilly logos on TV-visible scoring table signs throughout the season.
Through an expanded use of Spanish language radio, print, and outdoor, as well as sponsorships of over 45 local and regional festivals and events, we demonstrated our commitment to increasing marketing efforts that are targeted toward the Hispanic auto parts consumer.
In 2011, we continued our dedicated problem/solution communication strategy, which encourages vehicle owners to perform regular maintenance as a way to save money and protect their automotive investment over the long-term. This highly relevant message resonates with consumers and establishes O’Reilly as their source for the parts they need and excellent customer service.
Marketing to the Professional Service Provider Customer:
We have over 460 full-time O’Reilly sales representatives strategically located across our market areas as part of our First Call® program. Each sales representative is dedicated solely to calling upon, selling to and servicing our professional service provider customers. Targeted marketing materials such as flyers, quick reference guides and catalogs are produced and distributed on a regular basis to professional service providers, paint and body shops and fleet customers. Our industry-leading First Call program enables our sales representatives, district managers, and store managers to provide excellent customer service to each of our professional service provider accounts by providing the products and services identified below:
broad selection of merchandise at competitive prices
dedicated Installer Service Specialists in our stores
multiple, daily deliveries from our stores
same-day or overnight access to an average of 123,000 SKUs through five-night-a-week store inventory replenishments
separate service counter and phone line in our stores dedicated exclusively to service professional service providers
trade credit for qualified accounts
First Call Online, a dedicated Internet based catalog and ordering system designed to connect professional service providers directly to our inventory system
training and seminars covering topics of interest, such as technical updates, safety and general business management
access to a comprehensive inventory of products and equipment needed to operate and maintain their shop
Certified Auto Repair Center Program, a program that provides professional service providers with business tools they can utilize to profitably grow and market their shops
Marketing to the Independently Owned Parts Store:
Along with the daily operation and management of the DCs and the distribution of automotive products to our stores, Ozark Automotive Distributors, Inc., our wholly owned subsidiary (“Ozark”), also sells automotive products directly to independently owned parts stores (“jobber stores”) throughout our trade areas. These jobber stores are generally located in areas not directly serviced by an O’Reilly store. Ozark administers a dedicated and distinct marketing program specifically targeted to jobber stores.
Approximately 190 jobber stores currently purchase automotive products from Ozark and participate in our Parts City Auto Parts program, our proprietary jobber service program. As a participant in these programs, a jobber store, which meets certain financial and operational standards, is permitted to indicate its Parts City Auto Parts membership through the display of the respective logo that is owned by Ozark. In return for a commitment to purchase automotive products from Ozark, we provide computer software for business management, competitive pricing, advertising, marketing and sales assistance to Parts City Auto Parts affiliate stores.
Pricing
We believe that a competitive pricing policy is essential to successfully operate in the automotive aftermarket business. Product pricing is generally established to compete with the pricing policies of competitors in the market area served by each store. Most automotive products that we sell are priced based upon a combination of competitor price comparisons and internal gross margin targets and are generally sold at a discount to the manufacturer’s suggested retail price with additional savings offered through volume discounts and special promotional pricing. Consistent with our low price guarantee, each of our stores will match any verifiable price on any in-stock product of the same or comparable quality offered by our competitors in the same market area.
We have repositioned the product offering and pricing in all acquired CSK stores to an every-day low price strategy to ensure we are competitive in every market in which we operate. We believe competitive pricing is needed to grow our market share and maintain a customer’s repeat business, and we believe strongly that this strategy is more sustainable, requires less promotional spending and will produce better results than CSK’s historical promotional-based, high/low pricing strategy.
Customer Payments and Returns Policy
Our stores accept cash, checks, debit and credit cards. We also grant credit to many professional service provider customers who meet our pre-established credit requirements. Some of the factors considered in our pre-established credit requirements include customer creditworthiness, past transaction history with the customer, current economic and industry trends and changes in customer payment terms. No customer accounted for ten percent or more of our consolidated net sales, nor do we have any dependence on any single customer.
We accept product returns for new products, core products and warranty/defective products.
INDUSTRY ENVIRONMENT
The automotive aftermarket industry includes all products and services purchased for light- and heavy-duty vehicles after the original sale. The total size of the automotive aftermarket is estimated to be $215 billion, according to the Automotive Aftermarket Industry Association (“AAIA”). This market is made up of four segments – labor share of professional service provider sales, auto parts share of professional service provider sales, DIY sales and tire sales. O’Reilly’s addressable market within this industry includes the auto parts share of professional service provider sales and DIY sales. We do not sell tires or perform automotive repairs or installations.
Competition
We compete in both the DIY and professional service provider portions of the automotive aftermarket and are one of the largest specialty retailers within that market. We compete primarily with the stores identified below:
national retail and wholesale automotive parts chains (such as AutoZone, Inc., Advance Auto Parts, NAPA, CARQUEST and the Pep Boys - Manny, Moe and Jack, Inc.)
regional retail and wholesale automotive parts chains
independently owned parts stores
wholesalers or jobber stores (some of which are associated with national automotive parts distributors or associations such as NAPA, CARQUEST, Bumper to Bumper and Auto Value)
automobile dealers
mass merchandisers that carry automotive replacement parts, maintenance items and accessories (such as Wal-Mart Stores, Inc.)
We compete on the basis of customer service, which includes merchandise selection and availability, technical proficiency and helpfulness of store personnel, price, store layout and convenient and accessible store locations. Our dual market strategy requires significant capital expenditures to support, such as the capital expenditures required for the distribution network, store network and inventory levels necessary for providing products to both the DIY and professional service provider portions of the automotive aftermarket.
Inflation and Seasonality
We have been successful, in many cases, in reducing the effects of merchandise cost increases principally by taking advantage of vendor incentive programs, economies of scale resulting from increased volume of purchases and selective forward buying. To the extent our acquisition cost increases due to base commodity price increases industry wide, we have typically been able to pass along these increased costs through higher retail prices for the affected products. As a result, we do not believe our operations have been materially, adversely affected by inflation.
To some extent our business is seasonal, primarily as a result of the impact of weather conditions on customer buying patterns. Store sales, profits and inventory levels have historically been higher in the second and third quarters (April through September) than in the first and fourth quarters (October through March) of the year.
Regulations
We are subject to various federal, state and local laws and governmental regulations relating to our business, including those related to the handling, storage and disposal of hazardous substances, the recycling of batteries and used lubricants, and the ownership and operation of real property.
As part of our operations, we handle hazardous materials in the ordinary course of business and our customers may bring hazardous materials onto our property in connection with, for example, our oil and battery recycling programs. We currently provide a recycling program for batteries and the collection of used lubricants at certain of our stores as a service to our customers pursuant to agreements with third-party vendors. The batteries and used lubricants are collected by our associates, deposited into vendor-supplied containers and pallets, and then disposed of by the third-party vendors. In general, our agreements with such vendors contain provisions that are designed to limit our potential liability under applicable environmental regulations for any damage or contamination, which may be caused by the batteries and lubricants to off-site properties (including as a result of waste disposal) and to our properties, when caused by the vendor.
Compliance with any such laws and regulations has not had a material adverse effect on our operations to date. We cannot give any assurance, however, that we will not incur significant expenses in the future in order to comply with any such laws or regulations.
EXECUTIVE OFFICERS OF THE REGISTRANT
The following paragraphs discuss information about our executive officers of the Company who are not also directors:
Gregory L. Henslee, age 50,51, Chief Executive Officer and Co-President, has been an O’Reilly team memberTeam Member for 2627 years. Mr. Henslee’s O’Reilly career started as a parts specialist, and during his first five years he served in several positions in retail store operations, including district manager. From there he advanced to Computer Operations Manager, and over the next 15 years, he served as Director of Computer Operations/Loss Prevention, Vice President of Store Operations and as Senior Vice President. In 1999, he became President of Merchandise, Distribution, Information Systems and Loss Prevention, and has been in his current positions of Chief Executive Officer and Co-President since 2005.
Ted F. Wise, age 60,61, Chief Operating Officer and Co-President, has been an O’Reilly team memberTeam Member for 4041 years. Mr. Wise’s primary areas of responsibility are Sales, Operations and Real Estate. He began his O’Reilly career in sales in 1970, was promoted to store manager in 1973 and became our first district manager in 1977. He continued his progression with O’Reilly as Operations Manager, Vice President, Senior Vice President of Operations and Sales, and Executive Vice President. He has been President of Sales, Operations and Real Estate since 1999, and in his current positions of Chief Operating Officer and Co-President since 2005.
Thomas G. McFall, age 40,41, Executive Vice President of Finance and Chief Financial Officer, has been an O’Reilly team memberTeam Member since 2006 and has held his position as Chief Financial Officer during this time. Mr. McFall’s primary areas of responsibility are Finance, Accounting, Risk Management and Human Resources. Prior to joining O’Reilly, Mr. McFall held the position of Chief Financial Officer – Midwest Operation for CSK, following CSK’s acquisition of Murray’s Discount Auto Stores (“Murray’s”). Mr.
McFall served Murray’s for eight years as Controller, Vice President of Finance, and Chief Financial Officer, with direct responsibility for finance and accounting, distribution and logistics operations. Prior to joining Murray’s, Mr. McFall was an Audit Manager with Ernst & Young, LLP in Detroit, Michigan.
Gregory D. Johnson, age 45,46, Senior Vice President of Distribution Operations, has been an O’Reilly team memberTeam Member for 2829 years. Mr. Johnson’s primary area of responsibility is Distribution and Logistics. He began his O’Reilly career as a part-time stocker in the Nashville DC in 1982 and advanced with O’Reilly as Retail Systems Manager, WMS Systems Development Manager, Director of Distribution and Vice President of Distribution. He has been in his current position as Senior Vice President since September 2007.
Randy Johnson, age 55,56, Senior Vice President of Inventory Management, has been an O’Reilly team memberTeam Member for 3738 years. Mr. Johnson’s primary area of responsibility is Inventory Management, Purchasing, Logistics, and Store Design. He began his career in a DC in 1973, working in the stocking, shipping and will call counter departments, and was promoted to customer service manager in 1976. He continued to progress with the development of the inventory control department as Inventory Control Manager and Vice President of Store Inventory Management. He has been in his current position as Senior Vice President of Inventory Management since October 2010.
Jeff M. Shaw, age 48,49, Senior Vice President of Sales and Operations, has been an O’Reilly team memberTeam Member for 2223 years. Mr. Shaw’s primary areas of responsibility are Store Operations and Sales. His O’Reilly career started as a parts specialist, and has progressed through the roles of store manager, district manager, regional manager and Vice President of the Southern division. He advanced to Vice President of Sales and Operations in 2003 and to his current position as Senior Vice President of Sales and Operations in 2004.
Michael D. Swearengin, age 50,51, Senior Vice President of Merchandise, has been an O’Reilly team memberTeam Member for 1718 years. Mr. Swearengin’s primary areas of responsibility are Merchandise, Pricing and Advertising. His O’Reilly career started as an employee in a store later acquired by O’Reilly, he then became Product Manager, a position he held for four years. From there he advanced to Senior Product Manager, Director of Merchandise and Vice President of Merchandise with responsibility for product mix and replenishment. He has been in his current position as Senior Vice President since 2004.
Service Marks and TrademarksSERVICE MARKS AND TRADEMARKS
We have registered, acquired and/or been assigned the following service marks and trademarks: BESTEST®BESTEST®, BETTER PARTS. BETTER PRICES.®, BRAKEBEST®BRAKEBEST®, CERTIFIED AUTO REPAIR®REPAIR®, CUSTOMIZE YOUR RIDE®RIDE®, FIRST CALL®CALL®, FROM OUR STORE TO YOUR DOOR®DOOR®, HI-LO®HI-LO®, IMPORT DIRECT®DIRECT®, IPOLITE®IPOLITE®, MASTER PRO®PRO®, MASTER PRO REFINISHING®REFINISHING®, MICRO-GARD®MICRO-GARD®, MILES AHEAD®AHEAD®, MURRAY®MURRAY®, O®O®, OMNISPARK®OMNISPARK®, O’REILLY®O’REILLY®, O’REILLY AUTO COLOR PROFESSIONAL PAINT PEOPLE®PEOPLE®, O’REILLY AUTO PARTS®PARTS®, O’REILLY AUTO PARTS PROFESSIONAL PARTS PEOPLE®PEOPLE®, O’REILLY AUTOMOTIVE®AUTOMOTIVE®, O’REILLY RACING®RACING®, PARTNERSHIP NETWORK®NETWORK®, PARTS CITY®CITY®, PARTS CITY AUTO COLOR PROFESSIONAL PAINT PEOPLE®PEOPLE®, PARTS CITY AUTO PARTS®PARTS®, PARTS CITY TOOL BOX®BOX®, PARTS PAYOFF®PAYOFF®, POWER TORQUE®TORQUE®, REAL WORLD TRAINING®TRAINING®, SUPER START®START®, TOOLBOX®TOOLBOX®, ULTIMA®ULTIMA®, CSK PROSHOP®PROSHOP®, FLAG®FLAG®, KRAGEN AUTO PARTS®PARTS®, MURRAY’S AUTO PARTS®PARTS®, PRIORITY PARTS®PARTS®, PROXONE®PROXONE®, SCHUCK’S®SCHUCK’S®, WE’RE THE PLACE WITH ALL THE PARTS®PARTS®, MURRAY’S VIP PROGRAM®PROGRAM®, PAY N $AVE®$AVE®. Some of the service marks and trademarks listed above may also have a design associated therewith. Each of the service marks and trademarks are in duration for as long as we continue to use and seek renewal of such marks – the duration of each of these service marks and trademarks is typically between five and ten years per renewal. We believe that our business is not otherwise dependent upon any patent, trademark, service mark or copyright.
AVAILABLE INFORMATION
Our Internet address iswww.oreillyauto.com. Interested readers can access, free of charge, our annual reports on Form 10-K, quarterly reports on Form 10-Q, current reports on Form 8-K and any amendments to those reports filed or furnished pursuant to Section 13(a) or 15(d) of the Securities Exchange Act of 1934, as amended, through the Securities and Exchange Commission website atwww.sec.gov and searching with our ticker symbol “ORLY”. Such reports are generally available the day they are filed. Upon request, we will furnish interested readers a paper copy of such reports free of charge by contacting Mark Merz, Director of External Reporting and Investor Relations, at 233 South Patterson Avenue, Springfield, Missouri, 65802.
| Item | Risk Factors |
Our future performance is subject to a variety of risks and uncertainties. Although the risks described below are the risks that we believe are material, there may also be risks of which we are currently unaware, or that we currently regard as immaterial based upon the information available to us that later may prove to be material. Interested parties should be aware that the occurrence of the events described in these risk factors, elsewhere in this Form 10-K and in our other filings with the Securities and Exchange Commission could have a material adverse effect on our business, operating results and financial condition. Actual results, therefore, may materially differ from anticipated results described in these forward-looking statements.
Deteriorating economic conditions may adversely impact demand for our products, reduce access to credit and cause our customers and others with which we do business to suffer financial hardship, all of which could adversely impact our business, results of operations, financial condition and cash flows.
In recent years, worldwide economic conditions have deteriorated significantly in many countries and regions, including the United States, and such conditions may worsen in the foreseeable future. Although demand for many of our products is primarily non-discretionary in nature and tend to be purchased by consumers out of necessity, rather than on an impulse basis, our sales are impacted by constraints on the economic health of our customers. The economic health of our customers is affected by many factors, including, among others, general business conditions, interest rates, inflation, consumer debt levels, the availability of consumer credit, currency exchange rates, taxation, fuel prices, unemployment trends and other matters that influence consumer confidence and spending. Many of these factors are outside of our control. Our customers’ purchases, including purchases of our products, could decline during periods when income is lower, when prices increase in response to rising costs, or in periods of actual or perceived unfavorable economic conditions. If any of these events occur, or if unfavorable economic conditions challenge the consumer environment, our business, results of operations, financial condition and cash flows could be adversely affected.
Overall demand for products sold in the automotive aftermarket is dependent upon many factors including the total number of vehicle miles driven in the U.S., the total number of registered vehicles the U.S., the age and quality of these registered vehicles and the level of unemployment in the U.S. Adverse changes in these factors could lead to a decreased level of demand for our products, which could negatively impact our business, results of operations, financial condition and cash flows.
In addition, economic conditions, including decreased access to credit, may result in financial difficulties leading to restructurings, bankruptcies, liquidations and other unfavorable events for our customers, suppliers, logistics and other service providers and financial institutions which are counterparties to our credit facilities and interest rate swap transactions. Also, the ability of these third parties to overcome these difficulties may increase. If third parties, on whom we rely for merchandise, are unable to overcome difficulties resulting from the deterioration in economic conditions and provide us with the merchandise we need, or if counterparties to our credit facilities do not perform their obligations, our business, results of operations, financial condition and cash flows could be adversely affected.
We cannot assure that the recently integrated CSK Auto Corporation (“CSK”) stores will perform at the same desired level of profitability as historic O’Reilly stores.
We expect acquired CSK stores to approximate the profitability levels of our core O’Reilly stores, and believe this to be a significant factor in achieving our financial goals. The failure of these stores to attain these profitability levels could seriously impact our forecasted results of operations. Our ability to operate these stores at our expected level will depend, in part, on the successful preservation of the existing DIY customers already established in these markets, growing the commercial customer base, the adoption of the O’Reilly culture, along with maintaining employee morale and the retention of key personnel.
We may not be able to obtain these profitability levels in our acquired CSK stores as soon as we expect, or at all. If we fail to address the challenges of our new markets effectively, our growth strategy and future profitability could be negatively affected, and we may fail to achieve the intended benefits of the merger.
A downgrade in our credit rating would impact our cost of capital and could impact the market value of our unsecured senior notes as well as limit our access to attractive vendor financing programs.
Credit ratings are an important part of our cost of capital. The evaluations are based upon, among other factors, our financial strength. Our current credit ratings provide us with the ability to borrow funds at a specific rate. A downgrade in our current credit rating from both agencies would adversely affect our cost of capital by causing us to pay a higher interest rate on borrowed funds under our credit facility. A downgrade could also adversely affect the market price and/or liquidity of our notes, preventing a holder from selling the notes at a favorable price, as well as adversely affect our ability to issue new notes in the future. In addition, a downgrade could limit the financial institutions willing to commit funds to our vendor financing programs at attractive rates. Decreased participation in our vendor financing programs would lead to an increase in working capital needed to operate the business adversely affecting our cash flow.
Our increased debt levels could adversely affect our cash flow and prevent us from fulfilling our obligations.
We have in place, an unsecured revolving credit facility and unsecured senior notes, which could have important consequences to our financial health. For example, our level of indebtedness could, among other things:
make it more difficult to satisfy our financial obligations, including those relating to the notes and our credit facility;
increase our vulnerability to adverse economic and industry conditions;
limit our flexibility in planning for, or reacting to, changes and opportunities in our industry, which may place us at a competitive disadvantage;
require us to dedicate a substantial portion of our cash flows to service the principal and interest on the debt, reducing the funds available for other business purposes, such as working capital, capital expenditures or other cash requirements;
limit our ability to incur additional debt on acceptable terms, if at all; and
expose us to fluctuations in interest rates.
In addition, the terms of the financing obligations include restrictions, such as affirmative and negative covenants, conditions on borrowing and subsidiary guarantees. A failure to comply with these restrictions could result in a default under the financing
obligations or could require us to obtain waivers from our lenders for failure to comply with these restrictions. The occurrence of a default that remains uncured or the inability to secure a necessary consent or waiver could have a material adverse effect on our business, financial condition or results of operations.
A downgrade in our credit rating would impact our cost of capital and could impact the market value of our unsecured senior notes.
Credit ratings are an important part of our cost of capital. We currently have a BBB- credit rating, with a stable outlook, from Standard & Poor’s and a Baa3 credit rating, with a stable outlook, from Moody’s Investors Service. The evaluations are based upon, among other factors, our financial strength. Our current credit ratings provide us with the ability to borrow funds at a specific rate. A downgrade in our current credit rating from both agencies would adversely affect our cost of capital by causing us to pay a higher interest rate on borrowed funds under our credit facility. A downgrade could also adversely affect the market price and/or liquidity of our notes, preventing a holder from selling the notes at a favorable price, as well as adversely affect our ability to issue new notes in the future.
Risks associated with future acquisitions may not lead to expected growth and could result in increased costs and inefficiencies.
We expect to continue to make acquisitions as an element of our growth strategy. Acquisitions involve certain risks that could cause our actual growth and profitability to differ from our expectations, examples of such risks include the following:
we may not be able to continue to identify suitable acquisition targets or to acquire additional companies at favorable prices or on other favorable terms;
our management’s attention may be distracted;
we may fail to retain key personnel from acquired businesses;
we may assume unanticipated legal liabilities and other problems;
we may not be able to successfully integrate the operations (accounting and billing functions, for example) of businesses we acquire to realize economic, operational and other benefits; and
we may fail or be unable to discover liabilities of businesses that we acquire for which we, as a successor owner or operator, may be liable.
The automotive aftermarket business is highly competitive, and we may have to risk our capital to remain competitive.
Both the DIY and professional service provider portions of our business are highly competitive, particularly in the more densely populated areas that we serve. Some of our competitors are larger than we are and have greater financial resources. In addition, some of our competitors are smaller than us,we are, but have a greater presence than we do in a particular market. We may have to expend more resources and risk additional capital to remain competitive. For a list of our principal competitors, see the “Competition” section of Item 1 of this annual report on Form 10-K.
In order to be successful, we will need to retain and motivate key employees.
Our success has been largely dependent on the efforts of certain key personnel. In order to be successful, we will need to retain and motivate executives and other key employees. Experienced management and technical personnel are in high demand and competition for their talents is intense. We must also continue to motivate employees and keep them focused on our strategies and goals. Our business and results of operations could be materially adversely affected by the unexpected loss of the services of one or more of our key employees. We cannot be sure that we will be able to continue to attract qualified personnel, which could cause us to be less efficient, and as a result, may adversely impact our sales and profitability. For a discussion of our management, see the “Business” section of Item 1 of this annual report on Form 10-K.
We cannot assure future growth will be achieved.
We believe that our ability to open additional, profitable stores at a high growth rate will be a significant factor in achieving our growth objectives for the future. Our ability to accomplish our growth objectives is dependent, in part, on matters beyond our control, such as weather conditions, zoning and other issues related to new store site development, the availability of qualified management personnel and general business and economic conditions. We cannot be sure that our growth plans for 20112012 and beyond will be achieved. Failure to achieve our growth objectives may negatively impact the trading price of our common stock. For a discussion of our growth strategies, see the “Growth Strategy” section of Item 1 of this annual report on Form 10-K.
We are sensitive to regional economic and weather conditions that could reduce our costs and sales.
Approximately 29%28% of our stores are located in Texas and California. Therefore, our business is sensitive to the economic and weather conditions of those regions. Unusually inclement weather, such as significant rain, snow, sleet, freezing rain, flooding,
seismic activity and hurricanes, has historically discouraged our customers from visiting our stores during the affected period and reduced our sales, particularly to DIY customers. In addition, our stores located in coastal regions may be subject to increased insurance claims resulting from regional weather conditions and our results of operations and financial condition could be adversely affected.
Legal proceedings and related matters arising from CSK could adversely affect us.
As discussed in Item 3, “Legal Proceedings” and Note 14 “Legal Matters” to the consolidated financial statements, several of CSK’s former officers and employees were charged by the Department of Justice (“DOJ”) and named in civil actions by the Securities and Exchange Commission (“SEC”). O’Reilly and the DOJ have agreed in principle, subject to final documentation, to resolve CSK’s pre-acquisition issues with the DOJ. The pre-acquisition SEC investigation of CSK, which commenced in 2006, was settled in May of 2009 by administrative order without fines, disgorgement or other financial remedies. Under Delaware law, the charter documents of the CSK entities and certain indemnification agreements, CSK has certain obligations to indemnify these persons and, as a result, O’Reilly is currently incurring legal fees on the behalf of these persons in relation to certain matters. There can be no assurance that the expenses incurred in connection with the resolution of these matters will be covered by CSK’s directors’ and officers’ insurance policies. If we incur significant uninsured expenses in connection with the resolution of the matters described above, this could have a material adverse effect on our business, results of operations, financial condition and cash flows.
Sales of shares of our common stock eligible for future sale could adversely affect our share price.
All of the shares of common stock currently held by our affiliates may be sold in reliance upon the exemptive provisions of Rule 144 of the Securities Act of 1933, as amended, subject to certain volume and other conditions imposed by such rule. We cannot predict the effect, if any, which future sales of shares of common stock or the availability of such shares for sale will have on the market price of the common stock prevailing from time to time. We believe sales of substantial amounts of common stock, or the perception that such sales might occur, could adversely affect the prevailing market price of the common stock.
Risks related to the Companyus and unanticipated fluctuations in our quarterly operating results, could affect the Company’sour stock price.
We believe that quarter-to-quarter comparisons of our financial results are not necessarily meaningful indicators of theour future operating results of the Company and should not be relied on as an indication of future performance. If our quarterly operating results fail to meet the expectations of analysts, the trading price of our common stock could be negatively affected. We cannot be certain that our business strategy and our plans to integrate the operations of CSK will be successful or that they will successfully meet the expectations of these analysts. If we fail to adequately address any of these risks or difficulties, our business would likely suffer.
The market price of our common stock may be volatile and could expose us to securities class action litigation.
The stock market and the price of our common stock may be subject to wide fluctuations based upon general economic and market conditions. The market price for our common stock may also be affected by our ability to meet analysts’ expectations. Failure to meet such expectations, even slightly, could have an adverse effect on the market price of our common stock.
In addition, stock market volatility has had a significant effect on the market prices of securities issued by many companies for reasons unrelated to the operating performance of these companies. Downturns in the stock market may cause the price of our common stock to decline. In the past, following periods of volatility in the market price of a company’s securities, securities class action litigation has often been instituted against such companies. If similar litigation were instituted against us, it could result in substantial costs and a diversion of our management’s attention and resources, which could have an adverse effect on our business.
A change in the relationship with any of our key vendors or the unavailability of our key products at competitive prices could affect our financial health.
Our business depends on developing and maintaining close relationships with our vendors and on our vendors’ ability or willingness to sell quality products to us at favorable prices and terms. Many factors outside of our control may harm these relationships and the ability or willingness of these vendors to sell us products on favorable terms. For example, financial or operational difficulties that our vendors may face could increase the cost of the products we purchase from them or our ability to source product from them. In addition, the trend towards consolidation among automotive parts suppliers as well as the off-shoring of manufacturing capacity to foreign countries may disrupt or end our relationship with some vendors, and could lead to less competition and result in higher prices. We could also be negatively impacted by suppliers who might experience work stoppages, labor strikes or other interruptions to or difficulties in the manufacture or supply of the products we purchase from them.
ComplicationsBusiness interruptions in our distribution centers andor other factors affecting thefacilities may affect our store hours, operability of our computer systems, and/or availability and distribution of merchandise, which may affect our business.
We operate 23Weather, terrorist activities, war or other disasters or the threat of them, may result in the closure of our distribution centers (“DC”) nationwide to support our business. If complications arise with any facilitys) or if any facility is severely damagedother facilities or destroyed, our other DCs may not be able to fully support the resulting additional distribution demands. This may adversely affect our ability to deliver inventory to our stores on a nightly basis and thereforebasis. This may affect our ability to timely provide products to our customers, resulting in lost sales.sales or a potential loss of customer loyalty. Some of our merchandise is imported from other countries and these goods could become difficult or impossible to bring into the United States, and we may not be able to obtain such merchandise from other sources at similar prices. Such a disruption in revenue could potentially have a negative impact on our results of operations and financial condition.
We rely extensively on our computer systems to manage inventory, process transactions and timely provide products to our customers. Our systems are subject to damage or interruption from power outages, telecommunications failures, computer viruses, security breaches or other catastrophic events. If our systems are damaged or fail to function properly, we may experience loss of critical data and interruptions or delays in our ability to manage inventories or process customer transactions. Such a disruption in revenue could potentially have a negative impact on our results of operations and financial condition.
A breach of customer, Team Member or Company information could damage our reputation or result in substantial additional costs or possible litigation.
Our business involves the storage of personal information about our customers and Team Members. We have taken reasonable and appropriate steps to protect this information; however, if we experience a significant data security breach, we could be exposed to damage to our reputation, additional costs, lost sales or possible regulatory action. The regulatory environment related to information security and privacy is constantly changing, and compliance with those requirements could result in additional costs. There is no guarantee that the procedures that we have implemented to protect against unauthorized access to secured data are adequate to safeguard against all data security breaches, and such a breach could potentially have a negative impact on our results of operations and financial condition.
Environmental legislation and regulations could affect our operations, such as by increasing fuel prices, and therefore increase our operating costs.
Initiatives to limit greenhouse gas emissions and bills related to climate change have been introduced in the U.S. Congress, which could adversely impact all industries. While it is uncertain whether these will become law, additional climate change related mandates could potentially be forthcoming, and these mandates, if enacted, could adversely impact our costs, including, among other things, increasing fuel prices.
| Item 1B. | Unresolved Staff Comments |
Not applicable.
| Item 2. | Properties |
Distribution centers and other properties
We currently operate 23 regional distribution centers (“DC”s). As of December 31, 2011, we leased eight DCs (2.8 million operating square footage) and owned 15 DCs (5.7 million operating square footage) for total DC square footage of 8.5 million. The following table provides certain information regarding our administrativeDCs, returns facilities and corporate offices and distribution centers (“DC”) as of December 31, 2010:2011:
Location | Principal Use(s) | Operating Square Footage (1) | Interest | Lease Term Expiration | ||||||||
Atlanta, GA | Distribution Center | 492,350 | Leased | 12/31/2024 | ||||||||
Belleville, MI | Distribution Center | 333,262 | Leased | 2/28/2015 | ||||||||
Billings, MT | Distribution Center | 108,300 | Leased | 1/31/2031 | ||||||||
Dallas, TX | Distribution Center | 442,000 | Owned | |||||||||
Denver, CO | Distribution Center | 321,242 | Owned | |||||||||
Des Moines, IA | Distribution Center | 253,886 | Owned | |||||||||
| ||||||||||||
Greensboro, NC | Distribution Center | 441,600 | Owned | |||||||||
Houston, TX | Distribution Center | 532,615 | Owned | |||||||||
Indianapolis, IN | Distribution Center | 657,603 | Owned | |||||||||
Kansas City, MO | Distribution Center | 299,018 | Owned | |||||||||
Knoxville, TN | Distribution Center | 150,766 | Owned | |||||||||
Little Rock, AR | Distribution Center | 122,969 | Leased | 3/31/2017 | ||||||||
Lubbock, TX | Distribution Center | 276,896 | Owned | |||||||||
Mobile, AL | Distribution Center | 301,068 | Leased | 12/31/2022 | ||||||||
Moreno Valley, CA | Distribution Center | 547,478 | Owned | |||||||||
Nashville, TN | Distribution Center | 315,977 | Leased | 12/31/2018 | ||||||||
Oklahoma City, OK | Distribution Center | 320,667 | Owned | |||||||||
Phoenix, AZ | Distribution Center | 383,570 | Leased | 6/22/2015 | ||||||||
Salt Lake City, UT | Distribution Center | 294,932 | Owned | |||||||||
Seattle, WA | Distribution Center | 533,790 | Owned | |||||||||
Springfield, MO | Distribution Center | 328,721 | Owned | |||||||||
Stockton, CA | Distribution Center | 720,836 | Leased | 6/30/2025 | ||||||||
St. Paul, MN | Distribution Center | 324,668 | Owned | |||||||||
Auburn, WA | Bulk Facility | 81,761 | Leased | 6/30/2018 | ||||||||
Commerce, CA | Bulk Facility | 75,000 | Leased | 8/31/2013 | ||||||||
McAllen, TX | Bulk Facility | 24,560 | Leased | 4/30/2017 | ||||||||
Springfield, MO | Bulk Facility | 35,200 | Owned | |||||||||
Springfield, MO | Return/Deconsolidation Facility | |||||||||||
| Owned | |||||||||||
Phoenix, AZ | Corporate Offices | 174,664 | Leased | 10/31/2012 | ||||||||
Springfield, MO | Corporate Offices | 435,600 | Owned | |||||||||
Springfield, MO | Corporate Offices | 34,617 | Leased | 8/31/2024 | ||||||||
Springfield, MO | Corporate Offices, Training and Technical Center | 22,000 | Owned | |||||||||
Total operating square footage | 9,636,096 | |||||||||||
Includes floor and mezzanine operating square footage, excludes subleased square footage |
| (2) | Occupied under the terms of a lease |
Of the 3,57023 DCs that we operated at December 31, 2011, 15 were owned and 8 were leased. The leased facilities typically require a fixed base rent, payment of certain tax, insurance and maintenance expense and have an original term of, at a minimum, 20 years, subject to one five-year renewal at our option. One of our bulk facilities is leased from an entity owned by an affiliated director’s immediate family. This lease requires payment of a fixed base rent, payment of certain tax, insurance and maintenance expenses and an original term of 15 years, subject to three five-year renewals at our option. We believe that this lease agreement with the affiliated entity is on terms comparable to those obtainable from third parties.
Of the 3,740 stores that we operated at December 31, 2010, 1,1722011, 1,286 stores were owned, 2,3282,381 stores were leased from unaffiliated parties and 7077 stores were leased from oneentities in which certain of four entities owned by O’Reillyour affiliated directors, members of our affiliated director’s immediate family, members.or our executive officers, are affiliated. Leases with unaffiliated parties generally provide for payment of a fixed base rent, payment of certain tax, insurance and maintenance expenses and an original term of, at a minimum, 10 years, subject to one or more renewals at our option. We have entered into separate master lease agreements with each of the affiliated entities for the occupancy of the stores covered thereby. Such master lease agreements with two of the three O’Reilly familysix affiliated entities have been modified to extend the term of the lease agreement for specific stores. The master lease agreements or modifications thereto expire on dates ranging from March 31, 2011,2013, to December 31, 2029.September 30, 2031. We believe that the lease agreements with the affiliated entities are on terms comparable to those obtainable from third parties.
We believe that our present facilities are in good condition, are adequately insured and are adequate for the conduct of our current operations. The store servicing capability of our 23 existing DCs is approximately 4,2504,340 stores, providing a growth capacity for over 680of more than 500 stores. We believe this growth capacity will provide us with the DC infrastructure needed for near termnear-term expansion without the need for additional DC facilities.
| Item 3. | Legal Proceedings |
O’Reilly Litigation:
O’Reilly is currently involved in litigation incidental to the ordinary conduct of the Company’s business. The Company records reserves for litigation losses in instances where a material adverse outcome is probable and the Company is able to reasonably estimate the probable loss. The Company reserves for an estimate of material legal costs to be incurred in pending litigation matters. Although the Company cannot ascertain the amount of liability that it may incur from any of these matters, it does not currently believe that, in the aggregate, these matters, taking into account applicable insurance and reserves, will have a material adverse effect on its consolidated financial position, results of operations or cash flows in a particular quarter or annual period.
In addition, O’Reilly is involved in resolving the governmental investigations that were being conducted against CSK and CSK’s former officers and other litigation, prior to its acquisition by O’Reilly, Automotive, Inc. as described below.
CSK Pre-Acquisition Matters – Governmental Investigations and Actions:
As previously reported, the pre-acquisition Securities and Exchange Commission (“SEC”) investigationgovernmental investigations of CSK which commenced in 2006, was settled in Mayregarding its legacy pre-acquisition accounting practices have concluded.
CSK’s former Controller and its former Director of Credit and Receivables pled guilty to obstruction of justice on April 7, 2009 by administrative order without fines, disgorgement or other financial remedies. The Department of Justice (“DOJ”)’s criminal investigation into these same mattersand April 15, 2009, respectively, as previously disclosed is near a conclusion and is described more fully below. In addition, thereported. They were sentenced on November 7, 2011. CSK’s former Chief Financial Officer was sentenced, as previously reported, SEC complainton September 19, 2011. No appeal followed. Accordingly, with the sentencing on November 7, 2011, criminal proceedings against three (3) former CSK employees of CSK for alleged conduct related to CSK’s historical accounting practices remains ongoing. have reached finality.
The action filed by the SEC on July 22, 2009, against Maynard L. Jenkins, the former Chief Executive Officer of CSK, seeking reimbursement from Mr. Jenkins of certain bonuses and stock sale profits pursuant to Section 304 of the Sarbanes-Oxley Act of 2002, as previously reported, has also continues. reached finality. On November 16, 2011, the Court entered a Final Judgment which required Mr. Jenkins to reimburse $2.8 million to the Company as successor SEC issuer to CSK Auto Corp. Since entry of the Final Judgment, the payment obligation created thereunder has been satisfied and O’Reilly has recorded the reimbursement as an adjustment to operating income in the fourth quarter of 2011.
The previously reported DOJ criminal prosecution of Don Watson,SEC civil action for alleged misconduct related to CSK’s historical accounting practices against the former Chief Financial Officer, Controller and Director of Credit and Receivables of CSK, remains ongoing with trial set to commenceongoing. However, on or about June 7, 2011.
With respectJanuary 20, 2012, the parties filed a “Joint Report On Settlement Talks” wherein they report that offers of settlement had been made which would be presented to the ongoing DOJ investigation into CSK’s pre-acquisition accounting practices as referenced above, as previously disclosed, O’ReillyCommission for its consideration and approval. The parties have requested a “complete litigation standstill” while the DOJ agreed in principle, subject to final documentation, to resolveCommission considers the DOJ investigation of CSK’s legacy pre-acquisition accounting practices. The Company and the DOJ continue work to complete the final documentation necessary for the execution of the Non-Prosecution Agreement previously referenced and payment of the one-time monetary penalty of $20.9 million, also previously reported. The Company’s total reserve related to the DOJ investigation of CSK was $21.4 million as of December 31, 2010, which relates to the amount of the monetary penalty and associated legal costs.
Notwithstanding the agreement in principle with the DOJ, several of CSK’s former directors or officers and current or former employees have been or may be interviewed or deposed as part of criminal, administrative and civil investigations and lawsuits. As described above, certain former employees of CSK are the subject of civil and criminal litigation commenced by the government.settlement offers made. Under Delaware law, the charter documents of the CSK entities, and certain indemnification agreements, CSK hasmay have certain indemnification obligations to indemnify these personsin connection with the SEC civil action, and, as a result, O’Reilly is currently incurring legal fees on behalf of these persons in relation to pending matters.the ongoing SEC litigation. Some of these indemnification obligations and other related costs may not be covered by CSK’s insurance policies.
As a result of the CSK acquisition, O’Reilly has incurred and expects to continue to incur ongoingadditional legal fees and costs related to the indemnity obligations related toarising from the litigation that has commenced by the DOJ and SEC ofagainst CSK’s former employees.employees until final resolution of the remaining matters. O’Reilly has a remaining reserve, with respect to suchthe indemnification obligations of $18.8$14.1 million as ofat December 31, 2010,2011, which was primarily recordedrelates to both expected additional legal fees and costs and to the payment of those legal fees and costs already incurred.
The remaining litigation, as an assumed liability in the Company’s allocation of the purchase price of CSK.
The foregoing governmental investigations and indemnification matters aredescribed above, is subject to many uncertainties,uncertainty, and, given theirits complexity and scope, theirthe final outcome cannot be predicted at this time. It is possible that in a particular quarter or annual period the Company’s results of operations and cash flows could be materially affected by an ultimate unfavorable resolution of such matters,matter, depending, in part, upon the results of operations or cash flows for such period. However, at this time, management believes that the ultimate outcome of all of such regulatory proceedings and otherthe pending matters, that are pending, after consideration of applicable reserves and potentially available insurance coverage benefits not contemplated in recorded reserves should not have a material adverse effect on the Company’s consolidated financial condition, results of operations andor cash flows.
| Item 4. |
Not applicable.
PART II
| Item 5. | Market For Registrant’s Common Equity, Related |
The Company’sCommon stock:
Shares of O’Reilly Automotive, Inc. (the “Company”) common stock isare traded on The NASDAQ Global Select Market (“Nasdaq”) under the symbol “ORLY”. As of February 21, 2011, O’Reilly Automotive, Inc. had approximately 86,000 shareholders based on the number of holders of record and an estimate of individual participants represented by security position listings. The Company’s common stock began trading on April 22, 1993; no cash dividends have been declared since that time, and we do not anticipate paying any cash dividends in the foreseeable future.
As of February 20, 2012, the Company had approximately 96,000 shareholders of common stock based on the number of holders of record and an estimate of individual participants represented by security position listings.
The prices in the following table represent the high and low sales price for O’Reilly Automotive, Inc.the Company’s common stock as reported by Nasdaq. During fiscal 2010,
| 2011 | 2010 | |||||||||||||||
| High | Low | High | Low | |||||||||||||
First Quarter | $ | 60.69 | $ | 54.42 | $ | 43.00 | $ | 37.73 | ||||||||
Second Quarter | 65.51 | 55.38 | 51.40 | 41.61 | ||||||||||||
Third Quarter | 71.72 | 56.91 | 54.07 | 46.07 | ||||||||||||
Fourth Quarter | 81.70 | 64.97 | 63.04 | 52.84 | ||||||||||||
For the Year | 81.70 | 54.42 | 63.04 | 37.30 | ||||||||||||
Sales of unregistered securities:
There were no sales of unregistered securities during the year ended December 31, 2011.
Issuer purchases of equity securities:
The following table identifies all repurchases during the fourth quarter ended December 31, 2011, of any of the Company’s securities registered under Section 12 of the Exchange Act, as amended, by or on behalf of the Company made no purchases or repurchasesany affiliated purchaser (in thousands, except per share amounts):
| Issuer Purchases of Equity Securities | ||||||||||||||||
Period | Total Number of Shares Purchased | Average Price Paid per Share | Total Number of Shares Purchased as Part of Publicly Announced Programs | Maximum Dollar Value of Shares that May Yet Be Purchased Under the Programs (1) | ||||||||||||
October 1, 2011, through October 31, 2011 | 291 | $ | 65.81 | 291 | $ | 140,869 | ||||||||||
November 1, 2011, through November 30, 2011 | 581 | 75.32 | 581 | 597,160 | ||||||||||||
December 1, 2011, through December 31, 2011 | 932 | 78.82 | 932 | 523,678 | ||||||||||||
|
|
|
|
|
| |||||||||||
Total for the quarter ended December 31, 2011 | 1,804 | $ | 75.60 | 1,804 | ||||||||||||
|
|
|
|
|
| |||||||||||
| (1) | On January 11, 2011, the Company announced a $500 million share repurchase program, which was approved by the Board of Directors, scheduled to expire on January 10, 2014. On August 5, and November 16, 2011, the Company announced that its Board of Directors approved resolutions to increase the authorization under the repurchase program by additions of $500 million each, raising the cumulative authorization under the repurchase program to $1.5 billion. The additional $500 million authorizations are scheduled to expire on August 5, 2014 and November 16, 2014, respectively. Under the program, the Company may, from time to time, repurchase shares of its common stock solely through open market purchases effected through a broker dealer at prevailing market prices. No other share repurchase programs existed during the year ended December 31, 2011. |
The Company repurchased a total of 15.9 million shares of its common stock.stock under its publicly announced share repurchase program during the year ended December 31, 2011, at an average price per share of $61.49. Subsequent to December 31, 2011, and up to and including February 28, 2012, the Company repurchased an additional 0.6 million shares of its common stock at an average price per share of $83.39, for a total investment of $48 million, excluding fees and commissions.
Stock performance graph:
| 2010 | 2009 | |||||||||||||||
| High | Low | High | Low | |||||||||||||
First Quarter | $ | 43.00 | $ | 37.73 | $ | 35.63 | $ | 27.00 | ||||||||
Second Quarter | 51.40 | 41.61 | 38.85 | 35.08 | ||||||||||||
Third Quarter | 54.07 | 46.07 | 42.22 | 36.14 | ||||||||||||
Fourth Quarter | 63.04 | 52.84 | 40.26 | 33.68 | ||||||||||||
For the Year | 63.04 | 37.73 | 42.22 | 27.00 | ||||||||||||
The graph below shows the cumulative total stockholdershareholder return assuming the investment of $100, on December 31, 2005,29, 2006, and the reinvestment of dividends thereafter, in the Company’s common stock versus the Nasdaq Retail Trade Stocks Total Return Index, Nasdaq United States Stock Market Total Returns Index (“Nasdaq US”) and the Standard and Poor’s S&P 500 Index (“S&P 500”).
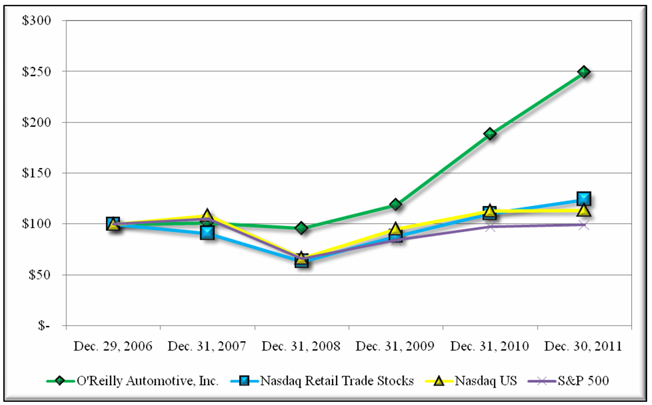
| For the Years Ended December 31, | ||||||||||||||||||||||||||||||||||||||||||||||||
Company/Index | 2005 | 2006 | 2007 | 2008 | 2009 | 2010 | Dec. 29, 2006 | Dec. 31, 2007 | Dec. 31, 2008 | Dec. 31, 2009 | Dec. 31, 2010 | Dec. 30, 2011 | ||||||||||||||||||||||||||||||||||||
O’Reilly Automotive, Inc. | $ | 100 | $ | 100 | $ | 101 | $ | 96 | $ | 119 | $ | 189 | $ | 100 | $ | 101 | $ | 96 | $ | 119 | $ | 188 | $ | 249 | ||||||||||||||||||||||||
Nasdaq Retail Trade Stocks | 100 | 109 | 99 | 69 | 96 | 121 | 100 | 91 | 63 | 88 | 110 | 124 | ||||||||||||||||||||||||||||||||||||
Nasdaq US | 100 | 110 | 119 | 57 | 82 | 98 | 100 | 108 | 66 | 95 | 113 | 114 | ||||||||||||||||||||||||||||||||||||
Standard and Poor’s S&P 500 | 100 | 116 | 122 | 77 | 97 | 112 | ||||||||||||||||||||||||||||||||||||||||||
S&P 500 | 100 | 105 | 66 | 84 | 97 | 99 | ||||||||||||||||||||||||||||||||||||||||||
| Item 6. | Selected Financial Data |
The table below compares the Company’sO’Reilly Automotive, Inc.’s (the “Company’s”) selected financial data over a ten-year period. In 2001, 2005 and 2008, the Company acquired Mid-State Automotive Distributors, Midwest Auto Parts Distributors and CSK Auto Corporation (“CSK”), respectively. The 2001 Mid-State acquisition added 82 stores, the 2005 Midwest acquisition added 72 stores and the 2008 CSK acquisition added 1,342 stores to the O’Reilly store count. Financial results for these acquired companies have been included in the Company’s consolidated financial statements from the dates of the acquisitions forward.
Years ended December 31, | 2010 | 2009 | 2008 | 2007 | 2006 | 2005 | 2004 | 2003 | 2002 | 2001 | 2011 | 2010 | 2009 | 2008 | 2007 | 2006 | 2005 | 2004 | 2003 | 2002 | ||||||||||||||||||||||||||||||||||||||||||||||||||||||||||||
| (In thousands, except per share data) | ||||||||||||||||||||||||||||||||||||||||||||||||||||||||||||||||||||||||||||||||
INCOME STATEMENT DATA: | ||||||||||||||||||||||||||||||||||||||||||||||||||||||||||||||||||||||||||||||||
Sales | $ | 5,397,525 | $ | 4,847,062 | $ | 3,576,553 | $ | 2,522,319 | $ | 2,283,222 | $ | 2,045,318 | $ | 1,721,241 | $ | 1,511,816 | $ | 1,312,490 | $ | 1,092,112 | $ | 5,788,816 | $ | 5,397,525 | $ | 4,847,062 | $ | 3,576,553 | $ | 2,522,319 | $ | 2,283,222 | $ | 2,045,318 | $ | 1,721,241 | $ | 1,511,816 | $ | 1,312,490 | ||||||||||||||||||||||||||||||||||||||||
Cost of goods sold, including warehouse and distribution expenses | 2,776,533 | 2,520,534 | 1,948,627 | 1,401,859 | 1,276,511 | 1,152,815 | 978,076 | 873,481 | 759,090 | 624,294 | 2,951,467 | 2,776,533 | 2,520,534 | 1,948,627 | 1,401,859 | 1,276,511 | 1,152,815 | 978,076 | 873,481 | 759,090 | ||||||||||||||||||||||||||||||||||||||||||||||||||||||||||||
|
|
|
|
|
|
|
|
|
| |||||||||||||||||||||||||||||||||||||||||||||||||||||||||||||||||||||||
Gross profit | 2,620,992 | 2,326,528 | 1,627,926 | 1,120,460 | 1,006,711 | 892,503 | 743,165 | 638,335 | 553,400 | 467,818 | 2,837,349 | 2,620,992 | 2,326,528 | 1,627,926 | 1,120,460 | 1,006,711 | 892,503 | 743,165 | 638,335 | 553,400 | ||||||||||||||||||||||||||||||||||||||||||||||||||||||||||||
Selling, general and administrative expenses | 1,887,316 | 1,788,909 | 1,292,309 | 815,309 | 724,396 | 639,979 | 552,707 | 473,060 | 415,099 | 353,987 | 1,973,381 | 1,887,316 | 1,788,909 | 1,292,309 | 815,309 | 724,396 | 639,979 | 552,707 | 473,060 | 415,099 | ||||||||||||||||||||||||||||||||||||||||||||||||||||||||||||
Legacy CSK DOJ investigation settlement | 20,900 | — | — | — | — | — | — | — | — | — | ||||||||||||||||||||||||||||||||||||||||||||||||||||||||||||||||||||||
Former CSK officer clawback | (2,798 | ) | — | — | — | — | — | — | — | — | — | |||||||||||||||||||||||||||||||||||||||||||||||||||||||||||||||||||||
Legacy CSK DOJ investigation charge | — | 20,900 | — | — | — | — | — | — | — | — | ||||||||||||||||||||||||||||||||||||||||||||||||||||||||||||||||||||||
|
|
|
|
|
|
|
|
|
| |||||||||||||||||||||||||||||||||||||||||||||||||||||||||||||||||||||||
Operating income | 712,776 | 537,619 | 335,617 | 305,151 | 282,315 | 252,524 | 190,458 | 165,275 | 138,301 | 113,831 | 866,766 | 712,776 | 537,619 | 335,617 | 305,151 | 282,315 | 252,524 | 190,458 | 165,275 | 138,301 | ||||||||||||||||||||||||||||||||||||||||||||||||||||||||||||
Write-off of asset-based revolving credit agreement debt issuance costs | (21,626 | ) | — | — | — | — | — | — | — | — | — | |||||||||||||||||||||||||||||||||||||||||||||||||||||||||||||||||||||
Termination of interest rate swap agreements | (4,237 | ) | — | — | — | — | — | — | — | — | — | |||||||||||||||||||||||||||||||||||||||||||||||||||||||||||||||||||||
Gain on settlement of note receivable | 11,639 | — | — | — | — | — | — | — | — | — | — | 11,639 | — | — | — | — | — | — | — | — | ||||||||||||||||||||||||||||||||||||||||||||||||||||||||||||
Other income (expense), net | (35,042 | ) | (40,721 | ) | (33,085 | ) | 2,337 | (50 | ) | (1,455 | ) | (2,721 | ) | (5,233 | ) | (7,319 | ) | (7,104 | ) | (25,130 | ) | (35,042 | ) | (40,721 | ) | (33,085 | ) | 2,337 | (50 | ) | (1,455 | ) | (2,721 | ) | (5,233 | ) | (7,319 | ) | ||||||||||||||||||||||||||||||||||||||||||
|
|
|
|
|
|
|
|
|
| |||||||||||||||||||||||||||||||||||||||||||||||||||||||||||||||||||||||
Total other income (expense) | (23,403 | ) | (40,721 | ) | (33,085 | ) | 2,337 | (50 | ) | (1,455 | ) | (2,721 | ) | (5,233 | ) | (7,319 | ) | (7,104 | ) | (50,993 | ) | (23,403 | ) | (40,721 | ) | (33,085 | ) | 2,337 | (50 | ) | (1,455 | ) | (2,721 | ) | (5,233 | ) | (7,319 | ) | ||||||||||||||||||||||||||||||||||||||||||
|
|
|
|
|
|
|
|
|
| |||||||||||||||||||||||||||||||||||||||||||||||||||||||||||||||||||||||
Income before income taxes and cumulative effect of accounting change | 689,373 | 496,898 | 302,532 | 307,488 | 282,265 | 251,069 | 187,737 | 160,042 | 130,982 | 106,727 | 815,773 | 689,373 | 496,898 | 302,532 | 307,488 | 282,265 | 251,069 | 187,737 | 160,042 | 130,982 | ||||||||||||||||||||||||||||||||||||||||||||||||||||||||||||
Provision for income taxes | 270,000 | 189,400 | 116,300 | 113,500 | 104,180 | 86,803 | 70,063 | 59,955 | 48,990 | 40,375 | 308,100 | 270,000 | 189,400 | 116,300 | 113,500 | 104,180 | 86,803 | 70,063 | 59,955 | 48,990 | ||||||||||||||||||||||||||||||||||||||||||||||||||||||||||||
|
|
|
|
|
|
|
|
|
| |||||||||||||||||||||||||||||||||||||||||||||||||||||||||||||||||||||||
Income before cumulative effect of accounting change | 419,373 | 307,498 | 186,232 | 193,988 | 178,085 | 164,266 | 117,674 | 100,087 | 81,992 | 66,352 | 507,673 | 419,373 | 307,498 | 186,232 | 193,988 | 178,085 | 164,266 | 117,674 | 100,087 | 81,992 | ||||||||||||||||||||||||||||||||||||||||||||||||||||||||||||
Cumulative effect of accounting change, net of tax (a) | — | — | — | — | — | — | 21,892 | — | — | — | — | — | — | — | — | — | — | 21,892 | — | — | ||||||||||||||||||||||||||||||||||||||||||||||||||||||||||||
|
|
|
|
|
|
|
|
|
| |||||||||||||||||||||||||||||||||||||||||||||||||||||||||||||||||||||||
Net income | $ | 419,373 | $ | 307,498 | $ | 186,232 | $ | 193,988 | $ | 178,085 | $ | 164,266 | $ | 139,566 | $ | 100,087 | $ | 81,992 | $ | 66,352 | $ | 507,673 | $ | 419,373 | $ | 307,498 | $ | 186,232 | $ | 193,988 | $ | 178,085 | $ | 164,266 | $ | 139,566 | $ | 100,087 | $ | 81,992 | ||||||||||||||||||||||||||||||||||||||||
|
|
|
|
|
|
|
|
|
| |||||||||||||||||||||||||||||||||||||||||||||||||||||||||||||||||||||||
BASIC EARNINGS PER COMMON SHARE: | ||||||||||||||||||||||||||||||||||||||||||||||||||||||||||||||||||||||||||||||||
BASIC EARNINGS PER COMMON SHARE: (b) | ||||||||||||||||||||||||||||||||||||||||||||||||||||||||||||||||||||||||||||||||
Income before cumulative effect of accounting change | $ | 3.02 | $ | 2.26 | $ | 1.50 | $ | 1.69 | $ | 1.57 | $ | 1.47 | $ | 1.07 | $ | 0.93 | $ | 0.77 | $ | 0.64 | $ | 3.77 | $ | 3.02 | $ | 2.26 | $ | 1.50 | $ | 1.69 | $ | 1.57 | $ | 1.47 | $ | 1.07 | $ | 0.93 | $ | 0.77 | ||||||||||||||||||||||||||||||||||||||||
Cumulative effect of accounting change (a) | — | — | — | — | — | — | 0.20 | — | — | — | — | — | — | — | — | — | — | 0.20 | — | — | ||||||||||||||||||||||||||||||||||||||||||||||||||||||||||||
|
|
|
|
|
|
|
|
|
| |||||||||||||||||||||||||||||||||||||||||||||||||||||||||||||||||||||||
Earnings per share – basic | $ | 3.02 | $ | 2.26 | $ | 1.50 | $ | 1.69 | $ | 1.57 | $ | 1.47 | $ | 1.27 | $ | 0.93 | $ | 0.77 | $ | 0.64 | $ | 3.77 | $ | 3.02 | $ | 2.26 | $ | 1.50 | $ | 1.69 | $ | 1.57 | $ | 1.47 | $ | 1.27 | $ | 0.93 | $ | 0.77 | ||||||||||||||||||||||||||||||||||||||||
|
|
|
|
|
|
|
|
|
| |||||||||||||||||||||||||||||||||||||||||||||||||||||||||||||||||||||||
Weighted-average common shares outstanding – basic | 138,654 | 136,230 | 124,526 | 114,667 | 113,253 | 111,613 | 110,020 | 107,816 | 106,228 | 104,242 | 134,667 | 138,654 | 136,230 | 124,526 | 114,667 | 113,253 | 111,613 | 110,020 | 107,816 | 106,228 | ||||||||||||||||||||||||||||||||||||||||||||||||||||||||||||
|
|
|
|
|
|
|
|
|
| |||||||||||||||||||||||||||||||||||||||||||||||||||||||||||||||||||||||
EARNINGS PER COMMON SHARE-ASSUMING DILUTION: | ||||||||||||||||||||||||||||||||||||||||||||||||||||||||||||||||||||||||||||||||
Income before cumulative effect of accounting change | $ | 2.95 | $ | 2.23 | $ | 1.48 | $ | 1.67 | $ | 1.55 | $ | 1.45 | $ | 1.05 | $ | 0.92 | $ | 0.76 | $ | 0.63 | $ | 3.71 | $ | 2.95 | $ | 2.23 | $ | 1.48 | $ | 1.67 | $ | 1.55 | $ | 1.45 | $ | 1.05 | $ | 0.92 | $ | 0.76 | ||||||||||||||||||||||||||||||||||||||||
Cumulative effect of accounting change (a) | — | — | — | — | — | — | 0.20 | — | — | — | — | — | — | — | — | — | — | 0.20 | — | — | ||||||||||||||||||||||||||||||||||||||||||||||||||||||||||||
|
|
|
|
|
|
|
|
|
| |||||||||||||||||||||||||||||||||||||||||||||||||||||||||||||||||||||||
Earnings per share – assuming dilution | $ | 2.95 | $ | 2.23 | $ | 1.48 | $ | 1.67 | $ | 1.55 | $ | 1.45 | $ | 1.25 | $ | 0.92 | $ | 0.76 | $ | 0.63 | ||||||||||||||||||||||||||||||||||||||||||||||||||||||||||||
dilution | $ | 3.71 | $ | 2.95 | $ | 2.23 | $ | 1.48 | $ | 1.67 | $ | 1.55 | $ | 1.45 | $ | 1.25 | $ | 0.92 | $ | 0.76 | ||||||||||||||||||||||||||||||||||||||||||||||||||||||||||||
|
|
|
|
|
|
|
|
|
| |||||||||||||||||||||||||||||||||||||||||||||||||||||||||||||||||||||||
Weighted-average common shares outstanding – assuming dilution | 141,992 | 137,882 | 125,413 | 116,080 | 115,119 | 113,385 | 111,423 | 109,060 | 107,384 | 105,572 | 136,983 | 141,992 | 137,882 | 125,413 | 116,080 | 115,119 | 113,385 | 111,423 | 109,060 | 107,384 | ||||||||||||||||||||||||||||||||||||||||||||||||||||||||||||
|
|
|
|
|
|
|
|
|
| |||||||||||||||||||||||||||||||||||||||||||||||||||||||||||||||||||||||
PRO FORMA INCOME STATEMENT DATA: (b) | ||||||||||||||||||||||||||||||||||||||||||||||||||||||||||||||||||||||||||||||||
PRO FORMA INCOME STATEMENT DATA: (c) | ||||||||||||||||||||||||||||||||||||||||||||||||||||||||||||||||||||||||||||||||
Sales | $ | 1,511,816 | $ | 1,312,490 | $ | 1,092,112 | $ | 1,511,816 | $ | 1,312,490 | ||||||||||||||||||||||||||||||||||||||||||||||||||||||||||||||||||||||
Cost of goods sold, including warehouse and distribution expenses | 872,658 | 754,844 | 618,217 | 872,658 | 754,844 | |||||||||||||||||||||||||||||||||||||||||||||||||||||||||||||||||||||||||||
|
| |||||||||||||||||||||||||||||||||||||||||||||||||||||||||||||||||||||||||||||||
Gross profit | 639,158 | 557,646 | 473,895 | 639,158 | 557,646 | |||||||||||||||||||||||||||||||||||||||||||||||||||||||||||||||||||||||||||
Selling, general and administrative expenses | 473,060 | 415,099 | 353,987 | 473,060 | 415,099 | |||||||||||||||||||||||||||||||||||||||||||||||||||||||||||||||||||||||||||
|
| |||||||||||||||||||||||||||||||||||||||||||||||||||||||||||||||||||||||||||||||
Operating income | 166,098 | 142,547 | 119,908 | 166,098 | 142,547 | |||||||||||||||||||||||||||||||||||||||||||||||||||||||||||||||||||||||||||
Other income (expense), net | (5,233 | ) | (7,319 | ) | (7,104 | ) | (5,233 | ) | (7,319 | ) | ||||||||||||||||||||||||||||||||||||||||||||||||||||||||||||||||||||||
|
| |||||||||||||||||||||||||||||||||||||||||||||||||||||||||||||||||||||||||||||||
Income before income taxes | 160,865 | 135,228 | 112,804 | 160,865 | 135,228 | |||||||||||||||||||||||||||||||||||||||||||||||||||||||||||||||||||||||||||
Provision for income taxes | 60,266 | 50,595 | 42,672 | 60,266 | 50,595 | |||||||||||||||||||||||||||||||||||||||||||||||||||||||||||||||||||||||||||
|
| |||||||||||||||||||||||||||||||||||||||||||||||||||||||||||||||||||||||||||||||
Net income | $ | 100,599 | $ | 84,633 | $ | 70,132 | $ | 100,599 | $ | 84,633 | ||||||||||||||||||||||||||||||||||||||||||||||||||||||||||||||||||||||
|
| |||||||||||||||||||||||||||||||||||||||||||||||||||||||||||||||||||||||||||||||
Net income per share | $ | 0.93 | $ | 0.8 | $ | 0.67 | ||||||||||||||||||||||||||||||||||||||||||||||||||||||||||||||||||||||||||
Net income per share – assuming dilution | $ | 0.92 | $ | 0.79 | $ | 0.66 | ||||||||||||||||||||||||||||||||||||||||||||||||||||||||||||||||||||||||||
| (a) | The cumulative change in accounting method, effective January 1, 2004, changed the method of applying last-in, first-out accounting policy for certain inventory costs. Under the new method, included in the value of inventory are certain procurement, warehousing and distribution center costs. The previous method was to recognize those costs as incurred, reported as a component of costs of goods sold. |
| (b) | Adjusted for a 2 for 1 stock split in 2005. |
| (c) | The pro forma income statement reflects the retroactive application of the cumulative effect of the accounting change to historical periods. |
Years ended December 31, SELECTED OPERATING DATA: Number of stores at year-end (a) Total store square footage at year-end (in 000’s)(a)(b) Sales per weighted-average store ( in 000’s)(a)(b) Sales per weighted-average square foot (b) Percentage increase in same store sales (c)(d) BALANCE SHEET DATA: Working capital Total assets Current portion of long-term debt and short-term debt Long-term debt, less current portion Shareholders’ equity 2010 2009 2008 2007 2006 2005 2004 2003 2002 2001 (In thousands, except per share data) 3,570 3,421 3,285 1,830 1,640 1,470 1,249 1,109 981 875 25,315 24,200 23,205 12,439 11,004 9,801 8,318 7,348 6,408 5,882 $ 1,527 $ 1,424 $ 1,379 $ 1,430 $ 1,439 $ 1,478 $ 1,443 $ 1,413 $ 1,372 $ 1,426 $ 216 $ 202 $ 201 $ 212 $ 215 $ 220 $ 217 $ 215 $ 211 $ 219 8.8 % 4.6 % 1.5 % 3.7 % 3.3 % 7.5 % 6.8 % 7.8 % 3.7 % 8.8 % $ 1,072,294 $ 1,007,576 $ 821,932 $ 573,328 $ 566,892 $ 424,974 $ 479,662 $ 441,617 $ 483,623 $ 429,527 5,047,827 4,781,471 4,193,317 2,279,737 1,977,496 1,718,896 1,432,357 1,157,033 1,009,419 856,859 1,431 106,708 8,131 25,320 309 75,313 592 925 682 16,843 357,273 684,040 724,564 75,149 110,170 25,461 100,322 120,977 190,470 165,618 3,209,685 2,685,865 2,282,218 1,592,477 1,364,096 1,145,769 947,817 784,285 650,524 556,291
Years ended December 31, | 2011 | 2010 | 2009 | 2008 | 2007 | 2006 | 2005 | 2004 | 2003 | 2002 | ||||||||||||||||||||||||||||||
SELECTED OPERATING DATA: | ||||||||||||||||||||||||||||||||||||||||
Number of stores at year end (a) | 3,740 | 3,570 | 3,421 | 3,285 | 1,830 | 1,640 | 1,470 | 1,249 | 1,109 | 981 | ||||||||||||||||||||||||||||||
Total store square footage at year end (in 000s)(a)(b) | 26,530 | 25,315 | 24,200 | 23,205 | 12,439 | 11,004 | 9,801 | 8,318 | 7,348 | 6,408 | ||||||||||||||||||||||||||||||
Sales per weighted-average store (in 000s)(a)(b) | $ | 1,566 | $ | 1,527 | $ | 1,424 | $ | 1,379 | $ | 1,430 | $ | 1,439 | $ | 1,478 | $ | 1,443 | $ | 1,413 | $ | 1,372 | ||||||||||||||||||||
Sales per weighted-average square foot (in 000s)(b) | $ | 221 | $ | 216 | $ | 202 | $ | 201 | $ | 212 | $ | 215 | $ | 220 | $ | 217 | $ | 215 | $ | 211 | ||||||||||||||||||||
Percentage increase in same store sales (c)(d) | 4.6 | % | 8.8 | % | 4.6 | % | 1.5 | % | 3.7 | % | 3.3 | % | 7.5 | % | 6.8 | % | 7.8 | % | 3.7 | % | ||||||||||||||||||||
BALANCE SHEET DATA: | ||||||||||||||||||||||||||||||||||||||||
(In thousands) | ||||||||||||||||||||||||||||||||||||||||
Working capital | 1,027,600 | 1,072,294 | 1,007,576 | 821,932 | 573,328 | 566,892 | 424,974 | 479,662 | 441,617 | 483,623 | ||||||||||||||||||||||||||||||
Total assets | 5,500,501 | 5,047,827 | 4,781,471 | 4,193,317 | 2,279,737 | 1,977,496 | 1,718,896 | 1,432,357 | 1,157,033 | 1,009,419 | ||||||||||||||||||||||||||||||
Inventory turnover | 1.5 | 1.4 | 1.4 | 1.6 | 1.6 | 1.6 | 1.7 | 1.6 | 1.7 | 1.5 | ||||||||||||||||||||||||||||||
Inventory turnover, net of payables | 3.4 | 2.5 | 2.6 | 3.1 | 3.0 | 2.8 | 2.8 | 2.5 | 2.3 | 1.8 | ||||||||||||||||||||||||||||||
Accounts payable to inventory | 64.4 | % | 44.3 | % | 42.8 | % | 46.9 | % | 43.2 | % | 39.2 | % | 40.3 | % | 38.5 | % | 27.9 | % | 16.9 | % | ||||||||||||||||||||
Current portion of long-term debt and short-term debt | 662 | 1,431 | 106,708 | 8,131 | 25,320 | 309 | 75,313 | 592 | 925 | 682 | ||||||||||||||||||||||||||||||
Long-term debt, less current portion | 796,912 | 357,273 | 684,040 | 724,564 | 75,149 | 110,170 | 25,461 | 100,322 | 120,977 | 190,470 | ||||||||||||||||||||||||||||||
Shareholders’ equity | 2,844,851 | 3,209,685 | 2,685,865 | 2,282,218 | 1,592,477 | 1,364,096 | 1,145,769 | 947,817 | 784,285 | 650,524 | ||||||||||||||||||||||||||||||
| (a) | Store count for 2002 does not include 27 stores acquired from Dick Smith Enterprises and Davie Automotive, Inc. in December 2002. |
| (b) | Total square footage includes normal selling, office, stockroom and receiving space. Sales per weighted-average store and square foot are weighted to consider the approximate dates of store openings or expansions. |
| (c) | Same-store sales are calculated based on the change in sales of stores open at least one year. Percentage increase in same-store sales is calculated based on store sales results, which exclude sales of specialty machinery, sales by outside salesmen, sales to |
| (d) | Same-store sales for 2008 include sales for stores acquired in the CSK acquisition. Comparable stores sales for stores operating on O’Reilly systems open at least one year increased 2.6% for the year ended December 31, 2008. Comparable stores sales for stores operating on the legacy CSK system open at least one year decreased 1.7% for the portion of CSK’s sales in 2008 since the July 11, 2008, acquisition. |
| Item 7. | Management’s Discussion and Analysis of Financial Condition and Results of Operations |
In Management’s Discussion and Analysis, we provide a historical and prospective narrative of our general financial condition, results of operations, liquidity and certain other factors that may affect our future results, including:
an overview of the key drivers of the automotive aftermarket;aftermarket industry;
key events and recent developments within our company;
our results of operations for the years ended 2011, 2010 2009 and 2008;2009;
our liquidity and capital resources;
any off balanceoff-balance sheet arrangements we utilize;
our guidance for selected financial metrics;
any contractual obligations to which we are committed;
our critical accounting estimates;
the inflation and seasonality of our business;
our quarterly results for the years ended December 31, 2010,2011, and 2009;2010; and
newrecent accounting standardspronouncements that may affect our company.
The review of Management’s Discussion and Analysis should be made in conjunction with our consolidated financial statements, related notes and other financial information included elsewhere in this annual report.
FORWARD-LOOKING STATEMENTS
We claim the protection of the safe-harbor for forward-looking statements within the meaning of the Private Securities Litigation Reform Act of 1995. You can identify these statements by forward-looking words such as “expect,” “believe,” “anticipate,” “should,” “plan,” “intend,” “estimate,” “project,” “will” or similar words. In addition, statements contained within this annual report that are not historical facts are forward-looking statements, such as statements discussing among other things, expected growth, store development, CSK Auto Corporation (“CSK”) Department of Justice (“DOJ”) investigation resolution, integration and expansion strategy, business strategies, future revenues and future performance. These forward-looking statements are based on estimates, projections, beliefs and assumptions and are not guarantees of future events and results. Such statements are subject to risks, uncertainties and assumptions, including, but not limited to, competition, product demand, the market for auto parts, the economy in general, inflation, consumer debt levels, governmental approvals,regulations, our increased debt levels, credit ratings on our public debt, our ability to hire and retain qualified employees, risks associated with the integrationperformance of acquired businesses including the acquisition and integration ofsuch as CSK Auto Corporation (“CSK”), weather, terrorist activities, war and the threat of war. Actual results may materially differ from anticipated results described or implied in these forward-looking statements. Please refer to the “Risk Factors” section of this annual report on Form 10-K for the year ended December 31, 2010,2011, for additional factors that could materially affect our financial performance. We undertake no obligation to publicly update any forward-looking statements, whether as a result of new information, future events or otherwise.
OVERVIEW
We are a specialty retailer of automotive aftermarket parts, tools, supplies, equipment and accessories in the United States. We are one of the largest automotive aftermarket specialty retailers, selling our products to both do-it-yourself (DIY)(“DIY”) customers and professional service providers. Our stores carry an extensive product line consisting of new and remanufactured automotive hard parts, maintenance items, and accessories, and a complete line of auto body paint and related materials, automotive tools and professional service provider service equipment. As of December 31, 2010, we operated 3,570 stores in 38 states.
Operating within the retail industry, we, along with other retail companies, are influenced by a number of general macroeconomic factors including, but not limited to, fuel costs, unemployment rates, consumer preferences and spending habits and competition. The difficult conditions that affected the overall macroeconomic environment in recent years continue to impact our Company and the retail sector in general. We cannot predict whether, when, or the manner in which, these economic conditions will change.
We believe that the number of U.S. miles driven, number of U.S. registered vehicles, average vehicle age, new light vehicle sales, unperformed maintenance, unemployment andOur extensive product quality differentiation are key drivers of current and future demand of products sold within the automotive aftermarket.
Number of miles driven:
Total miles driven in the U.S., along with changes in the average age of vehicles on the road, heavily influence the demand for the repair and maintenance products we sell. Historically, the long-term trend in the total miles driven in the U.S. has steadily increased. According to the Department of Transportation, between 1999 and 2007, the total number of miles driven in the U.S. increased at an average annual rate of approximately 1.6%. In 2008, however, difficult macroeconomic conditions and record high gas prices during the first half of the year led to a decrease in the number of miles driven and in 2009, miles driven remained relatively flat. Through November of 2010, miles driven in the U.S. increased by 0.7% with miles driven increasing each month since March. As the U.S. economy recovers, we believe that annual miles driven will return to historical growth rates and continue to increase the demand for our products.
Number of U.S. registered vehicles and new light vehicle sales:
As reported by the Automotive Aftermarket Industry Association (“AAIA”), the total number of vehicles on the road in the U.S. has exhibited steady growth over the past decade, with the total number of registered vehicles increasing 18%, from 205 million light vehicles in 2000 to 242 million in 2009. New light vehicle sales, however, have declined over the past decade. Between 2000 and 2007, new car sales in the U.S. decreased by 7%, from 17.4 million in 2000 to 16.2 million vehicles in 2007. Due to the recent difficult macroeconomic environment in the U.S., new light vehicles sales declined by 18% in 2008 to 13.2 million and declined by 21% in 2009 to 10.4 million vehicles, which is the lowest level in the past decade. Based on the current economic environment, we believe new light vehicle sales will remain below historic levels and consumers will continue to keep their vehicles longer and drive them at higher miles, continuing the trend of an aging vehicle population.
Average vehicle age of registered vehicles:
As reported by the AAIA, the average age of the U.S. vehicle population has increased over the past decade from 9.1 years for passenger cars and 8.5 years for light trucks in 1999 to 10.6 and 9.6 years in 2009, respectively. We believe this increase in average age can be attributed to better engineered and built vehicles, which can be reliably driven at higher miles due to better quality power trains, and interiors and exteriors, the decrease in new car sales over the past two years and the consumers’ willingness to invest in maintaining their higher-mileage, better built vehicles. As the average age of the vehicle on the road increases, a larger percentage of miles are being driven by vehicles which are outside of manufacturer warranty. These out-of-warranty, older vehicles generate strong demand for our products as they go through more routine maintenance cycles, have more frequent mechanical failures which require replacement parts and generally require more maintenance than newer vehicles would require.
Unperformed maintenance:
According to estimates compiled by the Automotive Aftermarket Suppliers Association, the annual amount of unperformed or underperformed maintenance in the U.S. totaled $54 billion for 2009 versus $50 billion for 2008. This metric represents the degree to which routine vehicle maintenance recommended by the manufacturer is not being performed. Consumer decisions to avoid or defer maintenance affect demand for our products, and the total amount of unperformed maintenance represents potential future demand. We believe that challenging macroeconomic conditions beginning in 2008 contributed to the increased amount of unperformed maintenance in 2009; however, with the reduced number of new car sales and consumers’ increased focus on maintaining their current vehicle with the expectation of keeping the vehicle longer than they would have in a better macroeconomic environment, we believe the amount of underperformed maintenance decreased in 2010, resulting in a strong year in the automotive aftermarket.
Unemployment:
Challenging macroeconomic conditions have lead to high levels of unemployment. Monthly U.S. unemployment rates for 2010 ranged from 9.4% to 9.9%. We believe that these unemployment rates and continued uncertainty in the overall economic health have a negative impact on consumer confidence and the level of consumer discretionary spending. We also believe macroeconomic uncertainties and the potential for future joblessness can motivate consumers to find ways to save money and can be an important factor in the consumer’s decision to defer the purchase of a new vehicle. While the deferral of vehicle purchases has lead to an increase in vehicle maintenance, long term trends of high unemployment levels could reduce the number of total annual miles driven as well as decrease consumer discretionary spending habits, both of which could negatively impact our business.
Product quality differentiation:
We provide our customers withline includes an assortment of products that are differentiated by quality and price for most of the product lines we offer. For many of our product offerings, this quality differentiation reflects “good”, “better”, and “best” alternatives. Our sales and total gross margin dollars are highest for the “best” quality category of products. Consumers’ willingness to select products at a higher point on the value spectrum is a driver of sales and profitability in our industry. As of December 31, 2011, we operated 3,740 stores in 39 states.
Operating within the retail industry, we are influenced by a number of general macroeconomic factors including, but not limited to, fuel costs, unemployment rates, consumer preferences and spending habits and competition. The difficult conditions that affected the overall macroeconomic environment in recent years continue to impact O’Reilly and the retail sector in general. We believe that the average consumer’s tendency has been to “trade-down” to lower quality products during the recent challenging macroeconomic conditions. We have ongoing initiatives aimed at tailoring our product offering to adjust to customers’ changing preferences; however, we also continue to have initiatives focused on marketing and training to educate customers on the advantages of purchasing up on the value spectrum.
We have ongoing initiatives targeted toat marketing higher quality products to our customers and expect our customers to be more willing to return to purchasing up on the value spectrum in the future as the U.S. economy recovers.recovers; however, we cannot predict whether, when, or the manner in which, these economic conditions will change.
We believe the key drivers of current and future demand of the products sold within the automotive aftermarket include the number of U.S. miles driven, number of U.S. registered vehicles, new light vehicle registrations, average vehicle age and unemployment.
Number of Miles Driven - The number of total miles driven in the U.S. heavily influences the demand for the repair and maintenance products sold within the automotive aftermarket. Historically, the long-term trend in the total miles driven in the U.S. has steadily increased; however, according to the Department of Transportation, total miles driven in the U.S. have remained relatively flat since 2007 as the U.S. has experienced difficult macroeconomic conditions. Historically, rapid increases in gasoline prices have negatively impacted U.S. total miles driven as consumers react to the increased expense by reducing travel. Average gasoline prices increased 7% in 2011, compared to an increase of 18% in 2010. We believe that as the U.S. economy recovers and gasoline prices stabilize, annual miles driven will return to historical growth rates and continue to drive demand for the industry.
Number of U.S. Registered Vehicles, New Light Vehicle Registrations and Average Vehicle Age - The total number of vehicles on the road and the average age of the U.S. vehicle population also heavily influence the demand for products sold within the automotive aftermarket. As reported by the Automotive Aftermarket Industry Association (“AAIA”), the total number of registered vehicles has increased 17% over the past decade, from 205 million light vehicles in 2000 to 240 million light vehicles in 2010. New light vehicle registrations, however, have declined 34% over the past decade, from 17 million registrations in 2000 to 11 million registrations in 2010. As of December 31, 2011, the seasonally adjusted annual rate of sales of total light vehicles in the U.S. was 13 million, indicating that the trend of declining new light vehicle registrations has reversed, however total sales of light vehicles has remained below historical rates for the past three years, contributing to an aging U.S. vehicle population. As reported by the AAIA, the average age of the U.S. vehicle population has increased 19% over the past decade, from 8.9 years in 2000 to 10.6 years in 2010. We believe this increase in average age can be attributed to better engineered and manufactured vehicles, which can be reliably driven at higher miles due to better quality power trains and interiors and exteriors; depressed new car sales over the past three years at below historical levels; and the consumer’s willingness to invest in maintaining their higher-mileage, better built vehicles. As the average age of the vehicle on the road increases, a larger percentage of miles are being driven by vehicles which are outside of a manufacturer warranty. These out-of-warranty, older vehicles generate strong demand for automotive aftermarket products as they go through more routine maintenance cycles, have more frequent mechanical failures and generally require more maintenance than newer vehicles. Based on this change in consumer sentiment surrounding the length of time older vehicles can be reliably driven at higher mileages, we believe consumers will continue to keep their vehicles even longer as the economy recovers maintaining the trend of an aging vehicle population.
Unemployment - Unemployment rates and continued uncertainty surrounding the overall economic health of the U.S. have had a negative impact on consumer confidence and the level of consumer discretionary spending. The annual U.S. unemployment rate over the past two years has remained at 30-year highs. We believe macroeconomic uncertainties and the potential for future joblessness can motivate consumers to find ways to save money, which can be an important factor in the consumer’s decision to defer the purchase of a new vehicle and maintain their existing vehicle. While the deferral of vehicle purchases has led to an increase in vehicle maintenance, long-term trends of high unemployment could continue to impede the growth of annual miles driven, as well as decrease consumer discretionary spending, both of which negatively impact demand for products sold in the automotive aftermarket. We believe that as the economy recovers, unemployment will return to more historic levels and we will see a corresponding increase in commuter traffic as unemployed individuals return to work. Aided by these increased commuter miles, overall annual U.S. miles driven should begin to grow resulting in continued demand for automotive aftermarket products.
KEY EVENTS AND RECENT DEVELOPMENTS
Several key events have had or may have a significant effectimpact on our operations and are summarizedidentified below:
Since July 11, 2008, and as a result of the CSK acquisition, we have incurred and may continue to incur legal fees related to ongoing governmental investigations and indemnity obligations for the litigation that has commenced against CSK and former CSK employees. O’Reilly and the DOJ have now agreed in principle, subject to final documentation, to resolve the DOJ investigation of CSK’s legacy accounting practices. Based upon the agreement in principle for a final settlement, we have recorded a charge of $20.9 million for the year ended December 31, 2010, in anticipation of the DOJ, CSK and O’Reilly executing a Non-Prosecution Agreement.
|
In March of 2010, the President of the United States of America signed into law the Patient Protection and Affordable Care Act, as amended by the Health Care and Education Reconciliation Act of 2010 (the “Acts”). The provisions of the Acts are not expected to have a significant impact to our consolidated financial statements in the short-term. However, the potential long-term impacts of the Acts to our business and consolidated financial statements, while currently uncertain, are being evaluated by management. We will continue to assess how the Acts apply to us, their effect on our business and how we plan to best meet the stated requirements.
On December 29, 2010, we completed a corporate reorganization creating a holding company structure (the “Reorganization”). The Reorganization was implemented through an agreement and plan of merger under Section 351.448 of The General Corporation Law of the State of Missouri which did not require a vote of the shareholders. As a result of the Reorganization, the previous parent company and registrant O’Reilly Automotive, Inc. (“Old O’Reilly”) was renamed O’Reilly Automotive Stores, Inc. and is now a wholly owned subsidiary of the new parent company and registrant, which was renamed O’Reilly Automotive, Inc.
On January 11, 2011, we announced a new Board-approved share repurchase program (the “Repurchase Program”) that authorizesauthorized us to repurchase up to $500 million of shares of our common stock over a three-year period. Stock repurchases underUnder the Repurchase Programprogram, we may, be made from time to time, as we deem appropriate,repurchase shares of our common stock, solely through open market purchases effected through a broker dealer at prevailing market prices, based on a variety of factors such as price, corporate trading policy requirements and weoverall market conditions. Our Board of Directors approved resolutions to increase the authorization under the share repurchase program by an additional $500 million on August 5, 2011, and an additional $500 million on November 16, 2011, raising the cumulative authorization under the share repurchase program to $1.5 billion. The additional $500 million authorizations are effective for three-year periods, expiring on August 5, 2014, and November 16, 2014. Our Board of Directors may increase or otherwise modify, renew, suspend or terminate the Repurchase Programshare repurchase program at any time, without prior notice. As of February 28, 2012, we had repurchased approximately 16.5 million shares of our common stock at an aggregate cost of $1 billion under this program.
On January 14, 2011, we issued $500 million aggregate principal amount of unsecured 4.875% Senior Notes due 2021 (the “2011 (“4.875% Senior Notes”Notes due 2021”) in the public market ofwith United Missouri Bank, N.A. (“UMB”) as trustee, which we, andwere guaranteed by certain of our subsidiaries are the guarantors and UMB Bank, N.A. (“UMB”(the “Subsidiary Guarantors”) is trustee.. The 2011 4.875% Senior Notes bear interestdue 2021 were issued at 4.875% which is payable99.297% of their face value and will mature on January 14, and July 14 of each year, beginning on July 14, 2011.2021. The 2011proceeds from the 4.875% Senior Notes due 2021 issuance were used to repay all of our outstanding borrowings under our existing secured asset-based revolving credit facility
(the “ABL Credit Facility”), pay fees and expenses related to the offering and for general corporate purposes. Concurrent with the issuance of the 4.875% Senior Notes due 2021, we entered into a 5-year credit agreement for a $750 million unsecured revolving credit facility (the “Revolving Credit Facility”) arranged by Bank of America (“BA”) and Barclays Capital to provide additional financial flexibility. All remaining debt issuance costs related to our previous ABL Credit Facility, totaling $22 million were written off, and all interest rate swap agreements related to notional amounts under the ABL Credit Facility, with a carrying value of $4 million, were terminated and charged to earnings as one-time, non-recurring items upon the repayment and retirement of the ABL Credit Facility in January of 2011, which is included in “Other income (expense)” on the accompanying Consolidated Statements of Income. |
On September 9, 2011, we amended our Revolving Credit Facility with BA, which decreased the facility to $660 million and reduced the fees and interest rate margins for borrowings under our Revolving Credit Facility. The amendment also extended the maturity of our Revolving Credit Facility to September of 2016. In conjunction with the amendment to our Revolving Credit Facility, we recognized a one-time charge related to the modification to the credit facility in the amount of $0.3 million, which is included in “Other income (expense)” on the accompanying Consolidated Statements of Income.
On September 19, 2011, we issued $300 million aggregate principal amount of unsecured 4.625% Senior Notes due 2021 (“4.625% Senior Notes due 2021”) in the public market with UMB as trustee, which were guaranteed by the Subsidiary Guarantors. The 4.625% Senior Notes due 2021 were issued at 99.826% of their face value and will mature on July 14,September 15, 2021. ProceedsThe proceeds from the issuance of the 2011 4.875%4.625% Senior Notes due 2021 were used to repay all outstanding borrowings under our previous credit facility, pay fees associatedand expenses related to the offering, with the issuance andremainder for general corporate purposes. Concurrent with the closing and issuance of the 2011 4.875% Senior Notes, on January 14, 2011, we entered into a credit agreement for a $750 million unsecured revolving credit facility (“the Revolver”) arranged by Bank of America, N.A. (“BA”) and Barclays Capital (“Barclays”) and simultaneously retired our existing secured revolving credit facility.purposes, including share repurchases.
RESULTS OF OPERATIONS
The following table sets forth certainincludes income statement data as a percentage of sales for the years ended December 31, 2011, 2010 2009 and 2008:2009:
Years ended December 31, | ||||||||||||
| 2010 | 2009 | 2008 | ||||||||||
Sales | 100.0 | % | 100.0 | % | 100.0 | % | ||||||
Cost of goods sold, including warehouse and distribution expenses | 51.4 | 52.0 | 54.5 | |||||||||
Gross profit | 48.6 | 48.0 | 45.5 | |||||||||
Selling, general and administrative expenses | 35.0 | 36.9 | 36.1 | |||||||||
Legacy CSK DOJ investigation charge | 0.4 | 0.0 | 0.0 | |||||||||
Operating income | 13.2 | 11.1 | 9.4 | |||||||||
Debt prepayment costs | — | — | (0.2 | ) | ||||||||
Interim facility commitment fee | — | — | (0.1 | ) | ||||||||
Interest expense | (0.7 | ) | (0.9 | ) | (0.7 | ) | ||||||
Interest income | — | — | 0.1 | |||||||||
Gain on settlement of note receivable | 0.2 | — | — | |||||||||
Other income, net | 0.1 | 0.1 | — | |||||||||
Income before income taxes | 12.8 | 10.3 | 8.5 | |||||||||
Provision for income taxes | 5.0 | 4.0 | 3.3 | |||||||||
Net income | 7.8 | % | 6.3 | % | 5.2 | % | ||||||
Sales Cost of goods sold, including warehouse and distribution expenses Gross profit Selling, general and administrative expenses Former CSK officer clawback Legacy CSK DOJ investigation charge Operating income Interest expense Interest income Write-off of asset-based revolving credit facility debt issuance costs Termination of interest rate swap agreements Gain on settlement of note receivable Other income, net Income before income taxes Provision for income taxes Net income 2011 2010 2009 100.0 % 100.0 % 100.0 % 51.0 51.4 52.0 49.0 48.6 48.0 34.1 35.0 36.9 (0.1 ) — — — 0.4 — 15.0 13.2 11.1 (0.5 ) (0.7 ) (0.9 ) 0.1 — — (0.4 ) — — (0.1 ) — — — 0.2 — — 0.1 0.1 14.1 12.8 10.3 5.3 5.0 4.0 8.8 % 7.8 % 6.3 %
20102011 Compared to 20092010
Sales:
Sales for the year ended December 31, 2011, increased $550$391 million or 11%,to $5.79 billion from $4.85$5.40 billion for the same period one year ago, representing an increase of 7.2%. Comparable store sales for stores open at least one year increased 4.6% and 8.8% for the years ended December 31, 2011 and 2010, respectively. Comparable store sales are calculated based on the change in 2009sales of stores open at least one year and exclude sales of specialty machinery, sales to $5.4 billion in 2010. independent parts stores and sales to Team Members.
The following table presents the components of the increase in sales for the year ended December 31, 20102011 (in millions):
| Increase in Sales for the Year Ended December 31, 2010, compared to the same period in 2009 | ||||
Comparable store sales | $ | 417 | ||
Stores opened throughout 2009, excluding stores open at least one year that are included in comparable stores sales | 56 | |||
Sales of stores opened throughout 2010 | 74 | |||
Non-store sales including machinery, sales to independent parts stores and team members | 8 | |||
Sales in 2009 for stores that have closed | (5 | ) | ||
Total increase in sales | $ | 550 | ||
| Increase in Sales for the year ended December 31, 2011, compared to the same period in 2010 | ||||
Store sales: | ||||
Comparable store sales | $ | 241 | ||
Non-comparable store sales: | ||||
Sales for stores opened throughout 2010, excluding stores open at least one year that are included in comparable store sales | 70 | |||
Sales in 2010 for stores that have closed | (13 | ) | ||
Sales for stores opened throughout 2011 | 82 | |||
Non-store sales: | ||||
Includes sales of machinery, sales to independent parts stores and team member sales | 11 | |||
|
| |||
Total increase in sales | $ | 391 | ||
|
| |||
We believe the increased sales achieved by our stores are the result of high levels of customer service, superior inventory availability, a broader selection of products offered in most stores, a targeted promotional and advertising effort through a variety of media and localized promotional events, continued improvement in the merchandising and store layouts of our stores, compensation programs for all store Team Members that provide incentives for performance and our continued focus on serving both DIY and professional service provider customers. Our comparable store sales increase for the year was driven by an increase in average ticket values, partially offset by a decline in customer transaction counts. The improvement in average ticket values was the result of the continued growth of the higher priced, hard part categories as a percentage of our total sales, and the impact of increased raw material acquisition costs, which were passed through to increased selling prices during the period. The growth in the hard part categories is driven by the increase of professional service provider sales as a percentage of our total sales mix and a shift in DIY sales to the hard part categories. During the year, DIY customer transaction counts were negatively impacted by the continued pressure on disposable income that our customers faced as a result of increased fuel costs and sustained unemployment levels above historical averages, which offset strong increases in professional service provider transaction counts.
We opened 170 net, new stores during the year ended December 31, 2011, compared to 149 net, new stores for the year ended December 31, 2010. At December 31, 2011, we operated 3,740 stores in 39 states compared to 3,570 stores in 38 states at December 31, 2010. We anticipate new store unit growth to increase to 180 net, new stores in 2012.
Gross profit:
Gross profit for the year ended December 31, 2011, increased to $2.84 billion (or 49.0% of sales) from $2.62 billion (or 48.6% of sales) for the same period one year ago, representing an increase of 8%. The increase in gross profit dollars was primarily a result of the increase in sales from new stores and the increase in comparable store sales at existing stores. The increase in gross profit as a percentage of sales was primarily due to a favorable product mix, improved acquisition costs, improved inventory shrinkage and distribution center efficiencies, partially offset by the impact of increased professional service provider sales as a percentage of the total sales mix. The improvement in product mix was primarily driven by increased sales in the hard part categories, which typically generate a high gross profit as a percentage of sales. Increasing hard part sales is the result of strong demand as consumers retain and maintain their vehicles beyond manufacturer warranty periods and our strong growth in sales to professional service providers in the acquired markets. The improved shrinkage is driven by our converted CSK stores, which are now managed using the O’Reilly point-of-sale system (“POS”), installed in all CSK stores as they converted to the O’Reilly distribution systems throughout 2009 and 2010. The O’Reilly POS provides our store managers with better tools to track and control inventory, resulting in improved inventory shrinkage. Distribution center efficiencies are the result of leverage on increased sales volumes and more tenured and experienced distribution center Team Members in our newer DCs. Professional service provider sales in the acquired CSK markets are growing at a faster rate than total DIY sales as a result of the enhanced distribution model in those markets, which supports the implementation of our dual market strategy. Professional service provider sales typically carry a lower overall gross profit as a percentage of sales than DIY sales, as volume discounts are granted on wholesale transactions to professional service providers, consequently creating pressure on our gross profit as a percentage of sales.
Selling, general and administrative expenses:
Selling, general and administrative expenses (“SG&A”) for the year ended December 31, 2011, increased to $1.97 billion (or 34.1% of sales) from $1.89 billion (or 35.0% of sales) for the same period one year ago, representing an increase of 5%. The increase in total SG&A dollars was primarily the result of additional employees, facilities and vehicles to support our increased store count. The decrease in SG&A as a percentage of sales was primarily the result of increased leverage of store occupancy and headquarters costs on strong comparable store sales, improved store payroll efficiencies and positive trends related to health benefits, partially offset by increased fuel costs for our store delivery vehicles supporting our growing commercial business.
Operating income:
Operating income for the year ended December 31, 2011, increased to $867 million (or 15.0% of sales) from $713 million (or 13.2% of sales) for the same period one year ago, representing an increase of 22%. The increase in operating income during the year was primarily due to the impacts discussed above, as well as $3 million of nonrecurring income in the current year related to a settlement between the Securities and Exchange Commission (“SEC”) and a former CSK officer that resulted in the reimbursement to CSK of incentive-based compensation and stock sale profits previously received by the officer (discussed in detail below – see Note 12 Legal Matters to the Consolidated Financial Statements) versus a $21 million charge to operating income in the prior year, related to the previously announced legacy CSK DOJ investigation (discussed in detail below – see Note 12 Legal Matters to the Consolidated Financial Statements). The increase in operating income as a percentage of sales is the result of our improvements in gross margin and significant leverage on fixed SG&A from strong comparable store sales.
Other income and expense:
Total other expense for the year ended December 31, 2011, increased to $51 million (or 0.9% of sales), from $23 million (or 0.4% of sales) for the same period one year ago, representing an increase of 118%. The increase in total other expense for the year was primarily due to one-time charges related to our new financing transactions that were completed in January of 2011 (discussed in detail below), offset by decreased interest expense on a lower average interest rate on outstanding borrowings, a lower facility fee on our revolving credit facility and less amortization of debt issuance costs in the current period as compared to the borrowing rates, facility fee and amortization of debt issuance costs in the prior period. In addition, during 2010, we recognized a nonrecurring, non-operating gain of $12 million related to the favorable settlement of a note receivable acquired in the acquisition of CSK (discussed in detail below).
Income taxes:
Our provision for income taxes for the year ended December 31, 2011, increased to $308 million (37.8% effective tax rate) from $270 million (39.2% effective tax rate) for the same period one year ago, representing an increase of 14%. The increase in our provision for income taxes was due to the increase in our taxable income. The decrease in the effective rate was primarily the result of the $21 million charge recorded in 2010 related to the legacy United States Department of Justice (“DOJ”) investigation of CSK, discussed in detail below, which was not deductible for tax purposes.
Net income:
As a result of the impacts discussed above, net income for the year ended December 31, 2011, increased to $508 million (or 8.8% of sales), from $419 million (or 7.8% of sales) for the same period one year ago, representing an increase of 21%.
Earnings per share:
Our diluted earnings per common share for the year ended December 31, 2011, increased 26% to $3.71 on 137 million shares from $2.95 on 142 million shares for the same period one year ago. The impact of share repurchases during 2011 on diluted earnings per share was an increase of approximately $0.19.
Adjustments for nonrecurring and non-operating events:
Our results for the year ended December 31, 2011, included nonrecurring income related to a settlement between the SEC and a former CSK officer that resulted in the reimbursement to O’Reilly, as successor issuer to CSK, of $3 million ($2 million, net of tax) of incentive-based compensation and stock sale profits previously received by the officer. This “clawback” amount was included in “Operating income” on our Consolidated Statements of Income for the year ended December 31, 2011. Our results for the year ended December 31, 2011, also included one-time charges associated with the new financing transactions we completed on January 14, 2011. The one-time charges included a non-cash charge to write off the balance of debt issuance costs related to our previous ABL Credit Facility in the amount of $22 million ($13 million, net of tax) and a charge related to the termination of our interest rate swap agreements in the amount of $4 ($3 million, net of tax). The charges related to our new financing transactions were included in “Other income (expense)” on our Consolidated Statements of Income for the year ended December 31, 2011. Our results for the year ended December 31, 2010, included a nonrecurring, non-operating gain in “Other income (expense)” of $12 million ($7 million, net of tax) related to the favorable settlement of a note receivable acquired in the CSK acquisition, as well as a charge related to the legacy DOJ investigation into CSK’s pre-acquisition historical accounting practices. We accrued $21 million during 2010 in anticipation of executing a Non-Prosecution Agreement (“NPA”) among the DOJ, CSK and O’Reilly and paying a one-time monetary penalty of $21 million. During the third quarter of 2011, the NPA was executed and the previously recorded, one-time $21 million penalty was paid to the DOJ on behalf of CSK. The charge related to the legacy CSK DOJ investigation was included in “Operating income” on our Consolidated Statements of Income for the year ended December 31, 2010. The results discussed in the paragraph below are adjusted for these nonrecurring items and are reconciled to the most directly comparable GAAP measure in the subsequent table.
Adjusted operating income for the year ended December 31, 2011, increased 18% to $864 million (or 14.9% of sales) from $734 million (or 13.6% of sales) for the same period one year ago. Adjusted net income for the year ended December 31, 2011, increased 21% to $522 million (or 9.0% of sales) from $433 million (or 8.0% of sales) for the same period one year ago. Adjusted diluted earnings per common share for the years ended December 31, 2011, increased 25% to $3.81 from $3.05 for the same period one year ago.
The table below outlines the impact of the charges related to the new financing transactions, the former CSK officer clawback, the legacy CSK DOJ investigation charge, as well as the gain on the settlement of the note receivable for the years ended December 31, 2011 and 2010 (amounts in thousands, except per share data):
| For the Year Ended December 31, | ||||||||||||||||
| 2011 | 2010 | |||||||||||||||
| Amount | % of Sales | Amount | % of Sales | |||||||||||||
GAAP Operating income | $ | 866,766 | 15.0 | % | $ | 712,776 | 13.2 | % | ||||||||
Former CSK officer clawback | (2,798 | ) | (0.1 | )% | — | — | % | |||||||||
Legacy CSK DOJ investigation charge | — | — | % | 20,900 | 0.4 | % | ||||||||||
|
|
|
|
|
|
|
| |||||||||
Non-GAAP adjusted operating income | $ | 863,968 | 14.9 | % | $ | 733,676 | 13.6 | % | ||||||||
|
|
|
|
|
|
|
| |||||||||
GAAP net income | $ | 507,673 | 8.8 | % | $ | 419,373 | 7.8 | % | ||||||||
Write-off of asset-based revolving credit facility debt issuance costs, net of tax | 13,458 | 0.2 | % | — | — | % | ||||||||||
Termination of interest rate swap agreements, net of tax | 2,637 | — | % | — | — | % | ||||||||||
Former CSK officer clawback, net of tax | (1,741 | ) | — | % | — | — | % | |||||||||
Legacy CSK DOJ investigation charge | — | — | % | 20,900 | 0.4 | % | ||||||||||
Gain on settlement of note receivable, net of tax | — | — | % | (7,215 | ) | (0.2 | )% | |||||||||
|
|
|
|
|
|
|
| |||||||||
Non-GAAP adjusted net income | $ | 522,027 | 9.0 | % | $ | 433,058 | 8.0 | % | ||||||||
|
|
|
|
|
|
|
| |||||||||
GAAP diluted earnings per common share | $ | 3.71 | $ | 2.95 | ||||||||||||
Write-off of asset-based revolving credit facility debt issuance costs, net of tax | 0.09 | — | ||||||||||||||
Termination of interest rate swap agreements, net of tax | 0.02 | — | ||||||||||||||
Former CSK DOJ officer clawback, net of tax | (0.01 | ) | — | |||||||||||||
Legacy CSK DOJ investigation charge | — | 0.15 | ||||||||||||||
Gain on settlement of note receivable, net of tax | — | (0.05 | ) | |||||||||||||
|
|
|
| |||||||||||||
Non-GAAP adjusted diluted earnings per common share | $ | 3.81 | $ | 3.05 | ||||||||||||
|
|
|
| |||||||||||||
Weighted-average common shares outstanding - assuming dilution | 136,983 | 141,992 | ||||||||||||||
The financial information presented in the paragraph and table above is not derived in accordance with United States generally accepted accounting principles (“GAAP”). We do not, nor do we suggest investors should, consider such non-GAAP financial measures in isolation from, or as a substitute for, GAAP financial information. We believe that the presentation of financial results and estimates excluding the impact of the non-cash charge to write off the balance of debt issuance costs, the charge related to the termination of interest rate swap contracts, the former CSK officer clawback, the charges for the legacy CSK DOJ investigation and the nonrecurring, non-operating gain related to the settlement of a note receivable acquired in the acquisition of CSK, provide meaningful supplemental information to both management and investors, which is indicative of our core operations. We exclude these items in judging our performance and believe this non-GAAP information is useful to investors as well. Material limitations of these non-GAAP measures are that such measures do not reflect actual GAAP amounts. We compensate for such limitations by presenting, in the table above, the accompanying reconciliation to the most directly comparable GAAP measures.
2010 Compared to 2009
Sales:
Sales for the year ended December 31, 2010, increased $550 million to $5.4 billion from $4.85 billion for the same period one year ago, representing an increase of 11%. Comparable store sales are calculated based on the change in sales of stores open at least one year and exclude sales of specialty machinery, sales to independent parts stores, sales to team membersTeam Members and sales during the one- to two-week period certain CSK branded stores were closed for conversion. Comparable store sales for stores open at least one year increased 8.8% and 4.6% for the year ended December 31, 2010 versus 4.6%and 2009, respectively.
The following table presents the components of the increase in sales for the year ended December 31, 2009.2010 (in millions):
| Increase in Sales for the year ended December 31, 2010, compared to the same period in 2009 | ||||
Store sales: | ||||
Comparable store sales | $ | 417 | ||
Non-comparable store sales: | ||||
Sales for stores opened throughout 2009, excluding stores open at least one year that are included in comparable store sales | 56 | |||
Sales in 2009 for stores that have closed | (5 | ) | ||
Sales for stores opened throughout 2010 | 74 | |||
Non-store sales: | ||||
Including sales of machinery, sales to independent parts stores and team member sales | 8 | |||
|
| |||
Total increase in sales | $ | 550 | ||
|
| |||
We believe that the increased sales achieved by our stores arewere the result of superior inventory availability, a broader selection of products offered in most stores, a targeted promotional and advertising effort through a variety of media and localized promotional events, continued improvement in the merchandising and store layouts of the stores, compensation programs for all store team membersTeam Members that provide incentives for performance and our continued focus on serving professional service providers. The improvement in comparable store sales for the year was driven both by increased transaction counts and higher average ticket values. We believe that the increase in transaction counts iswas a result of the customer’s focus on better maintaining their current vehicles, the stabilization of the economy and gas prices during the year and the growth of our commercial business in the acquired CSK markets. The improvement in average ticket value iswas primarily the result of a larger percentage of our total sales derived from higher priced hard parts categories.
Store growth:
We opened 149 net, new stores during the year ended December 31, 2010, compared to 142 net, new stores for the year ended December 31, 2009. At December 31, 2010, we operated 3,570 stores compared to 3,421 stores at December 31, 2009. We anticipate new store unit growth to increase to 170 net new stores in 2011 versus 149 net new stores in 2010.
Gross profit:
Gross profit for the year ended December 31, 2010, increased $294 million, or 13%,to $2.62 billion (or 48.6% of sales) from $2.33 billion (48.0%(or 48.0% of sales) in 2009 to $2.62 billion (48.6%for the same period one year ago, representing an increase of sales) in 2010.13%. The increase in gross profit dollars was primarily a result of the increase in sales from new stores and the increase in comparable store sales at existing stores. The increase in gross profit as a percentage of sales was the result of improved product mix, lower product acquisition costs and decreased inventory shrinkage at converted CSK stores, partially offset by the impact of increased commercial sales as a percent of the total sales mix and reduced leverage on the expanded number of distribution centers. The improvement in product mix iswas primarily driven by increased sales in the hard part categories, which typically generate a higher gross margin percentage than other categories. Increasing hard part sales arewere the result of strong consumer demand as consumers retainretained their vehicles longer and our enhanced and more comprehensive inventory levels in the hard part categories in the CSK stores, supported by a more extensive and robust distribution network. Lower product acquisition costs arewere derived from improved negotiating leverage with our vendors as the result of large purchase volume increases associated with the acquisition of CSK. The benefit of this improvement in gross margin was realized in the first and second quarterquarters of 2010 as compared to the same periods in 2009 when we renegotiated these vendor contracts. Our gross margin results for the third and fourth quarters of 2010 reflectreflected comparable periods of improved purchasing leverage. The decrease in inventory shrinkage at converted CSK stores iswas the result of the more robust O’Reilly point of sale system (“POS”), which was installed in all CSK stores when they converted to the O’Reilly distribution systems. The O’Reilly POS provides our store managers with better tools to track and control inventory resulting in improved inventory shrinkage. Commercial sales are growing at a faster rate than DIY sales as a result of the enhanced distribution model in our western markets, which supports the implementation of our dual market strategy in these areas. Commercial sales typically carry a lower gross margin percentage than DIY sales, as volume discounts are granted on wholesale transactions to professional customers, and create pressure on our gross margin as a percent of sales. The reduced leverage on distribution center costs iswas the result of the additional distribution centers, which have beenwere opened in conjunction with the CSK integration plan. New team membersTeam Members in these distribution centers arewere not yet fully proficient with distribution operations, resulting in inefficiencies. We believe that the long term impact of the improved
negotiating leverage with our vendors will allow us to generate gross margins at levels comparable to our 2010 full year results going forward, however continued growth in our commercial sales, as a percent of the total sales mix, will continue to pressure our gross margin results in the future.
Selling, general and administrative expenses:
SG&A for the year ended December 31, 2010, increased approximately $100 million, or 6%,to $1.89 billion (or 35.0% of sales) from $1.79 billion (36.9%(or 36.9% of sales) in 2009 to $1.89 billion (35.0%for the same period one year ago, representing an increase of sales) in 2010.6%. The increase in total SG&A dollars iswas primarily the result of additional employees, facilities and vehicles to support our increased store count and dual market strategy in the acquired CSK stores, as well as increased incentive compensation for team membersTeam Members resulting from strong comparable store sales. The decrease in SG&A as a percentage of sales was primarily attributable to increased leverage of fixed costs on very strong comparable store sales levels.
Operating income:
Operating income for the year ended December 31, 2010, increased $175to $713 million or 33%,(or 13.2% of sales) from $538 million (11.1%(or 11.1% of sales) in 2009 to $713 million (13.2%for the same period one year ago, representing an increase of sales) in 2010.33%. The increase in operating income iswas the result of increased sales and gross profit, offset by the increased SG&A discussed above as well as a $21 million charge related to the legacy DOJ investigation of CSK as discussed in Item 3, “Legal Proceedings” and Note 1412 “Legal Matters” to the consolidated financial statements. The increase in operating income as a percentage of sales iswas the result of our improvements in gross margin and significant leverage on fixed SG&A costs from strong comparable store sales. This full-year operating income as a percentage of sales represents a record high for the Company, and we would anticipate these operating levels to be sustainable.
Other income and expense:
Interest expense for the year ended December 31, 2010, decreased $6to $39 million (or 0.7% of sales) from $45 million (or 0.9% of sales) in 2009 to $39 million (or 0.7%for the same period one year ago, representing a decrease of sales) in 2010.13%. The decrease in interest expense during 2010 as compared to 2009 iswas the result of a lower level of average outstanding borrowings under our secured asset-backed credit facility (“ABL Credit Facility”).Facility. Included as a component of “Other income” for the year ended December 31, 2010, iswas a nonrecurring, non-operating gain of $12 million related to the favorable settlement of a note receivable acquired in the acquisition of CSK.
Income taxes:
Our provision for income taxes for the year ended December 31, 2010, increased $81to $270 million (39.2% effective tax rate) from $189 million (38.1% effective tax rate) in 2009 to $270 million (39.2% effective tax rate) in 2010.for the same period one year ago, representing an increase of 43%. The increase in our provision for income taxes iswas due to the increase in our taxable income. The increase in the effective rate iswas primarily the result of the charge related to the CSK DOJ investigation of $21 million which iswas not expected to be deductible for tax purposes.
Net income:
As a result of the impacts discussed above, net income for the year ended December 31, 2010, increased $112to $419 million or 36%,(or 7.8% of sales) from $307 million (6.3%(or 6.3% of sales) in 2009 to $419 million (7.8%for the same period one year ago, representing an increase of sales) in 2010.36%.
Earnings per share:
Our diluted earnings per common share for the year ended December 31, 2010, increased 32% to $2.95 on 142 million shares compared tofrom $2.23 on 138 million shares for the same period one year ago.
Adjustments for nonrecurring and non-operating events:
Our results for the year ended December 31, 2009, on 138 million shares.
Adjustments for nonrecurring and non-operating events:
Our year-to-date results include a nonrecurring charge2010, included charges related to the ongoing, legacy DOJ investigation of CSK as well as a nonrecurring, non-operating gain in other income related to the settlement of a note receivable acquired from CSK.CSK discussed above, as well as the charges related to the legacy CSK DOJ investigation discussed above. Adjusted operating income excluding the impact of the charge related to the DOJ investigation of CSK, increased 37% to $734 million (13.6% of sales) for the year ended December 31, 2010, from $538 million (11.1% of sales), for the same period in 2009.one year ago. Adjusted net income excluding the impact of the charge related to the DOJ investigation of CSK and the gain on the settlement of the note receivable increased 41% to $433 million (8.0% of sales) for the year ended December 31, 2010, from $307 million (6.3% of sales), for the same period in 2009.one year ago. Adjusted diluted earnings per common share excluding the impact of the charge related to the DOJ investigation of CSK and the gain on the settlement of the note receivable, increased 37% to $3.05 for the year ended December 31, 2010, from $2.23 for the same period in 2009.
one year ago. The table below outlines the impact of the chargecharges related to the legacy CSK DOJ investigation and the gain on the settlement of the note receivable for the yearyears ended December 31, 2010 as compared to the same period inand 2009 (amounts in thousands, except per share data):
| For the Year Ended December 31, | ||||||||||||||||
| 2010 | 2009 | |||||||||||||||
| Amount | % of Sales | Amount | % of Sales | |||||||||||||
Operating income | $ | 712,776 | 13.2 | % | $ | 537,619 | 11.1 | % | ||||||||
Legacy CSK DOJ investigation charge | 20,900 | 0.4 | % | — | — | % | ||||||||||
Adjusted operating income | $ | 733,676 | 13.6 | % | $ | 537,619 | 11.1 | % | ||||||||
Net income | $ | 419,373 | 7.8 | % | $ | 307,498 | 6.3 | % | ||||||||
Legacy CSK DOJ investigation charge | 20,900 | 0.4 | % | — | — | % | ||||||||||
Gain on settlement of note receivable, net of tax | (7,215 | ) | (0.2 | )% | — | — | % | |||||||||
Adjusted net income | $ | 433,058 | 8.0 | % | $ | 307,498 | 6.3 | % | ||||||||
Diluted earnings per common share | $ | 2.95 | $ | 2.23 | ||||||||||||
Legacy CSK DOJ investigation charge | 0.15 | — | ||||||||||||||
Gain on settlement of note receivable, net of tax | (0.05 | ) | — | |||||||||||||
Adjusted diluted earnings per common share | $ | 3.05 | $ | 2.23 | ||||||||||||
| For the Year Ended December 31, | ||||||||||||||||
| 2010 | 2009 | |||||||||||||||
| Amount | % of Sales | Amount | % of Sales | |||||||||||||
GAAP Operating income | $ | 712,776 | 13.2 | % | $ | 537,619 | 11.1 | % | ||||||||
Legacy CSK DOJ investigation charge | 20,900 | 0.4 | % | — | — | % | ||||||||||
|
|
|
|
|
|
|
| |||||||||
Non-GAAP adjusted operating income | $ | 733,676 | 13.6 | % | $ | 537,619 | 11.1 | % | ||||||||
|
|
|
|
|
|
|
| |||||||||
GAAP net income | $ | 419,373 | 7.8 | % | $ | 307,498 | 6.3 | % | ||||||||
Legacy CSK DOJ investigation charge | 20,900 | 0.4 | % | — | — | % | ||||||||||
Gain on settlement of note receivable, net of tax | (7,215 | ) | (0.2 | )% | — | — | % | |||||||||
|
|
|
|
|
|
|
| |||||||||
Non-GAAP adjusted net income | $ | 433,058 | 8.0 | % | $ | 307,498 | 6.3 | % | ||||||||
|
|
|
|
|
|
|
| |||||||||
GAAP diluted earnings per common share | $ | 2.95 | $ | 2.23 | ||||||||||||
Legacy CSK DOJ investigation charge | 0.15 | — | ||||||||||||||
Gain on settlement of note receivable, net of tax | (0.05 | ) | — | |||||||||||||
|
|
|
| |||||||||||||
Non-GAAP adjusted diluted earnings per common share | $ | 3.05 | $ | 2.23 | ||||||||||||
|
|
|
| |||||||||||||
Weighted-average common shares outstanding - assuming dilution | 141,992 | 137,882 | ||||||||||||||
The financial information presented in the paragraph and table above is not derived in accordance with United States generally accepted accounting principles (“GAAP”). These items include adjusted operating income, adjusted operating margin, adjusted net income and adjusted diluted earnings per share.GAAP. We do not, nor do we suggest investors should, consider such non-GAAP financial measures in isolation from, or as a substitute for, GAAP financial information. We believe that the presentation of financial results and estimates excluding the impact of the charges for the legacy CSK DOJ investigation charge and the nonrecurring, non-operating gain onrelated to the settlement of the CSKa note receivable providesacquired in the
acquisition of CSK provide meaningful supplemental information to both management and investors, thatwhich is indicative of our core operations. We exclude these items in judging our performance and believe this non-GAAP information is useful to investors as well. The material limitationMaterial limitations of these non-GAAP measures is that such measures are not reflective of actual GAAP amounts. We compensate for this limitation by presenting, in the table above, the accompanying reconciliation to the most directly comparable GAAP measures.
2009 Compared to 2008
Sales:
Sales increased $1.27 billion, or 36%, from $3.58 billion in 2008 to $4.85 billion in 2009. The following table presents the components of the increase in sales for the year ended December 31, 2009 (in millions):
| Increase in Sales for the Year Ended December 31, 2009, compared to the same period in 2008 | ||||
Comparable store sales | $ | 189 | ||
Stores opened throughout 2008, excluding stores open at least one year that are included in comparable stores sales | 72 | |||
Sales of stores opened throughout 2009 | 73 | |||
Non-store sales including machinery, sales to independent part stores and team members | 4 | |||
Sales in 2008 for stores that have merged or closed | (2 | ) | ||
Acquired CSK store sales, excluding sales that are included in comparable store sales (sales after 7/11/2009, the one year anniversary of the acquisition) | 935 | |||
Total increase in sales | $ | 1,271 | ||
Comparable store sales are calculated based on the change in sales of stores open at least one year and exclude sales of specialty machinery, sales to independent parts stores, sales to team members and sales during the one-to-two week period certain CSK branded stores were closed for conversion. Comparable store sales for stores operating on the O’Reilly systems increased 5.4% for the year ended December 31, 2009. The O’Reilly systems comparable store sales results consisted of a 6.6% increase for the core O’Reilly and post conversion Schuck’s stores, a 2.1% increase from the 123 converted Checker stores and a 11.9% decrease in comparable
stores sales from the 141 converted Murray’s stores. Comparable store sales for stores operating on the legacy CSK system increased 3.0% for the year ended December 31, 2009. Consolidated comparable store sales increased 4.6% for the year ended December 31, 2009, versus 1.5% for the year ended December 31, 2008.
We believe that the increased sales achieved by our stores are the result of superior inventory availability, a broader selection of products offered in most stores, a targeted promotional and advertising effort through a variety of media and localized promotional events, continued improvement in the merchandising and store layouts of the stores, compensation programs for all store team members that provide incentives for performance and our continued focus on serving professional service providers. The improvement in comparable store sales was primarily driven by an increase in transaction counts, while average ticket remained flat with the prior year. The flat average ticket value was attributable to more complex and costly repair parts, consistent with ongoing industry trends offset by competitive price reductions in the acquired CSK stores and the addition of a wider assortment of entry level products in those stores.
Store growth:
We opened 149 new O’Reilly branded stores and one new Schuck’s store in 2009. At December 31, 2009, we operated 3,421 stores compared to 3,285 stores at December 31, 2008. Due to the acquisition and integration of CSK, we anticipate new store unit growth to be limited to 150 new stores in 2010, excluding the previously disclosed consolidation and closure of underperforming stores related to the acquisition of CSK; however, we anticipate that continued store unit growth consistent with our historical openings will continue in the future.
Gross profit:
Gross profit increased $699 million, or 43%, from $1.63 billion (45.5% of sales) in 2008 to $2.33 billion (48.0% of sales) in 2009. The increase in gross profit dollars was primarily a result of the inclusion of a full year of sales from acquired CSK stores in 2009 versus roughly one half of a year of sales from acquired CSK stores in 2008, the increase in sales from new stores and an increase in comparable store sales from existing stores. The increase in gross profit as a percentage of sales is the result of lower product acquisition cost, changes in our product mix, distribution system improvements and a favorable pricing environment on certain commodity based products. Product acquisition costs improved primarily due to continued negotiating leverage with our vendors as a result of our significant growth related to the acquisition of CSK. We anticipate continued improvements in product acquisition costs at a moderate rate in 2010 from a full year of the benefit from improved leverage with our vendors as we anniversary product line changeovers in the acquired CSK stores throughout the year. We improved our product mix by continuing to implement strategies to differentiate our merchandise selections at each store based on customer demand and vehicle demographics in the store’s market and through ongoing Team Member training initiatives focused on selling products with greater gross margin contribution. Additionally, gross margin percentage improved as a result of an increased percentage of our total sales mix to DIY customers. Prior to the acquisition of CSK, our mix of sales to DIY customers was approximately equal to sales to professional service provider customers. At the time of the acquisition in July of 2008, acquired CSK stores generated more than 90% of their total sales from DIY customers. The addition of the acquired CSK stores’ predominantly retail sales has resulted in a mix shift of our consolidated sales to approximately 65% DIY and 35% professional service provider. In 2009, core O’Reilly stores derived approximately 53% of our sales from our DIY customers and approximately 47% from our professional service provider customers, while acquired CSK stores derived approximately 84% of sales from our DIY customers and approximately 16% from our professional service provider customers. Sales to DIY customers generally have higher gross margin percentages than sales to professional service providers as volume discounts are granted on these wholesale transactions to professional service providers. In addition, we have added our private label product lines to the acquired CSK stores inventory mix. Private label product sales generally offer better gross margin percentages than sales of corresponding branded products. Improvements in our distribution system were the result of capital projects designed to create operating expense efficiencies. The reductions in commodity prices, without corresponding decreases in retail pricing, that we experienced in 2009 returned to more normal levels by the end of 2009 and we would not anticipate this favorable pricing environment to continue in 2010. Additionally, in conjunction with the opening of our distribution centers (“DC”) in our western markets, we would anticipate a temporary decrease in distribution efficiencies as the new DC team members become proficient with the O’Reilly distribution systems and as duplicative capacity is removed from the system.
Selling, general and administrative expense:
SG&A increased $497 million, or 38%, from $1.29 billion (36.1% of sales) in 2008 to $1.79 billion (36.9% of sales) in 2009. The dollar increase in SG&A expenses resulted from a full year inclusion of CSK and new stores. The increase in SG&A expenses as a percentage of sales was attributable to the addition of the acquired CSK stores, which have a higher expense structure than the core O’Reilly store base, and the additional store payroll required to complete the ongoing product-line changeovers for acquired CSK stores. These increases were offset by a reduction in duplicative administrative corporate overhead as we continue to transition the CSK headquarters operations in Phoenix, Arizona to our facilities in Springfield, Missouri and increased leverage of fixed costs as a result of the increase in comparable store sales.
Operating income:
Operating income in 2009 increased $202 million, or 60%, from $336 million (or 9.4% of sales) in 2008 to $538 million (or 11.1% of sales) in 2009, representing an increase of 60%.
Interest expense:
Interest expense increased $19 million, from $26 million (or 0.7% of sales) in 2008 to $45 million (or 0.9% of sales) in 2009. The increase in interest expense is the result of a full-year of borrowings under our Credit Facility in 2009 that was used to fund the acquisition of CSK in 2008, the opening of new stores, ongoing capital expenditures related to the integration of the operations of CSK, the expansion of our distribution infrastructure and the operation of our existing stores slightly offset by more favorable interest rates in 2009 on the non-swapped portion of the outstanding borrowings under our Credit Facility which are subject to variable interest rate changes. Other income (expense) for the year ended December 31, 2008, included one-time charges of $4 million for interim financing facility commitment fees related to the CSK acquisition and $7 million of debt prepayment costs resulting from the payoff of our existing senior notes and synthetic lease facility.
Income taxes:
Our provision for income taxes increased from $116 million in 2008 (38.4% effective tax rate) to $189 million in 2009 (38.1% effective tax rate). The decrease in effective tax rate is the result of the one-time charge to adjust tax liabilities in 2008 relating to the CSK acquisition, offset by the generally higher effective tax rates in most states where CSK stores are located. The increase in the dollar amount for income taxes was due to the increase in income before income taxes.
Net income:
As a result of the impacts discussed above, net income increased $121 million, or 65%, from $186 million in 2008 (5.2% of sales) to $307 million in 2009 (6.3% of sales).
Earnings per share:
Our diluted earnings per common share for the year ended December 31, 2009, increased 51% to $2.23 on 138 million shares compared to $1.48 for the year ended December 31, 2008, on 125 million shares.
Adjustments for nonrecurring and non-operating events:
Our year ended December 31, 2008, included one-time and non-cash charges related to the July 11, 2008, acquisition of CSK. These charges included one-time costs for prepayment and extinguishment of our existing debt, commitment fees for an unused interim financing facility, a one-time adjustment to the tax liabilities resulting from the acquisition of CSK, a one-time charge to conform the CSK team member vacation policy with the O’Reilly policy and a non-cash charge to amortize the value assigned to CSK’s trade names and trademarks, which will be amortized over a period coinciding with the anticipated conversion of CSK store locations. Our year ended December 31, 2009, results included a non-cash charge to amortize the value assigned to CSK’s trade names and trademarks. Adjusted diluted earnings per share, excluding the impact of the acquisition related charges, increased 38% to $2.26 for the year ended December 31, 2009, from $1.64 for the same period one year ago. The table below outlines the impact of the acquisition related charges for the years ended December 31, 2009 and 2008 (amounts in thousands, except per share data):
| For the Year Ended December 31, | ||||||||||||||||
| 2009 | 2008 | |||||||||||||||
| Amount | % of Sales | Amount | % of Sales | |||||||||||||
Net income | $ | 307,498 | 6.3 | % | $ | 186,232 | 5.2 | % | ||||||||
Acquisition related charges: | ||||||||||||||||
Debt prepayment costs, net of tax | — | — | % | 4,402 | 0.1 | % | ||||||||||
Commitment fee for interim financing facility, net of tax | — | — | % | 2,552 | 0.1 | % | ||||||||||
Adjustments to tax liabilities | — | — | % | 3,142 | 0.1 | % | ||||||||||
Charge to conform vacation policies, net of tax | — | — | % | 5,879 | 0.1 | % | ||||||||||
Amortization of trade names and trademarks, net of tax | 3,894 | 0.1 | % | 3,267 | 0.1 | % | ||||||||||
Adjusted net income | $ | 311,392 | 6.4 | % | $ | 205,474 | 5.7 | % | ||||||||
Diluted earnings per common share | $ | 2.23 | $ | 1.48 | ||||||||||||
Acquisition related charges: | ||||||||||||||||
Debt prepayment costs, net of tax | — | 0.04 | ||||||||||||||
Commitment fee for interim financing facility, net of tax | — | 0.02 | ||||||||||||||
Adjustments to tax liabilities | — | 0.02 | ||||||||||||||
Charge to conform vacation policies, net of tax | — | 0.05 | ||||||||||||||
Amortization of trade names and trademarks, net of tax | 0.03 | 0.03 | ||||||||||||||
Adjusted diluted earnings per common share | $ | 2.26 | $ | 1.64 | ||||||||||||
The acquisition-related adjustments to EPS in the above paragraph and table present certain financial information not derived in accordance with GAAP. We do not, nor do we suggest investors should, consider such non-GAAP financial measures in isolation from, or as a substitute for, GAAP financial information. We believe that the presentation of adjusted net income and earnings per share excluding acquisition-related charges provides meaningful supplemental information to both management and investors that is indicative of the Company’s ongoing core operations. Management excludes these items in judging our performance and believes this
non-GAAP information is useful to gain an understanding of the recurring factors and trends affecting our business. Material limitations of this non-GAAP measure are that such measures do not reflect actual GAAP amounts and amortization of acquisition-related trade names and trademarks reflect charges to net income and earnings per share that will recur over the estimated useful lives of the assets ranging from one to three years.amounts. We compensate for such limitations by presenting, in the table above, the accompanying reconciliation to the most directly comparable GAAP measures.
LIQUIDITY AND CAPITAL RESOURCES
Our long-term business strategy requires capital to open new stores, fund strategic acquisitions, expand distribution infrastructure, operate and maintain existing stores and may include the opportunistic repurchase of shares of our common stock through our Board-approved share repurchase program. The primary sources of our liquidity are funds generated from operations and borrowed under our Revolving Credit Facility. Decreased demand for our products or changes in customer buying patterns could negatively impact our ability to generate funds from operations. Additionally, decreased demand or changes in buying patterns could impact our ability to meet the debt covenants of our credit agreement and, therefore, negatively impact the funds available under our Revolving Credit Facility. We believe that cash expected to be provided by operating activities and availability under our Revolving Credit Facility will be sufficient to fund both our short-term and long-term capital and liquidity needs for the foreseeable future. However, there can be no assurance that we will continue to generate cash flows at or above recent levels.
Liquidity and related ratios:
The following table highlights our liquidity and related ratios for the years endedas of December 31, 2011 and 2010 and 2009, as well as our cash flows from operating, investing and financing activities for the fiscal years ended December 31, 2010, 2009 and 2008 (amounts(dollars in millions):
| Year Ended | December 31, | December 31, | Percentage | |||||||||||||||||||||
Liquidity and Related Ratios | December 31, 2010 | December 31, 2009 | Percentage Change | 2011 | 2010 | Change | ||||||||||||||||||
Current assets | $ | 2,301 | $ | 2,227 | 3.3 | % | $ | 2,608 | $ | 2,301 | 13 | % | ||||||||||||
Quick assets(1) | 213 | 198 | 7.6 | % | 565 | 213 | 165 | % | ||||||||||||||||
Current liabilities | 1,229 | 1,219 | 0.8 | % | 1,580 | 1,229 | 29 | % | ||||||||||||||||
Working capital(2) | 1,072 | 1,008 | 6.3 | % | 1,028 | 1,072 | (4 | )% | ||||||||||||||||
Total debt | 359 | 791 | (54.6 | )% | 798 | 359 | 122 | % | ||||||||||||||||
Total equity | $ | 3,210 | $ | 2,686 | 19.5 | % | 2,845 | 3,210 | (11 | )% | ||||||||||||||
Current ratio(3) | 1.87:1 | 1.83:1 | 2.2 | % | 1.65:1 | 1.87:1 | (12 | )% | ||||||||||||||||
Quick ratio(4) | 0.23:1 | 0.26:1 | (11.5 | )% | 0.39:1 | 0.23:1 | 70 | % | ||||||||||||||||
Debt to equity(5) | 0.11 | 0.29 | (62.1 | )% | 0.28:1 | 0.11:1 | 155 | % | ||||||||||||||||
Adjusted debt to adjusted EBITDAR ratio (6) | 1.6:1 | 2.4:1 | (33.3 | )% | ||||||||||||||||||||
| Year Ended | ||||||||||||||||||||||||
Liquidity | December 31, 2010 | December 31, 2009 | December 31, 2008 | |||||||||||||||||||||
Total cash provided by (used in): | ||||||||||||||||||||||||
Operating activities | $ | 703,687 | $ | 285,200 | $ | 298,542 | ||||||||||||||||||
Investing activities | (351,277 | ) | (410,661 | ) | (367,597 | ) | ||||||||||||||||||
Financing activities | (349,624 | ) | 121,095 | 52,801 | ||||||||||||||||||||
Increase (decrease) in cash and cash equivalents | $ | 2,786 | $ | (4,366 | ) | $ | (16,254 | ) | ||||||||||||||||
| (1) | Quick assets include cash, cash equivalents and receivables. |
| (2) | Working capital is calculated as current assets less current liabilities. |
| (3) | Current ratio is calculated as current assets divided by current liabilities. |
| (4) | Quick ratio is calculated as current assets, less inventories, divided by current liabilities. |
| (5) | Debt to equity is calculated as total debt divided by |
|
Adjusted EBITDAR is calculated as the sum of net income, interest expense, taxes, depreciation and amortization, rent expense and stock option compensation expense, less the charge related to the CSK DOJ investigation and the nonrecurring, non-operating gain related to the settlement of the CSK note receivable, net of tax, for the year ended December 31, 2010.
Liquidity and related ratios:
Our working capital increased 6% from 2009 to 2010, primarily driven by an increased investment in hard parts inventories in the acquired CSK stores as we continue to grow and expand the professional service provider business in those markets as well as the additional net inventory investment required by our new store growth. Total debt decreased 55%increased 122% and total equity increased 20%decreased 11% from 20092010 to 2010.2011. The increase in total debt was attributable the issuance of our senior notes during 2011, partially offset by the repayment of our ABL Credit Facility in January of 2011. The decrease in total debt was driven by strong cash flowequity resulted from operations which allowed us to substantially pay down the outstanding borrowingsimpact of repurchase activity under our Credit Facility. Theshare repurchase program on additional paid-in capital and retained earnings, offset by an increase in total equity was due to increased retained earnings resulting from strong net income in 2010for the year and an increase in additional paid-in capital, primarilypaid-in-capital from the issuance of common stock upon the exerciseproceeds of stock optionsoption exercises, and the related excess tax benefits, as well asexecuted under our director and employee share-based compensation plans.
The following table identifies cash provided by/(used in) our operating, investing and financing activities for the impact of share based compensation.years ended December 30, 2011, 2010 and 2009 (in thousands):
| Year Ended | ||||||||||||
Liquidity | December 31, 2011 | December 31, 2010 | December 31, 2009 | |||||||||
Total cash provided by/(used in): | ||||||||||||
Operating activities | $ | 1,118,991 | $ | 703,687 | $ | 285,200 | ||||||
Investing activities | (319,653 | ) | (351,277 | ) | (410,661 | ) | ||||||
Financing activities | (467,507 | ) | (349,624 | ) | 121,095 | |||||||
|
|
|
|
|
| |||||||
Increase (decrease) in cash and cash equivalents | $ | 331,831 | $ | 2,786 | $ | (4,366 | ) | |||||
|
|
|
|
|
| |||||||
Operating activities:
NetThe increase in cash provided by operating activities in 2011 compared to 2010 is primarily due to strong net income for the year (adjusted for the effect of non-cash depreciation and amortization charges, the one-time, non-cash charge to write off the balance of debt issuance costs in conjunction with the retirement of our ABL Credit Facility in January of 2011 and deferred income taxes) and a significant decrease in net inventory investment, partially offset by a decrease in other current liabilities (driven by the payment of the one-time penalty to the DOJ for the legacy CSK DOJ investigation). Net inventory investment reflects our investment in inventory,
net of the amount of accounts payable to vendors. Our net inventory investment significantly decreased as a result of the impact of our enhanced vendor financing programs as well as our ongoing efforts to remove excess inventory from our systems. Our vendor financing programs enable us to reduce overall supply chain costs and negotiate extended payment terms with our vendors. Our accounts payable to inventory ratio was $70464.4% and 44.3% at December 31, 2011 and 2010, respectively. Our efforts to remove excess inventory from our systems resulted in a decrease in total inventory of $37 million in 2010, $285 million in 2009 and $299 million in 2008.during the year, despite the fact that we opened 170 new stores during the year. The increase in cash provided by operating activities in 2010 compared to 2009 iswas primarily due to an increase in net income (adjusted for the effect of non-cash depreciation and amortization charges gain/loss on property and equipment, deferred income taxes and stock based compensation charges)taxes), a significant decrease in net inventory investment and an increase in other liabilities as compared to the same period in 2009. Net inventory investment reflects our investment in inventory, net of the amount of accounts payable to vendors. The decrease in net inventory investment in 2010 as compared to 2009 iswas the result of the significant investments in 2009 to improve the
inventory availability in the acquired CSK stores. Although our investment in net inventory decreased year over year in 2010, duplicative and excess inventory levels throughout our distribution network have lead to an increase in per store average inventory. The average per-store inventory for our stores increased to $0.57 million as of December 31, 2010, from $0.56 million as of December 31, 2009. The increase in other liabilities iswas principally due to the accrual of the CSK DOJ investigation charge during 2010, which is expected to bewas paid in 2011. The decrease in net cash provided by operating activities in 2009 compared to 2008 was principally due to an increase in net inventory investment in 2009 as discussed above, which was slightly offset by an increase in operating income adjusted for non-cash depreciation and amortization expenses. The average per-store inventory for our stores increased to $0.56 million as of December 31, 2009, from $0.48 million as of December 31, 2008 as we made significant investments in the acquired CSK stores in 2009 to improve the inventory availability. During 2011, we will continue to refine the inventory levels in the acquired CSK stores and will focus on returning excess quantities to vendors where appropriate and selling through the remainder of the excess quantities on hand in the stores.
Investing activities:
NetThe decrease in cash used in investing activities was $351in 2011 compared to 2010 is primarily the result of decreased capital expenditures. Total capital expenditures were $328 million in 2011, $365 million in 2010 $411and $415 million in 20092009. During 2010, we completed the comprehensive expansion of our distribution system in the CSK markets and $368 millionthe conversion of the CSK stores to the O’Reilly POS, resulting in 2008.reduced levels of conversion related capital expenditures during 2011. The decrease in cash used in investing activities in 2010 compared to 2009 iswas principally due to a decrease in capital expenditures associated with the integration of CSK and an increase in payments received on notes receivable. Capital expenditures were $365 million in 2010, $415 million in 2009, and $342 million in 2008. Capital expenditures related to the acquisition of CSK includeincluded the purchase of properties for DCsdistribution centers (“DC”s) and costs associated with the conversion of CSK stores to the O’Reilly Brand. Although we opened four new DCs in 2010, a significant portion of the capital expenditures for these DCs occurred in 2009 as we acquired property and began construction of the facilities. The increase in payments received on notes receivable was due to the one-time nonrecurring payment received to settle thea note receivable acquired from CSK. Increases in cash used in investing activities in both 2009 and 2008 were primarily due to an increase in capital expenditures related to the conversions of acquired CSK stores to the O’Reilly Brand and the properties and facilities for the additional DCs. acquisition.
We opened 170 net, new stores in 2011, 149 net, new stores in 2010 and 150 net, new stores in both 2009 and 2008.2009. We plan to open 170180 net, new stores in 2011.2012. The costs associated with the opening of a new store (including the cost of land acquisition, improvements, fixtures, vehicles, net inventory investment and computer equipment) are estimated to average approximately $1.4$1.3 million to $1.6$1.5 million; however, such costs may be significantly reduced where we lease, rather than purchase, the store site.
Financing activities:
NetThe increase in net cash used in financing activities during 2011 compared to 2010 is primarily attributable to the impact of repurchases of our common stock during 2011 in accordance with our Board-approved share repurchase program, which was $350 millionpartially offset by an increase in 2010,net long term borrowings in 2011 as compared to net repayments under our facilities during 2010. The net borrowings in 2011 are the result of proceeds from the issuance of our 4.875% Senior Notes due 2021 and our 4.625% Senior Notes due 2021 in January and September of 2011, respectively, partially offset by the repayment and termination of our previous ABL Credit Facility and the payment of debt issuance costs related to the issuance of our senior notes and the establishment of our new unsecured Revolving Credit Facility. The net repayments under our facilities in 2010 were the result of our focus on using available cash provided by financing activitieson hand to reduce the level of $121 million in 2009 and $53 million in 2008.outstanding borrowings under our secured ABL Credit Facility. Net cash used in financing activities in 2010 compared to net cash provided by financing activities in 2009 is driven by the increase in net repayments of outstanding borrowings on our long-term debt. The repayments in 2010 were funded by increased cash provided by operating activities as well as decreased capital expenditures compared to the same period in 2009. The increase in cash provided by financing activities in 2009 compared to 2008 was primarily the result of an increase in the net proceeds from the issuance of common stock related to our stock option plans and the associated tax benefit from the exercises.
Sources of liquidity:
Our long-term business strategy requires capital to open new stores, to complete the conversions of the acquired CSK stores, expand distribution infrastructure and operate existing stores. The primary sources of our liquidity are funds generated from operations and borrowed under our Revolver. Decreased demand for our products or changes in customer buying patterns could negatively impact our ability to generate funds from operations. Additionally, decreased demand or changes in buying patterns could impact our ability to meet the debt covenants of our credit agreement and, therefore, negatively impact the funds available under our Revolver. We believe that cash expected to be provided by operating activities and availability under our Revolver will be sufficient to fund both our short-term and long-term capital and liquidity needs for the foreseeable future. However, there can be no assurance that we will continue to generate cash flows at or above recent levels.
Credit facilities:
On July 11, 2008, in connection with the acquisition of CSK, we entered into a credit agreement for a five-year $1.2 billion secured credit facility arranged by BA (the “Credit Facility”), which we used to refinance debt, fund the cash portion of the acquisition, pay for other transaction-related expenses and provide liquidity for the combined Company going forward. This Credit Facility replaced a previous unsecured, five-year syndicatedasset-based revolving credit facility, which was scheduled to mature in the amountJuly of $100 million.
The Credit Facility was comprised of a $1.075 billion tranche A revolving credit facility and a $125.0 million first-in-last-out revolving credit facility (“FILO tranche”). On the date of the transaction, the amount of the borrowing base available, as described in the credit agreement, under the Credit Facility was $1.05 billion of which we borrowed $588 million. We used borrowings under the Credit Facility to repay certain existing debt of CSK, repay our $75 million 2006-A Senior Notes and purchase all of the properties that had been leased under our synthetic lease facility. The terms of the Credit Facility granted us the right to terminate the FILO tranche upon meeting certain requirements, including no events of default and aggregate projected availability under the Credit Facility. During the year ended2013. At December 31, 2010, we elected to exercise our right to terminate the FILO tranche. As of December 31, 2010 and 2009, the amount of the borrowing base available under the Credit Facility was $1.071 billion and $1.196 billion, respectively, of which we had outstanding borrowings of $356 million and $679 million, respectively. The available borrowings under the ABL Credit Facility, of which $106 million were also reduced by stand-by letters of credit issued by us primarily to satisfy the requirements of workers compensation, general liability and other insurance policies. As of December 31, 2010 and 2009, we had stand-by letters of credit outstanding in the amount of $71 million and $72 million, respectively, and the aggregate availability for additional borrowingsnot covered under
the Credit Facility was $644 million and $445 million, respectively. As part of the Credit Facility, we had pledged substantially all of our assets as collateral and we were subject to an ongoing consolidated leverage ratio covenant, with which we complied as of December 31, 2010 and 2009.
At December 31, 2010, borrowings under the tranche A revolver bore interest at our option, at a rate equal to either a base rate plus 1.00% per annum or LIBOR plus 2.00% per annum, with each rate being subject to adjustment based upon certain excess availability thresholds. The base rate was equal to the higher of the prime lending rate established by BA from time to time and the federal funds effective rate as in effect from time to time plus 0.50%. Fees related to unused capacity under the Credit Facility were assessed at a rate of 0.50% of the remaining available borrowings under the facility, subject to adjustment based upon remaining unused capacity. In addition, we paid customary commitment fees, letter of credit fees, underwriting fees and other administrative fees in respect of the Credit Facility.swap contract. All outstanding borrowings under the ABL Credit Facility were repaid, in conjunctionand all related interest rate swap transaction contracts were terminated on January 14, 2011, and the ABL Credit Facility was retired concurrent with the issuance of our 2011 4.875% Senior Notes on January 14, 2011,due 2021, as further discusseddescribed below. In conjunction with the retirement of our ABL Credit Facility, we recognized a one-time non-cash charge to write off the balance of debt issuance costs related to the ABL Credit Facility in the amount of $22 million and a one-time charge related to the termination of our interest rate swap contracts in the amount of $4 million, which are included in “Other income (expense)” on the accompanying Consolidated Statements of Income for the year ended December 31, 2011.
On January 14, 2011, we entered into a new credit agreement for a five-year $750 million unsecured revolving credit facility (the “Revolver”)Revolving Credit Facility arranged by BA and Barclays Capital, which matureswas scheduled to mature in January of 2016. During 2011, we amended the unsecured Revolving Credit Facility, which decreased the facility to $660 million and reduced the fees and interest rate margins for borrowings under the Revolving Credit Facility. The Revolveramendment also extended the maturity of the Revolving Credit Facility to September of 2016. In conjunction with the amendment to the Revolving Credit Facility, we recognized a one-time charge related to the modification to the credit facility in the amount of $0.3 million, which is included in “Other income (expense)” on the accompanying Consolidated Statements of Income for the year ended December 31, 2011. The Revolving Credit Facility includes a $200 million sub-limit for the issuance of letters of credit and a $75 million sub-limit for swing line borrowings. Our ability to draw under the revolving facility is conditioned upon, among other things, our ability to certify that the representations and warranties containedAs described in the credit agreement are true, correct and complete in all material respects and that no event of default has occurred or would result fromgoverning the proposed extension of credit. Borrowings under the Revolver (other than swing line loans) bear interest, at our option, at either the Base Rate or Eurodollar Rate (both as defined in the agreement) plus a margin, that will vary from 1.325% to 2.500% in the case of loans bearing interest at the Eurodollar Rate and 0.325% to 1.500% in the case of loans bearing interest at the Base Rate, in each case based upon the ratings assigned to our debt by Moody’s Investor Service, Inc. and Standard & Poor’s Rating Services. Swing line loans made under the Revolver bear interest at the Base Rate plus the applicable margin described above. In addition, we will pay a facility fee on the aggregate amount of the commitments in an amount equal to a percentage of such commitments, varying from 0.175% to 0.500% based upon the ratings assigned to our debt by Moody’s Investor Service, Inc. and Standard & Poor’s Rating Services. The Revolver replaced the securedRevolving Credit Facility, we entered into on July 11, 2008.may, from time to time subject to certain conditions, increase the aggregate commitments under the Revolving Credit Facility by up to $200 million. As of December 31, 2011, we had stand-by letters of credit, primarily to satisfy workers’ compensation, general liability and other insurance policies, in the amount of $60 million. As of December 31, 2011, we had no outstanding borrowings under the Revolving Credit Facility.
6 3/4% Exchangeable Senior Notes:
On July 11, 2008, we executed the Third Supplemental Indenture (the “Third Supplemental Indenture”) to the 6 3/4% Exchangeable Senior Notes due 2025 (the “Notes”), in which we agreed to become a guarantor, on a subordinated basis, of the $100 million principal amount of the Notes originally issued by CSK pursuant to an Indenture dated as of December 19, 2005, as amended and supplemented by the First Supplemental Indenture dated as of December 30, 2005, and the Second Supplemental Indenture, dated as of July 27, 2006, by and between CSK Auto Corporation, CSK Auto, Inc. and The Bank of New York Mellon Trust Company, N.A., as trustee. On December 31, 2008, and effective as of July 11, 2008, we entered into the Fourth Supplemental Indenture in order to correct the definition of Exchange Rate in the Third Supplemental Indenture.
The Notes were exchangeable, under certain circumstances, into cash and shares of our common stock. The Notes bore interest at 6.75% per year until December 15, 2010, and 6.50% until maturity on December 15, 2025. Prior to their stated maturity, these Notes were exchangeable by the holder only under the following circumstances (as more fully described in the indenture under which the Notes were issued):
during any fiscal quarter (and only during that fiscal quarter) commencing after July 11, 2008, if the last reported sale price of our common stock was greater than or equal to 130% of the applicable exchange price of $36.17 for at least 20 trading days in the period of 30 consecutive trading days ending on the last trading day of the preceding fiscal quarter;
if the Notes had been called for redemption by us; or
upon the occurrence of specified corporate transactions, such as a change in control.
On July 1, 2010, the Notes became exchangeable at the option of the holders and remained exchangeable through September 30, 2010, the last trading day of our third quarter, as provided for in the indentures governing the Notes. The Notes became exchangeable as our common stock closed at or above 130% of the Exchange Price (as defined in the indentures governing the Notes) for 20 trading days within the 30 consecutive trading day period ending on June 30, 2010. As a result, during the exchange period commencing July 1, 2010, and continuing through and including September 30, 2010, for each $1,000 principal amount of the Notes held, holders of the Notes could, if they elected, surrender their Notes for exchange. If the Notes were exchanged, we would deliver cash equal to the lesser of the aggregate principal amount of Notes to be exchanged and our total exchange obligation and, in the event our total exchange obligation exceeded the aggregate principal amount of Notes to be exchanged, shares of our common stock in respect of that excess. The total exchange obligation reflects the exchange rate whereby each $1,000 in principal amount of the Notes is exchangeable into an equivalent value of approximately 25.97 shares of our common stock and approximately $60.61 in cash. On September 28, 2010, certain holders of the Notes delivered notice to the exchange agent to exercise their right to exchange $11 million of the principal amount of the Notes. The Cash Settlement Averaging Period (as defined in the indentures governing the Notes) ended on October 27, 2010, and on October 29, 2010, we delivered $11 million in cash, which represented the principal amount of the Notes exchanged and the value of partial shares, and 92,855 shares of our common stock to the exchange agent in settlement of the exchange obligation. Concurrently, we retired the $11 million principal amount of the exchanged Notes. On October 1, 2010, the Notes again became exchangeable at the option of the holders and remained exchangeable through December 31, 2010.
The Noteholders had the option to require us to repurchase some or all of the Notes for cash at a repurchase price equal to 100% of the principal amount of the Notes being repurchased, plus any accrued and unpaid interest on December 15, 2010; December 15, 2015; or December 15, 2020, or on any date following a fundamental change as described in the indenture. We had the option to redeem some or all of the Notes for cash at a redemption price of 100% of the principal amount plus any accrued and unpaid interest on or after December 15, 2010, upon at least 35-calendar days notice. On November 15, 2010, we announced our intention to redeem the Notes on December 21, 2010, at a redemption price of 100% of the principal amount thereof, plus any accrued and unpaid interest up to, but not including, the redemption date.
On or prior to December 17, 2010, the remaining holders of the Notes delivered notice to the exchange agent to exercise their right to exchange the $89 million remaining principal amount of the Notes. The Cash Settlement Averaging Period (as defined in the indentures governing the Notes) ended on December 16, 2010, and on December 21, 2010, we delivered $89 million in cash, which represented the principal amount of the Notes exchanged and the value of partial shares, and 939,312 shares of our common stock to the exchange agent in settlement of the exchange obligation. Concurrently, we retired the $89 million principal amount of the exchanged Notes.
4.875% Senior Notes due 2021:2021:
On January 14, 2011, we issued $500 million aggregate principal amount of unsecured 4.875% Senior Notes due 2021 (“4.875% Senior Notes due 2021”) at a price to the public of 99.297% of their face value inwith United Missouri Bank, N.A. (“UMB”) as trustee. Interest on the public market, of which certain of our subsidiaries are the guarantors, and UMB is trustee. The 2011 4.875% Senior Notes bear interest at 4.875% whichdue 2021 is payable on January 14 and July 14 of each year, beginningwhich began on July 14, 2011.2011, and is computed on the basis of a 360-day year. The 2011 4.875% Senior Notes mature on January 14, 2021. Proceedsnet proceeds from the issuance of the 2011 4.875% Senior Notes due 2021 were used to repay all of the outstanding borrowings under our previous securedABL Credit Facility and to pay fees and expenses related to the offering and costs associated with terminating our existing interest rate swap contracts, with the issuance andremainder used for general corporate purposes.
Prior to October 14, 2020, the 2011 4.875%4.625% Senior Notes are redeemable, in whole,due 2021:
On September 19, 2011, we issued $300 million aggregate principal amount of unsecured 4.625% Senior Notes due 2021 (“4.625% Senior Notes due 2021”) at any time, or in part,a price to the public of 99.826% of their face value with UMB as trustee. Interest on the 4.625% Senior Notes due 2021 is payable on March 15 and September 15 of each year beginning on March 15, 2012, and is computed on the basis of a 360-day year. The net proceeds from the issuance of the 4.625% Senior Notes due 2021 were used to pay fees and expenses related to the offering, with the remainder intended to be used to repay borrowings outstanding from time to time atunder the Revolving Credit Facility and for general corporate purposes, including share repurchases.
The senior notes are guaranteed on a senior unsecured basis by each of our option upon not less than 30 nor more than 60 days’ notice at a redemption price, plussubsidiaries (“Subsidiary Guarantors”) that incurs or guarantees our obligations under our Revolving Credit Facility or certain of our other debt or any accruedof our Subsidiary Guarantors. The guarantees are full and unpaid interest to, but not including, the redemption date, equal to the greater of:
100%unconditional and joint and several. Each of the principal amount thereof;Subsidiary Guarantors is wholly-owned, directly or
the sum indirectly, by us and we have no independent assets or operations other than those of the present valuesour subsidiaries. Our only direct or indirect subsidiaries that would not be Subsidiary Guarantors would be minor subsidiaries. No minor subsidiaries exist today. Neither we, nor any of the remaining scheduled paymentsour Subsidiary Guarantors, are subject to any material or significant restrictions on our ability to obtain funds from our subsidiaries by dividend or loan or to transfer assets from such subsidiaries, except as provided by applicable law. Each of principal and interest thereon discountedour senior notes is subject to the redemption date on a semiannual basis (assuming a 360-day year consistingcertain customary covenants, with which we complied as of twelve 30-day months) at the applicable Treasury Yield (as defined in the indenture governing the 2011 4.875% Senior Notes) plus 25 basis points.
On or after October 14, 2020, the 2011 4.875% Senior Notes are redeemable, in whole at any time or in part from time to time, at our option upon not less than 30 nor more than 60 days’ notice at a redemption price equal to 100% of the principal amount thereof plus accrued and unpaid interest to, but not including, the redemption date. In addition, if we undergo a Change of Control Triggering Event (as defined in the indenture governing the 2011 4.875% Senior Notes), holders of the 2011 4.875% Senior Notes may require us to repurchase all or a portion of their notes at a price equal to 101% of the principal amount of the 2011 4.875% Senior Notes being repurchased, plus accrued and unpaid interest, if any, to but not including the repurchase date.December 31, 2011.
Debt covenants:
The indentureindentures governing the 2011 4.875% Senior Notes containsour senior notes contain covenants that limit our ability and the ability of certain of our subsidiaries to, among other things: (i) create certain liens on assets to secure certain debt; (ii) enter into certain sale and leaseback transactions; and (iii) merge or consolidate with another company or transfer all or substantially all of our or its property, in each case as set forth in the indenture.indentures. These covenants are, however, subject to a number of important limitations and exceptions.
The new RevolverCredit Agreement contains certain positive and negative debt covenants. These covenants, includeincluding limitations on total outstanding borrowings under the Revolver,Revolving Credit Facility, a minimum consolidated fixed charge coverage ratio of 2.002.0 times from the closing through December 31, 2012,2012; 2.25 times through December 31, 2014, and 2.502014; 2.5 times through maturitymaturity; and a maximum adjusted consolidated leverage ratio of 3.003.0 times from the closing through maturity. OurThe consolidated leverage ratio includes a calculation of adjusted earnings before interest, taxes, depreciation, amortization, rent and stock option compensation expense (“EBITDAR”) to adjusted debt. Adjusted debt includes outstanding debt, outstanding standbystand-by letters of credit, six times capitalizedsix-times rent expense and excludes any premium or discount recorded in conjunction with the issuance of long-term debt. AsIn the event that we should default on any covenant contained within the Credit Agreement, certain actions may be taken against us, including but not limited to possible termination of January 14,credit extensions, immediate payment of outstanding principal amount plus accrued interest and litigation from our lenders. We had a fixed charge coverage ratio of 4.86 times and 4.21 times as of December 31, 2011 we wereand 2010, respectively, and an adjusted debt to adjusted EBITDAR ratio of 1.75 times and 1.57 times as of December 31, 2011 and 2010, respectively, remaining in compliance with all covenants related to the borrowing arrangements. Under our borrowing arrangements and expectcurrent financing policy, we have targeted an adjusted consolidated leverage ratio range of 2.0 times to remain in compliance with those covenants in the future.2.25 times.
OurThe table below outlines the calculations of the fixed charge coverage ratio and adjusted debt to adjusted EBITDAR ratio was 1.6 times and 2.4 timescovenants, as ofdefined in the Credit Agreement governing the Revolving Credit Facility, for the twelve months ended December 31, 2011 and 2010 and 2009, respectively. Under our current financing plan, we have a target adjusted consolidated leverage ratio of 2.0 times to 2.25 times.(dollars in thousands):
| Twelve Months Ended December 31, | ||||||||
| (In thousands, except adjusted debt to EBITDAR ratio) | 2010 | 2009 | ||||||
GAAP debt | $ | 358,704 | $ | 790,748 | ||||
Add: Letters of credit | 71,206 | 72,381 | ||||||
Rent X 6 | 1,361,274 | 1,374,804 | ||||||
Less: Premium on exchangeable notes | — | 718 | ||||||
Non-GAAP adjusted debt | $ | 1,791,184 | $ | 2,237,215 | ||||
GAAP net income | $ | 419,373 | $ | 307,498 | ||||
Legacy CSK DOJ investigation charge | 20,900 | — | ||||||
Gain on settlement of note receivable, net of tax | (7,215 | ) | — | |||||
Non-GAAP adjusted net income | 433,058 | 307,498 | ||||||
Add: Interest expense | 39,273 | 45,176 | ||||||
Taxes, net of impact of gain on settlement of note receivable | 265,576 | 189,400 | ||||||
Adjusted EBIT | 737,907 | 542,074 | ||||||
Add: Depreciation and amortization | 161,442 | 148,179 | ||||||
Rent expense | 226,879 | 229,134 | ||||||
Stock option compensation expense | 14,947 | 13,451 | ||||||
Adjusted EBITDAR | $ | 1,141,175 | $ | 932,838 | ||||
Adjusted debt to adjusted EBITDAR | 1.6 | 2.4 | ||||||
| Year Ended | Year Ended | |||||||
| December 31, 2011 | December 31, 2010 | |||||||
GAAP net income | $ | 507,673 | $ | 419,373 | ||||
Add: Interest expense | 28,165 | 39,273 | ||||||
Rent expense | 230,897 | 226,879 | ||||||
Provision for income taxes | 308,100 | 270,000 | ||||||
Depreciation expense | 164,579 | 154,812 | ||||||
Amortization expense | 1,301 | 6,630 | ||||||
Non-cash share based compensation | 20,579 | 14,947 | ||||||
Gain on settlement of note receivable | — | (11,639 | ) | |||||
Write-off of asset-based revolving credit facility debt issuance costs | 21,626 | — | ||||||
Legacy CSK DOJ investigation charge | — | 20,900 | ||||||
|
|
|
| |||||
Non-GAAP adjusted net income (EBITDAR) | $ | 1,282,920 | $ | 1,141,175 | ||||
|
|
|
| |||||
Interest expense | $ | 28,165 | $ | 39,273 | ||||
Capitalized interest | 4,666 | 5,133 | ||||||
Rent expense | 230,897 | 226,879 | ||||||
|
|
|
| |||||
Total fixed charges | $ | 263,728 | $ | 271,285 | ||||
|
|
|
| |||||
Fixed charge coverage ratio | 4.86 | 4.21 | ||||||
GAAP debt | $ | 797,574 | $ | 358,704 | ||||
Stand-by letters of credit | 59,917 | 71,206 | ||||||
Discount on senior notes | 3,683 | — | ||||||
Six-times rent expense | 1,385,382 | 1,361,274 | ||||||
|
|
|
| |||||
Non-GAAP adjusted debt | $ | 2,246,556 | $ | 1,791,184 | ||||
|
|
|
| |||||
Adjusted debt to adjusted EBITDAR ratio | 1.75 | 1.57 | ||||||
The fixed charge coverage ratio and adjusted debt to adjusted EBITDAR ratio discussed in the paragraph and presented in the table above isare not derived in accordance with United States generally accepted accounting principles (“GAAP”).U.S. GAAP. We do not, and nor do we suggest investors should, consider such non-GAAP financial measures in isolation from, or as a substitute for, GAAP financial information. We believe that the presentation of financial resultsour fixed charge coverage ratio and estimates excluding the impact of the CSK DOJ investigation charge, the gain from the settlement of the note receivable, and the presentation ofadjusted debt to adjusted EBITDAR provides meaningful supplemental information to both management and investors that is indicative ofreflects the required covenants under our core operations.credit agreement. We excludeinclude these items in judging our performance and believe this non-GAAP information is useful to investors as well. Material limitations of thisthese non-GAAP measuremeasures are that such measures do not reflect actual GAAP amounts. We compensate for such limitations by presenting, in the table above, the accompanying reconciliation to the most directly comparable GAAP measures.
OFF BALANCEOFF-BALANCE SHEET ARRANGEMENTS
Off balanceOff-balance sheet arrangements are transactions, agreements, or other contractual arrangements with an unconsolidated entity for which we have an obligation to the entity that is not recorded in our consolidated financial statements. We have utilized various off balance sheet financial instruments from time to time as sources of cash when such instruments provided a cost-effective alternative to our existing sources of cash. We do not believe, however, that we are dependent on the availability of these instruments to fund our working capital requirements or our growth plans.
On December 29, 2000, we entered into a sale-leaseback transaction with an unrelated party. Under the terms of the transaction, we sold 90 properties, including land, buildings and improvements, which generated $52.3$52 million of cash. The lease, which is being accounted for as an operating lease, provides for an initial lease term of 21 years and may be extended for one initial ten-year period and two additional successive periods of five years each. The resulting gain of $4.5$5 million has been deferred and is being amortized over the initial lease term. Net rent expense during the initial term is approximately $5.3$5 million annually.
In August 2001, we entered into a sale-leaseback with O’Reilly-Wooten, 2001 LLP (an entity owned by certain affiliates of the Company)our affiliates). The transaction involved the sale and leaseback of nine O’Reilly Auto Parts stores and generated approximately $5.6$6 million of cash. The transaction did not result in a material gain or loss. The lease, which has been accounted for as an operating lease, calls for an initial term of 15 years with three five-year renewal options.
We issuedissue stand-by letters of credit provided by a $200 million sub limit under the Revolving Credit Facility that reducedreduce our available borrowings.borrowings under the Revolving Credit Facility. Those letters of credit wereare issued primarily to satisfy the requirements of workers compensation, general liability and other insurance policies. Substantially all of the outstanding letters of credit hadhave a one-year term from the date of issuance. Letters of credit totaling $71.2$60 million and $72.3$71 million were outstanding at December 31, 20102011 and 2009,2010, respectively.
CONTRACTUAL OBLIGATIONS
Our contractual obligations as of December 31, 2011, included commitments for short and long-term debt arrangements, interest payments related to long-term debt, future payments under non-cancelable lease arrangements, self-insurance reserves and purchase obligations for construction contract commitments, which are identified in the table below and are fully disclosed in Note 5 “Long-Term Debt” and Note 11 “Commitments” to the Consolidated Financial Statements. We expect to fund these commitments primarily with operating cash flows generated in the normal course of business or through borrowings under our Revolving Credit Facility.
Deferred income taxes and commitments with various vendors for the purchase of inventory are included in “Other liabilities” on our Consolidated Balance Sheets but are not reflected in the table below due to the absence of scheduled maturities, the nature of the account or the commitment’s cancellation terms. Due to the absence of scheduled maturities, the timing of certain of these payments cannot be determined, except for amounts estimated to be payable in 2011,2012, which are included in “Current liabilities” on our Consolidated Balance Sheets.
Our contractual obligations as of December 31, 2010, included commitments for future payments under non-cancelable lease arrangements, short and long-term debt arrangements, interest payments related to long-term debt, fixed payments related to interest rate swaps and purchase obligations for construction contract commitments, which are summarized in the table below and are fully disclosed in Note 4 “Long-Term Debt” and Note 6 “Commitments” to the consolidated financial statements. We expect to fund these commitments primarily with operating cash flows generated in the normal course of business or through borrowings under our Revolver.
| Payments Due By Period | Payments Due By Period | |||||||||||||||||||||||||||||||||||||||
| Total | Before 1 Year | 1 to 2 Years | 3 to 4 Years | Years 5 and Over | Total | Before 1 Year | 1 to 2 Years | 3 to 4 Years | Years 5 and Over | |||||||||||||||||||||||||||||||
| (In thousands) | (In thousands) | |||||||||||||||||||||||||||||||||||||||
Contractual Obligations: | ||||||||||||||||||||||||||||||||||||||||
Long-term debt principal and interest payments | $ | 356,087 | $ | 87 | $ | 356,000 | $ | — | $ | — | $ | 797,727 | $ | 737 | $ | 477 | $ | 177 | $ | 796,336 | ||||||||||||||||||||
Payments under interest rate swap agreements | 4,768 | 4,768 | — | — | — | |||||||||||||||||||||||||||||||||||
Future minimum lease payments under capital leases (4) | 2,938 | 1,518 | 1,071 | 254 | 95 | |||||||||||||||||||||||||||||||||||
Future minimum lease payments under operating leases (4) | 1,507,557 | 219,941 | 381,106 | 276,108 | 630,402 | |||||||||||||||||||||||||||||||||||
Future minimum lease payments under capital leases(2) | 256 | 77 | 154 | 25 | — | |||||||||||||||||||||||||||||||||||
Future minimum lease payments under operating leases(2) | 1,650,698 | 226,381 | 400,661 | 297,947 | 725,709 | |||||||||||||||||||||||||||||||||||
Other obligations | 3,600 | 600 | 1,200 | 1,200 | 600 | 3,000 | 600 | 1,200 | 1,200 | — | ||||||||||||||||||||||||||||||
Self-insurance reserves (5) | 109,351 | 53,416 | 29,038 | 14,260 | 12,637 | |||||||||||||||||||||||||||||||||||
Self-insurance reserves(3) | 116,096 | 53,155 | 32,009 | 15,736 | 15,196 | |||||||||||||||||||||||||||||||||||
Construction commitments | 64,816 | 64,816 | — | — | — | 41,616 | 41,616 | — | — | — | ||||||||||||||||||||||||||||||
|
|
|
|
| ||||||||||||||||||||||||||||||||||||
Total contractual cash obligations | $ | 2,049,117 | $ | 345,146 | $ | 768,415 | $ | 291,822 | $ | 643,734 | $ | 2,609,393 | $ | 322,566 | $ | 434,501 | $ | 315,085 | $ | 1,537,241 | ||||||||||||||||||||
|
|
|
|
| ||||||||||||||||||||||||||||||||||||
| (1) |
| On January 14, 2011, we entered into a new credit agreement for a five-year $750 million |
| The minimum lease payments above do not include certain tax, insurance and maintenance costs, which are also required contractual obligations under our operating leases but are generally not fixed and can fluctuate from year to year. These expenses historically average approximately 20% of the corresponding lease payments. |
| We use various self-insurance mechanisms to provide for potential liabilities from workers’ compensation, vehicle and general liability, and employee health care benefits. These liabilities are recorded on our Consolidated Balance Sheets at our estimate of their net present value and do not have scheduled maturities, however we can estimate the timing of future payments based upon historical patterns. |
We record a reserve for potential liabilities related to uncertain tax positions, including estimated interest and penalties.penalties, which are fully disclosed in Note 14 “Income Taxes” to the Consolidated Financial Statements. These estimates are not included in the above table because the timing related to the ultimate resolution or settlement of these positions cannot be determined. As of December 31, 2010,2011, we recorded a liability of $41.3$53 million related to these uncertain tax positions on our Consolidated Balance Sheets, all of which was included as a component of “Other liabilities”.
CRITICAL ACCOUNTING ESTIMATES
The preparation of our financial statements in accordance with GAAP requires the application of certain estimates and judgments by management. Management bases its assumptions, estimates, and adjustments on historical experience, current trends and other factors believed to be relevant at the time the consolidated financial statements are prepared. Management believes that the following policies are critical due to the inherent uncertainty of these matters and the complex and subjective judgments required to establish these estimates. Management continues to review these critical accounting policies and estimates to ensure that the consolidated financial statements are presented fairly in accordance with GAAP. However, actual results could differ from our assumptions and estimates and such differences could be material.
Inventory Obsolescence and Shrink – Inventory, which consists of automotive hard parts, maintenance items, accessories and tools, is stated at the lower of cost or market. The extended nature of the life cycle of our products is such that the risk of obsolescence of our inventory is minimal. The products that we sell generally have applications in our markets for a relatively long period of time in conjunction with the corresponding vehicle population. We have developed sophisticated systems for monitoring the life cycle of a given product and, accordingly, have historically been very successful in adjusting the volume of our inventory in conjunction with a decrease in demand. We do record a reserve to reduce the carrying value of our inventory through a charge to cost of sales in the isolated instances where we believe that the market value of a product line is lower than our recorded cost. This reserve is based on our assumptions about the marketability of our existing inventory and is subject to uncertainty to the extent that we must estimate, at a given point in time, the market value of inventory that will be sold in future periods. Ultimately, our projections could differ from actual results and could result in a material impact to our stated inventory balances. We have historically not had to materially adjust our obsolescence reserves due to the factors discussed above and do not anticipate that we will experience material changes in our estimates in the future.
We also record a reserve to reduce the carrying value of our perpetual inventory to account for quantities in our perpetual records above the actual existing quantities on hand caused by unrecorded shrink. We estimate this reserve based on the results of our extensive and frequent cycle counting programs and periodic, full physical inventories at our stores and DCs. To the extent that our estimates do not accurately reflect the actual unrecorded inventory shrinkage, we could potentially experience a material impact to our inventory balances. We have historically been able to provide a timely and accurate measurement of shrink and have not experienced material adjustments to our estimates. If unrecorded shrink changed 10% from the estimate that we recorded based on our historical experience at December 31, 2011, the financial impact would have been approximately $1 million or 0.1% of pretax income for the year ended December 31, 2011.
Accounts Receivable – We provide credit to our commercial customers in the ordinary course of business. We estimate the allowance for doubtful accounts on these receivables based on historical loss ratios and other relevant factors. Actual results have consistently been within management’s expectations, and we do not believe there is a reasonable likelihood that there will be a material change in the future that will require a significant change in the assumptions or estimates we use to calculate our allowance for doubtful accounts. However, if actual results differ from our estimates, we may be exposed to losses or gains. If the allowance for doubtful accounts were changed 10% from our estimated allowance at December 31, 2011, the financial impact would have been approximately $1 million or 0.1% of pretax income for the year ended December 31, 2011.
Valuation of Long-Lived Assets and Goodwill -We evaluate the carrying value of long-lived assets for impairment whenever events or changes in circumstances indicate the carrying value of these assets might exceed their current fair values. As part of the evaluation, we review performance at the store level to identify any stores with current period operating losses that should be considered for impairment. A potential impairment has occurred if the projected future undiscounted cash flows realized from the best possible use of the asset are less than the carrying value of the asset. The estimate of cash flows includes management’s assumptions of cash inflows and outflows directly resulting from the use of that asset in operations. If the carrying amount of an asset exceeds its estimated future cash flows, an impairment charge is recognized for the amount by which the carrying amount of the asset exceeds the fair value of the assets. Our impairment analyses contain estimates due to the inherently judgmental nature of forecasting long-term estimated cash flows and determining the ultimate useful lives and fair values of the assets. Actual results could differ from these estimates, which could materially impact our impairment assessment.
We review goodwill for impairment annually on November 30, or when events or changes in circumstances indicate the carrying value of these assets might exceed their current fair values. We have not historically recorded an impairment to goodwill. The process of evaluating goodwill for impairment involves the determination of the fair value of our Company using the market approach. Inherent in such fair value determinations are certain judgments and estimates, including estimates which incorporate assumptions marketplace participants would use in making their estimates of fair value. In the future, if events or market conditions affect the estimated fair value to the extent that an asset is impaired, we will adjust the carrying value of these assets in the period in which the impairment occurs, however, we do not believe there has been any change of events or circumstances that would indicate that a reevaluation of goodwill is required as of December 31, 2011, nor do we believe goodwill is at risk of failing impairment testing. If the price of O’Reilly stock, which was a primary input used to determine our market capitalization during step one of goodwill impairment testing, changed by 10% from the value used during testing, the results and our conclusions would not have changed and no further steps would have been required.
Vendor concessions– We receive concessions from our vendors through a variety of programs and arrangements, including co-operative advertising, allowances for warranties, merchandise allowances and volume purchase rebates. Co-operative advertising allowances that are incremental to our advertising program, specific to a product or event and identifiable for accounting purposes, are reported as a reduction of advertising expense in the period in which the advertising occurred. All other material vendor concessions are recognized as a reduction to the cost of inventory. Amounts receivable from vendors also include amounts due to us relating to vendor purchases and product returns. Management regularly reviews amounts receivable from vendors and assesses the need for a reserve for uncollectible amounts based on our evaluation of our vendors’ financial position and corresponding ability to meet their financial obligations. Based on our historical results and current assessment, we have not recorded a reserve for uncollectible amounts in our consolidated financial statements, and we do not believe there is a reasonable likelihood that our ability to collect these amounts will differ from our expectations. The eventual ability of our vendors to pay us the obliged amounts could differ from our assumptions and estimates, and we may be exposed to losses or gains that could be material.
vendors and assesses the need for a reserve for uncollectible amounts based on our evaluation of our vendors’ financial position and corresponding ability to meet their financial obligations. Based on our historical results and current assessment, we have not recorded a reserve for uncollectible amounts in our consolidated financial statements, and we do not believe there is a reasonable likelihood that our ability to collect these amounts will differ from our expectations. The eventual ability of our vendors to pay us the obliged amounts could differ from our assumptions and estimates, and we may be exposed to losses or gains that could be material. |
Self-Insurance Reserves – We use a combination of insurance and self-insurance mechanisms to provide for potential liabilities from workers’ compensation, general liability, vehicle liability, property loss, and employeeTeam Member health care benefits. With the exception of employeecertain Team Member health care benefit liabilities, which are limited by the design of these plans, we obtain third-party insurance coverage to limit our exposure for any individual workers’ compensation, general liability, vehicle liability or property loss claim. When estimating our self-insurance liabilities, we consider a number of factors, including historical claims experience and trend-lines, projected medical and legal inflation, and growth patterns and exposure forecasts. The assumptions made by management as they relate to each of these factors represent our judgment as to the most probable cumulative impact of each factor to our future obligations. Our calculation of self-insurance liabilities requires management to apply judgment to estimate the ultimate cost to settle reported claims and claims incurred but not yet reported as of the balance sheet date and the application of alternative assumptions could result in a different estimate of these liabilities. Actual claim activity or development may vary from our assumptions and estimates, which may result in material losses or gains. As we obtain additional information that affects the assumptions and estimates we used to recognize liabilities for claims incurred in prior accounting periods, we adjust our self-insurance liabilities to reflect the revised estimates based on this additional information. These liabilities are recorded at our estimate of their net present value. These liabilities do not have scheduled maturities, but we can estimate the timing of future payments based upon historical patterns. We could apply alternative assumptions regarding the timing of payments or the applicable discount rate that could result in materially different estimates of the net present value of the liabilities. If self-insurance reserves were changed 10% from our estimated reserves at December 31, 2010,2011, the financial impact would have been approximately $10$11 million or 1.5%1.3% of pretax income for the year ended December 31, 2010.2011.
Accounts ReceivableClosed Property Reserves – We provide creditmaintain reserves for closed stores and other properties that are no longer utilized in current operations. We accrue for closed property operating lease liabilities using a credit-adjusted discount rate to calculate the present value of the remaining non-cancelable lease payments, contractual occupancy costs and lease termination fees after the closing date, net of estimated sublease income. The closed property lease liabilities are expected to be paid over the remaining lease terms. We estimate sublease income and future cash flows based on our commercial customersexperience and knowledge of the market in which the closed property is located, our previous efforts to dispose of similar assets and existing economic conditions. Adjustments to closed property reserves are made to reflect changes in estimated sublease income or actual exit costs from original estimates. Adjustments are made for changes in estimates in the ordinary course of business. We estimateperiod in which the allowance for doubtful accounts on these receivables based on historical loss ratios and other relevant factors. Actual results have consistently been within management’s expectations, and we do not believe there is a reasonable likelihood that there will be a material change in the future that will require a significant change in the assumptions or estimates we use to calculate our allowance for doubtful accounts. However, if actual results differ from our estimates, we may be exposed to losses or gains.changes become known. If the allowance for doubtful accountsclosed property reserves were changed 10% from our estimated allowancereserves at December 31, 2010,2011, the financial impact would have been approximately $0.8$1 million or 0.1%0.2% of pretax income for the year ended December 31, 2010.2011.
Legal Reserves – We maintain reserves for expenses associated with litigation for which O’Reilly is currently involved. We are currently involved in litigation incidental to the ordinary conduct of our business as well as resolving the governmental investigations and litigation that are being conducted against certain of CSK’s former employees for alleged conduct relating to periods prior to the acquisition date. As a result of the acquisition, we expect to continue to incur ongoing legal fees related to such investigations, litigation and indemnity obligations. Our legal reserve was principally recorded as an assumed liability in our allocation of the purchase price of CSK. Management, with the assistance of outside legal counsel, must make estimates of potential legal obligations and possible liabilities arising from such litigation and records reserves for these expenditures. If legal reserves were changed 10% from our estimated reserves at December 31, 2011, the financial impact would have been approximately $2 million or 0.2% of pretax income for the year ended December 31, 2011.
Taxes – We operate within multiple taxing jurisdictions and are subject to audit in these jurisdictions. These audits can involve complex issues, which may require an extended period of time to resolve. We regularly review our potential tax liabilities for tax years subject to audit. The amount of such liabilities is based on various factors, such as differing interpretations of tax regulations by the responsible tax authority, experience with previous tax audits and applicable tax law rulings. Changes in our tax liability may occur in the future as our assessments change based on the progress of tax examinations in various jurisdictions and/or changes in tax regulations. In management’s opinion, adequate provisions for income taxes have been made for all years presented. The estimates of our potential tax liabilities contain uncertainties because management must use judgment to estimate the exposures associated with our various tax positions and actual results could differ from our estimates. Alternatively, we could have applied assumptions regarding the eventual outcome of the resolution of open tax positions that could differ from our current estimates but that would still be reasonable given the nature of a particular position. While our estimates are subject to the uncertainty noted in the preceding discussion, our initial estimates of our potential tax liabilities have historically not been materially different from actual results except in instances where we have reversed liabilities that were recorded for periods that were subsequently closed with the applicable taxing authority.
Inventory Obsolescence and Shrink – Inventory, which consists of automotive hard parts, maintenance items, accessories and tools, is stated at the lower of cost or market. The extended nature of the life cycle of our products is such that the risk of obsolescence of our inventory is minimal. The products that we sell generally have applications in our markets for a relatively long period of time in conjunction with the corresponding vehicle population. We have developed sophisticated systems for
|
We also record a reserve to reduce the carrying value of our perpetual inventory to account for quantities in our perpetual records above the actual existing quantities on hand caused by unrecorded shrink. We estimate this reserve based on the results of our extensive and frequent cycle counting programs and periodic, full physical inventories at our stores and DCs. To the extent that our estimates do not accurately reflect the actual unrecorded inventory shrinkage, we could potentially experience a material impact to our inventory balances. We have historically been able to provide a timely and accurate measurement of shrink and have not experienced material adjustments to our estimates. If unrecorded shrink changed 10% from the estimate that we recorded based on our historical experience at December 31, 2010, the financial impact would have been approximately $0.6 million or 0.1% of pretax income for the year ended December 31, 2010.
Valuation of Long-Lived Assets and Goodwill – We evaluate the carrying value of long-lived assets whenever events or changes in circumstances indicate that a potential impairment has occurred. As part of the evaluation, we review performance at the store level to identify any stores with current period operating losses that should be considered for impairment. A potential impairment has occurred if the projected future undiscounted cash flows realized from the best possible use of the asset are less than the carrying value of the asset. The estimate of cash flows includes management’s assumptions of cash inflows and outflows directly resulting from the use of that asset in operations. If the carrying amount of an asset exceeds its estimated future cash flows, an impairment charge is recognized for the amount by which the carrying amount of the asset exceeds the fair value of the assets. Our impairment analyses contain estimates due to the inherently judgmental nature of forecasting long-term estimated cash flows and determining the ultimate useful lives and fair values of the assets. Actual results could differ from these estimates, which could materially impact our impairment assessment.
We review goodwill and other intangible assets for impairment annually on December 31, or when events or changes in circumstances indicate the carrying value of these assets might exceed their current fair values. We have not historically recorded an impairment to our goodwill or intangible assets. The process of evaluating goodwill for impairment involves the determination of the fair value of our Company using the market approach. Inherent in such fair value determinations are certain judgments and estimates, including estimates which incorporate assumptions marketplace participants would use in making their estimates of fair value. In the future, if events or market conditions affect the estimated fair value to the extent that an asset is impaired, we will adjust the carrying value of these assets in the period in which the impairment occurs, however, we do not believe there has been any change of events or circumstances that would indicate that a reevaluation of goodwill or other intangible assets is required as of December 31, 2010, nor do we believe goodwill or any other intangible assets are at risk of failing impairment testing. If the price of O’Reilly stock, which was a primary input used to determine the Company’s market capitalization during step one of goodwill impairment testing, changed by 10% from the value used during testing, the results and our conclusions would not have changed and no further steps would have been required.
Closed Property Reserves – We maintain reserves for closed stores and other properties that are no longer utilized in current operations. We accrue for closed property operating lease liabilities using a credit-adjusted discount rate to calculate the present value of the remaining non-cancelable lease payments, contractual occupancy costs and lease termination fees after the closing date, net of estimated sublease income. The closed property lease liabilities are expected to be paid over the remaining lease terms. We estimate sublease income and future cash flows based on our experience and knowledge of the market in which the closed property is located, our previous efforts to dispose of similar assets and existing economic conditions. Adjustments to closed property reserves are made to reflect changes in estimated sublease income or actual exit costs from original estimates. Adjustments are made for changes in estimates in the period in which the changes become known. If closed property reserves were changed 10% from our estimated reserves at December 31, 2010, the financial impact would have been approximately $2 million or 0.3% of pretax income for the year ended December 31, 2010.
Legal Reserves – We maintain reserves for expenses associated with litigation for which O’Reilly is currently involved. We are currently involved in litigation incidental to the ordinary conduct of our business as well as resolving the governmental investigations and litigation that are being conducted against CSK and certain of its former employees for alleged conduct relating to periods prior to the acquisition date. As a result of the acquisition, we expect to continue to incur ongoing legal fees related to such investigations, litigation and indemnity obligations. Our legal reserve was principally recorded as an assumed liability in our allocation of the purchase price of CSK. Management, with the assistance of outside legal counsel, must make estimates of potential legal obligations and possible liabilities arising from such litigation and records reserves for these expenditures. If legal reserves were changed 10% from our estimated reserves at December 31, 2010, the financial impact would have been approximately $4.3 million or 0.6% of pretax income for the year ended December 31, 2010.
INFLATION AND SEASONALITY
For the last three fiscal years, we have been successful, in many cases, in reducing the effects of merchandise cost increases principally by taking advantage of vendor incentive programs, economies of scale resulting from increased volume of purchases and selective forward buying. To the extent our acquisition cost increased due to base commodity price increases industry-wide, we have typically been able to pass along these increased costs through higher retail prices for the affected products. As a result, we do not believe our operations have been materially, adversely affected by inflation.
To some extent, our business is seasonal primarily as a result of the impact of weather conditions on customer buying patterns. While we have historically realized operating profits in each quarter of the year, our store sales and profits have historically been higher in the second and third quarters (April through September) than in the first and fourth quarters (October through March) of the year.
QUARTERLY RESULTS
The following table sets forth certain quarterly unaudited operating data for fiscal 20102011 and 2009.2010. The unaudited quarterly information includes all adjustments which management considers necessary for a fair presentation of the information shown.
The unaudited operating data presented below should be read in conjunction with our consolidated financial statements and related notes included elsewhere in this annual report, and the other financial information included therein.
| Fiscal 2010 | Fiscal 2011 | |||||||||||||||||||||||||||||||
| First Quarter | Second Quarter | Third Quarter | Fourth Quarter | First Quarter | Second Quarter | Third Quarter | Fourth Quarter | |||||||||||||||||||||||||
| (In thousands, except per share and comparable store sales data) | (In thousands, except per share and comparable store sales data) | |||||||||||||||||||||||||||||||
Comparable store sales | 6.9 | % | 7.9 | % | 11.1 | % | 9.2 | % | 5.7 | % | 4.4 | % | 4.8 | % | 3.3 | % | ||||||||||||||||
Sales | $ | 1,280,067 | $ | 1,381,241 | $ | 1,425,887 | $ | 1,310,330 | $ | 1,382,738 | $ | 1,479,318 | $ | 1,535,453 | $ | 1,391,307 | ||||||||||||||||
Gross profit | 618,347 | 672,633 | 693,415 | 636,597 | 669,781 | 718,661 | 754,210 | 694,697 | ||||||||||||||||||||||||
Former CSK officer clawback | — | — | — | (2,798 | ) | |||||||||||||||||||||||||||
Operating income | 168,445 | 181,164 | 199,031 | 164,136 | 196,437 | 222,368 | 241,050 | 206,911 | ||||||||||||||||||||||||
Gain on settlement of note receivable | — | — | — | 11,639 | ||||||||||||||||||||||||||||
Write-off of debt issuance costs | (21,626 | ) | — | — | — | |||||||||||||||||||||||||||
Termination of interest rate swap agreements | (4,237 | ) | — | — | — | |||||||||||||||||||||||||||
Net income | 97,476 | 99,595 | 116,542 | 105,760 | 102,474 | 133,772 | 148,439 | 122,988 | ||||||||||||||||||||||||
Earnings per share – basic | 0.71 | 0.72 | 0.84 | 0.76 | $ | 0.73 | $ | 0.97 | $ | 1.12 | $ | 0.96 | ||||||||||||||||||||
Earnings per share – assuming dilution | 0.70 | 0.71 | 0.82 | 0.74 | $ | 0.72 | $ | 0.96 | $ | 1.10 | $ | 0.94 | ||||||||||||||||||||
| Fiscal 2009 | Fiscal 2010 | |||||||||||||||||||||||||||||||
| First Quarter | Second Quarter | Third Quarter | Fourth Quarter | First Quarter | Second Quarter | Third Quarter | Fourth Quarter | |||||||||||||||||||||||||
| (In thousands, except per share and comparable store sales data) | (In thousands, except per share and comparable store sales data) | |||||||||||||||||||||||||||||||
Comparable store sales | 5.7 | % | 4.8 | % | 5.3 | % | 2.7 | % | 6.9 | % | 7.9 | % | 11.1 | % | 9.2 | % | ||||||||||||||||
Sales | $ | 1,163,749 | $ | 1,251,377 | $ | 1,258,239 | $ | 1,173,697 | $ | 1,280,067 | $ | 1,381,241 | $ | 1,425,887 | $ | 1,310,330 | ||||||||||||||||
Gross profit | 542,670 | 603,769 | 610,555 | 569,534 | 618,347 | 672,633 | 693,415 | 636,597 | ||||||||||||||||||||||||
Legacy CSK DOJ investigation charge | — | 15,000 | 5,900 | — | ||||||||||||||||||||||||||||
Operating income | 113,336 | 149,675 | 149,196 | 125,412 | 168,445 | 181,164 | 199,031 | 164,136 | ||||||||||||||||||||||||
Gain on settlement of note receivable | — | — | — | 11,639 | ||||||||||||||||||||||||||||
Net income | 62,835 | 85,515 | 87,225 | 71,923 | 97,476 | 99,595 | 116,542 | 105,760 | ||||||||||||||||||||||||
Earnings per share – basic | 0.47 | 0.63 | 0.64 | 0.52 | $ | 0.71 | $ | 0.72 | $ | 0.84 | $ | 0.76 | ||||||||||||||||||||
Earnings per share – assuming dilution | 0.46 | 0.62 | 0.63 | 0.52 | $ | 0.70 | $ | 0.71 | $ | 0.82 | $ | 0.74 | ||||||||||||||||||||
RECENT ACCOUNTING PRONOUNCEMENTS
In January of 2010, the Financial Accounting Standards Board (“FASB”) issued ASUAccounting Standards Update (“ASU”) No. 2010-06,Fair Value Measurements and Disclosures (Topic 820): Improving Disclosures about Fair Value Measurements(“ASU (“2010-06”). ASU 2010-06 amends Subtopic 820-10, requiring additional disclosures regarding fair value measurements such as transfers in and out of Levels 1 and 2, as well as separate disclosures about activity relating to Level 3 measurements. ASU 2010-06 clarifies existing disclosure requirements related to the level of disaggregation and input valuation techniques. The updated guidance iswas effective for interim and annual periods beginning after December 15, 2009, with the exception of the new Level 3 activity disclosures, which arewere effective for interim and annual periods beginning after December 15, 2010. The adoptionapplication of the newthis guidance affected disclosures only and therefore, did not have a materialan impact on our consolidated financial position,condition, results of operations or cash flows.
In May of 2011, the FASB issued ASU No. 2011-04,Amendments to Achieve Common Fair Value Measurement and Disclosure Requirements in U.S. GAAP and International Financial Reporting Standards (“2011-04”). ASU 2011-04 was issued to bring the definition of fair value, the guidance for fair value measurement and the disclosure requirements under U.S. GAAP and International Financial Reporting Standards (“IFRS”) in line with one another. ASU 2011-04 also enhanced the disclosure requirements for changes and transfers within the valuation hierarchy levels, particularly valuations in Level 3 fair value measurements, and was effective for periods beginning after December 15, 2011. The adoptionapplication of this guidance affects disclosures only and therefore, should not have an impact on our consolidated financial condition, results of operations or cash flows.
In June of 2011, the FASB issued ASU No. 2011-05,Presentation of Comprehensive Income (“2011-05”). ASU 2011-05 was issued to improve the comparability of financial reporting between U.S. GAAP and IFRS, and eliminates previous U.S. GAAP guidance that allowed an entity to present components of other comprehensive income (“OCI”) as part of its statement of changes in shareholders’ equity. With the issuance of ASU 2011-05, companies are now required to report all components of OCI either in a single continuous statement of total comprehensive income, which includes components of both OCI and net income, or in a separate statement appearing consecutively with the statement of income. ASU 2011-05 does not affect current guidance for the accounting of the new Level 3components of OCI, or which items are included within total comprehensive income. In December of 2011, the FASB issued ASU No. 2011-12Deferral of the Effective Date for Amendments to the Presentation of Reclassifications of Items Out of Accumulated Other Comprehensive Income in Accounting Standards Update No. 2011-05(“2011-12”). ASU 2011-12 defers changes in ASU 2011-05 that relate to the presentation of reclassification adjustments shown on the face of the financial statements. No other requirements of ASU 2011-05 were affected by the issuance of ASU 2011-12, including the requirement to report income either in a single continuous financial statement or in a separate statement of total comprehensive income, which is effective for periods beginning after December 15, 2011, with early adoption permitted. We adopted this guidance with our 2011 financial statements; the application of this guidance affects presentation only and therefore, did not have an impact on our consolidated financial condition, results of operations or cash flows.
In September of 2011, the FASB issued ASU No. 2011-08Testing Goodwill for Impairment (“2011-08”). ASU 2011-08 was issued to simplify the impairment test of goodwill, by allowing entities to use a qualitative approach to determine whether goodwill impairment might exist, before completing the entire impairment test. Under ASU 2011-08, an entity has the option to first assess any qualitative factors that would lead to a determination that it is required inmore likely than not that the fair value of a reporting unit is less than its carrying amount. The changes under ASU 2011-08 are effective for public companies for annual and interim testing performed for periods beginning after December 15, 2011, andwith early adoption permitted. The application of this guidance is not expected to have a material impact on our consolidated financial position,condition, results of operations or cash flows.
| Item 7A. | Quantitative and Qualitative Disclosures about Market Risk |
We are subject to interest rate risk to the extent we borrow against our unsecured revolving credit facilitiesfacility (the “Revolving Credit Facility”) with variable interest rates. We had potential interest rate exposure with respect torates based on either a Base Rate or Eurodollar Rate, as defined in the $356 million outstanding balance on our variable interest rate debt at December 31, 2010; however, from time to time,credit agreement governing the Revolving Credit Facility. Historically, we had entered into interest rate swaps to reduce this exposure. On July 24, 2008, October 14, 2008, November 24, 2008, and January 21, 2010, we reduced our exposure to changes in interest rates by entering into interest rate swap contracts (“the Swaps”) with a total notional amount of $450 million. The interest rate swap transaction that we entered into with BBT on July 24, 2008, for $100 million matured on August 1, 2010; the interest rate swap transaction that we entered into with BBT on October 14, 2008, for $25 million and was scheduled to mature on October 17, 2010, was terminated at our request on September 16, 2010; the interest rate swap transactions we entered into with BBT, BA and/or SunTrust on October 14, 2008, totaling $75 million, matured on October 17, 2010, bringing the total notional amount of swapped debt to $250 million as of December 31, 2010. The Swaps represented contracts to exchange a floating rate for fixed interest payments periodically over the life of the swap agreement without exchange of the underlying notional amount. The notional amount of the swap is used to measure interest to be paid or received and does not represent the amount of exposure to credit loss.
If interest rates increased or decreased by 100 basis points, annualized interest expense and cash payments for interest would increase or decrease by approximately $1.1 million ($0.7 million after tax), based on our exposure to interest rate changes on variable rate debt that is not covered by the Swaps. This analysis does not consider the effects of the change in the level of overall economic activity that could exist in an environment of adversely changing interest rates. In the event of an adverse change in interest rates and to the extent that we have amounts outstanding under our variable interest rate credit facilities, management would likely take further actions that would seek to mitigate our exposure to interest rate risk.
Therisks associated with borrowings against our previous credit facility with variable interest rate contracts are derivative instruments which have been designated as cash flow hedges. We do not hold or issue derivative financials instruments for trading purposes.
All of the interest rate swap transactions that existedrates, however, as of December 31, 2010, for a total notional amount of $250 million, were terminated at the Company’s request on January 14, 2011, concurrent with the closingwe did not have any interest rate swap contracts and issuancehad no outstanding borrowings under our Revolving Credit Facility.
We invest certain of our excess cash balances in short-term, highly-liquid instruments with maturities of 30 days or less. We do not expect any material losses from our invested cash balances and we believe that our interest rate exposure is minimal. As of December 31, 2011, 4.875% Senior Notes.our cash and cash equivalents totaled $362 million.
| Item 8. | Financial Statements and Supplementary Data |
MANAGEMENT’S REPORT ON INTERNAL CONTROL OVER FINANCIAL REPORTING
The management of O’Reilly Automotive, Inc. and Subsidiaries (the “Company”), under the supervision and with the participation of the Company’s principal executive officer and principal financial officer and effected by the Company’s Board of Directors, is responsible for establishing and maintaining adequate internal control over financial reporting.reporting as defined in Rule 13(a)-15(f) or 15(d)-15(f) under the Securities Exchange Act of 1934, as amended. The Company’s internal control system is designed to provide reasonable assurance regarding the reliability of financial reporting and the preparation of financial statements for external purposes in accordance with accounting principles generally accepted in the United States.
Internal control over financial reporting includes all policies and procedures that:
pertain to the maintenance of records that, in reasonable detail, accurately and fairly reflect the transactions and dispositions of the assets of the Company;
provide reasonable assurance that transactions are recorded as necessary to permit preparation of financial statements in accordance with accounting principles generally accepted accounting principles,in the United States of America, and that receipts and expenditures of the Company are being made only in accordance with authorizations of management and directors of the Company; and
provide reasonable assurance regarding prevention or timely detection of unauthorized acquisition, use or disposition of the Company’s assets that could have a material effect on the financial statements.
Management recognizes that all internal control systems, no matter how well designed, have inherent limitations. Therefore, even those systems determined to be effective can provide only reasonable assurance with respect to financial statement preparation and presentation. Also, projections of any evaluation of effectiveness to future periods are subject to risk. Over time, controls may become inadequate because of changes in conditions or deterioration in the degree of compliance with policies or procedures.
Under the supervision and with the participation of the Company’s principal executive officer and principal financial officer, management assessed the effectiveness of the Company’s internal control over financial reporting as of December 31, 2010.2011. In making this assessment, management used the criteria set forth by the Committee of Sponsoring Organizations of the Treadway Commission (“COSO”) inInternal Control – Integrated Framework. Based on this assessment, management believes that as of December 31, 2010,2011, the Company’s internal control over financial reporting is effective based on those criteria.
Ernst & Young LLP, Independent Registered Public Accounting Firm, has audited the Company’s consolidated financial statements and has issued an attestation report on the effectiveness of the Company’s internal control over financial reporting, as stated in their report which is included herein.
| /s/ | /s/ | |||
Greg Henslee Chief Executive Officer & Co-President | Thomas McFall Executive Vice President of Finance & Chief Financial Officer | |||
| February 28, | February 28, | |||
REPORT OF INDEPENDENT REGISTERED PUBLIC ACCOUNTING FIRM
The Board of Directors and Shareholders of O’Reilly Automotive, Inc. and Subsidiaries
We have audited O’Reilly Automotive, Inc. and Subsidiaries’ internal control over financial reporting as of December 31, 2010,2011, based on criteria established in Internal Control—Integrated Framework issued by the Committee of Sponsoring Organizations of the Treadway Commission (the COSO criteria). O’Reilly Automotive, Inc. and Subsidiaries’ management is responsible for maintaining effective internal control over financial reporting, and for its assessment of the effectiveness of internal control over financial reporting included in the accompanying Management’s Report on Internal Control Over Financial Reporting. Our responsibility is to express an opinion on the company’s internal control over financial reporting based on our audit.
We conducted our audit in accordance with the standards of the Public Company Accounting Oversight Board (United States). Those standards require that we plan and perform the audit to obtain reasonable assurance about whether effective internal control over financial reporting was maintained in all material respects. Our audit included obtaining an understanding of internal control over financial reporting, assessing the risk that a material weakness exists, testing and evaluating the design and operating effectiveness of internal control based on the assessed risk, and performing such other procedures as we considered necessary in the circumstances. We believe that our audit provides a reasonable basis for our opinion.
A company’s internal control over financial reporting is a process designed to provide reasonable assurance regarding the reliability of financial reporting and the preparation of financial statements for external purposes in accordance with generally accepted accounting principles. A company’s internal control over financial reporting includes those policies and procedures that (1) pertain to the maintenance of records that, in reasonable detail, accurately and fairly reflect the transactions and dispositions of the assets of the company; (2) provide reasonable assurance that transactions are recorded as necessary to permit preparation of financial statements in accordance with generally accepted accounting principles, and that receipts and expenditures of the company are being made only in accordance with authorizations of management and directors of the company; and (3) provide reasonable assurance regarding prevention or timely detection of unauthorized acquisition, use, or disposition of the company’s assets that could have a material effect on the financial statements.
Because of its inherent limitations, internal control over financial reporting may not prevent or detect misstatements. Also, projections of any evaluation of effectiveness to future periods are subject to the risk that controls may become inadequate because of changes in conditions, or that the degree of compliance with the policies or procedures may deteriorate.
In our opinion, O’Reilly Automotive, Inc. and Subsidiaries maintained, in all material respects, effective internal control over financial reporting as of December 31, 2010,2011, based on the COSO criteria.criteria.
We also have audited, in accordance with the standards of the Public Company Accounting Oversight Board (United States), the consolidated balance sheets as of December 31, 20102011 and 2009,2010, and the related consolidated statements of income, comprehensive income, shareholders’ equity, and cash flows for each of the three years in the period ended December 31, 2010,2011, of O’Reilly Automotive, Inc. and Subsidiaries and our report dated February 28, 2011,2012, expressed an unqualified opinion thereon.
/s/ Ernst & Young LLP
Kansas City, Missouri
February 28, 2012
REPORT OF INDEPENDENT REGISTERED PUBLIC ACCOUNTING FIRM
The Board of Directors and Shareholders of O’Reilly Automotive, Inc. and Subsidiaries:
We have audited the accompanying consolidated balance sheets of O’Reilly Automotive, Inc. and Subsidiaries as of December 31, 20102011 and 2009,2010, and the related consolidated statements of income, comprehensive income, shareholders’ equity, and cash flows for each of the three years in the period ended December 31, 2010.2011. Our audits also included the financial statement schedule listed in the Index at Item 15(a). These financial statements and schedule are the responsibility of the Company’s management. Our responsibility is to express an opinion on these financial statements and schedule based on our audits.
We conducted our audits in accordance with the standards of the Public Company Accounting Oversight Board (United States). Those standards require that we plan and perform the audit to obtain reasonable assurance about whether the financial statements are free of material misstatement. An audit includes examining, on a test basis, evidence supporting the amounts and disclosures in the financial statements. An audit also includes assessing the accounting principles used and significant estimates made by management, as well as evaluating the overall financial statement presentation. We believe that our audits provide a reasonable basis for our opinion.
In our opinion, the financial statements referred to above present fairly, in all material respects, the consolidated financial position of O’Reilly Automotive, Inc. and Subsidiaries at December 31, 20102011 and 2009,2010, and the consolidated results of their operations and their cash flows for each of the three years in the period ended December 31, 2010,2011, in conformity with U.S. generally accepted accounting principles. Also, in our opinion, the related financial statement schedule, when considered in relation to the basic financial statements taken as a whole, presents fairly in all material respects the information set forth therein.
We also have audited, in accordance with the standards of the Public Company Accounting Oversight Board (United States), O’Reilly Automotive, Inc. and Subsidiaries’ internal control over financial reporting as of December 31, 2010,2011, based on criteria established in Internal Control – Control—Integrated Framework issued by the Committee of Sponsoring Organizations of the Treadway Commission and our report dated February 28, 2011,2012, expressed an unqualified opinion thereon.thereon.
/s/ Ernst & Young LLP
Kansas City, Missouri
February 28, 2012
(In thousands, except share data)
| December 31, | ||||||||
| 2010 | 2009 | |||||||
Assets | ||||||||
Current assets: | ||||||||
Cash and cash equivalents | $ | 29,721 | $ | 26,935 | ||||
Accounts receivable, less allowance for doubtful accounts of $8,349 in 2010 and $6,795 in 2009 | 121,807 | 107,887 | ||||||
Amounts receivable from vendors | 61,845 | 63,110 | ||||||
Inventory | 2,023,488 | 1,913,218 | ||||||
Deferred income taxes | 33,877 | 85,934 | ||||||
Other current assets | 30,514 | 29,635 | ||||||
Total current assets | 2,301,252 | 2,226,719 | ||||||
Property and equipment, at cost | 2,705,434 | 2,353,240 | ||||||
Less: accumulated depreciation and amortization | 775,339 | 626,861 | ||||||
Net property and equipment | 1,930,095 | 1,726,379 | ||||||
Notes receivable, less current portion | 18,047 | 12,481 | ||||||
Goodwill | 743,975 | 744,313 | ||||||
Other assets, net | 54,458 | 71,579 | ||||||
Total assets | $ | 5,047,827 | $ | 4,781,471 | ||||
Liabilities and shareholders’ equity | ||||||||
Current liabilities: | ||||||||
Accounts payable | $ | 895,736 | $ | 818,153 | ||||
Self-insurance reserves | 51,192 | 55,348 | ||||||
Accrued payroll | 52,725 | 42,790 | ||||||
Accrued benefits and withholdings | 45,542 | 44,295 | ||||||
Income taxes payable | 4,827 | 8,068 | ||||||
Other current liabilities | 177,505 | 143,781 | ||||||
Current portion of long-term debt | 1,431 | 106,708 | ||||||
Total current liabilities | 1,228,958 | 1,219,143 | ||||||
Long-term debt, less current portion | 357,273 | 684,040 | ||||||
Deferred income taxes | 68,736 | 18,321 | ||||||
Other liabilities | 183,175 | 174,102 | ||||||
Shareholders’ equity: | ||||||||
Preferred stock, $0.01 par value: | — | — | ||||||
Common stock, $0.01 par value: | 1,410 | 1,375 | ||||||
Additional paid-in capital | 1,141,749 | 1,042,329 | ||||||
Retained earnings | 2,069,496 | 1,650,123 | ||||||
Accumulated other comprehensive loss | (2,970 | ) | (7,962 | ) | ||||
Total shareholders’ equity | 3,209,685 | 2,685,865 | ||||||
Total liabilities and shareholders’ equity | $ | 5,047,827 | $ | 4,781,471 | ||||
| December 31, | ||||||||
| 2011 | 2010 | |||||||
Assets | ||||||||
Current assets: | ||||||||
Cash and cash equivalents | $ | 361,552 | $ | 29,721 | ||||
Accounts receivable, less allowance for doubtful accounts of $6,403 in 2011 and $8,349 in 2010 | 135,149 | 121,807 | ||||||
Amounts receivable from vendors | 68,604 | 61,845 | ||||||
Inventory | 1,985,748 | 2,023,488 | ||||||
Deferred income taxes | — | 33,877 | ||||||
Other current assets | 56,557 | 30,514 | ||||||
|
|
|
| |||||
Total current assets | 2,607,610 | 2,301,252 | ||||||
Property and equipment, at cost | 3,026,996 | 2,705,434 | ||||||
Less: accumulated depreciation and amortization | 933,229 | 775,339 | ||||||
|
|
|
| |||||
Net property and equipment | 2,093,767 | 1,930,095 | ||||||
Notes receivable, less current portion | 10,889 | 18,047 | ||||||
Goodwill | 743,907 | 743,975 | ||||||
Other assets, net | 44,328 | 54,458 | ||||||
|
|
|
| |||||
Total assets | $ | 5,500,501 | $ | 5,047,827 | ||||
|
|
|
| |||||
Liabilities and shareholders’ equity | ||||||||
Current liabilities: | ||||||||
Accounts payable | $ | 1,279,294 | $ | 895,736 | ||||
Self-insurance reserves | 53,155 | 51,192 | ||||||
Accrued payroll | 52,465 | 52,725 | ||||||
Accrued benefits and withholdings | 41,512 | 45,542 | ||||||
Deferred income taxes | 1,990 | — | ||||||
Income taxes payable | — | 4,827 | ||||||
Other current liabilities | 150,932 | 177,505 | ||||||
Current portion of long-term debt | 662 | 1,431 | ||||||
|
|
|
| |||||
Total current liabilities | 1,580,010 | 1,228,958 | ||||||
Long-term debt, less current portion | 796,912 | 357,273 | ||||||
Deferred income taxes | 88,864 | 68,736 | ||||||
Other liabilities | 189,864 | 183,175 | ||||||
Shareholders’ equity: | ||||||||
Preferred stock, $0.01 par value: Authorized shares – 5,000,000 Issued and outstanding shares – none | — | — | ||||||
Common stock, $0.01 par value: Authorized shares – 245,000,000 Issued and outstanding shares – 127,179,792 as of December 31, 2011, and 141,025,544 as of December 31, 2010 | 1,272 | 1,410 | ||||||
Additional paid-in capital | 1,110,105 | 1,141,749 | ||||||
Retained earnings | 1,733,474 | 2,069,496 | ||||||
Accumulated other comprehensive loss | — | (2,970 | ) | |||||
|
|
|
| |||||
Total shareholders’ equity | 2,844,851 | 3,209,685 | ||||||
|
|
|
| |||||
Total liabilities and shareholders’ equity | $ | 5,500,501 | $ | 5,047,827 | ||||
|
|
|
| |||||
See accompanying Notes to consolidated financial statements.
46
Consolidated Statements of Income
(In thousands, except per share data)
| Years ended December 31, | ||||||||||||
| 2010 | 2009 | 2008 | ||||||||||
Sales | $ | 5,397,525 | $ | 4,847,062 | $ | 3,576,553 | ||||||
Cost of goods sold, including warehouse and distribution expenses | 2,776,533 | 2,520,534 | 1,948,627 | |||||||||
Gross profit | 2,620,992 | 2,326,528 | 1,627,926 | |||||||||
Selling, general and administrative expenses | 1,887,316 | 1,788,909 | 1,292,309 | |||||||||
Legacy CSK DOJ investigation charge | 20,900 | — | — | |||||||||
Operating income | 712,776 | 537,619 | 335,617 | |||||||||
Other income (expense): | ||||||||||||
Debt prepayment costs | — | — | (7,157 | ) | ||||||||
Interim facility commitment fee | — | — | (4,150 | ) | ||||||||
Interest expense | (39,273 | ) | (45,176 | ) | (26,138 | ) | ||||||
Interest income | 1,941 | 1,543 | 3,185 | |||||||||
Gain on settlement of note receivable | 11,639 | — | — | |||||||||
Other, net | 2,290 | 2,912 | 1,175 | |||||||||
Total other expense | (23,403 | ) | (40,721 | ) | (33,085 | ) | ||||||
Income before income taxes | 689,373 | 496,898 | 302,532 | |||||||||
Provision for income taxes | 270,000 | 189,400 | 116,300 | |||||||||
Net income | $ | 419,373 | $ | 307,498 | $ | 186,232 | ||||||
Earnings per share - basic: | ||||||||||||
Earnings per share - basic | $ | 3.02 | $ | 2.26 | $ | 1.50 | ||||||
Weighted-average common shares outstanding - basic | 138,654 | 136,230 | 124,526 | |||||||||
Earnings per share - assuming dilution: | ||||||||||||
Earnings per share - assuming dilution | $ | 2.95 | $ | 2.23 | $ | 1.48 | ||||||
Weighted-average common shares outstanding - assuming dilution | 141,992 | 137,882 | 125,413 | |||||||||
| Years ended December 31, | ||||||||||||
| 2011 | 2010 | 2009 | ||||||||||
Sales | $ | 5,788,816 | $ | 5,397,525 | $ | 4,847,062 | ||||||
Cost of goods sold, including warehouse and distribution expenses | 2,951,467 | 2,776,533 | 2,520,534 | |||||||||
|
|
|
|
|
| |||||||
Gross profit | 2,837,349 | 2,620,992 | 2,326,528 | |||||||||
Selling, general and administrative expenses | 1,973,381 | 1,887,316 | 1,788,909 | |||||||||
Former CSK officer clawback | (2,798 | ) | — | — | ||||||||
Legacy CSK DOJ investigation charge | — | 20,900 | — | |||||||||
|
|
|
|
|
| |||||||
Operating income | 866,766 | 712,776 | 537,619 | |||||||||
Other income (expense): | ||||||||||||
Interest expense | (28,165 | ) | (39,273 | ) | (45,176 | ) | ||||||
Interest income | 2,245 | 1,941 | 1,543 | |||||||||
Write-off of asset-based revolving credit facility debt issuance costs | (21,626 | ) | — | — | ||||||||
Termination of interest rate swap agreements | (4,237 | ) | — | — | ||||||||
Gain on settlement of note receivable | — | 11,639 | — | |||||||||
Other, net | 790 | 2,290 | 2,912 | |||||||||
|
|
|
|
|
| |||||||
Total other (expense) | (50,993 | ) | (23,403 | ) | (40,721 | ) | ||||||
|
|
|
|
|
| |||||||
Income before income taxes | 815,773 | 689,373 | 496,898 | |||||||||
Provision for income taxes | 308,100 | 270,000 | 189,400 | |||||||||
|
|
|
|
|
| |||||||
Net income | $ | 507,673 | $ | 419,373 | $ | 307,498 | ||||||
|
|
|
|
|
| |||||||
Earnings per share-basic: | ||||||||||||
|
|
|
|
|
| |||||||
Earnings per share | $ | 3.77 | $ | 3.02 | $ | 2.26 | ||||||
|
|
|
|
|
| |||||||
Weighted-average common shares outstanding – basic | 134,667 | 138,654 | 136,230 | |||||||||
Earnings per share-assuming dilution: | ||||||||||||
|
|
|
|
|
| |||||||
Earnings per share | $ | 3.71 | $ | 2.95 | $ | 2.23 | ||||||
|
|
|
|
|
| |||||||
Weighted-average common shares outstanding – assuming dilution | 136,983 | 141,992 | 137,882 | |||||||||
See accompanying Notes to consolidated financial statements.
47
Consolidated Statements of Comprehensive Income
(In thousands)
| Years ended December 31, | ||||||||||||
| 2011 | 2010 | 2009 | ||||||||||
Components of comprehensive income: | ||||||||||||
Net income | $ | 507,673 | $ | 419,373 | $ | 307,498 | ||||||
Unrealized losses on cash flow hedges, net of tax | — | 4,992 | 3,551 | |||||||||
Reclassification adjustment for unrealized losses on cash flow hedges, net of tax, included in net income | 2,970 | — | — | |||||||||
|
|
|
|
|
| |||||||
Other comprehensive income | 2,970 | 4,992 | 3,551 | |||||||||
|
|
|
|
|
| |||||||
Total comprehensive income | $ | 510,643 | $ | 424,365 | $ | 311,049 | ||||||
|
|
|
|
|
| |||||||
See accompanying Notes to consolidated financial statements.
Consolidated Statements of Shareholders’ Equity
(In thousands)
| Common Stock | Additional Paid-In Capital | Retained Earnings | Accumulated Other Comprehensive Income (Loss) | Total | Comprehensive Income | |||||||||||||||||||||||
| Shares | Par Value | |||||||||||||||||||||||||||
Balance at December 31, 2007 | 115,261 | $ | 1,153 | $ | 441,731 | $ | 1,156,393 | $ | (6,800 | ) | $ | 1,592,477 | ||||||||||||||||
Net income | — | — | — | 186,232 | — | 186,232 | $ | 186,232 | ||||||||||||||||||||
Other comprehensive loss | — | — | — | — | (4,713 | ) | (4,713 | ) | (4,713 | ) | ||||||||||||||||||
Comprehensive income | $ | 181,519 | ||||||||||||||||||||||||||
Issuance of common stock under employee benefit plans | 546 | 5 | 13,710 | — | — | 13,715 | ||||||||||||||||||||||
Issuance of common stock under option plans | 876 | 9 | 18,277 | — | — | 18,286 | ||||||||||||||||||||||
Issued in CSK acquisition | 18,146 | 181 | 465,645 | — | — | 465,826 | ||||||||||||||||||||||
Excess tax benefit of stock options exercised | — | — | 1,573 | — | — | 1,573 | ||||||||||||||||||||||
Share based compensation | — | — | 8,822 | — | — | 8,822 | ||||||||||||||||||||||
Balance at December 31, 2008 | 134,829 | $ | 1,348 | $ | 949,758 | $ | 1,342,625 | $ | (11,513 | ) | $ | 2,282,218 | ||||||||||||||||
Net income | — | — | — | 307,498 | — | 307,498 | $ | 307,498 | ||||||||||||||||||||
Other comprehensive income | — | — | — | — | 3,551 | 3,551 | 3,551 | |||||||||||||||||||||
Comprehensive income | $ | 311,049 | ||||||||||||||||||||||||||
Issuance of common stock under employee benefit plans | 393 | 4 | 12,969 | — | — | 12,973 | ||||||||||||||||||||||
Issuance of common stock under stock option plans | 2,246 | 23 | 54,049 | — | — | 54,072 | ||||||||||||||||||||||
Excess tax benefit of stock options exercised | — | — | 9,043 | — | — | 9,043 | ||||||||||||||||||||||
Share based compensation | — | — | 14,410 | — | — | 14,410 | ||||||||||||||||||||||
Fair value of equity component of 6 3/4% Senior Exchangeable Notes | — | — | 2,100 | — | — | 2,100 | ||||||||||||||||||||||
Balance at December 31, 2009 | 137,468 | $ | 1,375 | $ | 1,042,329 | $ | 1,650,123 | $ | (7,962 | ) | $ | 2,685,865 | ||||||||||||||||
Net income | — | — | — | 419,373 | — | 419,373 | $ | 419,373 | ||||||||||||||||||||
Other comprehensive income | — | — | — | — | 4,992 | 4,992 | 4,992 | |||||||||||||||||||||
Comprehensive income | $ | 424,365 | ||||||||||||||||||||||||||
Issuance of common stock under employee benefit plans | 194 | 2 | 7,860 | — | — | 7,862 | ||||||||||||||||||||||
Issuance of common stock under stock option plans | 2,332 | 23 | 56,827 | — | — | 56,850 | ||||||||||||||||||||||
Excess tax benefit of stock options exercised | — | — | 18,419 | — | — | 18,419 | ||||||||||||||||||||||
Share based compensation | — | — | 16,052 | — | — | 16,052 | ||||||||||||||||||||||
Exchange of 6 3/4% Senior Exchangeable Notes by Holders | 1,032 | 10 | 262 | — | — | 272 | ||||||||||||||||||||||
Balance at December 31, 2010 | 141,026 | $ | 1,410 | $ | 1,141,749 | $ | 2,069,496 | $ | (2,970 | ) | $ | 3,209,685 | ||||||||||||||||
| Common Stock | Additional Paid- In Capital | Retained Earnings | Accumulated Other Comprehensive Income (Loss) | Total | ||||||||||||||||||||
| Shares | Par Value | |||||||||||||||||||||||
Balance at December 31, 2008 | 134,829 | $ | 1,348 | $ | 949,758 | $ | 1,342,625 | $ | (11,513 | ) | $ | 2,282,218 | ||||||||||||
Net income | — | — | — | 307,498 | — | 307,498 | ||||||||||||||||||
Unrealized losses on cash flow hedge, net of tax | — | — | — | — | 3,551 | 3,551 | ||||||||||||||||||
Issuance of common stock under employee benefit plans | 393 | 4 | 12,969 | — | — | 12,973 | ||||||||||||||||||
Net issuance of common stock upon exercise of stock options | 2,246 | 23 | 54,049 | — | — | 54,072 | ||||||||||||||||||
Excess tax benefit of stock options exercised | — | — | 9,043 | — | — | 9,043 | ||||||||||||||||||
Share based compensation | — | — | 14,410 | — | — | 14,410 | ||||||||||||||||||
Fair value of equity component of exchangeable notes | — | — | 2,100 | — | — | 2,100 | ||||||||||||||||||
|
|
|
|
|
|
|
|
|
|
|
| |||||||||||||
Balance at December 31, 2009 | 137,468 | $ | 1,375 | $ | 1,042,329 | $ | 1,650,123 | $ | (7,962 | ) | $ | 2,685,865 | ||||||||||||
Net income | — | — | — | 419,373 | — | 419,373 | ||||||||||||||||||
Unrealized losses on cash flow hedge, net of tax | — | — | — | — | 4,992 | 4,992 | ||||||||||||||||||
Issuance of common stock under employee benefit plans | 194 | 2 | 7,860 | — | — | 7,862 | ||||||||||||||||||
Net issuance of common stock upon exercise of stock options | 2,332 | 23 | 56,827 | — | — | 56,850 | ||||||||||||||||||
Excess tax benefit of stock options exercised | — | — | 18,419 | — | — | 18,419 | ||||||||||||||||||
Share based compensation | — | — | 16,052 | — | — | 16,052 | ||||||||||||||||||
Exchange of exchangeable notes by holders | 1,032 | 10 | 262 | — | — | 272 | ||||||||||||||||||
|
|
|
|
|
|
|
|
|
|
|
| |||||||||||||
Balance at December 31, 2010 | 141,026 | $ | 1,410 | $ | 1,141,749 | $ | 2,069,496 | $ | (2,970 | ) | $ | 3,209,685 | ||||||||||||
Net income | — | — | — | 507,673 | — | 507,673 | ||||||||||||||||||
Reclassification adjustment for unrealized losses on cash flow hedge, net of tax, included in net income | — | — | — | — | 2,970 | 2,970 | ||||||||||||||||||
Issuance of common stock under employee benefit plans | 170 | 2 | 9,037 | — | — | 9,039 | ||||||||||||||||||
Net issuance of common stock upon exercise of stock options | 1,861 | 19 | 50,290 | — | — | 50,309 | ||||||||||||||||||
Excess tax benefit of stock options exercised | — | — | 22,885 | — | — | 22,885 | ||||||||||||||||||
Share based compensation | — | — | 18,922 | — | — | 18,922 | ||||||||||||||||||
Share repurchases, including fees | (15,877 | ) | (159 | ) | (132,778 | ) | (843,695 | ) | — | (976,632 | ) | |||||||||||||
|
|
|
|
|
|
|
|
|
|
|
| |||||||||||||
Balance at December 31, 2011 | 127,180 | $ | 1,272 | $ | 1,110,105 | $ | 1,733,474 | $ | — | $ | 2,844,851 | |||||||||||||
|
|
|
|
|
|
|
|
|
|
|
| |||||||||||||
See accompanying Notes to consolidated financial statements.
48
Consolidated Statements of Cash Flows
(In thousands)
| Years ended December 31, | ||||||||||||
| 2010 | 2009 | 2008 | ||||||||||
Operating activities | ||||||||||||
Net income | $ | 419,373 | $ | 307,498 | $ | 186,232 | ||||||
Adjustments to reconcile net income to net cash provided by operating activities: | ||||||||||||
Depreciation and amortization on property and equipment | 159,730 | 142,912 | 107,345 | |||||||||
Amortization of intangibles | 1,712 | 5,267 | 5,653 | |||||||||
Amortization of premium on exchangeable notes | (707 | ) | (750 | ) | (352 | ) | ||||||
Amortization of debt issuance costs | 8,559 | 8,508 | 4,084 | |||||||||
Excess tax benefit from stock options exercised | (18,587 | ) | (10,215 | ) | (2,184 | ) | ||||||
Deferred income taxes | 99,257 | 50,381 | 11,031 | |||||||||
Gain on settlement of note receivable | (11,639 | ) | — | — | ||||||||
Stock option compensation expense | 14,947 | 13,451 | 7,991 | |||||||||
Other share based compensation expense | 2,026 | 7,962 | 5,563 | |||||||||
Other | 6,893 | 8,739 | 8,226 | |||||||||
Changes in operating assets and liabilities: | ||||||||||||
Accounts receivable | (21,748 | ) | (9,714 | ) | (7,437 | ) | ||||||
Inventory | (110,271 | ) | (339,742 | ) | (142,333 | ) | ||||||
Accounts payable | 82,574 | 79,824 | 50,410 | |||||||||
Income taxes payable | 15,346 | 6,505 | 26,677 | |||||||||
Accrued payroll | 9,939 | (16,830 | ) | (602 | ) | |||||||
Accrued benefits and withholdings | 8,930 | 6,018 | 13,874 | |||||||||
Other | 37,353 | 25,386 | 24,364 | |||||||||
Net cash provided by operating activities | 703,687 | 285,200 | 298,542 | |||||||||
Investing activities | ||||||||||||
Cash component of acquisition price of CSK Automotive, Inc., net of cash acquired | — | — | (33,767 | ) | ||||||||
Purchases of property and equipment | (365,419 | ) | (414,779 | ) | (341,679 | ) | ||||||
Proceeds from sale of property and equipment | 2,124 | 4,288 | 1,246 | |||||||||
Payments received on notes receivable | 17,364 | 5,819 | 5,342 | |||||||||
Other | (5,346 | ) | (5,989 | ) | 1,261 | |||||||
Net cash used in investing activities | (351,277 | ) | (410,661 | ) | (367,597 | ) | ||||||
Financing activities | ||||||||||||
Proceeds from borrowings on asset-based revolving credit facility | 548,700 | 664,550 | 925,256 | |||||||||
Payments on asset-based revolving credit facility | (871,500 | ) | (599,950 | ) | (311,056 | ) | ||||||
Payment of debt issuance costs | — | — | (43,239 | ) | ||||||||
Principal payments on debt and capital leases | (108,527 | ) | (13,648 | ) | (534,944 | ) | ||||||
Debt prepayment costs | — | — | (7,157 | ) | ||||||||
Issuance cost of equity exchanged in CSK acquisition | — | — | (1,218 | ) | ||||||||
Excess tax benefit from stock options exercised | 18,587 | 10,215 | 2,184 | |||||||||
Net proceeds from issuance of common stock | 63,116 | 59,508 | 22,995 | |||||||||
Other | — | 420 | (20 | ) | ||||||||
Net cash (used in)/provided by financing activities | (349,624 | ) | 121,095 | 52,801 | ||||||||
Net increase/(decrease) in cash and cash equivalents | 2,786 | (4,366 | ) | (16,254 | ) | |||||||
Cash and cash equivalents at beginning of year | 26,935 | 31,301 | 47,555 | |||||||||
Cash and cash equivalents at end of year | $ | 29,721 | $ | 26,935 | $ | 31,301 | ||||||
Supplemental disclosures of cash flow information: | ||||||||||||
Income taxes paid | $ | 154,146 | $ | 130,720 | $ | 74,227 | ||||||
Interest paid, net of capitalized interest | 31,211 | 36,881 | 17,824 | |||||||||
Property and equipment acquired through issuance of capital lease obligations | — | 8,337 | 4,847 | |||||||||
Issuance of common stock to acquire CSK | — | — | 459,308 | |||||||||
Fair value of converted CSK stock options and restricted stock | — | — | 7,736 | |||||||||
| Years ended December 31, | ||||||||||||
| 2011 | 2010 | 2009 | ||||||||||
Operating activities: | ||||||||||||
Net income | $ | 507,673 | $ | 419,373 | $ | 307,498 | ||||||
Adjustments to reconcile net income to net cash provided by operating activities: | ||||||||||||
Depreciation and amortization of property, equipment and intangibles | 165,880 | 161,442 | 148,179 | |||||||||
Amortization of debt premium, discount and issuance costs | 1,797 | 7,852 | 7,758 | |||||||||
Write-off of asset-based revolving credit facility debt issuance costs | 21,626 | — | — | |||||||||
Excess tax benefit from stock options exercised | (22,985 | ) | (18,587 | ) | (10,215 | ) | ||||||
Deferred income taxes | 54,120 | 99,257 | 50,381 | |||||||||
Gain on settlement of note receivable | — | (11,639 | ) | — | ||||||||
Share-based compensation programs | 20,579 | 16,973 | 21,413 | |||||||||
Other | 8,292 | 6,893 | 8,739 | |||||||||
Changes in operating assets and liabilities: | ||||||||||||
Accounts receivable | (21,219 | ) | (21,748 | ) | (9,714 | ) | ||||||
Inventory | 37,740 | (110,271 | ) | (339,742 | ) | |||||||
Accounts payable | 383,632 | 82,574 | 79,824 | |||||||||
Income taxes payable | (8,625 | ) | 15,346 | 6,505 | ||||||||
Accrued payroll | (269 | ) | 9,939 | (16,830 | ) | |||||||
Accrued benefits and withholdings | 1,500 | 8,930 | 6,018 | |||||||||
Other | (30,750 | ) | 37,353 | 25,386 | ||||||||
|
|
|
|
|
| |||||||
Net cash provided by operating activities | 1,118,991 | 703,687 | 285,200 | |||||||||
Investing activities: | ||||||||||||
Purchases of property and equipment | (328,319 | ) | (365,419 | ) | (414,779 | ) | ||||||
Proceeds from sale of property and equipment | 2,715 | 2,124 | 4,288 | |||||||||
Payments received on notes receivable | 5,435 | 17,364 | 5,819 | |||||||||
Other | 516 | (5,346 | ) | (5,989 | ) | |||||||
|
|
|
|
|
| |||||||
Net cash used in investing activities | (319,653 | ) | (351,277 | ) | (410,661 | ) | ||||||
Financing activities: | ||||||||||||
Proceeds from borrowings on asset-based revolving credit facility | 42,400 | 548,700 | 664,550 | |||||||||
Payments on asset-based revolving credit facility | (398,400 | ) | (871,500 | ) | (599,950 | ) | ||||||
Proceeds from the issuance of long-term debt | 795,963 | — | — | |||||||||
Payment of debt issuance costs | (9,942 | ) | — | — | ||||||||
Principal payments on debt and capital leases | (1,443 | ) | (108,527 | ) | (13,648 | ) | ||||||
Repurchases of common stock | (976,632 | ) | — | — | ||||||||
Excess tax benefit from stock options exercised | 22,985 | 18,587 | 10,215 | |||||||||
Net proceeds from issuance of common stock | 57,562 | 63,116 | 59,508 | |||||||||
Other | — | — | 420 | |||||||||
|
|
|
|
|
| |||||||
Net cash (used in) / provided by financing activities | (467,507 | ) | (349,624 | ) | 121,095 | |||||||
|
|
|
|
|
| |||||||
Net increase/(decrease) in cash and cash equivalents | 331,831 | 2,786 | (4,366 | ) | ||||||||
Cash and cash equivalents at beginning of year | 29,721 | 26,935 | 31,301 | |||||||||
|
|
|
|
|
| |||||||
Cash and cash equivalents at end of year | $ | 361,552 | $ | 29,721 | $ | 26,935 | ||||||
|
|
|
|
|
| |||||||
Supplemental disclosures of cash flow information: | ||||||||||||
Income taxes paid | $ | 252,769 | $ | 154,146 | $ | 130,720 | ||||||
Interest paid, net of capitalized interest | 13,350 | 31,211 | 36,881 | |||||||||
Property and equipment acquired through issuance of capital lease obligations | — | — | 8,337 | |||||||||
See accompanying Notes to consolidated financial statements.
49
NOTE 1—SUMMARY OF SIGNIFICANT ACCOUNTING POLICIES
Nature of business:
O’Reilly Automotive, Inc. (“O’Reilly” or the “Company”) is a specialty retailer and supplier of automotive aftermarket parts. The Company’s stores carry an extensive product line, including new and remanufactured automotive hard parts, maintenance items and various automotive accessories. The Company owns and operates 3,5703,740 stores in 3839 states, which are located primarily in the Western, Midwestern and Southeasterncovering all regions of the United States except the Northeast, and caters to both the do-it-yourself (“DIY”) customer and the professional service provider. The Company’s robust distribution system provides stores with same-day or overnight access to an extensive inventory of hard to findhard-to-find items not typically stocked byin the stores of other auto parts retailers.
On December 29, 2010, the Company completed a corporate reorganization creating a holding company structure (the “Reorganization”). The Reorganization was implemented through an agreement and plan of merger under Section 351.448 of The General Corporation Law of the State of Missouri, which did not require a vote of the shareholders. As a result of the Reorganization, the previous parent company and registrant, O’Reilly Automotive, Inc. (“Old O’Reilly”) was renamed O’Reilly Automotive Stores, Inc. and is now a wholly-owned subsidiary of the new parent company and registrant, which was renamed O’Reilly Automotive, Inc.
Segment Reporting:reporting:
The Company is managed and operated by a single management team reporting to the chief operating decision maker. Generally, O’Reilly stores have similar characteristics including the nature of the products and services, the type and class of customers and the methods used to distribute products and provide service to its customers and, as a whole, make up a single operating segment. The Company does not prepare discrete financial information with respect to product lines or geographic locations and as such has one reportable segment.
Reclassification:
Certain prior period amounts have been reclassified to conform to current period presentation. These reclassifications had no effect on reported totals for assets, liabilities, shareholders’ equity, cash flows or net income.
Principles of consolidation:
The consolidated financial statements include the accounts of the Company and its wholly-owned subsidiaries. All significant inter-company balances and transactions have been eliminated in consolidation. On July 11, 2008, the Company completed the acquisition of CSK Auto Corporation (“CSK”), one of the largest specialty retailers of auto parts and accessories in the Western United States. The results of CSK’s operations have been included in the Company’s consolidated financial statements since the acquisition date.
Revenue recognition:
Over-the-counter retail sales are recorded when the customer takes possession of the merchandise. Sales to professional service providers, also referred to as “commercial sales,” are recorded upon same-day delivery of the merchandise to the customer, generally at the customer’s place of business. Wholesale sales to other retailers, also referred to as “jobber sales,” are recorded upon shipment of the merchandise from a regional DC with same-day delivery to the jobber customer’s location. Internet retail sales are recorded when the merchandise is shipped or when the merchandise is picked up in a store. All sales are recorded net of estimated allowances, discounts and taxes.
Use of estimates:
The preparation of the consolidated financial statements, in conformity with accounting principles generally accepted in the United States (“GAAP”), requires management to make estimates and assumptions that affect the amounts reported in the consolidated financial statements and accompanying notes. Actual results could materially differ from those estimates.
Cash equivalents:
Cash equivalents include investments with maturities of 90 days or less aton the daydate of purchase.
Accounts receivable:
The Company maintains allowances for doubtful accounts for estimated losses resulting from the inability of the Company’s customers to make required payments. The Company considers the following factors when determining if collection is reasonably assured: customer creditworthiness, past transaction history with the customer, current economic and industry trends and changes in customer payment terms. IncludedAmounts due to the Company from its Team Members are included as a component of accounts receivable are amounts due to the Company from employees.receivable. These amounts consist primarily of purchases of merchandise on employeeTeam Member accounts. Accounts receivable due from employeesTeam Members was approximately $2.2 million and $1.2 million at December 31, 20102011 and 2009, respectively.2010.
The Company grants credit to certain customers who meet the Company’s pre-established credit requirements. Concentrations of credit risk with respect to these receivables are limited because the Company’s customer base consists of a large number of smaller customers, spreading the credit risk across a broad base. The Company also controls this credit risk through credit approvals, credit limits and accounts receivable and credit monitoring procedures. Generally, the Company does not require security when credit is granted to customers. Credit losses are provided for in the Company’s consolidated financial statements and have consistently been within management’s expectations.
Amounts receivable from vendors:
The Company receives concessions from its vendors through a variety of programs and arrangements, including allowances for new stores and warranties, volume purchase rebates and co-operative advertising. Co-operative advertising allowances that are incremental to the Company’s advertising program, specific to a product or event and identifiable for accounting purposes, are reported as a reduction of advertising expense in the period in which the advertising occurred. All other vendor concessions are recognized as a reduction to the cost of inventory. Amounts receivable from vendors also includes amounts due to the Company for changeover merchandise and product returns. The Company regularly reviews vendor receivables for collectability and assesses the need for a reserve for uncollectable amounts based on an evaluation of the Company’s vendors’ financial positions and corresponding abilities to meet financial obligations. Management does not believe there is a reasonable likelihood that the Company will be unable to collect the amounts receivable from vendors and the Company did not record a reserve for uncollectable amounts from vendors in the consolidated financial statements at December 31, 2011 or 2010.
Inventory:
Inventory, which consists of automotive hard parts, maintenance items, accessories and tools, is stated at the lower of cost or market. Inventory also includes capitalized costs related to procurement, warehousing and distribution centers (“DC”). Cost has been determined using the last-in, first-out (“LIFO”) method, which more accurately matches costs with related revenues. The replacement cost of inventory was $2,046 million$2.04 billion and $1,922 million$2.05 billion as of December 31, 2011 and 2010, and 2009, respectively.
Amounts receivable from vendors:
The Company receives concessions from its vendors through a variety of programs and arrangements, including co-operative advertising, devaluation programs, allowances for warranties and volume purchase rebates. Co-operative advertising allowances that are incremental to the Company’s advertising program, specific to a product or event and identifiable for accounting purposes, are reported as a reduction of advertising expense in the period in which the advertising occurred. All other material vendor concessions are recognized as a reduction to the cost of inventory. Amounts receivable from vendors also includes amounts due to the Company for changeover merchandise and product returns. The Company regularly reviews vendor receivables for collectability and assesses the need for a reserve for uncollectible amounts based on an evaluation of the Company’s vendors’ financial positions and corresponding abilities to meet financial obligations. Management does not believe there is a reasonable likelihood that the Company will be unable to collect the amounts receivable from vendors and the Company did not record a reserve for uncollectible amounts from vendors in the consolidated financial statements at December 31, 2010 and 2009.
Debt issuance costs:
Deferred debt issuance costs totaled $21.6 million and $30.2 million, net of amortization, at December 31, 2010 and 2009, respectively, of which $8.6 million was included within “Other current assets” at December 31, 2010 and 2009. The remainder was included within “Other assets” at December 31, 2010 and 2009. Deferred debt issuance costs are amortized using the straight-line method over the term of the corresponding long-term debt issue and the amortization is included as a component of “Interest expense” in the Company’s Consolidated Statements of Income. All remaining debt issuance costs related to the Company’s asset-based revolving credit facility were expensed on January 14, 2011, in conjunction with the issuance of the Company’s $500 million of unsecured 4.875% Senior Notes due 2021 (the “2011 4.875% Senior Notes”) and subsequent repayment and retirement of the asset-based revolving credit facility as further described below and in Note 4.
Property and equipment:
Property and equipment are carried at cost. Depreciation is calculated using the straight-line method generally over the estimated useful lives of the assets. Leasehold improvements are amortized over the lesser of the lease term or the estimated economic life of the assets. The lease term includes renewal options determined by management at lease inception for which failure to renew options would result in a substantial economic penalty to the Company. Maintenance and repairs are charged to expense as incurred. Upon retirement or sale, the cost and accumulated depreciation are eliminated and the gain or loss, if any, is included as a component of “Other income (expense)” in the Company’s Consolidated Statements of Income. The Company reviews long-lived assets for impairment whenever events or changes in circumstances indicate that the carrying amount of an asset may not be fully recoverable.
Property The following table identifies the types of property and equipment consist ofincluded in the followingaccompanying consolidated financial statements as of December 31, 20102011 and 20092010 (in thousands, except useful lives):
| Original Useful Lives | December 31, 2010 | December 31, 2009 | Original Useful Lives | December 31, 2011 | December 31, 2010 | |||||||||||||||||
Land | $ | 392,600 | $ | 331,456 | $ | 462,790 | $ | 392,600 | ||||||||||||||
Buildings and building improvements | 15 – 39 years | 921,929 | 766,446 | 15 – 39 years | 1,012,709 | 921,929 | ||||||||||||||||
Leasehold improvements | 3 – 25 years | 370,018 | 314,751 | 3 – 25 years | 395,274 | 370,018 | ||||||||||||||||
Furniture, fixtures and equipment | 3 – 20 years | 777,485 | 645,839 | 3 – 20 years | 906,257 | 777,485 | ||||||||||||||||
Vehicles | 5 – 10 years | 182,942 | 157,535 | 5 – 10 years | 206,685 | 182,942 | ||||||||||||||||
Construction in progress | 60,460 | 137,213 | 43,281 | 60,460 | ||||||||||||||||||
|
| |||||||||||||||||||||
Total property and equipment | 2,705,434 | 2,353,240 | 3,026,996 | 2,705,434 | ||||||||||||||||||
Less: accumulated depreciation and amortization | 775,339 | 626,861 | 933,229 | 775,339 | ||||||||||||||||||
|
| |||||||||||||||||||||
Net property and equipment | $ | 1,930,095 | $ | 1,726,379 | $ | 2,093,767 | $ | 1,930,095 | ||||||||||||||
|
| |||||||||||||||||||||
The gross value of capital lease assets included in the “Furniture, fixtures and equipment” amounts of the above table was $7.7 million and $17.4 million at December 31, 2010 and 2009, respectively. The gross value of capital lease assets included in the “Vehicles” amountamounts of the above table was $9.6$8.6 million and $9.7$9.6 million at December 31, 20102011 and 2009,2010, respectively. As of December 31, 20102011 and 2009,2010, the Company recorded accumulated amortization on allthese capital lease assets in the amountamounts of $14.4$7.9 million and $10.5$7.5 million, respectively, all of which iswas included in “accumulated depreciation and amortization” in the above table.
The Company capitalizes interest costs as a component of construction in progress, based on the weighted-average interest rates incurred on long-term borrowings. Total interest costs capitalized for the years ended December 31, 2010, 2009 and 2008, were $5.1 million, $6.7 million and $2.3 million, respectively.
Goodwill and other intangible assets:
The accompanying Consolidated Balance Sheets at December 31,2011, 2010 and 2009, include goodwillwere $4.7 million, $5.1 million and other intangible assets recorded as the result of acquisitions. The Company reviews goodwill for impairment annually on December 31, or when events or changes in circumstances indicate the carrying value of these assets might exceed their current fair values, rather than systematically amortizing goodwill against earnings. The goodwill impairment test compares the fair value of a reporting unit to its carrying amount, including goodwill. The Company operates as a single reporting unit, and its fair value exceeded its carrying value, including goodwill, at December 31, 2010 and 2009; as such, no goodwill impairment adjustment was required at December 31, 2010 and 2009.
Operating leases:
The Company’s policy is to amortize leasehold improvements over the lesser of the lease term or the estimated economic life of those assets. Generally, the lease term for stores is the base lease term and the lease term for DCs includes the base lease term plus certain renewal option periods for which renewal is reasonably assured and failure to exercise the renewal option would result in a significant economic penalty. The Company recognizes rent expense on a straight-line basis over these respective lease terms.$6.7 million, respectively.
Notes receivable:
The Company had notes receivable from vendors and other third parties amounting to $22.2$15.0 million and $16.6$22.2 million at December 31, 20102011 and 2009,2010, respectively. The notes receivable, which bear interest at rates ranging from 0% to 10%, are due in varying amounts through March of 2018.2019. Interest income on notes receivable is recorded in accordance with the note terms to the extent that such amounts are expected to be collected. The Company regularly reviews its notes receivable for collectability and assesses the need for a reserve for uncollectibleuncollectable amounts based on an evaluation of the Company’s borrowers’ financial positions and corresponding abilities to meet financial obligations. At December 31, 2010,Management does not believe there is a reasonable likelihood that the Company will be unable to collect the notes receivable and the Company did not haverecord a reserve for uncollectible amounts ofuncollectable notes receivable in the consolidated financial statements. Atstatements at December 31, 2009,2011 or 2010.
Goodwill and other intangible assets:
The accompanying Consolidated Balance Sheets at December 31, 2011 and 2010, include goodwill and other intangible assets recorded as the result of acquisitions. The Company reviews goodwill for impairment annually on November 30, or when events or changes in circumstances indicate the carrying value of these assets might exceed their current fair values, rather than systematically amortizing goodwill against earnings. During 2011 and 2010, the goodwill impairment test included a quantitative assessment, which compared the fair value of a reporting unit to its carrying amount, including goodwill. The Company operates as a single reporting unit, and the Company had a reserve balance of $7.1 million related to a note receivable acquired in the CSK acquisitiondetermined that its fair value exceeded its carrying value, including goodwill, at December 31, 2011 and 2010; as such, no goodwill impairment adjustment was settled in 2010, which was included as a component of “Notes receivable, less current portion” in its Condensed Consolidated Balance Sheets.required at December 31, 2011 and 2010.
Self-insurance reserves:
The Company uses a combination of insurance and self-insurance mechanisms to provide for the potential liabilities for Team Member health care benefits, workers’ compensation, vehicle liability, general liability vehicle liability,and property loss, and employee health care benefits.loss. With the exception of employeecertain Team Member health care benefit liabilities, which are limited by the design of these plans, the Company obtains third-party insurance coverage to limit its exposure. The
Company estimates its self-insurance liabilities by considering a number of factors, including historical claims experience and trend-lines, projected medical and legal inflation, and growth patterns and exposure forecasts. TheseCertain of these liabilities arewere recorded at their net present value discounted using the Company’s incremental borrowing rate for instruments with similar maturities of 5.30%4.75% and 6.93%5.30% at December 31, 20102011 and 2009,2010, respectively.
The following table identifies the components of the Company’s self-insurance reserves were as follows onof December 31, 20102011 and 20092010 (in thousands):
| 2010 | 2009 | 2011 | 2010 | |||||||||||||
Self-insurance reserves (undiscounted) | $ | 109,351 | $ | 101,074 | $ | 116,696 | $ | 109,351 | ||||||||
Self-insurance reserves (discounted) | $ | 99,612 | $ | 90,968 | $ | 106,011 | $ | 99,612 | ||||||||
The current portion of the Company’s discounted self-insurance reserves totaled $51.2$53.2 million and $55.3$51.2 million at December 31, 20102011 and 2009,2010, respectively. The remainder was included within “Other liabilities” on the accompanying Consolidated Balance Sheets at December 31, 20102011 and 2009.2010.
Warranty costs:Warranties:
The Company offers warranties on the merchandise it sells with warranty periods ranging from 30 days to limited lifetime warranties. The risk of loss arising from warranty claims is typically the obligation of the Company’s vendors. Certain vendors provide upfront allowances to the Company in lieu of accepting the obligation for warranty claims. For this merchandise, when sold, the Company bears the risk of loss associated with the cost of warranty claims. Differences between vendor allowances received by the Company in lieu of warranty obligations and estimated warranty expense are recorded as an adjustment to cost of sales. Estimated warranty costs, which are recorded as obligations at the time of sale, are based on the historical failure rate of each individual product line. The Company’s historical experience has been that failure rates are relatively consistent over time and that the ultimate cost of warranty claims to the Company has been driven by volume of units sold as opposed to fluctuations in failure rates or the variation of the cost of individual claims. The change inSee Note 8 for further information concerning the Company’s aggregate product warranty liability.
Litigation reserves:
O’Reilly is currently involved in litigation incidental to the ordinary conduct of the Company’s business. The Company records reserves for litigation losses in instances where a material adverse outcome is probable and the Company is able to reasonably estimate the probable loss. The Company reserves for an estimate of material legal costs to be incurred on pending litigation matters. Although the Company cannot ascertain the total amount of liability that it may incur from any of these matters, the Company does not currently believe that in the aggregate, taking into account applicable insurance coverage, these matters will have a material adverse effect on its consolidated financial position, results of operations or cash flows. In addition, O’Reilly is involved in resolving legacy governmental investigations and litigation that were being conducted against certain former CSK Automotive Corporation (“CSK”) employees arising out of alleged conduct relating to periods prior to the Company’s acquisition of CSK. See Note 12 for further information concerning these legal matters.
Closed property liabilities:
The Company maintains reserves for closed stores and other properties that are no longer being utilized in current operations. The Company provides for these liabilities using a credit-adjusted discount rate to calculate the years ended December 31, 2010present value of the remaining non-cancelable lease payments, occupancy costs and 2009 islease termination fees after the close date, net of estimated sublease income. In conjunction with the acquisition of CSK, the Company’s reserves include purchase accounting liabilities related to acquired properties that were no longer being utilized in the acquired business as follows (in thousands):well as the Company’s planned exit activities. See Note 6 for further information concerning these closed store liabilities.
| 2010 | 2009 | |||||||
Balance at January 1, | $ | 19,637 | $ | 16,758 | ||||
Warranty claims | (44,791 | ) | (33,227 | ) | ||||
Warranty accruals | 47,583 | 36,106 | ||||||
Balance December 31, | $ | 22,429 | $ | 19,637 | ||||
Derivative instruments and hedging activities:
The Company’s accounting policies for derivative financial instruments are based on whether the instruments meet the criteria for designation as cash flow or fair value hedges. The criteria for designating a derivative as a hedge include the assessment of the instrument’s effectiveness in risk reduction, matching of the derivative instrument to its underlying transaction and the probability that the underlying transaction will occur. A designated hedge of the exposure to variability in the future cash flows of an asset or a liability qualifies as a cash flow hedge. A designated hedge of the exposure to changes in fair value of an asset or a liability qualifies as a fair value hedge. For derivatives with cash flow hedge accounting designation, the Company would recognize the after-tax gain or loss from the effective portion of the hedge as a component of “Accumulated other comprehensive loss” and reclassifieswould reclassify it into earnings in the same period or periods in which the hedged transaction affects earnings, and within the same income statement line item as the impact of the hedged transaction. For derivatives with fair value hedge accounting designation, the Company would recognize gains or losses from the change in fair value of these derivatives, as well as the offsetting change in the fair value of the underlying hedged item, in earnings. At December 31, 2011, the Company did not hold any instruments that qualified as cash flow or fair value hedge derivatives.
At December 31, 2010, the Company held derivative financial instruments to manage interest rate risk. The Company designated these derivative financial instruments as cash flow hedges. The derivative financial instruments were recorded at fair value and were included within “Other current liabilities” and “Other liabilities”. Derivative instruments recorded at fair value as liabilities totaled $4.8 million and $13.1 million as of December 31, 2010 and 2009, respectively. The portion of these derivative instruments included in “Other current liabilities” totaled $4.8 million and $4.1 million as of December 31, 2010 and 2009, respectively. The portion of these derivative instruments included in “Other liabilities” totaled $8.9 million as of December 31, 2009. On a quarterly basis, the Company measuresmeasured the effectiveness of the derivative financial instruments by comparing the present value of the cumulative change in the expected future interest to be paid or received on the variable leg of the instruments against the expected future interest payments on the corresponding variable rate debt. In addition, the Company comparescompared the critical terms, including notional amounts, underlying indices and reset dates of the derivative financial instruments with the respective variable rate debt to ensure all terms agree.agreed. Any ineffectiveness would bewas reclassified from “Accumulated other comprehensive loss” on the accompanying Consolidated Balance Sheets to “Interest expense”. on the accompanying Consolidated Statements of Income. See Note 87 for further information concerning these derivative instruments accounted for as hedges.
Share repurchases:
On January 11, 2011, the Company’s Board of Directors approved a share repurchase program. Under the program, the Company may, from time to time, repurchase shares of its common stock, solely through open market purchases effected through a broker dealer at prevailing market prices, based on a variety of factors such as price, corporate trading policy requirements and overall market conditions. All shares repurchased under the share repurchase program are retired and recorded under the par value method on the accompanying Consolidated Balance Sheets. See Note 9 for further information concerning the Company’s share repurchase program.
Revenue recognition:
Over-the-counter retail sales are recorded when the customer takes possession of the merchandise. Sales to professional service providers, also referred to as “commercial sales,” are recorded upon same-day delivery of the merchandise to the customer, generally at the customer’s place of business. Wholesale sales to other retailers, also referred to as “jobber sales,” are recorded upon shipment of the merchandise from a regional distribution center (“DC”) with same-day delivery to the jobber customer’s location. Internet retail sales are recorded when the merchandise is shipped or when the merchandise is picked up in a store. All sales are recorded net of estimated allowances, discounts and taxes.
Cost of goods sold and selling, general and administrative expenses:
The following table illustrates the primary costs classified in each major expense category:
Cost of goods sold, including warehouse and | Selling, general and administrative expenses | |
Total cost of merchandise sold, including: | Payroll and benefit costs for store and corporate Team Members | |
Freight expenses associated with acquiring merchandise and with moving merchandise inventories from the Company’s distribution centers to the stores | Occupancy costs of store and corporate facilities | |
Defective merchandise and warranty costs | Depreciation and amortization related to store and corporate assets | |
Vendor allowances and incentives, including: | Vehicle expenses for store delivery services | |
Allowances that are not reimbursements for specific, incremental and identifiable costs | Self-insurance costs | |
Cash discounts on payments to vendors | Closed store expenses | |
Costs associated with the Company’s supply chain, including: | Other administrative costs, including: | |
Payroll and benefit costs | Accounting, legal and other professional services | |
Warehouse occupancy costs | Bad debt, banking and credit card fees | |
Transportation costs | Supplies | |
Depreciation | Travel | |
Inventory shrinkage | Advertising costs | |
Operating leases:
The Company recognizes rent expense on a straight-line basis over the lease terms of its stores and DCs. Generally, the lease term for stores is the base lease term and the lease term for DCs includes the base lease term plus certain renewal option periods for which renewal is reasonably assured and failure to exercise the renewal option would result in a significant economic penalty. The Company’s policy is to amortize leasehold improvements associated with the Company’s operating leases over the lesser of the lease term or the estimated economic life of those assets.
Advertising expenses:
Advertising expense consists primarily of expenses related to the Company’s integrated marketing program, which includes television, radio, direct mail and newspaper distribution, in-store and online promotions, and sports and event sponsorships. The Company expenses advertising costs as incurred. The Company also participates in cooperative advertising arrangements with certain of its vendors. Advertising expense included as a component of “Selling, general and administrative expenses” (“SG&A”) on the accompanying Consolidated Statements of Income amounted to $73.8 million, $70.0 million and $72.9 million for the years ended December 31, 2011, 2010 and 2009, respectively.
Share-based compensation and benefit plans:
The Company sponsors employee share-based benefit plans and employee and director share-based compensation plans. The Company recognizes compensation expense for its share-based plans based on the fair value of the awards on the date of the grant, award or issuance. Share-based plans include stock option awards issued under the Company’s employee incentive plans, director stock plan, stock issued through the Company’s employee stock purchase plan and stock awarded to employees and directors through other compensation plans. See Note 10 for further information concerning these plans.
Pre-opening expenses:
Costs associated with the opening of new stores, which consist primarily of payroll and occupancy costs, are charged to SG&A as incurred. Costs associated with the opening of new distribution centers, which consist primarily of payroll and occupancy costs, are included as a component of “Cost of goods sold, including warehouse and distribution expenses” on the accompanying Consolidated Statements of Income as incurred.
Debt issuance costs:
In conjunction with the issuance or amendment of long-term debt instruments, the Company incurs various costs including debt registration fees, accounting and legal fees and underwriter and book runner fees. These debt issuance costs have been deferred and are being amortized over the term of the corresponding debt issue and the amortization expense is included as a component of “Interest expense” in the Company’s Consolidated Statements of Income. Deferred debt issuance costs totaled $9.0 million and $21.6 million, net of amortization, at December 31, 2011 and 2010, respectively, of which $1.3 million and $8.6 million were included within “Other current assets” on the accompanying Consolidated Balance Sheets at December 31, 2011 and 2010, with the remainder included within “Other assets” on the accompanying Consolidated Balance Sheets at December 31, 2011 and 2010. All unamortized debt issuance costs related to the Company’s asset-based revolving credit facility (“ABL Credit Facility”) were expensed on January 14, 2011, in conjunction with the issuance of the Company’s $500 million of unsecured 4.875% Senior Notes due 2021 (the “4.875% Senior Notes due 2021”) and subsequent repayment and retirement of the ABL Credit Facility. See Note 5 for further information concerning the issuance of the 4.875% Senior Notes due 2021 and the retirement of the ABL Credit Facility.
Income taxes:
The Company accounts for income taxes using the liability method, which requires the recognition of deferred tax assets and liabilities for the expected future tax consequences of events that have been included in the financial statements. Under this method, deferred tax assets and liabilities are determined based on differences between the GAAP basis and tax basis of assets and liabilities using enacted tax rules and rates currently scheduled to be in effect for the year in which the differences are expected to reverse. Tax carry forwards are also recognized in deferred tax assets and liabilities under this method. The effect of a change in tax rates on deferred tax assets and liabilities is recognized in income in the period of the enactment date. The Company recordswould record a valuation allowance against deferred tax assets to the extent it is more likely than not the amount will not be realized, based upon evidence available at the time of the determination and any change in the valuation allowance is recorded in the period of a change in such determination. The Company hasdid not establishedestablish a valuation allowance for deferred tax assets at December 31, 20102011 and 20092010, as it iswas considered more likely than not that deferred tax assets arewere realizable through a combination of future taxable income, the realization of deferred tax liabilities and tax planning strategies.
Advertising costs:
The Company expenses advertising costs as incurred. Advertising expense included as a component of “Selling, general and administrative expenses” (“SG&A”) amounted to $70.0 million, $72.9 million and $65.6 million for the years ended December 31, 2010, 2009 and 2008, respectively.
Pre-opening costs:
Costs associated with the opening of new stores, which consist primarily of payroll and occupancy costs, are charged to SG&A as incurred. Costs associated with the opening of new distribution centers, which consist primarily of payroll and occupancy costs, are included as a component of “Cost of goods sold, including warehouse and distribution expenses” as incurred.
Share-based compensation plans:
The Company currently sponsors share-based employee benefit plans and stock option plans. The Company recognizes compensation expense for its share-based payments based on the fair value of the awards on the date of the grant. Share-based payments include stock option awards issued under the Company’s employee stock option plan, director stock option plan, stock issued through the Company’s employee stock purchase plan and stock awarded to employees through other benefit programs. See Note 11 for further information concerning these plans.
Litigation reserves:
O’Reilly is currently involved in litigation incidental to the ordinary conduct of the Company’s business. The Company records reserves for litigation losses in instances where a material adverse outcome is probable and the Company is able to reasonably estimate the probable loss. The Company reserves for an estimate of material legal costs to be incurred on pending litigation matters. Although the Company cannot ascertain the total amount of liability that it may incur from any of these matters, the Company does
not currently believe that in the aggregate, taking into account applicable insurance coverage, these matters will have a material adverse effect on its consolidated financial position, results or operations or cash flows. In addition, O’Reilly is involved in resolving legacy governmental investigations and litigation that were being conducted against certain former CSK employees and CSK arising out of alleged conduct relating to periods prior to the acquisition. See Note 14 for further information concerning these legal matters.
Closed store liabilities:
The Company maintains reserves for closed stores and other properties that are no longer being utilized in current operations. The Company provides for these liabilities using a credit-adjusted discount rate to calculate the present value of the remaining non-cancelable lease payments, occupancy costs and lease termination fees after the close date, net of estimated sublease income. In conjunction with the acquisition of CSK, the Company’s reserves include purchase accounting liabilities related to acquired properties that were no longer being utilized in the acquired business as well as the Company’s planned exit activities. See Note 7 for further information concerning these liabilities.
Earnings per share:
Basic earnings per share is based oncalculated by dividing net income by the weighted-averageweighted average number of common shares outstanding common shares.during the fiscal period. Diluted earnings per share is based oncalculated by dividing the weighted-average outstanding shares as well as the effectnumber of common shares outstanding plus, where applicable, the common stock equivalents. Commonequivalents associated with the potential impact of dilutive stock options or conversion of convertible debt. Certain common stock equivalents that could potentially dilute basic earnings per share in the future, that were not included in the fully diluted computation because they would have been antidilutive. Generally, stock options are antidilutive were 1.4 million, 1.6 million and 7.4 million forexcluded from the years ended December 31, 2010, 2009 and 2008, respectively.earnings per share calculation when the exercise price exceeds the market price of the common shares. See Note 1215 for further information concerning these common stock equivalents.
Concentration of credit risk:
Financial instruments that potentially subject the Company to concentrations of credit risk consist primarily of cash equivalents, accounts receivable, notes receivable and variable rate debt.
The Company grants credit to certain customers who meet the Company’s pre-established credit requirements. Concentrations of credit risk with respect to these receivables are limited because the Company’s customer base consists of a large number of smaller customers, spreading the credit risk across a broad base. The Company also controls this credit risk through credit approvals, credit limits and accounts receivable and credit monitoring procedures. Generally, the Company does not require security when credit is granted to customers. Credit losses are provided for in the Company’s consolidated financial statements and have consistently been within management’s expectations.
The Company has entered into various derivative financial instruments to mitigate the risk of interest rate fluctuations on its variable rate long-term debt. If the market interest rate on the Company’s net derivative positions with counterparties exceeds a specified threshold, the counterparty is required to transfer cash in excess of the threshold to the Company. Conversely, if the market value of the net derivative positions falls below a specified threshold, the Company is required to transfer cash below the threshold to the counterparty. The Company is exposed to credit loss in the event of nonperformance by counterparties on derivative contracts used in these hedging activities. The counterparties to the Company’s derivative contracts are major financial institutions and the Company has not historically experienced nonperformance by any of its counterparties.
New accounting pronouncements:
In JanuaryMay of 2010,2011, the Financial Accounting Standards Board (“FASB”) issued ASUAccounting Standards Update (“ASU”) No. 2010-06,2011-04,Amendments to Achieve Common Fair Value MeasurementsMeasurement and Disclosures (Topic 820): Improving Disclosures about Fair Value MeasurementsDisclosure Requirements in U.S. GAAP and International Financial Reporting Standards(“ASU 2010-06” (“2011-04”). ASU 2010-06 amends Subtopic 820-10, requiring additional disclosures regarding2011-04 was issued to bring the definition of fair value, the guidance for fair value measurement and the disclosure requirements under U.S. GAAP and International Financial Reporting Standards (“IFRS”) in line with one another. ASU 2011-04 also enhances the disclosure requirements for changes and transfers within the valuation hierarchy levels, particularly valuations in Level 3 fair value measurements, such as transfers in and out of Levels 1 and 2, as well as separate disclosures about activity relating to Level 3 measurements. ASU 2010-06 clarifies existing disclosure requirements related to the level of disaggregation and input valuation techniques. The updated guidance is effective for interim and annual periods beginning after December 15, 2009, with the exception2011. The application of the new Level 3 activitythis guidance affects disclosures which are effective for interimonly and annual periods beginning after December 15, 2010. The adoption of the new guidance didtherefore, will not have a materialan impact on the Company’s consolidated financial position,condition, results of operations or cash flows. The adoption
In June of 2011, the FASB issued ASU No. 2011-05,Presentation of Comprehensive Income (“2011-05”). ASU 2011-05 was issued to improve the comparability of financial reporting between U.S. GAAP and IFRS, and eliminates previous U.S. GAAP guidance that allowed an entity to present components of other comprehensive income (“OCI”) as part of its statement of changes in shareholders’ equity. With the issuance of ASU 2011-05, companies are now required to report all components of OCI either in a single continuous statement of total comprehensive income, which includes components of both OCI and net income, or in a separate statement appearing consecutively with the statement of income. ASU 2011-05 does not affect current guidance for the accounting of the new Level 3components of OCI, or which items are included within total comprehensive income. In December of 2011, the FASB issued ASU No. 2011-12Deferral of the Effective Date for Amendments to the Presentation of Reclassifications of Items Out of Accumulated Other Comprehensive Income in Accounting Standards Update No. 2011-05(“2011-12”). ASU 2011-12 defers changes in ASU 2011-05 that relate to the presentation of reclassification adjustments shown on the face of the financial statements. No other requirements of ASU 2011-05 were affected by the issuance of ASU 2011-12, including the requirement to report income either in a single continuous financial statement or in a separate statement of total comprehensive income, which is effective for periods beginning after December 15, 2011, with early adoption permitted. The Company adopted this guidance with its 2011 financial statements; the application of this guidance affects presentation only and therefore, did not have an impact on the Company’s consolidated financial condition, results of operations or cash flows.
In September of 2011, the FASB issued ASU No. 2011-08,Testing Goodwill for Impairment (“2011-08”). ASU 2011-08 was issued to simplify the impairment test of goodwill, by allowing entities to use a qualitative approach to determine whether goodwill impairment might exist, before completing the entire impairment test. Under ASU 2011-08, an entity has the option to first assess any qualitative factors that would lead to a determination that it is required inmore likely than not that the fair value of a reporting unit is less than its carrying amount. The changes under ASU 2011-08 are effective for public companies for annual and interim testing performed for periods beginning after December 15, 2011, andwith early adoption permitted. The application of this guidance is not expected to have a material impact on the Company’s consolidated financial position,condition, results of operations or cash flows.
Subsequent events:
On January 11, 2011, the Company announced a new Board-approved share repurchase program (the “Repurchase Program”) that authorizes the Company to repurchase up to $500 million of shares of common stock over a three-year period. Stock repurchases under the Repurchase Program may be made from time to time as the Company deems appropriate, solely through open market purchases effected through a broker dealer at prevailing market prices, and the Company may increase or otherwise modify the Repurchase Program at any time without prior notice.
On January 14, 2011, the Company issued $500 million aggregate principal amount of unsecured 4.875% Senior Notes due 2021 in the public market, of which the Company and its subsidiaries are the guarantors, and UMB Bank, N.A. (“UMB”) is trustee. The 2011 4.875% Senior Notes were issued at 99.297% of their face value and will mature on January 14, 2021. The proceeds from the 2011 4.875% Senior Notes issuance were used to repay all of the Company’s outstanding borrowings under its existing secured credit
facility, pay fees associated with the issuance and for general corporate purposes. Concurrent with the issuance of the 2011 4.875% Senior Notes, the Company entered into a credit agreement for a $750 million unsecured revolving credit facility (“Revolver”) arranged by Bank of America, N.A. (“BA”) and Barclays Capital (“Barclays”), which replaced the previous secured credit facility entered into on July 11, 2008, and matures in January of 2016. Concurrent with the retirement of the Company’s previous secured credit facility on January 14, 2011, all remaining debt issuance costs related to the previous secured credit facility were expensed. See Note 4 for further information concerning the 2011 4.875% Senior Notes and Revolver.
NOTE 2—BUSINESS COMBINATION
OnEffective July 11, 2008, the Company completed the acquisition ofacquired CSK, which was one of the largest specialty retailers of auto parts and accessories in the Western United States and one of the largest such retailers in the United States, based on store count at the date of acquisition. The results of CSK’s operations have been included in the Company’s consolidated financial statements since the acquisition date.
At the date of the acquisition, CSK had 1,342 stores in 22 states, operating under four brand names: Checker Auto Parts, Schuck’s Auto Supply, Kragen Auto Parts and Murray’s Discount Auto Parts. As of December 31, 2010, we have converted all CSK stores to O’Reilly systems, merged 41 CSK stores with existing O’Reilly locations, closed 17 CSK stores and opened five new stores in CSK historical markets.
Purchase price allocation:
The final purchase price for CSK was comprised of the following amounts (in thousands):
O’Reilly stock exchanged for CSK shares | $ | 459,308 | ||
Cash payment to CSK shareholders | 42,253 | |||
CSK shares purchased by O’Reilly prior to merger | 21,724 | |||
Fair value of options and unvested restricted stock exchanged | 7,736 | |||
Direct costs of the acquisition | 11,227 | |||
Total purchase price | $ | 542,248 | ||
The acquisition was accounted for under the purchase method of accounting with O’Reilly Automotive, Inc. as the acquiring entity in accordance with the Statement of Financial Accounting Standard No. 141,Business Combinations. Accordingly, theThe purchase price to acquire CSK was $542.2 million and was finalized on June 30, 2009. The consideration paid by the Company to complete the acquisition was allocated to the assets acquired and liabilities assumed based upon their estimated fair values as of the date of the acquisition. The allocationresults of purchase price was based upon certain external valuations and other analyses, including the review of legal reserves (see Note 14).
The final purchase price allocation was as follows (in thousands):
| Final Purchase Price Allocation as of June 30, 2009 | ||||
Inventory | $ | 539,827 | ||
Other current assets | 84,959 | |||
Property and equipment | 124,208 | |||
Goodwill | 694,987 | |||
Deferred income taxes | 160,943 | |||
Other intangible assets | 65,270 | |||
Other assets | 6,270 | |||
Total assets acquired | $ | 1,676,464 | ||
Senior credit facility | $ | 343,921 | ||
Term loan facility | 86,700 | |||
Capital lease obligations | 16,486 | |||
Other current liabilities | 501,470 | |||
6 3/4% senior exchangeable notes | 103,920 | |||
Other liabilities | 81,719 | |||
Total liabilities assumed | $ | 1,134,216 | ||
Net assets acquired | $ | 542,248 | ||
Estimated fair values of intangible assets acquired as of the date of acquisition were as follows (in thousands):
| Intangible assets | Weighted-Average Useful Lives (in years) | |||||||
Trademarks and trade names | $ | 13,000 | 1.4 | |||||
Favorable property leases | 52,270 | 10.7 | ||||||
Total intangible assets | $ | 65,270 | ||||||
The estimated values of operating leases with unfavorable terms compared with current market conditions totaled approximately $49.7 million. These liabilities had an estimated weighted-average useful life of approximately 7.7 years and are included in “Other liabilities”. Favorable and unfavorable lease assets and liabilities are being amortized to selling, general and administrative expense over their expected lives, which approximates the period of time that the favorable or unfavorable lease terms will be in effect. Trademarks and trade namesCSK’s operations have useful lives of one to three years and were amortized coinciding with the conversions of CSK store brands to the O’Reilly branded locations.
The final allocation of the purchase price included $54 million of accrued liabilities for estimated costs to exit certain activities of CSK, including $14.8 million of exit costs associated with the planned closure of 51 CSK stores, $3.7 million of assumed liabilities related to CSK’s existing closed stores for 127 locations that were closed prior to the Company’s acquisition of CSK, $26.6 million of employee separation costs, and $8.9 million of exit costs associated with the planned closure of other administrative offices and certain distribution facilities.
The CSK senior credit facility and term loan facility required repayment upon merger or acquisition and the entire amounts outstanding under both facilities were repaid by the Company on the July 11, 2008, acquisition date. The excess of the final purchase price over the estimated fair values of tangible and identifiable intangible assets acquired and liabilities assumed was recorded as goodwill. Goodwill in the amount of $695 million was recorded in the final purchase price allocations and is not amortizable for tax purposes.
The premium that the Company paid in excess of fair value of the net assets acquired was based on the Company’s desire to rapidly obtain scale in attractive west coast markets and to take advantage of opportunities to enhance operating results through increased buying power for inventory, increased advertising optimization, reduced redundancy in administrative expenses, returns on incremental capital investments, and improved overall operating effectiveness.
NOTE 3—GOODWILL AND OTHER INTANGIBLE ASSETS
Goodwill is reviewed annually on December 31 for impairment, or more frequently if events or changes in business conditions indicate that impairment may exist. Goodwill is not amortizable for financial statement purposes. During the year ended December 31, 2010, the Company recorded a decrease in goodwill of approximately $0.3 million, due to adjustments to the purchase price allocations related to small acquisitions and adjustments to the provision for income taxes relating to the exercise of stock options acquired in the CSK acquisition (see Note 2). The Company did not record any goodwill impairment for the year ended December 31, 2010. For the years ended December 31, 2010, 2009 and 2008, the Company recorded amortization expense of $8.5 million, $14.1 million, and $9.2 million, respectively, related to amortizable intangible assets, which are included in “Other assets” on the accompanying Consolidated Balance Sheets. The components of the Company’s amortizable and unamortizable intangible assets were as follows as of December 31, 2010 and 2009 (in thousands):
| Cost | Accumulated Amortization | |||||||||||||||
| December 31, 2010 | December 31, 2009 | December 31, 2010 | December 31, 2009 | |||||||||||||
Amortizable intangible assets: | ||||||||||||||||
Favorable leases | $ | 52,010 | $ | 52,010 | $ | 18,329 | $ | 11,383 | ||||||||
Trade names and trademarks | 13,000 | 13,000 | 13,000 | 11,588 | ||||||||||||
Other | 579 | 481 | 309 | 201 | ||||||||||||
Total amortizable intangible assets | $ | 65,589 | $ | 65,491 | $ | 31,638 | $ | 23,172 | ||||||||
Unamortizable intangible assets: | ||||||||||||||||
Goodwill | $ | 743,975 | $ | 744,313 | ||||||||||||
Total unamortizable intangible assets | $ | 743,975 | $ | 744,313 | ||||||||||||
The favorable lease assets,been included in the table above, were recorded in conjunction with the acquisition of CSK and represent the values of operating leases acquired with favorable terms. These favorable leases had an estimated weighted-average remaining useful life of approximately 10.3 years as of December 31, 2010. In addition, the Company has recorded a liability for the values of operating leases with unfavorable terms, acquired in the acquisition of CSK, totaling approximately $49.6 million at December 31, 2010 and 2009. These unfavorable leases have an estimated weighted-average remaining useful life of approximately 6.3 years. During the years ended December 31, 2010, 2009 and 2008, the Company recognized an amortized benefit of $7.0 million, $9.2 million and $3.9 million, respectively, related to these unfavorable operating leases. The carrying amount, net of accumulated amortization, of the unfavorable lease liability is $29.5 million and $36.5 million as of December 31, 2010 and 2009, respectively, and is shown in the “Other liabilities” section of the Consolidated Balance Sheets. None of the liabilities related to these unfavorable leases relate to stores to be closed as discussed in Note 2 or Note 7.
As of December 31, 2010, the estimated net amortizable benefit of the Company’s intangible assets and liabilities for each of the next five years is as follows (in thousands):
2011 | $ | 747 | ||
2012 | 737 | |||
2013 | 553 | |||
2014 | 529 | |||
2015 | 136 | |||
Total | $ | 2,702 | ||
The change in goodwill for the years ended December 31, 2010 and 2009, was as follows (in thousands):
Balance at December 31, 2008 | $ | 720,508 | ||
Adjustment to preliminary purchase price allocation of CSK | 24,479 | |||
Other | (674 | ) | ||
Balance at December 31, 2009 | 744,313 | |||
Other | (338 | ) | ||
Balance at December 31, 2010 | $ | 743,975 | ||
NOTE 4—LONG-TERM DEBT AND CAPITAL LEASES
Outstanding long-term debt was as follows on December 31, 2010 and 2009 (in thousands):
| December 31, 2010 | December 31, 2009 | |||||||
Capital leases | $ | 2,704 | $ | 11,230 | ||||
6 3/4% Senior Exchangeable Notes | — | 100,718 | ||||||
FILO revolving credit facility | — | 125,000 | ||||||
Tranche A revolving credit facility | 356,000 | 553,800 | ||||||
Total debt and capital lease obligations | 358,704 | 790,748 | ||||||
Current maturities of debt and capital lease obligations | 1,431 | 106,708 | ||||||
Total long-term debt and capital lease obligations | $ | 357,273 | $ | 684,040 | ||||
6 3/4% Exchangeable Senior Notes:
Onconsolidated financial statements since July 11, 2008, the Company executed the Third Supplemental Indenture (the “Third Supplemental Indenture”) to the 6 3/4% Exchangeable Senior Notes due 2025 (the “Notes”), in which it agreed to become a guarantor, on a subordinated basis, of the $100 million principal amount of the Notes originally issued by CSK pursuant to an Indenture dated as of December 19, 2005, as amended and supplemented by the First Supplemental Indenture dated as of December 30, 2005, and the Second Supplemental Indenture, dated as of July 27, 2006, by and between CSK Auto Corporation, CSK Auto, Inc. and The Bank of New York Mellon Trust Company, N.A., as trustee. On December 31, 2008, and effective as of July 11, 2008, the Company entered into the Fourth Supplemental Indenture in order to correct the definition of Exchange Rate in the Third Supplemental Indenture.
The Noteholders had the option to require the Company to repurchase some or all of the Notes for cash at a repurchase price equal to 100% of the principal amount of the Notes being repurchased, plus any accrued and unpaid interest on December 15, 2010; December 15, 2015; or December 15, 2020, or on any date following a fundamental change as described in the indenture. None of the Noteholders exercised such option at December 15, 2010.
On July 1, 2010, the Notes became exchangeable, per the terms of the indentures governing the Notes, at the option of the holders and remained exchangeable through September 30, 2010, the last trading day of the Company’s third quarter, as provided for in the indentures governing the Notes. The Notes became exchangeable as the Company’s common stock closed at or above 130% of the Exchange Price for 20 trading days within the 30 consecutive trading day period ending on June 30, 2010. As a result, during the exchange period commencing July 1, 2010, and continuing through and including September 30, 2010, for each $1,000 principal amount of the Notes held, holders of the Notes could, if they elected, surrender their Notes for exchange. If the Notes were exchanged, the Company would deliver cash equal to the lesser of the aggregate principal amount of Notes to be exchanged and the Company’s total exchange obligation and, in the event the Company’s total exchange obligation exceeded the aggregate principal amount of Notes to be exchanged, shares of the Company’s common stock in respect of that excess. The total exchange obligation reflected the exchange rate whereby each $1,000 in principal amount of the Notes was exchangeable into an equivalent value of approximately 25.97 shares of the Company’s common stock and approximately $60.61 in cash. On September 28, 2010, certain holders of the Notes delivered notice to the exchange agent to exercise their right to exchange $11 million of the principal amount of the Notes. The Cash Settlement Averaging Period (as defined in the indentures governing the Notes) ended on October 27, 2010, and on October 29, 2010, the Company delivered $11 million in cash, which represented the principal amount of the Notes exchanged and the value of partial shares, and 92,855 shares of the Company’s common stock to the exchange agent in settlement of the exchange obligation. Concurrently, the Company retired the $11 million principal amount of the exchanged Notes. On October 1, 2010, the Notes again became exchangeable at the option of the holders and remained exchangeable through December 31, 2010.
The Company had the option to redeem some or all of the Notes for cash at a redemption price of 100% of the principal amount plus any accrued and unpaid interest on or after December 15, 2010, upon at least 35-calendar days notice. On November 15, 2010, the Company notified Noteholders of its intention to call all of the Notes on December 21, 2010, (the “Redemption Date”) at a redemption price of 100% of the principal amount thereof, plus any accrued and unpaid interest up to, but not including, the Redemption Date. As a result of the Notes being called for redemption, the Notes were exchangeable at any time on or prior to December 17, 2010, the second Trading Day (as defined in the Indenture) preceding the Redemption Date. Upon exchange, the Company would deliver cash equal to the lesser of the aggregate principal amount of Notes to be exchanged and the Company’s total exchange obligation and, in the event the Company’s total exchange obligation exceeded the aggregate principal amount of Notes to be exchanged, shares of the Company’s common stock in respect of that excess. On or prior to December 17, 2010, all holders of the Notes delivered notice to the exchange agent to exercise their right to exchange the remaining $89 million principal amount of the Notes. The Cash Settlement Averaging Period (as defined in the indentures governing the Notes) ended on December 16, 2010, and on December 21, 2010, the Company delivered $89 million in cash, which represented the principal amount of the Notes exchanged and the value of partial shares, and 939,312 shares of the Company’s common stock to the exchange agent in settlement of the exchange obligation. Concurrently, the Company retired the remaining $89 million principal amount of the exchanged Notes.
The Company distinguishes its financial instruments between permanent equity, temporary equity, and assets and liabilities. The share exchange feature and the embedded put and call options within the Notes are required to be accounted for as equity instruments. All of the outstanding Notes were retired on December 21, 2010. The principal amount of the Notes as of December 31, 2009, was $100 million. The unamortized premium on the Notes was $0.7 million as of December 31, 2009, resulting in a net carrying amount of the Notes as of December 31, 2009, of $100.7 million. For the year ended December 31, 2009, the if-converted value of the Notes was $100 million. The net interest expense related to the Notes for the year ended December 31, 2010, was $6.0 million, resulting in an effective interest rate of 6.0%. The net interest expense related to the Notes for the year ended December 31, 2009, was $6.0 million, resulting in an effective interest rate of 6.0%. The net interest expense related to the Notes for the year ended December 31, 2008, was $2.9 million, resulting in an effective interest rate of 6.0%.
Asset-based revolving credit facility:
On July 11, 2008, in connection with the acquisition of CSK (see Note 2), the Company entered into a credit agreement for a five year $1.2 billion credit facility arranged by BA, which the Company used to refinance debt, fund the cash portion of the acquisition, pay for other transaction-related expenses and provide liquidity for the combined Company going forward. The Credit Facility was comprised of a five-year $1.075 billion tranche A revolving credit facility and a five-year $125 million first-in-last-out revolving credit facility (“FILO tranche”) both of which were scheduled to mature on July 11, 2013. The terms of the Credit Facility grant the Company the right to terminate the FILO tranche upon meeting certain requirements, including no events of default and aggregate projected availability under the Credit Facility. During the third quarter ended September 30, 2010, the Company, upon meeting all requirements to do so, elected to exercise its right to terminate the FILO tranche. As of December 31, 2010, the amount of the borrowing base available under the Credit Facility was $1.071 billion, of which the Company had outstanding borrowings of $356 million. The available borrowings under the Credit Facility are also reduced by stand-by letters of credit issued by the Company primarily to satisfy the requirements of workers compensation, general liability and other insurance policies. As of December 31, 2010, the Company had stand-by letters of credit outstanding in the amount of $71.2 million and the aggregate availability for additional borrowings under the Credit Facility was $644 million. As of December 31, 2009, the amount of the borrowing base available under the Credit Facility was $1.196 billion, of which the Company had outstanding borrowings of $678.8 million. The available borrowings under the Credit Facility are also reduced by stand-by letters of credit outstanding in the amount of $72.3 million and the aggregate availability for additional borrowings under the Credit Facility was $445.2 million. As part of the Credit Facility, the Company pledged virtually all of its assets as collateral and was subject to an ongoing consolidated leverage ratio covenant, with which the Company complied on December 31, 2010 and 2009. All outstanding borrowings under the Credit Facility were repaid on January 14, 2011, and the facility was retired concurrent with the issuance of the Company’s 2011 4.875% Senior Notes as further described below.
At December 31, 2010, borrowings under the tranche A revolver bore interest, at the Company’s option, at a rate equal to either a base rate plus 1.00% per annum or LIBOR plus 2.00% per annum, with each rate being subject to adjustment based upon certain excess availability thresholds. The base rate is equal to the higher of the prime lending rate established by BA from time to time and the federal funds effective rate as in effect from time to time plus 0.50%, subject to adjustment based upon remaining available borrowings. Fees related to unused capacity under the Credit Facility are assessed at a rate of 0.50% of the remaining available borrowings under the facility, subject to adjustment based upon remaining unused capacity. In addition, the Company paid customary commitment fees, letter of credit fees, underwriting fees and other administrative fees in respect to the Credit Facility. At December 31, 2010, the Company had borrowings of $106 million under its Credit Facility, which were not covered under an interest rate swap agreement, with interest rates ranging from 2.31% to 4.25%. At December 31, 2009, the Company had borrowings of $278.8 million under its Credit Facility, which were not covered under an interest rate swap agreement, with interest rates ranging from 2.50% to 4.50%.
On each of July 24, 2008, October 14, 2008, and January 21, 2010, the Company entered into interest rate swap transactions with Branch Banking and Trust Company (“BBT”), BA, SunTrust Bank (“SunTrust”), and/or Barclays Capital (“Barclays”). The Company entered into these interest rate swap transactions to mitigate the risk associated with its floating interest rate based on LIBOR on an aggregate of $450 million of its debt that is outstanding under its Credit Facility, dated as of July 11, 2008. The interest rate swap transaction that the Company entered into with BBT on October 14, 2008, for $25 million and was scheduled to mature on October 17, 2010, was terminated at the Company’s request on September 16, 2010, (see Note 8). The interest rate swap transaction that the Company entered into with BBT on July 24, 2008, for $100 million matured on August 1, 2010; the interest rate swap transactions the Company entered into with BBT, BA and/or SunTrust on October 14, 2008, totaling $75 million, matured on October 17, 2010, bringing the total notional amount of swapped debt to $250 million as of December 31, 2010. The Company is required to make certain monthly fixed rate payments calculated on the notional amounts, while the applicable counter party is obligated to make certain monthly floating rate payments to the Company referencing the same notional amount. The interest rate swap transactions effectively fix the annual interest rate payable on these notional amounts of the Company’s debt, which may exist under the Credit Facility plus an applicable margin under the terms of the Credit Facility. At December 31, 2010, the interest rate swap transactions had maturity dates ranging from January 31, 2011, through October 17, 2011.
The counterparties, transaction dates, effective dates, applicable notional amounts, effective index rates and maturity dates of each of the interest rate swap transactions which existed as of December 31, 2010, are included in the table below:
Counterparty | Transaction Date | Effective Date | Notional Amount (in thousands) | Effective index rate | Spread at December 31, 2010 | Effective Interest Rate at December 31, 2010 | Maturity date | |||||||||||||||||||||
SunTrust | 07/24/2008 | 08/01/2008 | 75,000 | 3.83 | % | 2.00 | % | 5.83 | % | 08/01/2011 | ||||||||||||||||||
BA | 07/24/2008 | 08/01/2008 | 75,000 | 3.83 | % | 2.00 | % | 5.83 | % | 08/01/2011 | ||||||||||||||||||
BA | 10/14/2008 | 10/17/2008 | 50,000 | 3.56 | % | 2.00 | % | 5.56 | % | 10/17/2011 | ||||||||||||||||||
Barclays | 01/21/2010 | 01/22/2010 | 50,000 | 0.53 | % | 2.00 | % | 2.53 | % | 01/31/2011 | ||||||||||||||||||
| $ | 250,000 | |||||||||||||||||||||||||||
All of the interest rate swap transactions that existed as of December 31, 2010, for a total notional amount of $250 million, were terminated at the Company’s request on January 14, 2011, concurrent with the retirement of the Credit Facility and the issuance of its 2011 4.875% Senior Notes as further described below.
Capital lease agreements:date.
The Company leases certain equipment under capital lease agreements. The lease agreements have terms ranging from 63 to 180 months, expiring on dates ranging from October of 2013 to March of 2017. The present value of the future minimum lease payments under equipment capital leases totaled approximately $1.9 million and $10.5 million at December 31, 2010 and 2009, respectively, which have been classified as long-term debt in the accompanying consolidated financial statements. The Company acquired equipment under capital leases in the amount of $8.3 million during the year ended December 31, 2009. The Company did not acquire any additional equipment under capital leases during the year ended December 31, 2010.
The Company assumed certain building capital leases in the CSK acquisition. During the year ended December 31, 2010, the Company purchased all properties under these capital leases with the exception of one location, which will expire in April of 2015. The present value of future minimum lease payments under building capital leases totaled approximately $0.8 million at December 31, 2010 and 2009, which are classified as long-term debt in the accompanying consolidated financial statements. The Company did not acquire any additional buildings under capital leases during the periods ended December 31, 2010 and 2009.
As of December 31, 2010, principal maturities of long-term debt and capital lease obligations are as follows (in thousands):
2011 | $ | 1,431 | ||
2012 | 669 | |||
2013 | 356,291 | |||
2014 | 130 | |||
2015 | 89 | |||
Thereafter | 94 | |||
Total | $ | 358,704 | ||
New Financing Plan, Subsequent Event:
On January 11, 2011, the Company announced a multi-faceted financing plan, which included the offering of $500 million of unsecured notes and the entrance into a five-year $750 million unsecured revolving credit facility, which are further described below.
4.875% Senior Notes due 2021:
On January 14, 2011, the Company issued $500 million aggregate principal amount of unsecured 4.875% Senior Notes due 2021 in the public market, of which certain of the Company’s subsidiaries are the guarantors (“Subsidiary Guarantors”), and UMB is trustee. The 2011 4.875% Senior Notes were issued at 99.297% of their face value and mature on January 14, 2021. Interest on the 2011 4.875% Senior Notes accrues at a rate of 4.875% per annum and is payable semiannually on January 14 and July 14 of each year beginning on July 14, 2011. Interest is computed on the basis of a 360-day year.
The proceeds from the 2011 4.875% Senior Notes’ issuance were used to repay all of the Company’s outstanding borrowings under its Credit Facility and to pay fees and expenses related to the offering of the 2011 4.875% Senior Notes, with the remainder used for general corporate purposes.
Prior to October 14, 2020, the 2011 4.875% Senior Notes are redeemable in whole, at any time, or in part, from time to time, at the Company’s option upon not less than 30 nor more than 60 days’ notice at a redemption price, plus any accrued and unpaid interest to, but not including, the redemption date, equal to the greater of:
100% of the principal amount thereof; or
the sum of the present values of the remaining scheduled payments of principal and interest thereon discounted to the redemption date on a semiannual basis (assuming a 360-day year consisting of twelve 30-day months) at the applicable Treasury Yield (as defined in the indenture governing the 2011 4.875% Senior Notes) plus 25 basis points.
On or after October 14, 2020, the 2011 4.875% Senior Notes are redeemable, in whole at any time or in part from time to time, at the Company’s option upon not less than 30 nor more than 60 days’ notice at a redemption price equal to 100% of the principal amount thereof plus accrued and unpaid interest to, but not including, the redemption date. In addition, if the Company undergoes a Change of Control Triggering Event (as defined in the indenture governing the 2011 4.875% Senior Notes), holders of the 2011 4.875% Senior Notes may require the Company to repurchase all or a portion of their 2011 4.875% Senior Notes at a price equal to 101% of the principal amount of the 2011 4.875% Senior Notes being repurchased, plus accrued and unpaid interest, if any, to but not including the repurchase date.
The 2011 4.875% Senior Notes are subject to certain customary, positive and negative covenants, with which the Company complied as of January 14, 2011. The 2011 4.875% Senior Notes are guaranteed by certain of the Company’s subsidiaries on a senior unsecured basis. The guarantees are full and unconditional and joint and several. Each of the Subsidiary Guarantors are wholly-owned, directly or indirectly, by the Company and the Company has no independent assets or operations other than those of its subsidiaries. The only direct or indirect subsidiaries of the Company that are not Subsidiary Guarantors are minor subsidiaries. Neither the Company nor any of its Subsidiary Guarantors has any material or significant restrictions on the Company’s ability to obtain funds from its subsidiaries by dividend or loan or to transfer assets from such subsidiaries, except as provided by applicable law.
Unsecured revolving credit facility:
On January 14, 2011, the Company entered into a new credit agreement for a five-year $750 million unsecured revolving credit facility (the “Revolver”) arranged by BA and Barclays, which matures in January of 2016. The Revolver includes a $200 million sub-limit for the issuance of letters of credit and a $75 million sub-limit for swing line borrowings. Borrowings under the Revolver (other than swing line loans) bear interest, at the Company’s option, at either the Base Rate or Eurodollar Rate (both as defined in the agreement) plus a margin, that will vary from 1.325% to 2.50% in the case of loans bearing interest at the Eurodollar Rate and 0.325% to 1.50% in the case of loans bearing interest at the Base Rate, in each case based upon the ratings assigned to the Company’s debt by Moody’s Investor Service, Inc. (“Moody’s”) and Standard & Poor’s Rating Services (“S&P”). Swing line loans made under the Revolver bear interest at the Base Rate plus the applicable margin described above. In addition, the Company pays a facility fee on the aggregate amount of the commitments in an amount equal to a percentage of such commitments, varying from 0.175% to 0.50%
based upon the ratings assigned to the Company’s debt by Moody’s and S&P. The Revolver replaced the previous $1.2 billion Credit Facility entered into on July 11, 2008. At the time of closing, the Company did not have any borrowings outstanding under the Revolver.
The Revolver contains certain debt covenants, which include limitations on total outstanding borrowings, a minimum fixed charge coverage ratio of 2.0 times from the closing through December 31, 2012, 2.25 times through December 31, 2014 and 2.5 times through maturity and a maximum adjusted consolidated leverage ratio of 3.0 times through maturity. The consolidated leverage ratio includes a calculation of earnings before interest, taxes, depreciation, amortization, rent and stock option compensation expense to adjusted debt. Adjusted debt includes outstanding debt, outstanding standby letters of credit, six times rent expense and excludes any premium or discount recorded in conjunction with the issuance of long-term debt. As of January 14, 2011, the Company complied with all covenants related to the borrowing arrangements.
NOTE 5—RELATED PARTIES
The Company leases certain land and buildings related to 48 of its O’Reilly Auto Parts stores under fifteen-year operating lease agreements with New O’Reilly Investment Company LP and New O’Reilly Real Estate Company LP, entities in which certain shareholders and directors of the Company are partners. Generally, these lease agreements provide for renewal options for an additional five years at the option of the Company and the lease agreements are periodically modified to further extend the lease term for specific stores under the agreement. Additionally, the Company leases certain land and buildings related to 21 of its O’Reilly Auto Parts stores under fifteen-year operating lease agreements with O’Reilly-Wooten, 2001 LLP, an entity in which certain shareholders and directors of the Company are partners. Generally, these lease agreements provide for renewal options for two additional five-year terms at the option of the Company (see Note 6). Lease payments under these operating leases totaled $4.0 million, $3.7 million and $3.5 million in 2010, 2009 and 2008, respectively.
NOTE 6—COMMITMENTS
Lease commitments:
The Company leases certain office space, retail stores, property and equipment under long-term, non-cancelable operating leases. Most of these leases include renewal options and some include options to purchase and/or provisions for percentage rent based on sales or incremental step increase provisions. At December 31, 2010, future minimum lease payments under all of the Company’s operating leases for each of the next five years and in the aggregate are as follows (in thousands):
| Related Parties | Non-related Parties | Total | ||||||||||
2011 | $ | 3,873 | $ | 216,068 | $ | 219,941 | ||||||
2012 | 3,858 | 199,723 | 203,581 | |||||||||
2013 | 3,785 | 173,740 | 177,525 | |||||||||
2014 | 2,444 | 150,016 | 152,460 | |||||||||
2015 | 1,716 | 121,932 | 123,648 | |||||||||
Thereafter | 7,129 | 623,273 | 630,402 | |||||||||
Total | $ | 22,805 | $ | 1,484,752 | $ | 1,507,557 | ||||||
Rental expense incurred for all non-cancellable operating leases totaled $226.9 million, $229.1 million and $132.3 million for the years ended December 31, 2010, 2009 and 2008, respectively.
Other commitments:
The Company had construction commitments, which totaled approximately $64.8 million, at December 31, 2010.
NOTE 7—EXIT ACTIVITIES
The Company maintains reserves for closed stores and other properties that are no longer utilized in current operations, as well as reserves for employee separation liabilities. Reserves for closed stores and other properties include stores and other properties acquired in the CSK acquisition (see Note 2). Employee separation liabilities represent costs for anticipated payments, including payments required under various pre-existing employment arrangements with acquired CSK employees, which existed at the time of the acquisition, relating to the planned involuntary termination of employees performing overlapping or duplicative functions.
The Company accrues for closed property operating lease liabilities using a credit-adjusted discount rate to calculate the present value of the remaining non-cancelable lease payments, contractual occupancy costs and lease termination fees after the closing date, net of estimated sublease income. The closed property lease liabilities are expected to be paid over the remaining lease terms, which currently extend through April of 2023. The Company estimates sublease income and future cash flows based on the Company’s experience and knowledge of the market in which the closed property is located, previous efforts to dispose of similar assets and
existing economic conditions. Adjustments to closed property reserves are made to reflect changes in estimated sublease income or actual contracted exit costs, which vary from original estimates. Adjustments are made for material changes in estimates in the period in which the changes become known.
The following is a summary of closure reserves for stores, administrative office and distribution facilities and reserves for employee separation costs at December 31, 2010 and 2009 (in thousands):
| Store Closure Liabilities | Administrative Office and Distribution Facilities Closure Liabilities | Employee Separation Liabilities | ||||||||||
Balance at January 1, 2009: | $ | 7,374 | $ | 4,127 | $ | 25,079 | ||||||
Planned CSK exit activities | 10,646 | 4,739 | (996 | ) | ||||||||
Additions and accretion | 995 | 291 | — | |||||||||
Payments | (3,759 | ) | (1,375 | ) | (22,003 | ) | ||||||
Revisions to estimates | 521 | (129 | ) | — | ||||||||
Balance at December 31, 2009: | 15,777 | 7,653 | 2,080 | |||||||||
Additions and accretion | 902 | 446 | — | |||||||||
Payments | (3,121 | ) | (2,330 | ) | (1,519 | ) | ||||||
Revisions to estimates | 413 | (161 | ) | 595 | ||||||||
Balance at December 31, 2010: | $ | 13,971 | $ | 5,608 | $ | 1,156 | ||||||
The revisions to estimates in closure reserves for stores and administrative office and distribution facilities included changes in the estimates of sublease agreements, changes in assumptions of various store and office closure activities, and changes in assumed leasing arrangements since the acquisition of CSK. The cumulative amount incurred in closure reserves for stores from the inception of the exit activity through December 31, 2010, was $23.4 million. The cumulative amount incurred in administrative office and distribution facilities from the inception of the exit activity through December 31, 2010, was $9.3 million. The balance of both these reserves is included in “Other current liabilities” and “Other liabilities” on the accompanying Consolidated Balance Sheets based upon the dates when the reserves are expected to be settled. The revisions to estimates in the reserves for employee separation liabilities include additional severance and incentive compensation accrued for employees of CSK. The cumulative amount incurred in employee separation liabilities from the inception of the exit activity through December 31, 2010, was $29.4 million, the balance of which is included in “Accrued payroll” on the accompanying Consolidated Balance Sheets.
NOTE 8—DERIVATIVE INSTRUMENTS AND HEDGING ACTIVITIES
Interest rate risk management:
As discussed in Note 4, on each of July 24, 2008, October 14, 2008, and January 21, 2010, the Company entered into interest rate swap transactions with BBT, BA, SunTrust and/or Barclays to mitigate cash flow risk associated with the floating interest rate based on the one month LIBOR rate on an aggregate of $450 million of the debt outstanding under the Credit Facility, dated as of July 11, 2008. The interest rate swap transaction the Company entered into with BBT on July 24, 2008, for $100 million, matured on August 1, 2010, bringing the total notional amount of swapped debt to $350 million as of that date. The interest rate swap transaction that the Company entered into with BBT on October 14, 2008, for $25 million and was scheduled to mature on October 17, 2010, was terminated at the Company’s request on September 16, 2010, reducing the total notional amount of swapped debt to $325 million as of that date. The interest rate swap transactions the Company entered into with BBT, BA and/or SunTrust on October 14, 2008, totaling $75 million, matured on October 17, 2010, bringing the total notional amount of swapped debt to $250 million as of December 31, 2010. The swap transactions have been designated as cash flow hedges with interest payments designed to offset the interest payments for borrowings under the Credit Facility that correspond to the notional amounts of the swaps. The fair values of the Company’s outstanding hedges are recorded as a liability in the accompanying Consolidated Balance Sheets at December 31, 2010 and 2009. For qualifying cash flow hedges, the effective portion of the change in the fair value of the derivative instrument is recorded as a component of “Accumulated other comprehensive loss” and any ineffectiveness is recognized in earnings in the period of ineffectiveness. The change in the fair value of the $25 million interest rate swap contract, which was terminated by the Company on September 16, 2010, was deemed to be ineffective as of the termination date. The Company recognized $0.1 million in “Interest expense” for the year ended December 31, 2010, as a result of the hedge ineffectiveness. As of December 31, 2010, the Company’s remaining hedging instruments have been deemed to be highly effective.
The tables below represent the effect the Company’s derivative financial instruments had on its condensed consolidated financial statements as of December 31, 2010 and 2009 (in thousands):
| Fair Value of Derivative, Recorded as Payable | Fair Value of Derivative, Tax Effect | Amount of Loss Recognized in Accumulated Other Comprehensive Loss on Derivative, net of tax | ||||||||||||||||||||||
Derivative Designated as Hedging Instrument | December 31, 2010 | December 31, 2009 | December 31, 2010 | December 31, 2009 | December 31, 2010 | December 31, 2009 | ||||||||||||||||||
Interest rate swap contracts | $ | 4,845 | $ | 13,053 | $ | 1,875 | $ | 5,091 | $ | 2,970 | $ | 7,962 | ||||||||||||
Location and Amount of Loss Recognized in Income on Derivative (Ineffective Portion) | ||||||||||||
Derivative Designated as Hedging Instrument | Year ended December 31, 2010 | Year ended December 31, 2009 | ||||||||||
Interest rate swap contracts | Interest expense | $ | 65 | Interest expense | $ | — | ||||||
| Location of and Amount Recorded as Payable to Counterparties | ||||||||||||
Derivative Designated as Hedging Instrument | December 31, 2010 | December 31, 2009 | ||||||||||
Interest rate swap contracts | Other current liabilities | $ | 4,845 | Other current liabilities | $ | 4,140 | ||||||
Interest rate swap contracts | Other liabilities | — | Other liabilities | 8,913 | ||||||||
All of the interest rate swap transactions that existed as of December 31, 2010, for a total notional amount of $250 million, were terminated at the Company’s request on January 14, 2011, concurrent with the retirement of the Credit Facility and the issuance of its 2011 4.875% Senior Notes (see Note 4).
NOTE 93—FAIR VALUE MEASUREMENTS
The Company uses the fair value hierarchy, which prioritizes the inputs used to measure the fair value of certain of its financial instruments. The hierarchy gives the highest priority to unadjusted quoted prices in active markets for identical assets or liabilities (level(Level 1 measurement) and the lowest priority to unobservable inputs (level(Level 3 measurement). The Company uses the income and market approaches to determine the fair value of its assets and liabilities. The three levels of the fair value hierarchy are set forth below:
Level 1 – Observable inputs that reflect quoted prices in active markets.
Level 2 – Inputs other than quoted prices in active markets that are either directly or indirectly observable.
Level 3 – Unobservable inputs in which little or no market data exists, theretherefore requiring the Company to develop its own assumptions.
The Company did not have transfers between levels within the hierarchy during the years ended December 31, 2011 or 2010.
6 3/4% Exchangeable Senior Notes:Financial assets and liabilities measured at fair value on a recurring basis:
AsThe fair value of the Company’s outstanding interest rate swap contracts, as discussed in Note 4, the 6 3/4% Exchangeable Senior Notes were retired during 20105 and no amounts were outstanding at December 31, 2010. The carrying amount of the Company’s 6 3/4% Exchangeable Senior Notes at December 31, 2009,Note 7, was included in “Current portion of long-term debt”“Other current liabilities” on the accompanying Consolidated Balance Sheets.Sheets as of December 31, 2010. The fair value of the interest rate swap contracts was based on the discounted net present value of the swaps using third party quotes (Level 2). Changes in fair market value were recorded in “Accumulated other comprehensive loss” on the accompanying Consolidated Balance Sheets, and changes resulting from the termination of the interest rate swap contracts were recorded in “Other income (expense)” on the accompanying Consolidated Statements of Income. All of the interest rate swap contracts that existed as of December 31, 2010, were terminated at the Company’s request on January 14, 2011, concurrent with the retirement of the ABL Credit Facility and the issuance of the 4.875% Senior Notes due 2021, as discussed in Note 5 and Note 7.
The table below identifies the estimated fair value Derivative contracts Certain long-lived non-financial assets and liabilities may be required to be measured at fair value on a nonrecurring basis in certain circumstances, including when there is evidence of impairment. These non-financial assets and liabilities may include assets acquired in a business combination or property and equipment that are determined to be impaired. As of December 31, 2011 and 2010, the Company did not have any non-financial assets or liabilities that had been measured at fair value subsequent to initial recognition. The carrying amounts of the Company’s senior notes are included in “Long-term debt, less current portion” on the accompanying Consolidated Balance Sheets as of December 31, 2011. The table below identifies the estimated fair value of the Company’s senior notes, using the market approach, as of December 31, 2011, which was determined by reference to quoted market prices (Level 1) (in thousands): December 31, 2011 4.875% Senior Notes due 2021 4.625% Senior Notes due 2021 The carrying amount of the Company’s ABL Credit Facility as of December 31, 2010, was $356 million and was included in “Long-term debt, less current portion” on the accompanying Consolidated Balance Sheets at that time. The Company determined that the estimated fair value of its ABL Credit Facility approximated the carrying amount. This valuation was determined by consulting investment bankers (Level 2). All outstanding borrowings under the ABL Credit Facility were repaid on January 14, 2011, and the facility was retired concurrent with the issuance of the Company’s 4.875% Senior Notes due 2021 as discussed in Note 5. The accompanying Consolidated Balance Sheets include other financial instruments, including cash and cash equivalents, accounts receivable, amounts receivable from vendors and accounts payable. Due to the short-term nature of these financial instruments, the Company believes that the carrying values of these instruments approximate their fair values. NOTE 4—GOODWILL AND OTHER INTANGIBLES Goodwill: Goodwill is reviewed annually on November 30 for impairment, or more frequently if events or changes in business conditions indicate that impairment may exist. Goodwill is not amortizable for financial statement purposes. During the year ended December 31, 2011, the Company recorded a decrease in goodwill of less than $0.1 million, primarily due to adjustments to purchase price allocations related to small acquisitions and the excess tax benefit related to exercises of stock options acquired in the acquisition of CSK. The Company did not record any goodwill impairment during the year ended December 31, 2011.at December 31, 2009, of the Company’s 6interest rate swap contracts, using the discounted net present value of the swap using third party quotes (Level 2), as of December 31, 2010 (in thousands): 3December 31, 2010 Quoted Prices in
Active Markets for
Identical
Instruments
(Level 1) Significant Other
Observable Inputs
(Level 2) Significant
Unobservable Inputs
(Level 3) Total $ — $ (4,845 ) $ — $ (4,845 ) /Non-financial assets and liabilities measured at fair value on a nonrecurring basis:4Fair value of financial instruments:% Exchangeable Senior Notes, Quoted Prices in
Active Markets for
Identical
Instruments
(Level 1) Significant Other
Observable Inputs
(Level 2) Significant
Unobservable Inputs
(Level 3) Total $ 533,150 $ — $ — $ 533,150 $ 313,830 $ — $ — $ 313,830
The following table identifies the changes in goodwill for the years ended December 31, 2011 and 2010 (in thousands):
Balance at December 31, 2009 | $ | 744,313 | ||
Other | (338 | ) | ||
|
| |||
Balance at December 31, 2010 | 743,975 | |||
Other | (68 | ) | ||
|
| |||
Balance at December 31, 2011 | $ | 743,907 | ||
|
|
As of December 31, 2011 and 2010, the Company did not have any other unamortizable assets other than goodwill.
Intangibles other than goodwill:
The following table identifies the components of the Company’s amortizable intangibles as of December 31, 2011 and 2010 (in thousands):
| Cost | Accumulated Amortization (Expense) Benefit | |||||||||||||||
| December 31, 2011 | December 31, 2010 | December 31, 2011 | December 31, 2010 | |||||||||||||
Amortizable intangible assets: | ||||||||||||||||
Favorable leases | $ | 51,660 | $ | 52,010 | $ | (23,969 | ) | $ | (18,329 | ) | ||||||
Non-compete agreements | 793 | 579 | (427 | ) | (309 | ) | ||||||||||
|
|
|
|
|
|
|
| |||||||||
Total amortizable intangible assets | $ | 52,453 | $ | 52,589 | $ | (24,396 | ) | $ | (18,638 | ) | ||||||
|
|
|
|
|
|
|
| |||||||||
Unfavorable leases | $ | 49,380 | $ | 49,570 | $ | 26,560 | $ | 20,071 | ||||||||
The Company recorded favorable lease assets in conjunction with the acquisition of CSK; these favorable lease assets represent the values of operating leases acquired with favorable terms. These favorable leases had an estimated weighted-average remaining useful life of approximately 10.1 years as of December 31, 2011. For the years ended December 31, 2011, 2010 and 2009, the Company recorded amortization expense of $6.1 million, $8.5 million, and $14.1 million, respectively, related to its amortizable intangible assets, which are included in “Other assets, net” on the accompanying Consolidated Balance Sheets.
The Company recorded unfavorable lease liabilities in conjunction with the acquisition of CSK; these unfavorable lease liabilities represent the values of operating leases acquired with unfavorable terms. These unfavorable leases had an estimated weighted-average remaining useful life of approximately 5.8 years as of December 31, 2011. For the years ended December 31, 2011, 2010 and 2009, the Company recognized an amortized benefit of $6.7 million, $7.0 million and $9.2 million, respectively, related to these unfavorable operating leases, which are included in “Other liabilities” on the accompanying Consolidated Balance Sheets. These unfavorable lease liabilities are not included as a component of the Company’s closed store reserves, which are discussed in Note 6.
The following table identifies the estimated amortization expense and benefit of the Company’s intangibles for each of the next five years as of December 31, 2011 (in thousands):
| Amortization Expense | Amortization Benefit | Total | ||||||||||
2012 | $ | (4,956 | ) | $ | 5,651 | $ | 695 | |||||
2013 | (4,041 | ) | 4,548 | 507 | ||||||||
2014 | (3,143 | ) | 3,642 | 499 | ||||||||
2015 | (2,712 | ) | 2,794 | 82 | ||||||||
2016 | (2,357 | ) | 2,076 | (281 | ) | |||||||
|
|
|
|
|
| |||||||
Total | $ | (17,209 | ) | $ | 18,711 | $ | 1,502 | |||||
|
|
|
|
|
| |||||||
NOTE 5—LONG-TERM DEBT AND CAPITAL LEASES
The following table identifies the amounts included in “Current portion of long-term debt” and “Long-term debt, less current portion” on the accompanying Consolidated Balance Sheets as of December 31, 2011 and 2010 (in thousands):
| December 31, 2011 | December 31, 2010 | |||||||
ABL Credit Facility | $ | — | $ | 356,000 | ||||
Revolving Credit Facility | — | — | ||||||
4.875% Senior Notes due 2021 (1), effective interest rate of 4.945% | 496,824 | — | ||||||
4.625% Senior Notes due 2021(2), effective interest rate of 4.642% | 299,493 | — | ||||||
Capital leases | 1,257 | 2,704 | ||||||
|
|
|
| |||||
Total debt and capital lease obligations | 797,574 | 358,704 | ||||||
Current portion of long-term debt | 662 | 1,431 | ||||||
|
|
|
| |||||
Long-term debt, less current portion | $ | 796,912 | $ | 357,273 | ||||
|
|
|
| |||||
| (1) | Net of unamortized discount of $3.2 million |
| (2) | Net of unamortized discount of $0.5 million |
The following table identifies the principal maturities of long-term debt and capital lease obligations as of December 31, 2011 (in thousands):
2012 | $ | 662 | ||
2013 | 286 | |||
2014 | 130 | |||
2015 | 89 | |||
2016 | 71 | |||
Thereafter | 796,336 | |||
|
| |||
Total | $ | 797,574 | ||
|
|
Asset-based revolving credit facility:
On July 11, 2008, the Company entered into a credit agreement for a five-year asset-based revolving credit facility, the ABL Credit Facility, which was scheduled to mature in July of 2013. At December 31, 2010, the Company had outstanding borrowings of $356 million under the ABL Credit Facility, of which $106 million were not covered under an interest rate swap contract. All outstanding borrowings under the ABL Credit Facility were repaid, and all related interest rate swap contracts were terminated on January 14, 2011, and the ABL Credit Facility was retired concurrent with the issuance of the Company’s 4.875% Senior Notes due 2021, as further described below. In conjunction with the retirement of the Company’s ABL Credit Facility, the Company recognized a one-time non-cash charge to write off the balance of debt issuance costs related to the ABL Credit Facility in the amount of $21.6 million and a one-time charge related to the termination of the Company’s interest rate swap contracts in the amount of $4.2 million, which are included in “Other income (expense)” on the accompanying Consolidated Statements of Income for the year ended December 31, 2011.
Unsecured revolving credit facility:
On January 14, 2011, the Company entered into a new credit agreement for a five-year $750 million unsecured revolving credit facility (the “Revolving Credit Facility”) arranged by Bank of America, N.A. (“BA”) and Barclays Capital, originally scheduled to mature in January of 2016. On September 9, 2011, the Company amended the credit agreement (the “Credit Agreement”), decreasing the aggregate commitments under the Revolving Credit Facility to $660 million, extending the maturity date on the Credit Agreement to September of 2016 and reducing the facility fee and interest rate margins for borrowings under the Revolving Credit Facility. In conjunction with the amendment to the Credit Agreement, the Company recognized a one-time charge related to the modification in the amount of $0.3 million, which is included in “Other income (expense)” on the table below (in thousands):accompanying Consolidated Statements of Income for the twelve months ended December 31, 2011. The Credit Agreement includes a $200 million sub-limit for the issuance of letters of credit and a $75 million sub-limit for swing line borrowings under the Revolving Credit Facility. As described in the Credit Agreement governing the Revolving Credit Facility, the Company may, from time to time subject to certain conditions, increase the aggregate commitments under the Revolving Credit Facility by up to $200 million. As of December 31, 2011, the Company had outstanding letters of credit, primarily to satisfy workers’ compensation, general liability and other insurance policies, in the amount of $59.9 million, reducing the aggregate availability under the Revolving Credit Facility by that amount. As of December 31, 2011, the Company had no outstanding borrowings under the Revolving Credit Facility.
| December 31, 2010 | December 31, 2009 | |||||||||||||||
| Carrying Amount | Estimated Fair Value | Carrying Amount | Estimated Fair Value | |||||||||||||
Obligations under 6 3/4% senior exchangeable notes | $ | — | $ | — | $ | 100,718 | $ | 119,273 | ||||||||
Borrowings under the Revolving Credit Facility (other than swing line loans) bear interest, at the Company’s option, at the Base Rate or Eurodollar Rate (both as defined in the Credit Agreement) plus an applicable margin. Swing line loans made under the Revolving Credit Facility bear interest at the Base Rate plus the applicable margin. In addition, the Company pays a facility fee on the aggregate amount of the commitments in an amount equal to a percentage of such commitments. The interest rate margins and facility fee are based upon the better of the ratings assigned to the Company’s debt by Moody’s Investor Service, Inc. and Standard & Poor’s Rating Services. Based upon the Company’s credit ratings at December 31, 2011, its margin for Base Rate loans was 0.275%, its margin for Eurodollar Rate loans was 1.275% and its facility fee was 0.225%. Based on the Company’s current credit ratings, its margin for Base Rate loans is 0.200%, its margin for Eurodollar Rate loans is 1.200% and its facility fee is 0.175%.
The Credit Agreement contains certain debt covenants, which include limitations on total outstanding borrowings, a minimum fixed charge coverage ratio of 2.0 times through December 31, 2012; 2.25 times through December 31, 2014; 2.5 times through maturity; and a maximum adjusted consolidated leverage ratio of 3.0 times through maturity. The consolidated leverage ratio includes a calculation of adjusted earnings before interest, taxes, depreciation, amortization, rent and stock based compensation expense to adjusted debt. Adjusted debt includes outstanding debt, outstanding stand-by letters of credit, six-times rent expense and excludes any premium or discount recorded in conjunction with the issuance of long-term debt. In the event that the Company should default on any covenant contained within the Credit Agreement, certain actions may be taken, including, but not limited to, possible termination of credit extensions, immediate payment of outstanding principal amount plus accrued interest and litigation from lenders. As of December 31, 2011, the Company remained in compliance with all covenants related to the Credit Agreement.
Interest rate swap contracts:Senior notes:
4.875% Senior Notes due 2021:
On January 14, 2011, the Company issued $500 million aggregate principal amount of unsecured 4.875% Senior Notes due 2021 (“4.875% Senior Notes due 2021”) at a price to the public of 99.297% of their face value with United Missouri Bank, N.A. (“UMB”) as trustee. Interest on the 4.875% Senior Notes due 2021 is payable on January 14 and July 14 of each year and is computed on the basis of a 360-day year. The fair valuesnet proceeds from the issuance of the 4.875% Senior Notes due 2021 were used to repay all of the Company’s outstanding borrowings under its ABL Credit Facility and to pay fees and expenses related to the offering and costs associated with terminating the Company’s existing interest rate swap contracts, (see Note 4)with the remainder used for general corporate purposes, including share repurchases.
4.625% Senior Notes due 2021:
On September 19, 2011, the Company issued $300 million aggregate principal amount of unsecured 4.625% Senior Notes due 2021 (“4.625% Senior Notes due 2021”) at a price to the public of 99.826% of their face value with UMB as trustee. Interest on the 4.625% Senior Notes due 2021 is payable on March 15 and September 15 of each year and is computed on the basis of a 360-day year. The net proceeds from the issuance of the 4.625% Senior Notes due 2021 were used to pay fees and expenses related to the offering, with the remainder intended to be used to repay borrowings outstanding from time to time under the Revolving Credit Facility and for general corporate purposes, including share repurchases.
The senior notes are guaranteed on a senior unsecured basis by each of the Company’s subsidiaries (“Subsidiary Guarantors”) that incurs or guarantees the Company’s obligations under the Company’s Revolving Credit Facility or certain other debt of the Company or any of the Subsidiary Guarantors. The guarantees are full and unconditional and joint and several. Each of the Subsidiary Guarantors is wholly-owned, directly or indirectly, by the Company and the Company has no independent assets or operations other than those of its subsidiaries. The only direct or indirect subsidiaries of the Company that would not be Subsidiary Guarantors would be minor subsidiaries. No minor subsidiaries exist today. Neither the Company, nor any of its Subsidiary Guarantors, are subject to any material or significant restrictions on the Company’s ability to obtain funds from its subsidiaries by dividend or loan or to transfer assets from such subsidiaries, except as provided by applicable law. Each of the senior notes is subject to certain customary covenants, with which the Company complied as of December 31, 2011.
Capital lease agreements:
The Company assumed certain vehicle capital leases in the CSK acquisition. The remaining vehicle capital lease agreements have contractual terms of 63 months, which will expire on October 15, 2013. The present value of the future minimum lease payments under these vehicle capital leases totaled approximately $0.7 million and $1.9 million at December 31, 2011 and 2010, respectively, which were classified as long-term debt in the accompanying consolidated financial statements. The Company did not acquire any additional vehicles under capital leases during the periods ended December 31, 2011 or 2010.
The Company assumed certain building capital leases in the CSK acquisition. The remaining building capital lease agreements will expire on April 30, 2015, and March 31, 2017. The present value of future minimum lease payments under these building capital leases totaled approximately $0.5 million and $0.8 million at December 31, 2011 and 2010, respectively, which were classified as long-term debt in the accompanying consolidated financial statements. The Company did not acquire any additional buildings under capital leases during the periods ended December 31, 2011 or 2010.
NOTE 6—EXIT ACTIVITIES
The Company maintains reserves for closed stores and other properties that are no longer utilized in current operations, and had previously maintained reserves for employee separation liabilities.
The following table identifies the closure reserves for stores, administrative office and distribution facilities, and reserves for employee separation costs at December 31, 2011 and 2010 (in thousands):
| Store Closure Liabilities | Administrative Office and Distribution Facilities Closure Liabilities | Employee Separation Liabilities | ||||||||||
Balance at January 1, 2010: | $ | 15,777 | $ | 7,653 | $ | 2,080 | ||||||
Additions and accretion | 902 | 446 | — | |||||||||
Payments | (3,121 | ) | (2,330 | ) | (1,519 | ) | ||||||
Revisions to estimates | 413 | (161 | ) | 595 | ||||||||
|
|
|
|
|
| |||||||
Balance at December 31, 2010: | 13,971 | 5,608 | 1,156 | |||||||||
Additions and accretion | 695 | 314 | — | |||||||||
Payments | (3,634 | ) | (2,593 | ) | (912 | ) | ||||||
Revisions to estimates | 280 | 215 | (244 | ) | ||||||||
|
|
|
|
|
| |||||||
Balance at December 31, 2011: | $ | 11,312 | $ | 3,544 | $ | — | ||||||
|
|
|
|
|
| |||||||
Store, administrative office and distribution facilities closure liabilities:
The Company maintains reserves for closed stores and other properties that are no longer utilized in current operations. The Company accrues for closed property operating lease liabilities using a credit-adjusted discount rate to calculate the present value of the remaining non-cancelable lease payments, contractual occupancy costs and lease termination fees after the closing date, net of estimated sublease income. The closed property lease liabilities are expected to be paid over the remaining lease terms, which currently extend through April 23, 2023. The Company estimates sublease income and future cash flows based on the Company’s experience and knowledge of the market in which the closed property is located, the Company’s previous efforts to dispose of similar assets and existing economic conditions. Adjustments to closed property reserves are made to reflect changes in estimated sublease income or actual contracted exit costs, which vary from original estimates, and are made for material changes in estimates in the period in which the changes become known.
Revisions to estimates in closure reserves for stores and administrative office and distribution facilities include changes in the estimates of sublease agreements, changes in assumptions of various store and office closure activities, changes in assumed leasing arrangements and actual exit costs since the inception of the exit activities. Revisions to estimates and additions or accretions to closure reserves for stores and administrative office and distribution facilities are included in “Selling, general and administrative expenses” on the accompanying Consolidated Statements of Income for the years ended December 31, 2011, 2010 and 2009.
The cumulative amount incurred in closure reserves for stores from the inception of the exit activity through December 31, 2011, was $24.4 million. The cumulative amount incurred in administrative office and distribution facilities from the inception of the exit activity through December 31, 2011, was $9.8 million. The balance of both these reserves is included in “Other current liabilities” and “Other liabilities” on the accompanying Consolidated Balance Sheets.Sheets based upon the dates when the reserves are expected to be settled.
Employee separation liabilities:
The Company had previously maintained a reserve for employee separation liabilities. Employee separation liabilities represented costs for anticipated payments, including payments required under various pre-existing employment arrangements with acquired CSK employees, which existed at the time of the acquisition, related to the planned involuntary termination of employees performing overlapping or duplicative functions. The Company completed all restructuring activities related to these employee separation liabilities during 2011, and the reserve had no remaining balance as of December 31, 2011.
Revisions to estimates for employee separation liabilities included changes in assumptions surrounding the timing required to consolidate certain duplicative administration functions since the inception of the exit activities. Revisions to estimates and additions or accretions to employee separation liabilities are included in “Selling, general and administrative expenses” on the accompanying Consolidated Statements of Income for the years ended December 31, 2011, 2010 and 2009.
The cumulative amount incurred for employee separation liabilities from the inception of the exit activity through December 31, 2011, was $29.2 million. The reserve balance for employee separation liabilities was included in “Accrued payroll” on the accompanying Consolidated Balance Sheets at December 31, 2010.
NOTE 7—DERIVATIVE INSTRUMENTS AND HEDGING ACTIVITIES
Historically, the Company entered into interest rate swap contracts with various counterparties to mitigate cash flow risk associated with floating interest rates on outstanding borrowings under its ABL Credit Facility. The fair valuevalues of the Company’s outstanding hedges were recorded as liabilities in the accompanying Consolidated Balance Sheets at December 31, 2010. The effective portion of the change in fair values of the Company’s cash flow hedges was recorded as a component of “Accumulated other comprehensive loss” in the accompanying Consolidated Balance Sheets at December 31, 2010; any ineffectiveness was recognized in “Other income (expense)” in the accompanying Consolidated Statements of Income in the period of ineffectiveness. The interest rate swap contracts were designated as cash flow hedges with interest payments designed to offset the interest payments for borrowings under the ABL Credit Facility that corresponded with the notional amounts of the swaps. On January 14, 2011, the ABL Credit Facility was retired concurrent with the issuance of the Company’s 4.875% Senior Notes due 2021 and all interest rate swap contracts were terminated at the Company’s request. The Company recognized a charge of $4.2 million related to the termination of the interest rate swap contracts, which was included as a component of “Other income (expense)” in the accompanying Consolidated Statements of Income for the year ended December 31, 2011. As of December 31, 2011, the Company did not hold any instruments that qualified as cash flow hedge derivatives. During 2010, one interest rate swap contract was terminated at the Company’s request and was deemed to be ineffective as of the termination date. The Company recognized $0.1 million in “Other income (expense)” on the accompanying Consolidated Statements of Income for the year ended December 31, 2010, as a result of this hedge ineffectiveness.
The table below outlines the effects the Company’s derivative financial instruments had on its Consolidated Balance Sheets as of December 31, 2011 and 2010 (in thousands):
| Fair Value of Derivative, Recorded as Payable to Counterparties in “Other current liabilities” | Fair Value of Derivative, Tax Effect | Amount of Loss Recognized in Accumulated Other Comprehensive Loss on Derivative, net of tax | ||||||||||||||||||||||
| Derivatives Designated as Hedging Instruments | December 31, 2011 | December 31, 2010 | December 31, 2011 | December 31, 2010 | December 31, 2011 | December 31, 2010 | ||||||||||||||||||
Interest rate swap contracts | $ | — | $ | 4,845 | $ | — | $ | 1,875 | $ | — | $ | 2,970 | ||||||||||||
The table below outlines the effects the Company’s derivative financial instruments had on its Consolidated Statements of Income for the years ended December 31, 2011, 2010 and 2009 (in thousands):
Location and Amount of Loss Recognized in Income on Derivatives | ||||||||||||||
| Derivatives Designated as Hedging Instruments | Year ended December 31, | |||||||||||||
Classification | 2011 | 2010 | 2009 | |||||||||||
Interest rate swap contracts | Other income (expense) | $ | (4,237 | ) | $ | (65 | ) | $ | — | |||||
NOTE 8—WARRANTIES
The Company provides warranties on certain merchandise it sells with warranty periods ranging from 30 days to limited lifetime warranties. Estimated warranty costs are based on the discounted net present valuehistorical failure rate of each individual product line and are recorded as obligations. The Company’s historical experience has been that failure rates are relatively consistent over time and that the ultimate cost of warranty claims to the Company has been driven by volume of units sold as opposed to fluctuations in failure rates or the variation of the swap using third party quotes (Level 2). Changes in fair market value are recorded in “Other comprehensive income (loss)”, and changes resulting from ineffectiveness are recorded in current earnings.
cost of individual claims. The fair value of the Company’s interest rate contracts is included in the tables below (in thousands):
| December 31, 2010 | ||||||||||||||||
| Quoted Prices in Active Markets for Identical Assets (Level 1) | Significant Other Observable Inputs (Level 2) | Significant Unobservable Inputs (Level 3) | Total
| |||||||||||||
Derivative contracts | $ | — | $ | (4,845 | ) | $ | — | $ | (4,845 | ) | ||||||
| December 31, 2009 | ||||||||||||||||
| Quoted Prices in Active Markets for Identical Assets (Level 1) | Significant Other Observable Inputs (Level 2) | Significant Unobservable Inputs (Level 3) | Total
| |||||||||||||
Derivative contracts | $ | — | $ | (13,053 | ) | $ | — | $ | (13,053 | ) | ||||||
Asset-based revolving credit facility:
The Company has determined that the estimated fair value of its Credit Facility (see Note 4) approximates the carrying amount of $356.0 million and $678.8 million at December 31, 2010, and December 31, 2009, respectively, whichproduct warranty liabilities are included in “Long-term debt, less current portion”“Other liabilities” on the accompanying Consolidated Balance Sheets. These valuations were determined by consulting investment bankers, the Company’s observationsSheets as of the value tendered by counterparties moving intoDecember 31, 2011 and out of the facility and an analysis of2010.
The following table identifies the changes in credit spreadsthe Company’s aggregate product warranty liabilities for comparable companies in the industry (Level 2).years ended December 31, 2011 and 2010 (in thousands):
| 2011 | 2010 | |||||||
Balance at January 1, | $ | 22,429 | $ | 19,637 | ||||
Warranty claims | (46,779 | ) | (44,791 | ) | ||||
Warranty accruals | 45,992 | 47,583 | ||||||
|
|
|
| |||||
Balance December 31, | $ | 21,642 | $ | 22,429 | ||||
|
|
|
| |||||
NOTE 109—ACCUMULATED OTHER COMPREHENSIVE LOSSSHAREHOLDERS’ EQUITY
Preferred stock:
The Company is authorized to issue 5.0 million shares of preferred stock at $0.01 par value per share. No preferred stock was issued or outstanding as of December 31, 2011 or 2010.
Common Stock:
The Company is authorized to issue 245.0 million shares of common stock at $0.01 par value per share. The Company had common stock issued and outstanding of 127.2 million and 141.0 million as of December 31, 2011 and 2010, respectively.
Share repurchase program:
On January 11, 2011, the Company’s Board of Directors approved a $500 million share repurchase program. Under the program, the Company may, from time to time, repurchase shares of its common stock, solely through open market purchases effected through a broker dealer at prevailing market prices, based on a variety of factors such as price, corporate trading policy requirements and overall market conditions, for a three-year period. The Company’s Board of Directors approved resolutions to increase the authorization under the share repurchase program by an additional $500 million on August 5, 2011, and an additional $500 million on November 16, 2011, raising the cumulative authorization under the share repurchase program to $1.5 billion. Each additional $500 million authorization is effective for a three-year period, expiring on August 5, 2014, and November 16, 2014, respectively. The Company and its Board of Directors may increase or otherwise modify, renew, suspend or terminate the share repurchase program at any time, without prior notice.
The Company repurchased 15.9 million shares of its common stock under its publicly announced share repurchase program during the year ended December 31, 2011, at an average price per share of $61.49, for a total investment of $976.6 million. As of December 31, 2011, the Company had $523.7 million remaining under its share repurchase program. From January 1, 2012, through and including February 28, 2012, the Company repurchased 0.6 million shares of its common stock at an average price of $83.39, for a total investment of $48.4 million.
Accumulated other comprehensive loss:
Unrealized holding gains on available-for-sale securities, consistinglosses, net of the Company’s investment in CSK common stock prior to the Company’s completion of the acquisition of CSK (see Note 2), as well as unrealized lossestax, from interest rate swapsswap contracts that qualifyqualified as cash flow hedges arewere included in “Accumulated other comprehensive loss” on the accompanying Consolidated Balance Sheets. Sheets as of December 31, 2010, as discussed in Notes 5 and 7.
The adjustment tofollowing table identifies the changes in “Accumulated other comprehensive loss” foron the year ended December 31, 2010, totaled $8.2 million with a corresponding tax liability of $3.2 million resulting in a net of tax effect of $5.0 million. The adjustment to “Accumulated other comprehensive loss” for the year ended December 31, 2009, totaled $5.8 million with a corresponding tax liability of $2.3 million resulting in a net of tax effect of $3.6 million. During the year ended December 31, 2010, $0.1 million was reclassified from “Accumulated other comprehensive loss” into earnings due to the ineffectiveness of an interest rate swap contract which was terminated on September 16, 2010 (see Note 8). Changes in “Accumulated other comprehensive loss”, net of tax,accompanying Consolidated Balance Sheets for the years ended December 31, 2011, 2010 2009 and 2008, consisted of the following2009 (in thousands):
| Unrealized Gains (Losses) on Securities | Unrealized Losses on Cash Flow Hedges | Accumulated Other Comprehensive Loss | ||||||||||
Balance at December 31, 2007 | $ | (6,800 | ) | $ | — | $ | (6,800 | ) | ||||
Period change | 6,800 | (11,513 | ) | (4,713 | ) | |||||||
Balance at December 31, 2008 | — | (11,513 | ) | (11,513 | ) | |||||||
Period change | — | 3,551 | 3,551 | |||||||||
Balance at December 31, 2009 | — | (7,962 | ) | (7,962 | ) | |||||||
Period change | — | 4,992 | 4,992 | |||||||||
Balance at December 31, 2010 | $ | — | $ | (2,970 | ) | $ | (2,970 | ) | ||||
| Accumulated Other Comprehensive Loss | ||||
Balance at December 31, 2008 | $ | (11,513 | ) | |
Unrealized losses on cash flow hedges, net of tax | 3,551 | |||
|
| |||
Balance at December 31, 2009 | (7,962 | ) | ||
Unrealized losses on cash flow hedges, net of tax | 4,992 | |||
|
| |||
Balance at December 31, 2010 | (2,970 | ) | ||
Reclassification adjustment for unrealized losses on cash flow hedges, net of tax, included in net income | 2,970 | |||
|
| |||
Balance at December 31, 2011 | $ | — | ||
|
| |||
Comprehensive income is computed as net earnings plus certain other items that are recorded directly to shareholders’ equity during the period. The Company’s comprehensive income for the years ended December 31, 2011, 2010 and 2009, included net earnings, as well as changes in unrealized losses on cash flow hedges. Comprehensive income for the years ended December 31, 2011, 2010 and 2009, and 2008, was $510.6 million, $424.4 million $311.0 million and $181.5$311.0 million, respectively.
NOTE 11—10—SHARE-BASED EMPLOYEE COMPENSATION PLANS AND OTHER COMPENSATION AND BENEFIT PLANS
The Company recognizes share-based compensation expense based on the fair value of the grants, awards or shares at the time of the grant, award or issuance. Share-based payments includecompensation includes stock option awards issued under the Company’s employee stock option planincentive plans and director stock option plan, restricted stock awarded under the Company’s employee incentive plans, performance incentive plan and director stock plan, stock issued through the Company’s employee stock purchase plan and stock issuedawarded to employees through other benefit programs.
The table below identifies the shares that have been authorized for issuance and the shares available for future issuance under the Company plans, as of December 31, 2011 (in thousands):
Plans | Total Shares Authorized for Issuance under the Plans | Shares Available for Future Issuance under the Plans | ||||||
Employee Incentive Plans | 34,000 | 7,703 | ||||||
Director Stock Plan | 1,000 | 277 | ||||||
Performance Incentive Plan | 650 | 390 | ||||||
Employee Stock Purchase Plan | 4,250 | 1,116 | ||||||
Profit Sharing and Savings Plan | 4,200 | 349 | ||||||
Stock options:
The Company’s employee stock-based incentive plans provide for the granting of stock options for the purchase of the common stock of the Company to certain key employees of the Company for the purchase of commonCompany. Employee stock of the Company. A total of 34,000,000 shares have been authorized for issuance under these plans. Optionsoptions are granted at an exercise price that is equal to the closing market price of the Company’s common stock on the date of the grant. OptionsEmployee stock options granted under the plans expire after ten years and typically vest 25% aper year, over four years. The Company records compensation expense for the grant date fair value of the option awards, adjusted for estimated forfeitures, evenly over the vesting period underperiod.
The table below identifies the straight-line method.
A summary of the shares subject to currently issued and outstandingemployee stock optionsoption activity under these plans are as follows:during the year ended December 31, 2011:
| Shares | Weighted- Average Exercise Price | Weighted- Average Remaining Contractual Terms (in years) | Aggregate Intrinsic Value (in thousands) | Shares (in thousands) | Weighted- Average Exercise Price | Average Remaining Contractual Terms (in years) | Aggregate Intrinsic Value (in thousands) | |||||||||||||||||||||||||
Outstanding at December 31, 2009 | 9,724,879 | $ | 26.57 | |||||||||||||||||||||||||||||
Outstanding at December 31, 2010 | 8,255 | $ | 30.37 | |||||||||||||||||||||||||||||
Granted | 1,480,375 | 47.64 | 1,672 | 63.15 | ||||||||||||||||||||||||||||
Exercised | (2,248,650 | ) | 24.55 | (1,818 | ) | 26.97 | ||||||||||||||||||||||||||
Forfeited | (701,750 | ) | 32.78 | (716 | ) | 42.96 | ||||||||||||||||||||||||||
|
| |||||||||||||||||||||||||||||||
Outstanding at December 31, 2010 | 8,254,854 | $ | 30.37 | 6.78 | $ | 248,031 | ||||||||||||||||||||||||||
Outstanding at December 31, 2011 | 7,393 | $ | 37.41 | 6.68 | $ | 314,531 | ||||||||||||||||||||||||||
|
|
|
| |||||||||||||||||||||||||||||
Vested or expected to vest at December 31, 2010 | 7,430,477 | $ | 29.53 | 6.59 | $ | 229,497 | ||||||||||||||||||||||||||
Vested or expected to vest at December 31, 2011 | 6,876 | $ | 36.35 | 6.54 | $ | 299,798 | ||||||||||||||||||||||||||
|
|
|
| |||||||||||||||||||||||||||||
Exercisable at December 31, 2010 | 4,147,534 | $ | 25.36 | 5.24 | $ | 145,409 | ||||||||||||||||||||||||||
Exercisable at December 31, 2011 | 3,878 | $ | 27.51 | 5.15 | $ | 203,379 | ||||||||||||||||||||||||||
|
|
|
| |||||||||||||||||||||||||||||
The Company’s director stock plan provides for the granting of stock options for the purchase of the common stock of the Company maintains a stock based incentive plan forto directors of the Company pursuant to which the Company may grantCompany. Director stock options and/or restricted stock awards. A total of 1,000,000 shares of common stock have been authorized for issuance under this plan. Options are granted at an exercise price that is equal to the closing market valueprice of the Company’s common stock on the date of the grant. OptionsDirector stock options granted under the planplans expire after seven years and vest fully after six months. The Company records compensation expense for the grant date fair value of the option awards evenly over the vesting period underperiod.
The table below identifies the straight-line method. A summary of the shares subject to currently issued and outstandingdirector stock optionsoption activity under this plan is as follows:
| Shares | Weighted- Average Exercise Price | Weighted- Average Remaining Contractual Terms (in years) | Aggregate Intrinsic Value (in thousands) | |||||||||||||
Outstanding at December 31, 2009 | 205,000 | $ | 26.39 | |||||||||||||
Granted | 25,000 | 48.31 | ||||||||||||||
Exercised | (90,000 | ) | 21.52 | |||||||||||||
Forfeited | — | — | ||||||||||||||
Outstanding at December 31, 2010 | 140,000 | $ | 33.43 | 4.20 | $ | 3,778 | ||||||||||
Vested or expected to vest at December 31, 2010 | 140,000 | $ | 33.43 | 4.20 | $ | 3,778 | ||||||||||
Exercisable at December 31, 2010 | 140,000 | $ | 33.43 | 4.20 | $ | 3,778 | ||||||||||
At December 31, 2010, approximately 8,667,000 and 285,000 shares were available for future grants under the employee stock option plan and director stock option plan, respectively. Forduring the year ended December 31, 2010, the Company recognized stock option compensation expense related to these plans of $14.9 million and a corresponding income tax benefit of $5.7 million. For the year ended December 31, 2009, the Company recognized stock option compensation expense related to these plans of $13.5 million and a corresponding income tax benefit of $5.2 million. For the year ended December 31, 2008, the Company recognized stock option compensation expense related to these plans of $8.0 million and a corresponding income tax benefit of $3.1 million.2011:
| Shares (in thousands) | Weighted- Average Exercise Price | Average Remaining Contractual Terms (in years) | Aggregate Intrinsic Value (in thousands) | |||||||||||||
Outstanding at December 31, 2010 | 140 | $ | 33.43 | |||||||||||||
Granted | — | — | ||||||||||||||
Exercised | (43 | ) | 29.85 | |||||||||||||
Forfeited | — | — | ||||||||||||||
|
|
|
| |||||||||||||
Outstanding at December 31, 2011 | 97 | $ | 35.00 | 3.77 | $ | 4,383 | ||||||||||
|
|
|
|
|
|
|
| |||||||||
Vested or expected to vest at December 31, 2011 | 97 | $ | 35.00 | 3.77 | $ | 4,383 | ||||||||||
|
|
|
|
|
|
|
| |||||||||
Exercisable at December 31, 2011 | 97 | $ | 35.00 | 3.77 | $ | 4,383 | ||||||||||
|
|
|
|
|
|
|
| |||||||||
The fair value of each stock option grantaward is estimated on the date of the grant using the Black-Scholes option pricing model. The Black-Scholes model requires the use of assumptions, including expected volatility, expected life, the risk free rate, expected life, expected volatility and the expected dividend yield. Expected volatility is based upon
| • | Risk-free interest rate– The United States Treasury rates in effect at the time the options are granted for the options’ expected life. |
| • | Expected life – Represents the period of time that options granted are expected to be outstanding. The Company uses historical experience to estimate the expected life of options granted. |
| • | Expected volatility – Measure of the amount by which the Company’s stock price has historically fluctuated. |
| • | Expected dividend yield – The Company has not paid, nor does it have plans in the foreseeable future to pay, any dividends. |
The table below identifies the historical volatility of the Company’s stock. Expected life represents the period of time that options granted are expected to be outstanding. The Company uses historical data and experience to estimate the expected life of options granted. The risk free interest rates for periods within the contractual life of the options are based on the United States Treasury rates in effect at the time the options are granted for the options’ expected life.
The following weighted-average assumptions were used for grants issued for the years ended December 31, 2010, 2009 and 2008:
| 2010 | 2009 | 2008 | ||||||||||
Risk-free interest rate | 1.67 | % | 2.04 | % | 2.91 | % | ||||||
Expected life | 4.3 years | 4.7 years | 4.2 years | |||||||||
Expected volatility | 33.9 | % | 33.0 | % | 26.8 | % | ||||||
Expected dividend yield | 0 | % | 0 | % | 0 | % | ||||||
The weighted-average grant-date fair value of options grantedawarded during the years ended December 31, 2011, 2010 2009 and 2008, were $14.24, $11.10 and $7.01, respectively. 2009:
| December 31, | ||||||||||||
| 2011 | 2010 | 2009 | ||||||||||
Risk-free interest rate | 1.16 | % | 1.67 | % | 2.04 | % | ||||||
Expected life | 3.7 Years | 4.3 Years | 4.7 Years | |||||||||
Expected volatility | 33.3 | % | 33.9 | % | 33.0 | % | ||||||
Expected dividend yield | — | % | — | % | — | % | ||||||
The total intrinsic valueCompany’s forfeiture rate is the estimated percentage of options exercised duringawarded that are expected to be forfeited or cancelled prior to becoming fully vested. The Company’s estimate is evaluated periodically, is based upon historical experience at the years endedtime of evaluation and reduces expense ratably over the vesting period.
The following table summarizes activity related to stock options awarded by the Company for the periods ending December 31, 2011, 2010 2009 and 2008 were $60.0 million, $30.0 million and $6.6 million, respectively. The Company recorded cash received from the exercise of stock options of $56.9 million, $54.3 million and $18.6 million, in the years ended December 31, 2010, 2009 and 2008, respectively. 2009:
| For the Years Ended December 31, | ||||||||||||
| 2011 | 2010 | 2009 | ||||||||||
Compensation expense for stock options awarded (in millions) | $ | 17.6 | $ | 14.9 | $ | 13.5 | ||||||
Income tax benefit from compensation expense related to stock options (in millions) | 6.8 | 5.7 | 5.2 | |||||||||
Total intrinsic value of stock options exercised (in millions) | 71.5 | 60.0 | 30.0 | |||||||||
Cash received from exercise of stock options (in millions) | 50.3 | 56.9 | 54.3 | |||||||||
Weighted-average grant-date fair value of options awarded | $ | 16.93 | $ | 14.24 | $ | 11.10 | ||||||
Weighted-average remaining contractual life of exercisable options (in years) | 5.12 | 5.21 | 5.21 | |||||||||
The remaining unrecognized compensation expense related to unvested stock option awards at December 31, 2010,2011, was $37.2$39.6 million and the weighted-average period of time over which this expensecost will be recognized is 2.692.8 years. The weighted-average remaining contractual life of options currently exercisable at December 31, 2010, 2009 and 2008, was 5.21, 5.21 and 4.90 years, respectively.
Performance incentive planRestricted stock:
The Company has in effect aCompany’s performance incentive plan provides for the Company’saward of shares of restricted stock to its corporate and senior management under which the Company awards shares of restricted stock that vest equallyevenly over a three-year period and are held in escrow until such vesting has occurred. SharesGenerally, unvested shares are forfeited when an employee ceases employment. A totalThe fair value of 650,000 shares of common stock have been authorized for issuance under this plan. Shares awarded under this plan are valuedis based on the closing market price of the Company’s common stock on the date of grantaward and compensation expense is recorded evenly over the vesting period.
The Company recorded $0.9 million of compensation expense fortable below identifies the employee restricted stock activity under this plan forduring the year ended December 31, 2010,2011:
| Shares (in thousands) | Weighted- Average Grant- Date Fair Value | |||||||
Non-vested at December 31, 2010 | 34 | $ | 38.30 | |||||
Granted during the period | 42 | 55.48 | ||||||
Vested during the period(1) | (33 | ) | 44.27 | |||||
Forfeited during the period | (3 | ) | 47.51 | |||||
|
|
|
| |||||
Non-vested at December 31, 2011 | 40 | $ | 50.72 | |||||
|
|
|
| |||||
| (1) | Includes 11.3 million shares withheld to cover Team Members’ taxes upon vesting. |
The Company’s director stock plan provides for the award of shares of restricted stock that vest evenly over a three-year period and recognizedare held in escrow until such vesting has occurred. Generally, unvested shares are forfeited when a corresponding income tax benefitdirector ceases their service on the Company’s Board of $0.4 million.Directors. The Company recorded $0.5 millionfair value of shares awarded under this plan is based on the closing market price of the Company’s common stock on the date of award and compensation expense foris recorded evenly over the vesting period.
The table below identifies the director restricted stock activity under this plan forduring the year ended December 31, 2009, and recognized a corresponding income tax benefit of $0.2 million. 2011:
| Shares (in thousands) | Weighted- Average Grant- Date Fair Value | |||||||
Non-vested at December 31, 2010 | — | $ | — | |||||
Granted during the period | 8 | 59.65 | ||||||
Vested during the period | — | — | ||||||
Forfeited during the period | — | — | ||||||
|
|
|
| |||||
Non-vested at December 31, 2011 | 8 | $ | 59.65 | |||||
|
|
|
| |||||
The following table summarizes activity related to restricted stock awarded by the Company recorded $0.5 million of compensation expense for this plan for the year endedperiods ending December 31, 2008,2011, 2010 and recognized a corresponding income tax benefit of $0.2 million. The total fair value (at vest date) of shares vested for the years ended December 31, 2010, 2009 and 2008, were $1.6 million, $0.7 million and $0.5 million, respectively. 2009:
| For the Years Ended December 31, | ||||||||||||
| 2011 | 2010 | 2009 | ||||||||||
Compensation expense for restricted shares awarded (in millions) | $ | 1.7 | $ | 0.9 | $ | 0.5 | ||||||
Income tax benefit from compensation expense related to restricted shares (in millions) | 0.6 | 0.4 | 0.2 | |||||||||
Total fair value of restricted shares at vest date (in millions) | $ | 2.6 | $ | 1.6 | $ | 0.7 | ||||||
Shares awarded under the plans (in thousands) | 49.9 | 41.1 | 21.8 | |||||||||
Average grant-date fair value of shares awarded under the plans | $ | 56.18 | $ | 39.57 | $ | 33.36 | ||||||
The remaining unrecognized compensation expense related to unvested restricted share awards at December 31, 2010,2011, was $1.3 million. The Company awarded 41,134 shares under$2.5 million and the weighted-average period of time over which this plan in 2010 with an average grant-date fair value of $39.57. The Company awarded 21,773 shares under this plan in 2009 with an average grant-date fair value of $33.36. The Company awarded 16,830 shares under this plan in 2008 with an average grant-date fair value of $26.96. Compensation expense for shares awardedcost will be recognized is recognized over the three-year vesting period. Changes in the Company’s restricted stock for the year ended December 31, 2010, were as follows:
| Shares | Weighted- Average Grant-Date Fair Value | |||||||
Non-vested at December 31, 2009 | 19,532 | $ | 31.65 | |||||
Granted during the period | 41,134 | 39.57 | ||||||
Vested during the period | (26,037 | ) | 35.35 | |||||
Forfeited during the period | (996 | ) | 37.35 | |||||
Non-vested at December 31, 2010 | 33,633 | $ | 38.30 | |||||
At December 31, 2010, approximately 418,000 shares were reserved for future issuance under this plan.1.9 years.
Employee stock purchase plan:
The Company’s employee stock purchase plan (the “ESPP”) permits all eligible employees to purchase shares of the Company’s common stock at 85% of the fair market value. ParticipantsEmployees may authorize the Company to withhold up to 5% of their annual salary to participate in the plan. The stock purchase plan authorizes up to 4,250,000fair value of shares to be granted. During the year ended December 31, 2010, the Company issued 152,910 shares under the purchase plan at a weighted-average priceESPP is based on the average of $40.86 per share. During the year ended December 31, 2009,high and low market prices of the Company issued 178,523 shares underCompany’s common stock during the purchase plan at a weighted average price of $30.47 per share. During the year ended December 31, 2008, the Company issued 208,293 shares under the purchase plan at a weighted average price of $22.61 per share.offering periods. Compensation expense is recognized based on the discount between the grant dategrant-date fair value and the employee purchase price for the shares sold to employees. During the year ended December 31, 2010, the Company recorded $1.1 million of compensation expense
The following table summarizes activity related to the employee share purchases with a corresponding income tax benefit of $0.4 million. DuringCompany’s ESPP for the year endedperiods ending December 31, 2009, the Company recorded $1.0 million of compensation expense related to employee share purchases with a corresponding income tax benefit of $0.4 million. During the year ended December 31, 2008, the Company recorded $0.8 million of compensation expense related to employee share purchases with a corresponding income tax benefit of $0.3 million. At December 31,2011, 2010 approximately 1,251,000 shares were reserved for future issuance under this plan.
| For the Years Ended December 31, | ||||||||||||
| 2011 | 2010 | 2009 | ||||||||||
Compensation expense for shares issued under the ESPP (in millions) | $ | 1.3 | $ | 1.1 | $ | 1.0 | ||||||
Income tax benefit from compensation expense for shares issued under the ESPP (in millions) | $ | 0.5 | $ | 0.4 | $ | 0.4 | ||||||
Shares issued under the ESPP (in thousands) | 134.5 | 152.9 | 178.5 | |||||||||
Weighted-average price of shares issued under the ESPP | $ | 53.93 | $ | 40.86 | $ | 30.47 | ||||||
Other employee benefit plans:Profit sharing and savings plan:
The Company sponsors a contributory profit sharing and savings plan that covers substantially all employees who are at least 21 years of age and have at least six months of service. The Company makes matching contributions equal to 100% of the first 2% of each employee’s wages that are contributed and 25% of the next 4% of each employee’s wages that are contributed. The Company may also make additional discretionary profit sharing contributions to the plan on an annual basis as determined by the Board of Directors. Beginning in the fourth quarter of 2009, the Company’s matching and discretionary profit sharing contributions under this plan arebegan being funded in the form of cash. Prior to that time, the Company’s matching and discretionary profit sharing contributions under this plan were funded in the form of the Company’s common stock. A total of 4,200,000 shares of common stock have been authorized for issuance under this plan. During the year ended December 31, 2010, theThe Company did not record any share based compensation expense for contributions to this plan. Duringplan for the yearyears ended December 31, 2009, the2011 or 2010. The Company recorded $6.8 million of share based compensation expense for contributions to this plan withfor the year ended December 31, 2009, and recognized a corresponding income tax benefit of $2.7 million. During the year ended December 31, 2008, the Company recorded $4.2 million of share based compensation expense for contributions to this plan with a corresponding income tax benefit of $1.6 million. The Company did not issue any shares under this plan infor the years ended December 31, 2011 or 2010. The Company issued 193,1270.2 million shares in 2009 to fund matching contributions for the year ended December 31, 2009, at an average grant date fair value of $35.37. The Company issued 321,162 shares in 2008did not make any discretionary contributions to fund the 2007 profit sharingProfit Sharing and matching contributions at an average grant date fair value of $26.72. AtSavings Plan during the years ended December 31, 2011, 2010 approximately 349,000 shares were reserved for future issuance under this plan; however, theor 2009. The Company does not anticipate funding the plan with the issuance of shares in the future.
On July 11, 2008, in conjunction with
NOTE 11—COMMITMENTS
Operating lease commitments:
The Company leases certain office space, retail stores, property and equipment under long-term, non-cancelable operating leases. Most of these leases include renewal options and some include options to purchase, provisions for percentage rent based on sales and/or incremental step increase provisions.
The following table identifies the acquisitionfuture minimum lease payments under all of CSK (see Note 2), the Company became the sponsor for a 401(k) plan that was available to all CSK team members who are at least 21 years of age. The Company’s matching contributions from the July 11, 2008, acquisition date through December 31, 2008, totaled $0.9 million. The CSK 401(k) plan was merged with the Company’s profit sharing and savings plan effective January 1, 2009.
Supplemental retirement plan agreement:
In conjunction with the CSK acquisition, the Company assumed a supplemental executive retirement plan agreement with CSK’s former Chairman and Chief Executive Officer, Maynard Jenkins, which provides supplemental retirement benefitsoperating leases for a period of 10 years beginning on the first anniversaryeach of the effective date of termination of his employment. Mr. Jenkins retired on August 15, 2007. The benefit amountnext five years and in this agreement is fully vested and payable to Mr. Jenkins at a rate of $0.6 million per annum. The Company has accrued the entire present value of this obligation of approximately $4 million as of the July 11, 2008, acquisition date. A payment of $0.6 million was made to Mr. Jenkins in 2010, 2009 and between July 11, 2008, the acquisition date, and December 31, 2008. The total amount paid to Mr. Jenkins for the supplemental executive retirement plan agreement,aggregate as of December 31, 2010, was $1.8 million.2011 (in thousands):
NOTE 12—EARNINGS PER SHARE
| Related Parties | Non-related Parties | Total | ||||||||||
2012 | $ | 4,406 | $ | 222,052 | $ | 226,458 | ||||||
2013 | 4,346 | 206,244 | 210,590 | |||||||||
2014 | 4,257 | 185,968 | 190,225 | |||||||||
2015 | 3,587 | 158,511 | 162,098 | |||||||||
2016 | 3,119 | 132,756 | 135,875 | |||||||||
Thereafter | 12,555 | 713,154 | 725,709 | |||||||||
|
|
|
|
|
| |||||||
Total | $ | 32,270 | 1,618,685 | 1,650,955 | ||||||||
|
|
|
|
|
| |||||||
The future minimum lease payments under the Company’s operating leases, in the table above, do not include potential amounts for percentage rent or other operating lease related costs and have not been reduced by expected future minimum sublease income. Expected future minimum sublease income under non-cancelable subleases is approximately $14.5 million at December 31, 2011.
The following table sets forthidentifies the computation of basic and diluted earnings per sharenet rent expense amounts for the years ended December 31, 2011, 2010 and 2009:
| For the Years Ended December 31, | ||||||||||||
| 2011 | 2010 | 2009 | ||||||||||
Minimum operating lease expense | $ | 226,158 | $ | 221,540 | $ | 220,686 | ||||||
Contingent rents | 534 | 903 | 364 | |||||||||
Other lease related occupancy costs | 8,821 | 9,352 | 10,241 | |||||||||
|
|
|
|
|
| |||||||
Total rent expense | 235,513 | 231,795 | 231,291 | |||||||||
Less: sublease income | (4,616 | ) | (4,916 | ) | (2,157 | ) | ||||||
|
|
|
|
|
| |||||||
Net rent expense | $ | 230,897 | $ | 226,879 | $ | 229,134 | ||||||
|
|
|
|
|
| |||||||
Other commitments:
As of December 31, 2011, the Company had construction commitments in the amount of $41.6 million.
As of December 31, 2011, the Company had outstanding letters of credit, primarily to satisfy workers’ compensation, general liability and other insurance policies, in the amount of $59.9 million (see Note 5).
NOTE 12—LEGAL MATTERS
O’Reilly Litigation:
O’Reilly is currently involved in litigation incidental to the ordinary conduct of the Company’s business. The Company records reserves for litigation losses in instances where a material adverse outcome is probable and the Company is able to reasonably estimate the probable loss. The Company reserves for an estimate of material legal costs to be incurred in pending litigation matters. Although the Company cannot ascertain the amount of liability that it may incur from any of these matters, it does not currently believe that, in the aggregate, these matters, taking into account applicable insurance and reserves, will have a material adverse effect on its consolidated financial position, results of operations or cash flows in a particular quarter or annual period.
In addition, O’Reilly is involved in resolving governmental investigations that were being conducted against CSK and CSK’s former officers and other litigation, prior to its acquisition by O’Reilly, as described below.
CSK Pre-Acquisition Matters – Governmental Investigations and Actions:
As previously reported, the governmental investigations of CSK regarding its legacy pre-acquisition accounting practices have concluded.
CSK’s former Controller and its former Director of Credit and Receivables pled guilty to obstruction of justice on April 7, 2009 and 2008 (in thousands, except per share data):April 15, 2009, respectively, as previously reported. They were sentenced on November 7, 2011. CSK’s former Chief Financial Officer was sentenced, as previously reported, on September 19, 2011. No appeal followed. Accordingly, with the sentencing on November 7, 2011, criminal proceedings against former CSK employees have reached finality.
| Years ended December 31, | ||||||||||||
| 2010 | 2009 | 2008 | ||||||||||
Numerator (basic and diluted): | ||||||||||||
Net income | $ | 419,373 | $ | 307,498 | $ | 186,232 | ||||||
Denominator: | ||||||||||||
Weighted-average common shares outstanding – basic | 138,654 | 136,230 | 124,526 | |||||||||
Effect of stock options (See Note 11) | 2,348 | 1,651 | 887 | |||||||||
Effect of exchangeable notes (See Note 4) | 990 | 1 | — | |||||||||
Weighted-average common shares outstanding – assuming dilution | 141,992 | 137,882 | 125,413 | |||||||||
Earnings per share - basic | $ | 3.02 | $ | 2.26 | $ | 1.50 | ||||||
Earnings per share - assuming dilution | $ | 2.95 | $ | 2.23 | $ | 1.48 | ||||||
Incremental net shares forThe action filed by the exchange featureSEC on July 22, 2009, against Maynard L. Jenkins, the former Chief Executive Officer of CSK, seeking reimbursement from Mr. Jenkins of certain bonuses and stock sale profits pursuant to Section 304 of the NotesSarbanes-Oxley Act of 2002, as previously reported, has also reached finality. On November 16, 2011, the Court entered a Final Judgment which required Mr. Jenkins to reimburse $2.8 million to the Company as successor SEC issuer to CSK Auto Corp. Since entry of the Final Judgment, the payment obligation created thereunder has been satisfied and O’Reilly has recorded the reimbursement as an adjustment to operating income in the fourth quarter of 2011.
The previously reported SEC civil action for alleged misconduct related to CSK’s historical accounting practices against the former Chief Financial Officer, Controller and Director of Credit and Receivables of CSK, remains ongoing. However, on January 20, 2012, the parties filed a “Joint Report On Settlement Talks” wherein they report that offers of settlement had been made which would be presented to the Commission for its consideration and approval. The parties have requested a “complete litigation standstill” while the Commission considers the settlement offers made. Under Delaware law, the charter documents of the CSK entities, and certain indemnification agreements, CSK may have certain indemnification obligations in connection with the SEC civil action, and, as a result, O’Reilly is currently incurring legal fees in relation to the ongoing SEC litigation. Some of these indemnification obligations and other related costs may not be covered by CSK’s insurance policies.
As a result of the CSK acquisition, O’Reilly has incurred and expects to continue to incur additional legal fees and costs related to the indemnity obligations arising from the litigation commenced by the DOJ and SEC against CSK’s former employees until final resolution of the remaining matters. O’Reilly has a remaining reserve, with respect to the indemnification obligations of $14.1 million at December 31, 2011, which relates to both expected additional legal fees and costs and to the payment of those legal fees and costs already incurred.
The remaining litigation, as described above, is subject to uncertainty, and, given its complexity and scope, the final outcome cannot be predicted at this time. It is possible that in a particular quarter or annual period the Company’s results of operations and cash flows could be materially affected by an ultimate resolution of such matter, depending, in part, upon the results of operations or cash flows for such period. However, at this time, management believes that the ultimate outcome of the pending matters, after consideration of applicable reserves should not have a material adverse effect on the Company’s consolidated financial condition, results of operations or cash flows.
NOTE 13—RELATED PARTIES
The Company leases certain land and buildings related to 77 of its O’Reilly Auto Parts stores and one of its bulk facilities under fifteen- or twenty-year operating lease agreements with entities in which certain of the Company’s affiliated directors, members of an affiliated director’s immediate family or certain of the Company’s executive officers, are affiliated. Generally, these lease agreements provide for renewal options for an additional five years at the option of the Company and the lease agreements are periodically modified to further extend the lease term for specific stores under the agreements (see Note 4), were included in the diluted earnings per share calculation for11). Lease payments under these operating leases totaled $4.2 million, $4.4 million and $4.1 million during the years ended December 31, 2011, 2010 and December 31, 2009. The incremental net shares for2009, respectively. We believe that the exchange feature oflease agreements with the Notes were not included in the diluted earnings per share calculation for the year ended December 31, 2008, as the impact would have been antidilutive.affiliated entities are on terms comparable to those obtainable from third parties.
For the years ended December 31, 2010, 2009 and 2008, there were common stock equivalents which the Company did not include in the computation of diluted earnings per share. These common stock equivalents represent underlying stock options not included in the computation of diluted earnings per share, because the inclusion of such equivalents would have been antidilutive. The following table summarizes the antidilutive stock options as of December 31, 2010, 2009 and 2008 (in thousands):
| Years ended December 31, | ||||||||||||
| 2010 | 2009 | 2008 | ||||||||||
Antidilutive stock options | 1,373 | 1,587 | 7,441 | |||||||||
Weighted-average exercise price per share | $ | 48.15 | $ | 35.61 | $ | 28.97 | ||||||
NOTE 13—14—INCOME TAXES
Deferred income tax assets (liabilities):
Deferred income taxes reflect the net tax effects of temporary differences between the carrying amounts of assets and liabilities for financial reporting purposes and the amounts used for income tax purposes, and also include the tax effect of carry forwards. Significantcarryforwards.
The following table identifies significant components of the Company’s deferred tax assets and liabilities are as follows atof December 31, 2011 and 2010 (in thousands):
| December 31, | ||||||||
| 2011 | 2010 | |||||||
Deferred tax assets: | ||||||||
Current: | ||||||||
Allowance for doubtful accounts | $ | 1,933 | $ | 2,683 | ||||
Unrealized loss on cash flow hedges | — | 1,875 | ||||||
Net operating losses | — | 1,893 | ||||||
Tax credits | 541 | 5,437 | ||||||
Other accruals | 55,209 | 78,479 | ||||||
|
|
|
| |||||
Total current deferred tax assets: | $ | 57,683 | $ | 90,367 | ||||
Noncurrent: | ||||||||
Tax credits | 4,605 | 3,558 | ||||||
Net operating losses | 3,008 | 3,408 | ||||||
Other accruals | 50,855 | 20,464 | ||||||
|
|
|
| |||||
Total noncurrent deferred tax assets: | $ | 58,468 | $ | 27,430 | ||||
|
|
|
| |||||
Total deferred tax assets | $ | 116,151 | $ | 117,797 | ||||
Deferred tax liabilities: | ||||||||
Current: | ||||||||
Inventories | $ | 59,673 | $ | 56,490 | ||||
|
|
|
| |||||
Total current deferred tax liabilities: | $ | 59,673 | 56,490 | |||||
Noncurrent: | ||||||||
Property and equipment | 138,132 | 95,300 | ||||||
Other | 9,200 | 866 | ||||||
|
|
|
| |||||
Total noncurrent deferred tax liabilities: | 147,332 | 96,166 | ||||||
|
|
|
| |||||
Total deferred tax liabilities | 207,005 | 152,656 | ||||||
|
|
|
| |||||
Net deferred tax liabilities | $ | (90,854 | ) | $ | (34,859 | ) | ||
|
|
|
| |||||
The following table reconciles the above net deferred tax assets (liabilities) as presented on the accompanying Consolidated Balance Sheets as of December 31, 2011 and 2010 (in thousands):
| December 31, | ||||||||
| 2011 | 2010 | |||||||
Deferred tax assets - current | $ | 57,683 | $ | 90,367 | ||||
Deferred tax liabilities - current | (59,673 | ) | (56,490 | ) | ||||
|
|
|
| |||||
Deferred tax assets (liabilities) - current | (1,990 | ) | $ | 33,877 | ||||
Deferred tax assets - noncurrent | 58,468 | 27,430 | ||||||
Deferred tax liabilities - noncurrent | (147,332 | ) | (96,166 | ) | ||||
|
|
|
| |||||
Deferred tax assets (liabilities) - noncurrent | (88,864 | ) | $ | (68,736 | ) | |||
|
|
|
| |||||
Net deferred tax liabilities | $ | (90,854 | ) | $ | (34,859 | ) | ||
|
|
|
| |||||
Provision for income taxes:
The following table reconciles the “Provision for income taxes” included in the accompanying Consolidated Statements of Income for the years ended December 31, 2011, 2010 and 2009 (in thousands):
| 2010 | 2009 | |||||||
Deferred tax assets: | ||||||||
Current: | ||||||||
Allowance for doubtful accounts | $ | 2,683 | $ | 1,897 | ||||
Unrealized loss on cash flow hedges | 1,875 | 1,606 | ||||||
Net operating losses | 1,893 | 16,159 | ||||||
Tax credits | 5,437 | — | ||||||
Other accruals | 78,479 | 74,702 | ||||||
Noncurrent: | ||||||||
Tax credits | 3,558 | 9,202 | ||||||
Net operating losses | 3,408 | 4,016 | ||||||
Unrealized losses on cash flow hedges | — | 3,458 | ||||||
Other accruals | 20,464 | 31,375 | ||||||
Total deferred tax assets | 117,797 | 142,415 | ||||||
Deferred tax liabilities: | ||||||||
Current: | ||||||||
Inventories | 56,490 | 8,430 | ||||||
Noncurrent: | ||||||||
Property and equipment | 95,300 | 62,764 | ||||||
Other | 866 | 3,608 | ||||||
Total deferred tax liabilities | 152,656 | 74,802 | ||||||
Net deferred tax (liabilities) assets | $ | (34,859 | ) | $ | 67,613 | |||
2011 Federal State 2010 Federal State 2009 Federal State Current Deferred Total $ 228,443 $ 55,175 $ 283,618 25,537 (1,055 ) 24,482 $ 253,980 $ 54,120 $ 308,100 $ 146,259 $ 88,395 $ 234,654 24,484 10,862 35,346 $ 170,743 $ 99,257 $ 270,000 $ 121,919 $ 44,339 $ 166,258 17,100 6,042 23,142 $ 139,019 $ 50,381 $ 189,400
The provision for income taxes consists offollowing table outlines the following as of December 31, 2010, 2009 and 2008 (in thousands):
| Current | Deferred | Total | ||||||||||
2010: | ||||||||||||
Federal | $ | 146,259 | $ | 88,395 | $ | 234,654 | ||||||
State | 24,484 | 10,862 | 35,346 | |||||||||
| $ | 170,743 | $ | 99,257 | $ | 270,000 | |||||||
2009: | ||||||||||||
Federal | $ | 121,919 | $ | 44,339 | $ | 166,258 | ||||||
State | 17,100 | 6,042 | 23,142 | |||||||||
| $ | 139,019 | $ | 50,381 | $ | 189,400 | |||||||
2008: | ||||||||||||
Federal | $ | 90,544 | $ | 9,313 | $ | 99,857 | ||||||
State | 14,725 | 1,718 | 16,443 | |||||||||
| $ | 105,269 | $ | 11,031 | $ | 116,300 | |||||||
A reconciliation of the provision“Provision for income taxestaxes” amounts included in the accompanying Consolidated Statements of Income to the amounts computed at the federal statutory rate is as follows for the years ended December 31, 2011, 2010 2009 and 20082009 (in thousands):
| Years ended December 31, | ||||||||||||||||||||||||
| 2010 | 2009 | 2008 | 2011 | 2010 | 2009 | |||||||||||||||||||
Federal income taxes at statutory rate | $ | 241,281 | $ | 173,914 | $ | 105,887 | $ | 285,524 | $ | 241,281 | $ | 173,914 | ||||||||||||
State income taxes, net of federal tax benefit | 22,267 | 18,896 | 10,633 | 16,132 | 22,267 | 18,896 | ||||||||||||||||||
Other items, net | 6,452 | (3,410 | ) | (220 | ) | 6,444 | 6,452 | (3,410 | ) | |||||||||||||||
|
|
| ||||||||||||||||||||||
Total provision for income taxes | $ | 270,000 | $ | 189,400 | $ | 116,300 | $ | 308,100 | $ | 270,000 | $ | 189,400 | ||||||||||||
|
|
| ||||||||||||||||||||||
The excess tax benefit associated with the exercise of non-qualified stock options has been included within “Additional paid-in capital” inon the accompanying consolidated financial statements.
As of December 31, 2010,2011, the Company had tax credit carryforwards available for state tax purposes of $5.1 million. As of December 31, 2011, the Company had net operating loss carryforwards for federal income tax purposes of $5.4 million (for which a portion are also available for state tax purposes) and general business tax credit carry forwards available for federal and state tax purposes of $2.4 million and $4.1 million, respectively.$3.0 million. The Company also has an alternative minimum tax credit carry forward for federal tax purposes of $2.5 million. TheCompany’s state net operating loss carryforwards generally expire in years ranging from 2021 to 2027, and the Company’s tax credits generally expire in years ranging from 2019 to 2028. The alternative minimum tax credit carry forward doesdo not expire.
For the years ended December 31, 2010, 2009 and 2008, the Company had recorded a reserve for unrecognized tax benefits (including interest) of $41.3 million, $37.6 million and $34.3 million, respectively, of which $41.3 million, $37.6 million and $34.3 million would affect the Company’s effective tax rate if recognized, generally net of federal tax affect. The Company recognizes interest and penalties related to uncertain tax positions in income tax expense. As of the years ended December 31, 2010, 2009 and 2008, the Company had accrued approximately $4.6 million, $4.0 million and $3.9 million, respectively, of interest related to uncertain tax positions before the benefit of the deduction for interest on state and federal returns. During the years ended December 31, 2010, 2009 and 2008, the Company recorded tax expense related to an increase in its liability for interest of $1.5 million, $1.5 million and $1.4 million, respectively. Although unrecognized tax benefits for individual tax positions may increase or decrease during 2011, the Company expects a reduction of $3.1 million of unrecognized tax benefits during the one-year period subsequent to December 31, 2010, resulting from settlement or expiration of the statute of limitations.
The O’Reilly U.S. federal income tax returns for tax years 2007 and beyond remain subject to examination by the Internal Revenue Service (“IRS”). The IRS concluded an examination of the O’Reilly consolidated 2006 and 2007 federal income tax returns in the fourth quarter of 2009. The statute of limitations for the O’Reilly federal income tax returns for tax years 2006 and prior expired on September 15, 2010. The statute of limitations for the O’Reilly U.S. federal income tax return for 2007 will expire on September 15, 2011, unless otherwise extended. The IRS is currently conducting an examination of the O’Reilly consolidated return for the tax year 2008. The O’Reilly state income tax returns remain subject to examination by various state authorities for tax years ranging from 2001 through 2010.
CSK has had net operating losses in various years dating back to the tax year 1993. For CSK, the statute of limitation for a particular tax year for examination by the IRS is three years subsequent to the last year in which the loss carryover is finally used. The IRS completed an examination of the CSK consolidated federal tax return for the fiscal years ended January 30, 2005, January 29, 2006, February 4, 2007, and February 2, 2008. The statute of limitation for a particular tax year for examination by various states is generally three to four years subsequent to the last year in which the loss carryover is finally used.
Unrecognized tax benefits:
A summary ofThe following table summarizes the changes in the gross amount of unrecognized tax benefits, excluding interest and penalties, for the years ended December 31, 2011, 2010 2009 and 2008, is shown below2009 (in thousands):
| 2010 | 2009 | 2008 | ||||||||||
Balance as of January 1 | $ | 33,570 | $ | 30,400 | $ | 16,952 | ||||||
Addition based on tax positions related to the current year | 5,138 | 5,900 | 5,638 | |||||||||
Addition based on tax positions related to CSK acquisition | — | — | 8,620 | |||||||||
Reduction due to lapse of statute of limitations | (1,998 | ) | (2,730 | ) | (810 | ) | ||||||
Balance as of December 31 | $ | 36,710 | $ | 33,570 | $ | 30,400 | ||||||
Balance as of January 1, Additions based on tax positions related to the current year Additions based on tax positions related to prior years Reductions due to lapse of statute of limitations Balance as of December 31, NOTE 14—LEGAL MATTERS Years ended December 31, 2011 2010 2009 $ 36,710 $ 33,570 $ 30,400 7,308 5,138 5,900 4,060 — — (2,278 ) (1,998 ) (2,730 ) $ 45,800 $ 36,710 $ 33,570
For the years ended December 31, 2011, 2010 and 2009, the Company recorded a reserve for unrecognized tax benefits (including interest and penalties) of $53.0 million, $41.3 million and $37.6 million, respectively, of which $53.0 million, $41.3 million and $37.6 million would affect the Company’s effective tax rate if recognized, generally net of federal tax affect. The Company recognizes interest and penalties related to uncertain tax positions in income tax expense. As of the years ended December 31, 2011, 2010 and 2009, the Company had accrued approximately $7.2 million, $4.6 million and $4.0 million, respectively, of interest and penalties related to uncertain tax positions before the benefit of the deduction for interest on state and federal returns. During the years ended December 31, 2011, 2010 and 2009, the Company recorded tax expense related to an increase in its liability for interest and penalties of $3.9 million, $1.5 million and $1.5 million, respectively. Although unrecognized tax benefits for individual tax positions may increase or decrease during 2012, the Company expects a reduction of $4.0 million of unrecognized tax benefits during the one-year period subsequent to December 31, 2011, resulting from settlement or expiration of the statute of limitations. The Company’s United States federal income tax returns for tax years 2008 and beyond remain subject to examination by the Internal Revenue Service (“IRS”). The IRS concluded an examination of the O’Reilly Litigation:
O’Reillyconsolidated 2006 and 2007 federal income tax returns in the fourth quarter of 2009. The statute of limitations for the Company’s federal income tax returns for tax years 2007 and prior expired on September 15, 2011. The statute of limitations for the Company’s U.S. federal income tax return for 2008 will expire on September 15, 2012, unless otherwise extended. The IRS is currently involved in litigation incidental to the ordinary conductconducting an examination of the Company’s business. Althoughconsolidated returns for the Company cannot ascertaintax years 2008, 2009 and 2010. The Company’s state income tax returns remain subject to examination by various state authorities for tax years ranging from 2001 through 2010.
NOTE 15—EARNINGS PER SHARE
The following table reconciles the amount of liability that it may incur from any of these matters, it does not currently believe that,numerator and denominator used in the aggregate, these matters, taking into account applicable insurancebasic and reserves, will have a material adversediluted earnings per share calculations for the years ended December 31, 2011, 2010 and 2009 (in thousands, except per share data):
| Years ended December 31, | ||||||||||||
| 2011 | 2010 | 2009 | ||||||||||
Numerator (basic and diluted): | ||||||||||||
Net income | $ | 507,673 | $ | 419,373 | $ | 307,498 | ||||||
Denominator: | ||||||||||||
Denominator for basic earnings per share–weighted-average shares | 134,667 | 138,654 | 136,230 | |||||||||
Effect of stock options(1) | 2,316 | 2,348 | 1,651 | |||||||||
Effect of exchangeable notes | — | 990 | 1 | |||||||||
|
|
|
|
|
| |||||||
Denominator for diluted earnings per share—weighted-average shares and assumed conversion | 136,983 | 141,992 | 137,882 | |||||||||
Earnings per share-basic | $ | 3.77 | $ | 3.02 | $ | 2.26 | ||||||
|
|
|
|
|
| |||||||
Earnings per share-assuming dilution | $ | 3.71 | $ | 2.95 | $ | 2.23 | ||||||
|
|
|
|
|
| |||||||
Antidilutive common stock equivalents not included in the calculation of diluted earnings per share: | ||||||||||||
Stock options(1) | 1,756 | 1,373 | 1,587 | |||||||||
Weighted-average exercise price per share of antidilutive stock options(1) | $ | 62.79 | $ | 48.15 | $ | 35.61 | ||||||
| (1) | See Note 10 for further discussion on the terms of the Company’s share-based compensation plans. |
The exchangeable notes were retired in December of 2010, and therefore had no dilutive effect on its consolidated financial position, results of operations or cash flows in a particular quarter or annual period. In addition, O’Reilly is involved in resolving2011 results. Incremental net shares for the governmental investigations that were being conducted against CSK and CSK’s former officers prior to its acquisition by O’Reilly Automotive, Inc. as described below.
CSK Pre-Acquisition Matters – Governmental Investigations and Actions:
As previously reported, the pre-acquisition Securities and Exchange Commission (“SEC”) investigation of CSK, which commenced in 2006, was settled in May of 2009 by administrative order without fines, disgorgement or other financial remedies. The Department of Justice (“DOJ”)’s criminal investigation into these same matters as previously disclosed is near a conclusion and is described more fully below. In addition, the previously reported SEC complaint against three former employees of CSK for alleged conduct related to CSK’s historical accounting practices remains ongoing. The action filed by the SEC on July 22, 2009, against Maynard L. Jenkins, the former Chief Executive Officer of CSK seeking reimbursement from Mr. Jenkins of certain bonuses and stock sale profits pursuant to Section 304exchange feature of the Sarbanes-Oxley Act of 2002, as previously reported, also continues. The previously reported DOJ criminal prosecution of Don Watson,exchangeable notes were included in the former Chief Financial Officer of CSK, remains ongoing with trial set to commence on or about June 7, 2011.
With respect to the ongoing DOJ investigation into CSK’s pre-acquisition accounting practices as referenced above, as previously disclosed, O’Reilly and the DOJ agreed in principle, subject to final documentation, to resolve the DOJ investigation of CSK’s legacy pre-acquisition accounting practices. The Company and the DOJ continue work to complete the final documentation necessarydiluted earnings per share calculation for the execution of the Non-Prosecution Agreement previously referenced and payment of the one-time monetary penalty of $20.9 million, also previously reported. The Company’s total reserve related to the DOJ investigation of CSK was $21.4 million atyears ended December 31, 2010 which relates toand 2009.
From January 1, 2012, through and including February 28, 2012, the amountCompany repurchased 0.6 million shares of the monetary penalty and associated legal costs.
Notwithstanding the agreement in principle with the DOJ, several of CSK’s former directors or officers and current or former employees have been or may be interviewed or deposed as part of criminal, administrative and civil investigations and lawsuits. As described above, certain former employees of CSK are the subject of civil and criminal litigation commenced by the government. Under Delaware law, the charter documents of the CSK entities and certain indemnification agreements, CSK has certain obligations to indemnify these persons and, as a result, O’Reilly is currently incurring legal fees on behalf of these persons in relation to pending matters. Some of these indemnification obligations and other related costs may not be covered by CSK’s insurance policies.
As a result of the CSK acquisition, O’Reilly expects to continue to incur ongoing legal fees related to the indemnity obligations related to the litigation that has commenced by the DOJ and SEC of CSK’s former employees. O’Reilly has a remaining reserve, with respect to such indemnification obligations, of $18.8 millionits common stock at December 31, 2010, which was primarily recorded as an assumed liability in the Company’s allocation of the purchaseaverage price of CSK.
The foregoing governmental investigations and indemnification matters are subject to many uncertainties, and, given their complexity and scope, their final outcome cannot be predicted at this time. It is possible that in$83.39, for a particular quarter or annual period the Company’s resultstotal investment of operations and cash flows could be materially affected by an ultimate unfavorable resolution of such matters, depending, in part, upon the results of operations or cash flows for such period. However, at this time, management believes that the ultimate outcome of all of such regulatory proceedings and other matters that are pending, after consideration of applicable reserves and potentially available insurance coverage benefits not contemplated in recorded reserves, should not have a material adverse effect on the Company’s consolidated financial condition, results of operations and cash flows.$48.4 million.
NOTE 1516—SHAREHOLDER RIGHTS PLAN
On May 7, 2002, and as amended on December 29, 2010, and May 20, 2011, the Board of Directors adopted a shareholder rights plan (“Rights Agreement”) whereby one right was distributed for each share of common stock, par value $0.01 per share, of the Company held by stockholdersshareholders of record (the “Rights”) as of the close of business on May 31, 2002. The Rights initially entitle stockholdersshareholders to buy a unit representing one one-hundredth of a share of a new series of preferred stock of the Company for $160 and expire on May 30, 2012. The Rights generally will be exercisable only if a person or group acquires beneficial ownership of 15% or moreabove the threshold established in the Rights Agreement of the Company’s common stock or commences a tender or exchange offer upon consummation of which such person or group would beneficially own 15% or more than the threshold established in the Rights Agreement of the Company’s
common stock. If a person or group acquires beneficial ownership of 15% or moreabove the threshold established in the Rights Agreement of the Company’s common stock, each Right (other than Rights held by the acquirer) will, unless the Rights are redeemed by the Company, become exercisable upon payment of the exercise price of $160 for an amount of common stock of the Company having a market value of twice the exercise price of the Right. A copy of the Rights Agreement was filed on June 3, 2002, with the SEC, as Exhibit 4.2 to the Company’s report on Form 8-K.
NOTE 1617—QUARTERLY RESULTS (Unaudited)
The following table sets forth certain quarterly unaudited operating data for the fiscal years ended December 31, 2010,2011 and 2009.2010. The unaudited quarterly information includes all adjustments, which the Company considers necessary for a fair presentation of the information shown.shown:
| Fiscal 2011 | ||||||||||||||||
| First Quarter | Second Quarter | Third Quarter | Fourth Quarter | |||||||||||||
| (In thousands, except per share data) | ||||||||||||||||
Sales | $ | 1,382,738 | $ | 1,479,318 | $ | 1,535,453 | $ | 1,391,307 | ||||||||
Gross profit | 669,781 | 718,661 | 754,210 | 694,697 | ||||||||||||
Former CSK officer clawback | — | — | — | (2,798 | ) | |||||||||||
Operating income | 196,437 | 222,368 | 241,050 | 206,911 | ||||||||||||
Write-off of debt issuance costs | (21,626 | ) | — | — | — | |||||||||||
Termination of interest rate swap agreements | (4,237 | ) | — | — | — | |||||||||||
Net income | 102,474 | 133,772 | 148,439 | 122,988 | ||||||||||||
Earnings per share – basic | $ | 0.73 | $ | 0.97 | $ | 1.12 | $ | 0.96 | ||||||||
Earnings per share – assuming dilution | $ | 0.72 | $ | 0.96 | $ | 1.10 | $ | 0.94 | ||||||||
| Fiscal 2010 | ||||||||||||||||
| First Quarter | Second Quarter | Third Quarter | Fourth Quarter | |||||||||||||
| (In thousands, except per share data) | ||||||||||||||||
Sales | $ | 1,280,067 | $ | 1,381,241 | $ | 1,425,887 | $ | 1,310,330 | ||||||||
Gross profit | 618,347 | 672,633 | 693,415 | 636,597 | ||||||||||||
Legacy CSK DOJ investigation charge | — | 15,000 | 5,900 | — | ||||||||||||
Operating income | 168,445 | 181,164 | 199,031 | 164,136 | ||||||||||||
Gain on settlement of note receivable | — | — | — | 11,639 | ||||||||||||
Net income | 97,476 | 99,595 | 116,542 | 105,760 | ||||||||||||
Earnings per share – basic | $ | 0.71 | $ | 0.72 | $ | 0.84 | $ | 0.76 | ||||||||
Earnings per share – assuming dilution | $ | 0.70 | $ | 0.71 | $ | 0.82 | $ | 0.74 | ||||||||
The unaudited operating data presented below should be read in conjunction with the Company’s consolidated financial statements and related notes, and the other financial information included therein.
| Fiscal 2010 | ||||||||||||||||
| First Quarter | Second Quarter | Third Quarter | Fourth Quarter | |||||||||||||
| (In thousands, except per share data) | ||||||||||||||||
Sales | $ | 1,280,067 | $ | 1,381,241 | $ | 1,425,887 | $ | 1,310,330 | ||||||||
Gross profit | 618,347 | 672,633 | 693,415 | 636,597 | ||||||||||||
Operating income | 168,445 | 181,164 | 199,031 | 164,136 | ||||||||||||
Gain on settlement of note receivable | — | — | — | 11,639 | ||||||||||||
Net income | 97,476 | 99,595 | 116,542 | 105,760 | ||||||||||||
Earnings per share – basic | 0.71 | 0.72 | 0.84 | 0.76 | ||||||||||||
Earnings per share – assuming dilution | 0.70 | 0.71 | 0.82 | 0.74 | ||||||||||||
| Fiscal 2009 | ||||||||||||||||
| First Quarter | Second Quarter | Third Quarter | Fourth Quarter | |||||||||||||
| (In thousands, except per share data) | ||||||||||||||||
Sales | $ | 1,163,749 | $ | 1,251,377 | $ | 1,258,239 | $ | 1,173,697 | ||||||||
Gross profit | 542,670 | 603,769 | 610,555 | 569,534 | ||||||||||||
Operating income | 113,336 | 149,675 | 149,196 | 125,412 | ||||||||||||
Net income | 62,835 | 85,515 | 87,225 | 71,923 | ||||||||||||
Earnings per share – basic | 0.47 | 0.63 | 0.64 | 0.52 | ||||||||||||
Earnings per share – assuming dilution | 0.46 | 0.62 | 0.63 | | 0.52 | | ||||||||||
| Item 9. | Changes in and Disagreements With Accountants on Accounting and Financial Disclosure |
None.
| Item 9A. | Controls and Procedures |
EVALUATION OF DISCLOSURE CONTROLS AND PROCEDURES
As of the end of the period covered by this report, our management, under the supervision and with the participation of our Chief Executive Officer and Chief Financial Officer, evaluated the effectiveness of the design and operation of our disclosure controls and procedures pursuant to Rule 13a-15(b) and as defined in Rule 13a-15(e) of the Securities Exchange Act of 1934, as amended (“the Exchange Act”). Based on that evaluation, the Chief Executive Officer and the Chief Financial Officer concluded that our disclosure controls and procedures as of the end of the period covered by this report are functioning effectively to provide reasonable assurance that the information required to be disclosed by us (including our consolidated subsidiaries) in reports filed under the Exchange Act is recorded, processed, summarized and reported within the time periods specified in the Securities and Exchange Commission’s rules and forms and is accumulated and communicated to management, including our Chief Executive Officer and Chief Financial Officer, as appropriate to allow timely decisions regarding required disclosure.
CHANGES IN INTERNAL CONTROLS
There were no changes in the Company’s internal control over financial reporting during the fiscal quarter ended December 31, 2010,2011, that have materially affected, or are reasonably likely to materially affect, the Company’s internal control over financial reporting.
MANAGEMENT’S REPORT ON INTERNAL CONTROL OVER FINANCIAL REPORTING
OurThe management of O’Reilly Automotive, Inc. and Subsidiaries (the “Company”), under the supervision and with the participation of the Company’s principal executive officer and principal financial officer and effected by the Company’s Board of Directors, is responsible for establishing and maintaining adequate internal control over financial reporting for our company. Internal control over financial reporting isas defined in Rules 13a-15(f) and 15d-15(f) promulgatedRule 13(a)-15(f) or 15(d)-15(f) under the Securities Exchange Act of 1934, as a processamended. The Company’s internal control system is designed by, or under the supervision of, our principal executive and principal financial officers and effected by our board of directors, management and other personnel, to provide reasonable assurance regarding the reliability of financial reporting and the preparation of financial statements for external purposes in accordance with accounting principles generally accepted in the United States (“GAAP”) andStates.
Internal control over financial reporting includes thoseall policies and procedures that:
Pertainpertain to the maintenance of records that, in reasonable detail, accurately and fairly reflect the transactions and dispositions of our assets;the assets of the Company;
Provideprovide reasonable assurance that transactions are recorded as necessary to permit preparation of financial statements in accordance with GAAP,accounting principles generally accepted in the United States of America, and that our receipts and expenditures of the Company are being made only in accordance with authorizations of our management and membersdirectors of our board of directors;the Company; and
Provideprovide reasonable assurance regarding prevention or timely detection of unauthorized acquisition, use or disposition of ourthe Company’s assets that could have a material effect on ourthe financial statements.
Because of its inherent limitations,Management recognizes that all internal control oversystems, no matter how well designed, have inherent limitations. Therefore, even those systems determined to be effective can provide only reasonable assurance with respect to financial reporting may not prevent or detect misstatements. Projectionsstatement preparation and presentation. Also, projections of any evaluation of effectiveness to future periods are subject to the risk thatrisk. Over time, controls may become inadequate because of changes in conditions or thatdeterioration in the degree of compliance with the policies or procedures may deteriorate.procedures.
OurUnder the supervision and with the participation of the Company’s principal executive officer and principal financial officer, management has assessed the effectiveness of ourthe Company’s internal control over financial reporting as of December 31, 2010.2011. In making this assessment, management used the criteria set forth by the Committee of Sponsoring Organizations of the Treadway Commission (COSO)(“COSO”) inInternal Control—Control – Integrated Framework.
Framework. Based on ourthis assessment, management concludedbelieves that as of December 31, 2010, our2011, the Company’s internal control over financial reporting is effective based on those criteria.
Ernst & Young LLP, our independent registered public accounting firm,Independent Registered Public Accounting Firm, has audited management’s assessment ofthe Company’s consolidated financial statements and has issued an attestation report on the effectiveness of ourthe Company’s internal control over financial reporting, as of December 31, 2010, as stated in their report, which is included in Item 8.
| Item 9B. | Other Information |
Not Applicable.
PART III
| Item 10. | Directors, |
Directors and Officers:
The information regarding the directors of the Company containedO’Reilly Automotive, Inc. (the “Company”) will be included in the Company’s Proxy Statement on Schedule 14A for the 20112012 Annual Meeting of Shareholders (the “Proxy Statement”) under the caption “Proposal 1-Election of Class IIII Directors” and “Information Concerning the Board of Directors” and is incorporated herein by reference. The Proxy Statement will be filed with the Securities and Exchange Commission within 120 days of the end of our most recent fiscal year. The information regarding executive officers called for by Item 401 of Regulation S-K is included in Part I, in accordance with General Instruction G (3) to Form 10-K, for our executive officers who are not also directors.
Section 16(a) of the Exchange Act:
The information regarding compliance with Section 16(a) of the Exchange Act required by Item 405 of Regulation S-K, will be included in the Company’s Proxy Statement under the caption “Section 16(a) Beneficial Ownership Reporting Compliance” and is incorporated herein by reference.
Code of Ethics:
Our Board of Directors has adopted a code of ethics that applies to all of our directors, officers (including its chief executive officer, chief operating officer, chief financial officer, chief accounting officer, controller and any person performing similar functions) and employees.Team Members. Our Code of Ethics is available on our website at www.oreillyauto.com.www.oreillyauto.com.
Corporate Governance:
The Corporate Governance/Nominating Committee of the Board of Directors does not have a written policy on the consideration of Director candidates recommended by shareholders. It is the view of the Board of Directors that all candidates, whether recommended by a shareholder or the Corporate Governance/Nominating Committee, shall be evaluated based on the same established criteria for persons to be nominated for election to the Board of Directors and its committees.
The Board of Directors has established an Audit Committee pursuant to Section 3(a)(58)(A) of the Securities Exchange Act of 1934, as amended (the “Exchange Act”). The Audit Committee currently consists of Jay D. Burchfield, Thomas T. Hendrickson, Paul R. Lederer, John Murphy and Ronald Rashkow, each an independent director in accordance with The Nasdaq Stock Market Marketplace Rule 5605(a)(2), the standards of Rule 10A-3 of the Exchange Act and the requirements of The Nasdaq Stock Market Marketplace Rule 5605(c)(2). In addition, our Board of Directors has determined that Mr. Murphy, Chairman of the Audit Committee, qualifies as an audit committee financial expert under Item 407(d)(5) of Regulation S-K.
The information regarding compliance with Section 16(a) of the Exchange Act included in the Company’s Proxy Statement under the caption “Section 16(a) Beneficial Ownership Reporting Compliance” is incorporated herein by reference.
| Item 11. | Executive Compensation |
Director and Officer compensation:
The information required by Item 402 of Regulation S-K will be included in the Company’s Proxy Statement under the captions “Compensation of Executive Officers” and “Director Compensation” and that information is incorporated herein by reference.
Compensation Committee:
The information required by Item 407(e)(4) and (e)(5) of Regulation S-K will be included in the Company’s Proxy Statement under the captions “Compensation Committee Interlocks and Insider Participation” and “Compensation Committee Report” and that information is incorporated herein by reference.
| Item | Security Ownership of Certain Beneficial Owners and Management and Related Shareholder Matters |
The following table sets forth shares authorized for issuance under the Company’s equity compensation plans at December 31, 2010:2011:
Number of shares to be (a) | Weighted-average exercise price of outstanding options, warrants and rights (b) | Number of securities remaining available for future issuance under equity compensation plans (excluding securities reflected in column (a)). | Number of shares to be issued upon exercise of outstanding options, warrants and rights (a) | Weighted-average exercise price of outstanding options, warrants and rights (b) | Number of securities remaining available securities reflected in column (a)). | |||||||||||||||||||
Equity compensation plans approved by shareholders | 8,395 | $ | 30.42 | 9,370 | 7,490 | $ | 37.38 | 8,370 | ||||||||||||||||
Equity compensation plans not approved by shareholders | — | — | — | — | — | — | ||||||||||||||||||
|
|
| ||||||||||||||||||||||
Total | 8,395 | $ | 30.42 | 9,370 | 7,490 | $ | 37.38 | 8,370 | ||||||||||||||||
|
|
| ||||||||||||||||||||||
| (a) | Number of shares presented is in thousands. |
| (b) | Includes weighted-average exercise price of outstanding stock options. |
The information required by Item 403 of Regulation S-K will be included in the Proxy Statement under the captions “Security Ownership of Certain Beneficial Owners” and “Security Ownership of Directors and Management” and is incorporated herein by reference.
| Item 13. | Certain Relationships and Related Transactions, and Director Independence |
The information required by Item 404 of Regulation S-K will be included in the Company’s Proxy Statement under the caption “Certain Relationships and Related Transactions” and is incorporated herein by reference.
The information required by Item 407(a) of Regulation S-K will be included in the Company’s Proxy Statement under the caption “Director Independence” and is incorporated herein by reference.
| Item 14. | Principal Accountant Fees and Services |
The information required by Item 9(e) of Schedule 14A will be included in the Proxy Statement under the caption “Fees Paid to Independent Registered Public Accounting Firm” and is incorporated herein by reference.
PART IV
| Item 15. | Exhibits and Financial Statement Schedules |
| (a) | The following documents are filed as part of this Annual Report on Form 10-K: |
1.Financial Statements - O’Reilly Automotive, Inc. and Subsidiaries
The following consolidated financial statements of O’Reilly Automotive, Inc. and Subsidiaries included in the Annual Shareholders’ Report of the registrant for the year ended December 31, 2010,2011, are filed with this Annual Report in Part II, Item 8:
Management’s Report on Internal Control over Financial Reporting
Report of Independent Registered Public Accounting Firm – Internal Control over Financial Reporting
Report of Independent Registered Public Accounting Firm – Financial Statements
Consolidated Balance Sheets as of December 31, 20102011 and 20092010
Consolidated Statements of Income for the years ended December 31, 2011, 2010 2009 and 20082009
Consolidated Statements of Comprehensive Income for the years ended December 31, 2011, 2010 and 2009
Consolidated Statements of Shareholders’ Equity for the years ended December 31, 2011, 2010 2009 and 20082009
Consolidated Statements of Cash Flows for the years ended December 31, 2011, 2010 2009 and 20082009
Notes to Consolidated Financial Statements for the years ended December 31, 2011, 2010 2009 and 20082009
2.Financial Statement Schedules - O’Reilly Automotive, Inc. and Subsidiaries
The following consolidated financial statement schedule of O’Reilly Automotive, Inc. and Subsidiaries is included in Item 15(c)15(a):
Schedule II-Valuation and qualifying accounts
All other schedules for which provision is made in the applicable accounting regulations of the Securities and Exchange Commission are not required under the related instructions or are inapplicable, and therefore have been omitted.
3.Exhibits
See Exhibit Index beginning on page E-1.
SCHEDULE II - VALUATION AND QUALIFYING ACCOUNTS
O’REILLY AUTOMOTIVE, INC. AND SUBSIDIARIES
| Column A | Column B | Column C | Column D | Column E | Column B | Column C | Column D | Column E | ||||||||||||||||||||||||||||||||
Description | Balance at Beginning of Period | Additions - Charged to Costs and Expenses | Additions - Charged to Other Accounts - Describe | Deductions - Describe | Balance at End of Period | Balance at Beginning of Period | Additions - Charged to Costs and Expenses | Additions - Charged to Other Accounts - Describe | Deductions - Describe | Balance at End of Period | ||||||||||||||||||||||||||||||
| (amounts in thousands) | ||||||||||||||||||||||||||||||||||||||||
Year ended December 31, 2010: Deducted from asset account: Sales and returns allowances | $ | 5,316 | $ | 318 | $ | — | $ | — | $ | 5,634 | ||||||||||||||||||||||||||||||
Year ended December 31, 2011: | ||||||||||||||||||||||||||||||||||||||||
Deducted from asset account: | ||||||||||||||||||||||||||||||||||||||||
Sales and returns allowances | $ | 5,634 | $ | 772 | $ | — | $ | — | $ | 6,406 | ||||||||||||||||||||||||||||||
Allowance for doubtful accounts | 6,795 | 9,250 | — | 7,696 | (1) | 8,349 | 8,349 | 7,695 | — | 9,641 | (1) | 6,403 | ||||||||||||||||||||||||||||
Year ended December 31, 2009: Deducted from asset account: Sales and returns allowances | $ | 2,776 | $ | 2,540 | $ | — | $ | — | $ | 5,316 | ||||||||||||||||||||||||||||||
Year ended December 31, 2010: | ||||||||||||||||||||||||||||||||||||||||
Deducted from asset account: | ||||||||||||||||||||||||||||||||||||||||
Sales and returns allowances | $ | 5,316 | $ | 318 | $ | — | $ | — | $ | 5,634 | ||||||||||||||||||||||||||||||
Allowance for doubtful accounts | 4,521 | 11,342 | — | 9,068 | (1) | 6,795 | 6,795 | 9,250 | — | 7,696 | (1) | 8,349 | ||||||||||||||||||||||||||||
Year ended December 31, 2008: Deducted from asset account: Sales and returns allowances | $ | 2,263 | $ | 42 | $ | 656 | (2) | $ | 185 | (3) | $ | 2,776 | ||||||||||||||||||||||||||||
Year ended December 31, 2009: | ||||||||||||||||||||||||||||||||||||||||
Deducted from asset account: | ||||||||||||||||||||||||||||||||||||||||
Sales and returns allowances | $ | 2,776 | $ | 2,540 | $ | — | $ | — | $ | 5,316 | ||||||||||||||||||||||||||||||
Allowance for doubtful accounts | 3,179 | 7,439 | 431 | (2) | 6,528 | (1) | 4,521 | 4,521 | 11,342 | — | 9,068 | (1) | 6,795 | |||||||||||||||||||||||||||
| (1) | Uncollectable accounts written off |
SIGNATURES
Pursuant to the requirements of Section 13 or 15(d) of the Securities Exchange Act of 1934, as amended, the registrant has duly caused this report to be signed on its behalf by the undersigned, thereunto duly authorized.
O’REILLY AUTOMOTIVE, INC. | ||
(Registrant) | ||
| Date: February 28, | ||
| By | / | |
| Greg Henslee | ||
| Chief Executive Officer and Co-President | ||
Pursuant to the requirements of the Securities Exchange Act of 1934, as amended, this report has been signed below by the following persons on behalf of the registrant in the capacities and on the dates indicated.
Signature | Title | Date | ||
/s/
| Director and Chairman of the Board | February 28, | ||
| David E. O’Reilly | ||||
/s/
| Director and Vice-Chairman of the Board | February 28, | ||
| Lawrence P. O’Reilly | ||||
/s/
| Director and Vice-Chairman of the Board | February 28, | ||
| Charles H. O’Reilly, Jr. | ||||
/s/
| Director | February 28, | ||
| Rosalie O’Reilly Wooten | ||||
/s/
| Director | February 28, | ||
| Jay D. Burchfield | ||||
/s/
| Director | February 28, | ||
| Thomas Henrickson | ||||
/s/
| Director | February 28, | ||
| Paul R. Lederer | ||||
/s/
| Director | February 28, | ||
| John Murphy | ||||
/s/
| Director | February 28, | ||
| Ronald Rashkow | ||||
/
| Chief Executive Officer and Co-President | February 28, 2012 | ||
| Greg Henslee | (Principal Executive Officer) | |||
/s/
| Chief Operating Officer and Co-President | February 28, | ||
| Ted Wise | ||||
/s/
| Executive Vice-President of Finance and Chief | February 28, 2012 | ||
| Thomas McFall |
| |||
EXHIBIT INDEX
Exhibit No. | Description | |
| 2.1 | Agreement and Plan of Merger, dated April 1, 2008, between O’Reilly Automotive, Inc., OC Acquisition Company and CSK Auto Corporation, filed as Exhibit 2.1 to the Registrant’s Current Report on Form 8-K dated April 7, 2008, is incorporated herein by this reference. | |
| 2.2 | Agreement and Plan of Merger, dated December 29, 2010, between O’Reilly Automotive, Inc., O’Reilly Holdings, Inc. and O’Reilly MergerCo, Inc., filed as Exhibit 2.1 to the Registrant’s Current Report on Form 8-K dated December 29, 2010, is incorporated herein by this reference. | |
| 3.1 | Articles of Incorporation of the Registrant, as amended, filed as Exhibit 3.1 to the Registrant’s Current Report on Form 8-K dated December 29, 2010, is incorporated herein by this reference. | |
| 3.2 | Bylaws of the Registrant, as amended, filed as Exhibit 3.2 to the Registrant’s Current Report on Form 8-K dated December 29, 2010, is incorporated herein by this reference. | |
| 4.1 | Form of Stock Certificate for Common Stock, filed as Exhibit 4.1 to the Registration Statement of the Registrant on Form S-1, File No. 33-58948, is incorporated herein by this reference. | |
| 4.2 | Rights Agreement, dated as of May 7, 2002, and as amended on December 29, 2010, between O’Reilly Automotive, Inc. and Computershare Trust Company, N.A., as Successor Rights Agent, including the form of Certificate of Designation, Preferences and Rights as Exhibit A, the form of Rights Certificates as Exhibit B and the Form of Summary of Rights as Exhibit C, filed as Exhibit 4.2 to the Registrant’s Current Report on Form 8-K dated June 3, 2002, is incorporated herein by this reference. | |
| 4.3 | Amendment No. 1 to Rights Agreement, dated as of December 29, 2010, by and among O’Reilly Holdings, Inc., O’Reilly Automotive, Inc. and Computershare Trust Company, N.A., as successor rights agent to UMB Bank, N.A., filed | |
| 4.4 | Indenture, dated as of January 14, 2011, among O’Reilly Automotive, Inc. as guarantors, and UMB Bank, N.A., as Trustee, filed as Exhibit 4.1 to the Registrant’s Current Report on Form 8-K dated January 14, 2011, is incorporated herein by this reference. | |
| 4.5 | Amendment No. 2 to Rights Agreement, dated as of May 20, 2011, by and among O’Reilly Automotive, Inc. and Computershare Trust Company, N.A., as successor rights agent to UMB Bank, N.A., filed as Exhibit 4.5 to the Registrant’s Current Report on Form 8-K dated May 20, 2011, is incorporated herein by this reference. | |
| 4.6 | Indenture, dated as of September 19, 2011, among O’Reilly Automotive, Inc. as guarantors, and UMB Bank, N.A., as Trustee, filed as Exhibit 4.2 to the Registrant’s Current Report on Form 8-K dated September 19, 2011, is incorporated herein by this reference. | |
| 10.1 (a) | Form of Employment Agreement between the Registrant and David E. O’Reilly, | |
| 10.2 | Lease between the Registrant and O’Reilly Investment Company, filed as Exhibit 10.2 to the Registration Statement of the Registrant on Form S-1, File No. 33-58948, is incorporated herein by this reference. | |
| 10.3 | Lease between the Registrant and O’Reilly Real Estate Company, filed as Exhibit 10.3 to the Registration Statement of the Registrant on Form S-1, File No. 33-58948, is incorporated herein by this reference. | |
| 10.4 (a) | Form of Retirement Agreement between the Registrant and David E. O’Reilly, | |
| 10.5 (a) | O’Reilly Automotive, Inc. Profit Sharing and Savings Plan, filed as Exhibit 4.1 to the Registrant’s Registration Statement on Form S-8, File No. 33-73892, is incorporated herein by this reference. | |
| 10.6 (a) | O’Reilly Automotive, Inc. 1993 Stock Option Plan, filed as Exhibit 10.8 to the Registration Statement of the Registrant on Form S-1, File No. 33-58948, is incorporated herein by this reference. | |
| 10.7 (a) | O’Reilly Automotive, Inc. Stock Purchase Plan, | |
| O’Reilly Automotive, Inc. Director Stock Option Plan, | ||
Page E-1
78
EXHIBIT INDEX (continued)
|
| |
| 10.9 | ||
| O’Reilly Automotive, Inc. Performance Incentive Plan, filed as Exhibit 10.18 (a) to the Registrant’s Annual Shareholders’ Report on Form 10-K for the year ended December 31, 1996, is incorporated herein by this reference. | ||
| Second Amendment to the O’Reilly Automotive, Inc. 1993 Stock Option Plan, filed as Exhibit 10.20 to the Registrant’s Quarterly Report on Form 10-Q for the quarter ended June 30, 1997, is incorporated herein by this reference. | ||
| Third Amendment to the O’Reilly Automotive, Inc. 1993 Stock Option Plan, filed as Exhibit 10.21 to the Registrant’s Amended Quarterly Report on Form 10-Q/A for the quarter ended March 31, 1998, is incorporated herein by this reference. | ||
Page E-1
EXHIBIT INDEX (continued)
Exhibit No. | Description | |
| First Amendment to the O’Reilly Automotive, Inc. Directors’ Stock Option Plan, filed as Exhibit 10.22 to the Registrant’s Amended Quarterly Report on Form 10-Q/A for the quarter ended March 31, 1998, is incorporated herein by this reference. | ||
| O’Reilly Automotive, Inc. Deferred Compensation Plan, filed as Exhibit 10.23 to the Registrant’s Quarterly Report on Form 10-Q for the quarter ended March 31, 1998, is incorporated herein by this reference. | ||
| Trust Agreement between the Registrant’s Deferred Compensation Plan and Bankers Trust, dated February 2, 1998, filed as Exhibit 10.24 to the Registrant’s Quarterly Report on Form 10-Q for the quarter ended March 31, 1998, is incorporated herein by this reference. | ||
| 2001 Amendment to the O’Reilly Automotive, Inc. 1993 Stock Option Plan, dated May 8, 2001, filed as Exhibit 10.24 to the Registrant’s Annual Shareholders’ Report on Form 10-K for the year ended December 31, 2002, is incorporated herein by this reference. | ||
| First Amendment to Retirement Agreement, dated February 7, 2001, filed as Exhibit 10.26 to the Registrant’s Annual Shareholders’ Report on Form 10-K for the year ended December 31, 2001, is incorporated herein by this reference. | ||
| Fourth Amendment to the O’Reilly Automotive, Inc. 1993 Stock Option Plan, dated February 7, 2001, filed as Exhibit 10.27 to the Registrant’s Annual Shareholders’ Report on Form 10-K for the year ended December 31, 2001, is incorporated herein by this reference. | ||
| Amended and Restated O’Reilly Automotive, | ||
| Amended and Restated O’Reilly Automotive, Inc. 2003 Directors’ Stock Plan, filed as Appendix C to the Registrant’s Proxy Statement for 2005 Annual Meeting of Shareholders on Schedule 14A, is incorporated herein by this reference. | ||
| O’Reilly Automotive, Inc. 2009 Stock Purchase Plan, filed as Appendix A to the Registrant’s Proxy Statement for 2009 Annual Meeting of Shareholders on Schedule 14A, is incorporated herein by this reference. | ||
Page E-2
79
EXHIBIT INDEX (continued)
|
| |
| O’Reilly Automotive, Inc. 2009 Incentive Plan, filed as Appendix B to the Registrant’s Proxy Statement for 2009 Annual Meeting of Shareholders on Schedule 14A, is incorporated herein by this reference. | ||
| Form of Stock Option Agreement, dated as of December 31, 2009, filed as Exhibit 10.47 to the Registrant’s Annual | ||
| Credit Agreement, dated as of January 14, 2011, among O’Reilly Automotive, Inc., as the lead Borrower itself and the other Borrowers from time to time party thereto, the Guarantors from time to time party thereto, Bank of America N.A., as Administrative Agent, Swing Line Lender and L/C Issuer, filed as Exhibit 10.1 to the Registrant’s Current Report on Form 8-K dated January 14, 2011, is incorporated herein by this reference. | ||
| 10.24 | Amendment No. 1 to the Credit Agreement, dated as of September 9, 2011, by and among O’Reilly Automotive, Inc., as the lead Borrower, Bank of America N.A., as Administrative Agent, Swing Line Lender and L/C Issuer, filed as Exhibit 10.1 to the Registrant’s Current Report on Form 8-K dated September 9, 2011, is incorporated herein by this reference. | |
| 10.25 (a) | O’Reilly Automotive, Inc. Director Compensation Program, filed herewith. | |
| 18.0 | Independent Registered Public Accounting Firm Letter Regarding Accounting Change, dated March 7, 2005, filed as Exhibit 18.0 to the Registrant’s Annual Shareholders’ Report on Form 10-K for the year ended December 31, 2004, is incorporated herein by this reference. | |
| 21.1 | Subsidiaries of the Registrant, filed herewith. | |
| 23.1 | Consent of Ernst & Young LLP, independent registered public accounting firm, filed herewith. | |
| 31.1 | Certificate of the Chief Executive Officer pursuant to Section 302 of the Sarbanes-Oxley Act of 2002, filed herewith. | |
| 31.2 | Certificate of the Chief Financial Officer pursuant to Section 302 of the Sarbanes-Oxley Act of 2002, filed herewith. | |
| 32.1 | Certificate of the Chief Executive Officer pursuant to 18 U.S.C. Section 1350, as adopted pursuant to Section 906 of the Sarbanes-Oxley Act of 2002, filed herewith. | |
| 32.2 | Certificate of the Chief Financial Officer pursuant to 18 U.S.C. Section 1350, as adopted pursuant to Section 906 of the Sarbanes-Oxley Act of 2002, filed herewith. | |
| XBRL Instance Document | ||
| XBRL Taxonomy Extension Schema | ||
| XBRL Taxonomy Extension Calculation Linkbase | ||
| XBRL Taxonomy Extension Definition Linkbase | ||
| XBRL Taxonomy Extension Label Linkbase | ||
| XBRL Taxonomy Extension Presentation Linkbase | ||
| (a) | Management contract or compensatory plan or arrangement. |
Page E-3E-2
80
81