UNITED STATES
SECURITIES AND EXCHANGE COMMISSION
Washington, D.C. 20549
FORM 10-K
| x | ANNUAL REPORT PURSUANT TO SECTION 13 OR 15(D) OF THE SECURITIES EXCHANGE ACT OF 1934 |
For the fiscal year ended December 31, 20102011
or
| ¨ | TRANSITION REPORT PURSUANT TO SECTION 13 OR 15(d) OF THE SECURITIES EXCHANGE ACT OF 1934 |
For the transition period fromto
Commission file number 001-32924
GREEN PLAINS RENEWABLE ENERGY, INC.
(Exact name of registrant as specified in its charter)
| Iowa | 84-1652107 | |
(State or other jurisdiction of incorporation or organization) | (I.R.S. Employer Identification No.) | |
| (402) 884-8700 | ||
| (Address of principal executive offices, including zip code) | (Registrant’s telephone number, including area code) | |
Securities registered pursuant to Section 12(b) of the Act: Common Stock, $.001 par value
Name of exchanges on which registered: NASDAQ Stock Market
Securities registered pursuant to Section 12(g) of the Act: None
Indicate by check mark if the registrant is a well-known seasoned issuer, as defined in Rule 405 of the Securities Act.
Yes¨ Nox
Indicate by check mark if the registrant is not required to file reports pursuant to Section 13 or Section 15(d) of the Act.
Yes¨ Nox
Indicate by check mark whether the registrant (1) has filed all reports required to be filed by Section 13 or 15(d) of the Securities Exchange Act of 1934 during the preceding 12 months (or for such shorter period that the registrant was required to file such reports), and (2) has been subject to such filing requirements for the past 90 days. Yesx No¨
Indicate by check mark whether the registrant has submitted electronically and posted on its corporate Web site, if any, every Interactive Data File required to be submitted and posted pursuant to Rule 405 of Regulation S-T (§232.405 of this chapter) during the preceding 12 months (or for such shorter period that the registrant was required to submit and post such files).
Yes Yes¨x No¨
Indicate by check mark if disclosure of delinquent filers pursuant to Item 405 of Regulation S-K is not contained herein, and will not be contained, to the best of registrant’s knowledge, in definitive proxy or information statements incorporated by reference in Part III of this Form 10-K or any amendment to this Form 10-K. ¨.
Indicate by check mark whether the registrant is a large accelerated filer, an accelerated filer, a non-accelerated filer or a smaller reporting company. See definition of “large accelerated filer,” “accelerated filer” and “smaller reporting company” in Rule 12b-2 of the Exchange Act.
Large accelerated filer¨ Accelerated filerx Non-accelerated filer¨ Smaller reporting company¨
| Large accelerated filer | ¨ | Accelerated filer | x | |||||
| Non-accelerated filer | ¨ | Smaller reporting company | ¨ | |||||
Indicate by check mark whether the registrant is a shell company (as defined in Rule 12b-2 of the Act). Yes¨ Nox
The aggregate market value of the Company’s voting common stock held by non-affiliates of the registrant as of June 30, 20102011 (the last business day of the second quarter), based on the last sale price of the common stock on that date of $10.22,$10.79, was approximately $165.7$224.2 million. For purposes of this calculation, executive officers, directors and holders of 10% or more of the registrant’s common stock are deemed to be affiliates of the registrant.
As of March 1, 2011,February 10, 2012, there were 36,101,88833,322,581 shares of the registrant’s common stock outstanding.
DOCUMENTS INCORPORATED BY REFERENCE
Portions of the registrant’s definitive Proxy Statement for the 20112012 Annual Meeting of Shareholders are incorporated by reference in Part III herein. The Company intends to file such Proxy Statement with the Securities and Exchange Commission no later than 120 days after the end of the period covered by this report on Form 10-K.
Cautionary Information Regarding Forward-Looking Statements
The Securities and Exchange Commission, or SEC, encourages companies to disclose forward-looking information so that investors can better understand a company’s future prospects and make informed investment decisions. This report contains such “forward-looking statements” within the meaning of the Private Securities Litigation Reform Act of 1995. These statements may be made directly in this report, and they may also be made a part of this report by reference to other documents filed with the SEC, which is known as “incorporation by reference.”
This report contains forward-looking statements based on current expectations that involve a number of risks and uncertainties. Forward-looking statements generally do not relate strictly to historical or current facts, but rather to plans and objectives for future operations based upon management’s reasonable estimates of future results or trends, and include statements preceded by, followed by, or that include words such as “anticipates,” “believes,” “continue,” “estimates,” “expects,” “intends,” “outlook,” “plans,” “predicts,” “may,” “could,” “should,” “will,” and words and phrases of similar impact, and include, but are not limited to, statements regarding future operating or financial performance, business strategy, business environment, key trends, and benefits of actual or planned acquisitions. In addition, any statements that refer to expectations, projections or other characterizations of future events or circumstances, including any underlying assumptions, are forward-looking statements. The forward-looking statements are made pursuant to safe harbor provisions of the Private Securities Litigation Reform Act of 1995. Although we believe that our expectations regarding future events are based on reasonable assumptions, any or all forward-looking statements in this report may turn out to be incorrect. They may be based on inaccurate assumptions or may not account for known or unknown risks and uncertainties. Consequently, no forward-looking statement is guaranteed, and actual future results may vary materially from the results expressed or implied in our forward-looking statements. The cautionary statements in this report expressly qualify all of our forward-looking statements. In addition, we are not obligated, and do not intend, to update any of our forward-looking statements at any time unless an update is required by applicable securities laws. Factors that could cause actual results to differ from those expressed or implied in the forward-looking statements include, but are not limited to, those discussed in the section entitled “Risk Factors” in this report or in any document incorporated by reference. Specifically, we may experience significant fluctuations in future operating results due to a number of economic conditions, including, but not limited to, competition in the ethanol and other industries in which we compete,operate, commodity market risks, financial market risks, counter-party risks, risks associated with changes to federal policy or regulation, risks related to closing and achieving anticipated results from acquisitions, and other risk factors detailed in our reports filed with the SEC. Actual results may differ from projected results due, but not limited, to unforeseen developments.
In light of these assumptions, risks and uncertainties, the results and events discussed in the forward-looking statements contained in this report or in any document incorporated by reference might not occur. Investors are cautioned not to place undue reliance on the forward-looking statements, which speak only as of the date of this report or the date of the document incorporated by reference in this report. We are not under any obligation, and we expressly disclaim any obligation, to update or alter any forward-looking statements, whether as a result of new information, future events or otherwise.
Overview
References to “we,” “us,” “our,” “Green Plains,” or the “Company” in this report refer to Green Plains Renewable Energy, Inc., an Iowa corporation founded in June 2004, and its subsidiaries.
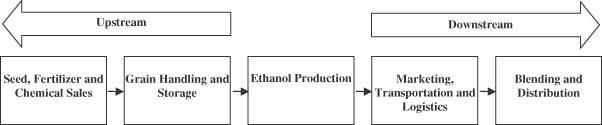
We are a leading, vertically-integrated producer, marketer and distributer of ethanol. We have grown rapidly, primarily through acquisitions, and today we have operations throughout the ethanol value chain. Our operations begin upstream with our agronomy and grain handling operations, continue through our
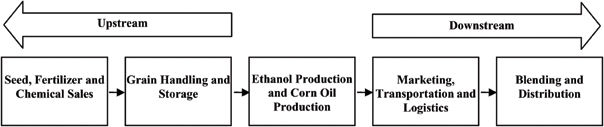
approximately 680 million gallons per year, or mmgy, of ethanol production capacity and end downstream with our ethanol marketing, distribution and blending facilities. We focus on generating stable operating margins through our diversified business segments and our risk management strategy. We believe that owning and operating assets throughout the ethanol value chain enables us to mitigate the effects of changes in commodity prices on our profitability and differentiates us from companies focused only on ethanol production. We have grown rapidly, primarily through acquisitions. Today, we have operations throughout the ethanol value chain, beginning upstream with our agronomy and grain handling operations, continuing through our approximately 740 million gallons per year, or mmgy, of ethanol production capacity and our corn oil production, and ending downstream with our ethanol marketing, distribution and blending facilities. Following is our visual presentation of the ethanol value chain:
Our disciplined risk management strategy is designed to lock in operating margins by forward contracting the four primary commodities involved in or derived from ethanol production: corn, natural gas, ethanol and distillers grains, along with the corn oil extracted prior to the production of distillers grains. We also seek to maintain an environment of continuous operational improvement to increase our efficiency and effectiveness as a low-cost producer of ethanol.
Currently, we operateWe review our operations within the three segments outlined below:following four separate operating segments:
| • | Ethanol Production. We |
| • | Corn Oil Production. We |
| • | Agribusiness.We operate three lines of business within our agribusiness segment: bulk grain, agronomy and petroleum. We believe our bulk grain business provides synergies with our ethanol production segment as it supplies a portion of the feedstock for our ethanol plants. In our bulk grain business, we have |
| • | Marketing and Distribution. Our in-house |
We intend to continue to take a disciplined approach in evaluating new opportunities related to potential acquisition of additional ethanol plants by considering whether the plants fit within the design, engineering and geographic criteria we have developed. In our marketing and distribution segment, our strategy is to renew existing marketing contracts, as well as enter new contracts with other ethanol producers. We also intend to pursue opportunities to develop or acquire additional grain elevators and agronomy businesses, specifically those located near our ethanol plants. We believe that owning additional agribusiness operations in close proximity to our ethanol plants enables us to strengthen relationships with local corn producers, allowing us to source corn more effectively and at a lower average cost. We also plan to continue to grow our downstream access to customers and are actively seeking new marketing opportunities with other ethanol producers. Additionally, we are a partner in a joint venture, BioProcess Algae LLC, formed to commercialize advanced photo-bioreactor technologies for the growing and harvesting of algal biomass.
Our Competitive Strengths
We believe we have created aan efficient platform that diversifies ourwith diversified revenues and income stream.streams. Fundamentally, we focus on managing commodity price risks, improving operating efficiencies and controlling costs.optimizing market opportunities. We believe our competitive strengths include:
Disciplined Risk Management.We believe risk management is a core competency of ours. Our primary focus is to lock in favorable operating margins whenever possible. We do not speculate on general price
movements by taking unhedged positions on commodity productscommodities such as corn, ethanol or natural gas. Our comprehensive risk management platform allows us to monitor real-time commodity price risk exposure at each of our plants, and to respond quickly to lock in acceptable margins or to temporarily reduce production levels at our ethanol plants during periods of compressed margins. By using a variety of risk management tools and hedging strategies, including our internally-developed real-time operating margin management system, we believe we are able to maintain a disciplined approach to risk management.
Demonstrated Asset Acquisition and Integration Capabilities.We have demonstrated the ability to make strategic acquisitions that we believe create synergies withwithin our vertically-integrated platform. Our belief is thatWe believe acquiring and developing complementary businesses enhances our ability to mitigate risks. Our balance sheet allows us to be selective in that process. Since our inception, we have acquired or developed eightnine ethanol plants in addition to upstream grain elevators and agronomy businesses and downstream blending and distribution businesses. We installed corn oil extraction technology at each of our ethanol plants to generate incremental returns from this value-added product. We believe these acquisitions and improvements have been successfully integrated into our business and have enhanced our overall returns.
Focus on Operational Excellence. All of our plants are staffed by experienced industry personnel. We focus on incremental operational improvements to enhance overall production efficiencies and we share operational knowledge across our plants. Using real-time production data and control systems, we continually monitor our plants in an effort to optimize performance. We believe our ability to improve operating efficiencies provides an operating cost advantage over most of our competitors. In turn, we believe we are well positioned to increase operating margins for any facilities that we may acquire in the future.
Leading Vertically-Integrated Ethanol Producer. We believe our operations throughout the ethanol value chain reduce our commodity and operating risks, and increase our pricing visibility and influence in key markets. Combined, we believe our agribusiness, ethanol production, corn oil production, and marketing and distribution businessessegments provide efficiencies across the ethanol value chain, from grain procurement to blending fuel. Our agribusiness operations help to reduce our supply risk by providing grain handling and storage capabilities for approximately 31.439.1 million bushels. Assuming full production capacity at each of our plants and those of our third-party ethanol producers, we would market and distribute more thanapproximately one billion gallons of ethanol per year from twelve plants. Our majority interest in Blendstar allowscorn oil systems are designed to extract non-edible corn oil that has multiple industrial uses. Our blending or terminaling facilities allow us to source, store, blend and distribute ethanol and biodiesel across multiple states.
Proven Management Team.Our senior management team brings an average of 21averages over 20 years of commodity risk management and related industry experience. We have specific expertise across all aspects of the ethanol supply, production, and distribution chain – from agribusiness, to plant operations and management, to commodity markets and risk management, to ethanol marketing.
Our Growth Strategy
We intend to continue toour focus on strengthening and diversifying our vertically-integrated platform by implementing or further acting upon the following growth strategies:
Expand Marketing and Distribution Activities. We plan to continue expanding our downstream access to customers and seeking opportunities to arbitrage markets with minimal risk allocation. We currently participate in ethanol transload and splash blending services and have begun to expand the capacity of these facilities through organic growth. The expansion of our capacity will encourage the distribution of blended fuel. We believe that further growth of our distribution efforts will enable us to continue to capitalize on our vertically-integrated platform.
Develop or Acquire Strategically-Located Grain Elevators. We intend to pursue opportunities to develop or acquire additional grain elevators within the agribusiness segment, specifically those located near our ethanol plants. We believe that owning additional grain elevators in close proximity to our ethanol plants enables us to strengthen relationships with local corn producers, allowing us to source corn more effectively and at a lower average cost. Since all of our plants are located within or near the corn belt where a number of competitors also have ethanol facilities, we believe that owning grain elevators provides us with a competitive advantage in the origination of corn.
Pursue Consolidation Opportunities within the Ethanol Industry. We continue to focus on the potential acquisition of additional ethanol plants. Throughout 2010,In the past several years, we werehave been approached with opportunities to acquire existing ethanol
plants. We believe those plants were available for a number of reasons including financial distress of a particular facility, a lack of operational expertise or a desire by existing owners to exit their original
investment. We will continue to take a disciplined approach in evaluating new opportunities by considering whether the plants fit within the design, engineering and geographic criteria we have developed. We acquired one additional ethanol plant during 2011 that met our criteria. We believe that our integrated platform, plant operations experience and disciplined risk management approach give us the ability to generate favorable returns from our acquisitions.
Improve Operational Efficiency. We seek to enhance profitability at each of our plants by increasing our production volumes through operational improvements. We continually research operational processes that may increase our efficiency by increasing yields, lowering our processing cost per gallon and increasing our production volumes. Additionally, we employ an extensive cost control system at each of our plants to continuously monitor our plants’ performance. We are able to use performance data from our plants to develop strategies for cost reduction and efficiency that can be applied across our platform.
Expand Our Third-Party Marketing Volumes. We plan to continue to grow our downstream access to customers and are actively looking at new marketing opportunities with other ethanol producers. We maintain active dialogues with prospective ethanol producers whose location, production and risk management practices are consistent with our vertically-integrated platform. We believe that further expansion of our third-party marketing volumes will enable us to continue to meet major ethanol customers’ needs by providing us with a broader market presence and allowing us to further leverage our marketing expertise and distribution systems.
Invest in Next Generation Biofuel Opportunities. We plan to continue our investment in the BioProcess Algae joint venture, which is focused on developing technology to growcommercialization of advanced photo-bioreactor technologies for the growing and harvest algae,harvesting of algal biomass which consume carbon dioxide, in commercially viable quantities.can be used as high-quality, low-cost feedstocks for human nutrition, animal feed and biofuels. We believe this technology has specific applications with facilities including ethanol plants, that emit carbon dioxide. The algae produced has the potential to be used for advanced biofuel production, high quality animal feed or as biomass for energy production.dioxide, including ethanol plants. Algae are currently grown in BioProcess Algae’s Grower HarvesterTM reactors co-located with our Shenandoah, Iowa ethanol plant.
Ethanol Industry Overview
The ethanol industry has grown significantly over the past several years,decade, with annual reported production increasing from 1.41.6 billion gallons in 19982000 to 13.2 billion gallons in 2010, according to the U.S. Energy Information Administration.Administration, or EIA. As of February 13, 2012, the Renewable Fuels Association, or RFA, estimated that there were 209 ethanol production facilities in the United States with capacity to produce approximately 14.8 billion gallons of ethanol per year. Annual ethanol production for 2011, based upon average monthly production in the first ten months of the year, was expected to be 13.8 billion gallons. While the market prices for our feedstock commodities are volatile and at times result in unprofitable ethanol operations, during the past three years, there have been few occasions where the simple crush spread, which we define as the market value of 2.8 gallons of ethanol less the cost of one bushel of corn (which represents the typical industry yield), has dropped to below $0.10 per gallon. We believe that ethanol, as a proportion of total transportation fuels, will continue to experience increased demand in the United States as there remains a focus on reducing reliance on petroleum-based transportation fuels due to high and volatile oil prices, heightened environmental concerns, and energy independence and national security concerns. Also according to the U.S. Energy Information Administration, ethanol blends accounted for approximately 9.1% of the U.S. gasoline supply for the twelve months ended December 31, 2010. We believe ethanol’s environmental benefits, ability to improve gasoline performance, fuel supply extender capabilities, attractive production economics and favorable government incentives could enable ethanol to comprise an increasingly larger portion of the U.S. fuel supply as more fully described below:
| • | Emissions Reduction. Ethanol demand increased substantially in the 1990’s, when federal law began requiring the use of oxygenates in reformulated gasoline in cities with unhealthy levels of air pollution on a seasonal or year-round basis. These oxygenates included ethanol and MTBE which, when blended with gasoline, |
| • | Octane Enhancer. Ethanol, with an octane rating of 113, is used to increase the octane value of gasoline with which it is blended, thereby improving engine performance. It is used as an octane enhancer both for producing regular grade gasoline from lower octane blending stocks and for upgrading regular gasoline to premium grades. According to the EIA, approximately 75% of the conventional gasoline market (which is approximately 60% of the total gasoline market) has switched to producing a lower grade of gasoline, commonly referred to as CBOB. CBOB is an 84 octane sub-grade gasoline that is economical to produce. As a result, octane must be added to the fuel prior to sale to consumers. Ethanol has become the primary additive used by refiners to increase octane levels. |
| • | Fuel Stock Extender. Ethanol is a valuable blend component that is used by refiners in the United States to extend fuel supplies. According to the |
| • | E15 Blending Waiver. In |
SUVs and light pickup trucks. In January 2011, the EPA |
| • | Economics of Ethanol Blending. We believe that |
| • | Mandated Use of Renewable Fuels. |
| • | Ethanol Exports.The United States has a long history as a net importer of ethanol. According to the U.S. Department of Agriculture, or USDA, Brazil has historically been the world’s low-cost supplier of ethanol. However, the USDA stated that in 2010, the United States became the global low-cost ethanol producer, generating a trade surplus of $556.0 million. According to the RFA, U.S. ethanol exports in 2011 exceeded the volume of exports in 2010, generating approximately 1.2 billion gallons in ethanol exports in 2011. |
Our Operating Segments
Ethanol Production Segment
Our ethanol production segment hadWe have the capacity to produce approximately 680740 mmgy of ethanol as of December 31, 2010.within our ethanol production segment. Our plants use a dry mill process to produce ethanol plants also produceand co-products such as wet, modified wet or dried distillers grains. Processing at full capacity, our plants will consume approximately 245265 million bushels of corn and produce approximately 2.02.1 million tons of distillers grains annually. Our plants use a dry mill process to produce ethanol and co-products. We operate all of our ethanol plants through wholly-owned operating subsidiaries. A summary of these plants is outlined below:
| Plant | Plant Production Capacity (mmgy) | Start Date | Technology | Land Owned (acres) | On Site Corn Storage Capacity (bushels) | Plant Production Capacity (mmgy) | Start or Acquisition Date | Technology | Land Owned (acres) | On-Site Corn Storage Capacity (bushels) | On-Site Ethanol Storage Capacity (gallons) | |||||||||||||||||||
Bluffton, Indiana | 120 | Sept. 2008 | ICM | 419 | 1,040,000 | 120 | Sept. 2008 | ICM | 420 | 1,040,000 | 2,800,000 | |||||||||||||||||||
Central City, Nebraska(1) | 100 | July 2009 | ICM | 40 | 1,200,000 | 100 | July 2009 | ICM | 40 | 1,200,000 | 2,250,000 | |||||||||||||||||||
Fergus Falls, Minnesota(1) | 60 | Mar. 2011 | Delta-T | 114 | 1,325,000 | 2,000,000 | ||||||||||||||||||||||||
Lakota, Iowa(1) | 100 | Oct. 2010 | ICM/Lurgi | 230 | 1,410,000 | 100 | Oct. 2010 | ICM/Lurgi | 93 | 1,410,000 | 2,500,000 | |||||||||||||||||||
Obion, Tennessee(2) | 120 | Nov. 2008 | ICM | 230 | 2,100,000 | 120 | Nov. 2008 | ICM | 230 | 2,100,000 | 2,894,000 | |||||||||||||||||||
Ord, Nebraska(1) | 55 | July 2009 | ICM | 170 | 400,000 | 55 | July 2009 | ICM | 170 | 400,000 | 1,500,000 | |||||||||||||||||||
Riga, Michigan(1) | 60 | Oct. 2010 | Delta-T | 132 | 525,000 | 60 | Oct. 2010 | Delta-T | 138 | 525,000 | 1,239,140 | |||||||||||||||||||
Shenandoah, Iowa | 65 | Aug. 2007 | ICM | 108 | 500,000 | 65 | Aug. 2007 | ICM | 123 | 500,000 | 1,500,000 | |||||||||||||||||||
Superior, Iowa | 60 | July 2008 | Delta-T | 264 | 525,000 | 60 | July 2008 | Delta-T | 238 | 525,000 | 1,226,406 | |||||||||||||||||||
| (1) | These plants operated under different ownership prior to the stated start date. |
| (2) | We lease an additional 129 acres of land near the Obion, Tennessee plant. |
Corn Feedstock and Ethanol Production
Ethanol is a chemical produced by the fermentation of carbohydrates found in grains and other biomass. Ethanol can be produced from a number of different types of grains, such as corn, wheat and sorghum, as well as from agricultural waste products such as rice hulls, cheese whey, potato waste, brewery and beverage wastes and forestry and paper wastes. At present, the majority of ethanol in the United States is produced from corn because corn contains large quantities of
carbohydrates, can be handled efficiently and is in greater supply than other grains. Such carbohydrates convert into glucose more easily than most other kinds of biomass. Outside the United States, sugarcane is the primary feedstock used in ethanol production.
Our plants use corn as feedstock in the dry mill ethanol production process. Each of our plants requires, depending on their production capacity, approximately 20 million to 40 million bushels of corn annually. The price and availability of corn are subject to significant fluctuations depending upon a number of factors that affect commodity prices in general, including crop conditions, weather, governmental programs and foreign purchases. Because the market price of ethanol is not directly related to corn prices, ethanol producers are generally not able to compensate for increases in the cost of corn feedstock through adjustments to prices charged for their ethanol.
Our corn supply is obtained primarily from local markets. We utilize cash and forward fixed-pricepurchase contracts with grain producers and elevators for the physical delivery of corn to our plants. At our Iowa (except Lakota), Minnesota, Nebraska Tennessee and IowaTennessee plants, we maintain relationships with local farmers, grain elevators and cooperatives which serve as our primary sources of grain feedstock. Most farmers in the areas where our plants are located have stored their corn in their own dry storage facilities, which allows us to purchase much of the corn needed to supply our plants directly from farmers throughout the year. At our Bluffton,Indiana, Michigan and Lakota, and RigaIowa plants, we have contracted with a third-party grain originatororiginators to supply all of our corn requirements for ethanol production. These contracts terminate between November 2012 and September 2015. Each of our plants is also situated on rail lines that we can use to receive corn from other regions of the country, if local corn supplies are insufficient.
Corn is received at the plant by truck or rail, which is then weighed and unloaded in a receiving building. Storage bins are utilized to inventory grain, which is passed through a scalper to remove rocks and debris prior to processing. Thereafter, the corn is transported to a hammer mill where it is ground into coarse flour and conveyed into a slurry tank for enzymatic processing. Water, heat and enzymes are added to convert the complex starch molecules into simpler carbohydrates. The slurry is heated to reduce the potential of microbial contamination and pumped to a liquefaction tank where additional enzymes are added. Next, the grain slurry is pumped into fermenters, where yeast, enzymes, and nutrients are added, to begin a batch fermentation process. A beer column, within the distillation system, separates the alcohol from the spent grain mash. Alcohol is then transported through a rectifier column, a side stripper and a molecular sieve system where it is dehydrated to 200 proof. The 200 proof alcohol is then pumped to a holding tank and then blended with approximately two percent denaturant (usually natural gasoline) as it is pumped into finished product storage tanks.
Distillers Grains
The spent grain mash from the beer column is pumped into one of several decanter type centrifuges for dewatering. The water, or thin stillage, is pumped from the centrifuges and then to an evaporator where it is dried into a thick syrup. The solids, or wet cake, that exits the centrifuge are conveyed to the dryer system. The wet cake is dried at varying degrees,temperatures, resulting in the production of distillers grains. Syrup might be reapplied to the wet cake prior to drying, providing additional nutrients ifto the distillers grains are to be used as animal feed.grains. Distillers grains, the principal co-product of the ethanol production process, are principally used as high-protein, high-energy animal fodder and feed supplements marketed to the dairy, beef, swine and poultry industries. Distillers grains have alternative uses as burning fuel, fertilizer and weed inhibitors.
Dry mill ethanol processing potentially creates three forms of distillers grains, depending on the number of times the solids are passed through the dryer system; wet, modified wet and dried distillers grains. Wet distillers grains are processed wet cake that contains approximately 65% to 70% moisture. Wet distillers grains have a shelf life of approximately three days and can be sold only to dairies or feedlots within the immediate vicinity of an ethanol plant. Modified wet distillers grains, which have been dried further to approximately 50% to 55% moisture, have a slightly longer shelf life of approximately three weeks and are marketed to regional dairies and feedlots. Dried distillers grains, which have been dried more extensively to approximately 10% to 12% moisture, have an almost indefinite shelf life and may be stored, sold and shipped to any market regardless of its proximity to an ethanol plant.
Utilities
The production of ethanol requires significant amounts of natural gas, electricity and water.
Natural Gas. Ethanol plants produce process steam from their own boiler systems and dry the distillers grains co-product via a direct gas-fired dryer. Depending on certain production parameters, our ethanol plants are expected to use approximately 22,000 to 32,000 British Thermal Units of natural gas per gallon of production. The price of natural gas can be
volatile; therefore, we use hedging strategies to mitigate increases in gas prices. We have entered into certain service agreements for the natural gas required by our ethanol plants and pay tariff fees to these providers for transporting the gas through their pipelines to our plants.
Electricity. Our plants require between 0.5 and 1.0 kilowatt hours of electricity per gallon of production. Local utilities supply necessary electricity to all of our ethanol plants at market-based rates.
Water. Although some of our plants expect to satisfy the majority of their water requirements from wells located on their respective properties, each anticipates that it will obtainplant also obtains potable water for certain processes from local municipal water sources at prevailing rates. Each facility operates a filtration system to purify the well water that is utilized for its operations. Local municipalities supply all of the necessary water for our plants that do not have onsite wells. Water quality is very important. Much of the water used in an ethanol plant is recycled back into the process. The plants require boiler makeup water and cooling tower water. Boiler makeup water is treated on-site to minimize minerals and substances that would harm the boiler. Recycled process water cannot be used for this purpose. Cooling tower water is deemed non-contact water (it does not come in contact with the mash) and, therefore, can be regenerated back into the cooling tower process.
Corn Oil Production Segment
We operate corn oil extraction systems at all nine of our ethanol plants. The corn oil systems are designed to extract non-edible corn oil from the thin stillage evaporation process immediately prior to production of distillers grains. Corn oil is produced by processing syrup and evaporated thin stillage, through a decanter style centrifuge or a disk stack style centrifuge. Corn oil has a lower density than water or solids which make up the syrup. The centrifuges separate the relatively light oil from the heavier components of the syrup, eliminating the need for significant retention time. De-oiled syrup is returned to the process for blending into wet, modified, or dry distillers grains.
Industrial uses for corn oil include feedstock for biodiesel, livestock feed additives, rubber substitutes, rust preventatives, inks, textiles, soaps and insecticides. Our corn oil is primarily sold to biodiesel manufactures and, to a lesser extent, feed lot and poultry markets. We generally transport our corn oil by truck to locations in a close proximity to our ethanol plants, primarily in the southeastern and midwestern regions of the United States.
Agribusiness Segment
We operate our agribusiness segment primarily through our wholly-owned subsidiary, Green Plains Grain Company LLC, which is a grain and farm supply business with three primary operating lines of business: bulk grain, agronomy and petroleum. We have seven locations in northwestern Iowa with approximately 19.6 million bushels of grain storage capacity, 3.6 million gallons of liquid fertilizer storage and 12,000 tons of dry fertilizer storage. We operate at five locations in western Tennessee with grain storage capacity of approximately 13.7 million bushels. We also own and operate grain elevators in Essex, Iowa, Hopkins, Missouri and St. Edward, Nebraska, with grain storage capacities of approximately 1.9 million, 2.0 million and 1.9 million bushels, respectively. We believe our agribusiness operations increase our operational efficiency, reduce commodity price and supply risks, and diversify our revenue streams.
Bulk Grain. We buy bulk grain, primarily corn, wheat, and soybeans, from area producers and provide grain drying and storage services to those producers. The grain is then sold to grain processing companies and area livestock producers. We have grain storage capacity of approximately 31.439.1 million bushels, not including the on-site storage capacity at each of our ethanol plants. This capacity supports the grain merchandising activities andat our Central City, Lakota, Obion, Ord, Shenandoah and Superior ethanol plant operations.plants. These bulk grain commodities are readily traded on commodity exchanges and inventory values are affected by market changes and spreads. To attempt to reduce risk due to market fluctuations from purchase and sale commitments, we enter into exchange-traded futures and options contracts designed to serve as economic hedges.
Agronomy. We have agronomists on staff who consult and provide services to our customers. The agronomy division also sells dry and liquid fertilizer and agricultural inputs, such as chemicals, seed and supplies that we buy wholesale, and provides application services to area producers. Having these experts on staff,
coupled with the wide variety of agricultural products we offer, allows us to provide customized attention and build long-term relationships with our customers.
Petroleum. A portion of our business consists of selling diesel, soydiesel, blended gasoline and propane that we buy wholesale, primarily to agricultural producers and consumers. We believe this business line demonstrates our ability to provide a range of fuel products that support the local communities in which we are located.
We own approximately 134 acres of land in seven locations in Northwest Iowa, near our Superior ethanol plant, for our agribusiness operations with licensed grain storage capacity of approximately 16.9 million bushels, 3.6 million gallons of liquid fertilizer storage and 12,000 tons of dry fertilizer storage. We own approximately 38 acres of land in five locations in western Tennessee, in the general region of our Obion ethanol plant, for our agribusiness operations with licensed grain storage capacity of approximately 11.7 million bushels. We also own approximately 11 additional acres of land at our grain elevator in Essex, Iowa, near our Shenandoah ethanol plant, with licensed grain storage capacity of approximately 2.8 million bushels.
Seasonality is present within our agribusiness operations. The spring planting and fall harvest periods have the largest seasonal impact, directly impacting the quarterly operating results of our agribusiness segment. This seasonality generally results in higher revenues and stronger financial results for this segment during the second and fourth quarters while the financial results of the first and third quarters generally will reflect periods of lower activity with low to negative margins.
Marketing and Distribution Segment
We have an in-house fee-based marketing business which is responsible for sales of Company-produced corn oil, along withthe sale, marketing and distribution of all ethanol, and distillers grains and corn oil produced at our eightnine ethanol plants. We also market and distribute ethanol for third-party ethanol producers. Assuming full production capacity at each of our plants and those of our third-party ethanol producers, we would market and distribute more than one billion gallons of ethanol. Our majority interest in Blendstar allowsethanol on an annual basis. Additionally, within the marketing and distribution segment, we operate nine blending or terminaling facilities, with approximately 625 mmgy of total throughput capacity, allowing us to source, store, blend and distribute biodiesel and ethanol, including our production and that of other producers, across multiple states.
Marketing
We market our ethanol and that of our third-party producers to many different customers on a local, regional and national basis. In addition, during 2010 we began purchasingpurchase ethanol from other independent producers to realize price arbitrages that may exist. These transactions are expected to increase in volume in 2011. Local markets are the easiest to service because of their close proximity to the related production facility. To achieve the best prices for the ethanol that we market, we sell into local, regional and national markets under sales agreements with integrated energy companies, jobbers, retailers, traders and resellers. Under these agreements, ethanol is priced under fixed and indexed pricing arrangements. Local markets are the easiest to service because of their close proximity to the related production facility. Deliveries to the majority of the local markets, within 150 miles of the plants, are generally transported by truck, and deliveries to more distant markets are shipped by rail using major U.S. rail carriers.
The market for distillers grains generally consists of local markets for wet, modified wet and dried distillers grains, and national markets for dried distillers grains. If our plants operate at full capacity and all of our distillers grains were marketed in the form of dried distillers grains, we expect that our ethanol plants would produce approximately 2.02.1 million tons of distillers grains annually. In addition, the market can be segmented by geographic region and livestock industry. The bulk of the current demand is for dried distillers grains delivered to geographic regions without significant local corn or ethanol production. Our market strategy includes shipping a substantial amount of distillers grains as dried distillers grains to regional and national markets by rail.
Most of our modified wet distillers grains are sold to midwestern feedlot markets. Our dried distillers grains are generally shipped to feedlot and poultry markets, as well as to Texas and west coast rail markets. Some of our
distillers grains are shipped by truck to dairy, beef, and poultry operations in the eastern United States. Also, at certain times of the year, we transport product to the Mississippi River to be loaded on barges destined for export markets.barges. We also ship by railcars into Eastern and Southeastern feed mill, poultry and dairy operations, as well as to domestic trade companies. Access to these markets allows us to move product into markets that are offering the highest net price.
Corn Oil
Recently, we began implementing corn oil extraction technology at our six legacy ethanol plants. We expect the implementation of corn oil extraction at our plants will be completed by the end of the second quarter of 2011. As of December 31, 2010, we were operating corn oil extraction systems at our Lakota, Obion, Ord and Riga plants. The corn oil systems are designed to extract non-edible corn oil from the thin stillage evaporation process immediately prior to production of distillers grains. Corn oil is produced by processing syrup and evaporated thin stillage, through a decanter style centrifuge or a disk stack style centrifuge. Corn oil has a lower density than water or solids which make up the syrup. The centrifuges separate the relatively light oil from the heavier components of the syrup, eliminating the need for significant retention time. De-oiled syrup is returned to the process for blending into wet, modified, or dry distillers grains. The corn oil product is primarily marketed as a livestock feed supplement or to the biodiesel market.
Industrial uses for corn oil include feedstock for biodiesel, livestock feed additives, rubber substitutes, rust preventatives, inks, textiles, soaps and insecticides. Our corn oil is primarily sold to biodiesel manufactures and, to a lesser extent, feed lot and poultry markets. We generally transport our corn oil by truck to locations in a close proximity to our ethanol plants, primarily in the southeastern and midwestern regions of the U.S.
Transportation and Delivery
Four of our plants are designed with unit-train load out capabilities and all have access to railroad mainlines. To meet the challenge of marketing ethanol and distillers grains to diverse market segments, five of our plants have extensive rail siding capable of handling more than 150 railcars at their production facilities whileand the three other four plants have rail siding that can accommodate approximately 90 railcars at their respective locations. At certain of our locations, we have large loop tracks which enable loading of unit trains of both ethanol and dried distillers grains, as well as spurs connecting the site’s rail loop to the railroad mainline or spurs that allow movement and storage of railcars on-site. These rail lines allow us to sell our products to various regional and national markets. The rail providers for our ethanol plants can switch cars to most of the other major railroads, allowing the plants to easily ship ethanol and distillers grains throughout the United States. Our railcar fleet is comprised of approximately 1,790 leased tank cars for the transportation of ethanol and approximately 770 leased hopper cars for the transportation of distillers grains. The lease contract terms range from six months to ten years. We seek to optimize the utilization of our rail assets, including potential use for transportation of products other than ethanol and distillers grains, depending on market opportunities.
Ethanol Blending and Distribution
We hold a majority interest in Blendstar, a biofuels terminal operator that ownsown and operatesoperate biofuel holding tanks and terminals, and providesprovide terminaling, splash blending and logistics solutions through our wholly-owned subsidiary, BlendStar LLC, to markets that currently do not have efficient access to
renewable fuels. BlendstarBlendStar operates blending and terminaling facilities at one owned and eight leased locations on approximately 19 acres in seven states with a combined total storage capacity of approximately 700,000820,000 gallons and throughput capacity of approximately 495625 mmgy. TheseThe BlendStar facilities are summarized below:
| Facility Location | Storage Capacity (gallons) | Throughput Capacity (mmgy) | Storage Capacity (gallons) | Throughput Capacity (mmgy) | ||||||||||
Birmingham, Alabama | 120,000 | 96 | 120,000 | 130 | ||||||||||
Little Rock, Arkansas | 30,000 | 36 | 30,000 | 36 | ||||||||||
Louisville, Kentucky | 60,000 | 30 | 60,000 | 30 | ||||||||||
Bossier City, Louisiana(1) | - | 60 | 60,000 | 60 | ||||||||||
Collins, Mississippi | 120,000 | 84 | 180,000 | 180 | ||||||||||
Oklahoma City, Oklahoma | 150,000 | 84 | 150,000 | 84 | ||||||||||
Tulsa, Oklahoma | - | 24 | — | �� | 24 | |||||||||
Knoxville, Tennessee | 60,000 | 21 | 60,000 | 21 | ||||||||||
Nashville, Tennessee | 160,000 | 60 | 160,000 | 60 | ||||||||||
(1) Five acre
| (1) | Five-acre facility is owned by BlendStar. |
In November 2011, we announced plans to build, own and operate a new ethanol unit train terminal in Birmingham, Alabama on the BNSF Railway. The new terminal will have 160,000 barrels, or approximately 6.7 million gallons, of storage capacity and will be able to receive full 96-car unit trains of ethanol, which can be offloaded within 24 hours. The terminal is expected to be completed in the fourth quarter of 2012. BlendStar’s existing Birmingham terminal will be retrofitted to handle other biofuels and liquid products when construction of the new unit train terminal facility is owned by Blendstar.complete.
Risk Management and Hedging Activities
The profitability of our operations and our industry are highly dependent on commodity prices, especially prices for corn, ethanol, distillers grains and natural gas. Because the market pricesprice fluctuations among these commodities are not always correlated, at times ethanol production may be unprofitable. We believe that ineffective commodity price risk management was a primary reason for the distressed conditions the ethanol industry faced in late 2008 and through the first 6 months of 2009 as ethanol producers had entered into fixed-price corn contracts, or built large inventory positions, in order to ensure corn supply. When corn and ethanol prices declined, these producers were unable to profitably produce ethanol given their higher feedstock costs. We believe the ethanol industry as a whole has and continues to demonstrate more discipline on utilizing risk management tools to avoid the issues experienced in late 2008 and early 2009.
We enter into forward contracts to supply a portion of our respective ethanol and distillers grains production or to purchase a portion of our respective corn or natural gas requirements in an attempt to partially offset the effects of volatility of ethanol, distillers grains, corn and natural gas prices. To a much lesser extent, we also engage in other hedging transactions involving exchange-traded futures contracts for corn, natural gas and ethanol from time to time. The financial statement impact of these activities is dependent upon, among other things, the prices involved and our ability to physically receive or deliver the commodities involved. Hedging arrangements also expose us to the risk of financial loss in situations where the counterparty to the hedging contract defaults on its contract or, in the case of exchange-traded contracts, where there is a change in the expected differential between the price of the commodity underlying the hedging agreement and the actual prices paid or received by us for the physical commodity bought or sold. Hedging activities can themselves result in losses when a position is purchased in a declining market or a position is sold in a rising market. A hedge position is often settled in the same time frame as the physical commodity is either purchased (corn and natural gas) or sold (ethanol, distillers grains and corn oil). Hedging losses may be offset by a decreased cash price for corn and natural gas and an increased cash price for ethanol, distillers grains and corn oil. We also vary the amount of hedging or other risk mitigation strategies we undertake, and we may choose not to engage in hedging
transactions at all. By using a variety of risk management tools and hedging strategies, including our internally-developed real-time operating margin management system, we believe our approach to risk management allows us to monitor real-time operating price risk exposure at each of our plants and to respond quickly to lock in acceptable margins when they are available or temporarily reduce production levels at our ethanol plants during periods in which we have identified compressed margins. In addition, our multiple business lines and revenue streams help diversify our operations and profitability.
Merger and Acquisition Activity
In October 2008, we completed a merger with VBV, LLC that resulted in our ownership of the Bluffton and Obion plants. Simultaneously with the closing of the merger, NTR plc, a leading international developer and operator in renewable energy and sustainable waste management and the majority equity holder of VBV prior to the merger, through its wholly-owned subsidiaries, invested $60 million in us by purchasing newly-issued shares of our common stock.
In January 2009, we acquired a majoritycontrolling interest in biofuel terminal operator Blendstar, LLC for $8.9 million.BlendStar LLC. The acquisition of BlendstarBlendStar was a strategic investment within the ethanol value chain whose operations are included in our marketing and distribution segment.
In July 2009, we acquired the membership interests in two limited liability companies that owned ethanol plants in Central City and Ord, Nebraska for approximately $121 million.Nebraska. These plants, which are a part of our ethanol production segment, were acquired to add to our overall ethanol and distillers grains production. The Central City and Ord plants added expected operating capacity totaling 150 mmgy. Following implementation of process improvements, collectively they are now operating athave production capacity of approximately 155 mmgy.
In April 2010, we acquired agribusiness operations in western Tennessee which includeincluded five grain elevators with federally licensed grain storage capacity of 11.7 million bushels for $25.7 million.bushels. The five grain elevators and other assets acquired are included in our agribusiness segment.
In October 2010, we acquired Global Ethanol, LLC, which owned two operating ethanol plants with a combinedin Lakota, Iowa and Riga, Michigan. These plants have production capacity of approximately 157 mmgy for approximately $174.2 million. These plants, which currently are operating at approximately 160 mmgy and are part of our ethanol production segment, were acquired to add to our overall ethanol, distillers grains and corn oil production.
In FebruaryMarch 2011, we announced that our bid to purchase certain assets of Otter Tail Ag Enterprises, LLC was accepted by the bankruptcy court overseeing the auction process. The 55 mmgy dry-millacquired an ethanol plant being acquired is locatedand certain other assets near Fergus Falls, Minnesota. The asset purchase is expected to close in March 2011. We will finance the $55 million acquisition with cash and financing from a group of nine lenders, led by AgStar Financial Services. The expected impact of this transaction on ourplant has production capacity of approximately 60 mmgy, adding to our ethanol, distillers grains and corn oil production and is part of our ethanol production segment. We are constructing 1.6 million bushels of additional grain storage capacity at the Otter Tail plant with completion expected in 2012.
In June 2011, we acquired 2.0 million bushels of grain storage capacity located in Hopkins, Missouri. The grain elevator is located approximately 45 miles from our Shenandoah, Iowa ethanol plant and is included in our agribusiness segment.
In July 2011, we acquired the 49% interest in biofuel terminal operator BlendStar LLC that we did not previously own. BlendStar, whose operations has not beenare included throughout this report as the transaction had not closed asin our marketing and distribution segment, provides ethanol transload and splash blending services.
In January 2012, we acquired 1.9 million bushels of the date of this filing.grain storage capacity located in St. Edward, Nebraska. The grain elevator is located approximately 40 miles from our Central City, Nebraska ethanol plant and is included in our agribusiness segment.
Algae Joint Venture
In November 2008, we formed a joint venture, BioProcess Algae LLC, between us, Clarcor Inc., BioHoldings, Ltd. and NTR plc, to commercialize algae production as part of our commitment to next-generation biofuels. BioProcess Algae LLC is a joint venture between us, Clarcor Inc., BioProcessH2O LLCfocused on developing technology to grow and NTR. Using advanced photobioreactor technology developed from base technology licensed from BioProcessH2O, BioProcess Algae currently is producingharvest algae, at a pilot plant located at our Shenandoah ethanol plant, sustained by the plant’s recycled heat, water andwhich consume carbon dioxide.dioxide in commercially viable quantities. We believe algae production fits well into our business model since we already engage in the business of marketing biofuel and feed products. The algae produced have the potential to be used for advanced bio-fuel production, high quality animal feed, or as biomass for energy production, but ourthe current primary focus is on efficiently capturing carbon dioxide to grow and harvest algae.
Using advanced photobioreactor technology developed from base technology licensed from BioProcessH2O LLC, BioProcess Algae currently is producing algae at a pilot plant located at our ethanol plant in Shenandoah, Iowa, sustained by the plant’s recycled heat, water and carbon dioxide. Construction of Phase II which began during the third quarter of 2010, was completed and the Grower HarvesterHarvesters™ bioreactors were successfully started up in January 2011. Phase II allows for verification of growth rates, energy balances and operating expenses, which are considered to be some of the key steps to commercialization. The Iowa Power Fund awarded BioProcess Algae an additional grant to continue the research and development of the Grower Harvester technology, and the remaining cost of the Phase II project was shared by the joint venture partners. As part of the Phase II funding, we increased our ownership in BioProcess Algae to 35%.
During the third quarter of 2011, BioProcess Algae constructed an outdoor Grower Harvester system next to our Shenandoah ethanol plant, and began successfully producing algae. BioProcess Algae also successfully completed its first round of algae-based poultry feed trials, in conjunction with the University of Illinois. The algae strains produced by the Grower Harvester system for the feed trials demonstrated high energy and protein content that was readily available, similar to other high value feed products used in the feeding of poultry today.
BioProcess Algae broke ground on a five acre algae farm in the first quarter of 2012 at the same location. If we and the other BioProcess Algae members determine that the venture can achieve the desired economic performance from the five acre farm, a build-out of 400 acres of Grower Harvester reactors will be considered. The cost of such a build-out is estimated at $40 million to $60 million and could take up to a year to complete. Funding for BioProcess Algae for such a project would come from a variety of sources including current partners, new equity investors, debt financing or a combination thereof. If a decision was made to replicate such a 400 acre algae farm at all of our ethanol plants, we estimate that the required investment could range from $300 million to $500 million. BioProcess Algae currently is exploring potential algae markets including animal feeds, nutraceuticals and biofuels.
Our Competition
Domestic Ethanol Competitors
We compete with numerous other ethanol producers located throughout the United States, several of which have much greater resources, in the sales of ethanol and distillers grains. In 2010,2011, the three largest ethanol producers in North America were Archer-Daniels-Midland Company, POET, LLC and Valero Energy Corporation. We believe that our principal competitors’ expected managed production capacity and ethanol marketed ranges between approximately 200 mmgy and approximately 1,800 mmgy. Based on production capacity as reported by Ethanol Producer Magazine, we believe we are the fourth largest ethanol producer in North America. According to Ethanol Producer Magazine, as of December 31, 2010,2011, there were 214218 ethanol-producing plants within the United States, capable of producing 14.114.8 billion gallons of ethanol annually, as well as several new plants that were under construction or expanding their capacity. The industry typically does not operate at 100% of capacity with historical rates of annual production to available plant capacity averaging in the high 80 percent to the low 90 percent range. We believe that by the end of 2011,2012, annual U.S. ethanol production capacity could reach 14.515.0 billion gallons.
Competition for corn supply from other ethanol plants and other corn consumers exists in all areas and regions in which our plants operate. According to Ethanol Producer Magazine, as of December 31, 2010, there were2011, the states of Iowa, Indiana, Michigan, Minnesota, Nebraska and Tennessee had a total of 107 operating ethanol plants. The state of Iowa had 42 operationaloperating ethanol plants in Iowa. The plants are concentrated, for the most part, in the northern and central regions of the state where a majority of the corn is produced. As of December 31, 2010, theThe state of Nebraska had 25 operating ethanol plants and one under construction. The state of Indiana had 13 operating ethanol plants with one under construction. The state of Tennessee had only two operational ethanol production facilities. The state of Michigan had 5 operational ethanol plants.
Foreign Ethanol Competitors
We also face competition from foreign producers of ethanol and such competition may increase significantly in the future. Large international companies with much greater resources than ours have developed, or are developing, increased foreign ethanol production capacities. Brazil is the world’s second largest ethanol producer. Brazil makes ethanol primarily from sugarcane. Several large companies produce ethanol in Brazil. For example, in August 2010, Royal Dutch Shell formed a joint venture with Cosan, which produces approximately 450 mmgy of sugar-basedsugarcane-based ethanol per year.
Ethanol produced in foreign countries, from sugarcane or other feed stocks imported into the United States, is subject to an import tariff of $0.54 per gallon. Production imported from the Caribbean region is eligible for tariff reduction or elimination under a program known as the Caribbean Basin Initiative. Large multinational companies have expressed interest in building dehydration plants in participating Caribbean Basin countries, such as El Salvador, which would convert ethanol into fuel-grade ethanol for shipment to the United States. Depending on feed stock prices, ethanol imported from Caribbean Basin countries may be less expensive than domestically-produced ethanol though transportation and infrastructure constraints may temper the market impact on the United States.
Other Competition
Alternative fuels, gasoline oxygenates and ethanol production methods are continually under development by ethanol and oil companies. Ethanol production technologies continue to evolve, and changes are expected to occur primarily in the area of ethanol made from cellulose obtained from other sources of biomass such as switchgrass or fast growing poplar trees. Because our plants are designed as single-feedstock facilities, we have limited ability to adapt the plants to a different feedstock or process system without additional capital investment and retooling.
Regulatory Matters
Government Ethanol Programs, Policies and Subsidies
In an effort to reduce this country’s dependence on foreign oil, federal and state governments have enacted numerous policies, incentives and subsidies to encourage the usage of domestically-produced alternative fuel solutions. The U.S. ethanol industry has benefited significantly as a direct result of these policies. While historically the ethanol industry has been dependent on economic incentives, the need for such incentives has and may continue to diminish as the acceptance of ethanol as a primary fuel and as a fuel extender continues to increase.
Passed in 2007 as part of the Energy Independence and Security Act, a federal Renewable Fuels Standard, or RFS, has been and will continue to be a driving factor in the growth of ethanol usage. As mandated by the RFS, 12.6 billion gallons of conventional biofuels, which corn-based ethanol falls under, mustwere required to be blended into the U.S. fuel supply in 2011. This requirement progressively increases up2011, increasing to 15.0 billion gallons per year by the year 2015. The RFS Flexibility Act was introduced on October 5, 2011 in the U.S. House of Representatives to reduce or eliminate the volumes of renewable fuel use required by RFS based upon corn stocks-to-use ratios. The Domestic Alternative Fuels Act of 2012 was introduced on January 18, 2012 in the U.S. House of Representatives to modify the RFS to include ethanol and other fuels produced from fossil fuels like coal and natural gas. We believe the RFS is a significant component of national energy policy that reduces dependence on foreign oil by the United States. As a result, we believe that the RFS Flexibility Act and the Domestic Alternative Fuels Act will not garner sufficient support to be enacted; however, no assurance can be provided.
To further drive growth in the increased adoption of ethanol, Growth Energy, an ethanol industry trade association, and a number of ethanol producers requested a waiver from the EPA to increase the amount of ethanol blended into gasoline from the current 10% level, or E10, to a 15% level, or E15. In October 2010, the EPA approvedgranted a partial waiver for E15 for use in model year 2007 and newer model passenger vehicles, including cars, SUVs and light pickup trucks. In January 2011, the EPA ruled thatgranted a second partial waiver for E15 was also approved for use in model year 2001 through 2006 passenger vehicles. The Department of Energy is funding research by two Kettering University mechanical engineering professors on how cars from the 1990s react to E15. The Kettering study is among several that may helpOn February 17, 2012, the EPA determine whetherannounced that evaluation of the health effects tests on E15 is safeare complete and that fuel manufacturers are now able to register E15 with the EPA to sell. Over 141 million vehicles, or 60% of the passenger vehicles in older cars. We believe this increased blend rate will have a positive impact on demand for ethanol.service, would be eligible to use E15.
Another majorprevious benefit to the industry iswas the Volumetric Ethanol Excise Tax Credit, or VEETC (often commonly referred to as the “blender’s credit”) created by the American Jobs Creation Act of 2004. This credit allowsallowed gasoline distributors who blend ethanol with gasoline to receive a federal excise tax credit of $0.45 per gallon of pure ethanol used, or $0.045 per gallon for E10 and $0.3825 per gallon for E85. Currently,The credit expired on December 31, 2011 and the blender’s creditimpact on ethanol demand is setuncertain at this time.
Ethanol produced in foreign countries, from sugarcane or other feed stocks imported into the United States, was previously subject to expire inan import tariff of $0.54 per gallon. The import tariff expired on December 31, 2011. There canProduction imported from the Caribbean region was eligible for tariff reduction or elimination under a program known as the Caribbean Basin Initiative. Depending on feed stock prices, ethanol imported from foreign countries may be no assurances thatless expensive than domestically-produced ethanol though foreign demand, transportation costs and infrastructure constraints may temper the blenders’ credit will be extended at the end of 2011.
In July 2010, Growth Energy called for the redirection and eventual phasing out of government support for ethanol in return for a level playing field in fuel distribution. The “Fueling Freedom” plan calls for the phasing out of the blenders credit and import tariff over time, by redirecting a portion of those funds to build out the infrastructure for the distribution and use of ethanol, and shifting the remaining portion away from oil companies. The primary elements of the plan include:
VEETC credits currently going to the oil industry as an incentive for blending ethanol into gasoline would be redirected to provide incentive for the build-out of distribution infrastructure for ethanol, possibly in the form of tax credits for retailers to install 200,000 blender pumps and federal backing of ethanol pipelines. This would provide Americans the access to choose ethanol in an open and free market and would allow for the elimination of the tax supports over time.
Requiring that all automobiles sold in the United States be flex-fuel vehicles. Assuming that consumers purchase an average of 14 to 15 million vehicles annually, it would take an estimated nine years to replace the 120 million vehicles inimpact on the United States. This would require no additional cost to taxpayers and a minimal costHowever, the impact of approximately $120 per vehicle to vehicle manufacturers.the expired tariff on the demand for domestically-produced ethanol is uncertain at this time.
Changes in corporate average fuel economy, or CAFE, standards have also benefited the ethanol industry by encouraging use of E85 fuel products. CAFE provides an effective 54% efficiency bonus to flexible-fuel vehicles running on E85. Though E85 is not in widespread use today, auto manufacturers may find it attractive to build more flexible-fuel trucks and sport utility vehicles that are otherwise unlikely to meet CAFE standards.
On July 21, 2010, President Obama signed the Dodd-Frank Wall Street Reform and Consumer Protection Act, or the Reform Act, which, among other things, aims to improve transparency and accountability in derivative markets. While the Reform Act increases the regulatory authority of the Commodity Futures Trading Commission, or CFTC, regarding over-the-counter derivatives, there is uncertainty on several issues related to market clearing, definitions of market participants, reporting, and capital requirements. While many details remain to be addressed in CFTC rulemaking proceedings, at this time we do not anticipate any material impact to our risk management strategy.
In addition to these federal standards, many states have taken other steps to encourage ethanol consumption including tax credits, mandated blend rates and subsidies.
Environmental and Other Regulation
Our ethanol production and agribusiness activities are subject to environmental and other regulations. We obtain environmental permits to construct and operate our ethanol plants.
Ethanol production involves the emission of various airborne pollutants, including particulate, carbon dioxide, oxides of nitrogen, hazardous air pollutants and volatile organic compounds. In 2007, the U.S. Supreme Court classified carbon dioxide as an air pollutant under the Clean Air Act in a case seeking to require the EPA to regulate carbon dioxide in vehicle emissions. In February 2010, the EPA released its final regulations on the Renewable Fuels Standard, or RFS 2. We believe these final regulations grandfather our plants at their current operating capacity, though expansion of our plants will need to meet a threshold of a 20% reduction in greenhouse gas, or GHG emissions from a 2005 baseline measurement to produce ethanol eligible for the RFS 2 mandate. In order to expand capacity at our plants, we may be required to obtain additional permits, install advanced technology, or reduce drying of certain amounts of distillers grains.
Separately, the California Air Resources Board, or CARB, has adopted a Low Carbon Fuel Standard, or LCFS, requiring a 10% reduction in GHG emissions from transportation fuels by 2020. An Indirect Land Use Change component is included in this lifecycle GHG emissions calculation, though this standard is being challenged by numerous lawsuits. On December 29, 2011, the U.S. District Court for the Eastern District of California issued several rulings in federal lawsuits challenging the LCFS. One of the rulings preliminarily prevents CARB from enforcing these regulations during the pending litigation. On January 23, 2012, CARB unsuccessfully attempted to appeal these rulings in the U.S. District Court for the Eastern District of California and on January 26, 2012 filed another appeal with the Ninth Circuit Court of Appeals.
Part of our business is regulated by environmental laws and regulations governing the labeling, use, storage, discharge and disposal of hazardous materials. Our agribusiness operations are subject to government regulation and regulation by certain private sector associations. Production levels, markets and prices of the grains we merchandise are affected by federal government programs, which include acreage control and price support programs of the U.S. Department of Agriculture, or USDA. In addition, grain that we sell must conform to official grade standards imposed by the USDA. Other examples of government policies that can have an impact on our business include tariffs, duties, subsidies, import and export restrictions and outright embargos.
We also employ maintenance and operations personnel at each of our ethanol plants. In addition to the attention that we place on the health and safety of our employees, the operations at our facilities are governed by the regulations of the Occupational Safety and Health Administration, or OSHA.
Employees
As of December 31, 2010,2011, we had 605665 full-time, part-time and temporary or seasonal employees. At that date, we employed 72100 people, including 3544 employees of our subsidiary, Green Plains Trade Group LLC, at our corporate office in Omaha, 111152 employees at our Iowa agribusiness operations, 435 employees at our Tennessee agribusiness operations, 10 employees at BlendstarBlendStar and the remainder at our eightnine ethanol plants.
Available Information
Our annual reports on Form 10-K, quarterly reports on Form 10-Q, current reports on Form 8-K and amendments to those reports filed or furnished pursuant to Section 13(a) or 15(d) of the Securities Exchange Act of 1934 (the “Exchange Act) are available free of charge on our website atwww.gpreinc.com as soon as reasonably practicable after we file or furnish such information electronically with the SEC. Also available on our website in our corporate governance section are the charters of our audit, compensation, and nominating committees, and a copy of our code of conduct and ethics that applies to our directors, officers and other employees, including our Chief Executive Officer and all senior financial officers. The information found on our website is not part of this or any other report we file with or furnish to the SEC.
The public may read and copy any materials we file with the SEC at the SEC’s Public Reference Room at 100 F Street, NE, Washington, DC 20549. The public may obtain information on the operation of the Public Reference Room by calling the SEC at 1-800-SEC-0330. The SEC also maintains an Internet site that contains reports, proxy and information statements, and other information regarding issuers that file electronically with the SEC athttp://www.sec.gov.
We operate in an evolving industry that presents numerous risks. Many of these risks are beyond our control and are driven by factors that often cannot be predicted. Investors should carefully consider the risk factors set forth below, as well as the other information appearing in this report, before making any investment in our securities. If any of the risks described below or in the documents incorporated by reference in this report actually occur, our financial results, financial condition or stock price could be materially adversely affected. These risk factors should be considered in conjunction with the other information included in this report.
Risks relating to our business and industry
Our results of operations and ability to operate at a profit is largely dependent on managing the spread among the prices of corn, natural gas, ethanol and distillers grains, the prices of which are subject to significant volatility and uncertainty.
The results of our ethanol production business are highly impacted by commodity prices, including the spread between the cost of corn and natural gas that we must purchase, and the price of ethanol and distillers grains that we sell. Prices and supplies are subject to and determined by market forces over which we have no control, such as weather, domestic and global demand, shortages, export prices, and various governmental policies in the United States and around the world. As a result of price volatility for these commodities, our operating results may fluctuate substantially. Increases in corn or natural gas prices or decreases in ethanol or distillers grains prices may make it unprofitable to operate our plants. No assurance can be given that we will be able to purchase corn and natural gas at, or near, current prices and that we will be able to sell ethanol or distillers grains at, or near, current prices. Consequently, our results of operations and financial position may be adversely affected by increases in the price of corn or natural gas or decreases in the price of ethanol or distillers grains.
We continuously monitor the profitability of our ethanol plants with a variety of risk management tools, including our internally-developed real-time operating margin management system. In early 2006,recent years, the spread between ethanol and corn prices was at historically high levels, driven in large part by oil companies removing a competitive product, methyl tertiary butyl ether, or MTBE, from the fuel stream and replacing it with ethanol in a relatively short time period. However, since that time, this spread has fluctuated widely and narrowed significantly. Fluctuations are likely to continue to occur. A sustained narrow spread or any further reduction in the spread between ethanol and corn prices, whether as a result of sustained high or increased corn prices or sustained low or decreased ethanol prices, would adversely affect our results of operations and financial position. Further, combined revenues from sales of ethanol and distillers grains could decline below our marginal cost of production, which could cause us to reduce or suspend production at some or all of our plants. A decrease in production volumes could adversely impact our overall profitability.
Our risk management strategies, including hedging transactions, may be ineffective and may expose us to decreased liquidity.
In an attempt to partially offset the effects of volatility of ethanol, distillers grains, corn oil, corn and natural gas prices, we enter into forward contracts to sell a portion of our respective ethanol, distillers grains and corn oil production or to purchase a portion of our respective corn or natural gas requirements. To a much lesser extent, we also engage in other hedging transactions involving exchange-traded futures contracts for corn, natural gas, ethanol and unleaded gasoline from time to time. The financial statement impact of these activities is dependent upon, among other things, the prices involved and our ability to physically receive or deliver the commodities involved. Hedging arrangements also expose us to the risk of financial loss in situations where the counterparty to the hedging contract defaults on its contract or, in the case of exchange-traded contracts, where there is a change in the expected differential between the price of the commodity underlying the hedging agreement and the actual prices paid or received by us for the physical commodity bought or sold. Hedging activities can themselves result in losses when a position is purchased in a declining market or a position is sold in a rising market. A hedge position is often settled in the same time frame as the physical commodity is either purchasedexpensed as a cost of goods sold (corn and natural gas) or sold (ethanol, distillers grains and corn oil). Hedging losses may be offset by a decreased cash price for corn and natural gas and an increased cash price for ethanol, distillers grains and corn oil. We also vary the amount of hedging or other risk mitigation strategies we undertake, and we may choose not to engage in hedging transactions at all. We cannot assure you that our risk management and hedging activities will be effective in offsetting the effects of volatility. If we fail to offset such volatility, our results of operations and financial position may be adversely affected.
We also attempt to reduce the market risk associated with fluctuations in commodity prices through the use of derivative financial instruments. Sudden changes in commodity prices may require cash deposits with brokers, or margin calls. Depending on our open derivative positions, we may require additional liquidity with little advance notice to meet margin calls. As part of our risk management strategy, we have routinely had to, and in the future will likely be required to, cover margin calls. While we continuously monitor our exposure to margin calls, we cannot guarantee you that we will be able to maintain adequate liquidity to cover margin calls in the future.
Price volatility of each commodity that we buy and sell could each adversely affect our results of operations and our ability to operate at a profit.
Corn. Because ethanol competes with non-corn derived fuels, we generally are unable to pass along increasedincreases in corn costs to our customers. At certain levels, corn prices may make ethanol uneconomical to produce. There is significant price pressure on local corn markets caused by nearby ethanol plants, livestock industries and other corn consuming enterprises. Additionally, local corn supplies and prices could be adversely affected by rising prices for alternative crops, increasing input costs, changes in government policies, shifts in global markets, or damaging growing conditions such as plant disease or adverse weather.
Natural Gas. The prices for and availability of natural gas are subject to volatile market conditions. These market conditions often are affected by factors beyond our control, such as weather conditions, overall economic conditions, and foreign and domestic governmental regulation and relations. Significant disruptions in the supply of natural gas could impair our ability to manufacture ethanol for our customers. Furthermore, increases in natural gas prices or changes in our natural gas costs relative to natural gas costs paid by competitors may adversely affect our results of operations and financial position.
Ethanol. Our revenues are dependent on market prices for ethanol. These market prices can be volatile as a result of a number of factors, including, but not limited to, the availability and price of competing fuels, the overall supply and demand for ethanol and corn, the price of gasoline and corn, and the level of government support.
Ethanol is marketed as a fuel additive to reduce vehicle emissions from gasoline, as an octane enhancer to improve the octane rating of the gasoline with which it is blended and, to a lesser extent, as a gasoline substitute. As a result, ethanol prices are influenced by the supply of and demand for gasoline. Our results of operations may be materially harmed if the demand for, or the price of, gasoline decreases. Conversely, a prolonged increase in the price of, or demand for, gasoline could lead the U.S. government to relaxavoid limiting imported ethanol; the import restrictionstariff of $0.54 per gallon was allowed to expire on foreign ethanol that currently benefit us.December 31, 2011.
Distillers Grains. Distillers grains compete with other protein-based animal feed products. The price of distillers grains may decrease when the prices of competing feed products decrease. The prices of competing animal feed products are based in part on the prices of the commodities from which these products are derived. Downward pressure on commodity prices, such as soybeans, will generally cause the price of competing animal feed products to decline, resulting in downward pressure on the price of distillers grains.
Historically, sales prices for distillers grains has tracked along with the price of corn. However, there have been occasions when the price increase for this co-product has lagged behind increases in corn prices. In addition, our distillers grains co-product competes with products made from other feedstocks, the cost of which may not have risen as corn prices have risen. Consequently, the price we may receive for distillers grains may not rise as corn prices rise, thereby lowering our cost recovery percentage relative to corn.
Due to industry increases in U.S. dry mill ethanol production, the production of distillers grains in the United States has increased dramatically, and this trend may continue. This may cause distillers grains prices to fall in the United States, unless demand increases or other market sources are found. To date, demand for distillers grains in the United States has increased roughly in proportion to supply. We believe this is because U.S. farmers use distillers grains as a feedstock, and distillers grains are slightly less expensive than corn, for which it is a substitute. However, if prices for distillers grains in the United States fall, it may have a materialan adverse effect on our business.
Corn Oil.Industrial uses for corn oil include feedstock for biodiesel, livestock feed additives, rubber substitutes, rust preventatives, inks, textiles, soaps and insecticides. Corn oil is generally marketed as a feedstock for biodiesel and, therefore, the price of corn oil is affected by demand for biodiesel. In general, corn oil prices follow the same price trends as heating oil and soybean oil. Corn oil revenues historically have not been significant to our business; however, our business may be materially affected by price volatility of corn oil in the future as we expand our corn oil production.
Our existing debt arrangements require us to abide by certain restrictive loan covenants that may hinder our ability to operate and reduce our profitability.
The loan agreements governing secured debt financing at our subsidiaries, and the convertible debt issued in November 2010 contain a number of restrictive affirmative and negative covenants. These covenants limit the ability of our subsidiaries to, among other things, incur additional indebtedness, make capital expenditures above certain limits, pay dividends or distributions, merge or consolidate, or dispose of substantially all of their assets.
We are also required to maintain specified financial ratios, including minimum cash flow coverage, minimum working capital and minimum net worth. Some of our loan agreements require us to utilize a portion of any excess cash flow generated by operations to prepay the respective term debt. A breach of any of these covenants or requirements could result in a default under our loan agreements. If any of our subsidiaries default, and if such default is not cured or waived, our lenders could, among other remedies, accelerate their debt and declare that debt immediately due and payable. If this occurs, we may not be able to repay such debt or borrow sufficient funds to refinance. Even if new financing is available, it may not be on terms that are acceptable. No assurance can be given that the future operating results of our subsidiaries will be sufficient to achieve compliance with such covenants and requirements, or in the event of a default, to remedy such default.
In the past, we have received waivers from our lenders for failure to meet certain financial covenants and have amended our subsidiary loan agreements to change these covenants if they have not been met.covenants. For example, during 2010,2011, the Green Plains Bluffton loan agreements for Bluffton and Central City wereagreement was amended to reduce certain financial covenants
related toinclude equity contributions in the denominator of the fixed coverage ratio.ratio and increase the capital expenditures limit. No assurance can be given that, if we are unable to comply with these covenants in the future, we will be able to obtain the necessary waivers or amend our subsidiary loan agreements to prevent a default. Default by us or any of our subsidiaries with respect to any loan in excess of $10.0 million constitutes an event of default under our convertible senior notes, which could result in the convertible senior notes being declared due and payable.
Additionally, in October 2010 we acquired Global Ethanol, LLC, which we renamed Green Plains Holdings II LLC, or Holdings II. Global Ethanol’s lenders had agreed, during a specified forbearance period, to not exercise any right or remedy under its credit agreement for specified defaults related to certain loan covenants that it had been unable to satisfy. Upon closing of the Global Ethanol acquisition, Holdings II entered into an amendment to the existing credit agreement which modifies existing covenants and extends the forbearance period to April 30,1, 2013. If any future defaults under Holdings II’s credit agreement occur, the lenders are permitted to accelerate the maturity date on the outstanding balance. In connection with the closing of our acquisition of Global Ethanol, we contributed $10 million of cash to Holdings II, of which $6.0 million was utilized to reduce outstanding debt. Notwithstanding these actions, we cannot assure you that Holdings II will be able to comply with the new covenants going forward or obtain additional waivers for non-compliance.
We may fail to realize all of the anticipated benefits of mergers and acquisitions that we have undertaken or may undertake because of integration challenges.
We have increased the size of our operations significantly through mergers and acquisitions and intend to continue to explore potential merger or acquisition opportunities. For example, in April 2010March 2011, we acquired additional agribusiness operations in western Tennessee that included five grain elevatorsour Otter Tail ethanol plant with federally licensed storage capacity of 11.7 million bushels. In October 2010, we acquired Global Ethanol, which owns two operating ethanol plants with a combinedan annual production capacity of approximately 15760 million gallons of ethanol.ethanol, in June 2011, we acquired 2.0 million bushels of grain storage capacity located in Hopkins, Missouri and in January 2012, we acquired 1.9 million bushels of grain storage capacity located in St. Edward, Nebraska. The anticipated benefits and cost savings of such mergers and acquisitions may not be realized fully, or at all, or may take longer to realize than expected. Acquisitions involve numerous risks, any of which could harm our business, including:
difficulties in integrating the operations, technologies, products, existing contracts, accounting processes and personnel of the target and realizing the anticipated synergies of the combined businesses;
risks relating to environmental hazards on purchased sites;
risks relating to acquiring or developing the infrastructure needed for facilities or acquired sites, including access to rail networks;
difficulties in supporting and transitioning customers, if any, of the target company;
diversion of financial and management resources from existing operations;
the purchase price or other devoted resources may exceed the value realized, or the value we could have realized if the purchase price or other resources had been allocated to another opportunity;
risks of entering new markets or areas in which we have limited or no experience, or are outside our core competencies;
potential loss of key employees, customers and strategic alliances from either our current business or the business of the target;
assumption of unanticipated problems or latent liabilities, such as problems with the quality of the target company’s products; and
inability to generate sufficient revenue to offset acquisition costs and development costs.
We also may pursue growth through joint ventures or partnerships. Partnerships and joint ventures typically involve restrictions on actions that the partnership or joint venture may take without the approval of the partners. These types of provisions may limit our ability to manage a partnership or joint venture in a manner that is in our best interest but is opposed by our other partner or partners.
Future acquisitions may involve the issuance of equity securities as payment or in connection with financing the business or assets acquired and, as a result, could dilute your ownership interest. In addition, additional debt may be necessary in order to complete these transactions, which could have a material adverse effect on our financial condition. The failure to successfully evaluate and execute acquisitions or joint ventures or otherwise adequately address the risks associated with acquisitions or joint ventures could have a material adverse effect on our business, results of operations and financial condition.
The ethanol industry is highly dependent on government usage mandates affecting ethanol production and favorable tax benefits for ethanol blending and any changes to such regulation could adversely affect the market for ethanol and our results of operations.
The domestic market for ethanol is largely dictated by federal mandates for blending ethanol with gasoline. The RFS mandate level for 2011conventional biofuels for 2012 of 12.613.2 billion gallons approximates current domestic production levels. Future demand will be largely dependent upon the economic incentives to blend based upon the relative value of gasoline versus ethanol, taking into consideration the blender’s creditrelative octane value of ethanol, environmental requirements and the RFS. Any significant increase in production capacity beyond the RFS level might have an adverse impact on ethanol prices. Additionally, the RFS mandate with respect to ethanol derived from grain could be reduced or waived entirely. A reduction or waiver of the RFS mandate could adversely affect the prices of ethanol and our future performance. The RFS Flexibility Act was introduced on October 5, 2011 in the U.S. House of Representatives to reduce or eliminate the volumes of renewable fuel use required by RFS based upon corn stocks-to-use ratios. The Domestic Alternative Fuels Act of 2012 was introduced on January 18, 2012 in the U.S. House of Representatives to modify the RFS to include ethanol and other fuels produced from fossil fuels like coal and natural gas. We believe the RFS is a significant component of national energy policy that reduces dependence on foreign oil by the United States. Our operations could be adversely impacted if the RFS Flexibility Act or the Domestic Alternative Fuels Act of 2012 are enacted.
The volumetric ethanol excise tax credit, or VEETC, is currently set to expire on December 31, 2011. Referred to as the blender’s credit, the Volumetric Ethanol Excise Tax Credit, or VEETC, providesprovided companies with a tax credit to blend ethanol with gasoline. The Food, Conservation and Energy Act of 2008, or the 2008 Farm Bill, amended the amount of tax credit provided under VEETC to 45 cents per gallon of pure ethanol and 38 cents per gallon for E85, a blended motor fuel containing 85% ethanol and 15% gasoline. The elimination or further reduction of VEETC or other federal tax incentives to the ethanol industry may have an adverse impactblender’s credit expired on our business by reducing the demand and market price for the ethanol we produce.December 31, 2011.
Federal law mandates the use of oxygenated gasoline. If these mandates are repealed, the market for domestic ethanol would be diminished significantly. Additionally, flexible-fuel vehicles receive preferential treatment in meeting corporate average fuel economy, or CAFE, standards. However, high blend ethanol fuels such as E85 result in lower fuel efficiencies. Absent the CAFE preferences, it may be unlikely that auto manufacturers would build flexible-fuel vehicles. Any change in these CAFE preferences could reduce the growth of E85 markets and result in lower ethanol prices.prices, which could adversely impact our operating results.
To the extent that such federal or state laws are modified, the demand for ethanol may be reduced, which could negatively and materially affect our ability to operate profitably.
Future demand for ethanol is uncertain and may be affected by changes to federal mandates, public perception and consumer acceptance, any of which could negatively affect demand for ethanol and our results of operations.
Ethanol production from corn has not been without controversy. Although many trade groups, academics and governmental agencies have supported ethanol as a fuel additive that promotes a cleaner environment, others have criticized ethanol production as consuming considerably more energy and emitting more greenhouse gases than other biofuels and potentially depleting water resources. Some studies have suggested that corn-based
ethanol is less efficient than ethanol produced from switchgrass or wheat grain and that it negatively impacts consumers by causing prices for dairy, meat and other foodstuffs from livestock that consume corn to increase. Additionally, ethanol critics contend that corn supplies are redirected from international food markets to
domestic fuel markets. If negative views of corn-based ethanol production gain acceptance, support for existing measures promoting use and domestic production of corn-based ethanol could decline, leading to reduction or repeal of federal mandates which would adversely affect the demand for ethanol. These views could also negatively impact public perception of the ethanol industry and acceptance of ethanol as an alternative fuel.
Beyond the federal mandates, there are limited markets for ethanol. Discretionary blending and E85 blending are important secondary markets. Discretionary blending is often determined by the price of ethanol versus the price of gasoline. In periods when discretionary blending is financially unattractive, the demand for ethanol may be reduced. A reduction in the demand for our products may depress the value of our products, erode our margins, and reduce our ability to generate revenue or to operate profitably. Consumer acceptance of E85 fuels and flexible-fuel technology vehicles is needed before ethanol can achieve any significant growth in market share.
Increased federal support of cellulosic ethanol may result in reduced incentives to corn-derived ethanol producers.
Recent legislation, such as the American Recovery and Reinvestment Act of 2009 and the Energy Independence and Security Act of 2007, provides numerous funding opportunities in support of cellulosic ethanol, which is obtained from other sources of biomass such as switchgrass and fast growing poplar trees. In addition, the amended RFS mandates an increasing level of production of biofuels that are not derived from corn. Federal policies suggest a long-term political preference for cellulosic processes using alternative feedstocks such as switchgrass, silage, wood chips or other forms of biomass. Cellulosic ethanol hasmay have a smaller carbon footprint because the feedstock does not require energy-intensive fertilizers and
industrial production processes. Additionally, cellulosic ethanol is favored because it is unlikely that foodstuff is being diverted from the market. Several cellulosic ethanol plants are under development. As research and development programs persist, there is the risk that cellulosic ethanol could displace corn ethanol. In addition, any replacement of federal incentives from corn-based to cellulosic-based ethanol production may reduce our profitability.
Our plants are designed as single-feedstock facilities and would require significant additional investment to convert to the production of cellulosic ethanol. Additionally, our plants are strategically located in high-yield, low-cost corn production areas. At present, there is limited supply of alternative feedstocks near our facilities. As a result, the adoption of cellulosic ethanol and its use as the preferred form of ethanol would have a significant adverse impact on our business.
Any inability to maintain required regulatory permits may impede or completely prohibit our ability to successfully operate our plants. Additionally, any change in environmental and safety regulations, or violations thereof, could impede our ability to successfully operate our businesses.
Our ethanol production and agribusiness segments are subject to extensive air, water and other environmental regulation. We have had to obtain a number of environmental permits to construct and operate our plants. Ethanol production involves the emission of various airborne pollutants, including particulate, carbon dioxide, oxides of nitrogen, hazardous air pollutants and volatile organic compounds. In addition, the governing state agencies could impose conditions or other restrictions in the permits that are detrimental to us or which increase our costs above those required for profitable operations. Any such event could have a material adverse effect on our operations, cash flows and financial position.
Environmental laws and regulations, both at the federal and state level, are subject to change and changes can be made retroactively. It is possible that more stringent federal or state environmental rules or regulations could be adopted, which could increase our operating costs and expenses. Consequently, even if we have the proper permits at the present time, we may be required to invest or spend considerable resources to comply with future environmental regulations. Furthermore, ongoing plant operations are governed by OSHA. OSHA regulations may change in a way that increases the costs of operations at our plants. If any of these events were to occur, they could have a materialan adverse impact on our operations, cash flows and financial position.
Part of our business is regulated by environmental laws and regulations governing the labeling, use, storage, discharge and disposal of hazardous materials. Because we use and handle hazardous substances in our businesses, changes in environmental requirements or an unanticipated significant adverse environmental event could have a materialan adverse effect on our business. We cannot assure you that we have been, or will at all times be, in compliance with all environmental requirements, or that we will not incur material costs or liabilities in connection with these requirements. Private parties, including current and former employees, could bring personal injury or other claims against us due to the presence of, or exposure to, hazardous substances used, stored or disposed of by us, or contained in its products. We are also exposed to residual risk because some of our facilities and land may have environmental liabilities arising from their prior use. In addition, changes to environmental regulations may require us to modify existing plant and processing facilities and could significantly increase the cost of those operations.
Our business is affected by the regulation of greenhouse gases, or GHG, and climate change. New climate change regulations could impede our ability to successfully operate our business.
Our plants emit carbon dioxide as a by-product of the ethanol production process. In 2007, the U.S. Supreme Court classified carbon dioxide as an air pollutant under the Clean Air Act in a case seeking to require the EPA to regulate carbon dioxide in vehicle emissions. On February 3, 2010, the EPA released its final regulations on RFS 2. We believe these final regulations grandfather our plants at their current operating capacity, though expansion of our plants will need to meet a threshold of a 20% reduction in GHG emissions from a 2005 baseline measurement for the ethanol over current capacity to be eligible for the RFS 2 mandate. The EPA issued its final rule on GHG emissions from stationary sources under the Clean Air Act in May 2010. These final rules may require us to apply for additional permits for our ethanol plants. Additionally, legislation is pending in Congress on a comprehensive carbon dioxide regulatory scheme, such as a carbon tax or cap-and-trade system. In order to expand capacity at our plants, we may have to apply for additional permits, install advanced technology, or reduce drying of certain amounts of distillers grains. We may also be required to install carbon dioxide mitigation equipment or take other steps unknown to us at this time in order to comply with other future law or regulation. Compliance with future law or regulation of carbon dioxide, or if we choose to expand capacity at certain of our plants, compliance with then-current regulation of carbon dioxide, could be costly and may prevent us from operating our plants as profitably, which may have a materialan adverse impact on our operations, cash flows and financial position.
The California Air Resources Board, or CARB, has adopted a Low Carbon Fuel Standard, or LCFS, requiring a 10% reduction in GHG emissions from transportation fuels by 2020. Additionally, an Indirect Land Use Change, or ILUC, component is included in the lifecycle GHG emissions calculation. On December 29, 2011, the U.S. District Court for the Eastern District of California issued several rulings in federal lawsuits challenging the LCFS. One of the rulings preliminarily prevents CARB from enforcing these regulations during the pending litigation. On January 23, 2012, CARB unsuccessfully attempted to appeal these rulings in the U.S. District Court for the Eastern District of California and on January 26, 2012 filed another appeal with the Ninth Circuit Court of Appeals. While this standard is currently being challenged by various lawsuits, implementation of such a standard may have an adverse impact on our market for corn-based ethanol in California if it is determined that in California corn-based ethanol fails to achieve lifecycle GHG emission reductions.
Our agribusiness business is subject to significant governmental and private sector regulations.
Our agribusiness operations are subject to government regulation and regulation by certain private sector associations, compliance with which can impose significant costs on our business. Failure to comply with such regulations can result in additional costs, fines or criminal action. Production levels, markets and prices of the grains we merchandise are affected by federal government programs, which include acreage control and price support programs of the USDA. In addition, grain that we sell must conform to official grade standards imposed by the USDA. Other examples of government policies that can have an impact on our business include tariffs, duties, subsidies, import and export restrictions and outright embargos. Changes in government policies and producer supports may impact the amount and type of grains planted, which in turn, may impact our ability to buy grain in our market region. Because a portion of our grain sales are to exporters, the imposition of export restrictions or tariffs could limit our sales opportunities.
Our agribusiness segment is affected by the supply and demand of commodities, and is sensitive to factors that are often outside of our control.
Within our agribusiness segment, we compete with other grain merchandisers, grain processors and end-users for the purchase of grain, as well as with other grain merchandisers, private elevator operators and cooperatives for the sale of grain. Many of our grain competitors are significantly larger and compete in more diverse markets, and our failure to compete effectively would impact our profitability.
We buy and sell various other commodities within our agribusiness division, some of which are readily traded on commodity futures exchanges. For example, we sell agronomy products to producers which necessitate the purchase of large volumes of fertilizer and chemicals for retail sale. Fixed-price purchase obligations and carrying inventories of these products subject us to the risk of market price fluctuations for periods of time between the time of purchase and final sale. Weather, economic, political, environmental and technological conditions and developments, both local and worldwide, as well as other factors beyond our control, can affect the supply and demand of these commodities and expose them to liquidity pressures due to rapidly rising or falling market prices. Changes in the supply and demand of these commodities can also affect the value of inventories held for resale, as well as the price of raw materials. Fluctuating costs of inventory and prices of raw materials could decrease operating margins and adversely affect profitability.
While our grain business hedges the majority of its grain inventory positions with derivative instruments to manage risk associated with commodity price changes, including purchase and sale contracts, we are unable to hedge all of the price risk of each transaction due to timing, unavailability of hedge contract counterparties and third-party credit risk. Furthermore, there is a risk that the derivatives we employ will not be effective in offsetting the changes associated with the risks we are attempting to manage. This can happen when the derivative and the hedged item are not perfectly matched. Our grain derivatives, for example, do not hedge the basis pricing component of our grain inventory and contracts. Basis is defined as the difference between the cash price of a commodity in one of our grain facilities and the nearest in time exchange-traded futures price. Differences can reflect time periods, locations or product forms. Although the basis component is smaller and generally less volatile than the futures component of grain market prices, significant unfavorable basis movement on grain positions as large as ours may significantly impact our profitability.
Our debt level could negatively impact our financial condition, results of operations and business prospects.
As of December 31, 2010,2011, our total debt was $669.0$636.8 million. Our level of debt could have significant consequences to our shareholders, including the following:
requiring the dedication of a substantial portion of cash flow from operations to make payments on debt, thereby reducing the availability of cash flow for working capital, capital expenditures and other general business activities;
requiring a substantial portion of our corporate cash reserves to be held as a reserve for debt service, limiting our ability to invest in new growth opportunities;
limiting the ability to obtain additional financing in the future for working capital, capital expenditures, acquisitions and general corporate and other activities;
limiting the flexibility in planning for, or reacting to, changes in the business and industry in which we operate;
increasing our vulnerability to both general and industry-specific adverse economic conditions;
being at a competitive disadvantage against less leveraged competitors;
being vulnerable to increases in prevailing interest rates;
subjecting all or substantially all of our assets to liens, which means that there may be no assets left for shareholders in the event of a liquidation; and
limiting our ability to make business and operational decisions regarding our business and subsidiaries, including, among other things, limiting our subsidiary’s ability to pay dividends, to our respective shareholders, make capital improvements, sell or purchase assets or engage in transactions deemed appropriate and in our best interest.
Most of our debt bears interest at variable rates, which creates exposure to interest rate risk. If interest rates increase, our debt service obligations with respect to the variable rate indebtedness would increase even though the amount borrowed remained the same, and our net income would decrease.
Our ability to make scheduled payments of principal and interest, or to refinance our indebtedness, depends on our future performance, which is subject to economic, financial, competitive and other factors beyond our control. Our business may not continue to generate cash flow in the future sufficient to service our debt because of factors beyond our control, including but not limited to the spread between corn prices and ethanol and distillers grains prices. If we are unable to generate sufficient cash flows, we may be required to adopt one or more alternatives, such as selling assets, restructuring debt or obtaining additional equity capital on terms that may be onerous or highly dilutive. Our ability to refinance our indebtedness will depend on the capital markets and our financial condition at such time. We may not be able to engage in any of these activities or engage in these activities on desirable terms, which could result in a default on our debt obligations.
Despite our current debt levels, we and our subsidiaries may incur substantially more debt or take other actions which would intensify the risks discussed above.
Despite our current debt levels, we and our subsidiaries may incur additional debt in the future, including secured debt. We and certain of our subsidiaries are not currently restricted under the terms of our debt from incurring additional debt, pledging assets, recapitalizing our debt or taking a number of other actions that are not limited by the terms of the debt but that could diminish our ability to make payments thereunder.
We operate in capital intensive businesses and rely on cash generated from operations and external financing. Limitations on access to external financing could adversely affect our operating results.
Some ethanol producers have faced financial distress, recently, culminating with bankruptcy filings by several companies over the past threefour years. This, in combination with continued volatility in the capital markets has resulted in reduced availability of capital for the ethanol industry generally. Construction of our plants and anticipated levels of required working capital were funded under long-term credit facilities. Increases in liquidity requirements could occur due to, for example, increased commodity prices. Our operating cash flow is dependent on our ability to profitably operate our businesses and overall commodity market conditions. In addition, we may need to raise additional financing to fund growth of our businesses. In this market environment, we may experience limited access to incremental financing. This could cause us to defer or cancel growth projects, reduce our business activity or, if we are unable to meet our debt repayment schedules, cause a default in our existing debt agreements. These events could have a materiallyan adverse effect on our operations and financial position.
Our subsidiaries’ debt facilities have ongoing payment requirements which we generally expect to meet from their operating cash flow. Our ability to repay current and anticipated future indebtedness will depend on our financial and operating performance and on the successful implementation of our business strategies. Our financial and operational performance will depend on numerous factors including prevailing economic conditions, volatile commodity prices, and financial, business and other factors beyond our control. If we cannot pay our debt service, we may be forced to reduce or delay capital expenditures, sell assets, restructure our indebtedness or seek additional capital. If we are unable to restructure our indebtedness or raise funds through sales of assets, equity or otherwise, our ability to operate could be harmed and the value of our stock could be significantly reduced.
We are a holding company, and there are limitations on our ability to receive distributions from our subsidiaries.
We conduct most of our operations through subsidiaries and are dependent upon dividends or other intercompany transfers of funds from our subsidiaries to generate free cash flow. Moreover, some of our subsidiaries are currently, or are expected in the future to be, limited in their ability to pay dividends or make distributions to us by the terms of their financing agreements. Consequently, we are not able to rely on the cash flow from one subsidiary to satisfy the loan obligations of another subsidiary. As a result, if a subsidiary is unable to satisfy its loan obligations, we may not be able to prevent a default on the loan by providing additional cash to that subsidiary, even if sufficient cash exists elsewhere in our consolidated organization.
Increased ethanol industry penetration by oil companies or other multinational companies may adversely impact our margins.
We operate in a very competitive environment. The ethanol industry is primarily comprised of smaller entities that engage exclusively in ethanol production and large integrated grain companies that produce ethanol along with their base grain businesses. We face competition for capital, labor, corn and other resources from these companies. Until recently, oil companies, petrochemical refiners and gasoline retailers have not been engaged in ethanol production to a large extent. These companies, however, form the primary distribution networks for marketing ethanol through blended gasoline. During the past year,few years, several large oil companies have entered the ethanol production market. If these companies increase their ethanol plant ownership or other oil companies seek to engage in direct ethanol production, there will be less of a need to purchase ethanol from independent ethanol producers like us. Such a structural change in the market could result in a materialan adverse effect on our operations, cash flows and financial position.
We operate in a highly competitive industry.
In the United States, we compete with other corn processors and refiners, including Archer-Daniels-Midland Company, POET, LLC and Valero Energy Corporation. Some of our competitors are divisions of larger enterprises and have greater financial resources than we do. Although some of our competitors are larger than we are, we also have many smaller competitors. Farm cooperatives comprised of groups of individual farmers have been able to compete successfully. As of December 31, 2010,2011, the top ten domestic producers accounted for approximately 50.4%48.6% of all production, with production capacities ranging from approximately 200 mmgy to 1,800 mmgy. If our competitors consolidate or otherwise grow and we are unable to similarly increase our size and scope, our business and prospects may be significantly and adversely affected.
Our competitors also include plants owned by farmers who earn their livelihood through the sale of corn, and competitors whose primary business is oil refining and retail gasoline sales. These competitors may continue to operate their plants when market conditions are uneconomic due to benefits realized in other operations.
Depending on commodity prices, foreign producers may produce ethanol at a lower cost than we can, which may result in lower ethanol prices which would adversely affect our financial results.
There is a risk of foreign competition in the ethanol industry. Brazil is currently the second largest ethanol producer in the world. Brazil’s ethanol production is sugarcane based, as opposed to corn based, and has historically been less expensive to produce. Other foreign producers may be able to produce ethanol at lower input costs, including costs of feedstock, facilities and personnel, than we can.
At present, there is a 54 cent per gallon tariff onWhile foreign ethanol. However, this tariff might not be sufficient to deter overseas producers from importing ethanol into the domestic market, resulting in depressed ethanol prices. It is also important to note that the tariff on foreign ethanol is the subject of ongoing controversy and disagreement amongst lawmakers. Many lawmakers attribute increases in food prices to growth in the ethanol industry. They see foreign competition in ethanol production as a means of reducing food prices. Additionally, the tariff on ethanol is controversial internationally because critics contend that it diverts corn from export and impedes Latin American agricultural development.
Ethanol produced or processed in numerous countries in Central America and the Caribbean region is eligible for tariff reduction or elimination upon importation to the United States under a program known as the Caribbean Basin Initiative. Large multinational companies have expressed interest in building dehydration plants in participating Caribbean Basin countries, such as El Salvador, which would convert ethanol into fuel-grade ethanol for shipment to the United States Ethanol imported from Caribbean Basin countries may be a less expensive alternative to domestically produced ethanol. As a result, our business faces a threat from imported ethanol either from Brazil, even with the import tariff, or from a Caribbean Basin source. Whiledemand, transportation costs and infrastructure constraints may temper the market impact throughout the United States, competition from imported ethanol may affect our ability to sell our ethanol profitably, which may have a materialan adverse effect on our operations, cash flows and financial position.
If significant additional foreign ethanol production capacity is created, such facilities could create excess supplies of ethanol on world markets, which may result in lower prices of ethanol throughout the world, including the United States. Such foreign competition is a risk to our business. Further, if the tariff on foreign ethanol is ever lifted, overturned, reduced, repealed or expires, our ability to profitably compete with low-cost international producers could be impaired. Any penetration of ethanol imports into the domestic market may have a material adverse effect on our operations, cash flows and financial position.
Our success may depend on our ability to manage our growing and changing operations.
Since our formation in 2004, our business has grown significantly in size and complexity. This growth has placed, and is expected to continue to place, significant demands on our management, systems, internal controls and financial and physical resources. Much of our operations are decentralized at our various facilities, with many functions being performed at the local level. In addition, if we acquire additional operations, we expect that we will need to further develop our financial and managerial controls and reporting systems to accommodate future growth. This will require us to incur expenses related to hiring additional qualified personnel, retaining professionals to assist in developing the appropriate control systems and expanding our information technology infrastructure. Our inability to manage growth effectively could have a materialan adverse effect on our results of operations, financial position and cash flows.
Future acquisitions may involve the issuance of equity securities as payment or in connection with financing the business or assets acquired and, as a result, could dilute your ownership interest. In addition, additional debt may be necessary in order to complete these transactions, which could have a material adverse effect on our financial condition. The failure to successfully evaluate and execute acquisitions or joint ventures or otherwise adequately address the risks associated with acquisitions or joint ventures could have a material adverse effect on our business, results of operations and financial condition.
We may fail to realize the anticipated benefits of our joint venture to commercialize algae production.
We have 35% ownership in a joint venture that is focused on developing technology to grow and harvest algae, which consume carbon dioxide, in commercially viable quantities. The algae produced have the potential to be used for advanced bio-fuel production, high quality animal feed, or as biomass for energy production, but our current primary focus is on efficiently growing, and developing primary markets for, algae on a large scale. We believe this technology has specific applications with facilities, including ethanol plants that emit carbon dioxide. We may fail to realize the expected benefits of capturing carbon dioxide to grow and harvest algae as acceptable production rates, operating costs, capital requirements and product market prices may not be achieved.
We have had a history of operating losses and may incur future operating losses.
We have had a history of operating losses from 2006 to 2008, and may incur operating losses in the future, which could be substantial. Although we recently achievedhave sustained profitability from 2009 to 2011, we may not be able to continue to sustain or increase profitability on a quarterly or annual basis, which could result in a decrease in the trading price of our common stock.
Our ability to successfully operate is dependent on the availability of energy and water at anticipated prices.
Our plants require a significant and uninterrupted supply of natural gas, electricity and water to operate. We rely on third parties to provide these resources. We cannot assure you that we will be able to secure an adequate supply of energy or water to support current and expected plant operations. If there is an interruption in the supply of energy or water for any reason, such as supply, delivery or mechanical problems, we may be required to halt production. If production is halted for an extended period of time, it may have a material adverse effect on our operations, cash flows and financial position.
Replacement technologies are under development that might result in the obsolescence of corn-derived ethanol or our process systems.
Ethanol is primarily an additive and oxygenate for blended gasoline. Although use of oxygenates is currently mandated, there is always the possibility that a preferred alternative product will emerge and eclipse the current market. Critics of ethanol blends argue that ethanol decreases fuel economy, causes corrosion of ferrous components and damages fuel pumps. Any alternative oxygenate product would likely be a form of alcohol (like ethanol) or ether (like MTBE). Prior to federal restrictions and ethanol mandates, MTBE was the dominant oxygenate. It is possible that other ether products could enter the market and prove to be environmentally or economically superior to ethanol. It is also possible that alternative biofuel alcohols such as methanol and butanol could evolve into ethanol replacement products.
Research is currently underway to develop other products that could directly compete with ethanol and may have more potential advantages than ethanol. Advantages of such competitive products may include, but are not limited to: lower vapor pressure, making it easier to add gasoline; energy content closer to or exceeding that of gasoline, such that any decrease in fuel economy caused by the blending with gasoline is reduced; an ability to blend at a higher concentration level for use in standard vehicles; reduced susceptibility to separation when water is present; and suitability for transportation in gaspetroleum pipelines. Such products could have a competitive advantage over ethanol, making it more difficult to market our ethanol, which could reduce our ability to generate revenue and profits.
New ethanol process technologies may emerge that require less energy per gallon produced. The development of such process technologies would result in lower production costs. Our process technologies may become outdated and obsolete, placing us at a competitive disadvantage against competitors in the industry. The development of replacement technologies may have a material adverse effect on our operations, cash flows and financial position.
We may be required to provide remedies for the delivery of off-specification ethanol, distillers grains or corn oil.
If we produce and deliver ethanol, distillers grains or corn oil that does not meet the specifications defined by the sales contract, we may be subject to quality claims requiring us to refund the purchase price of any non-conforming product or replace any non-conforming product at our expense. We may be forced to purchase replacement quantities of ethanol, distillers grains or corn oil at higher prices to fulfill these contractual obligations. In addition, ethanol, distillers grains or corn oil purchased from other producers, including producers that we provide marketing and distribution services for, and subsequently sold to others may result in similar claims if the product does not meet applicable contract specifications.
Our revenue from the sale of distillers grains depends upon its continued market acceptance as an animal feed.
Distillers grains is a co-product from the fermentation of various crops, including corn, to produce ethanol. Antibiotics may be utilized during the fermentation process to control bacterial contamination; therefore antibiotics may be present in small quantities in distillers grains marketed as animal feed. The U.S. Food and Drug Administration’s, or FDA’s, Center for Veterinary Medicine has expressed concern about potential animal and human health hazards from the use of distillers grains as an animal feed due to the possibility of antibiotic residues. As a result, the market value of this co-product could be diminished if the FDA were to introduce regulations that limit the sale of distillers grains in the domestic market or for export to international markets, which in turn would have a negative impact on our profitability. In addition, ifIf public perception of distillers grains as an acceptable animal feed were to change or if the public became concerned about the impact of distillers grains in the food supply, the market for distillers grains would be negatively impacted, which would have a negative impact on our profitability.
We may failextract non-edible corn oil from the whole stillage process immediately prior to realize the anticipated benefitsproduction of implementingdistillers grains. Several universities are trying to determine how corn oil extraction technology at our ethanol plants.
We recently have begun to implementmay affect nutritional energy values of the resulting distillers grains. If it is determined that corn oil extraction technology at eachadversely affects the digestible energy content of distillers grains, the value of our ethanol plants. Installation of such technology and extraction of corn oil at projected levelsdistillers grains may not be achieved due to implementation issues, emulsion issues or similar factors. We may fail to realize the expected profits based eitheraffected, which could have a negative impact on extraction issues or market prices for such co-product once extracted.our profitability.
Our operating results may suffer if our marketing and sales efforts are not effective.
We have established our own marketing, transportation and storage infrastructure. We lease tanker railcars and have contracted with storage depots near our customers and at strategic locations for efficient delivery of our
finished ethanol product. We have also hired a marketing and sales force, as well as logistical and other
operational personnel to staff our distribution activities. The marketing, sales, distribution, transportation, storage or administrative efforts we have implemented may not achieve expected results. Any failure to successfully execute these efforts would have a material adverse effect on our results of operations and financial position. Our financial results also may be adversely affected by our need to establish inventory in storage locations to fulfill our marketing and distribution contracts.
We are exposed to credit risk resulting from the possibility that a loss may occur from the failure of our contractual counterparties to perform according to the terms of our agreements.
In selling ethanol, distillers grains and corn oil we may experience concentrations of credit risk from a variety of customers, including major integrated oil companies, large independent refiners, petroleum wholesalers, other marketers and jobbers. We are also exposed to credit risk resulting from sales of grain to large commercial buyers, including other ethanol plants. Our fixed-price forward contracts also result in credit risk when prices change significantly prior to delivery. We continually monitor this credit risk exposure. In addition, we may prepay for or make deposits on undelivered inventories. Concentrations of credit risk with respect to inventory advances are primarily with a few major suppliers of petroleum products and agricultural inputs. The inability of a third party to make payments to us for our accounts receivable orsales, to provide inventoryproduct to us on advances made, or to perform on fixed-price contracts may cause us to experience losses and may adversely impact our liquidity and our ability to make our payments when due.
A loss may occur from the failure of our counterparties to perform according to the terms of their marketing agreements.
Under our third-party marketing agreements, we purchase all of our third-party producers’ ethanol production. In turn, we sell the ethanol in various markets for future deliveries. Under these marketing agreements, the third-party producers are not obligated to produce any minimum amount of ethanol and we cannot assure you that we will receive the full amount of ethanol that these third-party plants are expected to produce. The interruption or curtailment of production by any of our third-party producers for any reason could cause us to be unable to deliver quantities of ethanol sold under the contracts. As a result, we may be forced to purchase replacement quantities of ethanol at higher prices to fulfill these contractual obligations. However, these recoveries would be dependent on our third-party producer’s ability to pay, and in the event they were unable to pay, our profitability could be materially and adversely impacted.
We are exposed to potential business disruption from factors outside our control, including natural disasters, seasonality, severe weather conditions, accidents, and unforeseen plant shutdowns,operational failures due to faulty construction design or other factors, any of which could adversely affect our cash flows and operating results.
Potential business disruption in available transportation due to natural disasters, significant track damage resulting from a train derailment, or strikes by our transportation providers could result in delays in procuring and supplying raw materials to our ethanol or grain facilities, or transporting ethanol and distillers grains to our customers. We also run the risk of unforeseen operational issues, due to faulty construction design or other factors, that may result in an extended plant shutdown. Such business disruptions would cause the normal course of our business operations to stall and may result in our inability to meet customer demand or contract delivery requirements, as well as the potential loss of customers.
Many of our grain business activities, as well as corn procurement for our ethanol plants, are dependent on weather conditions. Adverse weather may result in a reduction in the sales of fertilizer or pesticides during typical application periods, a reduction in grain harvests caused by inadequate or excessive amounts of rain during the growing season, or by overly wet conditions, an early freeze or snowy weather during the harvest season. Additionally, corn stored in an open pile may become damaged by too much rain and warm weather before the corn is dried, shipped, consumed or moved into a storage structure.
Casualty losses may occur for which we have not secured adequate insurance.
We have acquired insurance that we believe to be adequate to prevent loss from foreseeable risks. However, events occur for which no insurance is available or for which insurance is not available on terms that are acceptable to us. Loss from such an event, such as, but not limited to, earthquake, tornados,tornado, war, riot, terrorism or other risks, may not be insured and such a loss may have a material adverse effect on our operations, cash flows and financial position.
Our Obion, Tennessee plant is located within a recognized seismic zone. The design of this facility has been modified to fortify it to meet structural requirements for that region of the country. We have also obtained additional insurance coverage specific to earthquake risk for this plant. However, there is no assurance that this facility would remain in operation if a seismic event were to occur.
If our internal computer network and applications suffer disruptions or fail to operate as designed, our operations will be disrupted and our business may be harmed.
We rely on network infrastructure and enterprise applications, and internal technology systems for our operational, marketing support and sales, and product development activities. The hardware and software systems related to such activities are subject to damage from earthquakes, floods, lightning, tornadoes,tornados, fire, power loss, telecommunication failures and other similar events. They are also subject to acts such as computer viruses, physical or electronic vandalism or other similar disruptions that could cause system interruptions and loss of critical data, and could prevent us from fulfilling our customers’ orders. We cannot assure you that any of our backup systems would be sufficient. Any event that causes failures or interruption in our hardware or software systems could result in disruption of our business operations, have a negative impact on our operating results, and damage our reputation.
We may not be able to hire and retain qualified personnel to operate our ethanol plants.
Our success depends, in part, on our ability to attract and retain competent personnel. For each of our plants, qualified managers, engineers, operations and other personnel must be hired. Competition for both managers and plant employees in the ethanol industry can be intense, and we may not be able to attract and retain qualified personnel. If we are unable to hire and retain productive and competent personnel, the amount of ethanol we produce may decrease and we may not be able to efficiently operate our ethanol plants and execute our business strategy.
Risks relating to ownership of our common stock
The price of our common stock may be volatile.
The trading price of our common stock may be highly volatile and could be subject to fluctuations in response to a number of factors beyond our control. Some of these factors are:
our results of operations and the performance of our competitors;
the public’s reaction to our press releases, other public announcements and filings with the SEC;
changes in earnings estimates or recommendations by research analysts who follow us or other companies in our industry;
changes in general economic conditions;
changes in market prices for our products or for our raw materials;
actions of our historical equity investors, including sales of common stock by our directors, executive officers and significant shareholders;
actions by institutional investors trading in our stock;
disruption of our operations;
any major change in our management team;
other developments affecting us, our industry or our competitors; and
U.S. and international economic, legal and regulatory factors unrelated to our performance.
In recent years the stock market has experienced significant price and volume fluctuations. These fluctuations may be unrelated to the operating performance of particular companies. These broad market fluctuations may cause declines in the market price of our common stock. The price of our common stock could fluctuate based upon factors that have little or nothing to do with our Company or its performance, and those fluctuations could materially reduce our common stock price.
Our principal shareholders have substantial influence over us and they may make decisions with which you disagree.
As of December 31, 2010,2011, subsidiaries of NTR plc, Wilon Holdings, S.A., and Wayne Hoovestol, a director and our former Chief Executive Officer, beneficially own approximately 31.1%23.5%, 5.7%6.3% and 2.6%2.8%, respectively, of our outstanding common stock. NTR, Wilon and Mr. Hoovestol have entered into a Shareholders’ Agreement with us in which NTR had the right to designate four individuals to be nominated to our board, so long as it owned more than 33.5% of our outstanding stock, and Wilon has the right to designate one individual to be nominated to our board so long it holds more than 2.5% of our outstanding stock. NTR, Wilon and Mr. Hoovestol have agreed to vote for such nomineesWilon’s nominee at any meeting of shareholders for the purpose of electing directors. Although NTR’s ownership recently has dropped below the level contractually required to designate four individuals to our board, it continues to hold a significant percentage of our stock. As a result of suchthe share ownership by NTR, Wilon and Mr. Hoovestol, these personsshareholders have the ability to controlsignificantly influence the composition of our Board of Directors and significantly influence other matters requiring shareholder approval including mergers and other significant transactions. These shareholders may have interests that differ from yours, and they may vote in a way with which you disagree and that may be adverse to your interests. This concentration of ownership could present or delay a change of control of us or deprive shareholders of a right to receive a premium for their shares as part of our sale, which could also affect the market price of our common stock.
A significant percentage of our outstanding voting stock is held by a concentrated number of shareholders which could impact your liquidity.
As of December 31, 2010,2011, approximately 44.1%36.8% of our outstanding common stock is held by NTR, Wilon, and our executive officers and directors. Continued concentrated ownership could result in fewer shares being available to be traded in the market, resulting in reduced liquidity. In addition, a decision by one or more large shareholder to liquidate its holdings could adversely affect the trading price of our stock. On August 11, 2010, the SEC declared effective the S-3 Registration Statement we had filed at the request of NTR to register the resale of 11,227,653 shares of our common stock representing all of NTR’s shares held at that date, as permitted under the Shareholders’ Agreement. The registration statement will permitpermits NTR to sell some or all of its shares without restriction. On September 9, 2011, we repurchased 3.5 million shares of common stock from NTR plc reducing their ownership to 7,727,653 shares. The registration of thesethe remaining shares of common stock does not necessarily mean that NTR will offer or sell any more of these shares.
Anti-takeover provisions could make it difficult for a third party to acquire us.
Our second amended and restated articles of incorporation, our amended and restated bylaws and Iowa law contain anti-takeover provisions that could have the effect of delaying or preventing changes in control of us or our management. These provisions could also discourage proxy contests and make it more difficult for our shareholders to elect directors and take other corporate actions without the concurrence of our management or Board of Directors. The provisions in our charter documents include the following:
a classified Board of Directors pursuant to which our directors are divided into three classes, with three-year staggered terms;
members of our Board of Directors can only be removed for cause by shareholders with the affirmative vote of not less than two-thirds of the outstanding shares of capital stock;
shareholder action may be taken only at a special or annual meeting, and not by any written consent, except where required by Iowa law;
our bylaws restrict our shareholders’ ability to make proposals at shareholder meetings; and
our Board of Directors has the ability to cause us to issue authorized and unissued shares of stock from time to time.
We are subject to the provisions of the Iowa Business Corporations Act, or IBCA, under which, certain business combinations between an Iowa corporation whose stock is publicly traded or held by more than 2,000 shareholders and an interested shareholder are prohibited for a three-year period following the date that such a shareholder became an interested shareholder unless certain exemption requirements are met. In addition, certain other provisions of the IBCA may have anti-takeover effects in certain situations.
Certain provisions in the convertible notes and the related indenture could make it more difficult or more expensive for a third party to acquire us. For example, if a takeover would constitute a fundamental change, holders of the notes will have the right to require us to repurchase their notes in cash. In addition, if a takeover constitutes a make-whole fundamental change, we may be required to increase the conversion rate for holders who convert their notes in connection with such takeover. In either case, and in other cases, our obligations under the notes and the related indenture could increase the cost of acquiring us or otherwise discourage a third party from acquiring us or removing incumbent management.
The foregoing items may discourage transactions that otherwise could provide for the payment of a premium over prevailing market prices of our common stock and also could limit the price that investors are willing to pay in the future for shares of our common stock.
Non-U.S. holders may be subject to U.S. income tax with respect to gain on disposition of their common stock.
If we are or have been a U.S. real property holding corporation at any time within the shorter of the five-year period preceding a disposition of common stock by a non-U.S. holder or such holder’s holding period of the stock disposed of, such non-U.S. holder may be subject to United States federal income tax with respect to gain on such disposition. Because the determination of whether we are a USRPHC depends on the fair market value of our United States real property interests relative to the fair market value of our other trade or business assets and our non-U.S. real property interests, there can be no assurance that we are not a USRPHC or will not become one in the future.
None.
Our loan agreements grant a security interest in substantially all of our owned real property. SeeNote 10 – Debtincluded herein as part of the Notes to Consolidated Financial Statements for a discussion of our loan agreements.
Corporate
We currently lease approximately 11,80029,857 square feet of office space at 9420 Underwood Avenue, Suite 100450 Regency Parkway in Omaha, Nebraska for our corporate headquarters, which houses our corporate administrative functions and commodity trading operations. This lease expires in October 2011. We have entered into a lease with a term of sixty-six months, effective on the later of our occupancy or June 1, 2011, to occupy 22,224 square feet of office space at 450 Regency Parkway in Omaha, Nebraska.
Ethanol Production Segment
As disclosed and detailed in our discussion of the ethanol production segment, we own a total of approximately 1,5931,530 acres of land in eightnine locations with a combined plant production capacity of 680740 mmgy. We also lease approximately 129 acres of land near our Obion plant. We believe that the property owned and leased at the sites of our eightnine ethanol plants will be adequate to accommodate our current needs, as well as potential expansion, at those sites.
Agribusiness Segment
We own approximately 134 acres of land inat seven locations in Northwestnorthwest Iowa near our Superior ethanol plant, for our agribusiness operations with licensed grain storage capacity of approximately 15.819.6 million bushels, 3.6 million gallons of liquid fertilizer storage and 12,000 tons of dry fertilizer storage. We also own approximately 11 additional acres of land at our grain elevator in Essex, Iowa, near our Shenandoah ethanol plant,with grain storage capacity of approximately 1.9 million bushels at this site. In west Tennessee, we own 38 acres of land with grain storage capacity of approximately 13.7 million bushels. In June 2011, we acquired approximately 5.1 acres of land in Hopkins, Missouri with licensed grain storage capacity of approximately 2.82.0 million bushels at this site. In 2010,and in January 2012, we acquired approximately 385.8 acres of land in west TennesseeSt. Edward, Nebraska with licensed grain storage capacity of approximately 11.71.9 million bushels. We believe that the property owned at these sites will be adequate to accommodate our current needs, as well as potential expansion.
Marketing and Distribution Segment
Our ethanol, distillers grains and corn oil marketing operations are located at our corporate office, which is discussed above. BlendstarBlendStar owns nine acres and leases approximately 19 acres of land in ten locations (with one owned location currently in development) throughout the south central United States, as disclosed inItem 1 – Business, for its blending and terminaling operations. We believe that the property owned and leased at the locations will be adequate to accommodate our current needs, as well as potential expansion.
Our loan agreements grant a security interest in substantially all of our owned real property. SeeNote 11 – Long-Term Debtincluded herein as part of the Notes to Consolidated Financial Statements for a discussion of our loan agreements.
None.In April 2011, Aventine Renewable Energy, Inc. filed a complaint in the United States Bankruptcy Court for the District of Delaware in connection with its Chapter 11 bankruptcy naming as defendants Green Plains Renewable Energy, Inc., Green Plains Obion LLC, Green Plains Bluffton LLC, Green Plains VBV LLC and Green Plains Trade Group LLC. This action alleges $24.4 million of damages from preferential transfers or, in the alternative, $28.4 million of damages from fraudulent transfers under an ethanol marketing agreement and an unspecified amount of damages for a continuing breach of a termination agreement related to rail cars. We are unable to predict the outcome of these matters at this time, and any views formed as to the viability of these claims or the financial exposure which could result may change as the matters proceed through their course. We intend to defend these claims vigorously.
Green Plains Bluffton LLC was issued a notice of violation under Section 113(a)(1) of the Clean Air Act by the EPA on July 1, 2011 for violations of the Indiana State Implementation Plan for exceeding NOx emission limits per hour and for operation of the thermal oxidizer below the required average temperature pursuant to the Federally Enforceable State Operating Permit issued to the facility by the Indiana Department of Environmental Management. The EPA has proposed a fine of approximately $197 thousand though we believe there are mitigating factors that may reduce this amount below such level once resolved. Furthermore, we believe we may have recourse to the vendor who installed the continuous emissions monitoring system, the operation of which was the source of the violation.
In addition to the above-described proceedings, we are currently involved in other litigation that has arisen in the ordinary course of business; however, we do not believe that any of this other litigation will have a material adverse effect on our financial position, results of operations or cash flows.
EXECUTIVE OFFICERS OF THE REGISTRANT.
As of December 31, 2010, our executive officers, their ages and their positions were as follows:
|
| |||||
| ||||||
| ||||||
| ||||||
| ||||||
| ||||||
| ||||||
| ||||||
| ||||||
TODD BECKER was named President and Chief Executive Officer of the Company on January 1, 2009, and was appointed as a Director in March 2009. Mr. Becker served as the Company’s President and Chief Operating Officer from October 2008 to December 2008. He served as Chief Executive Officer of VBV LLC from May 2007 to October 2008. Mr. Becker was Executive Vice President of Sales and Trading at Global Ethanol from May 2006 to May 2007. Prior to that, he worked for ten years with ConAgra Foods in various management positions including Vice President of International Marketing for ConAgra Trade Group and President of ConAgra Grain Canada. Mr. Becker has over 20 years of related experience in various commodity processing businesses, risk management and supply chain management, along with extensive international trading experience in agricultural markets. Mr. Becker has a Masters degree in Finance from the Kelley School of Business at Indiana University and a Bachelor of Science degree in Business Administration with a Finance emphasis from the University of Kansas.
JERRY PETERS joined the Company as Chief Financial Officer in June 2007. Mr. Peters served as Senior Vice President - Chief Accounting Officer for ONEOK Partners, L.P. from May 2006 to April 2007, as its Chief Financial Officer from July 1994 to May 2006, and in various senior management roles prior to that. ONEOK Partners is a publicly-traded partnership engaged in gathering, processing, storage, and transportation of natural gas and natural gas liquids. Prior to joining ONEOK Partners in 1985, he was employed by KPMG LLP as a certified public accountant. Mr. Peters has a Masters degree in Business Administration from Creighton University with a Finance emphasis and a Bachelor of Science degree in Business Administration from the University of Nebraska – Lincoln.
JEFF BRIGGS was named Chief Operating Officer in November 2009. Mr. Briggs served as a consultant to the Company from July 2009 to November 2009. Prior to his consulting role, he was Founder and General Partner of Frigate Capital, LLC, a private investment partnership investing in small and mid-sized companies, from January 2004 through January 2009. Prior to Frigate, Mr. Briggs spent nearly seven years at Valmont Industries, Inc. as President of the Coatings Division. Prior to Valmont, he acquired and managed an electronic manufacturing company; was Director of Mergers and Acquisitions for Peter Kiewit and Sons; worked for Goldman Sachs in their Equities Division; and served five years as an Officer in the U.S. Navy on a nuclear submarine. Mr. Briggs has a Masters degree in Business Administration from the Harvard Business School and a Bachelor of Science degree in Mechanical Engineering, Thermal and Power Systems from UCLA.
STEVE BLEYL joined the Company as Executive Vice President – Ethanol Marketing in October 2008. Mr. Bleyl served as Executive Vice President – Ethanol Marketing for VBV LLC from October 2007 to October 2008. From June 2003 until September 2007, he served as Chief Executive Officer of Renewable Products Marketing Group LLC, an ethanol marketing company, building it from a cooperative marketing group of five ethanol plants in one state to seventeen production facilities in seven states. Prior to that, Mr. Bleyl worked for over 20 years in various senior management and executive positions in the fuel industry. Mr. Bleyl has a Masters degree in Business Administration from the University of Oklahoma and a Bachelor of Science degree in Aerospace Engineering from the United States Military Academy.
RON GILLIS joined the Company as Executive Vice President – Finance and Treasurer in October 2008. Mr. Gillis served as Chief Financial Officer for VBV LLC from August 2007 to October 2008. From May 2005 until July 2007, he served as Chief Financial Officer of Renewable Products Marketing Group LLC, an ethanol marketing company. Prior to that, Mr. Gillis served for over 20 years in senior financial management, control and audit positions with ConAgra Foods Inc. in the commodity trading area, both domestic and international. Mr. Gillis is a certified management accountant and holds an Honors Commerce degree from the University of Manitoba.
MICHELLE MAPES was named Executive Vice President – General Counsel and Corporate Secretary in November 2009 after joining the Company in September 2009 as its General Counsel. Prior to joining Green Plains, Ms. Mapes was a Partner at Husch Blackwell Sanders, LLP, where for three years she focused her legal practice nearly exclusively in renewable energy. Prior to that, she was Chief Administrative Officer and General Counsel for HDM Corporation. Ms. Mapes served as Senior Vice President – Corporate Services and General Counsel to Farm Credit Services of America from April 2000 to June 2005. Ms. Mapes holds a Juris Doctorate, a Masters degree in Business Administration and a Bachelor of Science degree in Accounting and Finance, all from the University of Nebraska – Lincoln.
MIKE ORGAS joined the Company as Executive Vice President – Commercial Operations in November 2008. Mr. Orgas has extensive experience in supply chain management, logistics, risk management, and strategic planning. From May 2004 to October 2008, he served as the Director of Raw Materials Strategic Sourcing and Risk Management for the Malt-O-Meal Company. From February 2003 to December 2003, Mr. Orgas was a Partner in the Agribusiness/Food Practice of McCarthy & Company, an advisory services firm. Prior to that, he served in various management capacities at ConAgra Foods, Inc. and at General Mills. Mr. Orgas has a Masters degree in Business Management from the University of Montana and a Bachelor of Science degree in Business Administration from the University of Minnesota.
EDGAR SEWARD joined the Company as Executive Vice President – Plant Operations in October 2008. From May 2006 until October 2008, Mr. Seward served as the General Manager for Indiana Bio-Energy, LLC, a subsidiary of VBV LLC, where he managed development of the Bluffton ethanol plant from its inception through construction, staffing and operations. From January 2004 to April 2006, he served as a General Manager for United Bio-Energy, LLC, where he managed development of and provided technical support for multiple dry mill ethanol facilities. From October 2002 to December 2003, Mr. Seward served as a project manager for ICM, Inc., where he was actively involved in the design and specifications for dry milling technologies and facilities. Prior to that, he served in operations for a bio-technology business in the United Kingdom and in operations management at Aventine Renewable Energy. Mr. Seward has a Masters degree in Business Administration from the University of Illinois and a Bachelor of Science degree in Biology from Culver-Stockton College.Not Applicable.
Our common stock trades under the symbol “GPRE” on The NASDAQ Global Market, or NASDAQ. The following table sets forth, for the periods indicated, the high and low common stock sale prices as reported by NASDAQ.
Year Ended December 31, 2010 | High | Low | ||||||||||
Three months ended December 31, 2010 (1) | $ | 13.64 | $ | 10.53 | ||||||||
Three months ended September 30, 2010 | 12.35 | 8.12 | ||||||||||
Three months ended June 30, 2010 | 16.25 | 10.12 | ||||||||||
Three months ended March 31, 2010 | 17.97 | 11.23 | ||||||||||
Year Ended December 31, 2009 | High | Low | ||||||||||
Three months ended December 31, 2009 | $ | 16.00 | $ | 6.50 | ||||||||
Three months ended September 30, 2009 | 8.28 | 6.03 | ||||||||||
Three months ended June 30, 2009 | 9.45 | 1.95 | ||||||||||
Three months ended March 31, 2009 | 3.29 | 1.12 | ||||||||||
Year Ended December 31, 2011 | High | Low | ||||||
Three months ended December 31, 2011 (1) | $ | 11.48 | $ | 8.34 | ||||
Three months ended September 30, 2011 | 12.06 | 9.06 | ||||||
Three months ended June 30, 2011 | 12.80 | 9.87 | ||||||
Three months ended March 31, 2011 | 13.00 | 10.97 | ||||||
Year Ended December 31, 2010 | High | Low | ||||||
Three months ended December 31, 2010 | $ | 13.64 | $ | 10.53 | ||||
Three months ended September 30, 2010 | 12.35 | 8.12 | ||||||
Three months ended June 30, 2010 | 16.25 | 10.12 | ||||||
Three months ended March 31, 2010 | 17.97 | 11.23 | ||||||
(1) The closing price of our common stock on December 31, 2010 was $11.26.
| (1) | The closing price of our common stock on December 31, 2011 was $9.76 |
Holders of Record
As of December 31, 2010,2011, as reported to us by our transfer agent, there were 1,7912,673 holders of record of our common stock, not including beneficial holders whose shares are held in names other than their own. This figure does not include 14,404,21017,871,407 shares held in depository trusts.
Dividend Policy
To date, we have not paid dividends on our common stock. The payment of dividends on our common stock in the future, if any, is at the discretion of the Board of Directors and will depend upon our earnings, capital requirements, financial condition and other factors our board views as relevant. The payment of dividends may also effectively be limited by covenants in our subsidiaries’ loan agreements. Our board does not intend to declare any dividends in the foreseeable future.
Issuer Purchases of Equity Securities
The Company withholdsEmployees surrender shares upon the vesting of restricted stock grants to cover employeesatisfy payroll and income taxes.tax withholding obligations. The following table sets forth the shares that were withheldsurrendered by month during the fourth quarter of 2010.2011.
Month | Total Number of Shares Withheld | Average Price Paid per Share | Total Number of Shares Withheld | Average Price Paid per Share | ||||||||||||||||
October | 10,499 | $ | 11.94 | 9,626 | $ | 9.94 | ||||||||||||||
November | 2,187 | $ | 11.22 | 3,771 | $ | 10.43 | ||||||||||||||
December | - | $ | - | — | $ | — | ||||||||||||||
|
| |||||||||||||||||||
Total | 12,686 | $ | 11.82 | 13,397 | $ | 10.08 | ||||||||||||||
|
| |||||||||||||||||||
On September 9, 2011, we repurchased 3.5 million shares of common stock at a price of $8.00 per share from a subsidiary of NTR plc, which is a principal shareholder. We do not have a share repurchase program and do not intend to retire the repurchased shares.
Recent Sales of Unregistered Securities
None.
Equity Compensation Plans
The following table sets forth, as of December 31, 2010, certainRefer to Part III, Item 12, contained herein, for information related to our compensation plans under whichregarding shares of our common stock are authorized for issuance.
Plan Category | Number of Securities to be Issued upon Exercise of Outstanding Options, Warrants and Rights (a) | Weighted-Average Exercise Price of Outstanding Options, Warrants and Rights | Number of Securities Remaining Available for Future Issuance under Equity Compensation Plans (Excluding Securities Reflected in Column (a)) | |||||||||||||||||||||
| Equity compensation plans approved by security holders (1) | 824,475 | $ | 18.81 | 382,887 | ||||||||||||||||||||
| Equity compensation plans not approved by security holders (2) | 360,000 | $ | 7.66 | - | ||||||||||||||||||||
Total | 1,184,475 | 382,887 | ||||||||||||||||||||||
(1) The maximum number of shares that may be issuedissuance under the 2009 Equity Incentive Plan as option grants, restricted stock awards, restricted stock units, stock appreciation rights, direct share issuances and other stock-based awards is 1,000,000 shares of our common stock, which includes shares remaining under the 2007 Equity Incentive plan that were rolled in the 2009 Equity Incentive Plan on May 9, 2009. Also included in the 2007 plan were 267,528 shares assumed in the October 2008 merger with VBV.
(2) In connection with the October 2008 merger with VBV, 150,000 fully-vested options were issued to Todd A. Becker on October 16, 2008 as an inducement grant pursuant to the Becker Employment Agreement. Grants were given to six individuals for a total of 260,000 options as inducement to enter into employment arrangements with Green Plains. One-quarter of those options vested on the date of grant, with one-quarter vesting on the same date in each of the three years thereafter.equity compensation plans.
Performance Graph
The following line-graph compares our cumulative stockholder return on an indexed basis with the NASDAQ Composite Index (IXIC) and the NASDAQ Clean Edge Green Energy Index (CELS) for the two fiscal yearsyear ended November 30, 2006 and 2007, for the 13-month period ended December 31, 2008, and for the years ended December 31, 2009, 2010 and 2010.2011. The graph assumes that the value of the investment in our common stock and each index was $100 at November 30, 2005, the approximate date upon which we closed its first public offering (at an initial public offering price of $10 per share),2006, and that all dividends were reinvested.
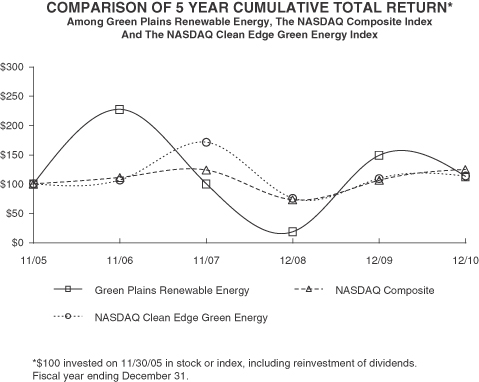
Among Green Plains Renewable Energy, the NASDAQ Composite Index,
and the NASDAQ Clean Edge Green Energy Index
| 11/05 | 11/06 | 11/07 | 12/08 | 12/09 | 12/10 | |||||||||||||||||||||||||||||||||||||||
Green Plains | $ | 100.00 | $ | 227.10 | $ | 100.00 | $ | 18.40 | $ | 148.70 | $ | 112.60 | ||||||||||||||||||||||||||||||||
NASDAQ Composite | $ | 100.00 | $ | 111.04 | $ | 123.68 | $ | 73.10 | $ | 106.14 | $ | 124.78 | ||||||||||||||||||||||||||||||||
NASDAQ Clean Edge Green Energy | $ | 100.00 | $ | 106.70 | $ | 170.90 | $ | 75.80 | $ | 109.25 | $ | 113.59 | ||||||||||||||||||||||||||||||||
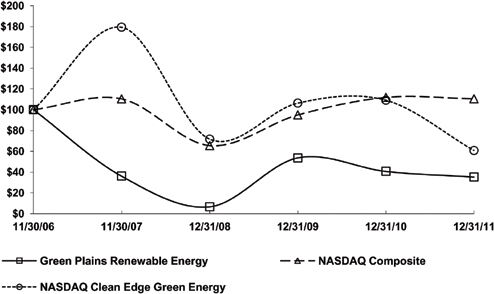
*$100 invested on 11/30/06 in stock or index, including reinvestment of dividends.
Fiscal year ending December 31.
| 11/06 | 11/07 | 12/08 | 12/09 | 12/10 | 12/11 | |||||||||||||||||||
Green Plains Renewable Energy, Inc. | $ | 100.00 | $ | 36.09 | $ | 6.64 | $ | 53.66 | $ | 40.64 | $ | 35.22 | ||||||||||||
NASDAQ Composite | $ | 100.00 | $ | 110.40 | $ | 65.47 | $ | 94.93 | $ | 111.79 | $ | 110.50 | ||||||||||||
NASDAQ Clean Edge Green Energy | $ | 100.00 | $ | 179.32 | $ | 71.67 | $ | 106.31 | $ | 109.08 | $ | 60.73 | ||||||||||||
The information contained in the Performance Graph will not be deemed to be soliciting material or to be filed with the SEC, nor will such information be incorporated by reference into any future filing under the Securities Act of 1933, as amended, or the Securities Act, or under the Securities Exchange Act of 1934, except to the extent that we specifically incorporate it by reference into any such filing.
The following selected financial data have been derived from our consolidated financial statements. The statement of operations data for the years ended December 31, 2011, 2010 and 2009, and for the nine-month transition period ended December 31, 2008, and the balance sheet data as of December 31, 20102011 and 2009 in the table2010 are derived from and should be read in conjunction with our audited consolidated financial statements, including accompanying notes, included elsewhere in this report. The statement of operations data for the nine-month transition period ended December 31, 2008 and the fiscal year ended
March 31, 2008, and for the period from September 29, 2006 (date of inception) to March 31, 2007 and the balance sheet data as of December 31, 2009, December 31, 2008 and March 31, 2008 and 2007 were derived from our audited consolidated financial statements not included in this report, which also containscontain a description of a number of matters that materially affect the comparability of the periods
presented. ThisThe data should be read together withItem 7 – Management’s Discussion and Analysis of Financial Condition and Results of Operations of this report. The financial information below is not necessarily indicative of results to be expected for any future period. Future results could differ materially from historical results due to many factors, including those discussed inItem 1A – Risk Factors of this report.
| Year Ended December 31, 2010 | Year Ended December 31, 2009 | Nine-Month Transition Period Ended December 31, 2008 (1) | Year Ended March 31, 2008 (1) | Period from September 29, 2006 (Date of Inception) to March 31, 2007 (1) | ||||||||||||||||||||||||||||||||
Statement of Operations Data: | ||||||||||||||||||||||||||||||||||||
(in thousands, except per share information) | ||||||||||||||||||||||||||||||||||||
Revenues | $ | 2,132,968 | $ | 1,304,174 | $ | 188,758 | $ | - | $ | - | ||||||||||||||||||||||||||
Cost of goods sold | 1,981,396 | 1,221,745 | 175,444 | - | - | |||||||||||||||||||||||||||||||
Gross profit | 151,572 | 82,429 | 13,314 | - | - | |||||||||||||||||||||||||||||||
Selling, general and administrative expenses | 60,467 | 44,923 | 18,467 | 5,423 | 1,421 | |||||||||||||||||||||||||||||||
Operating income (loss) | 91,105 | 37,506 | (5,153 | ) | (5,423 | ) | (1,421 | ) | ||||||||||||||||||||||||||||
Total other income (expense) | (25,054 | ) | (17,261 | ) | (2,896 | ) | 1,423 | 1,351 | ||||||||||||||||||||||||||||
Net income (loss) | 48,162 | 20,154 | (8,049 | ) | (4,000 | ) | (70 | ) | ||||||||||||||||||||||||||||
Net income (loss) attributable to Green Plains | 48,012 | 19,790 | (6,897 | ) | (3,520 | ) | (42 | ) | ||||||||||||||||||||||||||||
Earnings (loss) per share attributable to Green Plains: | ||||||||||||||||||||||||||||||||||||
Basic | $ | 1.55 | $ | 0.79 | $ | (0.56 | ) | $ | (0.47 | ) | $ | (0.01 | ) | |||||||||||||||||||||||
Diluted | $ | 1.51 | $ | 0.79 | $ | (0.56 | ) | $ | (0.47 | ) | $ | (0.01 | ) | |||||||||||||||||||||||
Other Data: | ||||||||||||||||||||||||||||||||||||
EBITDA (unaudited and in thousands) (2) | $ | 129,550 | $ | 67,707 | 601 | $ | (3,980 | ) | $ | (67 | ) | |||||||||||||||||||||||||
| December 31, | March 31, | |||||||||||||||||||||||||||||||||||
| Balance Sheet Data(in thousands): | 2010 | 2009 | 2008 | 2008 | 2007 | |||||||||||||||||||||||||||||||
Cash and cash equivalents | $ | 233,205 | $ | 89,779 | $ | 62,294 | $ | 538 | $ | 87,466 | ||||||||||||||||||||||||||
Current assets | 638,773 | 252,446 | 190,797 | 5,285 | 89,070 | |||||||||||||||||||||||||||||||
Total assets | 1,429,866 | 878,081 | 693,263 | 254,175 | 175,454 | |||||||||||||||||||||||||||||||
Current liabilities | 374,590 | 174,332 | 108,446 | 26,856 | 2,085 | |||||||||||||||||||||||||||||||
Long-term debt | 527,900 | 388,573 | 299,011 | 80,711 | 64,845 | |||||||||||||||||||||||||||||||
Total liabilities | 932,224 | 567,373 | 413,278 | 107,567 | 27,829 | |||||||||||||||||||||||||||||||
Stockholders’ equity | 497,642 | 310,708 | 279,985 | 107,986 | 108,523 | |||||||||||||||||||||||||||||||
(1) The October 15, 2008 merger with VBV, LLC was accounted for as a reverse acquisition. Although VBV was considered the acquiring entity for accounting purposes, the merger was structured so that VBV became our wholly-owned subsidiary. As a result, our assets and liabilities as of October 15, 2008, the date of the merger closing, were incorporated into VBV’s balance sheet based on the fair values of the net assets, which equaled the consideration paid in the merger. U.S. generally accepted accounting principles, or GAAP, also requires an allocation of the acquisition consideration to individual assets and liabilities including tangible assets, financial assets, separately-recognized intangible assets and goodwill.
Pursuant to reverse merger accounting rules, our consolidated financial statements and results of operations for the nine-month transition period ended December 31, 2008, the year ended March 31, 2008 and the period from September 29, 2006 (date of inception) to March 31, 2007 reflect the historical financial results of VBV and its subsidiaries for these periods, along with the acquired fair value of our assets and liabilities as of October 15, 2008 and our financial results since October 15, 2008.
(2) Management uses earnings before interest, income taxes, noncontrolling interests, depreciation and amortization, or EBITDA, to compare the financial performance of our business segments and to internally manage those segments. Management believes that EBITDA provides useful information to investors as a measure of comparison with peer and other companies. EBITDA should not be considered an alternative to, or more meaningful than, net income or cash flow as determined in accordance with generally accepted accounting principles. EBITDA calculations may vary from company to company. Accordingly, our computation of EBITDA may not be comparable with a similarly titled measure of another company. The following sets forth the reconciliation of net income to EBITDA for the periods indicated (in thousands):
| Year Ended December 31, 2011 | Year Ended December 31, 2010 | Year Ended December 31, 2009 | Nine-Month Transition Period Ended December 31, 2008 (1) | Year Ended March 31, 2008 (1) | ||||||||||||||||
Statement of Operations Data: | ||||||||||||||||||||
(in thousands, except per share information) | ||||||||||||||||||||
Revenues | $ | 3,553,712 | $ | 2,133,922 | $ | 1,305,793 | $ | 188,758 | $ | — | ||||||||||
Cost of goods sold | 3,381,480 | 1,981,396 | 1,221,745 | 175,444 | — | |||||||||||||||
Gross profit | 172,232 | 152,526 | 84,048 | 13,314 | — | |||||||||||||||
Selling, general and administrative expenses | 73,219 | 60,475 | 44,923 | 18,467 | 5,423 | |||||||||||||||
Operating income (loss) | 99,013 | 92,051 | 39,125 | (5,153 | ) | (5,423 | ) | |||||||||||||
Total other income (expense) | (37,114 | ) | (26,000 | ) | (18,880 | ) | (2,896 | ) | 1,423 | |||||||||||
Net income (loss) | 38,213 | 48,162 | 20,154 | (8,049 | ) | (4,000 | ) | |||||||||||||
Net income (loss) attributable to Green Plains | 38,418 | 48,012 | 19,790 | (6,897 | ) | (3,520 | ) | |||||||||||||
Earnings (loss) per share attributable to Green Plains: | ||||||||||||||||||||
Basic | $ | 1.09 | $ | 1.55 | $ | 0.79 | $ | (0.56 | ) | $ | (0.47 | ) | ||||||||
Diluted | $ | 1.01 | $ | 1.51 | $ | 0.79 | $ | (0.56 | ) | $ | (0.47 | ) | ||||||||
Other Data: | ||||||||||||||||||||
EBITDA (unaudited and in thousands) (2) | $ | 148,620 | $ | 129,550 | $ | 67,707 | $ | 601 | $ | (3,980 | ) | |||||||||
| December 31, | March 31, | |||||||||||||||||||
| 2011 | 2010 | 2009 | 2008 | 2008 | ||||||||||||||||
Balance Sheet Data(in thousands): | ||||||||||||||||||||
Cash and cash equivalents | $ | 174,988 | $ | 233,205 | $ | 89,779 | $ | 62,294 | $ | 538 | ||||||||||
Current assets | 576,420 | 606,686 | 252,446 | 190,797 | 5,285 | |||||||||||||||
Total assets | 1,420,828 | 1,397,779 | 878,081 | 693,263 | 254,175 | |||||||||||||||
Current liabilities | 360,965 | 342,503 | 174,332 | 108,446 | 26,856 | |||||||||||||||
Long-term debt | 493,407 | 527,900 | 388,573 | 299,011 | 80,711 | |||||||||||||||
Total liabilities | 915,471 | 900,137 | 567,373 | 413,278 | 107,567 | |||||||||||||||
Stockholders’ equity | 505,357 | 497,642 | 310,708 | 279,985 | 107,986 | |||||||||||||||
| Year Ended December 31, 2010 | Year Ended December 31, 2009 | Nine-Month Transition Period Ended December 31, 2008 | Year Ended March 31, 2008 | Period from September 29, 2006 (Date of Inception) to March 31, 2007 | ||||||||||||||||||||||||||||||||
Net income (loss) attributable to Green Plains | $ | 48,012 | $ | 19,790 | $ | (6,897 | ) | $ | (3,520 | ) | $ | (42 | ) | |||||||||||||||||||||||
Interest expense | 24,668 | 18,049 | 3,933 | - | - | |||||||||||||||||||||||||||||||
Depreciation and amortization | 38,831 | 29,413 | 4,717 | 20 | 3 | |||||||||||||||||||||||||||||||
Net income (loss) attributable to noncontrolling interests | 150 | 364 | (1,152 | ) | (480 | ) | (28 | ) | ||||||||||||||||||||||||||||
Income taxes | 17,889 | 91 | - | - | - | |||||||||||||||||||||||||||||||
EBITDA | $ | 129,550 | $ | 67,707 | $ | 601 | $ | (3,980 | ) | $ | (67 | ) | ||||||||||||||||||||||||
| (1) | The October 15, 2008 merger with VBV, LLC was accounted for as a reverse acquisition. Although VBV was considered the acquiring entity for accounting purposes, the merger was structured so that VBV became our wholly-owned subsidiary. As a result, our assets and liabilities as of October 15, 2008, the date of the merger closing, were incorporated into VBV’s balance sheet based on the fair values of the net assets, which equaled the consideration paid in the merger. U.S. generally accepted accounting principles, or GAAP, also requires an allocation of the acquisition consideration to individual assets and liabilities including tangible assets, financial assets, separately-recognized intangible assets and goodwill. Pursuant to reverse merger accounting rules, our consolidated financial statements and results of operations for the nine-month transition period ended December 31, 2008, the year ended March 31, 2008 and the period from September 29, 2006 (date of inception) to March 31, 2007 reflect the historical financial results of VBV and its subsidiaries for these periods, along with the acquired fair value of our assets and liabilities as of October 15, 2008 and our financial results since October 15, 2008. |
| (2) | Management uses earnings before interest, income taxes, noncontrolling interests, depreciation and amortization, or EBITDA, to compare the financial performance of our business segments and to internally manage those segments. Management believes that EBITDA provides useful information to investors as a measure of comparison with peer and other companies. EBITDA should not be considered an alternative to, or more meaningful than, net income or cash flow as determined in accordance with generally accepted accounting principles. EBITDA calculations may vary from company to company. Accordingly, our computation of EBITDA may not be comparable with a similarly titled measure of another company. The following sets forth the reconciliation of net income to EBITDA for the periods indicated (in thousands): |
Net income (loss) attributable to Green Plains Interest expense Depreciation and amortization Net income (loss) attributable to noncontrolling interests Income taxes EBITDA Year Ended
December 31,
2011 Year Ended
December 31,
2010 Year Ended
December 31,
2009 Nine-Month
Transition
Period Ended
December 31,
2008 Year Ended
March 31,
2008 $ 38,418 $ 48,012 $ 19,790 $ (6,897 ) $ (3,520 ) 36,645 26,144 18,827 4,119 — 50,076 37,355 28,635 4,531 20 (205 ) 150 364 (1,152 ) (480 ) 23,686 17,889 91 — — $ 148,620 $ 129,550 $ 67,707 $ 601 $ (3,980 )
General
The following discussion and analysis provides information which management believes is relevant to an assessment and understanding of our consolidated financial condition and results of operations. This discussion should be read in conjunction with the consolidated financial statements included herewith and notes to the consolidated financial statements thereto and the risk factors contained herein.
Overview
We were formed in June 2004, incurring development costs until our first two plants were completed. Our plant in Shenandoah, Iowa commenced operations in August 2007 and our plant in Superior, Iowa commenced operations in July 2008. To complement and enhance our ethanol production facilities, in April 2008, we acquired Great Lakes Cooperative, a full-service farm cooperative in northwestern Iowa and southwestern Minnesota. As a result of our October 2008 merger with VBV LLC, we acquired two additional ethanol plants, located in Bluffton, Indiana and Obion, Tennessee. OperationsTennessee, that commenced at the Bluffton and Obion plantsoperations in September 2008 and November 2008, respectively. In January 2009, we acquired a majority interest in Blendstar.BlendStar which operates nine blending or terminaling facilities with approximately 625 mmgy of total throughput capacity in seven states in the south central United States. In July 2009, we acquired two limited liability companies that owned ethanol plants in Central City and Ord, Nebraska that added expected operating capacity totaling 150 mmgy. In April 2010, we acquired five grain elevators with federally licensed grain storage capacity of 11.7 million bushels, all located in western Tennessee, within 50 miles of our Obion ethanol plant. In October 2010, we acquired Global Ethanol, LLC, which hasadding two operating ethanol plants with a combined annual production capacity of approximately 160 million gallons. In FebruaryMarch 2011, our bid to acquirewe acquired an ethanol plant innear Fergus Falls, Minnesota with approximately 55 mmgy of total ethanolan annual production capacity was accepted by the bankruptcy court overseeing the auction process. We expect to close this acquisitionof approximately 60 million gallons. In June 2011, we acquired 2.0 million bushels of grain storage capacity located in March 2011. The expected impactHopkins, Missouri, which is approximately 45 miles from our Shenandoah, Iowa ethanol plant. In July 2011, we acquired all remaining noncontrolling interests in BlendStar. In January 2012, we acquired 1.9 million bushels of this transaction has not been includedgrain storage capacity located in St. Edward, Nebraska, which is approximately 40 miles from our discussion below as the transaction had not closed as of the date of this filing.Central City, Nebraska ethanol plant.
We are a leading, vertically-integrated producer, marketer and distributer of ethanol. We focus on generating stable operating margins through our diversified business segments and our risk management strategy. We believe that owning and operating assets throughout the ethanol value chain enables us to mitigate changes in commodity prices and differentiates us from companies focused only on ethanol production. Today, we have
operations throughout the ethanol value chain, beginning upstream with our agronomy and grain handling operations, continuing through our approximately 680740 million gallons per year, or mmgy, of ethanol production capacity and ending downstream with our ethanol marketing, distribution and blending facilities.
Our management reviews our operations in threefour separate operating segments:
| • | Ethanol Production. |
| • | Corn Oil Production.We operate corn oil extraction systems at all nine of our ethanol plants, with the capacity to produce approximately 130 million pounds annually. The corn oil systems are designed to extract non-edible corn oil from the whole stillage process immediately prior to production of distillers grains. Industrial uses for corn oil include feedstock for biodiesel, livestock feed additives, rubber substitutes, rust preventatives, inks, textiles, soaps and insecticides. |
| • | Agribusiness.We operate three lines of business within our agribusiness segment: bulk grain, agronomy and petroleum. In our bulk grain business, we have |
| • | Marketing and Distribution. Our in-house |
We have redefined our operating segments to segregate corn oil production as a reportable segment to reflect the manner by which executive management manages, allocates resources to, and measures the performance of our businesses. We initiated corn oil production in October 2010, with implementation of such extraction technology at all of our ethanol plants completed during 2011. Corn oil production was previously reported as a component of our marketing and distribution segment; however, all prior period segment results have been restated to reflect this change.
We intend to continue to take a disciplined approach in evaluating new opportunities related to potential acquisition of additional ethanol plants by considering whether the plants fit within the design, engineering and geographic criteria we have developed. In our marketing and distribution segment, our strategy is to renew existing marketing contracts, as well as enter new contracts with other ethanol producers. In October 2010, we entered into a multi-year renewal of one of these ethanol marketing agreements, which involves expected production of approximately 140 mmgy. Conversely, one of these marketing contracts, with expected production of 110 mmgy, will terminate effective May 1, 2011. We also intend to pursue opportunities to develop or acquire additional grain elevators and agronomy businesses, specifically those located near our ethanol plants. We believe that owning additional agribusiness operations in close proximity to our ethanol plants enables us to strengthen relationships with local corn producers, allowing us to source corn more effectively and at a lower average cost. We also plan to continue to grow our downstream access to customers and are actively looking atseeking new marketing opportunities with other ethanol producers.
We continue our support of the BioProcess Algae joint venture, which is focused on developing technology to grow and harvest algae, which consume carbon dioxide, in commercially viable quantities. Construction of Phase II which began during the third quarter of 2010, was completed and the Grower HarvestersHarvesters™ bioreactors were successfully started up in January 2011. Phase II allows for verification of growth rates, energy balances and operating expenses, which are considered to be some of the key steps to commercialization. The Iowa Power Fund awarded BioProcess Algae an additional grant of $2.0 million to continue the research and development of the Grower Harvester technology. The remaining cost of the Phase II project is beingwas shared by the joint venture partners. As part of the Phase II funding, we increased our ownership in BioProcess Algae to 35%.
Recently, During the third quarter of 2011, BioProcess Algae constructed an outdoor Grower Harvester system next to our Shenandoah ethanol plant, which is successfully producing algae. BioProcess Algae successfully completed its first round of algae-based poultry feed trials, in conjunction with the University of Illinois. The algae strains produced by the Grower Harvester system for the feed trials demonstrated high energy and protein content that was readily available, similar to other high value feed products used in the feeding of poultry today. BioProcess Algae broke ground on a five acre algae farm in the first quarter of 2012 at the same location. If we began implementing corn oil extraction technology at our six legacy ethanol plants. The corn oil system is designed to extract non-edible corn oiland the other BioProcess Algae members determine that the venture can achieve the desired economic performance from the whole stillage process immediately priorfive acre farm, a build-out of 400 acres of Grower Harvester reactors will be considered. The cost of such a build-out is estimated at $40 million to production$60 million and could take up to a year to complete. Funding for BioProcess Algae for such a project would come from a variety of distillers grains. Industrial uses for corn oil include feedstock for biodiesel, livestock feed additives, rubber substitutes, rust preventatives, inks, textiles, soapssources including current partners, new equity investors, debt financing or a combination thereof. If a decision was made to replicate such a 400 acre algae farm at all of our ethanol plants, we estimate that the required investment could range from $300 million to $500 million. BioProcess Algae currently is exploring potential algae markets including animal feeds, nutraceuticals and insecticides. We expect the implementation of corn oil extraction at our plants will cost us approximately $18.0 million in the aggregate with completion by the end of the second quarter of 2011. At December 31, 2010, we were operating corn oil
extraction systems at our Lakota, Obion, Ord and Riga plants. Because the value of the corn oil as an extracted product is currently greater than its value as a component of distillers grains, we believe the implementation of corn oil extraction at our plants will provide a new revenue stream with greater value-added economics.biofuels.
Industry Factors Affecting our Results of Operations
Variability of Commodity Prices.Our operations and our industry are highly dependent on commodity prices, especially prices for corn, ethanol, distillers grains and natural gas. Because the market prices of these commodities are not always
correlated, at times ethanol production may be unprofitable. As commodity price volatility poses a significant threat to our margin structure, we have developed a risk management strategy focused on locking in favorable operating margins.margins when they are available. We continually monitor market prices of corn, natural gas and other input costs relative to the prices for ethanol and distillers grains at each of our production facilities. We create offsetting positions by using a combination of derivative instruments, fixed-price purchases and sales contracts, or a combination of strategies within strict limits. Our primary focus is not to manage general price movements of individual commodities, for example to minimize the cost of corn consumed, but rather to lock in favorable profit margins whenever possible. By using a variety of risk management tools and hedging strategies, including our internally-developed real-time margin management system, we believe we are able to maintain a disciplined approach to risk.
There may be periods of time that, due to the variability of commodity prices and compressed margins identified by our risk management system, we make a decision to reduce or cease ethanol production operations at certain of our ethanol plants. In the first quarter of 2012, we have reduced production volumes at two of our ethanol plants by approximately 30%, or about 5% of our total production, in direct response to unfavorable operating margins. In response to relatively strong margins in the fourth quarter of 2011, the ethanol industry increased production and ended the year with excess inventories, which has adversely affected the margin environment in the beginning of 2012.
Reduced Availability of Capital. Some ethanol producers have faced financial distress over the past few years, culminating with bankruptcy filings by several companies. This, in combination with continued volatility in the capital markets has resulted in reduced availability of capital for the ethanol industry generally. In this market environment, we may experience limited access to incremental financing.
Legislation. Federal and state governments have enacted numerous policies, incentives and subsidies to encourage the usage of domestically-produced alternative fuel solutions. Passed in 2007 as part of the Energy Independence and Security Act, a federal Renewable Fuels Standard, or RFS, has been and we expect will continue to be a driving factor in the growth of ethanol usage. The RFS Flexibility Act was introduced on October 5, 2011 in the U.S. House of Representatives to reduce or eliminate the volumes of renewable fuel use required by RFS based upon corn stocks-to-use ratios. The Domestic Alternative Fuels Act of 2012 was introduced on January 18, 2012 in the U.S. House of Representatives to modify the RFS to include ethanol and other fuels produced from fossil fuels like coal and natural gas.
To further drive growth in the increased adoption of ethanol, Growth Energy, an ethanol industry trade association, and a number of ethanol producers requested a waiver from the EPA to increase the allowable amount of ethanol blended into gasoline from the current 10% level, or E10, to a 15% level, or E15. In October 2010, the EPA approvedgranted a partial waiver for E15 for use in model year 2007 and newer model passenger vehicles, including cars, SUVs, and light pickup truck. In January 2011, the EPA ruled thatgranted a second partial waiver for E15 was also approved for use in model year 2001 to 2006 passenger vehicles. On February 17, 2012, the EPA announced that evaluation of the health effects tests on E15 are complete and that fuel manufacturers are now able to register E15 with the EPA to sell. Another major benefit to the industry iswas the blender’s credit, which allowsallowed gasoline distributors who blendblended ethanol with gasoline to receive a federal excise tax credit of $0.45 per gallon of pure ethanol used, or $0.045 per gallon for E10 and $0.3825 per gallon for E85. Currently,The blender’s credit expired on December 31, 2011; however, even without the blender’s credit, is setethanol remains at a discount to expire December 31, 2011. There can be no assurances that the blenders’ credit will be extended at the end of 2011.gasoline.
On July 21, 2010, President Obama signed the Dodd-Frank Wall Street Reform and Consumer Protection Act, or the Reform Act, which, among other things, aims to improve transparency and accountability in derivative markets. While the Reform Act increases the regulatory authority of the Commodity Futures Trading Commission, or CFTC, regarding over-the-counter derivatives, there is uncertainty on several issues related to market clearing, definitions of market participants, reporting, and capital requirements. While many details remain to be addressed in CFTC rulemaking proceedings, at this time we do not anticipate any material impact to our risk management strategy.
Critical Accounting Policies and Estimates
This disclosure is based upon our consolidated financial statements, which have been prepared in accordance with accounting principles generally accepted in the United States. The preparation of these financial statements requires that we make estimates and assumptions that affect the reported amounts of assets, liabilities, revenues and expenses, and related disclosure of contingent assets and liabilities. We base our estimates on
historical experience and other assumptions that we believe are proper and reasonable under the circumstances. We continually evaluate the appropriateness of estimates and assumptions used in the preparation of our consolidated financial statements. Actual results could differ materially from those estimates. Key accounting policies, including but not limited to those relating to revenue recognition, property and equipment, impairment of long-lived assets and goodwill, derivative financial instruments, and accounting for income taxes, are impacted significantly by judgments, assumptions and estimates used in the preparation of the consolidated financial statements.
Revenue Recognition
We recognize revenue when all of the following criteria are satisfied: persuasive evidence of an arrangement exists; risk of loss and title transfer to the customer; the price is fixed and determinable; and collectability is reasonably assured. For sales of ethanol, corn oil and distillers grains, we recognize revenue when title to the product and risk of loss transfer to an external customer.
We routinely enter into fixed-price, physical-delivery ethanol sales agreements. In certain instances, we intend to settle the transaction by open market purchases of ethanol rather than by delivery from our own production. These transactions are reported net as a component of revenues.
Revenue from sales of agricultural commodities, fertilizers and other similar products is recognized when title to the product and risk of loss transfer to the customer, which is dependent on the agreed upon sales terms with the customer. These sales terms provide for passage of title either at the time shipment is made or at the time the commodity has been delivered to its destination and final weights, grades and settlement prices have been agreed upon with the customer. Shipping and handling costs are recorded on a gross basis in the statements of operations with amounts billed included in revenues and also as a component of cost of goods sold. Revenue from grain storage is recognized as services are rendered. Revenue related to grain merchandising is recorded on a gross basis.
Revenue related to our marketing operations for third parties is recorded on a gross basis in the consolidated financial statements, as we take title to the product and assume risk of loss. Unearned revenue is reflected on our consolidated balance sheet for goods in transit for which we have received payment and title has not been transferred to the external customer. Revenue from ethanol transload and splash blending services is recognized as these services are rendered.
Intercompany revenues are eliminated on a consolidated basis for reporting purposes.
Property and Equipment
Property and equipment are stated at cost less accumulated depreciation. Depreciation on our ethanol production facilities, grain storage facilities, railroad track, computer equipment and software, office furniture and equipment, vehicles, and other fixed assets has been provided on the straight-line method over the estimated useful lives of the assets, which currently range from 3 to 40 years.
Land improvements are capitalized and depreciated. Expenditures for property betterments and renewals are capitalized. Costs of repairs and maintenance are charged to expense as incurred.
We periodically evaluate whether events and circumstances have occurred that may warrant revision of the estimated useful life of fixed assets, which is accounted for prospectively.
Impairment of Long-Lived Assets and Goodwill
Our long-lived assets consist of property and equipment. We review long-lived assets for impairment whenever events or changes in circumstances indicate that the carrying amount of a long-lived asset may not be recoverable. We measure recoverability of assets to be held and used by comparing the carrying amount of an
asset to the estimated undiscounted future cash flows expected to be generated by the asset. If the carrying amount of an asset exceeds its estimated future cash flows, we record an impairment charge in the amount by which the carrying amount of the asset exceeds the fair value of the asset. No impairment charges have been recorded during the periods presented.
Our goodwill consists of amounts relating to our acquisitions of Green Plains Ord, Green Plains Central City, and Green Plains Holdings II, (formerly Global Ethanol), as well as our majority interest in Blendstar.Green Plains Otter Tail and BlendStar. We review goodwill at an individual plant or subsidiary level for impairment at least annually, as of October 1, or more frequently whenever events or changes in circumstances indicate that impairment may have occurred. We perform a two-step impairment test to evaluate goodwill. Under the first step, we compare the estimated fair value of the reporting unit with its carrying value (including goodwill). If the estimated fair value of the reporting unit is less than its carrying value, we complete a second step to determine the amount of the goodwill impairment that we should record. In the second step, we determine an implied fair value of the reporting unit’s goodwill by
allocating the reporting unit’s fair value to all of its assets and liabilities other than goodwill. We compare the resulting implied fair value of the goodwill to the carrying amount and record an impairment charge for the difference. As of our most recent annual review of goodwill, we have determined that the estimated fair value of each reporting unit substantially exceeds each of their respective carrying values.
The reviews of long-lived assets and goodwill require making estimates regarding amount and timing of projected cash flows to be generated by an asset or asset group over an extended period of time. Management judgment regarding the existence of circumstances that indicate impairment is based on numerous potential factors including, but not limited to, declinesa decline in operatingour future projected cash flows, a decision to suspend operations at a plant for an extended period of time, a sustained decline in our market capitalization, a sustained decline in market prices for similar assets or industry trends.businesses, or a significant adverse change in legal or regulatory factors or the business climate. Significant management judgment is required in determining the fair value of our long-lived assets and goodwill to measure impairment, including projections of future cash flows. Fair value is determined through various valuation techniques including discounted cash flow models, quoted market values and third-party independent appraisals, as considered necessary. Changes in estimates of fair value could result in a write-down of the asset in a future period. Given the current economic and regulatory environment and uncertainties regarding the impact on our business, there are no assurances that our estimates and assumptions will prove to be an accurate prediction of the future.
Derivative Financial Instruments
We use various financial instruments, including derivatives, to minimize the effects of the volatility of commodity price changes primarily related to corn, natural gas and ethanol. We monitor and manage this exposure as part of our overall risk management policy. As such, we seek to reduce the potentially adverse effects that the volatility of these markets may have on our operating results. We may take hedging positions in these commodities as one way to mitigate risk. We have put in place commodity price risk management strategies that seek to reduce significant, unanticipated earnings fluctuations that may arise from volatility in commodity prices, principally through the use of derivative instruments. While we attempt to link our hedging activities to our purchase and sales activities, there are situations where these hedging activities can themselves result in losses.
By using derivatives to hedge exposures to changes in commodity prices, we have exposures on these derivatives to credit and market risk. We are exposed to credit risk that the counterparty might fail to fulfill its performance obligations under the terms of the derivative contract. We minimize our credit risk by entering into transactions with high quality counterparties, limiting the amount of financial exposure we have with each counterparty and monitoring the financial condition of our counterparties. Market risk is the risk that the value of the financial instrument might be adversely affected by a change in commodity prices or interest rates. We manage market risk by incorporating monitoring parameters within our risk management strategy that limit the types of derivative instruments and derivative strategies we use, and the degree of market risk that may be undertaken by the use of derivative instruments.
We evaluate our contracts to determine whether the contracts are derivatives as certain derivative contracts that involve physical delivery may be deemedqualify for the normal purchases or normal sales exemption as they will be expected to be used or sold over a reasonable period in the normal course of business. Any derivative contracts that do not meet the normal purchase or sales criteria are recorded at fair value with the unrealized gains and losses from the change in fair value recorded in operating income unless the contracts qualify for hedge accounting treatment.
Certain qualifying derivatives within our ethanol production segment are designed as cash flow hedges. Prior to entering into cash flow hedges, we evaluate the derivative instrument to ascertain its effectiveness. For cash flow hedges, any ineffectiveness is recognized in current period results, while other unrealized gains and losses are reflected in accumulated other comprehensive income until gains and losses from the underlying hedged transaction are realized. In the event that it becomes probable that a forecasted transaction will not occur, we would discontinue cash flow hedge treatment, which would affect earnings. These derivative financial instruments are recognized in other current assets or liabilities at fair value.
We use exchange-traded futures and options contracts to minimize the effects of changes in the prices of agricultural commodities on our agribusiness grain inventories and forward purchase and sales contracts.contracts within our agribusiness segment. Exchange-traded futures and options contracts are valued at unadjusted prices in an active market. CommodityGrain inventories held for sale, forward purchase contracts and forward sale contracts of this segment are valued at market prices, where available, or other market quotes adjusted for differences, primarily transportation, between the exchange-traded market and the local markets on which the terms of the contracts are based. Changes in the fair value of grain inventories held for sale, forward purchase and sale contracts, and exchange-traded futures and options contracts, are recognized in earnings as a component of cost of goods sold. These contracts are predominantly settled in cash. We are exposed to loss in the event of non-performance by the counter-party to forward purchase and forward sales contracts.
Accounting for Income Taxes
Income taxes are accounted for under the asset and liability method in accordance with GAAP. Deferred tax assets and liabilities are recognized for the future tax consequences attributable to differences between the financial statement carrying amount of existing assets and liabilities and their respective tax basis and for net operating loss and tax credit carry-forwards. Deferred tax assets and liabilities are measured using enacted tax rates expected to apply to taxable income in years in which those temporary differences are expected to be recovered or settled. The effect of a change in tax rates on deferred tax assets and liabilities is recognized in operations in the period that includes the enactment date. The realization of deferred tax assets is dependent upon the generation of future taxable income during the periods in which temporary differences become deductible. Management considers the scheduled reversal of deferred tax liabilities, projected future taxable income, and tax planning strategies in making this assessment. Management’s evaluation of the need for a valuation allowance must consider positive and negative evidence, and the weight given to the potential effects of such positive and negative evidence is based on the extent to which it can be objectively verified.
Related to accounting for uncertainty in income taxes, we follow a process by which the likelihood of a tax position is gauged based upon the technical merits of the position, perform a subsequent measurement related to the maximum benefit and the degree of likelihood, and determine the amount of benefit to be recognized in the financial statements, if any.
Recently Issued Accounting Pronouncements
Effective March 31, 2010,January 1, 2011, we adopted the first phase of the Financial Accounting Standards Board’s amended guidance in Accounting Standards Codification, or ASC Topic 820, “Fair Value Measurements and Disclosures,”805,Business Combinations, which, if we complete a business combination during the reporting period, requires us to disclose our pro forma revenue and earnings as though the amounts and reasons for significant transfers between Levels 1 and 2 inbusiness combinations that occurred during the fair value hierarchycurrent period had occurred as well as reasons for any transfers in or out of Level 3.the beginning of the comparable prior annual reporting period. The amended guidance also requires us to provide fair value measurement disclosures for each classinclude a description of assetsthe nature and liabilities and disclose information about bothamount of material, nonrecurring pro forma adjustments directly attributable to the valuation techniques and inputs used in estimating Level 2 and Level 3 fair value measurements. The adoption of this amendment required expanded disclosurebusiness combination included in the notes to our consolidated financial statements but did not impact our financial results.reported pro forma revenue and earnings.
Effective March 31,January 1, 2011, we will be required to adoptadopted the second phase of the amended guidance in ASC Topic 820,Fair Value Measurements and Disclosures, which requires us to disclose information in the reconciliation of recurring Level 3 measurements
regarding purchases, sales, issuances and settlements on a gross basis, with a separate reconciliation for assets and liabilities. We dodid not expectexperience an impact from this guidancethe additional disclosure requirements as we currently do not have any recurring Level 3 measurements. Adoption
Effective January 1, 2012, we will be required to adopt the third phase of thisamended guidance in ASC Topic 820,Fair Value Measurements and Disclosures.The purpose of the future could require expandedamendment is to achieve common fair value measurement and disclosure requirements by improving comparability of fair value measurements presented and disclosed in financial statements prepared in accordance with GAAP and those prepared in conformity with International Financial Reporting Standards, or IFRS. The amended guidance clarifies the application of existing fair value measurement requirements and requires additional disclosure for Level 3 measurements regarding the sensitivity of fair value to changes in unobservable inputs and any interrelationships between those inputs. We currently would not be impacted by the additional disclosure requirements as we do not have any recurring Level 3 measurements.
Effective January 1, 2012, we will be required to adopt the amended guidance in ASC Topic 220,Comprehensive Income. This accounting standards update, which helps to facilitate the convergence of GAAP and IFRS, is aimed at increasing the prominence of other comprehensive income in the notesfinancial statement by eliminating the option to ourpresent other comprehensive income in the statement of stockholders’ equity, and requiring comprehensive income to be reported in either a single continuous statement or in two separate but consecutive statements reporting net income and other comprehensive income. This amended guidance will be implemented retroactively. We have determined that the changes to the accounting standards will affect the presentation of consolidated financial statementsinformation but wouldwill not have a material effect on the Company’s financial position or results of operations.
Effective January 1, 2012, we will be permitted to adopt the amended guidance in ASC Topic 350,Intangibles – Goodwill and Other.The amended guidance permits an entity to first assess qualitative factors to determine whether it is more likely than not that the fair value of a reporting unit is less than its carrying amount as a basis for determining whether it is necessary to perform the two-step goodwill impairment test. The more-likely-than-not threshold is defined as having a likelihood of more than 50 percent. We have determined that the changes to the accounting standards will not impact our financial results.disclosure or reporting requirements.
Off-Balance Sheet Arrangements
We do not have any off-balance sheet arrangements that have or are reasonably likely to have a current or future material effect on our consolidated financial condition, results of operations or liquidity.
Components of Revenues and Expenses
Revenues. In our ethanol production segment, our revenues are derived primarily from the sale of ethanol and distillers grains, which is a co-product of the ethanol production process. In our corn oil production segment, our revenues are derived from the sale of corn oil, which is extracted from the whole stillage process immediately prior to the production of distillers grains. In our agribusiness segment, the sale of grain, fertilizer and petroleum products are our primary sources of revenue. In our marketing and distribution segment, the sale of ethanol, and distillers grains and corn oil that we market for our eightnine ethanol plants and the sale of ethanol we market for the ethanol plants owned by third parties represent our primary sources of revenue. Within this segment, we also produce and market corn oil using extraction equipment installed, or in the process of being installed during the first half of 2011, at each of our ethanol plants. Revenues also include net gains or losses from derivatives.
Cost of Goods Sold. Cost of goods sold in our ethanol production segmentand corn oil production segments includes costs for direct labor, materials and certain plant overhead costs. Direct labor includes all compensation and related benefits of non-management personnel involved in the operation of our ethanol plants. Plant overhead costs primarily consist of plant utilities, plant depreciation and outbound freight charges. Our cost of goods sold is mainly affected by the cost of ethanol, corn, natural gas and transportation. In this segment,these segments, corn is our most significant raw material cost. We purchase natural gas to power steam generation in our ethanol production process and to dry our distillers grains. Natural gas represents our second largest cost in this business segment. Cost of goods sold also includes net gains or losses from derivatives.
Grain, fertilizer and petroleum acquisition costs represent the primary components of cost of goods sold in our agribusiness segment. Grain inventories, forward purchase contracts and forward sale contracts are valued at market prices, where available, or other market quotes adjusted for differences, primarily transportation, between the exchange-traded market and the local markets on which the terms of the contracts are based. Changes in the market value of grain inventories, forward purchase and sale contracts, and exchange-traded futures and options contracts are recognized in earnings as a component of cost of goods sold.
In our marketing and distribution segment, purchases of ethanol, and distillers grains and corn oil represent the largest components of cost of goods sold. Costs of corn oil production will become more significant in this segment as we complete implementation of corn oil extraction technology at our ethanol plants. Transportation expense represents an additional major component of our cost of goods sold in this segment. Transportation expense includes rail car leases, freight and shipping of our ethanol and co-products, as well as costs incurred in storing ethanol at destination terminals.
Selling, General and Administrative Expenses.Selling, general and administrative expenses are recognized at the operating segment level, as well as at the corporate level. These expenses consist of employee salaries, incentives and benefits; office expenses; board fees; and professional fees for accounting, legal, consulting, and investor relations activities. Personnel costs, which include employee salaries, incentives and benefits, are the largest single category of expenditures in selling, general and administrative expenses. We refer to selling, general and administrative expenses that are not allocable to a segment as corporate activities.
Other Income (Expense). Other income (expense) includes interest earned, interest expense, amortization of debt financing costs and other non-operating items.
Results of Operations –
Comparability
The following summarizes various events that affect the comparability of our operating results:results for the past three years:
| ||
| ||
| ||
| ||
| ||
| ||
| ||
• July 2009 | Green Plains Central City and Green Plains Ord were | |
• April 2010 | Green Plains Grain Company TN | |
• October 2010 | Green Plains |
• October 2010
• March 2011 | Green Plains Otter Tail was acquired | |
• June 2011 | Green Plains Grain Company acquired Hopkins, Missouri grain elevator | |
• July 2011 | Green Plains acquired remaining 49% noncontrolling interests in BlendStar | |
• January 2012 | Green Plains Grain Company acquired St. Edward, Nebraska grain elevator |
The year ended December 31, 20092010 includes a full year of activity at our Bluffton, Obion, Shenandoah and Superior ethanol plants, as well as at the Iowa operations of Green Plains Grain, Essex Elevator and Blendstar, and approximately five months of activity at our Central City and Ord ethanol plants. In addition to the above operations, we hadplants, approximately eight months of activityoperations at theour Tennessee agribusiness operations, of Green Plains Grain and two months of activityoperations, including corn oil extraction, at our Lakota and Riga ethanol plants (operating as Green Plains Holdings II) during theplants. The year ended December 31, 2010 following their respective acquisitions.2011 includes a full year of operations at our Tennessee agribusiness operations and our Lakota and Riga ethanol plants, approximately nine months of operations at our Otter Tail ethanol plant, and the deployment of corn oil extraction technology at all remaining ethanol plants.
Segment Results
Our operations fall within the following threefour segments: (1) production of ethanol and related distillers grains, collectively referred to as ethanol production, (2) corn oil production, (3) grain warehousing and marketing, as well as sales and related services of agronomy and petroleum products, collectively referred to as agribusiness, and (3) production and sales of corn oil, along with the(4) marketing and distribution of Company-produced and third-party ethanol, and distillers grains and corn oil, collectively referred to as marketing and distribution. Selling, general and administrative expenses, primarily consisting of compensation of corporate employees, professional fees and overhead costs not directly related to a specific operating segment, are reflected in the table below as corporate activities. When the Company’s management evaluates segment performance, they review the information provided below, as well as segment earnings before interest, income taxes, noncontrolling interest, depreciation and amortization.
During the normal course of business, our operating segments enter into transactions with one another. For example, our ethanol production segment sellsand corn oil production segments sell ethanol, distillers grains and corn oil to our marketing and distribution segment and our agribusiness segment sells grain to our ethanol production segment. These intersegment activities are recorded by each segment at prices approximating market and treated as if they are third-party transactions. Consequently, these transactions impact segment performance. However, intersegment revenues and corresponding costs are eliminated in consolidation, and do not impact our consolidated results.
The table below reflects selected operating segment financial information for the periods indicated (in thousands):
| Year Ended December 31, 2010 | Year Ended December 31, 2009 | Nine-Month Transition Period Ended December 31, 2008 | ||||||||||||||||||||||||||||||
Revenues: | ||||||||||||||||||||||||||||||||
Ethanol production | $ | 1,115,171 | $ | 731,253 | $ | 131,538 | ||||||||||||||||||||||||||
Agribusiness | 370,284 | 220,615 | 68,785 | |||||||||||||||||||||||||||||
Marketing and distribution | 1,822,561 | 1,096,091 | 76,521 | |||||||||||||||||||||||||||||
Intersegment eliminations | (1,175,048 | ) | (743,785 | ) | (88,086 | ) | ||||||||||||||||||||||||||
| $ | 2,132,968 | $ | 1,304,174 | $ | 188,758 | Year Ended December 31, | ||||||||||||||||||||||||||
| 2011 | 2010 | 2009 | ||||||||||||||||||||||||||||||
Gross profit: | ||||||||||||||||||||||||||||||||
Revenue: | ||||||||||||||||||||||||||||||||
Ethanol production | $ | 105,099 | $ | 49,155 | $ | 5,058 | ||||||||||||||||||||||||||
Revenue from external customers | $ | 128,780 | $ | 63,001 | $ | 61,629 | ||||||||||||||||||||||||||
Intersegment revenue | 2,005,141 | 1,052,424 | 669,708 | |||||||||||||||||||||||||||||
|
|
| ||||||||||||||||||||||||||||||
Total segment revenue | 2,133,921 | 1,115,425 | 731,337 | |||||||||||||||||||||||||||||
Corn oil production | ||||||||||||||||||||||||||||||||
Revenue from external customers | 1,466 | 995 | — | |||||||||||||||||||||||||||||
Intersegment revenue | 43,391 | 707 | — | |||||||||||||||||||||||||||||
|
|
| ||||||||||||||||||||||||||||||
Total segment revenue | 44,857 | 1,702 | — | |||||||||||||||||||||||||||||
Agribusiness | 24,707 | 21,210 | 8,555 | |||||||||||||||||||||||||||||
Revenue from external customers | 358,968 | 248,619 | 147,890 | |||||||||||||||||||||||||||||
Intersegment revenue | 195,172 | 122,133 | 74,076 | |||||||||||||||||||||||||||||
|
|
| ||||||||||||||||||||||||||||||
Total segment revenue | 554,140 | 370,752 | 221,966 | |||||||||||||||||||||||||||||
Marketing and distribution | 22,836 | 11,975 | (192 | ) | ||||||||||||||||||||||||||||
Intersegment eliminations | (1,070 | ) | 89 | (107 | ) | |||||||||||||||||||||||||||
Revenue from external customers | 3,064,498 | 1,821,307 | 1,096,274 | |||||||||||||||||||||||||||||
Intersegment revenue | 467 | 293 | — | |||||||||||||||||||||||||||||
|
|
| ||||||||||||||||||||||||||||||
Total segment revenue | 3,064,965 | 1,821,600 | 1,096,274 | |||||||||||||||||||||||||||||
| $ | 151,572 | $ | 82,429 | $ | 13,314 | |||||||||||||||||||||||||||
Revenue including intersegment activity | 5,797,883 | 3,309,479 | 2,049,577 | |||||||||||||||||||||||||||||
Intersegment elimination | (2,244,171 | ) | (1,175,557 | ) | (743,784 | ) | ||||||||||||||||||||||||||
|
|
| ||||||||||||||||||||||||||||||
Operating income (loss): | ||||||||||||||||||||||||||||||||
Ethanol production | $ | 93,428 | $ | 40,435 | $ | (2,706 | ) | |||||||||||||||||||||||||
Agribusiness | 5,279 | 7,654 | 5,310 | |||||||||||||||||||||||||||||
Marketing and distribution | 11,170 | 2,761 | (334 | ) | ||||||||||||||||||||||||||||
Corporate activities | (17,712 | ) | (13,429 | ) | (7,324 | ) | ||||||||||||||||||||||||||
Intersegment eliminations | (1,060 | ) | 85 | (99 | ) | |||||||||||||||||||||||||||
Revenue as reported | $ | 3,553,712 | $ | 2,133,922 | $ | 1,305,793 | ||||||||||||||||||||||||||
|
|
| ||||||||||||||||||||||||||||||
| $ | 91,105 | $ | 37,506 | $ | (5,153 | ) | ||||||||||||||||||||||||||
Income (loss) before income taxes | ||||||||||||||||||||||||||||||||
Ethanol production | $ | 73,110 | �� | $ | 14,296 | $ | (10,177 | ) | ||||||||||||||||||||||||
Agribusiness | 2,621 | 4,378 | 4,248 | |||||||||||||||||||||||||||||
Marketing and distribution | 10,697 | 1,679 | (2,719 | ) | ||||||||||||||||||||||||||||
Corporate activities | (18,710 | ) | (191 | ) | 87 | |||||||||||||||||||||||||||
Intersegment eliminations | (1,667 | ) | 83 | 512 | ||||||||||||||||||||||||||||
| $ | 66,051 | $ | 20,245 | $ | (8,049 | ) | ||||||||||||||||||||||||||
Gross profit: Ethanol production Corn oil production Agribusiness Marketing and distribution Intersegment eliminations Operating income: Ethanol production Corn oil production Agribusiness Marketing and distribution Intersegment eliminations Corporate activities 00000000 00000000 00000000 Year Ended December 31, 2011 2010 2009 $ 87,010 $ 105,079 $ 47,825 27,067 878 — 34,749 25,199 22,561 23,112 21,192 13,572 294 178 90 $ 172,232 $ 152,526 $ 84,048 $ 73,242 $ 93,410 $ 38,778 26,999 878 — 11,721 5,614 8,847 9,475 9,673 4,843 334 188 85 (22,758 ) (17,712 ) (13,428 ) $ 99,013 $ 92,051 $ 39,125
The table below shows total assets for our operating segments as of the periods indicated (in thousands):
| December 31, | December 31, | |||||||||||||||||||
| 2010 | 2009 | 2011 | 2010 | |||||||||||||||||
Total assets: | ||||||||||||||||||||
Ethanol production | $ | 882,136 | $ | 708,657 | $ | 879,500 | $ | 850,049 | ||||||||||||
Corn oil production | 24,601 | 7,204 | ||||||||||||||||||
Agribusiness | 239,595 | 86,339 | 233,201 | 239,595 | ||||||||||||||||
Marketing and distribution | 176,352 | 68,096 | 181,466 | 169,148 | ||||||||||||||||
Corporate assets | 142,666 | 15,607 | 121,429 | 142,666 | ||||||||||||||||
Intersegement eliminations | (10,883 | ) | (618 | ) | ||||||||||||||||
Intersegment eliminations | (19,369 | ) | (10,883 | ) | ||||||||||||||||
|
| |||||||||||||||||||
| $ | 1,429,866 | $ | 878,081 | $ | 1,420,828 | $ | 1,397,779 | |||||||||||||
|
| |||||||||||||||||||
Year ended December 31, 2011 Compared to the Year ended December 31, 2010
Consolidated Results
Revenues increased $1.4 billion for the year ended December 31, 2011 compared to the same period in 2010 as a result of acquired operations and changes in commodity prices. We acquired our western Tennessee agribusiness operations in April 2010, our Lakota and Riga ethanol plants in October 2010, and our Otter Tail ethanol plant in March 2011. Revenue from existing operations was also impacted by increases in commodity prices, production efficiencies at our ethanol plants and the increase in the volume of corn oil extracted in 2011 compared to 2010. Gross profit increased $19.7 million compared to the same period in 2010. Gross profit increases in the corn oil production, agribusiness and market and distribution segments were partially offset by a decrease in gross profit in the ethanol production segment. Operating income increased $7.0 million compared to the same period in 2010. In addition to the factors identified above, selling, general and administrative expenses increased $12.7 million compared to the same period in 2010 due to the expanded scope of our operations.
Income before taxes was also affected by an increase in interest expense of $10.5 million due to debt issued to finance the acquisitions and $90.0 million of convertible notes issued in November 2010. Income tax expense for the year ended December 31, 2011 increased compared to 2010 due to an increase in income before taxes and additional state filing requirements resulting from acquired operations. In addition, income tax expense for the year ended December 31, 2010 was favorably impacted by the release of a portion of valuation allowances against certain deferred tax assets, established in prior years due to the uncertainty of realization.
The following discussion of segment results provides greater detail on period to period results.
Ethanol Production Segment
The table below presents key operating data within our ethanol production segment for the periods indicated:
| Year Ended December 31, | ||||||||
| 2011 | 2010 | |||||||
Ethanol sold | 721,535 | 544,388 | ||||||
(thousands of gallons) | ||||||||
Distillers grains sold | 2,047 | 1,566 | ||||||
(thousands of equivalent dried tons) | ||||||||
Corn consumed | 255,437 | 194,327 | ||||||
(thousands of bushels) | ||||||||
Revenues for the ethanol production segment increased $1.0 billion for the year ended December 31, 2011 compared to the same period in 2010. Revenues for the year ended December 31, 2011 included production of an additional 170 million gallons from our Lakota and Riga ethanol plants which were acquired in October 2010, as well as production from our Otter Tail ethanol plant, which was acquired in late March 2011. The Lakota, Riga and Otter Tail plants contributed an additional $516.0 million in combined revenues for the year ended December 31, 2011. The remaining increase in revenues was due to increased volume from production efficiencies at our other ethanol plants and increases in ethanol and distillers grains prices.
Cost of goods sold in the ethanol production segment increased $1.0 billion for the year ended December 31, 2011 compared to the same period in 2010. The increase was due primarily to the consumption of 61.1 million additional bushels of corn and a 56.9% increase in the average cost per bushel during 2011 compared to 2010. The volume increase was due to a full year of production at our Lakota and Riga plants and three quarters of production at our newly-acquired Otter Tail plant. Gross profit and operating income for the ethanol production segment decreased by $18.1 million and $20.2 million, respectively, for the year ended December 31, 2011 compared to 2010 primarily due to a greater increase in the average cost per bushel of corn than the average price per gallon of ethanol, which increased by 43.1%. In addition, depreciation and amortization expense for the ethanol production segment increased to $43.2 million during 2011 compared to $32.6 million in 2010 due to the acquisitions of the plants noted above in the fourth quarter of 2010 and first quarter of 2011.
Corn Oil Production Segment
We initiated corn oil production in the fourth quarter of 2010 with the acquisition of our Lakota and Riga ethanol plants and installation and deployment of corn oil extraction technology at our Obion and Ord ethanol plants. In 2011, we deployed corn oil extraction technology at our other ethanol plants. We currently have the capacity to produce approximately 130.0 million pounds of corn oil annually. During the year ended December 31, 2011, we sold 96.3 million pounds of corn oil compared to 5.0 million pounds in 2010.
Agribusiness Segment
The table below presents key operating data within our agribusiness segment for the periods indicated:
| Year Ended December 31, | ||||||||
| 2011 | 2010 | |||||||
Grain sold | 69,336 | 56,215 | ||||||
(thousands of bushels) | ||||||||
Fertilizer sold | 64,749 | 60,653 | ||||||
(tons) | ||||||||
Our agribusiness segment had an increase of $183.4 million in revenues, an increase of $9.6 million in gross profit, and an increase in operating income of $6.1 million for the year ended December 31, 2011 compared to 2010. Revenue, gross profit and operating income increased primarily due to an increase in fertilizer volumes from our agribusiness operations in Iowa, the sale of an additional 12.4 million bushels of grain from our western Tennessee agribusiness operations acquired in April 2010 and increases in average grain prices. The Tennessee agribusiness operations contributed $289.0 million in revenue in 2011 compared with $141.6 million in 2010. The agribusiness segment’s quarterly performance fluctuates on a seasonal basis with generally stronger results expected in the second and fourth quarters each year.
Marketing and Distribution Segment
Marketing and distribution revenues increased $1.2 billion for the year ended December 31, 2011 compared to the same period in 2010. The increase in revenues was primarily due to an increase in ethanol revenues of $1.1 billion and an increase in distillers grains revenues of $124.0 million. The remainder of the increase in revenue is attributable to sales of corn oil, which we began producing in October 2010. During 2011, we sold 96.3 million pounds of corn oil. We sold 1,064 million gallons of ethanol within the marketing and distribution segment during 2011 compared to 917 million gallons sold during the same period in 2010 and experienced an increase in revenue per gallon of ethanol sold due to higher prices. The increase in ethanol volumes is due to the expanded production of our own plants as a result of efficiency improvements and additional capacity from recently acquired operations. Marketing and distribution volumes from third-party ethanol producers decreased when comparing the year ended December 31, 2011 to the same period in 2010 due to the termination of a third-party marketing contract with expected production of 110 mmgy in May 2011.
Gross profit for the marketing and distribution segment increased $1.9 million and operating income decreased by $0.2 million for the year ended December 31, 2011 compared to 2010. The increase in gross profit was due primarily to increased ethanol and distillers grains volumes sold. Operating income was affected by an increase in selling, general and administrative expenses compared to 2010 due to an increase in personnel costs as a result of our growth and expanded operations.
Intersegment Eliminations
Intersegment eliminations of revenues increased $1.1 billion for year ended December 31, 2011 compared to the same period in 2010 due to an increase of $845.2 million, $107.6 million and $42.7 million in ethanol, distillers grains and corn oil, respectively, sold from our ethanol production and corn oil segments to our marketing and distribution segment. In addition, corn sales from our agribusiness segment to our ethanol production segment increased $72.8 million between the periods.
Corporate Activities
Operating income was impacted by an increase in operating expenses for corporate activities of $5.0 million for the year ended December 31, 2011 compared to the same period in 2010, primarily due to an increase in general and administrative expenses and personnel costs related to expanded operations.
Year ended December 31, 2010 Compared to the Year ended December 31, 2009
Consolidated Results
Several events that occurred during 2010 account for the overall increase in our revenues of $828.8$828.1 million, an increase in our gross profit of $69.1$68.5 million and an increase in operating income of $53.6$52.9 million. Our business activity increased primarily as a result of including a full year of operations from the Central City and Ord ethanol plants acquired in July 2009, additional agribusiness operations in western Tennessee acquired in April 2010 and additional ethanol plants acquired in October 2010. Selling, general and administrative expenses increased $15.5$15.6 million during 2010 due to the events described above. Interest expense increased $6.6$7.3 million during 2010 as compared to 2009 due to additional debt issued to finance these acquisitions and a convertible debt offering completed in November 2010. Income tax expenses of $17.9 million during 2010 were significantly higher than the expense of $0.1 million in 2009. Prior to 2009, we had losses before income taxes and the resulting potential tax benefits were fully reserved with a valuation allowance,allowance. A portion of those valuation allowances were released in 2009, resulting in noan income tax provision.provision of $0.1 million.
Management views our results on a segment level. See segment discussions below for more detail on period-to-period increases in revenues, gross profit and operating income.
Ethanol Production Segment
The charttable below presents key operating data within our ethanol production segment for the periods indicated:
| Year Ended December 31, | ||||||||
| 2010 | 2009 | |||||||
Ethanol sold | 544,388 | 379,393 | ||||||
(thousands of gallons) | ||||||||
Distillers grains sold | 1,566 | 1,098 | ||||||
(thousands of equivalent dried tons) | ||||||||
Corn consumed | 194,327 | 136,569 | ||||||
(thousands of bushels) | ||||||||
| Year Ended December 31, | ||||||||
| 2010 | 2009 | |||||||
Ethanol sold | 544,388 | 379,393 | ||||||
(thousand of gallons) | ||||||||
Distillers grain sold | 1,566 | 1,098 | ||||||
(thousand of equivalent dried tons) | ||||||||
Com consumed | 194,327 | 136,569 | ||||||
(thousand of bushels) | ||||||||
Revenue for the ethanol production segment increased $383.9$384.1 million for the year ended December 31, 2010, compared to the year ended December 31, 2009. Average2009 due to increased ethanol production and an increase in the average revenue per gallon of ethanol increased from $1.57 in 2009 to $1.74 in 2010.sold. Revenues for the year ended December 31, 2009, included five months of revenues from our Central City and Ord plants since their acquisition in July 2009 compared to a full year of revenues from these two plants in 2010. Additional revenues earned in 2010 compared to 2009 at the Central City and Ord plants were $195.1 million. In addition, 2010 results included approximately two months of revenues from our Lakota and Riga plants acquired in October 2010, contributing combined revenue of $80.6 million.
Cost of goods sold in the ethanol production segment increased $328.0$326.8 million, for the year ended December 31, 2010 as compared to the year ended December 31, 2009, primarily due to increased sales volumes as a result of the additional production discussed above. Our largest component of cost of goods sold is corn, which increased due to the increased volumes of production and an increase in average cost per bushel of approximately 21% compared to the prior year. Included in the ethanol production segment’s cost of goods sold during the year ended December 31, 2009 is a one-time charge of $4.6 million related to the cancellation of third-party ethanol marketing arrangements. Gross profit for the ethanol production segment increased $55.9$57.3 million for the year ended December 31, 2010 as compared to the year ended December 31, 2009 due primarily to the additional operations discussed above as well as an increase in the ethanol yield per bushel of corn consumed.
Operating income increased $53.0$54.6 million for the year ended December 31, 2010, compared to the year ended December 31, 2009 due to the factors discussed above.
Corn Oil Production Segment
We initiated corn oil production in the fourth quarter of 2010 and therefore did not have any corn oil operations in 2009. During the year ended December 31, 2010, we had revenues of $1.7 million from the sale of corn oil.
Agribusiness Segment
The charttable below presents key operating data within our agribusiness segment for the periods indicated:
| Year Ended December 31, | Year Ended December 31, | |||||||||||||||||||
| 2010 | 2009 | 2010 | 2009 | |||||||||||||||||
Grain sold | 58,280 | 32,780 | 56,215 | 32,780 | ||||||||||||||||
(thousands of bushels) | ||||||||||||||||||||
Fertilizer sold | 60,653 | 48,108 | 60,653 | 48,108 | ||||||||||||||||
(tons) | ||||||||||||||||||||
Our agribusiness segment had increases of $149.7$148.8 million in revenue, $3.5$2.6 million in gross profit, and a decrease of $2.4$3.2 million in operating income for the year ended December 31, 2010 compared to the year ended December 31, 2009. These revenue and gross profit increases are primarily attributable to the acquisition of agribusiness operations in western Tennessee in April 2010. The 2010 results included eight months of activity from the acquired operations, contributing $141.6
$141.6 million to 2010 revenue. The decrease in operating income is primarily due to an increase in selling, general and administrative expenses of $5.9 million as a result of additional expenses related to the Tennessee operations. Also, operating income was affected by a decrease in grain drying income in Iowa as a result of a considerably drier harvest in 2010 compared with 2009. These negative effects on operating income were greater than the additional operating income attributable to the Tennessee acquisition.
Marketing and Distribution Segment
Marketing and distribution revenues increased $726.5$725.3 million for the year ended December 31, 2010, as compared to the year ended December 31, 2009. The Company sold 933.8917 million gallons of ethanol within the marketing and distribution segment during the 2010, compared to 652.8653 million gallons sold during 2009. The increase in revenues was primarily due to an increase in ethanol-related marketing and distribution of $710.6 million and an increase in marketing and distribution for distillers grains of $12.4 million. Gross profit for the marketing and distribution segment increased $10.9$7.6 million for the year ended December 31, 2010 as compared to the year ended December 31, 2009. As described above, the increase in gross profit was due to greater volume of marketing and distribution as compared to the prior year.
Initially, our Superior, Bluffton and Obion ethanol plants sold our ethanol production exclusively to outside marketers at a price per gallon based on a market price at the time of sale, less certain marketing, storage, and transportation costs, as well as a profit margin for each gallon sold. We stopped selling our ethanol production to outside marketers during the first quarter of 2009. Following completion of the VBV merger and prior to the termination of the agreements, nearly all of our ethanol that was sold to one of the outside marketers was repurchased by Green Plains Trade, reflected in the marketing and distribution segment, and resold to other customers. Corresponding revenues and related costs of goods sold related to this marketer were eliminated in consolidation.
Operating income for the marketing and distribution segment increased $8.4$4.8 million for the year ended December 31, 2010 as compared to the year ended December 31, 2009. The increase in operating income was due to greater volume of marketing and distribution as compared to the prior year.
Intersegment Eliminations
Intersegment eliminations of revenues increased $431.3$431.8 million in 2010 due to a $363.7 million increase in ethanol sold from our ethanol production segment to our marketing and distribution segment and a $19.3 million increase in distillers grains sold from our ethanol production segment to our marketing and distribution segment. These increases are a result of the expanded scope of our operations in 2010.
Corporate Activities
Operating income was impacted by an increase in expenses for corporate activities of $4.3 million for the year ended December 31, 2010 as compared to the year ended December 31, 2009, primarily due to an increase in compensation, which was largely attributable to an increase in short-term incentive compensation based on the achievement of certain performance goals during 2010 and an increase in number of corporate employees resulting from expanded operations. Income before taxes related to corporate activities was affected by an increase in interest expense of $0.9 million and an increase in amortization of debt issuance costs of $0.1 million, related to $90 million of convertible debt issued early in November 2010.
Year Ended December 31, 2009 Compared to the Nine-Month Transition Period Ended December 31, 2008
Consolidated Results
Several events that occurred during 2009 account for the overall increase in our revenues of $1.1 billion, an increase in our gross profit of $69.1 million and an increase in operating income of $42.7 million. Our production increased as a result of our merger with VBV, the commencement of production at certain ethanol plants and several acquisitions as described above. In addition, ethanol production margins, the relationship between the costs of corn and natural gas and the price of ethanol and distillers grains, improved during 2009. Selling, general and administrative expenses increased $26.4 million during 2009 due to the events described above. In addition, selling, general and administrative expenses for the nine months ending December 31, 2008 included one-time merger-related costs of $2.7 million. Interest expense increased $14.1 million during 2009 as compared to the nine-month transition period ended December 31, 2008, due to three more months of activity during 2009 as well as interest relating to debt incurred for businesses developed or acquired during these periods. Income tax expense of $0.1 million during 2009 was impacted by a benefit for the reversal of a valuation allowance for deferred income tax assets established in prior years due to the uncertainty of realization. Prior to 2009, we had losses before income taxes and the resulting potential tax benefits were fully reserved with a valuation allowance, resulting in no income tax provision.
See segment discussions below for more detail on period-to-period increases in revenues, gross profit and operating income.
Ethanol Production Segment
Revenue for the ethanol production segment increased $599.7 million for the year ended December 31, 2009, compared to the nine-month transition period ended December 31, 2008. Revenues for the nine-month transition period ended December 31, 2008 include those of the Bluffton and Obion ethanol plants that commenced production in September and November, 2008, respectively, and the results of the Shenandoah and Superior plant following the VBV merger on October 15, 2008. Revenues for the year ended December 31, 2009, included production from these four plants for the entire year plus revenues from our Central City and Ord plants since their acquisition in July 2009.
Cost of goods sold in the ethanol production segment increased $555.6 million for the year ended December 31, 2009 as compared to the nine-month transition period ended December 31, 2008, primarily due to increased sales volumes as a result of the additional production discussed above. Our largest component of cost of goods sold is corn, which increased due to the increased volumes of production, and which also benefitted from a 10% decrease in our average corn costs compared with the prior period. As a result, gross profit for the ethanol production segment increased $44.1 million for the year ended December 31, 2009 as compared to the nine-month transition period ended December 31, 2008. Included in the ethanol production segment’s cost of goods sold during the year ended December 31, 2009 is a one-time charge of $4.6 million related to the cancellation of third-party ethanol marketing arrangements, as discussed below.
Operating income increased $43.1 million for the year ended December 31, 2009, compared to the nine-month transition period ended December 31, 2008 due to the factors discussed above.
Agribusiness Segment
Our agribusiness segment had increases of $151.8 million in revenue, $12.7 million in gross profit, and $2.3 million in operating income for the year ended December 31, 2009 compared to the nine-month transition period ended December 31, 2008. These increases are primarily attributable to a full year of activity in our agribusiness segment during 2009 as compared to two and one-half months of activity in 2008 because this segment was not included in our consolidated financial statements until after the VBV merger on October 15, 2008.
Marketing and Distribution Segment
Marketing and distribution revenues increased $1.0 billion for the year ended December 31, 2009, as compared to the nine-month transition period ended December 31, 2008. The increase in revenues was primarily due to an increase in ethanol- related marketing and distribution of $938.1 million and an increase in marketing and distribution for distillers grains of $76.1 million. For the nine-month period ended December 31, 2008, limited ethanol and distillers grains marketing and distribution activities were performed. During 2009, we began providing marketing services for four third-party ethanol plants, which resulted in an increase of $309.7 million of ethanol related marketing and distribution revenue during the year ended December 31, 2009, compared to the nine-month transition period ended December 31, 2008.
Gross profit for the marketing and distribution segment increased $12.2 million for the year ended December 31, 2009 as compared to the nine-month transition period ended December 31, 2008. As described above, the increase in gross profit was due to greater volume of marketing and distribution as compared to the prior period.
Initially, our Superior, Bluffton and Obion ethanol plants sold our ethanol production exclusively to outside marketers at a price per gallon based on a market price at the time of sale, less certain marketing, storage, and transportation costs, as well as a profit margin for each gallon sold. We stopped selling our ethanol production to outside marketers during the first quarter of 2009. Following completion of the VBV merger and prior to the termination of the agreements, nearly all of our ethanol that was sold to one of the outside marketers was repurchased by Green Plains Trade, reflected in the marketing and distribution segment, and resold to other customers. Corresponding revenues and related costs of goods sold related to this marketer were eliminated in consolidation.
Operating income for the marketing and distribution segment increased $3.1 million for the year ended December 31, 2009 as compared to the nine-month transition period ended December 31, 2008. The increase in operating income was due to greater volume of marketing and distribution as compared to the prior year.
Intersegment Eliminations
Intersegment eliminations of revenues increased $655.7 in 2009 due to a $550.4 million increase in ethanol sold from our ethanol production segment to our marketing and distribution segment, a $54.7 million increase in distillers grains sold from our ethanol production segment to our marketing and distribution segment, and a $50.5 million increase in corn sold from our agribusiness segment to our ethanol production segment. These increases are a result of the expanded scope of our operations and the additional three months included in the 2009 period.
Corporate Activities
Operating income was impacted by an increase in expenses for corporate activities of $6.1 million for the year ended December 31, 2009 as compared to the nine-month transition period in the previous year, primarily
due to an increase of $3.4 million in compensation, which was largely attributable to an increase in employees as we expanded production, an increase of $1.5 million in professional fees and an increase of $0.9 million in other general and administrative expenses. These increases are a result of the expanded scope of our operations and the additional three months included in the 2009 period.
Liquidity and Capital Resources
On December 31, 2010,2011, we had $233.2$175.0 million in cash and equivalents, excluding restricted cash, comprised of $114.6$71.5 million held at our corporatethe parent entity and the remainder at our subsidiaries. We had an additional $55.8$221.6 million available under our revolving credit agreements noneat our subsidiaries, some of which was subject to borrowing base restrictions or other specified lending conditions at December 31, 2010.2011. Funds held at our subsidiaries are generally required for their ongoing operational needs and distributions from our subsidiaries are restricted per the loan agreements. Additionally, at December 31, 2010,2011, there were approximately $478.0$528.6 million of net assets at our subsidiaries that were not available to be transferred to the parent company in the form of dividends, loans or advances due to restrictions contained in the credit facilities of these subsidiaries.
We incurred capital expenditures of $42.5 million in the year ended December 31, 2011 primarily for the installation of corn oil extraction facilities and expansions of grain storage capacity. Capital spending for 2012 is expected to be approximately $31.3 million, including the construction of a new ethanol unit train terminal in Birmingham, Alabama within
our marketing and distribution segment, expected to be completed in the third quarter of 2012. The remainder of our capital spending primarily relates to other recurring capital expenditures in the ordinary course of business. We believe available borrowings under our credit facilities and cash provided by operating activities will be sufficient to support our working capital, capital expenditures and debt service requirements for the foreseeable future.
In March 2010, we sold approximately 6.3 million newly-issued shares of our common stock at a price of $13.50 per share. The net proceeds of this equity offering totaled approximately $79.8$79.7 million. We have used and intend to continue using the net proceeds of this offering for general corporate purposes and to acquire or invest in additional facilities, assets or technologies consistent with our growth strategy.facilities.
In November 2010, we issued $90.0 million in 5.75% convertible senior notes due November 2015. The notes bear interest at a fixed rate of 5.75% per year, payable on May 1 and November 1 of each year, beginning May 1, 2011. The net proceeds of this issuance totaled approximately $86.6 million. We intend to useused the net proceeds for general corporate purposes includingand to acquire or invest in additional facilitiesfacilities.
On August 15, 2011, we entered into two short-term inventory financing arrangements with a financial institution. Under the terms of the financing agreements, we sold grain for $10.0 million, issued warehouse receipts to the financial institution and assets or technologies consistent withsimultaneously entered into agreements to repurchase the grain in future periods. The agreements mature in January and February of 2012. We accounted for the agreements as short-term notes rather than sales, and recorded our growth strategy. Net proceedsrepurchase obligation at fair value at the end of each period. At December 31, 2011, the grain inventory and short-term notes payable were valued at $8.9 million.
On September 9, 2011, we repurchased 3.5 million shares of common stock at a price of $8.00 per share from this offering werea subsidiary of NTR plc, which is a principal shareholder. We do not usedhave a share repurchase program and do not intend to fundretire the Global Ethanol acquisition.repurchased shares.
Net cash provided by operating activities was $34.8$108.9 million for the year ended December 31, 2011 compared to $34.8 million in 2010. ThisCash provided by operating activities for the year ended December 31, 2011 was primarilyaffected by an increase in accounts payable and a result of positive operating marginsdecrease in 2010, reducedderivative financial instruments offset partially by increased investmentincreases in working capital due to higher commodity pricesaccounts receivable and our expanded operations.inventory. Net cash used by investing activities was $62.6$54.5 million for the year ended December 31, 2010, mainly2011, primarily due to purchasesthe acquisition of property,our Otter Tail ethanol plant, and equipmentthe construction of additional grain storage and the acquisitionsinstallation of the agribusiness operations in western Tennessee and Global Ethanol.corn oil extraction equipment. Net cash providedused by financing activities was $171.2$112.6 million for the year ended December 31, 2010, primarily2011 due to the repayment of debt, net of proceeds from new issuances, of $68.8 million and $28.2 million in cash outflows for the issuancerepurchase of common stocktreasury stock. We made scheduled principal payments and convertible senior notes described above.$13.1 million in free cash flow payments for a total of $206.9 million in debt reduction on our term debt facilities and long-term revolving credit facilities, offset by advances of $138.1 million from long-term revolving credit facilities, during the year ended December 31, 2011. Green Plains Trade and Green Plains Grain utilize short-term revolving credit facilities to finance working capital.capital requirements. These facilities are frequently drawn upon and repaid resulting in significant cash flowsmovements that are reflected on a gross basis within financing activities as proceeds from financing activities. In addition, we made scheduled principaland payments on ourshort-term notes payable and other term debt facilities.borrowings.
Our business is highly impacted by commodity prices, including prices for corn, ethanol, distillers grains and natural gas. We attempt to reduce the market risk associated with fluctuations in commodity prices through the use of derivative financial instruments. Sudden changes in commodity prices may require cash deposits with brokers, or margin calls. Depending on our open derivative positions, we may require significant liquidity with little advanced notice to meet margin calls. We continuously monitor our exposure to margin calls and believe that we will continue to maintain adequate liquidity to cover such margin calls from operating results and borrowings. Recent increasesIncreases in grain prices and our expanded grain handling capacity have led to more frequent and larger margin calls. Accordingly, in November 2010, we expanded Green Plains Grain’s short-term borrowing capacity under its revolving credit facilities from $65 million to $107 million. Amounts available under these revolving credit facilities decrease to $100 million on April 1, 2011, and to $65 million on June 1, 2011. We intend to negotiate a new credit facility for Green Plains Grain prior to its maturity on August 1, 2011.
We are in compliance with our debt covenants or have obtained applicable waivers related to the period ended December 31, 2010.2011. Based upon our current forecasts, we believe we will maintain compliance at each of our subsidiaries for the upcoming twelve months, or if necessary have sufficient liquidity available on a
consolidated basis to resolve a subsidiary’s noncompliance; however, no obligation exists to provide such liquidity for a subsidiary’s compliance. No assurance can be provided that actual operating results will approximate our forecasts or that we will inject the necessary capital into a subsidiary to maintain compliance with its respective covenants. In the event actual results differ significantly from our forecasts and a subsidiary is unable to comply with its respective debt covenants, the subsidiary’s lenders may determine that an event of default has occurred. Upon the occurrence of an event of default, and following notice, the lenders may terminate any commitment and declare the entire unpaid balance due and payable.
We believe that we have sufficient working capital for our existing operations. However, we can provide no assurance that we will be able to secure additional funding for any of our operations. A sustained period of unprofitable operations may strain our liquidity and make it difficult to maintain compliance with our financing arrangements. While we may seek additional sources of working capital in response, we can provide no assurance that we will be able to secure this funding if necessary. We may sell additional equity or borrow additional amounts to improve or preserve our liquidity; expand our ethanol plants; build additional or acquire existing ethanol plants; or build additional or acquire existing agribusiness and ethanol distribution facilities. We can provide no assurance that we will be able to secure the funding necessary for these additional projects or for additional working capital needs at reasonable terms, if at all.
Long-Term Debt
For additional information related to our long-term debt, seeNote 1110 – Long-Term Debt included herein as part of the Notes to Consolidated Financial Statements.
Ethanol Production Segment
Each of our ethanol production segment subsidiaries have credit facilities with lender groups that provide for term and revolving term loans to finance construction and operation of the production facilities.
The Green Plains Bluffton loan is comprised of a $70.0 million amortizing term loan and a $20.0 million revolving term loan. At December 31, 2010, $56.02011, $48.0 million related to the term loan was outstanding, along with the entire revolving term loan. The term loan requires monthly principal payments of approximately $0.6 million. The loans mature on November 19, 2013.
The Green Plains Central City loan is comprised of a $55.0 million amortizing term loan and a $30.5 million revolving term loan as well as a statused revolving credit supplement (revolver) of up to $11.0 million. At December 31, 2010, $52.22011, $46.6 million related to the term loan was outstanding, along with $30.5$24.7 million on the revolving term loan and $6.2 million on the revolver.loan. The term loan requires monthly principal payments of $0.6 million beginning in June 2011.million. The term loan and the revolving term loan mature on July 1, 2016 and the revolver matures on July 1, 2011June 29, 2012 with an option to renew.
The Green Plains Holdings II loan is comprised of a $34.1 million amortizing term loan, a $42.6 million revolving term loan and a $15.0 million revolving line of credit loan. At December 31, 2011, $27.9 million was outstanding on the term loan, along with $35.7 million on the revolving term loan and $15.0 million on the revolving line of credit loan. The term loan requires quarterly principal payments of $1.5 million. The revolving term loan requires semi-annual principal payments of approximately $2.7 million. The amortizing term loan will mature on January 1, 2015. The revolving term loan will mature on April 1, 2016. The revolving line of credit will mature on April 30, 2013.
On February 9, 2012, Green Plains Holdings II entered into an amended and restated credit agreement comprised of a $26.4 million amortizing term loan and a $51.1 million revolving term loan. The final maturity dates of the amortizing term loan and revolving term loan are July 1, 2016 and October 1, 2018, respectively.
The Green Plains Obion loan is comprised of a $60.0 million amortizing term loan and a revolving term loan of $37.4 million. At December 31, 2010, $40.92011, $25.7 million related to the term loan and $36.2 million on the revolving term loan was outstanding. The term loan requires quarterly principal payments of $2.4 million. The term loan matures on MayAugust 20, 20152014 and the revolving term loan matures on MaySeptember 1, 2019.2018.
The Green Plains Ord loan is comprised of a $25.0 million amortizing term loan and a $13.0 million revolving term loan as well as a statused revolving credit supplement (revolver) of up to $5.0 million. At December 31, 2010, $23.82011, $21.3 million related to the term loan was outstanding, $13.0$12.2 million on the revolving term loan, along with $2.5$3.3 million on the revolver. The term loan requires monthly principal payments of $0.3 million beginning in June 2011.million. The term loan and the revolving term loan mature on July 1, 2016 and the revolver matures on July 1, 2011June 29, 2012 with an option to renew.
The Green Plains Otter Tail loan is comprised of a $30.3 million amortizing term loan, a $4.7 million revolver and a $19.2 million note payable. At December 31, 2011, $27.4 million related to the term loan, $4.7 million on the revolver and $18.9 million on the note payable were outstanding. The term loan requires monthly principal and interest payments of $0.5 million and the note payable requires monthly principal payments of $0.3 million beginning October 1, 2014. The term loan matures on September 1, 2018 and the revolver matures on March 23, 2012. We are currently in negotiations and expect to renew this revolver on or before its maturity date.
The Green Plains Shenandoah loan is comprised of a $30.0 million amortizing term loan and a $17.0 million revolving term loan. At December 31, 2010, $13.42011, $6.1 million related to the term loan was outstanding along with the entire $17.0 million on the revolving term loan. The term loan requires quarterly principal payments of $1.2 million. The term loan matures on May 20, 20142013 and the revolving term loan matures on November 1, 2017.2016.
The Green Plains Superior loan is comprised of a $40.0$23.5 million amortizing term loan and a $10.0 million revolving term loan. At December 31, 2010, $26.32011, $20.8 million related to the term loan was outstanding, along with the entire $10.0 million on the revolving term loan. The term loan requires quarterly principal payments of $1.375 million. The term loan matures on July 20, 2015 and the revolving term loan matures on July 1, 2017.
Each term loan, except for the Green Plains Holdings II and Green Plains Otter Tail agreements, has a provision that requires us to make annual special payments equal to a percentage ranging from 50%65% to 75% of the available free cash flow from the related entity’s operations (as defined in the respective loan agreements), subject to certain limitations. During the twelve monthsyear ended December 31, 2010, $7.72011, $13.1 million was paid under these requirements.
With certain exceptions, the revolving term loans within this segment are generally available for advances throughout the life of the commitment. Interest-only payments are due each month on all revolving term facilities until the final maturity date, with the exception of the Green Plains Obion’sObion loan, which requires additional semi-annual payments of $4.675 million beginning NovemberMarch 1, 2015.
On October 22, 2010, we acquired Global Ethanol and assumed its debt, now held by our subsidiary Green Plains Holdings II (Holdings II). As of October 22, 2010, following the payment of $6.0 million to reduce the assumed debt, the Holdings II loan was comprised of a $34.1 million amortizing term loan, a $42.6 million revolving term loan and a $15.0 million revolving line of credit loan. At December 31, 2010, $34.1 million was outstanding on the term loan, along with $42.2 million on the revolving term loan and $15.0 million on the revolving line of credit loan. The term loan requires quarterly principal payments of $1.5 million. The revolving term loan requires semi-annual payments of approximately $2.7 million. The amortizing term loan will mature on January 1, 2015. The revolving term loan will mature April 1, 2016. The revolving line of credit will mature on April 30, 2013.
The term loans and revolving term loans bear interest at LIBOR plus 1.5%3.00% to 4.50% or lender-established prime rates. Some have established a floor on the underlying LIBOR index. In some cases, the lender may allow us to elect to pay interest at a fixed interest rate to be determined. As security for the loans, the lenders received a first-position lien on all personal property and real estate owned by the respective entity borrowing the funds, including an assignment of all contracts and rights pertinent to construction and on-going operations of the plant. Additionally, debt facilities withinof Green Plains Central City and Green Plains Ord are cross-collateralized. These borrowing entities are also required to maintain certain combined financial and non-financial covenants during the terms of the loans.
Green Plains Bluffton also received $22.0 million in Subordinate Solid Waste Disposal Facility Revenue Bond funds from the Citycity of Bluffton, Indiana, of which $20.6$19.1 million remained outstanding at December 31, 2010.2011. The revenue bond requires: semi-annual principal and interest payments of approximately $1.5 million during the period commencing on March 1, 2010 through March 1, 2019; and a final principal and interest payment of $3.745 million on September 1, 2019. The revenue bond bears interest at 7.50% per annum.
Agribusiness Segment
The Green Plains Grain loan was modified in April, June and November 2010 and Februaryloans, executed on October 28, 2011, to beare comprised of a $20.0$30.0 million amortizing term loan and a $45.0$195.0 million revolving credit facility with various lenders to provide the agribusiness segment with additional term loan, a $20.0 million seasonal revolver and a $42.0 million bulge seasonal revolver.working capital funding. The term loan expiresand revolving credit facility mature on AugustNovember 1, 2021 and October 28, 2013, respectively. Equal payments of principal sufficient to amortize the revolving term loan expires on August 1, 2011, $7.0 million of the bulge seasonal revolver expires on April 1, 2011, the remainder of the bulge seasonal revolver expires June 1, 2011 and the seasonal revolver expires on August 1, 2011. Payments of $0.5 million under the term loanin full over a 15-year period, plus interest, are due on the first business day of every month with the remaining outstanding balance and all accrued interest due on the loan maturity date. The principal balance of each calendar quarter,
with any remaining amount payable at the expirationadvance of the revolving credit facility shall be due and payable on the respective maturity date but no later than October 28, 2013. The term loan term. The loans bearbears interest at three-month LIBOR plus 4.25% on the term loan, LIBOR plus 3.5% ona fixed rate of 6.00% per annum. Advances of the revolving term loan, and one-month LIBOR plus 3.75% on the seasonal revolver, allcredit facility are subject to an interest charges at a rate floor of 4.5%. Loan proceeds are used primarilyper annum equal to the LIBOR rate for working capital purposes.the outstanding period, or the base rate, plus the respective applicable margin. At December 31, 2010, $19.02011, $27.8 million on the term loan and $68.0$27.0 million on the various revolving loans were outstanding. As security for the loans,amortizing term loan the lender received a first-positionfirst priority lien on certain real estate equipment,and other property owned by the subsidiaries within the agribusiness segment. As security for the revolving credit facility, the lender received a first priority lien on certain cash, inventory, machinery, accounts receivable and other assets owned by subsidiaries of the agribusiness segment.
On August 15, 2011, we entered into two short-term inventory financing arrangements with a financial institution. Under the terms of the financing agreements, we sold quantities of grain totaling $10.0 million, issued warehouse receipts to the financial institution and simultaneously entered into agreements to repurchase the grain in future periods. The agreements mature in January and February of 2012. We have accounted for the agreements as short-term notes, rather than sales, and have recorded our repurchase obligation at fair value at the end of each period. At December 31, 2011, grain inventory and accounts receivable owned by Green Plains Grain. In addition, Green Plain Grain had outstanding equipment financing term loans totaling $0.9 millionthe short-term notes payable were valued at December 31, 2010.$8.9 million.
Marketing and Distribution Segment
The Green Plains Trade loan is comprised of a senior secured revolving credit facility of up to $30.0$70.0 million, subject to a borrowing base of 85% of eligible receivables and a current availability block of $5.0 million.receivables. At December 31, 2010, $21.22011, $33.7 million was outstanding on the revolving credit facility was outstanding.facility. The revolving credit facility expires on July 30, 2012March 31, 2014 and bears interest at the lender’s commercial floating rate plus 2.5% or LIBOR plus 3.5%. As security for the loan, the lender received a first-position lien on accounts receivable, inventory and other collateral owned by Green Plains Trade.
On January 21, 2011, Green Plains Trade enteredCorporate Activities
We also have $90.0 million of 5.75% Convertible Senior Notes due 2015. The Notes represent senior, unsecured obligations, with interest payable on May 1 and November 1 of each year. The Notes may be converted into an amendmentshares of common stock and restatementcash in lieu of fractional shares of the senior secured revolving credit facilitycommon stock based on a conversion rate initially equal to increase69.7788 shares of the common stock per $1,000 principal amount of Notes, which is equal to an initial conversion price of $14.33 per share. The conversion rate is subject to adjustment upon the occurrence of specified events. We may redeem for cash all, but not less than all, of the Notes at any time on and after November 1, 2013, if the last reported sale price of our common stock equals or exceeds 140% of the applicable conversion price for a specified time period, at a redemption price equal to 100% of the principal amount available from $30.0of the Notes, plus accrued and unpaid interest. Default with respect to any loan in excess of $10.0 million to $70.0 million. The amended facility expires on March 31, 2014.constitutes an event of default under the convertible senior notes, which could result in the convertible senior notes being declared due and payable.
Contractual Obligations
Our contractual obligations as of December 31, 20102011 were as follows (in thousands):
| Payments Due By Period | Payments Due By Period | |||||||||||||||||||||||||||||||||||||||||||||||||||||||||||
Contractual Obligations | Total | Less than 1 year | 1-3 years | 3-5 years | More than 5 years | Total | Less than 1 year | 1-3 years | 3-5 years | More than 5 years | ||||||||||||||||||||||||||||||||||||||||||||||||||
Long-term debt obligations (1) | $ | 668,968 | $ | 141,068 | $ | 177,192 | $ | 192,829 | $ | 157,879 | ||||||||||||||||||||||||||||||||||||||||||||||||||
Long-term and short-term debt obligations (1) | $ | 637,058 | $ | 143,359 | $ | 165,875 | $ | 203,706 | $ | 124,118 | ||||||||||||||||||||||||||||||||||||||||||||||||||
Interest and fees on debt obligations (2) | 86,820 | 25,256 | 37,040 | 19,381 | 5,143 | 104,795 | 29,609 | 42,662 | 23,668 | 8,856 | ||||||||||||||||||||||||||||||||||||||||||||||||||
Operating lease obligations (3) | 49,476 | 16,033 | 22,064 | 6,883 | 4,496 | 52,686 | 16,566 | 22,252 | 11,010 | 2,858 | ||||||||||||||||||||||||||||||||||||||||||||||||||
Deferred tax liabilities | 55,875 | — | — | — | 55,875 | |||||||||||||||||||||||||||||||||||||||||||||||||||||||
Purchase obligations | ||||||||||||||||||||||||||||||||||||||||||||||||||||||||||||
Forward grain purchase contracts (4) | 478,649 | 475,180 | 3,469 | - | - | 237,594 | 235,747 | 1,847 | — | — | ||||||||||||||||||||||||||||||||||||||||||||||||||
Other commodity purchase contracts (5) | 28,019 | 28,019 | - | - | - | 22,519 | 22,519 | — | — | — | ||||||||||||||||||||||||||||||||||||||||||||||||||
Other | 18,387 | 18,351 | 34 | 2 | - | 3,698 | 3,315 | 383 | — | — | ||||||||||||||||||||||||||||||||||||||||||||||||||
|
|
|
|
| ||||||||||||||||||||||||||||||||||||||||||||||||||||||||
Total contractual obligations | $ | 1,330,319 | $ | 703,907 | $ | 239,799 | $ | 219,095 | $ | 167,518 | $ | 1,114,225 | $ | 451,115 | $ | 233,019 | $ | 238,384 | $ | 191,707 | ||||||||||||||||||||||||||||||||||||||||
|
|
|
|
| ||||||||||||||||||||||||||||||||||||||||||||||||||||||||
| (1) | Includes the current portion of long-term |
| (2) | Interest amounts are calculated over the terms of the loans using current interest rates, assuming scheduled principle and interest amounts are paid pursuant to the debt agreements. Includes administrative and/or commitment fees on debt obligations. |
| (3) | Operating lease costs are primarily for railcars and office space. |
| (4) | Purchase contracts represent index-priced and fixed-price contracts. Index purchase contracts are valued at current |
| (5) | Includes fixed-price ethanol, dried distillers grains and natural gas purchase contracts. |
| Item 7A. |
We are exposed to various market risks, including changes in commodity prices and interest rates. Market risk is the potential loss arising from adverse changes in market rates and prices. In the ordinary course of business, we enter into various types of transactions involving financial instruments to manage and reduce the impact of changes in commodity prices and interest rates. At this time, we do not expect to have exposure to foreign currency risk as we expect to conduct all of our business in U.S. dollars.
Interest Rate Risk
We are exposed to market risk from changes in interest rates. Exposure to interest rate risk results primarily from holding term and revolving loans that bear variable interest rates. Specifically, we have $669.0$636.8 million outstanding in debt as of December 31, 2010, $454.42011, $400.0 million of which is variable-rate in nature. Interest rates on our variable-rate debt are determined based upon the market interest rate of either the lender’s prime rate or LIBOR, as applicable. A 10% change in interest rates would affect our interest cost on such debt by approximately $2.1$1.7 million per year in the aggregate. Other details of our outstanding debt are discussed in the notes to the consolidated financial statements included as a part of this report.
Commodity Price Risk
We produce ethanol, distillers grains and corn oil from corn and our business is sensitive to changes in the prices of each of these commodities. The price of corn is subject to fluctuations due to unpredictable factors such as weather; corn planted and harvested acreage; changes in national and global supply and demand; and government programs and policies. We use natural gas in the ethanol production process and, as a result, our business is also sensitive to changes in the price of natural gas. The price of natural gas is influenced by such weather factors as extreme heat or cold in the summer and winter, or other natural events like hurricanes in the spring, summer and fall. Other natural gas price factors include North American exploration and production, and the amount of natural gas in underground storage during both the injection and withdrawal seasons. Ethanol prices are sensitive to world crude-oil supply and demand; crude-oil refining capacity and utilization; government regulation; and consumer demand for alternative fuels. Distillers grains prices are sensitive to various demand factors such as numbers of livestock on feed, prices for feed alternatives, and supply factors, primarily production by ethanol plants and other sources.
We attempt to reduce the market risk associated with fluctuations in the price of corn, natural gas, ethanol, distillers grains and ethanolcorn oil by employing a variety of risk management and economic hedging strategies. Strategies include the use of forward fixed-price physical contracts and derivative financial instruments, such as futures and options executed on the Chicago Board of Trade and/orand the New York Mercantile Exchange.
We focus on locking in operating margins based on a model that continually monitors market prices of corn, natural gas and other input costs against prices for ethanol and distillers grains at each of our production facilities. We create offsetting positions by using a combination of forward fixed-price physical purchases and sales contracts and derivative financial instruments. As a result of this approach, we frequently have gains on derivative financial instruments that are conversely offset by losses on forward fixed-price physical contracts or inventories and vice versa. In our ethanol production segment, gains and losses on derivative financial instruments are recognized each period in operating results while corresponding gains and losses on physical contracts are generally designated as normal purchases or normal sales contracts and are not recognized until quantities are delivered or utilized in production. For cash flow hedges, any ineffectiveness is recognized in current period results, while other unrealized gains and losses are reflected in accumulated other comprehensive income until gains and losses from the underlying hedged transaction are realized. In the event that it becomes probable that a forecasted transaction will not occur, we would discontinue cash flow hedge treatment, which would affect earnings. During the year ended December 31, 2010,2011, revenues and cost of goods sold included net losses from derivative financial instruments of $8.7$45.3 million and $23.4$39.5 million respectively. To the extent the net gains or losses from settled derivative instruments are related to hedging current period production, they are generally offset by physical commodity purchases or sales resulting in the realization of the intended operating margins. However, our results of operations are impacted when there is a mismatch of gains or losses associated with the change in fair value of derivative instruments at the reporting period when the physical commodity purchase or sales has not yet occurred since they are designated as a normal purchase or normal sale.
In our agribusiness segment, inventory positions, physical purchase and sale contracts, and financial derivatives are marked to market with gains and losses included in results of operations. The market value of
derivative financial instruments such as exchange-traded futures and options has a high, but not perfect, correlation to the underlying market value of grain inventories and related purchase and sale contracts.
Ethanol Production Segment
A sensitivity analysis has been prepared to estimate our ethanol production segment exposure to ethanol, corn, distillers grains and natural gas price risk. Market risk related to these factors is estimated as the potential change in pre-taxnet income resulting from hypothetical 10% changes in prices of our expected corn and natural gas requirements, and ethanol and distillers grains output for a one-year period from December 31, 2010.2011. This analysis excludes the impact of risk management activities that result from our use of fixed-price purchase and sale contracts and derivatives. The results of this analysis, which may differ from actual results, are as follows (in thousands):
Commodity | Estimated Total Volume Requirements for the Next 12 Months | Unit of Measure | Income Effect of Approximate 10% Change in Price | Estimated Total Volume Requirements for the Next 12 Months | Unit of Measure | Net Income Effect of Approximate 10% Change in Price | ||||||||||||||||||||
Ethanol | 680,000 | Gallons | $ | 154,847 | 740,000 | Gallons | $ | 102,154 | ||||||||||||||||||
Corn | 245,000 | Bushels | $ | 149,374 | 265,000 | Bushels | $ | 102,445 | ||||||||||||||||||
Distillers grains | 2,000 | Tons (1) | $ | 27,895 | 2,100 | Tons (1) | $ | 17,396 | ||||||||||||||||||
Natural gas | 18,650 | MMBTU (2) | $ | 8,530 | 20,300 | MMBTU (2) | $ | 3,638 | ||||||||||||||||||
(1)
| (1) | Distillers grains quantities are stated on an equivalent dried ton basis. |
| (2) | Millions of British Thermal Units |
Corn Oil Production Segment
(2) MillionsA sensitivity analysis has been prepared to estimate our corn oil production segment exposure to corn oil price risk. Market risk related to these factors is estimated as the potential change in net income resulting from hypothetical 10% changes in prices of British Thermal Units
Atour expected corn oil output for a one-year period from December 31, 2010, approximately 14%2011. This analysis includes the impact of risk management activities that result from our forecasted ethanol production duringuse of fixed-price sale contracts. Market risk at December 31, 2011, based on the next 12 months has been sold under fixed-price contracts. Asestimated net income effect resulting from a result of these positions, the effect of ahypothetical 10% change in the price of ethanol shown above would be reduced bysuch prices, was approximately $21.6 million.
At December 31, 2010, approximately 16% of our estimated corn usage for the next 12 months was subject to fixed-price contracts. As a result of these positions, the effect of a 10% change in the price of corn shown above would be reduced by approximately $24.3 million.
At December 31, 2010, approximately 14% of our forecasted distillers grain production for the next 12 months was subject to fixed-price contracts. As a result of these positions, the effect of a 10% change in the price of distillers grains shown above would be reduced by approximately $3.9 million.
At December 31, 2010, approximately 20% of our forecasted natural gas requirements for the next 12 months have been purchased under fixed-price contracts. As a result of these positions, the effect of a 10% change in the price of natural gas shown above would be reduced by approximately $1.7$0.4 million.
Agribusiness Segment
The availability and price of agricultural commodities are subject to wide fluctuations due to unpredictable factors such as weather, plantings, foreign and domestic government farm programs and policies, changes in global demand created by population changes and changes in standards of living, and global production of similar and competitive crops. To reduce price risk caused by market fluctuations in purchase and sale commitments for grain and grain held in inventory, we enter into exchange-traded futures and options contracts that function as economic hedges. The market value of exchange-traded futures and options used for economic hedging has a high, but not perfect correlation, to the underlying market value of grain inventories and related purchase and sale contracts. The less correlated portion of inventory and purchase and sale contract market value, known as basis, is much less volatile than the overall market value of exchange-traded futures and tends to follow historical patterns. We manage this less volatile risk by constantly monitoring our position relative to the price changes in the market. In addition, inventory values are affected by the month-to-month spread relationships in the regulated futures markets, as we carry inventories over time. These spread relationships are
also less volatile than the overall market value and tend to follow historical patterns, but also represent a risk that cannot be directly offset. Our accounting policy for our futures and options, as well as the underlying inventory positions and purchase and sale contracts, is to mark them to the market and include gains and losses in the consolidated statement of operations in sales and merchandising revenues.
A sensitivity analysis has been prepared to estimate agribusiness segment exposure to market risk of our commodity position (exclusive of basis risk). Our daily net commodity position consists of inventories related to purchase and sale contracts and exchange-traded contracts. The fair value of our position, which is a summation of the fair values calculated for each commodity by valuing each net position at quoted futures market prices.prices, is approximately $484 thousand at December 31, 2011. Market risk isat that date, based on the estimated as the potential loss in fair valuenet income effect resulting from a hypothetical 10% change in such prices. The result of this analysis, as of December 31, 2010, which may differ from actual results, is as follows (in thousands):prices, was approximately $30 thousand.
Fair Value | $ | 28 | ||
Market Risk | $ | 3 |
| Item 8. |
The required consolidated financial statements and notes thereto are included in this report and are listed in Part IV, Item 15.
On June 2, 2009, the Company dismissed L.L. Bradford & Company, LLC (“L.L. Bradford”) as its independent registered public accounting firm effective upon the filing of the Company’s Form 10-Q for the second quarter ended June 30, 2009. The Company’s Audit Committee participated in and approved the decision to change independent accountants. We notified L.L. Bradford of this decision on June 2, 2009.
The report of L.L. Bradford on the consolidated financial statements for the nine-month transition period ended December 31, 2008 contained no adverse opinion or disclaimer of opinion and were not qualified or modified as to uncertainty, audit scope or accounting principle.
In connection with its audits for the nine-month transition period ended December 31, 2008 and through the interim period through June 2, 2009, there have been no disagreements with L.L. Bradford on any matter of accounting principles or practices, financial statement disclosure, or auditing scope or procedure, which disagreements if not resolved to the satisfaction of L.L. Bradford would have caused them to make reference thereto in their reports on the consolidated financial statements for such years.
During the nine-month transition period ended December 31, 2008 and through June 2, 2009, there have been no reportable events (as defined in Regulation S-K Item 304(a)(1)(v)).
We requested that L.L. Bradford furnish us with a letter addressed to the Securities and Exchange Commission stating whether or not it agrees with the above statements. A copy of that letter was filed as Exhibit 16.1 to our Form 8-K filed on June 5, 2009.
On June 2, 2009, the Company’s Audit Committee selected KPMG LLP (“KPMG”) as independent registered public accountants of the Company for the fiscal year ended December 31, 2009. During Green Plains’ two most recent fiscal years and in the subsequent period through June 2, 2009, neither Green Plains, nor anyone acting on its behalf, consulted with KPMG regarding either: (i) the application of accounting principles to a specified transaction, either completed or proposed, or the type of audit opinion that might be rendered on Green Plains’ financial statements, and no written report nor oral advice was provided by KPMG, or (ii) any matter that was either the subject of a disagreement, as that term is defined in Item 304(a)(1)(iv) of Regulation S-K, or a
reportable event, as that term is defined in Item 304(a)(1)(v) of Regulation S-K. The engagement of KPMG as the independent registered public accountants to audit Green Plains’ consolidated financial statements was approved by the Audit Committee of Green Plains.None.
Evaluation of Disclosure Controls and Procedures
We maintain disclosure controls and procedures that are designed to ensure that information required to be disclosed in the reports that we file or submit under the Exchange Act is recorded, processed, summarized and reported within the time periods specified in the SEC’s rules and forms, and that such information is accumulated and communicated to the Company’s management, including its Chief Executive Officer and Chief Financial Officer, as appropriate, to allow timely decisions regarding required financial disclosure.
As of the end of the period covered by this report, our management carried out an evaluation, under the supervision of and with the participation of our Chief Executive Officer and Chief Financial Officer, of the effectiveness of the design and operation of our disclosure controls and procedures (as defined in Rules 13a-15(e) and 15d-15(e) under the Exchange Act). Our disclosure controls and procedures are designed to ensure that information required to be disclosed in the reports that we file or submit under the Exchange Act is recorded, processed, summarized and reported within the time periods specified in SEC rules and forms. These disclosure controls and procedures are designed to ensure that information required to be disclosed by us in the reports that we file or submit under the Exchange Act is accumulated and communicated to our management, including our Chief Executive Officer and Chief Financial Officer, as appropriate, to allow timely decisions regarding required financial disclosure. Based upon that evaluation, our management, including the Chief Executive Officer and the Chief Financial Officer, concluded that our disclosure controls and procedures were effective.
Management’s Annual Report on Internal Control over Financial Reporting
Our management is responsible for establishing and maintaining adequateeffective internal control over financial reporting, as defined in Exchange Act Rule 13a-15(f). Our internal control system is designed to provide reasonable assurance regarding the reliability of financial reporting and the preparation of financial statements in accordance with U.S. generally accepted accounting principles.
Under the supervision of and with the participation of management, including our Chief Executive Officer and Chief Financial Officer, our management assessed the design and operating effectiveness of internal control over financial reporting as of December 31, 20102011 based on the framework set forth in Internal Control-Integrated Framework issued by the Committee of Sponsoring Organizations of the Treadway Commission. We acquired Global Ethanol LLC (Global) on October 22, 2010, and our management excluded from its assessment of the effectiveness of our internal control over financial reporting as of December 31, 2010, Global’s internal control over financial reporting associated with 13.3% of total assets and 3.8% of consolidated total revenue included in the financial statements of the Company as of and for the year ended December 31, 2010.
Based on this assessment, management concluded that our internal control over financial reporting was effective as of December 31, 2010.2011. KMPG LLP, an independent registered accounting firm, has audited and issued a report on the Company’s internal control over financial reporting as of December 31, 2010.2011. That report is included herein.
Changes in Internal Control over Financial Reporting
Our management is responsible for establishing and maintaining adequateeffective internal control over financial reporting to provide reasonable assurance regarding the reliability of our financial reporting and the preparation of our consolidated financial statements for external purposes in accordance with generally accepted accounting principles. In the fourth quarter of 2011, we implemented a process and information system enhancement, principally related to contract and risk management activities, in our trade operations that are reported as a part of the marketing and distribution segment. The process and information system resulted in modification to internal controls over the purchases, sales, accounts payable, accounts receivable, cash receipts and inventory management related to distillers grains. There were no other material changes in our internal control over financial reporting that occurred during the last fiscal quarter that have materially affected, or are reasonably likely to materially affect, our internal control over financial reporting.
Evaluation of Disclosure Controls and Procedures
Report of Independent Registered Public Accounting Firm
The Board of Directors and Stockholders
Green Plains Renewable Energy, Inc.:
We have audited the internal control over financial reporting of Green Plains Renewable Energy, Inc. and subsidiaries (the Company) internal control over financial reporting as of December 31, 2010,2011, based on criteria established in Internal Control – Integrated Framework issued by the Committee of Sponsoring Organizations of the Treadway Commission (COSO). The Company’s management is responsible for maintaining effective internal control over financial reporting and for its assessment of the effectiveness of internal control over financial reporting, included in the accompanying Management’s Annual Report on Internal Control Over Financial Reporting. Our responsibility is to express an opinion on the Company’s internal control over financial reporting based on our audit.
We conducted our audit in accordance with the standards of the Public Company Accounting Oversight Board (United States). Those standards require that we plan and perform the audit to obtain reasonable assurance about whether effective internal control over financial reporting was maintained in all material respects. Our audit included obtaining an understanding of internal control over financial reporting, assessing the risk that a material weakness exists, and testing and evaluating the design and operating effectiveness of internal control based on the assessed risk. Our audit also included performing such other procedures as we considered necessary in the circumstances. We believe that our audit provides a reasonable basis for our opinion.
A company’s internal control over financial reporting is a process designed to provide reasonable assurance regarding the reliability of financial reporting and the preparation of financial statements for external purposes in accordance with generally accepted accounting principles. A company’s internal control over financial reporting includes those policies and procedures that (1) pertain to the maintenance of records that, in reasonable detail, accurately and fairly reflect the transactions and dispositions of the assets of the company; (2) provide reasonable assurance that transactions are recorded as necessary to permit preparation of financial statements in accordance with generally accepted accounting principles, and that receipts and expenditures of the company are being made only in accordance with authorizations of management and directors of the company; and (3) provide reasonable assurance regarding prevention or timely detection of unauthorized acquisition, use, or disposition of the company’s assets that could have a material effect on the financial statements.
Because of its inherent limitations, internal control over financial reporting may not prevent or detect misstatements. Also, projections of any evaluation of effectiveness to future periods are subject to the risk that controls may become inadequate because of changes in conditions, or that the degree of compliance with the policies or procedures may deteriorate.
In our opinion, the Company maintained, in all material respects, effective internal control over financial reporting as of December 31, 2010,2011, based on criteria established inInternal Control – Integrated Framework issued by the Committee of Sponsoring Organizations of the Treadway Commission.
The Company acquired Global Ethanol LLC (Global) on October 22, 2010, and management excluded from its assessment of the effectiveness of the Company’s internal control over financial reporting as of December 31, 2010, Global’s internal control over financial reporting associated with 13.3% of the Company’s total assets and 3.8% of the Company’s consolidated total revenue included in the financial statements of the Company as of and for the year ended December 31, 2010. Our audit of internal control over financial reporting of the Company also excluded an evaluation of the internal control over financial reporting of Global.
We also have audited, in accordance with the standards of the Public Company Accounting Oversight Board (United States), the consolidated balance sheets of the Company as of December 31, 20102011 and 2009,2010, and the related consolidated statements of operations, stockholders’ equity and comprehensive income (loss), and cash flows for each of the years thenin the three-year period ended and the related financial statement scheduleDecember 31, 2011, and our report dated March 4, 2011,February 17, 2012 expressed an unqualified opinion on those consolidated financial statements and related financial statement schedule.
/s/ KPMG LLP
Omaha, NebraskaNE
March 4, 2011February 17, 2012
None.
The information required by this item with respect to our directors, our audit committee and our audit committee financial expert isInformation included in the sections entitled “Information about the Board of Directors and Corporate Governance” andGovernance,” “Proposal I1 – Election of Directors”Directors,” “Executive Officers,” and “Section 16(a) Beneficial Ownership Reporting Compliance” in our Proxy Statement for the 20112012 Annual Meeting of Stockholders (the “Proxy Statement”) and is incorporated herein by reference. Information included in the section entitled “Section 16(a) Beneficial Ownership Reporting Compliance” in the Proxy Statement is also incorporated herein by reference.
Certain information regarding our executive officers is included in Part 1 – Executive Officers of the Registrant of this report.
The Company has adopted a Code of Ethics that applies to our Chief Executive Officer and all senior financial officers, including the Chief Financial Officer, principal accounting officer, other senior financial officers and persons performing similar functions. The full text of the Code of Ethics is published on our website atwww.gpreinc.com in the “Investors – Corporate Governance” section. We intend to disclose future amendments to, or waivers from, certain provisions of the Code of Ethics on our website within five business days following the adoption of such amendment or waiver.
Information included in the sections entitled “Information about the Board of Directors and Corporate Governance,” “Director Compensation” and “Executive Compensation” in the Proxy Statement is incorporated herein by reference.
Information included in the sections entitled “Principal Shareholders”Shareholders,” “Equity Compensation Plans” and “Executive Compensation” in the Proxy Statement is incorporated herein by reference. Information concerning our equity compensation plans is set forth in Item 5 of this report.
Information included in the sections entitled “Information about the Board of Directors and Corporate Governance” and “Certain Relationships and Related Party Transactions,” if any, in the Proxy Statement is incorporated herein by reference.
Information included in the section entitled “Independent Public Accountants” in the Proxy Statement is incorporated herein by reference.
(1) Financial Statements. The following index lists consolidated financial statements and notes thereto filed as part of this annual report on Form 10-K.
| Page | ||
| F-1 | ||
| F-2 | ||
| F-3 | ||
(2) Financial Statement Schedules. The following condensed financial information and notes thereto are filed as part of this annual report on Form 10-K.
(2) Financial Statement Schedules. The following condensed financial information and notes thereto are filed as part of this annual report on Form 10-K. | ||
| Page | ||
Schedule I – Condensed Financial Information of the Registrant | ||
All other schedules have been omitted because they are not applicable or the required information is included in the consolidated financial statements or notes thereto.
(3) Exhibits.The following exhibit index lists exhibits incorporated herein by reference, filed as a part of this annual report on Form 10-K, or furnished as part of this annual report on Form 10-K.
EXHIBIT INDEXExhibit Index
Exhibit | Description of Exhibit | |
2.1 | Agreement and Plan of Merger among the Company, GPMS, Inc., Global Ethanol, LLC and Global Ethanol, Inc. dated September | |
3.1(a) | Second Amended and Restated Articles of Incorporation of the Company (Incorporated by reference to Exhibit 3.1 of the Company’s Current Report on Form 8-K filed October 15, 2008) | |
3.1(b) | Articles of Amendment to Second Amended and Restated Articles of Incorporation of Green Plains Renewable Energy, Inc. (Incorporated by reference to Exhibit 3.1 of the Company’s Current Report on Form 8-K, filed May 9, 2011) | ||
3.2(a) | Amended and Restated Bylaws of the Company (Incorporated by reference to Exhibit 3.2 of the Company’s Current Report on Form 8-K filed on October 15, 2008) | ||
3.2(b) | First Amendment to the Amended and Restated Bylaws of the Company (Incorporated by reference to Exhibit 99.2 of the Company’s Current Report on Form 8-K filed on March 13, 2009) | ||
4.1 | Shareholders’ Agreement by and among Green Plains Renewable Energy, Inc., each of the investors listed on Schedule A, and each of the existing shareholders and affiliates identified on Schedule B, dated May 7, 2008 (Incorporated by reference to Appendix F of the Company’s Registration Statement on Form S-4/A filed September 4, 2008) | ||
4.2 | Form of Senior Indenture (Incorporated by reference to Exhibit 4.5 of the Company’s Registration Statement on Form S-3/A filed December 30, 2009) | ||
4.3 | Form of Subordinated Indenture (Incorporated by reference to Exhibit 4.6 of the Company’s Registration Statement on Form S-3/A filed December 30, 2009) | ||
4.4 | Indenture relating to the 5.75% Convertible Senior Notes due 2015, dated as of November 3, 2010, between the Company and Wilmington Trust FSB, including the form of Global Note attached as Exhibit A thereto (Incorporated by reference to Exhibit 4.1 to the Company’s Current Report on Form 8-K filed November 3, 2010) | ||
4.5 | Form of Warrant to Purchase Common Stock (Incorporated by reference to Exhibit 4.1 to the Company’s Current Report on Form 8-K filed October 22, 2010) | |
*10.1 | ||
| Amended and Restated Employment Agreement dated October 24, 2008, by and between the Company and Jerry L. Peters (Incorporated by reference to Exhibit 10.1 of the Company’s Current Report on Form 8-K, dated October 28, 2008) | ||
*10.2 | ||
| 2007 Equity Incentive Plan (Incorporated by reference to Appendix A of the Company’s Definitive Proxy Statement filed March 27, 2007) | ||
10.3 | Form of Indemnification Agreement (Incorporated by reference to Exhibit 10.53 of the Company’s Registration Statement on Form S-4/A filed August 1, 2008) | |
* | Employment Agreement with Todd Becker (Incorporated by reference to Exhibit 10.54 of the Company’s Registration Statement on Form S-4/A filed August 1, 2008) | |
* | Amendment No. 1 to Employment Agreement with Todd Becker, dated December 18, 2009. (Incorporated by reference to Exhibit 10.7(b) of the Company’s Annual Report on Form 10-K filed February 24, 2010) | ||
10.5(a)
| Construction/Permanent Mortgage Security Agreement, Assignment of Leases and Rents, Financing Statement and Fixture Filing dated as of February 27, 2007 by Green Plains Bluffton LLC (f/k/a Indiana Bio-Energy, LLC) in favor of AgStar Financial Services, PCA (Incorporated by reference to Exhibit 10.48 of the Company’s Annual Report on Form 10-KT, dated March 31, 2009) | ||
10.5(b) | ||
10.5(c) | First Amendment to | |
10.6(a) | Loan Agreement between City of Bluffton, Indiana and Green Plains Bluffton LLC (f/k/a Indian Bio-Energy, LLC) dates as of March 1, 2007 (Incorporated by reference to Exhibit 10.46 of the Company’s Annual Report on Form 10-KT, dated March 31, 2009) | |
10.6(b) | Indenture of Trust dated as of March 1, 2007 by and between the City of Bluffton, Indiana, Indiana Bio-Energy, LLC (n/k/a Green Plains Bluffton LLC) and U.S. Bank National Association (Incorporated by reference to Exhibit 10.47 of the Company’s Annual Report on Form 10-KT, dated March 31, 2009) | |
10.6(c) | Subordinate Construction/Permanent Mortgage, Security Agreement, Assignment of Leases and Rents, Financing Statement and Fixture Filing dated as of March 1, 2007 between Green Plains Bluffton LLC (f/k/a Indiana Bio-Energy, LLC) and U.S. Bank National Association (Incorporated by reference to Exhibit 10.49 of the Company’s Annual Report on Form 10-KT, dated March 31, 2009) | |
* | Non-Statutory Stock Option Agreement between Steve Bleyl and Green Plains Renewable Energy, Inc. dated October 15, 2008 (Incorporated by reference to Exhibit 10.50 of the Company’s Annual Report on Form 10-KT, dated March 31, 2009) | |
* | Non-Statutory Stock Option Agreement between Edgar Seward and Green Plains Renewable Energy, Inc. dated October 15, 2008 (Incorporated by reference to Exhibit 10.51 of the Company’s Annual Report on Form 10-KT, dated March 31, 2009) | |
* | Non-Statutory Stock Option Agreement between Michael Orgas and Green Plains Renewable Energy, Inc. dated November 1, 2008 (Incorporated by reference to Exhibit 10.52 of the Company’s Annual Report on Form 10-KT, dated March 31, 2009) | |
* | ||
| Employment Agreement by and between Green Plains Renewable Energy, Inc. and Michael C. Orgas dated November 1, 2008 (Incorporated by reference to Exhibit 10.1 of the Company’s Quarterly Report on Form 10-Q filed May 15, 2009) | ||
* | Employment Offer Letter to Edgar Seward dated October 15, 2008 (Incorporated by reference to Exhibit 10.2 of the Company’s Quarterly Report on Form 10-Q filed May 15, 2009) | |
* | ||
| 2009 Equity Incentive Plan (Incorporated by reference to Exhibit 10.1 of the Company’s Current Report on Form 8-K dated May 11, 2009) | ||
* | Form of Stock Option Award Agreement for 2009 Equity Incentive Plan (Incorporated by reference to Exhibit 10.19(b) of the Company’s Annual Report on Form 10-K filed February 24, 2010) | ||
* | Form of Restricted Stock Award Agreement for 2009 Equity Incentive Plan (Incorporated by reference to Exhibit 10.19(c) of the Company’s Annual Report on Form 10-K/A (Amendment No. 1) filed February 25, 2010) | ||
* | Form of Deferred Stock Unit Award Agreement for 2009 Equity Incentive Plan (Incorporated by reference to Exhibit 10.19(d) of the Company’s Annual Report on Form 10-K filed February 24, 2010) | ||
10.13(a) | Credit Agreement by and among Green Plains Ord LLC, Green Plains Holdings LLC, AgStar Financial Services, PCA as Administrative Agent and the Banks named therein, dated July 2, 2009 (Incorporated by reference to Exhibit 10.5 of the Company’s Quarterly Report on Form 10-Q filed August 10, 2009) | ||
10.13(b) | Deed of Trust, Security Agreement, Assignment of Rents and Leases and Fixture Filing by and among Green Plains Ord LLC, Ticor Title Insurance Company and AgStar Financial Services, PCA, dated July 2, 2009 (Incorporated by reference to Exhibit 10.22(b) of the Company’s Annual Report on Form 10-K filed February 24, 2010) | ||
10.13(c) | Security Agreement by and among Green Plains Ord LLC, Green Plains Holdings LLC and AgStar Financial Services, PCA, dated July 2, 2009 (Incorporated by reference to Exhibit 10.22(c) of the Company’s Annual Report on Form 10-K filed February 24, 2010) | |
10.13(d) | Affiliate Security Agreement between Green Plains Central City LLC and AgStar Financial Services, PCA, dated July 2, 2009 (Incorporated by reference to Exhibit 10.22(d) of the Company’s Annual Report on Form 10-K filed February 24, 2010) | |
10.13(e) | Affiliate Deed of Trust, Security Agreement, Assignment of Rents and Leases and Fixture Filing between Green Plains Central City LLC, Ticor Title Insurance Company, and AgStar Financial Services, PCA, dated July 2, 2009 (Incorporated by reference to Exhibit 10.22(e) of the Company’s Annual Report on Form 10-K filed February 24, 2010) | |
10.14(a) | Credit Agreement by and among Green Plains Central City LLC, Green Plains Holdings LLC, AgStar Financial Services, PCA as Administrative Agent, and the Banks named therein, dated July 2, 2009 (Incorporated by reference to Exhibit 10.6 of the Company’s Quarterly Report on Form 10-Q filed August 10, 2009) | |
10.14(b) | Deed of Trust, Security Agreement, Assignment of Rents and Leases and Fixture Filing by and among Green Plains Central City LLC, Ticor Title Insurance Company, and AgStar Financial Services, PCA, dated July 2, 2009 (Incorporated by reference to Exhibit 10.23(b) of the Company’s Annual Report on Form 10-K filed February 24, 2010) | |
10.14(c) | Security Agreement by and among Green Plains Central City LLC, Green Plains Holdings LLC and AgStar Financial Services, PCA, dated July 2, 2009 (Incorporated by reference to Exhibit 10.23(c) of the Company’s Annual Report on Form 10-K filed February 24, 2010) | |
10.14(d) | Affiliate Security Agreement between Green Plains Ord LLC and AgStar Financial Services, PCA, dated July 2, 2009 (Incorporated by reference to Exhibit 10.23(d) of the Company’s Annual Report on Form 10-K filed February 24, 2010) | ||
10.14(e) | Affiliate Deed of Trust, Security Agreement, Assignment of Rents and Leases and Fixture Filing between Green Plains Ord LLC, Ticor Title Insurance Company, and AgStar Financial Services, PCA, dated July 2, 2009 (Incorporated by reference to Exhibit 10.23(e) of the Company’s Annual Report on Form 10-K filed February 24, 2010) | ||
10.14(f) | First Amendment to Credit Agreement by and among Green Plains Central City LLC, Green Plains Holdings LLC, AgStar Financial Services, PCA as Administrative Agent, and the Banks named therein, dated December 31, 2010 (Incorporated by reference to Exhibit 10.23(f) of the Company’s Annual Report on Form 10-K filed March 4, 2011) | ||
10.14(g) | Second Amendment dated June 30, 2011 to the Credit Agreement dated July 2, 2009 by and among Green Plains Central City LLC, Green Plains Holdings LLC, AgStar Financial Services, PCA as Administrative Agent and the Banks named therein (Incorporated by reference to Exhibit 10.5 of the Company’s Quarterly Report on Form 10-Q filed August 3, 2011) | ||
10.14(h) | Third Amendment dated June 30, 2011 to the Credit Agreement dated July 2, 2009 by and among Green Plains Central City LLC, Green Plains Holdings LLC, AgStar Financial Services, PCA as Administrative Agent and the Banks named therein (Incorporated by reference to Exhibit 10.6 of the Company’s Quarterly Report on Form 10-Q filed August 3, 2011) | ||
10.14(i) | First Amendment dated June 30, 2011 to Credit Agreement dated July 2, 2009 by and among Green Plains Ord LLC, Green Plains Holdings LLC, AgStar Financial Services, PCA as Administrative Agent and the Banks named therein (Incorporated by reference to Exhibit 10.7 of the Company’s Quarterly Report on Form 10-Q filed August 3, 2011) | ||
10.14(j) | Second Amendment dated June 30, 2011 to Credit Agreement dated July 2, 2009 by and among Green Plains Ord LLC, Green Plains Holdings LLC, AgStar Financial Services, PCA as Administrative Agent and the Banks named therein (Incorporated by reference to Exhibit 10.8 of the Company’s Quarterly Report on Form 10-Q filed August 3, 2011) | ||
10.15(a) | Amended and Restated Revolving Credit and Security Agreement dated January 21, 2011 by and between PNC Bank, National Association (as Lender and Agent) and Green Plains Trade Group LLC (Incorporated by reference to Exhibit 10.1 of the Company’s Current Report on Form 8-K filed January 27, 2011) | ||
10.15(b) | Amended and Restated Revolving Credit Note dated January 21, 2011 by and among Green Plains Trade Group LLC, the Lenders and PNC Bank, National Association (as Lender and Agent) (Incorporated by reference to Exhibit 10.2 of the Company’s Current Report on Form 8-K filed January 27, 2011) | |
10.15(c) | Revolving Credit Note dated January 21, 2011 by and among Green Plains Trade Group LLC, the Lenders and PNC Bank, National Association (as Lender and Agent) (Incorporated by reference to Exhibit 10.3 of the Company’s Current Report on Form 8-K filed January 27, 2011) | |
10.15(d) | Revolving Credit Note dated January 21, 2011 by and among Green Plains Trade Group LLC, the Lenders and PNC Bank, National Association (as Lender and Agent) (Incorporated by reference to Exhibit 10.4 of the Company’s Current Report on Form 8-K filed January 27, 2011) | |
* | Short-Term Incentive Plan (Incorporated by reference to Exhibit 10.1 of the Company’s Current Report on Form 8-K filed January 27, 2010) | |
* | Director Compensation effective January 1, 2009 (Incorporated by reference to Exhibit 10.26 of the Company’s Annual Report on Form 10-K filed February 24, 2010) | |
10.18 | Asset Purchase Agreement dated as of April 19, 2010 by and among Green Plains Grain Company TN LLC, as the Buyer, and Union City Grain Company LLC, Dyer Gin Company, Inc. and Thomas W. Wade, Jr. Living Trust dated July 25, 2002, collectively as the Seller, and Wade Gin Company, LLC (Incorporated by reference to Exhibit 10.1 of the Company’s Current Report on Form 8-K filed April 22, 2010) | |
10.19 | Asset Purchase Agreement dated as of April 19, 2010 by and among Green Plains Grain Company TN LLC, as the Buyer, and Farmers Grain of Trenton LLC, Farmers Grain Crop Insurance, LLC and Wilson Street Properties L.L.C., collectively as the Seller (Incorporated by reference to Exhibit 10.2 of the Company’s Current Report on Form 8-K filed April 22, 2010) | |
*10.20 | ||
*10.21 | Employment Agreement dated March 4, 2011 by and between the Company and Carl S. (Steve) Bleyl (Incorporated by reference to Exhibit 10.2 of the Company’s Current Report on Form 8-K, filed March 8, 2011) | |
10.22 | Master Loan Agreement dated June 13, 2011 by and among Green Plains Obion LLC and Farm Credit Services of Mid-America, FLCA (Incorporated by reference to Exhibit 10.12 of the Company’s Quarterly Report on Form 10-Q, filed August 3, 2011) | |
10.23(a) | Master Loan Agreement dated June 20, 2011 by and among Green Plains Superior LLC and Farm Credit Services of America, FLCA (Incorporated by reference to Exhibit 10.9 of the Company’s Quarterly Report on Form 10-Q, filed August 3, 2011) | |
10.23(b) | Term Loan Supplement dated June 20, 2011 by and among Green Plains Superior LLC and Farm Credit Services of America, FLCA (Incorporated by reference to Exhibit 10.10 of the Company’s Quarterly Report on Form 10-Q, filed August 3, 2011) | |
10.23(c) | Revolving Term Loan Supplement dated June 20, 2011 by and among Green Plains Superior LLC and Farm Credit Services of America, FLCA (Incorporated by reference to Exhibit 10.11 of the Company’s Quarterly Report on Form 10-Q, filed August 3, 2011) | |
10.24 | Stock Repurchase Agreement between Greenstar North America Holdings Inc. and Green Plains Renewable Energy. Inc. (Incorporated by reference to Exhibit 10.1 of the Company’s Current Report on Form 8-K, filed September 14, 2011) | |
10.25(a) | Master Loan Agreement, dated September 28, 2011, by and among Green Plains Shenandoah LLC and Farm Credit Services of America, FLCA (Incorporated by reference to Exhibit 10.3 of the Company’s Quarterly Report on Form 10-Q, filed November 1, 2011) | |
10.25(b) | Revolving Term Loan Supplement, dated September 28, 2011, by and among Green Plains Shenandoah LLC and Farm Credit Services of America, FLCA (Incorporated by reference to Exhibit 10.4 of the Company’s Quarterly Report on Form 10-Q, filed November 1, 2011) | |
10.25(c) | Multiple Advance Term Loan Supplement, dated September 28, 2011, by and among Green Plains Shenandoah LLC and Farm Credit Services of America, FLCA (Incorporated by reference to Exhibit 10.5 of the Company’s Quarterly Report on Form 10-Q, filed November 1, 2011) | |
10.26(a) | Credit Agreement dated | |
10.26(b) | ||
10.26(c) | ||
10.26(d) | |||
10.26(e) | |||
10.26(f) | |||
10.26(g) | |||
10.26(h) | |||
10.26(i) | |||
10.26(j) | |||
10.26(k) | |||
10.27(a) | |||
10.27(b) | |||
10.27(c) | ||
10.27(d) | ||
10.27(e) | ||
21.1 | Schedule of Subsidiaries | |
23.1 | Consent of KPMG LLP | |
31.1 | Certification of Chief Executive Officer pursuant to Rule 13a-14(a) and Section 302 of the Sarbanes-Oxley Act of 2002 | |
31.2 | Certification of Chief Financial Officer pursuant to Rule 13a-14(a) and Section 302 of the Sarbanes-Oxley Act of 2002 | |
32.1 | Certification of Chief Executive Officer pursuant to 18 U.S.C. Section 1350, as adopted pursuant to Section 906 of the Sarbanes-Oxley Act of 2002 | |
32.2 | Certification of Chief Financial Officer pursuant to 18 U.S.C. Section 1350, as adopted pursuant to Section 906 of the Sarbanes-Oxley Act of 2002 | |
101 | The following information from Green Plains Renewable Energy, Inc.’s Annual Report on Form 10-K for the annual period ended December 31, 2011, formatted in Extensible Business Reporting Language (XBRL): (i) the Consolidated Balance Sheet, (ii) the Consolidated Statement of Operations, (iii) the Consolidated Statements of Stockholders’ Equity and Comprehensive Income (Loss) (iv) the Consolidated Statement of Cash Flows and (v) the Notes to Consolidated Financial Statements and Financial Statement Schedules (tagged as blocks of text). | |
| * | Represents management compensatory contracts |
Pursuant to the requirements of Section 13 or 15(d) of the Securities Exchange Act of 1934, the registrant has duly caused this report to be signed on its behalf by the undersigned, thereunto duly authorized.
GREEN PLAINS RENEWABLE ENERGY, INC.
(Registrant)
| GREEN PLAINS RENEWABLE ENERGY, INC. | ||||||
| (Registrant) | ||||||
| Date: | By: |
| ||||
| Todd A. Becker | ||||||
| President and Chief Executive Officer | ||||||
| (Principal Executive Officer) | ||||||
Pursuant to the requirements of the Securities Exchange Act of 1934, this report has been signed below by the following persons on behalf of the registrant and in the capacities and on the dates indicated.
Signature | Title | Date | ||||
| President and Chief Executive Officer | |||||
| Todd A. Becker | (Principal Executive Officer) and Director | |||||
| Chief Financial Officer (Principal Financial | February 17, 2012 | ||||
| Jerry L. Peters | Officer and Principal Accounting Officer) | |||||
| Chairman of the Board | |||||
| Wayne B. Hoovestol | ||||||
| Director | |||||
| Jim Anderson | ||||||
| Director | |||||
| Jim Barry | ||||||
| Director | |||||
| James F. Crowley | ||||||
| Director | |||||
| Gordon F. Glade | ||||||
| Director | |||||
| Michael McNicholas | ||||||
| Director | |||||
| Gary R. Parker | ||||||
| Director | |||||
| Brian D. Peterson | ||||||
| Director | |||||
| Alain Treuer | ||||||
Report of Independent Registered Public Accounting Firm
The Board of Directors and Stockholders
Green Plains Renewable Energy, Inc:Inc.:
We have audited the accompanying consolidated balance sheets of Green Plains Renewable Energy, Inc. and subsidiaries (the Company) as of December 31, 20102011 and 2009,2010, and the related consolidated statements of operations, stockholders’ equity and comprehensive income (loss), and cash flows for each of the years then ended.in the three-year period ended December 31, 2011. In connection with our audits of the consolidated financial statements, we also have audited the financial statement schedule listed in the Index in Item 15. These consolidated financial statements and financial statement schedule are the responsibility of the Company’s management. Our responsibility is to express an opinion on these consolidated financial statements and related financial statement schedule based on our audits.
We conducted our audits in accordance with the standards of the Public Company Accounting Oversight Board (United States). Those standards require that we plan and perform the audit to obtain reasonable assurance about whether the financial statements are free of material misstatement. An audit includes examining, on a test basis, evidence supporting the amounts and disclosures in the financial statements. An audit also includes assessing the accounting principles used and significant estimates made by management, as well as evaluating the overall financial statement presentation. We believe that our audits provide a reasonable basis for our opinion.
In our opinion, the consolidated financial statements referred to above present fairly, in all material respects, the financial position of the Company as of December 31, 20102011 and 2009,2010, and the results of its operations and its cash flows for each of the years thenin the three year period ended December 31, 2011 in conformity with U.S. generally accepted accounting principles. Also in our opinion, the related financial statement schedule, when considered in relation to the basic consolidated financial statements taken as a whole, presents fairly, in all material respects, the information set forth therein.
We have also have audited, in accordance with the standards of the Public Company Accounting Oversight Board (United States), the Company’s internal control over financial reporting as of December 31, 2010,2011, based on criteria established inInternal Control – Integrated Frameworkissued by the Committee of Sponsoring Organizations of the Treadway Commission (COSO), and our report dated March 4, 2011,February 17, 2012, expressed an unqualified opinion on the effectiveness of the Company’s internal control over financial reporting.
/s//s/ KPMG LLP
Omaha, Nebraska
March 4, 2011
REPORT OF INDEPENDENT REGISTERED PUBLIC ACCOUNTANTS
To the Board of Directors and Stockholders of Green Plains Renewable Energy, Inc.
We have audited the accompanying consolidated balance sheet of Green Plains Renewable Energy, Inc. (formerly VBV LLC) (the “Company”) as of December 31, 2008, and the related statements of operations, stockholders’ equity / members’ capital and comprehensive income, and cash flows for the nine-month transition period ended December 31, 2008. In connection with our audits of the consolidated financial statements, we also have audited the financial statement schedule as listed in Item 15. The Company’s management is responsible for these financial statements. Our responsibility is to express an opinion on these financial statements based on our audits.
We conducted our audits in accordance with the standards of the Public Company Accounting Oversight Board (United States). Those standards require that we plan and perform the audit to obtain reasonable assurance about whether the financial statements are free of material misstatement. The Company is not required to have, nor were we engaged to perform, an audit of its internal control over financial reporting. Our audit included consideration of internal control over financial reporting as a basis for designing audit procedures that are appropriate in the circumstances, but not for the purpose of expressing an opinion on the effectiveness of the Company’s internal control over financial reporting. Accordingly, we express no such opinion. An audit also includes examining, on a test basis, evidence supporting the amounts and disclosures in the financial statements, assessing the accounting principles used and significant estimates made by management, as well as evaluating the overall financial statement presentation. We believe that our audits provide a reasonable basis for our opinion.
In our opinion, the consolidated financial statements and schedule referred to above present fairly, in all material respects, the financial position of Green Plains Renewable Energy, Inc. as of December 31, 2008, and the results of its operations and its cash flows for the nine-month transition period ended December 31, 2008, in conformity with accounting principles generally accepted in the United States of America.
As discussed in Note 1 to the consolidated financial statements, on October 15, 2008, Green Plains Renewable Energy, Inc. and VBV LLC completed a business combination. For financial reporting purposes, VBV LLC was determined to be the accounting acquirer and the accounting predecessor to the Company. The consolidated financial statements of the Company for the nine-month transition period ended December 31, 2008 include the results of VBV LLC from April 1, 2008 through October 14, 2008, and the consolidated results of the combined entity for the period from October 15, 2008 through December 31, 2008.
/s/ L.L. Bradford & Company, LLC
Las Vegas, Nevada
March 26, 2009, except as to the accounting
for noncontrolling interest as described in
note 2, which is as February 23, 201017, 2012
GREEN PLAINS RENEWABLE ENERGY, INC. AND SUBSIDIARIES
CONSOLIDATED BALANCE SHEETS
(in thousands, except share amounts)
| December 31, | December 31, | |||||||||||||||||||
| 2010 | 2009 | 2011 | 2010 | |||||||||||||||||
| ASSETS | ASSETS | |||||||||||||||||||
Current assets | ||||||||||||||||||||
Cash and cash equivalents | $ | 233,205 | $ | 89,779 | $ | 174,988 | $ | 233,205 | ||||||||||||
Restricted cash | 27,783 | 12,554 | 19,619 | 27,783 | ||||||||||||||||
Accounts receivable, net of allowances of $121 and $119, and including amounts from related parties of $2,520 and $2,311, respectively | 89,170 | 44,637 | ||||||||||||||||||
Accounts receivable, net of allowances of $263 and $121 | 106,198 | 89,170 | ||||||||||||||||||
Inventories | 184,888 | 81,558 | 229,070 | 184,888 | ||||||||||||||||
Prepaid expenses and other | 7,222 | 7,574 | 8,610 | 7,222 | ||||||||||||||||
Deferred tax assets | 8,463 | - | ||||||||||||||||||
Deferred income taxes | 14,828 | 8,463 | ||||||||||||||||||
Deposits | 54,485 | 14,752 | 5,679 | 11,091 | ||||||||||||||||
Derivative financial instruments | 33,557 | 1,592 | 17,428 | 44,864 | ||||||||||||||||
|
| |||||||||||||||||||
Total current assets | 638,773 | 252,446 | 576,420 | 606,686 | ||||||||||||||||
Property and equipment, net | 747,421 | 596,235 | 776,789 | 747,421 | ||||||||||||||||
Investment in unconsolidated subsidiaries | 2,768 | 2,272 | ||||||||||||||||||
Goodwill | 23,125 | 14,543 | 40,877 | 23,125 | ||||||||||||||||
Financing costs and other, net | 17,779 | 12,585 | ||||||||||||||||||
Other assets | 26,742 | 20,547 | ||||||||||||||||||
|
| |||||||||||||||||||
Total assets | $ | 1,429,866 | $ | 878,081 | $ | 1,420,828 | $ | 1,397,779 | ||||||||||||
|
| |||||||||||||||||||
| LIABILITIES AND STOCKHOLDERS’ EQUITY | ||||||||||||||||||||
| LIABILITIES AND STOCKHOLDERS’ EQUITY | ||||||||||||||||||||
Current liabilities | ||||||||||||||||||||
Accounts payable, including amounts to related parties | $ | 155,084 | $ | 70,246 | ||||||||||||||||
Accrued liabilities | 21,200 | 24,052 | ||||||||||||||||||
Accounts payable | $ | 172,328 | $ | 151,112 | ||||||||||||||||
Accrued and other liabilities | 29,825 | 27,742 | ||||||||||||||||||
Unearned revenue | 22,581 | 9,535 | 15,453 | 22,581 | ||||||||||||||||
Derivative financial instruments | 34,657 | 2,109 | ||||||||||||||||||
Short-term borrowings | 69,599 | 89,183 | ||||||||||||||||||
Current maturities of long-term debt | 141,068 | 68,390 | 73,760 | 51,885 | ||||||||||||||||
|
| |||||||||||||||||||
Total current liabilities | 374,590 | 174,332 | 360,965 | 342,503 | ||||||||||||||||
Long-term debt | 527,900 | 388,573 | 493,407 | 527,900 | ||||||||||||||||
Deferred tax liabilities | 25,079 | - | ||||||||||||||||||
Deferred income taxes | 55,970 | 25,079 | ||||||||||||||||||
Other liabilities | 4,655 | 4,468 | 5,129 | 4,655 | ||||||||||||||||
|
| |||||||||||||||||||
Total liabilities | 932,224 | 567,373 | 915,471 | 900,137 | ||||||||||||||||
|
| |||||||||||||||||||
Stockholders’ equity | ||||||||||||||||||||
Common stock, $0.001 par value; 50,000,000 shares authorized; | 36 | 25 | ||||||||||||||||||
Common stock, $0.001 par value; 75,000,000 and 50,000,000 shares authorized; 36,413,611 and 35,793,501 shares issued and 32,913,611 and 35,793,501 shares outstanding, respectively | 36 | 36 | ||||||||||||||||||
Additional paid-in capital | 431,289 | 292,231 | 440,469 | 431,289 | ||||||||||||||||
Retained earnings | 57,343 | 9,331 | 95,761 | 57,343 | ||||||||||||||||
Accumulated other comprehensive loss | (420 | ) | (123 | ) | ||||||||||||||||
Accumulated other comprehensive income (loss) | (2,953 | ) | (420 | ) | ||||||||||||||||
Treasury stock, 3,500,000 and 0 shares, respectively | (28,201 | ) | — | |||||||||||||||||
|
| |||||||||||||||||||
Total Green Plains stockholders’ equity | 488,248 | 301,464 | 505,112 | 488,248 | ||||||||||||||||
Noncontrolling interests | 9,394 | 9,244 | 245 | 9,394 | ||||||||||||||||
|
| |||||||||||||||||||
Total stockholders’ equity | 497,642 | 310,708 | 505,357 | 497,642 | ||||||||||||||||
|
| |||||||||||||||||||
Total liabilities and stockholders’ equity | $ | 1,429,866 | $ | 878,081 | $ | 1,420,828 | $ | 1,397,779 | ||||||||||||
|
| |||||||||||||||||||
See accompanying notes to the consolidated financial statements.
GREEN PLAINS RENEWABLE ENERGY, INC. AND SUBSIDIARIES
CONSOLIDATED STATEMENTS OF OPERATIONS
(in thousands, except per share amounts)
| Year Ended December 31, | ||||||||||||||||||||||||||||||||
| Year Ended December 31, 2010 | Year Ended December 31, 2009 | Nine-Month Transition Period Ended December 31, 2008 | 2011 | 2010 | 2009 | |||||||||||||||||||||||||||
Revenues | $ | 2,132,968 | $ | 1,304,174 | $ | 188,758 | $ | 3,553,712 | $ | 2,133,922 | $ | 1,305,793 | ||||||||||||||||||||
Cost of goods sold | 1,981,396 | 1,221,745 | 175,444 | 3,381,480 | 1,981,396 | 1,221,745 | ||||||||||||||||||||||||||
|
|
| ||||||||||||||||||||||||||||||
Gross profit | 151,572 | 82,429 | 13,314 | 172,232 | 152,526 | 84,048 | ||||||||||||||||||||||||||
Selling, general and administrative expenses | 60,467 | 44,923 | 18,467 | 73,219 | 60,475 | 44,923 | ||||||||||||||||||||||||||
|
|
| ||||||||||||||||||||||||||||||
Operating income (loss) | 91,105 | 37,506 | (5,153 | ) | ||||||||||||||||||||||||||||
Operating income | 99,013 | 92,051 | 39,125 | |||||||||||||||||||||||||||||
|
|
| ||||||||||||||||||||||||||||||
Other income (expense) | ||||||||||||||||||||||||||||||||
Interest income | 313 | 225 | 150 | 310 | 313 | 225 | ||||||||||||||||||||||||||
Interest expense, net of amounts capitalized | (24,668 | ) | (18,049 | ) | (3,933 | ) | ||||||||||||||||||||||||||
Interest expense | (36,645 | ) | (26,144 | ) | (18,827 | ) | ||||||||||||||||||||||||||
Other, net | (699 | ) | 563 | 887 | (779 | ) | (169 | ) | (278 | ) | ||||||||||||||||||||||
|
|
| ||||||||||||||||||||||||||||||
Total other income (expense) | (25,054 | ) | (17,261 | ) | (2,896 | ) | ||||||||||||||||||||||||||
Total other expense | (37,114 | ) | (26,000 | ) | (18,880 | ) | ||||||||||||||||||||||||||
|
|
| ||||||||||||||||||||||||||||||
Income (loss) before income taxes | 66,051 | 20,245 | (8,049 | ) | ||||||||||||||||||||||||||||
Income before income taxes | 61,899 | 66,051 | 20,245 | |||||||||||||||||||||||||||||
Income tax expense | 17,889 | 91 | - | 23,686 | 17,889 | 91 | ||||||||||||||||||||||||||
|
|
| ||||||||||||||||||||||||||||||
Net income (loss) | 48,162 | 20,154 | (8,049 | ) | ||||||||||||||||||||||||||||
Net income | 38,213 | 48,162 | 20,154 | |||||||||||||||||||||||||||||
Net (income) loss attributable to noncontrolling interests | (150 | ) | (364 | ) | 1,152 | 205 | (150 | ) | (364 | ) | ||||||||||||||||||||||
|
|
| ||||||||||||||||||||||||||||||
Net income (loss) attributable to Green Plains | $ | 48,012 | $ | 19,790 | $ | (6,897 | ) | |||||||||||||||||||||||||
Net income attributable to Green Plains | $ | 38,418 | $ | 48,012 | $ | 19,790 | ||||||||||||||||||||||||||
|
|
| ||||||||||||||||||||||||||||||
Earnings (loss) per share: | ||||||||||||||||||||||||||||||||
Income (loss) attributable to Green Plains stockholders - basic | $ | 1.55 | $ | 0.79 | $ | (0.56 | ) | |||||||||||||||||||||||||
Earnings per share: | ||||||||||||||||||||||||||||||||
Income attributable to Green Plains stockholders - basic | $ | 1.09 | $ | 1.55 | $ | 0.79 | ||||||||||||||||||||||||||
|
|
| ||||||||||||||||||||||||||||||
Income (loss) attributable to Green Plains stockholders - diluted | $ | 1.51 | $ | 0.79 | $ | (0.56 | ) | |||||||||||||||||||||||||
Income attributable to Green Plains stockholders - diluted | $ | 1.01 | $ | 1.51 | $ | 0.79 | ||||||||||||||||||||||||||
|
|
| ||||||||||||||||||||||||||||||
Weighted average shares outstanding: | ||||||||||||||||||||||||||||||||
Basic | 31,032 | 24,895 | 12,366 | 35,276 | 31,032 | 24,895 | ||||||||||||||||||||||||||
|
|
| ||||||||||||||||||||||||||||||
Diluted | 32,347 | 25,069 | 12,366 | 41,808 | 32,347 | 25,069 | ||||||||||||||||||||||||||
|
|
| ||||||||||||||||||||||||||||||
See accompanying notes to the consolidated financial statements.
GREEN PLAINS RENEWABLE ENERGY, INC. AND SUBSIDIARIES
CONSOLIDATED STATEMENTS OF STOCKHOLDERS’ EQUITY
AND COMPREHENSIVE INCOME (LOSS)
(in thousands)
| Common Stock | Additional Paid-in Capital | Retained Earnings (Accum. Deficit) | Accum. Other Comp. Gain (Loss) | Total Green Plains Stockholders’ Equity | Non- controlling Interest | Total Stockholders’ Equity | ||||||||||||||||||||||||||||||||||||||||||||||||||||||||||||||||||
| Shares | Amount | |||||||||||||||||||||||||||||||||||||||||||||||||||||||||||||||||||||||
Balance, March 31, 2008 | 7,498 | $ | 7 | $ | 111,541 | $ | (3,562 | ) | $ | - | $ | 107,986 | $ | 1,448 | $ | 109,434 | ||||||||||||||||||||||||||||||||||||||||||||||||||||||||
Net loss | - | - | - | (6,897 | ) | - | (6,897 | ) | (1,152 | ) | (8,049 | ) | ||||||||||||||||||||||||||||||||||||||||||||||||||||||||||||
Unrealized loss on derivatives | - | - | - | - | (298 | ) | (298 | ) | - | (298 | ) | |||||||||||||||||||||||||||||||||||||||||||||||||||||||||||||
Total comprehensive loss | - | - | - | - | - | (7,195 | ) | (1,152 | ) | (8,347 | ) | |||||||||||||||||||||||||||||||||||||||||||||||||||||||||||||
Capital contributions | - | - | 4,484 | - | - | 4,484 | - | 4,484 | ||||||||||||||||||||||||||||||||||||||||||||||||||||||||||||||||
Merger-related equity transactions | ||||||||||||||||||||||||||||||||||||||||||||||||||||||||||||||||||||||||
Historical Green Plains shares | 7,822 | 8 | 78,212 | - | - | 78,220 | - | 78,220 | ||||||||||||||||||||||||||||||||||||||||||||||||||||||||||||||||
Shares issued for IBE | 1,071 | 1 | 10,709 | - | - | 10,710 | - | 10,710 | ||||||||||||||||||||||||||||||||||||||||||||||||||||||||||||||||
Shares issued for EGP | 2,302 | 3 | 23,022 | - | - | 23,025 | - | 23,025 | ||||||||||||||||||||||||||||||||||||||||||||||||||||||||||||||||
Other | (34 | ) | - | (4 | ) | - | - | (4 | ) | - | (4 | ) | ||||||||||||||||||||||||||||||||||||||||||||||||||||||||||||
Investment by related party | 6,000 | 6 | 59,994 | - | - | 60,000 | - | 60,000 | ||||||||||||||||||||||||||||||||||||||||||||||||||||||||||||||||
Stock-based compensation | - | - | 2,463 | - | - | 2,463 | - | 2,463 | ||||||||||||||||||||||||||||||||||||||||||||||||||||||||||||||||
| Common Stock | Additional Paid-in | Retained | Accum. Other Comp. | Treasury Stock | Total Green Plains Stockholders’ | Non- controlling | Total Stockholders’ | |||||||||||||||||||||||||||||||||||||||||||||||||||||||||||||||||
| Shares | Amount | Capital | Earnings | Income (Loss) | Shares | Amount | Equity | Interest | Equity | |||||||||||||||||||||||||||||||||||||||||||||||||||||||||||||||
Balance, December 31, 2008 | 24,659 | 25 | 290,421 | (10,459 | ) | (298 | ) | 279,689 | 296 | 279,985 | 24,659 | $ | 25 | $ | 290,421 | $ | (10,459 | ) | $ | (298 | ) | — | $ | — | $ | 279,689 | $ | 296 | $ | 279,985 | ||||||||||||||||||||||||||||||||||||||||||
Net income | - | - | - | 19,790 | - | 19,790 | 364 | 20,154 | — | — | — | 19,790 | — | — | — | 19,790 | 364 | 20,154 | ||||||||||||||||||||||||||||||||||||||||||||||||||||||
Unrealized gain on derivatives | - | - | - | - | 175 | 175 | - | 175 | — | — | — | — | 175 | — | — | 175 | — | 175 | ||||||||||||||||||||||||||||||||||||||||||||||||||||||
|
|
| ||||||||||||||||||||||||||||||||||||||||||||||||||||||||||||||||||||||
Total comprehensive income | - | - | - | - | - | 19,965 | 364 | 20,329 | — | — | — | — | — | — | — | 19,965 | 364 | 20,329 | ||||||||||||||||||||||||||||||||||||||||||||||||||||||
Stock-based compensation | 65 | - | 1,208 | - | - | 1,208 | - | 1,208 | 65 | — | 1,208 | — | — | — | — | 1,208 | — | 1,208 | ||||||||||||||||||||||||||||||||||||||||||||||||||||||
Stock options exercised | 263 | - | 176 | - | - | 176 | - | 176 | 263 | — | 176 | — | — | — | — | 176 | — | 176 | ||||||||||||||||||||||||||||||||||||||||||||||||||||||
Acquisition | - | - | - | - | - | - | 8,584 | 8,584 | — | — | — | — | — | — | — | — | 8,584 | 8,584 | ||||||||||||||||||||||||||||||||||||||||||||||||||||||
Other | (30 | ) | - | 426 | - | - | 426 | - | 426 | (30 | ) | — | 426 | — | — | — | — | 426 | — | 426 | ||||||||||||||||||||||||||||||||||||||||||||||||||||
|
|
|
|
|
|
|
|
|
| |||||||||||||||||||||||||||||||||||||||||||||||||||||||||||||||
Balance, December 31, 2009 | 24,957 | 25 | 292,231 | 9,331 | (123 | ) | 301,464 | 9,244 | 310,708 | 24,957 | 25 | 292,231 | 9,331 | (123 | ) | — | — | 301,464 | 9,244 | 310,708 | ||||||||||||||||||||||||||||||||||||||||||||||||||||
Net income | - | - | - | 48,012 | - | 48,012 | 150 | 48,162 | — | — | — | 48,012 | — | — | — | 48,012 | 150 | 48,162 | ||||||||||||||||||||||||||||||||||||||||||||||||||||||
Unrealized loss on derivatives | - | - | - | - | (297 | ) | (297 | ) | - | (297 | ) | — | — | — | — | (297 | ) | — | — | (297 | ) | — | (297 | ) | ||||||||||||||||||||||||||||||||||||||||||||||||
|
|
| ||||||||||||||||||||||||||||||||||||||||||||||||||||||||||||||||||||||
Total comprehensive income | - | - | - | - | - | 47,715 | 150 | 47,865 | — | — | — | — | — | — | — | 47,715 | 150 | 47,865 | ||||||||||||||||||||||||||||||||||||||||||||||||||||||
Stock-based compensation | 102 | - | 2,124 | - | - | 2,124 | - | 2,124 | 102 | — | 2,124 | — | — | — | — | 2,124 | — | 2,124 | ||||||||||||||||||||||||||||||||||||||||||||||||||||||
Stock options exercised | 23 | - | 200 | - | - | 200 | - | 200 | 23 | — | 200 | — | — | — | — | 200 | — | 200 | ||||||||||||||||||||||||||||||||||||||||||||||||||||||
Share issuance | 6,325 | 6 | 79,726 | - | - | 79,732 | - | 79,732 | 6,325 | 6 | 79,726 | — | — | — | — | 79,732 | — | 79,732 | ||||||||||||||||||||||||||||||||||||||||||||||||||||||
Acquisition related issuance | 4,386 | 5 | 56,964 | - | - | 56,969 | - | 56,969 | 4,386 | 5 | 56,964 | — | — | — | — | 56,969 | — | 56,969 | ||||||||||||||||||||||||||||||||||||||||||||||||||||||
Other | - | - | 44 | - | - | 44 | - | 44 | — | — | 44 | — | — | — | — | 44 | — | 44 | ||||||||||||||||||||||||||||||||||||||||||||||||||||||
|
|
|
|
|
|
| �� |
|
|
| ||||||||||||||||||||||||||||||||||||||||||||||||||||||||||||||
Balance, December 31, 2010 | 35,793 | $ | 36 | $ | 431,289 | $ | 57,343 | $ | (420 | ) | $ | 488,248 | $ | 9,394 | $ | 497,642 | 35,793 | 36 | 431,289 | 57,343 | (420 | ) | — | — | 488,248 | 9,394 | 497,642 | |||||||||||||||||||||||||||||||||||||||||||||
Net income | — | — | — | 38,418 | — | — | — | 38,418 | (205 | ) | 38,213 | |||||||||||||||||||||||||||||||||||||||||||||||||||||||||||||
Unrealized loss on derivatives, net of tax effect of $1,700 | — | — | — | — | (2,533 | ) | — | — | (2,533 | ) | — | (2,533 | ) | |||||||||||||||||||||||||||||||||||||||||||||||||||||||||||
|
|
| ||||||||||||||||||||||||||||||||||||||||||||||||||||||||||||||||||||||
Total comprehensive income | — | — | — | — | — | — | — | 35,885 | (205 | ) | 35,680 | |||||||||||||||||||||||||||||||||||||||||||||||||||||||||||||
Repurchase of common stock | — | — | — | — | — | 3,500 | (28,201 | ) | (28,201 | ) | — | (28,201 | ) | |||||||||||||||||||||||||||||||||||||||||||||||||||||||||||
Purchase of noncontrolling interest in BlendStar, net of tax | — | — | 5,572 | — | — | — | — | 5,572 | (8,944 | ) | (3,372 | ) | ||||||||||||||||||||||||||||||||||||||||||||||||||||||||||||
Stock-based compensation | 593 | — | 3,429 | — | — | — | — | 3,429 | — | 3,429 | ||||||||||||||||||||||||||||||||||||||||||||||||||||||||||||||
Stock options exercised | 28 | — | 179 | — | — | — | — | 179 | — | 179 | ||||||||||||||||||||||||||||||||||||||||||||||||||||||||||||||
|
|
|
|
|
|
|
|
|
| |||||||||||||||||||||||||||||||||||||||||||||||||||||||||||||||
Balance, December 31, 2011 | 36,414 | $ | 36 | $ | 440,469 | $ | 95,761 | $ | (2,953 | ) | 3,500 | $ | (28,201 | ) | $ | 505,112 | $ | 245 | $ | 505,357 | ||||||||||||||||||||||||||||||||||||||||||||||||||||
|
|
|
|
|
|
|
|
|
| |||||||||||||||||||||||||||||||||||||||||||||||||||||||||||||||
See accompanying notes to the consolidated financial statements.
GREEN PLAINS RENEWABLE ENERGY, INC. AND SUBSIDIARIES
CONSOLIDATEDSTATEMENTS OF CASH FLOWS
(in thousands)
| Year Ended December 31, 2010 | Year Ended December 31, 2009 | Nine-Month Transition Period Ended December 31, 2008 | ||||||||||||||||||
Cash flows from operating activities: | ||||||||||||||||||||
Net income (loss) | $ | 48,162 | $ | 20,154 | $ | (8,049 | ) | |||||||||||||
Adjustments to reconcile net income (loss) to net cash provided (used) by operating activities: | ||||||||||||||||||||
Depreciation and amortization | 38,810 | 29,413 | 4,717 | |||||||||||||||||
Deferred income taxes | 16,520 | - | - | |||||||||||||||||
Stock-based compensation expense | 2,124 | 1,208 | 2,463 | |||||||||||||||||
Undistributed equity in loss of affiliates | 169 | - | - | |||||||||||||||||
Allowance for doubtful accounts | 79 | 55 | 174 | |||||||||||||||||
Changes in operating assets and liabilities: | ||||||||||||||||||||
Accounts receivable | (30,023 | ) | 13,493 | (32,448 | ) | |||||||||||||||
Inventories | (83,497 | ) | (35,724 | ) | 1,726 | |||||||||||||||
Deposits | (39,733 | ) | (2,000 | ) | (12,752 | ) | ||||||||||||||
Unrealized gains on derivative financial instruments | (4,618 | ) | (316 | ) | (10,221 | ) | ||||||||||||||
Prepaid expenses and other assets | 860 | 4,537 | (2,886 | ) | ||||||||||||||||
Accounts payable and accrued liabilities | 74,642 | 18,830 | 13,377 | |||||||||||||||||
Unearned revenues | 13,046 | 5,130 | - | |||||||||||||||||
Noncurrent liabilities | 200 | (1,683 | ) | - | ||||||||||||||||
Noncurrent assets | (1,719 | ) | - | - | ||||||||||||||||
Other | (206 | ) | 330 | (551 | ) | |||||||||||||||
Net cash provided (used) by operating activities | 34,816 | 53,427 | (44,450 | ) | ||||||||||||||||
Cash flows from investing activities: | ||||||||||||||||||||
Purchases of property and equipment | (20,030 | ) | (13,788 | ) | (79,870 | ) | ||||||||||||||
Investment in unconsolidated subsidiaries | (665 | ) | (1,173 | ) | (1,377 | ) | ||||||||||||||
Acquisition of businesses, net of cash acquired | (41,871 | ) | (3,101 | ) | 9,830 | |||||||||||||||
Other | - | 278 | (1,537 | ) | ||||||||||||||||
Net cash used by investing activities | (62,566 | ) | (17,784 | ) | (72,954 | ) | ||||||||||||||
Cash flows from financing activities: | ||||||||||||||||||||
Proceeds from the issuance of debt | 106,956 | 10,405 | 177,189 | |||||||||||||||||
Payments of principal on long-term debt | (50,392 | ) | (29,080 | ) | (77,870 | ) | ||||||||||||||
Proceeds from revolving credit lines | 2,155,361 | 699,976 | 19,445 | |||||||||||||||||
Payment on revolving credit lines | (2,101,203 | ) | (675,984 | ) | (2,142 | ) | ||||||||||||||
Proceeds from exercises of stock options | 200 | 176 | - | |||||||||||||||||
Proceeds from issuance of common stock | 79,732 | - | 60,000 | |||||||||||||||||
Change in restricted cash | (15,229 | ) | (12,323 | ) | 1,624 | |||||||||||||||
(Payments) refunds of loan fees | (4,249 | ) | (1,328 | ) | 914 | |||||||||||||||
Net cash provided (used) by financing activities | 171,176 | (8,158 | ) | 179,160 | ||||||||||||||||
Net change in cash and equivalents | 143,426 | 27,485 | 61,756 | |||||||||||||||||
Cash and cash equivalents, beginning of period | 89,779 | 62,294 | 538 | |||||||||||||||||
Cash and cash equivalents, end of period | $ | 233,205 | $ | 89,779 | $ | 62,294 | ||||||||||||||
Continued on the following page
GREEN PLAINS RENEWABLE ENERGY, INC. AND SUBSIDIARIES
CONSOLIDATED STATEMENTS OF CASH FLOWS
(in thousands)
| Year Ended December 31, | ||||||||||||
| 2011 | 2010 | 2009 | ||||||||||
Cash flows from operating activities: | ||||||||||||
Net income | $ | 38,213 | $ | 48,162 | $ | 20,154 | ||||||
Adjustments to reconcile net income to net cash provided by operating activities: | ||||||||||||
Depreciation and amortization | 50,076 | 37,355 | 28,635 | |||||||||
Amortization of debt issuance costs | 2,449 | 1,476 | 778 | |||||||||
Loss on sale of property and equipment | 106 | — | — | |||||||||
Deferred income taxes | 22,710 | 16,520 | — | |||||||||
Stock-based compensation expense | 3,429 | 2,124 | 1,208 | |||||||||
Undistributed equity in loss of affiliates | 779 | 169 | — | |||||||||
Allowance for doubtful accounts | 142 | 79 | 55 | |||||||||
Changes in operating assets and liabilities before effects of business combinations: | ||||||||||||
Accounts receivable | (17,059 | ) | (30,023 | ) | 13,493 | |||||||
Inventories | (38,837 | ) | (83,497 | ) | (35,724 | ) | ||||||
Deposits | 5,412 | 2,073 | (2,740 | ) | ||||||||
Derivative financial instruments | 26,429 | (46,424 | ) | 424 | ||||||||
Prepaid expenses and other assets | (1,354 | ) | 860 | 4,537 | ||||||||
Accounts payable and accrued liabilities | 23,408 | 74,642 | 18,830 | |||||||||
Unearned revenues | (7,128 | ) | 13,046 | 5,130 | ||||||||
Other | 114 | (1,746 | ) | (1,353 | ) | |||||||
|
|
|
|
|
| |||||||
Net cash provided by operating activities | 108,889 | 34,816 | 53,427 | |||||||||
|
|
|
|
|
| |||||||
Cash flows from investing activities: | ||||||||||||
Purchases of property and equipment | (42,483 | ) | (20,030 | ) | (13,788 | ) | ||||||
Acquisition of businesses, net of cash acquired | (8,115 | ) | (41,871 | ) | (3,101 | ) | ||||||
Other | (3,923 | ) | (665 | ) | (895 | ) | ||||||
|
|
|
|
|
| |||||||
Net cash used by investing activities | (54,521 | ) | (62,566 | ) | (17,784 | ) | ||||||
|
|
|
|
|
| |||||||
Cash flows from financing activities: | ||||||||||||
Proceeds from the issuance of long-term debt | 138,088 | 128,982 | 30,661 | |||||||||
Payments of principal on long-term debt | (206,866 | ) | (75,058 | ) | (37,730 | ) | ||||||
Proceeds from short-term borrowings | 3,525,923 | 2,133,335 | 679,720 | |||||||||
Payments on short-term borrowings | (3,543,798 | ) | (2,076,537 | ) | (667,334 | ) | ||||||
Proceeds from issuance of common stock | — | 79,732 | — | |||||||||
Payments for repurchase of common stock | (28,201 | ) | — | — | ||||||||
Acquisition of noncontrolling interest | (3,125 | ) | — | — | ||||||||
Change in restricted cash | 8,164 | (15,229 | ) | (12,323 | ) | |||||||
Payments of loan fees | (3,648 | ) | (4,249 | ) | (1,328 | ) | ||||||
Other | 878 | 200 | 176 | |||||||||
|
|
|
|
|
| |||||||
Net cash provided (used) by financing activities | (112,585 | ) | 171,176 | (8,158 | ) | |||||||
|
|
|
|
|
| |||||||
Net change in cash and equivalents | (58,217 | ) | 143,426 | 27,485 | ||||||||
Cash and cash equivalents, beginning of period | 233,205 | 89,779 | 62,294 | |||||||||
|
|
|
|
|
| |||||||
Cash and cash equivalents, end of period | $ | 174,988 | $ | 233,205 | $ | 89,779 | ||||||
|
|
|
|
|
| |||||||
Continued on the following page
F-5
GREEN PLAINS RENEWABLE ENERGY, INC. AND SUBSIDIARIES
CONSOLIDATED STATEMENTS OF CASH FLOWS
(in thousands)
Continued from the previous page
| Year Ended December 31, | ||||||||||||||||||||||||||||||||||||
| Year Ended December 31, 2010 | Year Ended December 31, 2009 | Nine-Month Transition Period Ended December 31, 2008 | 2011 | 2010 | 2009 | |||||||||||||||||||||||||||||||
Supplemental disclosures of cash flow: | ||||||||||||||||||||||||||||||||||||
Cash refunds received for income taxes, | $ | 9 | $ | 167 | $ | - | ||||||||||||||||||||||||||||||
Cash paid for income taxes | $ | 971 | $ | 9 | $ | 167 | ||||||||||||||||||||||||||||||
|
|
| ||||||||||||||||||||||||||||||||||
Cash paid for interest | $ | 25,828 | $ | 13,930 | $ | 3,565 | $ | 35,217 | $ | 25,828 | $ | 13,930 | ||||||||||||||||||||||||
|
|
| ||||||||||||||||||||||||||||||||||
Noncash investing and financing activities: | ||||||||||||||||||||||||||||||||||||
Supplemental noncash investing and financing activities: | ||||||||||||||||||||||||||||||||||||
Common stock issued for merger and acquisition activities | $ | 56,969 | $ | - | $ | 78,220 | $ | — | $ | 56,969 | $ | — | ||||||||||||||||||||||||
|
|
| ||||||||||||||||||||||||||||||||||
Noncash additions to property and equipment: | ||||||||||||||||||||||||||||||||||||
Property and equipment acquired in acquisitions | $ | 169,384 | $ | 116,515 | $ | 179,401 | ||||||||||||||||||||||||||||||
Capital lease obligations incurred for equipment | 196 | 852 | - | |||||||||||||||||||||||||||||||||
Total noncash additions to property and equipment | $ | 169,580 | $ | 117,367 | $ | 179,401 | ||||||||||||||||||||||||||||||
Supplemental noncash investing and financing activities: | ||||||||||||||||||||||||||||||||||||
Assets acquired in acquisitions and mergers | $ | 273,462 | $ | 145,900 | $ | 268,035 | $ | 62,686 | $ | 214,299 | $ | 141,001 | ||||||||||||||||||||||||
Less: liabilities assumed | (115,459 | ) | (129,316 | ) | (187,202 | ) | (54,571 | ) | (115,459 | ) | (129,316 | ) | ||||||||||||||||||||||||
|
|
| ||||||||||||||||||||||||||||||||||
Net assets acquired | $ | 158,003 | $ | 16,584 | $ | 80,833 | $ | 8,115 | $ | 98,840 | $ | 11,685 | ||||||||||||||||||||||||
|
|
| ||||||||||||||||||||||||||||||||||
See accompanying notes to the consolidated financial statements.
GREEN PLAINS RENEWABLE ENERGY, INC. AND SUBSIDIARIES
NOTES TO CONSOLIDATED FINANCIAL STATEMENTS
1. BASIS OF PRESENTATION AND DESCRIPTION OF BUSINESS
References to the Company
References to “we,” “us,” “our,” “Green Plains” or the “Company” in the consolidated financial statements and in these notes to the consolidated financial statements refer to Green Plains Renewable Energy, Inc., an Iowa corporation, and its subsidiaries.
Consolidated Financial Statements
The consolidated financial statements include the accounts of the Company, its wholly-owned subsidiaries, and entities which we control.it controls. All significant intercompany balances and transactions have been eliminated on a consolidated basis for reporting purposes. Unconsolidated entities are included in the financial statements on an equity basis.
Use of Estimates in the Preparation of Consolidated Financial Statements
The preparation of consolidated financial statements in conformity with U.S. generally accepted accounting principles, or GAAP, requires management to make certain estimates and assumptions that affect the reported amounts of assets and liabilities and disclosure of contingent assets and liabilities at the date of the consolidated financial statements and the reported amounts of revenues and expenses during the reporting period. Actual results could differ from those estimates.
Reverse Acquisition AccountingReclassifications
VBV LLC and its subsidiaries became wholly-owned subsidiaries of Green Plains Renewable Energy, Inc. pursuantCertain amounts previously reported within the consolidated financial statements have been reclassified to a merger on October 15, 2008. Underconform to the purchase method of accounting in a business combination effected through an exchange of equity interests, the entity that issues the equity interests is generally the acquiring entity. In some business combinations (commonly referred to as reverse acquisitions), however, the acquired entity issues the equity interests.current year presentation. The Company consideredpreviously reported margin deposits required for exchange-traded activity as deposits on the facts and circumstances surrounding the business combination, including the relative ownership and control of the entity by each of the parties subsequent to the merger. Based on a review of these factors, the October 2008 mergerconsolidated balance sheets. The liabilities associated with VBV was accounted forthis exchange-traded activity were previously reported as a reverse acquisition in which Green Plains was considered the acquired company and VBV was considered the acquiring company.
Asderivative financial instrument liability. Since this activity has a result, Green Plains’ assets and liabilities asright of October 15, 2008, the date of the merger closing, have been incorporated into VBV’s balance sheet based on the fair values of the net assets acquired, which equaled the consideration paid for the acquisition. In addition,offset, the Company allocated the acquisition considerationreclassified cash deposits of approximately $43.4 million at December 31, 2010, and derivative liabilities of approximately $32.1 million at December 31, 2010, to individual assets and liabilities including tangible assets andderivative financial assets. Further, the Company’s operating results (post-merger) include VBV’s operating results prior to the date of closing and the results of the combined entity following the closing of the merger. Although VBV was considered the acquiring entity for accounting purposes, the merger was structured so that VBV became a wholly-owned subsidiary of Green Plains Renewable Energy, Inc.
Changeinstruments in Fiscal Year Endcurrent assets.
Effective April 1, 2008, to more closely align our year end with that of the majority of our peer group, we changed our year end from March 31 to December 31.
Description of Business
The Company operates its business within four segments: (1) production of ethanol and distillers grains, collectively referred to as ethanol production, (2) corn oil production, (3) grain warehousing and marketing, as well as sales and related services of agronomy and petroleum products, collectively referred to as agribusiness, and (4) marketing and distribution of Company-produced and third-party ethanol, distillers grains and corn oil, collectively referred to as marketing and distribution. Additionally, the Company is a vertically-integrated producer, marketerpartner in a joint venture that was formed to commercialize advanced photo-bioreactor technologies for the growing and distributorharvesting of ethanol.algal biomass.
Ethanol Production Segment
Green Plains is North America’s fourth largest ethanol producer. The Company has operations throughoutoperates its nine ethanol plants, which have the value chain, beginning upstream with agronomy and grain handling operations, continuing throughcapacity to produce approximately 680740 million gallons per year, or mmgy, of ethanol, production capacity as of December 31, 2010 and ending downstream with ethanol marketing distribution and blending facilities.
Ethanol Production Segment
Our ethanol production segment had the capacity to produce approximately 680 mmgy of ethanol at December 31, 2010. Ourthrough separate wholly-owned operating subsidiaries. The Company’s ethanol plants also produce co-products such as wet, modified wet or dried distillers grains, andas well as corn oil. Processing at full capacity, our plants will consume approximately 245 million bushels of corn and produce approximately 2.0 million tons of distillers grains annually. Ouroil which is included in a separate segment. The Company’s plants use a dry mill process to produce ethanol and co-products. We operate our eightAt capacity, the Company’s plants consume approximately 265 million bushels of corn and produce approximately 2.1 million tons of distillers grains annually.
Corn Oil Production Segment
The Company produces corn oil at all nine of its ethanol plants within the corn oil production segment, which have the capacity to produce approximately 130 million pounds annually. The Company operates its corn oil extraction systems through separateits wholly-owned operating subsidiaries.subsidiary, Green Plains Commodities LLC. The corn oil systems are designed to extract non-edible corn oil from the whole silage process immediately prior to production of distillers grains. Industrial uses for corn oil include feedstock for biodiesel, livestock feed additives, rubber substitutes, rust preventatives, inks, textiles, soaps and insecticides.
Marketing and Distribution Segment
We haveThe Company has an in-house fee-based marketing business, whichGreen Plains Trade Group LLC, that is responsible for the sales, marketing and distribution of all ethanol, distillers grains and corn oil produced at our eightthe Company’s nine ethanol plants. WeThis marketing business also marketmarkets and distributedistributes ethanol for third-party ethanol producers. At capacity, at December 31, 2010, wethe Company would market approximately 680740 mmgy of ethanol from our eight strategically-locatedits nine ethanol plants along with approximately 360260 mmgy from our third-party producers. Additionally, through its wholly-owned subsidiary, BlendStar LLC, the Company holds a majority interest in Blendstar LLC, which operates nine blending or terminaling facilities with approximately 495625 mmgy of total throughput capacity in seven states in the south central United States.U.S. states.
Agribusiness Segment
We operate ourThe Company owns and operates grain handling and storage assets and provides complementary agronomy services to local grain producers through its agribusiness segment, primarily through ourits wholly-owned subsidiary, Green Plains Grain Company LLC, which is a grain and farm supply business withhas three primary operating lines of business: bulk grain, agronomy and petroleum. In addition to storage capacity at the Company’s ethanol plants, Green Plains Grain has 15 grain elevators with approximately 39.1 million bushels of total storage capacity, which supplies a portion of the feedstock for the Company’s ethanol plants; sells fertilizer and other agricultural inputs and provides application services to area producers through its agronomy business; and sells petroleum products including diesel, soydiesel, blended gasoline and propane, primarily to agricultural producers and consumers.
2. SUMMARY OF SIGNIFICANT ACCOUNTING POLICIES
Cash and Cash Equivalents and Restricted Cash
The Company considers short termshort-term highly liquid investments with original maturities of three months or less to be cash equivalents. Cash and cash equivalents as of December 31, 20102011 and 20092010 included bank deposits. The Company also has restricted cash which is comprised of cash restricted as to use for payment towards a revenue bond and cash restricted as to use for payment towards thea revolving credit agreement.
Revenue Recognition
The Company recognizes revenue when all of the following criteria are satisfied: persuasive evidence of an arrangement exists; risk of loss and title transfer to the customer; the price is fixed and determinable; and collectability is reasonably assured.
For sales of ethanol and distillers grains by Green Plains Trade Group, the Company’s fee-based marketing business, revenue is recognized when title to the product and risk of loss transfer to an external customer. Revenues related to our marketing operations for third parties are recorded on a gross basis in the consolidated financial statements as Green Plains Trade takes title to the product and assumes risk of loss. Unearned revenue is reflected on ourthe consolidated balance sheetsheets for goods in transit for which we havethe Company has received payment and title
has not been transferred to the customer. Revenues from Blendstar LLC, a majority-ownedBlendStar’s biofuel terminal operator that offersoperations, which include ethanol transload and splash blending services, are recognized as these services are rendered.
The Company routinely enters into fixed-price, physical-delivery ethanol sales agreements. In certain instances, the Company intends to settle the transaction by open market purchases of ethanol rather than by delivery from its own production. These transactions are reported net as a component of revenues. Revenues also include realized gains and losses on related derivative financial instruments, ineffectiveness on cash flow hedges, and reclassifications of realized gains and losses on effective cash flow hedges from accumulated other comprehensive income (loss).
Sales of agricultural commodities, fertilizers and other similar products are recognized when title to the product and risk of loss transfer to the customer, which is dependent on the agreed upon sales terms with the customer. These sales terms provide for passage of title either at the time shipment is made or at the time the commodity has been delivered to its destination and final weights, grades and settlement prices have been agreed upon with the customer. Shipping and handling costs are presented gross in the statements of operations with amounts billed included in revenues and also as a component of cost of goods sold. Revenues from grain storage are recognized as services are rendered. Revenues related to grain merchandising are presented gross.
Cost of Goods Sold
Cost of goods sold includes costs for direct labor, materials and certain plant overhead costs. Direct labor includes all compensation and related benefits of non-management personnel involved in the operation of ourthe Company’s ethanol plants. Grain purchasing and receiving costs, other than labor costs for grain buyers and scale operators, are also included in cost of goods sold. Direct materials consist of the costs of corn feedstock, denaturant, and process chemicals. Corn feedstock costs include unrealized gains and losses on related derivative financial instruments not designated as cash flow hedges, inbound freight charges, inspection costs and internal transfer costs. Corn feedstock costs also include realized gains and losses on related derivative financial instruments, ineffectiveness on cash flow hedges, and reclassifications of realized gains and losses on effective cash flow hedges from accumulated other comprehensive income (loss). Plant overhead costs primarily consist of plant utilities, plant depreciation and outbound freight charges. Shipping costs incurred directly by us,the Company, including railcar lease costs, are also reflected in cost of goods sold.
The Company uses exchange-traded futures and options contracts to minimize the effects of changes in the prices of agricultural commodities on ourits agribusiness segment’s grain inventories and forward purchase and sales contracts. Exchange-traded futures and options contracts are valued at quoted market prices. Commodity inventories, forward purchase contracts and forward sale contracts in the agribusiness segment are valued at market prices, where available, or other market quotes adjusted for differences, primarily transportation, between the exchange-traded market and the local markets on which the terms of the contracts are based. Changes in the market value of grain inventories, forward purchase and sale contracts, and exchange-traded futures and options contracts in the agribusiness segment, are recognized in earnings as a component of cost of goods sold. These contracts are predominantly settled in cash. The Company is exposed to loss in the event of non-performance by the counter-party to forward purchase and forward sales contracts.
Derivative Financial Instruments
To minimize the risk and the effects of the volatility of commodity price changes primarily related to corn, ethanol and natural gas, and ethanol, the Company uses various derivative financial instruments, including exchange-traded futures, and exchange-traded and over-the-counter options contracts. The Company monitors and manages this exposure as part of ourits overall risk management policy. As such, we seekthe Company seeks to reduce the potentially adverse effects that the volatility of these markets may have on ourits operating results. The Company may take hedging positions in these commodities as one way to mitigate risk. While the Company attempts to link its hedging activities to purchase and sales activities, there are situations where these hedging activities can themselves result in losses.
By using derivatives to hedge exposures to changes in commodity prices, the Company has exposures on these derivatives to credit and market risk. The Company is exposed to credit risk that the counterparty might fail to fulfill its performance obligations under the terms of the derivative contract. The Company minimizes its credit risk by entering into transactions with high quality counterparties, limiting the amount of financial exposure it has with each counterparty and monitoring the financial condition of its counterparties. Market risk is the risk that the value of the financial instrument might be adversely affected by a change in commodity prices or interest rates. The Company manages market risk by incorporating monitoring parameters within ourits risk management strategy that limit the types of derivative instruments and derivative strategies the Company uses, and the degree of market risk that may be undertaken by the use of derivative instruments.
The Company evaluates its contracts that involve physical delivery to determine whether they may be deemed “normal purchases”qualify for the normal purchases or “normal sales” thatnormal sales exemption and are expected to be used or sold over a reasonable period in the normal course of business. Any contracts that do not meet the normal purchase or sales criteria are recorded at fair value with the change in fair value recorded in operating income unless the contracts qualify for, and the Company elects, hedge accounting treatment.
Certain qualifying derivatives within the ethanol production segment are designeddesignated as cash flow hedges. Prior to entering into cash flow hedges the Company evaluates the derivative instrument to ascertain its effectiveness. For cash flow hedges, any ineffectiveness is recognized in current period results, while other unrealized gains and losses are reflected in accumulated other comprehensive income until gains and losses from the underlying hedged transaction are realized. In the event that it becomes probable that a forecasted transaction will not occur, the Company would discontinue cash flow hedge treatment, which would affect earnings. These derivative financial instruments are recognized in other current assets or other current liabilities at fair value.
Concentrations of Credit Risk
In the normal course of business, we arethe Company is exposed to credit risk resulting from the possibility that a loss may occur from the failure of another party to perform according to the terms of a contract. We transactThe Company transacts sales of
ethanol and distillers grains and areis marketing products for third parties, which may result in concentrations of credit risk from a variety of customers, including major integrated oil companies, large independent refiners, petroleum wholesalers, other marketers and jobbers. We areThe Company is also exposed to credit risk resulting from sales of grain to large commercial buyers, including other ethanol plants, which weit continually monitor.monitors. Although payments are typically received within fifteen days of sale for ethanol and distillers grains, wethe Company continually monitormonitors this credit risk exposure. In addition, wethe Company may prepay for or make deposits on undelivered inventories. Concentrations of credit risk with respect to inventory advances are primarily with a few major suppliers of petroleum products and agricultural inputs.
Inventories
Corn to be used in ethanol production, ethanol and distillers grains inventories are stated at the lower of average cost (determined quarterly) or market.
Other grain inventories include readily-marketable physical quantities of grain, forward contracts to buy and sell grain, and exchange traded futures and option contracts (all stated at market value). The futures and options contracts, which are used to hedge the value of both owned grain and forward contracts, are considered derivatives. All agribusiness segment grain inventories are marked to the market price with changes reflected in cost of goods sold. The forward contracts require performance in future periods. Contracts to purchase grain from producers generally relate to the current or future crop years for delivery periods quoted by regulated commodity exchanges. Contracts for the sale of grain to processors or other consumers generally do not extend beyond one year. The terms of contracts for the purchase and sale of grain are consistent with industry standards.
Fertilizer inventories are valued at the lower of cost (first-in, first-out)(weighted average) or market.
Finished goods inventory consists of denatured ethanol and its related co-products and is valued at the lower of cost (first-in, first-out) or market.
Property and Equipment
Property and equipment are stated at cost less accumulated depreciation. Depreciation of these assets is generally computed using the straight-line method over the following estimated useful lives of the assets:
| Years | ||
Plant, buildings and improvements | 10-40 | |
Ethanol production equipment | 15-40 | |
Other machinery and equipment | 5-7 | |
Land | 20 | |
Railroad track and equipment | 20 | |
Computer and software | 3-5 | |
Office furniture and equipment | 5-7 |
Property and equipment is capitalized at cost. Land improvements are capitalized and depreciated. Expenditures for property betterments and renewals are capitalized. Costs of repairs and maintenance are charged to expense as incurred.
WeThe Company periodically evaluateevaluates whether events and circumstances have occurred that may warrant revision of the estimated useful life of ourits fixed assets.
Impairment of Long-Lived Assets
Green Plains’The Company reviews its long-lived assets, currently consistconsisting of property and equipment. The Company reviews long-lived assetsequipment, for impairment whenever events or changes in circumstances indicate that the carrying amount of a long-lived asset may not be recoverable. Recoverability of assets to be held and used is measured by comparison of the carrying amount of an asset to estimated undiscounted future cash flows expected to be generated by the asset. If the carrying amount of an asset exceeds its estimated future cash flows, an impairment charge is recognized in the amount by which the carrying amount of the asset exceeds the fair value of the asset. Significant management judgment is required in determining the fair value of long-lived assets to measure impairment, including projections of future discounted cash flows. No impairment charges were recorded during 2010, 2009 or 2008.for the periods reported.
Goodwill
Goodwill is an asset representing the future economic benefits arising from other assets acquired in a business combination that are not individually identified and separately recognized. The Company has recorded goodwill for business combinations to the extent the purchase price exceeded the fair value of the net identifiable tangible and intangible assets of each acquired company. OurThe Company’s goodwill currently is comprised of amounts relating to ourits acquisitions of Green Plains Ord, Green Plains Central City, and Green Plains Holdings II (Global) as well as our majority interest in Blendstar., Green Plains Otter Tail and BlendStar.
Goodwill is reviewed for impairment at least annually. The goodwill impairment test is a two-step test. Under the first step, the fair value of the reporting unit is compared with its carrying value (including goodwill). If the fair value of the reporting unit is less than its carrying value, an indication of goodwill impairment exists for the reporting unit and the entity must perform step two of the impairment test. Under the second step, an impairment loss is recognized for any excess of the carrying amount of the reporting unit’s goodwill over the implied fair value of that goodwill. The implied fair value of goodwill is determined by allocating the fair value
of the reporting unit in a manner similar to a purchase price allocation and the residual fair value after this allocation is the implied fair value of the reporting unit goodwill. Fair value of the reporting unit is determined using a discounted cash flow analysis. If the fair value of the reporting unit exceeds its carrying value, no further analysis is necessary.
The Company performs its annual impairment review of goodwill at October 1, and when a triggering event occurs between annual impairment tests. No impairment losses were recorded for the periods reported.
Financing Costs
Fees and costs related to securing debt financing are recorded as financing costs. Debt issuance costs are stated at cost and are amortized utilizing the effective interest method for term loans and on a straight-line basis for revolving credit arrangements over the life of the loans.agreements. However, during the periodperiods of construction, amortizationsamortization of such costs wereis capitalized in construction-in-progress.
Noncontrolling Interests
Noncontrolling interests represent the minority partners’ shares of the equity and income of Blendstar and a majority-owned and consolidated subsidiary of Green Plains Grain.Grain at December 31, 2011; and in prior periods also included the minority partners’ share of the equity and income of BlendStar. The Company acquired all remaining noncontrolling interests in BlendStar in 2011. Noncontrolling interests are classified inon the consolidated statements of operations as a part of net income and the accumulated amount of noncontrolling interests are classified inon the consolidated balance sheets as a part of stockholders’ equity.
Selling, General and Administrative Expenses
Selling, general and administrative expenses are primarily general and administrative expenses for employee salaries, incentives and benefits; office expenses; director compensation; and professional fees for accounting, legal, consulting, and investor relations activities; as well as non-plant depreciation and amortization costs.
Environmental Expenditures
Environmental expenditures that pertain to our current operations and relate to future revenue are expensed or capitalized consistent with ourits capitalization policy. Probable liabilities incurred that are reasonably estimable are also expensed or capitalized according to this policy.policy and if material, would be disclosed in the Company’s quarterly and annual filings. Expenditures that result from the remediation of an existing condition caused by past operations and that do not contribute to future revenue are expensed as incurred.
Stock-Based Compensation
The Company recognizes compensation cost using a fair value based method whereby compensation cost is measured at the grant date based on the value of the award and is recognized over the service period, which is usually the vesting period. The Company uses the Black-Scholes pricing model to calculate the fair value of options and warrants issued to both employees and non-employees. Stock issued for compensation is valued using the market price of the stock on the date of the related agreement.
Income Taxes
The provision for income taxes is computed using the asset and liability method, under which deferred tax assets and liabilities are recognized for the expected future tax consequences attributable to temporary differences between the financial reporting carrying amount of existing assets and liabilities and their respective tax bases. Deferred tax assets and liabilities are measured using enacted tax rates expected to apply to taxable income in years in which those temporary differences are expected to be recovered or settled. The effect on deferred tax assets and liabilities of a change in tax rates is recognized in operating results in the period of
enactment. Deferred tax assets are reduced by a valuation allowance when it is more likely than not that some portion or all of the deferred tax assets will not be realized.
The Company recognizes uncertainties in income taxes within the financial statements based on FASB Accounting Standards Codification (ASC) 740. The standard prescribes a process by which the likelihood of a tax position is gauged based upon the technical merits of the position, and then a subsequent measurement relates the maximum benefit and the degree of likelihood to determine the amount of benefit recognized in the financial statements. The Company excludes interest and penalties on tax uncertainties from the computation of income tax expense. These costs are treated as pre-tax expenses.
Business Combinations
The Company accounts for business combinations based on the guidance within ASC 805. ASC 805, which generally requires an acquirer to recognize the identifiable assets acquired, liabilities assumed, contingent purchase consideration and any noncontrolling interest in the acquiree at fair value on the date of acquisition. It also requires an acquirer to recognize as expense most transaction and restructuring costs as incurred, rather than include such items in the cost of the acquired entity.
Recent Accounting Pronouncements
Effective March 31, 2010, weJanuary 1, 2011, the Company adopted the first phase of the amended guidance in the Financial Accounting Standards Board Accounting Standards Codification (ASC)ASC Topic 820,805,Fair Value Measurements and DisclosuresBusiness Combinations, which, if the company completes a business combination during the reporting period, requires usthe Company to disclose pro forma revenue and earnings of the amounts and reasons for significant transfers between Levels 1 and 2 incombined entity as though the fair value hierarchybusiness combinations that occurred during the current period had occurred as well as reasons for any transfers in or out of Level 3.the beginning of the comparable prior annual reporting period. The amended guidance also requires usthe Company to provide fair value measurement disclosures for each classinclude a description of assetsthe nature and liabilities and disclose information about bothamount of material, nonrecurring pro forma adjustments directly attributable to the valuation techniques and inputs used in estimating Level 2 and Level 3 fair value measurements. The adoption of this amendment requires expanded disclosurebusiness combination included in the notes to our consolidated financial statements but does not impact financial results.reported pro forma revenue and earnings.
Effective March 31,January 1, 2011, we will be required to adoptthe Company adopted the second phase of the amended guidance in ASC Topic 820,Fair Value Measurements and Disclosures,which requires usthe Company to disclose information in the reconciliation of recurring Level 3 measurements aboutregarding purchases, sales, issuances and settlements on a gross basis, separatelywith a separate reconciliation for assets and liabilities. The adoptionCompany did not experience an impact from the additional disclosure requirements as the Company does not have any recurring Level 3 measurements.
Effective January 1, 2012, the Company will be required to adopt the third phase of thisamended guidance in ASC Topic 820,Fair Value Measurements and Disclosures.The purpose of the amendment is to achieve common fair value measurement and disclosure requirements by improving comparability of fair value measurements presented and disclosed in financial statements prepared in accordance with GAAP and those prepared in conformity with International Financial Reporting Standards, or IFRS. The amended guidance clarifies the application of existing fair value measurement requirements and requires additional disclosure for Level 3 measurements regarding the sensitivity of fair value to changes in unobservable inputs and any interrelationships between those inputs. The Company currently would not be impacted by the additional disclosure requirements as the Company does not have any recurring Level 3 measurements.
Effective January 1, 2012, the Company will be required to adopt the amended guidance in ASC Topic 220,Comprehensive Income. This accounting standards update, which helps to facilitate the convergence of GAAP and IFRS, is aimed at increasing the prominence of other comprehensive income in the financial statements by eliminating the option to present other comprehensive income in the statement of stockholders’ equity, and requiring that net income and other comprehensive income be presented in either a single continuous statement or in two separate but consecutive statements. This amended guidance will require expanded disclosure inbe implemented retroactively. The Company has determined that the noteschanges to ourthe accounting standards will affect the presentation of consolidated financial statementsinformation but will not impacthave a material effect on the Company’s financial results.position or results of operations.
3. PUBLIC OFFERING OF COMMON STOCK
In March 2010,Effective January 1, 2012, the Company sold approximately 6.3 million newly-issued shareswill be permitted to adopt the amended guidance in ASC Topic 350,Intangibles – Goodwill and Other. The amended guidance permits an entity to first assess qualitative factors to determine whether it is
more likely than not that the fair value of a reporting unit is less than its common stock atcarrying amount as a pricebasis for determining whether it is necessary to perform the two-step goodwill impairment test. The more-likely-than-not threshold is defined as having a likelihood of $13.50 per share, with net proceeds totaling approximately $79.8 million.more than 50 percent. The Company has used and intendsdetermined that the changes to continue to use these proceeds for general corporate purposes and to acquirethe accounting standards will not impact its disclosure or invest in additional facilities, assets or technologies consistent with its growth strategy.reporting requirements.
4.3. ACQUISITIONS
Acquisition of Tennessee Grain ElevatorsOtter Tail
In April 2010,March 2011, the Company acquired agribusiness operations in western Tennessee which include five grain elevatorsan ethanol plant with federally licensed grain storagean expected annual production capacity of 11.760 mmgy and certain other assets near Fergus Falls, Minnesota from Otter Tail Ag Enterprises, LLC, or Otter Tail, for $59.7 million. Consideration included $19.2 million bushels. All of the grain elevators acquired are located within 50 miles of the Company’s Obion, Tennessee ethanol plant. With the addition of these agribusiness assets, the Company operates 13 grain elevators with approximately 31.4indebtedness to MMCDC New Markets Fund II, LLC, valued at $18.8 million, bushels of grain storage capacity. Also acquired were grain and fertilizer inventories and other agribusiness assets. The agribusiness assets were acquired from companies owned by the Thomas W. Wade, Jr. family and from Farmers
Grain of Trenton LLC for consideration totaling approximately $25.7 million, consisting of cash and $3.3$35.0 million in notes tofinancing from a group of nine lenders, led by AgStar Financial Services, with the sellers. The five grain elevators and other assets acquired are owned by Green Plains Grain Company TN LLC, a wholly-owned subsidiary of the Company, and are includedremaining $5.9 million paid in the Company’s agribusiness segment.cash. The operating results of Green Plains Grain in TennesseeOtter Tail have been included in the Company’s consolidated financial statements since April 19, 2010March 24, 2011, providing revenue and operating income of $141.6$33.6 million and $2.4$0.1 million, respectively, for the year ended December 31, 2010.2011.
Amounts of identifiable assets acquired and | Amounts of identifiable assets acquired and | Amounts of identifiable assets acquired and liabilities assumed (in thousands) | ||||||
Inventory | $ | 6,545 | $ | 4,986 | ||||
Other current assets | 1,679 | 738 | ||||||
Property and equipment, net | 19,968 | 51,925 | ||||||
Other noncurrent assets | 21 | |||||||
Current liabilities | (2,537 | ) | (409 | ) | ||||
Other | (138 | ) | ||||||
| ||||||||
Total identifiable net assets | 25,676 | 57,102 | ||||||
Goodwill | 2,600 | |||||||
| ||||||||
Purchase price | $ | 25,676 | $ | 59,702 | ||||
| ||||||||
The amounts above reflect final purchase price allocations. The fair value of real property acquired was determined with the assistance of an independent appraiser. Neither goodwill nor a gain from a bargain purchase was recognized in conjunction withGoodwill related to the acquisition is tax deductible and no contingent assets or liabilities were assumed. The Company has not presented revenue and earningsresults largely from economies of scale expected to be realized in the acquired companies orCompany’s operations.
Consolidated pro forma information (revenue and earnings on a pro forma combined basis) for the year ended December 31, 2010 due to the size of the acquisition.
Upon closing the acquisitions, Green Plains Grain Company LLC and Green Plains Grain Company TN, collectively, Green Plains Grain, simultaneously entered into a second amended and restated secured credit facility, amending the existing Green Plains Grain Company credit agreement. The security for the credit facility includes a first lien on all real estate and working capital of Green Plains Grain. The second amended and restated credit agreement and related documents include base revolving, seasonal, bulge seasonal and term credit commitments totaling $127.0 million.
Acquisition of Global Ethanol, LLC
On October 22, 2010, the Company acquired Global Ethanol, LLC, or Global, pursuant to the merger of a newly formed wholly-owned subsidiary of the Company with Global, with Global as the surviving entity. Global owns two operating ethanol plants which have a combined annual production capacity of approximately 157 million gallons. The Company valued the merger transaction at approximately $174.2 million, including approximately $147.6 million for the ethanol production facilities and the balance in working capital. The value of the transaction includes the assumption of outstanding debt, which totaled approximately $97.7 million at that time. Upon closing, Global was renamed Green Plains Holdings II LLC, or Holdings II. Upon closing of the merger transaction, all outstanding units of Global were exchanged for aggregate consideration consisting of 4,386,027 shares of restricted Company common stock valued at $53.9 million, warrants to purchase 700,000 shares of restricted Company common stock, valued at $3.1 million and $19.5 million in cash. The warrants, recorded as a component of additional paid-in capital, are not transferable, except in certain limited circumstances, and are exercisable for a period of three years from the closing date at a price of $14.00. Upon closing of the merger, Holdings II entered into an amendment to the existing credit agreement. In conjunction with the closing of the merger, the Company contributed $10.0 million of cash equity to Holdings II, $6.0 million of which was utilized to reduce outstanding debt. The operating results of Holdings II have been included in the
Company’s consolidated financial statements since October 22, 2010 providing revenue and operating income, had the acquisition of $81.6 millionthe Otter Tail ethanol plants occurred on January 1, 2010, would have been $3.6 billion and $5.8$99.1 million, respectively, for the year ended December 31, 2010.
Amounts of identifiable assets acquired and | ||||
Inventory | $ | 12,394 | ||
Other current assets | 15,709 | |||
Property and equipment, net | 149,416 | |||
Current liabilities | (11,896 | ) | ||
Total identifiable net assets | 165,623 | |||
Goodwill | 8,582 | |||
Purchase price | $ | 174,205 | ||
The amounts above are preliminary purchase price allocations. The Company expects to finalize the purchase price allocations during the first half of 2011 and it will not materially impact the preliminary amounts shown above. Pro forma revenue and net income, had the acquisition of Holdings II occurred on January 1, 2009, would have been $1.6$2.2 billion and $5.0 million, respectively, for the year ended December 31, 2009 and $2.4 billion and $33.6$92.1 million, respectively, for the year ended December 31, 2010. This unaudited information is based on historical results of operations and in our opinion, is not necessarily indicative of the results that would have been achieved had we operated the entity acquired sinceacquisitions occurred on such dates.date.
5.Acquisition of Remaining Interest in BlendStar
In January 2009, the Company acquired a 51% ownership interest in BlendStar, which operates nine blending and terminaling facilities with approximately 625 mmgy of total throughput capacity in seven states in the south central U.S. On July 19, 2011, the Company acquired the remaining 49% of BlendStar from the noncontrolling holders. BlendStar’s operations are included in the marketing and distribution segment.
4. GOODWILL
Changes in the carrying amount of goodwill attributable to each business segment during the years ended December 31, 20102011 and 20092010 were as follows (in thousands):
| Ethanol Production | Marketing and Distribution | Total | ||||||||||||||||||
Balance, December 31, 2008 | $ | - | $ | - | $ | - | ||||||||||||||
Acquisition of Blendstar | - | 10,598 | 10,598 | |||||||||||||||||
Acquisition of Ord | 1,604 | - | 1,604 | |||||||||||||||||
Acquisition of Central City | 2,341 | - | 2,341 | |||||||||||||||||
Balance, December 31, 2009 | 3,945 | 10,598 | 14,543 | |||||||||||||||||
Acquisition of Global Ethanol | 8,582 | - | 8,582 | |||||||||||||||||
Balance, December 31, 2010 | $ | 12,527 | $ | 10,598 | $ | 23,125 | ||||||||||||||
| Ethanol Production | Marketing and Distribution | Total | ||||||||||
Balance, December 31, 2009 | $ | 3,945 | $ | 10,598 | $ | 14,543 | ||||||
Acquisiton of Global Ethanol | 8,582 | — | 8,582 | |||||||||
|
|
|
|
|
| |||||||
Balance, December 31, 2010 | 12,527 | 10,598 | 23,125 | |||||||||
Adjustment to Global purchase price allocation | 15,152 | — | 15,152 | |||||||||
Acquisition of Otter Tail | 2,600 | — | 2,600 | |||||||||
|
|
|
|
|
| |||||||
Balance, December 31, 2011 | $ | 30,279 | $ | 10,598 | $ | 40,877 | ||||||
|
|
|
|
|
| |||||||
Revisions were made during 2011 to the preliminary purchase price allocation for the acquisition of Global Ethanol. The revisions resulted in a reduction of net property and equipment and an increase in goodwill of $15.2 million. Goodwill related to the acquisition is tax deductible and results largely from economies of scale expected to be realized in the Company’s operations.
6.5. FAIR VALUE DISCLOSURES
The following methods, assumptions and assumptionsvaluation techniques were used in estimating the fair value of the Company’s financial instruments:
Level 1 – Unadjustedunadjusted quoted prices in active markets for identical assets or liabilities that the Company has the ability to access at the measurement date. Level 1 assetsunrealized gains and liabilities include cashlosses on commodity derivatives relate to exchange-traded open trade equity and cash equivalents, deposits on margin accounts and exchange-traded derivative contracts.option values in the Company’s brokerage accounts.
Level 2 – Inputs other than quoted prices included within Level 1—directly or indirectly observable inputs such as quoted prices for similar assets or liabilities in active markets;markets other than quoted prices included within Level 1; quoted prices for identical or similar assets
in markets that are not active; and other inputs that are observable or can be substantially corroborated by observable market data by correlation or other means. Level 2 assets and liabilities include commodityGrain inventories and contracts.held for sale in the agribusiness segment are valued at nearby futures values, plus or minus nearby basis levels.
Level 3 – Unobservableunobservable inputs that are supported by little or no market activity and that are a significant component of the fair value of the assets or liabilities. The Company currently does not have any recurring Level 3 financial instruments.
There have been no changes in valuation techniques and inputs used in measuring fair value. The following tables set forth the Company’s assets and liabilities by level that were accounted for at fair value as of December 31, 20102011 and 20092010 (in thousands):
| Fair Value Measurements at December 31, 2010 | Fair Value Measurements at December 31, 2011 | |||||||||||||||||||||||||||||||||||
| Quoted Prices in Active Markets for Identical Assets (Level 1) | Significant Other Observable Inputs (Level 2) | Total | Quoted Prices in Active Markets for Identical Assets (Level 1) | Significant Other Observable Inputs (Level 2) | Reclassification for Balance Sheet Presentation | Total | ||||||||||||||||||||||||||||||
Assets | ||||||||||||||||||||||||||||||||||||
Cash and cash equivalents | $ | 233,205 | $ | - | $ | 233,205 | $ | 174,988 | $ | — | $ | — | $ | 174,988 | ||||||||||||||||||||||
Restricted cash | 29,983 | - | 29,983 | 21,820 | — | — | 21,820 | |||||||||||||||||||||||||||||
Margin deposits | 43,394 | - | 43,394 | |||||||||||||||||||||||||||||||||
Inventories carried at market | - | 96,916 | 96,916 | — | 112,948 | — | 112,948 | |||||||||||||||||||||||||||||
Unrealized gains on derivatives | 3,303 | 30,663 | 33,966 | 15,710 | 6,010 | (4,292 | ) | 17,428 | ||||||||||||||||||||||||||||
|
|
|
| |||||||||||||||||||||||||||||||||
Total assets measured at fair value | $ | 309,885 | $ | 127,579 | $ | 437,464 | $ | 212,518 | $ | 118,958 | $ | (4,292 | ) | $ | 327,184 | |||||||||||||||||||||
|
|
|
| |||||||||||||||||||||||||||||||||
Liabilities | ||||||||||||||||||||||||||||||||||||
Unrealized losses on derivatives | $ | 32,317 | $ | 2,569 | $ | 34,886 | $ | 2,828 | $ | 5,287 | $ | (2,698 | ) | $ | 5,417 | |||||||||||||||||||||
Margin deposits | 1,594 | — | (1,594 | ) | — | |||||||||||||||||||||||||||||||
Inventory financing arrangements | — | 8,894 | — | 8,894 | ||||||||||||||||||||||||||||||||
Other | 71 | — | — | 71 | ||||||||||||||||||||||||||||||||
|
|
|
| |||||||||||||||||||||||||||||||||
Total liabilities measured at fair value | $ | 32,317 | $ | 2,569 | $ | 34,886 | $ | 4,493 | $ | 14,181 | $ | (4,292 | ) | $ | 14,382 | |||||||||||||||||||||
|
|
|
| |||||||||||||||||||||||||||||||||
| Fair Value Measurements at December 31, 2009 | Fair Value Measurements at December 31, 2010 | |||||||||||||||||||||||||||||||||||
| Quoted Prices in Active Markets for Identical Assets (Level 1) | Significant Other Observable Inputs (Level 2) | Total | Quoted Prices in Active Markets for Identical Assets (Level 1) | Significant Other Observable Inputs (Level 2) | Reclassification for Balance Sheet Presentation | Total | ||||||||||||||||||||||||||||||
Assets | ||||||||||||||||||||||||||||||||||||
Cash and cash equivalents | $ | 89,779 | $ | - | $ | 89,779 | $ | 233,205 | $ | — | $ | — | $ | 233,205 | ||||||||||||||||||||||
Restricted cash | $ | 12,554 | - | $ | 12,554 | 32,183 | — | — | 32,183 | |||||||||||||||||||||||||||
Margin deposits | 1,588 | - | 1,588 | 43,394 | — | (43,394 | ) | — | ||||||||||||||||||||||||||||
Inventories carried at market | - | 25,123 | 25,123 | — | 96,916 | — | 96,916 | |||||||||||||||||||||||||||||
Unrealized gains on derivatives | 1,012 | 778 | 1,790 | 3,303 | 30,663 | 11,307 | 45,273 | |||||||||||||||||||||||||||||
|
|
|
| |||||||||||||||||||||||||||||||||
Total assets measured at fair value | $ | 104,933 | $ | 25,901 | $ | 130,834 | $ | 312,085 | $ | 127,579 | $ | (32,087 | ) | $ | 407,577 | |||||||||||||||||||||
|
|
|
| |||||||||||||||||||||||||||||||||
Liabilities | ||||||||||||||||||||||||||||||||||||
Unrealized losses on derivatives | $ | 1,758 | $ | 370 | $ | 2,128 | $ | 32,317 | $ | 2,569 | $ | (32,087 | ) | $ | 2,799 | |||||||||||||||||||||
|
|
|
| |||||||||||||||||||||||||||||||||
Total liabilities measured at fair value | $ | 1,758 | $ | 370 | $ | 2,128 | $ | 32,317 | $ | 2,569 | $ | (32,087 | ) | $ | 2,799 | |||||||||||||||||||||
|
|
|
| |||||||||||||||||||||||||||||||||
The Company believes the fair value of its debt approximates book value, which is $669.0$636.8 million and $457.0$669.0 million at December 31, 2011 and 2010, respectively. The Company also believes the fair value of its accounts receivable and 2009, respectively.accounts payable approximate book value, which were $106.2 million and $172.3 million, respectively, at December 31, 2011 and $89.2 and $151.1 million, respectively, at December 31, 2010.
Although the Company currently does not have any recurring Level 3 financial measurements, the fair values of the tangible assets and goodwill acquired represent Level 3 measurements and were derived using a combination of the income approach, the market approach and the cost approach as considered appropriate for the specific assets being valued.
7.6. SEGMENT INFORMATION
Company management reviews financial and operating performance in the following threefour separate operating segments: (1) production of ethanol and related distillers grains, collectively referred to as ethanol
production, (2) corn oil production, (3) grain warehousing and marketing, as well as sales and related services of agronomy and petroleum products, collectively referred to as agribusiness, and (3) production and sales of corn oil, along with the(4) marketing and distribution of Company-produced and third-party ethanol, and distillers grains and corn
oil, collectively referred to as marketing and distribution. Selling, general and administrative expenses, primarily consisting of compensation of corporate employees, professional fees and overhead costs not directly related to a specific operating segment, are reflected in the table below as corporate activities. When
In the second quarter of 2011, the Company redefined its operating segments to include corn oil production as a reportable segment. Corn oil production, which the Company initiated in October 2010, was previously reported as a component of the marketing and distribution segment. The Company added the corn oil production segment to reflect the manner in which the Company’s executive management evaluatescurrently manages, allocates resources, and measures performance of its businesses. Prior period segment performance, they review the information provided below, as well as segment earnings before interest, income taxes, noncontrolling interest, depreciation and amortization.results have been reclassified to reflect this change.
During the normal course of business, our segments enterthe Company enters into transactions with one another.between segments. Examples of these intersegment transactions include, but are not limited to, the ethanol production segment selling ethanol to the marketing and distribution segment and the agribusiness segment selling grain to the ethanol production segment. These intersegment activities are recorded by each segment at prices approximating market and treated as if they are third-party transactions. Consequently, these transactions impact segment performance. However, revenues and corresponding costs are eliminated in consolidation and do not impact the Company’s consolidated results.
The following are certain financial data for ourthe Company’s operating segments for the periods indicated (in thousands):
| Year Ended December 31, 2010 | Year Ended December 31, 2009 | Nine-Month Transition Period Ended December 31, 2008 | Year Ended December 31, | |||||||||||||||||||||||||||||
Revenues: | ||||||||||||||||||||||||||||||||
| 2011 | 2010 | 2009 | ||||||||||||||||||||||||||||||
Revenue: | ||||||||||||||||||||||||||||||||
Ethanol production | $ | 1,115,171 | $ | 731,253 | $ | 131,538 | ||||||||||||||||||||||||||
Revenue from external customers | $ | 128,780 | $ | 63,001 | $ | 61,629 | ||||||||||||||||||||||||||
Intersegment revenue | 2,005,141 | 1,052,424 | 669,708 | |||||||||||||||||||||||||||||
|
|
| ||||||||||||||||||||||||||||||
Total segment revenue | 2,133,921 | 1,115,425 | 731,337 | |||||||||||||||||||||||||||||
Corn oil production | ||||||||||||||||||||||||||||||||
Revenue from external customers | 1,466 | 995 | — | |||||||||||||||||||||||||||||
Intersegment revenue | 43,391 | 707 | — | |||||||||||||||||||||||||||||
|
|
| ||||||||||||||||||||||||||||||
Total segment revenue | 44,857 | 1,702 | — | |||||||||||||||||||||||||||||
Agribusiness | ||||||||||||||||||||||||||||||||
Revenue from external customers | 358,968 | 248,619 | 147,890 | |||||||||||||||||||||||||||||
Intersegment revenue | 195,172 | 122,133 | 74,076 | |||||||||||||||||||||||||||||
|
|
| ||||||||||||||||||||||||||||||
Total segment revenue | 554,140 | 370,752 | 221,966 | |||||||||||||||||||||||||||||
Marketing and distribution | ||||||||||||||||||||||||||||||||
Revenue from external customers | 3,064,498 | 1,821,307 | 1,096,274 | |||||||||||||||||||||||||||||
Intersegment revenue | 467 | 293 | — | |||||||||||||||||||||||||||||
|
|
| ||||||||||||||||||||||||||||||
Total segment revenue | 3,064,965 | 1,821,600 | 1,096,274 | |||||||||||||||||||||||||||||
Revenue including intersegment activity | 5,797,883 | 3,309,479 | 2,049,577 | |||||||||||||||||||||||||||||
Intersegment elimination | (2,244,171 | ) | (1,175,557 | ) | (743,784 | ) | ||||||||||||||||||||||||||
|
|
| ||||||||||||||||||||||||||||||
Revenue as reported | $ | 3,553,712 | $ | 2,133,922 | $ | 1,305,793 | ||||||||||||||||||||||||||
|
|
| ||||||||||||||||||||||||||||||
Gross profit: | ||||||||||||||||||||||||||||||||
Ethanol production | $ | 87,010 | $ | 105,079 | $ | 47,825 | ||||||||||||||||||||||||||
Corn oil production | 27,067 | 878 | — | |||||||||||||||||||||||||||||
Agribusiness | 370,284 | 220,615 | 68,785 | 34,749 | 25,199 | 22,561 | ||||||||||||||||||||||||||
Marketing and distribution | 1,822,561 | 1,096,091 | 76,521 | 23,112 | 21,192 | 13,572 | ||||||||||||||||||||||||||
Intersegment eliminations | (1,175,048 | ) | (743,785 | ) | (88,086 | ) | 294 | 178 | 90 | |||||||||||||||||||||||
|
|
| ||||||||||||||||||||||||||||||
| $ | 2,132,968 | $ | 1,304,174 | $ | 188,758 | $ | 172,232 | $ | 152,526 | $ | 84,048 | |||||||||||||||||||||
|
|
| ||||||||||||||||||||||||||||||
Gross profit: | ||||||||||||||||||||||||||||||||
Ethanol production | $ | 105,099 | $ | 49,155 | $ | 5,058 | ||||||||||||||||||||||||||
Agribusiness | 24,707 | 21,210 | 8,555 | |||||||||||||||||||||||||||||
Marketing and distribution | 22,836 | 11,975 | (192 | ) | ||||||||||||||||||||||||||||
Intersegment eliminations | (1,070 | ) | 89 | (107 | ) | |||||||||||||||||||||||||||
| $ | 151,572 | $ | 82,429 | $ | 13,314 | |||||||||||||||||||||||||||
Operating income (loss): | ||||||||||||||||||||||||||||||||
Ethanol production | $ | 93,428 | $ | 40,435 | $ | (2,706 | ) | |||||||||||||||||||||||||
Agribusiness | 5,279 | 7,654 | 5,310 | |||||||||||||||||||||||||||||
Marketing and distribution | 11,170 | 2,761 | (334 | ) | ||||||||||||||||||||||||||||
Corporate activities | (17,712 | ) | (13,429 | ) | (7,324 | ) | ||||||||||||||||||||||||||
Intersegment eliminations | (1,060 | ) | 85 | (99 | ) | |||||||||||||||||||||||||||
| $ | 91,105 | $ | 37,506 | $ | (5,153 | ) | ||||||||||||||||||||||||||
Income (loss) before income taxes | ||||||||||||||||||||||||||||||||
Ethanol production | $ | 73,110 | $ | 14,296 | $ | (10,177 | ) | |||||||||||||||||||||||||
Agribusiness | 2,621 | 4,378 | 4,248 | |||||||||||||||||||||||||||||
Marketing and distribution | 10,697 | 1,679 | (2,719 | ) | ||||||||||||||||||||||||||||
Corporate activities | (18,710 | ) | (191 | ) | 87 | |||||||||||||||||||||||||||
Intersegment eliminations | (1,667 | ) | 83 | 512 | ||||||||||||||||||||||||||||
| $ | 66,051 | $ | 20,245 | $ | (8,049 | ) | ||||||||||||||||||||||||||
| Year Ended December 31, | ||||||||||||||||||||||||||||||||
| 2011 | 2010 | 2009 | ||||||||||||||||||||||||||||||
Operating income: | ||||||||||||||||||||||||||||||||
Ethanol production | $ | 73,242 | $ | 93,410 | $ | 38,778 | ||||||||||||||||||||||||||
Corn oil production | 26,999 | 878 | — | |||||||||||||||||||||||||||||
Agribusiness | 11,721 | 5,614 | 8,847 | |||||||||||||||||||||||||||||
Marketing and distribution | 9,475 | 9,673 | 4,843 | |||||||||||||||||||||||||||||
Intersegment eliminations | 334 | 188 | 85 | |||||||||||||||||||||||||||||
Corporate activities | (22,758 | ) | (17,712 | ) | (13,428 | ) | ||||||||||||||||||||||||||
|
|
| ||||||||||||||||||||||||||||||
| $ | 99,013 | $ | 92,051 | $ | 39,125 | |||||||||||||||||||||||||||
|
|
| ||||||||||||||||||||||||||||||
Income before income taxes | ||||||||||||||||||||||||||||||||
Ethanol production | $ | 49,612 | $ | 72,903 | $ | 22,235 | ||||||||||||||||||||||||||
Corn oil production | 26,998 | 878 | — | |||||||||||||||||||||||||||||
Agribusiness | 6,170 | 2,464 | 7,223 | |||||||||||||||||||||||||||||
Marketing and distribution | 6,760 | 8,330 | 4,323 | |||||||||||||||||||||||||||||
Intersegment eliminations | 334 | 188 | 85 | |||||||||||||||||||||||||||||
Corporate activities | (27,975 | ) | (18,712 | ) | (13,621 | ) | ||||||||||||||||||||||||||
|
|
| ||||||||||||||||||||||||||||||
| $ | 61,899 | $ | 66,051 | $ | 20,245 | |||||||||||||||||||||||||||
| Year Ended December 31, 2010 | Year Ended December 31, 2009 | Nine-Month Transition Period Ended December 31, 2008 |
|
|
| |||||||||||||||||||||||||||
Depreciation and amortization: | ||||||||||||||||||||||||||||||||
Ethanol production | $ | 33,193 | $ | 26,441 | $ | 4,252 | $ | 43,169 | $ | 32,619 | $ | 25,872 | ||||||||||||||||||||
Corn oil production | 859 | 44 | — | |||||||||||||||||||||||||||||
Agribusiness | 3,566 | 2,117 | 400 | 3,975 | 3,070 | 2,009 | ||||||||||||||||||||||||||
Marketing and distribution | 1,736 | 702 | - | 1,623 | 1,383 | 602 | ||||||||||||||||||||||||||
Corporate activities | 336 | 153 | 65 | 450 | 239 | 152 | ||||||||||||||||||||||||||
|
|
| ||||||||||||||||||||||||||||||
| $ | 38,831 | $ | 29,413 | $ | 4,717 | $ | 50,076 | $ | 37,355 | $ | 28,635 | |||||||||||||||||||||
|
|
| ||||||||||||||||||||||||||||||
Interest expense: | ||||||||||||||||||||||||||||||||
Ethanol production | $ | 19,946 | $ | 16,065 | $ | 3,439 | $ | 23,725 | $ | 20,572 | $ | 16,633 | ||||||||||||||||||||
Corn oil production | — | — | — | |||||||||||||||||||||||||||||
Agribusiness | 2,674 | 1,526 | 423 | 5,569 | 3,169 | 1,634 | ||||||||||||||||||||||||||
Marketing and distribution | 1,088 | 445 | 3 | 2,716 | 1,344 | 546 | ||||||||||||||||||||||||||
Intersegement eliminations | (849 | ) | (95 | ) | (22 | ) | ||||||||||||||||||||||||||
Corporate activities | 1,055 | 36 | 68 | 5,484 | 1,154 | 36 | ||||||||||||||||||||||||||
Intersegement eliminations | (95 | ) | (23 | ) | - | |||||||||||||||||||||||||||
|
|
| ||||||||||||||||||||||||||||||
| $ | 24,668 | $ | 18,049 | $ | 3,933 | $ | 36,645 | $ | 26,144 | $ | 18,827 | |||||||||||||||||||||
|
|
| ||||||||||||||||||||||||||||||
Capital expenditures | ||||||||||||||||||||||||||||||||
Capital expenditures: | ||||||||||||||||||||||||||||||||
Ethanol production | $ | 6,763 | $ | 7,449 | $ | 79,559 | $ | 11,416 | $ | 6,763 | $ | 7,449 | ||||||||||||||||||||
Corn oil production | 15,375 | 6,277 | — | |||||||||||||||||||||||||||||
Agribusiness | 4,525 | 955 | 157 | 8,977 | 4,525 | 955 | ||||||||||||||||||||||||||
Marketing and distribution | 8,552 | 4,926 | - | 2,476 | 2,275 | 4,926 | ||||||||||||||||||||||||||
Corporate activities | 190 | 458 | 154 | 4,239 | 190 | 458 | ||||||||||||||||||||||||||
|
|
| ||||||||||||||||||||||||||||||
| $ | 20,030 | $ | 13,788 | $ | 79,870 | $ | 42,483 | $ | 20,030 | $ | 13,788 | |||||||||||||||||||||
|
|
| ||||||||||||||||||||||||||||||
The following are total assets for ourthe Company’s operating segments for the periods indicated (in thousands):
| December 31, | December 31, | |||||||||||||||||||
| 2010 | 2009 | 2011 | 2010 | |||||||||||||||||
Total assets: | ||||||||||||||||||||
Ethanol production | $ | 882,136 | $ | 708,657 | $ | 879,500 | $ | 850,049 | ||||||||||||
Corn oil production | 24,601 | 7,204 | ||||||||||||||||||
Agribusiness | 239,595 | 86,339 | 233,201 | 239,595 | ||||||||||||||||
Marketing and distribution | 176,352 | 68,096 | 181,466 | 169,148 | ||||||||||||||||
Corporate assets | 142,666 | 15,607 | 121,429 | 142,666 | ||||||||||||||||
Intersegement eliminations | (10,883 | ) | (618 | ) | ||||||||||||||||
Intersegment eliminations | (19,369 | ) | (10,883 | ) | ||||||||||||||||
|
| |||||||||||||||||||
| $ | 1,429,866 | $ | 878,081 | $ | 1,420,828 | $ | 1,397,779 | |||||||||||||
|
| |||||||||||||||||||
The following table sets forth revenues by product line for the periods indicated (in thousands):
| Revenues | Year Ended December 31, 2010 | Year Ended December 31, 2009 | Nine-Month Transition Period Ended December 31, 2008 | |||||||||||||||||
Ethanol | $ | 1,692,450 | $ | 1,000,878 | $ | 108,960 | ||||||||||||||
Distillers grains | 179,868 | 146,941 | 28,316 | |||||||||||||||||
Grain | 193,792 | 92,341 | 32,766 | |||||||||||||||||
Agronomy products | 48,881 | 46,792 | 14,966 | |||||||||||||||||
Other | 17,977 | 17,222 | 3,750 | |||||||||||||||||
Total revenues | $ | 2,132,968 | $ | 1,304,174 | $ | 188,758 | ||||||||||||||
Ethanol Distillers grains Corn Oil Grain Agronomy products Other Total revenues Year Ended December 31, Revenues 2011 2010 2009 $ 2,720,918 $ 1,692,450 $ 1,000,878 405,094 179,868 146,941 44,857 1,702 — 290,538 193,792 92,341 61,174 48,881 46,792 31,131 17,229 18,841 $ 3,553,712 $ 2,133,922 $ 1,305,793
8.7. INVENTORIES
Inventories are carried at the lower of cost or market, except grain held for sale, which is valued at market value. The components of inventories are as follows (in thousands):
| December 31, | December 31, | |||||||||||||||||||
| 2010 | 2009 | 2011 | 2010 | |||||||||||||||||
Finished goods | $ | 38,231 | $ | 23,574 | $ | 57,882 | $ | 38,231 | ||||||||||||
Grain held for sale | 96,916 | 25,123 | 112,948 | 96,916 | ||||||||||||||||
Raw materials | 23,306 | 16,323 | 23,215 | 23,306 | ||||||||||||||||
Petroleum & agronomy items held for sale | 9,011 | 8,501 | 14,206 | 9,011 | ||||||||||||||||
Work-in-process | 9,408 | 5,343 | 11,418 | 9,408 | ||||||||||||||||
Supplies and parts | 8,016 | 2,694 | 9,401 | 8,016 | ||||||||||||||||
|
| |||||||||||||||||||
| $ | 184,888 | $ | 81,558 | $ | 229,070 | $ | 184,888 | |||||||||||||
|
| |||||||||||||||||||
9.8. PROPERTY AND EQUIPMENT
The components of property and equipment are as follows (in thousands):
| December 31, | December 31, | |||||||||||||||||||
| 2010 | 2009 | 2011 | 2010 | |||||||||||||||||
Plant equipment | $ | 621,826 | $ | 485,345 | $ | 690,092 | $ | 621,826 | ||||||||||||
Plant, buildings and improvements | 106,550 | 77,951 | 112,895 | 106,550 | ||||||||||||||||
Land and improvements | 51,971 | 34,546 | 53,647 | 51,971 | ||||||||||||||||
Railroad track and equipment | 26,525 | 25,712 | 28,225 | 26,525 | ||||||||||||||||
Construction-in-progress | 7,918 | 4,901 | 5,573 | 7,918 | ||||||||||||||||
Computers and software | 4,038 | 2,586 | 4,688 | 4,038 | ||||||||||||||||
Office furniture and equipment | 1,098 | 897 | 1,716 | 1,098 | ||||||||||||||||
Leasehold improvements and other | 3,558 | 3,027 | 5,751 | 3,558 | ||||||||||||||||
|
| |||||||||||||||||||
Total property and equipment | 823,484 | 634,965 | 902,587 | 823,484 | ||||||||||||||||
Less: accumulated depreciation | (76,063 | ) | (38,730 | ) | (125,798 | ) | (76,063 | ) | ||||||||||||
|
| |||||||||||||||||||
Property and equipment, net | $ | 747,421 | $ | 596,235 | $ | 776,789 | $ | 747,421 | ||||||||||||
|
| |||||||||||||||||||
10.9. DERIVATIVE FINANCIAL INSTRUMENTS
At December 31, 2010,2011, the Company’s consolidated balance sheet reflects asheets reflect unrealized losses, net unrealized loss of $0.4tax, of $3.0 million in accumulated other comprehensive income (loss).loss. The Company expects all of the deferredunrealized losses at December 31, 20102011 will be reclassified into income over the next 12 months as a result of hedged transactions that are forecasted to occur. The amount ultimately realized in income, however, will differ as commodity prices change.
Fair Values of Derivative Instruments
The following table provides information about the fair values of ourthe Company’s derivative financial instruments and the line items inon the consolidated balance sheets in which the fair values are reflected.reflected (in thousands).
| Asset Derivatives | Liability Derivatives | |||||||||||||||||||||||||||||||||||||||||||||||
Derivative Instruments | Fair Value at | Fair Value at | Asset Derivatives Fair Value at December 31, | Liability Derivatives Fair Value at December 31, | ||||||||||||||||||||||||||||||||||||||||||||
Consolidated Balance Sheet | December 31, | December 31, | 2011 | 2010 | 2011 | 2010 | ||||||||||||||||||||||||||||||||||||||||||
| 2010 | 2009 | 2010 | 2009 | |||||||||||||||||||||||||||||||||||||||||||||
Derivative financial instruments (current assets) | $ | 33,557 | (1) | $ | 1,592 | $ | - | $ | - | |||||||||||||||||||||||||||||||||||||||
Derivative financial instruments (1) | $ | 19,022 | (2) | $ | 1,470 | (3) | $ | — | $ | — | ||||||||||||||||||||||||||||||||||||||
Financing costs and other | 409 | 198 | - | - | — | 409 | — | — | ||||||||||||||||||||||||||||||||||||||||
Derivative financial instruments (current liabilities) | - | - | 34,657 | 2,109 | ||||||||||||||||||||||||||||||||||||||||||||
Accrued and other liabilities | — | — | 5,280 | 2,570 | ||||||||||||||||||||||||||||||||||||||||||||
Other liabilities | - | - | 229 | 19 | — | — | 137 | 229 | ||||||||||||||||||||||||||||||||||||||||
|
|
|
| |||||||||||||||||||||||||||||||||||||||||||||
Total | $ | 33,966 | $ | 1,790 | $ | 34,886 | $ | 2,128 | $ | 19,022 | $ | 1,879 | $ | 5,417 | $ | 2,799 | ||||||||||||||||||||||||||||||||
|
|
|
| |||||||||||||||||||||||||||||||||||||||||||||
(1)
| (1) | Derivative financial instruments per the balance sheet include a margin deposit liability of $1.6 million and a margin deposit asset of $43.4 million at December 31, 2011 and 2010, respectively. |
| (2) | Balance at December 31, 2011, includes $12.2 million of net unrealized gains on derivative financial instruments designated as cash flow hedging instruments. |
| (3) | Balance at December 31, 2010, includes $477 thousand of net unrealized gains on derivative financial instruments designated as cash flow hedging instruments. |
Refer toNote 5 - Fair Value Disclosures, which also contains fair value information related to derivative financial instruments designated as cash flow hedging instruments.
Effect of Derivative Instruments on Consolidated Statements of Operations and Consolidated Statements of Stockholders’ Equity and Comprehensive Income
The following tables provide information about the gain or loss recognized in income and other comprehensive income on ourthe Company’s derivative financial instruments and the line items in the financial statements in which such gains and losses are reflected.reflected (in thousands).
Gains (Losses) on Derivative | Year Ended December 31, | Year Ended December 31, | Nine Month Transition Period Ended December 31, | |||||||||||||||||||||
Consolidated Statements of | ||||||||||||||||||||||||
| 2010 | 2009 | 2008 | ||||||||||||||||||||||
Revenue | $ | 2,480 | $ | (6,675 | ) | $ | (940 | ) | ||||||||||||||||
Cost of goods sold | (28,057 | ) | 15,602 | 14,145 | ||||||||||||||||||||
Net increase (decrease) recognized in earnings | $ | (25,577 | ) | $ | 8,927 | $ | 13,205 | |||||||||||||||||
Gains (Losses) Recognized in (Effective Portion) | Year Ended December 31, | Year Ended December 31, | Nine Month Transition Period Ended December 31, | |||||||||||||||||||
| 2010 | 2009 | 2008 | ||||||||||||||||||||
Commodity Contracts | $ | (6,803 | ) | $ | 175 | $ | (298 | ) | ||||||||||||||
Gains (Losses) on Derivative Instruments Not Designated in a Hedging Relationship | Year Ended December 31, | |||||||||||
Consolidated Statements of Operations Location | 2011 | 2010 | 2009 | |||||||||
Revenue | $ | 1,595 | $ | 2,480 | $ | (6,675 | ) | |||||
Cost of goods sold | (35,013 | ) | (28,057 | ) | 15,602 | |||||||
|
|
|
|
|
| |||||||
Net increase (decrease) recognized in earnings | $ | (33,418 | ) | $ | (25,577 | ) | $ | 8,927 | ||||
|
|
|
|
|
| |||||||
Locations of Gain (Loss) Due to Ineffectiveness of Cash Flow Hedges | Year Ended December 31, | |||||||||||
Consolidated Statements of Operations Location | 2011 | 2010 | 2009 | |||||||||
Revenue | $ | (201 | ) | $ | (100 | ) | $ | — | ||||
Cost of goods sold | (30 | ) | 30 | — | ||||||||
|
|
|
|
|
| |||||||
Net decrease recognized in earnings | $ | (231 | ) | $ | (70 | ) | $ | — | ||||
|
|
|
|
|
| |||||||
Location of Gains (Losses) Reclassified from Accumulated Other Comprehensive Income (Loss) into Net Income | Year Ended December 31, | |||||||||||
Consolidated Statements of Operations Location | 2011 | 2010 | 2009 | |||||||||
Revenue | $ | (46,686 | ) | $ | (11,135 | ) | $ | — | ||||
Cost of goods sold | (4,437 | ) | 4,629 | — | ||||||||
|
|
|
|
|
| |||||||
Net decrease recognized in earnings | $ | (51,123 | ) | $ | (6,506 | ) | $ | — | ||||
|
|
|
|
|
| |||||||
Effective Portion of Cash Flow Hedges Recognized in | Year Ended December 31, | |||||||||||
Other Comprehensive Income (Loss) | 2011 | 2010 | 2009 | |||||||||
Commodity Contracts | $ | (55,356 | ) | $ | (6,803 | ) | $ | 175 | ||||
|
|
|
|
|
| |||||||
Gains (Losses) Reclassified from Consolidated Statements of Revenue Cost of goods sold Net decrease recognized in earnings
Accumulated Other Comprehensive
Income (Loss) into Net Income Year Ended
December 31, Year Ended
December 31, Nine Month
Transition
Period Ended
December 31,
Operations Location 2010 2009 2008 $ (11,135 ) $ - $ - 4,629 - - $ (6,506 ) $ - $ -
Ineffectiveness related to the Company’s cash flow hedges resulted in a decrease to earnings of $0.1 million for the year ended December 31, 2010. There were no gains or losses due to the discontinuation of cash flow hedge treatment during the year ended December 31, 2010.
The table below summarizes the volumes of open commodity derivative positions as of December 31, 20102011 (in thousands):
| December 31, 2011 | ||||||||||||||||||||||||||||||||||||||||||||||||||
| Exchange Traded | Non-Exchange Traded | |||||||||||||||||||||||||||||||||||||||||||||||||
Derivative | December 31, 2010 | Net Long & (Short) (1) | Long (2) | (Short) (2) | Unit of Measure | Commodity | ||||||||||||||||||||||||||||||||||||||||||||
| Exchange Traded | Non-Exchange Traded | Unit of Measure | Commodity | |||||||||||||||||||||||||||||||||||||||||||||||
| Net Long & (Short) (1) | Long (2) | (Short) (2) | ||||||||||||||||||||||||||||||||||||||||||||||||
Futures | (28,155 | ) | Bushels | Corn, Soybeans and Wheat | (19,416 | ) | Bushels | Corn, Soybeans and Wheat | ||||||||||||||||||||||||||||||||||||||||||
Futures | 11,115 | (3) | Bushels | Corn | 35 | (3) | Bushels | Corn | ||||||||||||||||||||||||||||||||||||||||||
Futures | (12,907 | ) | Gallons | Ethanol | 9,336 | Gallons | Ethanol | |||||||||||||||||||||||||||||||||||||||||||
Futures | (51,072 | )(3) | Gallons | Ethanol | (34,566 | ) (3) | Gallons | Ethanol | ||||||||||||||||||||||||||||||||||||||||||
Options | 1,933 | Bushels | Corn | (216 | ) | Bushels | Corn | |||||||||||||||||||||||||||||||||||||||||||
Options | (8,722 | ) | Gallons | Ethanol | (2,611 | ) | Gallons | Ethanol | ||||||||||||||||||||||||||||||||||||||||||
Options | 123 | mmBTU | Natural Gas | (8,340 | ) (4) | Pounds | Soybean Oil | |||||||||||||||||||||||||||||||||||||||||||
Forwards | 22,212 | (5,112 | ) | Bushels | Corn, Soybeans and Wheat | 12,274 | (7,236 | ) | Bushels | Corn, Soybeans, Wheat and Milo | ||||||||||||||||||||||||||||||||||||||||
Forwards | 2,310 | (1,890 | ) | Gallons | Ethanol | 11,780 | (257,128 | ) | Gallons | Ethanol | ||||||||||||||||||||||||||||||||||||||||
Forwards | 35 | (24 | ) | Tons | Distillers Grains | 4 | (104 | ) | Tons | Distillers Grains | ||||||||||||||||||||||||||||||||||||||||
(1) Exchange traded futures and options are presented on a net long and (short) position basis. Options are presented on a delta-adjusted basis.
(2) Non-exchange traded forwards are presented on a gross long and (short) position basis.
(3) Futures used for cash flow hedges.
| (1) | Exchange traded futures and options are presented on a net long and (short) position basis. Options are presented on a delta- adjusted basis. |
| (2) | Non-exchange traded forwards are presented on a gross long and (short) position basis. |
| (3) | Futures used for cash flow hedges. |
| (4) | Soybean oil options are used to hedge corn oil. |
Energy trading contracts that do not involve physical delivery are presented net in revenues on the consolidated statements of operations. For the year ended December 31, 2010, gross revenueRevenues and cost of goods sold under such contracts were $30.3 million. Forare summarized in the year ended December 31, 2009, gross revenue and cost of goods sold under such contracts were $122.0 million and $117.2 million, respectively. Fortable below for the nine-month transition period ended December 31, 2008, gross revenue and cost of goods sold under such contracts were $25.0 million and $21.8 million, respectively.periods indicated (in thousands).
Refer toNote 6. Fair Value Disclosures, which also contains fair value information related to derivative financial instruments.
| Year Ended December 31, | ||||||||||||
| 2011 | 2010 | 2009 | ||||||||||
Revenue | $ | 133,619 | $ | 30,252 | $ | 122,018 | ||||||
Cost of goods sold | $ | 132,234 | $ | 30,283 | $ | 117,247 | ||||||
11. LONG-TERM10. DEBT
The principal balances of the components of long-term debt are as follows (in thousands):
| December 31, | ||||||||||||
| 2010 | 2009 | |||||||||||
Green Plains Bluffton: | ||||||||||||
Term loan | $ | 56,000 | $ | 63,000 | ||||||||
Revolving term loan | 20,000 | 20,000 | ||||||||||
Revenue bond | 20,615 | 22,000 | ||||||||||
Green Plains Central City: | ||||||||||||
Term loan | 52,200 | 55,000 | ||||||||||
Revolving term loan | 30,500 | 30,500 | ||||||||||
Revolver | 6,239 | 6,873 | ||||||||||
Equipment financing loan | 230 | 288 | ||||||||||
Green Plains Holdings II: | ||||||||||||
Term loan | 34,136 | - | ||||||||||
Revolving term loan | 42,214 | - | ||||||||||
Revolver | 15,000 | - | ||||||||||
Other | 387 | - | ||||||||||
Green Plains Obion: | ||||||||||||
Term loan | 40,930 | 52,800 | ||||||||||
Revolving term loan | 36,200 | 36,200 | ||||||||||
Revolver | - | 2,600 | ||||||||||
Note payable | 124 | 160 | ||||||||||
Equipment financing loan | 591 | 729 | ||||||||||
Economic development grant | 1,514 | 1,603 | ||||||||||
Green Plains Ord: | ||||||||||||
Term loan | 23,800 | 25,000 | ||||||||||
Revolving term loan | 13,000 | 13,000 | ||||||||||
Revolver | 2,500 | 2,672 | ||||||||||
Green Plains Shenandoah: | ||||||||||||
Term loan | 13,368 | 19,600 | ||||||||||
Revolving term loan | 17,000 | 17,000 | ||||||||||
Revolver | - | 1,581 | ||||||||||
Economic development loan | 45 | 105 | ||||||||||
Green Plains Superior: | ||||||||||||
Term loan | 26,250 | 31,750 | ||||||||||
Revolving term loan | 10,000 | 10,000 | ||||||||||
Equipment financing loan | 219 | 278 | ||||||||||
Green Plains Grain: | ||||||||||||
Term loan | 19,000 | 7,425 | ||||||||||
Revolving term loan | 68,004 | 17,931 | ||||||||||
Equipment financing loans | 915 | 1,262 | ||||||||||
Notes payable | 3,288 | - | ||||||||||
Green Plains Trade: | ||||||||||||
Revolving term loan | 21,179 | 14,455 | ||||||||||
Corporate: | ||||||||||||
Convertible Debt | 90,000 | - | ||||||||||
Other | 3,520 | 3,151 | ||||||||||
Total debt | 668,968 | 456,963 | ||||||||||
Less: current portion | (141,068 | ) | (68,390 | ) | ||||||||
Long-term debt | $ | 527,900 | $ | 388,573 | ||||||||
| December 31, | ||||||||
| 2011 | 2010 | |||||||
Green Plains Bluffton: | ||||||||
$70.0 million term loan | $ | 48,018 | $ | 56,000 | ||||
$20.0 million revolving term loan | 20,000 | 20,000 | ||||||
$22.0 million revenue bond | 19,120 | 20,615 | ||||||
Green Plains Central City: | ||||||||
$55.0 million term loan | 46,558 | 52,200 | ||||||
$30.5 million revolving term loan | 24,739 | 30,500 | ||||||
$11.0 million revolver | — | 6,239 | ||||||
Equipment financing loan | 170 | 230 | ||||||
Green Plains Holdings II: | ||||||||
$34.1 million term loan | 27,914 | 34,136 | ||||||
$42.6 million revolving term loan | 35,679 | 42,214 | ||||||
$15.0 million revolver | 15,000 | 15,000 | ||||||
Other | 194 | 387 | ||||||
Green Plains Obion: | ||||||||
$60.0 million term loan | 25,670 | 40,930 | ||||||
$37.4 million revolving term loan | 36,200 | 36,200 | ||||||
Note payable | 85 | 124 | ||||||
Equipment financing loan | 445 | 591 | ||||||
Economic development grant | 1,424 | 1,514 | ||||||
Green Plains Ord: | ||||||||
$25.0 million term loan | 21,300 | 23,800 | ||||||
$13.0 million revolving term loan | 12,151 | 13,000 | ||||||
$5.0 million revolver | 3,349 | 2,500 | ||||||
Green Plains Otter Tail: | ||||||||
$30.3 million term loan | 27,386 | — | ||||||
$4.7 million revolver | 4,675 | — | ||||||
$19.2 million note payable | 18,883 | — | ||||||
Capital lease payable | 166 | — | ||||||
Green Plains Shenandoah: | ||||||||
$30.0 million term loan | 6,068 | 13,368 | ||||||
$17.0 million revolving term loan | 17,000 | 17,000 | ||||||
Economic development loan | — | 45 | ||||||
Green Plains Superior: | ||||||||
$23.5 million term loan | 20,750 | 26,250 | ||||||
$10.0 million revolving term loan | 10,000 | 10,000 | ||||||
Equipment financing loan | 156 | 219 | ||||||
Continued on the following page
F-22
Continued from the previous page
| December 31, | ||||||||
| 2011 | 2010 | |||||||
Green Plains Grain: | ||||||||
$30.0 million term loan | 27,833 | — | ||||||
$195.0 revolving loan | 27,000 | — | ||||||
$20.0 million term loan | — | 19,000 | ||||||
$100.0 million revolving loan | — | 68,004 | ||||||
Inventory financing arrangements | 8,894 | — | ||||||
Equipment financing loans | 311 | 915 | ||||||
Notes payable | 2,000 | 3,288 | ||||||
Green Plains Trade: | ||||||||
$70.0 million revolving loan | 33,705 | 21,179 | ||||||
Corporate: | ||||||||
$90.0 million convertible notes | 90,000 | 90,000 | ||||||
Note Payable | 1,625 | — | ||||||
Capital Lease | 606 | — | ||||||
Other | 1,692 | 3,520 | ||||||
|
|
|
| |||||
Total debt | 636,766 | 668,968 | ||||||
Less: current portion of long-term debt | (73,760 | ) | (51,885 | ) | ||||
Less: short-term notes payble and other | (69,599 | ) | (89,183 | ) | ||||
|
|
|
| |||||
Long-term debt | $ | 493,407 | $ | 527,900 | ||||
|
|
|
| |||||
Scheduled long-term debt repayments, are as follows (in thousands):
Year Ending December 31, | Amount | Amount | ||||||||||
2011 | $ | 141,068 | ||||||||||
2012 | 54,565 | $ | 143,359 | |||||||||
2013 | 122,627 | 123,703 | ||||||||||
2014 | 42,121 | 42,172 | ||||||||||
2015 | 150,708 | 133,451 | ||||||||||
2016 | 70,255 | |||||||||||
Thereafter | 157,879 | 124,118 | ||||||||||
Debt discount | (292 | ) | ||||||||||
| ||||||||||||
Total | $ | 668,968 | $ | 636,766 | ||||||||
| ||||||||||||
Loan Terminology
Related to loan covenant discussions below, the following definitions generally apply to the Company’s loans (all calculated in accordance with GAAP consistently applied):
| • | Working capital – current assets less current liabilities. |
| • | Net worth – total assets less total liabilities plus subordinated debt. |
| • | Tangible Net worth – total assets less intangible assets less total liabilities plus subordinated debt. |
| • | Tangible owner’s equity ratio – tangible net worth divided by total assets. |
| • | Debt service coverage |
|
| • | Fixed charge coverage |
(1) adjusted EBITDA divided by (2) fixed charges, which are generally the sum of interest expense, scheduled principal payments, distributions, and maintenance capital, within the ethanol production segment.
(1) EBITDA, plus cash equity investments by the parent company, less capital expenditures and interest expense of working capital financings divided by (2) scheduled principal payments and interest expense on long-term indebtedness, within the agribusiness segment.
(1) EBITDA less capital expenditures less distributions less cash taxes, divided by (2) all debt payments for the previous four quarters, on a trailing quarter basis, within the marketing and distribution segment.
| • |
|
| * | Certain credit agreements allow for the inclusion of equity contributions from the parent company in the calculations of the debt service and fixed charge coverage ratios. |
Ethanol Production Segment
Each of the Company’s ethanol production segment subsidiaries has credit facilities with lender groups that provide for term and revolving term loans to finance construction and operation of the production facilities. The Green Plains Bluffton loan is comprised of a $70.0 million amortizing term loan and a $20.0 million revolving term facility (individually and collectively, the “Green Plains Bluffton Loan Agreement”). The Green Plains Central City loan is comprised of a $55.0 million amortizing term loan and a $30.5 million revolving term facility as well as a statused revolving credit supplement (revolver) of up to $11.0 million (individually and collectively, the “Green Plains Central City Loan Agreement”). The Green Plains Holdings II loan is comprised of a $34.1 million amortizing term loan, a $42.6 million revolving term loan and a $15.0 million revolving line of credit loan (individually and collectively, the “Green Plains Holdings II Loan Agreement”) The Green Plains Obion loan is comprised of a $60.0 million amortizing term loan and a revolving term loan of $37.4 million (individually and collectively, the “Green Plains Obion Loan Agreement”). The Green Plains Ord loan is comprised of a $25.0 million amortizing term loan and a $13.0 million revolving term facility as well as a statused revolving credit supplement (revolver) of up to $5.0 million (individually and collectively, the “Green Plains Ord Loan Agreement”). The Green Plains Shenandoah loan is comprised of a $30.0 million amortizing term loan and a $17.0 million revolving term facility (individually and collectively, the “Green Plains Shenandoah Loan Agreement”). The Green Plains Superior loan is comprised of a $40.0 million amortizing term loan and a $10.0 million revolving term facility (individually and collectively, the “Green Plains Superior Loan Agreement”).
Loan Repayment Terms
| • | Term Loans – |
|
Scheduled principal payments are as follows:
| $ | |
| $0.4 million per month | |
• Green Plains Holdings II | $1.5 million per quarter | |
• Green Plains Obion | $2.4 million per quarter | |
| $0.2 million per month | |
• Green Plains Otter Tail | $0.4 million per month | |
• Green Plains Shenandoah | $1.2 million per quarter | |
| $ | |
|
|
Final maturity dates (at the latest) are as follows:
|
| November 19, 2013 | |
| July 1, 2016 | |
| ||
| August 20, 2014 | |
• Green Plains Ord | July 1, 2016 | |
| September 1, 2018 | |
• Green Plains Shenandoah | May 20, | |
| July 20, 2015 | |
|
|
Each term loan, except for the Green Plains Holdings II and Green Plains Otter Tail term loans, has a provision that requires the respective subsidiary to make annual special payments equal to a percentage ranging from 65% to 75% of the available free cash flow from the related entity’s operations (as defined in the respective loan agreements), subject to certain limitations and provided that if such payment would result in a covenant default under the respective loan agreements, the amount of the payment shall be reduced to an amount which would not result in a covenant default.
|
As of December 31, 2011, free cash flow payments are discontinued when the aggregate of such future payments meets the following amounts:
| $15.0 million | |
• Green Plains Central City and Green Plains Ord combined | $16.0 million | |
| $ | |
| $ | |
| $10.0 million |
|
Free cash flow payments currently are not to exceed the following amounts in any given year:
| $4.0 million | |
| $ | |
| $8.0 million | |
| ||
| $2.5 million |
| • | Revolving Term Loans – The revolving term loans are generally available for advances throughout the life of the |
Shenandoah |
|
Final maturity dates (at the latest) are as follows:
| November 19, 2013 | |
| July 1, 2016 | |
| ||
| September 1, 2018 | |
• Green Plains Ord | July 1, 2016 | |
| November 1, | |
| July 1, 2017 | |
|
| • | Revolvers – The revolvers |
Final maturity dates are as follows:
• Green Plains Central City | June 29, 2012 | |
• Green Plains Holdings II | April 30, 2012 | |
• Green Plains Ord | June 29, 2012 | |
• Green Plains Otter Tail | March 23, 2012 |
PricingInterest and Fees
The term loans bear interest at LIBOR plus 3.00% to 4.50% or lender-established prime rates. Some have established a 2% floor on the underlying LIBOR index. The Central City and Ord term loans bear interest at a fixed rate of 5.5% until July 2011. A portion of the Green Plains Holdings II term loan is fixed at 8.22%
The revolving term loans bear interest at LIBOR plus 1.5% to 4.50% or lender-established prime rates. Some have established a 2% floor on the underlying LIBOR index.
The revolver loans for Green Plains Ord and Green Plains Central City bear interest at the greater of LIBOR or 2.0%, plus 4.0%. The revolver loan for Green Plains Holdings II bears interest at LIBOR, plus 4.50% or at lender-established prime rates.
Unused commitment fees, when charged, are 0.25% to 0.75%.
Security
As security for the loans, the lenders received a first-position lien on all personal property and real estate owned by the respective entity borrowing the funds, including an assignment of all contracts and rights pertinent to construction and on-going operations of the plant. These borrowing entities are also required to maintain certain financial and non-financial covenants during the terms of the loans. In addition, the debt facilities within Green Plains Central City and Green Plains Ord loans are cross-collateralized.
Representations, Warranties and Covenants
The loan agreements contain representations, warranties, conditions precedent, affirmative covenants (including financial covenants) and negative covenants including:
Maintenance of working capital, including unused portion of revolver, as follows:
| $12.0 million |
| $10.0 million, combined, excluding current maturities of long-term debt. | |
| $1.0 million (increasing periodically until reaching $7.5 million by March 31, 2013) | |
• Green Plains Obion | $9.0 million | |
| $8.0 million | |
• Green Plains Shenandoah | $6.0 million | |
| $ | |
|
Maintenance of net worth as follows:
| $70.0 million | |
• Green Plains Obion | $90.0 million | |
• Green Plains Shenandoah | $54.0 million | |
• Green Plains Superior | $23.0 million |
Maintenance of tangible net worth as follows:
• Green Plains Bluffton | $82.5 million | |
| $ | |
| ||
| ||
|
Maintenance of tangible owner’s equity as follows:
| at least 50% |
Maintenance of certain annual coverage ratios as follows:
Fixed charge coverage ratios:
| 1.25 to 1.0 | |
| ||
| ||
|
Debt service coverage ratios:
| ||
| 1.25 to 1.0 | |
• Green Plains Shenandoah | 1.25 to 1.0 | |
• Green Plains Superior | 1.25 to 1.0 |
Annual capital expenditures will be limited as follows:
| $ | |
| $ | |
| $ | |
| $ | |
| $ | |
| $5.0 million | |
• Green Plains Shenandoah | $1.3 million | |
• Green Plains Superior | $0.6 million | |
|
Allowable dividends or other annual distributions from each respective subsidiary, subject to certain additional restrictions including compliance with all loan covenants, terms and conditions, are as follows:
| Up to 35% of net profit before tax, and up to an additional 15% of net profit before tax, after free cash flow payment is made |
| ||
| ||
| Up to 40% of net profit before tax, and unlimited after free cash flow payment is made | |
| Up to 40% of net profit before tax, and a reasonable amount may be distributed provided maintenance of 40% tangible owner equity | |
• Green Plains Shenandoah | Up to 40% of net profit before tax and unlimited after free cash flow payment is made | |
• Green Plains Superior | Up to 40% of net profit before tax and unlimited after free cash flow payment is made |
All of the Company’s ethanol production subsidiaries were in compliance with their respective debt covenants or obtained applicable waivers relating to the period endedat December 31, 2010.2011.
Bluffton Revenue Bond
Green Plains Bluffton also received $22.0 million in Subordinate Solid Waste Disposal Facility Revenue Bond funds from the City of Bluffton, Indiana. The revenue bond requires: (1) semi-annual principal and interest payments of approximately $1.5 million during the period commencing on March 1, 2010 through March 1, 2019, and (2) a final principal and interest payment of $3.745 million on September 1, 2019.
The revenue bond bears interest at 7.50% per annum.
At December 31, 2010,2011, Green Plains Bluffton had $2.6$3.2 million of cash that was restricted as to use for payment towards the current maturity and interest of the revenue bond.
Subsequent Amendments
On February 9, 2012, Green Plains Holdings II entered into an amended and restated credit agreement comprised of a $26.4 million amortizing term loan and a $51.1 million revolving term loan. The final maturity dates of the amortizing term loan and revolving term loan are July 1, 2016 and October 1, 2018, respectively. The amended and restated credit agreement requires the Company to maintain certain affirmative and negative covenants including maintaining minimum working capital of $16.0 million (increasing periodically until reaching $22.5 million by March 31, 2013), maintaining minimum net worth of $80.0 million, and limiting annual capital expenditures to $5.0 million in 2012 (increasing to $6.0 million in 2013).
On February 16, 2012, Green Plains Bluffton entered into an amendment of its master loan agreement to decrease the minimum fixed charge coverage ratio, or FCCR, from 1.25 to 1.0 to a ratio of 1.15 to 1.0. The amendment required a $3.0 million capital injection from the parent entity and waives any potential noncompliance related to covenants of Green Plains Bluffton to that date. Without the amendment, the parent entity had the ability and intent to meet the FCCR covenant by injecting the necessary capital into Green Plains Bluffton prior to filing the compliance certificate. The Company believes it will maintain compliance with the FCCR, and all other covenants, related to the Green Plains Bluffton loan agreement going forward.
Agribusiness Segment
The Green Plains Grain loan was modified in April, June and November 2010 and Februaryloans, executed on October 28, 2011, to beare comprised of a $20.0$30.0 million amortizing term loan and a $45.0$195.0 million revolving term loan, a $20.0 million seasonal revolver and a $42.0 million bulge seasonal revolver (individually and collectively, the “Green Plains Grain Loan Agreement”). Loan proceeds are used primarily for working capital purposes.
Key Loan Information
credit facility with various lenders. The term loan expiresand revolving credit facility mature on AugustNovember 1, 2013.2021 and October 28, 2013, respectively.
The revolving$30.0 million amortizing term loan andwas disbursed in an initial advance in the seasonal revolver expireamount of $28.0 million on AugustOctober 31, 2011. The remaining $2.0 million amount may be requested on or before May 1, 2011.
The bulge seasonal revolver is reduced from2012. Equal payments of principal sufficient to amortize the loan in full over a $42 million facility to a $35 million facility on April 1, 2011 and expires June 1, 2011.
Payments of $0.5 million under the term loan15-year period, plus interest, are due on the first business day of each calendar quarter,every month with anythe remaining amount payable at the expiration ofoutstanding balance and all accrued interest due on November 1, 2021, the loan term.
maturity date. The loans bearloan bears interest at three-month LIBOR plus 4.25% on the term loan, LIBOR plus 3.5% on the revolving term loan, and one-month LIBOR plus 3.75% on the seasonal revolver, all subject to an interesta fixed rate floor of 4.5%.
6.00% per annum. As security for the loans,loan, the lender received a first-positionfirst priority lien on certain real estate equipment,and other property owned by the subsidiaries within the agribusiness segment.
The revolving credit facility includes total revolving credit commitments of $195.0 million and an accordion feature whereby amounts available under the facility may be increased by up to $55.0 million of new lender commitments upon agent approval. As security for the revolving credit facility, the lender received a first priority lien on certain cash, inventory, andmachinery, accounts receivable and other assets owned by Green Plains Grain.
Commitment feessubsidiaries of the agribusiness segment. Advances are 0.375%subject to interest charges at a rate per annum equal to the LIBOR rate for the outstanding period plus the applicable margin or a rate per annum equal to the base rate plus the applicable margin. The principal balance of each advance shall be due and payable on the unused portion.respective maturity date but no later than October 28, 2013.
The term loan and revolving credit facility agreements contain certain financial covenants and restrictions, including the following:
MaintenanceThe consolidated total fixed charge coverage ratio shall not at the end of workingany fiscal quarter, for the rolling four fiscal quarters then ending, be less than 1.25 to 1.00.
Working capital shall not be less than $30.0 million as of at least $21.4 million through March 31, 2011, $20.0 million from April 1, 2011 through May 31, 2011 and at least $13.0 million from June 1, 2011 through August 1, 2011.the end of each fiscal quarter.
Maintenance ofThe consolidated long-term indebtedness to consolidated net fixed assets ratio shall not exceed 0.70 to 1.00.
Total tangible net worth shall not be less than $50.0 million, with such minimum amount being increased by an amount equal to 50% of at least $27.0the consolidated net income for each fiscal year, without reduction for losses.
The leverage ratio shall be not greater than 5.5 to 1.0 as of the last day of any fiscal quarter.
Annual capital expenditures are limited to $5.0 million.
Maintenance of a fixed charge ratio of 1.25x or more and a senior leverage ratio that does not exceed 2.50x.
Unfunded capital expenditures for Green Plains Grain are restricted to $2.0 million per year. However, any unused portion from any fiscal year may be added to the limit for the next succeeding year.
Maintenance of year-to-date EBITDAR of at least negative $0.6 million as of March 31, 2011 and $1.2 million as of May 31, 2011.
As of December 31, 2010, Green Plains GrainThe agribusiness segment was in compliance with allits respective debt covenants or obtainedat December 31, 2011.
Inventory Financing Arrangements
On August 15, 2011, the necessary waivers.Company entered into two short-term inventory financing arrangements with a financial institution. Under the terms of the financing agreements, the Company sold quantities of grain totaling $10.0 million, issued warehouse receipts to the financial institution and simultaneously entered into agreements to repurchase the grain in future periods. The agreements mature on January 11, 2012 and February 10, 2012. The Company has accounted for the agreements as short-term notes, rather than sales, and has elected the fair value option to offset fluctuations in market prices of the inventory. At December 31, 2011, grain inventory and the short-term note payable were valued at $8.9 million and were measured using Level 2 inputs.
Equipment Financing Loans
Green Plains Grain has two separate equipment financing agreements with AXIS Capital Inc. initially totaling $1.75 million (individually and collectively, the “Equipment Financing Loans”). The Equipment Financing Loans provide financing for designated vehicles, implements and machinery. Pursuant to the terms of the agreements, Green Plains Grain is required to make 48 monthly principal and interest payments of $43,341,$43 thousand, which commenced in April 2008. SeeNote 17 – Related Party Transactions for further discussion.
Marketing and Distribution Segment
The Green Plains Trade loan is comprised of a senior secured revolving credit facility. Under the creditloan agreement, as amended, the lender will loan up to $30.0$70.0 million, subject to a borrowing base upequal to 85% of eligible receivables and a current availability blockreceivables. The balance is subject to interest charges of $5.0 million. At December 31, 2010 Green Plains Trade had $25.1 million cash that was restricted as to use for payment towards the credit agreement. Such cash is presented in restricted cash on the consolidated balance sheet.
On January 21, 2011, Green Plains Trade entered into an amendment of its revolving term loan, which increases the principal amount of the credit facility from $30.0 million to $70.0 million.
Key Loan Information
The amended revolving credit facility expires on March 31, 2014.
Interest is either: (1) Base Rate (lender’s commercial floating rate plus 2.5%); or, (2) LIBOR plus 3.5%. At December 31, 2011, Green Plains Trade had $18.5 million in cash that was restricted as to use for payment towards the loan agreement. Such cash is presented in restricted cash on the consolidated balance sheets. The amended revolving credit facility expires on March 31, 2014. As of December 31, 2011, Green Plains Trade was in compliance with all debt covenants.
The loan agreement contains certain financial covenants and restrictions, including the following:
Maintenance of a fixed charge coverage ratio not less than 1.15 to 1.0.
Capital expenditures for Green Plains Trade are restricted to $0.5 million per year.
As of December 31, 2010, Green Plains Trade was in compliance with all debt covenants in the loan agreements.
Corporate Activities
In November 2010, the Company issued $90 million of 5.75% Convertible Senior Notes due 2015. The notes represent senior, unsecured obligations of the Company, with interest payable on May 1 and November 1 of each year. The notes may be converted into shares of the Company’s common stock and cash in lieu of fractional shares of the common stock based on a conversion rate initially equal to 69.7788 shares of the common stock per $1,000 principal amount of Notes, which is equal to an initial conversion price of $14.33 per share. The conversion rate is subject to adjustment upon the occurrence of specified events. The Company may redeem for cash all but not less than all, of the Notes at any time on and after November 1, 2013, if the last reported sale price of the Company’s common stock equals or exceeds 140% of the applicable conversion price for a specified time period, at a redemption price equal to 100% of the principal amount of the Notes, plus accrued and unpaid interest. Default by the Company with respect to any loan in excess of $10.0 million constitutes an event of default under the convertible senior notes, which could result in the convertible senior notes being declared due and payable.
Capitalized Interest
The Company had no capitalized interest for years ended December 31, 2011, 2010 and 2009.
Restricted Net Assets
At December 31, 2010,2011, there were approximately $478.0$528.6 million of net assets at the Company’s subsidiaries that were not available to be transferred to the parent company in the form of dividends, loans, or advances due to restrictions contained in the credit facilities of these subsidiaries.
12.11. STOCK-BASED COMPENSATION
The Company records noncash compensation expense related to equity awards to employees and directors payment for employee services by an equity award in our financial statements over the requisite service period. The Company measures share-based compensation grants at fair value on the grant date, adjusted for estimated forfeitures.
The Company has 2007 and 2009 Equity Incentive Plans which reserve a combined total of 2.03.5 million shares of common stock for issuance pursuant to the terms of the plans. The plans provide for the granting of shares of stock, including options to purchase shares of common stock, stock appreciation rights tied to the value of common stock, non-vested stock and non-vested stock unit awards to eligible employees, non-employee directors and consultants. Additionally, outstanding stock options were assumed as partThe Company measures share-based compensation grants at fair value on the grant date, adjusted for estimated forfeitures. The Company records noncash compensation expense related to equity awards in its financial statements over the requisite service period on a straight-line basis. All of the merger.Company’s existing share-based compensation awards have been determined to be equity awards.
Grants under the 2007 and 2009 Equity Incentive Plans may include:
| • | Options – Stock options may be granted that are currently exercisable, that become exercisable in installments, or that are not exercisable until a fixed future date. Certain options that have been issued are exercisable during their term regardless of termination of employment while other options have been issued that terminate at a designated time following the date employment is terminated. Options issued to date may be exercised immediately and/or at future vesting dates, and must be exercised no later than five to eight years after the grant date or they will expire. |
| • | Stock Awards – Stock awards may be granted to directors and |
| • | Deferred Stock Units – Deferred stock units (“DSU”) may be granted to directors and |
For stock options granted during the periods indicated below, the fair value of options granted was estimated on the date of grant using the Black-Scholes option-pricing model, a pricing model acceptable under GAAP, with the following weighted-average assumptions:
| Year Ended December 31, 2010 | Year Ended December 31, 2009 | Year Ended December 31, 2011 | Year Ended December 31, 2010 | Year Ended December 31, 2009 | ||||||||||||||||
Expected life | 6.0 | 6.2 | * | 6.0 | 6.2 | |||||||||||||||
Interest rate | 2.32% | 2.85% | * | 2.32 | % | 2.85 | % | |||||||||||||
Volatility | 63.13% | 67.80% | * | 63.13 | % | 67.80 | % | |||||||||||||
Dividend yield | - | - | * | — | — | |||||||||||||||
| * | The Company did not grant any stock option awards during the year ended December 31, 2011. |
The expected life of options granted represents the period of time in years that options granted are expected to be outstanding. The Company uses a simplified method to estimate the expected life of options due to lack of historical experience. The interest rate represents the annual interest rate a risk-free investment could potentially earn during the expected life of the option grant. In the past, expected volatility was based on historical volatility of our common stock. Expected volatility is based on weighted-average historical volatility of ourthe Company’s common stock and a peer group.
All of the Company’s existing share-based compensation awards have been determined to be equity awards. The Company recognizes compensation costs for stock option awards which vest with the passage of time with only service conditions on a straight-line basis over the requisite service period.
A summary of stock option activity for the years ended December 31, 2010 and 2009 are as follows:
| Shares | Weighted- Average Exercise Price | Weighted- Average Remaining Contractual Term (in years) | Aggregate Intrinsic Value (in thousands) | |||||||||||||||||||||||||
Outstanding at December 31, 2008 | 1,311,528 | $ | 12.59 | |||||||||||||||||||||||||
Granted | 177,500 | 11.11 | ||||||||||||||||||||||||||
Exercised | (263,260 | ) | 0.67 | |||||||||||||||||||||||||
Forfeited | (45,833 | ) | 8.41 | |||||||||||||||||||||||||
Expired | (4,000 | ) | 17.50 | |||||||||||||||||||||||||
Cancelled | (9,336 | ) | 5.99 | |||||||||||||||||||||||||
Outstanding at December 31, 2009 | 1,166,599 | $ | 15.24 | 5.7 | $ | - | ||||||||||||||||||||||
Granted | 61,000 | 14.25 | ||||||||||||||||||||||||||
Exercised | (23,392 | ) | 7.69 | |||||||||||||||||||||||||
Forfeited | (14,750 | ) | 10.99 | |||||||||||||||||||||||||
Expired | (18,957 | ) | 13.19 | |||||||||||||||||||||||||
Outstanding at December 31, 2010 | 1,170,500 | $ | 15.42 | 5.1 | $ | 2,348,877 | ||||||||||||||||||||||
Exercisable at December 31, 2010 | 935,500 | $ | 16.86 | 4.5 | $ | 1,747,430 | ||||||||||||||||||||||
All fully-vested stock options as of December 31, 2010 are exercisable and are included in the above table. The weighted average grant-date fair values of options were $14.25 and $7.23 for the year ended December 31, 2010 and 2009 respectively. No other stock options were exercised before 2009. 2011 is as follows:
| Shares | Weighted- Average Exercise | Weighted- Average Remaining | Aggregate Intrinsic Value (in thousands) | |||||||||||||
Outstanding at December 31, 2010 | 1,170,500 | $ | 15.42 | 5.1 | $ | 2,349 | ||||||||||
Granted | — | $ | — | |||||||||||||
Exercised | (27,499 | ) | 6.51 | $ | 121 | |||||||||||
Forfeited | (13,251 | ) | 11.26 | |||||||||||||
Expired | (7,251 | ) | 17.41 | |||||||||||||
|
| |||||||||||||||
Outstanding at December 31, 2011 | 1,122,499 | $ | 15.68 | 3.8 | $ | 1,374 | ||||||||||
|
|
|
|
|
|
|
| |||||||||
Exercisable at December 31, 2011 (1) | 1,052,249 | $ | 15.89 | 3.5 | $ | 1,360 | ||||||||||
|
|
|
|
|
|
|
| |||||||||
| (1) | Includes in-the-money options totaling 357,499 shares at a weighted-average exercise price of $5.68. |
The Company’s option awards allow employees to exercise options through cash payment to usthe Company for the shares of common stock or through a simultaneous broker-assisted cashless exercise of a share option, through which the employee authorizes the exercise of an option and the immediate sale of the option shares in the open market. The Company uses newly-issued shares of common stock to satisfy ourits share-based payment obligations.
The following table summarizes non-vested stock activity and DSU activity for the year ended December 31, 2010:2011:
| Weighted- Average Number of Non-vested Shares and DSU’s | Weighted- Average Grant- Date Fair Value | Weighted- Average Remaining Vesting Term (in years) | Non-vested Shares and DSU’s | Weighted- Average Grant- Date Fair Value | Weighted- Average Remaining Vesting Term (in years) | |||||||||||||||||||||||||||
Nonvested at December 31, 2009 | 327,256 | $ | 3.04 | |||||||||||||||||||||||||||||
Nonvested at December 31, 2010 | 371,486 | $ | 10.15 | |||||||||||||||||||||||||||||
Granted | 260,118 | 16.18 | 392,056 | 12.01 | ||||||||||||||||||||||||||||
Forfeited | (4,374 | ) | 11.43 | (2,500 | ) | 16.95 | ||||||||||||||||||||||||||
Vested | (215,891 | ) | 6.65 | (275,030 | ) | 9.80 | ||||||||||||||||||||||||||
| ||||||||||||||||||||||||||||||||
Nonvested at December 31, 2011 | 486,012 | $ | 11.81 | 1.8 | ||||||||||||||||||||||||||||
|
|
| ||||||||||||||||||||||||||||||
Nonvested at December 31, 2010 | 367,109 | $ 10.13 | 1.9 | |||||||||||||||||||||||||||||
Compensation costs expensed for share-based payment plans described above were approximately $4.4 million, $2.9 million and $1.6 million for the yearyears ended December 31, 2011, 2010 and 2009, respectively. At December 31, 2010,2011, there was $3.6$4.0 million of unrecognized compensation costs from share-based compensation arrangements, which is related to non-vested shares. This compensation is expected to be recognized over a weighted-average period of approximately 1.91.7 years. The potential tax benefit realizable for the anticipated tax deductions of the exercise of share-based payment arrangements generally would approximate 40%37.5% of these expense amounts.
13.12. EARNINGS PER SHARE
Basic earnings per common shares (“EPS”) is calculated by dividing net income available to common stockholders by the weighted average number of common shares outstanding during the period. Diluted EPS is computed by dividing net income on an as-if-converted basis available to common stockholders by the weighted average number of common shares outstanding during the period, adjusted for the dilutive effect of any outstanding dilutive securities. The calculation of diluted earnings per share gives effect to common stock equivalents. The reconciliations of net income to net income on an as-if-converted basis and basic and diluted earnings per share are as follows (in thousands):
| Year Ended December 31, 2010 | Year Ended December 31, 2009 | Nine-Month Transition Period Ended December 31, 2008 | Year Ended December 31, | |||||||||||||||||||||||||||||
Net income (loss) attributable to Green Plains | $ | 48,012 | $ | 19,790 | $ | (6,897 | ) | |||||||||||||||||||||||||
| 2011 | 2010 | 2009 | ||||||||||||||||||||||||||||||
Net income attributable to Green Plains | $ | 38,418 | $ | 48,012 | $ | 19,790 | ||||||||||||||||||||||||||
Weighted average shares outstanding - basic | 31,032 | 24,895 | 12,366 | 35,276 | 31,032 | 24,895 | ||||||||||||||||||||||||||
Income (loss) attributable to Green Plains stockholders - basic | $ | 1.55 | $ | 0.79 | $ | (0.56 | ) | |||||||||||||||||||||||||
Income attributable to Green Plains stockholders - basic | $ | 1.09 | $ | 1.55 | $ | 0.79 | ||||||||||||||||||||||||||
|
|
| ||||||||||||||||||||||||||||||
Net income attributable to Green Plains | $ | 48,012 | $ | 19,790 | $ | (6,897 | ) | $ | 38,418 | $ | 48,012 | $ | 19,790 | |||||||||||||||||||
Interest on convertible debt | 863 | - | - | |||||||||||||||||||||||||||||
Amortization of debt issuance costs related to convertible debt | 97 | - | - | |||||||||||||||||||||||||||||
Interest and amortization on convertible debt | 5,776 | 960 | — | |||||||||||||||||||||||||||||
Tax effect of interest on convertible debt | (260 | ) | - | - | (2,166 | ) | (260 | ) | — | |||||||||||||||||||||||
|
|
| ||||||||||||||||||||||||||||||
Net income (loss) attributable to Green Plains on an as-if-converted basis | $ | 48,712 | $ | 19,790 | $ | (6,897 | ) | |||||||||||||||||||||||||
Net income attributable to Green Plains on an as-if-converted basis | $ | 42,028 | $ | 48,712 | $ | 19,790 | ||||||||||||||||||||||||||
|
|
| ||||||||||||||||||||||||||||||
Weighted average shares outstanding - basic | 31,032 | 24,895 | 12,366 | 35,276 | 31,032 | 24,895 | ||||||||||||||||||||||||||
Effect of dilutive convertible debt | 1,015 | - | - | 6,280 | 1,015 | — | ||||||||||||||||||||||||||
Effect of dilutive stock options | 300 | 174 | - | 252 | 300 | 174 | ||||||||||||||||||||||||||
|
|
| ||||||||||||||||||||||||||||||
Total potential shares outstanding | 32,347 | 25,069 | 12,366 | 41,808 | 32,347 | 25,069 | ||||||||||||||||||||||||||
|
|
| ||||||||||||||||||||||||||||||
Income attributable to Green Plains stockholders - diluted | $ | 1.01 | $ | 1.51 | $ | 0.79 | ||||||||||||||||||||||||||
|
|
| ||||||||||||||||||||||||||||||
Income (loss) attributable to Green Plains stockholders - diluted | $ | 1.51 | $ | 0.79 | $ | (0.56 | ) | |||||||||||||||||||||||||
Excluded from the computations of diluted EPS for the years ended December 31, 2011, 2010 and 2009, and the nine-month transition period ended December 31, 2008, were stock options, stock awards and DSUs totaling 0.9 million, 0.7 million 1.0 million and 0.71.0 million shares, respectively, because the exercise prices or the grant-date fair value, as applicable, of the corresponding awards were greater than the average market price of the Company’s common stock during the respective periods. As consideration for the Global acquisition in October 2010, the
Company issued warrants for 700,000 shares of its restricted stock at a price of $14.00 per share. The warrants are excluded from the computations of diluted EPS as the exercise price was greater than the average market price of the Company’s common stock for the years ended December 31, 2011 and 2010.
13. TREASURY STOCK
On September 9, 2011, the Company repurchased 3.5 million shares of common stock at a price of $8.00 per share from a subsidiary of NTR plc, which is a principal shareholder of the Company. Shares of common stock repurchased by the Company are recorded at cost as treasury stock and result in a reduction of stockholders’ equity on the consolidated balance sheets. When shares are reissued, the Company will use the weighted average cost method for determining the cost basis. The difference between the cost of the shares and the issuance price will be added or deducted from additional paid-in capital. The Company does not have a share repurchase program and does not intend to retire the repurchased shares.
14. INCOME TAXES
Income taxes are accounted for under the asset and liability method. Deferred tax assets and liabilities are recognized for the future tax consequences attributable to differences between the financial statement carrying amounts of existing assets and liabilities and their respective tax bases, and for net operating loss and tax credit carry-forwards. Deferred tax assets and liabilities are measured using enacted tax rates expected to apply to taxable income in the years in which those temporary differences are expected to be recovered or settled. The effect on deferred tax assets and liabilities of a change in tax rates is recognized in income in the period that includes the enactment date.
Income tax expense consists of the following (in thousands):
| Year Ended December 31, | ||||||||||||||||||||||||||||||||
| Year Ended December 31, 2010 | Year Ended December 31, 2009 | Nine-Month Transition Period Ended December 31, 2008 | 2011 | 2010 | 2009 | |||||||||||||||||||||||||||
Current | $ | 1,369 | $ | 438 | $ | - | $ | (612 | ) | $ | 1,369 | $ | 438 | |||||||||||||||||||
Deferred | 16,520 | (347 | ) | - | 24,298 | 16,520 | (347 | ) | ||||||||||||||||||||||||
|
|
| ||||||||||||||||||||||||||||||
Total | $ | 17,889 | $ | 91 | $ | - | $ | 23,686 | $ | 17,889 | $ | 91 | ||||||||||||||||||||
|
|
| ||||||||||||||||||||||||||||||
Deferred income tax provisions for the year ended December 31, 2009 andreflect the nine-month transition period ended December 31, 2008 have been determinedCompany’s determination that any benefit from net deferred tax assets related to be zero as the Company had net operating losses for tax purposes and had determined that any benefit from related net deferred tax assets may not be realized. ForAs a result, valuation allowances were provided. In 2010, due to profitability, the valuation allowances have beenwere released, except for those related to specific federal and state tax credits.
Differences between the income tax expense (benefit) computed at the statutory federal income tax rate and peras presented on the consolidated statements of operations are summarized as follows (in thousands):
| Year Ended December 31, | ||||||||||||||||||||||||||||||||
| Year Ended December 31, 2010 | Year Ended December 31, 2009 | Nine-Month Transition Period Ended December 31, 2008 | 2011 | 2010 | 2009 | |||||||||||||||||||||||||||
Tax expense (benefit) at federal statutory rate of 35% | $ | 23,118 | $ | 7,063 | $ | (2,837 | ) | $ | 21,737 | $ | 23,118 | $ | 7,063 | |||||||||||||||||||
State income tax benefit, net of federal expense | (1,883 | ) | (2,411 | ) | (544 | ) | ||||||||||||||||||||||||||
State income tax expense (benefit), net of federal expense | 2,989 | (1,883 | ) | (2,411 | ) | |||||||||||||||||||||||||||
Tax credits | - | (439 | ) | - | — | — | (439 | ) | ||||||||||||||||||||||||
Increase (decrease) in valuation allowance against deferred tax assets | (3,749 | ) | (3,004 | ) | 3,297 | |||||||||||||||||||||||||||
Decrease in valuation allowance against deferred tax assets | (2,084 | ) | (3,749 | ) | (3,004 | ) | ||||||||||||||||||||||||||
Other | 403 | (1,118 | ) | 84 | 1,044 | 403 | (1,118 | ) | ||||||||||||||||||||||||
|
|
| ||||||||||||||||||||||||||||||
Income tax expense | $ | 17,889 | $ | 91 | $ | - | $ | 23,686 | $ | 17,889 | $ | 91 | ||||||||||||||||||||
|
|
| ||||||||||||||||||||||||||||||
The Company’s state income tax benefit for the years ended December 31, 2010 and 2009 includes state income tax expense on income which was more than offset by certain state tax benefits and credits that will expire in years 2014 through 2023.
Significant components of deferred tax assets and liabilities are as follows (in thousands):
| December 31, | December 31, | |||||||||||||||||||
| 2010 | 2009 | 2011 | 2010 | |||||||||||||||||
Deferred tax assets: | ||||||||||||||||||||
Net operating loss carryforwards - Federal | $ | 12,915 | $ | 12,308 | $ | 14,863 | $ | 12,915 | ||||||||||||
Net operating loss carryforwards - State | 1,736 | 3,129 | 671 | 1,736 | ||||||||||||||||
Tax credit carryforwards - Federal | 1,340 | 1,616 | 1,354 | 1,340 | ||||||||||||||||
Tax credit carryforwards - State | 7,312 | 3,222 | 6,193 | 7,312 | ||||||||||||||||
Derivatives | 5,749 | 4,730 | 1,540 | 5,749 | ||||||||||||||||
Organizational and start-up costs | 4,606 | 5,379 | 6,373 | 4,606 | ||||||||||||||||
Stock options | 2,528 | 2,207 | ||||||||||||||||||
Stock-based compensation | 3,283 | 2,528 | ||||||||||||||||||
Inventory valuation | 3,258 | 4,415 | 711 | 3,258 | ||||||||||||||||
Accrued Expenses | 3,526 | 6,026 | 4,857 | 3,526 | ||||||||||||||||
Deferred Revenue | 616 | 653 | 590 | 616 | ||||||||||||||||
Other | 144 | 336 | 189 | 144 | ||||||||||||||||
|
| |||||||||||||||||||
Total deferred tax assets | 43,730 | 44,021 | 40,624 | 43,730 | ||||||||||||||||
|
| |||||||||||||||||||
Deferred tax liabilities: | ||||||||||||||||||||
Fixed assets | $ | (54,356 | ) | $ | (31,603 | ) | $ | (76,250 | ) | $ | (54,356 | ) | ||||||||
Investment in partnerships | - | (2,679 | ) | (946 | ) | — | ||||||||||||||
|
| |||||||||||||||||||
Total deferred tax liabilities | (54,356 | ) | (34,282 | ) | (77,196 | ) | (54,356 | ) | ||||||||||||
|
| |||||||||||||||||||
Valuation allowance | (5,990 | ) | (9,739 | ) | (2,754 | ) | (5,990 | ) | ||||||||||||
|
| |||||||||||||||||||
Deferred income taxes | $ | (16,616 | ) | $ | - | $ | (39,326 | ) | $ | (16,616 | ) | |||||||||
|
| |||||||||||||||||||
The deferred tax valuation allowance of $6.0$2.8 million includes federal and state valuation allowances of $0.7 million and $5.3$2.1 million, respectively. The state valuation allowance of $5.3 million is related to certain Iowa and Tennessee tax credits that have a remaining life between 53 and 1513 years.
As of December 31, 2011 and 2010, the Company had federal and state net operating loss carryforwards of $38.3$42.5 million and $28.9$36.9 million, respectively. As of December 31, 2009, the Company hadrespectively, which are available to reduce future federal and state net operating loss carryforwards of $37.7 million and $38.7 million, respectively.income tax, if any, through 2031. In determining these net operating loss carryforwards, wethe Company considered future taxable income and possible limitations on net operating losses. These losses will expire in years 2024 through 2029.
The Company continues to maintain a valuation allowance against some of its net deferred tax assets at December 31, 2010,2011, due to the uncertainty of realizing these assets in the future. In assessing the realizability of deferred tax assets, management considers whether it is more likely than not that some or all of the deferred tax assets will be realized. The ultimate realization of deferred tax assets is dependent upon the generation of future taxable income during the periods in which those temporary differences become deductible. Management considers the scheduled reversal of deferred tax liabilities, projected future taxable income, and tax planning strategies in making this assessment.
The Company conducts business and files tax returns in several states within the U.S. The Company’s federal returns for the tax years ended November 30, 2006 and later are still subject to audit. The Company’s state returns for the tax years ended November 30, 20072008 and later are also still subject to audit.
A reconciliation of the beginning and ending amount of unrecognized tax benefits is as follows (in thousands):
Unrecognized Tax Benefits | Unrecognized Tax Benefits | |||||||
Balance at January 1, 2010 | $ | 107 | ||||||
Balance at January 1, 2011 | $ | 1,061 | ||||||
Gross increases from tax positions in prior periods | 954 | 1,629 | ||||||
Settlements | (2,583 | ) | ||||||
| ||||||||
Balance at December 31, 2010 | $ | 1,061 | ||||||
Balance at December 31, 2011 | $ | 107 | ||||||
| ||||||||
TheDuring 2011, the Company believes that it is reasonably possible that $954 thousandreached a settlement with the IRS with respect to the audit of its unrecognizedthe November 30, 2006 and 2007 tax returns. Unrecognized tax benefits related to federal and state net operating loss carryforwards were affected by the timing of a particular deduction, could be settled with the relevant tax authority in the next 12 months.non-cash settlement. The unrecognized tax benefits, include an amount of $107 thousand which, if recognized, would favorably impact the Company’s effective tax rate.
We accrue
The Company accrues interest and penalties associated with uncertain tax positions as part of selling, general and administrative expense.
15. COMMITMENTS AND CONTINGENCIES
Operating Leases
We leaseThe Company leases certain facilities and parcels of land under agreements that expire at various dates. For accounting purposes, rent expense is based on a straight-line amortization of the total payments required over the lease term. The Company incurred lease expenses of $16.8 million, $11.3 million and $9.4 million during the years ended December 31, 2011, 2010 and 2009, respectively. Aggregate minimum lease payments under these agreements for future fiscal years are as follows (in thousands):
Year Ending December 31, | Amount | Amount | ||||||||||
2011 | $ | 16,033 | ||||||||||
2012 | 12,280 | $ | 16,566 | |||||||||
2013 | 9,782 | 14,496 | ||||||||||
2014 | 4,172 | 7,922 | ||||||||||
2015 | 2,693 | 5,877 | ||||||||||
2016 | 5,057 | |||||||||||
Thereafter | 4,516 | 2,768 | ||||||||||
| ||||||||||||
Total | $ | 49,476 | $ | 52,686 | ||||||||
| ||||||||||||
Commodities
As of December 31, 2010, we2011, the Company had contracted for future grain deliveries valued at $478.6$237.6 million, natural gas deliveries valued at approximately $14.8$8.3 million, ethanol product deliveries valued at approximately $5.8$12.5 million and distillers grains product deliveries valued at approximately $7.4$1.8 million.
Legal
In April 2011, Aventine Renewable Energy, Inc. filed a complaint in the United States Bankruptcy Court for the District of Delaware in connection with its Chapter 11 bankruptcy naming as defendants Green Plains Renewable Energy, Inc., Green Plains Obion LLC, Green Plains Bluffton LLC, Green Plains VBV LLC and Green Plains Trade Group LLC. This action alleges $24.4 million of damages from preferential transfers or, in the alternative, $28.4 million of damages from fraudulent transfers under an ethanol marketing agreement and an unspecified amount of damages for a continuing breach of a termination agreement related to rail cars. The Company is unable to predict the outcome of these matters at this time, and any views formed as to the viability of these claims or the financial exposure which could result may change as the matters proceed through their course. The Company intends to defend these claims vigorously.
In addition to the above-described proceeding, the Company is currently involved in other litigation that has arisen in the ordinary course of business, but it does not believe that any other pending litigation will have a material adverse effect on its financial position, results of operations or cash flows.
16. EMPLOYEE BENEFIT PLANS
The Company offers eligible employees a comprehensive employee benefits plan that includes health, dental, vision, life and accidental death, short-term disability, long-term disability, and flexible spending accounts. Additionally, the Company offers a 401(k) retirement plan that enables eligible employees to save on a tax-deferred basis up to the limits allowable under the Internal Revenue Code. The Company matches up to 4% of eligible employee contributions. Employee and employer contributions are 100% vested immediately. Employer contributions to the 401(k) plan were $ 0.60.9 million, $0.6 million and $0.5 million for the years ended December 31, 2011, 2010 and 2009 respectively.
Green Plains Grain contributes to a defined benefit pension plan. Although benefits under the plan were frozen as of January 1, 2009, Green Plains Grain remains obligated to ensure that the plan is funded in accordance with applicable requirements. As of December 31, 2010,2011, the assets of the plan are $6.1were $5.6 million and liabilities of the plan arewere $6.3 million. Excess plan liabilities over plan assets of $0.2$0.7 million and $0.3$0.2 million are included in other liabilities on ourthe consolidated
balance sheets at December 31, 20102011 and 2009,2010, respectively. Minimum funding standards generally require a plan’s underfunding to be made up over a seven-year period. The amount of underfunding could increase or decrease, based on investment returns of the plan’s assets or changes in the assumed discount rate used to value benefit obligations.
17. RELATED PARTY TRANSACTIONS
Sales and FinancingCommercial Contracts
Three subsidiaries have executed separate financing agreements for equipment with AXIS Capital Inc. Gordon F. Glade, President and Chief Executive Officer of AXIS Capital is a member of ourthe Company’s Board of Directors. A totalTotals of $0.5 million and $1.1 million and $1.6 million iswere included in debt at December 31, 20102011 and 2009,2010, respectively, under these financing arrangements. Payments, including principal and interest, totaled $0.7 million, $0.6$0.7 million and $0.4$0.6 million for the years ended December 31, 2011, 2010 and 2009, and the nine month transition period ended December 31, 2008, respectively. The highest amount outstanding during the fiscal year ended December 31, 20102011 was $1.6$1.1 million and the weighted average interest rate for all financing agreements is 7.8%6.9%.
The Company has entered into fixed-price ethanol purchase and sale agreements and throughput agreements with Center Oil Company. Gary R. Parker, President and Chief Executive Officer of Center Oil, is a member of ourthe Company’s Board of Directors. The purchasesDuring the year ended December 31, 2011, cash receipts from Center Oil totaled $146.9 million and sales agreements are executedpayments to hedge pricesCenter Oil totaled $8.7 million on a portion of our expected ethanol production.these contracts. During the year ended December 31, 2010, cash receipts from Center Oil totaled $81.5$81.6 million and payments to Center Oil totaled $6.3 million on these contracts. During the year ended December 31, 2009, cash receipts and payments totaled $112.0 million and $15.5 million, respectively, on these contracts. During the nine months ended December 31, 2008, cash receipts and payments totaled $18.8 million and $0.4 million, respectively, on these contracts. The Company had $6.0$1.0 million and $2.3$6.1 million included in accounts receivable at December 31, 2011 and 2010, and 2009, respectively, $69 thousand in outstanding payables at December 31, 2011 and no outstanding payables in current liabilities under these purchase and sale agreements for either year.at December 31, 2010.
Aircraft Lease
The Company has entered into an agreement on November 10, 2009 with Hoovestol, Inc. for the lease of an aircraft. Wayne B. Hoovestol, President of Hoovestol Inc., is Chairman of ourthe Company’s Board of Directors. The Company originallyhas agreed to pay $3,333 a$6,667 per month for two years for use of anup to 100 hours per year of the aircraft. The agreement was amended effective April 1, 2010 to increase the base usage amount and the monthly payment to $6,667. Also per the amended agreement, anyAny flight time in excess of 100 hours per year will incur additional hourly-based charges. For the years ended December 31, 2011, 2010 and 2009, payments related to this lease totaled $66,667$149 thousand, $67 thousand and $5,635$6 thousand, respectively, and at December 31, 20102011 and 2009,2010, the Company did not have any outstanding payables related to this lease.
18. SUBSEQUENT EVENTS
On January 21, 2011, Green Plains Trade entered into an amendment and restatement of its senior secured revolving credit facility to increase the principal amount available from $30 million to $70 million.
In February 2011, the Company’s bid to acquire an ethanol plant in Minnesota with approximately 55 mmgy of total ethanol production capacity was accepted by the bankruptcy court overseeing the auction process. Green Plains will finance the $55 million asset purchase with cash and financing from a group of nine lenders, led by AgStar Financial Services. The transaction is expected to close in March 2011.
On February 28, 2011, Green Plains Grain entered into an amendment to the Second Amended and Restated Credit Agreement, originally dated as of April 19, 2010, with First National Bank of Omaha. The amendment modifies certain definitions and covenants related to EBITDAR and working capital.
19. QUARTERLY FINANCIAL DATA (Unaudited)
The following table sets forth certain unaudited financial data for each of the quarters within the years ended December 31, 20102011 and 2009.2010. This information has been derived from ourthe Company’s consolidated financial statements and in management’s opinion, reflects all adjustments necessary for a fair presentation of the information for the quarters presented. The operating results for any quarter are not necessarily indicative of results for any future period.
| (Amounts in thousands, except per share amounts) | (Amounts in thousands, except per share amounts) | |||||||||||||||||||||||||||||||||||||||||||
| Three Months Ended | Three Months Ended | |||||||||||||||||||||||||||||||||||||||||||
| December 31, 2010 | September 30, 2010 | June 30, 2010 | March 31, 2010 | December 31, 2011 | September 30, 2011 | June 30, 2011 | March 31, 2011 | |||||||||||||||||||||||||||||||||||||
Revenues | $ | 756,836 | $ | 496,299 | $ | 453,360 | $ | 426,473 | $ | 922,791 | $ | 957,018 | $ | 861,576 | $ | 812,327 | ||||||||||||||||||||||||||||
Cost of goods sold | 705,414 | 464,295 | 422,687 | 389,000 | 870,738 | 909,725 | 826,314 | 774,703 | ||||||||||||||||||||||||||||||||||||
Operating income | 32,537 | 16,989 | 17,075 | 24,504 | 32,184 | 29,045 | 17,788 | 19,996 | ||||||||||||||||||||||||||||||||||||
Other expense | (8,264 | ) | (6,491 | ) | (5,670 | ) | (4,629 | ) | (9,428 | ) | (9,665 | ) | (9,917 | ) | (8,104 | ) | ||||||||||||||||||||||||||||
Income tax expense | 7,900 | 3,083 | 2,516 | 4,390 | 9,495 | 6,979 | 2,852 | 4,361 | ||||||||||||||||||||||||||||||||||||
Net income attributable to Green Plains | 16,384 | 7,366 | 8,685 | 15,577 | 13,266 | 12,429 | 4,982 | 7,741 | ||||||||||||||||||||||||||||||||||||
Basic earnings per share attributable to Green Plains | 0.47 | 0.23 | 0.28 | 0.59 | 0.40 | 0.35 | 0.14 | 0.21 | ||||||||||||||||||||||||||||||||||||
Diluted earnings per share attributable to Green Plains | 0.44 | 0.23 | 0.27 | 0.58 | 0.36 | 0.32 | 0.14 | 0.20 | ||||||||||||||||||||||||||||||||||||
| Three Months Ended | Three Months Ended | |||||||||||||||||||||||||||||||||||||||||||
| December 31, 2009 | September 30, 2009 | June 30, 2009 | March 31, 2009 | December 31, 2010 | September 30, 2010 | June 30, 2010 | March 31, 2010 | |||||||||||||||||||||||||||||||||||||
Revenues | $ | 436,713 | $ | 361,724 | $ | 284,655 | $ | 221,082 | $ | 757,032 | $ | 496,252 | $ | 453,748 | $ | 426,890 | ||||||||||||||||||||||||||||
Cost of goods sold | 392,449 | 340,321 | 269,772 | 219,203 | 705,414 | 464,295 | 422,687 | 389,000 | ||||||||||||||||||||||||||||||||||||
Operating income (loss) | 29,763 | 10,754 | 4,169 | (7,180 | ) | |||||||||||||||||||||||||||||||||||||||
Operating income | 32,722 | 16,942 | 17,465 | 24,922 | ||||||||||||||||||||||||||||||||||||||||
Other expense | (6,165 | ) | (5,394 | ) | (3,563 | ) | (2,106 | ) | (8,450 | ) | (6,445 | ) | (6,060 | ) | (5,045 | ) | ||||||||||||||||||||||||||||
Income tax expense (benefit) | 280 | (189 | ) | - | - | |||||||||||||||||||||||||||||||||||||||
Net income (loss) attributable to Green Plains | 23,050 | 5,454 | 627 | (9,341 | ) | |||||||||||||||||||||||||||||||||||||||
Basic earnings (loss) per share attributable to Green Plains | 0.92 | 0.22 | 0.03 | (0.38 | ) | |||||||||||||||||||||||||||||||||||||||
Diluted earnings (loss) per share attributable to Green Plains | 0.91 | 0.22 | 0.03 | (0.38 | ) | |||||||||||||||||||||||||||||||||||||||
Income tax expense | 7,900 | 3,083 | 2,516 | 4,390 | ||||||||||||||||||||||||||||||||||||||||
Net income attributable to Green Plains | 16,384 | 7,366 | 8,685 | 15,577 | ||||||||||||||||||||||||||||||||||||||||
Basic earnings per share attributable to Green Plains | 0.47 | 0.23 | 0.28 | 0.59 | ||||||||||||||||||||||||||||||||||||||||
Diluted earnings per share attributable to Green Plains | 0.44 | 0.23 | 0.27 | 0.58 | ||||||||||||||||||||||||||||||||||||||||
Schedule I – Condensed Financial Information of the Registrant (Parent Company Only)
GREEN PLAINS RENEWABLE ENERGY, INC.
CONDENSED FINANCIAL INFORMATION OF THE REGISTRANT
STATEMENTS OF BALANCE SHEETS -SHEET – PARENT COMPANY ONLY
(in thousands, except share amounts)thousands)
| December 31, | December 31, | |||||||||||||||||||
| 2010 | 2009 | 2011 | 2010 | |||||||||||||||||
| ASSETS | ||||||||||||||||||||
Current assets | ||||||||||||||||||||
Cash and cash equivalents | $ | 114,565 | $ | 11,591 | $ | 71,547 | $ | 114,565 | ||||||||||||
Accounts receivable, including amounts from related parties of $2,520 and $500, respectively | 2,556 | 520 | ||||||||||||||||||
Accounts receivable, including amounts from related parties of $51 and $2,520, respectively | 202 | 2,556 | ||||||||||||||||||
Prepaid expenses and other | 555 | 720 | 698 | 555 | ||||||||||||||||
Intercompany | 18,594 | - | ||||||||||||||||||
Due from subsidiaries | — | 16,066 | ||||||||||||||||||
|
| |||||||||||||||||||
Total current assets | 136,270 | 12,831 | 72,447 | 133,742 | ||||||||||||||||
Property and equipment, net | 688 | 738 | 4,425 | 688 | ||||||||||||||||
Investment in consolidated subsidiaries | 443,231 | 291,768 | 526,470 | 443,231 | ||||||||||||||||
Investment in unconsolidated subsidiaries | 2,768 | 2,272 | ||||||||||||||||||
Financing costs and other, net | 4,022 | 402 | ||||||||||||||||||
Other assets | 13,121 | 9,318 | ||||||||||||||||||
|
| |||||||||||||||||||
Total assets | $ | 586,979 | $ | 308,011 | $ | 616,463 | $ | 586,979 | ||||||||||||
|
| |||||||||||||||||||
| LIABILITIES AND STOCKHOLDERS’ EQUITY | ||||||||||||||||||||
Current liabilities | ||||||||||||||||||||
Accounts payable | $ | 1,223 | $ | 886 | $ | 1,600 | $ | 1,223 | ||||||||||||
Accrued liabilities | 7,016 | 3,873 | 7,808 | 7,016 | ||||||||||||||||
Intercompany | - | 636 | ||||||||||||||||||
Due to subsidiaries | 8,947 | — | ||||||||||||||||||
Current maturities of long-term debt | 492 | 485 | 204 | 492 | ||||||||||||||||
|
| |||||||||||||||||||
Total current liabilities | 8,731 | 5,880 | 18,559 | 8,731 | ||||||||||||||||
Long-term debt | 90,000 | 486 | 92,028 | 90,000 | ||||||||||||||||
Other liabilities | - | 181 | 764 | — | ||||||||||||||||
|
| |||||||||||||||||||
Total liabilities | 98,731 | 6,547 | 111,351 | 98,731 | ||||||||||||||||
|
| |||||||||||||||||||
Stockholders’ equity | ||||||||||||||||||||
Common stock, $0.001 par value; 50,000,000 shares authorized; | 36 | 25 | ||||||||||||||||||
Common stock, $0.001 par value; 75,000,000 and 50,000,000 shares authorized; 36,413,611 and 35,793,501 shares issued and 32,913,611 and 35,793,501 shares outstanding, respectively | 36 | �� | 36 | |||||||||||||||||
Additional paid-in capital | 431,289 | 292,231 | 440,469 | 431,289 | ||||||||||||||||
Retained earnings | 57,343 | 9,331 | 95,761 | 57,343 | ||||||||||||||||
Accumulated other comprehensive loss | (420 | ) | (123 | ) | (2,953 | ) | (420 | ) | ||||||||||||
Treasury stock, 3,500,000 and 0 shares, respectively | (28,201 | ) | — | |||||||||||||||||
|
| |||||||||||||||||||
Total stockholders’ equity | 488,248 | 301,464 | 505,112 | 488,248 | ||||||||||||||||
|
| |||||||||||||||||||
Total liabilities and stockholders’ equity | $ | 586,979 | $ | 308,011 | $ | 616,463 | $ | 586,979 | ||||||||||||
|
| |||||||||||||||||||
See accompanying notes to the condensed financial statements.
GREEN PLAINS RENEWABLE ENERGY, INC.
CONDENSED FINANCIAL INFORMATION OF THE REGISTRANT
STATEMENTS OF OPERATIONS -– PARENT COMPANY ONLY
(in thousands)
| Year Ended December 31, 2010 | Year Ended December 31, 2009 | Nine-Month Transition Period Ended December 31, 2008 | ||||||||||||||||||
Revenues | $ | - | $ | - | $ | - | ||||||||||||||
Cost of goods sold | - | - | - | |||||||||||||||||
Gross profit | - | - | - | |||||||||||||||||
Selling, general and administrative expenses | - | - | - | |||||||||||||||||
Operating income (loss) | - | - | - | |||||||||||||||||
Other income (expense) | ||||||||||||||||||||
Interest income | 324 | 122 | 83 | |||||||||||||||||
Interest expense, net of amounts capitalized | (1,056 | ) | (36 | ) | - | |||||||||||||||
Equity in earnings (loss) of consolidated subsidiaries | 48,035 | 19,947 | (6,983 | ) | ||||||||||||||||
Other, net | (267 | ) | (277 | ) | 3 | |||||||||||||||
Total other income (expense) | 47,036 | 19,756 | (6,897 | ) | ||||||||||||||||
Income (loss) before income taxes | 47,036 | 19,756 | (6,897 | ) | ||||||||||||||||
Income tax expense (benefit) | 976 | (34 | ) | - | ||||||||||||||||
Net income (loss) | $ | 48,012 | $ | 19,790 | $ | (6,897 | ) | |||||||||||||
| Year Ended December 31, | ||||||||||||
| 2011 | 2010 | 2009 | ||||||||||
Selling, general and administrative expenses | 471 | — | — | |||||||||
|
|
|
|
|
| |||||||
Operating income (loss) | (471 | ) | — | — | ||||||||
|
|
|
|
|
| |||||||
Other income (expense) | ||||||||||||
Interest income | 197 | 324 | 122 | |||||||||
Interest expense | (5,484 | ) | (1,154 | ) | (36 | ) | ||||||
Other, net | (779 | ) | (169 | ) | (277 | ) | ||||||
|
|
|
|
|
| |||||||
Total other expense | (6,066 | ) | (999 | ) | (191 | ) | ||||||
|
|
|
|
|
| |||||||
Income before income taxes | (6,537 | ) | (999 | ) | (191 | ) | ||||||
Income tax benefit | (2,462 | ) | (976 | ) | (34 | ) | ||||||
|
|
|
|
|
| |||||||
Income before equity in earnings of subsidiaries | (4,075 | ) | (23 | ) | (157 | ) | ||||||
Equity in earnings of consolidated subsidiaries | 42,493 | 48,035 | 19,947 | |||||||||
|
|
|
|
|
| |||||||
Net income | $ | 38,418 | $ | 48,012 | $ | 19,790 | ||||||
|
|
|
|
|
| |||||||
See accompanying notes to the condensed financial statements.
GREEN PLAINS RENEWABLE ENERGY, INC.
CONDENSED FINANCIAL INFORMATION OF THE REGISTRANT
STATEMENTS OF CASH FLOWS -– PARENT COMPANY ONLY
(in thousands)
| Year Ended December 31, 2010 | Year Ended December 31, 2009 | Nine-Month Transition Period Ended December 31, 2008 | ||||||||||||||||||
Cash flows from operating activities: | ||||||||||||||||||||
Net income (loss) | $ | 48,012 | $ | 19,790 | $ | (6,897 | ) | |||||||||||||
Equity in earnings of consolidated affiliates | (48,035 | ) | (19,947 | ) | 6,983 | |||||||||||||||
Equity in loss of unconsolidated subsidiary | (163 | ) | 277 | - | ||||||||||||||||
Net cash provided by (used by) operating activities | (186 | ) | 120 | 86 | ||||||||||||||||
Cash flows from investing activities: | ||||||||||||||||||||
Purchases of property and equipment | (189 | ) | (458 | ) | (170 | ) | ||||||||||||||
Investment in subsidiaries | (46,459 | ) | (63,288 | ) | (130,218 | ) | ||||||||||||||
Investment in unconsolidated subsidiaries | (333 | ) | (1,173 | ) | (1,377 | ) | ||||||||||||||
Intercompany | (19,312 | ) | 30,233 | (28,363 | ) | |||||||||||||||
Acquisition of businesses, net of cash acquired | - | - | 214 | |||||||||||||||||
Dividends received | - | 914 | - | |||||||||||||||||
Other | 21 | 541 | (1,797 | ) | ||||||||||||||||
Net cash used by investing activities | (66,272 | ) | (33,231 | ) | (161,711 | ) | ||||||||||||||
Cash flows from financing activities: | ||||||||||||||||||||
Proceeds from the issuance of debt | 90,000 | - | - | |||||||||||||||||
Payments of principal on long-term debt | (500 | ) | - | (1,000 | ) | |||||||||||||||
Proceeds from exercises of stock options | 200 | 176 | - | |||||||||||||||||
Proceeds from issuance of common stock | 79,732 | - | 207,151 | |||||||||||||||||
Net cash provided by financing activities | 169,432 | 176 | 206,151 | |||||||||||||||||
Net change in cash and equivalents | 102,974 | (32,935 | ) | 44,526 | ||||||||||||||||
Cash and cash equivalents, beginning of period | 11,591 | 44,526 | - | |||||||||||||||||
Cash and cash equivalents, end of period | $ | 114,565 | $ | 11,591 | $ | 44,526 | ||||||||||||||
| Year Ended December 31, | ||||||||||||
| 2011 | 2010 | 2009 | ||||||||||
Cash flows from operating activities: | $ | 36,400 | $ | (10,616 | ) | $ | 30,853 | |||||
|
|
|
|
|
| |||||||
Net cash provided (used) by operating activities | 36,400 | (10,616 | ) | 30,853 | ||||||||
|
|
|
|
|
| |||||||
Cash flows from investing activities: | ||||||||||||
Purchases of property and equipment | (4,239 | ) | (189 | ) | (458 | ) | ||||||
Investment in subsidiaires | (32,651 | ) | (46,459 | ) | (63,288 | ) | ||||||
Issuance of notes receivable from subsidiaries, net of payments received | (9,011 | ) | (8,550 | ) | (500 | ) | ||||||
Dividends received | — | — | 914 | |||||||||
Other, net | (4,162 | ) | (665 | ) | (1,173 | ) | ||||||
|
|
|
|
|
| |||||||
Net cash used by investing activities | (50,063 | ) | (55,863 | ) | (64,505 | ) | ||||||
|
|
|
|
|
| |||||||
Cash flows from financing activities: | ||||||||||||
Proceeds from the issuance of long-term debt | — | 90,000 | — | |||||||||
Payments of principal on long-term debt | (535 | ) | (500 | ) | — | |||||||
Purchase of noncontrolling interests | (3,125 | ) | — | — | ||||||||
Proceeds from issuance of common stock | — | 79,732 | — | |||||||||
Payments for repurchase of common stock | (28,201 | ) | — | — | ||||||||
Other, net | 2,506 | 221 | 717 | |||||||||
|
|
|
|
|
| |||||||
Net cash provided (used) by financing activities | (29,355 | ) | 169,453 | 717 | ||||||||
|
|
|
|
|
| |||||||
Net change in cash and equivalents | (43,018 | ) | 102,974 | (32,935 | ) | |||||||
Cash and cash equivalents, beginning of period | 114,565 | 11,591 | 44,526 | |||||||||
|
|
|
|
|
| |||||||
Cash and cash equivalents, end of period | $ | 71,547 | $ | 114,565 | $ | 11,591 | ||||||
|
|
|
|
|
| |||||||
See accompanying notes to the condensed financial statements.
GREEN PLAINS RENEWABLE ENERGY, INC.
CONDENSED FINANCIAL INFORMATION OF THE REGISTRANT
NOTES TO CONDENSED FINANCIAL STATEMENTS – PARENT COMPANY ONLY
1. BASIS OF PRESENTATION
Green Plains Renewable Energy, Inc., the Parent Company, is a holding company that conducts substantially all of its business operations through its subsidiaries. As specified in certain of its subsidiaries’ debt agreements, there are restrictions on the Parent Company’s ability to obtain funds from certain of its subsidiaries through dividends, loans or advances. SeeNote 1110 – Long-Term Debtin the Notes to the Consolidated Financial Statements for further information. Accordingly, these condensed financial statements have been presented on a “parent-only” basis. Under a parent-only presentation, the Parent Company’s investments in its consolidated subsidiaries are presented under the equity method of accounting. These parent-only financial statements should be read in conjunction with Green Plains Renewable Energy, Inc.’s audited consolidated financial statements included elsewhere herein.
2. COMMITMENTS AND CONTINGENCIES
Operating Leases
The Parent Company leases certain facilities under agreements that expire at various dates. For accounting purposes, rent expense is based on a straight-line amortization of the total payments required over the lease term. The Parent Company incurred lease expenses of $1.2$1.0 million and $0.3$1.2 million during the years ended December 31, 20102011 and 2009,2010, respectively. Aggregate minimum lease payments under these agreements for future fiscal years are as follows (in thousands):
Year Ending December 31, | Amount | Amount | ||||||||||
2011 | $ | 397 | ||||||||||
2012 | 465 | $ | 847 | |||||||||
2013 | 487 | 725 | ||||||||||
2014 | 509 | 751 | ||||||||||
2015 | 516 | 763 | ||||||||||
2016 | 788 | |||||||||||
Thereafter | 489 | 247 | ||||||||||
| ||||||||||||
Total | $ | 2,863 | $ | 4,121 | ||||||||
| ||||||||||||
Parent Guarantees
The various operating subsidiaries of the Parent Company enter into contracts as a routine part of their business activities. Examples of these contracts include financing and lease arrangements, commodity purchase and sale agreements, and agreements with vendors. In certain instances, the contractual obligations of such subsidiaries are guaranteed by, or otherwise supported by the Parent Company. As of December 31, 2010,2011, the Parent Company had $43.2$48.9 million in guarantees of subsidiary contracts and indebtedness.
3. LONG-TERM DEBT
Parent Company only debt is comprised of future annual payments related to an assumption of a liability to the former owners of Blendstar and the convertible notes issued in November 2010.2010, notes payable and capital leases obligations.
Scheduled long-term debt repayments are as follows (in thousands):
Year Ending December 31, | Amount | Amount | ||||||||||
2011 | $ | 492 | ||||||||||
2012 | - | $ | 204 | |||||||||
2013 | - | 1,839 | ||||||||||
2014 | - | 188 | ||||||||||
2015 | 90,000 | 90,000 | ||||||||||
2016 | — | |||||||||||
Thereafter | - | — | ||||||||||
| ||||||||||||
Total | $ | 90,492 | $ | 92,231 | ||||||||
| ||||||||||||
F-42F-40