UNITED STATES
SECURITIES AND EXCHANGE COMMISSION
Washington, D.C. 20549
FORM 10-K
| x | ANNUAL REPORT PURSUANT TO SECTION 13 OR 15(d) OF THE SECURITIES EXCHANGE ACT OF 1934 |
For the Fiscal Year Ended December 31, 20102011
OR
| ¨ | TRANSITION REPORT PURSUANT TO SECTION 13 OR 15(d) OF THE SECURITIES EXCHANGE ACT OF 1934 |
For the Transition Period From to
Commission File Number 001-35004
FLEETCOR TECHNOLOGIES, INC.
| DELAWARE | 72-1074903 | |
| (STATE OF INCORPORATION) | (I.R.S. ID) |
655 Engineering Drive,5445 Triangle Parkway, Suite 300,400, Norcross, Georgia 30092-283030092-2575
(770) 449-0479
Securities registered pursuant to Section 12(b) of the Act:
COMMON STOCK, $0.001 PAR VALUE PER SHARE | NEW YORK STOCK EXCHANGE |
Securities registered pursuant to Section 12(g) of the Act:
NONE
Indicate by check mark if the registrant is a well-known seasoned issuer, as defined in Rule 405 of the Securities Act. Yes ¨þ No þ¨
Indicate by check mark if the registrant is not required to file reports pursuant to Section 13 or Section 15(d) of the Exchange Act. Yes ¨ No þ
Indicate by check mark whether the registrant (1) has filed all reports required to be filed by Section 13 or 15(d) of the Securities Exchange Act of 1934 during the preceding 12 months (or for such shorter period that the registrant was required to file such reports), and (2) has been subject to such filing requirements for the past 90 days. Yes þ No ¨
Indicate by check mark whether the registrant has submitted electronically and posted on its corporate Web site, if any, every Interactive Data File required to be submitted and posted pursuant to Rule 405 of Regulation S-T (§232.405 of this chapter) during the preceding 12 months (or for such shorter period that the registrant was required to submit and post such files). Yes ¨þ No ¨
Indicate by check mark if disclosure of delinquent filers pursuant to Item 405 of Regulation S-K (§229.405 of this chapter) is not contained herein, and will not be contained, to the best of registrant’s knowledge, in definitive proxy or information statements incorporated by reference in Part III of this Form 10-K or any amendment to this Form 10-K. ¨
Indicate by check mark whether the registrant is a large accelerated filer, an accelerated filer, a non-accelerated filer, or a smaller reporting company. See the definitions of “large accelerated filer,” “accelerated filer” and “smaller reporting company” in Rule 12b-2 of the Exchange Act.
Large accelerated filer | þ | Accelerated filer | ¨ | |||
Non-accelerated filer |
| Smaller reporting company | ¨ | |||
Indicate by check mark whether the registrant is a shell company (as defined in Rule 12b-2 of the Exchange Act). Yes ¨ No þ
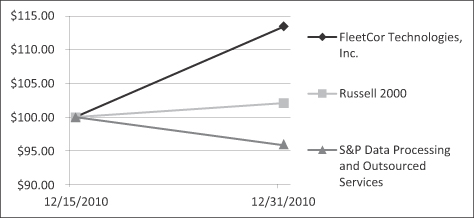
As of June 30, 2010, the registrant’s common stock was not listed on any exchange or over-the-counter market. The registrant’s common stock began trading on the New York Stock Exchange on December 15, 2010. As of December 31, 2010, the aggregate market value of the registrant’s common stock held by non-affiliates of the registrant was $747,260,615$908,814,063 as of June 30, 2011, based on the closing sale price as reported on the New York Stock Exchange.
As of February 7, 2011,10, 2012, there were 79,985,11682,232,940 shares of common stock outstanding.
DOCUMENTS INCORPORATED BY REFERENCE
Portions of the registrant’s definitive Proxy Statement to be delivered to shareholders in connection with the Annual Meeting of Shareholders to be held on May 24, 201122, 2012 are incorporated by reference into Part III.III of this report.
FLEETCOR TECHNOLOGIES, INC.
FORM 10-K
For The Fiscal Year Ended December 31, 20102011
| Page | ||||||||||
PART I | ||||||||||
| Item 1. | ||||||||||
| Item X. | ||||||||||
| Item 1A. | ||||||||||
| Item 1B. | 30 | |||||||||
| Item 2. | 31 | |||||||||
| Item | 31 | |||||||||
| Item 4. | 32 | |||||||||
PART II | ||||||||||
| Item 5. | 33 | |||||||||
| Item 6. | ||||||||||
| Item 7. | Management’s Discussion and Analysis of Financial Condition and Results of Operations | 36 | ||||||||
| Item 7A. | ||||||||||
| Item 8. | ||||||||||
| Item 9. | Changes in and Disagreements with Accountants on Accounting and Financial Disclosure | |||||||||
| Item 9A. | ||||||||||
| Item 9B. | ||||||||||
PART III | ||||||||||
| Item 10. | ||||||||||
| Item 11. | ||||||||||
| Item 12. | Security Ownership of Certain Beneficial Owners and Management and Related Stockholder Matters | |||||||||
| Item 13. | Certain Relationships and Related Transactions, and Director Independence | |||||||||
| Item 14. | ||||||||||
PART IV | ||||||||||
| Item 15. | ||||||||||
Note About Forward-Looking Statements
This report contains statements that express our opinions, expectations, beliefs, plans, objectives, assumptions or projections regarding future events or future results, in contrast with statements that reflect historical facts. In some cases, we have identified such forward-looking statements with typical conditionalwithin the meaning of the federal securities laws. Statements that are not historical facts, including statements about FleetCor’s beliefs, expectations and future performance, are forward-looking statements. Forward-looking statements can be identified by the use of words such as “anticipate,” “intend,” “believe,” “estimate,” “plan,” “seek,” “project” or “expect,” “may,” “will,” “would,” “could” or “should,” the negative of these terms or other comparable terminology.
These forward-looking statements are not a guarantee of performance, and you should not place undue reliance on such statements. We have based these forward-looking statements largely on our current expectations and projections about future events. Forward-looking statements are subject to many uncertainties and other variable circumstances, including those discussed in this report in Item 1A, “Risk factors,” and Item 7, “Management’s Discussion and Analysis of Financial Condition and Results of Operations,” many of which are outside of our control, that could cause our actual results and experience to differ materially from any forward-looking statement. Given these risks and uncertainties, you are cautioned not to place undue reliance on these forward-looking statements. The forward-looking statements included in this report are made only as of the date hereof. We do not undertake, and specifically decline,disclaim, any obligation to update any such statements or to publicly announce the results of any revisions to any of such statements to reflect future events or developments.
PART I
General
FleetCor is a leading independent global provider of specialized payment products and services to businesses, commercial fleets, major oil companies, petroleum marketers and government entities in 18 countries inthroughout North America, Europe, AfricaLatin America and Asia.Europe. Our payment programs enable our customers to better manage and control employee spending and provide card-accepting merchants with a high volume customer base that can increase their sales and customer loyalty. In 2010,2011, we processed more than 196215 million transactions on our proprietary networks and third-party networks. We believe that our size and scale, geographic reach, advanced technology and our expansive suite of products, services, brands and proprietary networks contribute to our leading industry position.
We provide our payment products and services in a variety of combinations to create customized payment solutions for our customers and partners. Our payment programs enable businesses to better manage and control employee spending and provide card-accepting merchants with a high volume customer base that can increase their sales and customer loyalty. In order to deliver our payment programs and services and process transactions, we own and operate six proprietary “closed-loop” networks through which we electronically connect to merchants and capture, analyze and report customized information. We also use third-party networks to deliver our payment programs and services in order to broaden our card acceptance and use. To support our payment products, we also provide a range of services, such as issuing and processing, as well as specialized information services that provide our customers with value-added functionality and data. Our customers can use this data to track important business productivity metrics, combat fraud and employee misuse, streamline expense administration and lower overall fleet operating costs.
We market our payment products directly to a broad range of commercial fleet customers, including vehicle fleets of all sizes and government fleets. Among these customers, we provide our products and services predominantly to small and medium commercial fleets. We believe these fleets represent an attractive segment of the global commercial fleet market given their relatively high use of less efficient payment products, such as cash and general purpose credit cards. We also manage commercial fleet card programs for major oil companies, such as British Petroleum (BP) (including its subsidiary Arco), Chevron and Citgo, and over 800 petroleum marketers.
These companies collectively maintain hundreds of thousands of end-customer relationships with commercial fleets. We refer to these major oil companies and petroleum marketers with whom we have strategic relationships as our “partners.”
FleetCor’s predecessor company was organized in the United States in 1986.
Our products and services
We sell a range of customized fleet and lodging payment programs directly and indirectly through partners, such as major oil companies and petroleum marketers. We provide our customers with various card products that typically function like a charge card to purchase fuel, lodging and related products and services at participating locations. We support these cards with specialized issuing, processing and information services that enable us to manage card accounts, facilitate the routing, authorization, clearing and settlement of transactions, and provide value-added functionality and data including customizable card-level controls and productivity analysis tools. Depending on our customer’s and partner’s needs, we provide these services in a variety of outsourced solutions ranging from a comprehensive “end-to-end” solution (encompassing issuing, processing and network services) to limited back office processing services. In addition, we offer a telematics solution in Europe that combines global positioning, satellite tracking and other wireless technology to allow fleet operators to monitor the capacity utilization and movement of their vehicles and drivers. Furthermore, we offer prepaid fuel and food vouchers and cards in Mexico that may be used as a form of payment in restaurants, grocery stores and gas stations. Approximately 8.5%10.4% of our revenue during the year ended December 31, 20102011 came from our lodging and telematics products.
Networks
In order to deliver our payment programs and services, we own and operate sixeight proprietary closed-loop networks in North America and internationally. In other geographiescases we utilize the networks of our major oil and petroleum marketer partners. Our networks have well-established brands in local markets and proprietary technology that enable us to capture, transact, analyze and report value-added information pertinent to managing and controlling employee spending. OurExamples of our networks include:
North American proprietary closed-loop networks
| • | Fuelman network—our primary proprietary fleet card network in the United States. We have negotiated card acceptance and settlement terms with over |
| • | Corporate Lodging Consultants network (CLC)—our proprietary lodging network in the United States and Canada. The CLC Lodging network covers more than |
| • | Commercial Fueling Network (CFN)—our “members only” unattended fueling location network in the United States and Canada. The CFN network is composed of approximately |
International proprietary closed-loop networks
| • | Keyfuels network—our primary proprietary fleet card network in the United Kingdom. We have negotiated card acceptance and settlement terms with approximately |
| • | CCS network—our primary proprietary fleet card network in the Czech Republic and Slovakia. We have negotiated card acceptance and settlement terms with several major oil companies on a brand-wide basis, including Agip, Benzina, OMV and Shell, and with approximately |
| • | Petrol Plus Region (PPR) network—our primary proprietary fleet card network in Russia, Poland, Ukraine, Belarus, Lithuania, Estonia and Latvia. We have negotiated card acceptance and settlement terms with |
| • | Mexican network—our newly acquired proprietary fuel and food card and voucher networks in Mexico. We have negotiated acceptance and settlement terms with approximately 18,230 individual merchants, providing the Mexican network with over 61,890 fueling sites and 5,595 food sites. |
| • | Allstar network—our newly acquired proprietary fleet card network in the United Kingdom. We have negotiated card acceptance and settlement terms with approximately 3,200 individual merchants, providing this network with over 7,500 fueling sites. |
Third-Party networks
In addition to our proprietary “closed-loop” networks, we also utilize various third-party networks to deliver our payment programs and services. TheseExamples of these networks include:
| • | MasterCard network—In the United States, we issue corporate cards that utilize the MasterCard payment network, which includes |
country. Our co-branded MasterCard corporate cards have additional purchasing capabilities and can be accepted at over |
| • | Major oil and fuel marketer networks—The proprietary networks of branded locations owned by our major oil and petroleum marketer partners in both North America and internationally are generally utilized to support the proprietary, branded card programs of these partners. |
| • | UTA network—UNION TANK Eckstein GmbH & Co. KG (UTA) operates a network of over |
| • | DKV network—DKV operates a network of over 45,000 fleet card-accepting locations across 36 countries throughout Europe, including more than 30,500 fueling sites. The DKV network is generally utilized by European transport companies that travel between multiple countries. |
| • | Carnet networks—In Mexico, we issue fuel cards and food cards that utilize the Carnet payment network, which includes approximately 8,700 fueling sites and 78,890 food locations across the country. |
Customers and distribution channels
We provide our products and services primarily to fleet customers and our major oil company and petroleum marketer partners. Our commercial fleet customers are businesses that operate fleets comprised of one or more vehicles, including small fleets (1-10 vehicles), medium fleets (11-150 vehicles), large fleets (over 150 vehicles), and government fleets (which are owned and operated by governments). We also provide services through strategic relationships with our partners, ranging in size from major oil companies, such as British Petroleum (BP) (including its subsidiary, Arco), Chevron, Shell and Citgo, to small petroleum marketers with a single fueling location. While we refer to companies with whom we have strategic relationships as “partners,” our legal relationships with these companies are contractual, and do not constitute legal partnerships.
We distribute our products and services directly to fleet customers as well as through our major oil company and petroleum marketer partners. We provide comprehensive “end-to-end” support for our direct card programs that include issuing, processing and network services. We manage and market the fleet card programs of our partners under our partners’ own brands. We support these programs with a variety of business models ranging from fully outsourced card programs, which include issuing, processing and network services, to card programs where we may only provide limited back office processing services. These supporting services vary based on our partners’ needs and their own card program capabilities.
We primarily provide issuing, processing and information services to our major oil company partners, as these partners utilize their proprietary networks of branded locations to support their card programs. In addition, we provide network services to those major oil company partners who choose to offer a co-branded MasterCard as part of their card program. Our agreements with our major oil company partners typically have initial terms of five to ten years with current remaining terms ranging from less than one year up to seven years. During the year ended December 31, 2010, ourOur top three strategic relationships with major oil companies represented in the aggregate approximately 22%21%, 18%22% and 14%18% of our consolidated revenue for the years ended December 31,
2011, 2010 2009 and 2008,2009, respectively. No single partner represented more than 10% of our consolidated revenue in these periods other than one partner,for the years ended December 31, 2011, 2010 and 2009 except for Chevron, which represented approximately 11% of our consolidated revenue for each of the yearyears ended December 31, 2011 and 2010.
We provide similar products and services to government fleet customers as we provide to other commercial fleet customers. Our government fleet customers generally constitute local, state or federal government-affiliated departments and agencies with vehicle fleets, such as police vehicle fleets and school bus fleets. For a description of our financial information by our North American and International segments and geographical areas, see “Note 16—Segments.”
Sales and marketing
We market our products and services to fleet operators in North America and internationally through multiple channels including field sales, telesales, direct marketing, point-of-sale marketing and the internet. We also leverage the sales and marketing capabilities of our strategic relationships with over 800 oil companies, petroleum marketers, card marketers and leasing companies. As of December 31, 2010,2011, we employed approximately 319370 sales and marketing employees worldwide that are focused on acquiring new customers for all of our direct business card programs, as well as select card programs for oil companies and petroleum marketers. We also utilize tradeshows, advertising and other awareness campaigns to market our products and services.
In marketing our products and services, we emphasize the size and reach of our card acceptance networks, the benefits of our purchasing controls and reporting functionality and a commitment to high standards of customer service. We utilize proprietary and third-party databases to develop our prospect universe, and segment those prospects by various characteristics, including industry, geography, fleet size and credit score, to identify potential customers. We develop customized offers for different types of potential customers and work to deliver those offers through the most effective marketing channel. We actively manage prospects across our various marketing channels to optimize our results and avoid marketing channel conflicts.
Our primary means of acquiring new customers include:
| • | Field sales—Our direct sales team includes approximately |
| • | Telesales—We had approximately |
| • | Direct marketing—We market directly to potential fleet customers via mail and email. We test various program offers and promotions, and adopt the most successful features into subsequent direct marketing initiatives. We seek to enhance the sales conversion rates of our direct marketing efforts by coordinating timely follow-up calls by our telesales teams. |
| • | Point-of-sale marketing—We provide marketing literature at the point-of-sale within our proprietary networks and those of major oil companies and petroleum marketers. Literature may include “take-one” applications, pump-top advertising and in-store advertising. Our point-of-sale marketing leverages the branding and distribution reach of the physical merchant locations. |
| • | Internet marketing—We manage numerous marketing websites around the |
| • | Product-specific websites—Our product-specific websites, including fuelman.com, cfnnet.com, checkinncard.com and keyfuels.co.uk, focus on one or more specific products, provide the most in-depth information available online regarding those particular products, allow prospects to apply for cards online (where appropriate) and allow customers to access and manage their accounts online. We manage product-specific websites for our own proprietary card programs as well as card programs of select oil companies and petroleum marketers. |
| • | Marketing portals—Our marketing portals, including fleetcardsUSA.com and fuelcards.co.uk, serve as information sources for fleet operators interested in fleet card products. In addition to providing helpful information on fleet management, including maintenance, tax reporting and fuel efficiency, these websites allow fleet operators to research card products, compare the features and benefits of multiple products, and identify the card product which best meets the fleet manager’s needs. Our exclusive FleetMatch™ technology matches an operator’s information, including fleet size, geographic span of operations and fuel type usage, to the benefits and features of our various fleet card products and provides a customized product recommendation to the fleet manager. |
As part of our internet marketing strategy, we monitor and modify our marketing websites to improve our search engine rankings and test our advertising keywords to optimize our pay-per-click advertising spend among the major internet search firms such as Google and Yahoo.
| • | Strategic relationships—We have developed and currently manage relationships with over 800 oil companies, independent petroleum marketers, card marketers and leasing companies. Our major oil company and petroleum marketer relationships offer our payment processing and information management services to their fleet customers in order to establish and enhance customer loyalty. Our card programs for major oil companies and petroleum marketers carry their proprietary branding and may or may not be accepted in one of our merchant networks. We benefit from the marketing efforts of major oil companies and petroleum marketers with whom we have strategic relationships to attract customers to their fueling locations. We manage the fleet card sales and marketing efforts for several major oil companies across the full spectrum of channels, including field sales, telesales, direct marketing, point-of-sale marketing and internet marketing. In these cases, we establish dedicated sales and marketing teams to focus exclusively on marketing the products of major oil companies and petroleum marketers. Our major oil company relationships include some of the world’s largest oil companies such as BP, Chevron, Shell and Citgo. Through our leasing company relationships, we offer our payment processing and information management services to their fleet customers as part of the leasing company’s broader package of fleet services. Our leasing company relationships all reside outside of North America, and we view these relationships as an important strategic growth area. |
Account management
| • | Customer service, account activation, account retention. We provide account management and customer services with approximately |
| • | Welcome and activation—We have dedicated teams that contact and welcome our new customers. These teams focus on successful activation and utilization of our new customers and provide training and education on the use of our products and services. |
| • | Strategic account management—We assign designated account managers who serve as the single point of contact for our large fleets. Our account managers have in-depth knowledge of our |
programs and our customers’ operations and objectives. Our account managers train fleet operators and support them on the operation and optimal use of our programs, oversee account setup and activation, review online billing and create customized reports. Our account managers also prepare periodic account reviews, provide specific information on trends in their accounts and work together to identify and discuss major issues and emerging needs of large fleets. |
| • | Account retention—We have proprietary, proactive strategies to contact customers who may be at risk of terminating their relationship with us. Through these strategies we seek to address service concerns, enhance product structures and provide customized solutions to address customer issues. |
| • | Merchant network services—Our representatives work with merchants such as fuel and vehicle maintenance providers to enroll them in one of our proprietary networks, install and test all network and terminal software and hardware and train them on the sale and transaction authorization process. In addition, our representatives provide transaction analysis and site reporting and address settlement issues. |
| • | Credit underwriting and collections. We follow detailed application credit review, account management, and collections procedures for all our fleet customers. We use multiple levers including billing frequency, payment terms, spending limits and security to manage risk in our portfolio. |
| • | New account underwriting. We use a combination of quantitative, third-party credit scoring models and judgmental underwriting to screen potential customers and establish appropriate credit terms and spend limits. Our underwriting process provides additional scrutiny for large credit amounts and we utilize tiered credit approval authority among our management. |
| • | Prepaid and secured accounts. We also offer products and services on a prepaid or fully-secured basis. Prepaid customer accounts are funded with an initial deposit and subsequently debited for each purchase transacted on the cards issued to the customer. Fully-secured customer accounts are funded with an initial deposit equal to the anticipated purchase volume for a given timeframe. The deposit is held until such time as the customer either fails to pay the account or closes its account after paying outstanding amounts. Under either approach, our prepaid and fully-secured offerings allow us to market to a broader universe of prospects, including customers who might otherwise not meet our credit standards. |
| • | Monitoring and account management. We have developed proprietary fraud detection programs to monitor transactions and prevent misuse of our products. We monitor the credit quality of our portfolio monthly utilizing external credit scores and internal behavior data to identify high risk or deteriorating credit quality accounts. We conduct targeted strategies to minimize exposure to high risk accounts, including reducing spending limits and payment terms or requiring additional security. |
| • | Collections. As accounts become delinquent, we may suspend future transactions based on our risk assessment of the account. Our collections strategy includes a combination of internal and outsourced resources which use both manual and dialer-based calling strategies. We use a segmented collection strategy which prioritizes higher risk and higher balance accounts. For severely delinquent, high balance accounts we may pursue legal |
Competition
We face considerable competition in our business. The most significant competitive factors in our business are the breadth of product and service features, network acceptance size, customer service and account management and price. We believe that we generally compete favorably with respect to each of these factors. However, we may experience competitive disadvantages with respect to each of these factors from time to time as potential customers prioritize or value these competitive factors differently. As a result, a specific offering of our products and service features, networks and pricing may serve as a competitive advantage with respect to one customer and a disadvantage for another based on the customers’ preferences.
We compete with independent fleet card providers, providers of card outsourcing services and major financial services companies as well as major oil companies and petroleum marketers that issue their own fleet cards. We also compete with providers of alternative payment mechanisms, such as financial institutions that issue corporate and consumer credit cards, and merchants offering house accounts as well as other forms of credit. Our primary independent fleet card competitors are Wright Express Corporation, Comdata Corporation and U.S. Bank Voyager Fleet Systems Inc. in North America and Arval UK Group Limited (a subsidiary of BNP Paribas)Wright Express Corporation, Edenred and Sodexo, Inc. internationally.
Technology
Our technology provides continuous authorization of transactions, processing of critical account and client information and settlement between merchants, issuing companies and individual commercial entities. We recognize the importance of state-of-the-art, secure, efficient and reliable technology in our business and have made significant investments in our applications and infrastructure. In 2010,2011, we spent more than $18$27 million in capital and operating expenses to operate, protect and enhance our technology and we expect to spend a similar amountapproximately $35 million in 2012 due in part to the integration of our Mexican prepaid card business and our UK fuel card business (Allstar) acquisitions during the second half of 2011.
Our technology function comprises approximately 124130 employees, as of December 31, 2010,2011, based in the United States and Europe with expertise in the management of applications, transaction networks and infrastructure. We operate application development centers in the United States, United Kingdom, Netherlands, Russia and Czech Republic. Our distributed application architecture allows us to maintain, administer and upgrade our systems in a cost-effective and flexible manner. We integrate our systems with third-party vendor applications for certain products, sales and customer relationship management and back-office support. Our technology organization has undertaken and successfully executed large scale projects to develop or consolidate new systems, convert oil company and petroleum marketer systems and integrate acquisitions while continuing to operate and enhance existing systems.
Our technology infrastructure is supported by best-in-class, highly-secure data centers, with redundant locations. We operate three primary data centers, located in Atlanta, Georgia, Prague, Czech Republic and Las Vegas, Nevada. We use only proven, client-server technology and have no foreseeable capacity limitations. Our systems meet the highest standards for security with multiple industry certifications. Our network is configured with multiple layers of security to isolate our databases from unauthorized access. We use sophisticated security protocols for communication among applications, and our employees access critical components on a need-only basis. As of December 31, 2010,2011, we have not experienced any breaches in network, application or data security.
We maintain up-to-date disaster recovery and business continuity plans. Our telecommunications and internet systems have multiple levels of redundancy to ensure reliability of network service. In 2010,2011, we experienced 99.99% up-time for authorizations.
Proprietary processing systems
We operate several proprietary processing systems that provide the features and functionality to run our card programs, including our card issuing, processing and information services. Our processing systems also integrate with our proprietary networks, which provide brand awareness and connectivity to our acceptance locations that enables the “end-to-end” card acceptance, data capture and transaction authorization capabilities of our card programs. Our proprietary processing systems are tailored to meet the unique needs of the individual markets they serve.
Intellectual property
Our intellectual property is an essential element of our business. We use trademark, copyright, trade secret and other intellectual property laws and confidentiality agreements to protect our intellectual property. We own
trademark registrations supporting a number of our brands, such as FleetCor®, Fuelman®, FleetNet®, FleetCards
USA®, CFN®, and Mannatec® in the United States. We also own trademark registrations in various European jurisdictions for a number of our brands, such as Keyfuels®, The Fuelcard Company®, CCS®, iMonitor® and, Transit Card®,and Allstar®. Our employees involved in technology development in some of the countries in which we operate, including the United States, are required to sign agreements acknowledging that all intellectual property created by them on our behalf is owned by us. We also have stringent internal policies regarding the protection, disclosure and use of our confidential information.
Regulatory
A substantial number of laws and regulations, both in the United States and in other jurisdictions, apply to businesses offering payment cards to customers or processing or servicing such cards. Thesefor payment cards and related accounts. In the United States, these laws generally apply onlyprimarily to consumer cards, which are cards used to make purchases for personal, family or household purposes. Because our payment cards are limited to purchases for business purposes only, they are typically classified as commercial cards whichand are generally not subject to many of the laws and regulations applicable to consumer cards. However,As a result, our business is less regulated than one that provides products or services to consumers; yet, we are still subject to significant regulation,domestic and theforeign regulation.
The following, while not exhaustive, is a description of certain United Statesseveral federal and state laws and regulations and certainin the United States that are applicable to our business. The laws and regulations of other jurisdictions applicablealso affect us, and they may be more or less restrictive than those in the United States and may also impact different parts of our operations. In addition, the legal and regulatory framework governing our business is subject to our business.ongoing revision, and changes in that framework could have a significant effect on us.
Federal Trade Commission Act
The Federal Trade Commission Act empowers the Federal Trade Commission, (the “FTC”)or FTC, to regulate unfair methods of competition and unfair or deceptive acts or practices affecting commerce. While this power is generally applies onlyexercised to “consumers,”protect consumers, the FTC has sometimes taken enforcement action on behalf of small business owners in certain circumstances. We also may be subject tobusinesses. A number of state laws and regulations that generallyalso prohibit engaging in unfair and deceptive business practices, which may extend to small businesses. Other countries in which we operate also regulate unfair and deceptive practices in a similar manner.practices.
Truth in Lending Act
The Truth in Lending Act, or TILA, which is implemented by the Federal Reserve’s Regulation Z, was enacted to increase consumer awareness of the cost of credit.credit and is implemented by Regulation Z. Most provisions of TILA and Regulation Z apply only to the extension of “consumer”consumer credit, but a limited number of provisions apply to commercial cards includingas well. One example where TILA and Regulation Z are generally applicable is a provision providinglimitation on liability for unauthorized use, although a business that in cases where tenacquires 10 or more credit cards are issued by a card issuer for use by the employees of an organization, the organization, to which credit is extended, mayits personnel can agree to liability imposed on the organization for unauthorized use without regard to Regulation Z limitations.more expansive liability. Our cardholder agreements generally provide that the customer agrees that if it has been issued ten or more cards at its request, then the customer waivesfor these business customers to waive, to the fullest extent possible, all limitations on liability for unauthorized card use.
Credit Card Accountability, Responsibility, and Disclosure Act of 2009
The Credit Card Accountability, Responsibility, and Disclosure Act of 2009 amended provisions of TILA that affect consumer credit and also directed the Federal Reserve Board to study the use of credit cards by small businesses and to make legislative recommendations. The report concluded that it is not clear whether the potential benefits outweigh the increased cost and reduced credit availability if the disclosure and substantive restrictions applicable to consumer cards were to be applied to small business cards. Legislation has been introduced to increase the protections afforded to small businesses that use payment cards. If legislation of this kind were enacted, our products and services for small businesses could be impacted.
Equal Credit Opportunity Act
The Equal Credit Opportunity Act, which is implemented by the Federal Reserve’sor ECOA, together with Regulation B prohibitsprohibit creditors from discriminating when extending credit on certain “prohibited bases”prohibited bases, such as an applicant’s sex, race, nationality, age and marital status, and further requires that creditors disclose the reasons they tookfor taking any adverse action against an applicant or a customer.customer seeking credit.
The Fair Credit Reporting Act
The Fair Credit Reporting Act, of 1970, or FCRA, regulates consumer reporting agencies and the disclosure and use of consumer reports by consumer reporting agencies.reports. We are permitted tomay obtain consumer reports with respect to an individual who guarantees or otherwise is obligated on a commercial card.
FACT Act
The Fair and Accurate Credit Transactions Act of 2003 or the FACT Act, amended certain provisions of FCRA applicable to consumer reports generally not applicable to business credit. However, the FACT Act included provisions that requireand requires creditors to adopt Identity Theft Prevention Programsidentity theft prevention programs to detect, prevent and mitigate
identity theft including detecting identity theft “red flags,” in connection with covered accounts, which can include business purpose accounts for which there is a reasonably foreseeable risk of identity theft (the “Red Flags Rules”). Enforcement of the Red Flags Rules by the FTC took effect January 1, 2011.theft.
Bank Secrecy Act
We are subject to certain provisions of theThe Currency and Foreign Transactions Reporting Act, and the accompanying regulations issued by the U.S. Department of the Treasury, orwhich is also known as the Bank Secrecy Act asand which has been amended by the USA PATRIOT Act of 2001, or the Patriot Act. The Patriot Act contains a wide variety of provisions aimed at fighting terrorism and money laundering. Among other things, the Bank Secrecy Act as amendedand implementing regulations issued by the Patriot Act, requires financial servicesU.S. Treasury Department require financial-services providers to establish anti-money laundering programs, that meet certain standards, including, in some instances, expanded reportingto report suspicious activity, and enhanced information gathering and recordkeeping requirements.to maintain a number of related records. We maintain anti-money laundering controls designed to prevent our network from being used for money laundering or terrorist financing purposes. Other countries in which we operate have also enacted laws or regulations regarding anti-terrorism and money laundering.
Credit Card Accountability Responsibility and Disclosure Act of 2009
The Credit Card Accountability Responsibility and Disclosure Act of 2009, or the Credit CARD Act, was adopted on May 22, 2009 and amended certain provisions of the TILA and Regulation Z generally not applicable to business purpose cards. However, the Credit CARD Act directs the Federal Reserve to conduct a study of credit card use by small businesses, and not later than 12 months after enactment to provide a report to Congress including recommendations for administrative or legislative initiatives to provide protections for credit card plans for small businesses, as appropriate. Any changes in credit card rules applicable to small businesses resulting from the study and recommendations, if any, may affect our small business customer card plans.financing.
Dodd-Frank Wall Street Reform and Consumer Protection Act
In July 2010, President Obama signed into law theThe Dodd-Frank Wall Street Reform and Consumer Protection Act of 2010, or the Reform Act. The ReformDodd-Frank Act, iseffected comprehensive in scope and containsrevisions to a wide array of provisions intending to govern the practices and oversight offederal laws governing financial institutions, financial services, and other participants in the financial markets. The focusAmong its most notable provisions is the creation of the Reform Act is consumer protection oriented; our principal business in the United States, however, is business purpose charge cards which do not currently appear to be the focusBureau of the reforms. For instance, among other matters, the law creates a new independent Consumer Financial Protection, Bureau, which will regulate consumer credit across the U.S. economy. The Bureau will have broad rulemaking and enforcement authority over providers of credit, savings, payment and otheris charged with regulating consumer financial products or services and services. Itwhich is unknown how this new bureau will exercise its authority. Many provisionsassuming much of the Reformrulemaking authority under TILA, ECOA, FCRA, and other federal laws affecting the extension of credit. The implementation of the Dodd-Frank Act requireis still in its early stages, and as a result, its overall impact remains far from clear. Its provisions, however, are sufficiently far reaching that, even though our industry was not targeted, it is possible that we could be directly or indirectly impacted. For example, a provision of the adoption of ruleslaw requires credit card issuers to implement. Proposedcollect and report information regarding applications made by women and minority owned businesses and small businesses. We are preparing for this requirement, but proposed regulations have not been published. Accordingly,
Payment card industry rules
Partner banks issuing payment cards bearing the ultimate consequences ofMasterCard brand, and FleetCor to the Reform Actextent that we provide certain services in connection with those cards and its implementingfleet customers acting as merchants accepting those cards, must comply with the bylaws, regulations on our business, results of operations and financial conditionrequirements that are uncertain at this time.promulgated by MasterCard and other applicable payment-card organizations, including the Payment Card Industry Data Security Standard developed by MasterCard and VISA, the MasterCard Site Data Protection Program and other applicable data-security program requirements.
State usury laws
SomeExtensions of credit under many of our card products may be deemed to involvetreated as commercial purpose loans. Most stateIn some states, usury laws providelimit the interest rates that money cannotcan be lent at ancharged not only on consumer loans but on commercial loans as well. To the extent that these usury laws apply, we are limited in the amount of interest rate in excess of a certain statutory maximum. This “usury limit” may act as a ceiling on interest to cardholders for the extension of credit. These limits are often different for consumer cardsthat we can charge and commercial cards.collect from our customers. Because we have substantial operations in multiple jurisdictions, and we utilize choice of law provisions in our cardholder agreements we have flexibility as to the laws of which jurisdiction to apply. In addition, the interest rates on certain of our card products are set based upon the usury limit of the cardholder’s state. With respect to card products where we work with a partner or issuing bank, the partner bank may utilize the law of the jurisdiction applicable to the bank and “exports” the usury limit of that state in connection with cards issued to residents of other states or we may use our choice of law provisions.
Payment card industry rules
Partner banks issuing payment cards bearing the MasterCard brand, and FleetCor to the extent it provides certain services in connection with those cards and fleet customers acting as merchants accepting those cards, must comply with the bylaws, regulations and requirements that are promulgated by MasterCard and other applicable payment card organizations, including the Payment Card Industry Data Security Standard developed by MasterCard and Visa, the MasterCard Site Data Protection Program, and any other applicable bank card data security program requirements.
Other laws and regulations
We are subject to U.S. federala variety of laws and stateregulations governing privacy, data security, and breach notification laws and regulations, as well as data protection laws in the foreign countries in which we operate.notification. We are also subject to debt-collection laws and to bankruptcy and debtor reliefother debtor-relief laws that can affect our ability to collect amounts owed to us.
Employees and labor relations
As of December 31, 2010,2011, we employed approximately 1,1972,130 employees, approximately 664700 of whom were located in the United States. None of our employees are subject to a collective bargaining agreement. We consider our employee relations to be good and have never experienced a work stoppage.
Additional Information
Our website address iswww.fleetcor.com. You may obtain free electronic copies of our annual report on Form 10-K, quarterly reports on Form 10-Q, current reports on Form 8-K and all amendments to such reports required to be filed or furnished pursuant to Section 13 or 15(d) of the Securities Exchange Act of 1934, as amended, at our website under the headings “Investor Relations—SEC Filings.Filing.”
ITEM X. EXECUTIVE OFFICERS OF THE REGISTRANT
The following table sets forth certain information regarding the members of our board of directors and our executive officers, with their respective ages as of December 31, 2010.2011. Our officers serve at the discretion of our board of directors. There are no family relationships between any of our directors or executive officers.
Name | Age | Position(s) | ||||
| 56 | |||||
| ||||||
Eric R. Dey | 52 | Chief Financial Officer | ||||
Todd W. House | 40 | President—U.S. Direct Business and Chief Operating Officer | ||||
| ||||||
| 51 | Executive Vice President—Global Business Products | ||||
John S. Coughlin | 44 | Executive Vice President—Corporate Development | ||||
Jeffrey D. Lamb | 54 | Executive Vice President—Global Strategy and U.S. Sales and Marketing | ||||
William J. Schmit | 55 | President—North American Partner Business | ||||
Timothy J. Downs | 54 | President—Corporate Lodging Consultants | ||||
Charles Freund | 39 | President—Developing Markets | ||||
Andrew R. Blazye | 53 | Chief Executive Officer—FleetCor Europe |
Ronald F. Clarke has been our President and Chief Executive Officer since August 2000 and was appointed Chairman of our board of directors in March 2003. From 1999 to 2000, Mr. Clarke served as President and Chief Operating Officer of AHL Services, Inc., a staffing firm. From 1990 to 1998, Mr. Clarke served as chief marketing officer and later as a division president with Automatic Data Processing, Inc., a computer services company. From 1987 to 1990, Mr. Clarke was a principal with Booz Allen Hamilton, a global management consulting firm. Earlier in his career, Mr. Clarke was a marketing manager for General Electric Company, a diversified technology, media, and financial services corporation.
Eric R. Dey has been our Chief Financial Officer since November 2002. From October 2000 to October 2002, Mr. Dey served as Chief Financial Officer of NCI Corporation, a call center company. From July 1999 to October 2000, Mr. Dey served as Chief Financial Officer of Leisure Time Technology, a software development/manufacturing company. On March 16, 2001, Leisure Time Technology filed a petition for bankruptcy under the federal bankruptcy laws. From 1994 to 1999, Mr. Dey served as Corporate Controller with Excel Communications, a telecommunications service provider. From 1984 to 1994, Mr. Dey held a variety of financial and accounting positions with PepsiCo, Inc., a global beverage, snack and food company.
Todd W. House has been our President—U.S. Direct Business since December 2010 and our Chief Operating Officer since April 2009. From July 2007 to April 2009, Mr. House held various positions, including Chief Financial Officer, with Axiant, LLC, a provider of financial services and recovery management solutions. From April 2005 to July 2007, Mr. House was Vice President and Chief Credit Officer with Carmax, Inc., an automobile retailer. From August 1993 to April 2005, Mr. House was Vice President–Credit Risk Management with Capital One Financial Corp., a financial services company. On November 20, 2009, Axiant, LLC filed a petition for bankruptcy under the federal bankruptcy laws.
Van E. Huff has been our Chief Information Officer since October 2004. From August 1984 to October 2004, Mr. Huff served in various positions, including as Senior Vice President—IT for First Data Corporation, a provider of electronic commerce and payment solutions.
Robert P. Brandes has been with us since June 2002. Mr. Brandes was named our Executive Vice President—Global Business Products effective December 2010. From September 2009 to December 2010, Mr. Brandes served as our President—Universal Fleet Cards. Mr. Brandes served as Senior Vice President—Product Management from December 2008 to September 2009, Senior Vice President—Co-Brand from January 2007 to December 2008 and Vice President—Marketing from June 2002 to January 2007.
John S. Coughlin has served as our Executive Vice President—Corporate Development since September 2010. From 2007 to 2010, Mr. Coughlin served as a Managing Director at PCG Capital Partners, a private equity firm. From 2005 to 2006, Mr. Coughlin served as Chief Executive Officer of NCDR LLC (dba Kool Smiles), a private equity owned national dental practice management company. From 1994 to 2005, Mr. Coughlin was with The Parthenon Group, a strategic advisory and principal investment firm, where he was a Senior Partner and the founder and head of the firm’s San Francisco office.
Jeffrey D. Lambjoined us in December 2010 and serves as our Executive Vice President—Global Strategy and U.S. Sales and Marketing. In July 2005, Mr. Lamb co-founded Socius Capital, LLC, an independent financial sponsor and management company to small and medium-sized businesses, and served as its Managing Director until December 2010. Since December 2008, Mr. Lamb has served on the Board of Managers of Wazee Companies, LLC, an electrical repair and maintenance service provider. Between July 2006 and March 2009, Mr. Lamb served on the Board of Directors of On the Scene Productions, Inc., a video production company for the public relations industry. Mr. Lamb also served as the Chief Executive Officer of On the Scene Productions, Inc. between July 2006 and February 2008. On the Scene Productions, Inc. filed its voluntary petition for bankruptcy liquidation under the U.S. Bankruptcy Code in October 2009. From 2001 to 2004, Mr. Lamb was Senior Director of Worldwide Marketing for the service division of Sun Microsystems, Inc. (acquired by Oracle Corporation in January 2010), a provider of network computing infrastructure solutions.
William J. Schmit, Jr. has served as our President—Major Oil Card Programs since November 2005. From April 1999 to November 2005, Mr. Schmit served as our Senior Vice President—Private Label Programs.
Timothy J. Downs joined us as President—Corporate Lodging Consultants in connection with our acquisition of CLC Group, Inc. in April 2009. Prior to joining us, Mr. Downs held various positions with Corporate Lodging Consultants, including Vice President Technology from May 1999 to September 2004 and as Executive Vice President Operations from September 2004 to April 2009.
Charles Freundwas named our President—Developing Markets effective December 2010 and has been with us since 2000. From January 2009 to December 2010, Mr. Freund served as our Senior Vice President—Corporate Strategy. Mr. Freund served as our Managing Director—The Fuelcard Company UK Limited from June 2006 to December 2008. Prior to June 2006, Mr. Freund served as our Vice President of Business Development.
Andrew R. Blazye has served as our Chief Executive Officer—FleetCor Europe, since July 2007. From April 2006 to June 2007, Mr. Blazye was a Group Director for Dunnhumby Ltd., a research firm. From September 1980, to March 2006, Mr. Blazye held various positions with Shell International Ltd., a subsidiary of Royal Dutch Shell plc, a global energy company, including Global Payments General Manager.
You should carefully consider the following risks applicable to us. If any of the following risks actually occur, our business, operating results, financial condition and the trading price of our common stock could be materially adversely affected. The risks discussed below also include forward-looking statements, and our actual results may differ substantially from those discussed in these forward-looking statements. See “Note Regarding Forward-Looking Statements” in this report.
Risks related to our business
A decline in retail fuel prices could adversely affect our revenue and operating results.
Our fleet customers use our products and services primarily in connection with the purchase of fuel. Accordingly, our revenue is affected by fuel prices, which are subject to significant volatility. A decline in retail fuel prices could cause a decrease in our revenue from fees paid to us by merchants based on a percentage of each transaction purchase amount. We believe that in 2010,2011, approximately 19.1%20% of our consolidated revenue was directly influenced by the absolute price of fuel. In this annual report, for the periods between January 1, 2005 and December 31, 2009, we refer to our consolidated revenue as adjusted for the impact of the new accounting guidance related to our securitization facility as our “consolidated revenue on a managed basis”. For the periods prior to January 1, 2005, we did not maintain a securitization facility. Changes in the absolute price of fuel may also impact unpaid account balances and the late fees and charges based on these amounts. A decline in retail fuel prices could adversely affect our revenue and operating results.
Fuel prices are dependent on several factors, all of which are beyond our control. These factors include, among others:
supply and demand for oil and gas, and market expectations regarding supply and demand;
actions by members of OPEC and other major oil-producing nations;
political conditions in oil-producing and gas-producing nations, including insurgency, terrorism or war;
oil refinery capacity;
weather;
the prices of foreign exports;
the implementation of fuel efficiency standards and the adoption by our fleet customers of vehicles with greater fuel efficiency or alternative fuel sources;
general worldwide economic conditions; and
governmental regulations, taxes and tariffs.
A portion of our revenue is derived from fuel-price spreads. As a result, a contraction in fuel-price spreads could adversely affect our operating results.
Approximately 21.4%19% of our consolidated revenue in 20102011 was derived from transactions where our revenue is tied to fuel-price spreads. Fuel-price spreads equal the difference between the fuel price we charge to the fleet customer and the fuel price paid to the fuel merchant. In transactions where we derive revenue from fuel-price spreads, the fuel price paid to the fuel merchant is calculated as the merchant’s wholesale cost of fuel plus a commission. The merchant’s wholesale cost of fuel is dependent on several factors including, among others, the factors described above affecting fuel prices. The fuel price that we charge to our fleet customer is dependent on several factors including, among others, the fuel price paid to the fuel merchant, posted retail fuel prices and competitive fuel prices. We experience fuel-price spread contraction when the merchant’s wholesale cost of fuel increases at a faster rate than the fuel price we charge to our fleet customers, or the fuel price we charge to our
fleet customers decreases at a faster rate than the merchant’s wholesale cost of fuel. Accordingly, when fuel-price spreads contract, we generate less revenue, which could adversely affect our operating results.
If we fail to adequately assess and monitor credit risks of our customers, we could experience an increase in credit loss.
We are subject to the credit risk of our customers, many of which are small to mid-sized businesses. We use various methods to screen potential customers and establish appropriate credit limits, but these methods cannot eliminate all potential credit risks and may not always prevent us from approving customer applications that are fraudulently completed. Changes in our industry and movement in fuel prices may result in periodic increases to customer credit limits and spending and, as a result, increased credit losses. We may also fail to detect changes to the credit risk of customers over time. Further, during a declining economic environment, we experience increased customer defaults.defaults and preference claims by bankrupt customers. If we fail to adequately manage our credit risks, our bad debt expense could be significantly higher than historic levels and adversely affect our business, operating results and financial condition.
We derive a portion of our revenue from program fees and charges paid by the users of our cards. Any decrease in our receipt of such fees and charges, or limitations on our fees and charges, could adversely affect our business, results of operations and financial condition.
Our card programs include a variety of fees and charges associated with transactions, cards, reports, late payments and optional services. We derived approximately 52.6%55% of our consolidated revenue on a managed basisrevenues from these fees and charges during the year ended December 31, 2010.2011. If the users of our cards decrease their transaction activity, the extent to which they pay invoices late or their use of optional services, our revenue could be materially adversely affected. In addition, several market factors can affect the amount of our fees and charges, including the market for similar charges for competitive card products and the availability of alternative payment methods such as cash or house accounts. Furthermore, regulators and Congress have scrutinized the electronic payments industry’s pricing, charges and other practices related to its customers. Any legislative or regulatory restrictions on our ability to price our products and services could materially and adversely affect our revenue. Any decrease in our revenue derived from these fees and charges could materially and adversely affect our business, operating results and financial condition.
We operate in a competitive business environment, and if we are unable to compete effectively, our business, operating results and financial condition would be adversely affected.
The market for our products and services is highly competitive, and competition could intensify in the future. Our competitors vary in size and in the scope and breadth of the products and services they offer. Our primary competitors in the United StatesNorth America are small, regional and large independent fleet card providers, major oil companies and petroleum marketers that issue their own fleet cards and major financial services companies that provide card services to major oil companies and petroleum marketers. Competitors in the hotel card business include travel agencies, online lodging discounters, internal corporate procurement and travel resources, and independent services companies, among others. We also compete for customers with providers of alternative payment mechanisms, such as financial institutions that issue corporate and consumer credit cards and merchants offering house cash accounts or other forms of credit. Our primary competitors in Europe are independent fleet card providers, major oil companies and petroleum marketers that issue branded fleet cards, and providers of card outsourcing services to major oil companies and petroleum marketers.
The most significant competitive factors in our business are the breadth of product and service features, network acceptance size, customer service and account management and price. We may experience competitive disadvantages with respect to any of these factors from time to time as potential customers prioritize or value these competitive factors differently. As a result, a specific offering of our products and service features, networks and pricing may serve as a competitive advantage with respect to one customer and a disadvantage for another based on the customers’ preferences.
Some of our existing and potential competitors have longer operating histories, greater brand name recognition, larger customer bases, more extensive customer relationships or greater financial and technical resources. In
addition, our larger competitors may also have greater resources than we do to devote to the promotion and sale of their products and services and to pursue acquisitions. For example, major oil companies and petroleum marketers and large financial institutions may choose to integrate fuel-card services as a complement to their existing card products and services. As a result, they may be able to adapt more quickly to new or emerging technologies and changing opportunities, standards or customer requirements. To the extent that our competitors are regarded as leaders in specific categories, they may have an advantage over us as we attempt to further penetrate these categories.
Future mergers or consolidations among competitors, or acquisitions of our competitors by large companies may present competitive challenges to our business. Resulting combined entities could be at a competitive advantage if their fuel-card products and services are effectively integrated and bundled into sales packages with their widely utilized non-fuel-card-related products and services. Further, larger competitors have reduced, and could continue tomay reduce the fees for their services, which has increased and may continue tocould increase pricing pressure within our markets.
Overall, increased competition in our markets could result in intensified pricing pressure, reduced profit margins, increased sales and marketing expenses and a failure to increase, or a loss of, market share. We may not be able to maintain or improve our competitive position against our current or future competitors, which could adversely affect our business, operating results and financial condition.
Our business is dependent on several key strategic relationships, the loss of which could adversely affect our operating results.
We intend to seek to expand our strategic relationships with major oil companies. We refer to the major oil companies and petroleum marketers with whom we have strategic relationships as our “partners.” During 2010,2011, our top three strategic relationships with major oil companies accounted for approximately 22%21% of our consolidated revenue. In the year ended December 31, 2010,2011, one partner, Chevron, accounted for approximately 11% of our consolidated revenue. Two of our partners eachrevenue and one other partner represented greater than 5% of our consolidated revenue during 2010.2011. Our agreements with our major oil company partners typically have initial terms of five to ten years with current remaining terms ranging from less than one year up to ten years.
The success of our business is in part dependent on our ability to maintain these strategic relationships and enter into additional strategic relationships with major oil companies. In our relationships with these major oil companies, our services are marketed under our partners’ brands. If these partners fail to maintain their brands, or decrease the size of their branded networks, our ability to grow our business may be adversely affected. Our inability to maintain or further develop these relationships or add additional strategic relationships could materially and adversely affect our business and operating results.
To enter into a new strategic relationship or renew an existing strategic relationship with a major oil company, we often must participate in a competitive bidding process, which may focus on a limited number of factors, such as pricing. The use of these processes may affect our ability to effectively compete for these relationships. Our competitors may be willing to bid for these contracts on pricing or other terms that we consider uneconomical in order to win this business. The loss of our existing major oil company partners or the failure to contract with additional partners could materially and adversely affect our business, operating results and financial condition.
We depend, in part, on our merchant relationships to grow our business. To grow our customer base, we must retain and add relationships with merchants who are located in areas where our customers purchase fuel and lodging. If we are unable to maintain and expand these relationships, our business may be adversely affected.
A portion of our growth is derived from acquiring new merchant relationships to serve our customers, our new and enhanced product and service offerings and cross-selling our products and services through existing merchant relationships. We rely on the continuing growth of our merchant relationships and our distribution channels in order to expand our customer base. There can be no guarantee that this growth will continue.
Similarly, our growth also will depend on our ability to retain and maintain existing merchant relationships that accept our proprietary closed-loop networks in areas where our customers purchase fuel and lodging. Our contractual agreements with fuel merchants typically have initial terms of one year and automatically renew on a year-to-year basis unless either party gives notice of termination. Our agreements with lodging providers typically have initial terms of one year and automatically renew on a month-to-month basis unless either party gives notice of termination. Furthermore, merchants with which we have relationships may experience bankruptcy, financial distress, or otherwise be forced to contract their operations. The loss of existing merchant relationships, the contraction of our existing merchants’ operations or the inability to acquire new merchant relationships could adversely affect our ability to serve our customers and our business and operating results.
A decline in general economic conditions, and in particular, a decline in demand for fuel and other vehicle products and services would adversely affect our business, operating results and financial condition.
Our operating results are materially affected by conditions in the economy generally, both in the United States and internationally. We generate revenue based in part on the volume of fuel purchase transactions we process. Our transaction volume is correlated with general economic conditions, particularly in the United States and Europe, and in particular, the amount of business activity in these economies.economies in which we operate. Downturns in these economies are generally characterized by reduced commercial activity and, consequently, reduced purchasing of fuel and other vehicle products and services by businesses. The recession in 2007 and 2008 negatively affected the organic growth of our business in 2009, which resulted from lower transaction volume from existing customers. Unfavorable changes in economic conditions, including declining consumer confidence, inflation, recession or other changes, may lead our customers, which are largely comprised of commercial fleets, to demand less fuel, or lead our partners to reduce their use of our products and services. These declines could result from, among other things, reduced fleet traffic, corporate purchasing, travel and other commercial activities from which we derive revenue.
Further, economic conditions also may impact the ability of our customers or partners to pay for fuel or other services they have purchased and, as a result, our reserve for credit losses and write-offs of accounts receivable could increase. In addition, demand for fuel and other vehicle products and services may be reduced by other factors that are beyond our control, such as the development and use of vehicles with greater fuel efficiency and alternative fuel sources.
We are unable to predict the likely duration and severity of the current disruption in financial markets and adverse economic conditions in the United States and Europe. As a result, a sustained deterioration in general economic conditions in the United States or Europe, or increases in interest rates in key countries in which we operate, could adversely affect our business and operating results.
We have expanded into new lines of business in the past and may do so in the future. If we are unable to successfully integrate these new businesses, our results of operations and financial condition may be adversely affected.
We have expanded our business to encompass new lines of business in the past. For example, within the past several years we have entered into the fuel and food card and voucher business in Mexico, the lodging card business in the United States and now offer a limited telematics service to European customers. We may continue to enter new lines of business and offer new products and services in the future. There is no guarantee that we will be successful in integrating these new lines of business into our operations. If we are unable to do so, our operating results and financial condition may be adversely affected.
If we fail to develop and implement new technology, products and services, adapt our products and services to changes in technology or the marketplace, or if our ongoing efforts to upgrade our technology, products and services are not successful, we could lose customers and partners.
The markets for our products and services are highly competitive, and characterized by technological change, frequent introduction of new products and services and evolving industry standards. We must respond to the
technological advances offered by our competitors and the requirements of our customers and partners, in order to maintain and improve upon our competitive position. We may be unsuccessful in expanding our technological capabilities and developing, marketing or selling new products and services that meet these changing demands, which could jeopardize our competitive position. In addition, we engage in significant efforts to upgrade our products and services and the technology that supports these activities on a regular basis. If we are unsuccessful in completing the migration of material technology, otherwise upgrading our products and services and supporting technology or completing or gaining market acceptance of new technology, products and services, it would have a material adverse effect on our ability to retain existing customers and attract new ones in the impacted business line.
Our debt obligations, or our incurrence of additional debt obligations, could limit our flexibility in managing our business and could materially and adversely effectaffect our financial performance.
As of December 31, 2010,2011, we had approximately $313.8$419 million of long-term indebtedness outstanding. In addition, we are permitted under our credit agreement to incur additional indebtedness, subject to specified limitations. Our substantial indebtedness currently outstanding, or as may be outstanding if we incur additional indebtedness, could have important consequences, including the following:
we may have difficulty satisfying our obligations under our debt facilities and, if we fail to satisfy these obligations, an event of default could result;
we may be required to dedicate a substantial portion of our cash flow from operations to required payments on our indebtedness, thereby reducing the availability of cash flow for acquisitions, working capital, capital expenditures and other general corporate activities. See “Management’s Discussion and Analysis of Financial Condition and Results of Operations—Contractual Obligations,” which sets forth our payment obligations with respect to our existing long-term debt;
covenants relating to our debt may limit our ability to enter into certain contracts or to obtain additional financing for acquisitions, working capital, capital expenditures and other general corporate activities;
covenants relating to our debt may limit our flexibility in planning for, or reacting to, changes in our business and the industry in which we operate, including by restricting our ability to make strategic acquisitions;
we may be more vulnerable than our competitors to the impact of economic downturns and adverse developments in the industry in which we operate;
we are exposed to the risk of increased interest rates because certain of our borrowings are subject to variable rates of interest;
although we have no current intention to pay any dividends, we may be unable to pay dividends or make other distributions with respect to your investment; and
we may be placed at a competitive disadvantage against any less leveraged competitors.
The occurrence of one or more of these potential consequences could have a material adverse effect on our business, financial condition, operating results, and ability to satisfy our obligations under our indebtedness.
In addition, we and our subsidiaries may be able to incur substantial additional indebtedness in the future. Although our credit agreement containsagreements contain restrictions on the incurrence of additional indebtedness, these
restrictions are subject to a number of significant qualifications and exceptions, and under certain circumstances, the amount of additional indebtedness that could be incurred in compliance with these restrictions could be substantial. If new debt is added to our existing debt levels, the related risks that we will face would increase.
We meet a significant portion of our working capital needs through a securitization facility, which we must renew on an annual basis.
We meet a significant portion of our working capital needs through a securitization facility, pursuant to which we sell accounts receivable to a special-purpose entity that in turn sells undivided participation interests in the accounts receivable to certain purchasers, who finance their purchases through the issuance of short-term commercial paper. The securitization facility has a one year term. During the financial crisis that began in 2008, the market for commercial paper experienced significant volatility. Although we have been able to renew our securitization facility annually, there can be no assurance that we will continue to be able to renew this facility in the future on terms acceptable to us.
A significant rise in fuel prices could cause our accounts receivable to increase beyond the capacity of the securitization facility. There can be no assurance that the size of the facility can be expanded to meet these increased working capital needs. Further, we may not be able to fund such increases in accounts receivable with our available cash resources. Our inability to meet working capital needs could adversely affect our financial condition and business, including our relationships with merchants, customers and partners. Further, we are exposed to the risk of increased interest rates because our borrowings under the securitization facility are subject to variable rates of interest.
We are subject to risks related to volatility in foreign currency exchange rates, and restrictions on our ability to utilize revenue generated in foreign currencies.
As a result of our foreign operations, we are subject to risks related to changes in currency rates for revenue generated in currencies other than the U.S. dollar. For the year ended December 31, 2010,2011, approximately 33.7%33.0% of our revenue was denominated in currencies other than the U.S. dollar (primarily Czech koruna, Russian ruble, British pound and British pound)Mexican peso). Revenue and profit generated by international operations may increase or decrease compared to prior periods as a result of changes in foreign currency exchange rates. Resulting exchange gains and losses are included in our net income. Volatility in foreign currency exchange rates may materially adversely affect our operating results and financial condition.
Furthermore, we are subject to exchange control regulations that restrict or prohibit the conversion of more than a specified amount of our foreign currencies into U.S. dollars, and, as we expand, we may become subject to further exchange control regulations that limit our ability to freely utilize and transfer currency in and out of particular jurisdictions. These restrictions may make it more difficult to effectively utilize the cash generated by our operations and may adversely effectaffect our financial condition.
We conduct a significant portion of our business in foreign countries and we expect to expand our operations into additional foreign countries where we may be adversely affected by operational and political risks that are greater than in the United States.
We have foreign operations in, or provide services for commercial card accounts in, Belarus, Belgium, Botswana, Canada, the Czech Republic, Estonia, Ireland, Latvia, Lithuania, Luxembourg, Mexico, Namibia, the Netherlands, Pakistan, Poland, the Russian Federation, Slovakia, South Africa, Swaziland, Ukraine and the United Kingdom. We also expect to seek to expand our operations into various countries in Asia, Europe and Latin America as part of our growth strategy.
Some of the countries where we operate, and other countries where we will seek to operate, have undergone significant political, economic and social change in recent years, and the risk of unforeseen changes in these countries may be greater than in the United States. In particular, changes in laws or regulations, including with
respect to taxation, information technology, data transmission and the Internet, or in the interpretation of existing laws or regulations, whether caused by a change in government or otherwise, could materially adversely affect
our business, operating results and financial condition. In addition, conducting and expanding our international operations subjects us to other risks that we do not generally face in the United States. These include:
difficulties in managing the staffing of our international operations, including hiring and retaining qualified employees;
difficulties and increased expense introducing corporate policies and controls in our international operations;
increased expense related to localization of our products and services, including language translation and the creation of localized agreements;
potentially adverse tax consequences, including the complexities of foreign value added tax systems, restrictions on the repatriation of earnings and changes in tax rates;
increased expense to comply with foreign laws and legal standards, including laws that regulate pricing and promotion activities and the import and export of information technology, which can be difficult to monitor and are often subject to change;
increased expense to comply with U.S. laws that apply to foreign operations, including the Foreign Corrupt Practices Act and Office of Foreign Assets Control regulations;
longer accounts receivable payment cycles and difficulties in collecting accounts receivable;
increased financial accounting and reporting burdens and complexities;
political, social and economic instability;
terrorist attacks and security concerns in general; and
reduced or varied protection for intellectual property rights and cultural norms in some geographies that are simply not respectful of intellectual property rights.
The occurrence of one or more of these events could negatively affect our international operations and, consequently, our operating results. Further, operating in international markets requires significant management attention and financial resources. Due to the additional uncertainties and risks of doing business in foreign jurisdictions, international acquisitions tend to entail risks and require additional oversight and management attention that are typically not attendant to acquisitions made within the United States. We cannot be certain that the investment and additional resources required to establish, acquire or integrate operations in other countries will produce desired levels of revenue or profitability.
We are dependent on technology systems and electronic communications networks managed by third parties, which could result in our inability to prevent disruptions in our services.
Our ability to process and authorize transactions electronically depends on our ability to communicate with our fuel, lodging and vehicle maintenance providersmerchants electronically through point-of-sale devices and electronic networks that are owned and operated by third parties. In addition, in order to process transactions promptly, our computer equipment and network servers must be functional 24 hours a day, which requires access to telecommunications facilities managed by third-parties and the availability of electricity, which we do not control. A severe disruption of one or more of these networks, including as a result of utility or third-party system interruptions, could impair our ability to authorize transactions and process information, which could harm our reputation, result in a loss of customers or partners and adversely affect our business and operating results.
We also utilize third-party providers to assist us with disaster recovery operations. As a result, we are subject to the risk of a provider’s unresponsiveness in the event of a significant breakdown in our computer equipment or networks. Furthermore, our property and business interruption insurance may not be adequate to compensate us for all losses or failures that may occur.
We may experience software defects, system errors, computer viruses and development delays, which could damage customer relations,relationships, decrease our profitability and expose us to liability.
Our products and services are based on proprietary and third-party network technology and processing systems that may encounter development delays and could be susceptible to undetected errors, viruses or defects. Development delays, system errors, viruses or defects that result in service interruption or data loss could have a material adverse effect on our business, damage our reputation and subject us to third-party liability. In addition, errors, viruses and defects in our network technology and processing systems could result in additional development costs and the diversion of our technical and other resources from other development efforts or operations. Further, our attempts to limit our potential liability, through disclaimers and limitation-of-liability provisions in our agreements, may not be successful.
We may incur substantial losses due to fraudulent use of our fleetpayment cards.
Under certain circumstances, when we fund customer transactions, we may bear the risk of substantial losses due to fraudulent use of our fleetpayment cards. We do not maintain any insurance to protect us against any such losses.
We may not be able to adequately protect the data we collect, about our customers and partners, which could subject us to liability and damage our reputation.
We electronically receive, process, store and transmit our customers’data and partners’ sensitive information about our customers and partners, including bank account information and expense data. We keep this information confidential; however, our websites, networks, information systems, services and technologies may be targeted for sabotage, disruption or misappropriation. Unauthorized access to our networks and computer systems could result in the theft or publication of confidential information or the deletion or modification of records or could otherwise cause interruptions in our service and operations.
Because techniques used to obtain unauthorized access or to sabotage systems change frequently and may not be recognized until launched against a target, we may be unable to anticipate these techniques or to implement adequate preventative measures. Although we believe we have sufficient controls in place to prevent disruption and misappropriation and to respond to such attacks, any inability to prevent security breaches could have a negative impact on our reputation, expose us to liability, decrease market acceptance of electronic transactions and cause our present and potential clients to choose another service provider. Any of these developments could have a material adverse effect on our business, operating results and financial condition.
We expect to expand through acquisitions, which may divert our management’s attention and result in unexpected operating difficulties, increased costs and dilution to our stockholders. We also may never realize the anticipated benefits of the acquisitions.
We have been an active business acquirer both in the United StatesNorth America and internationally, and, as part of our growth strategy, we expect to seek to acquire businesses, commercial account portfolios, technologies, services and products in the future. We have substantially expanded our overall business, customer base, headcount and operations both domestically and internationally through acquisitions. The acquisition and integration of each business involves a number of risks and may result in unforeseen operating difficulties and expenditures in assimilating or integrating the businesses, technologies, products, personnel or operations of the acquired business. Furthermore, future acquisitions may:
involve our entry into geographic or business markets in which we have little or no prior experience;
involve difficulties in retaining the customers of the acquired business;
involve difficulties and expense associated with regulatory requirements, competition controls or investigations;
result in a delay or reduction of sales for both us and the business we acquire; and
disrupt our ongoing business, divert our resources and require significant management attention that would otherwise be available for ongoing development of our current business.
In addition, international acquisitions often involve additional or increased risks including, for example:
difficulty managing geographically separated organizations, systems and facilities;
difficulty integrating personnel with diverse business backgrounds, languages and organizational cultures;
difficulty and expense introducing our corporate policies or controls;
increased expense to comply with foreign regulatory requirements applicable to acquisitions;
difficulty entering new foreign markets due to, among other things, lack of customer acceptance and a lack of business knowledge of these new markets; and
political, social and economic instability.
To complete a future acquisition, we may determine that it is necessary to use a substantial amount of our cash or engage in equity or debt financing. If we raise additional funds through further issuances of equity or convertible debt securities, our existing stockholders could suffer significant dilution, and any new equity securities we issue could have rights, preferences and privileges senior to those of holders of our common stock. Any debt financing obtained by us in the future could involve restrictive covenants relating to our capital-raising activities and other financial and operational matters that make it more difficult for us to obtain additional capital in the future and to pursue other business opportunities, including potential acquisitions. In addition, we may not be able to obtain additional financing on terms favorable to us, if at all, which could limit our ability to engage in acquisitions. Moreover, we can make no assurances that the anticipated benefits of any acquisition, such as operating improvements or anticipated cost savings, would be realized or that we would not be exposed to unexpected liabilities in connection with any acquisition.
Further, an acquisition may negatively affect our operating results because it may require us to incur charges and substantial debt or other liabilities, may cause adverse tax consequences, substantial depreciation and amortization or deferred compensation charges, may require the amortization, write-down or impairment of amounts related to deferred compensation, goodwill and other intangible assets, or may not generate sufficient financial return to offset acquisition costs.
The market for fleet-cardfleet card services is evolving and may not continue to develop or grow.
Our fleet-cardfleet card businesses rely on the acceptance and use of payment cards by businesses to purchase fuel for their vehicle fleets. If the use of fleet cards by businesses does not continue to grow, it could have a material adverse effect on our business, operating results and financial condition. In order to consistently increase and maintain our profitability, businesses and partners must continue to adopt our services. Similarly, growth in the acceptance and use of fleet cards will be impacted by the acceptance and use of electronic payment transactions generally. Furthermore, new technologies may displace fleet cards as payment mechanisms for fuel purchase transactions. A decline in the acceptance and use of fleet cards, and electronic payment transactions generally, by businesses and merchants could have a material adverse effect on our business, operating results and financial condition. The market for our lodging cards and food vouchers and cards is also evolving and that portion of our business is subject to similar risks.
Our balance sheet includes significant amounts of goodwill and intangible assets. The impairment of a significant portion of these assets would negatively affect our financial results.
Our balance sheet includes goodwill and intangible assets that represent approximately 53.6%48.3% of our total assets at December 31, 2010.2011. These assets consist primarily of goodwill and identified intangible assets associated with our acquisitions. We also expect to engage in additional acquisitions, which may result in our recognition of
additional goodwill and intangible assets. Under current accounting standards, we are required to amortize certain intangible assets over the useful life of the asset, while goodwill is not amortized. On at least an annual basis, we assess whether there have been impairments in the carrying value of goodwill and indefinite lived intangible assets. If the carrying value of the asset is determined to be impaired, then it is written down to fair value by a charge to operating earnings. An impairment of a significant portion of goodwill or intangible assets could materially negatively affect our operating results and financial condition.
If we are unable to protect our intellectual property rights and confidential information, our competitive position could be harmed and we could be required to incur significant expenses in order to enforce our rights.
To protect our proprietary technology, we rely on copyright, trade secret and other intellectual property laws and confidentiality agreements with employees and third parties, all of which offer only limited protection. Despite our precautions, it may be possible for third parties to obtain and use without consent confidential information or infringe on our intellectual property rights, and our ability to police that misappropriation or infringement is uncertain, particularly in countries outside of the United States. In addition, our confidentiality agreements with employees, vendors, customers and other third parties may not effectively prevent disclosure or use of proprietary technology or confidential information and may not provide an adequate remedy in the event of such unauthorized use or disclosure.
Protecting against the unauthorized use of our intellectual property and confidential information is expensive, difficult and not always possible. Litigation may be necessary in the future to enforce or defend our intellectual property rights, to protect our confidential information, including trade secrets, or to determine the validity and scope of the proprietary rights of others. This litigation could be costly and divert management resources, either of which could harm our business, operating results and financial condition. Accordingly, despite our efforts, we may not be able to prevent third parties from infringing upon or misappropriating our intellectual property and proprietary information.
We cannot be certain that the steps we have taken will prevent the unauthorized use or the reverse engineering of our proprietary technology. Moreover, others may independently develop technologies that are competitive to ours or infringe our intellectual property. The enforcement of our intellectual property rights also depends on our legal actions against these infringers being successful, and we cannot be sure these actions will be successful, even when our rights have been infringed. Furthermore, effective patent, trademark, service mark, copyright and trade secret protection may not be available in every country in which we may offer our products and services.
Claims by others that we or our customers infringe their intellectual property rights could harm our business.
Third parties could claim that our technologies and processes underlying our products and services infringe their intellectual property. In addition, to the extent that we gain greater visibility and market exposure, as a public company, we may face a higher risk of being the target of intellectual property infringement claims asserted by third parties. We may, in the future, receive notices alleging that we have misappropriated or infringed a third party’s intellectual property rights. There may be third-party intellectual property rights, including patents and pending patent applications that cover significant aspects of our technologies, processes or business methods. Any claims of infringement or misappropriation by a third party, even those without merit, could cause us to incur substantial defense costs and could distract our management from our business, and there can be no assurance that we will be able to prevail against such claims. Some of our competitors may have the capability to dedicate substantially greater resources to enforcing their intellectual property rights and to defending claims that may be brought against them than we do. Furthermore, a party making such a claim, if successful, could secure a judgment that requires us to pay substantial damages, potentially including treble damages if we are found to have willfully infringed a patent. A judgment could also include an injunction or other court order that could prevent us from offering our products and services. In addition, we might be required to seek a license for the use of a third party’s intellectual
property, which may not be available on commercially reasonable terms or at all. Alternatively, we might be required to develop non-infringing technology, which could require significant effort and expense and might ultimately not be successful.
Third parties may also assert infringement claims against our customers relating to their use of our technologies or processes. Any of these claims might require us to defend potentially protracted and costly litigation on their behalf, regardless of the merits of these claims, because under certain conditions we agree to indemnify our customers from third-party claims of intellectual property infringement. If any of these claims succeed, we might be forced to pay damages on behalf of our customers, which could adversely affect our business, operating results and financial condition.
Our success is dependent, in part, upon our executive officers and other key personnel, and the loss of key personnel could materially adversely affect our business.
Our success depends, in part, on our executive officers and other key personnel. Our senior management team has significant industry experience and would be difficult to replace. The market for qualified individuals is competitive, and we may not be able to attract and retain qualified personnel or candidates to replace or succeed members of our senior management team or other key personnel. The loss of key personnel could materially adversely affect our business.
Changes in laws, regulations and enforcement activities may adversely affect our products and services and the markets in which we operate.
The electronic payments industry is subject to increasing regulation in the United States and internationally. Domestic and foreign government regulations impose compliance obligations on us and restrictions on our operating activities, which can be difficult to administer because of their scope, mandates and varied requirements. We are subject to a number of government regulations, including, among others: interest rate and fee restrictions; credit access and disclosure requirements; collection and pricing regulations; compliance obligations; security and data breach requirements; identity theft avoidance programs; and anti-money laundering compliance programs. Government regulations can also include licensing or registration requirements. While a large portion of these regulations focuses on individual consumer protection, legislatures continue to consider whether to include business consumers within the scope of these regulations. As a result, new or expanded regulation focusing on business cardholders or changes in interpretation or enforcement of regulations may have an adverse effect on our business and operating results, due to increased compliance costs and new restrictions affecting the terms under which we offer our products and services.
Our partner banks also operate in a highly regulated industry, which recently has been the subject of extensive structural reforms that are expected to negatively affect the conduct and scope of their businesses, their ability to maintain or expand offerings of products and services, and the costs of their operations. These legislative and regulatory changes could prompt our partner banks to alter the extent or the terms of their dealings with us in ways that may have adverse consequences for our business.
In addition, we have structured our business in accordance with existing tax laws and interpretations, including those related to state occupancy taxes, value added taxes in foreign jurisdictions and restrictions on repatriation of funds or transfers of revenue between jurisdictions. Changes in tax laws or their interpretations could increase our tax liability, further limit our utilization of funds located in foreign jurisdictions and have a material adverse effect on our business and financial condition.
We generate a portion of our revenue from our lodging card business, which is affected by conditions in the hotel industry generally and has a concentration of customers in the railroad and trucking industries.
Revenue from our lodging card business, which we acquired on April 1, 2009, equaled $36.9 million of our consolidated revenue for the year ended December 31, 2010. Our lodging card business earns revenue from customers purchasing lodging from the hotel industry and derives a significant portion of this revenue from end users in the railroad and trucking industries. Therefore, we are
exposed to risks affecting each of these industries. For example, unfavorable economic conditions adversely impacting the hotel, railroad and trucking industries generally could cause a decrease in demand for our products and services in our lodging card business, resulting in decreased revenue.revenue, or increased credit risk and related losses, resulting in increased expenses. In addition, mergers or consolidations in these industries could reduce our customer and partnership base, resulting in a smaller market for our products and services.
We contract with government entities and are subject to risks related to our governmental contracts.
In the course of our business we contract with domestic and foreign government entities, including state and local government fleet customers, as well as federal government agencies. As a result, we are subject to various laws and regulations that apply to companies doing business with federal, state and local governments. The laws relating to government contracts differ from other commercial contracting laws and our government contracts may contain pricing terms and conditions that are not common among private contracts. In addition, we may be subject to investigation from time to time concerning our compliance with the laws and regulations relating to our government contracts. Our failure to comply with these laws and regulations may result in suspension of these contracts or administrative or other penalties.
Litigation and regulatory actions could subject us to significant fines, penalties or requirements resulting in increased expenses.
We are not currently party to any legal proceedings or governmental inquiries or investigations that we consider to be material. We are, however, subject to litigation from time to time in the ordinary course of our business, which if ultimately determined unfavorably could force us to pay damages or fines, or change our business practices, any of which could have a material adverse effect on our operating results. In addition, we may become involved in various actions or proceedings brought by domestic and foreign governmental regulatory agencies in connection with acquisitions or in the event of alleged noncompliance with laws or regulations, which could potentially subject us to significant fines, penalties or other requirements resulting in increased expenses or restricting the conduct of our business. We are currently involved in such an investigation by the Office of Fair Trading in the United Kingdom, relating to our Keyfuels product line. This product line consists of our proprietary payment card and associated site network in the United Kingdom. A competitor alleged we are dominant in a relevant market with our Keyfuels product line. The Office of Fair Trading is investigating whether we are dominant and, if dominant, whether some of our contracts with some sites and dealers would constitute exclusive dealings requiring them to be reformed to eliminate exclusivity. The Office of Fair Trading has issued a statement of objections, which we have responded to, and we are responding to.awaiting its conclusions. Although we do not currently anticipate an adverse result or material adverse impact from the investigation, if determined adversely, the regulator has authority to require us to reform contracts to eliminate exclusivity and impose significant fines. We also notified the Office of Fair Trading about our recent acquisition of Allstar Business Solutions Limited, in which we provided an analysis that the acquisition does not result in a substantial lessening of competition on any affected market and we subsequently responded to questions posed by the Office of Fair Trading in the course of its review. We anticipate that the Office of Fair Trading will determine whether or not to make a referral to the Competition Commission for further consideration by March 28, 2012. If the Competition Commission were to conclude that the acquisition results in a substantial lessening of competition, it could require remedial action, which could negatively affect our financial results.
We rely on third parties for card issuing and processing services supporting our MasterCard network fleet card products. Failure to maintain these contractual relationships upon acceptable terms would have an adverse effect on our MasterCard network fleet card offerings, customer retention and operating results.
Some of our fleet-card products in North America are accepted in the MasterCard merchant network pursuant to our contractual relationships with two issuing banks and two third-party processors. In order to continue offering fleet cards accepted at MasterCard network merchants, we must maintain our contractual relationship with at least one issuing bank. Further, unless we develop our own MasterCard-approved processing capabilities, we
must continue to obtain processing services from at least one processor approved by MasterCard with the capability to provide acceptable levels of reporting data for fleet operators. Generally, these contracts have remaining terms of between threeseven months and five years and automatically renew from year to year unless either party provides notice of termination; however, onetermination. One of the two issuing banks has provided us with notice that it does not intend to automatically renew our agreement when it expires in 2012. Approximately 2.6% of our 2010 revenue was associated with this issuing bank. We intend to replace this issuing bank if satisfactory arrangements to renew the contract are not concluded and we believe an alternative issuing bank can be found; however, ourbank. Our failure to maintain theseadequate relationships, or find suitable alternatives, could have an adverse effect on our MasterCard network fleet card products, our customer retention and our operating results.
Changes in MasterCard interchange fees could decrease our revenue.
A portion of our revenue is generated by network processing fees charged to merchants, known as interchange fees, associated with transactions processed using our MasterCard-branded fleet cards. Interchange fee amounts associated with our MasterCard network fleet cards are affected by a number of factors, including regulatory limits in the United States and Europe and fee changes imposed by MasterCard. In addition, interchange fees are the subject of intense legal and regulatory scrutiny and competitive pressures in the electronic payments industry, which could result in lower interchange fees generally in the future. Temporary or permanent decreases in the interchange fees associated with our MasterCard network fleet-card transactions, could adversely affect our business and operating results.
If we are not able to maintain and enhance our brands, it could adversely affect our business, operating results and financial condition.
We believe that maintaining and enhancing our brands is critical to our customer relationships, and our ability to obtain partners and retain employees. The successful promotion of our brands will depend upon our marketing and public relations efforts, our ability to continue to offer high-quality products and services and our ability to successfully differentiate our services from those of our competitors. In addition, future extension of our brands to add new products or services different from our current offerings may dilute our brands, particularly if we fail to maintain our quality standards in these new areas. The promotion of our brands will require us to make substantial expenditures, and we anticipate that the expenditures will increase as our markets become more competitive and we expand into new markets. To the extent that these activities yield increased revenue,revenues, this revenue may not offset the expenses we incur. There can be no assurance that our brand promotion activities will be successful.
Failure to comply with the United States Foreign Corrupt Practices Act, and similar laws associated with our international activities, could subject us to penalties and other adverse consequences.
As we continue to expand our business internationally, we may expand into certain foreign countries, particularly those with developing economies, where companies often engage in business practices that are prohibited by U.S. and U.K. regulations, including the United States Foreign Corrupt Practices Act, or the FCPA.FCPA, and the U.K. Bribery Act. Such laws prohibit improper payments or offers of payments to foreign governments and their officials and political parties by U.S. and other business entities for the purpose of obtaining or retaining business. We have implemented policies to discourage such practices; however, there can be no assurances that all of our employees, consultants and agents, including those that may be based in or from countries where practices that violate U.S. laws may be customary, will not take actions in violation of our policies, for which we may be ultimately responsible. Violations of the FCPA may result in severe criminal or civil sanctions and suspension or debarment from U.S. government contracting, which could negatively affect our business, operating results and financial condition.
Risks related to ownership of our common stock
Our stock price will likelycould be volatile and mayour stock could decline in value.
The market price of our common stock may fluctuate substantially as a result of many factors, some of which are beyond our control. Factors that could cause fluctuations in the market price of our common stock include the following:
quarterly variations in our results of operations;
results of operations that vary from the expectations of securities analysts and investors;
results of operations that vary from those of our competitors;
changes in expectations as to our future financial performance, including financial estimates by securities analysts and investors;
announcements by us or our competitors of significant contracts, acquisitions, or capital commitments;
announcements by third parties of significant claims or proceedings against us;
regulatory developments in the United States and abroad;
future sales of our common stock, and additions or departures of key personnel; and
general domestic and international economic, market and currency factors and conditions unrelated to our performance.
In addition, the stock market in general has experienced significant price and volume fluctuations that have often been unrelated or disproportionate to operating performance of individual companies. These broad market factors may seriously harm the market price of our common stock, regardless of our operating performance. In the past, following periods of volatility in the market price of a company’s securities, securities class action litigation has often been instituted. A securities class action suit against us could result in significant liabilities and, regardless of the outcome, could result in substantial costs and the diversion of our management’s attention and resources.
Our principal stockholders have a controlling influence over our business affairs.
Our principal stockholders and their affiliates beneficially own or control, directly or indirectly, 54,814,868at June 30, 2011, 49,589,138 shares of our common stock, which in the aggregate represents approximately 69%62% of the outstanding shares of our common stock. As a result, if some of these persons or entities act together, they will have the ability to exercise significant influence over matters submitted to our stockholders for approval, including the election and removal of directors, amendments to our certificate of incorporation and bylaws and the approval of any business combination. These actions may be taken even if they are opposed by other stockholders. This concentration of ownership may also have the effect of delaying or preventing a change of control of our company or discouraging others from making tender offers for our shares, which could prevent our stockholders from receiving a premium for their shares.
Some of these persons or entities who make up our principal stockholders may have interests different from our other stockholders. For example, they may be more interested in selling FleetCor to an acquirer than other stockholders or may want us to pursue strategies that deviate from the interests of other stockholders.
Future sales, or the perception of future sales, of a substantial amount of our common shares could depress the trading price of our common stock.
If we or our stockholders sell substantial amounts of our shares of common stock in the public market or if the market perceives that these sales could occur, the market price of shares of our common stock could decline. These sales may make it more difficult for us to sell equity or equity-related securities in the future at a time and price that we deem appropriate, or to use equity as consideration for future acquisitions.
We have 475 million shares of common stock authorized and at December 31, 2010 had 79,655,213 shares of common stock outstanding. Of these shares, 14,576,250 shares are freely tradable. We, our executive officers and directors, and certain stockholders (subject to certain limited exceptions) have entered into agreements with the underwriters for our initial public offering not to sell or otherwise dispose of shares of our common stock until after June 12, 2011, with certain exceptions. Immediately upon the expiration of this lock-up period, 15,647,786 shares will be freely tradable pursuant to Rule 144 under the Securities Act of 1933 by non-affiliates and another 54,274,868 shares will be eligible for resale pursuant to Rule 144 under the Securities Act of 1933, subject to the volume, manner of sale and other limitations of Rule 144.
Our failure to maintain effective internal control over financial reporting could adversely affect our business, operating results and financial condition.
Beginning with our annual report for the year ended December 31, 2011, Section 404 of the Sarbanes-Oxley Act of 2002, or Section 404, will require us to include a report by our management on our internal control over financial reporting. This report must contain an assessment by management of the effectiveness of our internal control over financial reporting as of the end of the year and a statement as to whether or not our internal controls are effective. Our annual report for the year ended December 31, 2011 must also contain a statement that our independent registered public accounting firm has issued an attestation report on our internal control over financial reporting.
In order to achieve timely compliance with Section 404, we have begun a process to document and evaluate our internal control over financial reporting. Our efforts to comply with Section 404 have resulted in, and are likely
to continue to result in, significant costs, the commitment of time and operational resources and the diversion of management’s attention. Even if we develop effective controls, such controls may become inadequate because of changes in conditions, and the degree of compliance with the policies or procedures may deteriorate. If our management identifies one or more material weaknesses in our internal control over financial reporting, we will be unable to assert that our internal control over financial reporting is effective. If we are unable to assert that our internal control over financial reporting is effective, or if our independent registered public accounting firm is unable to express an unqualified opinion that we have maintained effective internal control over financial reporting, market perception of our financial condition and the market price of our stock may be adversely affected, we could be subject to sanctions or investigations by the New York Stock Exchange, the Securities and Exchange Commission (the SEC) or other regulatory authorities, and customer perception of our business may suffer.
Furthermore, implementing any appropriate changes to our internal control over financial reporting may entail substantial costs to modify our existing accounting systems, may take a significant period of time to complete and may distract our officers, directors and employees from the operation of our business. These changes, however, may not be effective in maintaining the adequacy of our internal control over financial reporting, and any failure to maintain that adequacy, or consequent inability to produce accurate financial statements on a timely basis, could increase our operating costs and could adversely affect our business, operating results and financial condition.
Our disclosure controls and procedures may not prevent or detect all errors or acts of fraud.
We are subject to the periodic reporting requirements of the Securities Exchange Act of 1934, as amended, or the Exchange Act. Our disclosure controls and procedures are designed to reasonably ensure that information required to be disclosed by us in reports we file or submit under the Exchange Act is accumulated and communicated to management and recorded, processed, summarized and reported within the time periods
specified in the rules and forms of the Securities and Exchange Commission. We believe that any disclosure controls and procedures or internal controls and procedures, no matter how well conceived and operated, can provide only reasonable, not absolute, assurance that the objectives of the control system are and will be met. These inherent limitations include the realities that judgments in decision-making can be faulty and that breakdowns can occur because of simple error or mistake. Additionally, controls can be circumvented by the individual acts of some persons, by collusion of two or more people or by an unauthorized override of the controls. Accordingly, because of the inherent limitations in our control system, misstatements due to error or fraud may occur and not be detected.
Anti-takeover provisions in our charter documents could discourage, delay or prevent a change in control of our company and may affect the trading price of our common stock.
Our corporate documents and the Delaware General Corporation Law contain provisions that may enable our board of directors to resist a change in control of FleetCor even if a change in control were to be considered favorable by you and other stockholders. These provisions:
stagger the terms of our board of directors and require supermajority stockholder voting to remove directors;
authorize our board of directors to issue preferred stock and to determine the rights and preferences of those shares, which may be senior to our common stock, without prior stockholder approval;
establish advance notice requirements for nominating directors and proposing matters to be voted on by stockholders at stockholder meetings;
prohibit our stockholders from calling a special meeting and prohibit stockholders from acting by written consent; and
require supermajority stockholder voting to effect certain amendments to our certificate of incorporation and bylaws.
In addition, our certificate of incorporation prohibits large stockholders, in particular those owning 15% or more of our outstanding voting stock, from merging or consolidating with us except under certain circumstances. These provisions could discourage, delay or prevent a transaction involving a change in control of FleetCor. These provisions could also discourage proxy contests and make it more difficult for you and other stockholders to elect directors of your choosing and cause us to take other corporate actions you desire.
We do not expect to pay any dividends on our common stock for the foreseeable future.
We currently expect to retain all future earnings, if any, for future operation, expansion and debt repayment and have no current plans to pay any cash dividends to holders of our common stock for the foreseeable future. Any decision to declare and pay dividends in the future will be made at the discretion of our board of directors and will depend on, among other things, our operating results, financial condition, cash requirements, contractual restrictions and other factors that our board of directors may deem relevant. In addition, we must comply with the covenants in our credit agreements in order to be able to pay cash dividends, and our ability to pay dividends generally may be further limited by covenants of any existing and future outstanding indebtedness we or our subsidiaries incur.
ITEM 1B. UNRESOLVED STAFF COMMENTS
We have received no written comments regarding our periodic or current reports from the staff of the SEC that were issued 180 days or more preceding the end of our fiscal year 20102011 that remain unresolved.
We lease all of the real property used in our business, except as noted below. The following table lists each of our material facilities and its location, use and approximate square footage.footage, at December 31, 2011.
Facility | Use | Approximate size | ||||
United States | Square Feet | |||||
| Norcross, Georgia | Corporate headquarters and operations | 57,300 | ||||
| Covington, Louisiana | Accounting, treasury, merchant authorization | 13,600 | ||||
| Houston, Texas | Credit and collections | 15,000 | ||||
| Carlsbad, California | Customer support | 3,900 | ||||
| Concord, California | Customer support | 7,100 | ||||
| CFN operations | 2,300 | |||||
| Wichita, Kansas | CLC operations and customer support | 31,100 | ||||
| ||||||
| Prague, Czech Republic | CCS headquarters, operations, customer service and sales | 55,000 | ||||
| 6,900 | ||||||
| Kaliningrad, Russia | PPR, Baltics, Poland sales and customer support | 1,400 | ||||
| Moscow, Russia | PPR headquarters, sales, customer support, operations, credit and collections | 14,500 | ||||
| Sales | ||||||
| Ipswich, United Kingdom(1) | Operations, sales and customer support | 17,900 | ||||
| Knaresborough, United Kingdom | Operations, sales and customer support | 5,100 | ||||
| London, United Kingdom | Europe headquarters | 2,800 | ||||
| Swindon, United Kingdom | Operations, sales and customer support | 34,000 | ||||
| Walsall, United Kingdom | Operations, sales and customer support | 9,500 | ||||
| (1) | We own |
We also lease a number of minor additional facilities, including local sales and operations offices less than 1,000 square feet, small storage facilities and a small number of service stations in the United Kingdom. We believe our facilities are adequate for our needs for at least the next 12 months. We anticipate that suitable additional or alternative facilities will be available to accommodate foreseeable expansion of our operations.
We are not currently party to any legal proceedings or governmental inquiries or investigations that we consider to be material. We are and may become, however, subject to lawsuits from time to time in the ordinary course of our business. We are currently involved in an investigation by the Office of Fair Trading in the United Kingdom, relating to our Keyfuels product line. This product line consists of our proprietary payment card and associated site network in the United Kingdom. A competitor alleged we are dominant in a relevant market with our Keyfuels product line. The Office of Fair Trading is investigating whether we are dominant and, if dominant, whether some of our contracts with some sites and dealers would constitute exclusive dealings requiring them to be reformed to eliminate exclusivity. The Office of Fair Trading has issued a statement of objections, which we responded to, and we are responding to.awaiting its conclusions. Although we do not currently anticipate an adverse result or material adverse impact from the investigation, if determined adversely, the regulator has authority to require us to reform contracts to eliminate exclusivity and impose significant fines. We also notified the Office of Fair Trading about our recent acquisition of Allstar Business Solutions Limited, in which we provided an analysis that the acquisition does not result in a substantial lessening of competition on any affected market and we subsequently responded to questions posed by the Office of Fair Trading in the course of its review. We anticipate that the Office of Fair Trading will determine whether or not to make a referral to the Competition
Commission for further consideration by March 28, 2012. If the Competition Commission were to conclude that the acquisition results in a substantial lessening of competition, it could require remedial action, which could negatively affect our financial results.
ITEM 4. RESERVEDMINE SAFETY DISCLOSURES
Not applicable.
PART II
ITEM 5. MARKET FOR REGISTRANT’S COMMON EQUITY, RELATED STOCKHOLDER MATTERS, AND ISSUER PURCHASES OF EQUITY SECURITIES
Our common stock is traded on the New York Stock Exchange (NYSE) under the symbol “FLT”. Shares of our common stock commenced trading on December 15, 2010. On March 10,As of December 31, 2011, there were 193 registered79 holders of record of our common stockstock. The table set forth below provides the intraday high and the closing pricelow sales prices per share of our common stock was $30.25. The highfor the four quarters during 2011 and low common stock sales prices per share were as follows:the sixteen day period during 2010.
Quarter Ended | December 31, 2010 | |||
High | $ | 31.43 | ||
Low | $ | 24.50 | ||
| High | Low | |||||||
2011: | ||||||||
First Quarter | $ | 34.40 | $ | 27.25 | ||||
Second Quarter | 37.51 | 29.16 | ||||||
Third Quarter | 30.15 | 25.25 | ||||||
Fourth Quarter | 29.96 | 25.78 | ||||||
2010: | ||||||||
Fourth Quarter (from December 15) | $ | 31.43 | $ | 24.50 | ||||
DIVIDENDS AND SHARE REPURCHASES
We currently expect to retain all future earnings, if any, for use in the operation and expansion of our business. We have never declared or paid any dividends on our common stock and do not anticipate paying cash dividends to holders of our common stock in the foreseeable future. In addition, our credit agreements restrict our ability to pay dividends. Any determination to pay dividends in the future will be at the discretion of our board of directors and will depend upon, among other factors, our results of operations, financial condition, capital requirements and covenants in our existing financing arrangements and any future financing arrangements. During the three months ended December 31, 2010,2011, we did not repurchase any of our equity securities.
PERFORMANCE GRAPH
The following graph assumes $100 invested on December 15, 2010, at the closing price ($27.25) of our common stock on our first day of trading, and compares (a) the percentage change of our cumulative total stockholder return on the common stock (as measured by dividing (i) the difference between our share price at the end and the beginning of the period presented by (ii) the share price at the beginning of the periods presented) with (b) (i) the Russell 2000 Index and (ii) the S&P 500® Data Processing & Outsourced Services.
| Period Beginning | Period Ending | Period Ending | Period Ending | Period Ending | Period Ending | |||||||||||||||||||
| Index | 12/15/2010 | 12/31/2010 | 3/31/2011 | 6/30/2011 | 9/30/2011 | 12/31/2011 | ||||||||||||||||||
FleetCor Technologies, Inc. | $ | 100.00 | $ | 113.47 | $ | 119.85 | $ | 108.77 | $ | 96.37 | $ | 109.61 | ||||||||||||
Russell 2000 | $ | 100.00 | $ | 101.99 | $ | 109.79 | $ | 107.69 | $ | 83.84 | $ | 96.43 | ||||||||||||
S&P Data Processing and Outsourced Services | $ | 100.00 | $ | 95.81 | $ | 103.76 | $ | 109.64 | $ | 101.69 | $ | 117.84 | ||||||||||||
| Period Beginning | Period Ending | |||||||
Index | 12/15/2010 | 12/31/2010 | ||||||
FleetCor Technologies, Inc. | $ | 100.00 | $ | 113.47 | ||||
Russell 2000 | $ | 100.00 | $ | 102.07 | ||||
S&P Data Processing and Outsourced Services | $ | 100.00 | $ | 95.81 | ||||

RECENT SALES OF UNREGISTERED SECURITIES
Prior to registration of the common stock issued under our equity compensation plans, common stock issued under our equity compensation plans was unregistered, in reliance upon the exemption provided in Rule 701 of the Securities Act of 1933, as amended. During 2010, prior to registration: we granted stock options to purchase an aggregate of 3,725,078 shares of our common stock at exercise prices ranging from $20.00 to $23.00 per share to employees under our equity compensation plans; we issued and sold an aggregate of 137,832 shares of our common stock to employees and directors upon payment of approximately $649,216 pursuant to exercises of options granted under our equity compensation plans; and we issued 1,212,084 shares, net of forfeitures, of our restricted stock to our employees and directors.
AND USE OF PROCEEDS FROM REGISTERED SECURITIES
On December 14, 2010, our registration statement on Form S-1 (File No. 333-166092) became effective, and on December 20, 2010, we completed an initial public offeringWe had no unregistered sales of 14,576,250 shares of our common stock at an initial public offering price of $23.00 per share for an aggregate offering price of $335 million. Our common stock began trading on the New York Stock Exchange under the symbol “FLT” on December 15, 2010. J.P. Morgan Securities LLC and Goldman, Sachs & Co. acted as joint book-running managers of our initial public offering and as representatives of the underwriters. Barclays Capital Inc. and Morgan Stanley & Co. Incorporated also acted as joint book-running managers. PNC Capital Markets LLC, Raymond James & Associates, Inc., and Wells Fargo Securities, LLC acted as co-managers. The shares sold in our initial public offering included shares that were subjectsecurities during 2011.
Of the shares sold in our initial public offering, 14,145,289 shares were sold by selling stockholders and 430,961 shares were sold by us. Proceeds to us, after deducting underwriting discounts and other offering expenses of $4.3 million payable by us, were $5.5 million. We used $2.9 million of the net proceeds to repay a portion of our outstanding term loans under our 2005 Credit Facility. We used the remaining net proceeds for working capital and other general corporate purposes.
ITEM 6. SELECTED FINANCIAL DATA
We derived the consolidated statement of income and other financial data for the years ended December 31, 2011, 2010 2009 and 20082009 and the selected consolidated balance sheet data as of December 31, 20102011 and 20092010 from the audited consolidated financial statements included elsewhere in this report. We derived the selected historical financial data for the years ended December 31, 20072008 and 20062007 and the selected consolidated balance sheets as of December 31, 2009, 2008 2007 and 20062007 from our audited consolidated financial statements that are not included in this report.
The selected consolidated financial data set forth below should be read in conjunction with “Management’s Discussion and Analysis of Financial Condition and Results of Operations” and our audited consolidated financial statements and notes thereto included elsewhere in this report. Our historical results are not necessarily indicative of the results to be expected in any future period.
(in thousands, except per share data) | 2010 | 2009 | 2008 | 2007 | 2006 | |||||||||||||||
Consolidated statement of income data(1): | ||||||||||||||||||||
Revenues, net | $ | 433,841 | $ | 354,073 | $ | 341,053 | $ | 264,086 | $ | 186,209 | ||||||||||
Expenses: | ||||||||||||||||||||
Merchant commissions | 49,050 | 39,709 | 38,539 | 39,358 | 32,784 | |||||||||||||||
Processing | 69,687 | 57,997 | 51,406 | 34,060 | 26,388 | |||||||||||||||
Selling | 32,731 | 30,579 | 23,778 | 22,625 | 19,464 | |||||||||||||||
General and administrative | 78,135 | 51,375 | 47,635 | 41,986 | 23,175 | |||||||||||||||
Depreciation and amortization | 33,745 | 28,368 | 27,240 | 20,293 | 12,571 | |||||||||||||||
Operating income | 170,493 | 146,045 | 152,455 | 105,764 | 71,827 | |||||||||||||||
Other, net | (1,319 | ) | (933 | ) | (2,488 | ) | (1,554 | ) | 39 | |||||||||||
Interest expense, net | 20,532 | 17,363 | 20,256 | 19,735 | 11,854 | |||||||||||||||
Total other expense | 19,213 | 16,430 | 17,768 | 18,181 | 11,893 | |||||||||||||||
Income before income taxes | 151,280 | 129,615 | 134,687 | 87,583 | 59,934 | |||||||||||||||
Provision for income taxes | 43,384 | 40,563 | 37,405 | 25,998 | 21,957 | |||||||||||||||
Net income | $ | 107,896 | $ | 89,052 | $ | 97,282 | $ | 61,585 | $ | 37,977 | ||||||||||
Earnings per share: | ||||||||||||||||||||
Earnings per share, basic | $ | 3.00 | $ | 2.17 | $ | 2.60 | $ | 1.59 | $ | 1.15 | ||||||||||
Earnings per share, diluted | 1.34 | 1.13 | 1.35 | .86 | .57 | |||||||||||||||
Weighted average shares outstanding, basic | 35,434 | 33,802 | 33,033 | 31,885 | 31,311 | |||||||||||||||
Weighted average shares outstanding, diluted | 80,751 | 78,854 | 71,913 | 71,720 | 66,660 | |||||||||||||||
(in thousands, except per share data) | 2011 | 2010 | 2009 | 2008 | 2007 | |||||||||||||||||||||||||||||||||||
Consolidated statement of income data(1): | ||||||||||||||||||||||||||||||||||||||||
Revenues, net | $ | 519,591 | $ | 433,841 | $ | 354,073 | $ | 341,053 | $ | 264,086 | ||||||||||||||||||||||||||||||
Expenses: | ||||||||||||||||||||||||||||||||||||||||
Merchant commissions | 51,199 | 49,050 | 39,709 | 38,539 | 39,358 | |||||||||||||||||||||||||||||||||||
Processing | 84,516 | 69,687 | 57,997 | 51,406 | 34,060 | |||||||||||||||||||||||||||||||||||
Selling | 36,606 | 32,731 | 30,579 | 23,778 | 22,625 | |||||||||||||||||||||||||||||||||||
General and administrative | 84,765 | 78,135 | 51,375 | 47,635 | 41,986 | |||||||||||||||||||||||||||||||||||
Depreciation and amortization | 36,171 | 33,745 | 28,368 | 27,240 | 20,293 | |||||||||||||||||||||||||||||||||||
|
|
|
|
| ||||||||||||||||||||||||||||||||||||
Operating income | 226,334 | 170,493 | 146,045 | 152,455 | 105,764 | |||||||||||||||||||||||||||||||||||
|
|
|
|
| ||||||||||||||||||||||||||||||||||||
Other, net | (589 | ) | (1,319 | ) | (933 | ) | (2,488 | ) | (1,554 | ) | ||||||||||||||||||||||||||||||
Interest expense, net | 13,377 | 20,532 | 17,363 | 20,256 | 19,735 | |||||||||||||||||||||||||||||||||||
Loss on extinguishment of debt | 2,669 | — | — | — | — | |||||||||||||||||||||||||||||||||||
|
|
|
|
| ||||||||||||||||||||||||||||||||||||
Total other expense | 15,457 | 19,213 | 16,430 | 17,768 | 18,181 | |||||||||||||||||||||||||||||||||||
|
|
|
|
| ||||||||||||||||||||||||||||||||||||
Income before income taxes | 210,877 | 151,280 | 129,615 | 134,687 | 87,583 | |||||||||||||||||||||||||||||||||||
Provision for income taxes | 63,542 | 43,384 | 40,563 | 37,405 | 25,998 | |||||||||||||||||||||||||||||||||||
|
|
|
|
| ||||||||||||||||||||||||||||||||||||
Net income | $ | 147,335 | $ | 107,896 | $ | 89,052 | $ | 97,282 | $ | 61,585 | ||||||||||||||||||||||||||||||
|
|
|
|
| ||||||||||||||||||||||||||||||||||||
Earnings per share: | ||||||||||||||||||||||||||||||||||||||||
Earnings per share, basic | $ | 1.83 | $ | 3.00 | $ | 2.17 | $ | 2.60 | $ | 1.59 | ||||||||||||||||||||||||||||||
Earnings per share, diluted | 1.76 | 1.34 | 1.13 | 1.35 | .86 | |||||||||||||||||||||||||||||||||||
Weighted average shares outstanding, basic | 80,610 | 35,434 | 33,802 | 33,033 | 31,885 | |||||||||||||||||||||||||||||||||||
Weighted average shares outstanding, diluted | 83,654 | 80,751 | 78,854 | 71,913 | 71,720 | |||||||||||||||||||||||||||||||||||
| As of December 31, | As of December 31, | |||||||||||||||||||||||||||||||||||||||
(in thousands) | 2010 | 2009 | 2008 | 2007 | 2006 | 2011 | 2010 | 2009 | 2008 | 2007 | ||||||||||||||||||||||||||||||
Consolidated balance sheet data: | ||||||||||||||||||||||||||||||||||||||||
Cash and cash equivalents | $ | 114,804 | $ | 84,701 | $ | 70,355 | $ | 68,864 | $ | 18,191 | $ | 285,159 | $ | 114,804 | $ | 84,701 | $ | 70,355 | $ | 68,864 | ||||||||||||||||||||
Restricted cash(2) | 62,341 | 67,979 | 71,222 | 76,797 | 64,016 | 55,762 | 62,341 | 67,979 | 71,222 | 76,797 | ||||||||||||||||||||||||||||||
Total assets | 1,484,118 | 1,209,545 | 929,062 | 875,106 | 657,925 | 2,324,492 | 1,484,118 | 1,209,545 | 929,062 | 875,106 | ||||||||||||||||||||||||||||||
Total debt | 469,413 | 351,551 | 370,747 | 341,851 | 255,032 | 698,783 | 469,413 | 351,551 | 370,747 | 341,851 | ||||||||||||||||||||||||||||||
Total stockholders’ equity | 625,945 | 474,049 | 273,264 | 192,009 | 158,482 | 811,436 | 625,945 | 474,049 | 273,264 | 192,009 | ||||||||||||||||||||||||||||||
| (1) | In June 2009, the Financial Accounting Standards Board, or FASB, issued authoritative guidance limiting the circumstances in which a financial asset may be derecognized when the transferor has not transferred the entire financial asset or has continuing involvement with the transferred asset. This guidance was effective for us as of January 1, 2010. As a result of the adoption of such guidance, effective January 1, 2010, our statements of income |
| (2) | Restricted cash represents customer deposits repayable on demand. |
ITEM 7. MANAGEMENT’S DISCUSSION AND ANALYSIS OF FINANCIAL CONDITION AND RESULTS OF OPERATIONS
The following discussion and analysis of our financial condition and results of operations should be read in conjunction with the consolidated financial statements and related notes appearing elsewhere in this report. In addition to historical information, this discussion contains forward-looking statements that involve risks, uncertainties and assumptions that could cause actual results to differ materially from management’s expectations. Factors that could cause such differences include, but are not limited to, those identified below and those described in Item 1A “Risk Factors” appearing elsewhere in this report. All foreign currency amounts that have been converted into U.S. dollars in this discussion are based on the exchange rate as reported by Oanda for the applicable periods. In this report, when we refer to consolidated revenue, the provision for bad debts and interest expense on a “managed basis,” such amounts have been adjusted for the impact of the new accounting guidance related to our securitization facility as further discussed below. The term “managed basis” is used throughout “Management’s Discussion and Analysis of Financial Condition and Results of Operations”.
Overview
FleetCor is a leading independent global provider of specialized payment products and services to businesses, commercial fleets, major oil companies, petroleum marketers and government entities in 18 countries inthroughout North America, Europe, AfricaLatin America and Asia.Europe. Our payment programs enable our customers to better manage and control employee spending and provide card-accepting merchants with a high volume customer base that can increase their sales and customer loyalty. In 2010,2011, we processed more than 196215 million transactions on our proprietary networks and third-party networks. We believe that our size and scale, geographic reach, advanced technology and our expansive suite of products, services, brands and proprietary networks contribute to our leading industry position.
We provide our payment products and services in a variety of combinations to create customized payment solutions for our customers and partners. We sell these products and services directly and indirectly through partners with whom we have strategic relationships, such as major oil companies and petroleum marketers. We refer to these major oil companies and petroleum marketers as our “partners.” We provide our customers with various card products that typically function like a charge card to purchase fuel, lodging, food and related products and services at participating locations. Our payment programs enable businesses to better manage and control employee spending and provide card-accepting merchants with a high volume customer base that can increase their sales and customer loyalty.
In order to deliver our payment programs and services and process transactions, we own and operate sixeight proprietary “closed-loop” networks through which we electronically connect to merchants and capture, analyze and report customized information. We also use third-party networks to deliver our payment programs and services in order to broaden our card acceptance and use. To support our payment products, we also provide a range of services, such as issuing and processing, as well as specialized information services that provide our customers with value-added functionality and data. Our customers can use this data to track important business productivity metrics, combat fraud and employee misuse, streamline expense administration and lower overall fleet operating costs.
FleetCor’s predecessor company was organized in the United States in 1986. In 2000, our current chief executive officer joined us and we changed our name to FleetCor Technologies, Inc. Since 2000, we have grown significantly through a combination of organic initiatives, product and service innovation and over 40 acquisitions of businesses and commercial account portfolios. Our corporate headquarters are located in Norcross, Georgia. As of December 31, 2010,2011, we employed approximately 1,1972,130 employees, approximately 664700 of whom were located in the United States.
Our segments, sources of revenue and expenses
Segments
We operate in two segments, which we refer to as our North American and International segments. The results from our Mexican prepaid fuel card and food voucher business acquired during the third quarter of 2011 are reported in our International segment. Our revenue is reported net of the wholesale cost for underlying products and services. In this report, we refer to this net revenue as “revenue.” For the years ended December 31, 2011, 2010 2009, and 2008,2009, our North American and International segments generated the following revenue:
| Year ended December 31, | Year ended December 31, | |||||||||||||||||||||||||||||||||||||||||||||||
| 2010 | 2009 | 2008 | 2011 | 2010 | 2009 | |||||||||||||||||||||||||||||||||||||||||||
(dollars in millions) | Revenue | % of total revenue | Revenue | % of total revenue | Revenue | % of total revenue | Revenue | % of total revenue | Revenue | % of total revenue | Revenue | % of total revenue | ||||||||||||||||||||||||||||||||||||
North America | $ | 287.8 | 66.3 | % | $ | 227.4 | 64.2 | % | $ | 205.5 | 60.2 | % | $ | 348.8 | 67.1 | % | $ | 287.8 | 66.3 | % | $ | 227.4 | 64.2 | % | ||||||||||||||||||||||||
International | 146.0 | 33.7 | % | 126.7 | 35.8 | % | 135.6 | 39.8 | % | 170.8 | 32.9 | % | 146.0 | 33.7 | % | 126.7 | 35.8 | % | ||||||||||||||||||||||||||||||
|
|
|
|
|
| |||||||||||||||||||||||||||||||||||||||||||
| $ | 433.8 | 100.0 | % | $ | 354.1 | 100.0 | % | $ | 341.1 | 100.0 | % | $ | 519.6 | 100.0 | % | $ | 433.8 | 100.0 | % | $ | 354.1 | 100.0 | % | |||||||||||||||||||||||||
|
|
|
|
|
| |||||||||||||||||||||||||||||||||||||||||||
Sources of Revenue
Transactions. In both of our segments, we derive revenue from transactions and the related revenue per transaction. As illustrated in the diagram below, a transaction is defined as a purchase by a customer. Our customers include holders of our card products and those of our partners, for whom we manage card programs. Revenue from transactions is derived from our merchant and network relationships as well as our customers and partners. Through our merchant and network relationships we primarily offer fuel, vehicle maintenance, food or lodging services to our customers. We also earn revenue from our customers and partners through program fees and charges. The following diagram illustrates a typical transaction flow.
Illustrative Transaction Flow

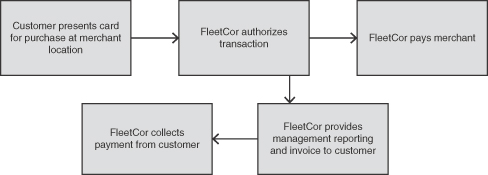
From our merchant and network relationships, we derive revenue from the difference between the price charged to a customer for a transaction and the price paid to the merchant or network for the same transaction. As illustrated in the table below, the price paid to a merchant or network may be calculated as (i) the merchant’s wholesale cost of fuel plus a markup; (ii) the transaction purchase price less a percentage discount; or (iii) the transaction purchase price less a fixed fee per unit. The difference between the price we pay to a merchant and the merchant’s wholesale cost for the underlying products and services is considered a “merchant commission” and is recognized as an expense. Approximately 44.5% and 47.4% of our revenue during 2011 and 2010, respectively, was derived from our merchant and network relationships.
Illustrative Revenue Model for Fuel Purchases
(unit of one gallon)
Illustrative Revenue Model | Illustrative Revenue Model | Merchant Payment Methods | Merchant Payment Methods | |||||||||||||||||||||||||||||||||||||||||
Retail Price | $ | 3.00 | i) Cost Plus Mark-up: | ii) Percentage Discount: | iii) Fixed Fee: | $ | 3.00 | i) Cost Plus Mark-up: | ii) Percentage Discount: | iii) Fixed Fee: | ||||||||||||||||||||||||||||||||||
| Wholesale Cost | (2.86 | ) | Wholesale Cost | $ | 2.86 | Retail Price | $ | 3.00 | Retail Price | $ | 3.00 | (2.86 | ) | Wholesale Cost | $ | 2.86 | Retail Price | $ | 3.00 | Retail Price | $ | 3.00 | ||||||||||||||||||||||
| ||||||||||||||||||||||||||||||||||||||||||||
| Mark-up | 0.05 | Discount (3%) | (0.09 | ) | Fixed Fee | (0.09 | ) | Mark-up | 0.05 | Discount (3%) | (0.09 | ) | Fixed Fee | (0.09 | ) | |||||||||||||||||||||||||||||
|
|
| ||||||||||||||||||||||||||||||||||||||||||
FleetCor Revenue | $ | 0.14 | $ | 0.14 | ||||||||||||||||||||||||||||||||||||||||
| ||||||||||||||||||||||||||||||||||||||||||||
| Merchant Commission | $ | (0.05 | ) | Price Paid to Merchant | $ | 2.91 | Price Paid to Merchant | $ | 2.91 | Price Paid to Merchant | $ | 2.91 | $ | (0.05 | ) | Price Paid to Merchant | $ | 2.91 | Price Paid to Merchant | $ | 2.91 | Price Paid to Merchant | $ | 2.91 | ||||||||||||||||||||
|
|
|
| |||||||||||||||||||||||||||||||||||||||||
| Price Paid to Merchant | $ | 2.91 | $ | 2.91 | ||||||||||||||||||||||||||||||||||||||||
| ||||||||||||||||||||||||||||||||||||||||||||
From our customers and partners, we derive revenue from a variety of program fees including transaction fees, card fees, network fees and report fees. Our programs include other fees and charges associated with late payments and based on customer credit risk. Approximately 55.5% and 52.6% of our revenue during 2011 and 2010, respectively, was derived from customer and partner program fees and charges.
Transaction volume and revenue per transaction. Set forth below is revenue per transaction information for the years ended December 31, 2011, 2010 2009, and 2008:2009:
| Year ended December 31, | Year ended December 31, | |||||||||||||||||||||||
| 2010 | 2009 | 2008 | 2011 | 2010 | 2009 | |||||||||||||||||||
Transactions (in millions) | ||||||||||||||||||||||||
North America | 147.3 | 143.5 | 149.5 | 152.7 | 148.6 | 143.5 | ||||||||||||||||||
International | 48.9 | 49.7 | 39.9 | |||||||||||||||||||||
International1,2 | 62.1 | 41.8 | 40.6 | |||||||||||||||||||||
|
|
| ||||||||||||||||||||||
Total transactions | 196.2 | 193.2 | 189.4 | |||||||||||||||||||||
Total transactions1,2 | 214.8 | 190.4 | 184.1 | |||||||||||||||||||||
|
|
| ||||||||||||||||||||||
Revenue per transaction | ||||||||||||||||||||||||
North America | $ | 1.95 | $ | 1.58 | $ | 1.37 | $ | 2.28 | $ | 1.94 | $ | 1.58 | ||||||||||||
International | 2.99 | 2.55 | 3.40 | |||||||||||||||||||||
Consolidated revenue per transaction | 2.21 | 1.83 | 1.80 | |||||||||||||||||||||
International1,2 | 2.75 | 3.47 | 3.09 | |||||||||||||||||||||
Consolidated revenue per transaction1,2 | 2.42 | 2.27 | 1.92 | |||||||||||||||||||||
| 1 | Calculation of revenue per transaction for our International segment and on a consolidated basis for the years ended December 31, 2010 and 2009 excludes the impact of a non-renewed partner contract in Europe, inherited from an acquisition, which we chose not to renew. This non-renewed contract contributed approximately 3.6 million transactions and $0.9 million in revenues, net to our International segment in the year ended December 31, 2010 and approximately 6.9 million transactions and $1.3 million in revenues, net to our International segment in the year ended December 31, 2009. This contract had a high number of transactions and very little revenue and if we had included it in the calculation would have reduced International segment revenue per transaction by $0.25 negative and $0.38 in the years ended December 31, 2010 and 2009, respectively. We believe that excluding the impact of this contract is a more effective measure for evaluating our revenue performance of its continuing business. Revenues, net, excluding the impact of a non-renewed partner contract in Europe for our International segment and on a consolidated basis are supplemental non-GAAP financial measures of performance. See “Management’s Use of Non-GAAP Financial Measures”. |
| 2 | The presentation of prior years presented herein has been conformed to the current period presentation that eliminates certain intercompany transactions. |
From 2010 to 2011, total transactions increased from 190.4 million to 214.8 million, excluding the impact of a non-renewed partner contract in Europe, an increase of 24.4 million or 12.8%. We experienced an increase in transactions in our North American and International segments, excluding the impact of a non-renewed partner contract in Europe, primarily due to organic growth in certain payment programs and the impact of the acquisition of our Mexican prepaid card company during the third quarter of 2011 and our acquisition of Allstar Business Solutions (Allstar) during the fourth quarter of 2011. This non-renewed partner had a high number of transactions and very little revenue.
From 2009 to 2010 transactions increased from 193.2184.1 million to 196.1190.4 million, excluding the impact of a non-renewed partner contract in Europe, an increase of 2.96.3 million or 1.5%3.4%. We experienced an increase in transactions in our North American segment due primarily to the full year impact of our acquisition of CLC Group, Inc., in April 2009, and organic growth in certain payment programs. We experienced a decreasean increase in transactions in our International segment, due toexcluding the wind downimpact of a non-renewed partner contract in Europe, inherited from an acquisition, which we chose notprimarily due to renew. This partner had a high number of transactions and very little revenue. This decrease in transactions was offset by the full year impact of acquisitions completed in 2009 and new acquisitions in 2010.
From 2008 to 2009 transactions increased from 189.3 million to 193.9 million, an increase of 4.6 million or 2.4%. We experienced a decrease in transactions in our North American segment due primarily to a reduction in transactions by existing customers that we believe was a result of the economic downturn, partially offset by our acquisition of CLC Group, Inc., in April 2009,2010 and organic growth in certain payment programs. We experienced an increase inThis non-renewed partner had a high number of transactions in our International segment due to the full year impact of acquisitions completed in 2008 and new acquisitions in 2009.very little revenue.
Revenue per transaction is derived from the various revenue types as discussed above and can vary based on geography, the relevant merchant relationship, the payment product utilized and the types of products or services purchased, the mix of which would be influenced by our acquisitions, organic growth in our business, and
fluctuations in foreign currency exchange rates. Revenue per transaction per customer increases as the level of services we provide to a customer increases.
Our consolidated revenue per transaction increased from $2.27 in 2010 to $2.42 in 2011, excluding the impact of a non-renewed partner contract in Europe, an increase of $0.15 per transaction or 6.6%. Our consolidated revenue per transaction was impacted by:
organic growth in certain of our payment programs;
higher average retail fuel prices in 2011 as compared to 2010 and higher spread revenue due to the wholesale cost of fuel decreasing at a faster rate than the retail price of fuel; and
the weakening of the U.S. dollar during 2011, relative to other foreign currencies, which resulted in favorable foreign exchange rates that increased our revenue in 2011 by $7.4 million.
During 2011, we completed the acquisition of a Mexican prepaid fuel card and food voucher company and Allstar Business Solutions, which together contributed to the increase in transaction volumes and revenues. However, the Mexican and Allstar businesses both produce lower aggregate consolidated revenue per transaction products in comparison to our other businesses and when combined with our other businesses’ transactions and revenues, results in a lower revenue per transaction than would have resulted without the acquisitions. The results from our Mexican and Allstar businesses are reported in our International segment.
Our consolidated revenue per transaction increased from $1.92 in 2009 to $2.27 in 2010, excluding the impact of a non-renewed partner contract in Europe, an increase of $0.35 per transaction or 18.2%. Our consolidated revenue per transaction was impacted by:
organic growth in certain of our payment programs;
higher average retail fuel prices in 2010 as compared to 2009; and
the adoption of Authoritative guidance related to our asset securitization agreement as further discussed in “Note 2—Summary of Significant Accounting Policies”, which resulted in an increase in 2009 revenue of $27.2 million or $0.14 per transaction.
During 2010, these positive impacts were partially offset by the strengthening of the U.S. dollar during 2010, relative to other foreign currencies, which resulted in unfavorable foreign exchange rates that reduced our 2010 revenue per transaction.
The revenue per transaction in the International segment runs higher than the North America segment due primarily to higher margins and higher fuel prices in our international product lines. International revenue per transaction has decreased from 2008 to 2009 in part due to changes in foreign exchange rates and the impact of an acquisition completed in 2008 that carries a lower fee per transaction based on the relevant card products associated with this acquisition.
Our consolidatedNorth American segment revenue per transaction increased from $1.83 in 2009$1.94 for the year ended December 31, 2010 to $2.21 in 2010. During 2010, our consolidated$2.28 for year ended December 31, 2011, an increase of $0.34 per transaction or 17.5%. Our North American segment revenue per transaction was positively impacted by:
organic growth in certain of our payment programs; and
higher average retail fuel prices in 2011 as compared to 2010 and higher spread revenue increased by $27.2 million or $0.14due to the wholesale cost of fuel decreasing at a faster rate than the retail price of fuel.
North American segment revenue per transaction increased from $1.58 for the year ended December 31, 2009 to $1.94 for year ended December 31, 2010, an increase of $0.36 per transaction or 22.8%. Our North American segment revenue per transaction was impacted by:
organic growth in certain of our payment programs;
higher average retail fuel prices in 2010 as compared to 2009 and higher spread revenue due to the wholesale cost of fuel decreasing at a resultfaster rate than the retail price of fuel; and
the adoption of Authoritative guidance related to our asset securitization agreement as further discussed in “Note 2—Summary of Significant Accounting Policies”;
the wind down of a partner contract in Europe which carried a high number of transactions and very little revenue;
the average retail price of fuel in 2010 was higher than the average retail price of fuel in 2009,, which resulted in an increase in our 20102009 revenue of $27.2 million or $0.14 per transaction.
International segment revenue per transaction;transaction decreased from $3.47 for the year ended December 31, 2010 to $2.75 for year ended December 31, 2011, a decrease of $0.72 per transaction or 20.7%. Our International segment revenue per transaction was positively impacted by:
organic growth in certain of our payment programs;
higher average retail fuel prices as compared to 2010; and
higher program feesthe weakening of the U.S. dollar during 2011, relative to other foreign currencies, which resulted in favorable foreign exchange rates that increased our revenue in 2011 by $7.4 million.
These positive impacts were offset by the impact of our international acquisitions during 2011. We acquired a Mexican prepaid fuel card and chargesfood voucher company and Allstar Business Solutions, which together contributed to the increase in transaction volumes and revenues in our International segment. However, the Mexican and Allstar businesses both produce lower aggregate revenue per transaction products in comparison to our other businesses and when combined with our other businesses’ transactions and revenues, results in a lower revenue per transaction.
International segment revenue per transaction increased from our existing customers.
During$3.09 for the year ended December 31, 2009 to $3.47 for year ended December 31, 2010, our consolidatedan increase of $0.38 per transaction or 12.3%. Our International segment revenue per transaction was negativelypositively impacted by a rangeby:
organic growth in certain of factors, includingour payment programs;
higher average retail fuel prices as compared to the same period in 2009; and
acquisitions completed during 2009, which contributed an aggregate of $9.5 million in revenue in 2010 in excess of revenue recognized in 2009.
During 2010, these positive impacts were partially offset by the strengthening of the U.S. dollar during 2010, relative to other foreign currencies, which resulted in unfavorable foreign exchange rates, as well as, lower spread revenue due to the wholesale cost of fuel increasing at a faster rate than the retail price of fuel, that reduced our 2010 revenue per transaction.
Our consolidated revenue per transaction increased from $1.80 in 2008
acquisitions completed during 2009, that carried a higher rate per transaction due to the relevant card products associated with these acquisitions; and
higher program fees and charges primarily resulting from the full-year impact of the implementation of a private label contract on our proprietary system.
During 2009, our consolidated revenue per transaction was negatively impacted by a range of factors, including:
the strengthening of the U.S. dollar during 2009, relative to other foreign currencies, which resulted in unfavorable foreign exchange rates that reduced our 2009 revenue per transaction;
the wholesale price of fuel decreased at a higher rate than the retail price of fuel during the second half of 2008 causing the margin between the wholesale cost of fuel and the retail price of fuel in 2008 to expand beyond historical levels. In 2009, fuel price spreads returned to historical levels; and
the average retail price of fuel in 2009 was significantly lower than the average retail price of fuel in 2008, which resulted in a decrease in our 2009 revenue per transaction.
Sources of expenses
We incur expenses in the following categories:
| • | Merchant commissions—We incur merchant commissions expenses when we reimburse merchants with whom we have direct, contractual relationships in respect of specific transactions in which a customer purchases products or services from the merchant. Merchant commission equals the difference between the price paid by us to the merchant and the merchant’s wholesale cost of the underlying products or services. |
| • | Processing—Our processing expense consists of expenses related to processing transactions, servicing our customers and merchants and bad debt expense. |
| • | Selling—Our selling expenses consist primarily of wages, benefits, sales commissions (other than merchant commissions) and related expenses for our sales, marketing and account management personnel and activities. |
| • | General and administrative—Our general and administrative expenses include compensation and related expenses (including stock-based compensation) for our executive, finance and accounting, information technology, human resources, legal and other administrative personnel. Also included are facilities expenses, third-party professional services fees, travel and entertainment expenses, and other corporate-level expenses. |
| • | Depreciation and amortization—Our depreciation and amortization expenses include depreciation of property and equipment, consisting of computer hardware and software (including proprietary software development amortization expense), card-reading equipment, furniture, fixtures, vehicles and buildings and leasehold improvements related to office space. Our amortization expenses include intangible assets related to customer and vendor relationships, |
| • | Other income, net—Other income, net includes foreign currency transaction gains or losses, revenue/costs from the sale of assets and other miscellaneous operating costs and revenue. |
| • | Interest expense, net—Interest expense, net includes interest income on our cash balances and interest expense on our outstanding debt and excludes interest on our securitization facility. We have historically invested our cash primarily in short-term money market funds. |
| • | Provision for income taxes—The provision for income taxes consists primarily of corporate income taxes related to profits resulting from the sale of our products and services in the United States and internationally. Our worldwide effective tax rate is lower than the U.S. statutory rate of 35%, due primarily to lower rates in foreign jurisdictions and foreign-sourced non-taxable income. |
Factors and trends impacting our business
We believe that the following factors and trends are important in understanding our financial performance:
| • | Fuel prices—Our fleet customers use our products and services primarily in connection with the purchase of fuel. Accordingly, our revenue is affected by fuel prices, which are subject to significant volatility. A change in retail fuel prices could cause a decrease or increase in our revenue from several sources, including fees paid to us based on a percentage of each customer’s total purchase. We believe that |
Fuel-price spread volatility—
| • | Fuel-price spread volatility—A portion of our revenue involves transactions where we derive revenue from fuel-price spreads, which is the difference between the price charged to a fleet customer for a transaction and the price paid to the merchant for the same transaction. In these transactions, the price |
paid to the merchant is based on the wholesale cost of fuel. The merchant’s wholesale cost of fuel is dependent on several factors including, among others, the factors described above affecting fuel prices. The fuel price that we charge to our customer is dependent on several factors including, among others, the fuel price paid to the merchant, posted retail fuel prices and competitive fuel prices. We experience fuel-price spread contraction when the merchant’s wholesale cost of fuel increases at a faster rate than the fuel price we charge to our customers, or the fuel price we charge to our customers decreases at a faster rate than the merchant’s wholesale cost of fuel. Approximately 19% and 21% of our consolidated revenue in 2011 and 2010, respectively, was derived from transactions where our revenue is tied to fuel-price spreads. |
| • | Acquisitions—Since 2002, we have completed over 40 acquisitions of companies and commercial account portfolios. Acquisitions have been an important part of our growth strategy, and it is our intention to |
continue to seek opportunities to increase our customer base and diversify our service offering through further strategic acquisitions. The impact of acquisitions has, and may continue to have, a significant impact on our results of operations and may make it difficult to compare our results between periods. |
| • | Interest rates—Our results of operations are affected by interest rates. We are exposed to market risk changes in interest rates on our cash investments and debt. |
Global economic downturn—Our results of operations are materially affected by conditions in the economy generally, both in North America and internationally. Factors affected by the economy include our transaction volumes and the credit risk of our customers. These factors affected our businesses in both our North American and International segments.
| • | Global economic downturn—Our results of operations are materially affected by conditions in the economy generally, both in North America and internationally. Factors affected by the economy include our transaction volumes and the credit risk of our customers. These factors affected our businesses in both our North American and International segments. |
Foreign currency changes—Our results of operations are impacted by changes in foreign currency rates; namely, by movements of the British pound, the Czech koruna, the Russian ruble, the Canadian dollar and the Euro relative to the U.S. dollar. Approximately 66.3% of our revenue in 2010 was derived in U.S. dollars and was not affected by foreign currency exchange rates.
| • | Foreign currency changes—Our results of operations are impacted by changes in foreign currency rates; namely, by movements of the British pound, the Czech koruna, the Russian ruble, the Canadian dollar, the Euro and the Mexican peso relative to the U.S. dollar. Approximately 67% and 66% of our revenue in 2011 and 2010, respectively, was derived in U.S. dollars and was not affected by foreign currency exchange rates. |
Expenses—In connection with being a public company and complying with the Sarbanes-Oxley Act of 2002, we expect our general and administrative expense to increase 2011 and then remain relatively constant or increase slightly as a percentage of revenue. Over the long term, we expect that our general and administrative expense will decrease as a percentage of revenue as our revenue increases. To support our expected revenue growth, we plan to continue to incur additional sales and marketing expense by investing in our direct marketing, third-party agents, internet marketing, telemarketing and field sales force.
| • | Expenses—In connection with being a public company and complying with the Sarbanes-Oxley Act of 2002, we expect our general and administrative expense to remain relatively constant or increase slightly as a percentage of revenue. Over the long term, we expect that our general and administrative expense will decrease as a percentage of revenue as our revenue increases. To support our expected revenue growth, we plan to continue to incur additional sales and marketing expense by investing in our direct marketing, third-party agents, internet marketing, telemarketing and field sales force. |
Accounts receivable securitization
We utilize an accounts receivable securitization facility (Securitization Facility) in the ordinary course of our business to finance a portion of our accounts receivable. OurPrior to 2010, activity associated with our Securitization Facility was recorded off-balance sheet activity utilizesutilizing a qualified special-purpose entity, or QSPE, in the form of a limited liability company. The QSPE raisesraised funds by issuing debt to third-party investors. The QSPE holdsheld trade accounts receivable whose cash flows are the primary source of repayment for the liabilities of the QSPE. Investors only havehad recourse to the assets held by the QSPE. Our involvement in these arrangements takes the form of originating accounts receivable and providing servicing activities. Accounts receivable that we sell under the securitization facility are reported in our consolidated financial statements in accordance with relevant authoritative literature. Trade accounts receivable sold under this program are excluded from accounts receivable in our consolidated financial statements.
In June 2009, the Financial Accounting Standards Board or FASB,(FASB), issued authoritative guidance limiting the circumstances in which a financial asset may be derecognized when the transferor has not transferred the entire financial asset or has continuing involvement with the transferred asset. The concept of a QSPE entity, which had previously facilitated sale accounting for certain asset transfers, is removed by this standard. This guidance was effective for us as of January 1, 2010. As a result of the adoption of such guidance, effective January 1, 2010, we consolidated the QSPE and the securitization of accounts receivable related to the QSPE is accounted for as a secured borrowing rather
than as a sale. Accordingly, we record accounts receivable and short-term debt related to the securitization facilities as assets and liabilities on ourthe balance sheet. In addition, our statements of income no longer include securitization activities in revenue. Rather, we report provision for bad debts and interest expense associated with the debt securities issued by the QSPE.QSPE in processing expense and interest expense, net, respectively, on the Consolidated Statements of Income.
As a result of the implementation of this guidance, effective January 1, 2010, we recorded a $218.0 million increase in accounts receivable and a $218.0 million increase in current liabilities. See “Note 2—Summary of significant accounting policies” to our consolidated financial statements included herein for further details.
Although, bad debt and interest associated with our securitization facilitySecuritization Facility were reported in revenue for periods prior to January 1, 2010, we monitored these costs on a managed basis. The following table presents for the year ended December 31, 2009, certain statement of income items adjusted for the impact of the new accounting guidance described above related to our securitization facility.Securitization Facility.
| Year ended December 31, | ||||||||||||||||||||||||||||||||||||
| 2009 | 2008 | 2009 | ||||||||||||||||||||||||||||||||||
(in millions) | As reported | Adjustments | As adjusted | As reported | Adjustments | As adjusted | As reported | Adjustments | As adjusted | |||||||||||||||||||||||||||
Net revenue | $ | 354.1 | $ | 27.2 | $ | 381.3 | $ | 341.1 | $ | 43.2 | $ | 384.3 | ||||||||||||||||||||||||
Revenues, net | $ | 354.1 | $ | 27.2 | $ | 381.3 | ||||||||||||||||||||||||||||||
Processing expense | 58.0 | 21.9 | 79.9 | 51.4 | 27.4 | 78.8 | 58.0 | 21.9 | 79.9 | |||||||||||||||||||||||||||
Interest expense, net | 17.4 | 5.3 | 22.7 | 20.3 | 15.8 | 36.1 | 17.4 | 5.3 | 22.7 | |||||||||||||||||||||||||||
Managed provision for bad debts as a percentage of gross billed revenue for the yearsyear ended December 31, 2009 is as follows (dollar amounts in millions):
| 2009 | 2008 | 2009 | ||||||||||
Provision for bad debt included in: | ||||||||||||
Processing expense | $ | 10.7 | $ | 7.5 | $ | 10.7 | ||||||
Revenue, net | 21.9 | 27.4 | ||||||||||
Revenues, net | 21.9 | |||||||||||
| ||||||||||||
Managed provision for bad debts | 32.6 | 34.9 | 32.6 | |||||||||
Managed provision for bad debts as a percentage of gross billed revenue(1) | 0.56 | % | 0.43 | % | 0.56 | % | ||||||
| (1) | In this table, gross billed revenue represents revenue billed to customers for which we bear credit risk and includes the costs underlying the transaction (e.g. fuel and lodging). Gross billed revenue is calculated on a one quarter lag. For example, gross billed revenue for the year ended December 31, 2009 is calculated as gross billed revenue for the three months ended December 31, 2008, plus gross billed revenue for the nine month period from January 1, 2009 through September 30, 2009. We believe this calculation better matches our provision for bad debts with the related gross billed revenue. |
Acquisitions
During 2011, we acquired two companies, which are described below. The results of our Mexican prepaid fuel card and food voucher business and Allstar business are included within our International segment, from the date of acquisition.
In August 2011, we completed the acquisition of all of the outstanding stock of a Mexican prepaid fuel card and food voucher business based in Mexico City, Mexico. The purchase price of this acquisition was funded with cash. With this acquisition, we entered the Latin American fuel card and food voucher markets.
In December 2011, we completed the acquisition of all of the outstanding shares of Allstar Business Solutions Limited, a fleet card company based in the United Kingdom. The aggregate purchase price
was £200 million, or approximately $312 million, (based on the exchange rate on the date of acquisition), and was funded with cash and debt. As a result of this acquisition, we expanded our commercial fleet card offerings in the United Kingdom. We notified the Office of Fair Trading of this acquisition, in which we provided an analysis that the acquisition does not result in a substantial lessening of competition on any affected market and we subsequently responded to questions posed by the Office of Fair Trading in the course of its review. We anticipate that the Office of Fair Trading will determine whether or not to make a referral to the Competition Commission for further consideration by March 28, 2012. If the Competition Commission were to conclude that the acquisition results in a substantial lessening of competition, it could require remedial action, which could negatively affect our financial results. |
During 2010, we consummated three acquisitions, which were not, individually or in the aggregate, material to our results of operations.
During 2009, we acquired three companies the two largest of which are described below.below; the third acquisition is immaterial. The results of CLC Group, Inc. and its subsidiaries since the date of acquisition are included within our North American segment. The results of operations for the remaining acquisitions are included in our International segment from their respective dates of acquisition.
In April 2009, we completed the acquisition of all of the outstanding stock of CLC Group, Inc., a provider of lodging management programs based in Wichita, Kansas, which we refer to as the CLC Acquisition in this report. The aggregate purchase price was $169.1 million, $161.1 million paid in cash and $8.0 million paid in the form of our Series E convertible preferred stock. Through this acquisition, we entered the lodging payments business.
In August 2009, we completed the acquisition of all of the outstanding shares of ReD Fuel Cards (Europe) Limited, a fleet card company based in the United Kingdom, which we refer to as the ReD Acquisition in this report. The aggregate purchase price was $62.9 million (based on the exchange rate on the date of acquisition). As a result of this acquisition, we expanded our commercial fleet card offerings in the United Kingdom and Ireland.
During 2008, we acquired four companies,Results of operations
Year ended December 31, 2011 compared to the three largest of which are discussed below. year ended December 31, 2010
The resultsfollowing table sets forth selected consolidated statement of operations data for these acquisitions are includedthe years ended December 31, 2011 and 2010
| Year ended December 31, 2011 | % of total revenue | Year ended December 31, 2010 | % of total revenue | Increase (decrease) | % Change | |||||||||||||||||||
Revenues, net: | ||||||||||||||||||||||||
North America | $ | 348.8 | 67.1 | % | $ | 287.8 | 66.3 | % | $ | 61.0 | 21.2 | % | ||||||||||||
International | 170.8 | 32.9 | % | 146.0 | 33.7 | % | 24.8 | 17.0 | % | |||||||||||||||
|
|
|
|
|
|
|
|
|
|
|
| |||||||||||||
Total revenues, net | 519.6 | 100.0 | % | 433.8 | 100.0 | % | 85.8 | 19.8 | % | |||||||||||||||
Consolidated operating expenses: | ||||||||||||||||||||||||
Merchant commissions | 51.2 | 9.9 | % | 49.1 | 11.3 | % | 2.1 | 4.3 | % | |||||||||||||||
Processing | 84.5 | 16.3 | % | 69.7 | 16.1 | % | 14.8 | 21.2 | % | |||||||||||||||
Selling | 36.6 | 7.0 | % | 32.7 | 7.5 | % | 3.9 | 11.9 | % | |||||||||||||||
General and administrative | 84.8 | 16.3 | % | 78.1 | 18.0 | % | 6.7 | 8.6 | % | |||||||||||||||
Depreciation and amortization | 36.2 | 7.0 | % | 33.7 | 7.8 | % | 2.5 | 7.4 | % | |||||||||||||||
|
|
|
|
|
|
|
|
|
|
|
| |||||||||||||
Operating income | 226.3 | 43.6 | % | 170.5 | 39.3 | % | 55.8 | 32.8 | % | |||||||||||||||
|
|
|
|
|
|
|
|
|
|
|
| |||||||||||||
Other income, net | (0.6 | ) | (0.1 | )% | (1.3 | ) | (0.3 | )% | (0.7 | ) | (55.3 | )% | ||||||||||||
Interest expense, net | 13.4 | 2.6 | % | 20.5 | 4.7 | % | (7.1 | ) | (34.8 | )% | ||||||||||||||
Loss on extinguishment of debt | 2.7 | 0.5 | % | — | — | 2.7 | 100.0 | % | ||||||||||||||||
Provision for income taxes | 63.5 | 12.2 | % | 43.4 | 10.0 | % | 20.1 | 46.5 | % | |||||||||||||||
|
|
|
|
|
|
|
|
|
|
|
| |||||||||||||
Net income | $ | 147.3 | 28.4 | % | $ | 107.9 | 24.9 | % | $ | 39.4 | 36.6 | % | ||||||||||||
|
|
|
|
|
|
|
|
|
|
|
| |||||||||||||
Operating income for segments: | ||||||||||||||||||||||||
North America | $ | 153.7 | 29.6 | % | $ | 106.7 | 24.6 | % | $ | 47.0 | 44.0 | % | ||||||||||||
International | 72.6 | 14.0 | % | 63.8 | 14.7 | % | 8.8 | 13.8 | % | |||||||||||||||
|
|
|
|
|
| |||||||||||||||||||
Operating income | $ | 226.3 | 43.6 | % | $ | 170.5 | 39.3 | % | $ | 55.8 | 32.7 | % | ||||||||||||
|
|
|
|
|
| |||||||||||||||||||
Operating margin for segments | ||||||||||||||||||||||||
North America | 44.1 | % | 37.1 | % | 7.0 | % | ||||||||||||||||||
International | 42.5 | % | 43.6 | % | (1.1 | )% | ||||||||||||||||||
Revenue
Our consolidated revenue increased from $433.8 million in 2010 to $519.6 million in 2011, an increase of $85.8 million, or 19.8%. The increase in our International segment from their respective dates of acquisition.consolidated revenue was primarily due to:
In March 2008,organic growth in certain of our payment programs;
acquisitions completed during 2011;
higher average retail fuel prices as compared to 2010;
higher spread revenue due to the wholesale cost of fuel decreasing at a faster rate than the retail price of fuel; and
the weakening of the U.S. dollar during 2011, relative to other foreign currencies, which resulted in favorable foreign exchange rates that increased our revenue in 2011 by $7.4 million.
North American segment revenue
North American revenue increased from $287.8 million in 2010 to $348.8 million in 2011, an increase of $61.0 million, or 21.2%. The increase in our North American revenue was primarily due to:
organic growth in certain of our payment programs;
higher average retail fuel prices as compared to 2010; and
higher spread revenue due to the wholesale cost of fuel decreasing at a faster rate than the retail price of fuel.
International segment revenue
International segment revenue increased from $146.0 million in 2010 to $170.8 million in 2011, an increase of $24.8 million, or 17.0%. The increase in International segment revenue was due primarily to the following:
organic growth in certain of our payment programs;
acquisitions completed during 2011;
higher average retail fuel prices as compared to 2010; and
the weakening of the U.S. dollar during 2011, relative to other foreign currencies, which resulted in favorable foreign exchange rates that increased our revenue in 2011 by $7.4 million.
Consolidated operating expenses
Merchant commission Merchant commissions increased from $49.1 million in 2010 to $51.2 million in 2011, an increase of $2.1 million, or 4.3%. This increase was due primarily to the fluctuation of the margin between the wholesale cost and retail price of fuel.
Processing Processing expenses increased from $69.7 million in 2010 to $84.5 million in 2011, an increase of $14.8 million, or 21.2%. During 2011, our processing expenses were primarily impacted by volume increases and a card conversion project in certain of our payment programs, a one-time contract termination charge, the unfavorable impact of foreign exchange rates and the impact of acquisitions completed in 2011.
Selling Selling expenses increased from $32.7 million in 2010 to $36.6 million in 2011, an increase of $3.9 million, or 11.9%. The increase was due primarily to additional sales and marketing spending in certain markets.
General and administrative General and administrative expense increased from $78.1 million in 2010 to $84.8 million in 2011, an increase of $6.7 million, or 8.6%. The increase was primarily due to additional public company costs during the period, transaction related costs, the impact of acquisitions completed during 2011 and the unfavorable impact of foreign exchange rates, partially offset by a decrease in non-cash stock compensation expense related to our stock incentive plans.
Depreciation and amortization Depreciation and amortization increased from $33.7 million in 2010 to $36.2 million in 2011, an increase of $2.5 million, or 7.4%. The increase was primarily attributable to the full year impact of acquisitions completed during 2010 as well as the impact of acquisitions completed in 2011, which resulted in an increase of $2.2 million related to the amortization of acquired intangible assets for customer and vendor relationships, trade names and trademarks, non-compete agreements and software, as well as acquired fixed assets.
Operating income and operating margin
Consolidated operating income
Operating income increased from $170.5 million in 2010 to $226.3 million in 2011, an increase of $55.8 million, or 32.7%. Our operating margin was 39.3% and 43.6% for 2010 and 2011, respectively. The increase in operating income from 2010 to 2011 was due primarily to organic growth in the business, the impact of higher fuel prices, higher fuel spread revenues, the impact of acquisitions completed during 2011, organic growth in the business and the positive impact of foreign exchange rates. These increases were partially offset by additional public company costs, transaction related costs and additional costs to support the growth in our business.
Additionally, during 2011, we completed the acquisition of alla Mexican prepaid fuel card and food voucher company and Allstar Business Solutions, which together contributed to the increase in consolidated operating income. However, the Mexican business and Allstar business both produce lower margin products in comparison to our other businesses and when combined with our other businesses’ operating income, produced a lower margin than would have resulted without the acquisitions.
For the purpose of the outstanding sharessegment operating results, we calculate segment operating income by subtracting segment operating expenses from segment revenue. Similarly, segment operating margin is calculated by dividing segment operating income by segment revenue.
North American segment operating income
North American operating income increased from $106.7 million in 2010 to $153.7 million in 2011, an increase of Abbey Group (OXON) Limited, a fleet card company based$47.0 million, or 44.0%. North American operating margin was 37.1% and 44.1% for 2010 and 2011, respectively. The increase in operating income from 2010 to 2011 was due primarily to organic growth in the United Kingdom,business, the impact of higher fuel prices, higher fuel spread revenues and affiliated entities,less stock compensation expense related to our stock incentive plans. These increases were partially offset by additional public company costs during 2011 compared to 2010.
International segment operating income
International operating income increased from $63.8 million in 2010 to $72.6 million in 2011, an increase of $8.8 million, or 13.8%. International operating margin was 43.6% and 42.5% for 2010 and 2011, respectively. The increase in operating income from 2010 to 2011 was due primarily to the impact of acquisitions completed in 2010 and 2011, the impact of higher fuel prices and the positive impact of foreign exchange rates. These increases were partially offset by additional amortization related to acquisitions completed during 2010 and 2011, transaction related costs and additional costs to support the growth in our business.
The lower operating margin was due to the Mexican prepaid fuel card and food voucher company and Allstar Business Solutions acquisitions, which both produce lower margin products in comparison to our other businesses.
Other income, net
Other income, net decreased from income of $1.3 million 2010 to $0.6 million in 2011, a decrease of $0.7 million, or 55.3%. The decrease was due primarily to lower foreign currency exchange gains recognized during 2011.
Interest expense, net
Interest expense, net reflects the amount of interest paid on our 2005 Credit Facility, CCS Credit Facility and new Credit Facility, (all of which are defined in “Liquidity and capital resources”) offset by interest income. Interest expense decreased from $20.5 million in 2010 to $13.4 million in 2011, a decrease of $7.1 million, or 34.8%. This decrease was primarily due to the expiration of an aggregate purchase priceinterest rate swap agreement, which matured in November 2010, which resulted in interest expense of $15.0$6.0 million (basedin 2010. The remaining decrease is due to the decline in interest rates on our credit facilities and lower term debt balances outstanding on our term loan facilities. Additionally, during 2011, we paid down of our 2005 Credit Facility and CCS Facility upon entry into our new Credit Facility on June 22, 2011. The average interest rate (including the exchangeunused credit facility fee) on our new Credit Facility was 2.38% in the year ended December 31, 2011. The average interest rate on the date of the acquisition).
In June 2008, we completed the acquisition of all of the outstanding shares of ICP International Card Products B.V., or ICP, a payment transaction processing company based2005 Credit Facility was 2.35% in the Netherlands, for an aggregate cash purchase price of $5.9 million (based on the exchange2011 compared to 4.75% in 2010. The average interest rate on the dateCCS Credit Facility was 2.66% in 2011 compared to 2.72% in 2010.
Loss on early extinguishment of debt
Loss on early extinguishment of debt increased from zero in 2010 to $2.7 million in 2011. This increase is due to the write-off of $1.7 million and $1.0 million in deferred debt issuance costs associated with the early extinguishment of the acquisition)2005 Facility and CCS Credit Facility, respectively, upon retirement of these credit facilities with the proceeds from our new Credit Facility signed on June 22, 2011.
Provision for income taxes
The provision for income taxes increased from $43.4 million in 2010 to $63.5 million in 2011, an increase of $20.1 million, or 46.5%. AsThe increase from 2010 to 2011 was due primarily to an increase in our income before income tax and an increase in our effective tax rate from 28.7% in 2010 to 30.1% in 2011. The increase in our effective tax rate was due primarily to a result of this acquisition, we expandedone-time favorable reduction in our processing servicesreserve for major oil companiesuncertain tax positions in Europe, Asia and Africa.
In July 2008, we completed the acquisition of all2010, which was not repeated in 2011. See also “Note 11-Income Taxes” for a reconciliation of the outstanding sharesfederal statutory rate to the consolidated effective tax rate.
Net income
For the reasons discussed above, our net income increased from $107.9 million in 2010 to $147.3 million in 2011, an increase of Petrol Plus Region, an independent fuel card provider based in Russia, and an affiliated entity, for an aggregate purchase price of $49.0 million. As a result of this acquisition, we have become the leading independent fuel card company in Russia with additional operations in Poland, Lithuania, Latvia and Estonia.
Results of operations$39.4 million, or 36.6%.
Year ended December 31, 2010 compared to the year ended December 31, 2009
The following table sets forth selected consolidated statement of operations data for the years ended December 31, 2010 and 2009
| Year ended December 31, 2010 | % of total revenue | Year ended December 31, 2009 | % of total revenue | Increase (decrease) | % Change | Year ended December 31, 2010 | % of total revenue | Year ended December 31, 2009 | % of total revenue | Increase (decrease) | % Change | |||||||||||||||||||||||||||||||||||||
Revenues, net: | ||||||||||||||||||||||||||||||||||||||||||||||||
North America | $ | 287.8 | 66.3 | % | $ | 227.4 | 64.2 | % | $ | 60.4 | 26.6 | % | $ | 287.8 | 66.3 | % | $ | 227.4 | 64.2 | % | $ | 60.4 | 26.6 | % | ||||||||||||||||||||||||
International | 146.0 | 33.7 | % | 126.7 | 35.8 | % | 19.3 | 15.2 | % | 146.0 | 33.7 | % | 126.7 | 35.8 | % | 19.3 | 15.2 | % | ||||||||||||||||||||||||||||||
|
|
|
|
|
| |||||||||||||||||||||||||||||||||||||||||||
Total revenues, net | 433.8 | 100.0 | % | 354.1 | 100.0 | % | 79.7 | 22.5 | % | 433.8 | 100.0 | % | 354.1 | 100.0 | % | 79.7 | 22.5 | % | ||||||||||||||||||||||||||||||
Consolidated operating expenses: | ||||||||||||||||||||||||||||||||||||||||||||||||
Merchant commissions | 49.1 | 11 | % | 39.7 | 11 | % | 9.4 | 23.7 | % | 49.1 | 11.3 | % | 39.7 | 11.2 | % | 9.4 | 23.7 | % | ||||||||||||||||||||||||||||||
Processing | 69.7 | 16 | % | 58.0 | 16 | % | 11.7 | 20.2 | % | 69.7 | 16.1 | % | 58.0 | 16.4 | % | 11.7 | 20.2 | % | ||||||||||||||||||||||||||||||
Selling | 32.7 | 8 | % | 30.6 | 9 | % | 2.1 | 6.9 | % | 32.7 | 7.5 | % | 30.6 | 8.6 | % | 2.1 | 6.9 | % | ||||||||||||||||||||||||||||||
General and administrative | 78.1 | 18 | % | 51.4 | 15 | % | 26.7 | 51.9 | % | 78.1 | 18.0 | % | 51.4 | 14.5 | % | 26.7 | 51.9 | % | ||||||||||||||||||||||||||||||
Depreciation and amortization | 33.7 | 8 | % | 28.4 | 8 | % | 5.3 | 18.7 | % | 33.7 | 7.8 | % | 28.4 | 8.0 | % | 5.3 | 18.7 | % | ||||||||||||||||||||||||||||||
|
|
|
|
|
| |||||||||||||||||||||||||||||||||||||||||||
Operating income | 170.5 | 39 | % | 146.0 | 41 | % | 24.5 | 16.8 | % | 170.5 | 39.3 | % | 146.0 | 41.2 | % | 24.5 | 16.8 | % | ||||||||||||||||||||||||||||||
|
|
|
|
|
| |||||||||||||||||||||||||||||||||||||||||||
Other income, net | (1.3 | ) | 0 | % | (0.9 | ) | 0 | % | (0.4 | ) | 44.4 | % | (1.3 | ) | (0.3 | )% | (0.9 | ) | 0.2 | % | 0.4 | 44.4 | % | |||||||||||||||||||||||||
Interest expense, net | 20.5 | 5 | % | 17.3 | 5 | % | 3.2 | 18.5 | % | 20.5 | 4.7 | % | 17.3 | 4.9 | % | 3.2 | 18.5 | % | ||||||||||||||||||||||||||||||
Provision for income taxes | 43.4 | 10 | % | 40.5 | 11 | % | 2.9 | 7.2 | % | 43.4 | 10.0 | % | 40.5 | 11.4 | % | 2.9 | 7.2 | % | ||||||||||||||||||||||||||||||
|
|
|
|
|
| |||||||||||||||||||||||||||||||||||||||||||
Net income | $ | 107.9 | 25 | % | $ | 89.1 | 25 | % | $ | 18.8 | 21.1 | % | $ | 107.9 | 24.9 | % | $ | 89.1 | 25.2 | % | $ | 18.8 | 21.1 | % | ||||||||||||||||||||||||
|
|
|
|
|
| |||||||||||||||||||||||||||||||||||||||||||
Operating income for segments: | ||||||||||||||||||||||||||||||||||||||||||||||||
North America | $ | 103.5 | 36 | % | $ | 91.7 | 40 | % | $ | 11.8 | 12.9 | % | $ | 106.7 | 24.6 | % | $ | 91.7 | 25.9 | % | $ | 15.0 | 16.4 | % | ||||||||||||||||||||||||
International | 67.0 | 46 | % | 54.3 | 43 | % | 12.7 | 23.4 | % | 63.8 | 14.7 | % | 54.3 | 15.3 | % | 9.5 | 17.5 | % | ||||||||||||||||||||||||||||||
|
|
| ||||||||||||||||||||||||||||||||||||||||||||||
Operating income | $ | 170.5 | 39 | % | $ | 146.0 | 41 | % | $ | 24.5 | 16.8 | % | $ | 170.5 | 39.3 | % | $ | 146.0 | 41.2 | % | $ | 24.5 | 16.8 | % | ||||||||||||||||||||||||
|
|
| ||||||||||||||||||||||||||||||||||||||||||||||
Operating margin for segments | ||||||||||||||||||||||||||||||||||||||||||||||||
North America | 36.0 | % | 40.3 | % | (4.4 | )% | 37.1 | % | 40.3 | % | (3.2 | )% | ||||||||||||||||||||||||||||||||||||
International | 45.9 | % | 42.9 | % | 3.0 | % | 43.6 | % | 42.9 | % | 0.7 | % | ||||||||||||||||||||||||||||||||||||
Revenue
Our consolidated revenue increased from $354.1 million in 2009 to $433.8 million in 2010, an increase of $79.7 million, or 22.5%. During 2010, our consolidated revenue was positively impacted by the following:
organic growth in certain of our payment programs;
higher average fuel prices as compared to 2009;
our total revenue increased by $27.2 million as a result of the adoption of authoritative guidance related to our asset securitization agreement as further discussed in “Note 2—Summary of Significant Accounting Policies”; and
acquisitions completed during 2009, which contributed an aggregate of $9.3 million in revenue in 2010 in excess of revenue recognized in 2009 (excluding the impact of foreign exchange rate fluctuations);
the average retail price of fuel was higher in 2010 as compared to 2009, which we believed added $4.5 million in revenue in 2010; and
higher program fees and charges from our existing customers.2009.
During 2010, our consolidated revenue was negatively impacted by a range of factors, including the strengthening of the U.S. dollar during 2010, relative to other foreign currencies, which resulted in unfavorable foreign exchange rates as compared to 2009 that reduced our revenue in 2010 by $1.0 million.
North American segment revenue
North American revenue increased from $227.4 million in 2009 to $287.8 million in 2010, an increase of $60.4 million, or 26.6%. The increase inDuring 2010, our North American segment revenue was positively impacted by the following:
organic growth in certain of our payment programs;
higher average fuel prices as compared to 2009;
higher spread revenue due primarily to:to the wholesale cost of fuel decreasing at a faster rate than the retail price of fuel; and
revenue increased by $27.2 million as a result of the adoption of authoritative guidance related to our asset securitization agreement as further discussed in “Note 2—Summary of significant accounting policies”;
a decrease in the wholesale price of fuel at a higher rate than the retail price of fuel during 2010, causing the margin between the wholesale cost of fuel and the retail price of fuel to expand, which we believed added $4.1 million in revenue in 2010;
the average retail price of fuel was higher in 2010 as compared to 2009, which we believed added $0.5 million in revenue in 2010; and
higher program fees and charges from our existing customers..
International segment revenue
International segment revenue increased from $126.7 million in 2009 to $146.0 million in 2010, an increase of $19.3 million, or 15.2%. The increase inDuring 2010, our International segment revenue was due primarily topositively impacted by the following:
theorganic growth in certain of our payment programs;
higher average retail price of fuel was higher in 2010prices as compared to 2009, which we believed added $4.0 million in revenue in 2010;2009; and
acquisitions completed during 2009, which contributed an aggregate of $9.5 million in revenue in2009.
During 2010, in excess of revenue recognized in 2009 (excluding the impact of foreign exchange rate fluctuations); and
higher program fees and charges from our existing customers.
The increase in International revenue was primarilythese positive impacts were partially offset by:
by the strengthening of the U.S. dollar during 2010, relative to other foreign currencies, which resulted in unfavorable foreign exchange rates that reduced our revenue in 2010 by $1.0 million;
an increase inmillion and lower spread revenue due to the wholesale pricecost of fuel increasing at a higherfaster rate than the retail price of fuel during 2010, causing the margin between the wholesale cost of fuel and the retail price of fuel to shrink, which we believed decreased revenue by $5.2 million in revenue in 2010; andfuel.
lower transaction volumes, which resulted primarily from the wind down of a partner contract in Europe, inherited from an acquisition, which we chose not to renew.
Consolidated operating expenses
Merchant commission Merchant commissions increased from $39.7 million in 2009 to $49.1 million in 2010, an increase of $9.4 million, or 23.7%. This increase was due primarily to the fluctuation of the margin between the wholesale cost and retail price of fuel and the impact of higher volumes in businesses where merchant commissions are paid.
Processing Processing expenses increased from $58.0 million in 2009 to $69.7 million in 2010, an increase of $11.7 million, or 20.2%. Our processing expenses increased by $21.9 million as a result of the adoption of authoritative guidance related to our asset securitization agreement as further discussed in “Note 2—Summary of Significant Accounting Policies”. This increase was offset by a decrease of $13.7 million for bad debt due to a lower percentage of uncollectible accounts.
Selling Selling expenses increased from $30.6 million in 2009 to $32.7 million in 2010, an increase of $2.1 million, or 6.9%. The increase was due primarily to additional sales and marketing spending in certain markets.
General and administrative. General and administrative expense increased from $51.4 million in 2009 to $78.1 million in 2010, an increase of $26.7 million, or 51.9%. The increase was primarily due to a one-time compensation charge of $23.8 million recorded in the fourth quarter of 2010 associated with our initial public offering and the vesting of restricted stock and stock options in connection with this liquidity event. Additional increases in expense are attributable to fees associated with procuring Sarbanes-Oxley compliance and stock compensation expense related to the issuance of additional shares during the year.
Merchant commission. Merchant commissions increased from $39.7 million in 2009 to $49.1 million in 2010, an increase of $9.4 million, or 23.7%. This increase was due primarily to higher wholesale market spreads which impact merchant commissions, as well as higher volumes in those revenue streams where merchant commissions are paid.
Processing. Processing expenses increased from $58.0 million in 2009 to $69.7 million in 2010, an increase of $11.7 million, or 20.2%. Our processing expenses increased by $21.9 million as a result of the adoption of authoritative guidance related to our asset securitization agreement as further discussed in “Note 2—Summary of Significant Accounting Policies”. This increase was offset by a decrease of $13.7 million for bad debt due to a lower percentage of uncollectible accounts.
Selling. Selling expenses increased from $30.6 million in 2009 to $32.7 million in 2010, an increase of $2.1 million, or 6.9%. The increase was due primarily to additional sales and marketing expense to increase sales production.
Depreciation and amortization. Depreciation and amortization increased from $28.4 million in 2009 to $33.7 million in 2010, an increase of $5.3 million, or 18.7%. An increase of $3.2 million was attributable to acquisitions completed during 2009 due primarily to the amortization of intangible assets related to customer and vendor relationships, trade names and trademarks, non-compete agreements and software. In addition we recognized $1.6 million additional depreciation expense related to an increase in capital expenditures primarily as a result of additional investments to build and enhance our proprietary processing systems.
Operating income and operating margin
Consolidated operating income
Operating income increased from $146.0 million in 2009 to $170.5 million in 2010, an increase of $24.5 million, or 16.8%. Our operating margin was 41.2% and 39.3% for 2009 and 2010, respectively. The increase in operating income was due primarily to an increase in managed revenue less merchant commissions of $43.2 million and lower bad debt of $13.7 million. These increases are offset by a $23.8 million one-time compensation charge in connection with our initial public offering and the vesting of restricted stock and stock options in connection with this liquidity event. The decrease in operating margin from 2009 to 2010 was due primarily to onetime compensation charge as discussed above.
For the purpose of segment operations, we calculate segment operating income by subtracting segment operating expenses from segment revenue. Similarly, segment operating margin is calculated by dividing segment operating income by segment revenue.
North American segment operating income
North American operating income increased from $91.7 million in 2009 to $103.5$106.7 million in 2010, an increase of $11.8$15.0 million, or 12.9%16.4%. North American operating margin was 40.3% and 36.0%37.1% for 2009 and 2010, respectively. The increase in operating income from 2009 to 2010 was due primarily to an increase in transaction volumes and rate per transaction during 2010 compared to 2009 and lower bad debt expense in 2010 compared to
2009, partially offset by a onetime compensation charge in 2010. The decrease in operating margin is due to the one-time compensation charge in 2010 related to our initial public offering.
International segment operating income
International operating income increased from $54.3 million in 2009 to $67.0$63.8 million in 2010, an increase of $12.7$9.5 million, or 23.4%17.5%. International operating margin was 42.9% and 45.9%43.6% for 2009 and 2010, respectively. The
increase in operating income and margin from 2009 to 2010 was due primarily to the full year impact of acquisitions completed during 2009, organic growth in our rate per transaction during 2010, and lower bad debt expense in 2010.
Interest expense, net
Interest expense, net reflects the amount of interest paid on our 2005 Credit Facility and CCS Credit Facility described below under the headings “2005 Credit Facility” and “CCS Credit Facility”, respectively, offset by interest income, related to our securitization facility, in accordance with the adoption of authoritative guidance related to our asset securitization agreement as further discussed in “Note 2—Summary of Significant Accounting Policies”.respectively. Interest expense increased from $17.3 million in 2009 to $20.5 million in 2010, an increase of $3.2 million, or 18.5%. During 2010 our interest expense increased $5.3 million as a result of the adoption of authoritative guidance related to our asset securitization agreement as further discussed in “Note 2—Summary of Significant Accounting Policies”. This increase was partially offset by lower average interest rates during 2010 than experienced during 2009. The average interest rate (including the effect of interest rate derivatives) on the 2005 Credit Facility was 5.48%4.75% in 2010 versus 5.13%5.25% in 2009. The average interest rate on the CCS Credit Facility was 2.13%2.72% in 2010 versus 3.81%3.94% in 2009.
Provision for income taxes
The provision for income taxes increased from $40.5 million in 2009 to $43.4 million in 2010, an increase of $2.9 million, or 7.2%. The increase from 2009 to 2010 was due primarily to an increase in our income before income tax, partially offset by a decrease in our effective tax rate from 31.3% in 2009 to 28.7% in 2010. The decrease in our effective tax rate was due primarily to a change in the mix of earnings between the taxing jurisdictions where we do business and a reduction in our reserve for uncertain tax positions. We pay taxes in many different taxing jurisdictions, including the U.S., most U.S. states and many non-U.S. jurisdictions. The tax rates in non-U.S. taxing jurisdictions are lower than the U.S. tax rate. Consequently, as our earnings fluctuate between taxing jurisdictions our effective tax rate fluctuates. See also “Note 11-Income Taxes” for a reconciliation of the federal statutory rate to the consolidated effective tax rate.
Net income
For all the reasons discussed above, our net income increased from $89.1 million in 2009 to $107.9 million in 2010, an increase of $18.8 million, or 21.1%.
Results of operations
Year ended December 31, 2009 compared to the year ended December 31, 2008
The following table sets forth selected consolidated statement of operations data for the years ended December 31, 2009 and 2008 (dollars in millions).
| Year ended December 31, 2009 | % of total revenue | Year ended December 31, 2008 | % of total revenue | Increase (decrease) | % Change | |||||||||||||||||||
Revenues, net: | ||||||||||||||||||||||||
North America | $ | 227.4 | 64 | % | $ | 205.5 | 60 | % | $ | 21.9 | 10.7 | % | ||||||||||||
International | 126.7 | 36 | % | 135.6 | 40 | % | (8.9 | ) | (6.6 | )% | ||||||||||||||
Total revenues, net | 354.1 | 100 | % | 341.1 | 100 | % | 13.0 | 3.8 | % | |||||||||||||||
Consolidated operating expenses: | ||||||||||||||||||||||||
Merchant commissions | 39.7 | 11 | % | 38.5 | 11 | % | 1.2 | 3.1 | % | |||||||||||||||
Processing | 58.0 | 16 | % | 51.4 | 15 | % | 6.6 | 12.8 | % | |||||||||||||||
Selling | 30.6 | 9 | % | 23.8 | 7 | % | 6.8 | 28.6 | % | |||||||||||||||
General and administrative | 51.4 | 15 | % | 47.6 | 14 | % | 3.8 | 8.0 | % | |||||||||||||||
Depreciation and amortization | 28.4 | 8 | % | 27.3 | 8 | % | 1.1 | 4.0 | % | |||||||||||||||
Operating income | 146.0 | 41 | % | 152.5 | 45 | % | (6.5 | ) | (4.3 | )% | ||||||||||||||
Other income, net | (.9 | ) | 0 | % | (2.5 | ) | (1 | )% | 1.6 | (64.0 | )% | |||||||||||||
Interest expense, net | 17.3 | 5 | % | 20.3 | 6 | % | (3.0 | ) | (14.8 | )% | ||||||||||||||
Provision for income taxes | 40.5 | 11 | % | 37.4 | 11 | % | 3.1 | 8.3 | % | |||||||||||||||
Net income | $ | 89.1 | 25 | % | $ | 97.3 | 29 | % | $ | (8.2 | ) | (8.4 | )% | |||||||||||
Operating income for segments: | ||||||||||||||||||||||||
North America | $ | 91.7 | 40 | % | $ | 88.3 | 43 | % | $ | 3.4 | 3.9 | % | ||||||||||||
International | 54.3 | 43 | % | 64.2 | 47 | % | (9.9 | ) | (15.4 | )% | ||||||||||||||
Operating income | $ | 146.0 | 41 | % | $ | 152.5 | 45 | % | $ | (6.5 | ) | (4.3 | )% | |||||||||||
Operating margin for segments: | ||||||||||||||||||||||||
North America | 40.3 | % | 43.0 | % | (2.5 | )% | ||||||||||||||||||
International | 42.9 | % | 47.3 | % | (4.4 | )% | ||||||||||||||||||
Revenue
Our consolidated revenue increased from $341.1 million in 2008 to $354.1 million in 2009, an increase of $13.0 million, or 3.8%. During 2009, our consolidated revenue was positively impacted by:
acquisitions completed during 2009, which represented an aggregate of $45.5 million in revenue from their respective dates of acquisition;
acquisitions completed during 2008, which contributed an aggregate of $7.2 million in revenue in 2009 in excess of revenue recognized in 2008 (excluding the impact of foreign exchange rate fluctuations); and
higher program fees and charges from our existing customers, including the full-year impact of the implementation of a private label contract on our proprietary system, which contributed approximately $14.9 million of revenue year over year.
During 2009, our consolidated revenue was negatively impacted by a range of factors, including:
the strengthening of the U.S. dollar during 2009, relative to other foreign currencies, which resulted in unfavorable foreign exchange rates as compared to 2008 that reduced our revenue in 2009 by $18.1 million;
lower transaction volumes during 2009 due primarily to the impact of the economic downturn;
a decrease in the wholesale price of fuel at a higher rate than the retail price of fuel during the second half of 2008, causing the margin between the wholesale cost of fuel and the retail price of fuel to expand beyond historical levels. We believe the differential contributed incremental revenue of approximately $9 million in 2008 relative to revenue in 2009. Fuel-price spread margins returned to more historical levels in 2009; and
the average retail price of fuel was lower in 2009 as compared to 2008. We believe that the lower average retail price of fuel in 2009 reduced revenue by approximately $10 million.
North American segment revenue
North American revenue increased from $205.5 million in 2008 to $227.4 million in 2009, an increase of $21.9 million, or 10.7%. The increase in our North American revenue was due primarily to:
the impact of nine months of revenue following the CLC Acquisition in April 2009, the results of which were reported in our results of operations from the date of acquisition and represented $37.1 million in revenue;
the loss on sales of receivables to the securitization facility, which on a managed basis represents interest on the securitization facility and bad debt expense on the securitized accounts receivable, decreased from $43.2 million in 2008 to $27.2 million in 2009, resulting in a lower adjustment to revenue of $16.0 million in 2009 versus 2008; and
$14.9 million in higher program fees and charges from our existing customers, including the full-year impact of the implementation of a private label contract on our proprietary system.
The increase in North American revenue was primarily offset by:
a decrease in the wholesale price of fuel at a higher rate than the retail price of fuel during the second half of 2008, causing the margin between the wholesale cost of fuel and the retail price of fuel to expand beyond historical levels. We believe the differential contributed incremental revenue of approximately $9 million in 2008 relative to revenue in 2009. Fuel-price spread margins returned to more historical levels in 2009;
the average retail price of fuel was lower in 2009 as compared to 2008. We believe that the lower average retail price of fuel in 2009 reduced revenue by approximately $10 million; and
lower transaction volumes, which we believe resulted from the economic downturn.
International segment revenue
International segment revenue decreased from $135.6 million in 2008 to $126.7 million in 2009, a decrease of $8.9 million, or 6.6%. The decrease in International segment revenue was due primarily to the following:
the strengthening of the U.S. dollar during 2009, relative to foreign currencies, which resulted in unfavorable foreign exchange rates that reduced our revenue in 2009 by $18.1 million; and
lower transaction volumes, which we believe resulted from the economic downturn.
The decrease in International segment revenue was partially offset by:
the full-year impact of acquisitions completed during 2008 and the partial-year impact of acquisitions completed during 2009, which represented an aggregate increase in revenue of $15.7 million in 2009; and
higher revenue per transaction from our existing card products as compared to 2008.
Consolidated operating expenses
Merchant commissions. Merchant commissions increased from $38.5 million in 2008 to $39.7 million in 2009, an increase of $1.2 million, or 3.1%. This increase was due primarily to acquisitions completed during 2009 which added $6.2 million in expense, partially offset by the favorable impact of foreign exchange rates of $3.3 million, and lower transaction volumes by existing customers, which we believe were due to the economic downturn.
Processing. Processing expenses increased from $51.4 million in 2008 to $58.0 million in 2009, an increase of $6.6 million, or 12.8%. This increase was due primarily to the impact of acquisitions completed during 2009 of $7.7 million and an increase of $0.5 million for bad debt related to non-securitized accounts receivable due to a higher percentage of uncollectible accounts. These increases were partially offset by the favorable impact of foreign exchange rates of $1.0 million and lower servicing costs of $2.4 million due to operating efficiencies.
Selling. Selling expenses increased from $23.8 million in 2008 to $30.6 million in 2009, an increase of $6.8 million, or 28.6%. The increase was due primarily to the impact of acquisitions completed during 2009 of $3.5 million and additional sales and marketing expense of $4.1 million to increase sales production. These increases were partially offset by the favorable impact of foreign exchange rates of $0.7 million.
General and administrative. General and administrative expense increased from $47.6 million in 2008 to $51.4 million in 2009, an increase of $3.8 million, or 8.0%. An increase of $9.2 million was attributable to acquisitions completed during 2009. This increase was partially offset by the favorable impact of foreign exchange rates of $3.7 million and operating efficiencies that we believe reduced expenses by $2.2 million.
Depreciation and amortization. Depreciation and amortization increased from $27.3 million in 2008 to $28.4 million in 2009, an increase of $1.1 million, or 4.0%. An increase of $5.7 million was attributable to acquisitions completed during 2009 due primarily to the amortization of intangible assets related to customer and vendor relationships, trade names and trademarks, non-compete agreements and software. This increase was partially offset by the impact of a contract that became fully amortized during 2008 and represented $5.9 million of additional amortization in 2008.
Operating income and operating margin
Consolidated operating income
Operating income decreased from $152.5 million in 2008 to $146.0 million in 2009, a decrease of $6.5 million, or 4.3%. Our operating margin was 44.7% and 41.2% for 2008 and 2009, respectively. The decrease in operating income and margin from 2008 to 2009 was due primarily to the impact of lower fuel price-spread revenue during 2009 relative to the higher than normal fuel-price spreads experienced during the second half of 2008, the unfavorable impact of foreign exchange rates in 2009 compared to 2008, lower average retail price of fuel in 2009 compared to 2008 and a decrease in transaction volumes as a result of the global economic downturn.
For the purpose of segment operations, we calculate segment operating income by subtracting segment operating expenses from segment revenue. Similarly, segment operating margin is calculated by dividing segment operating income by segment revenue.
North American segment operating income
North American operating income increased from $88.3 million in 2008 to $91.7 million in 2009, an increase of $3.4 million, or 3.9%. North American operating margin was 43.0% and 40.3% for 2008 and 2009, respectively. The increase in operating income from 2008 to 2009 was due primarily to the impact of the CLC Acquisition, which we completed in April 2009, and organic growth in our rate per transaction during 2009 compared to 2008. These factors were partially offset by lower fuel-price spread revenue in 2009 compared to 2008 due to higher than normal fuel-price spreads in the second half of 2008, a lower average retail price of fuel in 2009 compared to 2008 and a decrease in transaction volumes, which we believe resulted from the economic downturn. Operating margin decreased from 2008 to 2009 due primarily to lower fuel-price spread revenue in 2009 as discussed above without a corresponding decrease in our operating expenses. As a result, the higher than normal revenues in 2008 increased operating margin in that year by approximately 3%.
International segment operating income
International operating income decreased from $64.2 million in 2008 to $54.3 million in 2009, a decrease of $9.9 million, or 15.4%. International operating margin was 47.3% and 42.9% for 2008 and 2009, respectively. The decrease in operating income and margin from 2008 to 2009 was due primarily to the impact of foreign exchange rates and lower transaction volumes as a result of the economic downturn. These factors were partially offset by the impact of completed acquisitions during 2009 and the full year impact of the acquisitions completed during 2008.
Other income, net
Other income decreased from $2.5 million in 2008 to $0.9 million in 2009, a decrease of $1.6 million, or 64.0%. The decrease was due primarily to the reversal of a previously-recorded litigation reserve of $1.1 million in 2008 and losses on foreign currency transactions of $0.5 million in 2009.
Interest expense, net
Interest expense, net reflects the amount of interest paid on our 2005 Credit Facility and CCS Credit Facility described below under the headings “2005 Credit Facility” and “CCS Credit Facility”, respectively, offset by interest income. Interest expense decreased from $20.3 million in 2008 to $17.3 million in 2009, a decrease of $3.0 million, or 14.8%. The decrease from 2008 to 2009 resulted from lower average interest rates during 2009 than experienced during 2008. The average interest rate (including the effect of interest rate derivatives) on the 2005 Credit Facility was 5.13% in 2009 versus 6.19% in 2008. The average interest rate on the CCS Credit Facility was 3.81% in 2009 versus 5.82% in 2008.
Provision for income taxes
The provision for income taxes increased from $37.4 million in 2008 to $40.5 million in 2009, an increase of $3.1 million, or 8.3%. The increase from 2008 to 2009 was due primarily to an increase in our effective tax rate from 27.8% in 2008 to 31.3% in 2009. The increase in our effective tax rate was due primarily to the increase in valuation allowances on state net operating losses. As of December 31, 2009, we had net operating loss carryforwards for state income tax purposes of approximately $53.0 million, which are available to offset future state taxable income through 2021. A valuation allowance was made against our state net operating loss carryforwards, the cumulative effect of which was recognized as an increase in tax expense of approximately $0.9 million for 2009. Additionally, part of the increase was due to acquisition-related costs, which were expensed for accounting purposes but capitalized for tax purposes, and the mix of earnings between domestic and foreign jurisdictions with differing tax rates.
Net income
For all the reasons discussed above, our net income decreased from $97.3 million in 2008 to $89.1 million in 2009, a decrease of $8.2 million, or 8.4%.
Liquidity and capital resources
Our principal liquidity requirements are to service and repay our indebtedness, make acquisitions of businesses and commercial account portfolios and meet working capital, tax and capital expenditure needs.
Sources of liquidity
At December 31, 2010,2011, our unrestricted cash and cash equivalents balance totaled $114.8$285.2 million. Our restricted cash balance at December 31, 20102011 totaled $62.3$55.8 million. Restricted cash primarily represents customer deposits primarily in the Czech Republic, which we are restricted from using other than to repay customer deposits and which may not be deposited outside of the Czech Republic.
At December 31, 2011, cash and cash equivalents held in foreign subsidiaries where we have determined we are permanently reinvested is $261.8 million. All of the cash and cash equivalents held by our foreign subsidiaries, excluding restricted cash, are available for general corporate purposes. Our current intent is to permanently reinvest these funds outside of the U.S. Our current expectation for funds held in our foreign subsidiaries is to use the funds to finance foreign organic growth, to pay for potential future foreign acquisitions and to repay any foreign borrowings that may arise from time to time. We currently believe that funds generated from our U.S. operations, along with potential borrowing capabilities in the U.S. will be sufficient to fund our U.S. operations
for the foreseeable future, and therefore do not foresee a need to repatriate cash held by our foreign subsidiaries in a taxable transaction to fund our U.S. operations. However, if at a future date or time these funds are needed for our operations in the U.S. or we otherwise believe it is in our best interests to repatriate all or a portion of such funds, we may be required to accrue and pay U.S. taxes to repatriate these funds. No assurances can be provided as to the amount or timing thereof, the tax consequences related thereto or the ultimate impact any such action may have on our results of operations or financial condition.
We utilize an accounts receivable securitization facility to finance a majority of our domestic fuel card receivables, to lower our cost of funds and more efficiently use capital. We generate and record accounts receivable when a customer makes a purchase from a merchant using one of our card products and generally pay merchants within seven days of receiving the merchant billing. As a result, we utilize the asset securitization facilitySecuritization Facility as a source of liquidity to provide the cash flow required to fund merchant payments while we collect customer balances. These balances are primarily composed of charge balances, which are typically billed to the customer on a weekly, semimonthly or monthly basis, and are generally required to be paid within 3014 days of billing. We also consider the undrawn amounts under our securitization facilitySecuritization Facility and 2005 Credit Facility as funds available for working capital purposes or for acquisitions. At December 31, 2010,2011, we had the ability to generate approximately $108.2$26 million of additional liquidity under our securitization facilitySecuritization Facility and $50.0$475 million available under the 2005undrawn on our revolving Credit Facility.
Based on our current forecasts and anticipated market conditions, we believe that our current cash balances, our available borrowing capacity and our ability to generate cash from operations, will be sufficient to fund our liquidity needs for at least the next 12twelve months. However, we regularly evaluate our cash requirements for current operations, commitments, capital requirements and acquisitions, and we may elect to raise additional funds for these purposes in the future, either through the issuance of debt andor equity securities or otherwise.securities. We may not be able to obtain additional financing on terms favorable to us, if at all.
Cash flows
The following table summarizes our cash flows for the years ended December 31, 2011, 2010 2009, and 2008.2009.
| Year ended December 31, | Year ended December 31, | |||||||||||||||||||||||
(in millions) | 2010 | 2009 | 2008 | 2011 | 2010 | 2009 | ||||||||||||||||||
Net cash provided by operating activities | $ | 139.8 | $ | 178.8 | $ | 58.1 | $ | 279.6 | $ | 139.8 | $ | 178.8 | ||||||||||||
Net cash used in investing activities | (21.2 | ) | (240.8 | ) | (63.0 | ) | (347.2 | ) | (21.2 | ) | (240.8 | ) | ||||||||||||
Net cash provided/(used) by financing activities | (86.5 | ) | 72.2 | 14.9 | ||||||||||||||||||||
Net cash provided by (used) in financing activities | 236.2 | (86.5 | ) | 72.2 | ||||||||||||||||||||
Operating activities. Net cash provided by operating activities for 2011 was $279.6 million compared to $139.8 million for 2010. The increase is primarily due to additional net income of $39.4 million and a decrease in working capital, driven primarily by the increase in accounts payable, accrued expenses and customer deposits of $123.0 million, partially offset by an increase in accounts receivable of $41.1 million.
Net cash provided by operating activities for 2010 was $139.8 million compared to $178.8 million for 2009. The decrease was primarily attributable to a decrease in working capital, driven mainly by an increase in accounts receivable of $41.3 million, primarily due primarily fromto organic growth and higher fuel prices partially offset by improved collections.
Net cash provided by operating activities for 2009 was $178.8 million compared to $58.1 million for 2008. This improvement is attributable primarily to working capital improvements of $102.8 million, driven mainly by an increase in accounts payable due to timing of year-end merchant payables, interest and income tax and improved collection on accounts receivable, and an increase in prepaid expenses related to timing of purchases that contributed approximately $24.3 million year over year. These increases were partially offset by lower net income of $8.2 million.
Investing activities. Net cash used in investing activities was $347.2 million in 2011 compared to $21.2 million in 2010. The increase in cash used in investing activities is attributable to the increase in cash used for acquisitions of $323.7 million, net of cash acquired. Net cash used in investing activities decreased $219.6to $21.2 million in 2010 from $240.8 million in 2009,2010. This decrease is due primarily to the changesa reduction in dollars spent for acquisitions completed in 2009 of $221.1 million. In addition, our capital expenditures increased from $9.7 million in 2009 to $11.2 million in 2010 primarily as a result of additional investments to build and enhance our proprietary processing systems. Net cash used in investing activities increased $177.8 million in 2009, from $63.0 million in 2008, due primarily to the changes in dollars spent for acquisitions completed in 2009 of $175.2 million. In addition, our capital expenditures increased from $7.1 million in 2008 to $9.7 million in 2009 primarily as a result of additional investments to build and enhance our proprietary processing systems.acquisitions.
Financing activities. Net cash provided by financing activities increased $322.7 million, from cash used in financing activities of $86.5 million in 2010, to cash provided by financing activities of $236.2 million in 2011.
The increase in cash provided by financing activities is attributable primarily to additional borrowings on the securitization facility of $136.0 million in 2011 compared to payments on the Securitization Facility of $74.0 million in 2010. In addition, on June 22, 2011, we entered into a new five-year, $900 million Credit Facility with a syndicate of banks, which provided additional cash from financing activities during 2011 of $425.0 million over the same period in 2010. Proceeds from this new Credit Facility were used to retire our indebtedness under our 2005 Credit Facility and CCS Credit Facility. During 2011, we made aggregate principal payments on the 2005 Credit Facility and CCS Credit Facility of $330.0 million and seller financing payments of $1.6 million, compared to aggregate principal payments of $24.6 million in 2010. During 2011, we made principal payments of $7.5 million on the term loan under our new Credit Facility.
Net cash provided by financing activities decreased $158.7 million, from $72.2 million in 2009, resulting in a use of cash used in financing activities in 2010 of $86.5 million. The decrease in cash provided by financing activities resulted from the net proceeds received from the issuance of our Series E preferred stock of
$93.7 $93.7 million in April 2009. In addition, during 2010 we made principal payments on the securitization facilitySecuritization Facility of $74.0 million. This decrease was partially offset by proceeds from the issuance of common stock of $9.6 million in 2010 in connection with our initial public offering.
Net cash provided by financing activities increased $57.3 million in 2009, from $14.9 million in 2008. The increase in cash provided by financing activities resulted from the net proceeds received from the issuance of our Series E preferred stock of $93.7 million in April 2009. In addition, during 2009 we made principal payments on the 2005 Credit Facility and the CCS Credit Facility of $21.0 million compared to aggregate principal payments of $33.8 million in 2008. These increases were offset by note proceeds of $50.0 million received in 2008 under the delayed draw portion of the 2005 Credit Facility.
Capital spending summary
Our capital expenditures were $13.5 million in 2011 compared to $11.2 million in 2010, an increase of $2.3 million, or 20.5%. The increase was primarily related to additional investments to continue to enhance our existing processing systems and continued development of a new European processing system. We anticipate our capital expenditures to increase to approximately $16 million for 2012 as we continue to enhance our existing processing systems.
Our capital expenditures were $11.2 million in 2010 compared to $9.7 million in 2009, and $11.2 million in 2010, an increase of $1.5 million, or 15.5%. The increase was primarily related to additional investments to continue to enhance our existing processing systems and to develop a new European processing system.
Credit Facility
On June 22, 2011, we, and certain of our domestic and foreign owned subsidiaries, as designated co-borrowers (the “Borrowers”), entered into a new five-year, $900 million Credit Agreement (the “Credit Agreement”) with Bank of America, N.A., as administrative agent, swing line lender and L/C issuer, and a syndicate of financial institutions (the “Lenders”). The Credit Agreement provides for a $300 million term loan facility and a $600 million revolving credit facility, with sublimits for letters of credit, swing line loans and multicurrency borrowings in Euros, Sterling and Japanese Yen. Subject to certain conditions, including obtaining commitments of lenders, we have the option to increase the facility up to an additional $150 million. We refer to this facility as the Credit Facility in this report.
The obligations of the Borrowers under the Credit Agreement are guaranteed by us, as evidenced via an executed Guaranty, in favor of Bank of America, N.A. and the Lenders. The obligations of the Borrowers under the Credit Agreement are secured by a pledge of (i) 100% of the issued and outstanding equity interests owned by us of each Domestic Subsidiary and (2) 66% of the issued outstanding shares of equity interests entitled to vote and 100% of the issued and outstanding equity interests not entitled to vote of each Foreign Subsidiary directly owned by us, as evidenced via an executed a Pledge Agreement, dated as of June 22, 2011, in favor of Bank of America, N.A. and the Lenders.
Proceeds from this new Credit Facility were used to retire our existing indebtedness under our 2005 Credit Facility and CCS Credit Facility. Proceeds from this new Credit Facility may also be used for working capital purposes, acquisitions, and other general corporate purposes.
As of December 31, 2011, we had $292.5 million in outstanding term loans and $125.0 million in borrowings outstanding on the revolving line under the Credit Facility.
Interest on amounts outstanding under the Credit Agreement accrues based on the British Bankers Association LIBOR Rate (the Eurocurrency Rate), plus a margin based on a leverage ratio, or our option, the Base Rate (defined as the rate equal to the highest of (a) the Federal Funds Rate plus 0.50%, (b) the prime rate announced by Bank of America, N.A., or (c) the Eurocurrency Rate plus 1.00%) plus a margin based on a leverage ratio. Interest is payable quarterly in arrears. In addition, we have agreed to pay a quarterly commitment fee at a rate per annum ranging from 0.20% to 0.40% of the daily unused portion of the credit facility. At December 31, 2011, the interest rate on the term loan was 1.80%. At December 31, 2011 the interest rate on the revolving credit facility was 1.80 % and the unused credit facility fee was 0.25%.
The stated maturity date for our term loan and revolving loans and letters of credit under the Credit Agreement is June 22, 2016. The term loan is payable in quarterly installments and are due on the last business day of each March, June, September, and December with the final principal payment due on June 22, 2016. Borrowings on the revolving credit facility are repayable at our option of one, two, three or six months after borrowing, depending on the term of the borrowing on the facility.
Our Credit Agreement contains a number of negative covenants restricting, among other things, limitations on liens (with exceptions for our Securitization Facility) and investments, incurrence or guarantees of indebtedness, mergers, acquisitions, dissolutions, liquidations and consolidations, dispositions, dividends and other restricted payments and prepayments of other indebtedness. In particular, we are not permitted to make any restricted payments (which includes any dividend or other distribution) except that the we may declare and make dividend payments or other distributions to our stockholders so long as (i) on a pro forma basis both before and after the distribution the consolidated leverage ratio is not greater than 3.00:1.00 and we are in compliance with the financial covenants and (ii) no default or event of default shall exist or result therefrom. The Credit Agreement also contains customary events of default. The Credit Agreement includes financial covenants, including a leverage ratio requirement and an interest coverage ratio requirement, measured quarterly. The Company is required to maintain a consolidated leverage ratio to consolidated EBITDA of greater than 3.25 to 1.0 and a consolidated interest coverage ratio of no more than 4.00 to 1.0.
During 2011, we made principal payments of $7.5 million on the term loan. There were no principal payments made on the revolver during 2011. As of December 31, 2011, we were in compliance with each of the covenants under the new Credit Facility agreement.
2005 Credit Facility
We are awere party to a credit agreement, dated as of June 29, 2005, which has beenwas subsequently amended and restated as of April 30, 2007, among FleetCor Technologies Operating Company, LLC and FleetCor UK Acquisition Limited, as borrowers, FleetCor Technologies, Inc., JPMorgan Chase Bank, N.A., as administrative agent and collateral agent, J.P. Morgan Europe Limited, as London agent, and the other lenders party thereto.with a syndicate of banks. We refer to this facility as the 2005 Credit Facility in this report.
The 2005 Credit Facility providesprovided for term loans in the amount of $250.0 million and two tranches of multicurrency revolving loans, each of which revolving loans maywere available to be made in U.S. dollars, British pounds or Euros; a U.S. tranche for the U.S. borrower of up to $30.0 million (with a $10.0 million sub-limit for letters of credit), and a global tranche for both the U.S. borrower and U.K. borrower of up to $20.0 million. The 2005 Credit Facility also includesincluded a $10.0 million swing line facility which iswas available to the U.S. borrower. The credit agreement also providesprovided for delayed draw term loans in the amount of up to $50.0 million, of which $50.0 million was borrowed in April 2008. The 2005 Credit Facility further providesprovided for incremental term loans in an aggregate amount not to exceed $100.0 million. None of the incremental term loans have beenwere made. As of December 31, 2010, we had $270.4 million in outstanding term loans and no borrowings on the revolving line under the 2005 Credit Facility.
Interest on the facilities may accrue,accrued, at our election, based on a base rate, EURIBOR or LIBOR, plus a margin. The margin with respect to the term loans iswas fixed at 2.25% for LIBOR and EURIBOR loans and at 1.25% for base rate loans. With respect to revolving loans and letter of credit fees, the margin or fee iswas determined based on our leverage ratio and rangesranged from 2.00% to 2.50% for LIBOR and EURIBOR loans and from 1.00% to 1.50% for base rate loans. As of December 31, 2010 our term loans bore interest at LIBOR plus 2.25% and we had no U.S. revolving loans or multicurrency loans outstanding. Interest on overdue amounts will accrueaccrued at a rate equal to the applicable interest rate plus 2% per annum.
The stated maturity date for our term loans iswas April 30, 2013 and the stated maturity date for our revolving loans and letters of credit iswas April 30, 2012. The term loans arewere payable in quarterly installments of .25%0.25% of the initial aggregate principal amount of the loans and are due on the last business day of each March, June, September, and December, with the final principal payment due in April 2013. Principal payments of $5.9$270.4 million and $14.0$5.9 million were made on the term loan during 20102011 and 2009,2010, respectively.
Our credit agreement containscontained a number of negative covenants restricting, among other things, indebtedness, investments, liens, dispositions of assets, restricted payments (including dividends), mergers and acquisitions, “burdensome agreements” (as defined in the 2005 Credit Facility), accounting changes, transactions with
affiliates, prepayments of indebtedness, and capital expenditures. Two financial covenants, including a leverage ratio requirement and an interest coverage ratio requirement, arewere measured quarterly. We are currentlyDuring 2010, we were required to maintain a leverage ratio of not greater than 2.25 to 1, and beginning January 1, 2011, we will bewere required to maintain a leverage ratio of not greater than 2.00 to 1. We arewere required to maintain an interest coverage ratio of not less than 4.00 to 1.
On June 22, 2011, we retired our indebtedness under the 2005 Credit Facility with the proceeds from our new Credit Facility. As of December 31, 2010,the date of retirement of this indebtedness, we were in compliance with each of the covenants under the 2005 Credit Facility.
We have received commitments for an additional tranche of revolving loans in the amount of up to $100 million to be made under the terms of the 2005 Credit Facility. The additional revolving loans will be available only in U.S. dollars, and the commitments for the additional revolving loans will not be held pro rata with the commitments held by existing lenders for the revolving loans and term loans. The additional revolving loan commitments will have a maturity date of October 31, 2012. The maturity date of the existing commitments for revolving loans is April 30, 2012, and the lenders providing such commitments will be asked to extend the maturity date to October 31, 2012. The revolving commitments held by any lender not agreeing to the extension of the maturity date will remain April 30, 2012. In all other respects, we expect that the additional revolving loan commitments will be subject to the terms and conditions applicable to revolving loans made under the existing commitments for the U.S. tranche. The conditions for the additional revolving loan commitments include, among other things, the execution of definitive documentation on or before October 1, 2011.
In addition, J.P. Morgan Securities LLC has agreed to arrange an amendment to the 2005 Credit Facility to permit the additional revolving loans described above, to remove the mandatory prepayment requirement with respect to excess cash flow and certain equity issuances, to extend the maturity date on revolving loans with respect to consenting lenders to October 31, 2012, and to increase the interest rate margins for term loans. We expect that the proposed amendment will also include certain other covenant amendments, subject to the requisite consents of the other lenders. The conditions for the proposed amendments include, among other things, the execution of definitive documentation on or before October 1, 2011. A customary consent fee will be payable by us to consenting lenders, together with certain other amendment fees and expenses.
CCS Credit Facility
Certain of our subsidiaries are partieswere party to a credit agreement, dated as of December 7, 2006, which was subsequently amended as of March 28, 2008, among CCS Česká společnost pro platební karty a.s., as borrower, FENIKA s.r.o., as borrower (FENIKA s.r.o. and CCS Česká společnost pro platební karty a.s. subsequently merged intowith a new entity CCS Česká společnost pro platební karty s.r.o. (“CCS”)), FleetCor Luxembourg Holding 3 S.à r.l., as shareholder, HVB Bank Czech Republic a.s. (current commercial name UniCredit Bank Czech Republic, a.s.), as security agent, Bank Austria Creditanstalt AG (current commercial name Unicredit Bank Austria AG), as arranger and facility agent, and the other lenders party thereto.syndicate of banks. We refer to this facility as the CCS Credit Facility in this report.
The CCS Credit Facility agreement providesprovided for term loans in the total amount of CZK 1.675 billion ($80.384.3 million), which consists of a “Facility A” amortized term loan in the amount of CZK 990 million ($47.549.8 million) and a “Facility B” bullet term loan in the amount of CZK 685.0 million ($32.834.2 million). The unpaid principal balance of the term loans as of December 31, 2010 is approximately CZK 387.4 million ($20.4 million) for “Facility A” and approximately CZK 616.2 million ($32.4 million) for “Facility B”. The outstanding balance of CCS term notes payable decreased by an aggregate of $2.3 million as of December 31, 2010 and increased by an aggregate of $1.7 million as of December 31, 2009 due to changes in the value of the Czech koruna versus the U.S. dollar.
Interest on the term loans may accrue,accrued, calculated according to the term selected by CCS, based on a base rate, PRIBOR (Prague Interbank Offered Rate), plus a margin and a mandatory cost. The margin iswas determined based on CCS’s leverage ratio and ranges from 0.95% to 1.75% for the “Facility A” term loan and from 2.00% to 2.90% for the “Facility B” term loan. As of December 31, 2010, the interest rate on “Facility A” equaled 2.16% and the interest rate on “Facility B” was 3.01%.
The stated maturity date for CCS’s term loans iswas December 21, 2013 with respect to “Facility A” and December 21, 2014 with respect to “Facility B”. The “Facility A” term loan iswas payable in semiannual payments in June and December of each year, ending in December 2013 and the “Facility B” term loan iswas payable in one lump sum.sum on December 21, 2014. Principal payments of $6.5$59.7 million and $7.0$6.5 million were made in 20102011 and 2009,2010, respectively. CCS hashad the right to prepay the loans without premium or penalty on the last day of an interest period.
The CCS credit agreement containscontained a number of negative covenants restricting, among other things, indebtedness, investments, liens, dispositions of assets, change of business, restricted payments (including dividends), mergers and acquisitions, transactions with affiliates and prepayments of indebtedness. The agreement also containscontained financial covenants including a leverage ratio requirement, a debt service cover ratio requirement, an equity ratio requirement and a liquidity ratio requirement, all of which arewere tested quarterly. CCS is currentlywas required to maintain a leverage ratio of not greater than 3.25 to 1. CCS iswas required to maintain a debt service coverage ratio of not less than 1.00 to 1, an equity ratio of not less than 0.20 to 1, and a liquidity ratio not less than 1.00 to 1.
On June 22, 2011, we retired our indebtedness under the CCS Credit Facility with the proceeds from our new Credit Facility. As of December 31, 2010, CCS wasthe date of retirement of this indebtedness, we were in compliance with each of the covenants under the CCS Credit Facility agreement.
Seller financing
One of our subsidiaries, FleetCor Luxembourg Holding2 S.à r.l. (“Lux 2”), entered into a Share Sale and Purchase Agreement dated April 24, 2008 (the “Purchase Agreement”) with ICP Internet Cash Payments B.V. for the purchase of ICP International Card Products B.V. The acquired business is now being operated in the Netherlands as FleetCor Technologieën B.V. In connection with the purchase, Lux 2 agreed to make deferred payments in the aggregate amount of €1.0 million ($1.51.4 million), of which one remaining payments is due and payablethe final payment was made on June 6, 2011 in the amount of €0.33 million ($0.430.47 million). The obligation to make such deferred payments iswas described in the Purchase Agreement, as modified by letter agreement dated August 11, 2008, and iswas not evidenced by a promissory note.
In connection with an acquisition by FleetCor Luxembourg Holding4 S.à r.l. in October 2010, the parties agreed to defer our payment of a portion of the purchase price, equal to approximately $1.1 million, which was paid in the February 2011.
In connection with our acquisition of Petrol Plus Region and an affiliated company in 2007, the parties agreed to defer our payment of a portion of the purchase price, equal to approximately $11.9 million, which was paid on February 1, 2010.
In connection with an acquisition by FleetCor Luxembourg Holding4 S.à r.l. in October 2010, the parties agreed to defer our payment of a portion of the purchase price, equal to approximately $1.1 million, which was paid in the first quarter of 2011.
Securitization facility
We are a party to a receivables purchase agreement among FleetCor Funding LLC, as seller, PNC Bank, National Association as administrator, and the various purchaser agents, conduit purchasers and related committed purchasers parties thereto, which was amended and restated for the fourth time as of October 29, 2007 and which has been amended fourseven times since then to add or remove purchasers, and to extend the facility termination date among other things.and remove financial covenants. We refer to this arrangement as the securitization facilitySecuritization Facility in this report. The current purchase limit under the securitization facilitySecuritization Facility is $500 million. On June 22, 2011, concurrently with the signing of the Credit Agreement, FleetCor Funding LLC entered into a fifth amendment to the fourth amended and restated receivables purchase agreement. The amendment to the Securitization Facility revised certain definitions, removed the compliance certification reporting requirement, and removed financial covenant requirements. The Securitization Facility was amended for a sixth time on September 30, 2011 to permit us to sell receivables to the purchasers and repay purchasers on a non-ratable basis in order to take advantage of the lower cost of capital of certain purchasers. The facility was amended for the seventh time on February 24, 20116, 2012 to add a new purchaser and extend the facility termination date to February 4, 2013. There is now February 23, 2012.a program fee equal to the commercial paper rate of 0.34%, plus 0.90% as of December 31, 2011. The unused facility fee is payable at a rate of 0.50% per annum as of December 31, 2011.
Under a related purchase and sale agreement, dated as of December 20, 2004, and most recently amended on July 7, 2008, between FleetCor Funding LLC, as purchaser, and certain of our subsidiaries, as originators, the receivables generated by the originators are deemed to be sold to FleetCor Funding LLC immediately and without further action upon creation of such receivables. At the request of FleetCor Funding LLC, as seller, undivided percentage ownership interests in the receivables are ratably purchased by the purchasers in amounts not to exceed their respective commitments under the facility. Collections on receivables are required to be made pursuant to a written credit and collection policy and may be reinvested in other receivables, may be held in trust
for the purchasers, or may be distributed. Fees are paid to each purchaser agent for the benefit of the purchasers and liquidity providers in the related purchaser group in accordance with the securitization facilitySecuritization Facility and certain fee letter agreements.
The securitization facilitySecuritization Facility provides for certain termination events, upon the occurrence of which the administrator may declare the facility termination date to have occurred, may exercise certain enforcement rights with respect to the receivables, and may appoint a successor servicer, among other things. Termination events include nonpayment, noncompliance with covenants, default under any indebtedness in excess of $10.0 million, the failure to maintain certain ratiosThere are no financial covenant requirements related to defaults, delinquencies and dilution, change in control, failureour Securitization Facility.
Critical accounting policies and estimates
In applying the accounting policies that we use to prepare our consolidated financial statements, we necessarily make accounting estimates that affect our reported amounts of assets, liabilities, revenue and expenses. Some of these estimates require us to make assumptions about matters that are highly uncertain at the time we make the accounting estimates. We base these assumptions and the resulting estimates on historical information and other factors that we believe to be reasonable under the circumstances, and we evaluate these assumptions and estimates on an ongoing basis. In many instances, however, we reasonably could have used different accounting estimates and, in other instances, changes in our accounting estimates could occur from period to period, with the result in each case being a material change in the financial statement presentation of our financial condition or results of operations. We refer to estimates of this type as critical accounting estimates. Our significant accounting policies are summarized in the consolidated financial statements contained elsewhere in this report. The critical accounting estimates that we discuss below are those that we believe are most important to an understanding of our consolidated financial statements.
Revenue recognition and presentation
Revenue is derived from our merchant and network relationships as well as from customers and partners. We recognize revenue on fees generated through services to commercial fleets, major oil companies and petroleum marketers and record revenue net of the wholesale cost of the underlying products and services based on the following: (i) we are not the primary obligor in the fuel arrangement and we are not responsible for fulfillment and the acceptability of the product; (ii) we have no inventory risk, do not bear the risk of product loss and do not make any changes to the fuelproduct or have any involvement in the product specifications; (iii) we do not have significant latitude with respect to establishing the price for fuelthe product (predominantly fuel) and (iv) the amount we earn for our services is fixed.
Through our merchant and network relationships we primarily provide fuel, vehicle maintenance or lodging services to our customers. We derive revenue from our merchant and network relationships based on the difference between the price charged to a customer for a transaction and the price paid to the merchant or network for the same transaction. Our net revenue consists of margin on fuel sales and fees for technical support, processing, communications and reporting. The price paid to a merchant or network may be calculated as (i) the merchant’s wholesale cost of fuel plus a markup; (ii) the transaction purchase price less a percentage discount; or (iii) the transaction purchase price less a fixed fee per unit. The difference between the price we pay to a merchant and the merchant’s wholesale cost for the underlying products and services is considered a merchant commission and is recognized as an expense when the transaction is executed. We recognize revenue from merchant and network relationships when persuasive evidence of an arrangement exists, the services have been provided to the customer, the sales price is fixed or determinable and collectability is reasonably assured. We have entered into agreements with major oil companies and petroleum marketers, which specify that a transaction is deemed to be
captured when we have validated that the transaction has no errors and have accepted and posted the data to our records. Revenue is recognized on lodging and transportation management services when the lodging stay or transportation service is completed.
We also derive revenue from customers and partners from a variety of program fees including transaction fees, card fees, network fees, report fees and other transaction-based fees which typically are calculated based on measures such as percentage of dollar volume processed, number of transactions processed, or some combination thereof. Such services are provided through proprietary networks or through the use of third-party networks. Transaction fees and other transaction-based fees generated from our proprietary networks and third-party networks are recognized at the time the transaction is captured. Card fees, network fees and program fees are recognized as we fulfill our contractual service obligations. In addition, we recognize revenue from late fees and finance charges. Such fees are recognized net of a provision for estimated uncollectible amounts at the time the fees and finance charges are assessed.
Accounts receivable
As described above under the heading “Securitization facility,Facility,” we maintain a $500 million revolving trade accounts receivable securitization facility.Securitization Facility. Pursuant to the terms of the securitization facility,Securitization Facility, we transfer certain of our domestic receivables, on a revolving basis, to FleetCor Funding LLC, a wholly-owned bankruptcy remote subsidiary. In turn, FleetCor Funding LLC sells, without recourse, on a revolving basis, up to $500 million of undivided ownership interests in this pool of accounts receivable to a multi-seller, asset-backed commercial paper conduit. FleetCor Funding LLC maintains a subordinated interest, in the form of over collateralization, in a portion of the receivables sold to the conduit. Purchases by the conduit are financed with the sale of highly-rated commercial paper. On February 24, 2011,6, 2012, we extended the term of the securitization facilitySecuritization Facility to February 23, 2012.4, 2013.
We utilize proceeds from the sale of our accounts receivable as an alternative to other forms of debt, effectively reducing our overall borrowing costs. We have agreed to continue servicing the sold receivables for the financial institutions at market rates, which approximates our cost of servicing. We retain a residual interest in the accounts receivable sold as a form of credit enhancement. The residual interest’s fair value approximates carrying value due to its short-term nature.
FleetCor Funding LLC determines the level of funding achieved by the sale of trade accounts receivable, subject to a maximum amount. FleetCor Funding LLC retains a residual interest in the eligible receivables, transferred to the trust, such that amounts payable in respect of such residual interest will be distributed to FleetCor Funding LLC upon payment in full of all amounts owed by FleetCor Funding LLC to the financial institutions.
In June 2009, the FASB issued authoritative guidance limiting the circumstances in which a financial asset may be derecognized when the transferor has not transferred the entire financial asset or has continuing involvement with the transferred asset. The concept of a qualifying special-purpose entity, or QSPE, which had previously facilitated sale accounting for certain asset transfers, is removed by this standard. This guidance iswas effective for us as of January 1, 2010. As a result of the adoption of such guidance, effective January 1, 2010, we consolidated our QSPE. Using the carrying amounts of the assets and liabilities of the QSPE as prescribed by ASUAccounting Standards Update (“ASU”) No. 2009-17 and any corresponding elimination of activity between the QSPE and us resulting from the consolidation on January 1, 2010, we recorded a $218 million increase in total assets, a $218 million increase in total liabilities and non-cash financing activities of $218 million.
Beginning January 1, 2010, our consolidated balance sheet and consolidated statement of income no longer reflect activity related to our retained economic interests, but instead reflect activity related to our securitized accounts receivable and the corresponding securitized debt, including interest income,expense, fees generated from late payments, provision for losses on accounts receivable, and interest expense. Interest expense and provisions for losses on accounts receivable associated with the securitized accounts receivable are no longer included as a deductionreduction from revenues, net in the consolidated statement of income. The cash flows from borrowings and repayments, associated with the
securitized debt, are now presented as cash flows from financing activities. Our consolidated statement of income for the year ended December 31, 2009 has not been retrospectively adjusted to reflect the adoption of ASU Nos. 2009-16 and 2009-17. Therefore, current period results and balances will not be comparable to prior period amounts, particularly with regard to accounts receivable, securitization facility,the Securitization Facility, provision for losses on accounts receivable, interest expense and revenues, net.
Credit risk and reserve for losses on receivables
We control credit risk by performing periodic credit evaluations of our customers. Payments from customers are generally due within 3014 days of billing. We routinely review our accounts receivable balances and make provisions for probable doubtful accounts based primarily on the aging of those balances. Accounts receivable are deemed uncollectible and removed from accounts receivable and the allowance for doubtful accounts when internal collection efforts have been exhausted and accounts have been turned over to a third-party collection agency.
Impairment of long-lived assets and intangibles
We test our other long-lived assets for impairment in accordance with relevant authoritative guidance. We evaluate whether impairment indicators related to our property, plant and equipment and other long-lived assets are present. These impairment indicators may include a significant decrease in the market price of a long-lived asset or asset group, a significant adverse change in the extent or manner in which a long-lived asset or asset group is being used or in its physical condition, or a current-period operating or cash flow loss combined with a history of operating or cash flow losses or a forecast that demonstrates continuing losses associated with the use of a long-lived asset or asset group. If impairment indicators are present, we estimate the future cash flows for the asset or group of assets. The sum of the undiscounted future cash flows attributable to the asset or group of assets is compared to their carrying amount. The cash flows are estimated utilizing various projections of revenuerevenues and expenses, working capital and proceeds from asset disposals on a basis consistent with the strategic plan. If the carrying amount exceeds the sum of the undiscounted future cash flows, we determine the assets’ fair value by discounting the future cash flows using a discount rate required for a similar investment of like risk and we recordrecords an impairment charge as the difference between the fair value and the carrying value of the asset group. Generally, we perform our testing of the asset group at the business-line level, as this is the lowest level for which identifiable cash flows are available.
We evaluatecompleted our most recent annual goodwill and indefinite-life intangible asset impairment test as of October 1, 2011. Goodwill is tested for impairment annually in the fourth quarter at the reporting unit level, which is one leveland the impairment test consists of two steps, as well as a qualitative assessment, as appropriate. We early adopted the provisions of ASU 2011-08, as discussed below the operating segment level. We also test for impairment if eventsin “Adoption of New Accounting Standards”, and circumstances indicate that it is more likely than not thatperformed a qualitative assessment of certain of our reporting units before calculating the fair value of athe reporting units in step 1 of the goodwill impairment test. In this qualitative assessment we individually considered the following items for each reporting unit where we determined a qualitative analysis to be appropriate: the macroeconomic conditions, including any deterioration of general conditions, limitations on accessing capital, fluctuations in foreign exchange rates and other developments in equity and credit markets; industry and market conditions, including any deterioration in the environment where the reporting unit operates, increased competition, changes in the products/services and regulator and political developments; cost of doing business; overall financial performance, including any declining cash flows and performance in relation to planned revenues and earnings in past periods; other relevant reporting unit specific facts, such as changes in management or key personnel or pending litigation; events affecting the reporting unit, including changes in the carrying value of net assets, likelihood of disposal and whether there were any other impairment considerations within the business; the overall performance of our share price in relation to the market and our peers; and a quantitative stress test of the previously completed step 1 test from the prior year, updated with current year results and future projections.
We completed step 1 of the goodwill impairment testing for certain of our reporting units. In this first step the reporting unit’s carrying amount, including goodwill is belowcompared to its carrying amount.fair value which is measured based upon, among other factors, a discounted cash flow analysis as well as market multiples for comparable companies. If the carrying amount of the reporting unit is greater than theits fair value, goodwill is considered impaired and step two must be performed. Step two measures the impairment may be present. Our approach to estimatingloss by comparing the implied fair value of reporting unit goodwill with the carrying amount of that goodwill. The implied fair value of goodwill is determined by allocating the fair value of the equityreporting unit to all the assets and liabilities of that unit (including unrecognized intangibles) as if the reporting units is based on the income approach.unit had been acquired in a business combination. The income approach involves a discounted cash flow analysis for eachexcess of the reporting units. Estimates critical to our fair value estimates includeover the discount rate, projected average revenue growth and financial performance ofamounts allocated to the reporting unit. The discount rate is based on guideline companies that operate in the same industry as the reporting units and face similar risks in the market.
We measure the amount of any goodwill impairment based upon the estimated fair value of the underlying assets and liabilities of the reporting unit including any unrecognized intangible assets, and estimateis the implied fair value of goodwill. An impairment charge is recognized toThe excess of the extent the recorded goodwill exceedscarrying amount over the implied fair value is the impairment loss.
We estimate the fair value of goodwill.our reporting units using a combination of the income approach and the market approach. The income approach utilizes a discounted cash flow model incorporating management’s expectations for future revenue, operating expenses, EBITDA, capital expenditures and an anticipated tax rate. We discount the related cash flow forecasts using our estimated weighted-average cost of capital for each reporting unit at the date of valuation. The market approach utilizes comparative market multiples in the valuation estimate. Multiples
are derived by relating the value of guideline companies, based on either the market price of publicly traded shares or the prices of companies being acquired in the marketplace, to various measures of their earnings and cash flow. Such multiples are then applied to the historical and projected earnings and cash flow of the reporting unit in developing the valuation estimate.
Preparation of forecasts and the selection of the discount rates involve significant judgments about expected future business performance and general market conditions. Significant changes in our forecasts, the discount rates selected or the weighting of the income and market approach could affect the estimated fair value of one or more of our reporting units and could result in a goodwill impairment charge in a future period.
At December 31, 2011 we had goodwill of $823.5 million recorded on our consolidated balance sheet. We completed our most recent annual goodwill asset impairment test on October 1, 2011 and determined that the fair value of each of our reporting units is in excess of the carrying value. No events or changes in circumstances have occurred since the date of our most recent annual impairment test that would more likely than not reduce the fair value of a reporting unit below its carrying amount.
We also evaluate indefinite-lived intangible assets (primarily trademarks and trade names) for impairment annually. We also test for impairment if events and circumstances indicate that it is more likely than not that the fair value of an indefinite-lived intangible asset is below its carrying amount. Estimates critical to our evaluation of indefinite-lived intangible assets for impairment include the discount rate, royalty rates used in our evaluation
of trade names, projected average revenue growth and projected long-term growth rates in the determination of terminal values. An impairment charge is recorded if the carrying amount of an indefinite-lived intangible asset exceeds the estimated fair value on the measurement date.
Income taxes
We account for income taxes in accordance with relevant authoritative literature. Income taxes are accounted for under the asset and liability method. Deferred tax assets and liabilities are recognized for the future tax consequences attributable to differences between the financial statement carrying amounts of existing assets and liabilities and their respective tax bases. Deferred tax assets and liabilities are measured using enacted tax rates expected to apply to taxable income in the years in which those temporary differences are expected to be recovered or settled. The effect on deferred tax assets and liabilities of a change in tax rates is recognized in the period that includes the enactment date. The realizability of deferred tax assets mustis also be assessed.
The ultimate realization of deferred tax assets is dependent upon the generation of future taxable income during the periods in which the associated temporary differences became deductible. A valuation allowance must be established for deferred tax assets that are not believed to more likely than not be realized in the future. We include any estimated interest and penalties on tax-related matters in income taxes payable and income tax expense.
We do not provide deferred taxes for the undistributed earnings of our foreign subsidiaries that are considered to be indefinitely reinvested outside of the United States in accordance with relevant authoritative literature. If in the future these earnings are repatriated to the United States, or if we determine that the earnings will be remitted in the foreseeable future, additional tax provisions may be required.
We apply the relevant authoritative literature with respect to uncertainty in income taxes. This guidance clarifies the accounting for uncertainty in income taxes recognized in an entity’s financial statements and prescribes threshold and measurement attributes for financial statement disclosure of tax positions taken or expected to be taken on a tax return. Under the relevant authoritative literature, the impact of an uncertain income tax position on the income tax return must be recognized at the largest amount that is more likely than not to be sustained upon audit by the relevant taxing authority. An uncertain income tax position will not be recognized if it has less than a 50% likelihood of being sustained.
Business combinations
We have accounted for business combinations under the purchaseacquisition method of accounting. The costacquisition method requires that the acquired assets and liabilities including contingencies, be recorded at fair value determined on the acquisition date and changes thereafter reflected in income. For significant acquisitions, we obtain independent third party valuation studies for certain of each acquired business is allocated to the assets acquired and liabilities assumed based on their estimatedto assist in determining fair values. value. Goodwill represents the excess of the purchase price over the fair value of the tangible and intangible assets acquired and any liabilities assumed. The estimation of the fair values of the assets acquired and liabilities assumed involves a number of estimates and assumptions that could differ materially from the actual amounts recorded. The results of the acquired businesses are included in our results from operations beginning from the day of acquisition.
These estimates are revised during an allocation period as necessary when, and if, information becomes available to further define and quantify the value of the assets acquired and liabilities assumed. The allocation period does not exceed one year from the date of the acquisition. To the extent additional information to refine the original allocation becomes available during the allocation period, the allocation of the purchase price is adjusted. Should information become available after the allocation period, those items are included in operating results. The direct costs of the acquisition are recorded as operating expenses in 2009. Prior to 2009, the costs of an enterprise acquired in a business combination included the direct costexpenses. Some of the acquisition. A portion of our 2008 and earlier acquisitions include additional contingent consideration related to future earnouts based on the growth of the market. When the contingencies are resolved and additional consideration is distributable, we will record the consideration issued as additional cost of the acquired company, or goodwill. The operating results of entities acquired are included in our consolidated statements of operation from the completion date of the applicable transaction. Goodwill represents the excess of the purchase price over the fair value of the tangible and intangible assets acquired and any liabilities assumed.
Stock-based compensation
We account for employee stock options and restricted stock in accordance with relevant authoritative literature, which requires companiesliterature. Stock options are granted with an exercise price estimated to recognize compensation cost for stock options and other stock-based awards basedbe equal to the fair market value on the estimated fair valuedate of grant as measured on the grant date.authorized by our board of directors. Options granted have vesting provisions ranging from one to six years. Stock option grants are generally subject to forfeiture if employment terminates prior to vesting. We have selected the Black-Scholes option pricing model for estimating the grantgrand date fair value of share-based payments.stock option awards granted. There are assumptions within the Black-Scholes option pricing model. We have considered the retirement and forfeiture provisions of the options and utilized our historical experience to estimate the expected life of the options. We base the risk-free interest rate is based on the yield of a zero coupon U.S. Treasury security with a maturity equal to the expected life of the option from the date of the grant. We estimate the volatility of the share price of our common stock by considering the historical volatility of the stock of similar public entities. In determining the appropriateness of the public entities included in the volatility assumption, we consider a number of factors, including the entity’s life cycle stage, size, financial leverage, and products offered. Stock-based compensation cost is measured at the grant date based on the value of the award and is recognized as expense over the requisite service period based on the number of awards for which the requisite service is expected to be rendered.
Awards of restricted stock and restricted stock units are independent of stock option grants and are generally subject to forfeiture if employment terminates prior to vesting. Prior to our initial public offering, the vesting of the shares granted in 2010 were contingent on the sale of our company or a public offering of our common stock, subject to certain other conditions. The vesting of the shares granted in 2011and 2010 are generally based on the passage of time, performance or market conditions. Shares vesting based on the passage of time have vesting provisions ranging from one to six years. The fair value of restricted stock shares based on performance is based on the grant date fair value of our stock. The fair value of restricted stock shares based on market conditions is estimated using the Monte Carlo option pricing model. The risk-free interest rate and volatility assumptions used within the Monte Carlo option pricing model are calculated consistently with those applied in the Black-Scholes options pricing model utilized in determining the fair value of the stock option awards. For performance-based restricted stock awards, we must also make assumptions regarding the likelihood of achieving performance goals. If actual results differ significantly from these estimates, stock-based compensation expense and our results of operations could be materially affected.
In
Prior to our initial public offering, the grant date fair value was not readily available. Thus, in connection with making our fair value estimates related to our stock option and restricted stock grants prior to our initial public offering, we considered various factors including third-party equity transactions and certain commonly used valuation techniques. We sold convertible preferred stock to third parties in 2005, 2006 and 2009. In addition, in 2007 we repurchased common stock and preferred stock from the holders at a negotiated price, which we believe represented fair value. These third-party transactions served as a basis for determining the fair value of our common stock at various dates. In situations where we sold preferred stock that included conversion and dividend features, we considered such features in those instruments and the fact that such instruments could not be freely traded in determining a fair value for our common stock. Generally, we concluded that the fair value of our common stock was 10% to 25% less than the preferred stock at the date of such third-party transactions due to the features attributable to the preferred stock. In periods prior to third-party transactions, and in intervening periods subsequent to the third-party transactions, we utilized various earnings and revenue multiples to estimate the fair value of our common stock or to serve as an additional factor in determining fair value. Finally, we used information we obtained related to our acquisitions and the related determination of purchase prices for these acquisitions (which were generally based on earnings multiples) as additional data to help determine the fair value of our equity instruments.
We have continued to enhance our value through acquisitions and organic growth. Our third-party investors made their investments with the expectation that some form of liquidity event would occur in the future at values higher than their initial investments. We have continued to evaluate and adjust the estimated fair value of our common stock based on our acquisition strategy, organic growth, changes in management and other environmental factors. From June 2006 to December 2009, the estimated fair value of our common stock (as adjusted for the two and one half for one stock split effected November 30, 2010t)2010), as determined based on the factors noted above, increased from $6.55 per share to $18 per share and from April 2009 to December 2009, the fair value of our common stock increased from $10 per share to $18 per share. The factors we considered in connection with estimating the fair value of our common stock for the period from April 2009 through December 2009 were the consummation of our acquisitions of CLC Group, Inc. and ReD Fuel Cards (Europe) Limited in April 2009 and August 2009, respectively. These acquisitions—coupled with modest organic growth—contributed to increasing revenues and profitability measures during this period. Additionally, in December 2009, we began to consider certain strategic alternatives, including a liquidity event, which resulted in us having further discussions with third parties regarding our enterprise value. Based on these factors we estimated the fair value of our common stock had increased significantly during the period from April 2009 through December 2009. The CompanyWe completed itsour initial public offering at December 15, 2010 at a price of $23 per share.
Recent accounting pronouncementsAdoption of New Accounting Standards
Off balance sheet arrangements
Prior to 2010, we utilized an off-balance sheet arrangement in the ordinary course of business to finance a portion of our accounts receivable. Our off-balance sheet activity utilizes a qualified special-purpose entity, or QSPE, in the form of a limited liability company. The QSPE raises funds by issuing debt to third-party investors. The QSPE holds trade accounts receivable whose cash flows are the primary source of repayment for the
liabilities of the QSPE. Investors only have recourse to the assets held by the QSPE. Our involvement in these arrangements takes the form of originating accounts receivable and providing servicing activities.
In June 2009, the FASB issued authoritative guidance limiting the circumstances in which a financial asset may be derecognized when the transferor has not transferred the entire financial asset or has continuing involvement with the transferred asset. The concept of a qualified special-purpose entity, which had previously facilitated sale accounting for certain asset transfers, is removed by this standard. This guidance was effective for us as of January 1, 2010. As a result of the adoption of such guidance, effective January 1, 2010, we consolidated the QSPE and the securitization of accounts receivable related to the QSPE is accounted for as a secured borrowing rather than as a sale. Accordingly, we recorded accounts receivable and short-term debt related to the securitization facilitySecuritization Facility as assets
and liabilities on our balance sheet. In addition, subsequent to the adoption, our statements of income no longer include securitization activities in revenue. Rather, we report athe provision for bad debts and interest expense associated with the debt securities issued by the QSPE.QSPE in processing expense and interest expense, net, respectively, on the Consolidated Statements of Income.
Fair Value Measurements and Disclosures
In January 2010, the FASB issued ASU 2010-06, “Improving Disclosures About Fair Value Measurements,” which amends Accounting Standards Codification (“ASC”) 820, “Fair Value Measurements and Disclosures,” to add new requirements for disclosures about transfers into and out of Levels 1 and 2 of the fair value hierarchy and separate disclosures about purchases, sales, issuances, and settlements relating to Level 3 measurements within the fair value hierarchy. This ASU also clarifies existing fair value disclosures about the level of disaggregation and about inputs and valuation techniques used to measure fair value. This ASU was effective for us beginning January 1, 2010, except for the requirements to provide the Level 3 activity of purchases, sales, issuance, and settlements, if any, which were effective for us beginning January 1, 2011. Since ASU 2010-06 is a disclosure-only standard, its adoption had no impact on our results of operations, financial condition, or cash flows.
Multiple Revenue Arrangements
In October 2009, the FASB issued ASU 2009-13, “Multiple Revenue Arrangements—a Consensus of the FASB Emerging Issues Task Force” which supersedes certain guidance in ASC 605-25, “Revenue Recognition-Multiple Element Arrangements,” and requires an entity to allocate arrangement consideration to all of its deliverables at the inception of an arrangement based on their relative selling prices (i.e., the relative-selling-price method). The use of the residual method of allocation will no longer be permitted in circumstances in which an entity recognized revenue for an arrangement with multiple deliverables subject to ASC 605-25. ASU 2009-13 also requires additional disclosures. We adopted the provisions of ASU 2009-13 beginning on January 1, 2011. Based on our current revenue arrangements, the adoption of ASU 2009-13 did not have a material impact on our financial condition, results of operations, or cash flows.
Stock Based Compensation
In April 2010, the FASB issued ASU 2010-13, “Compensation-Stock Compensation (Topic 718)—Effect of Denominating the Exercise Price of a Share-Based Payment Award in the Currency of the Market in Which the Underlying Equity Security Trades—a Consensus of the FASB Emerging Issues Task Force.” ASU 2010-13 addresses whether an entity should classify a share-based payment award as equity or a liability if the award’s exercise price is denominated in the currency in which the underlying security trades and that currency is different from the (1) entity’s functional currency, (2) functional currency of the foreign operation for which the employee provides services, and (3) payroll currency of the employee. Under the existing guidance in ASC 718-10, “Compensation-Stock Compensation,” we do not classify any of our stock-based compensation as liabilities. ASU 2010-13 was effective for the Company beginning on January 1, 2011.The adoption of ASU 2010-13 does not change our current accounting for its stock-based compensation awards as ASU 2010-13’s application contains an exception for share-based payments that, like our’s, use exercise prices denominated in the currency of the market in which substantial portions of the entity’s equity securities trade.
Business Combination Pro Forma Information
In December 2010, the FASB issued ASU 2010-29, “Business Combinations (ASC Topic 805): Disclosure of Supplementary Pro Forma Information for Business Combinations.” The amendments in this ASU affect any public entity as defined by ASC Topic 805 that enters into business combinations that are material on an individual or aggregate basis. The amendments in this ASU specify that if a public entity presents comparative financial statements, the entity should disclose revenue and earnings of the combined entity as though the business combination(s) that occurred during the current year had occurred as of the beginning of the comparable
prior annual reporting period only. The amendments also expand the supplemental pro forma disclosures to include a description of the nature and amount of material, nonrecurring pro forma adjustments directly attributable to the business combination included in the reported pro forma revenue and earnings. The amendments are effective prospectively for business combinations for which the acquisition date is on or after the beginning of the first annual reporting period beginning on or after December 15, 2010. Early adoption is permitted. The adoption of ASU 2010-29 did not have a material impact on our results of operations or financial condition.
Goodwill Impairment Testing
In September 2011, the FASB issued ASU 2011-08, which gives entities testing goodwill for impairment the option of performing a qualitative assessment before calculating the fair value of a reporting unit in step 1 of the goodwill impairment test. If entities determine, on the basis of qualitative factors, that the fair value of the reporting unit is more likely than not less than the carrying amount, the two-step impairment testing would be required. Otherwise, further testing would not be needed. This ASU is effective for all entities for annual and interim goodwill impairment testing performed for fiscal years beginning after December 15, 2011, with early adoption permitted. We early adopted this guidance effective October 1, 2011, for certain reporting units, for purposes of our 2011 annual goodwill impairment testing. The adoption of this standard did not have an impact on the Company’s financial condition, results of operations of cash flows.
Comprehensive Income Presentation
In September 2011, the FASB issued ASU 2011-05, which revises the manner in which entities present comprehensive income in their financial statements. The new guidance removes the presentation options in ASC 220 and requires entities to report components of comprehensive income in either (1) a continuous statement of comprehensive income or (2) two separate but consecutive statements. The ASU does not change the items that must be reported in other comprehensive income or when an item of other comprehensive income must be reclassified to net income. Also the earnings per share computations will not change and will continue to be based on net income. This ASU is effective for fiscal years, and interim periods within those years, beginning after December 15, 2011. We adopted the ASU on December 31, 2011, using two separate statements of income and comprehensive income.
Goodwill with Zero or Negative Carrying Amounts
In December 2010, the FASB issued ASU 2010-28, which modifies Step 1 of the goodwill impairment test for reporting units with zero or negative carrying amounts. For those reporting units, an entity is required to perform Step 2 of the goodwill impairment test if it is more likely than not that a goodwill impairment exists. In determining whether it is more likely than not that a goodwill impairment exists, an entity should consider whether there are any adverse qualitative factors indicating that an impairment may exist. The qualitative factors are consistent with existing guidance which requires that goodwill of a reporting unit be tested for impairment between annual tests if an event occurs or circumstances change that would more likely than not reduce the fair value of a reporting unit below its carrying amount. The adoption of this standard did not have an impact on our financial position or results of operations because none of our reporting units have zero or negative carrying amounts.
Pending Adoption of Recently Issued Accounting Standards
From time to time, new accounting pronouncements are issued by the FASB or other standards setting bodies that are adopted by us as of the specified effective date. Unless otherwise discussed, our management believes that the impact of recently issued standards that are not yet effective will not have a material impact on our consolidated financial statements upon adoption.
Fair Value Measurement and Disclosure Requirements
In May 2011, the FASB issued ASU 2011-04, “Amendments to Achieve Common Fair Value Measurement and Disclosure Requirements in U.S. GAAP and IFRS,” which amends ASC 820, “Fair Value Measurement” to improve the comparability of fair value measurements presented and disclosed in financial statements prepared in accordance with U.S. generally accepted accounting principles (“GAAP”) and International Financial Reporting Standards. The amendments in this update explain how to measure fair value. They do not require additional fair value measurements and are not intended to establish valuation standards or affect valuation practices outside of financial reporting. The amendments are effective for us beginning January 1, 2012 and are required to be applied prospectively, with early adoption not permitted. Since ASU 2011-04 is a disclosure-only standard, its adoption will not affect our results of operations, financial condition, or cash flows.
Contractual obligations
The table below summarizes the estimated dollar amounts of payments under contractual obligations identified below as of December 31, 20102011 for the periods specified:
| Payments due by period(a) | Payments due by period(a) | |||||||||||||||||||||||||||||||||||||||
(in millions) | Total | Less than 1 year | 1-3 years | 3-5 years | More than 5 years | Total | Less than 1 year | 1-3 years | 3-5 years | More than 5 years | ||||||||||||||||||||||||||||||
Operating leases | $ | 11.3 | $ | 4.6 | $ | 5.6 | $ | 0.9 | $ | 0.2 | $ | 26.6 | $ | 6.1 | $ | 9.1 | $ | 4.5 | $ | 6.9 | ||||||||||||||||||||
2005 Credit Facility | 270.4 | 3.0 | 267.4 | — | — | |||||||||||||||||||||||||||||||||||
CCS Credit Facility | 52.8 | 6.8 | 13.6 | 32.4 | — | |||||||||||||||||||||||||||||||||||
Credit Facility | 417.5 | 140.0 | 52.5 | 225.0 | — | |||||||||||||||||||||||||||||||||||
Seller financing notes | 1.6 | 1.6 | — | — | — | 1.3 | 0.4 | 0.4 | 0.2 | 0.3 | ||||||||||||||||||||||||||||||
Securitization facility(b) | 144.0 | — | 144.0 | — | — | |||||||||||||||||||||||||||||||||||
Securitization facility | 280.0 | 280.0 | — | — | — | |||||||||||||||||||||||||||||||||||
|
|
|
|
| ||||||||||||||||||||||||||||||||||||
Total | $ | 480.1 | $ | 16.0 | $ | 430.6 | $ | 33.3 | $ | 0.2 | $ | 725.4 | $ | 426.5 | $ | 62.0 | $ | 229.7 | $ | 7.2 | ||||||||||||||||||||
|
|
|
|
| ||||||||||||||||||||||||||||||||||||
| (a) | Deferred income tax liabilities as of December 31, |
Management’s Use of Non-GAAP Financial Measures
Any analysis of non-GAAP financial measures should be used only in conjunction with results presented in accordance with GAAP. We have included in the discussion under the caption “Accounts receivable securitization” above a financial measure that was not prepared in accordance with GAAP. Within this caption, we define the non-GAAP financial measure, provide a reconciliation of the non-GAAP financial measure to the most directly comparable financial measure calculated in accordance with GAAP, and discuss the reasons that we believe this information is useful to management and may be useful to investors.
We have included in the discussion under the caption “Transaction volume and revenue per transaction” above a financial measure that was not prepared in accordance with GAAP. Below, we define the non-GAAP financial measure, provide a reconciliation of the non-GAAP financial measure to the most directly comparable financial measure calculated in accordance with GAAP, and discuss the reasons that we believe this information is useful to management and may be useful to investors.
Revenues, net, excluding the impact of a non-renewed partner contract
We have defined the non-GAAP measure revenues, net, excluding the impact of a non-renewed contract, as revenues, net as reflected in our income statement and segment footnote less the revenues, net provided by the non-renewed partner in the years ended December 31, 2011, 2010 and 2009, as applicable.
Our management uses revenues, net, excluding the impact of a non-renewed contract, along with other factors, to evaluate our financial performance. We believe that revenues, net, excluding the impact of a non-renewed contract is an appropriate supplemental measure of financial performance and may be useful to investors because it provides a more complete understanding of our revenue performance of continuing business. Revenues, net, excluding the impact of a non-renewed contract is not intended to be a substitute for GAAP financial measures and should not be used as such.
Set forth below is a reconciliation of revenues, net, excluding the impact of a non-renewed contract to the most directly comparable GAAP measure, Revenues, net (in thousands) for the years ended December 31, 2011, 2010 and 2009:
| Year Ended December 31, | ||||||||||||
| 2011 | 2010 | 2009 | ||||||||||
North America | ||||||||||||
Revenues, net | $ | 348,784 | 287,794 | $ | 227,373 | |||||||
Excluding non-renewed contract revenues | — | — | — | |||||||||
|
|
|
|
|
| |||||||
Revenues, net, excluding the impact of a non-renewed contract | $ | 348,784 | $ | 287,794 | $ | 227,373 | ||||||
|
|
|
|
|
| |||||||
International | ||||||||||||
Revenues, net | $ | 170,807 | $ | 146,047 | $ | 126,700 | ||||||
Excluding non-renewed contract revenues | — | (841 | ) | (1,264 | ) | |||||||
|
|
|
|
|
| |||||||
Revenues, net, excluding the impact of a non-renewed contract | $ | 170,807 | $ | 145,206 | $ | 125,436 | ||||||
|
|
|
|
|
| |||||||
Consolidated | ||||||||||||
Revenues, net | $ | 519,591 | $ | 433,841 | $ | 354,073 | ||||||
Excluding non-renewed contract revenues | — | (841 | ) | (1,264 | ) | |||||||
|
|
|
|
|
| |||||||
Revenues, net, excluding the impact of a non-renewed contract | $ | 519,591 | $ | 433,000 | $ | 352,809 | ||||||
|
|
|
|
|
| |||||||
ITEM 7A. QUANTATIVE AND QUALITATIVE DISCLOSURES ABOUT MARKET RISK
Foreign currency risk
Our International segment exposes us to foreign currency exchange rate changes that can impact translations of foreign-denominated assets and liabilities into U.S. dollars and future earnings and cash flows from transactions denominated in different currencies. Revenue from our International segment was 33.7%32.9%, 35.8%33.7% and 39.8%35.8% of total revenue for the years ended December 31, 2011, 2010 2009, and 2008,2009, respectively. We measure foreign currency exchange risk based on changes in foreign currency exchange rates using a sensitivity analysis. The sensitivity analysis measures the potential change in earnings based on a hypothetical 10% change in currency exchange rates. Exchange rates and currency positions as of December 31, 20102011 were used to perform the sensitivity analysis. Such analysis indicated that a hypothetical 10% change in foreign currency exchange rates would have increased or decreased consolidated pretax income during the year ended December 31, 20102011 by approximately $6.8$7.3 million had the U.S. dollar exchange rate increased or decreased relative to the currencies to which we had exposure. When exchange rates and currency positions as of December 31, 20092010 and 20082009 were used to perform this sensitivity analysis, the analysis indicated that a hypothetical 10% change in currency exchange rates would have increased or decreased consolidated pretax income for the years ended December 31, 20092010 and 20082009 by approximately $5.4$6.8 million and $7.7$5.4 million, respectively.
Interest rate risk
We are exposed to changes in interest rates on our cash investments and debt. We invest our excess cash either to pay down our securitization facilitySecuritization Facility debt or in securities that we believe are highly liquid and marketable in the short term. These investments are not held for trading or other speculative purposes. Under our new Credit Facility, we have a syndicated $300 million term loan agreement with a syndicate of term loan B investors in the United States, as well as a $600 million revolving credit facility. Interest on amounts outstanding under the Credit Agreement bear interest, at our election, at the British Bankers Association LIBOR Rate (the Eurocurrency Rate), plus a margin based on a leverage ratio, or at our option, the Base Rate (defined as the rate equal to the highest of (a) the Federal Funds Rate plus 0.50%, (b) the prime rate announced by Bank of America, N.A., or (c) the Eurocurrency Rate plus 1.00%) plus a margin based on a leverage ratio.
Prior to entering into our new Credit Facility, we had borrowings outstanding under the 2005 Credit Facility and the CCS Credit Facility. On June 22, 2011, proceeds from our new Credit Facility were used to retire our existing indebtedness under the 2005 Credit Facility and the CCS Credit Facility.
Under the 2005 Credit Facility, we havehad a syndicated $300.0 million term loan agreement with a syndicate of term loan B investors in the United States. The term loan bearsbore interest, at our election, at the prime rate or LIBOR plus a margin based on our leverage position. As of December 31, 2010, the interest rate on the term loan was LIBOR plus 2.25%. The term loan expires in April 2013.
Under the 2005 Credit Facility, we also havehad a $50 million unsecured revolving credit facility with a syndicate of banks based in the United States and Europe. The facility expires in April 2012, and borrowings bearBorrowings bore a variable interest rate based at the prime rate or LIBOR plus a margin that variesvaried according to our leverage position. As of December 31, 2010, there were no borrowings on this facility.
In addition, we havehad an $83.8$84.3 million term loan under our CCS Credit Facility. This term loan bearsbore interest on a base rate, PRIBOR, plus a margin and mandatory cost.
Based on the amounts and mix of our fixed and floating rate debt (exclusive of our asset securitization facility)Securitization Facility) at December 31, 20102011 and December 31, 2009,2010, if market interest rates had increased or decreased an average of 100 basis points, after considering the effect of our interest rate swap that expired in 2010, our interest expense would have changed by $1.9$1.3 million and $1.7$1.9 million, respectively. We determined these amounts by considering the impact of the hypothetical interest rates on our borrowing costs and interest rate swap agreement. These analyses do not consider the effects of changes in the level of overall economic activity that could exist in such an environment.
Fuel price risk
Our fleet customers use our products and services primarily in connection with the purchase of fuel. Accordingly, our revenue is affected by fuel prices, which are subject to significant volatility. A decline in retail fuel prices could cause a change in our revenue from several sources, including fees paid to us based on a percentage of each customer’s total purchase. Changes in the absolute price of fuel may also impact unpaid account balances and the late fees and charges based on these amounts. The impact of changes in fuel price is somewhat mitigated by our agreements with certain merchants, where the price paid to the merchant is equal to the lesser of the merchant’s
cost plus a markup or a percentage of the transaction purchase price. We do not enter into any fuel price derivative instruments.
Fuel-price spread risk
From our merchant and network relationships, we derive revenue from the difference between the price charged to a fleet customer for a transaction and the price paid to the merchant or network for the same transaction. The price paid to a merchant or network is calculated as the merchant’s wholesale cost of fuel plus a markup. The merchant’s wholesale cost of fuel is dependent on several factors including, among others, the factors described above affecting fuel prices. The fuel price that we charge to our customer is dependent on several factors including, among others, the fuel price paid to the fuel merchant, posted retail fuel prices and competitive fuel prices. We experience fuel-price spread contraction when the merchant’s wholesale cost of fuel increases at a faster rate than the fuel price we charge to our customers, or the fuel price we charge to our customers decreases at a faster rate than the merchant’s wholesale cost of fuel. Accordingly, if fuel-price spreads contract, we may generate less revenue, which could adversely affect our operating results. The impact of volatility in fuel spreads is somewhat mitigated by our agreements with certain merchants, where the price paid to the merchant is equal to the lesser of the merchant’s cost plus a markup or a percentage of the transaction purchase price.
ITEM 8. FINANCIAL STATEMENTS AND SUPPLEMENTARY DATA
INDEX TO CONSOLIDATED FINANCIAL STATEMENTS
Report of Independent Registered Public Accounting Firm
The Board of Directors and Stockholders of FleetCor Technologies, Inc. and Subsidiaries
We have audited the accompanying consolidated balance sheets of FleetCor Technologies, Inc. and subsidiaries as of December 31, 20102011 and 2009,2010, and the related consolidated statements of income, stockholders’ equity and comprehensive income (loss), and cash flows for each of the three years in the period ended December 31, 2010.2011. These financial statements are the responsibility of the Company’s management. Our responsibility is to express an opinion on these financial statements based on our audits.
We conducted our audits in accordance with the standards of the Public Company Accounting Oversight Board (United States). Those standards require that we plan and perform the audit to obtain reasonable assurance about whether the consolidated financial statements are free of material misstatement. We were not engaged to perform an audit of the Company’s internal control over financial reporting. Our audits included consideration of internal control over financial reporting as a basis for designing audit procedures that are appropriate in the circumstances, but not for the purpose of expressing an opinion on the effectiveness of the Company’s internal control over financial reporting. Accordingly, we express no such opinion. An audit also includes examining, on a test basis, evidence supporting the amounts and disclosures in the financial statements,statements. An audit also includes assessing the accounting principles used and significant estimates made by management, andas well as evaluating the overall financial statement presentation. We believe that our audits provide a reasonable basis for our opinion.
In our opinion, the financial statements referred to above present fairly, in all material respects, the consolidated financial position of FleetCor Technologies, Inc. and subsidiaries at December 31, 20102011 and 2009,2010, and the consolidated results of their operations and their cash flows for each of the three years in the period ended December 31, 2010,2011, in conformity with U.S. generally accepted accounting principles.
We also have audited, in accordance with the standards of the Public Company Accounting Oversight Board (United States), FleetCor Technologies, Inc.’s internal control over financial reporting as of December 31, 2011, based on criteria established in Internal Control-Integrated Framework issued by the Committee of Sponsoring Organizations of the Treadway Commission and our report dated February 28, 2012 expressed an unqualified opinion thereon.
As discussed in Note 2 to the consolidated financial statements, on January 1, 2010 the Company adopted the authoritative accounting guidance related toTransfers and Servicing andConsolidation.
/s/ Ernst & Young LLP
Atlanta, Georgia
March 25, 2011February 29, 2012
Report of Independent Registered Public Accounting Firm
The Board of Direct ors and Stockholders of FleetCor Technologies, Inc. and Subsidiaries
We have audited FleetCor Technologies, Inc. and subsidiaries’ internal control over financial reporting as of December 31, 2011, based on criteria established in Internal Control—Integrated Framework issued by the Committee of Sponsoring Organizations of the Treadway Commission (the COSO criteria). FleetCor Technologies, Inc. and subsidiaries’ management is responsible for maintaining effective internal control over financial reporting, and for its assessment of the effectiveness of internal control over financial reporting included in the accompanying Management’s Report on Internal Control Over Financial Reporting. Our responsibility is to express an opinion on the company’s internal control over financial reporting based on our audit.
We conducted our audit in accordance with the standards of the Public Company Accounting Oversight Board (United States). Those standards require that we plan and perform the audit to obtain reasonable assurance about whether effective internal control over financial reporting was maintained in all material respects. Our audit included obtaining an understanding of internal control over financial reporting, assessing the risk that a material weakness exists, testing and evaluating the design and operating effectiveness of internal control based on the assessed risk, and performing such other procedures as we considered necessary in the circumstances. We believe that our audit provides a reasonable basis for our opinion.
A company’s internal control over financial reporting is a process designed to provide reasonable assurance regarding the reliability of financial reporting and the preparation of financial statements for external purposes in accordance with generally accepted accounting principles. A company’s internal control over financial reporting includes those policies and procedures that (1) pertain to the maintenance of records that, in reasonable detail, accurately and fairly reflect the transactions and dispositions of the assets of the company; (2) provide reasonable assurance that transactions are recorded as necessary to permit preparation of financial statements in accordance with generally accepted accounting principles, and that receipts and expenditures of the company are being made only in accordance with authorizations of management and directors of the company; and (3) provide reasonable assurance regarding prevention or timely detection of unauthorized acquisition, use or disposition of the company’s assets that could have a material effect on the financial statements.
Because of its inherent limitations, internal control over financial reporting may not prevent or detect misstatements. Also, projections of any evaluation of effectiveness to future periods are subject to the risk that controls may become inadequate because of changes in conditions, or that the degree of compliance with the policies or procedures may deteriorate.
As indicated in the accompanying Management’s Report on Internal Control Over Financial Reporting, management’s assessment of and conclusion on the effectiveness of internal control over financial reporting did not include the internal controls of a prepaid fuel card and food voucher company in Mexico (Mexican Card and Voucher Company) and Allstar Business Solutions Limited (UK Fuel Card Company), which are included in the 2011 consolidated financial statements of FleetCor Technologies, Inc. and subsidiaries. The Mexican Card and Voucher Company and the UK Fuel Card Company constituted 26% and 21% of total and net assets, respectively, as of December 31, 2011 and 2.5% and 1% of revenues and net income, respectively, for the year then ended. Our audit of internal control over financial reporting of FleetCor Technologies, Inc. and subsidiaries also did not include an evaluation of the internal control over financial reporting of the Mexican Card and Voucher Company and the UK Fuel Card Company.
In our opinion, FleetCor Technologies, Inc. and subsidiaries maintained, in all material respects, effective internal control over financial reporting as of December 31, 2011, based on the COSO criteria.
We also have audited, in accordance with the standards of the Public Company Accounting Oversight Board (United States), the consolidated balance sheets as of December 31, 2011 and 2010, and the related consolidated statements of income, stockholders’ equity, comprehensive income (loss), and cash flows for each of the three years in the period ended December 31, 2011 of FleetCor Technologies, Inc. and subsidiaries and our report dated February 29, 2012 expressed an unqualified opinion thereon.
/s/ Ernst & Young LLP
Atlanta, Georgia
February 29, 2012
FleetCor Technologies, Inc. and Subsidiaries
Consolidated Balance Sheets
(In Thousands, Except Share and Par Value Amounts)
| December 31 | December 31 | |||||||||||||||
| 2010 | 2009 | 2011 | 2010 | |||||||||||||
Assets | ||||||||||||||||
Current assets: | ||||||||||||||||
Cash and cash equivalents | $ | 114,804 | $ | 84,701 | $ | 285,159 | $ | 114,804 | ||||||||
Restricted cash | 62,341 | 67,979 | 55,762 | 62,341 | ||||||||||||
Accounts receivable (less allowance for doubtful accounts of $14,256 and $14,764, respectively) | 260,163 | 163,461 | ||||||||||||||
Accounts receivable (less allowance for doubtful accounts of $15,315 and $14,256, respectively) | 481,791 | 260,163 | ||||||||||||||
Securitized accounts receivable—restricted for securitization investors | 144,000 | — | 280,000 | 144,000 | ||||||||||||
Prepaid expenses and other current assets | 33,191 | 24,113 | 15,416 | 33,191 | ||||||||||||
Deferred income taxes | 4,484 | 6,988 | 4,797 | 4,484 | ||||||||||||
|
| |||||||||||||||
Total current assets | 618,983 | 347,242 | 1,122,925 | 618,983 | ||||||||||||
|
| |||||||||||||||
Property and equipment | 83,013 | 72,091 | 93,380 | 83,013 | ||||||||||||
Less accumulated depreciation and amortization | (56,195 | ) | (44,868 | ) | (60,656 | ) | (56,195 | ) | ||||||||
|
| |||||||||||||||
Net property and equipment | 26,818 | 27,223 | 32,724 | 26,818 | ||||||||||||
Goodwill | 601,666 | 590,336 | 823,549 | 601,666 | ||||||||||||
Other intangibles, net | 193,861 | 197,430 | 299,460 | 193,861 | ||||||||||||
Other assets | 42,790 | 47,314 | 45,834 | 42,790 | ||||||||||||
|
| |||||||||||||||
Total assets | $ | 1,484,118 | $ | 1,209,545 | $ | 2,324,492 | $ | 1,484,118 | ||||||||
|
| |||||||||||||||
Liabilities and stockholders’ equity | ||||||||||||||||
Current liabilities: | ||||||||||||||||
Accounts payable | $ | 177,644 | $ | 175,578 | $ | 478,882 | $ | 177,644 | ||||||||
Accrued expenses | 49,176 | 46,746 | 42,242 | 49,176 | ||||||||||||
Customer deposits | 78,685 | 75,796 | 180,269 | 78,685 | ||||||||||||
Securitization facility | 144,000 | — | 280,000 | 144,000 | ||||||||||||
Current portion of notes payable and other obligations | 11,617 | 22,621 | 140,354 | 11,617 | ||||||||||||
|
| |||||||||||||||
Total current liabilities | 461,122 | 320,741 | 1,121,747 | 461,122 | ||||||||||||
|
| |||||||||||||||
Notes payable and other obligations, less current portion | 313,796 | 328,930 | 278,429 | 313,796 | ||||||||||||
Deferred income taxes | 83,255 | 85,825 | 112,880 | 83,255 | ||||||||||||
|
| |||||||||||||||
Total noncurrent liabilities | 397,051 | 414,755 | 391,309 | 397,051 | ||||||||||||
|
| |||||||||||||||
Commitments and contingencies | ||||||||||||||||
Stockholders’ equity: | ||||||||||||||||
Preferred stock, $.001 par value; 25,000,000 shares authorized and no shares issued and outstanding at 2010 | — | — | ||||||||||||||
Convertible preferred stock, $.001 par value; no shares authorized, issued and outstanding at 2010; 1,919,135 shares authorized and issued and 1,668,449 shares outstanding for Series D-1 at 2009; 230,769 shares authorized and issued and 201,923 shares outstanding for Series D-2 at 2009; 3,995,413 shares authorized, issued and outstanding for Series D-3 at 2009: 8,164,281 shares authorized, issued and outstanding for Series D-4 at 2009; 3,400,000 shares authorized, issued and outstanding for Series E at 2009; and 1,000,000 shares authorized for blank check preferred stock and none issued at 2009 (aggregate liquidation preference of $400,634) | — | 330,654 | ||||||||||||||
Common stock, $.001 par value; 475,000,000 shares authorized, 111,522,354 shares issued and 79,655,213 shares outstanding at 2010; and 130,000,000 shares authorized, 65,892,313 shares issued and 34,025,173 shares outstanding at 2009 | 112 | 66 | ||||||||||||||
Preferred stock, $0.001 par value; 25,000,000 shares authorized and no shares issued and outstanding at December 31, 2011 and 2010 | — | — | ||||||||||||||
Common stock, $0.001 par value; 475,000,000 shares authorized, 113,741,883 shares issued and 81,860,213 shares outstanding at December 31, 2011; and 111,522,354 shares issued and 79,655,213 shares outstanding at December 31, 2010 | 114 | 112 | ||||||||||||||
Additional paid-in capital | 421,991 | 94,996 | 466,203 | 421,991 | ||||||||||||
Retained earnings | 387,163 | 235,726 | 534,498 | 387,163 | ||||||||||||
Accumulated other comprehensive loss | (8,101 | ) | (12,173 | ) | (13,716 | ) | (8,101 | ) | ||||||||
Less treasury stock (31,867,141 shares at 2010 and 2009) | (175,220 | ) | (175,220 | ) | ||||||||||||
Less treasury stock (31,881,670 shares at December 31, 2011 and 31,867,141 shares at December 31, 2010) | (175,663 | ) | (175,220 | ) | ||||||||||||
|
| |||||||||||||||
Total stockholders’ equity | 625,945 | 474,049 | 811,436 | 625,945 | ||||||||||||
|
| |||||||||||||||
Total liabilities and stockholders’ equity | $ | 1,484,118 | $ | 1,209,545 | $ | 2,324,492 | $ | 1,484,118 | ||||||||
|
| |||||||||||||||
See accompanying notes.
FleetCor Technologies, Inc. and Subsidiaries
Consolidated Statements of Income
(In Thousands, Except Share Amounts)
| December 31 | December 31 | |||||||||||||||||||||||
| 2010 | 2009 | 2008 | 2011 | 2010 | 2009 | |||||||||||||||||||
Revenues, net | $ | 433,841 | $ | 354,073 | $ | 341,053 | $ | 519,591 | $ | 433,841 | $ | 354,073 | ||||||||||||
Expenses: | ||||||||||||||||||||||||
Merchant commissions | 49,050 | 39,709 | 38,539 | 51,199 | 49,050 | 39,709 | ||||||||||||||||||
Processing | 69,687 | 57,997 | 51,406 | 84,516 | 69,687 | 57,997 | ||||||||||||||||||
Selling | 32,731 | 30,579 | 23,778 | 36,606 | 32,731 | 30,579 | ||||||||||||||||||
General and administrative | 78,135 | 51,375 | 47,635 | 84,765 | 78,135 | 51,375 | ||||||||||||||||||
| 204,238 | 174,413 | 179,695 | ||||||||||||||||||||||
Depreciation and amortization | 33,745 | 28,368 | 27,240 | 36,171 | 33,745 | 28,368 | ||||||||||||||||||
|
|
| ||||||||||||||||||||||
Operating income | 170,493 | 146,045 | 152,455 | 226,334 | 170,493 | 146,045 | ||||||||||||||||||
|
|
| ||||||||||||||||||||||
Other income, net | (1,319 | ) | (933 | ) | (2,488 | ) | (589 | ) | (1,319 | ) | (933 | ) | ||||||||||||
Interest expense, net | 20,532 | 17,363 | 20,256 | 13,377 | 20,532 | 17,363 | ||||||||||||||||||
Loss on early extinguishment of debt | 2,669 | — | — | |||||||||||||||||||||
|
|
| ||||||||||||||||||||||
Total other expense | 19,213 | 16,430 | 17,768 | 15,457 | 19,213 | 16,430 | ||||||||||||||||||
|
|
| ||||||||||||||||||||||
Income before income taxes | 151,280 | 129,615 | 134,687 | 210,877 | 151,280 | 129,615 | ||||||||||||||||||
Provision for income taxes | 43,384 | 40,563 | 37,405 | 63,542 | 43,384 | 40,563 | ||||||||||||||||||
|
|
| ||||||||||||||||||||||
Net income | 107,896 | 89,052 | 97,282 | 147,335 | 107,896 | 89,052 | ||||||||||||||||||
Calculation of income attributable to common shareholders: | ||||||||||||||||||||||||
Convertible preferred stock accrued dividends | (1,488 | ) | (15,789 | ) | (11,357 | ) | — | (1,488 | ) | (15,789 | ) | |||||||||||||
|
|
| ||||||||||||||||||||||
Income attributable to common shareholders for basic earnings per share | $ | 106,408 | $ | 73,263 | $ | 85,925 | $ | 147,335 | $ | 106,408 | $ | 73,263 | ||||||||||||
|
|
| ||||||||||||||||||||||
Earnings per share: | ||||||||||||||||||||||||
Basic earnings per share | $ | 3.00 | $ | 2.17 | $ | 2.60 | $ | 1.83 | $ | 3.00 | $ | 2.17 | ||||||||||||
|
|
| ||||||||||||||||||||||
Diluted earnings per share | $ | 1.34 | $ | 1.13 | $ | 1.35 | $ | 1.76 | $ | 1.34 | $ | 1.13 | ||||||||||||
|
|
| ||||||||||||||||||||||
Weighted average shares outstanding: | ||||||||||||||||||||||||
Basic weighted average shares outstanding | $ | 35,434 | $ | 33,802 | $ | 33,033 | 80,610 | 35,434 | 33,802 | |||||||||||||||
|
|
| ||||||||||||||||||||||
Diluted weighted average shares outstanding | $ | 80,751 | $ | 78,854 | $ | 71,913 | 83,654 | 80,751 | 78,854 | |||||||||||||||
|
|
| ||||||||||||||||||||||
See accompanying notes.
FleetCor Technologies, Inc. and Subsidiaries
Consolidated Statements of Comprehensive Income
(In Thousands)
| December 31 | ||||||||||||
| 2011 | 2010 | 2009 | ||||||||||
Net income | $ | 147,335 | $ | 107,896 | $ | 89,052 | ||||||
Other comprehensive (loss) income: | ||||||||||||
Fair value of interest rate swaps, net of tax | — | 3,957 | 2,731 | |||||||||
Foreign currency translation adjustment (loss) gain, net of tax | (5,615 | ) | 115 | 4,374 | ||||||||
|
|
|
|
|
| |||||||
Total other comprehensive (loss) income | (5,615 | ) | 4,072 | 7,105 | ||||||||
|
|
|
|
|
| |||||||
Total comprehensive income | $ | 141,720 | $ | 111,968 | $ | 96,157 | ||||||
|
|
|
|
|
| |||||||
See accompanying notes.
FleetCor Technologies, Inc. and Subsidiaries
Consolidated Statements of Stockholders’ Equity
(In Thousands, Except Share Data)Thousands)
| Convertible Preferred Stock | Common Stock | Additional Paid-In Capital | Retained Earnings | Treasury Stock | Notes for Preferred Stock | Accumulated Other Comprehensive Income (Loss) | Total | |||||||||||||||||||||||||||||||||||||||||||||||||||||||||
Balance at December 31, 2007 | $ | 201,480 | $ | 64 | $ | 88,148 | $ | 76,566 | $ | (175,220 | ) | $ | (195 | ) | $ | 386 | $ | 191,229 | ||||||||||||||||||||||||||||||||||||||||||||||
Net income | — | — | — | 97,282 | — | — | — | 97,282 | ||||||||||||||||||||||||||||||||||||||||||||||||||||||||
Fair value of interest rate swaps, net of tax of $3,047 | — | — | — | — | — | — | (4,969 | ) | (4,969 | ) | ||||||||||||||||||||||||||||||||||||||||||||||||||||||
Other comprehensive income from currency exchange net of tax of $0 | — | — | — | — | — | — | (14,695 | ) | (14,695 | ) | ||||||||||||||||||||||||||||||||||||||||||||||||||||||
Total comprehensive income | 77,618 | |||||||||||||||||||||||||||||||||||||||||||||||||||||||||||||||
Issuance of restricted stock | — | — | 1 | — | — | — | — | 1 | ||||||||||||||||||||||||||||||||||||||||||||||||||||||||
Issuance of common stock | — | 1 | 4,415 | — | — | — | — | 4,416 | ||||||||||||||||||||||||||||||||||||||||||||||||||||||||
Accretion of convertible preferred stock | 11,384 | — | — | (11,384 | ) | — | — | — | — | |||||||||||||||||||||||||||||||||||||||||||||||||||||||
| Convertible Preferred Stock | Common Stock | Additional Paid-In Capital | Retained Earnings | Treasury Stock | Notes for Preferred Stock | Accumulated Other Comprehensive Income (Loss) | Total | |||||||||||||||||||||||||||||||||||||||||||||||||||||||||
Balance at December 31, 2008 | 212,864 | 65 | 92,564 | 162,464 | (175,220 | ) | (195 | ) | (19,278 | ) | 273,264 | $ | 212,864 | $ | 65 | $ | 92,564 | $ | 162,464 | $ | (175,220 | ) | $ | (195 | ) | $ | (19,278 | ) | $ | 273,264 | ||||||||||||||||||||||||||||||||||
Net income | — | — | — | 89,052 | — | — | — | 89,052 | — | — | — | 89,052 | — | — | — | 89,052 | ||||||||||||||||||||||||||||||||||||||||||||||||
Fair value of interest rate swaps, net of tax of ($1,674) | — | — | — | — | — | — | 2,731 | 2,731 | — | — | — | — | — | — | 2,731 | 2,731 | ||||||||||||||||||||||||||||||||||||||||||||||||
Other comprehensive income from currency exchange, net of tax of $500 | — | — | — | — | — | — | 4,374 | 4,374 | — | — | — | — | — | — | 4,374 | 4,374 | ||||||||||||||||||||||||||||||||||||||||||||||||
| ||||||||||||||||||||||||||||||||||||||||||||||||||||||||||||||||
Total comprehensive income | 96,157 | 96,157 | ||||||||||||||||||||||||||||||||||||||||||||||||||||||||||||||
Payment of note for preferred stock | — | — | — | — | — | 195 | — | 195 | — | — | — | — | — | 195 | — | 195 | ||||||||||||||||||||||||||||||||||||||||||||||||
Issuance of common stock | — | 1 | 2,930 | — | — | — | — | 2,931 | — | 1 | 2,930 | — | — | — | — | 2,931 | ||||||||||||||||||||||||||||||||||||||||||||||||
Issuance of preferred stock | 102,000 | — | — | — | — | — | — | 102,000 | 102,000 | — | — | — | — | — | — | 102,000 | ||||||||||||||||||||||||||||||||||||||||||||||||
Preferred stock issuance costs | — | — | (498 | ) | — | — | — | — | (498 | ) | ||||||||||||||||||||||||||||||||||||||||||||||||||||||
Issuance of preferred stock | — | — | (498 | ) | — | — | — | — | (498 | ) | ||||||||||||||||||||||||||||||||||||||||||||||||||||||
Accretion of convertible preferred stock | 15,790 | — | — | (15,790 | ) | — | — | — | — | 15,790 | — | — | (15,790 | ) | — | — | — | — | ||||||||||||||||||||||||||||||||||||||||||||||
|
|
|
|
|
|
|
| |||||||||||||||||||||||||||||||||||||||||||||||||||||||||
Balance at December 31, 2009 | 330,654 | 66 | 94,996 | 235,726 | (175,220 | ) | — | (12,173 | ) | 474,049 | 330,654 | 66 | 94,996 | 235,726 | (175,220 | ) | — | (12,173 | ) | 474,049 | ||||||||||||||||||||||||||||||||||||||||||||
Net income | — | — | — | 107,896 | — | — | — | 107,896 | — | — | — | 107,896 | — | — | — | 107,896 | ||||||||||||||||||||||||||||||||||||||||||||||||
Fair value of interest rate swaps, net of tax of $2,425 | — | — | — | — | — | — | 3,957 | 3,957 | — | — | — | — | — | — | 3,957 | 3,957 | ||||||||||||||||||||||||||||||||||||||||||||||||
Other comprehensive income from currency exchange, net of tax of $3 | — | — | — | — | — | — | 115 | 115 | — | — | — | — | — | — | 115 | 115 | ||||||||||||||||||||||||||||||||||||||||||||||||
| ||||||||||||||||||||||||||||||||||||||||||||||||||||||||||||||||
Total comprehensive income | — | — | — | — | — | — | — | 111,968 | 111,968 | |||||||||||||||||||||||||||||||||||||||||||||||||||||||
Payment of dividends on convertible preferred stock | (7,635 | ) | — | — | — | — | — | — | (7,635 | ) | (7,635 | ) | — | — | — | — | — | — | (7,635 | ) | ||||||||||||||||||||||||||||||||||||||||||||
Conversion of convertible preferred stock to common stock in connection with initial public offering | (323,019 | ) | 45 | 279,433 | 43,541 | — | — | — | — | (323,019 | ) | 45 | 279,433 | 43,541 | — | — | — | — | ||||||||||||||||||||||||||||||||||||||||||||||
Issuance of common stock | — | 1 | 47,562 | — | — | — | — | 47,563 | — | 1 | 47,562 | — | — | — | — | 47,563 | ||||||||||||||||||||||||||||||||||||||||||||||||
|
|
|
|
|
|
|
| |||||||||||||||||||||||||||||||||||||||||||||||||||||||||
Balance at December 31, 2010 | $ | — | $ | 112 | $ | 421,991 | $ | 387,163 | $ | (175,220 | ) | $ | — | $ | (8,101 | ) | $ | 625,945 | — | 112 | 421,991 | 387,163 | (175,220 | ) | — | (8,101 | ) | 625,945 | ||||||||||||||||||||||||||||||||||||
Net income | — | — | — | 147,335 | — | — | — | 147,335 | ||||||||||||||||||||||||||||||||||||||||||||||||||||||||
Other comprehensive income from currency exchange, net of tax of $0 | — | — | — | — | — | — | (5,615 | ) | (5,615 | ) | ||||||||||||||||||||||||||||||||||||||||||||||||||||||
| ||||||||||||||||||||||||||||||||||||||||||||||||||||||||||||||||
Total comprehensive income | 141,720 | |||||||||||||||||||||||||||||||||||||||||||||||||||||||||||||||
Repurchase of common stock | — | — | — | — | (443 | ) | — | — | (443 | ) | ||||||||||||||||||||||||||||||||||||||||||||||||||||||
Issuance of common stock | — | 2 | 44,212 | — | — | — | — | 44,214 | ||||||||||||||||||||||||||||||||||||||||||||||||||||||||
|
|
|
|
|
|
|
| |||||||||||||||||||||||||||||||||||||||||||||||||||||||||
Balance at December 31, 2011 | $ | — | $ | 114 | $ | 466,203 | $ | 534,498 | $ | (175,663 | ) | $ | — | $ | (13,716 | ) | $ | 811,436 | ||||||||||||||||||||||||||||||||||||||||||||||
|
|
|
|
|
|
|
| |||||||||||||||||||||||||||||||||||||||||||||||||||||||||
See accompanying notes.
FleetCor Technologies, Inc. and Subsidiaries
Consolidated Statements of Cash Flows
(In Thousands)
| Year Ended December 31 | Year Ended December 31 | |||||||||||||||||||||||
| 2010 | 2009 | 2008 | 2011 | 2010 | 2009 | |||||||||||||||||||
Operating activities | ||||||||||||||||||||||||
Net Income | $ | 107,896 | $ | 89,052 | $ | 97,282 | $ | 147,335 | $ | 107,896 | $ | 89,052 | ||||||||||||
Adjustments to reconcile net income to net cash provided by operating activities: | ||||||||||||||||||||||||
Depreciation | 11,261 | 9,648 | 8,608 | 11,451 | 11,261 | 9,648 | ||||||||||||||||||
Stock-based compensation | 26,755 | 2,666 | 2,758 | 21,743 | 26,755 | 2,666 | ||||||||||||||||||
Provision for losses on accounts receivable | 18,883 | 32,593 | 34,924 | 19,226 | 18,883 | 32,593 | ||||||||||||||||||
Amortization of deferred financing costs | 2,016 | 1,842 | 1,123 | 1,864 | 2,016 | 1,842 | ||||||||||||||||||
Amortization of intangible assets | 17,205 | 13,900 | 12,038 | 19,590 | 17,205 | 13,900 | ||||||||||||||||||
Amortization of premium on receivables | 3,263 | 3,257 | 5,471 | 3,266 | 3,263 | 3,257 | ||||||||||||||||||
Deferred income taxes | (3,952 | ) | 4,395 | 8,728 | (2,920 | ) | (3,952 | ) | 4,395 | |||||||||||||||
Loss on early extinguishment of debt | 2,669 | — | — | |||||||||||||||||||||
Changes in operating assets and liabilities (net of acquisitions): | ||||||||||||||||||||||||
Restricted cash | 5,639 | 3,243 | 5,575 | 6,579 | 5,639 | 3,243 | ||||||||||||||||||
Accounts receivable | (38,960 | ) | 2,345 | (9,372 | ) | (80,024 | ) | (38,960 | ) | 2,345 | ||||||||||||||
Prepaid expenses and other current assets | (3,506 | ) | 11,002 | (13,317 | ) | 17,581 | (3,506 | ) | 11,002 | |||||||||||||||
Other assets | 63 | (370 | ) | (7,555 | ) | (1,935 | ) | 63 | (370 | ) | ||||||||||||||
Excess tax benefits related to stock-based compensation | (10,710 | ) | — | (896 | ) | (13,727 | ) | (10,710 | ) | — | ||||||||||||||
Accounts payable, accrued expenses, and customer deposits | 3,902 | 5,217 | (87,278 | ) | 126,927 | 3,902 | 5,217 | |||||||||||||||||
|
|
| ||||||||||||||||||||||
Net cash provided by operating activities | 139,755 | 178,790 | 58,089 | 279,625 | 139,755 | 178,790 | ||||||||||||||||||
|
|
| ||||||||||||||||||||||
Investing activities | ||||||||||||||||||||||||
Acquisitions, net of cash acquired | (10,022 | ) | (231,097 | ) | (55,924 | ) | (333,763 | ) | (10,022 | ) | (231,097 | ) | ||||||||||||
Purchases of property and equipment | (11,194 | ) | (9,677 | ) | (7,088 | ) | (13,454 | ) | (11,194 | ) | (9,677 | ) | ||||||||||||
|
|
| ||||||||||||||||||||||
Net cash used in investing activities | (21,216 | ) | (240,774 | ) | (63,012 | ) | (347,217 | ) | (21,216 | ) | (240,774 | ) | ||||||||||||
|
|
| ||||||||||||||||||||||
Financing activities | ||||||||||||||||||||||||
Net proceeds from initial public offering | 9,560 | — | — | — | 9,560 | — | ||||||||||||||||||
Excess tax benefits related to stock-based compensation | 10,710 | — | 896 | 13,727 | 10,710 | — | ||||||||||||||||||
Payments on securitization facility, net | (74,000 | ) | — | — | ||||||||||||||||||||
Proceeds from (payments on) securitization facility, net | 136,000 | (74,000 | ) | — | ||||||||||||||||||||
Deferred financing costs paid | (1,067 | ) | — | (1,715 | ) | (7,839 | ) | (1,067 | ) | — | ||||||||||||||
Proceeds from notes payable | — | — | 50,000 | 425,000 | — | — | ||||||||||||||||||
Payment of dividends on convertible preferred stock | (7,634 | ) | — | — | — | (7,634 | ) | — | ||||||||||||||||
Proceeds from issuance of common stock | 538 | 266 | 763 | 8,477 | 538 | 266 | ||||||||||||||||||
Proceeds from issuance of convertible preferred stock, net | — | 93,696 | — | — | — | 93,696 | ||||||||||||||||||
Principal payments on notes payable | (24,634 | ) | (21,658 | ) | (34,720 | ) | (338,965 | ) | (24,634 | ) | (21,658 | ) | ||||||||||||
Principal payments on other obligations | (17 | ) | (66 | ) | (293 | ) | — | (17 | ) | (66 | ) | |||||||||||||
Other | (179 | ) | — | — | ||||||||||||||||||||
|
|
| ||||||||||||||||||||||
Net cash (used in) provided by financing activities | (86,544 | ) | 72,238 | 14,931 | ||||||||||||||||||||
Net cash provided by (used in) financing activities | 236,221 | (86,544 | ) | 72,238 | ||||||||||||||||||||
|
|
| ||||||||||||||||||||||
Effect of foreign currency exchange rates on cash | (1,892 | ) | 4,092 | (8,517 | ) | 1,726 | (1,892 | ) | 4,092 | |||||||||||||||
|
|
| ||||||||||||||||||||||
Net increase in cash | 30,103 | 14,346 | 1,491 | 170,355 | 30,103 | 14,346 | ||||||||||||||||||
Cash and cash equivalents at beginning of year | 84,701 | 70,355 | 68,864 | 114,804 | 84,701 | 70,355 | ||||||||||||||||||
|
|
| ||||||||||||||||||||||
Cash and cash equivalents at end of year | $ | 114,804 | $ | 84,701 | $ | 70,355 | $ | 285,159 | $ | 114,804 | $ | 84,701 | ||||||||||||
|
|
| ||||||||||||||||||||||
Supplemental cash flow information | ||||||||||||||||||||||||
Cash paid for interest | $ | 21,409 | $ | 22,242 | $ | 37,474 | $ | 14,961 | $ | 21,409 | $ | 22,242 | ||||||||||||
|
|
| ||||||||||||||||||||||
Cash paid for income taxes | $ | 45,998 | $ | 28,094 | $ | 38,756 | $ | 49,205 | $ | 45,998 | $ | 28,094 | ||||||||||||
|
|
| ||||||||||||||||||||||
Adoption of new accounting guidance related to asset securitization facility | $ | 218,000 | $ | — | $ | — | $ | — | $ | 218,000 | $ | — | ||||||||||||
|
|
| ||||||||||||||||||||||
Non-cash investing activity | ||||||||||||||||||||||||
Non-cash issuance of preferred stock | $ | — | $ | 8,000 | $ | — | $ | — | $ | — | $ | 8,000 | ||||||||||||
|
|
| ||||||||||||||||||||||
See accompanying notes.
FleetCor Technologies, Inc. and Subsidiaries
Notes to the Consolidated Financial Statements
December 31, 20102011
1. Description of Business
FleetCor Technologies Inc. and its subsidiaries (the Company) areis a leading independent global providers of specialized payment products and services to businesses, commercial fleets, major oil companies, lodging clients, petroleum marketers and government entities in 18 countries in North America, Europe, AfricaLatin America and Asia.Europe. The Company provides payment products and services in a variety of combinations to create customized payment solutions for customers. The Company sells its products and services directly and indirectly through major oil companies and petroleum marketers with whom it has strategic relationships. The Company provides customers with various card products that function like a charge card to purchase fuel, lodging and related products and services at participating locations. The Company’s payment programs enable businesses to better manage and control employee spending and provide card-accepting merchants with a high volume customer base that can increase their sales and customer loyalty. To support the payment products, the Company also provides a range of services, such as issuing and processing, as well as specialized information services that provide customers with value-added functionality and data. Customers can use this data to track important business productivity metrics, combat fraud and employee misuse, streamline expense administration and lower overall operating costs. The Company’s reporting segments, North America and International, reflect the Company’s global organization. Within its segments, services are provided to commercial fleets, major oil companies, and petroleum marketers. The Company also provides lodging and transportation management services in North America.America and prepaid fuel and food vouchers and cards internationally that may be used as a form of payment in restaurants, grocery stores and gas stations.
2. Summary of Significant Accounting Policies
Revenue Recognition and Presentation
Revenue is derived from the Company’s merchant and network relationships as well as from customers and partners. The Company recognizes revenue on fees generated through services to commercial fleets, major oil companies and petroleum marketers and is recordedrecords revenue net of the wholesale cost of the underlying products and services based on the following: (i) the Company isare not the primary obligor in the fuel arrangement and is not responsible for fulfillment and the acceptability of the product; (ii) the Company has no inventory risk, does not bear the risk of product loss and does not make any changes to the fuelproduct or have any involvement in the product specifications; (iii) the Company does not have significant latitude with respect to establishing the price for fuelthe product and (iv) the amount the Company earns for its services is fixed.
Through the Company’s merchant and network relationships the Company primarily provides fuel, vehicle maintenance or lodging services to its customers. The Company derives its revenue from the Company’s merchant and network relationships based on the difference between the price charged to a customer for a transaction and the price paid to the merchant or network for the same transaction. The Company’s net revenue consists of margin on fuel sales and fees for technical support, processing, communications and reporting. The price paid to a merchant or network may be calculated as (i) the merchant’s wholesale cost of fuel plus a markup; (ii) the transaction purchase price less a percentage discount; or (iii) the transaction purchase price less a fixed fee per unit. The difference between the price the Company pays to a merchant and the merchant’s wholesale cost for the underlying products and services is considered a merchant commission and is recognized as expense when the transaction is executed. The Company recognizes revenue from merchant and network relationships when persuasive evidence of an arrangement exists, the services have been provided to the customer, the sales price is fixed or determinable and collectability is reasonably assured. The Company has entered into agreements with major oil companies and petroleum marketers that specify that a transaction is deemed to be captured when
the Company has validated that the transaction has no errors and have accepted and posted the data to the Company’s records. Revenue is recognized on lodging and transportation management services when the lodging stay or transportation service is completed.
FleetCor Technologies, Inc. and Subsidiaries
Notes to Financial Statements (continued)
2. Summary of Significant Accounting Policies (continued)
The Company also derives revenue from customers and partners from a variety of program fees including transaction fees, card fees, network fees, report fees and other transaction-based fees which typically are calculated based on measures such as percentage of dollar volume processed, number of transactions processed, or some combination thereof. Such services are provided through proprietary networks or through the use of third-party networks. Transaction fees and other transaction-based fees generated from our proprietary networks and third-party networks are recognized at the time the transaction is captured. Card fees, network fees and program fees are recognized as the Company fulfills its contractual service obligations. In addition, the Company recognizes revenue from late fees and finance charges. Such fees are recognized net of a provision for estimated uncollectible amounts, at the time the fees and finance charges are assessed.
Use of Estimates
The preparation of consolidated financial statements in conformity with accounting principles generally accepted in the United States requires management to make estimates and assumptions that affect the reported amounts of assets and liabilities and disclosure of contingent assets and liabilities at the date of the consolidated financial statements and the reported amounts of revenues and expenses during the reporting period. Actual results could differ from those estimates.
Principles of Consolidation
The consolidated financial statements were prepared in accordance with U.S. generally accepted accounting principles (GAAP). The consolidated financial statements include all normal and recurring adjustments that are necessary for a fair presentation of the Company’s financial position and operating results.
The accompanying consolidated financial statements include the accounts of FleetCor Technologies, Inc. and all of its wholly owned subsidiaries. All significant intercompany balances and transactions have been eliminated.
Credit Risk and Reserve for Losses on Receivables
The Company controls credit risk by performing periodic credit evaluations of its customers. Payments from customers are generally due within 14 days of billing. The Company routinely reviews its accounts receivable balances and makes provisions for probable doubtful accounts based primarily on the aging of those balances. Accounts receivable are deemed uncollectible and removed from accounts receivable and the allowance for doubtful accounts when internal collection efforts have been exhausted and accounts have been turned over to a third-party collection agency.
Fair Value Measurements
The Company’s financial instruments include cash and cash equivalents, restricted cash, accounts receivable, accounts payable, derivative instruments, notes payable and short and long-term debt. The carrying values for current financial assets and liabilities, including cash and cash equivalents, restricted cash, accounts receivable and accounts payable, approximate their fair values due to the short maturity of such instruments. The fair values of the Company’s derivative instruments are recorded in the Consolidated Balance Sheets and are disclosed in Note 3. The fair values of certain of the Company’s short and long-term debt approximates their carrying values as they bear interest at varying rates.
FleetCor Technologies, Inc. and Subsidiaries
Notes to Financial Statements (continued)
2. Summary of Significant Accounting Policies (continued)
Business Combinations
Business combinations completed by the Company have been accounted for under the purchaseacquisition method of accounting. The costacquisition method requires that the acquired assets and liabilities, including contingencies, be recorded at fair value determined on the acquisition date and changes thereafter reflected in income. For significant acquisitions, the Company obtains independent third party valuation studies for certain of each acquired business is allocated to the assets acquired and liabilities assumed based on their estimatedto assist the Company in determining fair value. Goodwill represents the excess of the purchase price over the fair values of the tangible and is disclosedintangible assets acquired and liabilities assumed. The estimation of the fair values of the assets acquired and liabilities assumed involves a number of estimates
and assumptions that could differ materially from the actual amounts recorded. The results of the acquired businesses are included in Note 6.the Company’s results from operations beginning from the day of acquisition.
These estimates are revised during an allocation period as necessary when, and if, information becomes available to further define and quantify the fair value of the assets acquired and liabilities assumed. The allocation period does not exceed one year from the date of the acquisition. To the extent additional information to refine the original allocation becomes available during the allocation period, the allocation of the purchase price is adjusted. Should information become available after the allocation period, those items are included in operating results. The direct costs of the acquisition wereare recorded as operating expenses for the years ended December 31, 2010 and 2009. Prior to 2009, the costs of an enterprise acquired in a business combination included the direct cost of the acquisition. Some of the 2008 and earlierexpenses. Certain historic acquisitions include additional contingent consideration related to future earnouts based on the growth of the market. When the contingencies are resolved and additional consideration is distributable, the Company will record the consideration issued as additional cost of the acquired company, or goodwill. The operating results of entities acquired are included in the Consolidated Statements of Income from the completion date of the applicable transaction. Goodwill represents the excess of the purchase price over the fair values of the tangible and intangible assets acquired and liabilities assumed.
Impairment of Long-Lived Assets and Intangibles
The Company tests its long-lived assets for impairment in accordance with relevant authoritative guidance. The Company evaluates if impairment indicators related to its property, plant and equipment and other long-lived assets are present. These impairment indicators may include a significant decrease in the market price of a long-lived asset or asset group, a significant adverse change in the extent or manner in which a long-lived asset or asset group is being used or in its physical condition, or a current-period operating or cash flow loss combined with a history of operating or cash flow losses or a forecast that demonstrates continuing losses associated with the use of a long-lived asset or asset group. If impairment indicators are present, the Company estimates the future cash flows for the asset or group of assets. The sum of the undiscounted future cash flows attributable to the asset or group of assets is compared to its carrying amount. The cash flows are estimated utilizing various projections of revenues and expenses, working capital and proceeds from asset disposals on a basis consistent with the strategic plan. If the carrying amount exceeds the sum of the undiscounted future cash flows, the Company determines the assets’ fair value by discounting the future cash flows using a discount rate required for a similar investment of like risk and records an impairment charge as the difference between the fair value and the carrying value of the asset group. Generally, the Company performs its testing of the asset group at the business-line level, as this is the lowest level for which identifiable cash flows are available.
The Company evaluatescompleted its most recent annual goodwill and indefinite-life intangible asset impairment test as of October 1, 2011. Goodwill is tested for impairment annually in the fourth quarter at the reporting unit level, which is one level belowand the operating segment level.impairment test consists of two steps, as well as a qualitative assessment, as appropriate. The Company also tests for impairment if eventsearly adopted the provisions of ASU 2011-08, as discussed below in “Adoption of New Accounting Standards”, and circumstances indicate that it is more likely than not thatperformed a qualitative assessment of certain of our reporting units before calculating the fair value of athe reporting units in step 1 of the goodwill impairment test. In this qualitative assessment the Company individually considered the following items for each reporting unit where the Company determined a qualitative analysis to be appropriate: the macroeconomic conditions, including any deterioration of general conditions, limitations on accessing capital, fluctuations in foreign exchange rates and other developments in equity and credit markets; industry and market conditions, including any deterioration in the environment where the reporting unit operates, increased competition, changes in the products/services and regulator and political developments; cost of doing business; overall financial performance, including any declining cash flows and performance in relation to planned revenues and earnings in past periods; other relevant reporting unit specific facts, such as changes in management or key personnel or pending litigation; events affecting the reporting unit, including changes in the carrying value of net assets, likelihood of disposal and whether there were any other impairment considerations within the business; the overall performance of our share price in relation to the market and our peers; and a quantitative stress test of the previously completed step 1 test from the prior year, updated with current year results and future projections.
The Company completed step 1 of the goodwill impairment testing for certain of our reporting units. In this first step, the reporting unit’s carrying amount, including goodwill, is belowcompared to its carrying amount.fair value which is measured based upon, among other factors, a discounted cash flow analysis as well as market multiples for comparable companies. If the carrying amount of the reporting unit is greater than theits fair value, goodwill is considered
impaired and step two must be performed. Step two measures the impairment may be present.
loss by comparing the implied fair value of reporting unit goodwill with the carrying amount of that goodwill. The Company’s approach to estimatingimplied fair value of goodwill is determined by allocating the fair value of the equityreporting unit to all the assets and liabilities of that unit (including unrecognized intangibles) as if the reporting units is based on the income approach.unit had been acquired in a business combination. The income approach involves a discounted cash flow analysis for eachexcess of the reporting units. Estimates critical to the Company’s fair value estimates includeover the discount rate, projected average revenue growth and financial performance ofamounts allocated to the reporting unit. The discount rate is based on guideline companies that operate in the same industry as the reporting units and face similar risks in the market.
FleetCor Technologies, Inc. and Subsidiaries
Notes to Financial Statements (continued)
2. Summary of Significant Accounting Policies (continued)
Based upon the Company’s fourth quarter of 2010 impairment evaluation, no impairment was identified. If impairment is identified, the Company measures the amount of goodwill impairment based upon the estimated fair value of the underlying assets and liabilities of the reporting unit including any unrecognized intangible assets, and estimatesis the implied fair value of goodwill. An impairment charge would be recognized toThe excess of the extent the recorded goodwill exceedscarrying amount over the implied fair value is the impairment loss.
The Company estimated the fair value of goodwill.our reporting units using a combination of the income approach and the market approach. The income approach utilizes a discounted cash flow model incorporating management’s expectations for future revenue, operating expenses, earnings before interest, taxes, depreciation and amortization, capital expenditures and an anticipated tax rate. The Company discounted the related cash flow forecasts using our estimated weighted-average cost of capital for each reporting unit at the date of valuation. The market approach utilizes comparative market multiples in the valuation estimate. Multiples are derived by relating the value of guideline companies, based on either the market price of publicly traded shares or the prices of companies being acquired in the marketplace, to various measures of their earnings and cash flow. Such multiples are then applied to the historical and projected earnings and cash flow of the reporting unit in developing the valuation estimate.
Preparation of forecasts and the selection of the discount rates involve significant judgments about expected future business performance and general market conditions. Significant changes in our forecasts, the discount rates selected or the weighting of the income and market approach could affect the estimated fair value of one or more of our reporting units and could result in a goodwill impairment charge in a future period.
Based on the goodwill asset impairment test on October 1, 2011, the Company determined that the fair value of each of our reporting units is in excess of the carrying value. No events or changes in circumstances have occurred since the date of this most recent annual impairment test that would more likely than not reduce the fair value of a reporting unit below its carrying amount.
The Company also evaluates indefinite-lived intangible assets (primarily trademarks and trade names) for impairment annually. The Company also tests for impairment if events and circumstances indicate that it is more likely than not that the fair value of an indefinite-lived intangible asset is below its carrying amount. Estimates critical to the Company’s evaluation of indefinite-lived intangible assets for impairment include the discount rate, royalty rates used in its evaluation of trade names, projected average revenue growth and projected long-term growth rates in the determination of terminal values. An impairment charge is recorded if the carrying amount of an indefinite-lived intangible asset exceeds the estimated fair value on the measurement date.
Property, Plant and Equipment and Definite-Lived Intangible Assets
Property, plant and equipment are stated at cost (Note 8).cost. Depreciation expense is calculated principally on the straight-line basis. Definite-lived intangible assets, consisting primarily of customer relationships, are stated at fair value.value upon acquisition. Definite-lived intangible assets are amortized on a straight-line basis. Customer relationship useful lives are estimated using historical customer attrition rates.
Income Taxes
The Company accounts for income taxes in accordance with relevant authoritative literature (Note 11).literature. Income taxes are accounted for under the asset and liability method. Deferred tax assets and liabilities are recognized for the future tax consequences attributable to differences between the financial statement carrying amounts of existing assets and liabilities and their respective tax bases. Deferred tax assets and liabilities are measured using enacted tax rates expected to apply to taxable income in the years in which those temporary differences are expected to be recovered or settled. The effect on deferred tax assets and liabilities of a change in tax rates is recognized in the period that includes the enactment date. The realizability of deferred tax assets must also be assessed.
The ultimate realization of deferred tax assets is dependent up on the generation of future taxable income during the periods in which the associated temporary differences became deductible. A valuation allowance must be established for deferred tax assets which are not believed to more likely than not be realized in the future.
The Company does not provide deferred taxes for the undistributed earnings of the Company’s foreign subsidiaries that are considered to be indefinitely reinvested outside of the United States in accordance with authoritative literature. The Company includes any estimated interest and penalties on tax related matters in income taxes payable and income tax expense.
The Company has adopted the provisions of relevant authoritative literature with respect to uncertainty in income taxes. This guidance clarifies the accounting for uncertainty in income taxes recognized in an entity’s financial statements and prescribes threshold and measurement attributes for financial statement disclosure of tax positions taken or expected to be taken on a tax return. Under the relevant authoritative literature, the impact of an uncertain income tax position on the income tax return must be recognized at the largest amount that is more likely than not to be sustained upon audit by the relevant taxing authority. An uncertain income tax position will not be recognized if it has less than a 50 percent likelihood of being sustained.
FleetCor Technologies, Inc. and Subsidiaries
Notes to Financial Statements (continued)
2. Summary of Significant Accounting Policies (continued)
Cash Equivalents
Cash equivalents consist of cash on hand and highly liquid investments with maturities of three months or less when purchased. Restricted cash represents customer deposits repayable on demand.
Derivative Financial Instruments
Derivative financial instruments are generally used to manage certain interest rate risks through the use of interest rate swaps. These instruments, when settled, impact the Company’s cash flows from operations. On the date in which the Company enters into a derivative, the derivative is designated as a hedge of the identified exposure. The Company measures effectiveness of its hedging relationships both at hedge inception and on an ongoing basis.
Gains and losses on interest rate swaps designated as cash flow hedges, to the extent that the hedge relationship has been effective, are deferred in other comprehensive income and recognized in interest expense over the period in which the Company recognizes interest expense on the related debt instrument.
Any ineffectiveness on these instruments is immediately recognized in interest expense in the period that the ineffectiveness occurs. No significant ineffectiveness was recorded on designated hedges in the years ended December 31, 2010 2009 and 2008, respectively.
2009. At December 31, 2010, all interest rate swaps had matured.
Foreign Currency Translation
Assets and liabilities of foreign subsidiaries are translated into U.S. dollars at the rates of exchange in effect at period-end. The related translation adjustments are made directly to accumulated other comprehensive income. Income and expenses are translated at the average monthly rates of exchange in effect during the year. Gains and losses from foreign currency transactions of these subsidiaries are included in net income. The companyCompany recognized foreign exchange gains for the years ended December 31, 2011, 2010 and 2009 and 2008 of $0.6 million, $0.5 million $0.9 million and $1.4$0.9 million, respectively, which are classified within other income, net in the Consolidated Statements of Income.
Stock-Based Compensation
The Company accounts for employee stock options and restricted stock in accordance with relevant authoritative literature, which requires companiesliterature. Stock options are granted with an exercise price estimated to recognize compensation cost for stock options and other stock-based awards basedbe equal to the fair market value on the estimated fair valuedate of grant as measured onauthorized by the grant date (Note 5).Company’s board of directors. Options granted have vesting provisions ranging
from one to six years. Stock option grants are generally subject to forfeiture if employment terminates prior to vesting. The Company has selected the Black-Scholes option pricing model for estimating the grantgrand date fair value of share-based payments.
stock option awards granted. There are assumptions within the Black-Scholes option pricing model. The Company has considered the retirement and forfeiture provisions of the options and utilized its historical experience to estimate the expected life of the options. The Company bases the risk-free interest rate is based on the yield of a zero coupon U.S. Treasury security with a maturity equal to the expected life of the option from the date of the grant. The Company estimates the volatility of the share price of the Company’s common stock by considering the historical volatility of the stock of similar public entities. In determining the appropriateness of the public entities included in the volatility assumption, the Company considers a number of factors, including the entity’s life cycle stage, size, financial leverage, and products offered. Stock-based compensation cost is measured at the grant date based on the value of the award and is recognized as expense over the requisite service period based on the number of awards for which the requisite service is expected to be rendered.
Awards of restricted stock and restricted stock units are independent of stock option grants and are generally subject to forfeiture if employment terminates prior to vesting. Prior to the Company’s initial public offering, the vesting of the shares granted in 2010 were contingent on the sale of the Company or a public offering of the Company’s common stock, subject to certain other conditions. The vesting of the shares granted in 2011 and 2010 are generally based on the passage of time, performance or market conditions. Shares vesting based on the passage of time have vesting provisions ranging from one to six years. The fair value of restricted stock shares based on performance is based on the grant date fair value of the Company’s stock. The fair value of restricted stock shares based on market conditions is estimated using the Monte Carlo option pricing model. The risk-free interest rate and volatility assumptions used within the Monte Carlo option pricing model are calculated consistently with those applied in the Black-Scholes options pricing model utilized in determining the fair value of the stock option awards. For performance-based restricted stock awards, the Company must also make assumptions regarding the likelihood of achieving performance goals. If actual results differ significantly from these estimates;estimates, stock-based compensation expense and the Company’s results of operations could be materially affected.
FleetCor Technologies, Inc. and Subsidiaries
Notes to Financial Statements (continued)
2. Summary of Significant Accounting Policies (continued)
Deferred Financing Costs
Costs incurred to obtain financing, net of accumulated amortization, are included in other long-term assets in the Consolidated Balance Sheets, and are amortized over the term of the related debt. In June 2011, the Company wrote-off $1.7 million and $1.0 million in deferred debt issuance costs associated with the extinguishment of the 2005 Facility and CCS Credit Facility, respectively. Additionally, the Company incurred debt issuance costs associated with its new Credit Facility of $7.2 million. At December 31, 20102011 and 2009,2010, the Company had net deferred financing costs of $2.3$6.6 million and $4.5$2.3 million, respectively.
Comprehensive Income (Loss)
Comprehensive income (loss) is defined as the total of net income and all other changes in equity that result from transactions and other economic events of a reporting period other than transactions with owners. The Company discloses comprehensive income (loss) in the Consolidated Statements of Stockholders’ Equity and Comprehensive Income (Loss). The Company’s accumulated other comprehensive income (loss) includes foreign currency translation losses of $(8.1) million, $(8.2) million and $(12.6) million for the years ended December 31, 2010, 2009 and 2008 and the unrealized loss on interest rate swaps of $4.0 million and $6.7 million for the years ended December 31, 2009 and 2008, respectively.Income.
Accounts Receivable
The Company maintains a $500 million revolving trade accounts receivable securitization facility (the Facility). Pursuant to the terms of the Facility, the Company transfers certain of its domestic receivables, on a revolving basis, to FleetCor Funding LLC (Funding) a wholly-owned bankruptcy remote subsidiary. In turn, Funding sells, without recourse, on a revolving basis, up to $500 million of undivided ownership interests in this pool of accounts receivable to a multi-seller, asset-backed commercial paper conduit (Conduit). Funding maintains a subordinated interest, in the form of over collateralization, in a portion of the receivables sold to the Conduit.
Purchases by the Conduit are financed with the sale of highly-rated commercial paper. The Company utilizes proceeds from the sale of its accounts receivable as an alternative to other forms of debt, effectively reducing its overall borrowing costs. The Company has agreed to continue servicing the sold receivables for the financial institution at market rates, which approximates the Company’s cost of servicing. The Company retains a residual interest in the accounts receivable sold as a form of credit enhancement. The residual interest’s fair value approximates carrying value due to its short-term nature
Funding determines the level of funding achieved by the sale of trade accounts receivable, subject to a maximum amount. Prior to the adoption of new accounting guidance on January 1, 2010, Funding retained a residual interest in the eligible receivables transferred, such that amounts payable in respect of such residual interest will be distributed to Funding upon payment in full of all amounts owed by Funding to the financial institutions.
In June 2009, the Financial Accounting Standards Board (“FASB”) issued guidance limiting the circumstances in which a financial asset may be derecognized when the transferor has not transferred the entire financial asset or has continuing involvement with the transferred asset. The concept of a qualifying special purpose-entity, which had previously facilitated sale accounting for certain asset transfers, was removed by this guidance. In addition, the guidance also shifts the determination of which enterprise should consolidate a variable interest entity (VIE) to a current control approach, such that an entity that has both the power to make decisions and the right to receive benefits or absorb losses that could potentially be significant to the VIE will consolidate a VIE. The guidance also requires ongoing assessments related to who should consolidate the VIE. This guidance was effective as of January 1, 2010.
The Company analyzed the impact of the changes to the accounting guidance and concluded that it would consolidate Funding. The Company concluded it would consolidate this VIE because the Company maintains significant decision-making rights, owns a variable interest that could be potentially significant to the VIE, and receives all the benefits or is required to absorb all the losses of Funding. Accordingly, effective January 1, 2010, the Company consolidated Funding. Using the carrying amounts of the assets and liabilities of Funding as prescribed by the accounting guidance and any corresponding elimination of activity between Funding and the Company resulting from the consolidation on January 1, 2010, the Company recorded a $218 million increase in total assets, a $218 million increase in total liabilities and non-cash financing activities of $218 million.
Beginning January 1, 2010, the Company’s consolidated balance sheet and statement of income no longer reflects activity related to its retained residual interest in eligible accounts receivable sold to Funding, but instead reflect the activity related to its securitized accounts receivable and the corresponding securitized debt, including interest income, fees generated from late payments, provision for losses on accounts receivable and interest expense. Interest expense and the provision for losses on accounts receivable associated with the securitized accounts receivable are no longer included as a deduction from revenues, net in the consolidated statements of income, resulting in an increase of $27.2 million of revenues, net for the year ended December 31, 2010 compared to the year ended December 31, 2009. The cash flows from borrowings and repayments, associated with the securitized debt, are now presented as cash flows from financing activities. The Company’s consolidated statement of income for the year ended December 31, 2009 has not been retrospectively adjusted to reflect the adoption of this accounting guidance. Therefore, current period results and balances will not be comparable to prior period amounts, particularly with regard to accounts receivable, the securitization facility, the provision for losses on accounts receivable, interest expense and revenues, net.
On February 6, 2012, the Company extended the term of its asset securitization facility to February 4, 2013. The Company capitalized $0.6 million in deferred financing fees in connection with this extension.
The Company’s accounts receivable and securitized accounts receivable include the following at December 31 (in thousands):
| 2010 | 2009 | |||||||
Gross domestic retained receivables | $ | 160,641 | $ | 36,583 | ||||
Securitized gross accounts receivable | 144,000 | — | ||||||
Residual interest in eligible receivables sold to the Facility | — | 33,184 | ||||||
Gross foreign receivables | 113,778 | 108,458 | ||||||
Total gross receivables | 418,419 | 178,225 | ||||||
Less allowance for doubtful accounts | (14,256 | ) | (14,764 | ) | ||||
Net accounts receivable | $ | 404,163 | $ | 163,461 | ||||
FleetCor Technologies, Inc. and Subsidiaries
Notes to Financial Statements (continued)
2. Summary of Significant Accounting Policies (continued)
| 2011 | 2010 | |||||||
Gross domestic retained receivables | $ | 84,087 | $ | 160,641 | ||||
Securitized gross accounts receivable | 280,000 | 144,000 | ||||||
Gross foreign receivables | 413,019 | 113,778 | ||||||
|
|
|
| |||||
Total gross receivables | 777,106 | 418,419 | ||||||
Less allowance for doubtful accounts | (15,315 | ) | (14,256 | ) | ||||
|
|
|
| |||||
Net accounts receivable | $ | 761,791 | $ | 404,163 | ||||
|
|
|
| |||||
A rollforward of the Company’s allowance for doubtful accounts related to accounts receivable for the years ended December 31 is as follows (in thousands):
| 2010 | 2009 | 2008 | 2011 | 2010 | 2009 | |||||||||||||||||||
Allowance for doubtful accounts beginning of year | $ | 14,764 | $ | 10,407 | $ | 6,180 | $ | 14,256 | $ | 14,764 | $ | 10,407 | ||||||||||||
Add: | ||||||||||||||||||||||||
Provision for bad debts | 18,883 | 32,593 | 34,924 | 19,226 | 18,883 | 32,593 | ||||||||||||||||||
Less: | ||||||||||||||||||||||||
Write-offs | (19,391 | ) | (28,236 | ) | (30,697 | ) | (18,167 | ) | (19,391 | ) | (28,236 | ) | ||||||||||||
|
|
| ||||||||||||||||||||||
Allowance for doubtful accounts end of year | $ | 14,256 | $ | 14,764 | $ | 10,407 | $ | 15,315 | $ | 14,256 | $ | 14,764 | ||||||||||||
|
|
| ||||||||||||||||||||||
All foreign receivables are Company owned receivables and are not included in the Company’s receivable securitization program. At December 31, 2011 and 2010, there was $280 million and $144 million, respectively, of short-term debt outstanding under the Company’s accounts receivable securitization facility.Securitization Facility.
Purchase of Receivables
The Company recorded a premium on the purchase of receivables, which represented the amount paid in excess of the fair value of the receivables at the time of purchase. This premium is included in other long-term assets in the Consolidated Balance Sheets and is being amortized over its remaining useful life. At December 31, 20102011 and 20092010, the remaining net premium on the purchase of receivables was $26.3$23.0 million and $29.5$26.3 million, respectively.
Advertising
The Company expenses advertising costs as incurred. Advertising expense waswere $8.9 million, $8.2 million $9.8 million and $6.4$9.8 million for the years ended December 31, 2011, 2010 2009 and 2008,2009, respectively.
Concentrations
During 2011 and 2010, one customer, a major oil company, accounted for approximately 11% of the Company’s consolidated revenue. Agreements with the major oil company partners typically have initial terms of five to ten years with current remaining terms ranging from less than one year up to ten years.
No single customer represented more than 10% of consolidated revenue in 2009 and 2008.2009.
Earnings Per Share
Basic earnings per share is calculated using the weighted average of common stock and non vested restricted shares outstanding, unadjusted for dilution, and net income is adjusted for preferred stock accrued dividends to arrive at income attributable to common shareholders (Note 15).shareholders.
Diluted earnings per share is calculated using the weighted average shares outstanding and contingently issuable shares less weighted average shares recognized during the period. The net outstanding shares have been adjusted for the dilutive effect of common stock equivalents, which consist of outstanding stock options and unvested restricted stock units, and warrants for certain periods.
FleetCor Technologies, Inc. and Subsidiaries
Notes to Financial Statements (continued)
2. Summary of Significant Accounting Policies (continued)
units.
Initial Public Offering
On December 20, 2010, the Company completed an initial public offering of its common stock and issued 430,961 common shares and received net proceeds of $9,560,000. Selling shareholders sold 14,145,289 common shares (including shares sold in connection with the Underwriter’s overallotment option, which was exercised on December 20, 2010), for which the Company received no proceeds from such sale. In connection with the initial public offering (i) all previously issued convertible preferred stock was converted into 43,575,148 shares of common stock, (ii) all cumulative dividends on the Company’s convertible preferred stock, except for a portion of the dividends related to the Series D-3 convertible preferred stock where holders received cash dividends of approximately $7.6 million, were forgiven, (iii) compensation expense of $23.0 million was recorded related to 1,930,972 shares of restricted stock and stock options which vested upon the closing of the initial public offering, and (iv) a two and one-half for one stock split was effected on November 29, 2010. All common share and per common share amounts within the consolidated financial statements and footnotes have been adjusted for all periods to reflect the stock split.
Recent Accounting PronouncementsReclassifications
In June 2009, the FASB issued guidance limiting the circumstances in which a financial asset may be derecognized when the transferor has not transferred the entire financial asset or has continuing involvement with the transferred asset. The concept of a qualifying special purpose-entity, which had previously facilitated sale accounting for certain asset transfers, was removed by this guidance. In addition, the guidance also shifts the determination of which enterprise should consolidate a variable interest entity (VIE) to a current control approach, such that an entity that has both the power to make decisions and the right to receive benefits or absorb losses that could potentially be significant to the VIE will consolidate a VIE. The guidance also requires ongoing assessments related to who should consolidate the VIE. These updates were effective as of January 1, 2010.
The Company analyzed the impact of the changes to the accounting guidance and concluded that it would consolidate Funding. The Company concluded it would consolidate this VIE because the Company maintains significant decision-making rights, owns a variable interest that could be potentially significant to the VIE, and receives all the benefits or is required to absorb all the losses of Funding. Accordingly, effective January 1, 2010, the Company consolidated Funding. Using the carrying amounts of the assets and liabilities of Funding as prescribed by the accounting guidance and any corresponding elimination of activity between Funding and the Company resulting from the consolidation on January 1, 2010, the Company recorded a $218 million increase in total assets, a $218 million increase in total liabilities and non-cash financing activities of $218 million.
Beginning January 1, 2010, the Company’s consolidated balance sheet and statement of income no longer reflect activity related to its retained residual interest in eligible accounts receivable sold to Funding, but instead reflect the activity related to its securitized accounts receivable and the corresponding securitized debt, including interest income, fees generated from late payments, provision for losses on accounts receivable and interest expense. Interest expense and the provision for losses on accounts receivable associated with the securitized accounts receivable are no longer included as a deduction from revenues, net in the consolidated statements of income, resulting in an increase of $27.2 million of revenues, net for the year ended December 31, 2010 compared to the year ended December 31, 2009. The cash flows from borrowings and repayments, associated with the securitized debt, are now presented as cash flows from financing activities. The Company’s consolidated statements of income and its consolidated balance sheets as of December 31, 2009 and 2008 have not been retrospectively adjusted to reflect the adoption of this accounting guidance. Therefore, current period results and balances will not be comparable toCertain prior period amounts particularly with regardhave been reclassified to accounts receivable,conform to the securitization facility, the provision for losses on accounts receivable, interest expense and revenues, net.
FleetCor Technologies, Inc. and Subsidiaries
Notes to Financial Statements (continued)
current period presentation.
2. SummaryAdoption of SignificantNew Accounting Policies (continued)Standards
On February 24, 2011, the Company extended the term of its asset securitization facility to February 23, 2012. The Company capitalized $0.6 million in deferred financing fees in connection with this extension.
Fair Value Measurements and Disclosures
In January 2010, the FASB issued ASUAccounting Standards Update (“ASU”) 2010-06,Improving “Improving Disclosures About Fair Value Measurements,, (ASU 2010-06)” which amends ASCAccounting Standards Codification (“ASC”) 820,Fair “Fair Value Measurements and Disclosures,,” to add new requirements for disclosures about transfers into and out of Levels 1 and 2 along with the reasons for the transfers, of the fair value hierarchy and separate disclosures about purchases, sales, issuances, and settlements relating to Level 3 measurements within the fair value hierarchy. This ASU also clarifies existing fair value disclosures about the level of disaggregation and about inputs and valuation techniques used to measure fair value. This ASU was effective for the Company beginning January 1, 2010, except for the requirements to provide the Level 3 activity of purchases, sales, issuance, and settlements, if any, which will bewere effective for the Company beginning January 1, 2011. See fair value disclosures at Note 3.Since ASU 2010-06 is a disclosure-only standard, its adoption had no impact on the Company’s results of operations, financial condition, or cash flows.
Multiple Revenue Arrangements
Pending Adoption of New Accounting Standards
Multiple-Deliverable Revenue Arrangements
In October 2009, the FASB issued ASU 2009-13,Multiple “Multiple Revenue Arrangements—a consensusConsensus of the FASB Emerging Issues Task Force (ASU 2009-13)Force” which will supersedesupersedes certain guidance in ASC 605-25,Revenue “Revenue Recognition-Multiple Element Arrangements,, (ASC 605-25)” and will requirerequires an entity to allocate arrangement consideration to all of its deliverables at the inception of an arrangement based on their relative selling prices (i.e., the relative-selling-price method). The use of the residual method of allocation will no longer be permitted in circumstances in which an entity recognized revenue for an arrangement with multiple deliverables subject to ASC 605-25. ASU 2009-13 will also requirerequires additional disclosures. The Company will adoptadopted the provisions of ASU 2009-13 beginning on January 1, 2011. Based on the Company’s current revenue arrangements, the adoption of ASU 2009-13 isdid not expected to have a material impact on the Company’s financial condition, results of operations, or cash flows.
Stock Based Compensation
Stock-Based Compensation
In April 2010, the FASB issued ASU 2010-13,Compensation-Stock “Compensation-Stock Compensation (Topic 718)—Effect of Denominating the Exercise Price of a Share-Based Payment Award in the Currency of the Market in Which the Underlying Equity Security Trades—a consensusConsensus of the FASB Emerging Issues Task Force (ASU 2010-13).Force.” ASU 2010-13 addresses whether an entity should classify a share-based payment award as equity or a liability if the award’s exercise price is denominated in the currency in which the underlying security trades and that currency is different from the 1)(1) entity’s functional currency, 2)(2) functional currency of the foreign operation for which the employee provides services, and 3)(3) payroll currency of the employee. Under the existing guidance in ASC 718-10,Compensation-Stock “Compensation-Stock Compensation,,” the Company does not classify any of its stock-based compensation as liabilities. ASU 2010-13 iswas effective for the Company beginning on January 1, 2011. However, theThe adoption of ASU 2010-13 isdoes not expected to change the Company’s current accounting for its stock-based compensation plansawards as equity awards since ASU 2010-13’s application contains an exception for share-based payments that, like the Company’s, use exercise prices denominated in the currency of the market in which substantial portions of the entity’s equity securities trade.
Business Combination Pro Forma Information
FleetCor Technologies, Inc.In December 2010, the FASB issued ASU 2010-29, “Business Combinations (ASC Topic 805): Disclosure of Supplementary Pro Forma Information for Business Combinations.” The amendments in this ASU affect any public entity as defined by ASC Topic 805 that enters into business combinations that are material on an individual or aggregate basis. The amendments in this ASU specify that if a public entity presents comparative financial statements, the entity should disclose revenue and Subsidiariesearnings of the combined entity as though the business combination(s) that occurred during the current year had occurred as of the beginning of the comparable prior annual reporting period only. The amendments also expand the supplemental pro forma disclosures to include a description of the nature and amount of material, nonrecurring pro forma adjustments directly attributable to the business combination included in the reported pro forma revenue and earnings. The amendments are effective prospectively for business combinations for which the acquisition date is on or after the beginning of the first annual reporting period beginning on or after December 15, 2010. Early adoption is permitted. The adoption of ASU 2010-29 did not have a material impact on the Company’s results of operations or financial condition.
NotesGoodwill Impairment Testing
In September 2011, the FASB issued ASU 2011-08, which gives entities testing goodwill for impairment the option of performing a qualitative assessment before calculating the fair value of a reporting unit in step 1 of the goodwill impairment test. If entities determine, on the basis of qualitative factors, that the fair value of the reporting unit is more likely than not less than the carrying amount, the two-step impairment testing would be required. Otherwise, further testing would not be needed. This ASU is effective for all entities for annual and interim goodwill impairment testing performed for fiscal years beginning after December 15, 2011, with early adoption permitted. The Company early adopted this guidance effective October 1, 2011, for certain reporting units, for purposes of our 2011 annual and goodwill impairment testing. The adoption of this standard did not have an impact on the Company’s financial condition, results of operations of cash flows.
Comprehensive Income Presentation
In September 2011, the FASB issued ASU 2011-05, which revises the manner in which entities present comprehensive income in their financial statements. The new guidance removes the presentation options in ASC 220 and requires entities to report components of comprehensive income in either (1) a continuous statement of comprehensive income or (2) two separate but consecutive statements. The ASU does not change the items that must be reported in other comprehensive income or when an item of other comprehensive income must be reclassified to net income. Also the earnings per share computations will not change and will continue to be
based on net income. This ASU is effective for fiscal years, and interim periods within those years, beginning after December 15, 2011. The Company adopted the ASU on December 31, 2011, using two separate statements of income and comprehensive income.
Goodwill with Zero or Negative Carrying Amounts
In December 2010, the FASB issued ASU 2010-28, which modifies Step 1 of the goodwill impairment test for reporting units with zero or negative carrying amounts. For those reporting units, an entity is required to perform Step 2 of the goodwill impairment test if it is more likely than not that a goodwill impairment exists. In determining whether it is more likely than not that a goodwill impairment exists, an entity should consider whether there are any adverse qualitative factors indicating that an impairment may exist. The qualitative factors are consistent with existing guidance which requires that goodwill of a reporting unit be tested for impairment between annual tests if an event occurs or circumstances change that would more likely than not reduce the fair value of a reporting unit below its carrying amount. The adoption of this standard did not have an impact on our financial position or results of operations because none of our reporting units have zero or negative carrying amounts.
Pending Adoption of Recently Issued Accounting Standards
From time to time, new accounting pronouncements are issued by the FASB or other standards setting bodies that are adopted by the Company as of the specified effective date. Unless otherwise discussed, the Company’s management believes that the impact of recently issued standards that are not yet effective will not have a material impact on the Company’s consolidated financial statements upon adoption.
Fair Value Measurement and Disclosure Requirements
In May 2011, the FASB issued ASU 2011-04, “Amendments to Achieve Common Fair Value Measurement and Disclosure Requirements in U.S. GAAP and IFRS,” which amends ASC 820, “Fair Value Measurement” to improve the comparability of fair value measurements presented and disclosed in financial statements prepared in accordance with GAAP and IFRS. The amendments in this update explain how to measure fair value. They do not require additional fair value measurements and are not intended to establish valuation standards or affect valuation practices outside of financial reporting. The amendments are effective for the Company beginning January 1, 2012 and are required to be applied prospectively, with early adoption not permitted. Since ASU 2011-04 is a disclosure-only standard, its adoption will not affect the Company’s results of operations, financial condition, or cash flows.
3. Fair Value Measurements
Accounting principles generally accepted in the U.S. define fair value as the price that would be received to sell an asset or transfer a liability in an orderly transaction between market participants.
As such, fair value is a market-based measurement that should be determined based on assumptions that market participants would use in pricing an asset or liability. The authoritative guidance discusses valuation techniques, such as the market approach (comparable market prices), the income approach (present value of future income or cash flow), and the cost approach (cost to replace the service capacity of an asset or replacement cost). These valuation techniques are based upon observable and unobservable inputs. Observable inputs reflect market data obtained from independent sources, while unobservable inputs reflect the Company’s market assumptions.
As the basis for evaluating such inputs, a three-tier value hierarchy prioritizes the inputs used in measuring fair value as follows:
Level 1: Observable inputs such as quoted prices for identical assets or liabilities in active markets.
Level 2: Observable inputs other than quoted prices that are directly or indirectly observable for the asset or liability, including quoted prices for similar assets or liabilities in active markets; quoted prices for similar or identical assets or liabilities in markets that are not active; and model-derived valuations whose inputs are observable or whose significant value drivers are observable.
Level 3: Unobservable inputs that reflect the reporting entity’s own assumptions.
The Company’s financial assets and liabilities adjusted to fair value at least quarterly are its money market fund investments included in cash and cash equivalents, and in prior years its residual interest in eligible receivables sold to the Facility included with net accounts receivable, and its derivative instruments, which are primarily included in accrued expenses. As the Company adjusts the value of its investments and derivative instruments to fair value each reporting period, no adjustment to retained earnings resulted from the adoption of the authoritative guidance on fair value in 2008. The Company determines the fair value of its money market fund investments based on quoted market prices. There were no financial assets and liabilities measured at fair value on a recurring basis as of December 31, 2011.
Level 2 fair value determinations are derived from directly or indirectly observable (market based) information. Such inputs are the basis for the fair values of the Company’s derivative instruments. The Company generally uses derivatives for hedging purposes pursuant to the relevant authoritative guidance, and the Company’s derivatives are interest rate swaps. There were no Level 2 assets which required fair value determinations at December 31, 2011 and 2010.
Level 3 fair value determinations are derived from the Company’s estimate of recovery based on historical collection trends. Activity related to Level 3 assets is not significant and as a result of the adoption of new accounting guidance effective January 1, 2010, thereThere were no Level 3 assets or liabilities which required fair value determinations.determinations at December 31, 2011 and 2010.
The Company determines the fair value of its derivative instruments based on Level 2 inputs in the fair value hierarchy.
FleetCor Technologies, Inc. and Subsidiaries
Notes to Financial Statements (continued)
3. Fair Value Measurements (continued)
The following tables present the Company’s financial assets and liabilities which are measured at fair values on a recurring basis and that are subject to the disclosure requirements of the authoritative guidance as of December 31, 2010 and 2009 (in millions):
Description | Fair Value | Level 1 | Level 2 | Level 3 | Fair Value | Level 1 | Level 2 | Level 3 | ||||||||||||||||||||||||
December 31, 2010 | ||||||||||||||||||||||||||||||||
Assets: | ||||||||||||||||||||||||||||||||
Money market fund investments | $ | 12.6 | $ | 12.6 | $ | — | $ | — | $ | 12.6 | $ | 12.6 | $ | — | $ | — | ||||||||||||||||
|
|
|
| |||||||||||||||||||||||||||||
Total | $ | 12.6 | $ | 12.6 | $ | — | $ | — | $ | 12.6 | $ | 12.6 | $ | — | $ | — | ||||||||||||||||
|
|
|
| |||||||||||||||||||||||||||||
December 31, 2009 | ||||||||||||||||||||||||||||||||
Assets: | ||||||||||||||||||||||||||||||||
Money market fund investments | $ | 14.7 | $ | 14.7 | $ | — | $ | — | ||||||||||||||||||||||||
Residual interest in eligible receivables sold to the Facility | 33.2 | — | — | 33.2 | ||||||||||||||||||||||||||||
Total | $ | 47.9 | $ | 14.7 | $ | — | $ | 33.2 | ||||||||||||||||||||||||
Liabilities: | ||||||||||||||||||||||||||||||||
Interest rate swaps | $ | 6.4 | $ | — | $ | 6.4 | $ | — | ||||||||||||||||||||||||
Total | $ | 6.4 | $ | — | $ | 6.4 | $ | — | ||||||||||||||||||||||||
On January 1, 2009, the Company adopted the provisions of the fair value measurement accounting and disclosure guidance related to nonfinancial assets and liabilities recognized or disclosed at fair value on a nonrecurring basis. The Company’s nonfinancial assets which are measured at fair value on a nonrecurring basis include property, plant and equipment, goodwill and other intangible assets. As necessary, the Company generally uses projected cash flows, discounted as necessary,appropriate under relevant guidance, to estimate the fair values of the assets using key inputs such as management’s projections of cash flows on a held-and-used basis (if applicable), management’s projections of cash flows upon disposition and discount rates. Accordingly, these fair value measurements fall in level 3 of the fair value hierarchy. These assets and certain liabilities are measured at fair value on a nonrecurring basis as part of the Company’s impairment assessments and as circumstances require.
At December 31, 2010, all interest rate swaps had matured.
4. Stock Transactions
Common Stock
On November 29, 2010, the Company amended its certificate of incorporation to increase the authorized common stock to 130,000,000 shares, retain the par value of $0.001 per share, and to provide for a two and one-half-for-one Common Stock split. All common share and per common share amounts within the consolidated
financial statements and footnotes have been adjusted for all periods to reflect the stock split. On December 20, 2010, the Company amended its certificate of incorporation to increase the authorized common stock to 475,000,000 shares and to retain the par value of $0.001 per share.
FleetCor Technologies, Inc. and Subsidiaries
Notes to Financial Statements (continued)
4. Stock Transactions (continued)
Preferred Stock
At December 31, 2009, Convertible Preferred Stock consisted of the following (proceeds and cumulative dividends in thousands):
Series | Date of Issuance | Gross Proceeds | Net Proceeds | Shares Issued | Cumulative Dividends at December 31, 2009 | |||||||||||||
D-1 through D-3 | June 29, 2005 | $ | — | $ | — | 5,865,785 | $ | 23,453 | ||||||||||
D-4 | June 29, 2005 | — | — | 5,769,231 | 18,678 | |||||||||||||
| September 7, 2006 | — | — | 575,854 | 1,368 | ||||||||||||||
| December 19, 2006 | — | — | 1,819,196 | 3,821 | ||||||||||||||
E | April 1, 2009 | 102,000 | 94,000 | 3,400,000 | 3,857 | |||||||||||||
|
| |||||||||||||||||
| $ | 51,177 | |||||||||||||||||
|
| |||||||||||||||||
All shares of preferred stock were converted to common stock upon the public offering during 2010 and the Company’s amended certificate of incorporation authorizing 25,000,000 shares of preferred stock with a par value of $0.001 per share.
Upon any conversion of shares of Series D and Series E Preferred Stock into shares of common stock, all unpaid accrued dividends are forgiven, except with respect to Series D-3 and Series E which could be converted into shares of common stock in a Public Offering. Upon this occurrence, with regard to Series D-3, the Company is obligated to pay three-eighths of all unpaid Series D-3 prior accruing dividends. With regard to Series E, the Company is obligated to convert at the greater of the Series E liquidation value divided by the offering price or $18 divided by the offering price if the public offering price is below a predetermined minimum value. Assuming the Series E Preferred Stock liquidation value is less than $18 per share (such per share amount as adjusted for the stock split, stock dividends and share combinations) at the time of a public offering, the Company would be obligated to issue 112.5, 11.25, 4.5, or 2.55 shares of common stock for each share of Series E Preferred Stock if the public offering price was $0.4, $4, $10$0.40, $4.00, $10.00 or $17.60 per common share, respectively. Upon conversion of the Series E Preferred Stock into shares of common stock, all unpaid accrued dividends are forgiven. Further, where the offering price is equal to or greater than $45$45.00 (such per share amount as adjusted for stock splits, stock dividends and share combinations), each share of Series E Preferred Stock is convertible into one share of common stock.
In the event of any liquidation, before payment of any amount shall be made in respect of any class or series of stock, the holder of each share of Series E Preferred Stock shall be entitled to the greater of the applicable initial liquidation preference or the amount per share that would have been payable if converted to common stock immediately prior to such liquidation. After the distribution to the holders of the Series E but before any payment of any amount shall be made in respect of the common stock, the holder of each share of Series D Preferred Stock shall be entitled to the greater of the applicable initial liquidation preference or the amount per share that would have been payable if converted to common stock immediately prior to such liquidation, plus any accrued unpaid dividends.
5. Share Based Compensation
The Company accounts for stock-based compensation pursuant to relevant authoritative guidance, which requires measurement of compensation cost for all stock awards at fair value on the date of grant and recognition of
compensation, net of estimated forfeitures, over the requisite service period for awards expected to vest.
FleetCor Technologies, Inc. and Subsidiaries
Notes to Financial Statements (continued)
5. Share Based Compensation (continued)
The Company has Stock Incentive Plans (the Plans) pursuant to which the Company’s board of directors may grant stock options or restricted stock to key employees. The Company is authorized to issue grants of restricted stock and stock options to purchase up to 26,963,150, shares for the year ended December 31, 201026,963,150 and 20,213,150 shares for the years ended December 31, 2011, 2010 and 2009, and 2008.respectively. There were 2,584,4862,139,799 additional options available for grant under the Plans at December 31, 2010.
Stock Options
Stock options are granted with an exercise price estimated to be greater than or equal to the fair market value on the date of grant. Options granted have vesting provisions ranging from two to six years. Stock option grants are generally subject to forfeiture if employment terminates prior to vesting. All options were granted at estimated fair market value as authorized by the Company’s board of directors.
Restricted Stock
Awards of restricted stock and restricted stock units are independent of stock option grants and are generally subject to forfeiture if employment terminates prior to vesting. Prior to the initial public offering, the vesting of the shares granted in 2010 were contingent on the sale of the Company or a public offering of the Company’s common stock, subject to certain other conditions.2011.
The table below summarizes the expense related to share-based payments for the years ended December 31 (in thousands):
| 2010 | 2009 | 2008 | 2011 | 2010 | 2009 | |||||||||||||||||||
Stock options | $ | 3,775 | $ | 2,666 | $ | 2,757 | $ | 9,654 | $ | 3,775 | $ | 2,666 | ||||||||||||
Restricted stock | 22,980 | — | 1 | 12,089 | 22,980 | — | ||||||||||||||||||
|
|
| ||||||||||||||||||||||
Stock-based compensation | $ | 26,755 | $ | 2,666 | $ | 2,758 | $ | 21,743 | $ | 26,755 | $ | 2,666 | ||||||||||||
|
|
| ||||||||||||||||||||||
The following table summarizes information abouttax benefits recorded on stock options outstanding at December 31, 2010 (shares in thousands):
Exercise Price | Options Outstanding | Weighted Average Remaining Vesting Life in Years | Options Exercisable | |||||||||
$0.15 | 161 | — | 161 | |||||||||
1.20 – 1.56 | 892 | — | 892 | |||||||||
2.00 – 2.31 | 1,233 | — | 1,233 | |||||||||
5.20 | 966 | — | 966 | |||||||||
6.55 | 175 | — | 175 | |||||||||
10.00 – 10.07 | 1,396 | 1.38 | 688 | |||||||||
12.00 – 14.00 | 1,669 | 0.99 | 1,025 | |||||||||
18.00 | 112 | 2.96 | 28 | |||||||||
20.00 | 443 | 4.28 | — | |||||||||
23.00 | 3,182 | 4.34 | — | |||||||||
| 10,229 | 5,168 | |||||||||||
FleetCor Technologies, Inc.based compensation were $7.2 million, $7.8 million and Subsidiaries
Notes to Financial Statements (continued)
5. Share Based Compensation (continued)
The fair value of stock option awards granted was estimated using the Black-Scholes option pricing model with the following weighted-average assumptions$0.6 million for the years ended December 31, as follows:
| 2010 | 2009 | 2008 | ||||||||||
Risk-free interest rate | 1.93 | % | 2.61 | % | 2.55 | % | ||||||
Dividend yield | — | — | — | |||||||||
Expected volatility | 44.53 | % | 31.14 | % | 29.27 | % | ||||||
Expected life (in years) | 4.19 | 3.33 | 3.72 | |||||||||
The Company considered the retirement2011, 2010 and forfeiture provisions of the options and utilized its historical experience to estimate the expected life of the options.2009, respectively.
We estimate the volatility of the share price of the Company’s common stock by considering the historical volatility of the stock of similar public entities. In determining the appropriateness of the public entities included in the volatility assumption we considered a number of factors, including the entity’s life cycle stage, size, financial leverage, and products offered.
The following summarizes the changes in the number of shares of common stock under option for the following periods (shares and aggregate intrinsic value in thousands):
| Shares | Weighted Average Exercise Price | Options Exercisable at End of Year | Weighted Average Exercise Price of Exercisable Options | Weighted Average Fair Value of Options Granted During the Year | Aggregate Intrinsic Value | |||||||||||||||||||
Outstanding at December 31, 2007 | 6,905 | $ | 4.75 | 3,345 | 2.80 | $ | 91,507 | |||||||||||||||||
Granted | 1,513 | 14.00 | $ | 3.62 | ||||||||||||||||||||
Exercised | (398 | ) | 1.19 | 6,672 | ||||||||||||||||||||
Forfeited | (425 | ) | 8.80 | |||||||||||||||||||||
Outstanding at December 31, 2008 | 7,595 | 6.55 | 4,375 | 3.82 | 76,629 | |||||||||||||||||||
Granted | 1,375 | 11.46 | 2.96 | |||||||||||||||||||||
Exercised | (215 | ) | 1.23 | 3,608 | ||||||||||||||||||||
Forfeited | (693 | ) | 7.42 | |||||||||||||||||||||
Outstanding at December 31, 2009 | 8,062 | 7.45 | 5,523 | 5.15 | 70,958 | |||||||||||||||||||
Granted | 3,724 | 22.56 | 9.19 | |||||||||||||||||||||
Exercised | (143 | ) | 5.04 | 3,697 | ||||||||||||||||||||
Forfeited | (729 | ) | 11.95 | |||||||||||||||||||||
Tendered | (685 | ) | 5.63 | |||||||||||||||||||||
Outstanding at December 31, 2010 | 10,229 | 12.79 | 5,168 | 6.06 | 128,472 | |||||||||||||||||||
Vested and expected to vest at December 31, 2010 | 10,229 | $ | 12.79 | |||||||||||||||||||||
The weighted-average remaining contractual life for options outstanding was 1.92 years as of December 31, 2010.
FleetCor Technologies, Inc. and Subsidiaries
Notes to Financial Statements (continued)
5. Share Based Compensation (continued)
The following table summarizes the changes in the number of shares of restricted stock and restricted stock units for the following periods (shares in thousands):
| Shares | Weighted Average Grant Date Fair Value | |||||||
Outstanding at December 31, 2007 | 3,145 | $ | 1.87 | |||||
Granted | 80 | 14.00 | ||||||
Outstanding at December 31, 2008 | 3,225 | 2.17 | ||||||
Granted | 853 | 11.35 | ||||||
Cancelled | (63 | ) | 14.00 | |||||
Outstanding at December 31, 2009 | 4,015 | 4.41 | ||||||
Granted | 1,475 | 22.68 | ||||||
Cancelled | (263 | ) | 15.24 | |||||
Sold/issued | (3,977 | ) | 4.40 | |||||
Outstanding at December 31, 2010 | 1,250 | $ | 21.93 | |||||
The following table summarizes the Company’s total unrecognized compensation cost related to stock-based compensation as of December 31, 2010 (in millions):2011:
| Unrecognized Compensation Cost | Weighted Average Period of Expense Recognition (in Years) | Unrecognized Compensation Cost | Weighted Average Period of Expense Recognition (in Years) | |||||||||||||
Stock options | $ | 33.4 | 3.30 | $ | 25,765 | 1.97 | ||||||||||
Restricted stock | 21.4 | — | 15,102 | 1.88 | ||||||||||||
| ||||||||||||||||
Total | $ | 54.8 | $ | 40,867 | ||||||||||||
| ||||||||||||||||
In connection with making fair value estimates related to the Company’s stock option and restricted stock grants prior to the initial public offering, management considered various factors including third-party equity transactions and certain commonly used valuation techniques. The Company sold convertible preferred stock to third parties in 2005, 2006 and 2009. In addition, in 2007 the Company repurchased common stock and preferred stock from the holders at a negotiated value which the Company believed represented fair value. These third-party transactions served as a basis for determining the fair value of our common stock at various dates. In situations where the Company sold preferred stock that included conversion and dividend features the Company considered such features in those instruments and the fact that such instruments could not be freely traded in determining a fair value for its common stock. Generally, the Company concluded that the fair value of its common stock was 10% to 25% less than the preferred stock at the date of such third-party transactions due to the features attributable to the preferred stock holders. In periods prior to third-party transactions and in intervening periods subsequent to the third-party transactions the Company utilized various earnings and revenue multiples to estimate the fair value of its common stock or to serve as an additional factor in determining fair value.
FleetCor Technologies, Inc. and SubsidiariesStock Options
NotesStock options are granted with an exercise price estimated to be equal to the fair market value on the date of grant, as authorized by the Company’s board of directors. Options granted have vesting provisions ranging from one to six years. Stock option grants are generally subject to forfeiture if employment terminates prior to vesting. The Company issues new shares upon stock option exercises.
The following summarizes the changes in the number of shares of common stock under option for the following periods (shares and aggregate intrinsic value in thousands):
| Shares | Weighted Average Exercise Price | Options Exercisable at End of Year | Weighted Average Exercise Price of Exercisable Options | Weighted Average Fair Value of Options Granted During the Year | Aggregate Intrinsic Value | |||||||||||||||||||
Outstanding at December 31, 2008 | 7,595 | $ | 6.55 | 4,375 | $ | 3.82 | $ | 76,629 | ||||||||||||||||
Granted | 1,375 | 11.46 | $ | 2.96 | ||||||||||||||||||||
Exercised | (215 | ) | 1.23 | 3,608 | ||||||||||||||||||||
Forfeited | (693 | ) | 7.42 | |||||||||||||||||||||
|
|
|
|
|
|
|
|
|
|
|
| |||||||||||||
Outstanding at December 31, 2009 | 8,062 | 7.45 | 5,523 | 5.15 | 70,958 | |||||||||||||||||||
Granted | 3,724 | 22.56 | 9.19 | |||||||||||||||||||||
Exercised | (143 | ) | 5.04 | 3,697 | ||||||||||||||||||||
Forfeited | (729 | ) | 11.95 | |||||||||||||||||||||
Tendered | (685 | ) | 5.63 | |||||||||||||||||||||
|
|
|
|
|
|
|
|
|
|
|
| |||||||||||||
Outstanding at December 31, 2010 | 10,229 | 12.79 | 5,168 | 6.06 | 128,472 | |||||||||||||||||||
Granted | 526 | 30.56 | 9.72 | |||||||||||||||||||||
Exercised | (2,008 | ) | 4.51 | 50,921 | ||||||||||||||||||||
Forfeited | (406 | ) | 20.96 | |||||||||||||||||||||
|
|
|
|
|
|
|
|
|
|
|
| |||||||||||||
Outstanding at December 31, 2011 | 8,341 | $ | 15.51 | 4,394 | $ | 10.13 | $ | 119,802 | ||||||||||||||||
|
| |||||||||||||||||||||||
Vested and expected to vest at December 31, 2011 | 8,341 | $ | 15.51 | |||||||||||||||||||||
The following table summarizes information about stock options outstanding at December 31, 2011 (shares in thousands):
Exercise Price | Options Outstanding | Weighted Average Remaining Vesting Life in Years | Options Exercisable | |||||||||
$0.15 | 52 | — | 52 | |||||||||
1.20 – 1.56 | 176 | — | 176 | |||||||||
2.00 – 2.31 | 810 | — | 810 | |||||||||
5.20 | 705 | — | 705 | |||||||||
6.55 | 13 | — | 13 | |||||||||
10.00 – 10.07 | 1,224 | 0.69 | 792 | |||||||||
12.00 – 14.00 | 1,504 | 0.22 | 1,225 | |||||||||
18.00 | 108 | 1.96 | 52 | |||||||||
20.00 | 414 | 3.31 | 81 | |||||||||
23.00 | 2,809 | 3.31 | 419 | |||||||||
27.37 – 27.83 | 136 | 3.82 | — | |||||||||
29.00 – 29.90 | 227 | 3.13 | 53 | |||||||||
33.49 – 34.72 | 163 | 3.65 | 16 | |||||||||
|
|
|
| |||||||||
| 8,341 | 4,394 | |||||||||||
|
|
|
| |||||||||
The aggregate intrinsic value of options exercisable at December 31, 2011 was $86.8 million. The weighted average remaining contractual term of options exercisable at December 31, 2011 was 5.5 years.
The fair value of stock option awards granted was estimated using the Black-Scholes option pricing model with the following weighted-average assumptions for the years ended December 31 as follows:
| 2011 | 2010 | 2009 | ||||||||||
Risk-free interest rate | 1.47 | % | 1.93 | % | 2.61 | % | ||||||
Dividend yield | — | — | — | |||||||||
Expected volatility | 37.83 | % | 44.53 | % | 31.14 | % | ||||||
Expected life (in years) | 4.03 | 4.19 | 3.33 | |||||||||
The Company considered the retirement and forfeiture provisions of the options and utilized its historical experience to estimate the expected life of the options.
We estimate the volatility of the share price of the Company’s common stock by considering the historical volatility of the stock of similar public entities. In determining the appropriateness of the public entities included in the volatility assumption we considered a number of factors, including the entity’s life cycle stage, size, financial leverage, and products offered.
The risk-free interest rate is based on the yield of a zero coupon U.S. Treasury security with a maturity equal to the expected life of the option from the date of the grant. The Company estimates the volatility of the share price of the Company’s common stock by considering the historical volatility of the stock of similar public entities. In determining the appropriateness of the public entities included in the volatility assumption the Company considered a number of factors, including the entity’s life cycle stage, size, financial leverage, and products offered.
The weighted-average remaining contractual life for options outstanding was 7.0 and 7.25 years at December 31, 2011 and 2010, respectively.
Restricted Stock
Awards of restricted stock and restricted stock units are independent of stock option grants and are generally subject to forfeiture if employment terminates prior to vesting. Prior to the Company’s initial public offering, the vesting of the shares granted in 2010 were contingent on the sale of the Company or a public offering of the Company’s common stock, subject to certain other conditions. The vesting of the shares granted in 2011 and 2010 are generally based on the passage of time, performance or market conditions. Shares vesting based on the passage of time have vesting provisions ranging from one to six years. The fair value of restricted stock shares based on performance is based on the grant date fair value of the Company’s stock.
The fair value of restricted stock shares based on market conditions was estimated using the Monte Carlo option pricing model with the following assumptions during 2011.
| 2011 | ||||
Risk-free interest rate | 1.25 | % | ||
Dividend yield | — | |||
Expected volatility | 37.00 | % | ||
Expected life (in years) | 0.63 | |||
The risk-free interest rate and volatility assumptions were calculated consistently with those applied in the Black-Scholes options pricing model utilized in determining the fair value of the stock option awards.
The following table summarizes the changes in the number of shares of restricted stock and restricted stock units for the following periods (shares in thousands):
| Shares | Weighted Average Grant Date Fair Value | |||||||
Outstanding at December 31, 2008 | 3,225 | 2.17 | ||||||
Granted | 853 | 11.35 | ||||||
Cancelled | (63 | ) | 14.00 | |||||
|
|
|
| |||||
Outstanding at December 31, 2009 | 4,015 | 4.41 | ||||||
Granted | 1,475 | 22.68 | ||||||
Cancelled | (263 | ) | 15.24 | |||||
Sold/issued | (3,977 | ) | 4.40 | |||||
|
|
|
| |||||
Outstanding at December 31, 2010 | 1,250 | $ | 21.93 | |||||
Granted | 261 | 31.08 | ||||||
Cancelled | (50 | ) | 21.00 | |||||
Sold/issued | (621 | ) | 23.12 | |||||
|
|
|
| |||||
Outstanding at December 31, 2011 | 840 | $ | 23.15 | |||||
|
|
|
| |||||
6. Acquisitions
2011 Acquisitions
During 2011, the Company completed several foreign acquisitions with an aggregate purchase price of $333.8 million, net of cash acquired.
Allstar Business Solutions Limited
On December 13, 2011, the Company acquired all of the outstanding stock of Allstar Business Solutions Limited (Allstar) in the United Kingdom. The purpose of the transaction was to expand the Company’s European commercial fleet card offerings. The results of Allstar are included in the Company’s consolidated financial statements from the date of the acquisition. The total consideration for this acquisition was £200 million or approximately $312 million, including amounts applied at the closing to the repayment of Allstar’s debt. The consideration for the transaction was paid using FleetCor’s existing cash and credit facilities.
The following unaudited pro forma statements of income for the years ended December 31, 2011 and 2010 have been prepared to give effect to the Allstar acquisition described above assuming that it occurred on January 1 of each fiscal year presented. The pro forma statements of income are presented for illustrative purposes only and are not necessarily indicative of the results of operations that would have been obtained had this transaction actually occurred at the beginning of the periods presented, nor do they intend to be a projection of future results of operations. The pro forma statements of income have been prepared from the Company’s and Allstar’s historical audited consolidated statements of income for the years ended December 31, 2011 and 2010.
The pro forma information is based on estimates and assumptions that have been made solely for purposes of developing such pro forma information, including without limitations, purchase accounting adjustments. The pro forma financial information presented below also includes depreciation and amortization based on the valuation of Allstar’s tangible and intangible assets resulting from the acquisition. The pro forma financial information does not include any synergies or operating cost reductions that may be achieved from the combined operations.
| Pro forma statements of income for the year ended December 31 (unaudited) (in thousands except per share data) | ||||||||
| 2011 | 2010 | |||||||
Income statement data: | ||||||||
Revenues, net | $ | 595,864 | $ | 505,287 | ||||
Income before income taxes | 223,251 | 162,153 | ||||||
Net income | 156,430 | 115,496 | ||||||
Earnings per share: | ||||||||
Basic | $ | 1.94 | $ | 3.22 | ||||
Diluted | 1.87 | 1.43 | ||||||
Weighted average shares outstanding: | ||||||||
Basic | 80,610 | 35,434 | ||||||
Diluted | 83,654 | 80,751 | ||||||
The following table summarizes the preliminary allocation of the purchase price for Allstar (in thousands):
Trade and other receivables | $ | 253,628 | ||
Prepaid expenses and other | 139 | |||
Property and equipment | 601 | |||
Goodwill | 172,898 | |||
Other intangible assets | 82,053 | |||
Notes and other liabilities assumed | (177,004 | ) | ||
Deferred tax liabilities | (20,485 | ) | ||
|
| |||
Purchase price | $ | 311,830 | ||
|
|
The allocation of purchase price is preliminary due to the timing of the acquisition and our fiscal year end. Goodwill recognized is comprised primarily of expected synergies from combining the operations of the Company and Allstar. Included within goodwill is $20.5 million of deferred income tax liabilities recorded as part of the purchase price allocation. The goodwill acquired with this business is not deductible for tax purposes.
Mexican Prepaid FuelCard and Food Voucher business
In August 2011, the Company acquired all of the stock of a prepaid fuel card and food voucher company in Mexico. The acquired company provides fuel and food card/voucher services to businesses and governmental entities in Mexico and serves over 10,000 businesses, with over 800,000 cardholders and beneficiaries. Purchases are predominately prepaid and revenues are earned both from customers and merchants. Results from the acquired Mexico business are reported in our International segment. This business acquisition was not material to our consolidated financial statements and accordingly, we have not provided pro forma information relating to this acquisition. The goodwill acquired with this business is not deductible for tax purposes.
At December 31, 2011, approximately $237 million of the Company’s goodwill is deductible for tax purposes. The Company incurred acquisition related costs of $2.3 million in 2011, which are included within general and administrative expenses in the Consolidated Statements of Income. These acquisitions did not materially affect revenues and earnings during 2011.
2010 Acquisitions
During 2010, the Company completed several foreign acquisitions with an aggregate purchase price of $11.2 million.
The following table summarizes the allocation of the purchase price for the acquisitions during 2010 (in thousands):
Trade and other receivables | $ | 914 | ||
Prepaid expenses and other | 5,378 | |||
Property and equipment | 70 | |||
Goodwill | 11,330 | |||
Other intangible assets | 13,502 | |||
Notes and other liabilities assumed | (20,361 | ) | ||
|
| |||
Purchase price | $ | 10,833 | ||
|
|
The purchase price is net of cash and cash equivalents acquired totaling $1.9 million. Included within goodwill is $1.5 million of deferred income tax liabilities recorded as part of the purchase price allocation.
Intangible assets allocated in connection with the purchase price allocations consisted of the following (in thousands):
| Weighted Average Useful Lives (in Years) | 2010 Acquisitions | |||||||
Customer relationships | 9 – 20 | $ | 11,461 | |||||
Merchant network | 5 – 15 | 2,041 | ||||||
|
| |||||||
| $ | 13,502 | |||||||
|
| |||||||
2009 Acquisitions
CLC Group, Inc. and Subsidiaries
On April 1, 2009, the Company acquired all of the outstanding stock of CLC Group, Inc. and Subsidiaries (CLC). The purpose of the transaction was to expand the Company’s service offerings to include lodging and transportation management services. The results of CLC are included in the Company’s consolidated financial statements from the date of the acquisition. The total consideration for this acquisition was $169.1 million, consisting of cash paid of $161.1 million and the issuance of $8 million of Series E Preferred Stock.
On August 13, 2009, the Company acquired all of the outstanding stock of ReD Fuel Cards (Europe) Limited (ReD). The purpose of the transaction was to expand the Company’s European commercial fleet card offerings. The results of ReD are included in the Company’s consolidated financial statements from the date of the acquisition. The total consideration for this acquisition was cash of $62.9 million.
The following table summarizes the allocation of the purchase price for the acquisitions for the years ended December 31, 2010 and 2009 (in thousands):
| 2010 Acquisitions | 2009 Acquisitions | |||||||
Trade and other receivables | $ | 914 | $ | 40,072 | ||||
Prepaid expenses and other | 5,378 | 6,708 | ||||||
Property and equipment | 70 | 6,793 | ||||||
Goodwill | 11,330 | 182,899 | ||||||
Other intangible assets | 13,502 | 99,820 | ||||||
Notes and other liabilities assumed | (20,361 | ) | (103,855 | ) | ||||
Purchase price | $ | 10,833 | $ | 232,437 | ||||
The purchase price is net of cash and cash equivalents acquired totaling $1.9 million and $3.0 million for the 2010 and 2009 acquisitions, respectively. Included within goodwill, are $1.5 million and $39.2 million, respectively, of deferred income tax liabilities recorded as part of the purchase price allocation. At December 31, 2010, approximately $237 million of the Company’s goodwill is deductible for tax purposes.
Intangible assets allocated in connection with the purchase price allocations consisted of the following (in thousands):
| Weighted Average Useful Lives (in Years) | 2010 Acquisitions | 2009 Acquisitions | ||||||||||
Customer relationships | 9 – 20 | $ | 11,461 | $ | 80,863 | |||||||
Trade names and trademarks—indefinite | N/A | — | 5,926 | |||||||||
Merchant network | 5 – 15 | 2,041 | 7,930 | |||||||||
Non compete agreements | 2 – 5 | — | 581 | |||||||||
Software | 3 – 10 | — | 4,520 | |||||||||
| $ | 13,502 | $ | 99,820 | |||||||||
FleetCor Technologies, Inc. and Subsidiaries
Notes to Financial Statements (continued)
6. Acquisitions (continued)
The following unaudited pro forma statements of income for the years ended December 31, 2009 and 2008 have been prepared to give effect to the CLC acquisition described above assuming that it occurred on January 1 of each fiscal year presented. The pro forma statements of income are presented for illustrative purposes only and are not necessarily indicative of the results of operations that would have been obtained had this transaction actually occurred at the beginning of the periods presented, nor do they intend to be a projection of future results of operations. The pro forma statements of income have been prepared from the Company’s and CLC’s historical audited consolidated statements of income for the years ended December 31, 2009 and 2008.
The pro forma information is based on estimates and assumptions that have been made solely for purposes of developing such pro forma information, including without limitations, purchase accounting adjustments. The pro forma financial information presented below also includes depreciation and amortization based on the valuation of CLC’s tangible and intangible assets resulting from the acquisition. The pro forma financial information does not include any synergies or operating cost reductions that may be achieved from the combined operations.
| Pro forma statements of income for the year ended December 31 (unaudited) (in thousands except per share data) | Pro forma statements of income for the year ended December 31 (unaudited) (in thousands except per share data) | |||||||||||||||
| 2009 | 2008 | 2010 | 2009 | |||||||||||||
Income statement data: | ||||||||||||||||
Revenues, net | $ | 370,381 | $ | 399,668 | $ | 433,841 | $ | 370,381 | ||||||||
Income before income taxes | 137,092 | 159,828 | 151,280 | 137,092 | ||||||||||||
Net income | 93,413 | 112,225 | 107,896 | 93,413 | ||||||||||||
Earnings per share: | ||||||||||||||||
Basic | $ | 2.33 | $ | 2.97 | $ | 3.00 | $ | 2.33 | ||||||||
Diluted | 1.15 | 1.40 | 1.34 | 1.15 | ||||||||||||
Weighted average shares outstanding: | ||||||||||||||||
Basic | 33,802 | 33,033 | 35,434 | 33,802 | ||||||||||||
Diluted | 80,979 | 80,413 | 80,751 | 80,979 | ||||||||||||
ReD Fuel Cards (Europe)
On August 13, 2009, the Company acquired all of the outstanding stock of ReD Fuel Cards (Europe) Limited (ReD). The purpose of the transaction was to expand the Company’s European commercial fleet card offerings. The results of ReD are included in the Company’s consolidated financial statements from the date of the acquisition. The total consideration for this acquisition was cash of $62.9 million.
The following table summarizes the allocation of the purchase price for all acquisitions during 2009 (in thousands):
Trade and other receivables | $ | 40,072 | ||
Prepaid expenses and other | 6,708 | |||
Property and equipment | 6,793 | |||
Goodwill | 182,899 | |||
Other intangible assets | 99,820 | |||
Notes and other liabilities assumed | (103,855 | ) | ||
|
| |||
Purchase price | $ | 232,437 | ||
|
|
The purchase price is net of cash and cash equivalents acquired totaling $3.0 million. Included within goodwill is $39.2 million of deferred income tax liabilities recorded as part of the purchase price allocation.
Intangible assets allocated in connection with the purchase price allocations in 2009 consisted of the following (in thousands):
| Weighted Average Useful Lives (in Years) | 2009 Acquisitions | |||||||
Customer relationships | 9 – 20 | $ | 80,863 | |||||
Trade names and trademarks—indefinite | N/A | 5,926 | ||||||
Merchant network | 5 – 15 | 7,930 | ||||||
Non compete agreements | 2 – 5 | 581 | ||||||
Software | 3 – 10 | 4,520 | ||||||
|
| |||||||
| $ | 99,820 | |||||||
|
| |||||||
7. Goodwill and Other Intangible Assets
Other intangible assets consisted of the following at December 31 (in thousands):
| 2010 | 2009 | |||||||||||||||||||||||||
| Useful Lives (Years) | Gross Carrying Amounts | Accumulated Amortization | Net Carrying Amount | Gross Carrying Amounts | Accumulated Amortization | Net Carrying Amount | ||||||||||||||||||||
Customer and vendor agreements | 5 to 20 | $ | 218,250 | $ | (43,184 | ) | $ | 175,066 | $ | 204,617 | $ | (27,741 | ) | $ | 176,876 | |||||||||||
Trade names and trademarks—indefinite lived | N/A | 12,626 | — | 12,626 | 12,626 | — | 12,626 | |||||||||||||||||||
Trade names and trademarks—other | 3 to 15 | 3,160 | (980 | ) | 2,180 | 3,160 | (754 | ) | 2,406 | |||||||||||||||||
Software | 3 to 10 | 5,530 | (2,283 | ) | 3,247 | 5,530 | (1,111 | ) | 4,419 | |||||||||||||||||
Non compete agreements | 2 to 5 | 1,871 | (1,129 | ) | 742 | 1,871 | (768 | ) | 1,103 | |||||||||||||||||
Total other intangibles | $ | 241,437 | $ | (47,576 | ) | $ | 193,861 | $ | 227,804 | $ | (30,374 | ) | $ | 197,430 | ||||||||||||
FleetCor Technologies, Inc. and Subsidiaries
Notes to Financial Statements (continued)
7. Goodwill and Other Intangible Assets (continued)
Amortization expense related to intangible assets for the years ended December 31, 2010, 2009, and 2008 was $17.2 million, $13.9 million, and $12.0 million, respectively.
The future estimated amortization of intangibles at December 31, 2010 is as follows (in thousands):
2011 | $ | 17,863 | ||
2012 | 17,664 | |||
2013 | 17,251 | |||
2014 | 16,209 | |||
2015 | 15,884 | |||
Thereafter | 96,364 |
A summary of changes in the Company’s goodwill by reportable business segment is as follows (in thousands):
| December 31, 2009 | Acquisitions | Purchase Price Adjustments | Foreign Currency | December 31, 2010 | December 31, 2010 | Acquisitions | Purchase Price Adjustments | Foreign Currency | December 31, 2011 | |||||||||||||||||||||||||||||||
Segment | ||||||||||||||||||||||||||||||||||||||||
North America | $ | 274,929 | $ | — | $ | 1,000 | $ | — | $ | 275,929 | $ | 275,929 | $ | — | $ | 785 | $ | — | $ | 276,714 | ||||||||||||||||||||
International | 315,407 | 1,514 | 9,150 | (334 | ) | 325,737 | 325,737 | 225,733 | (4,687 | ) | 52 | 546,835 | ||||||||||||||||||||||||||||
|
|
|
|
| ||||||||||||||||||||||||||||||||||||
| $ | 590,336 | $ | 1,514 | $ | 10,150 | $ | (334 | ) | $ | 601,666 | $ | 601,666 | $ | 225,733 | $ | (3,902 | ) | $ | 52 | $ | 823,549 | |||||||||||||||||||
|
|
|
|
| ||||||||||||||||||||||||||||||||||||
| December 31, 2008 | Acquisitions | Purchase Price Adjustments | Foreign Currency | December 31, 2009 | December 31, 2009 | Acquisitions | Purchase Price Adjustments | Foreign Currency | December 31, 2010 | |||||||||||||||||||||||||||||||
Segment | ||||||||||||||||||||||||||||||||||||||||
North America | $ | 153,033 | $ | 120,353 | $ | 1,543 | $ | — | $ | 274,929 | $ | 274,929 | $ | — | $ | 1,000 | $ | — | $ | 275,929 | ||||||||||||||||||||
International | 254,404 | 53,255 | 6,572 | 1,176 | 315,407 | 315,407 | 1,514 | 9,150 | (334 | ) | 325,737 | |||||||||||||||||||||||||||||
|
|
|
|
| ||||||||||||||||||||||||||||||||||||
| $ | 407,437 | $ | 173,608 | $ | 8,115 | $ | 1,176 | $ | 590,336 | $ | 590,336 | $ | 1,514 | $ | 10,150 | $ | (334 | ) | $ | 601,666 | ||||||||||||||||||||
|
|
|
|
| ||||||||||||||||||||||||||||||||||||
Goodwill adjustments in 2011 represent earnouts of $0.8 million and other adjustments of $4.7 million related to prior year foreign acquisitions. Goodwill adjustments in 2010 represent earnouts of $1.0 million related to acquisitions in 2005, plusand other adjustments of $9.2 million related to prior year foreign acquisitions. Goodwill adjustments in 2009 represent earnouts
Other intangible assets consisted of $1.5 millionthe following at December 31 (in thousands):
| 2011 | 2010 | |||||||||||||||||||||||||
| Useful Lives (Years) | Gross Carrying Amounts | Accumulated Amortization | Net Carrying Amount | Gross Carrying Amounts | Accumulated Amortization | Net Carrying Amount | ||||||||||||||||||||
Customer and vendor agreements | 5 to 20 | $ | 336,839 | $ | (61,110 | ) | $ | 275,729 | $ | 218,250 | $ | (43,184 | ) | $ | 175,066 | |||||||||||
Trade names and trademarks—indefinite lived | N/A | 18,626 | — | 18,626 | 12,626 | — | 12,626 | |||||||||||||||||||
Trade names and trademarks—other | 3 to 15 | 3,160 | (1,200 | ) | 1,960 | 3,160 | (980 | ) | 2,180 | |||||||||||||||||
Software | 3 to 10 | 5,530 | (3,383 | ) | 2,147 | 5,530 | (2,283 | ) | 3,247 | |||||||||||||||||
Non compete agreements | 2 to 5 | 2,471 | (1,473 | ) | 998 | 1,871 | (1,129 | ) | 742 | |||||||||||||||||
|
|
|
|
|
|
|
|
|
|
|
| |||||||||||||||
Total other intangibles | $ | 366,626 | $ | (67,166 | ) | $ | 299,460 | $ | 241,437 | $ | (47,576 | ) | $ | 193,861 | ||||||||||||
|
|
|
|
|
|
|
|
|
|
|
| |||||||||||||||
Amortization expense related to acquisitions in 2004intangible assets for the years ended December 31, 2011, 2010, and 2005, plus adjustments2009 was $19.6 million, $17.2 million, and $13.9 million, respectively.
The future estimated amortization of $6.6 million related to prior year foreign acquisitions.intangibles at December 31, 2011 is as follows (in thousands):
2012 | $ | 28,673 | ||
2013 | 28,260 | |||
2014 | 27,188 | |||
2015 | 26,858 | |||
2016 | 26,051 | |||
Thereafter | 143,804 |
8. Property, Plant and Equipment
Property, plant and equipment, net consisted of the following at December 31 (in thousands):
| Estimated Useful Lives (in Years) | 2010 | 2009 | ||||||||||
Computer hardware and software | 3 to 7 | $ | 65,419 | $ | 55,255 | |||||||
Card-reading equipment | 5 | 6,695 | 8,316 | |||||||||
Furniture, fixtures, and vehicles | 3 to 6 | 5,619 | 4,269 | |||||||||
Buildings and improvements | 10 to 30 | 5,280 | 4,251 | |||||||||
Less: accumulated depreciation | 83,013 | 72,091 | ||||||||||
Property, plant and equipment, net | (56,195 | ) | (44,868 | ) | ||||||||
| $ | 26,818 | $ | 27,223 | |||||||||
FleetCor Technologies, Inc. and Subsidiaries
Notes to Financial Statements (continued)
8. Property, Plant and Equipment (continued)
| Estimated Useful Lives (in Years) | 2011 | 2010 | ||||||||
Computer hardware and software | 3 to 7 | $ | 72,920 | $ | 65,419 | |||||
Card-reading equipment | 5 | 6,960 | 6,695 | |||||||
Furniture, fixtures, and vehicles | 3 to 6 | 5,236 | 5,619 | |||||||
Buildings and improvements | 10 to 30 | 8,264 | 5,280 | |||||||
|
|
|
| |||||||
Property, plant and equipment, gross | 93,380 | 83,013 | ||||||||
Less: accumulated depreciation | (60,656 | ) | (56,195 | ) | ||||||
|
|
|
| |||||||
Property, plant and equipment, net | $ | 32,724 | $ | 26,818 | ||||||
|
|
|
| |||||||
Depreciation expense related to property and equipment for the years ended December 31, 2011, 2010, and 2009 and 2008 was $11.5 million, $11.3 million, $9.6 million, and $8.6$9.6 million, respectively. Depreciation expense includes $4.1 million, $3.9 million, $3.7 million, and $3.4$3.7 for capitalized computer software costs for the years ended December 31, 2011, 2010, 2009, and 2008,2009, respectively. At December 31, 20102011 and 2009,2010, the Company had unamortized computer software costs of $11.4$13.8 million and $10.6$11.4 million, respectively.
9. Accrued Expenses
Accrued expenses consisted of the following at December 31 (in thousands):
| 2010 | 2009 | 2011 | 2010 | |||||||||||||
Accrued bonuses | $ | 4,397 | $ | 3,759 | $ | 6,120 | $ | 4,397 | ||||||||
Accrued interest | 580 | 1,267 | 77 | 580 | ||||||||||||
Accrued taxes | 26,333 | 16,502 | 10,256 | 26,333 | ||||||||||||
Interest rate swap | — | 6,383 | ||||||||||||||
Other | 17,866 | 18,835 | 25,789 | 17,866 | ||||||||||||
|
| |||||||||||||||
| $ | 49,176 | $ | 46,746 | $ | 42,242 | $ | 49,176 | |||||||||
|
| |||||||||||||||
10. Debt
The Company’s debt instruments at December 31, 20102011 and 2009,2010, consist primarily of term notes and a securitization facility as follows (in thousands):
| 2010 | 2009 | |||||||
Term note payable—domestic(a) | $ | 270,350 | $ | 276,250 | ||||
Term note payable—foreign(b) | 52,830 | 61,576 | ||||||
Other debt | 2,233 | 13,725 | ||||||
Total notes payable | 325,413 | 351,551 | ||||||
Securitization facility(c) | 144,000 | — | ||||||
Total notes payable, credit agreements and securitization facility | $ | 469,413 | $ | 351,551 | ||||
| 2011 | 2010 | |||||||
Term note payable—domestic(a) | $ | 292,500 | $ | — | ||||
Revolving line of credit—domestic(a) | 125,000 | |||||||
Term note payable—domestic(b) | — | 270,350 | ||||||
Term note payable—foreign(c) | — | 52,830 | ||||||
Other obligations | 1,283 | 2,233 | ||||||
|
|
|
| |||||
Total notes payable and other obligations | 418,783 | 325,413 | ||||||
Securitization facility(d) | 280,000 | 144,000 | ||||||
|
|
|
| |||||
Total notes payable, credit agreements and securitization facility | $ | 698,783 | $ | 469,413 | ||||
|
|
|
| |||||
Current portion | $ | 420,354 | $ | 155,617 | ||||
Long-term portion | 278,429 | 313,796 | ||||||
|
|
|
| |||||
Total notes payable, credit agreements and securitization facility | $ | 698,783 | $ | 469,413 | ||||
|
|
|
| |||||
| (a) | The Company entered into a $300 million term loan and a $600 million revolving line of credit on June 22, 2011. The revolving line of credit contains a $20 million sublimit for letters of credit, a $20 million sublimit for swing line loans and a sublimit for multicurrency borrowings in Euros, Sterling and Japanese Yen. Proceeds from this new credit facility were used to retire the Company’s indebtedness under its 2005 Credit Facility and CCS Credit Facility, as described below. At December 31, 2011, the Company had $293 million borrowings outstanding on the term loan and $125 million outstanding on the revolving line of credit, respectively. Interest on the line of credit ranges from the sum of the Base Rate plus 0.25% to 1.25% or the Eurodollar Rate plus 1.25% to 2.25%. The term loan is payable in quarterly installments and is due on the last business day of each March, June, September, and December with the final principal payment due in June 2016. Borrowings on the revolving credit facility are repayable at our option of one, two, three or six months after borrowing, depending on the term of the borrowing on the facility. This facility is referred to as the Credit Facility. Principal payments of $7.5 million were made on the term loan during 2011. |
| (b) | The Company entered into a $130 million term loan and a $30 million revolving line of credit on June 2, 2005. On April 30, 2007, the Company amended and restated the facility increasing the term loan to $250 million, increasing the revolving line of credit facility to $50 million and entering into a $50 million delayed draw term loan facility. This facility is referred to as the 2005 Credit Facility. In April 2008, the Company borrowed the additional $50 million from the delayed draw term loan facility. The revolving line of credit facility |
FleetCor Technologies, Inc. and Subsidiaries
Notes to Financial Statements (continued)
10. Debt (continued)
On December 7, 2006, one of the Company’s foreign subsidiaries entered into foreign term loans in the Czech Republic denominated in Czech Koruna. The Facility A term loan was for |
| referred to as the CCS Credit Facility. Interest on the Facility A term loan |
| The Company is party to a receivables purchase agreement |
The Company was in compliance with all financial covenants at December 31, 2010 and 2009, respectively.2011.
The contractual maturities of the Company’s notes payable at December 31, 20102011 are as follows (in thousands):
2011 | $ | 11,617 | ||||||
2012 | 10,041 | $ | 140,354 | |||||
2013 | 271,313 | 22,776 | ||||||
2014 | 32,442 | 30,116 | ||||||
2015 | 45,111 | |||||||
2016 | 180,111 | |||||||
Thereafter | — | 315 | ||||||
In 2005, the Company entered into an interest rate collar agreement with a notional value of $45 million which matured in October 2008. In November 2007, the Company also entered into an interest rate swap agreement with a notional value of $175$175.0 million, which matured in November 2010. Both agreementsThe agreement converted a portion of the Company’s variable rate debt exposure to a fixed rate.
The Company recordsrecorded any differences paid or received on these interest rate agreements as adjustments to interest expense over the liveslife of the agreements. These interest rate agreements have been designated as cash flow hedges and the changes in the fair value of the agreements arewere recorded to accumulated other
FleetCor Technologies, Inc. and Subsidiaries
Notes to Financial Statements (continued)
10. Debt (continued)
comprehensive income. During the years ended December 31, 2010 2009 and 2008,2009, no gains or losses were recognized on these instruments and there was no effect on income from hedge ineffectiveness. The net difference between interest paid and interest received related to these agreements resulted in $6 million, $7$6.0 million and $3$7.0 million of increases in interest expense for the years ended December 31, 2010 and 2009, and 2008, respectively. All swaps had matured as of December 31, 2010.
11. Income Taxes
Income before the provision for income taxes is attributable to the following jurisdictions (in thousands) for years ended December 31:
| 2010 | 2009 | 2008 | 2011 | 2010 | 2009 | |||||||||||||||||||
United States | $ | 92,979 | $ | 83,561 | $ | 84,773 | $ | 144,928 | $ | 92,979 | $ | 83,561 | ||||||||||||
Foreign | 58,301 | 46,054 | 49,914 | 65,949 | 58,301 | 46,054 | ||||||||||||||||||
|
|
| ||||||||||||||||||||||
Total | $ | 151,280 | $ | 129,615 | $ | 134,687 | $ | 210,877 | $ | 151,280 | $ | 129,615 | ||||||||||||
|
|
| ||||||||||||||||||||||
The provision (benefit) for income taxes for the years ended December 31 2010, 2009 and 2008 consists of the following (in thousands):
| 2010 | 2009 | 2008 | 2011 | 2010 | 2009 | |||||||||||||||||||
Current: | ||||||||||||||||||||||||
Federal | $ | 31,337 | $ | 16,636 | $ | 22,610 | $ | 45,817 | $ | 31,337 | $ | 16,636 | ||||||||||||
State | 2,545 | 1,321 | 1,145 | 2,578 | 2,545 | 1,321 | ||||||||||||||||||
Foreign | 13,496 | 13,355 | 13,806 | 17,375 | 13,496 | 13,355 | ||||||||||||||||||
|
|
| ||||||||||||||||||||||
Total current | 47,378 | 31,312 | 37,561 | 65,770 | 47,378 | 31,312 | ||||||||||||||||||
Deferred: | ||||||||||||||||||||||||
Federal | (1,308 | ) | 10,558 | 2,075 | 1,538 | (1,308 | ) | 10,558 | ||||||||||||||||
State | (93 | ) | 900 | 391 | 132 | (93 | ) | 900 | ||||||||||||||||
Foreign | (2,593 | ) | (2,207 | ) | (2,622 | ) | (3,898 | ) | (2,593 | ) | (2,207 | ) | ||||||||||||
|
|
| ||||||||||||||||||||||
Total deferred | (3,994 | ) | 9,251 | (156 | ) | (2,228 | ) | (3,994 | ) | 9,251 | ||||||||||||||
|
|
| ||||||||||||||||||||||
Total provision | $ | 43,384 | $ | 40,563 | $ | 37,405 | $ | 63,542 | $ | 43,384 | $ | 40,563 | ||||||||||||
|
|
| ||||||||||||||||||||||
The provision for income taxes differs from amounts computed by applying the U.S. federal tax rate of 35% to income before income taxes for the years ended December 31 2010, 2009 and 2008 due to the following (in thousands):
| 2010 | 2009 | 2008 | ||||||||||||||||||||||
Computed “expected” tax expense | $ | 52,948 | 35.00 | % | $ | 45,365 | 35.00 | % | $ | 47,140 | 35.00 | % | ||||||||||||
Changes resulting from: | ||||||||||||||||||||||||
Foreign income tax differential | (7,074 | ) | (4.68 | ) | (6,025 | ) | (4.65 | ) | (6,238 | ) | (4.63 | ) | ||||||||||||
State taxes net of federal benefits | 1,279 | 0.85 | 1,490 | 1.15 | 999 | 0.74 | ||||||||||||||||||
Foreign-sourced non taxable income | (3,873 | ) | (2.56 | ) | (2,825 | ) | (2.18 | ) | (5,236 | ) | (3.89 | ) | ||||||||||||
Other | 104 | 0.07 | 2,558 | 1.98 | 740 | 0.55 | ||||||||||||||||||
Provision for income taxes | $ | 43,384 | 28.68 | % | $ | 40,563 | 31.30 | % | $ | 37,405 | 27.77 | % | ||||||||||||
FleetCor Technologies, Inc. and Subsidiaries
Notes to Financial Statements (continued)
11. Income Taxes (continued)
| 2011 | 2010 | 2009 | ||||||||||||||||||||||
Computed “expected” tax expense | $ | 73,807 | 35.00 | % | $ | 52,948 | 35.00 | % | $ | 43,565 | 35.00 | % | ||||||||||||
Changes resulting from: | ||||||||||||||||||||||||
Foreign income tax differential | (8,333 | ) | (3.95 | ) | (7,074 | ) | (4.68 | ) | (6,025 | ) | (4.65 | ) | ||||||||||||
State taxes net of federal benefits | 1,923 | 0.91 | 1,279 | 0.85 | 1,490 | 1.15 | ||||||||||||||||||
Foreign-sourced non taxable income | (4,423 | ) | (2.10 | ) | (3,873 | ) | (2.56 | ) | (2,825 | ) | (2.18 | ) | ||||||||||||
Other | 568 | 0.27 | 104 | 0.07 | 2,558 | 1.98 | ||||||||||||||||||
|
|
|
|
|
|
|
|
|
|
|
| |||||||||||||
Provision for income taxes | $ | 63,542 | 30.13 | % | $ | 43,384 | 28.68 | % | $ | 40,563 | 31.30 | % | ||||||||||||
|
|
|
|
|
|
|
|
|
|
|
| |||||||||||||
The tax effects of temporary differences that give rise to significant portions of the deferred tax assets and liabilities at December 31 are as follows (in thousands):
| 2010 | 2009 | 2011 | 2010 | |||||||||||||
Deferred tax assets: | ||||||||||||||||
Accounts receivable, principally due to the allowance for doubtful accounts | $ | 3,201 | $ | 2,897 | $ | 3,251 | $ | 3,201 | ||||||||
Interest rate derivatives | — | 2,746 | ||||||||||||||
Accrued expenses not currently deductible for tax | 1,284 | 1,345 | 1,652 | 1,284 | ||||||||||||
Stock based compensation | 6,070 | 1,516 | 8,289 | 6,070 | ||||||||||||
Foreign Tax Credit | 177 | 177 | ||||||||||||||
Foreign tax credit | 177 | 177 | ||||||||||||||
Net operating loss carryforwards | 2,865 | 1,831 | 3,168 | 2,865 | ||||||||||||
Other | 217 | 98 | 363 | 217 | ||||||||||||
|
| |||||||||||||||
Deferred tax assets before valuation allowance | 13,814 | 10,610 | 16,900 | 13,814 | ||||||||||||
Valuation allowance | (1,784 | ) | (902 | ) | (1,709 | ) | (1,784 | ) | ||||||||
|
| |||||||||||||||
Deferred tax assets, net | 12,030 | 9,708 | 15,191 | 12,030 | ||||||||||||
|
| |||||||||||||||
Deferred tax liabilities: | ||||||||||||||||
Property and equipment, principally due to differences between book and tax depreciation | (2,297 | ) | (2,405 | ) | (4,020 | ) | (2,297 | ) | ||||||||
Intangibles—including goodwill | (88,504 | ) | (86,140 | ) | (119,254 | ) | (88,504 | ) | ||||||||
|
| |||||||||||||||
Deferred tax liabilities | (90,801 | ) | (88,545 | ) | (123,274 | ) | (90,801 | ) | ||||||||
|
| |||||||||||||||
Net deferred tax liabilities | $ | (78,771 | ) | $ | (78,837 | ) | $ | (108,083 | ) | $ | (78,771 | ) | ||||
|
| |||||||||||||||
The Company’s deferred tax balances are classified in its balance sheets based on net current items and net non-current items as of December 31 as follows (in thousands):
| 2010 | 2009 | 2011 | 2010 | |||||||||||||
Current deferred tax assets and liabilities: | ||||||||||||||||
Current deferred tax assets | $ | 4,484 | $ | 6,988 | $ | 4,797 | $ | 4,484 | ||||||||
Long term deferred tax assets and liabilities: | ||||||||||||||||
Long term deferred tax assets | 7,546 | 2,720 | 10,394 | 7,546 | ||||||||||||
Long term deferred tax liabilities | (90,801 | ) | (88,545 | ) | (123,274 | ) | (90,801 | ) | ||||||||
|
| |||||||||||||||
Net long term deferred tax liabilities | (83,255 | ) | (85,825 | ) | (112,880 | ) | (83,255 | ) | ||||||||
|
| |||||||||||||||
Net deferred tax liabilities | $ | (78,771 | ) | $ | (78,837 | ) | $ | (108,083 | ) | $ | (78,771 | ) | ||||
|
| |||||||||||||||
We reduce federal and state income taxes payable by the tax benefits associated with the exercise of certain stock options. To the extent realized tax deductions for options exceed the amount previously recognized as deferred tax benefits related to share-based compensation for these option awards, we record an excess tax benefit in stockholders’ equity. We recorded excess tax benefits of $13.7 million, $10.7 million and $0.9$0.0 million in the years ended 2011, 2010 and 2008, respectively, and none in 2009.2009, respectively.
At December 31, 2010,2011, U.S. taxes were not provided on earnings of the Company’s foreign subsidiaries. The Company’s intent is for such earnings to be reinvested by the subsidiaries or to be repatriated only when it would be tax effective through the utilization of foreign tax credits. If in the future these earnings are repatriated to the U.S, or if the Company determines that the earnings will be remitted in the foreseeable future, an additional tax
FleetCor Technologies, Inc. and Subsidiaries
Notes to Financial Statements (continued)
11. Income Taxes (continued)
provision and related liability may be required. If such earnings were distributed, U.S. income taxes would be partially reduced by available credits for taxes paid to the jurisdictions in which the income was earned. Cumulative undistributed earnings of non-U.S. subsidiaries for which U.S. taxes have not been provided are included in consolidated retained earnings in the amount of approximately $263.8 million, $197.9 million, $139.5 million, and $93.4$139.5 million at December 31, 2011, 2010, and 2009, and 2008, respectively. Because of the availability of United States foreign tax credits, it is not practicable to determine the domestic federal income tax liability that would be payable if such earnings were not reinvested indefinitely.
The valuation allowance for deferred tax assets at December 31, 2011 and 2010 and 2009 was $1.8$1.7 million and $0.9$1.8 million, respectively. The valuation allowance relates to foreign and state net operating loss carryforwards and foreign tax credit carryforwards. The net change in the total valuation allowance for the years ended December 31, 2011 and 2010 and 2009 was an increasea decrease of $0.9 million.
During 2010, a valuation allowance was established for certain state net operating losses and certain foreign income net operating losses that, if realizable, would reduce future state taxes payable totaling $0.2 million and future foreign income taxes payable totaling $0.5 million. Additionally, a valuation allowance associated with certain foreign tax credits was established that, if realized, would reduce future federal income taxes payable totaling $0.2$0.1 million.
As of December 31, 2010,2011, the Company had net operating loss carryforwards for state income tax purposes of $58.8$58.7 million that are available to offset future state taxable income through 2023. Additionally, the Company had $1.7$1.9 million of net operating loss carryforwards for foreign income tax purposes that are available to offset future foreign taxable income. The foreign net operating loss carryforwards will not expire in future years.
The Company recognizes interest and penalties on unrecognized tax benefits (including interest and penalties calculated on uncertain tax positions on which the Company believes it will ultimately prevail) within the provision for income taxes on continuing operations in the consolidated financial statements. This policy is a continuation of the Company’s policy prior to adoption of the guidance regarding uncertain tax positions. As of December 31, 20102011 and 2009,2010, the Company had recorded accrued interest and penalties related to the unrecognized tax benefits of $0.5$0.9 million and $0.9$0.5 million, respectively.
The Company files numerous consolidated and separate income tax returns in the U.S. federal jurisdiction and various state and foreign jurisdictions. The statute of limitations for the Company’s U.S. federal income tax returns has expired for years prior to 2007. The statute of limitations for the Company’s U.K. income tax returns has expired for years prior to 2010. The statute of limitations has expired for years prior to 2008 for the Company’s Czech Republic income tax returns.
A reconciliation of the beginning and ending balances of the total amounts of gross unrecognized tax benefits including interest for the years ended December 31, 2011, 2010 2009 and 20082009 is as follows (in thousands):
Unrecognized tax benefits at January 1, 2008 | $ | 2,413 | ||||||
Additions based on tax provisions related to the current year | 1,188 | |||||||
Unrecognized tax benefits at December 31, 2008 | 3,601 | |||||||
Unrecognized tax benefits at January 1, 2009 | $ | 3,601 | ||||||
Additions based on tax provisions related to the current year | 859 | 859 | ||||||
Deductions based on settlement/expiration of prior year tax positions | (417 | ) | (417 | ) | ||||
| ||||||||
Unrecognized tax benefits at December 31, 2009 | 4.043 | 3,601 | ||||||
Additions based on tax provisions related to the current year | 549 | 549 | ||||||
Deductions based on settlement/expiration of prior year tax positions | (680 | ) | (680 | ) | ||||
| ||||||||
Unrecognized tax benefits at December 31, 2010 | $ | 3,912 | 3,912 | |||||
Additions based on tax provisions related to the current year | 524 | |||||||
Additions based on tax provisions related to the prior year | 1,010 | |||||||
Deductions based on settlement/expiration of prior year tax positions | (452 | ) | ||||||
| ||||||||
Unrecognized tax benefits at December 31, 2011 | $ | 4,994 | ||||||
| ||||||||
FleetCor Technologies, Inc. and Subsidiaries
Notes to Financial Statements (continued)
11. Income Taxes (continued)
As of December 31, 2011 the Company had total unrecognized tax benefits of $5.0 million of which $4.3 million, if recognized, would affect its effective tax rate. It is not anticipated that there are any unrecognized tax benefits that will significantly increase or decrease within the next twelve months.
12. Leases
The Company enters into noncancelable operating lease agreements for equipment, buildings and vehicles. The minimum lease payments for the noncancelable operating lease agreements are as follows (in thousands):
2011 | $ | 4,551 | ||||||
2012 | 3,296 | $ | 6,113 | |||||
2013 | 2,294 | 5,567 | ||||||
2014 | 684 | 3,546 | ||||||
2015 | 175 | 2,799 | ||||||
2016 | 1,723 | |||||||
Thereafter | 236 | 6,876 | ||||||
Rent expense for noncancelable operating leases approximated $6.2 million, $5.1 million, $4.7 million, and $3.9$4.7 million for the years ended December 31, 2011, 2010, 2009, and 2008,2009, respectively. The leases are generally renewable at the Company’s option for periods of one to five years.
13. Commitments and Contingencies
In the ordinary course of business, the Company is involved in various pending or threatened legal actions. The Company has recorded reserves for certain legal proceedings. The amounts recorded are estimated and as additional information becomes available, the Company will reassess the potential liability related to its pending litigation and revise its estimate in the period that information becomes known. In the opinion of management, the amount of ultimate liability, if any, with respect to these actions will not have a material adverse effect on the Company’s consolidated financial position, results of operations, or liquidity.
14. Related-Party Notes
The Company issued 1,325,000 sharesnotified the Office of Series B preferred stock (subsequently reclassifiedFair Trading about its recent acquisition of Allstar Business Solutions Limited, in which it provided an analysis that the acquisition does not result in a substantial lessening of competition on any affected market and it subsequently responded to Series D-2 preferred stock asquestions posed by the Office of Fair Trading in the course of its review. We anticipate that the Office of Fair Trading will determine whether or not to make a referral to the Competition Commission for further discussedconsideration by March 28, 2012. If the Competition Commission were to conclude that the acquisition results in Note 4) at $0.20 per share in May 2002. The Company executed promissory notes witha substantial lessening of competition, it could require remedial action, which could negatively affect the holders, payable in seven years or within 120 days of termination of employment. The notes were paid in full as of December 31, 2009.Company’s financial results.
15.14. Earnings Per Share
The Company reports a dual presentation of basic and diluted EPS. Basic EPS is computed by dividing net income attributable to shareholders of the Company by the weighted average number of common shares outstanding during the reported period. Diluted EPS reflects the potential dilution related to equity-based incentives using the if-converted and treasury stock methods, where applicable.
FleetCor Technologies, Inc. and Subsidiaries
Notes to Financial Statements (continued)
15. Earnings Per Share (continued)
The calculation and reconciliation of basic and diluted earnings per share for the years ended December 31 (in thousands, except per share data):
| 2010 | 2009 | 2008 | 2011 | 2010 | 2009 | |||||||||||||||||||
Numerator for basic earnings per share: | ||||||||||||||||||||||||
Net income | $ | 107,896 | $ | 89,052 | $ | 97,282 | $ | 147,335 | $ | 107,896 | $ | 89,052 | ||||||||||||
Convertible preferred stock accrued dividends | (1,488 | ) | (15,789 | ) | (11,357 | ) | — | (1,488 | ) | (15,789 | ) | |||||||||||||
|
|
| ||||||||||||||||||||||
Earnings attributable to common shareholders for basic earnings per share | $ | 106,408 | $ | 73,263 | $ | 85,925 | $ | 147,335 | $ | 106,408 | $ | 73,263 | ||||||||||||
|
|
| ||||||||||||||||||||||
Numerator for diluted earnings per share: | ||||||||||||||||||||||||
Income attributable to common shareholders for basic earnings per share | $ | 106,408 | $ | 73,263 | $ | 85,925 | $ | 147,335 | $ | 106,408 | $ | 73,263 | ||||||||||||
Effect of convertible preferred stock | 1,488 | 15,789 | 11,357 | — | 1,488 | 15,789 | ||||||||||||||||||
|
|
| ||||||||||||||||||||||
Net earnings for diluted earnings per share | $ | 107,896 | $ | 89,052 | $ | 97,282 | $ | 147,335 | $ | 107,896 | $ | 89,052 | ||||||||||||
|
|
| ||||||||||||||||||||||
Denominator for basic and diluted earnings per share: | ||||||||||||||||||||||||
Weighted-average shares outstanding | $ | 33,704 | $ | 32,522 | $ | 32,255 | 79,477 | 33,704 | 32,522 | |||||||||||||||
Share-based payment awards classified as participating securities | 1,730 | 1,280 | 778 | 1,133 | 1,730 | 1,280 | ||||||||||||||||||
|
|
| ||||||||||||||||||||||
Denominator for basic earnings per share | 35,434 | 33,802 | 33,033 | 80,610 | 35,434 | 33,802 | ||||||||||||||||||
Dilutive securities | 3,055 | 3,602 | 3,488 | 3,044 | 3,055 | 3,602 | ||||||||||||||||||
Warrants | — | — | 317 | |||||||||||||||||||||
Convertible preferred stock | 42,262 | 41,450 | 35,075 | — | 42,262 | 41,450 | ||||||||||||||||||
|
|
| ||||||||||||||||||||||
Denominator for diluted earnings per share | $ | 80,751 | $ | 78,854 | $ | 71,913 | 83,654 | 80,751 | 78,854 | |||||||||||||||
|
|
| ||||||||||||||||||||||
Basic earnings per share | $ | 3.00 | $ | 2.17 | $ | 2.60 | $ | 1.83 | $ | 3.00 | $ | 2.17 | ||||||||||||
Diluted earnings per share | 1.34 | 1.13 | 1.35 | 1.76 | 1.34 | 1.13 | ||||||||||||||||||
16.15. Segments
The Company reports information about its operating segments in accordance with the authoritative guidance related to segments. The Company’s reportable segments represent components of the business for which separate financial information is evaluated regularly by the chief operating decision maker in determining how to allocate resources and in assessing performance. The Company operates in two reportable segments, North America and International. The Company has identified these segments due to commonality of the products in each of their business lines having similar economic characteristics, services, customers and processes. There were no significant inter-segment sales.
FleetCor Technologies, Inc. and Subsidiaries
Notes
16. Segments (continued)
The Company’s segment results are as follows as of and for the years ended December 31 (in thousands):
| 2010 | 2009 | 2008 | ||||||||||
Revenues, net: | ||||||||||||
North America | $ | 287,794 | $ | 227,373 | $ | 205,468 | ||||||
International | 146,047 | 126,700 | 135,585 | |||||||||
| $ | 433,841 | $ | 354,073 | $ | 341,053 | |||||||
Operating income: | ||||||||||||
North America | $ | 103,501 | $ | 91,715 | $ | 88,286 | ||||||
International | 66,992 | 54,330 | 64,169 | |||||||||
| $ | 170,493 | $ | 146,045 | $ | 152,455 | |||||||
Depreciation and amortization: | ||||||||||||
North America | $ | 20,220 | $ | 15,990 | $ | 16,058 | ||||||
International | 13,525 | 12,378 | 11,182 | |||||||||
| $ | 33,745 | $ | 28,368 | $ | 27,240 | |||||||
Capital expenditures: | ||||||||||||
North America | $ | 6,891 | $ | 5,097 | $ | 4,659 | ||||||
International | 4,303 | 4,580 | 2,429 | |||||||||
| $ | 11,194 | $ | 9,677 | $ | 7,088 | |||||||
| 2010 | 2009 | |||||||
Long-lived assets (excluding goodwill): | ||||||||
North America | $ | 113,192 | $ | 121,519 | ||||
International | 150,277 | 150,448 | ||||||
| $ | 263,469 | $ | 271,967 | |||||
The table below presents certain financial information related to the Company’s significant foreign operations as of and for the years ended December 31 (in millions):
| 2010 | 2009 | 2008 | ||||||||||
Revenues, net: | ||||||||||||
Czech Republic | $ | 52.9 | $ | 48.6 | $ | 54.6 | ||||||
United Kingdom | 77.3 | 55.7 | 61.8 | |||||||||
Long-lived assets (excluding goodwill): | ||||||||||||
Czech Republic | $ | 55.5 | $ | 59.5 | ||||||||
United Kingdom | 64.2 | 66.3 | ||||||||||
| 2011 | 2010 | 2009 | ||||||||||
Revenues, net: | ||||||||||||
North America | $ | 348,784 | $ | 287,794 | $ | 227,373 | ||||||
International | 170,807 | 146,047 | 126,700 | |||||||||
|
|
|
|
|
| |||||||
| $ | 519,591 | $ | 433,841 | $ | 354,073 | |||||||
|
|
|
|
|
| |||||||
Operating income: | ||||||||||||
North America | $ | 153,687 | $ | 106,745 | $ | 91,715 | ||||||
International | 72,647 | 63,748 | 54,330 | |||||||||
|
|
|
|
|
| |||||||
| $ | 226,334 | $ | 170,493 | $ | 146,045 | |||||||
|
|
|
|
|
| |||||||
Depreciation and amortization: | ||||||||||||
North America | $ | 19,845 | $ | 20,220 | $ | 15,990 | ||||||
International | 16,326 | 13,525 | 12,378 | |||||||||
|
|
|
|
|
| |||||||
| $ | 36,171 | $ | 33,745 | $ | 28,368 | |||||||
|
|
|
|
|
| |||||||
Capital expenditures: | ||||||||||||
North America | $ | 6,840 | $ | 6,891 | $ | 5,097 | ||||||
International | 6,614 | 4,303 | 4,580 | |||||||||
|
|
|
|
|
| |||||||
| $ | 13,454 | $ | 11,194 | $ | 9,677 | |||||||
|
|
|
|
|
| |||||||
| 2011 | 2010 | |||||||||||
Long-lived assets (excluding goodwill): | ||||||||||||
North America | $ | 113,030 | $ | 113,192 | ||||||||
International | 264,988 | 150,277 | ||||||||||
|
|
|
| |||||||||
| $ | 378,018 | $ | 263,469 | |||||||||
|
|
|
| |||||||||
For the years ended December 31, 2011, 2010 and 2009, the revenues of our businesses in the United Kingdom and 2008,Czech Republic each represent greater than 10% of our consolidated revenues. At December 31, 2011 and 2010, the long-lived assets (excluding goodwill) of our businesses in the United Kingdom and Czech Republic each represent greater than 10% of our consolidated long-lived assets (excluding goodwill).
For the years ended December 31, 2011, 2010 and 2009, two customers represented 30.8%29.5%, 25.1%30.8% and 20.5%25.1%, respectively, of the Company’s Revenues, net revenue in North America. For the years ended December 31, 2011 and 2010, one partner, Chevron, accounted for approximately 11% of our consolidated revenues, net.
FleetCor Technologies, Inc. and Subsidiaries
Notes
17.16. Selected Quarterly Financial Data (Unaudited)
Fiscal Quarters Year Ended December 31, 2011 | First | Second | Third | Fourth | ||||||||||||||||||||||||||||
Revenues, net | $ | 111,005 | $ | 134,213 | $ | 134,213 | $ | 140,160 | ||||||||||||||||||||||||
Operating income | 50,487 | 59,892 | 61,723 | 54,232 | ||||||||||||||||||||||||||||
Net income | 32,335 | 36,715 | 40,514 | 37,771 | ||||||||||||||||||||||||||||
Earnings per share: | ||||||||||||||||||||||||||||||||
Basic earnings per share | $ | 0.40 | $ | 0.46 | $ | 0.50 | $ | 0.46 | ||||||||||||||||||||||||
Diluted earnings per share | 0.39 | 0.44 | 0.48 | 0.45 | ||||||||||||||||||||||||||||
Weighted average shares outstanding: | ||||||||||||||||||||||||||||||||
Basic weighted average shares outstanding | 79,937 | 80,151 | 80,819 | 81,512 | ||||||||||||||||||||||||||||
Diluted weighted average shares outstanding | 83,378 | 83,548 | 83,649 | 84,035 | ||||||||||||||||||||||||||||
Fiscal Quarters Year Ended December 31, 2010 | First | Second | Third | Fourth | First | Second | Third | Fourth | ||||||||||||||||||||||||
Revenues, net | $ | 104,202 | $ | 111,437 | $ | 111,655 | $ | 106,547 | $ | 104,202 | $ | 111,437 | $ | 111,655 | $ | 106,547 | ||||||||||||||||
Operating income | 47,100 | 50,557 | 49,062 | 23,774 | 47,100 | 50,557 | 49,062 | 23,774 | ||||||||||||||||||||||||
Net income | 27,345 | 29,640 | 33,397 | 17,514 | 27,345 | 29,640 | 33,398 | 17,513 | ||||||||||||||||||||||||
Earnings per share: | ||||||||||||||||||||||||||||||||
Basic earnings per share | $ | 0.67 | $ | 0.74 | $ | 0.85 | $ | 0.43 | $ | 0.67 | $ | 0.74 | $ | 0.85 | $ | 0.43 | ||||||||||||||||
Diluted earnings per share | 0.34 | 0.37 | 0.41 | 0.22 | 0.34 | 0.37 | 0.41 | 0.22 | ||||||||||||||||||||||||
Weighted average shares outstanding: | ||||||||||||||||||||||||||||||||
Basic weighted average shares outstanding | 34,011 | 33,988 | 34,076 | 39,612 | 34,011 | 33,988 | 34,076 | 39,612 | ||||||||||||||||||||||||
Diluted weighted average shares outstanding | 80,489 | 80,701 | 80,880 | 80,931 | 80,489 | 80,701 | 80,880 | 80,931 | ||||||||||||||||||||||||
Fiscal Quarters Year Ended December 31, 2009 | First | Second | Third | Fourth | ||||||||||||||||||||||||||||
Revenues, net | $ | 68,076 | $ | 88,110 | $ | 100,575 | $ | 97,312 | ||||||||||||||||||||||||
Operating income | 23,051 | 33,928 | 47,867 | 41,199 | ||||||||||||||||||||||||||||
Net income | 13,414 | 20,808 | 29,882 | 24,948 | ||||||||||||||||||||||||||||
Earnings per share: | ||||||||||||||||||||||||||||||||
Basic earnings per share | $ | 0.31 | $ | 0.49 | $ | 0.76 | $ | 0.61 | ||||||||||||||||||||||||
Diluted earnings per share | 0.19 | 0.26 | 0.37 | 0.31 | ||||||||||||||||||||||||||||
Weighted average shares outstanding: | ||||||||||||||||||||||||||||||||
Basic weighted average shares outstanding | 33,766 | 33,767 | 33,792 | 33,883 | ||||||||||||||||||||||||||||
Diluted weighted average shares outstanding | 71,690 | 80,463 | 81,687 | 81,575 | ||||||||||||||||||||||||||||
The sum of the quarterly earnings per common share amounts for 20102011 and 20092010 do not equal the earnings per common share for the years ended December 31, 20102011 and 20092010 due to rounding.
ITEM 9. CHANGES IN AND DISAGREEMENTS WITH ACCOUNTANTS ON ACCOUNTING AND FINANCIAL DISCLOSURE
Not applicable.
ITEM 9A. CONTROLS AND PROCEDURES
UnderEvaluation of Disclosure Controls and Procedures
As of December 31, 2011, management carried out, under the supervision and with the participation of our management, includingprincipal executive officer and principal financial officer, an evaluation of the Chief Executive Officereffectiveness of the design and Chief Financial Officer, we have evaluated the effectivenessoperation of our disclosure controls and procedures as required by(as defined in Rules 13a-15(e) and 15d-15(e) under the Securities Exchange Act Rule 13a-15(b)of 1934). Based on this evaluation, our principal executive officer and principal financial officer concluded that, as of the end of the period covered by this report. Based on that evaluation, the Chief Executive Officer and Chief Financial Officer have concluded that theseDecember 31, 2011, our disclosure controls and procedures were effective in ensuring that information required to be disclosed by us in the reports that we file or submit under the Securities Exchange Act of 1934, as amended, is recorded, processed, summarized and reported within the time periods specified in applicable rules and forms and are effective.designed to ensure that information required to be disclosed in those reports is accumulated and communicated to management, including our principal executive and principal financial officers, as appropriate to allow timely decisions regarding required disclosure.
Management Report on Internal Control over Financial Reporting
Our management team is responsible for establishing and maintaining adequate internal control over financial reporting foras defined in Rules 13a-15(f) and 15d-15(f) under the company. Securities Exchange Act of 1934. Our management assessed the effectiveness of our internal control over financial reporting as of December 31, 2011. In making this assessment, our management used the criteria set forth by the Committee of Sponsoring Organizations of the Treadway Commission (COSO) inInternal Control-Integrated Framework.As of December 31, 2011, management believes that the Company’s internal control over financial reporting is a process to provide reasonable assurance regarding the reliability ofeffective based on those criteria. Our independent registered public accounting firm has issued an audit report on our financial reporting for external purposes in accordance with accounting principles generally accepted in the United States of America. Internalinternal control over financial reporting, includes maintaining records thatwhich is included in reasonable detail accurately and fairly reflectthis annual report.
In connection with management’s evaluation, our transactions; providing reasonable assurance that transactions are recorded as necessary for preparationmanagement team excluded from its assessment of the effectiveness of our internal control over financial statements; providing reasonable assurancereporting as of December 31, 2011 the internal controls relating to two subsidiaries that receiptswe acquired during the year ended December 31, 2011 and expendituresfor which financial results are included in our consolidated financial statements. On August 31, 2011, we acquired all of the stock of a prepaid fuel card and food voucher company in Mexico (Mexican Card and Voucher Company). On December 13, 2011, we acquired all of the stock of a fuel card company in the United Kingdom (UK Fuel Card Company). The Mexican Card and Voucher Company and UK Fuel Card Company acquisitions represented 26% and 21% of total and net assets, are maderespectively, as of December 31, 2011 and 2.5% and 1% of revenues and net income, respectively, for the year then ended. This exclusion was in accordance with management authorization;Securities and providing reasonable assuranceExchange Commission guidance that unauthorized acquisition, use, or dispositionan assessment of company assets that could have a material effectrecently acquired business may be omitted in management’s report on ourinternal control over financial statements would be prevented or detected on a timely basis. reporting in the year of acquisition.
Because of its inherent limitations, internal control over financial reporting ismay not intendedprevent or detect all misstatements. Projections of any evaluation of effectiveness to future periods are subject to the risk that controls may become inadequate because of changes in conditions or that the degree of compliance with the policies or procedures may deteriorate. Internal control over financial reporting cannot provide absolute assurance of achieving financial reporting objectives because of its inherent limitations. Internal control over financial reporting is a process that involves human diligence and compliance and is subject to lapses in judgment and breakdowns resulting from human failures. Internal control over financial reporting also can be circumvented by collusion or improper management override. Due to such limitations, there is a misstatement of our financial statements wouldrisk that material misstatements
may not be prevented or detected.detected on a timely basis by internal control over financial reporting. However, these inherent limitations are known features of the financial reporting process. Therefore, it is possible to design into the process safeguards to reduce, though not eliminate, such risk.
Changes in Internal Control over Financial Reporting
There were no changes in our internal control over financial reporting during the quarter ended December 31, 20102011 that have materially affected, or are reasonably likely to materially affect, our internal control over financial reporting.
This report does not include a report of management’s assessment regarding internal control over financial reporting or an attestation report of our independent registered public accounting firm due to a transition period established by the rules of the SEC for newly public companies.
Not applicable.
PART III
ITEM 10. DIRECTORS, EXECUTIVE OFFICERS AND CORPORATE GOVERNANCE
A list of our executive officers and biographical information appears in Part I, Item X of this Form 10-K. Information about our directors may be found under the caption “Nominees” and “Continuing Directors” in our Proxy Statement for the Annual Meeting of Shareholders to be held May 24, 201022, 2012 (the “Proxy Statement”). Information about our Audit Committee may be found under the caption “Board Committees” in the Proxy Statement. That information is incorporated herein by reference.
The information in the Proxy Statement set forth under the caption “Section 16(a) Beneficial Ownership Reporting Compliance” is incorporated herein by reference.
We have adopted the FleetCor Code of Business Conduct and Ethics (the “code of ethics”), which applies to our Chief Executive Officer, Chief Financial Officer, Chief Accounting Officer and Corporate Controller, and other finance organization employees. The code of ethics is publicly available on our Web site at www.fleetcor.com under Investor Relations. If we make any substantive amendments to the code of ethics or grant any waiver, including any implicit waiver, from a provision of the code to our Chief Executive Officer, Chief Financial Officer, or Chief Accounting Officer, we will disclose the nature of the amendment or waiver on that Web site or in a report on Form 8-K.
ITEM 11. EXECUTIVE COMPENSATION
The information in the Proxy Statement set forth under the captions “Director Compensation,” “Named Executive Officer Compensation,” “Compensation Committee Report,” and “Compensation Committee Interlocks and Insider Participation” is incorporated herein by reference.
ITEM 12. SECURITY OWNERSHIP OF CERTAIN BENEFICIAL OWNERS AND MANAGEMENT AND RELATED STOCKHOLDER MATTERS
The information in the Proxy Statement set forth under the captions “Securities Authorized for Issuance Under Equity Compensation Plans,” “Information Regarding Beneficial Ownership of Principal Shareholders, Directors, and Management” and “Equity Compensation Plan Information” is incorporated herein by reference.
ITEM 13. CERTAIN RELATIONSHIPS AND RELATED TRANSACTIONS, AND
DIRECTOR INDEPENDENCE
The information set forth in the Proxy Statement under the captions “Director Independence” and “Certain Relationships and Related Transactions” is incorporated herein by reference.
ITEM 14. PRINCIPAL ACCOUNTANT FEES AND SERVICES
Information concerning principal accountant fees and services appears in the Proxy Statement under the headings “Fees Billed by Ernst & Young” and “Policy on Audit Committee Pre-Approval of Audit and Permissible Non-Audit Services of Independent Auditor” and is incorporated herein by reference.
PART IV
ITEM 15. EXHIBITS AND FINANCIAL STATEMENT SCHEDULES
| (a) | Financial Statements and Schedules |
The financial statements are set forth under Item 8 of this Form 10-K, as indexed below. Financial statement schedules have been omitted since they either are not required, not applicable, or the information is otherwise included.
| Page | ||||
| ||||
Consolidated Balance Sheets at December 31, | ||||
Consolidated Statements of Income for the Years Ended December 31, 2011, 2010 | ||||
Consolidated Statements of Comprehensive Income for the Years Ended December 31, 2011, 2010 and 2009 | 74 | |||
Consolidated Statements of Cash Flows for the Years Ended December 31, 2011, 2010 | ||||
Financial statement schedules have been omitted since they either are not required, not applicable, or the information is otherwise included. | ||||
| (b) | Exhibit Listing |
Exhibit | ||
| 2.1 | Stock Purchase Agreement, dated as of April 1, 2009, among FleetCor Technologies Operating Company, LLC, CLC Group, Inc., and the entities and individuals identified on the signature pages thereto (incorporated by reference to Exhibit No. 2.1 to Amendment No. 1 to the registrant’s Registration Statement on form S-1, file number 333-166092, filed on May 20, 2010) | |
| 2.2 | Share Purchase Agreement among Arval UK Group Limited, FleetCor UK Acquisition Limited and FleetCor Technologies, Inc. (incorporated by reference to exhibit No. 2.1 to the registrant’s form 8-K, filed on December 13, 2011) | |
| 3.1 | Amended and Restated Certificate of Incorporation of FleetCor Technologies, Inc. (incorporated by reference to Exhibit No. 3.1 to the registrant’s form 10-K, filed on March 25, 2011) | |
| 3.2 | Amended and Restated Bylaws of FleetCor Technologies, Inc. (incorporated by reference to Exhibit No. 3.2 to the registrant’s form 10-K, filed on March 25, 2011) | |
| 4.1 | Form of Stock Certificate for Common Stock (incorporated by reference to Exhibit No. 4.1 to Amendment No. 3 to the registrant’s Registration Statement on form S-1, file number 333-166092, filed on June 29, 2010) | |
| 10.1* | Form of Indemnity Agreement entered into between FleetCor and its directors and executive officers (incorporated by reference to Exhibit 10.1 to Amendment No. 3 to the registrant’s Registration Statement on form S-1, file number 333-166092, filed on June 29, 2010) | |
| 10.2* | FleetCor Technologies, Inc. Amended and Restated Stock Incentive Plan (incorporated by reference to Exhibit 10.2 to Amendment No. 1 to the registrant’s Registration Statement on form S-1, file number 333-166092, filed on May 20, 2010) | |
Exhibit | ||
| 10.3* | First Amendment to FleetCor Technologies, Inc. Amended and Restated Stock Incentive Plan (incorporated by reference to Exhibit 10.3 to Amendment No. 1 to the registrant’s Registration Statement on form S-1, file number 333-166092, filed on May 20, 2010) | |
| 10.4* | Second Amendment to FleetCor Technologies, Inc. Amended and Restated Stock Incentive Plan (incorporated by reference to Exhibit 10.4 to Amendment No. 1 to the registrant’s Registration Statement on form S-1, file number 333-166092, filed on May 20, 2010) | |
| 10.5* | Third Amendment to FleetCor Technologies, Inc. Amended and Restated Stock Incentive Plan (incorporated by reference to Exhibit 10.5 to Amendment No. 1 to the registrant’s Registration Statement on form S-1, file number 333-166092, filed on May 20, 2010) | ||
| 10.6* | Fourth Amendment to FleetCor Technologies, Inc. Amended and Restated Stock Incentive Plan (incorporated by reference to Exhibit 10.6 to Amendment No. 1 to the registrant’s Registration Statement on form S-1, file number 333-166092, filed on May 20, 2010) | ||
| 10.7* | Form of Incentive Stock Option Award Agreement pursuant to the FleetCor Technologies, Inc. Amended and Restated Stock Incentive Plan (incorporated by reference to Exhibit 10.7 to Amendment No. 1 to the registrant’s Registration Statement on form S-1, file number 333-166092, filed on May 20, 2010) | ||
| 10.8* | Form of Non-Qualified Stock Option Award Agreement pursuant to the FleetCor Technologies, Inc. Amended and Restated Stock Incentive Plan (incorporated by reference to Exhibit 10.8 to Amendment No. 1 to the registrant’s Registration Statement on form S-1, file number 333-166092, filed on May 20, 2010) | ||
| 10.9* | Form of Performance Share Restricted Stock Agreement pursuant to the FleetCor Technologies, Inc. Amended and Restated Stock Incentive Plan (incorporated by reference to Exhibit 10.9 to Amendment No. 1 to the registrant’s Registration Statement on form S-1, file number 333-166092, filed on May 20, 2010) | ||
| 10.10* | Form of FleetCor Technologies, Inc. 2010 Equity Compensation Plan (incorporated by reference to Exhibit 10.10 to Amendment No. 2 to the registrant’s Registration Statement on form S-1, file number 333-166092, filed on June 8, 2010) | ||
| 10.11* | FleetCor Technologies, Inc. Annual Executive Bonus Program (incorporated by reference to Exhibit 10.11 to Amendment No. 2 to the registrant’s Registration Statement on form S-1, file number 333-166092, filed on June 8, 2010) | ||
| 10.12* | Employee Noncompetition, Nondisclosure and Developments Agreement, dated September 25, 2000, between Fleetman, Inc. and Ronald F. Clarke (incorporated by reference to Exhibit 10.12 to Amendment No. 2 to the registrant’s Registration Statement on form S-1, file number 333-166092, filed on June 8, 2010) | ||
| 10.13* | Offer Letter, dated September 20, 2002, between FleetCor Technologies, Inc. and Eric R. Dey (incorporated by reference to Exhibit 10.13 to Amendment No. 2 to the registrant’s Registration Statement on form S-1, file number 333-166092, filed on June 8, 2010) | ||
| 10.14* | Offer Letter, dated March 17, 2009, between FleetCor Technologies, Inc. and Todd W. House (incorporated by reference to Exhibit 10.15 to Amendment No. 2 to the registrant’s Registration Statement on form S-1, file number 333-166092, filed on June 8, 2010) | ||
| 10.15* | Service Agreement, dated July 9, 2007, between FleetCor Technologies, Inc. and Andrew R. Blazye (incorporated by reference to Exhibit 10.16 to Amendment No. 2 to the registrant’s Registration Statement on form S-1, file number 333-166092, filed on June 8, 2010) | ||
Exhibit | ||
| 10.16 | Sixth Amended and Restated Registration Rights Agreement, dated April 1, 2009, between FleetCor Technologies, Inc. and each of the stockholders party thereto (incorporated by reference to Exhibit 10.17 to Amendment No. 2 to the registrant’s Registration Statement on form S-1, file number 333-166092, filed on June 8, 2010) | |
| 10.17 | First Amendment to Sixth Amended and Restated Registration Rights | |
| 10.18 | Credit Agreement, dated June 29, 2005, among FleetCor Technologies Operating Company, LLC, as Borrower, FleetCor Technologies, Inc., as Parent, JPMorgan Chase Bank, N.A., as Administrative Agent, Collateral Agent and L/C Issuer, PNC Bank, National Association, as Syndication Agent, the other lenders party thereto, and J.P. Morgan Securities Inc. and PNC Capital Markets, Inc. as Co-Lead Arrangers and Joint Bookrunners (incorporated by reference to Exhibit 10.18 to Amendment No. 1 to the registrant’s Registration Statement on form S-1, file number 333-166092, filed on May 20, 2010). | ||
| 10.19 | Fourth Amended and Restated Receivables Purchase Agreement, dated October 29, 2007, among FleetCor Funding LLC, as Seller, FleetCor Technologies Operating Company, LLC, as Servicer, the various purchaser groups from time to time party thereto and PNC Bank, National Association, as Administrator (incorporated by reference to Exhibit 10.19 to Amendment No. 1 to the registrant’s Registration Statement on form S-1, file number 333-166092, filed on May 20, 2010). | ||
| 10.20 | First Amendment to the Fourth Amended and Restated Receivables Purchase Agreement, dated July 8, 2008, among FleetCor Funding LLC, as Seller, FleetCor Technologies Operating Company, LLC, as Servicer, the various purchaser groups from time to time party thereto and PNC Bank, National Association, as Administrator (incorporated by reference to Exhibit 10.20 to Amendment No. 1 to the registrant’s Registration Statement on form S-1, file number 333-166092, filed on May 20, 2010). | ||
| 10.21 | Assignment, Assumption Agreement and Second Amendment to the Fourth Amended and Restated Receivables Purchase Agreement, dated November 10, 2008, among FleetCor Funding LLC, as Seller, FleetCor Technologies Operating Company, LLC, as Servicer, Market Street Funding LLC, as conduit purchaser assignor and as related committed purchaser assignor, Atlantic Asset Securitization LLC, as a conduit purchaser and assignee, Calyon New York Branch, as a related committed purchaser assignee and the purchaser agent for the Atlantic Purchaser Group, the various purchaser agents, conduit purchasers and related committed purchasers listed on the signature pages thereto, and PNC Bank, National Association, as purchaser agent for the Market Street Purchaser Group and Administrator (incorporated by reference to Exhibit 10.21 to Amendment No. 1 to the registrant’s Registration Statement on form S-1, file number 333-166092, filed on May 20, 2010). | ||
| 10.22 | Third Amendment to the Fourth Amended and Restated Receivables Purchase Agreement, dated February 25, 2010, among FleetCor Funding LLC, as Seller, FleetCor Technologies Operating Company, LLC, as Servicer, the various purchaser groups from time to time party thereto and PNC Bank, National Association, as Administrator (incorporated by reference to Exhibit 10.22 to Amendment No. 1 to the registrant’s Registration Statement on form S-1, file number 333-166092, filed on May 20, 2010). | ||
| 10.23 | Fourth Amendment to the Fourth Amended and Restated Receivables Purchase Agreement, dated February 24, 2011, among FleetCor Funding LLC, FleetCor Technologies Operating Company, LLC, the various purchaser agents, conduit purchasers and related committed purchasers listed on the signature pages thereto, and PNC Bank, National Association, as administrator, (incorporated by reference to Exhibit 10.1 to the registrant’s Current Report on form 8-K, filed on March 1, 2011). | ||
Exhibit | ||
| 10.24 | Purchase and Sale Agreement, dated December 20, 2004, among various entities listed on Schedule I thereto, as originators, and FleetCor Funding LLC (incorporated by reference to Exhibit 10.23 to Amendment No. 1 to the registrant’s Registration Statement on form S-1, file number 333-166092, filed on May 20, 2010). | |
| 10.25 | First Amendment to Purchase and Sale Agreement, dated February 3, 2005, among FleetCor Funding LLC and each originator party thereto (incorporated by reference to Exhibit 10.24 to Amendment No. 1 to the registrant’s Registration Statement on form S-1, file number 333-166092, filed on May 20, 2010). | |
| 10.26 | Second Amendment to Purchase and Sale Agreement, dated March 28, 2005, among FleetCor Funding LLC and each originator party thereto (incorporated by reference to Exhibit 10.25 to Amendment No. 1 to the registrant’s Registration Statement on form S-1, file number 333-166092, filed on May 20, 2010). | |
| 10.27 | Third Amendment to Purchase and Sale Agreement, dated August 1, 2005, among FleetCor Funding LLC and each remaining originator listed on Schedule I thereto (incorporated by reference to Exhibit 10.26 to Amendment No. 1 to the registrant’s Registration Statement on form S-1, file number 333-166092, filed on May 20, 2010). | ||
| 10.28 | Fourth Amendment to Purchase and Sale Agreement, dated October 29, 2007, among FleetCor Funding LLC and each originator listed on the signature pages thereto (incorporated by reference to Exhibit 10.27 to Amendment No. 1 to the registrant’s Registration Statement on form S-1, file number 333-166092, filed on May 20, 2010). | ||
| 10.29 | Fifth Amendment to Purchase and Sale Agreement, dated July 8, 2008, among FleetCor Funding LLC and each originator listed on the signature pages thereto (incorporated by reference to Exhibit 10.28 to Amendment No. 1 to the registrant’s Registration Statement on form S-1, file number 333-166092, filed on May 20, 2010). | ||
| 10.30 | Performance Guaranty, dated December 20, 2004, among FleetCor Technologies, Inc. and FleetCor Technologies Operating Company, LLC, in favor of PNC Bank, National Association (incorporated by reference to Exhibit 10.29 to Amendment No. 1 to the registrant’s Registration Statement on form S-1, file number 333-166092, filed on May 20, 2010). | ||
| 10.31 | First Amendment to Performance Guaranty, dated March 19, 2010, among FleetCor Technologies, Inc., FleetCor Technologies Operating Company, LLC, PNC Bank, National Association and Credit Agricole Corporate and Investment Bank New York Branch (incorporated by reference to Exhibit 10.30 to Amendment No. 1 to the registrant’s Registration Statement on form S-1, file number 333-166092, filed on May 20, 2010). | ||
| 10.32 | Second Amendment to Performance Guaranty, dated February 24, 2011, among FleetCor Technologies, Inc., FleetCor Technologies Operating Company, LLC, PNC Bank, National Association, and Credit Agricole Corporate and Investment Bank (incorporated by reference to Exhibit 10.2 to the registrant’s Current Report on form 8-K, filed on March 1, 2011). | ||
| 10.33 | Credit Facilities Agreement, dated December 7, 2006, among FENIKA, s.r.o., CCS Ceská spolecnost pro platební karty a.s. and Bank Austria Creditanstalt AG, as Arranger (incorporated by reference to Exhibit 10.31 to Amendment No. 1 to the registrant’s Registration Statement on form S-1, file number 333-166092, filed on May 20, 2010). | ||
| 10.34 | First Amendment to Credit Facilities Agreement, dated March 25, 2008, among CCS Ceská spolecnost pro platební karty s.r.o., as Borrower, FleetCor Luxembourg Holding 3 S.à r.l., as Guarantor, Bank Austri Creditanstalt AG, as Facility Agent, and Unicredit Bank Czech Republic, A.S., as lender (incorporated by reference to Exhibit 10.32 to Amendment No. 1 to the registrant’s Registration Statement on form S-1, file number 333-166092, filed on May 20, 2010). | ||
Exhibit | ||
| 10.35 | Payment Undertaking dated December 7, 2006, among FleetCor Technologies, Inc., CCS Ceská spolecnost pro platební karty a.s., Bank Austria Creditanstalt AG, as Arranger, Original Lender and Facility Agent, and HVB Bank Czech Republic a.s., as Security Agent (incorporated by reference to Exhibit 10.33 to Amendment No. 1 to the registrant’s Registration Statement on form S-1, file number 333-166092, filed on May 20, 2010). | |
| 10.36 | Form of Indemnity Agreement to be entered into between FleetCor and representatives of its major stockholders (incorporated by reference to Exhibit 10.37 to Amendment No. 3 to the registrant’s Registration Statement on form S-1, file number 333-166092, filed on June 29, 2010). | |
| 10.37 | Form of Director Restricted Stock Grant Agreement pursuant to the FleetCor Technologies, Inc. 2010 Equity Compensation Plan (incorporated by reference to Exhibit 10.38 to Amendment No. 6 to the registrant’s Registration Statement on form S-1, file number 333-166092, filed on November 30, 2010). | |
| 10.38* | Form of Employee Performance Share Restricted Stock Agreement pursuant to the FleetCor Technologies, Inc. 2010 Equity Compensation Plan (incorporated by reference to Exhibit 10.39 to Amendment No. 6 to the registrant’s Registration Statement on form S-1, file number 333-166092, filed on November 30, 2010). | ||
| 10.39* | Form of Employee Incentive Stock Option Award Agreement pursuant to the FleetCor Technologies, Inc. 2010 Equity Compensation Plan (incorporated by reference to Exhibit 10.40 to Amendment No. 6 to the registrant’s Registration Statement on form S-1, file number 333-166092, filed on November 30, 2010). | ||
| 10.40* | Form of Employee Non-Qualified Stock Option Award Agreement pursuant to the FleetCor Technologies, Inc. 2010 Equity Compensation Plan (incorporated by reference to Exhibit 10.41 to Amendment No. 6 to the registrant’s Registration Statement on form S-1, file number 333-166092, filed on November 30, 2010). | ||
| 10.41 | Form of Director Non-Qualified Stock Option Award Agreement pursuant to the FleetCor Technologies, Inc. 2010 Equity Compensation Plan (incorporated by reference to Exhibit 10.42 to Amendment No. 6 to the registrant’s Registration Statement on form S-1, file number 333-166092, filed on November 30, 2010). | ||
| 10.42* | Amended and Restated Employee Noncompetition, Nondisclosure and Developments Agreement, dated November 29, 2010, between FleetCor Technologies, Inc. and Ronald F. Clarke (incorporated by reference to Exhibit No. 10.43 to Amendment No. 6 to the registrant’s Registration Statement on form S-1, file number 333-166092, filed on November 30, 2010). | ||
| 10.43 | Pledge Agreement, dated as of June 22, 2011, by and among FleetCor Technologies, Inc., FleetCor Technologies Operating Company, LLC, certain Domestic Subsidiary Guarantors and Bank of America, N.A. (incorporated by reference to exhibit No. 10.2 to the registrant’s form 8-K, filed on June 24, 2011) | ||
| 10.44 | Fifth Amendment to the Fourth Amended and Restated Receivables Purchase Agreement, dated as of June 22, 2011, by and among FleetCor Funding LLC., PNC Bank, National Association and the other parties thereto (incorporated by reference to exhibit No. 10.3 to the registrant’s form 8-K, filed on June 24, 2011) | ||
| 10.45 | Second Amendment to Performance Guaranty, dated as of June 22, 2011, by and among FleetCor Technologies, Inc., PNC Bank, National Association and the other parties thereto (incorporated by reference to exhibit No. 10.4 to the registrant’s form 8-K, filed on June 24, 2011) | ||
Exhibit | ||
| 10.46 | Sixth Amendment to the Fourth Amended and Restated Receivables Purchase Agreement, dated September 30, 2011, among FleetCor Funding LLC, FleetCor Technologies Operating Company, LLC, the various purchaser agents, conduit purchasers and related committed purchasers listed on the signature pages thereto, and PNC Bank, National Association, as administrator (incorporated by reference to Exhibit 10.1 to the Registrant’s Current Report on Form 8-K, filed on October 6, 2011) | |
| 10.47 | Seventh Amendment to the Fourth Amended and Restated Receivables Purchase Agreement, dated February 6, 2012, among FleetCor Funding LLC, FleetCor Technologies Operating Company, LLC, the various purchaser agents, conduit purchasers and related committed purchasers listed on the signature pages thereto, and PNC Bank, National Association, as administrator (incorporated by reference to exhibit No. 10.1 to the registrant’s form 8-K, filed on February 6, 2012) | |
| 10.48 | Credit Agreement, by and among FleetCor Technologies, Inc. and certain of its subsidiaries, as borrowers and guarantors, Bank of America, N.A., as administrative agent, swing line lender and letter of credit issuer, and the other lenders party thereto (incorporated by reference to exhibit No. 10.1 to the registrant’s form 8-K, filed on June 24, 2011) | |
| 11.1 | Statement of Computation of Share Earnings (See Note 15) | |
| 21.1 | List of subsidiaries of FleetCor Technologies, Inc. | |
| 23.1 | Consent of Independent Registered Public Accounting Firm | |
| 31.1 | Certification of Chief Executive Officer Pursuant to Section 302 | |
| 31.2 | Certification of Chief Financial Officer Pursuant to Section 302 | |
| 32.1 | Certification of Chief Executive Officer Pursuant to Section 906 | |
| 32.2 | Certification of Chief Financial Officer Pursuant to Section 906 | |
| 101 | The following financial information from the Annual Report on Form 10-K for the fiscal year ended December 31, 2011, formatted in XBRL (“Extensible Business Reporting Language”) and furnished electronically herewith: (i) the Consolidated Balance Sheets; (ii) the Consolidated Statements of Income; (iii) the Consolidated Statements of Comprehensive Income; (iv) the Consolidated Statements of Changes in Equity; (v) the Consolidated Statements of Cash Flows; and (vi) the Notes to the Consolidated Financial Statements | |
| * | Identifies management contract or compensatory plan or arrangement. |
Pursuant to the requirements of Section 13 or 15(d) of the Securities Exchange Act of 1934, the Registrant has duly caused this report to be signed on its behalf by the undersigned; thereunto duly authorized, in the City of Atlanta, State of Georgia, on March 25, 2011.February 29, 2012.
| FleetCor Technologies, Inc. | ||
By: | /s/ | |
| Ronald F. Clarke | ||
| President and Chief Executive Officer | ||
Pursuant to the requirements of the Securities Exchange Act of 1934, this report has been signed below by the following persons on behalf of Registrant and in the capacities indicated on March 25, 2011.February 29, 2012.
Signature | Title | |
/s/ RONALD F. CLARKE Ronald F. Clarke
| President, Chief Executive Officer and Chairman of the Board of Directors (Principal Executive Officer) | |
/s/ ERIC R. DEY Eric R. Dey
| Chief Financial Officer (Principal Financial Officer and Principal Accounting Officer) | |
/s/ ANDREW B. BALSON Andrew B. Balson
| Director | |
/s/ JOHN R. CARROLL John R. Carroll
| Director | |
/s/ BRUCE R. EVANS Bruce R. Evans
| Director | |
/s/ MARK A. JOHNSON Mark A. Johnson
| Director | |
/s/ RICHARD MACCHIA Richard Macchia
| Director | |
/s/ GLENN W. MARSCHEL Glenn W. Marschel
| Director | |
/s/ STEVEN T. STULL Steven T. Stull
| Director | |
103116