UNITED STATES
SECURITIES AND EXCHANGE COMMISSION
Washington, D.C. 20549
FORM 10-K
(Mark One)
| þ ANNUAL | REPORT PURSUANT TO SECTION 13 OR 15(d) OF THE SECURITIES EXCHANGE ACT OF 1934 |
For the fiscal year ended December 31, 20102011
OR
| ¨ TRANSITION | REPORT PURSUANT TO SECTION 13 OR 15(d) OF THE SECURITIES EXCHANGE ACT OF 1934 |
For the transition period from to
Commission File No. 001-35083
GSI Group Inc.
(Exact name of registrant as specified in its charter)
| New Brunswick, Canada | 98-0110412 | |
| (State or other jurisdiction of incorporation or organization) | (I.R.S. Employer Identification No.) | |
| 125 Middlesex Turnpike | 01730 | |
| Bedford, Massachusetts, USA | (Zip Code) | |
| (Address of principal executive offices) | ||
(781) 266-5700
(Registrant’s telephone number, including area code)
Securities Registered Pursuant to Section 12(b) of the Act:
Title of Each Class | Name of Exchange on Which Registered | |
| Common Shares, no par value | The NASDAQ Stock Market LLC |
Securities Registered Pursuant to Section 12(g) of the Act:
None
Indicate by check mark if the registrant is a well-known seasoned issuer, as defined in Rule 405 of the Securities Act. Yes ¨ No þ
Indicate by check mark if the registrant is not required to file reports pursuant to Section 13 or 15(d) of the Act. Yes ¨ No þ
Indicate by check mark whether the registrant (1) has filed all reports required to be filed by Section 13 or 15(d) of the Securities Exchange Act of 1934 during the preceding 12 months (or such shorter period that the registrant was required to file such reports), and (2) has been subject to such filing requirements for the past 90 days. Yes þ No ¨
Indicate by check mark whether the registrant has submitted electronically and posted on its corporate Website, if any, every Interactive Data File required to be submitted and posted pursuant to Rule 405 of Regulation S-T (Section 232.405 of this chapter) during the preceding 12 months (or for such shorter period that the registrant was required to submit and post such files). Yes ¨þ No ¨
Indicate by check mark if disclosure of delinquent filers pursuant to Item 405 of Regulation S-K is not contained herein, and will not be contained, to the best of registrant’s knowledge, in definitive proxy or information statements incorporated by reference in Part III of this Form 10-K or any amendment to this Form 10-K. ¨þ
Indicate by check mark whether the registrant is a large accelerated filer, an accelerated filer, a non-accelerated filer, or a smaller reporting company. See the definitions of “large accelerated filer”, “accelerated filer” and “smaller reporting company” in Rule 12b-2 of the Exchange Act. (Check one):
Large accelerated filer ¨ | Accelerated filer | Non-accelerated filer ¨ | Smaller reporting company | |||
(Do not check if a smaller reporting company) |
Indicate by check mark whether the registrant is a shell company (as defined in Rule 12b-2 of the Act). Yes ¨ No þ
The aggregate market value of the Registrant’s outstanding common shares held by non-affiliates of the Registrant, based on the closing price of the common shares on OTC Markets Group, Inc.the NASDAQ Global Select Market on the last business day of the Registrant’s most recently completed second fiscal quarter (July 2, 2010)1, 2011) was $54,981,836.$280,364,818. For purposes of this disclosure, common shares held by officers and directors of the Registrant and by persons who hold more than 5% of the Registrant’s outstanding common shares have been excluded because such persons may be deemed to be affiliates. This determination of affiliate status is not necessarily conclusive.
Indicate by check mark whether the registrant has filed all documents and reports required to be filed by Section 12 , 13 or 15(d) of the Securities Exchange Act of 1934 subsequent to the distribution of securities under a plan confirmed by a court. Yes þ No ¨
There were approximately 33,342,16933,515,041 of the Registrant’s common shares, no par value, issued and outstanding on February 28, 2011.29, 2012.
DOCUMENTS INCORPORATED BY REFERENCE
Portions of the Registrant’s Definitive Proxy Statement for the Registrant’s Annual Meeting of Shareholders scheduled to be held on May 11, 2011June 14, 2012 to be filed with the Securities and Exchange Commission are incorporated by reference in answer to Part III of this Annual Report on Form 10-K.
GSI GROUP INC.
FORM 10-K
YEAR ENDED DECEMBER 31, 20102011
As used in this report, the terms “we,” “us,” “our,” “GSI Group”, “GSI”, “GSIG” and the “Company” mean GSI Group Inc. and its subsidiaries, unless the context indicates another meaning.
Unless otherwise noted, all dollar amounts in this report are expressed in United States dollars.
The following trademarksbrand and trade names of GSI Group are used in this report: GSI WaferMark,™, GSI WaferRepair,™, GSI WaferTrim,™, GSI CircuitTrim,™, MicroE® Systems, Westwind Air Bearings, Synrad, JK Lasers, Continuum, Quantronix, Baublys, Control Laser, Cambridge Technology, ExoTec Precision, The Optical Corporation, General Scanning Thermal Printers, Photo Research, JK Fiber Lasers and Westwind®.Spectron Lasers.
PART I
Cautionary Note Regarding Forward-Looking Statements
Except for historical information, the matters discussed in this Annual Report on Form 10-K are forward-looking statements that involve risks, uncertainties and assumptions that, if they never materialize or if they prove incorrect, could cause our consolidated results to differ materially from those expressed or implied by such forward-looking statements. The Company makes such forward-looking statements under the provision of the “Safe Harbor” section of the Private Securities Litigation Reform Act of 1995. Actual future results may vary materially from those projected, anticipated, or indicated in any forward-looking statements as a result of various factors, including those set forth in Item 1A of this Annual Report on Form 10-K under the heading “Risk Factors.” Readers should also carefully review the risk factors described in the other documents that we file from time to time with the SEC. In this Annual Report on Form 10-K, the words “anticipates,” “believes,” “expects,” “intends,” “future,” “could,” “estimates,” “plans,”, “would,” “should,” “potential,” “continues” and similar words or expressions (as well as other words or expressions referencing future events, conditions or circumstances) identify forward-looking statements. Forward-looking statements also include the assumptions underlying or relating to any of the foregoing statements. The forward-looking statements contained in this Annual Report include, but are not limited to, statements related to: anticipated financial performance; expected liquidity and capitalization; drivers of revenue growth; management’s plans and objectives for future operations, expenditures and product development, and investments in research and development; business prospects; potential of future product releases; anticipated sales performance; industry trends; market conditions; changes in accounting principles; changes in actual or assumed tax liabilities; expectations regarding tax exposures; anticipated reinvestment of future earnings; anticipated expenditures in regard to the adequacyCompany’s benefit plans; future acquisitions and dispositions and anticipated benefits from such acquisitions; anticipated outcomes of cash flowsthe legal proceedings and litigation matters; anticipated use of currency hedges; timing, scope and expected savings and charges related to realignment and restructuring initiatives; expected interest savings from operations and available cash; our refinancing; ability to improverepay our liquidity, and the impact of our reorganization on our general liquidity, including our ability to obtain working capital loans or to refinance our existing indebtedness; our ability to grow inintentions regarding the future and generate meaningful shareholder value; our ability to integrate businesses we have acquired; our ability to recruit permanent management; our industry position and our ability to operate successfully as markets recover; our internal controls over accounting for revenue recognition and our financial close process; our resultsuse of operations and financial condition; our ability to maintain listing of our common shares on NASDAQ or another securities exchange;cash; and other statements that are not historical facts. All forward-looking statements included in this document are based on information available to us on the date hereof. We will not undertake and specifically decline any obligation to update any forward-looking statements.
OVERVIEW
GSI Group Inc. and its subsidiaries (collectively referred to as the “Company”, “we”, “us”, “ours”) design, develop, manufacture and sell precision motion control devices and associated precision technologies, photonics-basedlaser-based solutions (consisting of lasers and laser-based systems), laser systemsscanning devices, and electro-optical components)precision motion and semiconductor systems.optical control technologies. Our customers incorporate our technology is incorporated into theircustomer products or manufacturing processes for a wide range of applications in a variety of markets, including: industrial, scientific, electronics, semiconductor,industrial, medical, and aerospace.scientific. Our products enable customers to make advances in materials and processing technology and to meet extremely precise manufacturing specifications.
Our products are grouped into three segments: Precision Technology, Semiconductor Systemsstrategy is to drive sustainable, profitable growth through short term and Excel. We strive to create shareholder value through:long term initiatives, including:
Driving profitable organic sales growthstrengthening our strategic position in scanning solutions, fiber lasers, and medical components through our participationcontinual investment in attractive end markets;differentiated new products and solutions;
Delivering a continual stream of successful new product launches incorporating differentiated technology;expanding our market access and reach, particularly in higher growth, emerging regions, through investment in internal sales channels as well as external channel partners;
Generating high levels of cash flow from operations;
Broadeningbroadening our product and service offerings through the acquisition of innovative and complementary technologies and solutions;
streamlining our existing operations through site consolidations and strategic divestitures and expanding our business through strategic acquisitions;
expanding operating margins by establishing a continuous improvement culture through formalized productivity programs and initiatives; and
Attracting,attracting, retaining, and developing talented and motivated employees.
GSI Group Inc. was founded and initially incorporated in Massachusetts in 1968 as General Scanning, Inc. (“General Scanning”). General Scanning developed, manufactured and sold components and subsystems used for high-speed micro positioning of laser beams. In 1999, General Scanning merged with Lumonics Inc., a Canadian company that developed, manufactured and sold laser-based, advanced manufacturing systems for electronics, semiconductor, and general industrial applications. The post-merger entity, GSI Lumonics Inc., continued under the laws of the Province of New Brunswick, Canada. In 2005, we changed our name to GSI Group Inc. In August 2008, we acquired Excel Technology, Inc. (“Excel”), a designer, manufacturer and marketer of photonics-based solutions consisting of lasers, laser-based systems, precision motion devices, and electro-optical components primarily used in industrial and scientific applications.
We maintain a website with the addresshttp://www.gsig.com. We are not including the information contained in our website as part of, or incorporating it by reference into, this Annual Report on Form 10-K. We make available, free of charge through our website, our annual reports on Form 10-K, quarterly reports on Form 10-Q, current reports on Form 8-K and amendments to these reports as soon as reasonably practicable after we electronically file these materials with, or otherwise furnish them to, the Securities and Exchange Commission (“SEC”). In addition, our reports and other information are filed with securities commissions or other similar authorities in Canada, and are available over the Internet athttp://www.sedar.com.
RECENT DEVELOPMENTS
A number of events have occurred since August 2008 that are importantDuring the first quarter ended April 1, 2011, we modified our operating segments into three reportable segments: Laser Products, Precision Motion and Technologies, and Semiconductor Systems. The prior period information stated herein has been restated to an understanding of our Company.
In August 2008, we acquired Excel Technology, Inc. (“Excel”), a designer, manufacturerconform to the new segment presentation. The following table shows the revenues and marketer of photonics-based solutions consisting of lasers, laser-based systems, precision motion devices and electro-optical components primarily used in industrial and scientific applications,gross profit percentage for approximately $368.7 million. A portioneach of the Excel purchase price was financed with proceeds from the issuance of $210 million of 11% Senior Notes due 2013 (the “2008 Senior Notes”).
Following the acquisition of Excel, during the fourth quarter of 2008, we identified errors in the timing of revenue recognized in connection with sales to customers in our Semiconductor Systems segment during the first and second quarters of 2008. We subsequently identified additional errors in the timing of revenue recognized in 2004, 2005, 2006 and 2007 and announced that previously issued financial statements for 2004 through 2008 would be restated.
As a result of the Excel acquisition and errors identified in the timing of revenue recognized in earlier periods, we were unable to file our Quarterly Report on Form 10-Qthree segments for the periodyear ended September 26, 2008 within the time permitted by SEC rules. Consequently, certain holders of the 2008 Senior Notes notified us that we wereDecember 31, 2011 (dollars in default of the reporting provisions of the indenture governing the 2008 Senior Notes (the “2008 Senior Note Indenture”). In November 2009, we entered into an agreement with certain beneficial owners holding approximately 88.1% of the outstanding aggregate principal amount of the 2008 Senior Notes to reduce the obligations outstanding under the 2008 Senior Notes. In order to implement the debt restructuring, on November 20, 2009, our holding company, GSI Group Inc. (“GSIG”), and two of our wholly-owned United States subsidiaries, GSI Group Corporation (“GSI US”) and MES International, Inc. (“MES” and, collectively with GSIG and GSI US, the “Debtors”), filed voluntary petitions for relief under Chapter 11 of the United States Bankruptcy Code (the “Bankruptcy Code”). In May 2010, we reached a consensual agreement with the parties-in-interest to the Chapter 11 proceedings and on May 27, 2010, the United States Bankruptcy Court approved our Final Fourth Modified Chapter 11 Plan of Reorganization (the “Final Chapter 11 Plan”). We emerged from bankruptcy on July 23, 2010 and in connection therewith completed a rights offering pursuant to which we sold common shares for approximately $64.9 million in cash proceeds. The proceeds from the rights offering were used to pay down a portion of the 2008 Senior Notes. The remaining obligations due with respect to the 2008 Senior Notes were satisfied through the issuance of common shares, the payment of cash and the issuance of new 12.25% Senior Secured PIK Election Notes due 2014 (the “New Notes”). In addition, upon our emergence from Chapter 11 restructuring on July 23, 2010, our Board of Directors was reconstituted.
| Sales | Gross Profit Margin | |||||||
Laser Products | $ | 130,957 | 37.2 | % | ||||
Precision Motion and Technologies | 191,382 | 47.4 | % | |||||
Semiconductor Systems | 43,941 | 47.6 | % | |||||
|
| |||||||
Total | $ | 366,280 | 43.8 | % | ||||
|
| |||||||
Additional information regarding the acquisition of Excel and the Chapter 11 proceedings can be found in the Notes to our 2010 Consolidated Financial Statements included elsewhere in this Annual Report on Form 10-K.
Following our emergence from bankruptcy, our Board of Directors commenced a search for a permanent Chief Executive Officer (“CEO”) which culminated in the appointment of John Roush as Chief Executive Officer effective December 14, 2010. Following Mr. Roush’s appointment, we announced in February 2011 the hiring of a permanent Chief Financial Officer (“CFO”), Robert Buckley. Mr. Buckley will assume the role of our CFO shortly after the filing of this Annual Report on Form 10-K.
On December 29, 2010, we announced that the 1 for 3 reverse stock split previously approved by our Board of Directors and shareholders became effective and that we had filed an application to list our common shares on The NASDAQ Stock Market LLC. Our common shares began trading on The NASDAQ Global Select Market on February 14, 2011.
Lastly, on February 22, 2011, the United States District Court for the District of Massachusetts entered an order granting final approval of the previously announced settlement in a putative shareholder class action that was filed on December 12, 2008 following our announcement that previously issued financial statements for 2008 would be restated as a result of errors identified in the timing of revenue recognized in connection with sales to customers in our Semiconductor Systems segment. See Note 1413 to Consolidated Financial Statements for additional financial information regarding the settlement.
OUR CONTINUING OPERATIONS
We operate in three segments: Precision Technology, Semiconductor Systems and Excel, which are described below.about our segments.
Precision TechnologyLaser Products Segment
Our Precision TechnologyThe Laser Products segment designs, manufactures and markets photonics-based solutions, consisting of lasers optics, air bearing spindles, encoders, and thermal printerslaser-based systems, to customers worldwide. The products that we sell to original equipment manufacturers (“OEM’s”) include those based on our core competencies in laser, precision motionsegment serves highly demanding photonics-based applications such as cutting, welding, marking, engraving, micro-machining, and motion control technology.scientific research. The businesses that comprise our Precision Technology segment sell theirsells these products both directly utilizing our highly technical sales force and indirectly through resellers and distributors.
The Precision TechnologyLaser Products segment has fiveis comprised of three major product lines:
Product Line | Key End Markets | Brand Names | Description | |||
| Industrial Lasers | Industrial, Electronics, Automotive, Medical, Packaging and Aerospace | JK Lasers, Spectron Lasers, | Applications include welding, cutting, drilling, surface marking, and | |||
| Laser Systems | Industrial, Packaging and | Control Laser, Baublys | Applications include laser marking, engraving, semiconductor analysis and repair | |||
Precision Motion and Technologies Segment
The Precision Motion and Technologies segment designs, manufactures and markets air bearing spindles, encoders, thermal printers, laser scanning devices, and light and color measurement systems to customers worldwide. The vast majority of the segment’s product offerings are sold to original equipment manufacturers (“OEM’s”) based on the segment’s core competencies in precision motion and optical control technologies. The segment sells these products both directly utilizing a highly technical sales force and indirectly through resellers and distributors.
The Precision Motion and Technologies segment has five major product lines:
Product Line | Key End Markets | Brand Names | Description | |||
| Printed Circuit Board Spindles | Electronics | Westwind Air Bearings | High-speed air bearing spindles used to drill very small and precise holes in printed circuit | |||
| Optical Encoders | Electronics, Industrial, Scientific and Medical | MicroE Systems | Linear and rotary electro-optical tracking devices that measure movement with sub-micron accuracy. Applications include motion control of semiconductor and electronic manufacturing equipment, confocal microscopes, positioning magnetic rings on hard drives, precision manufacturing, | |||
Aerospace, Automotive, Lighting, Motion Picture, Research and | ||||||
Semiconductor Systems Segment
Our Semiconductor Systems segment designs, developsDevelopment, Electronics and sells production systems that process semiconductor wafers using laser beams and high precision motion technology. Systems manufactured by our Semiconductor Systems segment are sold to integrated device manufacturers and wafer processors. Our systems perform laser-based processing on all of the following types of semiconductors: general wafers used for logic or memory purposes, dynamic random access memory (DRAM, “Not And” or NAND) chips and high performance analog chips.
Semiconductor manufacturers’ main technology challenge is to meet the trend toward ever shrinking circuit sizes demanded by consumers of micro-electronics, such as cell phones. As semiconductor manufacturers put more memory on smaller dye, the two critical challenges for production system suppliers are the ability to provide systems that can process wafers with manufacturing accuracy to the sub-micron level and to increase the wafer processing throughput.
Our Semiconductor Systems segment has three major product lines:
|
|
| ||
| ||||
| ||||
|
|
| ||
|
Our Semiconductor Systems segment also includes a smaller product line, CircuitTrim systems, which are used in the production of thick and thin film resistive components for surface mount technology electronic circuits, known as chip resistors, as well as thick and thin film hybrid circuits, and for adjusting the performance of complete multi-chip modules.
Excel Segment
Our Excel segment designs, manufactures and markets photonics-based solutions consisting of lasers, laser-based systems, precision motion devices and electro-optical components, primarily for industrial and scientific applications. We sell the products in the Excel segment to customers worldwide, both directly and indirectly through resellers and distributors.
The Excel segment has four major product lines:
Product Line | Key End Markets | Brand Names | Description | |||
| Laser Scanners | Industrial, Medical, Electronics, Scientific, Aerospace and Military | Cambridge Technology, The Optical Corporation and ExoTec Precision | High precision motors that, when coupled with a mirror, can direct a laser beam with a high degree of accuracy. Applications include | |||
Semiconductor Systems Segment
Our Semiconductor Systems segment designs, develops and sells laser-based production systems for semiconductor, microelectronics and electronics manufacturing. The segment offers a full spectrum of production systems, featuring high precision laser and motion technology, to process semiconductor wafers, LCD panels and microelectronic components. Semiconductor Systems’ solutions address a wide range of applications in a variety of end markets, including industrial, scientific, consumer electronics, medical, and aerospace. Today, the segment supplies leading global foundries, integrated device manufacturers and component manufacturers.
Our Semiconductor Systems segment has three major product lines:
Product Line | Key End Markets | Brand Names | Description | |||
| WaferRepair | Semiconductor—DRAM, Flash Memory chips, and LCDs | GSI WaferRepair | Used to raise production yields for 300mm and 200mm DRAM and NAND wafers to commercially acceptable levels and to upgrade equipment for LCD panels and modules | |||
| WaferMark | Semiconductor—silicon suppliers and integrated circuit factories | GSI WaferMark | Used to mark silicon wafers with characters or markings at various stages of the wafer and integrated circuit manufacturing process. The marks are designed to aid process control and device traceability | |||
Product Line | Key End Markets | Brand Names | Description | |||
| GSI WaferTrim and GSI CircuitTrim | |||||
Excel’s Scanners product line includes certain portions of a specific product line that was previously included within the Precision Technology segment, which were transferred to and integrated with Excel’s existing business in 2009.
Products and Services
The following table shows the revenues and gross margins for each of the three segments for the year ended December 31, 2010 (dollars in thousands):
| Sales | Gross Profit Percentage | |||||||
Precision Technology | $ | 128,220 | 46.1 | % | ||||
Semiconductor Systems | 81,283 | 39.1 | % | |||||
Excel | 183,384 | 43.7 | % | |||||
Intersegment sales eliminations(1) | (9,371 | ) | 49.8 | % | ||||
Total | $ | 383,516 | 43.4 | % | ||||
See Note 15 to Consolidated Financial Statements for additional financial information about our segments.
Customers
We have a diverse group of customers that includesinclude companies that are global leaders in their industries. Many of our customers participate in several market segments. There were no customers with greater than 10% of our sales in 2011. In 2010, one customer Samsung,within the Semiconductor Systems segment accounted for approximately 11% of our sales. Samsung isIn 2009, a different customer and certain related parties of that customer within the Semiconductor Systems segment. In 2009, one customer, Powerchip Technology Corporation and certain related parties,segment accounted for approximately 10% of our sales. Powerchip Technology Corporation and certain related parties is a customer within the Semiconductor Systems segment. In 2008, no single customer accounted for 10% or more of our sales.
Customers of our Semiconductor Systems segment include some of the major semiconductor, electronic device and silicon wafer producers. Most of these customers are end users who use our systems to manufacture products that include silicon wafers, memory chips, flat panel displays, and analog and hybrid micro-circuits in volume in their factories. A large number of these customers are based in Asia.
Customers of our Precision TechnologyMotion and ExcelTechnologies and Laser Products segments include a large number of original equipment manufacturersOEMs who integrate our products into their systems for sale to end users. Some of ourOur Precision TechnologyMotion and Excel products areTechnologies and Laser Products segments also soldsell directly to end users. Precision TechnologyMotion and Technologies segment and ExcelLaser Products segment customers include leaders in the semiconductor equipment, industrial systems, electronics,microelectronics, automotive, data storage, and medical equipment markets. A typical OEM customer will usually evaluate a product designed and manufactured by our Precision Technology segment or Excel segmentability to provide application support and customization before deciding to incorporate our product into their product or system. Customers generally choose suppliers based on a number of factors, including product performance, reliability, application support, price, breadth of the supplier’s product offering, the financial condition of the supplier and the geographical coverage offered by the supplier. Once products of our Precision TechnologyMotion and Technologies segment and ExcelLaser Products segment have been designed into a given OEM customer’s product or system, there are generally significant barriers to subsequent supplier changes.
Seasonality
While on a consolidated basis our sales are not highly seasonal on a consolidated basis, the sales of some of our individual business units,product lines, particularly our laser businesses, are attributable to orders received from governmental entities or research institutions whose budgeting and funding cycles may be different from those of our commercial and industrial customers.
Backlog
As of December 31, 2010,2011, our consolidated backlog was approximately $92$78.0 million. Approximately $87 millionThe majority of orders included in backlog represent open orders for products and services that management has concluded have a reasonable probability of being delivered over the subsequent twelve month period. Orders included in backlog may be canceled or rescheduled by customers without significant penalty. Management believes that backlog is not a meaningful indicator of future business prospects for any of our business segments due to the wide range of different lead times required by our various types of customers.customers and the ability of our customers to reschedule or cancel orders. Therefore, backlog as of any particular date should not be relied upon as indicative of our revenues for any future period.
Manufacturing
Manufacturing functions are performed internally when management chooses to maintain control over critical portions of the production process or for cost related reasons. To the extent it makes financial sense, we will consider outsourcing additional portions of the production process. For example, our Semiconductor Systems segment focuses on outsourcing low value parts and modules and internally retains the tasks of final assembly of subsystems, testing and quality control.
Products offered by our Precision TechnologyLaser Products segment are manufactured at facilities in East Setauket, New York; Orlando, Florida; Santa Clara, California; Rugby, United Kingdom; Mukilteo, Washington; Suzhou, China; and Ludwigsburg, Germany.
Products offered by our Precision Motion and Technologies segment are primarily manufactured at facilities in Bedford and Lexington, Massachusetts; Poole Rugby and Taunton, United Kingdom; Chatsworth and Oxnard, California; and Suzhou, China.
The systems offered by our Semiconductor Systems segment are manufactured, assembled and tested in Bedford, Massachusetts. Products offered by our Excel segment are manufactured at facilities in Lexington, Massachusetts; East Setauket, New York; Orlando, Florida; Chatsworth, Oxnard and Santa Clara, California; Mukilteo, Washington; and Ludwigsburg, Germany.
MostMany of our products are manufactured under ISO 9001 certification and our encoders are manufactured under ISO 13485 certification.
Research and Development and Engineering
We incur research and development and engineering expenses as part of our ongoing operations. The following table shows total research and development and engineering expenses and as a percent of total sales for the years ended December 31, 2011, 2010 and 2009 (dollars in thousands):
| Year Ended December 31, | ||||||||||||
| 2011 | 2010 | 2009 | ||||||||||
Research and development and engineering expenses | $ | 31,966 | $ | 29,857 | $ | 28,254 | ||||||
As a percentage of sales | 8.7% | 7.8% | 11.1% | |||||||||
We are strongly committed to research and development for core technology programs directed at creating new products, product enhancements and new applications for existing products, as well as funding research into future market opportunities. Each of theOur markets that we serve is generally characterized byhave experienced rapid technological changechanges and product innovation.innovations. We believe that continued timely development of new products and product enhancements to serve existing and new markets is necessary for us to remain competitive.
In 2010, 2009 and 2008, respectively, we incurred research and development and engineering expenses of $29.9 million, $28.3 million and $33.4 million, which represents 7.8%, 11.1%, and 11.6% of sales, respectively.
Marketing, Sales and Distribution
We sell our products worldwide through our direct sales force team and through distributors and sales agents. In the case of products sold through our direct sales force, ordistributors. Our local sales, applications and service teams and our distributors work closely with our customers and leverage incremental supporting organizations from us to ensure customer satisfaction with our products. Our distributors work with customers in a similar fashion.
| • | Precision |
| • | Semiconductor Systemsproducts are sold directly and, in some territories, through distributors. |
| • |
|
Competition
The markets in which we compete are dynamic and highly competitive. Due to the wide range of our products, we face many different types of competition and competitors. This affects our ability to sell our products and the prices at which these products are sold. Our competitors range from large foreign and domestic organizations, which produce a comprehensive array of goods and services and that may have greater financial and other resources than we do, to small firms producing a limited number of goods or services for specialized market segments. We expect the proportion of large competitors to increase through the continued consolidation of competitors.
Competitive factors in our Precision TechnologyMotion and ExcelTechnologies and Laser Products segments include product performance, price, quality and reliability, features, flexibility, compatibility of products with existing systems, technical support, product breadth, market presence, on-time delivery and our overall reputation. The main competitive factors in the Semiconductor Systems segment include product performance, throughput and price. We believe that our products offer a number of competitive advantages,advantages; however, some of our competitors are substantially larger and have greater financial and other resources than us.
Raw Materials, Components and Supplies
Each of our businesses uses a wide variety of raw materials, key components and supplies that are generally available from alternatealternative sources of supply and in adequate quantities from domestic and foreign sources. In some instances, we design and/or re-engineer the parts and components used in our products. For certain critical raw materials, key components and supplies used in the production of some of our principal products, we have qualifiedidentified only a limited number of suppliers or, in some instances, a single source of supply. Sources for parts and components that we design and/or re-engineer may be more limited than off-the-shelf parts and components. We also rely on a limited number of independent contractors to manufacture subassemblies for some of our products.
The businesses that compriseIn the Laser Products segment, we rely upon unaffiliated suppliers for the material components and parts used to assemble our products. Most parts and components purchased from suppliers are available from multiple sources.
Our Precision TechnologyMotion and Technologies segment sourcesources most of theirits parts externally. However, they also manufacture many parts, includingexternally while some critical parts are manufactured internally, particularly in the air bearing spindlespindles business. Fully functional electronics as well as certain key components such as laser diodes, are purchased from external sources.
Our Semiconductor Systems segment purchases major subsystems, such as lasers, motion stages, vision systems and software, fully functional electronics, and frames and racks from the merchant market. Some of the optical components used in our systems are internally manufactured while others are purchased externally. In some cases, upper level assemblies and entire subsystems are outsourced to electronic manufacturing services companies.
In the Excel segment, we rely upon unaffiliated suppliers for the material components and parts used to assemble our products. Most parts and components purchased from suppliers are available from multiple sources.
For a further discussion of the importance to our business of, and the risks attendant to,associated with our supply chain, see “Risk Factors—Disruptions in the supply of or defects in raw materials, certain key components and other goods from our suppliers, including limited or single source suppliers, could have an adverse effect on the results of our business operations, and could damage our relationships with customers” inapplicable risk factors under Item 1A of this Annual Report on Form 10-K.
Patents and Intellectual Property
We rely upon a combination of copyrights, patents, trademarks, trade secret laws and restrictions on disclosure to protect our intellectual property rights. We hold approximately 360 issueda number of registered and pending patents approximately 200 in the United States and approximately 160 in foreign countries. These patents are set to expire from 2011 through 2029. Additionally, we have approximately 220 pending patents, approximately 40 in the United States and approximately 180 in foreignother countries. The issued patents cover various products in many of our key product
categories, particularly semiconductor systems, opticallaser scanning products, encoders, air bearing spindles, and lasers. In addition, we also have trademarks registered in the United States and foreign countries. We will continue to actively pursue application for new patents and trademarks as we deem appropriate. However, there can be no assurance that any other patents will be issued to us or that such patents, if and when issued, will provide any protection or benefit to us.
Although we believe that our patents and pending patent applications are important, we rely upon several additional factors that are essential to our business success, including: market position, technological innovation, know-how, application knowledge and product performance. There can be no assurance that we will realize any of these advantages.
We also protect our proprietary rights by controlling access to our proprietary information and by maintaining confidentiality agreements with our employees, and consultants, and certain of our customers and suppliers. For a further discussion of the importance toof risks associated with our business of, and the risks attendant to, intellectual property rights, see “Risk Factors—Others may violate our intellectual property rights” and “Risk Factors—Our success depends upon our ability to protect our intellectual property and to successfully defend against claims of infringement by third parties” inapplicable risk factors under Item 1A of this Annual Report on Form 10-K.
Human Resources
As of December 31, 2011 and 2010, we employed approximately1,539 and 1,593 employees, in our continuing operations, compared to employing approximately 1,297 employees in our continuing operations as of December 31, 2009. More than 60% of our workforce is related to production operations and field services. We consider our relations with employees to be satisfactory.respectively.
Geographic Information
EachWe are a multinational company with approximately 66% of our reporting segments conducts business in, and derives substantial revenue from, various countries2011 sales outside the United States. We are exposedStates and approximately 21% of our long-lived assets outside the United States at December 31, 2011. Geographic information is discussed in Note 13 to Consolidated Financial Statements. For a further discussion of the risks associated with internationalour foreign operations, including exchange rate fluctuations, regional and country-specific political and economic conditions, foreign receivables collection concerns, trade protection measures and import or export licensing requirements, tax risks, staffing and labor law concerns, intellectual property protection risks, and differing regulatory requirements. We anticipate that sales from international operations will continue to represent a substantial portionsee applicable risk factors under Item 1A of our total sales in the future.
Information regarding the geographic components of our sales and long-lived assets is provided in Note 15 to Consolidated Financial Statements included in this Annual Report on Form 10-K.
Government Regulation
We are subject to the laser radiation safety regulations of the Radiation Control for Health and Safety Act administered by the National Center for Devices and Radiological Health, a branch of the United States Food and Drug Administration. Among other things, those regulations require laser manufacturers to file new product and annual reports, to maintain quality control and sales records, to perform product testing, to distribute appropriate operating manuals, to incorporate design and operating features in lasers sold to end-users and to certify and label each laser sold to end-users as one of four classes (based on the level of radiation from the laser that is accessible to users). Various warning labels must be affixed and certain protective devices installed depending on the class of product. The National Center for Devices and Radiological Health is empowered to seek fines and other remedies for violations of the regulatory requirements. We are also subject to certain safety regulations in the United Kingdom related to the manufacturing of beryllium structures. The Control of Substances Hazardous to Health (COSHH) regulations are administered by the Health and Safety Executive and require us to monitor beryllium levels, provide health safety information to our employees and limit exposure to beryllium. Non-compliance with these regulations could result in warnings, penalties or fines. We believe that we are currently in compliance with these regulations.
We are subject to similar regulatory oversight, including comparable enforcement remedies, in the European markets we serve.
The following risk factors could have a material adverse effect on our business, financial position, results of operations and cash flows and could cause the market value of our common shares to fluctuate or decline. These risk factors may not include all of the important factors that could affect our business or that could cause our future financial results to differ materially from historic or expected results or cause the market price of our common shares to fluctuate or decline.
Risks Relating to our Review of Historical Transactions, Restatement of Historical Consolidated Financial Statements and Control Procedures
The SEC’s formal investigation relating to our historical accounting practices and the restatement of our historical consolidated financial statements could continue to divert management’s attention and could result in adversarial proceedings, damages or penalties.
In addition to the recently settled litigation prompted by the restatement of our previously issued financial statements as discussed in Item 3, “Legal Proceedings”, we received a notice from the SEC indicating that the SEC is conducting a formal investigation relating to our historical accounting practices and the restatement of our historical consolidated financial statements. On September 16, 2010, we received a “Wells Notice” from the SEC, stating that the Staff is considering recommending that the Commission institute a civil injunctive action or administrative proceeding against us, alleging that we violated various provisions of the Securities Act and the Securities Exchange Act, and providing us with the opportunity to make a submission to the Staff in connection therewith. In connection with the contemplated action, the SEC may seek a permanent injunction or cease-and-desist order, disgorgement, prejudgment interest and the imposition of a civil penalty. We are cooperating fully with the SEC investigation. The conduct and resolution of the SEC investigation and related matters could be time-consuming, expensive and distracting to the conduct of our business and to our management. In the event that the investigation results in an adversarial action or proceeding being brought against us, or any of our current or former officers or directors, our business (including our ability to complete financing transactions), and the trading price of our securities, may be adversely impacted. Additionally, if the SEC investigation continues for a prolonged period of time, it may have the same impact regardless of the ultimate outcome of the investigation. In the event of an adverse judgment in any action or proceeding, we may be required to pay damages or penalties, or other remedies may be imposed upon us, which could have a material adverse impact on our business, financial condition, results of operations and cash flows.
Additionally, while we believe we have made appropriate judgments in determining the correct reporting periods for restated revenues, the SEC may disagree with the manner in which we have accounted for and reported, or not reported, the financial impact. Accordingly, there is a risk we may have to further restate our historical financial statements, amend prior filings with the SEC, or take other actions not currently contemplated.
Our management and independent auditors have identified material weaknesses in our internal controls, and we may be unable to develop, implement and maintain appropriate controls in future periods, which may lead to errors or omissions in our financial statements.
In connection with the preparation of our 2008, 2009 and 2010 financial statements, our management team and independent registered public accounting firm identified certain weaknesses in our internal controls that were considered to be material weaknesses and significant deficiencies. Specifically, as they relate to the 2008 financial statements, such material weaknesses included: inadequate and ineffective controls over the financial statement close process; inadequate and ineffective controls over the accounting for revenue recognition; inadequate and ineffective controls over the accounting for income taxes; and, inadequate and ineffective controls over the evaluation process for the impairment assessment for goodwill, intangible assets and other long-lived assets. The material weaknesses related to income taxes and the evaluation process for the impairment
assessment for goodwill, intangible assets, and other long-lived assets were remediated during 2009. The material weakness that was identified in 2009 related to Semiconductor Systems revenue recognition was remediated during 2010. The material weakness that was identified in 2009 related to the inadequate and ineffective controls over the financial statement close process was not fully remediated in 2010. Prior to the complete remediation of this material weakness, there remains risk that the transitional controls on which we currently rely will fail to be sufficiently effective, which could result in a material misstatement of our financial position or results of operations and require a restatement of our financial statements.
We are currently designing and implementing new procedures and controls intended to address the material weakness described above over the financial statement close process. While this design and implementation phase is underway, we are relying significantly on outside accounting professionals until permanent employees can be hired to fill these roles and on manual procedures to assist us with meeting the objectives otherwise fulfilled by an effective control environment. The implementation of new procedures and controls could be costly and distract management from other activities.
We note that a system of procedures and controls, no matter how well conceived and operated, can provide only reasonable, not absolute, assurance that the objectives of the control system are met. Because of the inherent limitations in all systems of procedures and controls, no evaluation can provide absolute assurance that all control issues including instances of fraud, if any, have been detected. These inherent limitations include the realities that judgments in decision-making can be faulty, and breakdowns can occur because of simple error or mistake. Additionally, procedures and controls can be circumvented by the individual acts of some persons, by collusion of two or more people, or by management override. The design of any system of procedures and controls also is based in part upon certain assumptions about the likelihood of future events, and there can be no assurance that any design will succeed in achieving its stated goals under all potential future conditions. Over time, our systems of procedures and controls, as we further develop and enhance them, may become inadequate because of changes in conditions, or the degree of compliance with the policies or procedures may deteriorate. Because of the inherent limitations in a cost-effective system of procedures and controls, misstatements due to error or fraud may occur and not be detected and could be material and require a restatement of our financial statements.
If we are unable to establish appropriate internal controls, we may not have adequate, accurate or timely financial information, and we may be unable to meet our reporting obligations or comply with the requirements of the SEC or the Sarbanes-Oxley Act of 2002, which could result in the imposition of sanctions, including the inability of registered broker dealers to make a market in our common shares, or investigation by regulatory authorities. Any such action or other negative results caused by our inability to meet our reporting requirements or comply with legal and regulatory requirements or by disclosure of an accounting, reporting or control issue could adversely affect the trading price of our securities. Further and continued determinations that there are significant deficiencies or material weaknesses in the effectiveness of our internal controls could also reduce our ability to obtain financing or could increase the cost of any financing we obtain and require additional expenditures to comply with applicable requirements.
Risks Relating to our Business
Our recent bankruptcy and reorganization, our recent inability to provide current financial reports and recent changes in our management could have a negative impact on our relationship with key employees, suppliers and customers.
As discussed elsewhere in this 10-K, in July 2010, we emerged from a lengthy and well-publicized reorganization process, which included a voluntary bankruptcy filing. We believe these events adversely impacted our suppliers’ willingness to extend trade credit to us, and our customers’ willingness to develop products with us, or order or purchase products from us and may continue to have a negative impact on our business, as suppliers and customers may remain wary of our financial or operating stability.
Our results of operations could be adversely affected by economic and political conditions and the effects of these conditions on our customers’ businesses and level of business activity.
A large portion of our product sales are dependent on the need for increased capacity or replacement of inefficient manufacturing processes, because of the capital-intensive nature of our customers’ businesses.processes. These sales also tend to lag behind other businesses in an economic recovery. There was a rapid softening of the economy and tightening of the financial markets in the second half of 2008 that continued into the first half of 2009. This slowing of the economy reduced the financial capacity of our customers, thereby slowing spending on the products and services we provide. While business conditions improved during the second half of 2009 and throughout 2010, ifeconomic conditions have been softening again since the third quarter of 2011, particularly in the microelectronics markets. If such improvement is not sustainableweak economic conditions continue or if a new general economic slowdown commences,worsen, we may not be able to meet anticipated revenue levels on a quarterly or annual basis. A severe and/or prolonged economic downturn or a negative or uncertain political climate could adversely affect our customers’ financial condition and the timing or levels of business activity of our customers and the industries we serve. This may reduce the demand for our products or depress pricing for our products and have a material adverse effect on our results of operations. Changes in global economic conditions could also shift demand to products or services for which we do not have competitive advantages, and this could negatively affect the amount of business that we are able to obtain. In addition, if we are unable to successfully anticipate changing economic and political conditions, we may be unable to effectively plan for and respond to those changes, and our business could be negatively affected.
Our business depends significantly upon our customers’ capital expenditures, which are subject to cyclical market fluctuations.
The semiconductor and electronics materials processing industries are cyclical and have historically experienced periods of oversupply, resulting in downturns in demand for capital equipment, including the products that we manufacture. The timing, length and severity of these cycles, and their impact on our business, are difficult to predict. Further, our order levels or results of operations for a given period may not be indicative of order levels or results of operations for subsequent periods. We cannot assure investors that demand for our products will increase or that demand will not decrease. For the foreseeable future, our operations will continue to depend upon industries that are subject to market cycles which, in turn, could adversely affect the market for our products.
Cyclical variations may have the most pronounced effect on our Semiconductor Systems segment, which concentrates in the semiconductor and electronics industries. In past economic slowdowns, we have experienced significant cyclical fluctuations, and we cannot assure you that such slowdowns will not recur or that the impact of such slowdowns will be more or less significant compared to historical fluctuations.
Our business success depends upon our ability to respond to fluctuations in product demand, but doing so may require us to incur costs despite limited visibility toward future business declines.
If our business declines, we may be required to reduce costs while at the same time maintaining the ability to motivate and retain key employees. Additionally, to remain competitive, we must also continually invest in research and development, which may inhibit our ability to reduce costs in a down cycle. Additionally, longLong product lead-times create a risk that we may purchase or manufacture inventories of products that we are unable to sell. While we practice inventory management, we can offer no assurances that our efforts to mitigate this risk will be successful.
During a period of increasing demand and rapid growth, we must be able to increase manufacturing capacity quickly. Our inability to quickly increase production in response to a surge in demand could prompt customers to look for alternative sources of supply or leave our customers without a supply, both of which events could harm our reputation and make it difficult for us to retain our existing customers or to obtain new customers.
The success of our business requires that we continually innovate.
Technology requirements in our markets are consistently advancing. We must continually introduce new products that meet evolving customer needs. Our ability to grow depends on the successful development, introduction and market acceptance of new or enhanced products that address our customer’s requirements. Developing new technology is a complex and uncertain process requiring us to accurately anticipate technological and market trends and meet those trends with responsive products. Additionally, this requires that we manage the transition from older products to minimize disruption in customer ordering patterns, avoid excess inventory and ensure adequate supplies of new products. Failed market acceptance of new products or problems associated with new product transitions could harm our business.
Delays in delivery of new products could have a negative impact on our business. If we do not introduce new products in a timely manner, we may lose market share and be unable to achieve revenue growth targets.
Our research and development efforts may not lead to the successful introduction of products within the time period our customers demand. Our competitors may introduce new or improved products, processes or technologies that make our current or proposed products obsolete or less competitive. We may encounter delays or problems in connection with our research and development efforts. Product development delays may result from numerous factors, including:
changing product specifications and customer requirements;
the inability to manufacture products cost effectively;
difficulties in reallocating engineering resources and overcoming resource limitations;
changing market or competitive product requirements; and
unanticipated engineering complexities.
New products often take longer to develop, have fewer features than originally considered desirable and achieve higher cost targets than initially estimated. There may be delays in starting volume production of new products and/or new products may not be commercially successful. There may also be difficulty in sourcing components for new products.
Our reliance upon third party distribution channels subjects us to credit, inventory, business concentration and business failure risks beyond our control.
We sell products through resellers, distributors original equipment manufacturers (“OEMs”) and system integrators. We sell certain lasers through a 50% owned joint venture in India. The holder of the other 50% of the joint venture is not a related party. Selling products through third parties can subject us to credit and business risks. Our sales also depend upon the ability of our OEM customers to develop and sell systems that incorporate our products. Adverse economic conditions, large inventory positions, limited marketing resources and other factors influencing these OEM customers could have a substantial impact upon our financial results. We cannot assure investors that our OEM customers will not experience financial or other difficulties that could adversely affect their operations and, in turn, our financial condition or results of operations.
Our quarterly results of operations may fluctuate in the future.significantly from period to period. As a result, we may fail to meet or exceed the expectations of securities analysts or investors, which could cause our stock price to decline.
We sell a relatively small number of high revenue semiconductor systems within any period. These systems are complex and may have multiple elements for customer delivery including overall systems, spare parts,
extended warranties, installation and training and may be subject to customer acceptance criteria. In certain transactions, we recognize all or a portion of revenue upon shipment provided that title and risk of loss hashave passed to
the customer, evidence of an arrangement exists, fees are contractually fixed or determinable, collectability is reasonably assured through historical collection results and regular credit evaluations, and there are no uncertainties regarding the receipt or timing of customer acceptance. As a result, it is often difficult to project the timing of product revenue recognition. Consequently, our revenue and financial results could vary significantly from expectations in a particular quarter if anticipated orders from even a few customers are not received and fulfilled in time to satisfy customer obligations to the extent necessary to permit revenue to be recognized under generally accepted accounting principles. In addition, our product order backlog at the beginning of each quarter may not include all systems needed to achieve expected revenues for that quarter. Because we may build systems according to forecast, the absence of a significant backlog for an extended period of time could adversely affect financial results.
Customer order timing and other factors beyond our control may cause our operating results to fluctuate from period to period.
Changes in customer order timing and the existence of certain other factors beyond our control may cause our operating results to fluctuate from period to period. Such factors include:
fluctuations in our customers’ businesses;
timing and recognition of revenues from customer orders;
timing and market acceptance of new products or enhancements introduced by us or our competitors;
availability of parts from our suppliers and the manufacturing capacity of our subcontractors;
timing and level of expenditures for sales, marketing and product development;
changes in the prices of our products or of our competitors’ products; and
fluctuations in exchange rates for foreign currency.currencies.
A large percentageCertain of our sales come from products with high selling prices and significant lead times. We may receive several large orders in one quarter from a customer and then receive no orders from that customer in the next quarter. As a result, the timing and recognition of sales from customer orders can cause significant fluctuations in our operating results from quarter to quarter.
A delay in a shipment or failure to meet our revenue recognition criteria near the end of a reporting period due, for example, to rescheduling or cancellations by customers or to unexpected difficulties experienced by us, may cause sales in the period to fall significantly and may have materially adverse effects on our operations for that period. Our inability to adjust quickly enough could magnify the adverse effects of that revenue shortfall on our results of operations.
As a result of these factors, our results of operations for any quarter are not necessarily indicative of results to be expected in future periods. We believe that fluctuations in quarterly results may cause the market prices of our common shares to fluctuate, perhaps substantially.
If we experience a significant disruption in, or breach in security of, our information technology systems, our business may be adversely affected.
We rely on information technology systems throughout our company to manage orders, process shipments to customers, manage inventory levels and maintain financial information. Events could result in the disruption of our systems, including power outages, computer attacks by hackers, viruses, catastrophes, hardware and software failures and other unforeseen events. If we were to experience a significant period of system disruption in information technology systems that involve our interactions with customers or suppliers, it could result in the loss of sales and customers and significant incremental costs, which could adversely affect our business. In
addition, security breaches of our information technology systems could result in the misappropriation or unauthorized disclosure of confidential information belonging to us or to our employees, partners, customers or suppliers, which could result in our suffering significant financial or reputational damage.
We transact a significant portion of our sales, and maintain significant cash balances, in foreign currencies and in the past we have maintained and may in the future maintain foreign currency exchange contracts. As a result, changes in interest rates, credit ratings or foreign currency rates could have a material effect on our operations, financefinancial position, results of operations and cash flows.
A significant portion of our sales are derived from our European and Asian operations and transacted primarily in Euros and Japanese yen, respectively, while our products are mainly are manufactured in the United States. In the event of a decline in the value of the Euro or yen, we would typically experience a decline in our revenues. In addition, because our products are mainly
manufactured in the United States, we may have to increase the sale prices on our products sold in Europe and Japan in order to maintain sales margins and recover costs. This may have a materially adverse impact on our operations, financial position results of operation and cash flows.
Additionally, balances we maintain in foreign currencies create additional financial exposure to changing interest and currency rates. We have in the past, and may in the future, attempt to mitigate these risks by purchasing foreign currency exchange contracts, and by investing in United States government issued treasury bills. However, if long term interest rates or foreign currency rates were to change rapidly, we could incur material losses. Further, if management chooses to invest in less risk adverse investment vehicles, the risk of losing principal and/or interest could increase.
International operations are an expanding part of our business and our operations in foreign countries subject us to risks not faced by companies operating exclusively in the United States.
During the year ended December 31, 2010, 65.9%2011, 66% of our revenues were derived from operations outside of the United States. The scope of our international operations subjects us to risks which could materially impact our results of operations, including:
foreign exchange rate fluctuations;
social and political unrest in countries where we operate;
climatic or other natural disasters in regions where we operate;
increases in shipping costs or increases in fuel costs;
longer payment cycles;
acts of terrorism;
greater difficulty in collecting accounts receivable;
use of incompatible systems and equipment;
problems with staffing and managing foreign operations in diverse cultures;
protective tariffs;
trade barriers and export/import controls;
transportation delays and interruptions;
increased vulnerability to the theft of, and reduced protection for intellectual property rights;
government currency control and restrictions, delays, penalties or required withholdings on repatriation of earnings; and
the impact of recessionary foreign economies.
We cannot predict whether the United States or any other country will impose new quotas, tariffs, taxes or other trade barriers upon the importation or exportation of our products or supplies or gauge the effect that new barriers would have on our financial position or results of operations.
We also are subject to risks that our operations outside the United States could be conducted by our employees, contractors, service providers, representatives or agents in ways that violate the Foreign Corrupt Practices Act or other similar anti-bribery laws. Any such violations could have a negative impact on our business and could result in government investigations and/or injunctive, monetary or other penalties. Moreover, we face additional risks that our anti-bribery policy and procedures may be violated by third-party sales representatives or other agents that help sell our products or provide other services, because such representatives or agents are not our employees and it may be more difficult to oversee their conduct.
There are inherent risks as we increase our focus on overseas operations.
We manufacture certain products in plants in the United Kingdom, Germany and China. Manufacturing in overseas locations creates risks, including the possibility that as operations are transferred or expanded in foreign locations we may not be able to produce products to the quality standards or deliver products as quickly as our customers
have come to expect. This possibility may come about due to an inability to find qualified personnel overseas. It is also possible that after an overseas transition, we may find that we have been producing products with latent defects that come to light only after a long period of operation. Transitioning a business to an overseas location has many additional risks such as developing solid financial, enterprise resource planning (ERP) and customer relationship management (CRM) systems.
The increased use of outsourcing in foreign countries exposes us to additional risks which could negatively impact our business.
We are increasingly outsourcing the manufacture of subassemblies to suppliers based in China and elsewhere overseas. Economic, political or trade problems with foreign countries could substantially impact our ability to obtain critical parts needed in the timely manufacture of our products. Additionally, this practice increases our vulnerability to the theft of, and reduced protection for, our intellectual property.
CustomsOur global operations are subject to extensive and complex import and export rules are complex andthat vary withinamong the legal jurisdictions in which we operate. Failure to comply with local customs regulationsthese rules could result in substantial penalties.
Customs rulesDue to the international scope of our operations, we are subject to a complex system of import- and export-related laws and regulations, including U.S. export control and customs regulations and customs regulations of other countries. These regulations are complex and vary withinamong the legal jurisdictions in which we operate. We seekAny alleged or actual failure to mitigate this risk by maintaining export control systems and an internal customs staff charged with the responsibility of strictly complying with all applicable import/export laws. Further, we attempt to maintain arms length transactions with our foreign subsidiaries and their customers. However, we cannot assure you that we will comply with all applicable local customssuch regulations may subject us to government scrutiny, investigation and such a failurecivil and criminal penalties, and may limit our ability to import or export our products or to provide services outside the United States. Any of these penalties could result in substantial penalties, including debarment, and have a material impact on our operations, financial position, results of operations and cash flows.
We have a history of operating losses and we may not be able to sustain or grow our profitability.
We incurred operating losses in each of the years from 1998 through 2003 and again in 2008 and 2009. Although we reported an operating profit for the yearyears ended December 31, 2010 and 2011, no assurances can be given that we will be able to sustain or increase the level of profitability in the future based on extrinsic market forces, and theforces. The trading market priceprices of our common shares may decline as a result.
We are exposed to the credit risk of some of our customers and to credit exposures in weakened markets, which could result in material losses.adversely affect our results of operations.
Customers with liquidity issues may lead to additional bad debt expense. We monitor individual customer payment capability in granting open credit arrangements, and seek to limit such open credit to amounts we believe our customers can pay, and we maintain reserves we believe are adequate to cover exposure for doubtful accounts. However, thereThere can be no assurance that our open credit customers will pay the amounts they owe to us or that the reserves we maintain will be adequate to
cover such credit exposure. Our customers’ failure to pay and/or our failure to maintain sufficient reserves could have a material adverse effect on our operating results and financial condition.
In addition, to the extent that the ongoing turmoil in the credit markets makes it more difficult for some customers to obtain financing, those customers’ ability to pay may be adversely impacted, which in turn could have a material adverse effect on our business, operating results and financial condition.
While we generally sell a portion of our sales directly to customers, future sales may be increasingly derived through distributors. As distributors tend to have more limited financial resources than original equipment manufacturers (“OEM”) and end-user customers, they generally represent sources of increased credit risk. Additionally, in the event that the ongoing turmoil in the credit markets makes it more difficult for some customers to obtain financing, those customers’ ability to pay could be adversely impacted which, in turn, could have a material adverse impact on our business, operating results and financial condition.
Others may violate our intellectual property rights and cause us to incur significant costs to protect our rights.
Our future success depends in part upon our intellectual property rights, including trade secrets, know-how and continuing technological innovation. We do not have personnel dedicated to the oversight, organization and management of our intellectual property. There can be no assurance that the steps we take to protect our intellectual property rights will be adequate to prevent misappropriation or disclosure, or that others will not develop competitive technologies or products outside of our patented intellectual property. It is possible that, despite our efforts, other parties may use, obtain or try to copy our technology and products. There can be no assurance that other companies are not investigating or developing other technologies that are similar to ours, that any patents will issue from any application filed by us or that, if patents do issue, the claims allowed will be sufficiently broad to deter or prohibit others from marketing similar products. In addition, there can be no assurance that anyour patents issued to us will notmay be challenged, invalidated or circumvented in a legal or administrative proceeding, or that ourproceeding. Our patents and know how willknow-how may not provide a competitive advantage to us. Policing unauthorized use of our intellectual property rights is difficult and time consuming and may involve initiating claims or litigation against third parties for infringement of our proprietary rights, which could be costly.
Our success depends upon our ability to protect our intellectual property and to successfully defend against claims of infringement by third parties.
We have received in the past, and could receive in the future, notices from third parties alleging that our products infringe patent or other proprietary rights. We believe that our products are non-infringing or that we have the patents and/or licenses to allow us to lawfully sell our products throughout the world. However, we may be sued for infringement. In the event any third party makes a valid claim against us or our customers for which a license was not available to us on commercially reasonable terms, weour operating results would be adversely affected. Adverse consequences may also apply to our failure to avoid litigation for infringement or misappropriation of proprietary rights of third parties.
Our efforts to protect our intellectual property rights may not be effective in some foreign countries where we operate or sell our products. Many U.S. companies have encountered substantial problems in protecting their intellectual property rights against infringement in foreign countries. If we fail to adequately protect our intellectual property in these countries, it could be easier forwe may lose significant business to our competitors to sell competing products in foreign countries.competitors.
We operate in highly competitive industries and, if we lose competitive advantages, our business would suffer adverse consequences.
Some of our competition comes from established competitors, some of which have greater financial, engineering, manufacturing and marketing resources than we do. Our competitors will continue to improve the design and performance of their products and introduce new products. It is possible that we may not successfully
differentiate our current and proposed products from the products of our competitors, or that the marketplace will not consider our products to be superior to competing products. To remain competitive, we will be required to invest heavily in research and development, marketing and customer service and support. It is also possible that we may not be able to make the technological advances necessary to maintain our competitive position, or our products will not receive market acceptance. We may not be able to compete successfully in the future, and increasedfuture. Increased competition may result in price reductions, reduced profit margins, loss of market share and an inability to generate cash flows that are sufficient to maintain or expand our development of new products.
Our business strategy may include finding and making strategic acquisitions and divestitures. There can be no assurance that we will be able to continue to make acquisitions or divestitures that provide business benefit.
Our business strategy has included finding and making strategic acquisitions and divestitures. For example, we acquireddivesting certain non-core businesses. We have placed our Semiconductor Systems segment and laser systems product line, which is sold under the Control Laser and Baublys brand names, under strategic review. We intend to exit these businesses. The divestiture of an opticsexisting business could reduce our future operating cash flows and revenues, make our financial results more volatile, and/or cause a decline in revenues and profits. A divestiture could also cause a decline in the United Kingdom in 2007, we completed our acquisition of Excel in August
2008 and we sold our U.S. Optics Business in October 2008. We expect to continue to evaluate potential acquisitions and divestitures as partprice of our long-term strategic plan. Ourcommon shares and increased reliance on other elements of our core business operations. If we do not successfully manage the risks associated with a divestiture, our business, financial condition, and results of operations could be adversely affected. In addition, there could be other negative unforeseen effects from a divestiture. We also may not find suitable purchasers for the businesses that we intend to divest.
In addition, our identification of suitable acquisition candidates involves risks inherent in an assessment of the values, strengths, weaknesses, risks, synergy and profitability of acquisition candidates, including the effects of the possible acquisition on our business, diversion of management’s attention from our core businesses and risks associated with unanticipated problems or liabilities. We cannot assure investors our efforts will be sufficient, or thatmay not find suitable acquisition candidates will be receptiveor succeed in executing acquisitions that are accretive to our advances or that any acquisitionearnings.
We have made, and expect to continue to make, acquisitions, and we may make would be accretivefail to earnings. We also cannot assure investorssuccessfully integrate future acquisitions into our business.
As part of our business strategy, from time to time we have acquired, and continue to consider acquiring, businesses, technologies, assets and product lines that we believe complement or expand our existing business. It is likely that we will find suitable purchasersmake such acquisitions in the event thatfuture.
We may face challenges as a result of these acquisition activities, because these activities entail numerous risks. For example, we identify a potential divestiture candidate in the future. Further, given our significant debt and current inability to use Form S-3, we may have difficulty obtaining financing for such strategic acquisitions on a timely basis or at all.
We may fail to successfully complete the integration of Excel into our business and, as a result, may fail to realize the synergies, cost savings and other benefits expected from the acquisition.
We may fail to successfully complete the integration of Excelfuture acquisitions into our business and, as a result, may fail to realize the synergies, cost savings and other benefits expected from the acquisition. We may continue to fail to grow and build revenues and profits in Excel’sfrom acquired business lines or achieve sufficient cost savings through the integration of customers or administrative and other operational activities. Furthermore, we must achieve these objectives without adversely affecting our revenues. If we are not able to successfully achieve these objectives, the anticipated benefits of the acquisitionsuch potential acquisitions may not be realized fully or at all, or it may take longer to realize them than expected, and our results of operations could be materially adversely affected.
Further, our ability to maintain and increase profitability of Excel’sacquired business lines will depend on our ability to manage and control operating expenses and to generate and sustain increased levels of revenue. Our expectations to achieve more consistent and predictable levels of revenue and to increase Excel’s profitability as a result of any acquisitions may not be realized, and such revenues and profitability may decline as we integrate Excel’s operations into our business. If Excel’s revenues of acquired businesses’ grow more slowly than we anticipate, or if itstheir operating expenses are higher than we expect, we may not be able to sustain or increase itstheir profitability, in which case our financial condition will suffer and our stock price could decline. As discussed in Note 6 to Consolidated Financial Statements, in 2008, we recordedMoreover, our acquisition
activities may divert management’s attention from our regular operations and managing a significant impairment charge against the value of assets that were primarily attributed to the goodwill, intangible assetslarger and other long-lived assets of Excel. Should there be a deterioration in Excel’s future outlook or actual performance, we may be required to record additional impairment charges against Excel’s assets.
We continuemore geographically widespread operation and product portfolio could pose challenges for our leadership transition and expansion of our financial and accounting team. Until we are able to successfully complete such transition and expansion, if at all, our business could be materially adversely affected.management.
During 2008, 2009, 2010 and early 2011, we experienced significant turnover in our management team, including our Chief Executive Officer, our Chief Financial Officer, our General Counsel, our Corporate Controller and certain senior members of our various segments or operating groups. On April 1, 2010, our Board of Directors appointed a principal financial officer to replace our former Chief Financial Officer who resigned in 2008. On May 14, 2010, our Board of Directors appointed a chief restructuring officer, whose appointment was approved by the Bankruptcy Court on May 27, 2010. On December 14, 2010, our Board of Directors appointed a new Chief Executive Officer and, by early April 2011, Robert Buckley will assume the role of our Chief Financial Officer. We continuously review our management, business and organizational structures, and, as a part of that process are seeking to expand our financial and accounting team, but there are no assurances that we will be able to adequately staff such team in the near future. There are risks associated with changes in strategy and management at the executive and/or director level, and changes in product or operational focus.
If we do not retain our key personnel, our ability to execute our business strategy will be limited.
Our success depends to a significant extent upon the continued service of our executive officers and key management and technical personnel, particularly our experienced engineers, and on our ability to continue to attract, retain, and motivate qualified personnel. The competition for these employees is intense. The loss of the services of one or more of our key personnel could have a material adverse effect on our operating results. In addition, there could be a material adverse effect on us should the turnover rates for engineers and other key personnel increase significantly or if we are unable to continue to attract qualified personnel. We do not maintain any key person life insurance policies on any of our officers or employees.
Our success also depends on our ability to execute leadership succession plans. The inability to successfully transition key management roles could have a material adverse effect on our operating results.
We conducted an internal review of potential issues related to the Foreign Corrupt Practices Act and voluntarily shared information relating to that review with the SEC in the third quarter of 2009. These matters could have a material adverse effect on us. Further, our reputation and our ability to do business may be impaired by improper conduct by any of our employees, agents or business partners.
On or about November 25, 2008, we initiated an independent review of sales transactions in our Semiconductor Systems segment and certain other sales transactions for fiscal years 2006, 2007 and 2008 and in May 2009, we announced that we were expanding the review to include 2004 and 2005. During the course of performing the review, our Audit Committee and its advisors identified certain potential issues related to the Foreign Corrupt Practices Act (“FCPA”), in particular in China, and referred those issues to our management for review. With the assistance of outside legal counsel, we conducted and completed an internal review of those potential issues and voluntarily shared information relating to the internal review with the SEC in the third quarter of 2009. While we have not received any further requests from the SEC relating to the matters raised as a result of this internal FCPA review, we cannot predict whether the SEC will request any further information from us or take any other action.
Following the aforementioned internal review, we updated our FCPA compliance policies and enhanced our FCPA training program. However, we cannot provide assurance that our internal controls will protect us from reckless or criminal acts committed by our employees, agents or business partners that would violate U.S. and/or non-U.S. laws, including the laws governing payments to government officials, competition, money laundering and data privacy. Any such improper actions could subject us to civil or criminal investigations in the U.S. and in other jurisdictions, and could lead to substantial civil or criminal, monetary and non monetary penalties against us or our subsidiaries.
We have undertaken restructuring and realignment activities, and we will continue to assess our operating structure. These actions may not improve our financial position, and may ultimately prove detrimental to our operations and sales.
Our ability to reduce operating expenses is dependent upon the nature of the actions we take to reduce expenseexpenses and subsequent ability to implement those actions and realize expected cost savings. For example, in the past years we shifted certain of our operations in the United States and United Kingdom to China to reduce expenses. In addition, duringcosts. During 2008, 2009 and 2009,2011, we undertook actions to consolidate redundant or excess personnel that resulted from our acquisition of Excel and lower demand for certain of our products due to the global economic slowdown. WeAs discussed in further detail in Note 11 to Consolidated Financial Statements, we have also divested businesses.initiated a new strategic initiative to eliminate up to twelve facilities through a combination of site consolidations and divestitures. There can be no assurance that these actions will improve our financial position, results of operations or cash flows. Further, there is a risk that these actions may ultimately prove detrimental to our operations and sales, or to our intellectual property protections.
We expect to be consolidating some of our operations for greater efficiency, which may disrupt our operations or result in write-offs or other charges.
We expect to be consolidating some of our operations for greater efficiency. We cannot assure investors that economies of scale will or can be realized as a result of any historic or planned restructuring activities. These
actions will take time and will include substantial operational risks, including the possible disruption of manufacturing lines. We cannot assure investors that any moves would not disrupt business operations or have a material impact on our results of operations.
In addition, any decision to limit investment in, dispose of or otherwise exit business activities may result in the recording of special charges, such as asset write-offs, workforce reduction costs, charges relating to consolidation of excess facilities, or a loss on the sale of assets. Our estimates with respect to the useful life or ultimate recoverability of our carrying value of assets, including intangible assets, could also change as a result of such decisions. Further, our estimates related to the liabilities for excess facilities are affected by changes in real estate market conditions. Additionally, we are required to perform goodwill impairment tests on an annual basis and at additional times during the year in certain circumstances. For example, our December 2008 assessment of the carrying value of goodwill and intangible assets resulted in substantial write downs and our December 2009 assessment resulted in additional write downs. There can be no assurance that future goodwill and intangible assets impairment tests will not result in a charge to earnings.
Product defects or problems with integrating our products with other vendors’ products may seriously harm our business and reputation.
We produce complex products that can contain latent errors or performance problems. For example, on occasion we have found errors after the launch ofThis could happen to both existing and new products. Similarly, in certain instances, we have found latent errors in our products. Unfortunately, we cannot always resolve errors that we believe would be considered serious by our customers before implementation, thus our products are not always free from errors. These errorsSuch defects or performance problems could be detrimental to our business and reputation.
In addition, customers frequently integrate our products with other vendors’ products. When problems occur in a combined environment, it may be difficult to identify the source of the problem. These problems may cause us to incur significant warranty and repair costs, divert the attention of our engineering personnel from our product development efforts and cause significant customer relationsrelationship problems. These problems may also complicate our determination of the timing and amount of revenue recognition. To date, defects in our products or those of other vendors’ products with which our products are used by our customersrecognition and could have not had a material negative effect on our business relationships with our customers. However, we cannot be certain that a material negative impact will not occur in the future.on our business.
Disruptions in the supply of or defects in raw materials, certain key components and other goods from our suppliers, including limited or single source suppliers, could have an adverse effect on the results of our business operations, and could damage our relationships with customers.
The production of our products requires a wide variety of raw materials, key components and other goods that are generally available from alternate sources of supply. However, certain critical raw materials, key components and other goods required for the production and sale of some of our principal products are available from limited or single sources of supply. Many of our products are manufactured with high precision parts and
components designed and/or manufactured by outside suppliers, which subjects us to an increased risk of defects. Any such parts or components that have latent or known defects may materially impact relationsour relationship with our customers if they cause us to miss our scheduled shipment deadlines. If latent defects are incorporated into our products and discovered later, there could be a material impact on our operations, financial position, results of operations and cash flow.
We also rely on a limited number of independent contractors to manufacture subassemblies for some of our products, particularly in our Semiconductor Systems segment. In addition, certain of our businesses buy components, including limited or sole source items, from competitors of our other businesses, and certain of our businesses sell products to customers that compete with certain other segments of our business. This dynamic
may adversely impact our relationship with these suppliers and customers. For example, these suppliers could increase the price of those components or reduce their supply of those components to us. Similarly, these customers could elect to manufacture products to meet their own requirements rather than purchasepurchasing products from us. There can be no assurance that ourOur businesses will notmay be adversely affected by our other businesses’ relationshipbusiness relationships with customers and suppliers or that oursuppliers. Our current or alternative sources willmay not be able to continue to meet all of our demands on a timely basis. If suppliers or subcontractors experience difficulties, or fail to meet any of our manufacturing requirements, our business would be harmed until we are able to secure alternative sources, if any, on commercially reasonable terms. A prolonged inability to obtain certain raw materials, key components or other goods is possible and could have an adverse effect on our business operations, and could damage our relationships with customerscustomers.
Production difficulties and product delivery delays or disruptions could materially adversely affecthave a material adverse effect on our business.
We assemble our products at our facilities in the United States, the United Kingdom, Germany and China. If use of any of our manufacturing facilities were interrupted by a natural disaster or otherwise, our operations couldwould be negatively impacted until we could establish alternative production and service operations. Significant production difficulties could be the result of:
mistakes made while transferring manufacturing processes between locations;
changing process technologies;
ramping production;
installing new equipment at our manufacturing facilities; and
shortage of key components.
In addition, we may experience product delivery delays in the future. A significant disruption in third-party package delivery and import/export services, or significant increases in prices for those services, could interfere with our ability to ship products, increase our costs and lower our profitability.
We ship a significant portion of our products to our customers through independent package delivery and import/export companies. We also ship our products through national trucking firms, overnight carrier services and local delivery practices. If one or more of the package delivery or import/export providers experiences a significant disruption in services or institutes a significant price increase, the delivery of our products could be prevented or delayed. Such events could cause us to incur increased shipping costs that could not be passed on to our customers, negatively impacting our profitability and our relationships with certain customers.
Changes in governmental regulation of our business or our products could reduce demand for our products or increase our expenses.
We are subject to many governmental regulations, including but not limited to the laser radiation safety regulations of the Radiation Control for Health and Safety Act administered by the National Center for Devices and Radiological Health, a branch of the United States Food and Drug Administration, and certain health
regulations related to the manufacture of products using beryllium, an element used in some of our structures and mirrors. Among other things, these regulations require us to file annual reports, to maintain quality control and sales records, to perform product testing, to distribute appropriate operating manuals, to conduct safety reviews, to incorporate design and operating features in products sold to end-users and to certify and label our products. Various warning labels must be affixed and certain protective devices installed depending on the class of product. We are also subject to regulatory oversight, including comparable enforcement remedies, in the markets we serve, and we compete in many markets in which we and our customers must comply with federal, state, local and international
regulations, such as environmental, health and safety and food and drug regulations. We develop, configure and market our products to meet customer needs created by those regulations. Any significant change in these regulations could reduce demand for our products or increase our expenses, which in turn could materially adversely affect our business, operatingfinancial condition, results financial conditionof operations and cash flows.
If we experience a significant disruption in our information technology systems or if we fail to implement new information technology systems and software successfully, our business could be adversely affected.
We rely on various centralized information systems throughout our company to keep financial records, process orders, manage inventory, process shipments to customers and operate other critical functions. If we wereare unable to experiencesuccessfully implement new systems which record, process or manage financial information, we may be unable to recognize the expected synergies associated with new systems at a prolonged system disruption in the information technology systems that involve our interactions with customers and suppliers, it could result in the loss of sales and customers and significant incremental costs, which could adversely affectcost to our business.
Our results of operations will be adversely affected if we fail to realize the full value of our intangible assets.
As of December 31, 2010,2011, our total assets included $97.7$90.4 million of net intangible assets, including goodwill. Net intangible assets consist principally of goodwill, associated with acquisitions and costs associated with securing patent rights, trademark rights,patents, trademarks, core technology and technology licenses, net of accumulated amortization. We test certain of these items—specifically all of those thatGoodwill and indefinite-lived intangible assets are considered “non-amortizing”—tested for impairment at least on an annual basis for potential impairment by comparing the carrying value to the fair market value of the reporting unit to which they are assigned.basis. All of our amortizingother intangible assets are evaluated for impairment should discrete events occur that call into question the recoverability of the intangible assets.
Adverse changes in our business, adverse changes in the assumptions used to determine the fair value of our reporting units, or the failure to grow our segments may result in impairment of our intangible assets, which could adversely affect our results of operations.
Risks Relating to Taxes
We may be required to make additional tax payments and/or recalculate certain of our tax attributes depending on the resolution of the complaint we filed against the United States of America pursuant to Bankruptcy Code Section 505.
On July 13, 2010, we filed a complaint against the United States of America pursuant to Bankruptcy Code Section 505 (the “Section 505 Action”) to recover refunds resulting from federal income taxes we overpaid in previous years. Bankruptcy Code Section 505 generally gives the Bankruptcy Court jurisdiction to determine the amount or legality of any tax, any fine or penalty relating to a tax, or any addition to tax. We have filed federal carryback refund claims aggregating $18.8 million for federal income tax refunds related to tax years 2000 through 2008. The Internal Revenue Service (“IRS”) has filed proofs of claim asserting that we owe federal income taxes of approximately $7.7 million for the same period. Depending on the outcome of the Section 505 Action, we could be required to pay some or all of the approximately $7.7 million that the IRS alleges we owe and/or certainowe. Certain of our tax attributes could also be negatively impacted. Either result could have a material adverse impact on our financial condition, results of operations and operating results.cash flows.
Our ability to utilize our net operating loss carryforwards and other tax attributes may be limited as a result of the effectiveness of the Final Chapter 11 Plan and is dependent on our ability to generate sufficient future taxable income.
Section 382 of the Internal Revenue Code of 1986, as amended, limits a corporation’s ability to utilize net operating loss carryforwards (“NOLs”) and other tax attributes following a section 382 ownership change. Upon
the implementation of the Final Chapter 11 Plan, we may have undergone a section 382 ownership change and, consequently, our ability to utilize our tax attributes may be limited. A significant limitation in our ability to utilize our tax attributes could have a negative impact on our financial results.
In addition, ourOur ability to use future tax deductions is dependent on our ability to generate sufficient future taxable income in tax jurisdictions in which we operate. In determining our provision for income taxes, our tax attributes and liabilities and any valuation allowance recorded against our net tax attributes requires judgment and analysis. We consistently evaluate our tax attributes based on taxes recoverable in the carryback period, existing deferred tax liabilities, tax planning strategies and projected future taxable income. In the U.S. and the U.K., we have experienced cumulative losses in recent years and, as a result, we exclude consideration of projected future taxable income when we evaluate our ability to realize our deferred tax assets in those jurisdictions.jurisdictions because of the cumulative losses in recent years. Our ability to recover all of our tax attributes in certain jurisdictions depends upon our ability to continue to generate future profits. If actual results differ from our plans or we do not achieve the desired level of profitability in a given jurisdiction, we may be required to increase the valuation allowance on our tax attributes by taking a charge to the statement of operations, which could have a material negative result on our financial results.operations.
Our effective tax rates are subject to fluctuation, which could impact our financial position, and our estimates of tax liabilities may be subject to audit, which could result in additional tax assessments.
Our effective tax rates are subject to fluctuation as the income tax rates for each year are a function of (a) taxable income levels in numerous tax jurisdictions, (b) our ability to utilize recorded deferred tax assets, (c) taxes, interest, or penalties resulting from tax audits and (d) credits and deductions as a percentage of total taxable income. Further, tax law changes may cause our effective tax rates to fluctuate between periods.
We may be subject to U.S. federal income taxation even though GSIG is a non-U.S. corporation.
Our holding company, GSIG, is a non-U.S. corporation organized in Canada and is subject to Canadian tax laws. However, our operating company, GSI US continues to beis subject to U.S. tax and files U.S. federal income tax returns. In addition, distributions or payments from entities in one jurisdiction to entities in another jurisdiction may be subject to withholding taxes. Our holding company does not intend to operate in a manner that will cause it to be treated as engaged in a U.S. trade or business or otherwise be subject to U.S. federal income taxes on its net income, but it generally will be subject to U.S. federal withholding tax on certain U.S.-source passive income items, such as dividends and certain types of interest.
To prevent U.S.-based multinationals from improperly avoiding U.S. taxation by inversion, section 7874(b) of the Internal Revenue Code provides that, in certain instances, a foreign corporation may be treated as a domestic corporation for U.S. federal income tax purposes. However, section 7874 contains an exception for foreign corporations if, on or before March 4, 2003, such entity acquired directly or indirectly more than half of the properties held directly or indirectly by the domestic corporation. Our holding company expects to satisfy this safe harbor; however, no assurance can be given that the IRS will agree with this position.
The IRS may also assert that section 269 of the Internal Revenue Code applies to our holding Company’s organization in Canada pursuant to the implementation of the Final Chapter 11 Plan. Under section 269, if the IRS determines that the principal purpose of an acquisition was to evade or avoid U.S. federal income tax, the IRS may disallow certain deductions, credits or other allowances. We believe that, if the Final Chapter 11 Plan was challenged by the IRS, we could show, among other things, that the principal purpose for the Final Chapter 11 Plan was not to evade or avoid federal income tax, and, thus, section 269 should not apply. However, no assurance can be given in this regard.
We may be subject to the AMTAlternative Minimum Tax (“AMT”) for U.S. federal income tax purposes.
In general, an Alternative Minimum Tax (“AMT”)AMT is imposed on a corporation’s alternative minimum taxable income at a 20% rate to the extent such tax exceeds the corporation’s regular federal income tax. For purposes of computing taxable income for AMT purposes, certain tax deductions and other beneficial allowances are modified or eliminated. In particular, even though a corporation otherwise might be able to offset all of its taxable income for regular tax purposes by available net operating loss (“NOL”)NOL carryforwards, only 90% of a corporation’s taxable income for AMT purposes may be offset by available NOL carryforwards (as recomputed for AMT purposes). Therefore, if we are subject to the AMT, our U.S. federal income tax liability will likely be increased.
We have a limited ability to carry back certain losses for U.S. federal income tax purposes.
Section 172(b)(1)(E) of the Internal Revenue Code contains special rules that limit a corporation’s ability to carryback certain NOLs. Specifically, if there is a corporate equity reduction transaction (“CERT”), such as a major stock acquisition, and an applicable corporation has a corporate equity reduction interest loss (“CERT Loss”) during the year in which the CERT occurred or any of the two (2) succeeding tax years, then the CERT Loss may not be carried back to a tax year before the year in which the CERT occurred. In 2008, we acquired Excel in a transaction that qualifies as a CERT. In connection with this transaction, approximately $8 million was identified as a CERT Loss. Accordingly, we cannot carryback more than approximately $8 million of losses for 2008 to the extent that it relates to an excess interest loss.
Risks Relating to Our Common Shares and Our Capital Structure
We may require additional capital to reduce our vulnerability to economic downturns and position us to adequately respond to business challenges or opportunities and repay or refinance our existing indebtedness, and this capital may not be available on acceptable terms or at all.
We do not currently have a working capital credit facility in place. In order to reduce our vulnerability to economic downturns and position us to adequately respond to business challenges or opportunities, we may need to obtain a working capital credit facility. However, we do not currently have any commitments from lenders to provide such a facility, and, should such a facility become necessary, we may be unable to obtain it on terms acceptable to us or at all.
Under the terms of the indenture governing the New Notes (the “New Indenture”), we are permitted to obtain such a working capital credit facility in an amount up to $40 million, provided that we first obtain the consent of the holders of the New Notes. To the extent the aggregate principal amount of outstanding principal amount and unused commitments under the working capital credit facility exceed $20 million, we will be required to offer to use such excess working capital proceeds to make an offer to purchase a portion of the New Notes at 100% of the principal amount thereof, plus accrued and unpaid interest to the date of purchase. We may not be able to obtain the required consents from the note holders on a timely basis, on reasonable terms, or at all. Furthermore, any working capital financing obtained by us in the future would likely include restrictive covenants relating to our capital raising activities and other financial and operational matters, which may make it more difficult for us to obtainrequire additional capital and to pursue business opportunities, including potential acquisitions.
If we determine that we need a working capital facility but fail to obtain such a facility we may not have sufficient operating capital to operate one or more of our businesses. Without sufficient operating capital, our business, results of operations, financial position and cash flows would be extremely vulnerable to disruptions or downturns in the economy. In addition, we may be unable to adequately respond to business challenges or opportunities that may arise, including but not limited to the need to develop new products or enhance our existing products, maintaining or expanding research and development projects, the need to build inventory or invest other cash to support business growth and opportunities to acquire complementary businesses and technologies.
We alsoUnder the terms of our existing senior secured credit facility, we can borrow up to $40.0 million of revolving loans subject to certain conditions. If we are unable to satisfy those conditions or our needs exceed the amounts available under the facility, we may need to engage in equity or debt financings to obtain additional funds. If we raise additional funds through further issuances of equity or convertible debt securities, our existing shareholders could suffer significant dilution, and anydilution. Any new equity securities we issue could have rights, preferences and privileges superior to those of the holders of our common shares. Further, our New Notes restrictexisting senior secured credit facility restricts our ability to obtain additional debt financing. If we are unable to obtain adequate financing or financing on terms satisfactory to us when we require it, our ability to continue to support our business growth and to respond to business challenges could be significantly limited. In addition, the terms of any additional equity or debt issuances may adversely affect the value and price of our common shares.
Global credit conditions have varied widely over the last several years and could vary significantly in the future. Although these conditions have not affected our current plans, adverse credit conditions in the future could have a negative impact on our ability to execute on future strategic activities.
The market for our common shares may be volatile.
The market price of our common shares could be subject to wide fluctuations. These fluctuations could be caused by:
quarterly variations in our results of operations;
changes in earnings estimates by analysts;
conditions in our markets; or
general market or economic conditions.
In addition, in recent years the stock market has experienced extreme price and volume fluctuations. These fluctuations have had a substantial effect on the market prices of many semiconductor and electronics materials processing companies, often unrelated to the operating performance of the specific companies. These market fluctuations could adversely affect the price of our common shares.
To service our indebtedness and fund our operations, we will require a significant amount of cash. Our ability to generate cash depends on many factors beyond our control.
Our ability to make payments on and torepay or refinance our indebtedness including the New Notes, and to fund planned capital expenditures and research and development efforts will depend on our ability to generate cash in the future. This, to a certain extent, is subject to general economic, financial, competitive, legislative, regulatory and other factors that are beyond our control.
We cannot assure you,There is no assurance, however, that our business will generate sufficient cash flow from operations, that currently anticipated cost savings and operating improvements will be realized on schedule or that future borrowings will be available to us in an amount sufficient to enable us to paymake payments on and repay or refinance our indebtedness, including the New Notes, or to fund our other liquidity needs. We may need to refinance all or a portion of our indebtedness, including the New Notesborrowings under our new senior secured credit agreement, on or before their maturityit matures in 2014. We cannot assure you that2015. In the event we willneed to refinance any borrowings under our new senior secured credit agreement, we may not be able to refinance any of our indebtedness, including the New Notes,do so on commercially reasonable terms or at all.
We may not have access to the cash flow and other assets of our subsidiaries that may be needed to service our indebtedness and fund our operations.
Although much of our business is conducted through our subsidiaries, none of our subsidiaries isare obligated to make funds available to us. Accordingly, our ability to make payments on our indebtedness and fund our operations may be dependent on the earnings and the distribution of funds from our subsidiaries. Local laws and
regulations and/or the terms of the indenture governing the New Notesour indebtedness may restrict certain of our subsidiaries
from paying dividends and otherwise transferring assets to us. We cannot assure you that applicable laws and regulations and/or the terms of the indentureour indebtedness will permit our subsidiaries to provide us with sufficient dividends, distributions or loans when necessary.
We have several significant shareholders. Eachshareholders, one of whom serves on our Board of Directors. These significant shareholders and their respective affiliates could have substantial controlinfluence over our Board of Directors and our outstanding common shares, which could limit yourour other shareholders’ ability to influence the outcome of key transactions, including a change of control.transactions.
Our largest shareholders and their respective affiliates, in the aggregate, beneficially own a substantial amount of our outstanding common shares. As a result, these shareholders may be able to influence or control matters requiring approval by our shareholders, including the election of directors and the approval of mergers, acquisitions or other extraordinary transactions. TheyOne of these shareholders also serves on our Board of Directors and therefore could have a substantial influence over our Board of Directors. These substantial shareholders may have interests that differ from yoursother shareholders and may vote in a way with which you disagree and whichthat may be adverse to your interests. This concentrationthe interests of ownership may have the effect of delaying, preventing or deterring a change of control of our company, could deprive our shareholders of an opportunity to receive a premium for their common shares as part of a sale of our company and might affect the market price of our common shares.other shareholders.
Certain provisions of our articles of incorporation may delay or prevent a change in control of our company.
Our corporate documents and our existence as a corporation under the laws of New Brunswick subject us to provisions of Canadian law that may enable our Board of Directors to resist a change in control of our company. These provisions include:
limitations on persons authorized to call a special meeting of shareholders;
the ability to issue an unlimited number of common shares; and
advance notice procedures required for stockholders to nominate candidates for election as directors or to bring matters before an annual meeting of shareholders.
These antitakeover defenses could discourage, delay or prevent a transaction involving a change in control of our company. These provisions could also discourage proxy contests and make it more difficult for shareholders to elect directors of their choosing and cause us to take other corporate actions that shareholders desire. In addition, New Brunswick law provides that cumulative voting is mandatory in director elections which can result in stockholders holding less than a majority of shares being able to elect persons to the Board of Directors and prevent a majority stockholder from controlling the election of all of the directors.
We have a significant amount of debt as a result of our New Notes, whichOur existing indebtedness could adversely affect our future business, financial condition and results of operations and our ability to meet our payment obligations under our outstanding liabilities.operations.
We emerged from the Chapter 11 proceedings with $107As of December 31, 2011, we had $68.0 million of outstanding debt, pursuant to the New Notes, which could adversely affect our business, financial condition and results of operations and our ability to meet our payment obligations under our outstanding liabilities.operations. This level of debt could have significant consequences on our future operations, including:
Making it more difficult for us to meet our payment and other obligations under our outstanding debt;
Possibly resulting in an event of default if we fail to comply with the covenants contained in the indenture governing the New Notes, which event of default could result in all amounts thereunder becoming immediately due and payable;
Reducingreducing the availability of our cash flow to fund working capital, capital expenditures, research and development efforts, acquisitions and other general corporate purposes, and limiting our ability to obtain additional financing for these purposes;
Limitinglimiting our flexibility in planning for, or reacting to, and increasing our vulnerability to, changes in our business, market changes in the industries in which we operate and the general economy; and
Placingplacing us at a competitive disadvantage compared to our competitors that have less debt or are less leveraged.
Any of the above-listed factors could have an adverse effect on our business, financial condition and results of operations and our ability to meet our payment obligations under our outstanding liabilities.operations.
In addition, the indenture governing the New Notesour new senior secured credit agreement contains covenants that will limit our ability to engage in activities that may be in our long-term best interests. Our failure to comply with those covenants could result in an event of default which, if not cured or waived, could result in the acceleration of all of our debts.borrowings thereunder.
We do not intend to pay dividends in the near future.
We do not anticipate paying any dividends on our common shares in the foreseeable future. We intend to retain our earnings, if any, to useinvest in our growth and ongoing operations. In addition, the terms of the indenturecredit agreement governing the New Notes restrictsour senior credit facility restrict our ability to pay dividends on our common shares.
Risks Relating to Noncompliance with SEC and CSA RequirementsOur Internal Controls
If we fail to maintain appropriate internal controls in the future, we may not be able to report our financial results accurately, which may adversely affect our stock price and our business.
In connection with the preparation of our financial statements in 2008, 2009 and 2010, our management team and our independent registered public accounting firm identified certain material weaknesses in our internal controls, which we remediated in 2011.
While our management and our independent registered public accounting firm concluded that our internal control over financial reporting was effective as of December 31, 2011, it is possible that material weaknesses may be identified in the future.
We note that a system of procedures and controls, no matter how well conceived and operated, can provide only reasonable, not absolute, assurance that the objectives of the control system are met. Because of the inherent limitations in all systems of procedures and controls, no evaluation can provide absolute assurance that all control issues, including instances of fraud, if any, have been detected. These inherent limitations include the realities that judgments in decision-making can be faulty, and breakdowns can occur because of simple errors or mistakes. Additionally, procedures and controls can be circumvented by the individual acts of some persons, by collusion of two or more people, or by management override. The design of any system of procedures and controls also is based in part upon certain assumptions about the likelihood of future events, and there can be no assurance that any design will succeed in achieving its stated goals under all potential future conditions. Over time, our systems of procedures and controls, as we further develop and enhance them, may become inadequate because of changes in conditions, or the degree of compliance with the policies or procedures may deteriorate. Because of the inherent limitations in a cost-effective system of procedures and controls, misstatements due to errors or fraud may occur and not be detected. Such misstatements could be material and require a restatement of our financial statements.
If we are unable to maintain effective internal controls, we may not have adequate, accurate or timely financial information, and we may be unable to timely file certain periodic reportsmeet our reporting obligations or comply with the SEC and CSA.
During 2008, 2009 and 2010, we did not timely file withrequirements of the SEC or the Sarbanes-Oxley Act of 2002, which could result in the imposition of sanctions, including the inability of registered broker dealers to make a market in our common shares, or investigation by regulatory authorities. Any such action or other negative results caused by our inability to meet our reporting requirements or comply with legal and regulatory requirements or by disclosure of an accounting, reporting or control issue could adversely affect the Canadian Securities Administrators (“CSA”) certain periodic reports required by SEC and CSA rules and regulations. As discussed elsewhere in this Annual Report on Form 10-K, we will require substantial time to identify, incent and hire qualified personnel to augmenttrading price of our financial team. We cannot give any assurances as to whether we will be able to complete and file our future periodic reports with the SEC and CSA within the timeframes required by SEC and CSA rules and regulations. The CSA may issue management cease trade orders and undertakings that restrict ussecurities and our senior officers from tradingbusiness. Significant deficiencies or material weaknesses in our securities ifinternal control over financial reporting could also reduce our ability to obtain financing or could increase the cost of any financing we fail to file our annual and quarterly periodic reports in a timely manner with the CSA in the future.
We failed to file with the SEC a registration statement relating to securities issued under our 2006 Equity Inventive Plan. As a result, we may have engaged in multiple issuances of duly authorized but unregistered securities and we may be subject to enforcement proceedings, fines, sanctions and/or penalties.
During the preparation of the Annual Report on Form 10-K for the year ended December 31, 2008 in March 2010, it came to our attention that between March 2007 and March 2010, we inadvertently issued 257,679 shares having a total fair market value of approximately $3.9 million, to fifty-two employees and directors pursuant to our 2006 Equity Incentive Plan without an appropriate restrictive legend and that a registration statement on Form S-8 or other appropriate form had not been filed and the issuances were not made pursuant to a valid exemption from the applicable federal and state securities laws. Accordingly, it may be determined that such issuances were not exempt from registration or qualification under federal and state securities laws, and we did not obtain the required registrations or qualifications. As a result, we may be subject to civil litigation, enforcement proceedings, fines, sanctions and/or penalties. Our common shares, including those issued under the 2006 Equity Incentive Plan, were exchanged for new common shares in connection with our emergence from bankruptcy pursuant to the exemption from registration under Section 1145 of the Bankruptcy Code and are now freely tradable by holders who are not deemed to be underwriters.obtain.
Item 1B.Unresolved Staff Comments
None.
The principal owned and leased properties of the Company and its subsidiaries are listed in the table below.
Location | Principal Use | Current Segment (a) | Approximate Square Feet | Owned/Leased | Principal Use | Current Segment (a) | Approximate Square Feet | Owned/Leased | ||||||||
Bedford, Massachusetts, USA | Manufacturing, R&D, Marketing, Sales and Administrative | 1,2,4 | 147,000 | Leased; expires in 2013 | Manufacturing, R&D, Marketing, Sales and Administration | 1,2,4 | 147,000 | Leased; expires in 2013 | ||||||||
Rugby, United Kingdom | Manufacturing, R&D, Marketing, Sales and Administrative | 1 | 40,500 | Leased; expires in 2019 | Manufacturing, R&D, Marketing, Sales and Administration | 3 | 43,000 | Leased; expires in 2019 | ||||||||
Poole, United Kingdom | Manufacturing, R&D, Marketing, Sales and Administrative | 1 | 51,000 | Building owned; land leased through 2078 | Manufacturing, R&D, Marketing, Sales and Administration | 1 | 51,000 | Building owned; land leased through 2078 | ||||||||
Orlando, Florida, USA | Manufacturing, R&D, Marketing, Sales and Administrative | 3 | 80,000 | Owned | Manufacturing, R&D, Marketing, Sales and Administration | 3 | 80,000 | Owned | ||||||||
East Setauket, New York, USA | Manufacturing, R&D, Marketing, Sales and Administrative | 3 | 65,000 | Leased; expires in 2012 | Manufacturing, R&D, Marketing, Sales and Administration | 3 | 65,000 | Owned | ||||||||
Mukilteo, Washington, USA | Manufacturing, R&D, Marketing, Sales and Administrative | 3 | 63,000 | Owned | Manufacturing, R&D, Marketing, Sales and Administration | 3 | 63,000 | Owned | ||||||||
Suzhou, People’s Republic of China | Manufacturing, R&D, Marketing, Sales and Administrative | 1 | 55,000 | Leased; expires in 2011 | Manufacturing, R&D, Marketing, Sales and Administration | 1,3 | 55,000 | Leased; expires in 2013 | ||||||||
Santa Clara, California, USA | Manufacturing, R&D, Marketing, Sales and Administrative | 3 | 44,328 | Leased; expires in 2013 | Manufacturing, R&D, Marketing, Sales and Administration | 3 | 44,328 | Leased; expires in 2013 | ||||||||
Lexington, Massachusetts, USA | Manufacturing, R&D, Marketing, Sales and Administrative | 3 | 33,339 | Leased; expires in 2016 | Manufacturing, R&D, Marketing, Sales and Administration | 1 | 33,339 | Leased; expires in 2016 | ||||||||
Ludwigsburg, Germany | Manufacturing, R&D, Marketing, Sales and Administrative | 3 | 22,500 | Leased; expires in 2013 | Manufacturing, R&D, Marketing, Sales and Administration | 1,3 | 22,500 | Leased; expires in 2013 | ||||||||
Chatsworth, California, USA | Manufacturing, R&D, Marketing, Sales and Administrative | 3 | 22,000 | Owned | Manufacturing, R&D, Marketing, Sales and Administration | 1 | 22,000 | Owned | ||||||||
Taunton, United Kingdom | Manufacturing, R&D, Marketing and Sales | 1 | 19,000 | Leased; expires in 2017 | Manufacturing, R&D, Marketing and Sales | 1 | 19,000 | Leased; expires in 2017 | ||||||||
Mumbai, India | Service, Sales and Administrative | 3 | 16,769 | Owned | Service, Sales, Marketing and Administration | 3 | 17,758 | Owned (land leased) | ||||||||
Oxnard, California, USA | Manufacturing, Sales and Administrative | 3 | 14,000 | Leased; expires in 2014 | ||||||||||||
| (a) | The facilities house product lines that belong to the following segments: |
1 — Precision TechnologyMotion and Technologies Segment
2 — Semiconductor Systems Segment
3 — ExcelLaser Products Segment
4 — Corporate
On July 23, 2010,October 19, 2011, in connection with our emergence from bankruptcy proceedings,debt refinancing, we entered into mortgagesopen ended deeds of trust for our Orlando, Florida, Los Angeles, California, and Mukilteo, Washington properties as well as our interest in theand East Setauket, New York property.properties.
Additional manufacturing, research and development, sales, service and logistics sites are located in California, Colorado, Germany, France, Italy, Japan, Korea, Taiwan, China, Malaysia and Sri Lanka. These additional offices are in leased facilities occupying approximately 71,00094,000 square feet in the aggregate.
A portion of our leased facilities in Bedford, Massachusetts and East Setauket, New York and our owned facilities in Orlando,New York and Florida and Mumbai, India are currently underutilized. We lease a 29,000 square foot building in Munich, Germany. However, as a result of prior year restructuring activities, this building had more space than we needed in this location and the space was ultimately abandoned. We continue to pay for this space in Munich until the expiration of the lease in 2013. We also lease a 13,000 square feet of spacefoot facility in Novi, Michigan. However, as a result of a 2008 restructuring activity, this space was abandoned, and is being sublet. We continue to pay for this space in Novi until the expiration of the lease in 2012. As part of our 2011 restructuring, the Company plans to exit up to twelve facilities, including the New York and Florida facilities in 2012.
As of December 31, 20102011 and 2009,2010, we were productively utilizing substantially all of the space in our facilities, except for space identified above as underutilized, unoccupied, or as subleased to third parties.
During the third quarter of 2005, the Company’s French subsidiary, GSI Lumonics SARL (“GSI France”), filed for bankruptcy protection, which was granted on July 7, 2005. On April 18, 2006, the commercial court of Le Creusot (France) ordered GSI France to pay approximately 0.7 million Euros to SCGI in the context of a claim filed by SCGI that a Laserdyne 890 system delivered in 1999 had unresolved technical problems. No appeal was lodged. On May 6, 2011, GSI Group Ltd. was served with summons from the official receiver of GSI France demanding that GSI Group Ltd. and the Company’s German subsidiary, GSI Group GmbH, appear before the Paris commercial court. GSI Group GmbH was subsequently served with a separate summons from the official receiver. The receiver claims (i) that the bankruptcy proceedings initiated against GSI France in 2005 should be extended to GSI Group Ltd. and GSI Group GmbH on the ground that GSI France’s decisions were actually made by GSI Group Ltd. and that GSI Group GmbH made financial advances for no consideration, which would reveal in both cases confusion of personhood, or (ii) alternatively, that GSI Group Ltd. be ordered to pay approximately 3.1 million Euros (i.e. the aggregate of GSI France’s liabilities, consisting primarily of approximately 0.7 million Euros to SCGI and approximately 2.4 million Euros to GSI Group GmbH). GSI Group Ltd. filed submissions on December 12, 2008, in connection with6, 2011 whereby it challenged the delayedjurisdiction of the Paris commercial court over the claims raised by the receiver. After a request by the receiver, the Paris commercial court combined the cases against GSI Group Ltd. and GSI Group GmbH into a single case (docket number 2011/088718). The next hearing is scheduled on April 10, 2012 for the filing of its results for the quarter ended September 26, 2008, andreceiver’s reply on the announcementlack of jurisdiction issue. The Company currently does not believe a review of revenue transactions, a putative shareholder class action alleging federal securities violations was filedloss is probable. Accordingly, no accrual has been made in the United States District Court for the District of Massachusetts (“U.S. District Court”) against us, a former officer and a then-current officer and director. The complaint alleged that the Company and the individual defendants violated Sections 10(b) and 20(a) of the Securities Exchange Act of 1934 and Rule 10b-5 promulgated thereunder, and sought recovery of damages in an unspecified amount. In May 2010, the parties reached an agreement in principleCompany’s accompanying consolidated financial statements with respect to settle the litigation. The settlement covered purchasers of the common stock of the Company between February 27, 2007 and June 30, 2009. On February 22, 2011, the U.S. District Court entered an order granting final approval of the settlement in the putative shareholder class action. The Company’s contribution to the settlement amount was limited to the Company’s self-insured retention under its directors and officers liability insurance policy.this claim.
The Company is also subject to various legal proceedings and claims that arise in the ordinary course of business. The Company does not believe that the outcome of these claims will have a material adverse effect upon its financial condition or results of operations but there can be no assurance that any such claims, or any similar claims, would not have a material adverse effect upon its financial condition or results of operations.
Chapter 11 CasesIRS Claim
On November 20, 2009,April 5, 2010, the DebtorsIRS filed voluntary petitions for relief under Chapter 11amended proofs of the Bankruptcy Code inclaim aggregating approximately $7.7 million with the United States Bankruptcy Court for Delaware (the “Bankruptcy Court”) (the “Chapteras part of the Company’s proceedings
under Chapter 11 Cases”).of the Bankruptcy Code. On May 27,July 13, 2010, the Company filed a complaint,GSI Group Corporation v. United States of America, in Bankruptcy Court enteredin an order confirmingattempt to recover refunds totaling approximately $18.8 million in federal income taxes the Company asserts it overpaid to the IRS relating to tax years 2000 through 2008, together with applicable interest. The complaint includes an objection to the IRS proofs of claim which the Company believes are not allowable claims and approvingshould be expunged in their entirety. Those tax proceedings remain pending, and their resolution in the Finalordinary course will not be affected by the closing of the Chapter 11 Plan for the Debtors and the Plan Documents (as defined in the Final Chapter 11 Plan). On July 23, 2010, the Debtors consummated their reorganization through a series of transactions contemplated by the Final Chapter 11 Plan, and the Final Chapter 11 Plan became effective pursuant to its terms. Certain claims under the Final Chapter 11 Plan remain subject to final resolution.Cases on September 2, 2011. See Note 1412 to Consolidated Financial Statements for additional information on claims and Note 2 to Consolidated Financial Statements for additional information on the Chapter 11 Cases.proceedings.
SEC Investigation
On May 14, 2009, the SEC notified the Company that it was conducting a formal investigation relating to its historical accounting practices and the restatement of its historical consolidated financial statements. On September 16, 2010, the Company received a “Wells Notice” from the SEC, stating that the Staff is considering recommending that the Commission institute a civil injunctive action or administrative proceeding against the Company, alleging that the Company violated various provisions of the Securities Act and the Securities Exchange Act. In connection with the contemplated action, the SEC may seek a permanent injunction or cease-and-desist order, disgorgement, prejudgment interest and the imposition of a civil penalty. The Company continues to cooperate fully with the SEC’s investigation and is currently in settlement discussions with the SEC.
Item 4.[Removed and Reserved]Mine Safety Disclosures
Not applicable.
PART II
Item 5.Market for Registrant’s Common Shares, Related Stockholder Matters and Issuer Purchases of Equity Securities
Market Information
Since February 14, 2011, the Company’s common shares, no par value, have traded on The NASDAQ Global Select Market under the trading symbol “GSIG”. From December 29, 2010 to January 27, 2011, the Company’s common shares no par value, were quoted on the OTC Markets Group, Inc. under the trading symbol “LASRD.PK”. Thereafter, until February 14, 2011, the Company’s trading symbol reverted to “LASR.PK”. The Company’s common shares no par value, had beenwere quoted on the OTC Markets Group, Inc. under the trading symbol “LASR.PK” sincefrom July 23,24, 2010 to December 28, 2010. From November 20, 2009 through July 23, 2010, the Company’s common shares were quoted on the OTC Markets Group, Inc. under the trading symbol “GSIGQ”. From November 5, 2009 through November 19, 2009, the Company’s common shares were quoted on the OTC Markets Group, Inc. under the trading symbol “GSIG”. From January 1, 2009 through November 4, 2009, the Company’s common shares traded on The NASDAQ Global Select Market under the trading symbol “GSIG”. The following table sets forth the high and low sale prices during the periods indicated. All amounts have been adjusted to reflect the reverse stock split.split effected on December 29, 2010.
| 2010 | 2009 | 2011 | 2010 | |||||||||||||||||||||||||||||
| High | Low | High | Low | High | Low | High | Low | |||||||||||||||||||||||||
First Quarter | $ | 6.24 | $ | 2.37 | $ | 3.54 | $ | 1.53 | $ | 13.96 | $ | 10.30 | $ | 6.24 | $ | 2.37 | ||||||||||||||||
Second Quarter | 9.00 | 6.18 | 4.14 | 1.77 | $ | 12.18 | $ | 10.31 | $ | 9.00 | $ | 6.18 | ||||||||||||||||||||
Third Quarter | 7.56 | 6.21 | 2.79 | 1.56 | $ | 12.65 | $ | 7.68 | $ | 7.56 | $ | 6.21 | ||||||||||||||||||||
Fourth Quarter | 10.60 | 7.44 | 2.91 | 1.80 | $ | 11.08 | $ | 7.27 | $ | 10.60 | $ | 7.44 | ||||||||||||||||||||
Stock Split
On December 29, 2010, the Company effected a one-for-three reverse stock split. All share data and per share amounts in this Annual Report on Form 10-K have been retroactively adjusted to reflect the reverse stock split.
Holders
As of the close of business on February 28, 2011,29, 2012, there were approximately 3731 holders of record of the Company’s common shares. Since many of the common shares are registered in “nominee” or “street” names, the Company believes that the total number of beneficial owners is considerably higher.
Dividend Policy
The Company has never declared or paid cash dividends on its common shares. The Company currently intends to retain any current and future earnings to finance the growth and development of its business and, therefore, does not anticipate paying any cash dividends in the foreseeable future.
Purchases of Equity Securities by the Issuer and Affiliated Purchaser
None.
Performance Graph
The following graph compares the cumulative total return to stockholders for the Company’s common shares for the period from December 31, 20052006 through December 31, 20102011 with the NASDAQ Composite Index and the Philadelphia Semiconductor SectorS&P Technology Index. The comparison assumes an investment of $100 is made on December 31, 20052006 in the Company’s common shares and in each of the indices and in the case of the indices it also assumes reinvestment of all dividends. The performance shown is not necessarily indicative of future performance.
| December 31, 2005 | December 31, 2006 | December 31, 2007 | December 31, 2008 | December 31, 2009 | December 31, 2010 | |||||||||||||||||||
GSI Group Inc. | $ | 100.00 | $ | 89.23 | $ | 85.08 | $ | 5.25 | $ | 8.01 | $ | 32.47 | ||||||||||||
NASDAQ Composite Index | $ | 100.00 | $ | 109.52 | $ | 120.27 | $ | 71.51 | $ | 102.89 | $ | 120.29 | ||||||||||||
PHLX Semiconductor Sector Index | $ | 100.00 | $ | 97.40 | $ | 85.10 | $ | 44.25 | $ | 75.06 | $ | 85.89 | ||||||||||||
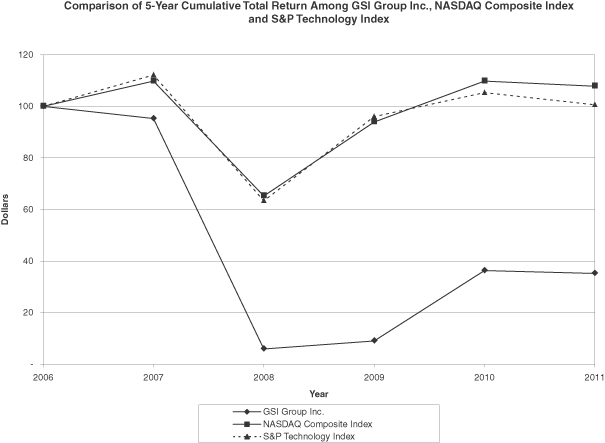
| December 31, 2006 | December 31, 2007 | December 31, 2008 | December 31, 2009 | December 31, 2010 | December 31, 2011 | |||||||||||||||||||
GSI Group Inc. | $ | 100.00 | $ | 95.36 | $ | 5.88 | $ | 8.98 | $ | 36.39 | $ | 35.19 | ||||||||||||
NASDAQ Composite Index | $ | 100.00 | $ | 109.81 | $ | 65.29 | $ | 93.95 | $ | 109.84 | $ | 107.86 | ||||||||||||
S&P Technology | $ | 100.00 | $ | 112.14 | $ | 63.44 | $ | 96.04 | $ | 105.32 | $ | 100.67 | ||||||||||||
PHLX Semiconductor Sector | $ | 100.00 | $ | 87.37 | $ | 45.43 | $ | 77.06 | $ | 88.18 | $ | 78.03 | ||||||||||||
Item 6.Selected Financial Data
The data for the consolidated balance sheet as of December 31, 2006 was previously restated to reflect the impact of the adjustments from the Company’s restatement of its previously issued financial statements as reported in its Annual Report on Form 10-K for the year-ended December 31, 2008 and its Quarterly Report on Form 10-Q for the quarter ended September 26, 2008, but such restated data have not been audited and is derived from the books and records of the Company. The information set forth below is not necessarily indicative of results of future operations, and should be read in conjunction with Item 7, “Management’s Discussion and Analysis of Financial Condition and Results of Operations” and the consolidated financial statements and related notes thereto included in Item 8 of this Annual Report on Form 10-K to fully understand factors that may affect the comparability of the information presented below. The selected consolidated financial data in this section is not intended to replace the consolidated financial statements.
On November 20, 2009, the Company, along with two of its subsidiaries, voluntarily filed petitions for relief under Chapter 11 of the United States Bankruptcy Code. Under the Bankruptcy Code, the Company’s status as a bankruptcy debtor automatically accelerated the payment of all of the Company’s debt, including the debt arising under the 2008 Senior Notes. Accordingly, the Company classified this debt as current as of December 31, 2008 and has classified the debt as part of liabilities subject to compromise as of December 31, 2009. On July 23, 2010, the Company successfully emerged from bankruptcy as a reorganized company pursuant to the Final Chapter 11 Plan. Upon the Company’s emergence from bankruptcy, the Company consummated a series of transactions that reduced its outstanding debt from $210.0 million to $107.0 million. On July 23, 2010, the Company issued $107.0 million in aggregate principal amount of New Notes, which mature on July 23, 2014. Accordingly, such debt is classified as long-term as of December 31, 2010. All other liabilities previously subject to compromise have been paid or were reinstated to the appropriate liability classification in the consolidated balance sheet.
| Years Ended December 31, | ||||||||||||||||||||
| 2011 | 2010 | 2009 | 2008 | 2007 | ||||||||||||||||
| (In thousands, except per share data) | ||||||||||||||||||||
Condensed Consolidated Statements of Operations: | ||||||||||||||||||||
Sales | $ | 366,280 | $ | 383,516 | $ | 254,388 | $ | 288,468 | $ | 291,081 | ||||||||||
Gross profit | 160,380 | 166,401 | 98,546 | 97,618 | 113,133 | |||||||||||||||
Operating expenses: | ||||||||||||||||||||
Research and development and engineering | 31,966 | 29,857 | 28,254 | 33,449 | 29,861 | |||||||||||||||
Selling, general and administrative | 78,360 | 74,880 | 60,422 | 65,904 | 59,545 | |||||||||||||||
Amortization of purchased intangible assets | 3,515 | 4,436 | 5,805 | 5,714 | 2,213 | |||||||||||||||
Impairment of goodwill, intangible assets and other long-lived assets(1) | — | — | 1,045 | 215,051 | — | |||||||||||||||
Acquisition related in-process research and development charge(2) | — | — | — | 12,142 | — | |||||||||||||||
Restructuring, restatement related costs and other | 2,304 | 2,592 | 16,291 | 10,485 | 6,655 | |||||||||||||||
Pre-petition and post-emergence professional fees | 296 | 727 | 6,966 | — | — | |||||||||||||||
|
|
|
|
|
|
|
|
|
| |||||||||||
Total operating expenses | 116,441 | 112,492 | 118,783 | 342,745 | 98,274 | |||||||||||||||
|
|
|
|
|
|
|
|
|
| |||||||||||
Income (loss) from operations | 43,939 | 53,909 | (20,237 | ) | (245,127 | ) | 14,859 | |||||||||||||
Interest income (expense), foreign exchange transaction gains (losses) and other income (expense), net | (11,882 | ) | (17,653 | ) | (28,067 | ) | (6,694 | ) | 7,313 | |||||||||||
|
|
|
|
|
|
|
|
|
| |||||||||||
Income (loss) from continuing operations before reorganization items and income taxes | 32,057 | 36,256 | (48,304 | ) | (251,821 | ) | 22,172 | |||||||||||||
Reorganization items(3) | — | (26,156 | ) | (23,606 | ) | — | — | |||||||||||||
|
|
|
|
|
|
|
|
|
| |||||||||||
Income (loss) from continuing operations before income taxes | 32,057 | 10,100 | (71,910 | ) | (251,821 | ) | 22,172 | |||||||||||||
Income tax provision (benefit) | 3,056 | 10,739 | (773 | ) | (39,032 | ) | 7,484 | |||||||||||||
|
|
|
|
|
|
|
|
|
| |||||||||||
Income (loss) from continuing operations | 29,001 | (639 | ) | (71,137 | ) | (212,789 | ) | 14,688 | ||||||||||||
Income (loss) from discontinued operations, net of tax | — | — | (132 | ) | 270 | 467 | ||||||||||||||
Gain on disposal of discontinued operations, net of tax(4) | — | — | — | 8,732 | — | |||||||||||||||
|
|
|
|
|
|
|
|
|
| |||||||||||
Consolidated net income (loss) | 29,001 | (639 | ) | (71,269 | ) | (203,787 | ) | 15,155 | ||||||||||||
Less: Net income attributable to noncontrolling interest | (28 | ) | (48 | ) | (61 | ) | (60 | ) | — | |||||||||||
|
|
|
|
|
|
|
|
|
| |||||||||||
Net income (loss) attributable to GSI Group Inc | $ | 28,973 | $ | (687 | ) | $ | (71,330 | ) | $ | (203,847 | ) | $ | 15,155 | |||||||
|
|
|
|
|
|
|
|
|
| |||||||||||
Income (loss) from continuing operations attributable to GSI Group Inc. per common share: | ||||||||||||||||||||
Basic | $ | 0.87 | $ | (0.03 | ) | $ | (4.47 | ) | $ | (14.81 | ) | $ | 1.04 | |||||||
Diluted | $ | 0.86 | $ | (0.03 | ) | $ | (4.47 | ) | $ | (14.81 | ) | $ | 1.04 | |||||||
Income (loss) from discontinued operations attributable to GSI Group Inc. per common share: | ||||||||||||||||||||
Basic | $ | — | $ | — | $ | (0.01 | ) | $ | 0.63 | $ | 0.03 | |||||||||
Diluted | $ | — | $ | — | $ | (0.01 | ) | $ | 0.63 | $ | 0.03 | |||||||||
Net income (loss) attributable to GSI Group Inc. per common share: | ||||||||||||||||||||
Basic | $ | 0.87 | $ | (0.03 | ) | $ | (4.48 | ) | $ | (14.18 | ) | $ | 1.07 | |||||||
Diluted | $ | 0.86 | $ | (0.03 | ) | $ | (4.48 | ) | $ | (14.18 | ) | $ | 1.07 | |||||||
Weighted average common shares outstanding—basic | 33,481 | 23,703 | 15,916 | 14,375 | 14,121 | |||||||||||||||
Weighted average common shares outstanding—diluted | 33,589 | 23,703 | 15,916 | 14,375 | 14,215 | |||||||||||||||
| Years Ended December 31, | ||||||||||||||||||||
| 2010 | 2009 | 2008 | 2007 | 2006 | ||||||||||||||||
| (In thousands, except per share data) | ||||||||||||||||||||
Condensed Consolidated Statements of Operations: | ||||||||||||||||||||
Sales | $ | 383,516 | $ | 254,388 | $ | 288,468 | $ | 291,081 | $ | 259,030 | ||||||||||
Gross profit | 166,401 | 98,546 | 97,618 | 113,133 | 102,398 | |||||||||||||||
Operating expenses: | ||||||||||||||||||||
Research and development and engineering | 29,857 | 28,254 | 33,449 | 29,861 | 30,130 | |||||||||||||||
Selling, general and administrative | 74,880 | 60,422 | 65,904 | 59,545 | 62,893 | |||||||||||||||
Amortization of purchased intangible assets | 4,436 | 5,805 | 5,714 | 2,213 | 2,131 | |||||||||||||||
Impairment of goodwill, intangible assets and other long-lived assets | — | 1,045 | 215,051 | — | — | |||||||||||||||
Acquisition related in-process research and development charge | — | — | 12,142 | — | — | |||||||||||||||
Restructuring, restatement related costs and other | 2,592 | 16,291 | 10,485 | 6,655 | — | |||||||||||||||
Pre-petition and post-emergence professional fees | 727 | 6,966 | — | — | — | |||||||||||||||
Total operating expenses | 112,492 | 118,783 | 342,745 | 98,274 | 95,154 | |||||||||||||||
Income (loss) from operations | 53,909 | (20,237 | ) | (245,127 | ) | 14,859 | 7,244 | |||||||||||||
Interest income (expense), foreign exchange transaction gains (losses) and other income (expense), net | (17,653 | ) | (28,067 | ) | (6,694 | ) | 7,313 | 2,526 | ||||||||||||
Income (loss) from continuing operations before reorganization items and income taxes | 36,256 | (48,304 | ) | (251,821 | ) | 22,172 | 9,770 | |||||||||||||
Reorganization items | (26,156 | ) | (23,606 | ) | — | — | — | |||||||||||||
Income (loss) from continuing operations before income taxes | 10,100 | (71,910 | ) | (251,821 | ) | 22,172 | 9,770 | |||||||||||||
Income tax provision (benefit) | 10,739 | (773 | ) | (39,032 | ) | 7,484 | 2,914 | |||||||||||||
Income (loss) from continuing operations | (639 | ) | (71,137 | ) | (212,789 | ) | 14,688 | 6,856 | ||||||||||||
Income (loss) from discontinued operations, net of tax | — | (132 | ) | 270 | 467 | 645 | ||||||||||||||
Gain on disposal of discontinued operations, net of tax | — | — | 8,732 | — | — | |||||||||||||||
Consolidated net income (loss) | (639 | ) | (71,269 | ) | (203,787 | ) | 15,155 | 7,501 | ||||||||||||
Less: Net income attributable to noncontrolling interest | (48 | ) | (61 | ) | (60 | ) | — | — | ||||||||||||
Net income (loss) attributable to GSI Group Inc | $ | (687 | ) | $ | (71,330 | ) | $ | (203,847 | ) | $ | 15,155 | $ | 7,501 | |||||||
Income (loss) from continuing operations attributable to GSI Group Inc. per common share: | ||||||||||||||||||||
Basic | $ | (0.03 | ) | $ | (4.47 | ) | $ | (14.81 | ) | $ | 1.04 | $ | 0.49 | |||||||
Diluted | $ | (0.03 | ) | $ | (4.47 | ) | $ | (14.81 | ) | $ | 1.04 | $ | 0.48 | |||||||
Income (loss) from discontinued operations attributable to GSI Group Inc. per common share: | ||||||||||||||||||||
Basic | $ | — | $ | (0.01 | ) | $ | 0.63 | $ | 0.03 | $ | 0.05 | |||||||||
Diluted | $ | — | $ | (0.01 | ) | $ | 0.63 | $ | 0.03 | $ | 0.05 | |||||||||
Net income (loss) attributable to GSI Group Inc. per common share: | ||||||||||||||||||||
Basic | $ | (0.03 | ) | $ | (4.48 | ) | $ | (14.18 | ) | $ | 1.07 | $ | 0.54 | |||||||
Diluted | $ | (0.03 | ) | $ | (4.48 | ) | $ | (14.18 | ) | $ | 1.07 | $ | 0.53 | |||||||
Weighted average common shares outstanding—basic | 23,703 | 15,916 | 14,375 | 14,121 | 13,965 | |||||||||||||||
Weighted average common shares outstanding—diluted | 23,703 | 15,916 | 14,375 | 14,215 | 14,084 | |||||||||||||||
| (1) | The Company recorded an impairment charge of $215.1 million in 2008 related to goodwill ($131.2 million), intangible assets ($78.5 million) and property, plant and equipment ($5.4 million) primarily due to an economic downturn which reduced the estimated future cash flow of these assets. |
| (2) | The Company recorded $12.1 million related to in-process research and development paid for as part of the Excel acquisition in 2008. |
| (3) | The Company recorded $26.2 million and $23.6 million in 2010 and 2009, respectively, related to our bankruptcy proceedings. |
| (4) | The Company sold its US Optics Business in 2008 and recorded a gain on disposal of $8.7 million in 2008. |
| December 31, | ||||||||||||||||||||||||||||||||||||||||
| 2010 | 2009 | 2008 | 2007 | 2006 | ||||||||||||||||||||||||||||||||||||
| (In thousands) | 2011 | 2010 | 2009 | 2008 | 2007 | |||||||||||||||||||||||||||||||||||
| (Unaudited) | (In thousands) | |||||||||||||||||||||||||||||||||||||||
Balance Sheet Data: | ||||||||||||||||||||||||||||||||||||||||
Cash, cash equivalents and short-term investments | $ | 56,781 | $ | 63,328 | $ | 69,001 | $ | 172,387 | $ | 136,501 | $ | 54,835 | $ | 56,781 | $ | 63,328 | $ | 69,001 | $ | 172,387 | ||||||||||||||||||||
Total assets | 367,167 | 414,670 | 520,317 | 507,645 | 464,143 | 348,503 | 367,167 | 414,670 | 520,317 | 507,645 | ||||||||||||||||||||||||||||||
Deferred revenue, current and long-term | 15,408 | 55,755 | 84,225 | 101,563 | 80,283 | 6,065 | 15,408 | 55,755 | 84,225 | 101,563 | ||||||||||||||||||||||||||||||
Debt, current | — | — | 185,115 | — | — | 10,000 | — | — | 185,115 | — | ||||||||||||||||||||||||||||||
Debt, long-term | 107,575 | — | — | — | — | 58,000 | 107,575 | — | — | — | ||||||||||||||||||||||||||||||
Liabilities subject to compromise(1) | — | 220,560 | — | — | — | — | — | 220,560 | — | — | ||||||||||||||||||||||||||||||
Long-term liabilities, excluding deferred revenue and debt | 21,250 | 20,739 | 44,964 | 20,262 | 25,734 | 22,783 | 21,250 | 20,739 | 44,964 | 20,262 | ||||||||||||||||||||||||||||||
Total stockholders’ equity | 178,678 | 84,311 | 152,897 | 345,678 | 317,676 | 209,003 | 178,678 | 84,311 | 152,897 | 345,678 | ||||||||||||||||||||||||||||||
| (1) | Includes $210.0 million related to obligations due under the 2008 Senior |
Item 7.Management’s Discussion and Analysis of Financial Condition and Results of Operations
Management’s Discussion and Analysis of Financial Condition and Results of Operations (“MD&A”) should be read in conjunction with the Consolidated Financial Statements and Notes included in Item 8 of this Annual Report on Form 10-K. The MD&A contains certain forward-looking statements within the meaning of the United States Private Securities Litigation Reform Act of 1995, Section 27A of the United States Securities Act of 1933, as amended, and Section 21E of the United States Securities Exchange Act of 1934, as amended. In addition to historical financial information, the following discussion and analysis contains forward-looking statements that involve risks, uncertainties and assumptions. These forward-looking statements include, but are not limited to, anticipated financial performance; our ability to continue as a going concern; expected liquidity and capitalization; drivers of revenue growth; management’s plans and objectives for future operations, expenditures and product development and investments in research and development; business prospects; potential of future product releases; anticipated sales performance; industry trends; market conditions; changes in accounting principles and changes in actual or assumed tax liabilities; expectations regarding tax exposure; anticipated reinvestment of future earnings; anticipated expenditures in regard to the Company’s benefit plans; future acquisitions and dispositions and anticipated benefits from prior acquisitions; anticipated outcomes of the SEC investigation and legal proceedings and litigation matters; and anticipated use of currency hedges. These forward-looking statements are neither promises nor guarantees, but involve risks and uncertainties that may cause actual results to differ materially from those contained in the forward-looking statements. Our actual results could differ materially from those anticipated in these forward-looking statements for many reasons, including, but not limited to, the following: economic and political conditions and the effects of these conditions on our customers’ businesses and level of business activity; our significant dependence upon our customers’ capital expenditures, which are subject to cyclical market fluctuations; our dependence upon our ability to respond to fluctuations in product demand; our ability to continually innovate; delays in our delivery of new products; our reliance upon third party distribution channels subject to credit, business concentration and business failure risks describedbeyond our control; fluctuations in our quarterly results, and our failure to meet or exceed the expectations of securities analysts or investors; customer order timing and other similar factors beyond our control; disruptions in or breaches in Security of, our information technology systems; changes in interest rates, credit ratings or foreign currency exchange rates; risk associated with our operations in foreign countries; our increased use of outsourcing in foreign countries; our failure to comply with local import and export regulations in the jurisdictions in which we operate; our history of operating losses and our ability to sustain our profitability; our exposure to the credit risk of some of our customers and in weakened markets; violations of our intellectual property rights and our ability to protect our intellectual property against infringement by third parties; risk of losing our competitive advantage; our ability to make acquisitions or divestitures that provide business benefits; our failure to successfully integrate future acquisitions into our business; our ability to retain key personnel; our restructuring and realignment activities and disruptions to our operations as a result of consolidation of our operations; product defects or problems integrating our products with other vendors’ products; disruptions in the supply of or defects in raw materials, certain key components or other goods from our suppliers; production difficulties and product delivery delays or disruptions; changes in governmental regulation of our business or products; our failure to implement new information technology systems and software successfully; our failure to realize the full value of our intangible assets; any requirement to make additional tax payments and/or recalculate certain of our tax attributes depending on the resolution of the complaint we filed against the U.S. government; our ability to utilize our net operating loss carryforwards and other tax attributes; fluctuations in our effective tax rates and audit of our estimates of tax liabilities; being subject to U.S. federal income taxation even though we are a non-U.S. corporation; being subject to the Alternative Minimum Tax for U.S. federal income tax purposes; any need for additional capital to adequately respond to business challenges or opportunities and repay or refinance our existing indebtedness, which may not be available on acceptable terms or at all; volatility in the market for our common shares; our dependence on significant cash flow to service our indebtedness and fund our operations; our ability to access cash and other assets of our subsidiaries; the influence over our business of several significant shareholders; provisions of our articles of incorporation may delay or prevent a change in control; our significant existing indebtedness and restrictions in our new senior secured credit agreement that may limit our ability to engage in certain activities; our intention not to pay dividends in the near future; and our failure to maintain appropriate internal controls in
the future. Other important risk factors that could affect the outcome of the events set forth in these statements and that could affect the Company’s operating results and financial condition are discussed in Item 1A of this Annual Report on Form 10-K and elsewhere in this Annual Report on Form 10-K. In this Annual Report on Form 10-K, the words “anticipates,” “believes,” “expects,” “intends,” “future,” “could,” “estimates,” “plans,” “would,” “should,” “potential,”“anticipates”, “believes”, “expects”, “intends”, “future”, “could”, “estimates”, “plans”, “would”, “should”, “potential”, “continues”, and similar words or expressions (as well as other words or expressions referencing future events, conditions or circumstances) identify forward-looking statements See also “Cautionary Note Regarding Forward-Looking Statements” at the beginning of this Annual Report on Form 10-K.statements. Readers should not place undue reliance on any such forward-looking statements, which speak only as of the date they are made. Management and the Company disclaim any obligation to publicly update or revise any such statement to reflect any change in its expectations or in events, conditions, or circumstances on which any such statements may be based, or that may affect the likelihood that actual results will differ from those contained in the forward-looking statements.
Accounting Period
Our interim financial statements are prepared on a quarterly basis ending on the Friday closest to the end of the calendar quarter, with the exception of the fourth quarter which always ends on December 31st.
Business Overview
We design, develop, manufacture and sell precision motion control devices and associated precision technologies, photonics-basedlaser-based solutions (consisting of lasers and laser-based systems), laser systemsscanning devices, and electro-optical components)precision motion and semiconductor systems.optical control technologies. Our customers incorporate our technology is incorporated into theircustomer products or manufacturing processes for a wide range of applications in a variety of markets, including: industrial, scientific, electronics, semiconductor,industrial, medical, and aerospace.scientific. Our products enable customers to make advances in materials and processing technology and to meet extremely precise manufacturing specifications.
During the quarter ended April 1, 2011, we realigned the structure of our internal organization and business processes in a manner that caused the composition of our reportable segments to change. This decision was made as a result of our internal assessment of our organization based on information received by our chief operating decision maker, the Chief Executive Officer. As a result of this process, we changed our reportable segments to the following three strategic operating segments: Laser Products, Precision Motion and Technologies, and Semiconductor Systems. Our products are grouped into three segments: Precision Technology,new reportable segment structure allows us to prioritize our investments, align our resources to meet the demands of the markets we serve, optimize business performance and maximize opportunities for collaboration and synergy within each segment. We evaluate the performance of, and allocate resources to, our segments based on sales and gross profit. Our reportable segments have been identified based on commonality of end markets, customers and technologies amongst our individual product lines, which is consistent with our operating structure and associated management structure. Each segment reports to a separate divisional manager. Consequently, the realignment caused the composition of our reportable segments to change from prior years, with the exception of the Semiconductor Systems segment. Our reportable segment financial information has been restated to reflect the updated reportable segment structure for all periods presented.
Our Laser Products segment designs, manufactures and Excel.markets photonics-based solutions, consisting of lasers and laser-based systems, to customers worldwide. The segment serves highly demanding photonics-based applications such as cutting, welding, marking, engraving, micro-machining, and scientific research. The segment sells these products both directly utilizing our highly technical sales force and indirectly through resellers and distributors.
Our Precision Motion and Technologies segment designs, manufactures and markets precision motion and optical control technologies, consisting of air bearing spindles, encoders, thermal printers, laser scanning devices, and light and color measurement devices to customers worldwide. The vast majority of the segment’s product offerings are sold to original equipment manufacturers (“OEM’s”). The segment sells these products both directly utilizing a highly technical sales force and indirectly through resellers and distributors.
Our Semiconductor Systems segment designs, develops and sells laser-based production systems for semiconductor, microelectronics and electronics manufacturing. The segment offers a full spectrum of production systems, featuring high precision laser and motion technology, to process semiconductor wafers, LCD panels and microelectronic components. Semiconductor Systems’ solutions address a wide range of applications in a variety of end markets, including industrial, scientific, consumer electronics, medical, and aerospace. The segment supplies leading global foundries, integrated device manufacturers and component manufacturers.
Recent Events
Refinancing and Reduction of Debt
On August 17, 2011, we optionally redeemed $35.0 million in aggregate principal of our 12.25% Senior Secured PIK Election Notes (the “2014 Notes”), constituting 32% of the outstanding $108.1 million principal amount. On October 19, 2011, we consummated the refinancing of the remaining $73.1 million of 2014 Notes through the proceeds from a new $80.0 million senior secured credit agreement (the “Credit Agreement”) with a syndicate of banks. In December 2011, we voluntarily repaid $5.1 million on our new revolving credit facility. The refinancing and reduction of our principal debt from $107.6 million as of December 31, 2010 to $68.0 million as of December 31, 2011 substantially reduced our interest expense, while extending the maturity of our principal debt.
Restructuring Plan
In the fourth quarter 2011, we initiated a new restructuring program, targeting as much as $5.0 million in annualized cost savings with a goal of eliminating up to twelve (12) facilities. The facility reductions, which include manufacturing and R&D facilities as well as sales offices, are expected to be achieved through a combination of site consolidations and divestitures. Three facilities have been consolidated as of December 31, 2011. We striveexpect to createincur cash charges of $4.0 million to $5.0 million related to our 2011 restructuring plan, $1.2 million of which was recorded during 2011. Additionally, we expect to incur non-cash restructuring charges, related to accelerated depreciation of $3.0 million to $4.0 million, $1.0 million of which was recorded during 2011. We expect to substantially complete the restructuring program by the end of 2012.
As part of the restructuring plan, we have placed our Semiconductor Systems segment and laser systems product line, which is sold under the Control Laser and Baublys brand names, under strategic review. We intend to exit these businesses. In aggregate, these three businesses contributed approximately $62.0 million of revenue in 2011, with operating profitability below our other business lines.
Appointment of Executive Officers
We appointed John Roush as Chief Executive Officer in December 2010 and Robert Buckley as Chief Financial Officer in April 2011. During 2011, we appointed Jamie Bader as President and Group Executive of our Precision Motion and Technologies segment; David Clarke as Group Executive of our Laser Products segment; and Deborah Mulryan as Vice President of Human Resources.
Settlement of SEC Investigation
On May 16, 2011, we agreed to settle the SEC’s investigation relating to our historical accounting practices and the restatement of our historical financial statements that began on May 14, 2009, without admitting or denying the findings of the SEC, by consenting to the entry of an administrative order that requires us to cease and desist from committing or causing any violations and any future violations of the reporting, books and records, and internal controls provisions of the Securities Exchange Act of 1934. The SEC did not charge us with fraud nor impose a civil penalty or other money damages as part of the settlement. The settlement completely resolves the SEC investigation as it relates to the Company.
Settlement of Class Action
On February 22, 2011, the United States District Court for the District of Massachusetts entered an order granting final approval of settlement in the putative shareholder value through:class action filed on December 12, 2008. Our contribution to the settlement amount was limited to our self-insured retention amount under our directors and officers insurance policy. As a result of the court’s final approval of the settlement, 993,743 shares of our common stock that were placed in a reserve account and held in escrow for the benefit of the holders of Section 510(b) claims were released to our shareholders entitled to such shares.
Final Closure of Chapter 11 Bankruptcy
On November 20, 2009, GSI Group Inc. and two of its wholly owned subsidiaries, GSI Group Corporation and MES International, Inc. (the “Debtors”), filed voluntary petitions for relief under Chapter 11 of the United States Bankruptcy Code. On July 23, 2010, we emerged from bankruptcy and our Board of Directors was reconstituted. Our bankruptcy cases initiated under Chapter 11 of the Bankruptcy Code were closed on September 2, 2011. We no longer have any legal or material financial liability relating to those cases. Please see Notes 2, 7, and 12 to Consolidated Financial Statements included under Part II, Item 8 of this Annual Report on Form 10-K for additional information regarding the Chapter 11 proceedings.
Listing of Common Shares
Our common shares were approved for listing on The NASDAQ Global Select Market on February 9, 2011 and began trading on February 14, 2011 under the symbol “GSIG”.
Strategy
Our strategy is to drive sustainable, profitable growth through short term and long term initiatives, including:
Driving profitable organic sales growthstrengthening our strategic position in scanning solutions, fiber lasers, and medical components through our participationcontinual investment in attractive end markets;differentiated new products and solutions;
Delivering a continual stream of successful new product launches incorporating differentiated technology;expanding our market access and reach, particularly in higher growth, emerging regions, through investment in internal sales channels as well as external channel partners;
Generating high levels of cash flow from operations;
Broadeningbroadening our product and service offerings through the acquisition of innovative and complementary technologies and solutions;
streamlining our existing operations through site consolidations and strategic divestitures and expanding our business through strategic acquisitions;
expanding operating margins by establishing a continuous improvement culture through formalized productivity programs and initiatives; and
Attracting,attracting, retaining, and developing talented and motivated employees.
GSI Group Inc. was founded and initially incorporated in Massachusetts in 1968 as General Scanning, Inc. (“General Scanning”). General Scanning developed, manufactured and sold components and subsystems used for high-speed micro positioning of laser beams. In 1999, General Scanning merged with Lumonics Inc., a Canadian company that developed, manufactured and sold laser-based, advanced manufacturing systems for electronics, semiconductor, and general industrial applications. The post-merger entity, GSI Lumonics Inc., continued under the laws of the Province of New Brunswick, Canada. In 2005, we changed our name to GSI Group Inc.
We group our business units, also known as product lines, into three segments: Precision Technology, Semiconductor Systems, and Excel. Our Precision Technology segment primarily sells components to original equipment manufacturers (“OEM”s), who then integrate products of our Precision Technology segment into application specific products or systems. Our Precision Technology segment’s OEM products include those based on its core competencies in laser, precision motion and motion control technology. Our Semiconductor Systems segment designs, develops and sells production systems that process semiconductor wafers using laser beams and high precision motion technology. Our Semiconductor Systems segment sells manufacturing systems to integrated device manufacturers and wafer processors. Our Excel segment designs, manufactures and markets photonics-based solutions consisting of lasers, laser-based systems, precision motion devices and electro-optical components, primarily for industrial and scientific applications. Our Excel segment primarily sells components to OEMs, who then integrate the Excel segment’s products into application specific products or systems. Upon the completion of a review of our reporting structure by our new Chief Executive Officer, we may change the composition of our segments in the future.
Strategy
We strive to expand our presence in the markets we serve both through profitable organic growth and strategic acquisitions. This strategy led to our acquisition of Excel in the third quarter of 2008. The acquisition of Excel represented a major step in our effort to penetrate attractive markets that depend on photonics-based solutions. The acquisition also allowed our Precision Technology segment to expand our presence in several markets that it serves. During 2008 and 2009, we undertook steps to integrate parts of Excel’s business with those of our legacy business. As a result of the bankruptcy filing in November 2009, further integration of the two businesses was delayed. We expect to have additional opportunities to integrate the two businesses in the future but our primary focus in the near term will be on the continued development and introduction of new products, increasing our presence in markets we currently serve and identifying new market opportunities for new and existing products. In addition, we may explore potential divestments of non-strategic businesses.
Significant Events
The following significant events occurred through the filing of this Annual Report on Form 10-K:
Overview of Financial Results
As a result of the significantrecent events discussed above as well as developments in the economy, our financial results in 2011, 2010 and 2009 differ significantly from each other and from those in prior years. In 2010,2011, we reported a net lossincome of $29.0 million as compared to net losses of $0.7 million compared to a net loss ofand $71.3 million in 2009.2010 and 2009, respectively. Our 2011 operating results saw a significant decrease in non-recurring charges, which in prior years related to professional fees associated with our bankruptcy filing and restatement of prior period financial statements. Our 2011 results included $2.3 million of restructuring, restatement related costs and other charges, and $0.3 million of post-emergence professional fees resulting from our emergence from bankruptcy on July 23, 2010. Our 2010 operating results included $29.5 million of non-recurring charges comprised of $26.2 million of net reorganization items, $2.6 million of restructuring, restatement related costs and other charges, and $0.7 million of post-emergence professional fees subsequent to our emergence from bankruptcy on July 23, 2010.fees. Our 2009 operating results included $47.9 million of non-recurring charges comprised of $23.6 million of net reorganization items, $16.3 million of restructuring, restatement related costs and other charges, $7.0 million of pre-petition professional fees, related to the debt restructuring analysis, and $1.0 million relating to the impairment of our goodwill and intangible assets.
Our
Excluding the impact of the non-recurring bankruptcy and restatement related costs, our financial results for 2011 and 2010 improved significantly compared to 2009, which reflected2009. This is a reflection of the adverse impact that the world-wide economic downturn had on the demand for our products beginning in the latter half of 2008, which was one of the worst economic downturns in recent history.2008. The reduced demand for our products significantly contributed to the $71.3 million loss that we reported for 2009. Our sales began to recover somewhat in the latter part of 2009, and began to grow in 2010. Included in our results forsaw increasing demand during 2010 wasand 2011, exclusive of the Semiconductor System segment’s recognition of revenue of $0.5 million, $45.7 million in the first quarter relatedand $30.4 million for 2011, 2010 and 2009, respectively, relating to orders placed by customers prior to 2009 that had been previously deferred due to undelivered elements or unresolved commitments. The specific components of our operating results for 2011, 2010 and 2009 are further discussed below.
Results of Operations
The following table sets forth our results of operations as a percentage of sales for the periods indicated:
| Year Ended December 31, | Year Ended December 31, | |||||||||||||||||||||||
| 2010 | 2009 | 2008 | 2011 | 2010 | 2009 | |||||||||||||||||||
Sales | 100.0 | % | 100.0 | % | 100.0 | % | 100.0 | % | 100.0 | % | 100.0 | % | ||||||||||||
Cost of goods sold | 56.6 | 61.3 | 66.2 | 56.2 | 56.6 | 61.3 | ||||||||||||||||||
|
|
| ||||||||||||||||||||||
Gross profit | 43.4 | 38.7 | 33.8 | 43.8 | 43.4 | 38.7 | ||||||||||||||||||
|
|
| ||||||||||||||||||||||
Operating expenses: | ||||||||||||||||||||||||
Research and development and engineering | 7.8 | 11.1 | 11.6 | 8.7 | 7.8 | 11.1 | ||||||||||||||||||
Selling, general and administrative | 19.5 | 23.7 | 22.8 | 21.4 | 19.5 | 23.7 | ||||||||||||||||||
Amortization of purchased intangible assets | 1.2 | 2.3 | 2.0 | 1.0 | 1.2 | 2.3 | ||||||||||||||||||
Impairment of goodwill, intangible assets and other long-lived assets | — | 0.4 | 74.5 | |||||||||||||||||||||
Acquisition related in-process research and development charge | — | — | 4.2 | |||||||||||||||||||||
Impairment of goodwill and intangible assets | — | — | 0.4 | |||||||||||||||||||||
Restructuring, restatement related costs and other | 0.7 | 6.5 | 3.7 | 0.6 | 0.7 | 6.5 | ||||||||||||||||||
Pre-petition and post-emergence professional fees | 0.2 | 2.7 | — | 0.1 | 0.2 | 2.7 | ||||||||||||||||||
|
|
| ||||||||||||||||||||||
Total operating expenses | 29.4 | 46.7 | 118.8 | 31.8 | 29.4 | 46.7 | ||||||||||||||||||
|
|
| ||||||||||||||||||||||
Income (loss) from operations | 14.0 | (8.0 | ) | (85.0 | ) | 12.0 | 14.0 | (8.0 | ) | |||||||||||||||
Interest income | — | 0.1 | 1.1 | — | — | 0.1 | ||||||||||||||||||
Interest expense | (5.2 | ) | (10.9 | ) | (3.6 | ) | (3.5 | ) | (5.2 | ) | (10.9 | ) | ||||||||||||
Foreign exchange transaction gains (losses) | 0.1 | (0.3 | ) | 0.4 | ||||||||||||||||||||
Foreign exchange transaction gains (losses), net | — | 0.1 | (0.3 | ) | ||||||||||||||||||||
Other income (expense), net | 0.5 | 0.1 | (0.2 | ) | 0.3 | 0.5 | 0.1 | |||||||||||||||||
|
|
| ||||||||||||||||||||||
Income (loss) from continuing operations before reorganization items and income taxes | 9.4 | (19.0 | ) | (87.3 | ) | 8.8 | 9.4 | (19.0 | ) | |||||||||||||||
Reorganization items | (6.8 | ) | (9.3 | ) | — | — | (6.8 | ) | (9.3 | ) | ||||||||||||||
|
|
| ||||||||||||||||||||||
Income (loss) from continuing operations before income taxes | 2.6 | (28.3 | ) | (87.3 | ) | 8.8 | 2.6 | (28.3 | ) | |||||||||||||||
Income tax provision (benefit) | 2.8 | (0.3 | ) | (13.5 | ) | 0.8 | 2.8 | (0.3 | ) | |||||||||||||||
|
|
| ||||||||||||||||||||||
Loss from continuing operations | (0.2 | ) | (28.0 | ) | (73.8 | ) | ||||||||||||||||||
Income (loss) from discontinued operations, net of tax | — | — | — | |||||||||||||||||||||
Gain on disposal of discontinued operations, net of tax | — | — | 3.1 | |||||||||||||||||||||
Income (loss) from continuing operations | 8.0 | (0.2 | ) | (28.0 | ) | |||||||||||||||||||
Loss from discontinued operations, net of tax | — | — | — | |||||||||||||||||||||
|
|
| ||||||||||||||||||||||
Consolidated net loss | (0.2 | ) | (28.0 | ) | (70.7 | ) | ||||||||||||||||||
Consolidated net income (loss) | 8.0 | (0.2 | ) | (28.0 | ) | |||||||||||||||||||
Less: Net income attributable to non-controlling interest | — | — | — | — | — | — | ||||||||||||||||||
|
|
| ||||||||||||||||||||||
Net loss attributable to GSI Group Inc. | (0.2 | )% | (28.0 | )% | (70.7 | )% | ||||||||||||||||||
Net income (loss) attributable to GSI Group Inc. | 8.0 | % | (0.2 | )% | (28.0 | )% | ||||||||||||||||||
|
|
| ||||||||||||||||||||||
Years Ended December 31, 2010 and 2009
Sales
The following table sets forth external sales by businessreportable segment for 2011, 2010 and 2009 in dollars (dollars in thousands) and percentage change::
| 2010 | 2009 | Increase (Decrease) | Percentage Change | |||||||||||||
Precision Technology | $ | 128,220 | $ | 79,456 | $ | 48,764 | 61.4 | % | ||||||||
Semiconductor Systems | 81,283 | 49,669 | 31,614 | 63.6 | % | |||||||||||
Excel | 183,384 | 129,964 | 53,420 | 41.1 | % | |||||||||||
Intersegment sales eliminations(1) | (9,371 | ) | (4,701 | ) | (4,670 | ) | 99.3 | % | ||||||||
Total | $ | 383,516 | $ | 254,388 | $ | 129,128 | 50.8 | % | ||||||||
| % Change | ||||||||||||||||||||
| 2011 | 2010 | 2009 | 2011 vs. 2010 | 2010 vs. 2009 | ||||||||||||||||
Laser Products | $ | 130,957 | $ | 121,360 | $ | 94,567 | 7.9 | % | 28.3% | |||||||||||
Precision Motion and Technologies | 191,382 | 180,872 | 110,152 | 5.8 | % | 64.2% | ||||||||||||||
Semiconductor Systems | 43,941 | 81,284 | 49,669 | (45.9 | )% | 63.7% | ||||||||||||||
|
|
|
|
|
|
|
|
|
| |||||||||||
Total | $ | 366,280 | $ | 383,516 | $ | 254,388 | (4.5 | )% | 50.8% | |||||||||||
|
|
|
|
|
|
|
|
|
| |||||||||||
2011 Compared with 2010
During 2010, Precision Technology segment salesSales increased by $48.8$9.6 million, or 61.4%7.9%, from $79.5 millionprimarily as a result of increases among many of the laser products due to stronger demand, primarily in 2009 to $128.2 millionour industrial and custom lasers and laser systems that serve the industrial, electronics and scientific markets. These increases in 2010. sales were partially offset by a slight decrease in certain sales of our industrial sealed lasers.
2010 Compared with 2009
Sales increased by $26.8 million, or 28.3%, primarily attributable to the improvement in the overall global economic environment, which resulted in a rebound in sales among many of our products during 2010 as compared to 2009. Growth and demand was particularly strong for our industrial lasers, which are found in virtually every industrial marketplace.
Precision Motion and Technologies
2011 Compared with 2010
Sales increased by $10.5 million, or 5.8%, primarily attributable to strong growth and demand in our laser scanning devices as a result of the continued rebound of the electronics and industrial end markets. We also experienced continued growth in our printed circuit board spindles product line, which serves the PCB drilling industry. These sales increases were partially offset by a decrease in sales in our encoder product line due to weaker demand in the data storage industry.
2010 Compared with 2009
Sales increased by $70.7 million, or 64.2%, primarily due to sales increases across allnearly every product lines that compriseline within the Precision Technology segment, primarily due to higher demand from OEM and other customers, who in turn experienced increases in demand for their products due to anthe improving world economy. Our results for 2009, particularly the first half of the year, reflected periods of particularly weak demand for our products due to the tight credit conditions and low levels of personal consumption and capital investment that existed at that time. The increase in sales, from 2009 to 2010, was primarily driven by recoveries in our drilling components business, which serves a variety of consumer industries including electronics and automobiles and our encoder technologies, which serve a variety of industries including motion control, semiconductor, electronics, medical equipment and data storage.
Semiconductor Systems
Semiconductor Systems segment sales transactions are generally multiple element arrangements that are accounted for in accordance with the provisions of Accounting Standards Codification (“ASC”) 605-25, “Multiple Element Arrangements”. Due to the multiple element nature and timing of customer acceptance of Semiconductor Systems segment sales transactions, sales in any given period may not correspond to shipments made during that period and may not be indicative of future results. During
2011 Compared with 2010 Semiconductor Systems segment
Sales decreased by $37.3 million, or 45.9%, primarily due to $45.7 million that was recognized in 2010 that had been deferred from orders placed by customers prior to 2009 but had not been recognized due to previously undelivered elements or unresolved commitments, compared to $0.5 million of such revenue recognized in 2011. Exclusive of these transactions, we experienced sales growth in the memory repair and LCD repair applications. To a lesser extent, sales also increased in our wafer marking and circuit trim product lines. These sales increases were partially offset by a decrease in sales of upgrades in our wafer trim product line.
2010 Compared with 2009
Sales increased by $31.6 million, or 63.6%63.7%, from $49.7 million in 2009primarily due to $81.3 million in 2010. Thean increase in Semiconductor Systems sales was due to higher sales of wafer marking equipment and equipment upgrades to customers, whose level of capital expenditures began rebounding in 2010 from historically low levels in previous years due to the turmoil in the world economy, especially for capital goods and electronic products. The increase in sales was also attributable to the recognition of revenue of $45.7 million of revenue during 2010 as compared to $30.4 million during 2009, that had been deferred from orders placed by customers prior to 2009 but had not been recognized due to previously undelivered elements or unresolved commitments.
Gross Profit
The following table sets forth the external gross profit and external gross profit margin for each of our reportable segments for 2011, 2010 and 2009 (dollars in thousands):
| 2011 | 2010 | 2009 | ||||||||||
Gross profit: | ||||||||||||
Laser Products | $ | 48,724 | $ | 46,734 | $ | 34,611 | ||||||
Precision Motion and Technologies | 90,741 | 88,352 | 47,787 | |||||||||
Semiconductor Systems | 20,915 | 31,315 | 16,148 | |||||||||
|
|
|
|
|
| |||||||
Total | $ | 160,380 | $ | 166,401 | $ | 98,546 | ||||||
|
|
|
|
|
| |||||||
Gross profit margin: | ||||||||||||
Laser Products | 37.2 | % | 38.5 | % | 36.6 | % | ||||||
Precision Motion and Technologies | 47.4 | % | 48.8 | % | 43.4 | % | ||||||
Semiconductor Systems | 47.6 | % | 38.5 | % | 32.5 | % | ||||||
|
|
|
|
|
| |||||||
Total | 43.8 | % | 43.4 | % | 38.7 | % | ||||||
|
|
|
|
|
| |||||||
Gross profit and gross profit margin can be influenced by a number of factors including product mix, pricing, volume, costs for raw materials and outsourced manufacturing, headcount, inventory and warranty expenses, and shipping and handling costs, at any particular time.
Laser Products
2011 Compared with 2010
Gross profit increased $2.0 million, or 4.3%, in 2011 compared to 2010, primarily due to the 7.9% increase in sales. The 1.3 percentage point decrease in gross profit margin was primarily attributable to unfavorable product mix and pricing among various product lines.
2010 Compared with 2009
Gross profit increased $12.1 million, or 35.0%, in 2010 as compared to 2009. The 1.9 percentage point improvement in gross profit margin was primarily attributable to the increase in volume of sales as well as a change in product mix, partially offset by an increase in inventory and warranty expenses.
Precision Motion and Technologies
2011 Compared with 2010
Gross profit increased $2.4 million, or 2.7%, in 2011 as compared to 2010 due to the 5.8% increase in sales. The 1.4 percentage point decrease in gross profit margin was primarily attributable to an unfavorable mix of products sold in 2011 compared to 2010.
2010 Compared with 2009
Gross profit increased $40.6 million, or 84.9%, in 2010 as compared to 2009. The increase in gross profit and the 5.4 percentage point increase in gross profit margin were primarily attributable to volume growth and the higher capacity utilization resulting from the increased demand for our products, particularly in our air bearing spindles, encoders, and laser scanning devices. Our increase in gross profit margin was partially offset by increases in inventory and warranty expenses.
Semiconductor Systems
2011 Compared with 2010
Gross profit decreased $10.4 million, or 33.2%, in 2011 as compared to 2010. The decrease was primarily due to the impact of $20.0 million of gross profit recognized in 2010 related to orders received prior to 2009 for which we did not recognize revenue in the period in which the order was shipped due to previously undelivered elements or unresolved commitments, as compared to the final remaining $0.3 million of gross profit recognized in 2011. Excluding the impact of these transactions, gross profit in terms of dollars and as a percentage of sales, significantly increased. Gross profit margin in 2011 was 47.6% compared to 38.5% in 2010, an improvement of 9.1 percentage points. The increase in gross profit margin percentage was primarily attributable to a favorable product mix, which included a shift to highly profitable upgrade and retrofit sales. Gross profit margin also improved due to lower inventory and warranty expenses.
2010 Compared with 2009
Gross profit increased by $15.2 million, or 93.9%, in 2010 as compared to 2009 and gross profit margin improved 6.0 percentage points from 32.5% in 2009 to 38.5% in 2010. These increases were attributable to higher capacity utilization and absorption and a favorable product mix. Sales in 2010 had a higher proportion of sales attributable to higher margin equipment sales and equipment upgrades. Gross profit of $20.0 million in 2010 and $16.4 million in 2009 resulted from the recognition of revenue that had been deferred from orders placed by customers prior to 2009, but had not been recognized in the period in which shipments occurred due to previously undelivered elements or unresolved commitments. The revenue related to these orders was recognized once the final deliverables or commitments were resolved. We expect to recognize the remaining $0.4 million of revenue related to these orders in 2011.
Excel segment sales increased by $53.4 million, or 41.1%, from $130.0 million in 2009 to $183.4 million in 2010. The increase in sales was primarily attributable to the improving economy, which resulted in a rebound in sales among many of the product lines during 2010 as compared to 2009. The growth was primarily attributable to our scanners and lasers product lines, which continued to rebound with the improving economy and demand for capital goods and electronic products. Growth and demand was particularly strong for our sealed CO2 lasers and electro-optics technologies, which are found in cutting and engraving machines, laser marking systems, and custom laser processing tools in virtually every industrial marketplace. Growth and demand was also strong in our optical scanning devices, including galvanometer technology which has allowed us to introduce products that have raised the bar for accuracy, speed, performance and reliability in scientific and OEM optical scanning solutions.
Gross Profit
The following table sets forth gross profit and gross profit percentage, by business segments for 2010 and 2009 (dollars in thousands):
| 2010 | 2009 | |||||||
Gross profit: | ||||||||
Precision Technology | $ | 59,140 | $ | 31,267 | ||||
Semiconductor Systems | 31,790 | 16,157 | ||||||
Excel | 80,135 | 53,041 | ||||||
Intersegment sales eliminations and other | (4,664 | ) | (1,919 | ) | ||||
Total | $ | 166,401 | $ | 98,546 | ||||
Gross profit percentages: | ||||||||
Precision Technology | 46.1 | % | 39.4 | % | ||||
Semiconductor Systems | 39.1 | % | 32.5 | % | ||||
Excel | 43.7 | % | 40.8 | % | ||||
Intersegment sales eliminations and other | 49.8 | % | 40.8 | % | ||||
Total | 43.4 | % | 38.7 | % | ||||
Gross profit as a percentage of sales can be influenced by a number of factors including product mix, pricing, volume, costs for raw materials and outsourced manufacturing, headcount, warranty costs and charges related to excess and obsolete inventory, at any particular time.
The Precision Technology segment’s gross profit increased by $27.9 million, or 89.1%, from $31.3 million in 2009 to $59.1 million in 2010. The Precision Technology segment’s gross profit margin in 2010 was 46.1%, compared with 39.4% in 2009, an increase of 6.7 percentage points. Our gross margin, in terms of dollars and percentage of sales, improved due to volume growth and the higher capacity utilization resulting from the increased demand for our products, particularly in our drilling and encoder product lines. Our increase in gross profit margin was partially offset by increases in excess and obsolete inventory and warranty provisions.expenses.
Operating Expenses
The Semiconductor System segment’s gross profit increased by $15.6 million, or 96.8%, from $16.2 million in 2009 to $31.8 million in 2010. Semiconductor Systems segment’s gross profit margin in 2010 was 39.1%, an improvement of 6.6 percentage points over 2009. The increase in the Semiconductor Systems segment gross profit margin was attributable to higher capacity utilization and absorption and a favorable product mix. Sales in 2010 had a higher proportion of sales attributable to wafer marking equipment and equipment upgrades, which generally have higher margins than the segment’s other products. Gross margin of $20.0 million infollowing table sets forth operating expenses for 2011, 2010 and $16.4 million2009 (dollars in 2009 resulted from the recognition of $45.7 million of revenue during 2010 as compared to $30.4 million during 2009, that had been deferred from orders placed by customers prior to 2009, but had not been recognized in the period in which shipments occurred due to previously undelivered elements or unresolved commitments. The revenue related to these orders was recognized once the final deliverables or commitments were resolved. Our increase in gross profit margin was partially offset by increases in excess and obsolete inventory and warranty provisions.thousands):
The Excel segment’s gross profit in 2010 was $80.1 million, compared with $53.0 million in 2009. The Excel segment’s gross profit margin in 2010 was 43.7%, an improvement of 2.9 percentage points over 2009. The increase in gross profit and gross profit margin was primarily attributable to the increase in volume of sales as well as a change in product mix, partially offset by an increase in excess and obsolete inventory and warranty provisions.
| % Change | ||||||||||||||||||||
| 2011 | 2010 | 2009 | 2011 vs. 2010 | 2010 vs. 2009 | ||||||||||||||||
Research and development and engineering | $ | 31,966 | $ | 29,857 | $ | 28,254 | 7.1% | 5.7% | ||||||||||||
Selling, general and administrative | 78,360 | 74,880 | 60,422 | 4.6% | 23.9% | |||||||||||||||
Amortization of purchased intangible assets | 3,515 | 4,436 | 5,805 | (20.8)% | (23.6)% | |||||||||||||||
Impairment of goodwill and intangible assets | — | — | 1,045 | — | n/a | |||||||||||||||
Restructuring, restatement related costs and other | 2,304 | 2,592 | 16,291 | (11.1)% | (84.1)% | |||||||||||||||
Pre-petition and post-emergence professional fees | 296 | 727 | 6,966 | (59.3)% | (89.6)% | |||||||||||||||
|
|
|
|
|
|
|
|
|
| |||||||||||
Total | $ | 116,441 | $ | 112,492 | $ | 118,783 | 3.5% | (5.3)% | ||||||||||||
|
|
|
|
|
|
|
|
|
| |||||||||||
Research and Development and Engineering Expenses
Research and development and engineering (“R&D”) expenses are primarily comprised of labor, and other employee-related expenses. expenses and materials.
2011 Compared with 2010
R&D expenses were $32.0 million, or 8.7% of sales, in 2011, compared with $29.9 million, or 7.8% of sales, in 2010. R&D expenses, in terms of total dollars and as a percentage of sales, increased as a result of increased headcount and higher project spending for the development of new products and technologies in several of our product lines.
2010 Compared with 2009
R&D expenses were $29.9 million, in 2010, representingor 7.8% of sales, in 2010, compared to
$28.3with $28.3 million, or 11.1%, of sales, in 2009. R&D expenses, in terms of total dollars, increased slightly due to engineering costs for the next generation wafer repair system in our Semiconductor Systems segment, and decreased as a percentage of sales due to the overall growthincrease in sales during 2010.
Selling, General and Administrative Expenses
Selling, general and administrative (“SG&A”) expenses include costs for sales and marketing, sales administration, finance, human resources, legal, information systems, facilities and executive management,management.
2011 Compared with 2010
SG&A expenses were $78.4 million, or 21.4% of sales, in 2011, compared to $74.9 million, or 19.5% of sales, in 2010. SG&A expenses, in terms of total dollars and includesas a percentage of sales, increased primarily as a result of an increase in employee personnel costs and an increase in selling and marketing costs. These increases were partially offset by decreases in various professional fees, which were significantly higher in 2010 due to the costs associated with the filing of various quarterly and annual financial statements with the SEC related costs, commissions, advertising, legal, tax, accountingto 2008, 2009 and other professional fees. 2010.
2010 Compared with 2009
SG&A expenses were $74.9 million, in 2010, representingor 19.5% of sales, in 2010, compared to $60.4 million, or 23.7% of sales, in 2009. SG&A expenses, in terms of total dollars, increased primarily as a result of an increase in overall sales, selling costs and commissions, and an increase in legal, financial and accounting related consulting and professional fees. Financial and accounting related consulting and professional fees increased due to our efforts to emerge from bankruptcy and to issue our 2009 quarterly and annual financial statements and our 2010 quarterly financial statements. We expect to incur consulting and professional fees in connection with the 2010 annual financial statements and the 2011 periodic reporting requirements. In addition, SG&A included a charge of $1.0 million during 2010 related to severance and stock compensation pursuant to a separation agreement related to the resignation of our former CEO.
Amortization of Purchased Intangible Assets
Amortization of intangible assets is discussed below in “Critical Accounting Policies and Estimates.” Amortization of purchased intangible assets is charged to our Precision TechnologyMotion and ExcelTechnologies and Laser Products segments. Amortization for core technology is included in cost of goods sold and charged to our Precision Motion and Technologies and Laser Products segments.
Amortization of purchased intangible assets, excluding the amortization for core technology, that is includedwas $3.5 million, or 1.0% of sales, in cost of goods sold, was2011; $4.4 million, or 1.2% of sales, in 2010, compared to2010; and $5.8 million or 2.3%, of sales, in 2009. The decrease in 2010,decreases, in terms of bothtotal dollars and as a percentage of sales, was primarilywere related to the completion of amortization of certain intangible assets, including intangible assets acquired as part of the 2008 Excel acquisition becoming fully amortized in the second half of 2009.acquisition.
Impairment of Goodwill, Intangible Assets and Other Long-Lived Assets
The two most recent annual goodwill and indefinite-lived intangible asset impairment test wastests were performed as of the beginning of the second quarter of 2011 and 2010, respectively, noting no impairment. Due to our bankruptcy filing in November 2009, we conducted an interim review as of December 31, 2009 to assess whether the carrying value of our goodwill, intangible assets and other long-lived assets was impaired. Based on our review and evaluation, we noted that the carrying value of certain assets exceeded their fair market value, which resulted in a $1.0 million charge to reduce the carrying amounts of goodwill and intangible assets.assets in 2009.
Restructuring, Restatement Related Costs and Other
We recorded restructuring, restatement related costs and other expensecharges of $2.3 million, $2.6 million and $16.3 million induring 2011, 2010 and 2009, respectively.
Restructuring Charges
We recorded a restructuring charge of $2.2 million in December 2011 related to the consolidation of certain operations in Asia and the United States in an effort to reduce manufacturing and operating costs pursuant to the 2011 restructuring program. Three facilities have been eliminated as of December 31, 2011. The $2.2 million charge was related to accelerated depreciation of $1.0 million due to the change in useful lives of certain long-lived assets, severance and retention related costs of $0.8 million, and other restructuring related costs of $0.4 million. We expect to incur cash charges of $4.0 million to $5.0 million related to our 2011 restructuring plan, $1.2 million of which was recorded during 2011. Additionally, we expect to incur non-cash restructuring charges, related to accelerated depreciation of $3.0 million to $4.0 million, $1.0 million of which was recorded during 2011. We expect to substantially complete the restructuring program by the end of 2012.
During 2011, we also recorded a $0.1 million charge related to revised assumptions for our abandoned lease and accretion expense related to a prior year restructuring charge for a German facility, compared to a charge of $0.4 million in 2010 related to this facility.
In 2009, we determined that we would no longer recover sublease payments from a subtenant in a German location.facility. As a result of revised sublease assumptions, we recorded restructuring charges of $0.4 million and $1.3 million during 2010 and 2009, respectively.
In 2009, we also initiated certain restructuring activities to consolidate our German sales and distribution operations for the Precision TechnologyMotion and Technologies segment located in Munich, Germany with those of Excel Technology Europe,operations located in Darmstadt, Germany. These consolidation activities were completed in 2009, at a total cost of $0.2 million.
During 2009, we recorded $0.8 million in additionalnet restructuring costs of $0.7 million related our 2008 UKU.K. restructuring plan, which moved operations from the UKU.K. to China.
Restatement Related Costs and Other
During the years ended December 31,2011, 2010 and 2009, we incurred costs to third parties, including auditors, attorneys, forensic accountants,for professional services performed in connection with the SEC investigation and other advisors, that relate to the restatement of our previously issued financial statements as reported in our Annual Report on Form 10-K for the year-endedyear ended December 31, 2008 and Quarterly Report onour Form 10-Q for the quarter ended September 26, 2008, including 2008. These costs totaled $0.1 million during 2011, primarily related to legal fees associated with
the SEC investigation, certain shareholder actions and the internal FCPA investigation. These costs are chargedas compared to expense as incurred and are included$2.2 million in our restructuring and other charges for the respective periods in the accompanying consolidated statements of operations. The costs incurred were $2.2 million2010 and $14.1 million in 20102009, primarily related to legal fees associated with the SEC investigation and 2009, respectively.accounting and tax fees associated with the restatement of our previously issued financial statements.
Pre-Petition and Post-Emergence Professional Fees
Pre-petition professional fees represent retentionrepresented costs incurred during 2009 prior to the bankruptcy for financial and legal advisors to assist in the analysis of debt restructuring alternatives, as well as costs incurred by us offor financial and legal advisors retained by the noteholdersholders of our 2008 Senior Notes pursuant to certain binding agreements between the two parties. Pre-petition professional fees incurred in 2009 were $7.0 million, with no comparable amount in 2010. See Note 2 to Consolidated Financial Statements.
Post-emergence professional fees represent costs incurred subsequent to bankruptcy emergence for financial and legal advisors to assist with matters in finalizing the bankruptcy process.
Pre-petition fees totaled $7.0 million during 2009 with no comparable amounts in 2010 or 2011. Post-emergence professional fees incurredtotaled $0.3 million and $0.7 million during 2011 and 2010, were $0.7 million,respectively, with no comparable amount inamounts for 2009.
Interest Income, Interest Expense, Foreign Exchange Transaction Gains (Losses), and Other Income (Expense), Net
| 2010 | 2009 | Increase (Decrease) | Percentage Change | |||||||||||||
Interest income | $ | 87 | $ | 294 | $ | (207 | ) | (70.4 | )% | |||||||
Interest expense | (19,908 | ) | (27,751 | ) | 7,843 | (28.3 | )% | |||||||||
Foreign exchange transactions gains (losses) | 328 | (816 | ) | 1,144 | (140.2 | )% | ||||||||||
Other income (expense), net | 1,840 | 206 | 1,634 | 793.2 | % | |||||||||||
Total | $ | (17,653 | ) | $ | (28,067 | ) | $ | 10,414 | (37.1 | )% | ||||||
Interest IncomeThe following table sets forth interest income, interest expense, foreign exchange transactions and other income (expense), net (dollars in thousands).
Interest income was $0.1 million in 2010, as compared to $0.3 million in 2009. The decrease was primarily attributable to decreasing amounts of interest earned on our outstanding auction rate securities, which were being sold throughout 2009 and were completely sold by the second quarter of 2010.
| 2011 | 2010 | 2009 | ||||||||||
Interest income | $ | 92 | $ | 87 | $ | 294 | ||||||
Interest expense | (13,062 | ) | (19,908 | ) | (27,751 | ) | ||||||
Foreign exchange transactions gains (losses), net | (95 | ) | 328 | (816 | ) | |||||||
Other income (expense), net | 1,183 | 1,840 | 206 | |||||||||
|
|
|
|
|
| |||||||
Total | $ | (11,882 | ) | $ | (17,653 | ) | $ | (28,067 | ) | |||
|
|
|
|
|
| |||||||
Interest Expense
Interest expense was $19.9 million in2011 Compared with 2010 as compared to $27.8 million in 2009. Approximately $4.5 million of the
The decrease in interest expense was primarily attributable to the reduction of our debt. In July 2010, we reduced as debt from $210.0 million on the 2008 Senior Notes to $107.0 million on the 2014 Notes, pursuant to our emergence from bankruptcy. We further reduced and refinanced our debt in 2011 to $68.0 million by entering into our new variable rate Senior Credit Facility (see “Liquidity and Capital Resources” below for a discussion of our new credit facility), with an interest that approximated 3.2% as of December 31, 2011 as compared to 12.25% fixed rate interest on our 2014 Notes. The decrease in interest expense was partially offset by a $1.1 million loss on extinguishment of debt related to unamortized deferred financing fees on our 2014 Notes. In addition, during 2011 and 2010, we incurred $0.3 million and $0.8 million, respectively, of non-cash interest expense related to the reporting default PIK interest of 2% on our 2014 Notes, and $0.5 million and $0.2 million, respectively, of non-cash interest expense related to the amortization of deferred financing costs.
2010 Compared with 2009
The decrease in interest expense from $27.8 million in 2009 to $19.9 million in 2010 was primarily attributable to a decrease in amortization of deferred financing costs.costs and the reduction of our principal debt. We wrote-offwrote off our debt discount and deferred financing costs related to the 2008 Senior Notes in the fourth quarter of 2009 and did not capitalize and begin amortizing our new financing fees related to the New2014 Notes until we emerged from bankruptcy onin July 23, 2010. Interest expense also decreased an additional $4.1 million due to the reduction of our debt from $210.0 million to $107.0 million as part ofpursuant to our emergence from bankruptcy. The reduction in debt was partially offset by higher interest rates on the New Notes. In addition, we are incurringincurred additional reporting default non-cash PIK interest of 2% on the New2014 Notes, which totaled $0.8 million in 2010.2010 with no comparable amount in 2009.
Foreign Exchange Transaction Gains (Losses), Net
Foreign exchange currency transaction gains (losses), net, were $(0.1) million, $0.3 million inand $(0.8) million during 2011, 2010 compared to net losses of $0.8 million inand 2009, respectively, due to the strengtheningperformance of the U.S. dollarDollar against certainseveral foreign currencies, inwhich weakened from 2010 as compared to 2009.2011 and strengthened between 2009 to 2010.
Other Income (Expense), Net
Other income (expense), net, was $1.8In 2011, we recognized $1.2 million in 2010 as compared to $0.2 million in 2009. earnings on our equity investment.
In 2010, we recognized a $1.0 million gain on the sale of our remaining our auction rate securities and $0.8 million in earnings on our equity investment.
In 2009, we recognized a $2.4 million gain on the sale of a portion of our auction rate securities, $0.5 million in earnings on our equity investment, and $0.3 million of other items. These items were offset by a $3.0 million penalty that was accrued and payable to the holders of the 2008 Senior Notes. As a result of our bankruptcy, the penalty was subsequently reversed into income in the fourth quarter of 2009 and is reflected in the reorganization items line item in our consolidated statement of operations. See Notes 2 and 8Note 7 to Consolidated Financial Statements.
Reorganization Items
Reorganization items represent expense or income amounts that were recorded in the consolidated financial statements as a result of the bankruptcy proceedings. Reorganization items totalingtotaled $26.2 million were incurred during the year-ended December 31, 2010. Reorganization items totalingand $23.6 million were incurred from the date of the bankruptcy filing through December 31, 2009.during 2010 and 2009, respectively, with no comparable amount in 2011. The reorganization items recorded in 2010 consisted of $21.4 million of professional fees and $4.8 million of other fees, which included a $4.2 million charge related to a fee paid by us to certain of the noteholdersholders of our 2008 Senior Notes to ensure that at least $20 million of our common shares were issued in connection with our rights offering pursuant to a backstop commitment. The reorganization items recorded in 2009 consisted of $22.4 million, net, related to the elimination and write-off of certain amounts recognized in connection with our 2008 Senior Notes, including the elimination of the penalty amount discussed above, and $1.2 million of professional fees. See Note 2 to Consolidated Financial Statements.
Income Taxes
2011 Compared with 2010
We recorded a tax expense of $3.1 million in 2011, as compared to $10.7 million in 2010. The effective tax rate for 2011 was 9.5% of income before taxes, compared to an effective tax rate of 106.3% of income before taxes for 2010. We are incorporated in Canada and therefore use the Canadian statutory rate. Our tax rate in 2011 differs from the Canadian statutory rate of 27.0% primarily due to a $9.8 million net decrease in valuation allowance which was largely attributable to current year income in valuation allowance jurisdictions. The aforementioned benefit was partially offset by $1.3 million of international tax rate differences and a $1.3 million net increase in our liability for uncertain tax positions.
2010 Compared with 2009
We recorded a tax expense of $10.7 million and a tax benefit of $(0.8) million during the year ended December 31, 2010.2010 and 2009, respectively. The effective tax rate for 2010 was 106.3% of income before taxes, compared to an effective tax rate of (1.1%) of income before taxes for 2009. We are incorporated in Canada and therefore use the Canadian statutory rate. Our tax rate in 2010 differs from the Canadian statutory rate of 28.0% due to a $9.6 million charge for unfavorable permanent differences primarily related to non-deductible bankruptcy costs, a $0.9 million charge related to the expiration of net operating losses in Canada, and a $1.0 millionan increase in our liability for uncertain tax positions. The aforementioned charges were partially offset by benefits derived from a $0.2 million increase in research and development tax credits, a $0.3 million benefit related to interest income on previously filed income tax returns, a $3.8 million net decrease in valuation allowance and a $0.9 million benefit due to international tax rate differences.
Income from Discontinued Operations, Net of Tax
In 2009, we recorded a charge of $0.1 million related to an insurance premium adjustment for our discontinued U.S. Optics Business, with no corresponding amount in 2010.
Years Ended December 31, 2009 and 2008
Sales
The following table sets forth sales by business segment for 2009 and 2008 in dollars (dollars in thousands) and percentage change:
| 2009 | 2008 | Increase (Decrease) | Percentage Change | |||||||||||||
Precision Technology | $ | 79,456 | $ | 138,684 | $ | (59,228 | ) | (42.7 | )% | |||||||
Semiconductor Systems | 49,669 | 88,342 | (38,673 | ) | (43.8 | )% | ||||||||||
Excel | 129,964 | 63,736 | 66,228 | 103.9 | % | |||||||||||
Intersegment sales eliminations(1) | (4,701 | ) | (2,294 | ) | (2,407 | ) | 104.9 | % | ||||||||
Total | $ | 254,388 | $ | 288,468 | $ | (34,080 | ) | (11.8 | )% | |||||||
During 2009, Precision Technology segment sales decreased by $59.2 million, or 42.7%, from $138.7 million in 2008 to $79.5 million in 2009. Sales decreased across all of the significant product lines that comprise the Precision Technology segment. However, the overall decrease in sales was primarily attributable to a decline in sales of Spindles, Lasers and Encoders during the first half of 2009. Worldwide demand for those products and in general weakened markedly in late 2008 as turmoil in world financial markets intensified, credit conditions tightened and business and consumer confidence plummeted. The weakness in demand continued during the first half of 2009 before starting to recover late in 2009.
Semiconductor Systems segment sales transactions are generally multiple element arrangements that are accounted for in accordance with the provisions of ASC 605-25, “Multiple Element Arrangements”. Due to the multiple element nature and timing of customer acceptance of Semiconductor Systems segment sales transactions, sales in any given period may not correspond to shipments made during that period and may not be indicative of future results. During 2009, Semiconductor Systems segment sales decreased by $38.7 million, or 43.8%, from $88.3 million in 2008 to $49.7 million in 2009. The decrease in Semiconductor Systems sales was primarily attributable to the global slowdown in semiconductor manufacturing due to markedly weakened end-user demand for electronic products. The slowdown in demand for capital equipment by semiconductor manufacturers had a dramatic adverse effect on sales of our Semiconductor Systems segment beginning late in 2008 and continuing through late 2009. Sales for 2009 and 2008 of our Semiconductor Systems segment include the recognition of revenue that had been deferred from orders placed by customers prior to 2008, but had not been recognized in the period in which the order was received due to previously undelivered elements or unresolved commitments. The revenue related to these orders was recognized in 2009 and 2008 once the final deliverables or commitments were resolved. The deferred revenue included in our consolidated balance sheet at December 31, 2009 and December 31, 2008 is primarily related to our Semiconductor Systems segment. The total deferred revenue balance decreased by $28.4 million, or 33.7%, from $84.2 million at December 31, 2008 to $55.8 million at December 31, 2009. A significant portion of the deferred revenue balance at December 31, 2008 was recognized as revenue in the first half of 2009. We expect that a significant portion of the deferred revenue balance at December 31, 2009 will be recognized as revenue in 2010 after the final deliverables or commitments are resolved.
Excel segment sales increased by $66.2 million, or 103.9%, from $63.7 million in 2008 to $130.0 million in 2009. The Excel segment contributed sales of $63.7 million from the date of acquisition in August 2008 to December 31, 2008. The increase in our Excel segment sales reflects a full year of operations. The Excel segment was established following the acquisition of Excel in August 2008. Originally, the Excel segment was comprised solely of the operations of the then-newly acquired entity. In 2009, we changed the structure of our internal
organization in a manner that caused the composition of our reportable segments to change. More specifically, certain portions of a specific product line within the Precision Technology segment were transferred to the Excel segment. Our reportable segment financial information has been restated to reflect the updated reportable segment structure for all periods presented.
Gross Profit
The following table sets forth gross profit and gross profit percentage, by business segments for 2009 and 2008 (dollars in thousands):
| 2009 | 2008 | |||||||
Gross profit: | ||||||||
Precision Technology | $ | 31,267 | $ | 45,015 | ||||
Semiconductor Systems | 16,157 | 28,463 | ||||||
Excel | 53,041 | 24,764 | ||||||
Intersegment sales eliminations and other | (1,919 | ) | (624 | ) | ||||
Total | $ | 98,546 | $ | 97,618 | ||||
Gross profit percentages: | ||||||||
Precision Technology | 39.4 | % | 32.5 | % | ||||
Semiconductor Systems | 32.5 | % | 32.2 | % | ||||
Excel | 40.8 | % | 38.9 | % | ||||
Intersegment sales eliminations and other | 40.8 | % | 27.2 | % | ||||
Total | 38.7 | % | 33.8 | % | ||||
Gross profit as a percentage of sales can be influenced by a number of factors including product mix, pricing, volume, costs for raw materials and outsourced manufacturing, headcount, warranty costs and charges related to excess and obsolete inventory, at any particular time.
The Precision Technology segment’s gross profit decreased by $13.7 million, or 30.5%, from $45.0 million in 2008 to $31.3 million in 2009. The decline of gross profit is primarily due to the $59.2 million decline in sales during the same period. The Precision Technology segment’s gross profit margin in 2009 was 39.4% compared with 32.5% in 2008, an increase of 6.9 percentage points. The improvement in gross profit margin resulted from changes in the mix of product line sales, as the gross profit margins vary among the product lines that comprise this segment, and reductions in manufacturing overhead costs primarily due to personnel reductions. In 2009, Encoders and Thermal Printers accounted for a larger percentage of the Precision Technology segment’s sales compared with 2008.
The Semiconductor System segment’s gross profit decreased by $12.3 million, or 43.2%, from $28.5 million in 2008 to $16.2 million in 2009. The decrease in the Semiconductor Systems segment’s gross profit was primarily due to the $38.7 million decrease in sales during the same period. Semiconductor Systems segment’s gross profit margin in 2009 was 32.5%, an improvement of 0.3 percentage points over 2008. The improvement in gross profit margins is due to reductions in manufacturing overhead costs in 2009 compared with 2008, primarily due to personnel reductions and lower provisions for excess and obsolete inventory.
The Excel segment’s gross profit in 2009 was $53.0 million compared with $24.8 million in 2008. Excel was acquired in August 2008 and thus is included in our 2008 operating results for approximately 4 months. The Excel segment’s gross profit margin in 2009 was 40.8%, an improvement of 1.9 percentage points over 2008. The improvement in gross margin was primarily due to changes in the mix of product line sales towards product lines that have higher gross margins. Gross profit margins vary among the product lines that comprise the Excel segment.
Research and Development and Engineering Expenses
R&D expenses are primarily comprised of labor and other employee-related expenses. R&D expenses were $28.3 million in 2009, representing 11.1% of sales compared to $33.4 million, or 11.6%, of sales in 2008. R&D expenses, in terms of total dollars, decreased primarily as a result of our reduction in Semiconductor Systems segment headcount in connection with the restructuring activities discussed below. The reduction was partially offset by the full year impact of R&D costs associated with our acquisition of Excel in August 2008. We believe that the development and market introduction of new products and the enhancement of existing products are essential to our success. Accordingly, during 2009, we continued to invest in the development of new products across all three of our segments. We plan to continue to invest in R&D in all of our segments.
Selling, General and Administrative Expenses
SG&A expenses include costs for sales and marketing, sales administration, finance, human resources, legal, information systems, facilities and executive management, and includes personnel related costs, commissions, advertising, legal, tax, accounting and other professional fees. SG&A expenses were $60.4 million in 2009, representing 23.7% of sales, compared to $65.9 million, or 22.8% of sales in 2008. SG&A expenses, in total dollars terms, decreased primarily as a result of our 2008 reductions in headcount and associated payroll costs in connection with restructuring activities discussed below. This decrease was partially offset by the full year impact of costs associated with our acquisition of Excel in August 2008.
Amortization of Purchased Intangible Assets
Amortization of intangible assets is discussed below in “Critical Accounting Policies and Estimates.” Amortization of purchased intangible assets is charged to our Precision Technology and Excel segments. Amortization of purchased intangible assets, excluding the amortization for core technology that is included in cost of goods sold, was $5.8 million, or 2.3% of sales in 2009, compared to $5.7 million, or 2.0%, of sales in 2008. The increase in 2009, in terms of dollars and as a percentage of sales, was primarily related to the amount of intangible assets acquired in connection with our acquisition of Excel in August 2008.
Impairment of Goodwill, Intangible Assets and Other Long-Lived Assets
As of December 31, 2009, we conducted a review to assess whether the carrying value of our goodwill, intangible assets and other long-lived assets was impaired. Based on our review, we noted that the carrying value of certain assets exceeded their fair market value. Additional information with respect to the manner in which we conducted our review is discussed below under “Critical Accounting Policies and Estimates.” Based on our evaluation, we recorded a charge to reduce the carrying amounts of goodwill and intangible assets by an aggregatepositions of $1.0 million.
As of December 31, 2008, we conducted a review to assess whether the carrying value of our goodwill, intangible assets and other long-lived assets was impaired. Based on our review, we noted that the carrying value of certain assets exceeded their fair market value. Additional information with respect to the manner in which we conducted our review is discussed below under “Critical Accounting Policies and Estimates.” Based on our evaluation, we recorded a charge to reduce the carrying amounts of goodwill, intangible assets and other long-lived assets by an aggregate of $215.1 million.
Restructuring, Restatement Related Costs and Other
We recorded restructuring, restatement related costs and other expense of $16.3 million and $10.5 million in 2009 and 2008, respectively.
Restructuring Charges
In 2008, we reported charges of $3.6 million in connection with our closure of excess manufacturing operations in the United Kingdom, as those operations moved to China. We also accrued $4.7 million, including
charges for duplicate facilities and staffing reductions, to consolidate certain of our operations within the United States into our new Bedford, Massachusetts facility. These 2008 charges were partially offset by reductions to the restructuring charge relating to the sale of inventory from a prior year’s restructuring charge. During 2009, we recorded the remaining $0.8 million in restructuring costs related to the United Kingdom restructuring plan. It was comprised of $0.7 million of employee severance costs and $0.1 million for manufacturing transition costs.
In 2009, we determined that we would no longer recover sublease payments from the subtenant in a German location. Accordingly, the previous estimate of future sublease payments was revised. As a result, we recorded an additional restructuring charge of $1.3 million during 2009 related to the revised sublease assumptions.
In 2009, we also initiated certain restructuring activities to consolidate our German sales and distribution operations for the Precision Technology segment located in Munich, Germany with those of Excel Technology Europe, located in Darmstadt, Germany. These consolidation activities were completed in 2009, at a total cost of $0.2 million.
Restatement Related Costs and Other
During the years ended December 31, 2009 and 2008, we incurred costs to third parties, including auditors, attorneys, forensic accountants, and other advisors, that relate to the restatement of our previously issued financial statements as reported in our Annual Report on Form 10-K for the year-ended December 31, 2008 and Quarterly Report on Form 10-Q for the quarter ended September 26, 2008, including, the SEC investigation, certain shareholder actions and the internal FCPA investigation. These costs are charged to expense as incurred and are included in our restructuring and other charges for the respective periods in the accompanying consolidated statements of operations. The costs incurred were $14.1 million and $1.9 million in 2009 and 2008, respectively.
Pre-Petition Professional Fees
Pre-petition professional fees represent retention costs incurred during 2009 prior to the bankruptcy for financial and legal advisors to assist in the analysis of debt restructuring alternatives, as well as costs incurred by us of financial and legal advisors retained by the noteholders pursuant to certain binding agreements between the two parties. Pre-petition professional fees incurred in 2009 were $7.0 million. See Note 2 to Consolidated Financial Statements.
Acquisition Related In-Process Research and Development Charge
In connection with our acquisition of Excel in August 2008, we recorded a $12.1 million charge for acquisition related in-process research and development. The value assigned to in-process research and development was determined using an income approach by estimating the costs to develop the acquired technology into commercially viable products, estimating the resulting net cash flows from the projects, and discounting the net cash flows to their present value. At the date of acquisition, the development of these projects had not yet reached technological feasibility, and had no alternative future uses. Accordingly, we have expensed the value of this research and development at the acquisition date in accordance with the provisions of Statement of Financial Accounting Standards (“SFAS”) No. 141, “Business Combinations” (SFAS No. 141). The successful development of new products and product enhancements is subject to numerous risks and uncertainties, both known and unknown, including unanticipated delays, access to capital, budget overruns, technical problems and other difficulties that could result in the abandonment or substantial change in the design, development and commercialization of these new products and enhancements. Given the uncertainties inherent with product development and introduction, there can be no assurance that any of our product development efforts will be successful on a timely basis or within budget, if at all. The failure of the combined Company to develop new products and product enhancements on a timely basis or within budget could harm our results of operations and financial condition.
Interest Income, Interest Expense, Foreign Exchange Transaction Gains (Losses) and Other Income (Expense), Net
| 2009 | 2008 | Increase (Decrease) | Percentage Change | |||||||||||||
Interest income | $ | 294 | $ | 3,310 | $ | (3,016 | ) | (91.1 | )% | |||||||
Interest expense | (27,751 | ) | (10,387 | ) | (17,364 | ) | 167.2 | % | ||||||||
Foreign exchange transactions gains (losses) | (816 | ) | 928 | (1,744 | ) | (187.9 | )% | |||||||||
Other income (expense), net | 206 | (545 | ) | 751 | (137.8 | )% | ||||||||||
Total | $ | (28,067 | ) | $ | (6,694 | ) | $ | (21,373 | ) | 319.3 | % | |||||
Interest Income
Interest income was $0.3 million in 2009 as compared to $3.3 million in 2008. Interest income decreased due to lower cash and investment balances following our acquisition of Excel in August 2008.
Interest Expense
Interest expense was $27.8 million in 2009 as compared to $10.4 million in 2008. Cash related interest expense increased to $23.1 million due to the full year impact of interest on our $210.0 million debt as compared to $8.5 million for 2008. In addition, full year impacts of non-cash interest expense charges related to the debt discount and financing costs totaled $4.7 million in 2009 as compared to $1.9 million for 2008.
Foreign Exchange Transaction Gains (Losses)
Foreign exchange currency transaction losses, net, were $0.8 million in 2009, compared to net gains of $0.9 million in 2008, due to the weaker U.S. dollar against many foreign currencies in 2009 as compared to 2008.
Other Income (Expense), Net
Other income (expense), net, was $0.2 million in 2009 as compared to $(0.5) million in 2008. In 2009, we recognized a $2.4 million gain on the sale of a portion of our auction rate securities, $0.5 million in earnings on our equity investment, and $0.3 million of other items. These items were offset by a $3.0 million penalty, payable to the holders of the 2008 Senior Notes, relating to our failure to maintain the effectiveness of the registration statement on Form S-3 that we filed in October 2008 covering the issuance of common shares underlying the detachable warrants that were issued to the holders of the 2008 Senior Notes. The corresponding penalty amount in 2008 was $0.8 million. As part of the bankruptcy filing and reorganization, the warrant penalty was subsequently reversed into income in the fourth quarter of 2009 and is reflected in the reorganization items line item in our consolidated statement of operations. See Notes 2 and 8 to Consolidated Financial Statements.
Reorganization Items
Reorganization items represent expense or income amounts that were recorded in the consolidated financial statements as a result of the bankruptcy proceedings. Reorganization items totaling $23.6 million were incurred from the date of the bankruptcy filing through December 31, 2009. The reorganization items consisted of $22.4 million, net, related to the elimination and write-off of certain amounts recognized in connection with our 2008 debt financing associated with the acquisition of Excel, including the elimination of the penalty amount discussed above, and $1.2 million of professional fees. See Note 2 to Consolidated Financial Statements.
Income Taxes
We recorded a tax benefit of $0.8 million during the 2009 fiscal year. The effective tax rate for 2009 was (1.1%) of income before taxes, compared to an effective tax rate of (15.5%) of income before taxes for 2008. We
are incorporated in Canada and therefore use the Canadian statutory rate. Our tax rate in 2009 differs from the Canadian statutory rate of 31.5% due to a $1.3 million charge for unfavorable permanent differences, a $2.7 million charge related to the expiration of net operating losses in Canada, a $0.7 million increase in our liability for uncertain tax positions, $0.5 million charge related to the deferred tax on unremitted earnings, and a $22.5 million increase in the valuation allowance. The aforementioned charges were partially offset by benefits derived from a $0.2 million benefit from research and development tax credits, a $0.2 million benefit related to a settlement with the Canadian Revenue Agency, a $0.8 million benefit related to interest income on previously filed income tax returns, and a $2.9 million benefit due to international tax rate differences.
Income from Discontinued Operations, Net of Tax
On October 8, 2008, we completed the sale of our U.S. Optics Business, located in Moorpark, California, which was a part of our Precision Technology segment for proceeds of $21.6 million. The net gain of $8.7 million on the sale of the U.S. Optics Business is reported as Gain on Disposal of Discontinued Operations, net of tax, in our consolidated statement of operations for the year ended December 31, 2008. The operating results of this business have been reclassified and reported as income from discontinued operations in our consolidated statements of operations for fiscal years 2008, 2007 and 2006. In 2009 we recorded an additional charge of $0.1 million related to discontinued operations associated with an insurance premium adjustment.
Liquidity and Capital Resources
On November 20, 2009,We assess our holding company, GSI Group Inc., and twoliquidity in terms of our wholly-owned United States subsidiaries, GSI Group Corporation and MES International, Inc., voluntarily filed petitions for relief under Chapter 11 of the United States Bankruptcy Code. Under the Bankruptcy Code, our status as a bankruptcy debtor automatically accelerated the payment of the debt arising under the 2008 Senior Notes.
However, we emerged from bankruptcy on July 23, 2010 and, in connection therewith, completed a rights offering pursuant to which we sold common shares for cash proceeds of approximately $64.9 million. The proceeds from the Rights Offering, together with $10.0 million of cash on hand, were used to pay down $74.9 million of the $210.0 million principal obligations due with respect to the 2008 Senior Notes. The principal obligations on the 2008 Senior Notes were further reduced and settled through the issuance of common shares in exchange for $28.1 million of 2008 Senior Notes. In addition, upon emergence from bankruptcy, we used cash to pay all outstanding accrued interest on the 2008 Senior Notes which totaled $21.7 million.
The remaining $107.0 million obligation due with respect to the 2008 Senior Notes was satisfied through the issuance of the New Notes which mature in July 2014. Interest accrues on the New Notes at a rate of 12.25% per year and is payable quarterly in arrears on February 15, May 15, August 15 and November 15 of each year, commencing on August 15, 2010. We may elect to pay the interest in cash, or, under certain conditions, by increasing the principal amount of the New Notes or issuing additional notes on the same terms and conditions as the existing New Notes (“PIK”). However, we are required to pay cash interest if our fixed charge coverage ratio is greater than 1.75 to 1.00. Furthermore, until we became current in our reporting obligations under the Securities Exchange Act of 1934, as amended (the “Exchange Act”) and until our common shares were listed on an Eligible Market (as defined in the New Indenture) on February 15, 2011, the rate of interest under the New Notes was increased by an additional 2% per annum, payable by PIK beginning August 15, 2010 through February 15, 2011. The interest rate on the New Notes may be increased upon certain defaults, as defined in the New Indenture. Interest PIK notes issued and PIK payments in lieu of cash payments accrue at a rate of 13%. If the New Notes remain outstanding until their scheduled maturity date in 2014, annual interest expense on the New Notes would be approximately $13.2 million per year from 2011 to 2013 and $7.4 million in 2014. Cash paid for interest on the New Notes was $4.2 million for the year ended December 31, 2010. The New Notes may be repaid at any time without penalty.
As a result of our emergence from bankruptcy, the associated restructuring of our debt obligations, and our current level of business activity, we believe we will have sufficient liquidity to fund our operations through at
least the end of 2011. However, our ability to make payments on or to refinance our indebtedness and to fund planned capital expenditures and research and development efforts will depend on our ability to generate cash in the future and have access to capital markets. This, to a certain extent, is subject to general economic, financial, competitive, legislative, regulatory and other factors that are beyond our control.
We cannot assure you that our business will generate sufficient cash flow from operations, that currently anticipated cost savings and operating improvements will be realized on schedule or that future borrowings will be available to us in an amount sufficient to enable us to pay our indebtedness or to fund our other liquidity needs. We oroperating, investing, and financing activities. Our primary ongoing cash requirements are funding operations, capital expenditures, investments in businesses, and repayment of our affiliates may retire or purchase our outstanding debt through cash purchases and/or exchanges for equity securities, in open market purchases, privately negotiated transactions or otherwise. Such repurchases or exchanges, if any, will depend on prevailing market conditions, our liquidity requirements, contractual restrictions and other factors. The amounts involved may be material and could have a material effect on the trading market for such debt and on ourrelated interest expense. Our primary sources of liquidity are internally generated cash flows and borrowings under our revolving credit facility. We believe our future operating cash flows will be sufficient to meet our future operating and investing cash needs for the foreseeable future, including at least the next 12 months. The availability of borrowings under our revolving credit facility provides an additional potential source of liquidity should it be required. In addition, we may seek to raise additional capital, commitments and resources. We may needwhich could be in the form of bonds, convertible debt or equity, to refinance allfund business development activities or a portionother future investing cash requirements.
Significant factors affecting the management of our indebtedness, includingongoing cash requirements are the New Notes on or before their maturity in 2014. Under the termsadequacy of available bank lines of credit and our ability to attract long-term capital with satisfactory terms. The sources of our liquidity are subject to all of the New Indenture, GSI US may obtain a working capital facility of up to $40 million with the consent of the noteholders, whose consent cannot be unreasonably withheld. To the extent the aggregate principal amount of the outstanding indebtedness under the working capital facility exceeds $20 million, or upon certain asset sales, GSIG or GSI US will be required to offer to use such excess working capital proceeds or excess net proceeds, as applicable, to make an offer to purchase a portion of the New Notes at 100% of the principal amount thereof. We cannot assure you that we will be able to refinance anyrisks of our indebtedness, including the New Notes, on commercially reasonable terms or at all.business and could be adversely affected by, among other factors, a decrease in demand for our products, our ability to integrate future acquisitions, deterioration in certain financial ratios, and market changes in general. See “Risks Relating to Our Common Shares and Our Capital Structure—To service our indebtedness and fund our operations, we will require a significant amount of cash. Our ability to generate cash depends on many factors beyond our control”Structure” included in Item 1A of this Annual Report on Form 10-K.
As of December 31, 2011, $29.3 million of our $54.8 million cash and cash equivalents was held by our subsidiaries outside of Canada and the United States. Generally, our intent is to use cash held in these foreign subsidiaries to fund our local operations. Further, local laws and regulations may also restrict certain of our subsidiaries from paying dividends or otherwise transferring assets to us. However, in certain instances, we have identified excess cash for which we may repatriate and we have established liabilities for the expected tax cost.
Although much of our business is conducted through our subsidiaries, none of our subsidiaries isare obligated to make funds available to us. Accordingly, our ability to make payments on our indebtedness and fund our operations may be dependent on the earnings and the distribution of funds from our subsidiaries. Local laws and regulations and/or the terms of the indenture governing the New Notesour indebtedness may restrict certain of our subsidiaries from paying dividends and otherwise transferring assets to us. We cannot assure you that applicable laws and regulations and/or the terms of the indentureour indebtedness will permit our subsidiaries to provide us with sufficient dividends, distributions or loans when necessary.
Refinancing of 2014 Notes
During the third quarter of 2011, we elected to optionally redeem $35.0 million in aggregate principal amount (constituting 32% of the outstanding $108.1 million in aggregate principal amount) of our outstanding 2014 Notes, including PIK notes, which left an outstanding principal debt balance of $73.1 million. The redemption was financed from a portion of our available cash and cash equivalents.
During the fourth quarter of 2011, we consummated the refinancing of the remaining $73.1 million outstanding 2014 Notes through the proceeds from a new $80.0 million senior secured credit agreement (the “Credit Agreement”) with a syndicate of banks. The Credit Agreement provides for a $40.0 million, 4-year, term
loan facility and a $40.0 million, 4-year, revolving credit facility that matures in 2015 (collectively, the “Senior Credit Facility”). The Credit Agreement also provides for an additional uncommitted $25.0 million incremental facility (in the form of a term loan and/or revolving credit facility), subject to satisfaction of certain customary covenants. We also paid $3.0 million in new debt issuance costs for the Senior Credit Facility from available cash and cash equivalents.
In December 2011, we optionally repaid $5.1 million of borrowings under the revolving credit facility from available cash and cash equivalents, leaving a total principal debt outstanding on the Senior Credit Facility of $68.0 million at December 31, 2011. The refinancing and repayment of a portion of our principal debt substantially reduces our interest expense, while extending the maturity of our principal debt. The term loan facility requires $2.5 million quarterly repayments beginning on January 15, 2012, while the revolving credit facility is due at maturity in 2015. Outstanding borrowings under the Senior Credit Facility will bear interest at a rate per annum equal to LIBOR plus an initial spread of 275 basis points through March 31, 2012, subject to adjustment thereafter based on our consolidated leverage ratio.
We expect interest cost savings of $6.1 million on our outstanding debt of $68.0 million in 2012 based on the difference between our weighted average interest rate on our Senior Credit Facility of 3.22% at December 31, 2011 as compared to an interest rate of 12.25% on our 2014 Notes.
The Credit Agreement applicable to our Senior Credit Facility contains various covenants that we believe are usual and customary for this type of agreement. The Senior Credit Facility includes a minimum adjusted EBITDA (as defined in the Credit Agreement), a maximum allowed leverage ratio, and a minimum required fixed charge coverage ratio. The following table summarizes these financial covenant requirements and our compliance as of December 31, 2011:
| Requirement | Actual | |||||||
Minimum consolidated adjusted EBITDA | $ | 40.0 million | $ | 65.3 million | ||||
Maximum consolidated leverage ratio | 2.50:1.00 | 1.08:1.00 | ||||||
Minimum consolidated fixed charge coverage ratio | 1.50:1.00 | 4.75:1.00 | ||||||
We were compliant with the covenant requirements as of December 31, 2011. Availability under the revolving credit facility is subject to a borrowing base, which is based on certain assets in our U.S. and U.K. subsidiaries, consisting of 85% of eligible accounts receivable, 100% of eligible restricted cash and 50% of eligible inventory, as defined in the Credit Agreement, and may be subject to modifications. To the extent that our eligible accounts receivable and inventory balances decline, our borrowing base may decrease and the availability under the revolving credit facility may decrease below $40.0 million. As aof December 31, 2011, we were eligible to borrow the maximum $40.0 million, of which $28.0 million was outstanding. On March 9, 2012, we entered into an amendment (“the First Amendment”) to the Credit Agreement, to expand the definition of eligible receivables to include (i) receivables payable in Euro and Japanese Yen under certain conditions and (ii) receivables whose payments are covered by appropriate insurance, subject to certain limitations. The result of these amendments is to expand the non-timely filing of our Annual Reports on Form 10-K for the years ended December 31, 2008 and 2009 and our Quarterly Reports on Form 10-Q for the quarters ended September 26, 2008, April 3, 2009, July 3, 2009, October 2, 2009, April 2, 2010, July 2, 2010 and October 1, 2010 with the SEC, we will be ineligibleborrowing base available to register our securities on Form S-3 for sale by us or resale by others until one year from December 13, 2010, the date the last delinquent filing was made. While we may use Form S-1 to raise capital or complete acquisitions, the use of Form S-1 could increase transaction costs and adversely impact our ability to raise capital or complete acquisitions of other companies in a timely manner.us.
Cash Flows
Cash and cash equivalents totaled $54.8 million at December 31, 2011, compared to $56.8 million at December 31, 2010, compared to $63.3 million at December 31, 2009.2010. The net decrease in cash and cash equivalents is primarily related to costs associated with$43.1 million of net cash outflows for the reduction and refinancing of our emergence from bankruptcy, including payments on our 2008 Senior Notes totaling $21.7 million and $10.0 million for interest and principal, respectively,debt and $4.2 million for capital expenditures. These cash outflows were primarily offset by the $45.2 million of interestcash generated by our operating activities, which primarily resulted from our strong earnings in 2011 and a reduction in non-recurring costs as compared to 2010.
We believe that our existing cash and cash equivalents of $54.8 million as of December 31, 2011, our future cash flow from operations, and available borrowing capacity under our revolving credit facility provide sufficient
liquidity to meet the cash requirements of our existing businesses for the foreseeable future, including at least the next 12 months. We will evaluate and consider strategic acquisitions, divestitures and other transactions to create shareholder value and enhance financial performance. Such transactions may require cash expenditures beyond current sources of liquidity and may require us to raise additional capital through debt and/or equity offerings.
The following table summarizes our cash and cash equivalent balances, cash flows and unused and available funds on our New Notes. In addition, we incurred $26.2 million of reorganization items forrevolving credit facility over the year ended December 31, 2010, comprised of $21.4 million of professional fees, a $4.2 million backstop fee payment to certain holders of our 2008 Senior Notesyears indicated (dollars in connection with the Rights Offering, and $0.6 million of other costs. The net decrease to cash was partially offset by increases in cash resulting from the sale of our remaining auction rate securities, which netted proceeds of $11.4 million during the year ended December 31, 2010. In addition, we experienced stronger cash flows as a result of the improving economy, increasing sales and improvements in collections among our segments.
| 2011 | 2010 | 2009 | ||||||||||
Cash and cash equivalents | $ | 54,835 | $ | 56,781 | $ | 63,328 | ||||||
Net cash provided by (used in) operating activities | $ | 45,173 | $ | (4,738 | ) | $ | (25,786 | ) | ||||
Net cash provided by (used in) investing activities | $ | (4,217 | ) | $ | 8,749 | $ | 19,708 | |||||
Net cash used in financing activities | $ | (43,095 | ) | $ | (11,565 | ) | $ | — | ||||
Unused and available funds on revolving credit facility | $ | 12,000 | $ | — | $ | — | ||||||
Operating Cash Flows for the Year Ended December 31, 2010 and December 31, 2009
Cash provided by operating activities was $45.2 million in 2011 compared to $4.7 million and $25.8 million used in operations in 2010 and 2009, respectively. Operating cash flows during the three years ended December 31, 2011 were impacted by several factors, most notably our earnings, our bankruptcy and reorganization costs, interest payments on our debt, payments and refunds of income taxes, and our restructuring, restatement related and other costs, and other related professional fees.
The $45.2 million of cash provided by operating activities in 2011 was primarily related to our net income of $29.0 million, before non-cash adjustments to reconcile net income to net cash from operating activities totaling $27.3 million. Cash provided by operations also improved significantly over last year due to a decrease in bankruptcy related professional fees and a decrease in cash interest payments of $13.4 million, a portion of which were offset by changes in operating assets and liabilities.
The $4.7 million compared toof cash used in operations of $25.8 millionoperating activities in 2009, resulting in a net cash improvement of $21.1 million. The improvement in cash flow2010 was primarily attributablerelated to the following factors:
In 2010, we recorded a net loss of $0.6 million, compared with net loss of $71.3 million in 2009, before non-cash adjustments to reconcile net loss to net cash fromused in operating activities.activities totaling $28.2 million. Cash used in operations were primarily attributable to cash paid for reorganization items totaling $26.7 million, cash paid for interest of $25.9 million, and financial and accounting related consulting and professional fees related to the issuance of various quarterly and annual SEC filings, which were funded by our growth in operating profit as compared to 2009.
Non-cashThe $25.8 million of cash used in operating activities in 2009 was primarily related to our net loss of $71.3 million, before non-cash adjustments to reconcile net loss to net cash flows from operations included the following items:
In 2009, we recorded non-cash reorganization itemsused in operating activities totaling $26.2$53.2 million, primarily attributable to the write-offs of the discount and deferred financing costs associated with the 2008 Senior Notes.
Other non-cash charges were $24.5Notes of $26.2 million in 2010 as compared to $27.2and $27.0 million in 2009. The $2.7 million decrease inof other non-cash charges was primarily due to a $3.7 million decrease in non-cash interest expense, a $1.7 million decrease in depreciation and amortization expense, a $1.0 million decrease in bad debt provisions, and a $0.2 million decrease in stock compensation. These reductions were primarily offset by a $3.9 million increase in inventory obsolescence provisions.
Non-cash changes in our deferred income taxes resulted in a cash increase of $5.6 million in 2010 as compared to a $1.4 million cash increase in 2009.
charges. Cash used in operations as a resultin 2009 was primarily attributable to professional fees for restructuring, restatement related and other costs, pre-petition bankruptcy costs, cash paid for interest $22.8 million, partially offset by tax refunds received of net changes$10.5 million.
We expect to incur additional cash expenditures related to the 2011 restructuring program in our operating assets2012. Cash expenditures related to such activities are expected to be between $2.9 million and liabilities totaled $32.3$3.9 million in 2012.
Investing Cash Flows
Cash used in investing activities was $4.2 million during 2011 due to capital expenditures, compared to cash provided by investing activities of $8.7 million in 2010 as compared to $7.7 million in 2009, resulting in a net cash decrease of $24.6 million. The decrease in cash is primarily attributable to the following items:
An increase in our accounts receivable balance due to sales growth totaled $7.7$11.4 million in 2010, compared to a $0.9 million decrease in our accounts receivable balance in 2009;
An increase in our inventory balances to support sales growth totaled of $8.2 million in 2010, compared with a decreasecash proceeds from the sale of $8.4 million in 2009;
Cash used in operations due to an increase in accounts payable and accrued expenses totaled $0.1 million in 2010, compared to $8.2 million in 2009;
Cash used in operations due to our net change to deferred revenue and related deferred costauction rate securities, offset by capital expenditures of goods sold totaled $18.1 million in 2010, compared to $13.9 million in 2009;
Cash paid for interest totaled $25.9 million in 2010, compared to $22.8 million in 2009.
$2.7 million. Cash provided by investing activities was $8.7 million during 2010, compared to $19.7 million in 2009. Changes in cash balances in 2010 and 2009 due to investing activities resulted$17.0 million of cash proceeds from the following items:
We sold our remainingsale of auction rate securities, for proceeds of $11.4$4.0 million in 2010, compared to our proceeds from sales of $17.0 million in 2009;
We used $2.7 million of cash in 2010 for capital expenditures, compared to $1.3 million in 2009;
In 2009, we generated $4.0 millionproceeds from the sale of property, plant and equipment, (primarilypartially offset by capital expenditures of $1.3 million. We have no material commitments to purchase property, plant and equipment and expect such expenditures to be approximately $8.0 million to $9.0 million in 2012.
Financing Cash Flows
Cash used in financing activities was $43.1 million during 2011, primarily due to the U.K.) as a result$40.1 million net reduction of our restructuring efforts, with no comparable amount in 2010.
principal debt, resulting from repayments and extinguishment of debt of $113.2 million, offset by the $73.1 million of proceeds from our Senior Credit Facility. We also paid $3.0 million for debt issuance costs. Cash used in financing activities was $11.6 million induring 2010, with no comparable amount in 2009. Financing activities in 2010 included the following items:
We receivedprimarily due to proceeds of $64.9 million from the sale of our common shares in connection with the Rights Offering;
We useda rights offering offset by $74.9 million of cash used to repay a portion of the principal amount outstanding on our 2008 Senior Notes;
We usedNotes, and $1.6 million offor cash paid for payments of debt issuance costs related to the New Notes.
In addition to cash flows from operating, investing and financing activities, exchange rate changes resulted in an increase of $1.0 million in our cash balances in 2010, compared to an increase of $0.4 million in 2009.
Cash Flows for the Year Ended December 31, 2009 and December 31, 2008
Cash used in operations in 2009 was $25.8 million, compared to cash provided by operations of $51.9 million in 2008, resulting in a net cash usage change of $77.7 million. The decrease in cash flow was primarily attributable to the following factors:
In 2009, we recorded a net loss of $71.3 million, compared with net loss of $203.8 million in 2008, before non-cash adjustments to reconcile net income (loss) to net cash from operating activities.
Non-cash adjustments to reconcile net income (loss) to cash flows from operations, included the following material items:
In 2009, we recorded non-cash reorganization items totaling $26.2 million attributable primarily to the write-offs of the discount and deferred financing costs associated with the 2008 Senior Notes.
In 2008, we recorded an impairment charge of $215.1 million to write down our goodwill, other intangible assets and property, plant and equipment to their fair value as of December 31, 2008. We also recorded an acquisition related in-process research and development charge of $12.1 million in connection with our acquisition of Excel.
Other non-cash charges, such as depreciation and amortization of fixed assets and intangible assets, non-cash restructuring charges, share-based compensation, bad debt and inventory obsolescence provisions, and non-cash interest accretion charges, were $27.2 million in 2009 as compared to $37.6 million in 2008. The $10.4 million decrease in non-cash charges was due to a decrease in inventory obsolescence provisions of $7.7 million, a $3.5 million decrease in non-cash restructuring charges, and a $1.6 million decrease in depreciation and amortization expense. These reductions were offset by a $2.8 million increase in 2009 in non-cash interest expense accretion related to our debt in 2009.
Non-cash changes in our deferred income taxes resulted in a cash increase of $1.4 million in 2009 as compared to a $33.7 million cash decrease in 2008, primarily attributable to non-deductible amortization.
Cash used in operations as a result of net changes in our operating assets and liabilities totaled $7.7 million in 2009, as compared to cash provided by operating activities of $33.9 million in 2008, resulting in a net cash usage change of $41.6 million. The decrease in cash is primarily attributable to the following items:
Decreases in our accounts receivable balances provided cash of $0.9 million in 2009, compared to $35.9 million in 2008;
Decreases in our inventory balances provided cash of $8.4 million in 2009, compared with $10.2 million in 2008;
Decreases in our deferred revenue and related deferred cost of goods sold resulted in decreases of $13.9 million in 2009, compared to $9.8 million in 2008;
An increase in the outflow of cash used in operations for accounts payable and accrued expenses of $8.2 million in 2009, compared to $6.4 million in 2008; and
Cash proceeds of $4.0 million received in 2008 from our landlord related to allowances for leasehold expenditures to fit-up and occupy one of our U.S. facilities, with no comparable amount in 2009.
The decreases in cash related items above were offset by tax refunds received in 2009 totaling $10.5 million, as compared to $2.0 million in refunds received in 2008.
Cash provided by investing activities in 2009 was $19.7 million, compared to $351.4 million cash used in investing activities in 2008, which primarily related to the acquisition of Excel. The cash provided by investing activities in 2009 was primarily attributable to the following factors:
We sold a portion of our auction rate securities netting proceeds totaling $17.0 million;
In 2009, we generated $4.0 million from the sale of property, plant, and equipment (primarily in the U.K.) as a result of our restructuring efforts, compared to $3.2 million in 2008; and
We decreased our capital expenditures to $1.3 million in 2009, as compared to $18.0 million in 2008, the majority of which related to our newly leased U.S facility.
The cash used in investing activities in 2008, exclusive of capital expenditures and the sale of property, plant, and equipment, related to the cash used to purchase Excel, net of cash acquired, of $358.3 million, offset by $21.6 million in proceeds received from the sale of our U.S. Optics Business.
costs. We did not have any cash related financing activities during 2009.
We expect to use $11.5 million of cash in 2009. Cash provided by2012 for financing activities, in 2008 was $196.9comprised of $10.0 million primarily attributable to the following factors:
Cash proceeds, net of issuance costs, of $203.5for our $2.5 million from the issuance ofquarterly repayments on our 2008 Senior Notes that were used to fund a portion ofterm loan facility, and $1.5 million for our acquisition of Excel; andcapital lease obligations.
Repurchases of our shares totaling $6.4 million.
In addition to cash flows from operating, investing and financing activities, exchange rate changes resulted in an increase of $0.4 million in our cash balances in 2009, compared to a decrease of $0.8 million in 2008.
Other Liquidity Matters
Pension Plans
We maintain two plans that are considered to be defined benefit plans under the provisions of ASC 715, “Defined Benefit Plans”, apension plans—one plan in the U.K. (the “U.K. Plan”), and aone plan in Japan.Japan (the “Japan Plan”). Our U.K. Plan was closed to new members in 1997 and we curtailed our sponsorshipstopped accruing additional pension benefits for existing members in 2002, thereby limiting our obligation to benefits earned through that date. Benefits under this plan were based on the employees’ years of service and compensation. We continue to follow our policy to fund this pension plan based on widely accepted actuarial methods. Our Japanese planJapan Plan is an active plan.
Our funding policy is to fund pensions and other benefits based on actuarial methods as permitted by regulatory authorities. The results of funding valuations depend on the assumptions that we make with regard to attributes such as asset returns, rates of members’ benefits increases, mortality, retail price inflation and other market driven changes. The assumptions used represent one estimate of a possible future outcome. The final cost to us will be determined by events as they actually become known. Because ofDue to the underfunded positions that our pension plans currently have and potential changes in the actual outcomes relative to our assumptions, we may have to increase payments to fund these plans in the future.
In the U.K., funding valuations are conducted every three years in order to determine the future level of contributions. Our latest funding valuation was completed in October 2010, and based on the results of the
valuation, we are increasingagreed to increase our annual funding contributions tofor the U.K. Plan from approximately $0.6 million to $0.8 million for a period of 10 years and 5 months beginning September 2010. In 2010, we also contributed an additional one-time lump-sum payment of approximately $1.6 million, of which $0.8 million was paid in September 2010 and $0.8 million was paid in December 2010.annually through 2020. The Japanese plan includes a guarantee of return of principal and yearly interest of 0.75%; therefore, there are no significant fluctuations in this plan. See Note 119 to Consolidated Financial Statements for further information about these plans.
As a result of the covenant that exists between our U.K. subsidiary and the Plan Trustees regarding the funding of the U.K. Plan, our ability to transfer assets outside our U.K. subsidiary, and its wholly owned subsidiary in China, may be limited.
Off-Balance Sheet Arrangements, Contractual Obligations
Contractual Obligations
The following table summarizes our contractual obligations at December 31, 20102011 and the effect such obligations are expected to have on liquidity and cash flow in future years. We have excluded the future cash payments for FIN 48 (codified within ASC 740) tax liabilities because the timing of the settlement of these liabilities cannot be estimated by year. However, these FIN 48 liabilities have been classified as long-term on the consolidated balance sheets.
Contractual Obligations | Total | 2011 | 2012-2013 | 2014-2015 | Thereafter | Total | 2012 | 2013-2014 | 2015-2016 | Thereafter | ||||||||||||||||||||||||||||||
| (In thousands) | (In thousands) | |||||||||||||||||||||||||||||||||||||||
12.25% Senior Secured PIK Election Notes due 2014(1) | $ | 107,575 | $ | — | $ | — | $ | 107,575 | $ | — | ||||||||||||||||||||||||||||||
Interest on 12.25% Senior Secured PIK Election Notes(2) | 46,965 | 13,178 | 26,356 | 7,431 | — | |||||||||||||||||||||||||||||||||||
Senior Credit Facility(1) | $ | 68,000 | $ | 10,000 | $ | 20,000 | $ | 38,000 | $ | — | ||||||||||||||||||||||||||||||
Interest on Senior Secured Credit Facility(2) | 5,928 | 2,005 | 3,060 | 863 | — | |||||||||||||||||||||||||||||||||||
Capital leases | 2,287 | 1,531 | 756 | — | — | |||||||||||||||||||||||||||||||||||
Operating leases(3) | 21,212 | 5,306 | 7,342 | 2,097 | 6,467 | 17,812 | 5,586 | 4,496 | 1,820 | 5,910 | ||||||||||||||||||||||||||||||
Purchase commitments(4) | 45,266 | 41,140 | 4,055 | 71 | — | 28,568 | 25,259 | 3,304 | 5 | — | ||||||||||||||||||||||||||||||
U.K. pension plan(5) | 7,798 | 773 | 1,546 | 1,546 | 3,933 | 7,006 | 771 | 1,542 | 1,542 | 3,151 | ||||||||||||||||||||||||||||||
|
|
|
|
| ||||||||||||||||||||||||||||||||||||
Total contractual cash obligations | $ | 228,816 | $ | 60,397 | $ | 39,299 | �� | $ | 118,720 | $ | 10,400 | $ | 129,601 | $ | 45,152 | $ | 33,158 | $ | 42,230 | $ | 9,061 | |||||||||||||||||||
|
|
|
|
| ||||||||||||||||||||||||||||||||||||
| (1) | On |
| (2) |
| (3) | These amounts represent the gross amounts due for facilities that are leased. The amounts include payments due with respect to both continuing operating facilities and facilities that have been accounted for within our restructuring liability. However, these amounts do not reflect anticipated sub-lease income of approximately $0.1 million in total |
| (4) |
| (5) | Represents funding obligations equivalent to $0.8 million per year through January 2021. |
Off-Balance Sheet Arrangements
Through December 31, 2010,2011, we have not entered into any off-balance sheet arrangements or material transactions with unconsolidated entities or other persons.
Critical Accounting Policies and Estimates
The preparation of financial statements in conformity with generally accepted accounting principles requires us to make estimates and assumptions that affect the reported amounts of assets and liabilities and disclosure of contingent assets and liabilities at the dates of the financial statements and the reported amounts of salesrevenues and expenses during the reporting periods. On an ongoing basis, we evaluate our estimates, assumptions and judgments, including those related to revenue recognition, allowance for doubtful accounts, inventory costing and reserves, accounting for business combinations, the assessment of the valuation of goodwill, intangible assets and tangible long-lived assets, accounting for restructuring activities, employee benefit plans, accounting for income taxes and related valuation allowances, and accounting for loss contingencies. Actual results could differ significantly from our estimates.estimates in the future.
We believe that the following critical accounting policies most significantly affect the portrayal of our financial condition and results of operations and require the most difficult and subjective judgments.
Revenue Recognition.We recognizeRevenue from the sale of products is recognized when we meet all of the criteria for revenue when persuasiverecognition in financial statements. These criteria include: evidence of an arrangement exists, delivery
has occurred, the price is fixed or determinable, risk of loss has passed to the customer and collection of the resulting receivable is reasonably assured. Revenue recognition requires judgment and estimates, which may affect the amount and timing of revenue recognized in any given period.
WeOn January 1, 2011, we adopted the provisions of Accounting Standards Update (“ASU”) 2009-13, “Revenue Recognition (Topic 605)—Multiple-Deliverable Revenue Arrangements” (“ASU 2009-13”). ASU 2009-13 addresses the accounting for multiple-element arrangements by providing two significant changes. First, this guidance removes the requirement to have objective and reliable evidence of fair value for undelivered elements in an arrangement and results in more elements being treated as separate units of accounting. Specifically, this guidance amends the criteria in Subtopic 605-25, “Revenue Recognition-Multiple-Element Arrangements” (“ASC 605-25”), for separating consideration in multiple-element arrangements. This guidance establishes a selling price hierarchy for determining the “selling price” of an element, which is based on: (a) vendor-specific objective evidence; (b) third-party evidence; or (c) management’s best estimate. Our best estimate was based on factors such as gross margin, volume discounts, new strategic customers, geography, customer class and competitive pressures. The second change modifies the manner in which the transaction consideration is allocated across the separately identified elements. Entities are no longer able to apply the residual method of allocation. Instead, the arrangement consideration is required to be allocated at the inception of the arrangement to all elements using the relative selling price method. The relative selling price method uses the weighted average of the “selling price” and applies that to the contract value to establish the consideration for each element.
For transactions entered into prior to the adoption of ASU 2009-13, we follow the provisions of ASC 605-25 “Multiple Element Arrangements” for all multiple elementmultiple-element arrangements. Under ASC 605-25,the guidance prior to ASU 2009-13, we assess whether the deliverableselements specified in a multiple elementmultiple-element arrangement should be treated as separate units of accounting for revenue recognition purposes and whether objective and reliable evidence of fair value exists for these separate units of accounting. We apply the residual method when objective and reliable evidence of fair value exists for all of the undelivered elements in a multiple elementmultiple-element arrangement. When objective and reliable evidence of fair value does not exist for all of the undelivered elements in a multiple elementmultiple-element arrangement, we recognize revenue under the multiple units shipped methodology, whereby revenue is recognized in each period based upon the lowest common percentage of the products shipped in the period. This approximates a proportional performance model of revenue recognition. This generally results in a partial deferral of revenue to a later reporting period. No revenue is recognized unless one or more units of each product hashave been delivered.
AlthoughOn January 1, 2011, we adopted the provisions of ASU 2009-14, “Software (Topic 985)—Certain Revenue Arrangements That Include Software Elements” (“ASU 2009-14”). ASU 2009-14 changes revenue recognition for tangible products containing software and hardware elements. Specifically, tangible products containing software and hardware that function together to deliver the tangible products’ essential functionality are scoped out of the existing software revenue recognition guidance and will be accounted for under the multiple-element arrangements revenue recognition guidance under ASU 2009-13. With the adoption of ASU 2009-14, we concluded that when there is software included in tangible products, it is essential to the functionality of the tangible product. It is therefore outside the scope of ASC 985-605, “Software Revenue Recognition” (“ASC 985-605”) as amended. Prior to the adoption of ASU 2009-14, although certain of our products contain operating and application software, we havehad determined the software element iswas incidental in accordance with ASC 985-605, “Software Revenue Recognition”.985-605.
We determine the unit of accounting for certain transactions basedBased on the guidance in ASC 985-605. In particular,985-605, multiple purchase orders may be deemed to be interrelated and considered to constitute a multiple elementmultiple-element arrangement for accounting purposes.
Semiconductor Systems transactions are generally multiple elementmultiple-element arrangements which may include hardware, software, installation, training, an initial standard warranty, and optional extended warranty arrangements. We generallyGenerally, we design, market and sell these products as standard configurations. For those standard configurations where acceptance criteria, if any, exist and are demonstrated prior to shipment,Typically, revenue is recorded at the time of shipment. For those cases whereshipment or acceptance, criteria cannot be demonstrated prior to shipmentwhich is the same under pre and post-adoption of a product or if a significant amount of fees are due upon acceptance, we recognize revenue upon customer acceptance.ASU 2009-13. Acceptance is generally required for sales of our Semiconductor Systems segment products to Japanese
customers and sales of “New Products”, which. New Products are considered by us, for purposes of revenue recognition
determination, to be either (a) a product that is newly released to all customers, including a product which may have been existing previously, but which has been substantially upgraded with respect to its features or functionality; or, (b) the sale of an existing product to a customer who has not previously purchased that product. We follow a set of predetermined criteria when changing the classification of a New Product to a standard configuration whereby acceptance criteria are considered to be demonstrated at the time of shipment.
The Laser Products and Precision TechnologyMotion and ExcelTechnologies segments have revenue transactions includethat are comprised of both single elementsingle-element and multiple elementmultiple-element transactions. Multiple elementMultiple-element transactions may include two or more products and occasionally also contain installation, training or preventative maintenance plans. RevenueFor multiple-element transactions entered into or materially modified after January 1, 2011, revenue is recognized under ASU 2009-13, generally upon shipment using the relative selling price method. For all other multiple-element transactions, revenue is generally recognized under the multiple units shipped methodology described above.
Our Semiconductor Systems segment also sells spare parts and consumable items, which Single-element transactions are not subject to acceptance criteria. Revenue for these spare parts and consumable items is generally recognized under the multiple units shipped methodology described above.upon shipment.
Installation is generally a routine process that occurs within a short period of time from delivery and we have concluded that this obligation is inconsequential and perfunctory. As such, for transactions that include installation, and for which customer acceptance has not been deemed necessary in order to record the revenue, the cost of installation is accrued at the time product revenue is recorded and no related revenue is deferred. Historically, the costs of installation have not been significant.
The initial standard warranty for product sales is accounted for under the provisions of ASC 450, “Contingencies”, as we have the ability to ascertain the probable likelihood of the liability and can estimate the amount of the liability. A provision for the estimated cost related to warranty is recorded to cost of goods sold at the time revenue is recognized. Our estimate of costs to service the warranty obligations are based on historical experience and expectations of future conditions. To the extent we experience increased warranty claims or increased costs associated with servicing those claims, revisions to the estimated warranty liability are recorded as increases or decreases to the accrual at that time, with an offsetting entry recorded to cost of goods sold.
We also sell optional extended warranty services and preventative maintenance contracts, at the time of their product purchase.contracts. We account for these agreements in accordance with provisions of ASC 605-20-25-3, “Separately Priced Extended Warranty and Product Maintenance Contracts”, under which we recognize the separately priced extended warranty and preventative maintenance fees over the associated period.
We, atAt the request of our customers, we may at times perform professional services for our customers, generally for the maintenance and repairs of products previously sold to those customers. These services are usually in the form of time and materials based contracts which are short in their duration. Revenue for time and materialmaterials services is recorded at the completion of services requested under a customer’s purchase order. Customers may, at times subsequent to the initial product sale, purchase a service contract whereby services, including preventative maintenance plans, are provided over a defined period, generally one year. Revenue for such service contracts are recorded ratably over the period of the contract.
We typically negotiate trade discounts and agreed terms in advance of order acceptance and record any such items as a reduction of revenue. Our revenue recognition policy allows for revenue to be recognized under arrangements where the payment terms are 180 days or less, presuming all other revenue recognition criteria have been met. From time to time, based on our review of customer creditworthiness and other factors, we may provide our customers with payment terms that exceed 180 days. To the extent all other revenue recognition criteria have been met, we recognize revenue for these extended payment arrangements as the payments become due.
We have significantrecorded deferred revenue included in our accompanying consolidated balance sheets, with balances (including both current and long-term amounts) of $15.4$6.1 million and $55.8$15.4 million as of December 31, 2011 and 2010, and 2009, respectively. A significant majority of these amounts relate to arrangements whereby the entireThe deferred revenue balance is primarily comprised of: (a) pre ASU 2009-13 multiple-
arrangement has been accounted for as deferred revenue, aselement arrangements, delivered over multiple periods, whereby there is no fair value for one or more of the undelivered elements orelement(s); and (b) arrangements where acceptance has not been received. Upon the final delivery or acceptance of the undelivered element(s) of the arrangement, the revenue will be recorded for that arrangement. To a much lesser extent, the deferred revenue balances relate to either:to: (a) the unrecognized portion of a multiple element arrangements that is being recognized into revenue over a ratable basis as associated services are performed; (b) arrangements not currently recognizable due to the arrangement not being fixed and determinable at its inception; (c) the future amortization to revenue of extended warranty contracts and preventative maintenance plans; (d)(b) revenue deferrals for product shipments with FOB destination shipping terms; (c) the future amortization of revenue related to extended warranty contracts and (e)preventative maintenance plans; or (d) deposits from customers against future orders. The classification of deferred revenue and deferred cost of goods sold is based on our expectations relativewith respect to when the revenue will be recognized, based on facts known to us as of the date ourthe financial statements are released.
Allowances for Doubtful Accounts.We are required to estimate the collectability of our trade receivables. A considerable amount of judgment is required in assessing the ultimate realization of receivables, including the current credit-worthiness of each customer. We maintain an allowance for doubtful accounts for estimated losses resulting from the inability of our customers to make required payments. If the financial condition of our customers were to deteriorate, resulting in an impairment of their ability to make payments, additional allowances may be required. The collectability of accounts receivable is evaluated based on a combination of factors. In circumstances where we are aware of a specific customer’s inability to meet its financial obligations (e.g., bankruptcy filings), a specific reserve for bad debts is recorded against amounts due, to reduce the net recognized receivable to the amount we reasonably believe will be collected. For all other customers, we estimate an allowance for bad debts based upon the total accounts receivable balance and the percentage expected to be realized through subsequent cash collections. If circumstances change (i.e., higher than expected defaults or an unexpected material adverse change in a major customer’s ability to meet its financial obligations to us), our estimates of the recoverability of amounts due to us could be reduced by a material amount.
Inventories.Inventories, which include materials and conversion costs, are stated at the lower of cost or market, afterusing a first-in, first-out method. We periodically review these values to ascertain that market value of the inventory continues to exceed its recorded cost. Generally, reductions in value of inventory below cost are caused by technological obsolescence of the inventory.
We regularly review inventory quantities on hand and, when necessary, record provisions for excess and obsolete inventory salable at prices below cost. Costs are determined using first-in, first-out method.
We write down inventory forbased on either our estimated obsolescence or unmarketable inventory equal to the difference between the costforecast of inventory and the estimated market value based upon assumptions about futureproduct demand and market conditions.production requirements, or historical trailing usage of the product. If our sales do not materialize as planned or at historic levels, we may have to increase our reserve for excess and obsolete inventory, which would reduce our earnings. If actual market conditions are lessmore favorable than those projected by us, additionalanticipated, inventory write-downspreviously written down may be required.sold, resulting in lower costs of sales and higher income from operations than expected in that period.
Business Combinations. Valuation of Long-lived Assets.For business combinations consummated prior to January 1, 2009, we allocated the purchase price of acquired companies to the tangible and intangible assets acquired and liabilities assumed as well as to in-process research and development based upon their estimated fair values at the acquisition date in accordance with Statement of Financing Accounting Standards (“SFAS”) No. 141, “Business Combinations”. The purchase price allocation process requires management to make significant estimates and assumptions, especially at acquisition date with respect to intangible assets, support obligations assumed, estimated restructuring liabilities and pre-acquisition contingencies.
Although we believe the assumptions and estimates we have made in the past have been reasonable and appropriate, they are based in part on historical experience and information obtained from the management of the acquired companies and are inherently uncertain. Examples of critical estimates in valuing certain of the intangible assets we have acquired or may acquire in the future include but are not limited to:
future expected cash flows from sales of acquired product lines, developed technologies and patents;
expected costs to develop in-process research and development projects into commercially viable products and the estimated cash flows from the projects when completed;
the acquired company’s brand and competitive position, as well as assumptions about the period of time the acquired brand will continue to be used in the combined company’s product portfolio; and
discount rates.
Unanticipated events and circumstances may occur which may affect the accuracy or validity of such assumptions, estimates or actual results.
Effective January 1, 2009, we adopted ASC 805, “Business Combinations”.
Goodwill, Intangible Assets and Impairment Assessment.As discussed above, in “Business Combinations,” our goodwill and intangible assets generally arise from business combinations. Our most significant intangible assets are acquired technology, customer relationships, and trademarks and trade names. The purchase price we pay for acquired companies is allocated first to the identifiable assets acquired tangible assets and liabilities assumed at their fair value. Any excess purchase price is then allocated to identifiable intangible assets and the remainder, if any, is assigned to goodwill. We make various assumptions and estimates in order to assign fair value to acquired tangible and intangible assets and liabilities, including those associated with our business plans and related cash flow forecasts, as well as discount rates and terminal values, among others. Actual cash flows may vary from forecasts used to value the intangible assets at the time of the business combination.
Our most significant intangible assets are acquired technology,technologies, customer relationships, and trademarks and trade names. In addition to our review of the carrying values of each asset, the useful life assumptions for each asset, including the classification of certain intangible assets as ‘indefinite lived’, are reviewed on a periodic basis to determine if changes in circumstances warrant revisions to them. All definite-lived intangible assets are amortized over the periods in which their economic benefits are expected to be realized.
We test ourImpairment analyses of goodwill for impairment on an annual basis, and more frequently if impairment indicatorsindefinite-lived intangible assets are identified,conducted in accordance with ASC 350, “Intangibles—Goodwill and Other”,. We test our goodwill balances annually as of the beginning of the second quarter or more frequently if indicators are present or changes in circumstances suggest that impairment may exist. In performing the test, we utilize the two-step approach which first requires a comparison of the carrying value of each of our reporting units’ net assetsunits to theirthe fair value.value of these reporting units. If the carrying value of a reporting unit exceeds its fair value, we calculate the implied fair value of the reporting unit’s goodwill and compare it to the goodwill’s carrying value. If the carrying value of goodwill exceeds its implied fair value, an impairment charge is recorded for the difference. The implied fair value of goodwilla reporting unit is calculated by performingprimarily based on a fairdiscounted cash flow (“DCF”) method. The DCF approach requires that we forecast future cash flows for each of the reporting units and discount the cash flow streams based on a weighted average cost of capital (“WACC”) that is derived, in part, from comparable companies within similar industries. The DCF calculations also include a terminal value assessmentcalculation that is based upon an expected long-term growth rate for the applicable reporting unit. The carrying values of theeach reporting unit include assets and liabilities ofwhich relate to the reporting unit, in a manner consistent with the discussion above with respect to the initial fair value allocation performed in a business combination. The carrying value of each reporting unit’s assets and liabilities are predominantly specifically identifiable.operations. Additionally, reporting units that benefit from corporate assets or liabilities are allocated a portion of those corporate assets and liabilities on a systematic, proportional basis.
Our indefinite-lived intangible assets represent trade names that were acquired in the August 2008 Excel acquisition. We assess these indefinite-lived intangible assets for impairment on an annual basis, and more frequently if
impairment indicators are identified, and periodically reassess their continuing classification as indefinite-lived. We use the relief from royalty method, based on forecasted revenues, to estimate the fair value of indefinite-lived intangible assets. Impairment exists if the fair value of the intangible asset is less than its carrying value. An impairment charge equal to the difference is recorded to reduce the carrying value to its fair value.
We evaluate amortizable intangible assets and other long-lived assets for impairment, in accordance with ASC 360-10-35-15, “Impairment or Disposal of Long-Lived Assets”, whenever changes in events or circumstances indicate carrying values may exceed their undiscounted cash flow forecasts. If undiscounted cash flow forecasts indicate the carrying value of a definite-lived intangible asset or other long-lived asset may not be recoverable, a fair value assessment is performed. For intangible assets, fair value estimates are derived from discounted cash flow forecasts. For other long-lived assets, fair value estimates are derived from the sources most appropriate for the particular asset and have historically included such approaches as: sales comparison approach, replacement cost approach, prices reflected in comparable sales transactions and estimated construction costs. If fair value is less than carrying value, an impairment charge equal to the difference is recorded, thereby reducing the intangible asset’s and other long-lived asset’s carrying value to its fair value.recorded. We also review the useful life and residual value assumptions for definite-lived intangible assets and other long-lived assets on a periodic basis to determine if changes in circumstances warrant revisions to them. All definite-lived intangible assets and other long-lived assets are amortized over the periods in which their economic benefits are expected to be realized.
Factors which may trigger an impairment of our goodwill, intangible assets and other long-lived assets include the following:
filing for bankruptcy protection;
underperformance relative to historical or projected future operating results;
changes in the manner of our use of the acquired assets or the strategy for our overall business;
negative industry or economic trends;
interest rate changes;
technological changes or developments;
changes in competition;
loss of key customers or personnel;
adverse judicial or legislative outcomes or political developments;
declines in our stock price for a sustained period; and
the decline of our market capitalization below net book value.
The occurrence of any of these events or any other unforeseeable event or circumstance that materially affects future results or cash flows may cause an impairment that is material to our results of operations or financial position in the reporting period in which it occurs or is identified.
The most recent annual goodwill and indefinite-lived intangible asset impairment test was performed as of the beginning of the second quarter of 2010,2011, noting no impairment. No impairment charges were recognized during the year ended December 31, 2010.
We undertook an impairment review of goodwill and intangible assets at the end of 2009 due to the filing for voluntary relief under Chapter 11 of the U.S. Bankruptcy Code on November 20, 2009. This review led us to record an impairment charge of approximately $1.0 million to reduce the carrying values of certain assets to their fair value. Goodwill and the definite-lived customer relationship intangible asset for the Excel segment were each impaired by approximately $0.5 million. The results of the impairment review as of December 31, 2009 are summarized in the following table (in thousands):
| Pre-Impairment Net Carrying Value | Impairment Charge | Post-Impairment Net Carrying Value | ||||||||||
Goodwill | $ | 45,063 | $ | (485 | ) | $ | 44,578 | |||||
Indefinite-lived intangible assets | 13,027 | — | 13,027 | |||||||||
Definite-lived intangible assets | 49,042 | (560 | ) | 48,482 | ||||||||
Property, plant and equipment | 49,502 | — | 49,502 | |||||||||
| $ | 156,634 | $ | (1,045 | ) | $ | 155,589 | ||||||
The significant downturn in the global economy experienced in 2008, and most notably in the fourth quarter of 2008, negatively impacted our estimated future revenues and cash flows, as compared to our prior estimates, including those estimates made at the time we acquired Excel. Excel’s 2009 actual revenues were significantly lower than Excel’s 2009 projected revenues at the time of the acquisition in August 2008. From the acquisition in August 2008 to December 2008, when the impairment analysis was performed, we reduced Excel’s annual revenue projections by $50.1 to $54.5 million per year, or on average approximately 26% per year, compared to the projections used to initially value the intangible assets in Excel’s purchase price allocation. During this same period of time, our cost of capital increased significantly, primarily due to the increase in risk associated with an investment in our equity securities. Our estimated cost of capital increased in the fourth quarter of 2008 after we
announced the delayed filing of our financial results. The announcement increased our risk profile and made financing more expensive, as a result of the decline in our stock price, the receipt of default notices from our noteholders, and the severe economic downturn. Our weighted average cost of capital forms the basis of the rates used to discount our cash flow forecasts which are integral to our fair value estimates. The discount rates utilized to initially value the intangible assets in the purchase price allocation ranged from 10.0% to 13.0%, while the discount rates utilized in the December 31, 2008 impairment analyses of the goodwill and other intangible assets ranged from 16.5% to 17.5%. Consequently, we undertook an impairment review of our goodwill, intangible assets and other long-lived assets (property, plant and equipment) as of December 31, 2008. This review led to us recording a charge to reduce the carrying value of these assets by an aggregate of $215.1 million. The results of the impairment review as of December 31, 2008 are summarized in the following table (in thousands):
| Pre-Impairment Net Carrying Value | Impairment Charge | Post-Impairment Net Carrying Value | ||||||||||
Goodwill | $ | 176,232 | $ | (131,169 | ) | $ | 45,063 | |||||
Indefinite-lived intangible assets | 34,341 | (21,314 | ) | 13,027 | ||||||||
Definite-lived intangible assets | 115,563 | (57,130 | ) | 58,433 | ||||||||
Property, plant and equipment | 59,877 | (5,438 | ) | 54,439 | ||||||||
| $ | 386,013 | $ | (215,051 | ) | $ | 170,962 | ||||||
We continue to maintain a significant balance in our goodwill, intangible assets and other long-lived assets (property, plant and equipment). The following table shows the December 31, 20102011 breakdown of goodwill, intangibles and property, plant and equipment by reportable segment (in thousands):
| Goodwill | Intangible Assets | Property, Plant & Equipment | ||||||||||
Precision Technology | $ | 9,245 | $ | 6,379 | $ | 6,676 | ||||||
Semiconductor Systems | — | — | 255 | |||||||||
Excel | 35,333 | 46,760 | 28,458 | |||||||||
Corporate | — | — | 10,013 | |||||||||
| $ | 44,578 | $ | 53,139 | $ | 45,402 | |||||||
To the extent that our assumptions used to value the assets as of December 31, 2010 should adversely change or there is a further deterioration of the markets we serve, the broader worldwide economy, or the performance of our business relative to our expectations as of December 31, 2010, we may be required to record additional impairment charges in the future.
Restructuring, Restatement Related Costs and Other Charges.In accounting for our restructuring activities, we follow the provisions of ASC 420, “Exit or Disposal Cost Obligations”. In accounting for these obligations, we make assumptions related to the amounts of employee severance, benefits, and related costs and to the time period over which facilities will remain vacant, sublease terms, sublease rates and discount rates. Estimates and assumptions are based on the best information available at the time the obligation has arisen. These estimates are reviewed and revised as facts and circumstances dictate; changes in these estimates could have a material effect on the amount previously expensed against our earnings, and currently accrued on our consolidated balance sheet.
During the years ended December 31, 2010, 2009 and 2008, we incurred costs to third parties, including auditors, attorneys, forensic accountants, and other advisors for services performed in connection with the restatement of our previously issued financial statements as reported in our Annual Report on Form 10-K for the year-ended December 31, 2008 and our Quarterly Report on Form 10-Q for the quarter-ended September 26, 2008, including, the SEC investigation, certain shareholder actions and the internal FCPA investigation. These costs are charged to expense as incurred and are included in our restructuring, restatement related costs and other charges.
| Goodwill | Intangible Assets | Property, Plant & Equipment | ||||||||||
Laser Products | $ | 13,826 | $ | 15,250 | $ | 25,466 | ||||||
Precision Motion and Technologies | 30,752 | 30,547 | 8,465 | |||||||||
Semiconductor Systems | — | — | 72 | |||||||||
Corporate | — | — | 9,408 | |||||||||
|
|
|
|
|
| |||||||
| $ | 44,578 | $ | 45,797 | $ | 43,411 | |||||||
|
|
|
|
|
| |||||||
Pension Plans. Two of our subsidiaries, located in the United KingdomU.K. and Japan, maintain retirement plans that are accounted for as defined benefit pension plans.
Our United Kingdom pension planU.K. Plan was closed to new membership in 1997 and we curtailed our sponsorshipstopped accruing for additional pension benefits for existing members in 2002,2001, limiting our obligation to benefits earned through that date. Benefits under this plan were based on the employees’ years of service and compensation. At December 31, 2010,2011, the market value of the plan assets was $1.6$2.7 million less than the projected benefit obligation.
The cost and obligations of our United Kingdom pension planU.K. Plan are calculated using many assumptions to estimate the benefits, the amount of which cannot be completely determined until the benefit payments cease. Major assumptions used in the accounting for this pension plan include the discount rate, rate of inflation, and expected return on plan assets. Assumptions are determined based on the Company’s data and appropriate market indicators in consultation with a third-party actuary, and is evaluated each year as of the plan’s measurement date. Should any of these assumptions change, they would have an effect on net periodic pension cost and the unfunded benefit obligation.
Our Japanese pension plan is a tax qualified plan that covers substantially all Japanese employees. Benefits are based on years of service and the employee’s compensation at retirement. We fund the plan sufficient to meet current benefits as well as fund a certain portion of future benefits as permitted in accordance with regulatory authorities.by local regulations. Since this is an active plan, a significant portion of the pension benefit obligation is determined based on the rate of future compensation increases. We deposit funds under various fiduciary-type arrangements and/or purchase annuities under group insurance contracts. At December 31, 2010,2011, the market value of the plan assets was $1.4$1.5 million less than the projected benefit obligation.
Given both pension plans’ current under-funded status, changes in economicRestructuring, Restatement Related Costs and market conditions may require usOther Charges.In accounting for our restructuring activities, we follow the provisions of ASC 420, “Exit or Disposal Cost Obligations”. In accounting for these obligations, we make assumptions related to increase cash contributions in future years. Furthermore,the amounts of employee severance, benefits, and related costs and to the time period over which facilities will remain vacant, sublease terms, sublease rates and discount rates. Additionally, we make assumptions on the estimated remaining useful lives of assets being restructured and the residual value of the assets. Estimates and assumptions are based on the results ofbest information available at the time the obligation has arisen. These estimates are reviewed and revised as facts and circumstances dictate. Changes in these estimates could have a new funding valuation in 2010, we are required to increasematerial effect on the amount previously expensed against our annual contributions to the U.K. Plan from approximately $0.6 million to $0.8 million for a period of 10 yearsearnings and 5 months, including an additional one-time lump-sum payment of approximately $1.6 million, which was paid during the year-ended December 31, 2010.currently accrued on our consolidated balance sheet.
Accounting for Income Taxes.As part of the process of preparing our consolidated financial statements, we are required to calculate our income tax provision (benefit) in each of the jurisdictions in which we operate. This process involves estimating our current income tax provision (benefit) together with assessing temporary differences resulting from differing treatment of items for tax and accounting purposes. These differences result in deferred tax assets and liabilities, which are included within our consolidated balance sheet.
Judgment is required in determining our worldwide income tax provision. In the ordinary course of global business, there are many transactions and calculations where the ultimate outcome is uncertain. Although we believe our estimates are reasonable, no assurance can be given that the final outcome of these matters will not be different from that which is reflected in our historical income tax provisions and accruals. Such differences could have a material impact on our income tax provision and operating results in the period in which such determination is made.
We record a valuation allowance on our deferred tax assets when it is more likely than not that they will not be realized. We have considered future taxable income and ongoing prudent and feasible tax planning strategies in assessing the need for a valuation allowance. In the event we were to determine that we would beare able to realize our deferred tax assets in the future in excess of itstheir net recorded amount, an adjustment to the valuation allowance for the deferred tax assetassets would increase our net income in the period such determination wasis made. Likewise, should we
determine that we wouldwill not be able to realize all or part of our net deferred tax assetassets in the future, an adjustment to the valuation allowance for the deferred tax asset would be charged toassets will reduce our net income in the period such determination wasis made.
In conjunction with our ongoing review of our actual results and anticipated future earnings, we continuously reassess the possibility of releasing the valuation allowance currently in place on our deferred tax assets. It is reasonably possible that a significant portion of the valuation allowance will be released within the next twelve months. Such a release will be reported as a reduction to income tax expense with no impact on cash flows in the quarter in which it is released.
The amount of income taxes we pay is subject to audits by federal, state and foreign tax authorities, which may result in proposed assessments. We believe that we have adequately provided for any reasonably foreseeable outcome related to these matters. However, our future results may include favorable or unfavorable adjustments to our tax liabilities in the period that the assessments are made or resolved, or when the statute of limitations for certain periods expires. As a result,of December 31, 2011, the amount of gross unrecognized tax benefits totaled approximately $7.3 million all of which would favorably affect our effective tax rate, may fluctuate significantly onif recognized. We are currently under examination in the United States for tax years from 2000 to 2008. It is reasonably possible that the U.S. examination for the periods from 2000 to 2008 will be completed during the next 12 months, which would result in a quarterly basis.
Undistributed earnings of our non-Canadian subsidiaries amounted to approximately $16.0 million asAs of December 31, 2010. We have not provided any income taxes or withholding taxes on2011, the undistributedamount of non-Canadian earnings as such earnings have beenthat are expected to remain indefinitely reinvested in the business as defined in the provisions of ASC 740 “Income Taxes”., and for which we have not provided any tax costs of repatriation, is approximately $13.6 million. In general, the determination of the amount of the unrecognized deferred tax liability related to the undistributedreinvested earnings is not practicablepractical because of the complexities associated with its hypothetical calculation.
Loss Contingencies.We are subject to legal proceedings, lawsuits and other claims relating to labor, service and other matters arising in the ordinary course of business. Quarterly, we review the status of each significant matter and assess our potential financial exposure. If the potential loss from any claim or legal proceeding is considered probable and the amount can be reasonably estimated, we accrue a liability for the estimated loss. Significant judgment is required in both the determination of probability and the determination as to whether an exposure is reasonably estimable. Because of uncertainties related to these matters, accruals are based only on the best information available at the time. As additional information becomes available, we reassess the potential liability related to our pending claims and litigation and may revise our estimates. Such revisions in the estimates of the potential liabilities could have a material impact on our results of operations and financial position. We expense legal fees as incurred.
Recent Accounting Pronouncements
See Note 3 to Consolidated Financial Statements for recent accounting pronouncements that could have an effect on us.
Item 7A.Quantitative and Qualitative Disclosures about Market Risk
We are exposed to market risk from changes in foreign currency exchange rates and interest rates, which could affect our operating results, financial position and cash flows. We manage our exposure to these market risks through our regular operating and financing activities. We generally do not enter into derivative financial instruments to manage foreign currency exposure.
Foreign Currency Exchange Rate Risk and Sensitivity
We are exposed to changes in foreign currency exchange rates. Any foreign currency transaction, definedrates which could affect operating results as a transaction denominated in a currency other than the U.S. dollar, will be reported in U.S. dollars at the applicable exchange rate. Assetswell as our financial position and liabilities are translated into U.S. dollars at exchange rates in effect at the balance sheet date and income and expense items are translated at average rates for the period.cash flows. The primary foreign currency denominated transactions include revenue and expenses and the resulting accounts receivable and accounts payable balances reflected on our balance sheet. Therefore, the change in the value of the U.S. dollar compared to foreign currencies will have either a positive or negative effect on our financial position and results of operations. Historically, our primary exposure has related to transactions denominated in the Japanese Yen, Euro and British Pound and Canadian Dollar.Pound.
A hypothetical change of 10% in appreciation or depreciation in foreign currency exchange rates from the quoted foreign currency exchange rates atduring the year ended and as of December 31, 20102011 would not have a material impact on our revenue, operating results, cash flows or cash flows.financial position.
Interest Rate Risk and SensitivityRates
Our exposure to market risk associated with changes in interest rates relates primarily to our cash and cash equivalents short-term investments, long-term investments and debt obligations. At December 31, 2010,2011, we had $56.8$54.8 million invested in cash and cash equivalents, as compared to $63.3$56.8 million at December 31, 2009.2010. Due to the average maturities and the nature of the cash portfolio at December 31, 2010,2011, a one percent change100 basis point increase in interest rates could have a $0.6$0.5 million impact on interest income on an annual basis. In addition, we have $68.0 million of outstanding variable rate debt as of December 31, 2011. A 100 basis point increase in interest rates at December 31, 2011 would increase our annual pre-tax interest expense by approximately $0.7 million. We do not actively trade derivative financial instruments, but may use them in the future to manage interest rate positions associated with our debt instruments. We did not hold interest rate derivative contracts as of December 31, 2010.2011.
Item 8.Financial Statements and Supplementary Data
INDEX TO CONSOLIDATED FINANCIAL STATEMENTS
REPORT OF INDEPENDENT REGISTERED PUBLIC ACCOUNTING FIRM
The Board of Directors and Shareholders of GSI Group Inc.
We have audited the accompanying consolidated balance sheets of GSI Group Inc. as of December 31, 20102011 and 2009,2010, and the related consolidated statements of operations, comprehensive income (loss), stockholders’ equity, and cash flows for each of the three years in the period ended December 31, 2010.2011. These financial statements are the responsibility of the Company’s management. Our responsibility is to express an opinion on these financial statements based on our audits.
We conducted our audits in accordance with the standards of the Public Company Accounting Oversight Board (United States). Those standards require that we plan and perform the audit to obtain reasonable assurance about whether the financial statements are free of material misstatement. We were not engaged to perform an audit of the Company’s internal control over financial reporting. Our audits included consideration of internal control over financial reporting as a basis for designing audit procedures that are appropriate in the circumstances, but not for the purpose of expressing an opinion on the effectiveness of the Company’s internal control over financial reporting. Accordingly, we express no opinion. An audit also includes examining, on a test basis, evidence supporting the amounts and disclosures in the financial statements,statements. An audit also includes assessing the accounting principles used and significant estimates made by management, andas well as evaluating the overall financial statement presentation. We believe that our audits provide a reasonable basis for our opinion.
In our opinion, the financial statements referred to above present fairly, in all material respects, the consolidated financial position of GSI Group Inc. at December 31, 20102011 and 2009,2010, and the consolidated results of its operations and its cash flows for each of the three years in the period ended December 31, 2010,2011, in conformity with U.S. generally accepted accounting principles.
We also have audited, in accordance with the standards of the Public Company Accounting Oversight Board (United States), GSI Group Inc.’s internal control over financial reporting as of December 31, 2011, based on criteria established in Internal Control-Integrated Framework issued by the Committee of Sponsoring Organizations of the Treadway Commission and our report dated March 14, 2012 expressed an unqualified opinion thereon.
/s/ Ernst & Young LLP
Boston, Massachusetts
March 30, 201114, 2012
CONSOLIDATED BALANCE SHEETS
(In thousands of U.S. dollars except share data)or shares)
| December 31, 2010 | December 31, 2009 | December 31, 2011 | December 31, 2010 | |||||||||||||
| ASSETS | ||||||||||||||||
Current Assets | ||||||||||||||||
Cash and cash equivalents | $ | 56,781 | $ | 63,328 | $ | 54,835 | $ | 56,781 | ||||||||
Accounts receivable, net of allowance of $696 and $1,776, respectively | 55,110 | 47,037 | ||||||||||||||
Accounts receivable, net of allowance of $557 and $696, respectively | 50,167 | 55,110 | ||||||||||||||
Income taxes receivable | 21,920 | 24,192 | 22,707 | 21,920 | ||||||||||||
Inventories | 66,721 | 65,596 | 65,810 | 66,721 | ||||||||||||
Deferred tax assets | 4,226 | 5,578 | 5,335 | 4,226 | ||||||||||||
Deferred cost of goods sold | 7,789 | 30,070 | 1,998 | 7,789 | ||||||||||||
Prepaid expenses and other current assets | 5,580 | 5,479 | 5,969 | 5,580 | ||||||||||||
|
| |||||||||||||||
Total current assets | 218,127 | 241,280 | 206,821 | 218,127 | ||||||||||||
Property, plant and equipment, net of accumulated depreciation | 45,402 | 49,502 | 43,411 | 45,402 | ||||||||||||
Deferred tax assets | 1,445 | 1,546 | 814 | 1,445 | ||||||||||||
Investments in auction rate securities | — | 11,272 | ||||||||||||||
Other assets | 4,476 | 4,983 | 7,082 | 4,476 | ||||||||||||
Intangible assets, net | 53,139 | 61,509 | 45,797 | 53,139 | ||||||||||||
Goodwill | 44,578 | 44,578 | 44,578 | 44,578 | ||||||||||||
|
| |||||||||||||||
Total assets | $ | 367,167 | $ | 414,670 | $ | 348,503 | $ | 367,167 | ||||||||
|
| |||||||||||||||
| LIABILITIES AND STOCKHOLDERS’ EQUITY | ||||||||||||||||
Current Liabilities | ||||||||||||||||
Short-term debt | $ | 10,000 | $ | — | ||||||||||||
Accounts payable | $ | 19,766 | $ | 13,430 | 14,679 | 19,766 | ||||||||||
Income taxes payable | 1,785 | 518 | 1,835 | 1,785 | ||||||||||||
Accrued compensation and benefits | 7,988 | 5,271 | 9,572 | 7,988 | ||||||||||||
Deferred revenue | 15,006 | 55,755 | 5,913 | 15,006 | ||||||||||||
Deferred tax liabilities | — | 39 | 140 | — | ||||||||||||
Other accrued expenses | 14,717 | 14,047 | 16,069 | 14,717 | ||||||||||||
|
| |||||||||||||||
Total current liabilities | 59,262 | 89,060 | 58,208 | 59,262 | ||||||||||||
Debt (Note 8) | 107,575 | — | ||||||||||||||
Long-term debt | 58,000 | 107,575 | ||||||||||||||
Deferred revenue | 402 | — | 152 | 402 | ||||||||||||
Deferred tax liabilities | 8,373 | 4,518 | 8,722 | 8,373 | ||||||||||||
Accrued restructuring, net of current portion | 769 | 1,256 | ||||||||||||||
Income taxes payable | 6,644 | 6,088 | 8,057 | 6,644 | ||||||||||||
Accrued pension liability | 3,044 | 4,838 | ||||||||||||||
Accrued pension liabilities | 4,265 | 3,044 | ||||||||||||||
Other liabilities | 2,420 | 4,039 | 1,739 | 3,189 | ||||||||||||
|
| |||||||||||||||
Total long-term liabilities | 129,227 | 20,739 | 80,935 | 129,227 | ||||||||||||
Liabilities subject to compromise (Note 2) | — | 220,560 | ||||||||||||||
|
| |||||||||||||||
Total liabilities | 188,489 | 330,359 | 139,143 | 188,489 | ||||||||||||
Commitments and contingencies (Note 14) | ||||||||||||||||
Stockholders’ Equity: | ||||||||||||||||
Common shares, no par value; Authorized shares: unlimited; Issued and outstanding: 33,342,169 and 15,947,743, respectively | 423,856 | 330,896 | ||||||||||||||
Commitments and contingencies (Note 12) | ||||||||||||||||
Stockholders’ Equity | ||||||||||||||||
Common shares, no par value; Authorized shares: unlimited; Issued and outstanding: 33,478 and 33,342, respectively | 423,856 | 423,856 | ||||||||||||||
Additional paid-in capital | 14,655 | 12,610 | 17,931 | 14,655 | ||||||||||||
Accumulated deficit | (256,733 | ) | (256,046 | ) | (227,760 | ) | (256,733 | ) | ||||||||
Accumulated other comprehensive loss | (3,429 | ) | (3,430 | ) | (5,024 | ) | (3,429 | ) | ||||||||
|
| |||||||||||||||
Total GSI Group Inc. stockholders’ equity | 178,349 | 84,030 | 209,003 | 178,349 | ||||||||||||
Noncontrolling interest | 329 | 281 | 357 | 329 | ||||||||||||
|
| |||||||||||||||
Total stockholders’ equity | 178,678 | 84,311 | 209,360 | 178,678 | ||||||||||||
|
| |||||||||||||||
Total liabilities and stockholders’ equity | $ | 367,167 | $ | 414,670 | $ | 348,503 | $ | 367,167 | ||||||||
|
| |||||||||||||||
The accompanying notes are an integral part of these consolidated financial statements.
CONSOLIDATED STATEMENTS OF OPERATIONS
(In thousands of U.S. dollars or shares, except per share amounts)
| Year Ended December 31, | Year Ended December 31, | |||||||||||||||||||||||
| 2010 | 2009 | 2008 | 2011 | 2010 | 2009 | |||||||||||||||||||
Sales | $ | 383,516 | $ | 254,388 | $ | 288,468 | $ | 366,280 | $ | 383,516 | $ | 254,388 | ||||||||||||
Cost of goods sold | 217,115 | 155,842 | 190,850 | 205,900 | 217,115 | 155,842 | ||||||||||||||||||
|
|
| ||||||||||||||||||||||
Gross profit | 166,401 | 98,546 | 97,618 | 160,380 | 166,401 | 98,546 | ||||||||||||||||||
|
|
| ||||||||||||||||||||||
Operating expenses: | ||||||||||||||||||||||||
Research and development and engineering | 29,857 | 28,254 | 33,449 | 31,966 | 29,857 | 28,254 | ||||||||||||||||||
Selling, general and administrative | 74,880 | 60,422 | 65,904 | 78,360 | 74,880 | 60,422 | ||||||||||||||||||
Amortization of purchased intangible assets | 4,436 | 5,805 | 5,714 | 3,515 | 4,436 | 5,805 | ||||||||||||||||||
Impairment of goodwill, intangible assets and other long-lived assets | — | 1,045 | 215,051 | |||||||||||||||||||||
Acquisition related in-process research and development charge | — | — | 12,142 | |||||||||||||||||||||
Impairment of goodwill and intangible assets | — | — | 1,045 | |||||||||||||||||||||
Restructuring, restatement related costs and other | 2,592 | 16,291 | 10,485 | 2,304 | 2,592 | 16,291 | ||||||||||||||||||
Pre-petition and post-emergence professional fees | 727 | 6,966 | — | 296 | 727 | 6,966 | ||||||||||||||||||
|
|
| ||||||||||||||||||||||
Total operating expenses | 112,492 | 118,783 | 342,745 | 116,441 | 112,492 | 118,783 | ||||||||||||||||||
|
|
| ||||||||||||||||||||||
Income (loss) from operations | 53,909 | (20,237 | ) | (245,127 | ) | 43,939 | 53,909 | (20,237 | ) | |||||||||||||||
Interest income | 87 | 294 | 3,310 | 92 | 87 | 294 | ||||||||||||||||||
Interest expense | (19,908 | ) | (27,751 | ) | (10,387 | ) | (13,062 | ) | (19,908 | ) | (27,751 | ) | ||||||||||||
Foreign exchange transaction gains (losses) | 328 | (816 | ) | 928 | ||||||||||||||||||||
Foreign exchange transaction (losses) gains, net | (95 | ) | 328 | (816 | ) | |||||||||||||||||||
Other income (expense), net | 1,840 | 206 | (545 | ) | 1,183 | 1,840 | 206 | |||||||||||||||||
|
|
| ||||||||||||||||||||||
Income (loss) from continuing operations before reorganization items and income taxes | 36,256 | (48,304 | ) | (251,821 | ) | 32,057 | 36,256 | (48,304 | ) | |||||||||||||||
Reorganization items | (26,156 | ) | (23,606 | ) | — | — | (26,156 | ) | (23,606 | ) | ||||||||||||||
|
|
| ||||||||||||||||||||||
Income (loss) from continuing operations before income taxes | 10,100 | (71,910 | ) | (251,821 | ) | 32,057 | 10,100 | (71,910 | ) | |||||||||||||||
Income tax provision (benefit) | 10,739 | (773 | ) | (39,032 | ) | 3,056 | 10,739 | (773 | ) | |||||||||||||||
|
|
| ||||||||||||||||||||||
Loss from continuing operations | (639 | ) | (71,137 | ) | (212,789 | ) | ||||||||||||||||||
Income (loss) from discontinued operations, net of tax | — | (132 | ) | 270 | ||||||||||||||||||||
Gain on disposal of discontinued operations, net of tax | — | — | 8,732 | |||||||||||||||||||||
Income (loss) from continuing operations | 29,001 | (639 | ) | (71,137 | ) | |||||||||||||||||||
Loss from discontinued operations, net of tax | — | — | (132 | ) | ||||||||||||||||||||
|
|
| ||||||||||||||||||||||
Consolidated net loss | (639 | ) | (71,269 | ) | (203,787 | ) | ||||||||||||||||||
Consolidated net income (loss) | 29,001 | (639 | ) | (71,269 | ) | |||||||||||||||||||
Less: Net income attributable to noncontrolling interest | (48 | ) | (61 | ) | (60 | ) | (28 | ) | (48 | ) | (61 | ) | ||||||||||||
|
|
| ||||||||||||||||||||||
Net loss attributable to GSI Group Inc. | $ | (687 | ) | $ | (71,330 | ) | $ | (203,847 | ) | |||||||||||||||
Net income (loss) attributable to GSI Group Inc. | $ | 28,973 | $ | (687 | ) | $ | (71,330 | ) | ||||||||||||||||
|
|
| ||||||||||||||||||||||
Loss from continuing operations attributable to GSI Group Inc. per common share: | ||||||||||||||||||||||||
Income (loss) from continuing operations attributable to GSI Group Inc. per common share: | ||||||||||||||||||||||||
Basic | $ | (0.03 | ) | $ | (4.47 | ) | $ | (14.81 | ) | $ | 0.87 | $ | (0.03 | ) | $ | (4.47 | ) | |||||||
Diluted | $ | (0.03 | ) | $ | (4.47 | ) | $ | (14.81 | ) | $ | 0.86 | $ | (0.03 | ) | $ | (4.47 | ) | |||||||
Income (loss) from discontinued operations attributable to GSI Group Inc. per common share: | ||||||||||||||||||||||||
Loss from discontinued operations attributable to GSI Group Inc. per common share: | ||||||||||||||||||||||||
Basic | $ | — | $ | (0.01 | ) | $ | 0.63 | $ | — | $ | — | $ | (0.01 | ) | ||||||||||
Diluted | $ | — | $ | (0.01 | ) | $ | 0.63 | $ | — | $ | — | $ | (0.01 | ) | ||||||||||
Net loss attributable to GSI Group Inc. per common share: | ||||||||||||||||||||||||
Net income (loss) attributable to GSI Group Inc. per common share: | ||||||||||||||||||||||||
Basic | $ | (0.03 | ) | $ | (4.48 | ) | $ | (14.18 | ) | $ | 0.87 | $ | (0.03 | ) | $ | (4.48 | ) | |||||||
Diluted | $ | (0.03 | ) | $ | (4.48 | ) | $ | (14.18 | ) | $ | 0.86 | $ | (0.03 | ) | $ | (4.48 | ) | |||||||
Weighted average common shares outstanding—basic | 23,703 | 15,916 | 14,375 | 33,481 | 23,703 | 15,916 | ||||||||||||||||||
Weighted average common shares outstanding—diluted | 23,703 | 15,916 | 14,375 | 33,589 | 23,703 | 15,916 | ||||||||||||||||||
Amounts attributable to GSI Group Inc.: | ||||||||||||||||||||||||
Loss from continuing operations | $ | (687 | ) | $ | (71,198 | ) | $ | (212,849 | ) | |||||||||||||||
Income (loss) from discontinued operations | — | (132 | ) | 9,002 | ||||||||||||||||||||
Income (loss) from continuing operations | $ | 28,973 | $ | (687 | ) | $ | (71,198 | ) | ||||||||||||||||
Loss from discontinued operations | — | — | (132 | ) | ||||||||||||||||||||
|
|
| ||||||||||||||||||||||
Net loss | $ | (687 | ) | $ | (71,330 | ) | $ | (203,847 | ) | |||||||||||||||
Net income (loss) | $ | 28,973 | $ | (687 | ) | $ | (71,330 | ) | ||||||||||||||||
|
|
| ||||||||||||||||||||||
The accompanying notes are an integral part of these consolidated financial statements.
CONSOLIDATED STATEMENTS OF COMPREHENSIVE INCOME (LOSS)
(In thousands of U.S. dollars)
| Year Ended December 31, | ||||||||||||
| 2011 | 2010 | 2009 | ||||||||||
Consolidated net income (loss) | $ | 29,001 | $ | (639 | ) | $ | (71,269 | ) | ||||
Other comprehensive income (loss): | ||||||||||||
Foreign currency translation adjustments | 241 | 701 | 2,706 | |||||||||
Net unrealized gains and reclassifications of investments, net of tax(1) | — | (568 | ) | 488 | ||||||||
Pension liability adjustments, net of tax(1) | (1,836 | ) | (132 | ) | (2,388 | ) | ||||||
|
|
|
|
|
| |||||||
Total other comprehensive income (loss), net of tax | (1,595 | ) | 1 | 806 | ||||||||
|
|
|
|
|
| |||||||
Total consolidated comprehensive income (loss) | 27,406 | (638 | ) | (70,463 | ) | |||||||
Less: Comprehensive income attributable to noncontrolling interest | (28 | ) | (48 | ) | (61 | ) | ||||||
|
|
|
|
|
| |||||||
Comprehensive income (loss) attributable to GSI Group Inc. | $ | 27,378 | $ | (686 | ) | $ | (70,524 | ) | ||||
|
|
|
|
|
| |||||||
| (1) | The tax effect on the component of comprehensive income (loss) is nominal for all periods presented. |
The accompanying notes are an integral part of these consolidated financial statements.
CONSOLIDATED STATEMENTS OF STOCKHOLDERS’ EQUITY
(In thousands of U.S. dollars or shares)
| GSI Group Inc. Stockholders | ||||||||||||||||||||||||||||||||
| Capital Stock | Additional Paid-In Capital | Accumulated Other Comprehensive Income (Loss) | Retained Earnings (Accumulated Deficit) | Noncontrolling Interest | ||||||||||||||||||||||||||||
| # of Shares | Amount | Total | Comprehensive Income (Loss) | |||||||||||||||||||||||||||||
Balance, December 31, 2007 | 14,054 | $ | 310,970 | $ | 8,191 | $ | 7,386 | $ | 19,131 | $ | — | $ | 345,678 | |||||||||||||||||||
Net income (loss) | — | — | — | — | (203,847 | ) | 60 | (203,787 | ) | $ | (203,787 | ) | ||||||||||||||||||||
Noncontrolling interest acquired | — | — | — | — | — | 160 | 160 | — | ||||||||||||||||||||||||
Exercise of stock options and warrants | 1,958 | 26,365 | — | — | — | — | 26,365 | — | ||||||||||||||||||||||||
Issuance of common stock upon vesting of non-vested stock awards | 102 | — | — | — | — | — | — | — | ||||||||||||||||||||||||
Repurchase of treasury shares | (258 | ) | (6,439 | ) | — | — | — | — | (6,439 | ) | — | |||||||||||||||||||||
Share based compensation | — | — | 2,761 | — | — | — | 2,761 | — | ||||||||||||||||||||||||
Excess tax expense of stock options and restricted stock | — | — | (219 | ) | — | — | — | (219 | ) | — | ||||||||||||||||||||||
Unrealized gain on investments, net of tax | — | — | — | 80 | — | — | 80 | 80 | ||||||||||||||||||||||||
Pension liability, net of tax | — | — | — | 797 | — | — | 797 | 797 | ||||||||||||||||||||||||
Foreign currency translation adjustments | — | — | — | (12,499 | ) | — | — | (12,499 | ) | (12,499 | ) | |||||||||||||||||||||
Balance, December 31, 2008 | 15,856 | 330,896 | 10,733 | (4,236 | ) | (184,716 | ) | 220 | 152,897 | $ | (215,409 | ) | ||||||||||||||||||||
Net income (loss) | — | — | — | — | (71,330 | ) | 61 | (71,269 | ) | $ | (71,269 | ) | ||||||||||||||||||||
Issuance of common stock upon vesting of non-vested stock awards | 92 | — | — | — | — | — | — | — | ||||||||||||||||||||||||
Share based compensation | — | — | 1,877 | — | — | — | 1,877 | — | ||||||||||||||||||||||||
Unrealized gain on investments, net of tax | — | — | — | 488 | — | — | 488 | 488 | ||||||||||||||||||||||||
Pension liability, net of tax | — | — | — | (2,388 | ) | — | — | (2,388 | ) | (2,388 | ) | |||||||||||||||||||||
Foreign currency translation adjustments | — | — | — | 2,706 | — | — | 2,706 | 2,706 | ||||||||||||||||||||||||
Balance, December 31, 2009 | 15,948 | 330,896 | 12,610 | (3,430 | ) | (256,046 | ) | 281 | 84,311 | $ | (70,463 | ) | ||||||||||||||||||||
Net income (loss) | — | — | — | — | (687 | ) | 48 | (639 | ) | $ | (639 | ) | ||||||||||||||||||||
Issuance of common stock upon vesting of non-vested stock awards | 146 | — | 135 | — | — | — | 135 | — | ||||||||||||||||||||||||
Issuance of common stock | 33 | — | 233 | — | — | — | 233 | — | ||||||||||||||||||||||||
Reclassification of share-based compensation liability | — | — | 44 | — | — | — | 44 | — | ||||||||||||||||||||||||
Cancellation of 16,127 old common shares in exchange for new common shares | — | — | — | — | — | — | — | — | ||||||||||||||||||||||||
Issuance of common shares under rights offering | 12,585 | 67,960 | — | — | — | — | 67,960 | — | ||||||||||||||||||||||||
Issuance of common shares for conversion of debt | 4,630 | 25,000 | — | — | — | — | 25,000 | — | ||||||||||||||||||||||||
Share based compensation | — | — | 1,633 | — | — | — | 1,633 | — | ||||||||||||||||||||||||
Reclassification of unrealized gain on investments, net of tax | — | — | — | (568 | ) | — | — | (568 | ) | (568 | ) | |||||||||||||||||||||
Pension liability, net of tax | — | — | — | (132 | ) | — | — | (132 | ) | (132 | ) | |||||||||||||||||||||
Foreign currency translation adjustments | — | — | — | 701 | — | — | 701 | 701 | ||||||||||||||||||||||||
Balance, December 31, 2010 | 33,342 | $ | 423,856 | $ | 14,655 | $ | (3,429 | ) | $ | (256,733 | ) | $ | 329 | $ | 178,678 | $ | (638 | ) | ||||||||||||||
| GSI Group Inc. Stockholders | ||||||||||||||||||||||||||||
| Capital Stock | Additional Paid-In Capital | Accumulated Other Comprehensive Income (Loss) | Retained Earnings (Accumulated Deficit) | Noncontrolling Interest | ||||||||||||||||||||||||
| # of Shares | Amount | Total | ||||||||||||||||||||||||||
Balance, December 31, 2008 | 15,856 | $ | 330,896 | $ | 10,733 | $ | (4,236 | ) | $ | (184,716 | ) | $ | 220 | $ | 152,897 | |||||||||||||
Net income (loss) | — | — | — | — | (71,330 | ) | 61 | (71,269 | ) | |||||||||||||||||||
Issuance of common stock upon vesting of non-vested stock awards | 92 | — | — | — | — | — | — | |||||||||||||||||||||
Share-based compensation | — | — | 1,877 | — | — | — | 1,877 | |||||||||||||||||||||
Other comprehensive income | — | — | — | 806 | — | — | 806 | |||||||||||||||||||||
|
|
|
|
|
|
|
|
|
|
|
|
|
| |||||||||||||||
Balance, December 31, 2009 | 15,948 | 330,896 | 12,610 | (3,430 | ) | (256,046 | ) | 281 | 84,311 | |||||||||||||||||||
Net income (loss) | — | — | — | — | (687 | ) | 48 | (639 | ) | |||||||||||||||||||
Issuance of common stock upon vesting of non-vested stock awards | 146 | — | 135 | — | — | — | 135 | |||||||||||||||||||||
Issuance of common stock | 33 | — | 233 | — | — | — | 233 | |||||||||||||||||||||
Reclassification of share-based compensation liability | — | — | 44 | — | — | — | 44 | |||||||||||||||||||||
Cancellation of 16,127 old common shares in exchange for new common shares | — | — | — | — | — | — | — | |||||||||||||||||||||
Issuance of common shares under rights offering | 12,585 | 67,960 | — | — | — | — | 67,960 | |||||||||||||||||||||
Issuance of common shares for conversion of debt | 4,630 | 25,000 | — | — | — | — | 25,000 | |||||||||||||||||||||
Share-based compensation | — | — | 1,633 | — | — | — | 1,633 | |||||||||||||||||||||
Other comprehensive income | — | — | — | 1 | — | — | 1 | |||||||||||||||||||||
|
|
|
|
|
|
|
|
|
|
|
|
|
| |||||||||||||||
Balance, December 31, 2010 | 33,342 | 423,856 | 14,655 | (3,429 | ) | (256,733 | ) | 329 | 178,678 | |||||||||||||||||||
Net income | — | — | — | — | 28,973 | 28 | 29,001 | |||||||||||||||||||||
Issuance of common stock upon vesting of non-vested stock awards | 136 | — | — | — | — | — | — | |||||||||||||||||||||
Share-based compensation | — | — | 3,276 | — | — | — | 3,276 | |||||||||||||||||||||
Other comprehensive loss | — | — | — | (1,595 | ) | — | — | (1,595 | ) | |||||||||||||||||||
|
|
|
|
|
|
|
|
|
|
|
|
|
| |||||||||||||||
Balance, December 31, 2011 | 33,478 | $ | 423,856 | $ | 17,931 | $ | (5,024 | ) | $ | (227,760 | ) | $ | 357 | $ | 209,360 | |||||||||||||
|
|
|
|
|
|
|
|
|
|
|
|
|
| |||||||||||||||
The accompanying notes are an integral part of these consolidated financial statements.
CONSOLIDATED STATEMENTS OF CASH FLOWS
(In thousands of U.S. dollars)
| Year Ended December 31, | Year Ended December 31, | |||||||||||||||||||||||
| 2010 | 2009 | 2008 | 2011 | 2010 | 2009 | |||||||||||||||||||
Cash flows from operating activities: | ||||||||||||||||||||||||
Consolidated net loss | $ | (639 | ) | $ | (71,269 | ) | $ | (203,787 | ) | |||||||||||||||
Adjustments to reconcile net loss to net cash from operating activities: | ||||||||||||||||||||||||
(Income) loss from operations of discontinued operations | — | 132 | (270 | ) | ||||||||||||||||||||
Gain on disposal of discontinued operations | — | — | (8,732 | ) | ||||||||||||||||||||
Consolidated net income (loss) | $ | 29,001 | $ | (639 | ) | $ | (71,269 | ) | ||||||||||||||||
Adjustments to reconcile net income (loss) to net cash from operating activities: | ||||||||||||||||||||||||
Loss from operations of discontinued operations | — | — | 132 | |||||||||||||||||||||
Depreciation and amortization | 15,653 | 17,330 | 18,906 | 15,267 | 15,653 | 17,330 | ||||||||||||||||||
Provision (recoveries) for uncollectible receivables | (469 | ) | 561 | 297 | ||||||||||||||||||||
Provision for inventory obsolescence | 6,361 | 2,485 | 10,165 | |||||||||||||||||||||
Impairment of goodwill, intangible assets and property, plant and equipment | — | 1,045 | 215,051 | |||||||||||||||||||||
Acquisition related in-process research and development charge | — | — | 12,142 | |||||||||||||||||||||
Step-up value of acquired inventory sold | — | 139 | 1,240 | |||||||||||||||||||||
Provision for inventory | 6,646 | 6,361 | 2,485 | |||||||||||||||||||||
Impairment of goodwill and intangible assets | — | — | 1,045 | |||||||||||||||||||||
Share-based compensation | 1,871 | 2,052 | 2,761 | 3,276 | 1,871 | 2,052 | ||||||||||||||||||
Deferred income taxes | 5,553 | 1,356 | (33,670 | ) | 78 | 5,553 | 1,356 | |||||||||||||||||
Earnings from equity investment | (857 | ) | (515 | ) | (214 | ) | (1,171 | ) | (857 | ) | (515 | ) | ||||||||||||
Loss (gain) on sale of property and assets | 13 | 63 | (1,352 | ) | ||||||||||||||||||||
Gain on sale of auction rate securities | (988 | ) | (2,414 | ) | — | — | (988 | ) | (2,414 | ) | ||||||||||||||
Non-cash reorganization items | — | 26,223 | — | — | — | 26,223 | ||||||||||||||||||
Non-cash interest expense | 976 | 4,661 | 1,890 | 1,881 | 976 | 4,661 | ||||||||||||||||||
Non-cash restructuring charges | 72 | 81 | 3,565 | 1,163 | 72 | 81 | ||||||||||||||||||
Changes in operating assets and liabilities, net of effects from business acquired: | ||||||||||||||||||||||||
Other non-cash items | 199 | (456 | ) | 763 | ||||||||||||||||||||
Changes in operating assets and liabilities: | ||||||||||||||||||||||||
Accounts receivable | (7,727 | ) | 880 | 35,915 | 4,822 | (7,727 | ) | 880 | ||||||||||||||||
Inventories | (8,171 | ) | 8,355 | 10,178 | (6,062 | ) | (8,171 | ) | 8,355 | |||||||||||||||
Deferred costs | 22,281 | 12,461 | 5,484 | |||||||||||||||||||||
Deferred cost of goods sold | 5,791 | 22,281 | 12,461 | |||||||||||||||||||||
Prepaid expenses and other current assets | (103 | ) | 671 | 960 | (50 | ) | (103 | ) | 671 | |||||||||||||||
Deferred revenue | (40,347 | ) | (26,315 | ) | (15,255 | ) | (9,343 | ) | (40,347 | ) | (26,315 | ) | ||||||||||||
Deferred rent | (905 | ) | (316 | ) | 4,698 | |||||||||||||||||||
Accounts payable, accruals and taxes receivable and payable | 3,955 | (1,809 | ) | (8,111 | ) | |||||||||||||||||||
Changes in other non-current assets and liabilities | (1,267 | ) | (1,511 | ) | 110 | |||||||||||||||||||
Accounts payable, accrued expenses and income taxes receivable and payable | (3,961 | ) | 3,955 | (1,809 | ) | |||||||||||||||||||
Other non-current assets and liabilities | (2,364 | ) | (2,172 | ) | (1,827 | ) | ||||||||||||||||||
Cash used in operating activities of discontinued operations | — | (132 | ) | (40 | ) | — | — | (132 | ) | |||||||||||||||
|
|
| ||||||||||||||||||||||
Cash provided by (used in) operating activities | (4,738 | ) | (25,786 | ) | 51,931 | 45,173 | (4,738 | ) | (25,786 | ) | ||||||||||||||
Cash flows from investing activities: | ||||||||||||||||||||||||
Acquisition of Excel | — | — | (368,711 | ) | ||||||||||||||||||||
Cash received in acquisition of Excel | — | — | 10,430 | |||||||||||||||||||||
Purchases of property, plant and equipment | (2,659 | ) | (1,321 | ) | (17,951 | ) | (4,217 | ) | (2,659 | ) | (1,321 | ) | ||||||||||||
Proceeds from the sale of auction rate securities | 11,408 | 16,975 | — | — | 11,408 | 16,975 | ||||||||||||||||||
Proceeds from the sale of property, plant and equipment | — | 4,054 | 3,211 | — | — | 4,054 | ||||||||||||||||||
Proceeds from sale of discontinued operations | — | — | 21,593 | |||||||||||||||||||||
|
|
| ||||||||||||||||||||||
Cash provided by (used in) investing activities | 8,749 | 19,708 | (351,428 | ) | ||||||||||||||||||||
Cash (used in) provided by investing activities | (4,217 | ) | 8,749 | 19,708 | ||||||||||||||||||||
Cash flows from financing activities: | ||||||||||||||||||||||||
Proceeds from issuance of debt | — | — | 210,000 | |||||||||||||||||||||
Proceeds from term loan and revolving credit facilities | 73,107 | — | — | |||||||||||||||||||||
Payments for debt issuance costs | (1,565 | ) | — | (6,472 | ) | (2,988 | ) | (1,565 | ) | — | ||||||||||||||
Purchases of the Company’s common shares | — | — | (6,439 | ) | ||||||||||||||||||||
Net proceeds from the issuance of share capital | 64,889 | — | 63 | |||||||||||||||||||||
Repayments of debt | (74,889 | ) | — | — | ||||||||||||||||||||
Excess tax expense of stock options | — | — | (219 | ) | ||||||||||||||||||||
Proceeds from Rights Offering | — | 64,889 | — | |||||||||||||||||||||
Repayments of long-term debt and revolving credit facility | (113,214 | ) | (74,889 | ) | — | |||||||||||||||||||
|
|
| ||||||||||||||||||||||
Cash provided by (used in) financing activities | (11,565 | ) | — | 196,933 | ||||||||||||||||||||
Cash used in financing activities | (43,095 | ) | (11,565 | ) | — | |||||||||||||||||||
Effect of exchange rates on cash and cash equivalents | 1,007 | 405 | (822 | ) | 193 | 1,007 | 405 | |||||||||||||||||
|
|
| ||||||||||||||||||||||
Decrease in cash and cash equivalents | (6,547 | ) | (5,673 | ) | (103,386 | ) | (1,946 | ) | (6,547 | ) | (5,673 | ) | ||||||||||||
Cash and cash equivalents, beginning of period | 63,328 | 69,001 | 172,387 | |||||||||||||||||||||
Cash and cash equivalents, beginning of year | 56,781 | 63,328 | 69,001 | |||||||||||||||||||||
|
|
| ||||||||||||||||||||||
Cash and cash equivalents, end of period | $ | 56,781 | $ | 63,328 | $ | 69,001 | ||||||||||||||||||
Cash and cash equivalents, end of year | $ | 54,835 | $ | 56,781 | $ | 63,328 | ||||||||||||||||||
|
|
| ||||||||||||||||||||||
Supplemental disclosure of cash flow information: | ||||||||||||||||||||||||
Cash paid for interest expense | 25,899 | 22,779 | 156 | |||||||||||||||||||||
Cash paid for interest | $ | 12,464 | $ | 25,899 | $ | 22,779 | ||||||||||||||||||
Cash paid for income taxes | 2,145 | 954 | 1,345 | 1,912 | 2,145 | 954 | ||||||||||||||||||
Income tax refunds received | 2,053 | 10,456 | 1,961 | 25 | 2,053 | 10,456 | ||||||||||||||||||
Cash paid for reorganization items | 26,686 | 679 | — | — | 26,686 | 679 | ||||||||||||||||||
Supplemental disclosure of non cash financing activity: | ||||||||||||||||||||||||
Issuance of warrants | — | — | 26,302 | |||||||||||||||||||||
Issuance of common shares for conversion of debt | 28,071 | — | — | |||||||||||||||||||||
Exchange of debt for common shares | — | 28,071 | — | |||||||||||||||||||||
Issuance of PIK notes | 532 | 535 | — | |||||||||||||||||||||
Assets acquired under capital lease obligations | 2,214 | — | — | |||||||||||||||||||||
Supplemental disclosure of non cash investing activity: | ||||||||||||||||||||||||
Auction rate securities | — | 773 | 80 | — | — | 773 | ||||||||||||||||||
Accrual for capital expenditures | 362 | — | — | |||||||||||||||||||||
The accompanying notes are an integral part of these consolidated financial statements.
NOTES TO CONSOLIDATED FINANCIAL STATEMENTS
As of December 31, 20102011
1. Organization Presentation and Significant EventsPresentation
GSI Group Inc. (“GSIG”) and its subsidiaries (collectively “the Company”referred to as the “Company”) designs, develops, manufacturesdesign, develop, manufacture and sells photonics-basedsell laser-based solutions (consisting of lasers and laser systemsbased systems), laser scanning devices, and electro-optical components), precision motion devices, associated precision motionand optical control technologies. Our technology and systems. Its customers incorporate its technologyis incorporated into theircustomer products or manufacturing processes for a wide range of applications in a variety of markets, including: industrial, scientific, electronics, semiconductor,industrial, medical, and aerospace. The Company operatesscientific. Our products enable customers to make advances in three segments: Precision Technology, Semiconductor Systemsmaterials and Excel. The Company’s principal markets are in North America, Europeprocessing technology and Asia-Pacific. The Company exists under the laws of New Brunswick, Canada.
Acquisition of Excel Technology, Inc.
In August 2008, the Company acquired Excel Technology, Inc. (“Excel”), a designer, manufacturer and marketer of photonics-based solutions consisting of lasers, laser-based systems, precision motion devices and electro-optical components, primarily for industrial and scientific applications. Excel manufactures its products in plants located in the United States and Germany, and sells its products to customers worldwide, both directly and indirectly through resellers and distributors. Following the acquisition of Excel, the Company established a third reportable segment comprised solely of the operations of the newly acquired entity. See Note 4 to Consolidated Financial Statements for further details regarding the Excel transaction.
Divestiture of U.S. General Optics Business
On October 8, 2008, the Company completed the sale of its General Optics business (the “U.S. Optics Business”). The sale of the U.S. Optics Business is reported as Gain on Disposal of Discontinued Operations in the Company’s consolidated statement of operations for the year ended December 31, 2008. This business was part of the Company’s Precision Technology segment. The results of operations of the U.S. Optics Business have been reclassified and reported as income from discontinued operations in the Company’s consolidated statements of operations. See Note 5 to Consolidated Financial Statements for further details regarding the sale of the U.S. Optics Business.
Chapter 11 Bankruptcy Proceedings
On November 20, 2009 (the “Petition Date”), GSIG and two of its United States subsidiaries, GSI Group Corporation (“GSI US”) and MES International, Inc. (“MES” and, collectively with GSIG and GSI US, the “Debtors”), filed voluntary petitions for relief (the “Chapter 11 Petitions”) under Chapter 11 of the United States Bankruptcy Code (the “Bankruptcy Code”) in the United States Bankruptcy Court for the District of Delaware (the “Bankruptcy Court”) (the “Chapter 11 Cases”).
Following the Petition Date, the Debtors continued to operate their business as “debtors-in-possession” under the jurisdiction of the Bankruptcy Court and in accordance with the applicable provisions of the Bankruptcy Code and orders of the Bankruptcy Court. In late December 2009, the United States Trustee overseeing the Chapter 11 Cases appointed an Official Committee of Equity Security Holders (the “Equity Committee”) to represent the interests of the Company’s equity holders.
On May 14, 2010, the Debtors entered into a Restructuring Plan Support Agreement (the “May Plan Support Agreement”) with the Equity Committee, the individual members of the Equity Committee (the “Committee Members”) and eight of ten beneficial holders (the “Consenting Noteholders”) of the $210.0 million of 11% unsecured senior notes due 2013 (the “2008 Senior Notes”). The Consenting Noteholders held 88.1% of the
GSI GROUP INC.
NOTES TO CONSOLIDATED FINANCIAL STATEMENTS—(Continued)
As of December 31, 2010
outstanding principal amount of the 2008 Senior Notes. Pursuant to the May Plan Support Agreement, which superseded the previous plan support agreement, the Equity Committee, the Committee Members and the Consenting Noteholders agreed to support a modified plan, in the form of the Fourth Modified Joint Chapter 11 Plan of Reorganization for the Debtors (the “May Plan”).
On May 24, 2010, the Debtors filed with the Bankruptcy Court a modified joint Chapter 11 plan of reorganization for the Debtors, which was further supplemented on May 27, 2010 to provide for minor modifications to the May Plan (as supplemented, the “Final Chapter 11 Plan”). On May 27, 2010, the Bankruptcy Court entered an order confirming and approving the Final Chapter 11 Plan and the plan documents.
On July 23, 2010 (the “Effective Date”) the Debtors consummated their reorganization through a series of transactions contemplated by the Final Chapter 11 Plan, and the Final Chapter 11 Plan became effective pursuant to its terms. Refer to Note 2 to Consolidated Financial Statements for additional information concerning the Chapter 11 Cases including a description of material agreements the Company entered into on the Effective Date pursuant to the terms of the Final Chapter 11 Plan.meet extremely precise manufacturing specifications.
Listing of Common Shares
Prior to November 4, 2009,On February 9, 2011, the Company’s common shares were tradedapproved for listing on The NASDAQ Global Select Market and began trading on February 14, 2011 under the symbol “GSIG”. From November 5, 2009 through November 19, 2009, the Company’s common shares were quoted on the OTC Markets Group, Inc., under the trading symbol “GSIG”. Following the Company’s filing of the Chapter 11 Petitions on November 20, 2009, its common shares were quoted on the OTC Markets Group, Inc. under the trading symbol “GSIGQ”. Following the Company’s emergence from bankruptcy on July 23, 2010, its common shares were quoted on the OTC Markets Group, Inc. under the trading symbol “LASR.PK”.
Basis of Presentation
These consolidated financial statements have been prepared by the Company in U.S. dollars and in accordance with U.S. generally accepted accounting principles, applied on a consistent basis.
On February 14,December 29, 2010, the Company effected a one-for-three reverse stock split. All share data and per share amounts have been retroactively adjusted for the reverse stock split in the accompanying consolidated financial statements and notes thereto for all periods presented.
Basis of Consolidation
The consolidated financial statements include the accounts of GSI Group Inc. and its wholly owned subsidiaries. The accounts include a 50% owned joint venture, Excel Laser Technology Private Limited (“Excel SouthAsia JV”), since it is a variable interest entity and the Company is the primary beneficiary of the joint venture. The accompanying consolidated financial statements of the Company include the assets, liabilities, revenue, and expenses of Excel SouthAsia JV over which the Company exercises control. The Company records noncontrolling interest in its consolidated statements of operations for the ownership interest of the minority owners of Excel SouthAsia JV. Financial information related to the joint venture is not considered material to the consolidated financial statements. Intercompany accounts and transactions have been eliminated. The Company accounts for investments in businesses in which it owns between 20% and 50% using the equity method.
Reclassifications
The Company realigned the structure of its internal organization during the three months ended April 1, 2011 in a manner that caused the Company���s common shares began trading oncomposition of its reportable segments to change to the following three segments: Laser Products, Precision Motion and Technologies and Semiconductor Systems. The NASDAQ Global Select Market underCompany’s reportable segment financial information has been reclassified to reflect the trading symbol “GSIG”.updated reportable segment structure for all periods presented. See Notes 5 and 13 to Consolidated Financial Statements for further information the Company’s reportable segments. In addition, certain immaterial reclassifications have been made to prior periods to conform to current period presentation.
GSI GROUP INC.
NOTES TO CONSOLIDATED FINANCIAL STATEMENTS—(Continued)
As of December 31, 2011
2. Bankruptcy Disclosures
As discussed in Note 1 to Consolidated Financial Statements, GSIGOn November 20, 2009, GSI Group, Inc. and two of its United States subsidiaries filed voluntary petitions for relief under Chapter 11 of the Bankruptcy Code.Code (the “Chapter 11 Cases”). On May 27, 2010, the Bankruptcy Court entered an order confirming and approving the Finalplan of reorganization (the “Final Chapter 11 Plan for the Debtors and the Final Chapter 11 Plan became effective and thePlan”). The transactions contemplated under the Final Chapter 11 Plan were consummated on July 23, 2010. Presented below is information concerning liabilities subject to compromise under the FinalThe Chapter 11 Plan, pre-petitionCases were closed on September 2, 2011, and post-emergence professional fees and reorganization items.the Company no longer has any legal or material financial constraint relating to those cases.
Upon the Company’s emergence from bankruptcy on July 23, 2010 (the “Effective Date”), the Company was not required to apply fresh-start accounting under Accounting Standards Codification (“ASC”) 852, “Reorganizations” (“ASC 852”). From the Company’s bankruptcy filing on November 20, 2009 through the date of emergence, the Company prepared the consolidated financial statements in accordance with ASC 852 and on a going-concern basis, which assumed continuity of operations, realization of assets and satisfaction of liabilities in the ordinary course of business.
ASC 852 requires that the financial statements for periods subsequent to a Chapter 11 filing separate transactions and events that are directly associated with the reorganization from the ongoing operations of the business. Accordingly, all transactions (including, but not limited to, all professional fees, realized gains and losses and provisions for losses) directly associated with the reorganization and restructuring of the businesses are reported separately in the financial statements. All such costs are reported in reorganization items in the accompanying consolidated statements of operations for the years-endedyears ended December 31, 2010 and 2009.
GSI GROUP INC.
NOTES TO CONSOLIDATED FINANCIAL STATEMENTS—(Continued)
As of December 31, 2010
SummaryBasis of EmergenceConsolidation
On July 23, 2010,The consolidated financial statements include the accounts of GSI Group Inc. and its wholly owned subsidiaries. The accounts include a 50% owned joint venture, Excel Laser Technology Private Limited (“Excel SouthAsia JV”), since it is a variable interest entity and the Company successfully emerged from bankruptcy as a reorganized company pursuant tois the Final Chapter 11 Plan after voluntarily filing for bankruptcy on November 20, 2009.primary beneficiary of the joint venture. The Final Chapter 11 Plan deleveraged the Company’s balance sheet by reducing debt and increasing stockholders’ equity. Theaccompanying consolidated financial restructuring was accomplished through a debt-for-equity exchange and by using the proceeds from a shareholder rights offering and cash on hand to reduce outstanding indebtedness.
Upon the Company’s emergence from Chapter 11 bankruptcy proceedings on July 23, 2010,statements of the Company was not required to apply fresh-start accounting based oninclude the provisionsassets, liabilities, revenue, and expenses of ASC 852 due to the fact that the pre-petition holders of the Company’s outstanding common shares immediately before confirmation of the Final Chapter 11 Plan received more than 50% of the Company’s outstanding common shares upon emergence. Accordingly, a new reporting entity was not created for accounting purposes.
Below is a summary of the significant transactions affecting the Company’s capital structure as a result of the effectiveness of the Final Chapter 11 Plan.
Equity Transactions
On the Effective Date, the Company issued an aggregate of 33,334,060 post-emergence new common shares (“New Common Shares”) pursuant to the Final Chapter 11 Plan. Consistent with the Confirmation Order and applicable law, the Company relied on Section 1145(a)(1) of the Bankruptcy Code to exempt from the registration requirements of the Securities Act of 1933, as amended (the “Securities Act”), the issuance of such New Common Shares. The New Common Shares were issued as a result of the following transactions:
Rights offering:The Company conducted a rights offering (the “Rights Offering”) inExcel SouthAsia JV over which the Company offeredexercises control. The Company records noncontrolling interest in its consolidated statements of operations for salethe ownership interest of the minority owners of Excel SouthAsia JV. Financial information related to existing shareholders upthe joint venture is not considered material to a maximum of $85.0 millionthe consolidated financial statements. Intercompany accounts and transactions have been eliminated. The Company accounts for investments in businesses in which it owns between 20% and 50% using the equity method.
Reclassifications
The Company realigned the structure of its common sharesinternal organization during the three months ended April 1, 2011 in a manner that caused the composition of its reportable segments to be issued upon emergence from bankruptcy at a purchase price per share of $5.40 (the “Price Per Share”). As provided in the Final Chapter 11 Plan, the cash proceeds from the rights offering were used to pay down the 2008 Senior Notes. As such, 12,585,356 of the Company’s common shares were subscribed for a total subscription price of $68.0 million. Of the total common shares subscribed for in the rights offering, $64.9 million were subscribed for by payment in cash and $3.1 million were subscribed for by exchange of the 2008 Senior Notes. As a result of the rights offering and the shares issued pursuantchange to the backstop commitment described below,following three segments: Laser Products, Precision Motion and Technologies and Semiconductor Systems. The Company’s reportable segment financial information has been reclassified to reflect the Company’s shareholders prior to the emergence from bankruptcy retained approximately 86.1% of the Company’s capital stock following emergence (subject to the distribution of shares placed in reserve pending resolution of certain litigation matters unrelated to the Chapter 11 Cases). The remaining 13.9% of the Company’s capital stock was issued to the holders of the 2008 Seniorupdated reportable segment structure for all periods presented. See Notes in partial exchange of such notes5 and pursuant to the commitment of certain holders to backstop the Rights Offering.
Backstop commitment: Pursuant to the Final Chapter 11 Plan, and subject to the terms and conditions of a Backstop Commitment Agreement (the “Backstop Agreement”), certain note holders agreed to backstop the entire rights offering. Regardless of the number of shares purchased in the rights offering, the backstop investors agreed to purchase a minimum of $20 million of common shares by exchanging the principal amount of their 2008 Senior Notes for New Common Shares at the Price Per Share. Because the difference between the total amount of the shares offered and the shares subscribed for in the rights offering was less than $20 million, 3,703,704 New Common Shares for a total of the backstop commitment amount of $20 million were issued pursuant to the backstop commitment. In
GSI GROUP INC.
NOTES TO CONSOLIDATED FINANCIAL STATEMENTS—(Continued)
As of December 31, 2010
|
Supplemental equity exchange: Pursuant to and in accordance with the Final Chapter 11 Plan, the holders of the 2008 Senior Notes exchanged an aggregate principal amount of $5.0 million of 2008 Senior Notes for post-emergence New Common Shares at the Price Per Share (the “Supplemental Equity Exchange”). In connection with the Supplemental Equity Exchange, the Company issued 925,926 New Common Shares on the Effective Date on a pro rata basis to the holders of the 2008 Senior Notes.
Existing equity holders: The Company issued 15,125,331 New Common Shares on the Effective Date to holders of the common shares issued and outstanding immediately prior to the Effective Date and to holders of vested share rights.
In addition, on the Effective Date and pursuant to the terms of the Final Chapter 11 Plan, the Company placed 993,743 New Common Shares in a reserve (the “Reserve Shares”) to be held in escrow for the benefit of the holders of Section 510(b) Claims (as defined in the Final Chapter 11 Plan) pending the final disposition of that certain putative shareholder class action entitledWiltold Trzeciakowski, Individually and on behalf of all others similarly situated v. GSI Group Inc., Sergio Edelstein, and Robert Bowen, Case No. 08-cv-12065 (GAO), filed on December 12, 2008, in the United States District Court (see Note 1413 to Consolidated Financial Statements for additional information). On February 22, 2011, the United States District Court entered an order granting final approval of the settlement in the putative shareholder class action. The Company’s contribution to the settlement amount was limited tofurther information the Company’s self-insured retention under its directors and officers liability insurance policy. Accordingly, the 993,743 shares of the Company’s common stock that were placed in a reserve account and held in escrow for the benefit of the holders of Section 510(b) Claims were releasedreportable segments. In addition, certain immaterial reclassifications have been made to the Company’s shareholders entitledprior periods to such shares during the year-ended December 31, 2011.
Furthermore, on and as of the Effective Date, pursuantconform to the Final Chapter 11 Plan and the Confirmation Order, all of the issued and outstanding shares of capital stock of the Company, including all options, calls, rights, participation rights, puts, awards, commitments or any other agreement to acquire shares of capital stock of the Company that existed prior to the Effective Date, were cancelled and in exchange therefore, holders of such interests received distributions pursuant to the terms of the Final Chapter 11 Plan as summarized above.current period presentation.
Additionally, all unvested restricted stock awards and unexercised options to purchase shares of common stock related to the Company’s 2006 Equity Incentive Plan and pre-2006 equity plans that were outstanding on the date of the Company’s emergence from bankruptcy were assumed by the reorganized Company upon emergence, other than those held by the Company’s directors who did not continue as members of the reorganized Company’s Board of Directors following emergence. Such assumed restricted stock awards and options will be honored by the Company as if they had originally been granted for the issuance of the Company’s post-emergence common shares. The Company’s 2006 Equity Incentive Plan and pre-2006 equity plans were cancelled upon the Company’s emergence from bankruptcy.
Lastly, on and as of the Effective Date, the Company’s stock repurchase plan and shareholder rights plan were also cancelled upon the Company’s emergence from bankruptcy.
GSI GROUP INC.
NOTES TO CONSOLIDATED FINANCIAL STATEMENTS—(Continued)
As of December 31, 20102011
Debt Transactions2. Bankruptcy Disclosures
On November 20, 2009, GSI Group, Inc. and two of its United States subsidiaries filed voluntary petitions for relief under Chapter 11 of the Bankruptcy Code (the “Chapter 11 Cases”). On May 27, 2010, the Bankruptcy Court entered an order confirming and approving the plan of reorganization (the “Final Chapter 11 Plan”). The transactions contemplated under the Final Chapter 11 Plan were consummated on July 23, 2010. The Chapter 11 Cases were closed on September 2, 2011, and the Company no longer has any legal or material financial constraint relating to those cases.
Upon the Company’s emergence from bankruptcy the Company consummated a series of transactions that reduced its outstanding debt from $210.0 million under the 2008 Senior Notes to $107.0 million. The Company reduced its debt by making cash payments of $74.9 million and exchanging debt for common shares totaling $28.1 million. The remaining $107.0 million of 2008 Senior Notes were cancelled and replaced by the 12.25% Senior Secured PIK Election Notes due July 23, 2014 (the “New Notes”) issued under that certain indenture (the “New Indenture”), by and among GSI US, as issuer, the Mellon Trust Company, N.A., as trustee (the “Trustee”). Refer to Note 8 of Consolidated Financial Statements for further discussion regarding the $107.0 million of New Notes that were issued upon emergence from bankruptcy.
A summary of the transactions affecting the Company’s debt balances is as follows:
2008 Senior Notes balance prior to emergence from bankruptcy | $ | 210,000 | ||
Repayment of debt with proceeds from Rights Offering | (64,889 | ) | ||
Exchange of debt for New Common Shares pursuant to Rights Offering | (3,071 | ) | ||
Exchange of debt for New Common Shares under the Backstop Agreement | (20,000 | ) | ||
Exchange of debt for New Common Shares under the Supplemental Equity Exchange | (5,000 | ) | ||
Repayment in cash | (10,000 | ) | ||
Exchange of 2008 Senior Notes for New Notes | (107,040 | ) | ||
Gain (loss) on extinguishment | $ | — | ||
The Company’s issuance of the New Notes in exchange for the 2008 Senior Notes is accounted for as an extinguishment of debt as the terms of the New Notes were deemed to be substantially different. As a result, the New Notes were recorded at fair value and were compared to the carrying value of the 2008 Senior Notes as ofon July 23, 2010 to determine the debt extinguishment gain or loss to be recognized. The Company determined that fair value of the New Notes equaled the carrying value of the 2008 Senior Notes and as a result, no gain or loss was recognized. In addition,(the “Effective Date”), the Company capitalized approximately $1.6 million of legal and other third-party fees and will recognize these costs overwas not required to apply fresh-start accounting under Accounting Standards Codification (“ASC”) 852, “Reorganizations” (“ASC 852”). From the four year holding period of the New Notes.
On the Effective Date and in connection with the New Notes, GSI US entered into a Security Agreement (the “Security Agreement”) with the Guarantors, as defined in the New Indenture, and the Trustee, as collateral agent thereunder, pursuant to which GSI US and the Guarantors, as grantors under the Security Agreement, provided for the grant of a first priority perfected security interest in all (except as otherwise provided therein) of the U.S. property and assets of GSI US and each Guarantor to secure GSI US’s obligations under the New Indenture and the New Notes and each Guarantor’s obligations under the New Indenture.
GSI GROUP INC.
NOTES TO CONSOLIDATED FINANCIAL STATEMENTS—(Continued)
As of December 31, 2010
Liabilities Subject to Compromise
Certain pre-petition liabilities and indebtedness were subject to compromise under the Final Chapter 11 Plan and were reported at amounts allowed or expected to be allowed by the Bankruptcy Court. A summary of liabilities subject to compromise reflected in the consolidated balance sheets as of December 31, 2010 and 2009, is shown below:
| As of December 31, | ||||||||
| 2010 | 2009 | |||||||
| (In thousands) | ||||||||
2008 Senior Notes | $ | — | $ | 210,000 | ||||
Accrued interest on 2008 Senior Notes | — | 6,001 | ||||||
Other | — | 4,559 | ||||||
Total | $ | — | $ | 220,560 | ||||
All pre-petition claims were considered liabilities subject to compromise as of December 31, 2009. As discussed above, portions of the 2008 Senior Notes were repaid, exchanged for New Common Shares, and exchanged for the New Notes. Accrued interest on the 2008 Senior Notes was paid upon emergence from bankruptcy. All other liabilities subject to compromise outstanding as of December 31, 2010 have been paid or were reinstated to the appropriate liability classification on the accompanying consolidated balance sheet.
In addition, under the terms of the Final Chapter 11 Plan, the Company is obligated to make additional payments to the holders of 2008 Senior Notes claims in its Chapter 11 Cases if the amount of certain claims under the Final Chapter 11 Plan exceeds $22.5 million. The additional payment, if any, would equal approximately $1.00 for each dollar by which the $22.5 million cap amount is exceeded. Refer to Note 14 to Consolidated Financial Statements for further discussion.
Pre-Petition and Post-Emergence Professional Fees
Pre-petition professional fees represent costs incurred prior to the Company’s bankruptcy filing related to the financial and legal advisors retained by the Company to assist in the analysis of debt restructuring alternatives, as well as costs incurred by the Company related to financial and legal advisors retained by the noteholders pursuant to certain binding agreements between the two parties. Pre-petition professional fees incurred were as follows:
| Year Ended December 31, | ||||||||||||
| 2010 | 2009 | 2008 | ||||||||||
| (In thousands) | ||||||||||||
Professional fees | $ | — | $ | 6,966 | $ | — | ||||||
Total | $ | — | $ | 6,966 | $ | — | ||||||
Post-emergence professional fees represent costs incurred subsequent to bankruptcy emergence for financial and legal advisors to assist with matters in finalizing the bankruptcy process. Post-emergence professional fees incurred were as follows:
| Year Ended December 31, | ||||||||||||
| 2010 | 2009 | 2008 | ||||||||||
| (In thousands) | ||||||||||||
Professional fees | $ | 727 | $ | — | $ | — | ||||||
Total | $ | 727 | $ | — | $ | — | ||||||
GSI GROUP INC.
NOTES TO CONSOLIDATED FINANCIAL STATEMENTS—(Continued)
As of December 31, 2010
Reorganization Items
Reorganization items represent expense or income amounts that were recorded in the consolidated financial statements as a result of the bankruptcy proceedings. Reorganization items were incurred starting with the date of the bankruptcy filing through the date of bankruptcy emergence. Reorganization items were as follows:
| Year Ended December 31, | ||||||||||||
| 2010 | 2009 | 2008 | ||||||||||
| (In thousands) | ||||||||||||
Elimination of debt discount, deferred financing costs and accrued warrant penalty related to the 2008 Senior Notes | $ | — | $ | 22,397 | $ | — | ||||||
Professional fees | 21,425 | 1,209 | — | |||||||||
Other | 4,731 | — | — | |||||||||
Total | $ | 26,156 | $ | 23,606 | $ | — | ||||||
The other amount primarily consists of the $4.2 million backstop commitment fee. Additionally, the other amount includes $0.4 million related to an insurance premium incurred byemergence, the Company with respect to liability insurance coverage forprepared the members of the Company’s pre-emergence Board of Directors.
3. Summary of Significant Accounting Policies
Basis of Presentation
These consolidated financial statements have been prepared by the Company in U.S. dollars and in accordance with U.S. generally accepted accounting principles, appliedASC 852 and on a consistent basis.going-concern basis, which assumed continuity of operations, realization of assets and satisfaction of liabilities in the ordinary course of business.
ASC 852 requires that the financial statements for periods subsequent to a Chapter 11 filing separate transactions and events that are directly associated with the reorganization from the ongoing operations of the business. Accordingly, all transactions (including, but not limited to, all professional fees, realized gains and losses and provisions for losses) directly associated with the reorganization and restructuring of the businesses are reported separately in the financial statements. All such costs are reported in reorganization items in the accompanying consolidated statements of operations for the years ended December 31, 2010 and 2009.
Basis of Consolidation
The consolidated financial statements include the accounts of GSI Group Inc. and its wholly owned subsidiaries. The accounts include a 50% owned joint venture, Excel Laser Technology Private Limited (“Excel SouthAsia JV”), since it is a variable interest entity and the Company is the primary beneficiary of the joint venture. The accompanying consolidated financial statements of the Company include the assets, liabilities, revenue, and expenses of Excel SouthAsia JV over which the Company exercises control. The Company records noncontrolling interest in its consolidated statements of operations for the ownership interest of the minority owners of Excel SouthAsiaJV.SouthAsia JV. Financial information related to the joint venture is not considered material to the consolidated financial statements. Intercompany accounts and transactions have been eliminated. The Company accounts for investments in businesses in which it owns between 20% and 50% using the equity method.
Reclassifications
Certain prior year amounts haveThe Company realigned the structure of its internal organization during the three months ended April 1, 2011 in a manner that caused the composition of its reportable segments to change to the following three segments: Laser Products, Precision Motion and Technologies and Semiconductor Systems. The Company’s reportable segment financial information has been reclassified to reflect the updated reportable segment structure for all periods presented. See Notes 5 and 13 to Consolidated Financial Statements for further information the Company’s reportable segments. In addition, certain immaterial reclassifications have been made to prior periods to conform to the current year presentation in the consolidated financial statements and notes thereto as of and for the year ended December 31, 2010. The Company reclassified: (i) approximately $0.6 million from cost of goods sold to selling, general and administrative expenses for the year ended December 31, 2009 in the accompanying consolidated statement of operations; (ii) approximately $1.1 million from inventories, prepaid expenses and other current assets, and accrued expenses to deferred cost of goods sold as of December 31, 2009 in the accompanying consolidated balance sheet; and (iii) approximately $0.2 million from other accrued expenses to accrued compensation and benefits as of December 31, 2009 in the accompanying consolidated balance sheet. In addition, in 2010, the Company netted its deferred tax assets and deferred tax liabilities by particular tax jurisdiction. As a result, as of December 31, 2009, short-term deferred tax assets and short-term deferred tax liabilities each decreased by $0.8 million and long-term deferred tax assets andperiod presentation.
GSI GROUP INC.
NOTES TO CONSOLIDATED FINANCIAL STATEMENTS—(Continued)
As of December 31, 20102011
long-term deferred tax2. Bankruptcy Disclosures
On November 20, 2009, GSI Group, Inc. and two of its United States subsidiaries filed voluntary petitions for relief under Chapter 11 of the Bankruptcy Code (the “Chapter 11 Cases”). On May 27, 2010, the Bankruptcy Court entered an order confirming and approving the plan of reorganization (the “Final Chapter 11 Plan”). The transactions contemplated under the Final Chapter 11 Plan were consummated on July 23, 2010. The Chapter 11 Cases were closed on September 2, 2011, and the Company no longer has any legal or material financial constraint relating to those cases.
Upon the Company’s emergence from bankruptcy on July 23, 2010 (the “Effective Date”), the Company was not required to apply fresh-start accounting under Accounting Standards Codification (“ASC”) 852, “Reorganizations” (“ASC 852”). From the Company’s bankruptcy filing through the date of emergence, the Company prepared the consolidated financial statements in accordance with ASC 852 and on a going-concern basis, which assumed continuity of operations, realization of assets and satisfaction of liabilities each decreasedin the ordinary course of business.
ASC 852 requires that the financial statements for periods subsequent to a Chapter 11 filing separate transactions and events that are directly associated with the reorganization from the ongoing operations of the business. Accordingly, all transactions (including, but not limited to, all professional fees, realized gains and losses and provisions for losses) directly associated with the reorganization and restructuring of the businesses are reported separately in the financial statements. All such costs are reported in reorganization items in the accompanying consolidated statements of operations for the years ended December 31, 2010 and 2009.
Summary of Emergence
On July 23, 2010, the Company successfully emerged from bankruptcy as a reorganized company pursuant to the Final Chapter 11 Plan after voluntarily filing for bankruptcy on November 20, 2009. The Final Chapter 11 Plan deleveraged the Company’s balance sheet by $21.3reducing debt and increasing stockholders’ equity. The financial restructuring was accomplished through a debt-for-equity exchange and by using the proceeds from a shareholder rights offering and cash on hand to reduce outstanding indebtedness.
Upon the Company’s emergence from Chapter 11 bankruptcy proceedings on July 23, 2010, the Company was not required to apply fresh-start accounting based on the provisions of ASC 852 due to the fact that the pre-petition holders of the Company’s outstanding common shares immediately before confirmation of the Final Chapter 11 Plan received more than 50% of the Company’s outstanding common shares upon emergence. Accordingly, a new reporting entity was not created for accounting purposes.
Below is a summary of the significant transactions affecting the Company’s capital structure as a result of the effectiveness of the Final Chapter 11 Plan.
Equity Transactions
On the Effective Date, the Company issued an aggregate of 33,334,060 post-emergence new common shares (“New Common Shares”) pursuant to the Final Chapter 11 Plan. Consistent with the Confirmation Order and applicable law, the Company relied on Section 1145(a)(1) of the Bankruptcy Code to exempt from the registration requirements of the Securities Act of 1933, as amended (the “Securities Act”), the issuance of such New Common Shares. The New Common Shares were issued as a result of the following transactions:
Rights offering:The Company conducted a rights offering (the “Rights Offering”) in which the Company offered for sale to existing shareholders up to a maximum of $85.0 million of its common
GSI GROUP INC.
NOTES TO CONSOLIDATED FINANCIAL STATEMENTS—(Continued)
As of December 31, 2011
shares to be issued upon emergence from bankruptcy at a purchase price per share of $5.40 (the “Price Per Share”). As provided in the Final Chapter 11 Plan, the cash proceeds from the rights offering were used to pay down the 11% unsecured senior notes due in 2013 (the “2008 Senior Notes”). As such, 12,585,356 of the Company’s common shares were subscribed for a total subscription price of $68.0 million. Of the total common shares subscribed for in the rights offering, $64.9 million were subscribed for by payment in cash and $3.1 million were subscribed for by exchange of the 2008 Senior Notes. As a result of the rights offering and the shares issued pursuant to the backstop commitment described below, the Company’s shareholders prior to the emergence from bankruptcy retained approximately 86.1% of the Company’s capital stock following emergence (subject to the distribution of shares placed in reserve pending resolution of certain litigation matters unrelated to the Chapter 11 Cases). The remaining 13.9% of the Company’s capital stock was issued to the holders of the 2008 Senior Notes in partial exchange of such notes and pursuant to the commitment of certain holders to backstop the Rights Offering. |
Backstop commitment: Pursuant to the Final Chapter 11 Plan, and subject to the terms and conditions of a Backstop Commitment Agreement (the “Backstop Agreement”), certain note holders agreed to backstop the entire rights offering. Regardless of the number of shares purchased in the rights offering, the backstop investors agreed to purchase a minimum of $20.0 million of common shares by exchanging the principal amount of their 2008 Senior Notes for New Common Shares at the Price Per Share. Because the difference between the total amount of the shares offered and the shares subscribed for in the rights offering was less than $20.0 million, 3,703,704 New Common Shares for a total of the backstop commitment amount of $20 million were issued pursuant to the backstop commitment. In addition, the backstop investors who agreed to backstop the rights offering received a cash backstop fee of $4.2 million, which represented 5% of the $85.0 million maximum proceeds from the offering. The backstop fee is reflected in reorganization items in the accompanying consolidated statement of operations for the year ended December 31, 2010.
Supplemental equity exchange: Pursuant to and in accordance with the Final Chapter 11 Plan, the holders of the 2008 Senior Notes exchanged an aggregate principal amount of $5.0 million of 2008 Senior Notes for post-emergence New Common Shares at the Price Per Share (the “Supplemental Equity Exchange”). In connection with the Supplemental Equity Exchange, the Company issued 925,926 New Common Shares on the Effective Date on a pro rata basis to the holders of the 2008 Senior Notes.
Existing equity holders: The Company issued 15,125,331 New Common Shares on the Effective Date to holders of the common shares issued and outstanding immediately prior to the Effective Date and to holders of vested share rights.
In addition, on the Effective Date and pursuant to the terms of the Final Chapter 11 Plan, the Company placed 993,743 New Common Shares in a reserve (the “Reserve Shares”) to be held in escrow for the benefit of the holders of Section 510(b) Claims (as defined in the Final Chapter 11 Plan) pending the final disposition of a putative shareholder class action entitledWiltold Trzeciakowski, Individually and on behalf of all others similarly situated v. GSI Group Inc., Sergio Edelstein, and Robert Bowen, Case No. 08-cv-12065 (GAO), filed on December 12, 2008, in the United States District Court. On February 22, 2011, the United States District Court entered an order granting final approval of the settlement in the putative shareholder class action. The Company’s contribution to the settlement amount was limited to the Company’s self-insured retention under its directors and officers liability insurance policy. Accordingly, the 993,743 shares of the Company’s common stock that were placed in a reserve account and held in escrow for the benefit of the holders of Section 510(b) Claims were released to the Company’s shareholders entitled to such shares during the year ended December 31, 2011.
GSI GROUP INC.
NOTES TO CONSOLIDATED FINANCIAL STATEMENTS—(Continued)
As of December 31, 2011
Furthermore, on and as of the Effective Date, pursuant to the Final Chapter 11 Plan and the Confirmation Order, all of the issued and outstanding shares of capital stock of the Company, including all options, calls, rights, participation rights, puts, awards, commitments or any other agreement to acquire shares of capital stock of the Company that existed prior to the Effective Date, were cancelled and in exchange therefore, holders of such interests received distributions pursuant to the terms of the Final Chapter 11 Plan as summarized above.
Additionally, all unvested restricted stock awards and unexercised options to purchase shares of common stock related to the Company’s 2006 Equity Incentive Plan and pre-2006 equity plans that were outstanding on the date of the Company’s emergence from bankruptcy were assumed by the reorganized Company upon emergence, other than those held by the Company’s directors who did not continue as members of the reorganized Company’s Board of Directors following emergence. Such assumed restricted stock awards and options were honored by the Company as if they had originally been granted for the issuance of the Company’s post-emergence common shares. The Company’s 2006 Equity Incentive Plan and pre-2006 equity plans were cancelled upon the Company’s emergence from bankruptcy.
Lastly, on and as of the Effective Date, the Company’s stock repurchase plan and shareholder rights plan were also cancelled upon the Company’s emergence from bankruptcy.
Debt Transactions
Upon the Company’s emergence from bankruptcy, the Company consummated a series of transactions that reduced its outstanding debt from $210.0 million under the 2008 Senior Notes to $107.0 million. The reclassifications described in (i) through (iii)Company reduced its debt by making cash payments of $74.9 million and exchanging debt for common shares totaling $28.1 million. The remaining $107.0 million of 2008 Senior Notes were cancelled and replaced by the 12.25% Senior Secured PIK Election Notes due July 23, 2014 (the “2014 Notes”) issued under an indenture by and among GSI Group Corporation (“GSI US”), as issuer, and the reclassificationMellon Trust Company, N.A., as Trustee.
A summary of deferred tax assetsthe transactions affecting the Company’s debt balances is as follows (in thousands):
2008 Senior Notes balance prior to emergence from bankruptcy | $ | 210,000 | ||
Repayment of debt with proceeds from Rights Offering | (64,889 | ) | ||
Exchange of debt for New Common Shares pursuant to Rights Offering | (3,071 | ) | ||
Exchange of debt for New Common Shares under the Backstop Agreement | (20,000 | ) | ||
Exchange of debt for New Common Shares under the Supplemental Equity Exchange | (5,000 | ) | ||
Repayment in cash | (10,000 | ) | ||
Exchange of 2008 Senior Notes for 2014 Notes | (107,040 | ) | ||
|
| |||
Gain (loss) on extinguishment | $ | — | ||
|
|
The Company’s issuance of the 2014 Notes in exchange for the 2008 Senior Notes is accounted for as an extinguishment of debt as the terms of the 2014 Notes were deemed to be substantially different. As a result, the 2014 Notes were recorded at fair value and deferred taxwere compared to the carrying value of the 2008 Senior Notes as of July 23, 2010 to determine the debt extinguishment gain or loss to be recognized. The Company determined that fair value of the 2014 Notes equaled the carrying value of the 2008 Senior Notes and as a result, no gain or loss was recognized. In addition, the Company capitalized approximately $1.6 million of legal and other third-party fees. Refer to Note 7 to Consolidated Financial Statements for further discussion regarding the 2014 Notes.
GSI GROUP INC.
NOTES TO CONSOLIDATED FINANCIAL STATEMENTS—(Continued)
As of December 31, 2011
Pre-Petition and Post-Emergence Professional Fees
Pre-petition professional fees represent costs incurred prior to the Company’s bankruptcy filing related to the financial and legal advisors retained by the Company to assist in the analysis of debt restructuring alternatives, as well as costs incurred by the Company related to financial and legal advisors retained by the holders of our 2008 Senior Notes pursuant to certain binding agreements between the two parties. The total pre-petition professional fees incurred were $7.0 million in 2009, with no comparable amounts in 2010 or 2011.
Post-emergence professional fees represent costs incurred subsequent to bankruptcy emergence for financial and legal advisors to assist with matters in finalizing the bankruptcy process. Post-emergence professional fees totaled $0.3 million and $0.7 million during 2011 and 2010, respectively, with no comparable amounts during 2009.
Reorganization Items
Reorganization items represent amounts that were recorded in the consolidated financial statements as a result of the bankruptcy proceedings. Reorganization items were incurred starting with the date of the bankruptcy filing. Reorganization items totaled $26.2 million and $23.6 million during 2010 and 2009, respectively, with no comparable amounts during 2011.
3. Summary of Significant Accounting Policies
Foreign Currency Translation
The financial statements of the Company and its subsidiaries outside the United States have been translated into United States dollars in accordance with ASC 830, “Foreign Currency Matters”. Assets and liabilities had noof foreign operations are translated from foreign currencies into United States dollars at the exchange rates in effect on the Company’s previouslybalance sheet date. Sales and expenses are translated at the average exchange rate in effect for the period. Accordingly, gains and losses resulting from translating foreign currency financial statements are reported resultsas a separate component of operationsother comprehensive income (loss) in stockholders’ equity. Foreign currency transaction gains and cash flows, but decreased total assets and total liabilities by $22.0 million.losses, primarily from transactions denominated in currencies other than the functional currency, are included in the accompanying consolidated statements of operations.
Use of Estimates
The preparation of financial statements in conformity with generally accepted accounting principles requires management to make estimates and assumptions that affect the reported amounts of assets and liabilities, and disclosure of contingent assets and liabilities at the dates of the financial statements, and the reported amounts of sales and expenses during the reporting periods. On an ongoing basis, theThe Company evaluates its estimates based on historical experience, current conditions and various other assumptions that it believes are reasonable under the circumstances. Estimates and judgments, including those relatedassumptions are reviewed on an on-going basis and the effects of revisions are reflected in the period in which they are deemed to revenue recognition; fair value measurements; allowance for doubtful accounts; inventory costing and reserves; the assessment of warranty reserves; the valuation of goodwill, intangible assets and other long-lived assets; accounting for business combinations; employee benefit plans; accounting for restructuring activities; accounting for income taxes and related valuation allowances; and, accounting for loss contingencies.be necessary. Actual results could differ significantly from those estimates.
Cash and Cash Equivalents
Cash equivalents, consist principally ofprimarily money market funds invested in U.S. Treasury Securities and repurchase agreements of U.S. Treasury Securities that haveaccounts, are highly liquid investments with original maturities of 90 daysthree months or less. The Company does not believe it is exposed to any significant credit risk related to its cash equivalents.These investments are carried at cost, which approximates fair value.
GSI GROUP INC.
Financial Instruments and Fair Value MeasurementsNOTES TO CONSOLIDATED FINANCIAL STATEMENTS—(Continued)
Financial instruments with remaining maturities within one year from the balance sheet date are classified as current. Financial instruments with remaining maturities more than one year from the balance sheet date are classified as long-term.
Long-Term Investments
As of December 31, 2011
Long-Term Investments
At December 31, 2011 and 2010, the Company had liquidated allhas a 25.1% equity investment in a privately held company located in the United Kingdom. The Company uses the equity method to record the results of its previously held auction rate securities. Asthis entity. The Company recognized investment income of December 31, 2009, the Company held auction rate securities, recorded at a fair value of $11.3$1.2 million, $0.8 million and with a par value$0.5 million during 2011, 2010 and 2009, respectively, which is included in other income (expense), net in the accompanying consolidated statements of $13.0 million. These auction rate notes were student loans backed by the federal governmentoperations. The Company’s net investment balance was $3.3 million and were privately insured. From January 1, 2009 through December 31, 2009, the Company recorded $0.8$2.2 million of other comprehensive income attributable to the change in unrealized gains relating to assets still held at December 31, 2009. There was no comparable amount2011 and 2010, respectively, and is included in 2010.other assets in the accompanying consolidated balance sheets.
During the year ended December 31, 2010, the Company sold its remaining $13.0 million in par value of its auction rate securities valued at $10.4 million for $11.4 million in proceeds, which resulted in the recognition of realized gains of $1.0 million related to the sale of these securities. During the year ended December 31, 2009, the Company sold $19.3 million in par value of its auction rate securities valued at $14.6 million for $17.0 million in proceeds, which resulted in the recognition of realized gains of $2.4 million. The Company had no sales of auction rate securities in 2008. The gains realized upon the sale of the auction rate securities are recorded in other income (expense), net in the accompanying consolidated statements of operations for the years ended December 31, 2010 and 2009. No losses were realized upon the sale of any auction rate securities during the years ended December 31, 2010 or December 31, 2009. The Company determinesdetermined the cost of a securitythe securities sold and
GSI GROUP INC.
NOTES TO CONSOLIDATED FINANCIAL STATEMENTS—(Continued)
As of December 31, 2010
the amount to beamounts reclassified out of accumulated other comprehensive income (loss) into earnings based on the specific identification method. During the years ended December 31, 2010 and 2009, the Company reclassified $0.6 million and $0.8 million, respectively, out of accumulated other comprehensive income (loss) into earnings related to the sale of the Company’s auction rate securities.
At December 31, 2010 and 2009, the Company had a 25.1% equity investment in a privately held company located in the United Kingdom, valued at $2.2 million and $1.4 million at December 31, 2010 and 2009, respectively, and included in other assets in the accompanying consolidated balance sheets. The Company uses the equity method to record the results of this entity. In relation to this investment, the Company recognized income of $0.8 million, $0.5 million and $0.2 million in 2010, 2009 and 2008, respectively, which are included in other income (expense), net in the accompanying consolidated statements of operations.
Fair Value Measurements
On January 1, 2008, the Company adopted ASC 820, “Fair Value Measurements and Disclosures” with no impact to its consolidated results and financial position. ASC 820 defines fair value, establishes a framework for measuring fair value, and enhances disclosures about fair value measurements. Fair value is defined as the price that would be received for an asset, or paid to transfer a liability, in an orderly transaction between market participants at the measurement date. Valuation techniques must maximize the use of observable inputs and minimize the use of unobservable inputs.
ASC 820 establishes a value hierarchy based on three levels of inputs, of which the first two are considered observable and the third is considered unobservable:
Level 1: Quoted prices for identical assets or liabilities in active markets which the Company can access.
Level 2: Observable inputs other than those described in Level 1.
Level 3: Unobservable inputs.
On January 1, 2009, the Company implemented the guidance in ASC 820 related to all nonrecurring fair value measurements of nonfinancial assets and nonfinancial liabilities. During the years ended December 31, 2010 and 2009, the Company conducted nonrecurring fair value measurements for the annual and interim impairment tests for goodwill and indefinite-lived intangible assets.
The following table summarizes the Company’s assets and liabilities, as of December 31, 2010, that are measured at fair value on a recurring basis (in thousands):
| December 31, 2010 | Quoted Prices in Active Markets for Identical Assets (Level 1) | Significant Other Observable Inputs (Level 2) | Significant Other Unobservable Inputs (Level 3) | |||||||||||||
Cash equivalents(1) | $ | 7,808 | $ | 7,808 | $ | — | $ | — | ||||||||
Total | $ | 7,808 | $ | 7,808 | $ | — | $ | — | ||||||||
GSI GROUP INC.
NOTES TO CONSOLIDATED FINANCIAL STATEMENTS—(Continued)
As of December 31, 2010
The following table summarizes the Company’s assets and liabilities, as of December 31, 2009, that are measured at fair value on a recurring basis (in thousands):
| December 31, 2009 | Quoted Prices in Active Markets for Identical Assets (Level 1) | Significant Other Observable Inputs (Level 2) | Significant Other Unobservable Inputs (Level 3) | |||||||||||||
Cash equivalents(1) | $ | 12,863 | $ | 12,863 | $ | — | $ | — | ||||||||
Auction rate securities(2) | 11,272 | — | — | 11,272 | ||||||||||||
Total | $ | 24,135 | $ | 12,863 | $ | — | $ | 11,272 | ||||||||
The following table summarizes the activity during the years ended December 31, 2010 and 2009 with respect to the auction rate securities, where fair value is determined by Level 3 inputs (in thousands):
Balance at December 31, 2008 | $ | 25,065 | ||
Sales | (16,973 | ) | ||
Gross realized gains, included in other income (expense), net | 2,407 | |||
Gross unrealized gains included in other comprehensive income (loss) | 1,608 | |||
Reclassifications out of accumulated other comprehensive income (loss) | (835 | ) | ||
Balance at December 31, 2009 | 11,272 | |||
Sales | (11,408 | ) | ||
Gross realized gains, included in other income (expense), net | 988 | |||
Reclassifications out of accumulated other comprehensive income (loss) | (852 | ) | ||
Balance at December 31, 2010 | $ | — | ||
The most recent annual goodwill and indefinite-lived intangible asset impairment test was performed as of the beginning of the second quarter of 2010 noting no impairment. As a result of the impairment review of goodwill and intangible assets conducted due to the Company’s filing for Chapter 11 bankruptcy protection, the Company identified certain assets as impaired and as of December 31, 2009 has classified these assets as measured at fair value on a nonrecurring basis as follows (in thousands):
| December 31, 2009 | Quoted Prices in Active Markets for Identical Assets (Level 1) | Significant Other Observable Inputs (Level 2) | Significant Other Unobservable Inputs (Level 3) | Total Gains (Losses) | ||||||||||||||||
Goodwill(1) | $ | — | $ | — | $ | — | $ | — | $ | (485 | ) | |||||||||
Intangible assets(2) | — | — | — | — | (560 | ) | ||||||||||||||
Total | $ | — | $ | — | $ | — | $ | — | $ | (1,045 | ) | |||||||||
The fair values reflected above represents only those assets for which an impairment loss was recognized during the year ended December 31, 2009. The goodwill and intangible assets have been classified as Level 3.
GSI GROUP INC.
NOTES TO CONSOLIDATED FINANCIAL STATEMENTS—(Continued)
As of December 31, 2010
The goodwill was initially valued based on the excess of the purchase price of the associated business combination over the fair value of the acquired tangible and intangible net assets and the intangible assets were initially valued at fair value. When identified as impaired, the goodwill and intangible assets were revalued at estimated fair value, which was zero as of December 31, 2009. The Company used unobservable inputs such as the estimated future cash flows associated to the reporting unit and respective intangible asset to determine the associated fair value.
See Note 8 to Consolidated Financial Statements for discussion of the estimated fair value of the Company’s debt. See Note 11 to Consolidated Financial Statements for discussion of the estimated fair value of the Company’s pension plan assets.
Accounts Receivable and Allowance for Doubtful Accounts
Trade accounts receivable are recorded at the invoiced amount. The Company generally does not require collateral for trade accounts receivable. The Company maintains an allowance for doubtful accounts. The allowance for doubtful accounts is based on the Company’s best estimate of the amount of probable credit losses resulting from the inability of the Company’s customers to make required payments. The Company determines the allowance based on a variety of factors including the age of amounts outstanding relative to their contractual due date, specific customer factors, and other known risks and economic trends in industries.trends. Charges booked to the allowance for doubtful accounts are recorded as selling, general and administrative expenses, and are recorded in the period that theythe outstanding receivables are determined to be uncollectible. Account balances are charged off against the allowance when the Company believes it is probable the receivable will not be recovered.
For the years ended December 31, 2011, 2010 2009 and 2008,2009, the allowance for doubtful accounts was as follows:
| Year Ended December 31, | ||||||||||||
| 2010 | 2009 | 2008 | ||||||||||
| (In thousands) | ||||||||||||
Balance at beginning of period | $ | 1,776 | $ | 1,687 | $ | 374 | ||||||
Assumed in Excel acquisition | — | — | 1,221 | |||||||||
(Benefit) increase charged to selling, general and administrative expense | (469 | ) | 561 | 297 | ||||||||
Write-offs, net of recoveries of amounts previously reserved | (504 | ) | (498 | ) | (131 | ) | ||||||
Exchange rate changes | (107 | ) | 26 | (74 | ) | |||||||
Balance at end of period | $ | 696 | $ | 1,776 | $ | 1,687 | ||||||
| 2011 | 2010 | 2009 | ||||||||||
| (In thousands) | ||||||||||||
Balance at beginning of year | $ | 696 | $ | 1,776 | $ | 1,687 | ||||||
Provision (benefit) charged to selling, general and administrative expense | 20 | (469 | ) | 561 | ||||||||
Write-offs, net of recoveries of amounts previously reserved | (160 | ) | (504 | ) | (498 | ) | ||||||
Exchange rate changes | 1 | (107 | ) | 26 | ||||||||
|
|
|
|
|
| |||||||
Balance at end of year | $ | 557 | $ | 696 | $ | 1,776 | ||||||
|
|
|
|
|
| |||||||
GSI GROUP INC.
NOTES TO CONSOLIDATED FINANCIAL STATEMENTS—(Continued)
As of December 31, 2011
Inventories
Inventories, which include materials and conversion costs, are stated at the lower of cost or market, using the first-in, first-out method. Market is defined as replacement cost for raw materials and net realizable value for other inventories. Demo inventory is recorded at the lower of cost or its net realizable value. Inventories reflect appropriate reservesThe Company periodically reviews quantities of inventories on hand and compares these amounts to the expected use of each product. The Company records a charge to cost of goods sold for potential obsolete, slow moving or otherwise impaired material.the amount required to reduce the carrying value of inventory to net realizable value. Costs associated with the procurement of inventories such as inbound freight charges, purchasing and receiving costs are capitalized in inventory on the balance sheet.
Property, Plant and Equipment
Property, plant and equipment are statedrecorded at cost, adjusted for any impairment, less accumulated depreciation. The Company uses the straight-line method to calculate the depreciation of its fixed assets over
GSI GROUP INC.
NOTES TO CONSOLIDATED FINANCIAL STATEMENTS—(Continued)
As of December 31, 2010
their estimated useful lives. Estimated useful lives for buildings and improvements range from 3 to 6030 years and for machinery and equipment from 1 to 13 years. Leasehold improvements are amortized over the lesser of their useful lives or lease terms, including any renewal period options that are expected to bereasonably assured of being exercised. Repairs and maintenance are expensed as incurred.
The Company undertakes a review Lease arrangements meeting the criteria of its property, plant and equipment carrying values whenever events or circumstances indicate that the carrying amounts may not be recoverable. The Company reliesASC 840-30 “Leases – Capital Leases” are capitalized based on the guidance included in ASC 360-10-35-15, “Impairment or Disposalpresent value of Long-Lived Assets” when conducting these reviews.
As a resultfuture lease payments and generally depreciated over the term of the severity of the global economic downturn in 2008, notably during the fourth quarter, which negatively impacted the Company’s revenue and cash flow forecasts, the Company conducted an impairment review of its property, plant and equipment as of December 31, 2008. Impairment was measured as the difference between estimated fair value and carrying value for property, plant and equipment whose carrying value was not deemed recoverable. For personal property (machinery and equipment, furniture and fixtures, computers, software, and automobiles), the Company estimated the fair value of the assets using either a sales comparison or a replacement cost approach. The sales comparison approach utilized input from used equipment vendors and auction sites to estimate fair value. The replacement cost approach started with an estimate of the cost to replace a given asset at current prices and converted it to a fair value estimate. Fair value estimates reflected the physical deterioration, utilization rates and estimated remaining economic lives of the underlying assets. For real property, the Company engaged real estate professionals to help estimate fair value. A combination of the assumed sale of owned real estate and its value under a sale-and-leaseback arrangement were options considered in assessing the fair value of real property. When utilizing the sales of owned real estate, fair value was derived from recent transactions of comparable properties or the asking prices of competing properties on the market. The fair value of leasehold improvements was based on estimated changes in construction costs in the relevant market.
Property, plant and equipment impairment charges totaling $5.4 million were recorded in 2008, of which approximately $2.7 million pertained to assets in the Precision Technology segment, approximately $2.1 million pertained to assets in the Excel segment, and approximately $0.7 million related to corporate assets. No impairment charges related to property, plant and equipment were recorded in 2010 or 2009.lease.
Business Combinations
For business combinations consummated prior to January 1, 2009, the Company determined and allocated the purchase price of an acquired company to the tangible and intangible assets acquired and liabilities assumed as well as to in-process research and development as of the business combination date in accordance with Statement of Financing Accounting Standards (“SFAS”) No. 141, “Business Combinations.” The purchase price allocation process requires the Company to use significant estimates and assumptions, including fair value estimates, as of the business combination date including:
estimated fair values of intangible assets;
expected costs to complete any in-process research and development projects;
estimated income tax assets and liabilities assumed from the acquiree; and
estimated fair value of pre-acquisition contingencies assumed from the acquiree.
While the Company uses its best estimates and assumptions as a part of the purchase price allocation process to accurately value assets acquired and liabilities assumed at the business combination date, its estimates
GSI GROUP INC.
NOTES TO CONSOLIDATED FINANCIAL STATEMENTS—(Continued)
As of December 31, 2010
and assumptions are inherently uncertain and subject to refinement. As a result, during the purchase price allocation period, the Company has recorded adjustments to the assets acquired and liabilities assumed, with a corresponding offset to goodwill. Generally, with the exception of unresolved income tax matters, any adjustment to assets acquired or liabilities assumed subsequent to the purchase price allocation period is included in operating results in the period in which the adjustment is determined.
For business combinations consummated prior to January 1, 2009, in-process research and development costs have been expensed when acquired and represent the estimated fair value as of the dates of acquisition of in-process projects acquired that have not yet reached technological feasibility and have no alternative future uses.
Effective January 1, 2009, the Company adopted ASC 805, “Business Combinations”.
Goodwill and Intangible Assets
Goodwill represents the excess of the purchase price in a business combination over the fair value of the acquired net tangible and intangible net assets. In connection with its acquisition of Excel Technologies, Inc. (“Excel”) in 2008, the Company acquired certain trade names that are classified as intangible assets with indefinite lives. Goodwill and indefinite-lived intangibles are not amortized but they are required to be assessed for impairment at least annually to ensure their current fair values exceed their carrying values.
The Company also has certain intangible assets that are amortized over their estimated useful lives. These definite-lived intangible assets were acquired in connection with the Company’s historic business combinations. The Company’s most significant intangible assets are acquired technology, customer relationships, and trademarks and trade names. All definite-lived intangible assets are amortized over the periods in which their economic benefits are expected to be realized. In addition to the Company’s review of the carrying values of intangible assets, theThe Company also reviews the useful life assumptions, including the classification of certain intangible assets as ‘indefinite-lived’, on a periodic basis to determine if changes in circumstances warrant revisions to them.
The Company’s product lines generally correspond with its reporting units which is the level at which the Company evaluates its goodwill, intangible assets and other long-lived assets for impairment. All of the Company’s goodwill and intangible assets reside in the Precision TechnologyMotion and ExcelTechnologies and Laser Products segments.
Impairment Charges
Impairment analyses of goodwill and indefinite-lived intangible assets are conducted in accordance with ASC 350, “Intangibles—Goodwill and Other”. The Company tests its goodwill balances annually as of the beginning of the second quarter or more frequently if indicators are present or changes in circumstances suggest that impairment may exist. In performing the test, the Company utilizes the two-step approach which requires a
GSI GROUP INC.
NOTES TO CONSOLIDATED FINANCIAL STATEMENTS—(Continued)
As of December 31, 2011
comparison of the carrying value of each of the Company’s reporting units to the fair value of these reporting units. If the carrying value of a reporting unit exceeds its fair value, the Company calculates the implied fair value of the reporting unit’s goodwill and compares it to the goodwill’s carrying value. If the carrying value of the goodwill exceeds its implied fair value, an impairment charge is recorded for the difference. The fair value of a reporting unit is based on a discounted cash flow (“DCF”) approach. The DCF approach requires that the Company forecast future cash flows for each of the reporting units and discount the cash flow streams based on a weighted average cost of capital (“WACC”) that is derived, in part, from comparable companies within similar industries. The DCF calculations also
GSI GROUP INC.
NOTES TO CONSOLIDATED FINANCIAL STATEMENTS—(Continued)
As of December 31, 2010
include a terminal value calculation that is based upon an expected long-term growth rate for the applicable reporting unit. The carrying values of each reporting unit include assets and liabilities which relate to the reporting unit’s operations. Additionally, reporting units that benefit from corporate assets or liabilities are allocated a portion of those corporate assets and liabilities on a systematic, proportional basis.
As mentioned above, the Company’s indefinite-lived intangible assets represent trade names that were acquired in the August 2008 Excel acquisition. The Company assesses these indefinite-lived intangible assets for impairment on an annual basis as of the beginning of the second quarter, and more frequently if indicators are present or changes in circumstances suggest that impairment may exist. The Company will also periodically reassess the continuing classification of these indefinite-lived intangible assets’ continuing classification as indefinite-lived. The fair values of the Company’s indefinite-lived intangible assets are determined using the relief from royalty method, based on forecasted revenues. If the fair value of an intangible asset is less than its carrying value, an impairment charge is recorded to reflect the difference between the carrying value and the fair value of the impaired asset.
Intangible assets with definite lives are amortized over their estimated useful lives. The carrying amounts of definite-lived intangible assets and other long-lived assets are reviewed for impairment whenever changes in events or circumstances indicate that their carrying values may not be recoverable. The impairment analyses are conducted in accordance with ASC 360-10-35-15. The recoverability of carrying value is determined by comparison of the reporting unit’s carrying value to its future undiscounted cash flows. When this test indicates the potential for impairment, a fair value assessment is performed.
Once an impairment is determined and measured, an impairment charge is recorded to reflect the difference between the carrying value and the fair value of the impaired asset. In addition to evaluating the impairment of goodwill and intangible assets, the Company also assesses its other long-lived assets for impairment in accordance with the provisions of ASC 360-10-35-15. This process is discussed above under “Property, plant and equipment.”
The most recent annual goodwill and indefinite-lived intangible asset impairment test was performed as of the beginning of the second quarter of 2010, noting no impairment. The Company also undertook an impairment review of goodwill and intangible assets at the end of 2009 due to the filing for voluntary relief under Chapter 11 of the U.S. Bankruptcy Code on November 20, 2009. This review resulted in an impairment charge of approximately $1.0 million to reduce the carrying values of these assets to their fair value. Goodwill and the definite-lived customer relationship intangible asset for the Excel segment were each impaired by approximately $0.5 million. The impairment of the customer relationship intangible asset is reflected as a reduction in its gross carrying amount.
The significant downturn in the global economy experienced in 2008, and most notably in the fourth quarter of 2008, negatively impacted the Company’s estimated future revenues and cash flows. The Company had performed its annual goodwill impairment test in the beginning of the second quarter noting no impairment. However, the downturn in the global economy and its effect on the Company’s business, including its revenues, suggested that an impairment might exist as of December 31, 2008. Consequently, the Company undertook an impairment review of its goodwill, intangible assets and other long-lived assets (property, plant and equipment) at the end of 2008. This review led the Company to record an impairment charge of $215.1 million to reduce the carrying values of these assets to their fair value. Goodwill was impaired by $131.2 million. Intangible assets and property, plant and equipment were impaired by $78.5 million and $5.4 million, respectively. The impairments of intangible assets and property, plant and equipment have been reflected as reductions in their gross carrying amounts.
GSI GROUP INC.
NOTES TO CONSOLIDATED FINANCIAL STATEMENTS—(Continued)
As of December 31, 2010
Revenue Recognition
The Company recognizes revenue when persuasive evidence of an arrangement exists, delivery has occurred, the price is fixed or determinable, risk of loss has passed to the customer and collection of the resulting receivable is reasonably assured. Revenue recognition requires judgment and estimates, which may affect the amount and timing of revenue recognized in any given period.
On January 1, 2011, the Company adopted the provisions of Accounting Standards Update (“ASU”) 2009-13, “Revenue Recognition (Topic 605) – Multiple-Deliverable Revenue Arrangements” (“ASU 2009-13”). ASU 2009-13 addresses the accounting for multiple-element arrangements by providing two significant changes. First, this guidance removes the requirement to have objective and reliable evidence of fair value for undelivered elements in an arrangement and results in more elements being treated as separate units of accounting. Specifically, this guidance amends the criteria in Subtopic 605-25, “Revenue Recognition-Multiple-Element Arrangements” (“ASC 605-25”), for separating consideration in multiple-element arrangements. This guidance establishes a selling price hierarchy for determining the “selling price” of an element, which is based on: (a) vendor-specific objective evidence; (b) third-party evidence; or (c) management’s best estimate. Management’s best estimate for the Company was based on factors such as gross margin, volume discounts, new strategic customers, geography, customer class and competitive pressures. The second change modifies the manner in which the transaction consideration is allocated across the separately identified elements. Entities are no longer able to apply the residual method of allocation. Instead the arrangement consideration is required to be allocated at the inception of the arrangement to all elements using the relative selling price method. The relative selling price method uses the weighted average of the “selling price” and applies that to the contract value to establish the consideration for each element.
For transactions entered into prior to the adoption of ASU 2009-13, the Company follows the provisions of ASC 605-25 “Multiple Element Arrangements” for all multiple elementmultiple-element arrangements. Under ASC 605-25,the guidance prior to ASU 2009-13, the Company assesses whether the deliverableselements specified in a multiple elementmultiple-element arrangement should be treated as separate units of
GSI GROUP INC.
NOTES TO CONSOLIDATED FINANCIAL STATEMENTS—(Continued)
As of December 31, 2011
accounting for revenue recognition purposes and whether objective and reliable evidence of fair value exists for these separate units of accounting. The Company applies the residual method when objective and reliable evidence of fair value exists for all of the undelivered elements in a multiple elementmultiple-element arrangement. When objective and reliable evidence of fair value does not exist for all of the undelivered elements, in a multiple element arrangement, the Company recognizes revenue under the multiple units shipped methodology, whereby revenue is recognized in each period based upon the lowest common percentage of the products shipped in the period. This approximates a proportional performance model of revenue recognition. This generally results in a partial deferral of revenue to a later reporting period. No revenue is recognized unless one or more units of each product hashave been delivered.
AlthoughOn January 1, 2011, the Company adopted the provisions of ASU 2009-14, “Software (Topic 985)—Certain Revenue Arrangements That Include Software Elements” (“ASU 2009-14”). ASU 2009-14 changes revenue recognition for tangible products containing software and hardware elements. Specifically, tangible products containing software and hardware that function together to deliver the tangible products’ essential functionality are scoped out of the existing software revenue recognition guidance and will be accounted for under the multiple-element arrangements revenue recognition guidance under ASU 2009-13. With the adoption of ASU 2009-14, the Company concluded that when there is software included in tangible products, it is essential to the functionality of the tangible product. It is therefore outside the scope of ASC 985-605, “Software Revenue Recognition” (“ASC 985-605”) as amended. Prior to the adoption of ASU 2009-14, although certain of the Company’s products contain operating and application software, the Company hashad determined the software element iswas incidental in accordance with ASC 985-605, “Software Revenue Recognition”.
The Company determines the unit of accounting for certain transactions based on the guidance in ASC 985-605. In particular, multiple purchase orders may be deemed to be interrelated and considered to constitute a multiple element arrangement for accounting purposes.
Semiconductor Systems transactions are generally multiple elementmultiple-element arrangements which may include hardware, software, installation, training, an initial standard warranty, and optional extended warranty arrangements. The Company generally designs, markets and sells these products as standard configurations. For those standard configurations where acceptance criteria, if any, exist and are demonstrated prior to shipment,Typically, revenue is recorded at the time of shipment. For those cases whereshipment or acceptance, criteria cannot be demonstrated prior to shipmentwhich is the same under pre and post-adoption of a product or if a significant amount of fees are due upon acceptance, the Company recognizes revenue upon customer acceptance.ASU 2009-13. Acceptance is generally required for sales of Semiconductor Systems segment products to Japanese customers and sales of “New Products”, which. New Products are considered by the Company, for purposes of revenue recognition determination, to be either (a) a product that is newly released to all customers, including a product which may have been existing previously, but which has been substantially upgraded with respect to its features or functionality; or (b) the sale of an existing product to a customer who has not previously purchased that product. The Company follows a set of predetermined criteria when changing the classification of a New Product to a standard configuration whereby acceptance criteria are considered to be demonstrated at the time of shipment.
The Laser Products and Precision TechnologyMotion and ExcelTechnologies segments have revenue transactions includethat are comprised of both single elementsingle-element and multiple elementmultiple-element transactions. Multiple elementMultiple-element transactions may include two or more products and occasionally also contain installation, training or preventative maintenance plans. RevenueFor multiple-element transactions entered into or materially modified after January 1, 2011, revenue is recognized under ASU 2009-13, generally upon shipment using the relative selling price method. For all other multiple-element transactions, revenue is generally recognized under the multiple units shipped methodology described above.previously. Single-element transactions are generally recognized upon shipment.
The Company’s Semiconductor Systems segment also sells spare parts and consumable items, which are not subject to acceptance criteria. Revenue for these spare parts and consumable itemsFor multiple-element transactions entered into or materially modified after January 1, 2011, revenue is recognized under ASU 2009-13, generally upon shipment using the relative selling price method. For all other multiple-element transactions, revenue is generally recognized under the multiple units shipped methodology described above.previously. Single-element transactions are generally recognized upon shipment.
GSI GROUP INC.
NOTES TO CONSOLIDATED FINANCIAL STATEMENTS—(Continued)
As of December 31, 20102011
Installation is generally a routine process that occurs within a short period of time fromfollowing delivery and the Company has concluded that this obligation is inconsequential and perfunctory. As such, for transactions that include installation, and for which customer acceptance has not been deemed necessary in order to record the revenue, the cost of installation is accrued at the time product revenue is recorded and no related revenue is deferred. Historically, the costs of installation have not been significant.
The Company generally provides warranties for its products. The standard warranty period is typically 12 to 24 months. The initial standard warranty for product sales is accounted for under the provisions of ASC 450, “Contingencies”, as the Company has the ability to ascertain the probable likelihood of the liability, and can estimate the amount of the liability. A provision for the estimated cost related to warranty is recorded to cost of goods sold at the time revenue is recognized. The Company’s estimate of costs to service the warranty obligations are based on historical experience and expectations of future conditions. To the extent the Company experiences increased warranty claims or increased costs associated with servicing those claims, revisions to the estimated warranty liability are recorded as increases or decreases to the accrual at that time, with an offsetting entry recorded to cost of goods sold.time.
The Company also sells optional extended warranty services and preventative maintenance contracts at the time of their product purchase.to customers. The Company accounts for these agreements in accordance with provisions of ASC 605-20-25-3, “Separately Priced Extended Warranty and Product Maintenance Contracts”, under which it recognizes the separately priced extended warranty and preventative maintenance fees over the associated period.
The Company, at the request of its customers, may at times perform professional services for its customers, generally for the maintenance and repairs of products previously sold to those customers. These services are usually in the form of time and materials based contracts which are short in their duration. Revenue for time and material services is recorded at the completion of services requested under a customer’s purchase order. Customers may, at times subsequent to the initial product sale, purchase a service contract whereby services, including preventative maintenance plans, are provided over a defined period, generally one year. Revenue for such service contracts are recorded ratably over the period of the contract.
The Company typically negotiates trade discounts and agreed terms in advance of order acceptance and records any such items as a reduction of revenue. The Company’s revenue recognition policy allows for revenue to be recognized under arrangements where the payment terms are 180 days or less, presuming all other revenue recognition criteria have been met. From time to time, based on the Company’s review of customer creditworthiness and other factors, the Company may provide its customers with payment terms that exceed 180 days. To the extent all other revenue recognition criteria have been met, the Company recognizes revenue for these extended payment arrangements aswhen the payments become due.cash is received.
The Company has significant deferred revenue included in its accompanying consolidated balance sheets, with balances (including both current and long-term amounts) of $15.4$6.1 million and $55.8$15.4 million as of December 31, 2011 and 2010, and 2009, respectively. A significant majority of these amounts relate to arrangements whereby the entire arrangement has been accounted for asThe deferred revenue asbalance is primarily comprised of: (a) pre ASU 2009-13 multiple-element arrangements, delivered over multiple periods, whereby there is no fair value for one or more of the undelivered elements orelement(s); and (b) arrangements where acceptance has not been received. UponThe balance sheet classification of deferred revenue and deferred cost of goods sold is based on the final delivery or acceptance of the undelivered element(s) of the arrangement,Company’s expectations with respect to when the revenue will be recorded for that arrangement. To a much lesser extent, the deferred revenue balances relate to either: (a) the unrecognized portion of a multiple element arrangements that is being recognized, into revenue over a ratable basis as associated services are performed; (b) arrangements not currently recognizable duebased on facts known to the arrangement not being fixedCompany as of the date its financial statements.
The Company has certain pre ASU 2009-13 multiple-element arrangements outstanding, delivered over multiple periods, in which the Company recognized $31.5 million in revenue for the year ended December 31, 2011. Such arrangements will continue to be accounted for under the prior accounting standards until they are completed. As of December 31, 2011 and determinable at its inception; (c)2010, the future amortization to revenue of extended warranty contractsCompany has $0.3 million and preventative maintenance plans; (d) revenue deferrals for product shipments with FOB destination shipping terms; and (e) deposits from$8.9 million, respectively, in
GSI GROUP INC.
NOTES TO CONSOLIDATED FINANCIAL STATEMENTS—(Continued)
As of December 31, 20102011
customers against future orders. The classification of deferred revenue and deferred costrelated to these arrangements. For multiple-element arrangements, delivered over multiple periods, which were entered into after the adoption of goods sold, is based onASU 2009-13, the Company’s expectations relative to whenCompany recognized $45.6 million in revenue for the revenue will be recognizable, based on facts knownyear ended December 31, 2011, with no deferrals related to the Companyadoption of ASU 2009-13 as of the date its financial statements are released.December 31, 2011.
Deferred Cost of Goods Sold
The Company defers the corresponding direct costs associated with the deferred revenue. These deferred costs have been recorded as deferred cost of goods sold in the current and long-term sections of the accompanying consolidated balance sheets as appropriate, and are reflectedrecorded in the consolidated statements of operations as cost of goods sold when the related revenue is expected to be recognized. These costs represent the direct and incremental costs that are attributable to the product whose revenue is being deferred.
Research and Development and Engineering Costs
Internal costs relating to research and development and engineering costs incurred for new products and enhancements to existing products are expensed as incurred.
Product Warranty
The Company generally warrants its products for material and labor to repair and service the product. The Company provides for estimated warranty costs for the products at the time revenue is recognized. Warranty liabilities are based on estimated future repair costs using historical labor and material costs. The standard warranty is generally a period of up to 12 months, with the exception of two product lines, DRC Encoders and JK Lasers, both being product lines that are included in the Precision Technology segment, and which have a warranty period of 24 months. The accounting for warranty provisions is discussed further in the “Revenue Recognition” section of this Note 3.
Share-Based Compensation
The Company has stock-basedrecords the expense associated with share-based compensation plans which are more fully described in Note 10awards to Consolidated Financial Statements. The Company recognizesemployees based on the fair value of all share-based payments to employeesawards as expense.of the grant date. Such expenses are recognized in the consolidated statements of operations ratably over the vesting period of the award, net of estimated forfeitures.
Shipping & Handling Costs
Shipping and handling costs are recorded in cost of goods sold.
Advertising Costs
Advertising costs are expensed to selling, general and administrative expense as incurred. Advertising expenses were $0.6 million $0.6 millionin 2011, 2010 and $0.8 million in 2010, 2009, and 2008, respectively.
Foreign Currency Translation
The financial statements of the Company and its subsidiaries outside the United States have been translated into United States dollars in accordance with ASC 830, “Foreign Currency Matters”. Assets and liabilities of foreign operations are translated from foreign currencies into United States dollars at the exchange rates in effect on the balance sheet date. Sales and expenses are translated at the average exchange rate in effect for the period.
GSI GROUP INC.
NOTES TO CONSOLIDATED FINANCIAL STATEMENTS—(Continued)
As of December 31, 2010
Accordingly, gains and losses resulting from translating foreign currency financial statements are reported as a separate component of other comprehensive income (loss) in stockholders’ equity. Foreign currency transaction gains and losses are included in net income (loss) in the accompanying consolidated statements of operations. These amounts arise primarily from transactions denominated in currencies other than the functional currency.
Restructuring, Restatement Related Costs and Other Charges
In accounting for its restructuring activities, the Company follows the provisions of ASC 420, “Exit or Disposal Cost Obligations”. In accounting for these obligations, theThe Company makes assumptions related to the amounts of employee severance benefits and related costs, and to the time period over which facilities will remain vacant, useful lives and residual value of long-lived assets, sublease terms, sublease rates and discount rates. Estimates and assumptions are based on the best information available at the time the obligation has arisen.is recognized. These estimates are reviewed and revised as facts and circumstances dictate; changes in these estimates could have a material effect on the amount previously expensed against the Company’s earnings, and currently accrued on the Company’s consolidated balance sheet.dictate.
The costs incurred related to third parties, including auditors, attorneys, forensic accountants, and other advisors for services performed in connection with the restatement of the Company’s previously issued financial statements as reported in its Annual Report on Form 10-K for the year-endedyear ended December 31, 2008 and its Quarterly Report on Form 10-Q for the quarter ended September 26, 2008, including the United States Securities and Exchange Commission (“SEC”) investigation and certain shareholder actions, and the internal Foreign Corrupt Practices Act (“FCPA”) investigation have been included within the Company’s restructuring, restatement related costs and other charges in the accompanying consolidated statements of operations.
Accumulated Other Comprehensive Loss
The following table provides the details of accumulated other comprehensive loss:
| December 31, | ||||||||
| 2010 | 2009 | |||||||
| (In thousands) | ||||||||
Foreign currency translation adjustments | $ | 2,568 | $ | 1,867 | ||||
Unrealized gain on investments, net of tax | — | 568 | ||||||
Pension liability, net of tax | (5,997 | ) | (5,865 | ) | ||||
Total accumulated other comprehensive loss | $ | (3,429 | ) | $ | (3,430 | ) | ||
Comprehensive Loss
The components of comprehensive loss are as follows:
| Year Ended December 31, | ||||||||||||
| 2010 | 2009 | 2008 | ||||||||||
| (In thousands) | ||||||||||||
Consolidated net loss | $ | (639 | ) | $ | (71,269 | ) | $ | (203,787 | ) | |||
Foreign currency translation adjustments | 701 | 2,706 | (12,499 | ) | ||||||||
Net unrealized gains and reclassifications of investments, net of tax(1) | (568 | ) | 488 | 80 | ||||||||
Pension liability adjustments, net of tax(2) | (132 | ) | (2,388 | ) | 797 | |||||||
Consolidated comprehensive loss | (638 | ) | (70,463 | ) | (215,409 | ) | ||||||
Less: Comprehensive income attributable to noncontrolling interest | (48 | ) | (61 | ) | (60 | ) | ||||||
Comprehensive loss attributable to GSI Group Inc. | $ | (686 | ) | $ | (70,524 | ) | $ | (215,469 | ) | |||
GSI GROUP INC.
NOTES TO CONSOLIDATED FINANCIAL STATEMENTS—(Continued)
As of December 31, 20102011
Other Comprehensive Income (Loss) and Accumulated Other Comprehensive Income (Loss)
In December 2011, the Company early adopted the provisions of ASU 2011-05, “Presentation of Comprehensive Income” (“ASU 2011-05”). ASU 2011-05 addresses the presentation of comprehensive income (loss) in consolidated financial statements and footnotes. The adoption impacts presentation only and had no effect on the Company’s financial condition, results of operations or cash flows. The Company did not adopt the provisions of the reclassification requirements, which were deferred by ASU 2011-12 “Comprehensive Income: Deferral of the Effective Date for Amendments to the Presentation of Reclassifications of Items Out of Accumulated Other Comprehensive Income in Accounting Standards Update No. 2011-05” in December 2011. The adoption required the Company to present the components of other comprehensive income either in a continuous statement or two separate but consecutive statements. The Company elected to retroactively present two separate statements—the “Consolidated Statements of Operations” and the “Consolidated Statements of Comprehensive Income (Loss)”.
In addition, as permitted by ASU 2011-05, the Company also retroactively adjusted the Consolidated Statements of Stockholders’ Equity to summarize the total net components of other comprehensive income (loss) and included a reconciliation of the changes in accumulated other comprehensive income (loss) as presented below (in thousands):
| Total accumulated other comprehensive income (loss) | Foreign currency translation adjustments | Unrealized gain on investments and reclassifications(1) | Pension liability(2) | |||||||||||||
Balance at December 31, 2008 | $ | (4,236 | ) | $ | (839 | ) | $ | 80 | $ | (3,477 | ) | |||||
Other comprehensive income (loss) | 806 | 2,706 | 488 | (2,388 | ) | |||||||||||
|
|
|
|
|
|
|
| |||||||||
Balance at December 31, 2009 | (3,430 | ) | 1,867 | 568 | (5,865 | ) | ||||||||||
Other comprehensive income (loss) | 1 | 701 | (568 | ) | (132 | ) | ||||||||||
|
|
|
|
|
|
|
| |||||||||
Balance at December 31, 2010 | (3,429 | ) | 2,568 | — | (5,997 | ) | ||||||||||
Other comprehensive income (loss) | (1,595 | ) | 241 | — | (1,836 | ) | ||||||||||
|
|
|
|
|
|
|
| |||||||||
Balance at December 31, 2011 | $ | (5,024 | ) | $ | 2,809 | $ | — | $ | (7,833 | ) | ||||||
|
|
|
|
|
|
|
| |||||||||
| (1) | During the |
| (2) | During the years ended December 31, 2011, 2010 and 2009, the Company reclassified $0.3 million, $0.3 million and $0.2 million, respectively, out of accumulated other comprehensive loss into net income (loss). The tax effects on the components of comprehensive income (loss) were nominal for all periods presented. |
GSI GROUP INC.
NOTES TO CONSOLIDATED FINANCIAL STATEMENTS—(Continued)
As of December 31, 2011
Net Income (Loss) per Common Share
Basic net income (loss) per common share is computed by dividing net income (loss) by the weighted-average number of common shares outstanding during the period. For diluted net income (loss) per common share, the denominator also includes any dilutive effect of outstanding stock options, restricted stock awards, restricted stock units and warrants determined using the treasury stock method. Potentially dilutive securities are excluded from the diluted earnings per share computation to the extent they are anti-dilutive. Common and common share equivalent disclosuresWeighted average shares are computed as follows (in thousands):
| Year Ended December 31, | ||||||||||||||||||||||||
| 2010 | 2009 | 2008 | 2011 | 2010 | 2009 | |||||||||||||||||||
Weighted average common shares outstanding—basic | 23,703 | 15,916 | 14,375 | 33,481 | 23,703 | 15,916 | ||||||||||||||||||
Dilutive potential common shares(1) | — | — | — | 108 | — | — | ||||||||||||||||||
|
|
| ||||||||||||||||||||||
Weighted average common shares outstanding—diluted | 23,703 | 15,916 | 14,375 | 33,589 | 23,703 | 15,916 | ||||||||||||||||||
|
|
| ||||||||||||||||||||||
Excluded from diluted common shares calculation—weighted stock options, restricted stock awards, restricted stock units and warrants that are anti-dilutive | 183 | 267 | 465 | |||||||||||||||||||||
Excluded from diluted common shares calculation—weighted average shares represented by stock options, restricted stock awards, restricted stock units and warrants that are anti-dilutive | 132 | 183 | 267 | |||||||||||||||||||||
|
|
| ||||||||||||||||||||||
| (1) | Due to the Company’s net loss position for |
Discontinued Operations
During 2008, the Company completed the sale of its U.S. Optics Business. During 2009, the Company recorded an additional charge of $0.1 million to discontinued operations related to an insurance premium adjustment.
Accounting for Income Taxes
The asset and liability method is used to account for income taxes. Under the asset and liability method, deferred tax assets and liabilities are recognized for the estimated future tax consequences attributable to temporary differences between the financial statement carrying amounts of assets and liabilities and their respective tax bases. This method also requires the recognition of future tax benefits, such as net operating loss carryforwards, to the extent that realization of such benefitsit is more likely than not.not that such benefits will be realized. Deferred tax assets and liabilities are measured using enacted tax rates in effect for the year in which the differences are expected to be recovered or settled. A valuation allowance is established to reduce the deferred tax assets if it is “moremore likely than not”not that some or all of the related tax benefits will not be realized in the future. With respect
The majority of the Company’s business activities are conducted through its subsidiaries outside of Canada. Earnings from these subsidiaries are generally indefinitely reinvested in the local businesses. Further, local laws and regulations may also restrict certain subsidiaries from paying dividends to corporate earnings that are permanently reinvested offshore,their parents. As such, the Company does not accrue taxincome taxes for the repatriation of such earnings in accordance with ASC 740, “Income Taxes.” To the extent that there are excess accumulated earnings that the Company intends to repatriate from any such subsidiaries, the Company recognizes deferred tax liabilities on such foreign earnings.
Recent Accounting Pronouncements
Recently Adopted Accounting Pronouncements
Fair Value Measurements
On January 1, 2010,Judgment is required in determining the Company’s worldwide income tax provision. In the ordinary course of global business, there are many transactions and calculations where the ultimate outcome is uncertain. Although the Company adopted Accounting Standards Update (“ASU”) 2010-06, “Improving Disclosures about Fair Value Measurement”, which requires interim disclosures regarding significant transfers in and outbelieves its estimates are reasonable, no assurance can be given that the final outcome of Level 1 and Level 2 fair value measurements. Additionally, this ASU requires disclosure for each
GSI GROUP INC.
NOTES TO CONSOLIDATED FINANCIAL STATEMENTS—(Continued)
As of December 31, 20102011
class of assets and liabilities and disclosures about the valuation techniques and inputs used to measure fair value for both recurring and non-recurring fair value measurements. These disclosures are required for fair value measurementsthese matters will not be different from that fall in either Level 2 or Level 3. Further, the ASU requires separate presentation of purchases, sales, issuances and settlements in the Level 3 rollforward of the fair value measurements. The Company adopted the interim disclosure requirements under this ASU on January 1, 2010, with the exception of the separate presentation in the Level 3 activity rollforward, which is not effective until fiscal years beginning after December 15, 2010reflected in its historical income tax provisions and for interim periods within those fiscal years. The Company’s adoption of ASU 2010-06 did notaccruals. Such differences could have ana material impact on the Company’s financial position,income tax provision and operating results of operations or cash flows.in the period in which such determination is made.
Recent Accounting Pronouncements
Subsequent EventsFair Value Measurements
On April 4, 2009, the Company adopted ASC 855, “Subsequent Events”, which establishes general standards of accounting for, and disclosure of, events that occur after the balance sheet date but before financial statements are issued or are available to be issued. ASC 855 originally required all companies to disclose the date through which subsequent events have been evaluated for disclosure and recognition. In February 2010,May 2011, the Financial Accounting Standards Board (“FASB”(the “FASB”) issued anamended ASC 820, “Fair Value Measurement” (“ASC 820”). This amendment is intended to ASC 855 (ASU 2010-09, “Subsequent Events-Amendments to Certain Recognitionresult in convergence between U.S. GAAP and Disclosure Requirements”International Financial Reporting Standards (“IFRS”), which removed requirements for measurement of and disclosures about fair value. This guidance clarifies the requirementapplication of existing fair value measurements and disclosures, and changes certain principles or requirements for an SEC filer to disclose the date through which subsequent events have been evaluated for disclosurefair value measurements and recognition in issued and revised financial statements. ASU 2010-09 wasdisclosures. The amendment is effective for the Company immediately.interim and annual periods beginning after December 15, 2011. The Company’s adoption of ASC 855 didthis amendment is not expected to have ana material impact on the Company’s consolidated financial position, results of operations or cash flows. The Company adopted ASU 2010-09 in February 2010, but its adoption did not have an impact on its financial position, results of operations or cash flows.statements.
Recently Issued Accounting Pronouncements
Revenue Recognition
In September 2009, the FASB issued ASU 2009-13, “Multiple-Deliverable Revenue Arrangements”. ASU 2009-13 amends existing revenue recognition accounting pronouncements that are currently within the scope of ASC 605-25, “Multiple Element Arrangements”. ASU 2009-13 provides two significant changes to the existing multiple element revenue recognition guidance. First, this guidance removes the requirement to have objective and reliable evidence of fair value for undelivered elements in an arrangement and will result in more deliverables being treated as separate units of accounting. The second change modifies the manner in which the transaction consideration is allocated across the separately identified deliverables. These changes may result in entities recognizing more revenue up-front, and entities will no longer be able to apply the residual method and defer the fair value of undelivered elements. Upon adoption, each separate unit of accounting must have an estimated selling price, which can be based on management’s estimate when there is no other means to determine the fair value of that undelivered item, and the arrangement consideration is allocated based on the elements’ relative selling price. This accounting guidance is effective no later than fiscal years beginning on or after June 15, 2010 but may be early adopted as of the first quarter of an entity’s fiscal year. Entities may elect to adopt this accounting guidance either through prospective application to all revenue arrangements entered into or materially modified after the date of adoption or through a retrospective application to all revenue arrangements for all periods presented in the financial statements. The Company is currently evaluating the impact that its adoption of ASU 2009-13 will have on its financial position, results of operations and cash flows. The Company will adopt ASU 2009-13 effective January 1, 2011 on a prospective basis.
In September 2009, the FASB issued ASU 2009-14, “Certain Revenue Arrangements that Include Software Elements”. ASU 2009-14 amends existing accounting guidance for how entities account for arrangements that include both hardware and software, which typically resulted in the sale of hardware being accounted for under
GSI GROUP INC.
NOTES TO CONSOLIDATED FINANCIAL STATEMENTS—(Continued)
As of December 31, 2010
the software revenue recognition rules. This accounting guidance changes revenue recognition for tangible products containing software elements and non-software elements. The tangible element of the product is always outside of the scope of the software rules, and the software elements of tangible products when the software element and non-software elements function together to deliver the product’s essential functionality are outside the scope of the software rules. As a result, both the hardware and qualifying related software elements are excluded from the scope of the software revenue guidance and accounted for under the revised multiple-element revenue recognition guidance. This accounting guidance is effective for all fiscal years beginning on or after June 15, 2010 with early adoption permitted. Entities must adopt ASU 2009-14 and ASU 2009-13 in the same manner and at the same time. The Company is currently evaluating the impact that its adoption of ASU 2009-14 will have on its financial position, results of operations and cash flows. The Company will adopt ASU 2009-14 effective January 1, 2011 on a prospective basis.
Goodwill Impairment
In December 2010,September 2011, the FASB issued ASU 2010-28, “WhenNo. 2011-08, “Testing Goodwill for Impairment (the revised standard)”. The revised standard is intended to Perform Step 2reduce the cost and complexity of the Goodwill Impairment Test for Reporting Units with Zero or Negative Carrying Amounts”. ASU 2010-28 amends ASC 350-20 to modify Step 1 of theannual goodwill impairment test for reporting units with zero or negative carrying amounts. For those reporting units,by providing entities an entity is requiredoption to perform Step 2 of the goodwilla “qualitative” assessment to determine whether further impairment test if ittesting is more likely than not that a goodwill impairment exists. In determining whether it is more likely than not that a goodwill impairment exists, an entity should consider whether there are any adversenecessary. This qualitative assessment includes assessing factors indicating that an impairment may exist. The qualitative factors are consistent with the existing guidance and examples in paragraph 350-20-35-30, which requires that goodwill of a reporting unit be tested for impairment between annual tests if an event occurs or circumstances change that would more likely than not reduce the fair value of a reporting unit below its carrying amount. Upon adoption, an entity with reporting units that have carrying amounts that are zero or negative is required to assessdetermine whether it is more likely than not that the fair value of the reporting units’ goodwillunit is impaired. If the entity determines thatless than its carrying amount as a basis for determining whether it is necessary to perform the two-step goodwill impairment test. The more-likely-than-not threshold is defined as having a likelihood of more than 50 percent. If, after assessing the events or circumstances, a company determines it is not more likely than not that the goodwillfair value of one or more ofa reporting unit is less than its reporting units is impaired,carrying amount, then performing the entity should perform Step 2 of the goodwilltwo-step impairment test for those reporting unit(s). Any resulting goodwill impairment should be recorded as a cumulative-effect adjustment to beginning retained earnings in the period of adoption. Any goodwill impairments occurring after the initial adoption of the amendments should be included in earnings. ASU 2010-28is not required. The revised standard is effective for public entitiesannual and interim goodwill impairment tests performed for fiscal years and interim periods within those years beginning after December 15, 2010. Early2011, with early adoption is not permitted. The adoption of this amendment will not have a material impact on the Company’s consolidated financial statements.
4. Fair Value Measurements
ASC 820 establishes a fair value hierarchy based on three levels of inputs, of which the first two are considered observable and the third is considered unobservable:
Level 1: Quoted prices for identical assets or liabilities in active markets which the Company will adopt ASU 2010-28 on January 1, 2011can access.
Level 2: Observable inputs other than those described in Level 1.
Level 3: Unobservable inputs.
Cash equivalents are money market accounts, which represent the only asset the Company measures at fair value on a prospectiverecurring basis. The Company is currently evaluating the impact, if any, that its adoptionCash equivalents of ASU 2010-28 will have on its financial position, results$4.1 million and $7.8 million as of operationsDecember 31, 2011 and cash flows.
4. Business Combinations
Acquisition of Excel Technology, Inc.
On August 20, 2008, the Company acquired 78.6% of the outstanding common shares of Excel. Thereafter, the Company commenced a tender offering for all remaining Excel common shares. On August 27, 2008, the Company had obtained 92.8% of Excel’s outstanding shares and performed a short form merger to acquire Excel’s remaining outstanding shares. On August 29, 2008, the Company completed its acquisition of Excel for a cash purchase price of $368.7 million, including: a payment of $32.00 per outstanding common share of Excel; a payment of $32.00 less the strike price of each outstanding option for the purchase of common stock and restricted share of common stock; and transaction costs. In addition to these payments, employee termination costs totaling $18.4 million were paid to the chief executive officer and chief financial officer of Excel; these costs have not been included2010, respectively, are classified as Level 1 in the purchase price, butfair value hierarchy because they are includedvalued at quoted prices in the allocationactive markets. The fair values of the purchase consideration. Excel provides complementary products, technologies,cash, accounts receivable, income taxes receivable, accounts payable, income taxes payable, accrued compensation and distribution channels. The Company believes that the combined Company will provide its customers a significantly broader product offering. Thebenefits, and other accrued expenses, approximate their carrying values because of their short-term nature.
GSI GROUP INC.
NOTES TO CONSOLIDATED FINANCIAL STATEMENTS—(Continued)
As of December 31, 20102011
The Company has initiated the integration of key operating units, and those activities are either complete or well underway. These synergistic efforts have enabled substantial cost savings initiatives. Certain integration activities were delayed due to the Company’s restatementsold all of its financial resultsremaining auction rate securities held during the year ended December 31, 2010. The auction rate securities were previously included in Level 3 as reported inof December 31, 2009. The following table summarizes the Annual Report on Form 10-Kactivity for the year ended December 31, 2008 and Quarterly Report on Form 10-Q for2010 with respect to the quarter ended September 26, 2008 and the Chapter 11 Cases. auction rate securities, where fair value was determined by Level 3 inputs (in thousands):
Balance at December 31, 2009 | $ | 11,272 | ||
Sales | (11,408 | ) | ||
Gross realized gains, included in other income (expense), net | 988 | |||
Reclassifications out of accumulated other comprehensive income (loss) | (852 | ) | ||
|
| |||
Balance at December 31, 2010 | $ | — | ||
|
|
The Company previously expectedalso applies the guidance in ASC 820 related to complete the integrationall nonrecurring fair value measurements of Excel with its existing operations by the end of 2010. nonfinancial assets and nonfinancial liabilities.
As a result of the bankruptcy filing on November 20, 2009impairment review of goodwill and a change inintangible assets conducted due to the Company’s Board of Directors, the previous plan is being reevaluated.
The Company accountedfiling for the acquisition as a purchase. The Company has included Excel’s results of operations with the Company’s results beginning August 20, 2008. Subsequent to the acquisition of Excel,Chapter 11 bankruptcy protection, the Company established a third segment which was comprised solelyidentified certain assets as impaired and as of the operations of the newly acquired entity. InDecember 31, 2009 the Company changed the structure of its internal organization in a manner that caused the composition of its reportable segments to change. More specifically, certain portions of a specific product line within the Precision Technology segment were transferred to the Excel segment. The Company’s reportable segment financial information has been restated to reflect the updated reportable segment structure for all periods presented. The Company has recorded theclassified these assets purchased and liabilities assumed (collectively, the “net assets”) based on their estimated fair valuesas measured at the date of acquisition. The excess of the total purchase consideration over the fair value of net assets is recorded to goodwill. The goodwill recognized on the Excel acquisition reflects synergies and other benefits expected to be realized from the combination of the two businesses following the acquisition. The goodwill recorded in connection with this acquisition is not deductible for tax purposes.
A summary of the purchase price allocation isa nonrecurring basis as follows (in thousands):
Total Purchase Consideration: | ||||
Cash paid to shareholders | $ | 347,730 | ||
Cash paid to option holders and restricted stockholders | 12,674 | |||
Transaction fees | 8,307 | |||
Total Purchase Consideration | $ | 368,711 | ||
Allocation of the Purchase Consideration: | ||||
Cash and cash equivalents | $ | 10,430 | ||
Long-term investments (auction rate securities) | 24,985 | |||
Accounts receivable | 20,435 | |||
Inventories | 37,690 | |||
Income tax receivable | 7,002 | |||
Deferred tax assets | 3,442 | |||
Property, plant and equipment | 33,050 | |||
Identifiable intangible assets | 132,685 | |||
In-process research and development charge | 12,142 | |||
Goodwill | 149,941 | |||
Other assets | 2,292 | |||
Total assets acquired | 434,094 | |||
Accounts payable and accrued expenses | 15,554 | |||
Income taxes payable | 348 | |||
Deferred tax liabilities, non-current | 47,541 | |||
Other liabilities | 1,940 | |||
Total liabilities assumed | 65,383 | |||
Net assets acquired | $ | 368,711 | ||
GSI GROUP INC.
NOTES TO CONSOLIDATED FINANCIAL STATEMENTS—(Continued)
As of December 31, 2010
| December 31, 2009 | Quoted Prices in Active Markets for Identical Assets (Level 1) | Significant Other Observable Inputs (Level 2) | Significant Other Unobservable Inputs (Level 3) | Total Gains (Losses) | ||||||||||||||||
Goodwill | $ | — | $ | — | $ | — | $ | — | $ | (485 | ) | |||||||||
Intangible assets | — | — | — | — | (560 | ) | ||||||||||||||
|
|
|
|
|
|
|
|
|
| |||||||||||
Total | $ | — | $ | — | $ | — | $ | — | $ | (1,045 | ) | |||||||||
|
|
|
|
|
|
|
|
|
| |||||||||||
The deferred tax liability primarily relates to the tax impact of future tax amortization associated with the identified intangiblefair values reflected above represents only those assets acquired, the adjustment in fair value of certain tangible assets acquired, and the difference between book and tax basis for original issue discount on the debt. The estimated taxes are based on an expected effective tax rate of 36.35%.
The Company used the income approach to determine fair value of the intangible assets. This approach calculates fair value by discounting the after-tax cash flows back to a present value. The baseline data for this analysis were based on the cash flow estimates used to price the transaction. Cash flows were forecasted for each intangible asset, and then discounted based on an appropriate discount rate. In estimating the useful life of the amortizable intangible assets, the Company considered ASC 350, “Intangibles—Goodwill and Other”, Subsection 30-35-3, which lists the pertinent factors to be considered when estimating the useful life of an intangible asset. These factors included a review of the expected use by the combined company of the assets acquired; the expected useful life of any other asset (or group of assets) related to the acquired assets; legal, regulatory or other contractual provisions that may limit the useful life of an acquired asset or may enable the extension of the useful life of an acquired asset without substantial cost; the effects of obsolescence, demand, competition and other economic factors; and the level of maintenance expenditures required to obtain the expected future cash flows from the asset. Definite-lived intangible assets are being amortized on a straight-line basis.
The value assigned to in-process research and development was determined using an income approach by estimating the costs to develop the acquired technology into commercially viable products, estimating the resulting net cash flows from the projects, and discounting the net cash flows to their present value. At the date of acquisition, the development of these projects had not yet reached technological feasibility, and had no alternative future uses. Accordingly, the Company has expensed the value of this research and development at the acquisition date. Due to the nature of the forecasts and the risks associated with the developmental projects, a discount rate of 15.0% was used to discount the net cash flows to their present value. The successful development of new products and product enhancements is subject to numerous risks and uncertainties, both known and unknown, including unanticipated delays, access to capital, budget overruns, technical problems and other difficulties that could result in the abandonment or substantial change in the design, development and commercialization of these new products and enhancements. Given the uncertainties inherent with product development and introduction, there can be no assurance that any of the combined Company’s product development efforts will be successful on a timely basis or within budget, if at all. The failure of the combined Company to develop new products and product enhancements on a timely basis or within budget could harm the combined Company’s results of operations and financial condition.
The following assets are the identifiable intangible assets acquired and their respective weighted average lives as of the date of acquisition (dollars in thousands):
| Amount | Weighted Average Life (Years) | |||||||
Amortizable intangible assets: | ||||||||
Core technology | $ | 42,355 | 9.9 | |||||
Customer relationships | 44,764 | 11.9 | ||||||
Customer backlog | 3,186 | 1.0 | ||||||
Non-compete agreements | 8,040 | 2.9 | ||||||
Amortizable intangible assets | 98,345 | 10.0 | ||||||
Non-amortizable intangible assets: | ||||||||
Trade names | 34,340 | |||||||
Total identifiable intangible assets | $ | 132,685 | ||||||
GSI GROUP INC.
NOTES TO CONSOLIDATED FINANCIAL STATEMENTS—(Continued)
As of December 31, 2010
As discussed in further detail in Note 6 to Consolidated Financial Statements, the Company undertook an impairment review of its goodwill, intangible assets and other long-lived assets (property, plant and equipment) at December 31, 2008 due to the significant downturn in the global economy in 2008, particularly in the fourth quarter. Included in the impairment charge recorded as of December 31, 2008 were impairments of the goodwill, intangible assets and fixed assets from the Company’s acquisition of Excel. These assets were reduced by $114.1 million, $66.5 million and $2.1 million, respectively. In addition, the Company undertook an impairment review of its goodwill and intangible assets at December 31, 2009 due to the filing for Chapter 11 bankruptcy protection. As a result of this review, goodwill and the definite-lived customer relationship intangible asset for the Excel segment were each impaired by approximately $0.5 million.
Supplementary Pro Forma Information (Unaudited)
The following unaudited pro forma information presents a summary of consolidated results of operations of the Company and Excel as if the acquisition had occurred at the beginning of the periods presented with pro forma adjustments to give effect to amortization of intangible assets, an increase in interest expense on acquisition financing and certain other adjustments together with related tax effects. The unaudited pro forma financial information excludes the material, non-recurring charge for the purchased in-process research and development charge of $12.1 million. The unaudited pro forma condensed consolidated financial information is presented for informational purposes only. The pro forma information is not necessarily indicative of what the financial position or results of operations actually would have been had the merger been completed at the dates indicated. In addition, the unaudited pro forma condensed consolidated financial information does not purport to project the future financial position or operating results of the combined Company after completion of the acquisition (in thousands, except per share amounts):
| Year Ended December 31, | ||||
| 2008 | ||||
Sales | $ | 387,255 | ||
Loss from continuing operations | (217,983 | ) | ||
Income from discontinued operations, net of tax | 270 | |||
Gain on disposal of discontinued operations, net of tax | 8,732 | |||
Net loss attributable to GSI Group Inc. | $ | (208,981 | ) | |
Loss from continuing operations per common share—basic and diluted | $ | (15.17 | ) | |
Income from discontinued operations per common share—basic and diluted | 0.63 | |||
Net loss attributable to GSI Group Inc. per common share—basic and diluted | $ | (14.54 | ) | |
5. Discontinued Operations
The Company evaluates its businesses and product lines periodically for strategic fit within its operations. On July 3, 2008, the Company entered into a definitive agreement to sell its U.S. Optics Business located in Moorpark, California and part of the Company’s Precision Technology segment for $21.6 million. The saleloss was closed on October 8, 2008. The Company includes all current and historical earnings from the U.S. Optics Business in the income (loss) from discontinued operations on the consolidated statement of operations. The net gain of $8.7 million is reported as gain on disposal of discontinued operations, net of tax, in the accompanying consolidated statement of operations forrecognized during the year ended December 31, 2008.2009. The goodwill and intangible assets were classified as Level 3. The goodwill was initially valued based on the excess of the purchase price of the associated business combination over the fair value of the acquired tangible and intangible net assets and the intangible assets were initially valued at fair value. When identified as impaired, the goodwill and intangible assets were revalued at estimated fair value, which was zero as of December 31, 2009. The Company used unobservable inputs such as the estimated future cash flows associated to the reporting unit and respective intangible asset to determine the associated fair value.
See Note 7 to Consolidated Financial Statements for discussion of the estimated fair value of the Company’s debt, Note 9 for discussion of the estimated fair value of the Company’s pension plan assets and Note 11 for discussion of the fair value of the Company’s restructuring estimates.
5. Goodwill, Intangible Assets and Impairment Charges
Goodwill
There were no changes in the carrying amount of goodwill during the years ended December 31, 2011 and 2010. The Company modified its operating and reporting segments in April 2011 into three reportable segments: Laser Products, Precision Motion and Technologies and Semiconductor Systems. The prior period goodwill
GSI GROUP INC.
NOTES TO CONSOLIDATED FINANCIAL STATEMENTS—(Continued)
As of December 31, 20102011
In accordance with ASC 360, “Impairment or Disposal of Long-Lived Assets”, the following amounts relatedinformation stated herein has been restated to conform to the U.S. Optics Business have been segregated from continuing operations and included in discontinued operations, net of tax, in the consolidated statements of operations (in thousands):
| Year Ended December 31, | ||||||||||||
| 2010 | 2009 | 2008 | ||||||||||
Sales of discontinued business | $ | — | $ | — | $ | 10,188 | ||||||
Pre-tax income (loss) of discontinued business | — | (132 | ) | 495 | ||||||||
Provision for taxes on income of discontinued business | — | — | (225 | ) | ||||||||
Income (loss) from operations of discontinued business attributable to GSI Group Inc.—net of tax | — | (132 | ) | 270 | ||||||||
Pre-tax gain on discontinued business | — | — | 13,412 | |||||||||
Provision for taxes on gain | — | — | (4,680 | ) | ||||||||
Gain on discontinued business attributable to GSI Group Inc.—net of tax | — | — | 8,732 | |||||||||
Income (loss) from discontinued business attributable to GSI Group Inc.—net of tax | $ | — | $ | (132 | ) | $ | 9,002 | |||||
new segment presentation. The assets and liabilities relating to the U.S. Optics Business were segregated from other of the Company’s assets and liabilities. During the year-ended December 31, 2009, the Company recorded an additional charge of $0.1 million related to discontinued operations associated with an insurance premium adjustment; however, the Company did not have any significant continuing involvement with the operations of this component after the disposal transaction. Net cash flows of the Company’s discontinued operations from each of the categories of operating, investing and financing were not significant for the years ended December 31, 2010, 2009 and 2008.
6. Goodwill, Intangible Assets and Impairment Charges
Goodwill
Goodwill is recorded when the consideration for an acquisition exceeds the fair value of net tangible and identifiable intangible assets acquired. The change in the carrying amount of goodwill during the years ended December 31, 20102011 and 2009,2010, by reportable segment, is as follows (in thousands):
| Reportable Segment | Laser Products | Precision Motion and Technologies | Total | |||||||||||||||||||||
| Excel | Precision Technology | Total | ||||||||||||||||||||||
Balance as of December 31, 2008: | ||||||||||||||||||||||||
Goodwill | $ | 149,941 | $ | 26,291 | $ | 176,232 | $ | 67,926 | $ | 108,306 | $ | 176,232 | ||||||||||||
Accumulated impairment of goodwill | (114,123 | ) | (17,046 | ) | (131,169 | ) | (54,099 | ) | (77,555 | ) | (131,654 | ) | ||||||||||||
|
|
| ||||||||||||||||||||||
| 35,818 | 9,245 | 45,063 | $ | 13,827 | $ | 30,751 | $ | 44,578 | ||||||||||||||||
|
|
| ||||||||||||||||||||||
Impairment of goodwill | (485 | ) | — | (485 | ) | |||||||||||||||||||
Balance as of December 31, 2009: | ||||||||||||||||||||||||
Goodwill | 149,941 | 26,291 | 176,232 | |||||||||||||||||||||
Accumulated impairment of goodwill | (114,608 | ) | (17,046 | ) | (131,654 | ) | ||||||||||||||||||
| 35,333 | 9,245 | 44,578 | ||||||||||||||||||||||
Balance at December 31, 2010: | ||||||||||||||||||||||||
Goodwill | 149,941 | 26,291 | 176,232 | |||||||||||||||||||||
Accumulated impairment of goodwill | (114,608 | ) | (17,046 | ) | (131,654 | ) | ||||||||||||||||||
| $ | 35,333 | $ | 9,245 | $ | 44,578 | |||||||||||||||||||
Intangible Assets
Intangible assets as of December 31, 2011 and 2010, respectively, are summarized as follows (in thousands):
| December 31, 2011 | ||||||||||||||||
| Gross Carrying Amount | Accumulated Amortization | Net Carrying Amount | Weighted Average Remaining Life (Years) | |||||||||||||
Amortizable intangible assets: | ||||||||||||||||
Patents and acquired technologies | $ | 61,279 | $ | (47,350 | ) | $ | 13,929 | 4.8 | ||||||||
Customer relationships | 33,115 | (16,514 | ) | 16,601 | 7.5 | |||||||||||
Customer backlog | 2,355 | (2,355 | ) | — | — | |||||||||||
Non-compete agreements | 4,870 | (4,870 | ) | — | — | |||||||||||
Trademarks, trade names and other | 5,692 | (3,452 | ) | 2,240 | 7.2 | |||||||||||
|
|
|
|
|
|
|
| |||||||||
Amortizable intangible assets | 107,311 | (74,541 | ) | 32,770 | 6.3 | |||||||||||
|
|
|
|
|
|
|
| |||||||||
Non-amortizable intangible assets: | ||||||||||||||||
Trade names | 13,027 | — | 13,027 | |||||||||||||
|
|
|
|
|
| |||||||||||
Total | $ | 120,338 | $ | (74,541 | ) | $ | 45,797 | |||||||||
|
|
|
|
|
| |||||||||||
| December 31, 2010 | ||||||||||||||||
| Gross Carrying Amount | Accumulated Amortization | Net Carrying Amount | Weighted Average Remaining Life (Years) | |||||||||||||
Amortizable intangible assets: | ||||||||||||||||
Patents and acquired technologies | $ | 61,298 | $ | (43,546 | ) | $ | 17,752 | 5.5 | ||||||||
Customer relationships | 33,121 | (14,183 | ) | 18,938 | 8.4 | |||||||||||
Customer backlog | 2,355 | (2,355 | ) | — | — | |||||||||||
Non-compete agreements | 4,870 | (4,001 | ) | 869 | 0.7 | |||||||||||
Trademarks, trade names and other | 5,696 | (3,143 | ) | 2,553 | 8.2 | |||||||||||
|
|
|
|
|
|
|
| |||||||||
Amortizable intangible assets | 107,340 | (67,228 | ) | 40,112 | 6.9 | |||||||||||
|
|
|
|
|
|
|
| |||||||||
Non-amortizable intangible assets: | ||||||||||||||||
Trade names | 13,027 | — | 13,027 | |||||||||||||
|
|
|
|
|
| |||||||||||
Total | $ | 120,367 | $ | (67,228 | ) | $ | 53,139 | |||||||||
|
|
|
|
|
| |||||||||||
GSI GROUP INC.
NOTES TO CONSOLIDATED FINANCIAL STATEMENTS—(Continued)
As of December 31, 20102011
Intangible Assets
As of December 31, 2010, intangible assets consisted of the following (in thousands):
| December 31, 2010 | ||||||||||||||||
| Gross Carrying Amount | Accumulated Amortization | Net Carrying Amount | Weighted Average Remaining Life (Years) | |||||||||||||
Amortizable intangible assets: | ||||||||||||||||
Patents and acquired technology | $ | 61,298 | $ | (43,546 | ) | $ | 17,752 | 5.5 | ||||||||
Customer relationships | 33,121 | (14,183 | ) | 18,938 | 8.4 | |||||||||||
Customer backlog | 2,355 | (2,355 | ) | — | — | |||||||||||
Non-compete agreements | 4,870 | (4,001 | ) | 869 | 0.7 | |||||||||||
Trademarks, trade names and other | 5,696 | (3,143 | ) | 2,553 | 8.2 | |||||||||||
Amortizable intangible assets | 107,340 | (67,228 | ) | 40,112 | 6.9 | |||||||||||
Non-amortizable intangible assets: | ||||||||||||||||
Trade names | 13,027 | — | 13,027 | |||||||||||||
Totals | $ | 120,367 | $ | (67,228 | ) | $ | 53,139 | |||||||||
As of December 31, 2009, intangible assets consisted of the following (in thousands):
| December 31, 2009 | ||||||||||||||||
| Gross Carrying Amount | Accumulated Amortization | Net Carrying Amount | Weighted Average Remaining Life (Years) | |||||||||||||
Amortizable intangible assets: | ||||||||||||||||
Patents and acquired technology | $ | 61,463 | $ | (39,807 | ) | $ | 21,656 | 6.4 | ||||||||
Customer relationships | 33,121 | (11,516 | ) | 21,605 | 9.3 | |||||||||||
Customer backlog | 2,355 | (2,355 | ) | — | — | |||||||||||
Non-compete agreements | 4,870 | (2,543 | ) | 2,327 | 1.6 | |||||||||||
Trademarks, trade names and other | 5,746 | (2,852 | ) | 2,894 | 9.2 | |||||||||||
Amortizable intangible assets | 107,555 | (59,073 | ) | 48,482 | 7.6 | |||||||||||
Non-amortizable intangible assets: | ||||||||||||||||
Trade names | 13,027 | — | 13,027 | |||||||||||||
Totals | $ | 120,582 | $ | (59,073 | ) | $ | 61,509 | |||||||||
All definite-lived intangible assets are amortized on a straight-line basis over their remaining life. Amortization expense for customer relationships, customer backlog, non-compete agreements and definite-lived trademarks, trade names and other is included in operating expenses in the accompanying consolidated statements of operations and was $3.5 million, $4.4 million and $5.8 million for the years ended December 31, 2011, 2010 and $5.7 million in 2010, 2009, and 2008, respectively. Amortization expense for patents and acquired technologytechnologies is included in cost of goods sold in the accompanying consolidated statements of operations and was $3.9 million $3.9 million and $4.7 million in 2010, 2009 and 2008, respectively.
GSI GROUP INC.
NOTES TO CONSOLIDATED FINANCIAL STATEMENTS—(Continued)
Asfor each of the years ended December 31, 2011, 2010
and 2009.
Estimated amortization expense for each of the five succeeding years and thereafter as of December 31, 2010,2011, is as follows (in thousands):
Year Ending December 31, | Cost of Goods Sold | Operating Expenses | Total | Cost of Goods Sold | Operating Expenses | Total | ||||||||||||||||||
2011 | $ | 3,823 | $ | 3,516 | $ | 7,339 | ||||||||||||||||||
2012 | 3,165 | 2,648 | 5,813 | $ | 3,165 | $ | 2,647 | $ | 5,812 | |||||||||||||||
2013 | 3,165 | 2,648 | 5,813 | 3,165 | 2,647 | 5,812 | ||||||||||||||||||
2014 | 3,165 | 2,561 | 5,726 | 3,165 | 2,561 | 5,726 | ||||||||||||||||||
2015 | 2,065 | 2,391 | 4,456 | 2,066 | 2,391 | 4,457 | ||||||||||||||||||
2016 | 1,184 | 2,391 | 3,575 | |||||||||||||||||||||
Thereafter | 2,369 | 8,596 | 10,965 | 1,184 | 6,204 | 7,388 | ||||||||||||||||||
|
|
| ||||||||||||||||||||||
Total | $ | 17,752 | $ | 22,360 | $ | 40,112 | $ | 13,929 | $ | 18,841 | $ | 32,770 | ||||||||||||
|
|
| ||||||||||||||||||||||
Impairment Charges
The most recent annualCompany did not have any goodwill andor indefinite-lived intangible asset impairment test was performed as of the beginning of the second quarter of 2010 noting no impairment. No impairment charges were recorded for goodwill, intangible assets or other long-lived assets during the year-endedyears ended December 31, 2011 and 2010. TheDuring 2009, the Company undertookrecognized an impairment review of goodwill and intangible assets at the end of 2009 due to the filing for Chapter 11 bankruptcy protection. This review led the Company to record an impairment charge of approximately $1.0 million to reduce the carrying values of these assets to their fair value. Goodwill and the definite-lived customer relationship intangible asset for the Excel segmentasset. These assets were each impaired by approximately $0.5 million. The impairmentmillion and $0.6 million, respectively. A total of $0.2 million and $0.3 million of the customer relationship intangible asset is reflected as a reduction in its gross carrying amount.
The results of thetotal goodwill impairment review as of December 31, 2009 are summarized in the following table (in thousands):
| Pre-Impairment Net Carrying Value | Impairment Charge | Post-Impairment Net Carrying Value | ||||||||||
Goodwill | $ | 45,063 | $ | (485 | ) | $ | 44,578 | |||||
Indefinite-lived intangible assets | 13,027 | — | 13,027 | |||||||||
Definite-lived intangible assets | 49,042 | (560 | ) | 48,482 | ||||||||
Property, plant and equipment | 49,502 | — | 49,502 | |||||||||
| $ | 156,634 | $ | (1,045 | ) | $ | 155,589 | ||||||
The significant downturn in the global economy experienced in 2008, and most notably in the fourth quarter of 2008, negatively impacted the Company’s estimated future revenues and cash flows. The downturn in the global economy and its effect on the Company’s business, including its revenues, suggested that an impairment might exist as of December 31, 2008. Consequently, the Company undertook an impairment review of its goodwill, intangible assets and other long-lived assets (property, plant and equipment) at the end of 2008. This review led the Company to record an impairment charge of $215.1 million to reduce the carrying values of these assets to their fair value. The impairments of intangible assets and property, plant and equipment have been reflected as reductions in their gross carrying amounts. The impairment charge by segment is as follows:
Precision Technology: $17.1 million for goodwill, $11.9 million for definite-lived intangible assets and $2.7 million for property, plant and equipment. Total impairment: $31.7 million.
GSI GROUP INC.
NOTES TO CONSOLIDATED FINANCIAL STATEMENTS—(Continued)
As of December 31, 2010
Excel: $114.1 million for goodwill, $21.3 million for indefinite-lived intangible assets, $45.2 million for definite-lived intangible assets and $2.1 million for property, plant and equipment. Total impairment: $182.7 million.
Corporate: $0.7 million for property, plant and equipment.
The results of the impairment review as of December 31, 2008 are summarized in the following table (in thousands):
| Pre-Impairment Net Carrying Value | Impairment Charge | Post-Impairment Net Carrying Value | ||||||||||
Goodwill | $ | 176,232 | $ | (131,169 | ) | $ | 45,063 | |||||
Indefinite-lived intangible assets | 34,341 | (21,314 | ) | 13,027 | ||||||||
Definite-lived intangible assets | 115,563 | (57,130 | ) | 58,433 | ||||||||
Property, plant and equipment | 59,877 | (5,438 | ) | 54,439 | ||||||||
| $ | 386,013 | $ | (215,051 | ) | $ | 170,962 | ||||||
Revenue and the resulting cash flows, as well as the applied discount rate that is associated with risk and the Company’s cost of capital, are significant inputs in the calculation of the fair value of goodwill and intangible assets. The deterioration of certain reporting unit cash flow forecasts, and other factors, resulted in the decrease in the fair value of the Company’s goodwill and intangible assets in 2009 and 2008.
The downward revision in the Company’s estimated future cash flows and the increase in the rates used to discount them account for most of the impairment recorded on the Company’s goodwill and intangible assets in 2008. The downward revision in the Company’s estimated future cash flows for a particular Excel segment reporting unit resulted in the impairment recorded on the Company’s goodwill and intangible assets in 2009. Following the Company’s 2009 and 2008 impairment charges, the Company continues to maintain a significant balance in its goodwill, intangible assets and other long-lived assets. To the extent that the Company’s assumptions used to value the goodwill and other intangible assets should adversely change, due to a further deterioration of the markets that the Company serves, the broader worldwide economy, or the performance of the Company’s business relative to its expectations, the Company may be required to record additional impairment charges in the future.
The Company’s impairment charge recorded on December 31, 2008 included a significant charge against the goodwill, intangible assets and other long-lived assets that it acquired in connection with its business combination of Excel on August 20, 2008. Specifically, the impairment charges noted above included a reduction in the acquired goodwill, intangible assets and other long-lived assets of Excel of $114.1 million, $66.5 million and $2.1 million, respectively. These impairment charges represent 76%, 50% and 6% of the respective amounts acquired in August 2008.
The Company’s acquisition of Excel was finalized on August 20, 2008 pursuant to a merger agreement that was entered into as of July 9, 2008. Inherent in the Company’s purchase price valuation of Excel were estimates of the future performance of Excel, including revenue and expense projections. In September 2008, shortly after the acquisition, the worldwide economies began a dramatic period in which credit was tightened and international trade declined dramatically. The significant downturn in the global economy experienced in 2008, and most notably in the fourth quarter of 2008, negatively impacted the Company’s estimated future revenues and cash flows, as comparedrelated to the Company’s prior estimates, including those estimates made at the time the
GSI GROUP INC.Laser Products and Precision Motion and Technologies segments, respectively.
NOTES TO CONSOLIDATED FINANCIAL STATEMENTS—(Continued)
As of December 31, 2010
Company acquired Excel. Excel’s 2009 unaudited actual revenues were approximately 32% lower than Excel’s 2009 projected revenue at the time of the acquisition in August 2008. From the acquisition in August 2008 to December 2008, when the impairment analysis was performed, the Company reduced Excel’s annual revenue projections by $50.1 to $54.5 million per year, or on average approximately 26% per year, compared to the projections used to initially value the intangible assets in Excel’s purchase price allocation. During this same period of time, the Company’s cost of capital increased significantly, primarily due to the increase in risk associated with an investment in the Company’s equity securities. The Company’s estimated cost of capital increased in the fourth quarter of 2008 after the Company announced the delayed filing of its financial results. The announcement increased the Company’s risk profile and made financing more expensive, as a result of the decline in the Company’s stock price, the receipt by the Company of default notices from its noteholders, and the severe economic downturn. The Company’s weighted average cost of capital forms the basis of the rates used to discount the Company’s cash flow forecasts which are integral to the Company’s fair value estimates. The discount rates utilized to initially value the intangible assets in the purchase price allocation ranged from 10.0% to 13.0%, while the discount rates utilized in the December 31, 2008 impairment analyses of the goodwill and other intangible assets ranged from 16.5% to 17.5%.
7.6. Supplementary Balance Sheet Information
The following tables provide the details of selected balance sheet items as of December 31, 20102011 and 2009:2010:
Inventories
| December 31, | ||||||||
| 2010 | 2009 | |||||||
| (In thousands) | ||||||||
Raw materials | $ | 37,315 | $ | 34,982 | ||||
Work-in-process | 16,613 | 14,905 | ||||||
Finished goods | 10,261 | 11,116 | ||||||
Demo inventory | 1,249 | 3,751 | ||||||
Consigned inventory | 1,283 | 842 | ||||||
Total inventories | $ | 66,721 | $ | 65,596 | ||||
Property, Plant and Equipment, net
| December 31, | ||||||||
| 2010 | 2009 | |||||||
| (In thousands) | ||||||||
Cost: | ||||||||
Land, buildings and improvements | $ | 48,545 | $ | 48,577 | ||||
Machinery and equipment | 52,193 | 50,598 | ||||||
Total cost | 100,738 | 99,175 | ||||||
Accumulated depreciation | (55,336 | ) | (49,673 | ) | ||||
Net property, plant and equipment | $ | 45,402 | $ | 49,502 | ||||
| December 31, | ||||||||
| 2011 | 2010 | |||||||
| (In thousands) | ||||||||
Raw materials | $ | 34,131 | $ | 37,315 | ||||
Work-in-process | 18,506 | 16,613 | ||||||
Finished goods | 11,048 | 10,261 | ||||||
Demo inventory | 1,431 | 1,249 | ||||||
Consigned inventory | 694 | 1,283 | ||||||
|
|
|
| |||||
Total inventories | $ | 65,810 | $ | 66,721 | ||||
|
|
|
| |||||
GSI GROUP INC.
NOTES TO CONSOLIDATED FINANCIAL STATEMENTS—(Continued)
As of December 31, 20102011
Property, Plant and Equipment, net
| December 31, | ||||||||
| 2011 | 2010 | |||||||
| (In thousands) | ||||||||
Cost: | ||||||||
Land, buildings and improvements | $ | 46,469 | $ | 48,545 | ||||
Machinery and equipment | 56,685 | 52,193 | ||||||
|
|
|
| |||||
Total cost | 103,154 | 100,738 | ||||||
Accumulated depreciation | (59,743 | ) | (55,336 | ) | ||||
|
|
|
| |||||
Net property, plant and equipment | $ | 43,411 | $ | 45,402 | ||||
|
|
|
| |||||
In 2011, the Company capitalized $2.2 million of assets which met the capital lease criteria of ASC 840-30 “Leases—Capital Lease”. The assets acquired under the capital lease are included in machinery and equipment. Depreciation expense, including amortization of demo inventory,units and the capital lease, was $7.9 million, $7.4 million and $7.7 million for 2011, 2010 and $8.52009, respectively. Accumulated amortization related to the capital lease totaled $0.1 million for 2010, 2009 and 2008, respectively.as of December 31, 2011.
Prepaid Expenses and Other Current Assets
| December 31, | December 31, | |||||||||||||||
| 2010 | 2009 | 2011 | 2010 | |||||||||||||
| (In thousands) | (In thousands) | |||||||||||||||
Prepaid expenses | $ | 4,803 | $ | 4,565 | $ | 4,694 | $ | 4,803 | ||||||||
Other current assets | 777 | 914 | 1,275 | 777 | ||||||||||||
|
| |||||||||||||||
Total | $ | 5,580 | $ | 5,479 | $ | 5,969 | $ | 5,580 | ||||||||
|
| |||||||||||||||
Other Accrued Expenses
| December 31, | ||||||||
| 2010 | 2009 | |||||||
| (In thousands) | ||||||||
Accrued interest | $ | 1,647 | $ | 2,631 | ||||
Accrued warranty | 3,977 | 3,140 | ||||||
Accrued professional fees | 2,165 | 3,143 | ||||||
Accrued third party sales commissions | 497 | 266 | ||||||
Customer deposits | 1,241 | 1,112 | ||||||
Accrued restructuring, current portion | 797 | 1,194 | ||||||
Accrued litigation settlements | — | 403 | ||||||
Deferred rent, current portion | 1,325 | 343 | ||||||
Accrued VAT | 540 | 216 | ||||||
Other | 2,528 | 1,599 | ||||||
Total | $ | 14,717 | $ | 14,047 | ||||
| December 31, | ||||||||
| 2011 | 2010 | |||||||
| (In thousands) | ||||||||
Accrued warranty | $ | 3,506 | $ | 3,977 | ||||
Customer deposits | 3,630 | 1,241 | ||||||
Other | 8,933 | 9,499 | ||||||
|
|
|
| |||||
Total | $ | 16,069 | $ | 14,717 | ||||
|
|
|
| |||||
Accrued Warranty
| December 31, | ||||||||
| 2010 | 2009 | |||||||
| (In thousands) | ||||||||
Balance at beginning of period | $ | 3,140 | $ | 3,793 | ||||
Charged to costs and expenses | 4,359 | 1,831 | ||||||
Use of provision | (3,492 | ) | (2,590 | ) | ||||
Foreign currency exchange rate changes | (30 | ) | 106 | |||||
Balance at end of period | $ | 3,977 | $ | 3,140 | ||||
Other Liabilities
| December 31, | ||||||||
| 2010 | 2009 | |||||||
| (In thousands) | ||||||||
Deferred rent | $ | 2,151 | $ | 4,039 | ||||
Accrued PIK Notes | 269 | — | ||||||
Total | $ | 2,420 | $ | 4,039 | ||||
| December 31, | ||||||||
| 2011 | 2010 | |||||||
| (In thousands) | ||||||||
Balance at beginning of period | $ | 3,977 | $ | 3,140 | ||||
Provision charged to cost of goods sold | 3,250 | 4,359 | ||||||
Use of provision | (3,718 | ) | (3,492 | ) | ||||
Foreign currency exchange rate changes | (3 | ) | (30 | ) | ||||
|
|
|
| |||||
Balance at end of period | $ | 3,506 | $ | 3,977 | ||||
|
|
|
| |||||
GSI GROUP INC.
NOTES TO CONSOLIDATED FINANCIAL STATEMENTS—(Continued)
As of December 31, 20102011
8.7. Debt
Debt consisted of the following:
| December 31, | ||||||||
| 2011 | 2010 | |||||||
| (In thousands) | ||||||||
Senior Credit Facility—term loan | $ | 10,000 | $ | — | ||||
|
|
|
| |||||
Total short-term debt | $ | 10,000 | $ | — | ||||
|
|
|
| |||||
Senior Credit Facility—term loan | $ | 30,000 | $ | — | ||||
Senior Credit Facility—revolving credit facility | 28,000 | — | ||||||
12.25% Senior Secured PIK Election Notes | — | 107,575 | ||||||
|
|
|
| |||||
Total long-term debt | $ | 58,000 | $ | 107,575 | ||||
|
|
|
| |||||
12.25% Senior Secured PIK Election NotesCredit Facility
On the Effective Date,October 19, 2011, GSI US issued $107.0consummated the refinancing of all $73.1 million in aggregate principal amount of Newits outstanding 2014 Notes which mature on July 23, 2014, pursuant to that certain Indenture, by and among GSI US, as issuerthrough the proceeds from a new $80.0 million senior secured credit agreement (the “Issuer”“Credit Agreement”), the Guarantors named therein (including GSIG and MES) and The with Bank of New York Mellon Trust Company,America, N.A., as trustee.
Interest accrues onAdministrative Agent, Silicon Valley Bank, as Syndication Agent, Merrill Lynch, Pierce, Fenner & Smith Incorporated, as Sole Lead Arranger and Sole Book Manager, and HSBC Bank USA N.A. and the New Notes atother lenders from time to time party thereto. The Credit Agreement provides for a rate$40.0 million, 4-year, term loan facility due in quarterly installments of 12.25% per year$2.5 million beginning in January 2012 and is payable quarterlya $40.0 million, 4-year, revolving credit facility (collectively the “Senior Credit Facility”) that matures in arrears on February 15, May 15, August 15 and November 15 of each year, commencing on August 15, 2010. GSI US may elect to pay the interest in cash, or, under certain conditions, by increasing the principal amount of the New Notes or issuing additional notes on the same terms and conditions as the existing New Notes (“PIK”). However, the Company is required to pay cash interest if its fixed charge coverage ratio is greater than 1.75 to 1.00. Furthermore, until the Company became current in its reporting obligations under the Securities Exchange Act of 1934, as amended (the “Exchange Act”) and until the Company’s common shares were listed on an Eligible Market (as defined in the New Indenture), the rate of interest under the New Notes was increased by2015. The Credit Agreement also provides for an additional 2% per annum, payable by PIK beginning after August 15, 2010. Additionally,uncommitted $25.0 million incremental facility, subject to the satisfaction of certain customary covenants. The weighted average interest rate and interest rate for the term loan was 3.31% and 3.17%, respectively, at December 31, 2011. The interest rate on the New Notes may be increased under certain defaults,revolving credit facility was 3.30% at December 31, 2011. We are required to pay a commitment fee on unused commitments ranging between 0.3% and 0.5% annually, based on the Company’s leverage ratio, as defined in the New Indenture. Interest PIK notes issued and PIK payments in lieuCredit Agreement. As of cash payments accrue interest at a rate of 13% per annum. The Company became current in its reporting obligationsDecember 31, 2011, $12.0 million was available for borrowing on the revolving credit facility.
Outstanding borrowings under the Exchange Act on December 13, 2010 with the filing of its Form 10-Q for the quarter-ended October 1, 2010. On February 14, 2011, the Company’s common shares were listed on The NASDAQ Global Select Market under the trading symbol “GSIG”. Accordingly, as of February 14, 2011, this 2% per annum additional interest penalty ceased.
The New Notes are fully and unconditionally guaranteed, jointly and severally, on a senior secured basis by the Guarantors. The obligations of GSI US under the New Indenture and the New Notes, and each of the Guarantor’s obligations under the New Indenture, are secured by a first priority perfected security interest on all of the U.S. property and assets of GSI US and of all Guarantors, including pledges of up to 66 2/3% of the stock of the foreign subsidiaries held by GSI US and the respective Guarantors.
GSI US may, at any time, redeem up to 100% of the aggregate principal amount of the New Notes (including any such notes issued after the Effective Date), in whole or in part, at a redemption price equal to 100% of the principal amount of the New Notes to be redeemed, plus accrued and unpaid interest thereon, if any, to, but not including, the date of redemption. To the extent the aggregate principal amount of outstanding indebtedness under a working capital facility which GSI US may enter into pursuant to the terms of the New Indenture exceeds $20 million or upon certain asset sales, GSIG or GSI US will be required to offer to use such excess working capital proceeds or excess net proceeds, as applicable, to make an offer to purchase a portion of the New Notes at 100% of the principal amount thereof, plus accrued and unpaid interest through the date of purchase.
The terms of the New Notes require GSI US, GSIG and certain of their subsidiaries to comply with covenants that restrict some of their corporate activities, including the ability of GSI US, GSIG and such subsidiaries to incur additional debt, pay dividends, create liens, make investments, sell assets, repurchase equity or subordinated debt, or engage in specified transactions with affiliates.
Noncompliance with any of the covenants without cure or waiver would constitute an event of default under the New Notes. An event of default resulting from a breach of a covenant may result, at the option of the holders, in an acceleration of the principal and interest outstanding. At any time after the occurrence and during the continuance of an event of default, the New Notes will bearSenior Credit Facility initially bore interest at a rate per annum equal to Prime plus 175 basis points. Upon the thenexecution of a conversion notice in October 2011, outstanding borrowings under the Senior Credit Facility now bears interest at a rate per annum equal to LIBOR plus initial spread of 275 basis points through March 31, 2012, subject to adjustment thereafter based on the Company’s consolidated leverage ratio, payable in arrears on the last day of the applicable interest period but in no event less frequently than every three months. In addition, availability under the revolving credit facility will be subject to customary borrowing base limitations. In particular, amounts outstanding under the revolving credit facility may not exceed the borrowing base, an amount determined with reference to eligible inventory, eligible receivables and eligible cash. The borrowing base is also subject to customary reserves that may be set from time to time by the Administrative Agent under the Senior Credit Facility.
The Credit Agreement contains various customary representations, warranties and covenants applicable to the Company and its subsidiaries, including, without limitation, (i) covenants regarding maximum leverage ratio, minimum EBITDA (as defined in the Credit Agreement), and minimum fixed charge coverage ratio; (ii) limitations on dividend payments and stock repurchases; (iii) limitations on fundamental changes involving
GSI GROUP INC.
NOTES TO CONSOLIDATED FINANCIAL STATEMENTS—(Continued)
As of December 31, 20102011
applicable rate plus 2% per annum (the “Default Rate”). the Company or its subsidiaries; (iv) limitations on the disposition of assets and; (v) limitations on indebtedness, investments, restricted payments and liens. In addition, the minimum EBITDA covenant and the borrowing base are in effect until December 31, 2012, subject to satisfaction of specific financial criteria. We are in compliance with these covenants as of December 31, 2011.
The New Notesobligations of GSI US under the Senior Credit Facility are secured on a senior basis by a lien on substantially all of the assets of the Company and its material United States (“U.S.”) and United Kingdom (“U.K.”) subsidiaries and guaranteed by the Company and its material U.S. and U.K. subsidiaries, as discussed below. The Credit Agreement also contain othercontains customary events of default (subjectdefault.
The term loan facility requires amortization in the form of quarterly principal payments of $2.5 million beginning January 15, 2012. Subject to specified grace periods), including defaults based on events of bankruptcy and insolvency, cessation of effectivenesscertain exceptions, GSI US will be required to prepay outstanding loans under the Credit Agreement with the net proceeds of certain related security documentsasset dispositions and nonpaymentincurrences of certain debt. The Company may voluntarily prepay loans or reduce commitments under the Senior Credit Facility, in whole or in part, without premium or penalty, subject to minimum principal amounts.
Concurrent with securing the Senior Credit Facility on October 19, 2011, GSI US provided formal notice that it had elected to optionally redeem all $73.1 million in aggregate principal amount of its outstanding 2014 Notes in accordance with the terms of the 2014 Indenture, pursuant to which the 2014 Notes were issued. In accordance with the 2014 Indenture, the redemption price for the 2014 Notes being redeemed is 100% of the principal amount, plus accrued and unpaid interest or fees when due.thereon, if any, from the last interest payment date to, but not including, November 18, 2011, the redemption date. As a result of the delivery of the notice of redemption, the Company’s obligation to repay the 2014 Notes was accelerated to November 18, 2011. Upon delivery of the notice of redemption, an amount sufficient to repay all of the obligations of the Company and its subsidiaries under the 2014 Notes was deposited with the trustee and the Company and its subsidiaries were discharged from the 2014 Indenture.
Interest expense on the New NotesSenior Credit Facility for the year ended December 31, 20102011 was $6.6 million, including PIK$0.5 million.
Guarantees
Each Guarantor, as defined in the Credit Agreement establishing the Senior Credit Facility, jointly and severally, unconditionally guarantees the due and punctual payment of the principal, interest and fees on the Senior Credit Facility, when due and payable, whether at maturity, by required prepayment, by acceleration or otherwise. In addition, guarantors guarantee the due and punctual payment, fees and interest on the overdue principal of $0.8 million. the Senior Credit Facility and the due and punctual performance of all obligations of the Company in accordance with the terms of the Credit Agreement. Furthermore, each Guarantor, jointly and severally, unconditionally guarantees that in the event of any extension, renewal, amendment, refinancing or modification of any of the Senior Credit Facility or any of such other Obligations, as defined in the Credit Agreement, amounts due will be promptly paid in full when due or performed in accordance with the terms of the extension or renewal, at stated maturity, by acceleration or otherwise.
The PIK interest relatesobligations of each Guarantor are limited to the additional 2% assessment per annummaximum amount as described above. will, after giving effect to all other contingent and fixed liabilities of such Guarantor and after giving effect to any collections from or payments made by or on behalf of any other Guarantor in respect of the obligations of the Company or such other Guarantor under its Guarantee, as defined in the Credit Agreement, or pursuant to its contribution obligations under the Credit Facility, result in the obligations of the Company or such Guarantor under its Guarantee not
GSI GROUP INC.
NOTES TO CONSOLIDATED FINANCIAL STATEMENTS—(Continued)
As of December 31, 2010,2011
constituting a fraudulent conveyance or fraudulent transfer under federal or state law. Each Guarantor that makes a payment or distribution under a Guarantee is entitled to a contribution from each other Guarantor of its Pro Rata Share, as defined in the Credit Agreement, based on the adjusted net assets of each Guarantor. The Guarantees will continue to be effective or be reinstated, as the case may be, if at any time any payment of any of the obligations of the Guarantors is rescinded or must otherwise be returned upon the insolvency, bankruptcy or reorganization of the Company, a Guarantor or otherwise, all as though such payment had not been made.
Each Guarantor may be released from its obligations under its respective Guarantee and its obligations under the Credit Agreement upon the occurrence of certain events, including, but not limited to: (i) the Guarantor ceases to be a Subsidiary, as defined in the Credit Agreement and (ii) payment in full of the principal, accrued and unpaid interest on the Senior Credit Facility, and all other Obligations.
As of December 31, 2011, the maximum potential amount of future payments the Guarantors could be required to make under the Guarantee is the principal amount of the Senior Credit Facility plus all unpaid but accrued interest totaled $1.9thereon. However, as of December 31, 2011, the Guarantors are not expected to be required to perform under the Guarantee.
Mortgages
In connection with the Agreement and as required thereby, Quantronix Corporation (“Quantronix”), Synrad, Inc. (“Synrad”) and Control Laser Corporation (“Control Laser”), each a subsidiary of the Company, entered into an Open-End Deed of Trust, Assignment of Leases and Rents, Security Agreement and Fixture Filing, dated as of October 19, 2011, in favor of or for the benefit of the Trustee, wherein Quantronix, Synrad and Control Laser mortgaged, granted, bargained, assigned, sold and conveyed their respective interest in the property located in East Setauket, New York; Mukilteo, Washington; and Orlando, Florida, respectively, to secure (a) the payment of all of the obligations of the Borrower and the Guarantors under the Credit Agreement, the respective mortgages and the other Security Documents (as defined in the respective mortgage), and (b) the performance of all terms, covenants, conditions, provisions, agreements and liabilities contained in the Credit Agreement, the respective mortgage and the other Security Documents.
Loss on Extinguishment of Debt
Upon the early redemption of the Company’s 2014 Notes in 2011, the Company recorded non-cash charges of $1.1 million, to write off the unamortized deferred financing costs included in other assets. The $1.1 million loss on the early extinguishment of which $1.6 milliondebt is classified as other accrued expenses and $0.3 million (PIK) is classified as other liabilitiesincluded in interest expense in the accompanying consolidated balance sheet asstatements of operations for the year ended December 31, 2010. A $0.5 million PIK note was issued in 2010 and is classified as debt in the accompanying consolidated balance sheet as of December 31, 2010.2011.
Deferred Financing Costs
In connection with the execution of the Senior Credit Facility, the Company capitalized $3.0 million in deferred financing costs. The Company allocated these costs evenly between the two debt facilities and amortizes the costs using the effective interest method for the term loan facility (which requires quarterly principal repayments) and on a straight-line basis for the revolving credit facility, which is due at maturity in 2015. Non-cash interest expense related to the amortization of the deferred financing costs under the Senior Credit Facility for the year ended December 31, 2011 was $0.2 million. Unamortized deferred financing costs totaled $2.8 million, of which $0.3 million is included in prepaid expenses and other current assets and $2.5 million is included in other assets in the accompanying consolidated balance sheet as of December 31, 2011.
GSI GROUP INC.
NOTES TO CONSOLIDATED FINANCIAL STATEMENTS—(Continued)
As of December 31, 2011
12.25% Senior Secured PIK Election Notes
On July 23, 2010 (“the Effective Date”), GSI US issued $107.0 million in aggregate principal amount of Notes (“2014 Notes”). In 2011, the 2014 notes were extinguished. On August 17, 2011, GSI US optionally redeemed $35.0 million in aggregate principal amount (constituting 32% of the $108.1 million in aggregate principal amount) of its outstanding 2014 Notes, including PIK notes, in accordance with the terms of the 2014 Indenture, at the redemption price of 100% of the principal amount of such 2014 Notes, plus accrued and unpaid interest thereon, if any, to, but not including, August 17, 2011, the redemption date. The redemption was financed from a portion of the available cash and cash equivalents of the Company and its subsidiaries. The remaining 2014 Notes were extinguished in October 2011 as part of the debt refinancing.
Interest accrued on the 2014 Notes at a rate of 12.25% per year, commencing on August 15, 2010. GSI US had the option to elect to pay the interest in cash, or, under certain conditions, by increasing the principal amount of the 2014 Notes or issuing additional notes on the same terms and conditions as the existing 2014 Notes (“PIK”). Furthermore, until the Company became current in its reporting obligations under the Securities Exchange Act of 1934, as amended (the “Exchange Act”) and until the Company’s common shares were listed on an Eligible Market (as defined in the Indenture), the rate of interest under the 2014 Notes was increased by an additional 2% per annum, payable by PIK beginning after August 15, 2010. Interest PIK notes issued and PIK payments in lieu of cash payments accrue interest at a rate of 13% per annum. The Company became current in its reporting obligations under the Exchange Act on December 13, 2010 with the filing of its Form 10-Q for the quarter ended October 1, 2010. On February 14, 2011, the Company’s common shares were listed on The NASDAQ Global Select Market under the trading symbol “GSIG”. Accordingly, as of February 14, 2011, the 2% per annum additional interest penalty ceased.
Interest expense on the 2014 Notes for the years ended December 31, 2011 and 2010 was $10.9 million and $6.6 million, respectively. This includes PIK interest of $0.3 million and $0.8 million in 2011 and 2010, respectively. The PIK interest relates to the additional 2% assessment per annum as described above. As of December 31, 2010, accrued interest on the 2014 Notes totaled $1.9 million, of which $1.6 million is classified as other accrued expenses and $0.3 million (PIK) is classified as other liabilities in the accompanying consolidated balance sheet as of December 31, 2010. PIK notes totaling $0.5 million were issued in 2011 and 2010 and were classified as debt in the consolidated balance sheet. There was no accrued interest or additional PIK notes issued in 2011 as a result of the refinancing of the 2014 notes as described above.
In connection with the issuance of the New2014 Notes, the Company capitalized $1.6 million in deferred financing costs which arewere included in other assets in the accompanying consolidated balance sheet as of December 31, 2010. These deferred financing costs arewere being amortized to interest expense on a straight-line basis over the four year contractual term of the New Notes. As of December 31, 2010,2014 Notes based on the unamortized portion of the deferred financing costs was $1.4 million.principal balance outstanding. Non-cash interest expense related to the amortization of the deferred financing costs for the year-endedyears ended December 31, 2011 and 2010 was $0.3 million and $0.2 million.
Guarantees
Each Guarantor, as defined inmillion, respectively. The Company wrote off the New Indenture, jointly and severally, unconditionally guarantees (each a “Note Guarantee” and collectivelyremaining $1.1 million of unamortized deferred financing costs during the “Note Guarantees”) the due and punctual payment of the principal of and interest on the New Notes, when due and payable, whether at maturity, by acceleration or otherwise, the due and punctual payment of interest on the overdue principal of and interest on the New Notes, the due and punctual payment of all other Obligations, as defined in the New Indenture, and the due and punctual performance of all obligations of the Company in accordance with the terms of the New Indenture. Furthermore, each Guarantor, as defined in the New Indenture, jointly and severally, unconditionally guarantees that in the event of any extension of time of payment or renewal of any of the New Notes or any of such other Obligations, as defined in the New Indenture, with respect to the New Notes, amounts due will be promptly paid in full when due or performed in accordance with the terms of the extension or renewal, at stated maturity, by acceleration or otherwise.
The obligations of each Guarantor are limited to the maximum amount as will, after giving effect to all other contingent and fixed liabilities of such Guarantor and after giving effect to any collections from or payments made by or on behalf of any other Guarantor in respect of the obligations of the Company or such other Guarantor under its Note Guarantee or pursuant to its contribution obligations under the New Indenture, result in the obligations of the Company or such Guarantor under its Note Guarantee not constituting a fraudulent conveyance or fraudulent transfer under federal or state law. Each Guarantor that makes a payment or distribution under a Note Guarantee is entitled to a contribution from each other Guarantor in a pro rata amount based on the Adjusted Net Assets, as defined, of each Guarantor. The Note Guarantees will continue to be effective or be reinstated, as the case may be, if at any time any payment of any of the obligations of the Guarantors is rescinded or must otherwise be returned upon the insolvency, bankruptcy or reorganization of the Company, a Guarantor or otherwise, all as though such payment had not been made.
Each Guarantor may be released from its obligations under its respective Note Guarantee and its obligations under the New Indenture upon the occurrence of certain events, including, but not limited to: (i) sale or other
GSI GROUP INC.
NOTES TO CONSOLIDATED FINANCIAL STATEMENTS—(Continued)
As ofyear ended December 31, 2010
disposition of all or substantially all assets of such Guarantor, (ii) designation of such Guarantor as an Unrestricted Subsidiary, as defined in the New Indenture, or termination of such Guarantor’s designation as a Restricted Subsidiary, as defined in the New Indenture, and (iii) satisfaction and discharge of the New Indenture or payment in full of the principal, accrued and unpaid interest on the New Notes, and all other Obligations, as defined in the New Indenture.
As of December 31, 2010, the maximum potential amount of future payments the Guarantors could be required to make under the Note Guarantees is the principal amount of the New Notes plus all unpaid, but accrued interest thereon, including all PIK and Default Rate interest. However, as of December 31, 2010, the Guarantors are not expected to be required to perform under the Note Guarantees.
Security Agreement
On the Effective Date and2011 in connection with the New Indenture, GSI US entered into a Security Agreement (the “Security Agreement”) with the Guarantors and the Trustee, as collateral agent thereunder, pursuant to which GSI US and the Guarantors, as grantors under the Security Agreement, provided for the grant of a first priority perfected security interest in all (except as otherwise provided therein)extinguishment of the U.S. property and assets of GSI US and each Guarantor to secure GSI US’s obligations under the New Indenture and the New Notes and each Guarantor’s obligations under the New Indenture, including pledges of up to 66 2/3% of the stock of the foreign subsidiaries held by GSI US and the respective Guarantors.
Mortgages
In connection with the Security Agreement and as required thereby, Synrad, Inc. (“Synrad”), Control Laser Corporation (“Control Laser”) and Photo Research, Inc. (“Photo Research”), each a subsidiary of the Company, entered into an Open-End Deed of Trust, Assignment of Leases and Rents, Security Agreement and Fixture Filing, dated as of July 23, 2010, in favor of or for the benefit of the Trustee, wherein Synrad, Control Laser and Photo Research mortgaged, granted, bargained, assigned, sold and conveyed their respective interest in the property located in Mukilteo, Washington; Orlando, Florida; and Los Angeles, California, respectively, to secure (a) the payment of all of the obligations of the Issuer and the Guarantors under the New Indenture, the respective mortgages and the other Security Documents (as defined in the respective mortgage), and (b) the performance of all terms, covenants, conditions, provisions, agreements and liabilities contained in the New Indenture, the respective mortgage and the other Security Documents.2014 Notes.
2008 Senior Notes
On August 20, 2008 (the “Closing Date”), the Company issued to various investors $210.0 million of 11% unsecured senior notes due 2013 pursuant to the terms of an indenture (the “2008 Senior Note Indenture”), along with detachable warrants (the “Warrants”) for the purchase of 1,960,840 of the Company’s common shares, for collective net proceeds to the Company of $203.5 million. The proceeds were used to fund a portion of the Company’s
GSI GROUP INC.
NOTES TO CONSOLIDATED FINANCIAL STATEMENTS—(Continued)
As of December 31, 2011
acquisition of Excel, and the 2008 Senior Notes carried a fixed interest rate of 11.0%. The Warrants were net exercised by the holders in October 2008, in exchange for 1,952,832 common shares of the Company. The Company ascribed a fair value to the Warrants in the amount of $26.3 million as of the Closing Date and recognized this amount as debt discount that was being amortized over the term of the 2008 Senior Notes. The fair value was based upon the Black-Scholes option pricing model, assuming a risk-free interest rate of 3.0%, an expected term of 5.0 years, a volatility rate of 85.0% and a 0.0% dividend yield. In addition, the Company incurred $6.5 million in issuance fees.
GSI GROUP INC.
NOTES TO CONSOLIDATED FINANCIAL STATEMENTS—(Continued)
As of December 31, 2010
As discussed in Note 1 to Consolidated Financial Statements, GSIG and two of its wholly-owned United States subsidiaries filed for bankruptcy on November 20, 2009. Accordingly, the 2008 Senior Notes were classified as a liability subject to compromise in accordance with ASC 852 in the Company’s accompanying consolidated balance sheet as of December 31, 2009, until the Company’s emergence from bankruptcy on July 23, 2010.
In accordance with the reclassification of the 2008 Senior Notes after the November 20, 2009 bankruptcy filing to liabilities subject to compromise, the Company recorded write-offs related to the remaining unamortized portion of the discount attributable to the Warrants and deferred debt financing costs in order to record the 2008 Senior Notes at the expected amount of the allowed claims. On November 20, 2009, the aggregate amount of the write-off related to the remaining unamortized portion of the discount attributable to the Warrants totaled $21.4 million, while the write-off related to the remaining unamortized portion of the deferred debt financing costs totaled $4.9 million. Both the write-off related to the remaining unamortized portion of the debt discount attributable to the Warrants and the write-off related to the deferred debt financing costs were recorded as reorganization items during the year ended December 31, 2009. For the years ended December 31, 2010 2009 and 2008,2009, the total amount recorded to interest expense related to the 2008 Senior Notes, including accretion of the debt discount attributable to the Warrants and amortization of the debt issuance costs, was $13.1 million and $27.7 million, and $10.2 million, respectively.respectively, with no comparable amount in 2011.
During the third quarter of 2008, the Company failed to timely file its annual and quarterly reports. Pursuant to a Registration Rights Agreement (the “RRA”) with the Warrant holders, the Company notified the Warrant holders that it was indefinitely suspending its registration statement on Form S-3. Under the RRA, monetary penalties accrued and were payable to the Warrant holders for failure to maintain an effective registration statement, subject to certain terms and conditions more specifically set forth therein. The Company incurred penalties under the RRA beginning in the fourth quarter of 2008 through the date of the Company’s filing for Chapter 11 bankruptcy protection on November 20, 2009. Through November 20, 2009, the Company had accrued the maximum penalty due under the RRA of $3.8 million. However, as a result of the Company’s filing for Chapter 11 bankruptcy protection on November 20, 2009, the Company reversed the existing balance of the Warrant penalty accrual as part of its reclassification of the 2008 Senior Notes as liabilities subject to compromise.
Pursuant to the Final Chapter 11 Plan, on July 23, 2010 upon emergence from bankruptcy, $74.9 million of the 2008 Senior Notes were repaid in cash, $28.1 million were exchanged for approximately 5.2 million common shares, and the remaining $107.0 million were cancelled and replaced by the New2014 Notes. In addition, the Company paid $21.7 million of accrued interest on the Effective Date, of which $6.0 million had been classified as a liability subject to compromise as of December 31, 2009 and $15.7 million had accrued from November 20, 2009 to July 23, 2010.
Fair Value of Debt
TheAs of December 31, 2011, the outstanding balance of the Company’s term loan and revolving credit facility of $68.0 million approximated fair value based on current rates available to the Company emerged from bankruptcy with $107.0 millionfor debt of 12.25% Senior Secured PIK Election Notes, which mature on July 23, 2014 (the “New Notes”). Since the date the New Notes were issued, trading activity with respect to New Notes has been limited. same maturity.
As of December 31, 2010, the estimated fair value of the Company’s New2014 Notes approximated $113.4 million. This fair value estimate represents the value at which the Company estimates the lenders could trade the debt within the financial markets, and does not represent the settlement value of these long-term debt liabilities to the Company. The fair value of the New Notes will continue to fluctuate each period and these fluctuations may have little to no correlation to the Company’s outstanding debtmillion based on quoted market prices for comparable issues.
GSI GROUP INC.
NOTES TO CONSOLIDATED FINANCIAL STATEMENTS—(Continued)
As of December 31, 20102011
balances. The Company estimated the fair value of the New Notes based on quoted market prices for comparable issues. Fair value estimates are made at a specific point in time based on relevant market information. These estimates are subjective in nature and involve uncertainties and matters of significant judgments and therefore cannot be determined with precision. Changes in assumptions could significantly affect these estimates.
No public trades occurred in the 2008 Senior Notes during the year-ended December 31, 2009. The Company engaged in ongoing negotiations regarding the value of the 2008 Senior Notes and an appropriate restructuring plan throughout this time period with the lender group and others. Thus, although the actual value of the 2008 Senior Notes may have varied materially if trading had taken place, the Company estimates that the fair value of the 2008 Senior Notes as of December 31, 2009 was its associated par value.
9. Stockholders’ Equity8. Share-Based Compensation
Stock Split
On December 29, 2010, the Company effected a one-for-three reverse stock split. All share data and per share amounts have been retroactively adjusted for the reverse stock split in the accompanying consolidated financial statements and notes thereto for all periods presented.
Capital Stock
The authorized capital of the Company consists of an unlimited number of common shares without nominal or par value. Holders of common shares are entitled to one vote per share. Holders of common shares are entitled to receive dividends, if and when declared by the Board of Directors, and to share ratably in its assets legally available for distribution to the stockholders in the event of liquidation. Holders of common shares have no redemption or conversion rights.
Warrants
As discussed in Note 8, in August 2008 the Company issued Warrants which were later net exercised in October 2008 for an aggregate of 1,952,832 common shares.
Shareholders Rights Plan
At the annual meeting of shareholders held on May 15, 2008, shareholders approved a resolution approving the continuation, amendment and restatement of the Company’s shareholders rights plan.
Prior to the 2008 annual meeting of shareholders, the Board of Directors of the Company approved an amended and restated shareholder rights plan agreement to be dated May 15, 2008 (the “Rights Plan”), if approved by shareholders at such meeting. The Rights Plan was originally approved by the Company’s shareholders on May 26, 2005 and its continued existence had to be approved and confirmed by independent shareholders on or before the date of the Company’s 2008 annual meeting of shareholders or the Rights Plan would expire.
The amended and restated shareholder rights plan created a right (which was only to be triggered if a person or a control group acquired 20% or more of the Company’s issued and outstanding publicly traded common shares) for each shareholder, other than the acquiring person or its associates or affiliates, to acquire additional
GSI GROUP INC.
NOTES TO CONSOLIDATED FINANCIAL STATEMENTS—(Continued)
As of December 31, 2010
common shares of the Company at one-half of the then market price at the time of exercise. The net effect of an exercise was to dilute the prospective acquirer’s share position, and inhibit a change of control event unless the Rights Plan was withdrawn or the buyer made a bid that was permitted by the terms of the plan.
The Rights Plan was intended to give the Company’s Board of Directors more time and control over any sale process and increase the likelihood of maximizing shareholder value. The Rights Plan was cancelled in connection with the Company’s emergence from the Chapter 11 proceedings.
Stock Repurchase Plan
In December 2005, the Company’s Board of Directors authorized a stock repurchase program providing for the repurchase of up to $15.0 million in shares of the Company’s common shares. In February 2008, the Company’s Board of Directors authorized an increase in the stock repurchase program up to a total of $40.0 million. The Company repurchased and retired 257,489 shares, 272,277 shares, and 127,100 shares in 2008, 2007, and 2006, respectively, at an aggregate cost of $6.4 million, $7.8 million, and $3.8 million, respectively. The program was suspended in May 2008 as a result of the Company’s decision to acquire Excel. In connection with the Chapter 11 Cases, the stock repurchase program was cancelled. Accordingly, no amounts remain available for future Company purchases under this program.
10. Share-Based Compensation
Equity Compensation Plans
As of December 31, 2010,2011, the Company has one active equity compensation plan under which it may grant stock-basedshare-based compensation awards to employees, consultants and directors. The Company has other plansanother plan under which there are awards outstanding, but under which no further awards may be made as such plans wereplan was cancelled upon the Company’s emergence from bankruptcy on July 23, 2010.
2010 Incentive Award Plan
On November 23, 2010, theThe Company’s shareholders approved the Company’s 2010 Incentive Award Plan (the “2010 Incentive Plan”). in November 2010. The 2010 Incentive Plan had previously been approved and adopted by the Company’s Board of Directors on October 13, 2010, subject to the approval of the Company’s shareholders. Pursuant to the Final Chapter 11 Plan, the Company’s previous equity incentive plans were cancelled upon the Company’s emergence from bankruptcy on July 23, 2010. The Final Chapter 11 Plan required the Company to establish and implement a new management incentive plan under which shares in an amount not to exceed 8% of the fully-diluted common stock will be reserved for issuance thereunder. The maximum number of shares which can be issued pursuant to the 2010 Incentive Plan is 2,898,613, subject to adjustment as set forth in the 2010 Incentive Plan. The 2010 Incentive Plan provides for the grant of incentive stock options, non-qualified stock options, restricted stock, restricted stock units, stock appreciation rights, deferred stock, deferred stock units, dividend equivalents, performance awards and stock payments (collectively referred to as “Awards”) to employees, consultants and directors. The 2010 Incentive Plan provides for specific limits on the number of shares that may be subject to different types of Awards and the amount of cash that can be paid with respect to different types of Awards. The 2010 Incentive Plan will expire and no further Awards may be granted after October 13, 2020, the tenth anniversary of its approval by the Company’s Board of Directors. During the year-ended December 31, 2010, the Company granted 333,334 time-based restricted stock units under the 2010 Incentive Plan. As of December 31, 2010,2011, there are 2,565,2791,996,159 shares available for future issuance under the 2010 Incentive Plan.
GSI GROUP INC.
NOTES TO CONSOLIDATED FINANCIAL STATEMENTS—(Continued)
As of December 31, 2010
Restricted stock units represent the right to receive common shares or the fair market value of such shares in cash as determined by the administrator of the plan at a specified date in the future, subject to forfeiture of such right. The purchase price for restricted stock units will be determined by the administrator of the plan on an award-by-award basis. Deferred stock units entitle the recipient thereof to receive one share of common stock on the date such deferred stock unit becomes vested and other conditions are removed or expire, if applicable or upon a specified settlement date thereafter. Deferred stock units are typically awarded without payment of consideration. Generally, options and stock appreciation rights granted will have an exercise price of not less than 100% of the fair market value of the Company’s common stock on the date granted and will have a contractual term of not more than ten years from the date granted. Additionally, options can be exercisable in whole or in part, with the exception of fractional shares, and potentially subject to a minimum number of shares.shares as may be determined by the administrator of the plan. The option exercise price may be paid in cash, by check, shares of common stock which have been held by the option broker, through a broker-assisted cashless exercise, a loan or such
GSI GROUP INC.
NOTES TO CONSOLIDATED FINANCIAL STATEMENTS—(Continued)
As of December 31, 2011
other methods as the administrator of the plan may accept from time to time. The administrator of the plan may, in some cases, have the right to substitute stock appreciation rights for options granted under the 2010 Incentive Plan at any time prior to or upon exercise of options.
Shares subject to Awards that have expired, been forfeited or settled in cash, or repurchased by the Company at the same price paid by reason of a forfeiture provisionthe awardee may be added back to the number of shares available for grant under the 2010 Incentive Plan and may be granted as new Awards. Shares that are used to pay the exercise price for an option, shares withheld to pay taxes, shares subject to a stock appreciation right that are not issued in connection with the stock settlement of the stock appreciation right on exercise thereof, and shares purchased on the open market with the cash proceeds from the exercise of options will be cancelled and will not be added back to the number of shares available for grant under the 2010 Incentive Plan. Shares issued to satisfy awardsAwards under the 2010 Incentive Plan may be previously authorized but unissued shares or shares bought on the open market or otherwise.
The table below summarizes activityactivities relating to restricted stock units issued and outstanding under the 2010 Incentive Plan during the year-endedyear ended December 31, 2010:2011:
| Restricted Stock Units (In thousands) | Market Price Per Share | Weighted Average Grant Date Fair Value | Weighted Average Remaining Vesting Period in Years | Aggregate Intrinsic Value(1) (In thousands) | Restricted Stock Units (In thousands) | Weighted Average Grant Date Fair Value | Weighted Average Remaining Vesting Period in Years | Aggregate Intrinsic Value(1) (In thousands) | ||||||||||||||||||||||||||||
Unvested at December 31, 2009 | — | $ | — | $ | — | |||||||||||||||||||||||||||||||
Unvested at December 31, 2010 | 333 | $ | 9.87 | |||||||||||||||||||||||||||||||||
Granted | 333 | 9.87 | 9.87 | 537 | 11.36 | |||||||||||||||||||||||||||||||
Vested | — | — | — | (119 | ) | 9.90 | ||||||||||||||||||||||||||||||
Forfeited | — | — | — | (10 | ) | 10.30 | ||||||||||||||||||||||||||||||
| ||||||||||||||||||||||||||||||||||||
Unvested at December 31, 2010 | 333 | $ | 9.87 | $ | 9.87 | 1.97 years | $ | 3,527 | ||||||||||||||||||||||||||||
Unvested at December 31, 2011 | 741 | $ | 10.94 | 1.35 years | $ | 7,584 | ||||||||||||||||||||||||||||||
| ||||||||||||||||||||||||||||||||||||
Exercisable at December 31, 2010 | — | — | — | — | — | |||||||||||||||||||||||||||||||
Expected to vest as of December 31, 2011 | 736 | $ | 10.94 | 1.35 years | $ | 7,529 | ||||||||||||||||||||||||||||||
| ||||||||||||||||||||||||||||||||||||
Expected to vest as of December 31, 2010 | 333 | $ | 9.87 | $ | 9.87 | 1.97 years | $ | 3,527 | ||||||||||||||||||||||||||||
| (1) | The aggregate intrinsic value is calculated based on the fair value of $10.23 per share of the Company’s common stock on December 31, |
GSI GROUP INC.
NOTES TO CONSOLIDATED FINANCIAL STATEMENTS—(Continued)
AsThe total fair value of December 31,restricted stock units that vested in 2011, based on the market price of the underlying stock on the day of vesting, was $1.2 million. No restricted stock units vested in 2010
or 2009.
2006 Equity Incentive Plan
On May 15, 2006, shareholders of the Company approved theThe Company’s 2006 Equity Incentive Plan which provided for the sale or grant of various awards of, or the value of, the Company’s common shares, including stock options, stock appreciation rights, restricted stock and performance shares and units, performance-based awards, and stock grants, to officers, directors, employees and certain consultants toof the Company. From 2006 through the date of plan cancellation, the Company had issued only restricted stock in the form of time and performance-based grants to senior executives, key employees and directors under this plan. It is the Company’s policy to issue new shares for awards issued pursuant to the 2006 Equity Incentive Plan. The maximum number of shares which could have been issued pursuant to the 2006 Equity Incentive Plan was 3,135,333 shares, including a 833,333 share increase as approved by the Company’s shareholders at the May 2008 annual meeting, and subject to adjustment in the event of certain corporate events and reduced by the number of shares already issued pursuant to awards under the Company’s 1992 and 1995 Equity Incentive Plans. The plan had a ten-year term. All unvested restricted stock awards and unexercised options to purchase shares of common stock related to the Company’s 2006 Equity Incentive Plan that were outstanding on the date of the Company’s emergence from bankruptcy were assumed by the reorganized Company upon emergence, other than those held by the Company’s directors who did not continue as members of the reorganized Company’s Board of Directors following emergence. Such assumed restricted stock awards and options will be honored by the Company as if they had originally been granted for the issuance of the Company’s post-emergence common shares. The Company’s 2006 Equity Incentive Plan was cancelled upon the Company’s emergence from bankruptcy. Accordingly, no shares remain available for future issuance under this plan.
GSI GROUP INC.
NOTES TO CONSOLIDATED FINANCIAL STATEMENTS—(Continued)
As of December 31, 2011
The table below summarizes activity relating to restricted stock awards issued and outstanding under the 2006 Equity Incentive Plan during the year-endedyear ended December 31, 2010:2011:
| Restricted Stock Awards (In thousands) | Weighted Average Grant Date Fair Value | Restricted Stock Awards (In thousands) | Weighted Average Grant Date Fair Value | |||||||||||||
Nonvested restricted stock at December 31, 2009 | 254 | $ | 15.20 | |||||||||||||
Nonvested restricted stock at December 31, 2010 | 31 | $ | 11.36 | |||||||||||||
Granted | 12 | $ | 6.90 | — | — | |||||||||||
Vested | (146 | ) | $ | 23.11 | (18 | ) | $ | 15.51 | ||||||||
Forfeited | (89 | ) | $ | 4.03 | (6 | ) | $ | 8.12 | ||||||||
| ||||||||||||||||
Nonvested restricted stock at December 31, 2010 | 31 | $ | 6.80 | |||||||||||||
Nonvested restricted stock at December 31, 2011 | 7 | $ | 3.91 | |||||||||||||
| ||||||||||||||||
The weighted-average grant date fair value per share of the restricted stock awards granted in 2010, 2009 and 2008 was $6.90, $1.83 and $23.73, respectively. The total fair value of restricted stock awards that vested in 2011, 2010 2009 and 2008,2009, based on the market price of the underlying stock on the day of vesting, was $0.2 million, $1.0 million and $0.2 million, and $2.3 million, respectively.
Other Incentive Compensation Plans
Prior to the Company’s emergence from bankruptcy, the Company had several stock option plans with outstanding grants that pre-dated the 2006 Equity Incentive Plan. In 2005, the unvested options were accelerated. No new options were to be granted under pre-2006 equity plans. All unexercised options to purchase shares of common stock related to the Company’s pre-2006 equity plans that were outstanding on the date of the Company’s emergence from bankruptcy were assumed by the reorganized Company upon emergence, other than those held by the Company’s directors who did not continue as members of the reorganized Company’s Board of
GSI GROUP INC.
NOTES TO CONSOLIDATED FINANCIAL STATEMENTS—(Continued)
As of December 31, 2010
Directors following emergence. Such assumed options will be honored by the Company as if they had originally been granted for the issuance of the Company’s post-emergence common shares. All of the Company’s pre-2006 equity plans were cancelled upon the Company’s emergence from bankruptcy. Accordingly, no shares remain available for future issuance under these plans.
The table below summarizes activity relating to options outstanding under the pre-2006 equity plans during the year ended December 31, 2010:
| Number of Shares (In thousands) | Weighted Average Exercise Price | Weighted Average Remaining Term in Years | Aggregate Intrinsic Value(1) | |||||||||||||
Outstanding at December 31, 2009 | 88 | $ | 29.47 | 1.24 years | $ | — | ||||||||||
Granted | — | — | ||||||||||||||
Exercised | — | — | ||||||||||||||
Forfeited and expired | (81 | ) | $ | 29.65 | ||||||||||||
Outstanding at December 31, 2010 | 7 | $ | 27.32 | 0.48 years | $ | — | ||||||||||
Exercisable at December 31, 2010 | 7 | $ | 27.32 | 0.48 years | $ | — | ||||||||||
No options were exercised during the years ended December 31, 2010 or 2009. The intrinsic value of options exercised during the year ended December 31, 2008 was less than $0.1 million.
The following summarizes outstanding and exercisable options as of December 31, 2010:
Exercise Prices | Number of Shares (In thousands) | Weighted Average Remaining Term (In years) | Weighted Average Exercise Price | |||||||||
$26.49 | 3 | 0.85 | $ | 26.49 | ||||||||
$28.08 | 4 | 0.14 | $ | 28.08 | ||||||||
| 7 | 0.48 | $ | 27.32 | |||||||||
Other Issuances
On September 2, 2010, the Company granted 83,337 deferred stock units to the members of its Board of Directors at a weighted average grant date fair value of $6.66 per share. The deferred stock units were issued pursuant to standalone award agreements that are independent of an equity incentive plan. These transactions were exempt from registration under the Securities Act of 1933 pursuant to Section 4(2) of such act as transactions not involving a public offering. Each deferred stock unit represents the right to receive one common share of the Company on the date of termination of the holder’s service with the Company’s Board of Directors. The deferred stock units were fully vested and nonforfeitable on the date of grant. Accordingly, the associated compensation expense was recognized in full on the date of grant. The Company recognized approximately $0.6 million of compensation expense related to the deferred stock units during the year-endedyear ended December 31, 2010 based on the grant date fair value of $6.66 per share. The grant date
GSI GROUP INC.
NOTES TO CONSOLIDATED FINANCIAL STATEMENTS—(Continued)
As of December 31, 2010
fair value was determined based on the closing market price of the Company’s common stock on the date of grant. The expense associated with the Company’s deferred stock units is reported within selling, general and administrative expense in the accompanying consolidated statement of operations for the year-endedyear ended December 31, 2010.
Share-Based Compensation Expense
The Company recognized share-based compensation expense totaling $3.3 million, $1.9 million $2.1 million and $2.8$2.1 million during the years ended December 31, 2011, 2010 2009 and 2008,2009, respectively. Stock compensation expense is primarily included in selling, general, and administrative expense in the Company’s consolidated statements of operations and as an increase to additional paid-in capital on the Company’s consolidated balance sheets. As the awards granted during 2011, 2010 2009 and 20082009 are issuable to the holder, typically subject to vesting provisions, with no consideration payable by the holder, the grant date fair value per share is based on the quoted price of the Company’s common stock on the date of the grant and is generally the basis for which compensation expense is recognized. ForThe restricted stock and restricted stock unit awards thathave generally been issued with a three-year vesting period and vest based solely on service conditions,conditions. Accordingly, the Company recognizes compensation expense on a straight-line basis over the requisite service period, which is generally from the grant of the awards through the end of the vesting period. For awards with vesting that is contingent upon the achievement of performance conditions, the Company recognizes compensation expense on a straight-line basis over the requisite service period, which is generally from the grant of the awards through the end of the vesting period, for each separately vesting tranche of the award. The Company reduces the compensation expense by an estimated forfeiture rate which is based on anticipated forfeitures and actual experience.
GSI GROUP INC.
NOTES TO CONSOLIDATED FINANCIAL STATEMENTS—(Continued)
As of December 31, 2011
The Company assessesexpense recorded during each of the likelihood that performance-based shares will be earned based on the probability of meeting the performance criteria. For those performance-based awards that are deemed probable of achievement, expense is recorded,years ended December 31, 2011 and for those awards that are deemed not probable of achievement, no expense is recorded. The Company assesses the probability of achievement each quarter.
Restricted stock awards and restricted2010 also includes $0.6 million related to deferred stock units have generally been issued with a three-year vesting period. Thegranted to the members of the Company’s Board of Directors, including 42,536 deferred stock units granted in 2011 pursuant to the Company’s 2010 Incentive Plan and 83,337 deferred stock units granted in 2010 pursuant to standalone award agreements that are independent of an equity incentive plan. The expense associated with the respective deferred stock units was recognized in full on the respective date of grant, as the deferred stock units were fully vested and nonforfeitable on the date of grant. Accordingly,Additionally, during the associated compensation expense of approximately $0.6 million, based on the grant date value of $6.66 per share, was recognized in full on the date of grant in 2010. Additionally, duringyears ended December 31, 2011 and 2010, the Company recognized approximately $0.1 million and $0.4 million, respectively, of compensation expense upon the acceleration of vesting of all outstanding but unvested restricted stock awards or units that had been previously granted to certain of the Company’s former Chief Executive Officerexecutives as of the respective effective datedates of termination on May 25, 2010.termination. Approximately $0.2 million of the compensation expense recognized during the years ended December 31, 2010 and 2009 relates to awards granted under the 2006 Equity Incentive Plan that were accounted for as share-based liabilities under ASC 718 until settled, forfeited or reclassified. The share-based liabilities related to the Company’s obligations arising from its commitment to issue shares of restricted stock and common stock to the members of its pre-emergence Board of Directors as compensation for their services provided as members of the Company’s Board of Directors. In connection with the Company’s emergence from bankruptcy, such obligations were either settled through the issuance of common shares, forfeited due to the termination of service or reclassified to additional paid-in capital. Accordingly, no share-based liability remains as of December 31, 2010. The associated liability is reported within other accrued expenses in the accompanying consolidated balance sheet as of December 31, 2009. The expense associated with the Company’s share-based liabilities is reported within selling, general and administrative expense in the accompanying consolidated statements of operations for the years ended December 31, 2010 and 2009. No share-based liability remained as of December 31, 2011 or 2010. No awards were accounted for as share-based liabilities during the year-ended December 31, 2008.2011.
As of December 31, 2010,2011, the Company’s outstanding equity awards for which compensation expense will be recognized in the future consist of time-based restricted stock units granted under the 2010 Incentive Plan and
GSI GROUP INC.
NOTES TO CONSOLIDATED FINANCIAL STATEMENTS—(Continued)
As of December 31, 2010
time-based restricted stock awards granted under the 2006 Equity Incentive Plan. The Company expects to record aggregate compensation expense of $3.4$6.6 million, including an estimate of forfeitures, subsequent to December 31, 2010,2011, over a weighted average period of 1.922.2 years, for all outstanding equity awards.
11.9. Employee Benefit Plans
U.K. Defined Benefit Pension Plan
The Company maintains a pension plan in the United Kingdom that consists of two components: the Final Salary Plan (the “U.K. Plan”), which is a defined benefit plan, and the Retirement Savings Plan, which is a defined contribution plan. In 1997, membership to the U.K. Plan was closed and in 2003 the Company was allowed to stop accruing additional benefits to the participants. Benefits under the U.K. Plan were based on the employees’ years of service and compensation. Most of the beneficiaries of this plan are no longer employed by the Company.
Pension and other benefit costs reflected in the accompanying consolidated statements of operations are based on a projected benefit method of valuation. Within the accompanying consolidated balance sheets, pension plan benefit liabilities are included in accrued pension liability.
The net periodic pension cost (benefit) for the U.K. Plan includes the following components:
| 2010 | 2009 | 2008 | ||||||||||
| (In thousands) | ||||||||||||
Components of the net periodic pension cost (benefit): | ||||||||||||
Service cost | $ | — | $ | — | $ | — | ||||||
Interest cost | 1,447 | 1,334 | 1,609 | |||||||||
Expected return on plan assets | (1,467 | ) | (1,310 | ) | (1,814 | ) | ||||||
Amortization of the unrecognized transition obligation (asset) | — | — | — | |||||||||
Amortization of prior service cost (credit) | — | — | — | |||||||||
Amortization of (gain) loss | 204 | 146 | 90 | |||||||||
Net periodic pension cost (benefit) | $ | 184 | $ | 170 | $ | (115 | ) | |||||
The actuarial assumptions used to compute the net periodic pension cost (benefit) for the U.K. Plan were as follows:
| 2010 | 2009 | 2008 | ||||||||||
Weighted-average discount rate | 5.8 | % | 6.0 | % | 5.8 | % | ||||||
Weighted-average rate of compensation increase | — | — | — | |||||||||
Weighted-average long-term rate of return on plan assets | 6.5 | % | 6.7 | % | 7.3 | % | ||||||
The actuarial assumptions used to compute the funded status for the U.K. Plan were as follows:
| 2010 | 2009 | |||||||
Weighted-average discount rate | 5.3 | % | 5.8 | % | ||||
Weighted-average rate of compensation increase | — | — | ||||||
Rate of inflation | 3.2 | % | 3.6 | % | ||||
Weighted-average long-term rate of return on plan assets | 5.9 | % | 6.5 | % | ||||
GSI GROUP INC.
NOTES TO CONSOLIDATED FINANCIAL STATEMENTS—(Continued)
As of December 31, 2010
The discount rate used is derived from plotting a trend curve base on the yields on all AA corporate bonds at durations up to 15 years, with the iBoxx series of Corporate Bond indices as of December 31, 2010. This was then extrapolated beyond 15 years, taking into account the trend for gilts and swaps. The discount rate was then set to reflect the expected cash flows from the plan.
The inflation assumption has been derived from the difference between the yield on government fixed interest and index-linked gilts at December 31, 2010 adjusted by 0.2% to reflect possible distortions due to supply and demand and an inflation risk premium.
The overall expected rate of return on assets assumption has been derived by calculating the weighted average of the expected rate of return for each asset class. Fixed interest securities are based on current market yields, equities and alternative assets are based on an additional return of 3.25% above U.K. government securities, and cash is based on the current Bank of England base rate.
The liabilities were calculated using a rollforward method, using the membership data provided for the 2009 valuation and updated for known movements and pension increases.
The following table provides a reconciliation of benefit obligations and plan assets of the U.K. Plan (in thousands):
| 2010 | 2009 | |||||||
Change in benefit obligation: | ||||||||
Projected benefit obligation at beginning of year | $ | 25,947 | $ | 20,819 | ||||
Service cost | — | — | ||||||
Interest cost | 1,447 | 1,334 | ||||||
Actuarial (gains)/losses | 1,297 | 2,257 | ||||||
Benefits paid | (603 | ) | (610 | ) | ||||
Foreign currency exchange rate changes | (747 | ) | 2,147 | |||||
Projected benefit obligation at end of year | $ | 27,341 | $ | 25,947 | ||||
Accumulated benefit obligation | $ | 27,341 | $ | 25,947 | ||||
Change in plan assets: | ||||||||
Fair value of plan assets at beginning of year | $ | 22,372 | $ | 18,069 | ||||
Actual return on plan assets | 2,366 | 2,424 | ||||||
Employer contributions | 2,212 | 622 | ||||||
Benefits paid | (603 | ) | (610 | ) | ||||
Foreign currency exchange rate changes | (637 | ) | 1,866 | |||||
Fair value of plan assets at end of year | $ | 25,710 | $ | 22,371 | ||||
Funding status at end of year | $ | (1,631 | ) | $ | (3,576 | ) | ||
Amount recognized in the financial statements consists of: | ||||||||
Accrued pension liability | $ | 1,631 | $ | 3,576 | ||||
Amounts included in accumulated other comprehensive income (loss) not yet recognized in periodic pension cost (benefit) | $ | (5,555 | ) | $ | (5,523 | ) | ||
Amounts expected to be amortized from accumulated other comprehensive income (loss) into net periodic pension costs over the next fiscal year consists of | ||||||||
Net actuarial loss | $ | 217 | $ | 209 | ||||
Net transition obligation | — | — | ||||||
GSI GROUP INC.
NOTES TO CONSOLIDATED FINANCIAL STATEMENTS—(Continued)
As of December 31, 2010
The Company’s overall objective is to invest in a portfolio of diversified assets, primarily through the use of institutional collective funds, to achieve long-term growth. The strategic asset allocation uses a combination of risk controlled and index strategies in fixed income and global equities. The target allocations are approximately 50% to funds investing in global equities, approximately 30% to funds investing in global bonds, approximately 16% to alternative assets (including commodities, private equity and debt, real estate, infrastructure, hedge funds and currency funds), and approximately 4% in cash. The plan maintains enough liquidity at all times to meet the near-term benefit payments.
The following table reflects the total expected benefit payments to the U.K. Plan participants as of December 31, 2010. These payments have been estimated based on the same assumptions used to measure the Company’s benefit obligation at year end (in thousands):
2011 | $ | 560 | ||
2012 | 453 | |||
2013 | 481 | |||
2014 | 857 | |||
2015 | 826 | |||
2016-2020 | 5,817 | |||
Total | $ | 8,994 | ||
In the U.K., funding valuations are conducted every three years in order to determine the future level of contributions. The Company’s latest funding valuation was completed in October 2010. Based on the results of the valuation, the Company increased its annual contributions to the U.K. Plan from approximately $0.6 million to $0.8 million for a period of 10 years and 5 months beginning September 2010, including an additional one-time lump-sum payment of approximately $1.6 million, of which $0.8 million was paid in September 2010 and $0.8 million was paid in December 2010.
Japan Defined Benefit Pension Plan
The Company also maintains a tax qualified pension plan in Japan (the “Japan Plan”) that covers the majoritycertain of the Company’s Japanese employees. The Company deposits funds in various fiduciary-type arrangements and/or purchases annuities. Benefits are based on years of service and the employee’s compensation at retirement. Employees with less than twenty years of service to the Company receive a lump sum benefit payout. Employees with twenty or more years of service to the Company receive a benefit that is guaranteed for a certain number of years. Participants may, under certain circumstances, receive a benefit upon termination of employment.
Pension and other benefit costs reflected in the accompanying consolidated statements of operations are based on a projected benefit method of valuation. Within the accompanying consolidated balance sheets,The funded status of pension plan benefit liabilities are included in accrued pension liability.
The assumptions that are used to valueliabilities in the costs and obligations of the plan reflect the Japanese economic environment.accompanying consolidated balance sheets. The Company continues to fund theeach plan sufficient to meet current benefits as well as fund a portion of future benefits as permitted by regulatory authorities. An actuarial valuation of the plan was conducted as of December 31, 2010, 2009 and 2008.
GSI GROUP INC.
NOTES TO CONSOLIDATED FINANCIAL STATEMENTS—(Continued)
As of December 31, 20102011
The net periodic pension cost (benefit) for the U.K. Plan and the Japan defined benefit pension planPlan includes the following components:components (in thousands):
| 2010 | 2009 | 2008 | ||||||||||
| (In thousands) | ||||||||||||
Components of the net periodic pension cost (benefit): | ||||||||||||
Service cost | $ | 194 | $ | 251 | $ | 214 | ||||||
Interest cost | 24 | 32 | 26 | |||||||||
Expected return on plan assets | (1 | ) | (2 | ) | (5 | ) | ||||||
Amortization of the unrecognized transition obligation (asset) | 70 | 70 | 72 | |||||||||
Amortization of prior service cost (credit) | — | — | — | |||||||||
Amortization of (gain) loss | — | — | — | |||||||||
Settlement (gain) loss | — | (14 | ) | — | ||||||||
Curtailment (gain) loss | — | 130 | — | |||||||||
Net periodic pension cost (benefit) | $ | 287 | $ | 467 | $ | 307 | ||||||
| U.K. Plan | Japan Plan | |||||||||||||||||||||||
| 2011 | 2010 | 2009 | 2011 | 2010 | 2009 | |||||||||||||||||||
Components of the net periodic pension cost: | ||||||||||||||||||||||||
Service cost | $ | — | $ | — | $ | — | $ | 207 | $ | 194 | $ | 251 | ||||||||||||
Interest cost | 1,486 | 1,447 | 1,334 | 30 | 24 | 32 | ||||||||||||||||||
Expected return on plan assets | (1,576 | ) | (1,467 | ) | (1,310 | ) | — | (1 | ) | (2 | ) | |||||||||||||
Amortization of the unrecognized transition obligation | — | — | — | 78 | 70 | 70 | ||||||||||||||||||
Amortization of prior service cost | — | — | — | 4 | — | — | ||||||||||||||||||
Amortization of loss | 224 | 204 | 146 | — | — | — | ||||||||||||||||||
Settlement gain | — | — | — | — | — | (14 | ) | |||||||||||||||||
Curtailment loss | — | — | — | — | — | 130 | ||||||||||||||||||
|
|
|
|
|
|
|
|
|
|
|
| |||||||||||||
Net periodic pension cost | $ | 134 | $ | 184 | $ | 170 | $ | 319 | $ | 287 | $ | 467 | ||||||||||||
|
|
|
|
|
|
|
|
|
|
|
| |||||||||||||
The actuarial assumptions used to compute the net periodic pension cost (benefit) for the U.K. Plan and the Japan defined benefit pension planPlan were as follows:
| U.K. Plan | Japan Plan | |||||||||||||||||||||||||||||||||||
| 2010 | 2009 | 2008 | 2011 | 2010 | 2009 | 2011 | 2010 | 2009 | ||||||||||||||||||||||||||||
Weighted-average discount rate | 1.3 | % | 1.6 | % | 1.7 | % | 5.3 | % | 5.8 | % | 6.0 | % | 1.3 | % | 1.3 | % | 1.6 | % | ||||||||||||||||||
Weighted-average rate of compensation increase | 3.0 | % | 3.0 | % | 3.0 | % | — | — | — | 3.0 | % | 3.0 | % | 3.0 | % | |||||||||||||||||||||
Weighted-average long-term rate of return on plan assets | 0.1 | % | 0.3 | % | 0.8 | % | 5.9 | % | 6.5 | % | 6.7 | % | — | 0.1 | % | 0.3 | % | |||||||||||||||||||
The actuarial assumptions used to compute the funded status for the U.K. Plan and the Japan defined benefit pension planPlan were as follows:
| U.K. Plan | Japan Plan | |||||||||||||||||||||||
| 2010 | 2009 | 2011 | 2010 | 2011 | 2010 | |||||||||||||||||||
Weighted-average discount rate | 1.3 | % | 1.3 | % | 4.9 | % | 5.3 | % | 1.2 | % | 1.3 | % | ||||||||||||
Weighted-average rate of compensation increase | 3.0 | % | 3.0 | % | — | — | 3.0 | % | 3.0 | % | ||||||||||||||
Weighted-average long-term rate of return on plan assets | 0.1 | % | 0.3 | % | ||||||||||||||||||||
Rate of inflation | 2.2 | % | 3.2 | % | — | — | ||||||||||||||||||
The estimatesdiscount rates used are basedderived on actuarially computed best estimates(AA) corporate bonds that have a maturity approximating the terms of the related obligations. In estimating the expected return on plan assets, the Company considered the historical performance of the major asset classes held, or anticipated to be held, by the applicable pension asset long-termplans and current forecasts of future rates of return and long-term rate of obligation escalation. Variances betweenfor these estimates and actual experience are amortized over the employees’ average remaining service life.asset classes.
GSI GROUP INC.
NOTES TO CONSOLIDATED FINANCIAL STATEMENTS—(Continued)
As of December 31, 20102011
The most recent actuarial valuation of the plan was performed as of December 31, 2010. This valuation includes the actuarial present value of the pension benefit obligation. The following table provides a reconciliation of benefit obligations and plan assets of the U.K. Plan and the Japan defined benefit pension planPlan (in thousands):
| 2010 | 2009 | |||||||
Change in benefit obligation: | ||||||||
Projected benefit obligation at beginning of year | $ | 1,805 | $ | 2,112 | ||||
Service cost | 194 | 251 | ||||||
Interest cost | 24 | 32 | ||||||
Curtailments | — | (13 | ) | |||||
Settlements | — | (490 | ) | |||||
Actuarial (gains)/losses | (22 | ) | (40 | ) | ||||
Benefits paid | (101 | ) | — | |||||
Foreign currency exchange rate changes | 242 | (47 | ) | |||||
Projected benefit obligation at end of year | $ | 2,142 | $ | 1,805 | ||||
Accumulated benefit obligation | $ | 1,698 | $ | 1,422 | ||||
Change in plan assets: | ||||||||
Fair value of plan assets at beginning of year | $ | 543 | $ | 836 | ||||
Actual return on plan assets | (9 | ) | (8 | ) | ||||
Employer contributions | 216 | 225 | ||||||
Settlements | — | (490 | ) | |||||
Benefits paid | (101 | ) | — | |||||
Foreign currency exchange rate changes | 80 | (20 | ) | |||||
Fair value of plan assets at end of year | $ | 729 | $ | 543 | ||||
Funding status at end of year | $ | (1,413 | ) | $ | (1,262 | ) | ||
Amount recognized in the financial statements consists of: | ||||||||
Accrued pension liability | $ | 1,413 | $ | 1,262 | ||||
Amounts included in accumulated other comprehensive income (loss) not yet recognized in periodic pension cost (benefit) | $ | (301 | ) | $ | (312 | ) | ||
Amounts expected to be amortized from accumulated other comprehensive income (loss) into net periodic pension costs over the next fiscal year consists of | ||||||||
Net actuarial gain | $ | — | $ | — | ||||
Net transition obligation | 75 | 66 | ||||||
The following table reflects the total expected benefit payments to plan participants as of December 31, 2010. These payments have been estimated based on the same assumptions used to measure the Company’s benefit obligation for the Japan defined benefit pension plan at year end (in thousands):
2011 | $ | 137 | ||
2012 | 145 | |||
2013 | 153 | |||
2014 | 232 | |||
2015 | 158 | |||
2016-2020 | 1,147 | |||
Total | $ | 1,972 | ||
| U.K. Plan | Japan Plan | |||||||||||||||
| 2011 | 2010 | 2011 | 2010 | |||||||||||||
Change in benefit obligation: | ||||||||||||||||
Projected benefit obligation at beginning of year | $ | 27,341 | $ | 25,947 | $ | 2,142 | $ | 1,805 | ||||||||
Service cost | — | — | 207 | 194 | ||||||||||||
Interest cost | 1,486 | 1,447 | 30 | 24 | ||||||||||||
Actuarial (gains) losses | (767 | ) | 1,297 | 95 | (22 | ) | ||||||||||
Benefits paid | (645 | ) | (603 | ) | (18 | ) | (101 | ) | ||||||||
Foreign currency exchange rate changes | (80 | ) | (747 | ) | 150 | 242 | ||||||||||
|
|
|
|
|
|
|
| |||||||||
Projected benefit obligation at end of year | $ | 27,335 | $ | 27,341 | $ | 2,606 | $ | 2,142 | ||||||||
|
|
|
|
|
|
|
| |||||||||
Accumulated benefit obligation at end of year | $ | 27,335 | $ | 27,341 | $ | 2,086 | $ | 1,698 | ||||||||
|
|
|
|
|
|
|
| |||||||||
Change in plan assets: | ||||||||||||||||
Fair value of plan assets at beginning of year | $ | 25,710 | $ | 22,372 | $ | 729 | $ | 543 | ||||||||
Actual return (loss) on plan assets | (1,247 | ) | 2,366 | (16 | ) | (9 | ) | |||||||||
Employer contributions | 802 | 2,212 | 349 | 216 | ||||||||||||
Benefits paid | (645 | ) | (603 | ) | (18 | ) | (101 | ) | ||||||||
Foreign currency exchange rate changes | (30 | ) | (637 | ) | 42 | 80 | ||||||||||
|
|
|
|
|
|
|
| |||||||||
Fair value of plan assets at end of year | $ | 24,590 | $ | 25,710 | $ | 1,086 | $ | 729 | ||||||||
|
|
|
|
|
|
|
| |||||||||
Funded status at end of year | $ | (2,745 | ) | $ | (1,631 | ) | $ | (1,520 | ) | $ | (1,413 | ) | ||||
|
|
|
|
|
|
|
| |||||||||
Amount recognized in the financial statements consists of: | ||||||||||||||||
Accrued pension liabilities | $ | 2,745 | $ | 1,631 | $ | 1,520 | $ | 1,413 | ||||||||
|
|
|
|
|
|
|
| |||||||||
Amounts included in accumulated other comprehensive loss not yet recognized in net periodic pension cost | ||||||||||||||||
Net actuarial gain (loss) | $ | (7,301 | ) | $ | (5,555 | ) | $ | (42 | ) | $ | 67 | |||||
Prior service cost | $ | — | $ | — | $ | (35 | ) | $ | — | |||||||
Net transition obligation | $ | — | $ | — | $ | (550 | ) | $ | (600 | ) | ||||||
Amounts expected to be amortized from accumulated other comprehensive loss into net periodic pension cost over the next fiscal year consists of: | ||||||||||||||||
Net actuarial loss | $ | 381 | $ | 217 | $ | — | $ | — | ||||||||
Prior service cost | $ | — | $ | — | $ | 4 | $ | — | ||||||||
Net transition obligation | $ | — | $ | — | $ | 79 | $ | 75 | ||||||||
GSI GROUP INC.
NOTES TO CONSOLIDATED FINANCIAL STATEMENTS—(Continued)
As of December 31, 20102011
The following table reflects the total expected benefit payments to plan participants and have been estimated based on the same assumptions used to measure the Company’s benefit obligations as of December 31, 2011 (in thousands):
| U.K. Plan | Japan Plan | |||||||
2012 | $ | 458 | $ | 197 | ||||
2013 | 487 | 175 | ||||||
2014 | 858 | 266 | ||||||
2015 | 762 | 182 | ||||||
2016 | 896 | 187 | ||||||
2017-2021 | 6,457 | 1,239 | ||||||
|
|
|
| |||||
Total | $ | 9,918 | $ | 2,246 | ||||
|
|
|
| |||||
In the U.K., funding valuations are conducted every three years in order to determine the future level of contributions. The Company’s latest funding valuation was completed in October 2010. Based on the results of the valuation, the Company increased its annual contributions to the U.K. Plan from approximately $0.6 million to $0.8 million for a period of 10 years and 5 months beginning September 2010, including an additional one-time lump-sum payment of approximately $1.6 million which was paid in 2010. The Company anticipates that contributions to the plan in 2011for 2012 will be $0.3 million. The plans investment strategy is low risk with preservation of principal as$0.8 million for the primary objective.U.K. Plan assets are held in insurance related investments. There was no significant change inand $0.4 million for the investment strategy of this plan during 2010, 2009 or 2008.Japan Plan.
Fair Value of Plan Assets
In the U.K., the Company’s overall objective is to invest plan assets in a portfolio of diversified assets, primarily through the use of institutional collective funds, to achieve long-term growth. The strategic asset allocation uses a combination of risk controlled and index strategies in fixed income and global equities. The target allocations are approximately 50% to funds investing in global equities, approximately 30% to funds investing in global bonds, approximately 16% to alternative assets (including commodities, private equity and debt, real estate, infrastructure, hedge funds and currency funds), and approximately 4% in cash.
In Japan, the investment strategy is primarily focused on the preservation of principal invested in insurance contracts.
The following table summarizes the fair values of the Company’s U.K. pension plan assets as of December 31, 2011 (in thousands):
Asset Category | Fair Value | Quoted Prices in Active Markets for Identical Assets (Level 1) | Significant Other Observable Inputs (Level 2) | Significant Other Unobservable Inputs (Level 3) | ||||||||||||
U.K. Plan | ||||||||||||||||
Mutual Funds: | ||||||||||||||||
Balanced(1) | $ | 12,353 | $ | — | $ | 12,353 | $ | — | ||||||||
Growth(2) | 12,136 | — | 12,136 | — | ||||||||||||
Cash | 101 | 101 | — | — | ||||||||||||
|
|
|
|
|
|
|
| |||||||||
Total | $ | 24,590 | $ | 101 | $ | 24,489 | $ | — | ||||||||
|
|
|
|
|
|
|
| |||||||||
Japan Plan | ||||||||||||||||
Insurance contracts(3) | $ | 1,086 | $ | — | $ | 1,086 | $ | — | ||||||||
|
|
|
|
|
|
|
| |||||||||
Total | $ | 1,086 | $ | — | $ | 1,086 | $ | — | ||||||||
|
|
|
|
|
|
|
| |||||||||
GSI GROUP INC.
NOTES TO CONSOLIDATED FINANCIAL STATEMENTS—(Continued)
As of December 31, 2011
| (1) | This class comprises a diversified portfolio of global investments which seeks a balanced return between capital growth and fixed income and is allocated as follows: equities (40%), debt (36%), other assets (17%) and cash (7%). |
| (2) | This class comprises a diversified portfolio of global investments which seeks long-term capital growth and is allocated as follows: equities (60%), other assets (16%), debt (18%), and cash (6%). |
| (3) | This class represents funds invested in insurance contracts. |
The following table summarizes the fair values of Plan assets as of December 31, 2010 by asset category (in thousands):
| U.K. Defined Benefit Pension Plan | ||||||||||||||||||||||||||||||||
Asset Category | Fair Value | Quoted Prices in Active Markets for Identical Assets (Level 1) | Significant Other Observable Inputs (Level 2) | Significant Other Unobservable Inputs (Level 3) | Fair Value | Quoted Prices in Active Markets for Identical Assets (Level 1) | Significant Other Observable Inputs (Level 2) | Significant Other Unobservable Inputs (Level 3) | ||||||||||||||||||||||||
U.K. Plan | ||||||||||||||||||||||||||||||||
Equity: | ||||||||||||||||||||||||||||||||
Equity securities(1) | $ | 1,477 | $ | — | $ | 1,477 | $ | — | $ | 1,477 | $ | — | $ | 1,477 | $ | — | ||||||||||||||||
Mutual Funds: | ||||||||||||||||||||||||||||||||
Balanced(2) | 11,022 | — | 11,022 | — | 11,022 | — | 11,022 | — | ||||||||||||||||||||||||
Growth(3) | 11,144 | — | 11,144 | — | 11,144 | — | 11,144 | — | ||||||||||||||||||||||||
Fixed Income: | ||||||||||||||||||||||||||||||||
Debt securities(4) | 350 | — | 350 | — | 350 | — | 350 | — | ||||||||||||||||||||||||
Cash | 1,717 | 1,717 | — | — | 1,717 | 1,717 | — | — | ||||||||||||||||||||||||
|
|
|
| |||||||||||||||||||||||||||||
Total | $ | 25,710 | $ | 1,717 | $ | 23,993 | $ | — | $ | 25,710 | $ | 1,717 | $ | 23,993 | $ | — | ||||||||||||||||
|
|
|
| |||||||||||||||||||||||||||||
Japan Plan | ||||||||||||||||||||||||||||||||
Insurance contracts(5) | $ | 729 | $ | — | $ | 729 | $ | — | ||||||||||||||||||||||||
|
|
|
| |||||||||||||||||||||||||||||
Total | $ | 729 | $ | — | $ | 729 | $ | — | ||||||||||||||||||||||||
|
|
|
| |||||||||||||||||||||||||||||
| (1) | This class comprises a diversified portfolio of global equities in various industries which |
| (2) | This class comprises a diversified portfolio of global investments which seeks a balanced return between capital growth and fixed income and is allocated as follows: equities (44%-49%), debt (28%-29%), other assets (18%-23%) and cash (4%-5%). |
| (3) | This class comprises a diversified portfolio of global investments which seeks long-term capital growth and is allocated as follows: equities (56%-65%), other assets (18%-28%), debt (14%), and cash (2%-3%). |
| (4) | This class represents a passively managed index fund investing primarily in government or other public securities issued by the government of the U.K. |
| (5) | This class represents funds invested in insurance contracts. |
The tabletables above presentspresent the fair value of the U.K. Planplan assets in accordance with the fair value hierarchy. Certain pension plan assets are measured using net asset value per share (or its equivalent) and are reported as a level 2 investment above due to the Company’s ability to redeem its investmentinvestments either at the balance sheet date or within limited time restrictions.
The following table summarizes the fair values of the Company’s Japan defined benefit pension plan assets as of December 31, 2010 by asset category (in thousands):
| Japan Defined Benefit Pension Plan | ||||||||||||||||
Asset Category | Fair Value | Quoted Prices in Active Markets for Identical Assets (Level 1) | Significant Other Observable Inputs (Level 2) | Significant Other Unobservable Inputs (Level 3) | ||||||||||||
Insurance contracts(1) | $ | 729 | $ | — | $ | 729 | $ | — | ||||||||
Total | $ | 729 | $ | — | $ | 729 | $ | — | ||||||||
GSI GROUP INC.
NOTES TO CONSOLIDATED FINANCIAL STATEMENTS—(Continued)
As of December 31, 20102011
The following table summarizes the fair values of the Company’s U.K. pension plan assets as of December 31, 2009 by asset category (in thousands):
| U.K. Defined Benefit Pension Plan | ||||||||||||||||
Asset Category | Fair Value | Quoted Prices in Active Markets for Identical Assets (Level 1) | Significant Other Observable Inputs (Level 2) | Significant Other Unobservable Inputs (Level 3) | ||||||||||||
Equity securities(1) | $ | 16,979 | $ | — | $ | 16,979 | $ | — | ||||||||
Debt securities(2) | 1,249 | — | 1,249 | — | ||||||||||||
Property(3) | 1,998 | — | 1,998 | — | ||||||||||||
Cash | 2,145 | 2,145 | — | — | ||||||||||||
Total | $ | 22,371 | $ | 2,145 | $ | 20,226 | $ | — | ||||||||
The table above presents the fair value of the U.K. Plan assets in accordance with the fair value hierarchy. Certain pension plan assets are measured using net asset value per share (or its equivalent) and are reported as a level 2 investment above due to the Company’s ability to redeem its investment either at the balance sheet date or within limited time restrictions.
The following table summarizes the fair values of the Company’s Japan defined benefit pension plan assets as of December 31, 2009 by asset category (in thousands):
| Japan Defined Benefit Pension Plan | ||||||||||||||||
Asset Category | Fair Value | Quoted Prices in Active Markets for Identical Assets (Level 1) | Significant Other Observable Inputs (Level 2) | Significant Other Unobservable Inputs (Level 3) | ||||||||||||
Insurance contracts(1) | $ | 543 | $ | — | $ | 543 | $ | — | ||||||||
Total | $ | 543 | $ | — | $ | 543 | $ | — | ||||||||
Defined Contribution Plans
The Company has defined contribution employee savings plans in the United Kingdom,U.K. and the United States and Canada. In the United Kingdom the Company offers a retirement savings plan. The United States employees can make contributions to a 401(k) plan.U.S. The Company matches the contributions of participating employees on the basis of percentages specified in each plan. Company matching contributions to the plans were $1.6$2.0 million, $1.6 million and $3.0$1.6 million in 2011, 2010 and 2009, and 2008, respectively.
10. Income Taxes
Components of our income (loss) from continuing operations are as follows:
| 2011 | 2010 | 2009 | ||||||||||
| (In thousands) | ||||||||||||
Income (loss) from continuing operations before income taxes: | ||||||||||||
Canadian | $ | (871 | ) | $ | 1,302 | $ | 2,609 | |||||
U.S. | 15,928 | (6,813 | ) | (75,798 | ) | |||||||
Other | 17,000 | 15,611 | 1,279 | |||||||||
|
|
|
|
|
| |||||||
Total | $ | 32,057 | $ | 10,100 | $ | (71,910 | ) | |||||
|
|
|
|
|
| |||||||
Components of the Company’s income tax provision (benefit) are as follows:
| 2011 | 2010 | 2009 | ||||||||||
| (In thousands) | ||||||||||||
Current | ||||||||||||
Canadian | $ | — | $ | 629 | $ | 81 | ||||||
U.S. | 1,358 | 1,781 | (2,712 | ) | ||||||||
Other | 1,620 | 3,192 | 623 | |||||||||
|
|
|
|
|
| |||||||
| 2,978 | 5,602 | (2,008 | ) | |||||||||
Deferred | ||||||||||||
Canadian | — | (40 | ) | 3,691 | ||||||||
U.S. | (743 | ) | 4,946 | (2,565 | ) | |||||||
Other | 821 | 231 | 109 | |||||||||
|
|
|
|
|
| |||||||
| 78 | 5,137 | 1,235 | ||||||||||
|
|
|
|
|
| |||||||
Income tax provision (benefit) | $ | 3,056 | $ | 10,739 | $ | (773 | ) | |||||
|
|
|
|
|
| |||||||
GSI GROUP INC.
NOTES TO CONSOLIDATED FINANCIAL STATEMENTS—(Continued)
As of December 31, 20102011
12. Income Taxes
The Company recorded a tax expense of $10.7 million during the 2010 fiscal year. The effective tax rate for 2010 was 106.3% of income before taxes, compared to an effective tax rate of (1.1%) of income before taxes for 2009. The Company is incorporated in Canada and therefore uses the Canadian statutory rate. The Company’s tax rate in 2010 differs from the Canadian statutory rate of 28.0% due to a $9.6 million charge for unfavorable permanent differences primarily related to non-deductible bankruptcy costs, a $0.9 million charge related to the expiration of net operating losses in Canada, and a $1.0 million increase in the Company’s liability for uncertain tax positions. The aforementioned charges were partially offset by benefits derived from a $0.2 million increase in research and development tax credits, a $0.3 million benefit related to interest income on previously filed income tax returns, a $3.8 million net decrease in valuation allowance and a $0.9 million benefit due to international tax rate differences.
| 2010 | 2009 | 2008 | ||||||||||
| (In thousands) | ||||||||||||
Income (loss) from continuing operations before income taxes: | ||||||||||||
Canadian | $ | 1,302 | $ | 2,609 | $ | 4,664 | ||||||
U.S. | (6,813 | ) | (75,798 | ) | (252,693 | ) | ||||||
Other | 15,611 | 1,279 | (3,792 | ) | ||||||||
Total | $ | 10,100 | $ | (71,910 | ) | $ | (251,821 | ) | ||||
Details of the income tax provision (benefit) are as follows: |
| |||||||||||
| 2010 | 2009 | 2008 | ||||||||||
| (In thousands) | ||||||||||||
Current | ||||||||||||
Canadian | $ | 629 | $ | 81 | $ | 388 | ||||||
U.S. | 1,781 | (2,712 | ) | (5,518 | ) | |||||||
Other | 3,192 | 623 | 837 | |||||||||
| 5,602 | (2,008 | ) | (4,293 | ) | ||||||||
Deferred | ||||||||||||
Canadian | (40 | ) | 3,691 | 1,332 | ||||||||
U.S. | 4,946 | (2,565 | ) | (36,151 | ) | |||||||
Other | 231 | 109 | 80 | |||||||||
| 5,137 | 1,235 | (34,739 | ) | |||||||||
Income tax provision (benefit) | $ | 10,739 | $ | (773 | ) | $ | (39,032 | ) | ||||
GSI GROUP INC.
NOTES TO CONSOLIDATED FINANCIAL STATEMENTS—(Continued)
As of December 31, 2010
The reconciliation of the statutory Canadian income tax rate related to income from continuing operations before income taxes to the effective rate is as follows:
| 2010 | 2009 | 2008 | ||||||||||
| (In thousands, except percentages) | ||||||||||||
Reconciliation of effective tax rate in the statement of operations | ||||||||||||
Expected Canadian tax rate | 28.0 | % | 31.5 | % | 29.5 | % | ||||||
Expected income tax provision (benefit) | $ | 2,828 | $ | (22,652 | ) | $ | (74,287 | ) | ||||
Permanent differences | 9,606 | 1,288 | 47,004 | |||||||||
International tax rate differences | (863 | ) | (2,858 | ) | (13,776 | ) | ||||||
Change in valuation allowance | (3,778 | ) | 22,480 | (23 | ) | |||||||
Prior year provision to tax return differences | 832 | (271 | ) | 1,927 | ||||||||
NOL expirations | 877 | 2,653 | — | |||||||||
Statutory tax rate change | 371 | (41 | ) | 98 | ||||||||
Uncertain tax positions | 972 | 732 | 1,165 | |||||||||
Tax credits | (197 | ) | (193 | ) | (244 | ) | ||||||
State income tax, net | 520 | (1,736 | ) | (1,647 | ) | |||||||
Withholding tax | (67 | ) | 80 | 388 | ||||||||
Amended returns and prior filings | (318 | ) | (762 | ) | 363 | |||||||
Other | (44 | ) | 507 | — | ||||||||
Reported income tax provision (benefit) | $ | 10,739 | $ | (773 | ) | $ | (39,032 | ) | ||||
Effective tax rate (benefit) | 106.3 | % | (1.1 | )% | (15.5 | )% | ||||||
Judgment is required in determining the Company’s worldwide income tax provision. In the ordinary course of global business, there are many transactions and calculations where the ultimate outcome is uncertain. Although the Company believes its estimates are reasonable, no assurance can be given that the final outcome of these matters will not be different from that which is reflected in its historical income tax provisions and accruals. Such differences could have a material impact on the Company’s income tax provision and operating results in the period in which such determination is made.
GSI GROUP INC.
NOTES TO CONSOLIDATED FINANCIAL STATEMENTS—(Continued)
As of December 31, 2010
| 2011 | 2010 | 2009 | ||||||||||
| (In thousands, except percentages) | ||||||||||||
Statutory Canadian tax rate | 27.0 | % | 28.0 | % | 31.5 | % | ||||||
Expected income tax provision (benefit) | $ | 8,655 | $ | 2,828 | $ | (22,652 | ) | |||||
Permanent differences | 187 | 9,606 | 1,288 | |||||||||
International tax rate differences | 1,313 | (863 | ) | (2,858 | ) | |||||||
Change in valuation allowance | (9,814 | ) | (3,778 | ) | 22,480 | |||||||
Prior year provision to return differences | 1,115 | 832 | (271 | ) | ||||||||
NOL expirations | — | 877 | 2,653 | |||||||||
Statutory tax rate change | 516 | 371 | (41 | ) | ||||||||
Uncertain tax positions | 1,332 | 972 | 732 | |||||||||
Tax credits | (416 | ) | (197 | ) | (193 | ) | ||||||
State income tax, net | 577 | 520 | (1,736 | ) | ||||||||
Amended returns and prior filings | (268 | ) | (318 | ) | (762 | ) | ||||||
Other | (141 | ) | (111 | ) | 587 | |||||||
|
|
|
|
|
| |||||||
Reported income tax provision (benefit) | $ | 3,056 | $ | 10,739 | $ | (773 | ) | |||||
|
|
|
|
|
| |||||||
Effective tax rate | 9.5 | % | 106.3 | % | (1.1 | )% | ||||||
|
|
|
|
|
| |||||||
Deferred income taxes result principally from temporary differences in the recognition of certain revenue and expense items and operating loss carryforwards and credit carryforwards for financial and tax reporting purposes. Significant components of the Company’s deferred tax assets and liabilities as of December 31, 20102011 and 20092010 are as follows:
| 2010 | 2009 | 2011 | 2010 | |||||||||||||
| (In thousands) | (In thousands) | |||||||||||||||
Deferred tax assets | ||||||||||||||||
Operating tax loss & IRC Section 163(j) carryforwards | $ | 27,546 | $ | 25,818 | ||||||||||||
Losses & IRC Section 163(j) carryforwards | $ | 17,892 | $ | 27,546 | ||||||||||||
Compensation related deductions | 2,271 | 4,327 | 3,533 | 2,271 | ||||||||||||
Tax credits | 5,958 | 4,867 | 6,395 | 5,958 | ||||||||||||
Restructuring related liabilities | 2,432 | 3,534 | 581 | 508 | ||||||||||||
Deferred revenue | 128 | 3,164 | 263 | 128 | ||||||||||||
Transaction costs | 1,792 | 1,431 | — | 1,792 | ||||||||||||
Inventory | 6,172 | 5,662 | 7,088 | 6,172 | ||||||||||||
Depreciation | 439 | 974 | 208 | 439 | ||||||||||||
Amortization | 3,675 | 3,680 | 32 | 3,675 | ||||||||||||
Original issue discount | — | 9,087 | ||||||||||||||
Warranty | 761 | 819 | ||||||||||||||
Other | 1,231 | 1,105 | ||||||||||||||
|
| |||||||||||||||
Total deferred tax assets | 50,413 | 62,544 | 37,984 | 50,413 | ||||||||||||
Valuation allowance for deferred tax assets | (29,663 | ) | (33,935 | ) | (20,357 | ) | (29,663 | ) | ||||||||
|
| |||||||||||||||
Net deferred income tax assets | $ | 20,750 | $ | 28,609 | $ | 17,627 | $ | 20,750 | ||||||||
|
| |||||||||||||||
Deferred tax liabilities | ||||||||||||||||
Unremitted earnings | $ | — | $ | (528 | ) | |||||||||||
Equity investment | $ | (699 | ) | $ | — | |||||||||||
Depreciation | (3,248 | ) | (4,282 | ) | (3,277 | ) | (3,248 | ) | ||||||||
Amortization | (19,884 | ) | (21,155 | ) | (15,542 | ) | (19,884 | ) | ||||||||
Other | (320 | ) | (77 | ) | (822 | ) | (320 | ) | ||||||||
|
| |||||||||||||||
Total deferred tax liabilities | $ | (23,452 | ) | $ | (26,042 | ) | $ | (20,340 | ) | $ | (23,452 | ) | ||||
|
| |||||||||||||||
Net deferred income tax asset (liability) | $ | (2,702 | ) | $ | (2,567 | ) | $ | (2,713 | ) | $ | (2,702 | ) | ||||
|
| |||||||||||||||
GSI GROUP INC.
NOTES TO CONSOLIDATED FINANCIAL STATEMENTS—(Continued)
As of December 31, 2011
In determining its fiscal 2011, 2010, 2009, and 20082009 tax provisions, the Company calculated deferred tax assets and liabilities for each separate jurisdiction. Management then considered a number of factors, including positive and negative evidence related to the realization of its deferred tax assets to determine whether a valuation allowance should be recognized with respect to its deferred assets. The Company has recorded valuation allowances on its deferred tax assets in jurisdictions where it is more likely than not that the deferred tax assets will not be realized. The Company has considered forecasted earnings, the mix of earnings in the jurisdictions in which the Company operates, and prudent and feasible tax planning strategies in determining the need for valuation allowances. The Company will continue to evaluate its deferred tax position on a periodic basis and will record any increase or decrease to the amount currently reflected in the period that the Company’s judgment changes.
The Company has provided valuation allowances in the amount of $29.7 million and $33.9 million at December 31, 2010 and December 31, 2009, respectively. The change in valuation allowance is due to changes in the Company’s net deferred tax asset position in numerous jurisdictions. In the United States, Canada, and the United Kingdom, the Company determined that it is more likely than not that it will not realize certain of its deferred tax assets.
GSI GROUP INC.
NOTES TO CONSOLIDATED FINANCIAL STATEMENTS—(Continued)
As The Company has provided valuation allowances in the amount of $20.4 million and $29.7 million at December 31, 2011 and December 31, 2010,
respectively. The change in valuation allowance is due to changes in the Company’s net deferred tax asset position in various jurisdictions. In conjunction with the Company’s ongoing review of its actual results and anticipated future earnings, the Company continuously reassesses the possibility of releasing the valuation allowance currently in place on its deferred tax assets. It is reasonably possible that a significant portion of the valuation allowance will be released within the next twelve months. Such a release will be reported as a reduction to income tax expense with no impact on cash flows in the quarter in which it is released.
At December 31, 2010,2011, the Company has loss carryforwards of $20.5$17.9 million (tax effected) available to reduce future years’ income for tax purposes. Of this amount, approximately $16.1$14.6 million relates to the United States and expires between 2011 and 2031, $0.2through 2032; $0.4 million relates to Canada and expires starting in 2015, $2.92015; $2.7 million relates to the United Kingdom and can be carried forward indefinitelyindefinitely; and the remaining $1.3$0.2 million relates to various foreign jurisdictions. At December 31, 2010, the Company had an Internal Revenue Code (“IRC”) Section 163(j) excess interest carryforward of $7.1 million (tax effected) available to reduce future years’ taxable income.
At December 31, 2010,2011, the Company had tax credits of approximately $6.0$6.4 million available to reduce future years’ income tax.taxes. Of this amount, approximately $3.6$4.0 million relates to the United States and expires between 2016 andthrough 2031 and $2.4 million relates to Canada of which $1.6 million expires in 2011between 2020 and 20122022 and $0.8 million can be carried forward indefinitely.
Income taxes paid during 2010 and 2009 were $2.1 and $1.0 million, respectively.
Undistributed earnings of the Company’s non-Canadian subsidiaries amounted to approximately $16.0 million asAs of December 31, 2010. The Company has not provided any income taxes or withholding taxes on2011, the undistributedamount of non-Canadian earnings as such earnings have beenthat are expected to remain indefinitely reinvested in the business.business as defined in the provisions of ASC 740, “Income Taxes”, and for which we have not provided any tax costs of repatriation, is $13.6 million. In general, the determination of the amount of the unrecognized deferred tax liability related to the undistributedreinvested earnings is not practicablepractical because of the complexities associated with its hypothetical calculation.
As of December 31, 2009,2010, the Company’s total amount of gross unrecognized tax benefits is $5.3was $5.1 million all of which would favorably affect its effective tax rate, if recognized. As of December 31, 2010,2011, the amount of gross unrecognized tax benefits totaled approximately $5.1$7.3 million all of which would favorably affect the Company’s effective tax rate, if recognized. The Company is currently under examination in the United States for tax years from 2000 to 2008. It is reasonably possible that the U.SU.S. examination for the periods from 2000 to 2008 will be completed during the next 12 months, which wouldmight result in a decrease of approximately $0 to $4.3$3.6 million in the Company’s balance of unrecognized tax benefits as a result of a settlement. The Company believes that there are no other jurisdictions in which the outcome of unresolved issues or claims is likely to be material to its results of operations, financial position or cash flows. Furthermore, the Company believes that it has adequately provided for all income tax uncertainties.
GSI GROUP INC.
NOTES TO CONSOLIDATED FINANCIAL STATEMENTS—(Continued)
As of December 31, 20102011
The reconciliation of the total amounts of unrecognized tax benefits is as follows (in thousands):
Balance at December 31, 2007 | $ | 2,988 | ||||||
Additions based on tax positions related to the current year | 729 | |||||||
Additions for tax positions of prior years | 583 | |||||||
Excel acquisition | 356 | |||||||
Reductions for tax positions of prior years | — | |||||||
Settlements | — | |||||||
Balance at December 31, 2008 | 4,656 | $ | 4,656 | |||||
Additions based on tax positions related to the current year | 677 | 677 | ||||||
Additions for tax positions of prior years | — | |||||||
Reductions for tax positions of prior years | — | |||||||
Settlements | — | |||||||
| ||||||||
Balance at December 31, 2009 | 5,333 | 5,333 | ||||||
Additions based on tax positions related to the current year | 241 | 241 | ||||||
Additions for tax positions of prior years | (36 | ) | (36 | ) | ||||
Reductions for tax positions of prior years | (450 | ) | (450 | ) | ||||
Settlements | — | |||||||
| ||||||||
Balance at December 31, 2010 | $ | 5,088 | 5,088 | |||||
Additions based on tax positions related to the current year | 2,318 | |||||||
Additions for tax positions of prior years | 55 | |||||||
Reductions to tax positions resulting from a lapse of the applicable statute of limitations | (177 | ) | ||||||
| ||||||||
Balance at December 31, 2011 | $ | 7,284 | ||||||
| ||||||||
The Company recognizes interest and penalties related to uncertain tax positions in income tax expense. As of December 31, 20102011 and 2009,2010, the Company had approximately $1.6$1.2 million and $0.8$1.6 million, respectively, of accrued interest and penalties related to uncertain tax positions. During the years ended December 31, 2010 2009 and 2008,2009, the Company recognized approximately $0.8 million $0.2 million and $0.3$0.2 million, respectively, of interest and penalties related to uncertain tax positions. During the year ended December 31, 2011, the Company recognized approximately $0.2 million in interest related to uncertain tax positions and recognized a $0.5 million benefit from lower penalties related to uncertain tax positions.
The Company files income tax returns in Canada and the U.S. federal,, various states, and foreign jurisdictions. Generally, the Company is no longer subject to U.S. federal, state or local, or foreign income tax examinations by tax authorities for the years before 2000. Currently, the Company is under examination in the United States for tax years 2000 through 2008.
The Company’s income tax returns may be reviewed in the following countries for the following periods under the appropriate statute of limitations: United States (2009-present), Canada (2004-present), United Kingdom (2007-present), China (2007-present), Japan (2005-present) and Germany (2007-present).
United States | 2000 - Present | |||
Canada | 2005 - Present | |||
United Kingdom | 2008 - Present | |||
China | 2008 - Present | |||
Japan | 2007 - Present | |||
Germany | 2006 - Present |
GSI GROUP INC.
13.NOTES TO CONSOLIDATED FINANCIAL STATEMENTS—(Continued)
As of December 31, 2011
11. Restructuring, Restatement Related Costs and Other
The following table summarizes restructuring, restatement related costs and other expenseexpenses in the accompanying consolidated statements of operations:
| Year Ended December 31, | ||||||||||||
| 2010 | 2009 | 2008 | ||||||||||
| (In thousands) | ||||||||||||
United Kingdom restructuring | $ | (70 | ) | $ | 710 | $ | 3,628 | |||||
Germany restructuring | 460 | 1,520 | 187 | |||||||||
Novi restructuring | — | — | 1,390 | |||||||||
Bedford restructuring | 1 | 11 | 3,338 | |||||||||
Restructuring charges | 391 | 2,241 | 8,543 | |||||||||
Restatement related costs and other charges | 2,201 | 14,050 | 1,942 | |||||||||
Total restructuring, restatement related costs and other charges | $ | 2,592 | $ | 16,291 | $ | 10,485 | ||||||
2011 restructuring United Kingdom restructuring Germany restructuring Other restructuring Restructuring charges Restatement related costs and other Total restructuring, restatement related costs and other 2011 2010 2009 (In thousands) $ 2,161 $ — $ — — (70 ) 710 81 460 1,520 — 1 11 2,242 391 2,241 62 2,201 14,050 $ 2,304 $ 2,592 $ 16,291
GSI GROUP INC.2011 Restructuring
NOTES TO CONSOLIDATED FINANCIAL STATEMENTS—(Continued)
As of December 31, 2010
Restructuring Charges
The Company’s initial estimate for its liability for ongoing costs associated with workforce reductions and abandoned lease facilities are recorded at fair value. Generally, the expense and liability recorded is calculated using discounted cash flows of the Company’s estimated ongoing severance obligations and lease obligations, including contractual rental and build-out commitments, net of estimated sublease rentals, offset by related sublease costs. In estimating the expense and liability for its lease obligations,November 2011, the Company estimated: (i) The costsannounced a strategic initiative (“2011 restructuring”) which aims to be incurredconsolidate operations to satisfy rentalreduce our cost structure and build-out commitments under the lease, (ii) The lead time necessary to sublease the space, (iii) The projected sublease rental rates, and (iv) The anticipated durationimprove operational efficiency. As part of subleases. The Company used a credit adjusted risk free rate of approximately 5% to discount the estimated cash flows for obligations with payments due in excess of one year.
The Company reviews its assumptions and estimates quarterly and updates its estimates of the liability as changes in circumstances require. The Company’s estimates have changed in the past, and may change in the future, resulting in additional adjustments to the estimate of the liability, and the effect of any such adjustments could be material. Changes to the Company’s estimate of the liability are recorded as additional restructuring expense (benefit). In addition, because the Company’s estimate of the liability includes the application of a discount rate to reflect the time-value of money,this initiative, the Company records imputed interest costs relatedexpects to the liability each period. These costs are reflected in restructuring expense (benefit) on the accompanying consolidated statementseliminate up to 12 facilities, through consolidation of operations.
United Kingdom Restructuring
On February 29, 2008certain manufacturing and June 27, 2008, the Company executed agreements to sell assets related to its otherwise discontinued Impact product line,sales and certain assets related to its Laser Markdistribution facilities and Excimer Laser product lines within the Precision Technology segment. The majoritydivestiture of the assets sold in the transaction represent inventory that had already been written off and were included as part of the restructuring charges recorded in 2007. Payments received on asset sales that are due beyond one year are recorded as restructuring benefits when they are received. Accordingly, the sales resulted in a restructuring benefit of $0.1 million for the year-ended December 31, 2010 and the year ended December 31, 2009, and $0.3 million for the year ended December 31, 2008. All of the assetsbusinesses. Three facilities have been soldeliminated as of December 31, 2010.2011. The Company expects to complete the consolidation and divesture of up to nine additional facilities in 2012. As part of these site closures and consolidations, the Company incurred $1.0 million of accelerated depreciation related to changes in estimated useful lives of certain long-lived assets for which the Company intends to exit. The Company estimated the net realizable value of these assets based on comparable market values of similar properties, using Level 2 inputs from the fair value hierarchy discussed in Note 4. Costs incurred during 2011 totaled $1.8 million, $0.2 million and $0.2 million for the Laser Products, Semiconductor Systems, and Precision Motion and Technologies segments, respectively.
The Company expects to incur cash charges of $4.0 million to $5.0 million related to the 2011 restructuring plan, $1.2 million of which was recorded during 2011. Additionally, the Company expects to incur non-cash restructuring charges, related to accelerated depreciation of $3.0 million to $4.0 million, $1.0 million of which was recorded during 2011. The Company expects to substantially complete the restructuring program by the end of 2012.
U.K. Restructuring
In December 2008, the Company announced the transfer of all volume relatedcertain manufacturing activities from its Rugby, U.K. facility within the Precision TechnologyLaser Products segment to the Company’s facilities in China and the then-newly acquired Excel manufacturing sites. These activities have been completed in 2009, at a total cost of $4.7 million, which is comprised of non-cash land and building impairment charges of $3.6 million, employee severance costs of $1.0 million and facility related charges of $0.1 million. In December 2008, the Company recorded $3.9 million of this total to restructuring expense. It was comprised of $3.6 million of non-cash land and building impairment charges and $0.3 million of employee severance costs. In addition to the amount recorded to restructuring, restatement related costs and other expense, the Company recorded a charge of $0.6 million for inventory write-offs against cost of goods sold in 2008.China. During the year-ended December 31, 2009, the Company recorded the remaining $0.8 million in restructuring costs related to this restructuring plan. It was comprised of $0.7 million of employee severance costs and $0.1 million forof manufacturing transition costs. NoDuring both 2010 and 2009, the Company recorded a $0.1 million restructuring costsbenefit related to the sale of inventory that had been previously written off and included in 2008 restructuring charges for the sale of assets of a discontinued U.K. product line. All of the assets pertaining to this restructuring were recorded during the year endedsold as of December 31, 2010, as the activities were completed in 2009.2010.
Germany Restructuring
As a result of restructuring programs undertaken in 2000 through 2004 and the subsequent sublease of the Company’s Munich, Germany facility within the Precision TechnologyMotion and Technologies segment in May 2007 through the end of
GSI GROUP INC.
NOTES TO CONSOLIDATED FINANCIAL STATEMENTS—(Continued)
As of December 31, 20102011
through the end of its lease term in January 2013, the Company carriedhas a $2.1$0.7 million accrual for the cost of this lease as of December 31, 2009. As noted above, the Company regularly reviews its assumptions with respect to excess space, including contractual lease payments and expected proceeds from the sublessor. Following this review, the Company recorded adjustments to the restructuring accrual in each of 2009 and 2008.2011. During the year-ended December 31, 2009, the Company determined that it would no longer recover sublease payments from the existing subtenant. Accordingly, the previous estimate of future sublease payments was revised. As a result, the Company recordedrevised to record an additional restructuring charge of $1.3 million during the year-ended December 31, 2009 related to themillion. Based on revised sublease assumptions. During the year ended December 31, 2010, the Company revised its assumptions with respect to its estimateestimates of future potential sublease proceeds. As a result,payments and interest accretion, the Company recorded an additional restructuring charge of $0.4 million. In addition, as a result of changes in the present value of the net cash flows from expected sublease income and lease expenses, the Company recorded an additional restructuring expensecharges of $0.1 million.million and $0.5 million in 2011 and 2010, respectively. As of December 31, 2010,2011, the cumulative expense related to this restructuring plan is $4.6$4.7 million. The remaining accrual of $1.4 million will be paid ratably over the remaining term of the lease, which expires in January 2013.
On July 23,During 2009, the Company initiated certain restructuring activities to consolidate its German sales and distribution operations for the Precision Technology segment located in Munich, Germany with those of Excel Technology Europe, located in Darmstadt, Germany. The Company’s lease obligations related to the facility in Darmstadt, Germany were acquired in connection with the Company’s acquisition of Excel in August 2008.operations. These consolidation activities have beenwere completed in 2009, at a total cost of $0.2 million, which iswas comprised entirely of facility related charges including a lease termination fee, required remaining lease payments and movemoving costs.
Rollforward of Accrued Expenses Related to Restructuring
The following table summarizes the accrual activities, by component, related costs. Of the total restructuring charge of $0.2 million incurred during the year ended December 31, 2009, $0.1 million was paid prior to December 31, 2009. The remaining $0.1 million was paid during the year ended December 31, 2010.
Novi Restructuring
In the second quarter of 2008, the Company implemented a plan to close its Novi, Michigan facility, which provided U.S. sales, applications and service support to a product line included in the Company’s Precision Technology segment. The Novi facility wasrestructuring charges recorded on the accompanying consolidated within the Company’s Bedford, Massachusetts facility. In connection with this action, the Company recorded a restructuring charge of $1.4 million during the year-ended December 31, 2008, consisting of $0.7 million for employee severance costs and $0.7 million in lease abandonment and related costs. The majority of the employee severance payments were made in 2008 and the remaining amounts have been paid in 2009. The lease costs are being paid ratably over the duration of the lease, which ends in 2012.balance sheets (in thousands):
Bedford Restructuring
| Total | Severance | Facility | Accelerated Depreciation | Other | ||||||||||||||||
Balance at December 31, 2009 | $ | 2,450 | $ | — | $ | 2,450 | $ | — | $ | — | ||||||||||
Restructuring charges, net | 391 | — | 391 | — | — | |||||||||||||||
Cash payments | (906 | ) | — | (906 | ) | — | — | |||||||||||||
Non-cash write-offs or other adjustments | (369 | ) | — | (369 | ) | — | — | |||||||||||||
|
|
|
|
|
|
|
|
|
| |||||||||||
Balance at December 31, 2010 | 1,566 | — | 1,566 | — | — | |||||||||||||||
Restructuring charges, net | 2,242 | 774 | 371 | 1,002 | 95 | |||||||||||||||
Cash payments | (1,250 | ) | (277 | ) | (907 | ) | — | (66 | ) | |||||||||||
Non-cash write-offs or other adjustments | (970 | ) | — | 32 | (1,002 | ) | — | |||||||||||||
|
|
|
|
|
|
|
|
|
| |||||||||||
Balance at December 31, 2011 | $ | 1,588 | $ | 497 | $ | 1,062 | $ | — | $ | 29 | ||||||||||
|
|
|
|
|
|
|
|
|
| |||||||||||
In September 2008, the Company consolidated its operations and facilities in Massachusetts to a new facility in Bedford, Massachusetts. At that time, the Company implemented a plan to reduce its United States workforce by approximately 50 people and took a restructuring charge in the third quarter of 2008 of $3.0 million for severance costs. The Company charged $1.2 million of this amount to the Semiconductor Systems segment; $0.7 million to the Precision Technology segment; and $1.1 million against corporate operations. The workforce reduction is expected to save the Company $6.8 million in annual salary and related costs. In December 2008, in connection with its consolidation of the historic Scanner business with the then-newly acquired Scanner business of Excel, Cambridge Technology, the Company recorded a restructuring charge of $0.3 million relating to employee severance costs. The $0.3 million restructuring charge was charged to the Precision Technology segment. The majority of these employee severance payments were made in 2008, and the remaining amounts have been paid in 2009.
GSI GROUP INC.
NOTES TO CONSOLIDATED FINANCIAL STATEMENTS—(Continued)
As of December 31, 2011 and 2010,
approximately $0.1 million and $0.8 million, respectively, of long term accrued restructuring liabilities were classified as other liabilities in the accompanying consolidated balance sheets. The current portion of accrued restructuring liabilities is included in other accrued expenses.
Restatement Related Costs and Other Charges
During the years ended December 31,In 2011, 2010 2009 and 2008,2009, the Company incurred costs related to third parties, including auditors, attorneys, forensic accountants, and other advisors, for services performed in connection with the restatement of the Company’s previously issued financial statements as reported in its Annual Report on Form 10-K for the year ended December 31, 2008 and its Quarterly Report on Form 10-Q for the quarter ended September 26, 2008 and other related matters, including, the SEC investigation and certain shareholder actions and the internal FCPA investigation.actions. These costs are charged to expense as incurred and are included in the Company’s restructuring, restatement related costs and other charges for the respective periods in the accompanying consolidated statements of operations. The costs incurredoperations and were $0.1 million, $2.2 million and $14.1 million in 2011, 2010 and $1.9 million in 2010, 2009, and 2008, respectively.
Rollforward of Accrued Expenses Related to RestructuringGSI GROUP INC.
The following table summarizes the accrual activity related to the Company’s restructuring charges recorded on the accompanying consolidated balance sheets (in thousands):NOTES TO CONSOLIDATED FINANCIAL STATEMENTS—(Continued)
Balance at December 31, 2007 | $ | 1,342 | ||
Restructuring charges (benefits), net | 8,543 | |||
Cash payments | (3,803 | ) | ||
Non-cash write-offs or other adjustments | (3,563 | ) | ||
Balance at December 31, 2008 | 2,519 | |||
Restructuring charges (benefits), net | 2,241 | |||
Cash payments | (2,677 | ) | ||
Non-cash write-offs or other adjustments | 367 | |||
Balance at December 31, 2009 | 2,450 | |||
Restructuring charges (benefits), net | 391 | |||
Cash payments | (906 | ) | ||
Non-cash write-offs or other adjustments | (369 | ) | ||
Balance at December 31, 2010 | $ | 1,566 | ||
As of December 31, 2010 and 2009, $0.8 million and $1.3 million, respectively, of accrued restructuring charges were included in long-term liabilities classified as accrued restructuring, net of current portion in the accompanying consolidated balance sheets. The current portion of accrued restructuring charges is included in other accrued expenses. See Note 7 to Consolidated Financial Statements.2011
14.12. Commitments and Contingencies
Operating Leases
The Company leases certain equipment and facilities under operating lease agreements. Most of these lease agreements expire between 20112012 and 2019. In the United Kingdom,U.K., where longer lease terms are more common, the Company has land leases that extend through 2078. Under the terms of the facility leases, the Company is responsible to pay real estate taxes and other operating costs. In connection with its acquisition of Excel in 2008, the Company assumed fourteen new facility leases used in manufacturing, research and development, sales and administration. The rent on certain leases is subject to escalation clauses in future years.
GSI GROUP INC.
NOTES TO CONSOLIDATED FINANCIAL STATEMENTS—(Continued)
As of December 31, 2010
In 2007, the Company signed a 12-year lease for a 147,000 square footsquare-foot facility in Bedford, Massachusetts. The terms ofIn February 2010, the Company amended the lease provideto reduce the Company with two renewal options forremaining term from approximately 10 years to 3 years from the new effective date of May 27, 2010. In the aggregate, the modification reduced the Company’s obligations under the lease by approximately $10.8 million, of which $0.9 million relates to 2013, $1.6 million relates to 2014 and $8.3 million relates to periods of five years each. The Company consolidated its Natick, Massachusetts; Billerica, Massachusetts and Wilmington, Massachusetts operations into this facility. The consolidation was completed in the second quarter of 2008.thereafter. Under the terms of the lease agreement, the landlord waived the rent payments for the first 5.5 months rent (representing a savingssaving of $0.7 million). This savingssaving is being amortized as a reduction to rent expense over the life of the amended lease, and is included within deferred rent classified as other accrued expenses or other liabilities in the accompanying consolidated balance sheets based on the associated amortization period.
The Company incurred $14.3 million in expenditures to fit-upretrofit and occupy the Bedford facility, of which the landlord provided $4.0 million in build-out allowances. These expenditures were completed as of December 31, 2008. The landlord allowance has been included in the Company’s accompanying consolidated balance sheets in property, plant and equipment, and within deferred rent classified as other accrued expenses or other liabilities based on the associated amortization period. The property, plant and equipment balance is being amortized to depreciation expense ratably over the life of the amended lease, and the landlord allowance is being offsetamortized as a reduction to rent expense, ratably over the life of the amended lease.
In February2011, 2010 the Company entered into an Amended Lease Agreement with 125 Middlesex Turnpike, LLC to reduce the remaining term of its current lease at 125 Middlesex Turnpike, Bedford, Massachusetts from approximately 10 years to 3 years from the new effective date of May 27, 2010. The rental payment will continue at $0.1 million per month. In the aggregate, the modification reduced the Company’s obligations under the current lease by approximately $10.8 million, of which $0.9 million relates to 2013, $1.6 million relates to 2014 and $8.3 million relates to periods thereafter. Accordingly, the Company’s remaining associated deferred rent and property, plant and equipment balances are being amortized over the adjusted lease term beginning on the effective date of the modification.
For the years ended December 31, 2010, 2009, and 2008 lease expense was $3.8 million, $3.8 million and $5.2 million, respectively.
Capital Leases
In 2011, the Company capitalized $2.2 million of assets which met the criteria under ASC 840-30, “Leases—Capitalized Leases”, which requires the Company to capitalize and $5.4 million, respectively. depreciate the assets over its lease term.
Future minimum lease payments under operating and capital leases expiring subsequent to December 31, 2010,2011, including both continuing operating facilities and facilities accounted for within the Company’s restructuring liability, are as follows (in thousands):
2011 | $ | 5,306 | ||||||||||
| Operating Leases | Capital Leases(1) | |||||||||||
2012 | 4,699 | $ | 5,586 | $ | 1,531 | |||||||
2013 | 2,643 | 3,169 | 756 | |||||||||
2014 | 1,241 | 1,327 | — | |||||||||
2015 | 856 | 983 | — | |||||||||
2016 | 837 | — | ||||||||||
Thereafter | 6,467 | 5,910 | — | |||||||||
|
| |||||||||||
Total minimum lease payments | $ | 21,212 | $ | 17,812 | $ | 2,287 | ||||||
|
| |||||||||||
The Company has a sublease agreement on its Novi, Michigan facility and expects that it will receive aggregate proceeds of $0.1 million from 2011 to 2012 in connection with this agreement. The payments presented in the table above do not include assumptions relative to the receipt of sublease payments.
Purchase Commitments
As of December 31, 2010, the Company had purchase commitments for inventory and services of $45.3 million. These purchase commitments are expected to be incurred as follows: $41.1 million in 2011, $3.2 million in 2012, $0.9 million in 2013 and $0.1 million in 2014.
| (1) | Capital lease payments include interest payments of $0.1 million. |
GSI GROUP INC.
NOTES TO CONSOLIDATED FINANCIAL STATEMENTS—(Continued)
As of December 31, 20102011
Line of CreditPurchase Commitments
As of December 31, 2010 and 2009,2011, the Company had an outstanding lineunconditional purchase commitments for inventory and services of credit$28.6 million. These purchase commitments are expected to secure standby letters of credit that were issued for certain facility operating leases, customer prepayments, warranty obligations, customs dutiesbe incurred as follows: $25.3 million in 2012, $2.6 million in 2013, $0.7 million in 2014 and bid bonds. The total amount available under the line of credit is approximately 500,000€, of which 429,869€ and 225,590€ was available at December 31, 2010 and 2009, respectively.less than $0.1 million in 2015.
Legal Proceedings
During the third quarter of 2005, the Company’s French subsidiary, GSI Lumonics SARL (“GSI France”), filed for bankruptcy protection, which was granted on July 7, 2005. On April 18, 2006, the commercial court of Le Creusot (France) ordered GSI France to pay approximately 0.7 million Euros to SCGI in the context of a claim filed by SCGI that a Laserdyne 890 system delivered in 1999 had unresolved technical problems. No appeal was lodged. On May 6, 2011, GSI Group Ltd. was served with summons from the official receiver of GSI France demanding that GSI Group Ltd. and the Company’s German subsidiary, GSI Group GmbH, appear before the Paris commercial court. GSI Group GmbH was subsequently served with a separate summons from the official receiver. The receiver claims (i) that the bankruptcy proceedings initiated against GSI France in 2005 should be extended to GSI Group Ltd. and GSI Group GmbH on the ground that GSI France’s decisions were actually made by GSI Group Ltd. and that GSI Group GmbH made financial advances for no consideration, which would reveal in both cases confusion of personhood, or (ii) alternatively, that GSI Group Ltd. be ordered to pay approximately 3.1 million Euros (i.e. the aggregate of GSI France’s liabilities, consisting primarily of approximately 0.7 million Euros to SCGI and approximately 2.4 million Euros to GSI Group GmbH). GSI Group Ltd. filed submissions on December 6, 2011 whereby it challenged the jurisdiction of the Paris commercial court over the claims raised by the receiver. After a request by the receiver, the Paris commercial court combined the cases against GSI Group Ltd. and GSI Group GmbH into a single case (docket number 2011/088718). The next hearing is scheduled on April 10, 2012 for the filing of the receiver’s reply on the lack of jurisdiction issue. The Company currently does not believe a loss is probable. Accordingly, no accrual has been made in the Company’s accompanying consolidated financial statements with respect to this claim.
On December 12, 2008, in connection with the delayed filing of its results for the quarter ended September 26, 2008 and the announcement of a review of revenue transactions, a putative shareholder class action alleging federal securities violations was filed in the United States District Court for the District of Massachusetts (“U.S. District Court”) against us,the Company, a former officer and a then-current officer and director. The complaint alleged that the Company and the individual defendants violated Sections 10(b) and 20(a) of the Securities Exchange Act of 1934 and Rule 10b-5 promulgated thereunder, and sought recovery of damages in an unspecified amount. In May 2010, the parties reached an agreement in principle to settle the litigation. The settlement covered purchasers of the common stock of the Company between February 27, 2007 and June 30, 2009. On February 22, 2011, the U.S. District Court entered an order granting final approval of the settlement in the putative shareholder class action. The Company’s contribution to the settlement amount was limited to the Company’s self-insured retention under its directors and officers liability insurance policy.
The Company is also subject to various legal proceedings and claims that arise in the ordinary course of business. The Company does not believe that the outcome of these claims will have a material adverse effect upon its financial condition or results of operations but there can be no assurance that any such claims, or any similar claims, would not have a material adverse effect upon its financial condition or results of operations.
Chapter 11 Cases
On November 20, 2009, GSI Group Inc. and two of its wholly-owned United States subsidiaries, GSI Group Corporation and MES International, Inc. (collectively, the Debtors“Debtors”) filed voluntary petitions for relief under
GSI GROUP INC.
NOTES TO CONSOLIDATED FINANCIAL STATEMENTS—(Continued)
As of December 31, 2011
Chapter 11 of the Bankruptcy Code in the United States Bankruptcy Court for Delaware.Delaware (the “Bankruptcy Court”) (the “Chapter 11 Cases”). On May 27, 2010, the Bankruptcy Court entered an order confirming and approving the Finala modified joint Chapter 11 Planplan of reorganization for the Debtors, which was further supplemented (as supplemented, the “Final Chapter 11 Plan”), and the Plan Documents (as defined in the Final Chapter 11 Plan). On July 23, 2010, the Debtors consummated their reorganization through a series of transactions contemplated by the Final Chapter 11 Plan, and the Final Chapter 11 Plan became effective pursuant to its terms. Certain claims under the FinalThe Chapter 11 Plan remain subject to final resolution, including claims filed by the Internal Revenue Service (“IRS”)Cases were closed on September 2, 2011, and the SEC.Company no longer has any legal or material financial constraint relating to those cases.
IRS Claim
On April 8,5, 2010, the IRS filed amended proofs of claim aggregating approximately $7.7 million with the Bankruptcy Court. To date,Court as part of the IRS has been unable to provideCompany’s proceedings under Chapter 11 of the Company with information supporting its claim.Bankruptcy Code. On July 13, 2010, the Company filed a complaint,GSI Group Corporation v. United States of America, in Bankruptcy Court in an attempt to recover refunds totaling approximately $18.8 million in federal income taxes the Company asserts it overpaid to the IRS relating to tax years 2000 through 2008, together with applicable interest. The complaint includes an objection to the IRS’ proofs of claim which the Company believes are not allowable claims and should be expunged in their entirety.
On May 13, 2010, Those tax proceedings remain pending, and their resolution in the SEC filed a proof of claim in an indeterminate amount for penalties, disgorgement, and prejudgment interest arising from possible violationsordinary course will not be affected by the closing of the federal securities laws. As noted below, the SEC has been conducting a formal investigation into certain pre-bankruptcy transactions and practices involving the Company and sent a “Wells Notice” to the Company on September 16, 2010. Based on its investigation, the SEC
GSI GROUP INC.
NOTES TO CONSOLIDATED FINANCIAL STATEMENTS—(Continued)
As of December 31, 2010
indicated in its proof of claim that it may file a civil action against the Company in an appropriate forum. The Company is unable to predict the outcome of this matter but, as noted below, the Company is cooperating fully with the SEC’s investigation.
In addition, under the terms of the Final Chapter 11 Plan, the Company is obligated to make additional payments to the holders of 2008 Senior Notes claims in its Chapter 11 Cases if the amount of certain claims under the Final Chapter 11 Plan exceeds $22.5 million. The additional payment, if any, would equal approximately $1.00 for each dollar by which the $22.5 million cap amount is exceeded. The Company cannot make a final determination of the amount, if any, the Company may owe as a result of this provision until certain claims filed in connection with its Chapter 11 Cases, including the IRS and SEC claims described above, are finally resolved. The amount of such claims, based on the known and estimated amount of such claims, is currently well below the $22.5 million cap amount. As the Company does not believe it is probable that its losses under these claims will exceed $22.5 million, nothing has been accrued in the Company’s accompanying consolidated financial statements with respect to this potential obligation.Cases.
SEC Investigation
On May 14, 2009, the SEC notified the Company that it was conducting a formal investigation relating to its historical accounting practices and the restatement of its historical consolidated financial statements. On September 16, 2010, the Company received a “Wells Notice” from the SEC, stating that the Staff iswas considering recommending that the Commission institute a civil injunctive action or administrative proceeding against the Company, alleging that the Company violated various provisions of the Securities Act and the Securities Exchange Act. In connection with the contemplated action, the SEC may seek a permanent injunction or cease-and-desist order, disgorgement, prejudgment interest and the imposition of a civil penalty. The Company continues to cooperate fully with the SEC’s investigation and is currently in settlement discussions with the SEC.
Issuance of Unregistered Securities
Between March 2007 and March 2010,On May 16, 2011, the Company inadvertently issued unregistered shares of common stock under its 2006 Equity Incentive Plan as a result of its inadvertent failureagreed to filesettle with the SEC, a registration statement on Form S-8. The 2006 Equity Incentive Plan was approvedwithout admitting or denying the findings of the SEC, by consenting to the Company’s shareholders in May 2006. During the relevant time period,entry of an administrative order that requires the Company issued approximately 257,679 duly authorized common shares with a total fair market value atto cease and desist from committing or causing any violations and any future violations of the datereporting, books and records, and internal controls provisions of issuancethe Securities Exchange Act of approximately $3,889,796 to fifty-two employees and directors under its 2006 Equity Incentive Plan. As a result,1934. The SEC did not charge the Company may be subjectwith fraud nor did the SEC require the Company to pay a civil litigation, enforcement proceedings, fines, sanctions and/penalty or penalties.other money damages as part of the settlement. The Company’s common shares, including those issued undersettlement completely resolves the 2006 Equity Incentive Plan, were exchanged for new common shares in connection with the Company’s emergence from bankruptcy pursuantSEC investigation as it relates to the exemption from registration under §1145 of the Bankruptcy Code and are now freely tradable by holders who are not deemed to be underwriters.Company.
Guarantees and Indemnifications
In the normal course of its operations, the Company executes agreements that provide for indemnification and guarantees to counterparties in transactions such as business dispositions, the sale of assets, sale of products and operating leases. Additionally, the by-laws of the Company require it to indemnify certain current or former directors, officers, and employees of the Company against expenses incurred by them in connection with each proceeding in which he or she is involved as a result of serving or having served in certain capacities. Indemnification is not available with respect to a proceeding as to which it has been adjudicated that the person
GSI GROUP INC.
NOTES TO CONSOLIDATED FINANCIAL STATEMENTS—(Continued)
As of December 31, 2010
did not act in good faith in the reasonable belief that the action was in the best interests of the Company. On June 5, 2009, the Board of Directors of the Company approved a form of indemnification agreement to be implemented by the Company with respect to its directors and officers. The form of indemnification agreement provides, among other things, that each director and officer of the Company who signs the indemnification agreement shall be indemnified to the fullest extent permitted by applicable law against all expenses, judgments,
GSI GROUP INC.
NOTES TO CONSOLIDATED FINANCIAL STATEMENTS—(Continued)
As of December 31, 2011
fines and amounts paid in settlement actually and reasonably incurred by such officer or director in connection with any proceeding by reason of his or her relationship with the Company. In addition, the form of indemnification agreement provides for the advancement of expenses incurred by such director or officer in connection with any proceeding covered by the indemnification agreement, subject to the conditions set forth therein and to the extent such advancement is not prohibited by law. The indemnification agreement also sets out the procedures for determining entitlement to indemnification, the requirements relating to notice and defense of claims for which indemnification is sought, the procedures for enforcement of indemnification rights, the limitations on and exclusions from indemnification, and the minimum levels of directors’ and officers’ liability insurance to be maintained by the Company.
Credit Risks and Other Uncertainties
The Company maintains financial instruments such as cash and cash equivalents and trade receivables. From time to time, certain of these instruments may subject the Company to concentrations of credit risk whereby one institution may hold a significant portion of the cash and cash equivalents, or one customer may compose a large portion of the accounts receivable balances.
There was no concentration of credit risk related to the Company’s position in trade accounts receivable as of either December 31, 2010 or December 31, 2009. Nono individual customer represented 10% or more of the Company’s outstanding accounts receivable at December 31, 20102011 and 2009.2010. Credit risk with respect to trade accounts receivables is generally minimized because of the diversification of the Company’s operations, as well as its large customer base and its geographical dispersion.
The Company acquired certain auction rate securities in connection with its purchase of Excel. In current markets, the fair value of these auction rate securities is not able to be ascertained by observable inputs. See Note 3 to Consolidated Financial Statements for further discussion. As of December 31, 2010, the Company had liquidated all of its previously held auction rate securities.
Certain of the components and materials included in the Company’s laser systems and optical products are currently obtained from single source suppliers. There can be no assurance that a disruption of this outside supply would not create substantial manufacturing delays and additional cost to the Company.
The Company’s operations involve a number of other risks and uncertainties including, but not limited to, the cyclicality of the semiconductor and electronics markets, the effects of general economic conditions, rapidly changing technology, and international operations.
15.13. Segment Information
Reportable Segments
The Company identifies its reportable segments based on its operating and reporting structure. The Company operates in three reportable segments: Laser Products, Precision Motion and Technologies and Semiconductor Systems. The Company’s chief operating decision maker is the Chief Executive Officer. As a result of the Company’s acquisitionChief Executive Officer’s reassessment of Excel in 2008, it reassessed its segment reporting based on the Company’s operating and reporting structure, the Company realigned the structure of its internal organization in April 2011 into three distinct operating divisions, each reporting to a separate divisional manager. Consequently, the realignment caused the composition of the combined company. In 2008,Company’s reportable segments to change from prior years, with the exception of the Semiconductor Systems segment. The new structure allows the Company concluded thatto prioritize its investments, align its resources to meet the acquisitiondemands of Excelthe markets the Company serves, optimize business performance and maximize opportunities for collaboration and synergy within each segment. The Company’s reportable segments have been identified based on commonality of end markets, customers and technologies amongst the Company’s individual product lines, which is consistent with the Company’s operating structure and associated management structure. The
GSI GROUP INC.
NOTES TO CONSOLIDATED FINANCIAL STATEMENTS—(Continued)
As of December 31, 20102011
resulted in the establishment of a third segment which was comprised solely of the operations of the then-newly acquired entity. In 2009, the Company changed the structure of its internal organization in a manner that caused the composition of its reportable segments to change. More specifically, certain portions of a specific product line within the Precision Technology segment were transferred to the Excel segment. The Company’s reportable segment financial information has been restated to reflect the updated reportable segment structure for all periods presented. The Company’s reportable segments and their principal activities consistare described below.
Laser Products
The Laser Products segment designs, manufactures and markets photonics-based solutions, consisting of lasers and laser-based systems, to customers worldwide. The segment serves highly demanding photonics-based applications such as cutting, welding, marking, engraving, micro-machining, and scientific research. The segment sells these products both directly utilizing the following:highly technical sales force and indirectly through resellers and distributors.
Precision TechnologyMotion and Technologies
ThisThe Precision Motion and Technologies segment designs, manufactures and markets air bearing spindles, encoders, thermal printers, laser scanning devices, and light and color measurement systems to customers worldwide. The vast majority of the segment’s products include technologies forproduct offerings in precision motion linear and rotary motionoptical control medical printers, lasers, electro-optical componentstechnologies are sold to original equipment manufacturers (“OEM’s”). The segment sells these products both directly utilizing a highly technical sales force and precision optics used in a broad range of commercialindirectly through resellers and semiconductor applications. These products are used in the electronics, aerospace, materials processing, data storage, imaging and other light industrial markets. The products are designed and manufactured at the Company’s facilities in the United States, Europe and Asia.distributors.
Semiconductor Systems
The Company’s Semiconductor Systems segment’s products are designed and manufactured at its facility in the United States. Specific applications include laser repair to improve yields in the production of memory chips; laser marking systems for work-in-process management and traceability of silicon wafers; laser trimming of linear and mixed signal integrated circuits and chip resistors; and inspection of solder paste and component placement on printed circuit boards. TheOur Semiconductor Systems segment also derives significant revenues from partsdesigns, develops and servicesells laser based production systems for semiconductor, microelectronics and electronics manufacturing. The segment offers a full spectrum of production systems, featuring high precision laser and motion technology, to its installed base.
Excel
This segment’s products include lasers, electro-optical components, precision opticsprocess semiconductor wafers, LCD panels and photonics-basedmicroelectronic components. Semiconductor Systems’ solutions primarily consistingaddress a wide range of laser systems usedapplications in a broad rangevariety of commercialend markets, including industrial, scientific, consumer electronics, medical, and scientific research applications. These products are used inaerospace. Today, the electronics, aerospace, materials processing, data storage, imagingsegment supplies leading global foundries, integrated design manufacturers and other light industrial markets. The products are designed and manufactured at the Company’s facilities in the United States and Europe.component manufacturers.
Reportable Segment Financial Information
| Year Ended December 31, | ||||||||||||||||||||||||
| 2010 | 2009 | 2008 | 2011 | 2010 | 2009 | |||||||||||||||||||
| (In thousands) | (In thousands) | |||||||||||||||||||||||
Sales | ||||||||||||||||||||||||
Precision Technology | $ | 128,220 | $ | 79,456 | $ | 138,684 | ||||||||||||||||||
Laser Products | ||||||||||||||||||||||||
External | $ | 130,957 | $ | 121,360 | $ | 94,567 | ||||||||||||||||||
Intersegment | 1,802 | 1,659 | 591 | |||||||||||||||||||||
Precision Motion and Technologies | ||||||||||||||||||||||||
External | 191,382 | 180,872 | 110,152 | |||||||||||||||||||||
Intersegment | 843 | 912 | 325 | |||||||||||||||||||||
Semiconductor Systems | 81,283 | 49,669 | 88,342 | |||||||||||||||||||||
Excel | 183,384 | 129,964 | 63,736 | |||||||||||||||||||||
External | 43,941 | 81,284 | 49,669 | |||||||||||||||||||||
Intersegment | — | — | — | |||||||||||||||||||||
Intersegment sales elimination | (9,371 | ) | (4,701 | ) | (2,294 | ) | (2,645 | ) | (2,571 | ) | (916 | ) | ||||||||||||
|
|
| ||||||||||||||||||||||
Total | $ | 383,516 | $ | 254,388 | $ | 288,468 | $ | 366,280 | $ | 383,516 | $ | 254,388 | ||||||||||||
|
|
| ||||||||||||||||||||||
GSI GROUP INC.
NOTES TO CONSOLIDATED FINANCIAL STATEMENTS—(Continued)
As of December 31, 20102011
| Year Ended December 31, | ||||||||||||||||||||||||
| 2010 | 2009 | 2008 | 2011 | 2010 | 2009 | |||||||||||||||||||
| (In thousands) | (In thousands) | |||||||||||||||||||||||
Gross Profit | ||||||||||||||||||||||||
Precision Technology | $ | 59,140 | $ | 31,267 | $ | 45,015 | ||||||||||||||||||
Laser Products | ||||||||||||||||||||||||
External | $ | 48,724 | $ | 46,734 | $ | 34,611 | ||||||||||||||||||
Intersegment | 1,051 | 958 | 515 | |||||||||||||||||||||
Precision Motion and Technologies | ||||||||||||||||||||||||
External | 90,741 | 88,352 | 47,787 | |||||||||||||||||||||
Intersegment | 449 | 451 | 150 | |||||||||||||||||||||
Semiconductor Systems | 31,790 | 16,157 | 28,463 | |||||||||||||||||||||
Excel | 80,135 | 53,041 | 24,764 | |||||||||||||||||||||
Intersegment gross profit elimination | (4,664 | ) | (1,919 | ) | (624 | ) | ||||||||||||||||||
External | 20,915 | 31,315 | 16,148 | |||||||||||||||||||||
Intersegment | — | — | — | |||||||||||||||||||||
Intersegment sales elimination | (1,500 | ) | (1,409 | ) | (665 | ) | ||||||||||||||||||
|
|
| ||||||||||||||||||||||
Total | $ | 166,401 | $ | 98,546 | $ | 97,618 | $ | 160,380 | $ | 166,401 | $ | 98,546 | ||||||||||||
|
|
| ||||||||||||||||||||||
The Company reports operating expenses and assets on a consolidated basis to the chief operating decision maker.
Geographic Segment Information
The Company attributesaggregates geographic sales to geographic areasbased on the basis of the customer location where products are shipped. Sales to these customers are as follows (in thousands):
| Year Ended December 31, | ||||||||||||||||||||||||||||||||||||||||||||||||
| 2010 | 2009 | 2008 | 2011 | 2010 | 2009 | |||||||||||||||||||||||||||||||||||||||||||
| Sales | % of Total | Sales | % of Total | Sales | % of Total | Sales | % of Total | Sales | % of Total | Sales | % of Total | |||||||||||||||||||||||||||||||||||||
United States | $ | 130,622 | 34.1 | % | $ | 80,299 | 31.6 | % | $ | 88,533 | 30.7 | % | $ | 123,243 | 33.6 | % | $ | 130,622 | 34.1 | % | $ | 80,299 | 31.6 | % | ||||||||||||||||||||||||
Asia-Pacific | 120,545 | 31.4 | 80,028 | 31.4 | 62,008 | 21.5 | 83,290 | 22.7 | 120,545 | 31.4 | 80,028 | 31.4 | ||||||||||||||||||||||||||||||||||||
Japan | 46,099 | 12.0 | 30,525 | 12.0 | 73,646 | 25.5 | 46,367 | 12.7 | 46,099 | 12.0 | 30,525 | 12.0 | ||||||||||||||||||||||||||||||||||||
Europe | 83,960 | 21.9 | 61,606 | 24.2 | 59,653 | 20.7 | 106,044 | 29.0 | 83,960 | 21.9 | 61,606 | 24.2 | ||||||||||||||||||||||||||||||||||||
Latin and South America, other | 2,290 | 0.6 | 1,930 | 0.8 | 4,628 | 1.6 | ||||||||||||||||||||||||||||||||||||||||||
Other | 7,336 | 2.0 | 2,290 | 0.6 | 1,930 | 0.8 | ||||||||||||||||||||||||||||||||||||||||||
|
|
|
|
|
| |||||||||||||||||||||||||||||||||||||||||||
Total | $ | 383,516 | 100.0 | % | $ | 254,388 | 100.0 | % | $ | 288,468 | 100.0 | % | $ | 366,280 | 100.0 | % | $ | 383,516 | 100.0 | % | $ | 254,388 | 100.0 | % | ||||||||||||||||||||||||
|
|
|
|
|
| |||||||||||||||||||||||||||||||||||||||||||
Long-lived assets consist of property, plant and equipment and are attributed toaggregated based on the geographic areas in which the Company’s assets are located.location of assets. A summary of these long-lived assets is as follows (in thousands):
| As of December 31, | ||||||||
| 2010 | 2009 | |||||||
United States | $ | 37,270 | $ | 41,152 | ||||
Europe | 4,561 | 4,661 | ||||||
Japan | 272 | 270 | ||||||
Asia-Pacific, other | 3,299 | 3,419 | ||||||
Total | $ | 45,402 | $ | 49,502 | ||||
Significant Customers
During the year ended December 31, 2010, one customer, Samsung, accounted for approximately 11% of the Company’s sales. Samsung is a customer within the Semiconductor Systems segment. During the year ended December 31, 2009, one customer, Powerchip Technology Corporation and certain related parties, accounted for approximately 10% of the Company’s sales. Powerchip Technology Corporation and certain related parties is a
| As of December 31, | ||||||||
| 2011 | 2010 | |||||||
United States | $ | 34,082 | $ | 37,270 | ||||
Europe | 4,972 | 4,561 | ||||||
Japan | 419 | 272 | ||||||
Asia-Pacific and other | 3,938 | 3,299 | ||||||
|
|
|
| |||||
Total | $ | 43,411 | $ | 45,402 | ||||
|
|
|
| |||||
GSI GROUP INC.
NOTES TO CONSOLIDATED FINANCIAL STATEMENTS—(Continued)
As of December 31, 20102011
Significant Customers
During 2011, no customers accounted for greater than 10% of the Company’s sales. In 2010, one customer within the Semiconductor Systems segment. There was no individual customer in 2008 thatsegment accounted for 10% or moreapproximately 11% of our sales. In 2009, a different customer and certain related parties of that customer within the Company’s sales. At December 31, 2010 and 2009, no individual customerSemiconductor Systems segment accounted for approximately 10% or more of the Company’s accounts receivable balance.our sales.
16.14. Related Party Transactions
Richard B. Black,K. Peter Heiland, a member of the ChairmanCompany’s Board of Directors from July 23, 2010 until February 27, 2012, is the owner and managing partner of JEC Capital Partners, LLC, a privately held investment company and a significant shareholder of the Company, prior toand was the founder and served as President of Integrated Dynamics Engineering Gmbh (“IDE”) through August 31, 2011. IDE is a developer and manufacturer of vibration control products, magnetic field compensation systems, acoustic enclosures and robotics. During 2011 and 2010, the Company’s emergenceSemiconductor Systems segment purchased subassemblies from Chapter 11 bankruptcy protection,IDE on terms no more favorable than similar transactions with other of the Company’s suppliers.
Byron O. Pond, a member of the Company’s Board of Directors, is alsoon the PresidentBoard of Directors of ECRM, Inc. and Chief Executive Officer ofis a shareholder in ECRM, Inc., a manufacturer of laser-based systems used by the printing and publishing industry and a customer of the Company. Byron O. Pond, a memberRichard B. Black, the Chairman of the Company prior to the Company’s Boardemergence from Chapter 11 bankruptcy protection, is the President and Chief Executive Officer of Directors, is also on the Board of Directors of ECRM, Inc. and is a shareholder in ECRM, Inc. All sales to ECRM, Inc. were made pursuant to the Company’s standard contract terms and conditions. The transactions with ECRM, Inc. during the year ended December 31,2011, 2010 and 2009 were on terms and conditions that were consistent with similar transactions consummated in previous periods and reviewed by the Nominating and Corporate Governance Committee of the Company’s Board of Directors. The Nominating and Corporate Governance Committee determined that transactions between the Company and ECRM, Inc. were on terms no more favorable than similar transactions with other customers.
K. Peter Heiland, a member of the Company’s Board of Directors since July 23, 2010, is the owner and manager of JEC II Associates, LLC, a privately held investment company and a significant shareholderMichael Katzenstein was an officer of the Company and is the founder and President of Integrated Dynamics Engineering Gmbh (“IDE”). IDE is a developer and manufacturer of vibration control products, magnetic field compensation systems, acoustic enclosures and robotics.from May 6, 2010 through May 31, 2011. During the year ended December 31, 2010, the Company’s Semiconductor Systems segment purchased subassemblies from IDE on terms no more favorable than similar transactions with other of the Company’s suppliers.
Michael Katzenstein,this time, he served as Chief Restructuring Officer of the Company sincefrom December 14, 2010 through May 31, 2011 and from May 14,6, 2010 through July 23, 2010, and as principal executive officer and member of the Company’s Board of Directors from July 23, 2010 through December 14, 2010,2010. Mr. Katzenstein is employed by FTI Consulting, Inc. (“FTI”). The Company engaged FTI in May 2010 to provide for the services of Mr. Katzenstein and certain other temporary employees and management services to support Mr. Katzenstein in his role. From May 2010 to February 2011, Mr. Katzenstein reportsreported directly to the Board of Directors.Directors, and beginning in February 2011, Mr. Katzenstein reported to the Company’s Chief Executive Officer. On July 28, 2011, the Company and FTI agreed to terminate this engagement with FTI as of August 5, 2011. As part of that agreement on July 28, 2011, the Company and FTI agreed that Mr. Katzenstein’s services as the Company’s Chief Restructuring Officer were terminated as of May 31, 2011. The Company has a separate arrangement with another segment of FTI, which commenced in November 2009, to provide certain accounting and financial reporting services. This segment of FTI reports directly to the Board of Directors. As a result of these arrangements, the Company incurred fees owed to FTI for services rendered during the year-ended December 31,2011 and 2010.
The Company recorded salesPrior to and raw material purchases from Sumitomo Heavy Industries Ltd. (“Sumitomo”), a significant shareholder. Following the Company’s emergence from bankruptcy on July 23, 2010, Sumitomo is no longer consideredHeavy Industries Ltd. (“Sumitomo”), was a related party.significant shareholder of the Company. The Company has recorded sales to and raw material purchases from Sumitomo. The transactions with Sumitomo were on terms believed to be no more or less favorable than similar transactions with other customers and suppliers.
GSI GROUP INC.
NOTES TO CONSOLIDATED FINANCIAL STATEMENTS—(Continued)
As of December 31, 2011
The following table summarizes related party transactions in the consolidated statements of operations (in thousands):
| Year Ended December 31, | ||||||||||||
| 2010 | 2009 | 2008 | ||||||||||
Sales to ECRM, Inc. | $ | 216 | $ | 242 | $ | 514 | ||||||
Sales to Sumitomo Heavy Industries Ltd. | 1,431 | 1,242 | 3,329 | |||||||||
Purchases from Sumitomo Heavy Industries Ltd. | 18 | 62 | 108 | |||||||||
Purchases from Integrated Dynamics Engineering Gmbh | 439 | 111 | * | |||||||||
Services from FTI Consulting, Inc.** | 7,255 | * | * | |||||||||
GSI GROUP INC.
NOTES TO CONSOLIDATED FINANCIAL STATEMENTS—(Continued)
As of December 31, 2010
| 2011 | 2010 | 2009 | ||||||||||
Sales to ECRM, Inc. | $ | 269 | $ | 216 | $ | 242 | ||||||
Sales to Sumitomo Heavy Industries Ltd. | * | 1,431 | 1,242 | |||||||||
Purchases from Sumitomo Heavy Industries Ltd. | * | 18 | 62 | |||||||||
Purchases from Integrated Dynamics Engineering Gmbh | 177 | 439 | 111 | |||||||||
Services from FTI Consulting, Inc.** | 2,271 | 7,255 | * | |||||||||
| * | Not a related party during this period. |
| ** | For the year |
The following table summarizes related party transactions included in the consolidated balance sheets (in thousands):
| As of December 31, | As of December 31, | |||||||||||||||
| 2010 | 2009 | 2011 | 2010 | |||||||||||||
Accounts receivable from ECRM, Inc. | $ | 45 | $ | 60 | $ | 72 | $ | 45 | ||||||||
Accounts receivable from Sumitomo Heavy Industries Ltd. | 182 | 414 | * | 182 | ||||||||||||
Accounts payable to Sumitomo Heavy Industries Ltd. | — | — | ||||||||||||||
Accounts payable to Integrated Dynamics Engineering Gmbh | 88 | — | * | 88 | ||||||||||||
Accounts payable to FTI Consulting, Inc.** | 1,000 | * | ||||||||||||||
Accounts payable to FTI Consulting, Inc | * | 1,000 | ||||||||||||||
| As of December 31, |
On December 14, 2010, John A. Roush was appointed the Company’s Chief Executive Officer and a member of the Board of Directors. Prior thereto, Mr. Roush was a corporate officer of PerkinElmer, Inc. and its subsidiaries (collectively, “PerkinElmer”) until December 3, 2010. PerkinElmer supplies components to the Company, and the Company supplies scanners to PerkinElmer. During the year-ended December 31, 2010, the Company purchased approximately $1.5 million of components from PerkinElmer, and PerkinElmer purchased approximately $0.1 million of scanners from the Company. Accounts payable to PerkinElmer as of December 31, 2010 was approximately $0.2 million, and there was no accounts receivable from PerkinElmer as of December 31, 2010.
GSI GROUP INC.
NOTES TO CONSOLIDATED FINANCIAL STATEMENTS—(Continued)
As of December 31, 20102011
17.15. Quarterly Financial Information (unaudited)
The Company’s interim financial statements are prepared on a quarterly basis ending on the Friday closest to the end of the calendar quarter, with the exception of the fourth quarter which always ends on December 31st.31.
| Three Months Ended | ||||||||
| December 31, 2010 | October 1, 2010 | |||||||
| (in thousands, except per share data) | ||||||||
Sales | $ | 91,619 | $ | 91,545 | ||||
Cost of goods sold | 53,256 | 50,601 | ||||||
Gross profit | 38,363 | 40,944 | ||||||
Operating expenses | 28,815 | 29,835 | ||||||
Income from operations | 9,548 | 11,109 | ||||||
Interest income (expense) and other income (expense), net | (3,654 | ) | (4,443 | ) | ||||
Income from continuing operations before reorganization items and income taxes | 5,894 | 6,666 | ||||||
Reorganization items | — | (5,909 | ) | |||||
Income from continuing operations before income taxes | 5,894 | 757 | ||||||
Income tax provision | 7,611 | 665 | ||||||
Consolidated net income (loss) | (1,717 | ) | 92 | |||||
Less: Net (income) loss attributable to noncontrolling interest | (25 | ) | 29 | |||||
Net income (loss) attributable to GSI Group Inc. | $ | (1,742 | ) | $ | 121 | |||
Net income (loss) per common share: | ||||||||
Basic | $ | (0.05 | ) | $ | 0.00 | |||
Diluted | $ | (0.05 | ) | $ | 0.00 | |||
| Three Months Ended | ||||||||
| July 2, 2010 | April 2, 2010 | |||||||
| (in thousands, except per share data) | ||||||||
Sales | $ | 85,737 | $ | 114,615 | ||||
Cost of goods sold | 47,681 | 65,577 | ||||||
Gross profit | 38,056 | 49,038 | ||||||
Operating expenses | 27,109 | 26,733 | ||||||
Income from operations | 10,947 | 22,305 | ||||||
Interest income (expense) and other income (expense), net | (4,747 | ) | (4,809 | ) | ||||
Income from continuing operations before reorganization items and income taxes | 6,200 | 17,496 | ||||||
Reorganization items | (10,617 | ) | (9,630 | ) | ||||
Income (loss) from continuing operations before income taxes | (4,417 | ) | 7,866 | |||||
Income tax provision | 638 | 1,825 | ||||||
Consolidated net income (loss) | (5,055 | ) | 6,041 | |||||
Less: Net income attributable to noncontrolling interest | (11 | ) | (41 | ) | ||||
Net income (loss) attributable to GSI Group Inc. | $ | (5,066 | ) | $ | 6,000 | |||
Net income (loss) per common share: | ||||||||
Basic | $ | (0.32 | ) | $ | 0.38 | |||
Diluted | $ | (0.32 | ) | $ | 0.38 | |||
GSI GROUP INC.
NOTES TO CONSOLIDATED FINANCIAL STATEMENTS—(Continued)
As of December 31, 2010
| Three Months Ended | ||||||||
| December 31, 2009 | October 2, 2009 | |||||||
| (in thousands, except per share data) | ||||||||
Sales | $ | 72,509 | $ | 55,067 | ||||
Cost of goods sold | 44,314 | 32,768 | ||||||
Gross profit | 28,195 | 22,299 | ||||||
Operating expenses | 29,401 | 28,382 | ||||||
Loss from operations | (1,206 | ) | (6,083 | ) | ||||
Interest income (expense) and other income (expense), net | (5,313 | ) | (7,573 | ) | ||||
Loss from continuing operations before reorganization items and income taxes | (6,519 | ) | (13,656 | ) | ||||
Reorganization items | (23,606 | ) | — | |||||
Loss from continuing operations before income taxes | (30,125 | ) | (13,656 | ) | ||||
Income tax provision (benefit) | 1,622 | (739 | ) | |||||
Consolidated net loss | (31,747 | ) | (12,917 | ) | ||||
Less: Net income attributable to noncontrolling interest | (17 | ) | (49 | ) | ||||
Net loss attributable to GSI Group Inc. | $ | (31,764 | ) | $ | (12,966 | ) | ||
Net loss per common share: | ||||||||
Basic | $ | (1.99 | ) | $ | (0.81 | ) | ||
Diluted | $ | (1.99 | ) | $ | (0.81 | ) | ||
GSI GROUP INC.
NOTES TO CONSOLIDATED FINANCIAL STATEMENTS—(Continued)
As of December 31, 2010
| Three Months Ended | ||||||||
| July 3, 2009 | April 3, 2009 | |||||||
| (in thousands, except per share data) | ||||||||
Sales | $ | 62,904 | $ | 63,908 | ||||
Cost of goods sold | 38,451 | 40,309 | ||||||
Gross profit | 24,453 | 23,599 | ||||||
Operating expenses | 27,441 | 33,559 | ||||||
Loss from operations | (2,988 | ) | (9,960 | ) | ||||
Interest income (expense) and other income (expense), net | (7,459 | ) | (7,722 | ) | ||||
Loss from continuing operations before reorganization items and income taxes | (10,447 | ) | (17,682 | ) | ||||
Reorganization items | — | — | ||||||
Loss from continuing operations before income taxes | (10,447 | ) | (17,682 | ) | ||||
Income tax benefit | (734 | ) | (922 | ) | ||||
Loss from continuing operations | (9,713 | ) | (16,760 | ) | ||||
Loss from discontinued operations, net of tax | (132 | ) | — | |||||
Consolidated net loss | (9,845 | ) | (16,760 | ) | ||||
Less: Net (income) loss attributable to noncontrolling interest | (14 | ) | 19 | |||||
Net loss attributable to GSI Group Inc. | $ | (9,859 | ) | $ | (16,741 | ) | ||
Loss from continuing operations per common share: | ||||||||
Basic | $ | (0.61 | ) | $ | (1.06 | ) | ||
Diluted | $ | (0.61 | ) | $ | (1.06 | ) | ||
Loss from discontinued operations per common share: | ||||||||
Basic | $ | (0.01 | ) | $ | — | |||
Diluted | $ | (0.01 | ) | $ | — | |||
Net loss per common share: | ||||||||
Basic | $ | (0.62 | ) | $ | (1.06 | ) | ||
Diluted | $ | (0.62 | ) | $ | (1.06 | ) | ||
18. Subsequent Events
Hiring of Chief Financial Officer
On February 10, 2011, the Company entered into an employment agreement with Robert Buckley to serve as the Company’s Chief Financial Officer beginning by early April 2011 and to serve in an advisory role to the Company’s Chief Executive Officer during the preceding transition period beginning February 22, 2011. Mr. Buckley will succeed Glenn Davis, who has served as the Company’s principal financial officer since April 2010.
NASDAQ Listing
On February 9, 2011, the Company’s common shares were approved for listing on The NASDAQ Global Select Market. The Company’s common shares began trading on The NASDAQ Global Select Market on February 14, 2011 under the symbol “GSIG”. As a result of the NASDAQ listing, the Company is no longer subject to the additional 2% per annum interest penalty relating to the reporting default under its 12.25% Senior Secured PIK Election Notes.
GSI GROUP INC.
NOTES TO CONSOLIDATED FINANCIAL STATEMENTS—(Continued)
As of December 31, 2010
Settlement of Class Action
On February 22, 2011, the United States District Court for the District of Massachusetts entered an order granting final approval of the previously announced settlement in the putative shareholder class action entitledWiltold Trzeciakowski, Individually and on behalf of all others similarly situated v. GSI Group Inc., Sergio Edelstein, and Robert Bowen, Case No. 08-cv-12065 (GAO), filed on December 12, 2008. The Company’s contribution to the settlement amount was limited to the Company’s self-insured retention under its directors and officers liability policy. As a result of the court’s final approval of the settlement, 993,743 shares of the Company’s common stock that were placed in a reserve account and held in escrow for the benefit of the holders of Section 510(b) claims, as defined in the Company’s Final Chapter 11 Plan, were released to the Company’s shareholders entitled to such shares.
| Three Months Ended | ||||||||||||||||
| December 31, 2011 | September 30, 2011 | July 1, 2011 | April 1, 2011 | |||||||||||||
| (in thousands except per share data) | ||||||||||||||||
Sales | $ | 79,795 | $ | 93,257 | $ | 101,370 | $ | 91,858 | ||||||||
Cost of goods sold | 45,210 | 52,349 | 56,377 | 51,964 | ||||||||||||
|
|
|
|
|
|
|
| |||||||||
Gross profit | 34,585 | 40,908 | 44,993 | 39,894 | ||||||||||||
Operating expenses | 29,093 | 28,375 | 30,220 | 28,753 | ||||||||||||
|
|
|
|
|
|
|
| |||||||||
Income from operations | 5,492 | 12,533 | 14,773 | 11,141 | ||||||||||||
Interest income (expense) and other income (expense), net | (2,600 | ) | (2,810 | ) | (3,160 | ) | (3,312 | ) | ||||||||
|
|
|
|
|
|
|
| |||||||||
Income from continuing operations before income taxes | 2,892 | 9,723 | 11,613 | 7,829 | ||||||||||||
Income tax provision (benefit) | (956 | ) | 907 | 1,538 | 1,567 | |||||||||||
|
|
|
|
|
|
|
| |||||||||
Consolidated net income | 3,848 | 8,816 | 10,075 | 6,262 | ||||||||||||
Net (income) loss attributable to noncontrolling interest | 7 | 29 | (9 | ) | (55 | ) | ||||||||||
|
|
|
|
|
|
|
| |||||||||
Net income attributable to GSI Group Inc. | $ | 3,855 | $ | 8,845 | $ | 10,066 | $ | 6,207 | ||||||||
|
|
|
|
|
|
|
| |||||||||
Net income per common share: | ||||||||||||||||
Basic | $ | 0.12 | $ | 0.26 | $ | 0.30 | $ | 0.19 | ||||||||
Diluted | $ | 0.11 | $ | 0.26 | $ | 0.30 | $ | 0.19 | ||||||||
| Three Months Ended | ||||||||||||||||
| December 31, 2010 | October 1, 2010 | July 2, 2010 | April 2, 2010 | |||||||||||||
| (in thousands except per share data) | ||||||||||||||||
Sales | $ | 91,619 | $ | 91,545 | $ | 85,737 | $ | 114,615 | ||||||||
Cost of goods sold | 53,256 | 50,601 | 47,681 | 65,577 | ||||||||||||
|
|
|
|
|
|
|
| |||||||||
Gross profit | 38,363 | 40,944 | 38,056 | 49,038 | ||||||||||||
Operating expenses | 28,815 | 29,835 | 27,109 | 26,733 | ||||||||||||
|
|
|
|
|
|
|
| |||||||||
Income from operations | 9,548 | 11,109 | 10,947 | 22,305 | ||||||||||||
Interest income (expense) and other income (expense), net | (3,654 | ) | (4,443 | ) | (4,747 | ) | (4,809 | ) | ||||||||
|
|
|
|
|
|
|
| |||||||||
Income from continuing operations before reorganization items and income taxes | 5,894 | 6,666 | 6,200 | 17,496 | ||||||||||||
Reorganization items | — | (5,909 | ) | (10,617 | ) | (9,630 | ) | |||||||||
|
|
|
|
|
|
|
| |||||||||
Income (loss) from continuing operations before taxes | 5,894 | 757 | (4,417 | ) | 7,866 | |||||||||||
Income tax provision | 7,611 | 665 | 638 | 1,825 | ||||||||||||
|
|
|
|
|
|
|
| |||||||||
Consolidated net income (loss) | (1,717 | ) | 92 | (5,055 | ) | 6,041 | ||||||||||
Net (income) loss attributable to noncontrolling interest | (25 | ) | 29 | (11 | ) | (41 | ) | |||||||||
|
|
|
|
|
|
|
| |||||||||
Net income (loss) attributable to GSI Group Inc. | $ | (1,742 | ) | $ | 121 | $ | (5,066 | ) | $ | 6,000 | ||||||
|
|
|
|
|
|
|
| |||||||||
Net income (loss) per common share: | ||||||||||||||||
Basic | $ | (0.05 | ) | $ | 0.00 | $ | (0.32 | ) | $ | 0.38 | ||||||
Diluted | $ | (0.05 | ) | $ | 0.00 | $ | (0.32 | ) | $ | 0.38 | ||||||
Item 9.Changes In and Disagreements with Accountants on Accounting and Financial Disclosure
None.
Item 9A.Controls and Procedures.Procedures
The required certifications of our Chief Executive Officer and Chief Financial Officer are included in Exhibits 31.1-31.2 to this Annual Report on Form 10-K. The disclosures set forth in this Item 9A contain information concerning the evaluation of our disclosure controls and procedures, management’s report on internal controls over financial reporting and changes in internal control over financial reporting referred to in those certifications. Those certifications should be read in conjunction with this Item 9A for a more complete understanding of the matters covered by the certifications.
Evaluation of Disclosure Controls and Procedures as of December 31, 20102011
Our management, with the participation of our Chief Executive Officer and PrincipalChief Financial Officer, evaluated the effectivenessconducted an evaluation of our disclosure controls and procedures, (asas such term is defined inunder Rule 13a-15(e) promulgated under the Securities Exchange Act of 1934, (the “Exchange Act”)) as of December 31, 2010. Because of the material weakness in our internal control over financial reporting as described below,amended, or Exchange Act. Based on this evaluation, our Chief Executive Officer and PrincipalChief Financial Officer have concluded that our disclosure controls and procedures were not effective as of December 31, 2010.
Management’s Annual Report on Internal Control Over Financial Reporting
Management is responsible for establishing and maintaining adequate internal control over financial reporting, as defined in Rules 13a-15(f) and 15d-15(f) under the Exchange Act. Internal control over financial reporting is designed to provide reasonable assurance regarding the reliability of financial reporting and the preparation of financial statements for external reporting purposes in accordance with generally accepted accounting principles. Internal control over financial reporting includes those policies and procedures that:
pertain to the maintenance of records that, in reasonable detail, accurately and fairly reflect our transactions and dispositions of our assets;
provide reasonable assurance that transactions are recorded as necessary to permit preparation of financial statements in accordance with generally accepted accounting principles, and that our receipts and expenditures are being made only in accordance with authorizations of our management and directors; and
provide reasonable assurance regarding prevention or timely detection of unauthorized acquisition, use or disposition of our assets that could have a material effect on the financial statements.
Because of its inherent limitations, a system of internal control over financial reporting may not prevent or detect misstatements. Also, projections of any evaluation of effectiveness to future periods are subject to the risk that controls may become inadequate because of changes in conditions and that the degree of compliance with the policies or procedures may deteriorate.
Our management assessed the effectiveness of our internal control over financial reporting as of December 31, 2010. In making their assessment, our management utilized the criteria set forth in Internal Control—Integrated Framework issued by the Committee of Sponsoring Organizations (“COSO”) of the Treadway Commission.
As of December 31, 2010, our management identified a material weakness in our internal control over financial reporting. A material weakness is a deficiency, or combination of deficiencies, in internal control over financial reporting, such that there is a reasonable possibility that a material misstatement of our annual or interim financial statements will not be prevented or detected on a timely basis. The material weakness is discussed below.
As a result of ineffective procedures and controls, our financial statement close process for the first three quarters of 2010 was not completed in an accurate and timely manner and resulted in significant post-closing adjustments which were appropriately reflected in our consolidated financial statements for the first three quarters of 2010. Additionally, although our 2010 year-end financial statement close process was completed in a
timely manner, it was not completed in an accurate manner as a significant post-closing adjustment related to excess inventory was identified and recorded. The ineffective procedures and controls were primarily due to the lack of standardized closing processes and procedures across all of our business units.
As a result of the material weakness described above, our management has determined that, as of December 31, 2010, we did not maintain effective internal control over financial reporting at the reasonable assurance level based on the COSO criteria.
This annual report does not include an attestation report of the Company’s registered public accounting firm regarding internal control over financial reporting. Management’s report was not subject to attestation by the Company’s registered public accounting firm pursuant to the Dodd-Frank Wall Street Reform and Consumer Protection Act, which exempts issuers that are neither accelerated filers nor large accelerated filers, as defined in Rule 12b-2 under the Exchange Act, from Section 404(b) of the Sarbanes-Oxley Act of 2002. This exemption permits us to provide only management’s report in this annual report on Form 10-K.2011.
Remediation of Previously Reported Material Weaknesses and Ongoing Remediation Efforts
In Item 9A (Controls and Procedures) of our Annual Report on Form 10-K for the year ended December 31, 2009,2010, we reported two material weaknesses in our internal control over financial reporting. As a result of these material weaknesses, we concluded that our internal control over financial reporting was not effective at the reasonable assurance level as of December 31, 2009.
In an effort to remediate these material weaknesses, in 2010, we made changes that materially affected our internal control over financial reporting. We have taken and continue to take significant steps to improve our overall control over financial reporting. As discussed below, of the two material weaknesses noted in our report as of December 31, 2009, the controls relating to one of the two items are sufficiently improved such that they no longer constitute a material weakness as of December 31, 2010:
Implemented enhanced documentation, review and supervision processes and procedures over the review of significant revenue transactions.
Hired qualified consulting professionals to perform and supervise the aforementioned processes and procedures until the corporate finance and accounting function is properly staffed with permanent employees.
In addition, for the one item which we believe still constitutes a material weakness, we have made significant improvements and a number of material changes to controls over the financial statement close process. We have implemented enhanced documentation and review and supervision processes and procedures, including in the preparation of general account reconciliations and certain key accounting analyses.
Management plans to put in place additional measures in 2011 to strengthen internal controls over financial reporting and address the material weakness described above. Our remediation efforts will involve numerous business and accounting process improvements. In general, the improvements will be designed to: (1) enhance the number of persons within the corporate accounting group with the technical experience to properly evaluate and account for complex accounting transactions, as well as to provide appropriate managerial oversight to our accounting staff, and (2) improve the timeliness and access to information that is required by the accounting team in order to make appropriate assessments of transactions in accordance with generally accepted accounting principles. We began implementing certain of these measures in 2010.
We expect the implementation of the additional remedial actions to be substantially completed in 2011. Until we are able to remediate the weakness, we intend to rely on the continued use of outside professionals in order to perform procedures and reviews deemed appropriate and necessary for us to perform accounting procedures and report timely and accurate financial results.
The remediation plans that we have undertaken, or plan to undertake, include the following measures:
Plans with respect to accounting personnel
Appoint a permanent Chief Financial Officer and enhance the number and quality of the composition of our corporate finance team. This will include us conducting an assessment of the current skill set to support the staffing of a finance group with the requisite expertise. We will review the composition of our team of salaried accounting professionals, in terms of skills, technical expertise and overall experience level.
Recruit and retain qualified accounting professionals necessary to help ensure the accountability and effective implementation of key controls and remedial actions designed in the areas that material weaknesses have been identified.
Until such time as the review and hiring of salaried accounting professionals is finalized, we have engaged outside professionals to assist us in finalizing our accounting and related SEC reporting for the periods included in this Annual Report on Form 10-K. We have also utilized outside professionals to assist with similar activities in connection with our activities in closing the accounting records for periods in 2009 and 2010. We plan to continue to rely on outside professionals as needed until a permanent staff is deployed.
Increase the amount and frequency of the training of our accounting staff. This training is focused on the following matters:
Technical accounting matters that are to be performed by certain staff, and upon whose expertise we will rely to ensure timely, complete and accurate accounting procedures have been performed and documented.
Review current, and yet to be updated, processes and controls to help ensure that our accounting staff understand requirements and procedures. Additionally, this training is intended to help ensure that our accounting personnel with managerial responsibilities are capable of supervising the required accounting work, including all necessary reviews, to produce complete, timely and accurate financial information.
Education with respect to our product offerings, including related services, will be provided by our sales and operational groups in order to make our accounting personnel aware of current product and service offerings.
Plans with respect to organization-wide personnel
Reinforce the “message from the top” with respect to our policies and corporate responsibilities. Provide continued reinforcement of these standards and expectations from the executive level officers.
Provide training to our sales, operations and accounting teams with respect to certain corporate governance and public company matters, including guidelines and procedures to ensure that relevant information is promptly and adequately communicated to the accounting team, or other senior management representatives, as appropriate. Also provide training to our sales, operations and accounting teams with respect to revenue recognition, including implications of certain activities, such as discussions or other communications between our personnel and customers.
Enhance the cross-functional reviews and approvals of transactions, including policies with respect to electronic approvals, and with respect to the downstream performance of activities that mandate prior approvals or actions.
Develop enhanced procedures with respect to the review of facts, assumptions and other related information that has been reviewed or considered when reaching accounting conclusions. We plan to
|
Plans with respect to organization-wide processes and information systems
Review our information systems to assess which processes can be further automated including, as appropriate, the configuration of our information systems to allow for tracking of certain information that is not routinely captured currently. The accounting processes will be reviewed, standardized and expanded as deemed necessary across all of our business units. In addition, we will review and assess non-accounting information that is captured in our enterprise wide information systems, as certain of this information can assist the evaluation and documentation of accounting conclusions.
Redesign our key accounting processes with respect to our accounting team management’s oversight and review of accounting records, source documentation and related assumptions that form the basis for conclusions, including increased oversight of subsidiary accounting functions.
If the remedial measures described above are insufficient to address the identified material weakness or are not implemented effectively, or additional deficiencies arise in the future, material misstatements in our interim or annual financial statements may occur in the future, and we may become delinquent in our filings. We are currently working to improve and, where feasible, simplify our internal processes and implement enhanced controls, as discussed above, to address the material weakness in our internal control over financial reporting due to inadequate and ineffective controls over the financial statement close process. During the year ended December 31, 2011, we took actions to remedy the ineffectiveness of our disclosure controls and procedures. Whileremediate this implementation phase is underway, we are relying on extensive manual procedures, including the use of qualified external consultants and incremental management oversight and reviews, to assist us with meeting the objectives otherwise fulfilled by an effective internal control system. A key element of our remediation effort is the ability to recruit and retain qualified individuals to support our remediation efforts. Despite our efforts to continually improve our control procedures and environment, we cannot provide assurance that our remediation measures will be completed or become effective by any given date. Among other things, any unremediated material weakness, could resultincluding enhancement of the preparation and review procedures, recruitment of individuals with significant technical experience in material post-closing adjustmentsthe corporate accounting function to evaluate complex accounting matters and timely preparation and assessment of accounting transactions in futureaccordance with generally accepted accounting principles. These remediation efforts were completed in the fourth quarter ended December 31, 2011, when annual controls over the financial statementsstatement preparation and in our inability to file future financial statements with the SEC in a timely manner. Furthermore, any such unremediated material weakness could have the effects described in “Item 1A. Risk Factors—Our Audit Committee, management and independent auditors have identified material weaknesses in our internal controls, and we may be unable to develop, implement and maintain appropriate controls in future periods, which may lead to errors or omissions in our financial statements.” in Part I of this Annual Report on Form 10-K.review processes were performed.
Changes in Internal Control Over Financial Reporting
Other than the changes noted above, there have been no changes to our internal control over financial reporting during the quarter ended December 31, 20102011 that have materially affected, or are reasonably likely to materially affect, our internal control over financial reporting.
Management’s Annual Report on Internal Control Over Financial Reporting
Management is responsible for establishing and maintaining adequate internal control over financial reporting, as defined in Rules 13a-15(f) and 15d-15(f) under the Exchange Act. Internal control over financial reporting is designed to provide reasonable assurance regarding the reliability of financial reporting and the preparation of financial statements for external reporting purposes in accordance with generally accepted accounting principles. Internal control over financial reporting includes those policies and procedures that:
pertain to the maintenance of records that, in reasonable detail, accurately and fairly reflect our transactions and dispositions of our assets;
provide reasonable assurance that transactions are recorded as necessary to permit preparation of financial statements in accordance with generally accepted accounting principles, and that our receipts and expenditures are being made only in accordance with authorizations of our management and directors; and
provide reasonable assurance regarding prevention or timely detection of unauthorized acquisition, use or disposition of our assets that could have a material effect on the financial statements.
Because of its inherent limitations, a system of internal control over financial reporting may not prevent or detect misstatements. Also, projections of any evaluation of effectiveness to future periods are subject to the risk that controls may become inadequate because of changes in conditions and that the degree of compliance with the policies or procedures may deteriorate.
Our management assessed the effectiveness of our internal control over financial reporting as of December 31, 2011. In making their assessment, our management utilized the criteria set forth in Internal Control—Integrated Framework issued by the Committee of Sponsoring Organizations (“COSO”) of the Treadway Commission. Based on our evaluation under the framework inInternal Control—Integrated Framework, our management concluded that our internal control over financial reporting was effective as of December 31, 2011.
The Report of Ernst & Young LLP on internal control over financial reporting is contained in Item 9A of this Annual Report.
Report of Independent Registered Public Accounting Firm
The Board of Directors and Shareholders of GSI Group Inc.
We have audited GSI Group Inc.’s internal control over financial reporting as of December 31, 2011, based on criteria established in Internal Control—Integrated Framework issued by the Committee of Sponsoring Organizations of the Treadway Commission (the COSO criteria). GSI Group Inc.’s management is responsible for maintaining effective internal control over financial reporting, and for its assessment of the effectiveness of internal control over financial reporting included in the accompanying Management’s Annual Report on Internal Control Over Financial Reporting. Our responsibility is to express an opinion on the company’s internal control over financial reporting based on our audit.
We conducted our audit in accordance with the standards of the Public Company Accounting Oversight Board (United States). Those standards require that we plan and perform the audit to obtain reasonable assurance about whether effective internal control over financial reporting was maintained in all material respects. Our audit included obtaining an understanding of internal control over financial reporting, assessing the risk that a material weakness exists, testing and evaluating the design and operating effectiveness of internal control based on the assessed risk, and performing such other procedures as we considered necessary in the circumstances. We believe that our audit provides a reasonable basis for our opinion.
A company’s internal control over financial reporting is a process designed to provide reasonable assurance regarding the reliability of financial reporting and the preparation of financial statements for external purposes in accordance with generally accepted accounting principles. A company’s internal control over financial reporting includes those policies and procedures that (1) pertain to the maintenance of records that, in reasonable detail, accurately and fairly reflect the transactions and dispositions of the assets of the company; (2) provide reasonable assurance that transactions are recorded as necessary to permit preparation of financial statements in accordance with generally accepted accounting principles, and that receipts and expenditures of the company are being made only in accordance with authorizations of management and directors of the company; and (3) provide reasonable assurance regarding prevention or timely detection of unauthorized acquisition, use, or disposition of the company’s assets that could have a material effect on the financial statements.
Because of its inherent limitations, internal control over financial reporting may not prevent or detect misstatements. Also, projections of any evaluation of effectiveness to future periods are subject to the risk that controls may become inadequate because of changes in conditions, or that the degree of compliance with the policies or procedures may deteriorate.
In our opinion, GSI Group Inc. maintained, in all material respects, effective internal control over financial reporting as of December 31, 2011, based on the COSO criteria.
We also have audited, in accordance with the standards of the Public Company Accounting Oversight Board (United States), the consolidated balance sheets of GSI Group Inc. as of December 31, 2011 and 2010, and the related consolidated statements of operations, comprehensive income (loss), stockholders’ equity, and cash flows for each of the three years in the period ended December 31, 2011 of GSI Group Inc. and our report dated March 14, 2012 expressed an unqualified opinion thereon.
/s/ Ernst & Young LLP
Boston, Massachusetts
March 14, 2012
Not applicable.On March 9, 2012, the Company entered into an amendment to the Credit Agreement (the “First Amendment”). The First Amendment expands the definition of eligible receivables to include (i) receivables payable in Euro and Japanese Yen under certain conditions in addition to receivables payable in Dollars or Pounds Sterling and (ii) receivables whose payments are covered by appropriate insurance, subject to certain limitations. The result of these amendments is to expand the borrowing base available to the Company.
PART III
Certain information required by Part III is omitted from this Annual Report on Form 10-K and is incorporated herein by reference to the Registrant’s Definitive Proxy Statement for the Annual Meeting of Shareholders scheduled to be held on May 11, 2011June 14, 2012 to be filed with the Securities and Exchange Commission.
Item 10.Directors, Executive Officers and Corporate Governance
All of the Company’s directors, officers and employees must act in accordance with the Code of Ethics and Business Conduct, which has been adopted by the Company’s Board of Directors. A copy of the Code of Ethics and Business Conduct is available on the Company’s website at http://www.gsig.com in the “About GSI Group” section. (This website address is not intended to function as a hyperlink, and the information contained in our website is not intended to be a part of this filing). The Company will provide to any person without charge, upon request, a copy of the Code of Ethics and Business Conduct. Such a request should be made in writing and addressed to GSI Group Inc., Attention: Investor Relations, 125 Middlesex Turnpike, Bedford, MA 01730. The Company intends to satisfy the disclosure requirement under Item 5.05 of Form 8-K regarding disclosure of an amendment to, or waiver from, a provision of this Code of Ethics and Business Conduct with respect to its principal executive officer, principal financial officer, principal accounting officer or controller, or persons performing similar functions, by posting such information on the Company’s website at http://www.gsig.com in the “About GSI Group” section, unless a Form 8-K is otherwise required by law or applicable listing rules.
The remainder of the response to this item is contained in the Proxy Statement for the Company’s Annual Meeting of Shareholders scheduled to be held on May 11, 2011June 14, 2012 and is incorporated herein by reference.
Item 11.Executive Compensation
The information required to be disclosed by this item is contained in the Proxy Statement for the Company’s Annual Meeting of Shareholders scheduled to be held on May 11, 2011June 14, 2012 and is incorporated herein by reference.
Item 12.Security Ownership of Certain Beneficial Owners and Management and Related Stockholder Matters
The information required to be disclosed by this item is contained in the Proxy Statement for the Company’s Annual Meeting of Shareholders scheduled to be held on May 11, 2011June 14, 2012 and is incorporated herein by reference.
Item 13.Certain Relationships and Related Transactions, and Director Independence
The information required to be disclosed by this item is contained in the Proxy Statement for the Company’s Annual Meeting of Shareholders scheduled to be held on May 11, 2011June 14, 2012 and is incorporated herein by reference.
Item 14.Principal Accountant Fees and Services
The information required to be disclosed by this item is contained in the Proxy Statement for the Company’s Annual Meeting of Shareholders scheduled to be held on May 11, 2011June 14, 2012 and is incorporated herein by reference.
PART IV
Item 15.Exhibits and Financial Statement Schedules
| (a) | Documents filed as part of this report: |
1. List of Financial Statements
The financial statements required by this item are listed in Item 8, “Financial Statements and Supplementary Data” herein.
2. List of Financial Statement Schedules
All schedules are omitted because they are not applicable, not required or the required information is shown in the consolidated financial statements or notes thereto.
3. List of Exhibits
Incorporated by Reference | ||||||||||||
Exhibit Number | Exhibit Description | Form | File No. | Exhibit | Filing Date | Filed Herewith | ||||||
| 2.6 | Agreement and Plan of Merger, by and among the Registrant, Eagle Acquisition Corporation, and Excel Technology, Inc. dated July 9, 2008. | 8-K | 000-25705 | 2.1 | 7/11/08 | |||||||
| 2.7 | Asset Purchase Agreement, by and between GSI Group Corporation and Gooch & Housego (California) LLC., dated July 3, 2008. | 10-Q | 000-25705 | 2.1 | 4/13/10 | |||||||
| 2.8 | Final Fourth Modified Joint Chapter 11 Plan of Reorganization for the Registrant, GSI Group Corporation, and MES International, Inc., dated as of May 24, 2010, as supplemented on May 27, 2010, and as confirmed by the United States Bankruptcy Court for the District of Delaware on May 27, 2010. | 8-K | 000-25705 | 99.2 | 05/28/10 | |||||||
| 3.1 | Certificate and Articles of Continuance of the Registrant, dated March 22, 1999. | S-4/A | 333-71449 | Annex H | 2/11/99 | |||||||
| 3.2 | By-Laws of the Registrant, as amended | 10-Q | 000-25705 | 3.2 | 4/13/10 | |||||||
| 3.3 | Articles of Reorganization of the Registrant, dated July 23, 2010. | 8-K | 000-25705 | 3.1 | 07/23/10 | |||||||
| 3.4 | Articles of Amendment of the Registrant, dated December 29, 2010. | 8-K | 000-25705 | 3.1 | 12/29/10 | |||||||
| 4.8 | Indenture, dated as of July 23, 2010, by and among GSI Group Corporation, as Issuer, the Guarantors named therein and The Bank of New York Mellon Trust Company, N.A., as trustee. | 8-K | 000-25705 | 4.1 | 7/23/10 | |||||||
| 4.9 | Registration Rights Agreement, by and between the Registrant and the Common Shareholders named therein, dated as of July 23, 2010. | 8-K | 000-25705 | 4.2 | 7/23/10 | |||||||
| 10.5† | Form of Indemnification Agreement. | 8-K | 000-25705 | 10.1 | 6/10/09 | |||||||
Incorporated by Reference Exhibit Number Exhibit Description Form File No. Exhibit Filing Date Filed Herewith Incorporated by Reference Exhibit Number Exhibit Description Form File No. Exhibit Filing Date Filed Herewith Lease, by and between GSI Group Corporation and 125 Middlesex Turnpike, LLC, dated November 2, 2007. Lease Agreement, by and between GSI Lumonics Corporation and SEWS-DTC, INC., dated February 11, 2005. 10.5† Form of Indemnification Agreement. 8-K 000-25705 10.1 6/10/09 10.6 Noteholder Restructuring Plan Support Agreement, by and among the Registrant, GSI Group Corporation, MES International, Inc. and Liberty Harbor Master Fund I, L.P., Tinicum Capital Partners II, L.P., Highbridge International LLC, Special Value Continuation Partners, L.P., Special Value Expansion Fund, LLC, Tennenbaum Opportunities Partners V, LP, Special Value Opportunities Fund, LLC, and Hale Capital Partners, LP., dated November 19, 2009. 8-K 000-25705 10.1 11/20/09 10.7 Amended and Restated Noteholder Restructuring Plan Support Agreement, by and among the Registrant, GSI Group Corporation, MES International, Inc. and Liberty Harbor Master Fund I, L.P., Tinicum Capital Partners II, L.P., Highbridge International LLC, Special Value Continuation Partners, L.P., Special Value Expansion Fund, LLC, Tennenbaum Opportunities Partners V, LP, Special Value Opportunities Fund, LLC, and Hale Capital Partners, LP., dated March 16, 2010. 8-K 000-25705 10.1 3/19/10 10.19 Lease, by and between GSI Group Corporation and 125 Middlesex Turnpike, LLC, dated November 2, 2007. 10-K 000-25705 10.19 4/13/10 10.20 Lease Agreement, by and between GSI Lumonics Corporation and SEWS-DTC, INC., dated February 11, 2005. 8-K 000-25705 10.2 2/16/05 10.24 Sublease Agreement, by and between GSI Lumonics GmbH and MotorVison Film, dated March 17, 2006. 8-K 000-25705 10.1 3/23/06 10.25 Real Estate Purchase and Sale Agreement, by and between the GSI Group Corporation and SAgE Aggregation, LLC, dated November 14, 2005. 8-K 000-25705 10.1 1/10/06 10.26 Amendment to Real Estate Purchase and Sale Agreement, by and between the GSI Group Corporation and SAgE Aggregation, LLC, dated December 26, 2005. 8-K 000-25705 10.2 1/10/06 10.27 Second Amendment to Real Estate Purchase and Sale Agreement, by and between the GSI Group Corporation and Stag II Maple Grove LLC (successor to SAgE Aggregation, LLC), dated December 29, 2005. 8-K 000-25705 10.3 1/10/06 10.6 Noteholder Restructuring Plan Support Agreement, by and among the Registrant, GSI Group Corporation, MES International, Inc. and Liberty Harbor Master Fund I, L.P., Tinicum Capital Partners II, L.P., Highbridge International LLC, Special Value Continuation Partners, L.P., Special Value Expansion Fund, LLC, Tennenbaum Opportunities Partners V, LP, Special Value Opportunities Fund, LLC, and Hale Capital Partners, LP., dated November 19, 2009. 8-K 000-25705 10.1 11/20/09 10.7 Amended and Restated Noteholder Restructuring Plan Support Agreement, by and among the Registrant, GSI Group Corporation, MES International, Inc. and Liberty Harbor Master Fund I, L.P., Tinicum Capital Partners II, L.P., Highbridge International LLC, Special Value Continuation Partners, L.P., Special Value Expansion Fund, LLC, Tennenbaum Opportunities Partners V, LP, Special Value Opportunities Fund, LLC, and Hale Capital Partners, LP., dated March 16, 2010. 8-K 000-25705 10.1 3/19/10 10.19 10-K 000-25705 10.19 4/13/10 10.20 8-K 000-25705 10.2 2/16/05 10.24 Sublease Agreement, by and between GSI Lumonics GmbH and MotorVison Film, dated March 17, 2006. 8-K 000-25705 10.1 3/23/06 10.25 Real Estate Purchase and Sale Agreement, by and between GSI Group Corporation and SAgE Aggregation, LLC, dated November 14, 2005. 8-K 000-25705 10.1 1/10/06 10.26 Amendment to Real Estate Purchase and Sale Agreement, by and between GSI Group Corporation and SAgE Aggregation, LLC, dated December 26, 2005. 8-K 000-25705 10.2 1/10/06 10.27 Second Amendment to Real Estate Purchase and Sale Agreement, by and between GSI Group Corporation and Stag II Maple Grove LLC (successor to SAgE Aggregation, LLC), dated December 29, 2005. 8-K 000-25705 10.3 1/10/06 10.29 OEM Supply Agreement, by and between the Registrant and Sumitomo Heavy Industries, Ltd., dated August 31, 1999. 10-K 000-25705 10.21 3/22/00
Incorporated by Reference Exhibit Number Exhibit Description Form File No. Exhibit Filing Date Filed Herewith Incorporated by Reference Exhibit Number Exhibit Description Form File No. Exhibit Filing Date Filed Herewith 10.29 OEM Supply Agreement, by and between the Registrant and Sumitomo Heavy Industries, Ltd., dated August 31, 1999. 10-K 000-25705 10.21 3/22/00 10.30† Form of Executive Retirement And Severance Benefits Agreement. 8-K 000-25705 10.1 2/16/05 10.43 Letter from Jones Day, on behalf of Stephen Bershad, to Brown Rudnick LLP, on behalf of the Registrant and its debtor affiliates, dated December 2, 2009. 8-K 000-25705 10.1 12/7/09 10.44 Restructuring Plan Support Agreement, by and among the Registrant, GSI Group Corporation, MES International, Inc., the Equity Committee, the Equity Holders, and the Noteholders, dated as of May 14, 2010. 8-K 000-25705 10.1 5/18/10 10.45 Backstop Commitment Agreement, by and among the Registrant and the investors indentified on Schedule I thereto, dated as of May 14, 2010. 8-K 000-25705 10.2 5/18/10 10.46 Engagement Letter between the Registrant, GSI Group Corporation, MES International, Inc. and FTI Consulting, Inc., dated as of May 6, 2010. 8-K 000-25705 10.3 5/18/10 10.47† Separation and Release Agreement, by and between the Registrant and Sergio Edelstein, dated as of May 24, 2010. 8-K 000-25705 10.1 5/28/10 10.48 Security Agreement, by and among GSI Group Corporation, the Grantors named therein and The Bank of New York Mellon Trust Company, N.A., as collateral agent, dated as of July 23, 2010. 8-K 000-25705 10.1 7/23/10 10.49 Escrow Agreement, by and among the Registrant and Law Debenture Trust Company of New York, as escrow agent, dated as of July 23, 2010. 8-K 000-25705 10.2 7/23/10 10.50 Open-End Deed of Trust, Assignment of Leases and Rents, Security Agreement and Fixture Filing, dated as of July 23, 2010, made by Synrad, Inc. in favor of First American Title Insurance Company and The Bank of New York Mellon Trust Company, N.A. 8-K 000-25705 10.3 7/23/10 10.51 Open-End Mortgage, Assignment of Leases and Rents, Security Agreement and Fixture Filing, dated as of July 23, 2010, made by Control Laser Corporation in favor of The Bank of New York Mellon Trust Company, N.A. 8-K 000-25705 10.4 7/23/10 10.30† Form of Executive Retirement And Severance Benefits Agreement. 8-K 000-25705 10.1 2/16/05 10.43 Letter from Jones Day, on behalf of Stephen Bershad, to Brown Rudnick LLP, on behalf of the Registrant and its debtor affiliates, dated December 2, 2009. 8-K 000-25705 10.1 12/7/09 10.44 Restructuring Plan Support Agreement, by and among the Registrant, GSI Group Corporation, MES International, Inc., the Equity Committee, the Equity Holders, and the Noteholders, dated as of May 14, 2010. 8-K 000-25705 10.1 5/18/10 10.45 Backstop Commitment Agreement, by and among the Registrant and the investors indentified on Schedule I thereto, dated as of May 14, 2010. 8-K 000-25705 10.2 5/18/10 10.46 Engagement Letter between the Registrant, GSI Group Corporation, MES International, Inc. and FTI Consulting, Inc., dated as of May 6, 2010. 8-K 000-25705 10.3 5/18/10 10.47† Separation and Release Agreement, by and between the Registrant and Sergio Edelstein, dated as of May 24, 2010. 8-K 000-25705 10.1 5/28/10 10.48 Security Agreement, by and among GSI Group Corporation, the Grantors named therein and The Bank of New York Mellon Trust Company, N.A., as collateral agent, dated as of July 23, 2010. 8-K 000-25705 10.1 7/23/10 10.49 Escrow Agreement, by and among the Registrant and Law Debenture Trust Company of New York, as escrow agent, dated as of July 23, 2010. 8-K 000-25705 10.2 7/23/10 10.50 Open-End Deed of Trust, Assignment of Leases and Rents, Security Agreement and Fixture Filing, dated as of July 23, 2010, made by Synrad, Inc. in favor of First American Title Insurance Company and The Bank of New York Mellon Trust Company, N.A. 8-K 000-25705 10.3 7/23/10 10.51 Open-End Mortgage, Assignment of Leases and Rents, Security Agreement and Fixture Filing, dated as of July 23, 2010, made by Control Laser Corporation in favor of The Bank of New York Mellon Trust Company, N.A. 8-K 000-25705 10.4 7/23/10 10.52 Deed of Trust, Assignment of Leases and Rents, Security Agreement and Fixture Filing, dated as of July 23, 2010, made by Photo Research, Inc., in favor of First American Title Insurance Company and The Bank of New York Mellon Trust Company, N.A. 8-K 000-25705 10.5 7/23/10
Incorporated by Reference Exhibit Number Exhibit Description Form File No. Exhibit Filing Date Filed Herewith Incorporated by Reference Exhibit Number Exhibit Description Form File No. Exhibit Filing Date Filed Herewith 10.52 Deed of Trust, Assignment of Leases and Rents, Security Agreement and Fixture Filing, dated as of July 23, 2010, made by Photo Research, Inc., in favor of First American Title Insurance Company and The Bank of New York Mellon Trust Company, N.A. 8-K 000-25705 10.5 7/23/10 10.53 First Amendment to Lease, dated February 10, 2010 and effective as of May 27, 2010, by and between GSI Group Corporation and 125 Middlesex Turnpike, LLC. 10-K 000-25705 10.53 10/1/10 10.54† GSI Group Inc. 2010 Incentive Award Plan. 8-K 000-25705 10.1 11/30/10 10.55† First Amendment to the GSI Group Inc. 2010 Incentive Award Plan. * 10.56† Employment Agreement, dated as of November 16, 2010, between GSI Group Inc. and John Roush. 8-K 000-25705 10.1 11/17/10 10.57† Employment Agreement, dated as of February 10, 2011, between GSI Group Inc. and Robert Buckley. 8-K 001-35083 10.1 2/11/11 10.58† Restricted Stock Cancellation Agreement, dated as of March 11, 2011 between GSI Group Inc. and Byron Pond. * 10.59† Form of Deferred Stock Unit Award Agreement. * 10.60† Form of Restricted Stock Unit Award Agreement for John Roush and Robert Buckley. * 10.61 First Amendment to Engagement Letter between the Registrant, GSI Group Corporation, MES International, Inc. and FTI Consulting, Inc., dated as of February 6, 2011. * 21.1 Subsidiaries of the Registrant. * 23.1 Consent of Independent Registered Public Accounting Firm. * 24 Power of Attorney. * 31.1 Chief Executive Officer Certification pursuant to Section 302 of the Sarbanes-Oxley Act of 2002. * 31.2 Chief Financial Officer Certification pursuant to Section 302 of the Sarbanes-Oxley Act of 2002. * 32.1 Chief Executive Officer Certification pursuant to 18 U.S.C. Section 1350, as adopted pursuant to Section 906 of the Sarbanes-Oxley Act of 2002. * 32.2 Chief Financial Officer Certification pursuant to 18 U.S.C. Section 1350, as adopted pursuant to Section 906 of the Sarbanes-Oxley Act of 2002. * 10.53 First Amendment to Lease, dated February 10, 2010 and effective as of May 27, 2010, by and between GSI Group Corporation and 125 Middlesex Turnpike, LLC. 10-K 000-25705 10.53 10/1/10 10.54† GSI Group Inc. 2010 Incentive Award Plan. 8-K 000-25705 10.1 11/30/10 10.55† First Amendment to the GSI Group Inc. 2010 Incentive Award Plan. 10-K 001-35083 10.55 3/30/11 10.56† Employment Agreement, dated as of November 16, 2010, between GSI Group Inc. and John Roush. 8-K 000-25705 10.1 11/17/10 10.57† Employment Agreement, dated as of February 10, 2011, between GSI Group Inc. and Robert Buckley. 8-K 001-35083 10.1 2/11/11 10.58† Restricted Stock Cancellation Agreement, dated as of March 11, 2011 between GSI Group Inc. and Byron Pond. 10-K 001-35083 10.58 3/30/11 10.59† Form of Deferred Stock Unit Award Agreement. 10-K 001-35083 10.59 3/30/11 10.60† Form of Restricted Stock Unit Award Agreement for John Roush and Robert Buckley. 10-K 001-35083 10.60 3/30/11 10.61 First Amendment to Engagement Letter between the Registrant, GSI Group Corporation, MES International, Inc. and FTI Consulting, Inc., dated as of February 6, 2011. 10-K 001-35083 10.61 3/30/11 10.62† Form of U.S. Restricted Stock Unit Award Agreement. 10-Q 001-35083 10.2 5/16/11 10.63† Letter Agreement, between GSI Group Inc. and Anthony J. Bellantuoni, dated June 21, 2011. 8-K 001-35083 10.1 6/22/11 10.64† Severance Agreement, dated as of April 25, 2011, by and between GSI Group Inc. and David Clarke. 10-Q 001-35083 10.1 8/11/11 10.65† Offer Letter, dated June 23, 2011, between GSI Group Inc. and Jamie Bader. 10-Q 001-35083 10.3 8/11/11 10.66† Offer Letter, dated June 8, 2011, between GSI Group Inc. and Peter Chang. 10-Q 001-35083 10.1 11/10/11 10.67† Offer Letter, dated July 27, 2011, between GSI Group Inc. and Deborah Mulryan. 10-Q 001-35083 10.2 11/10/11 10.68 Credit Agreement, dated October 19, 2011, by and among GSI Group Corporation, GSI Group Inc., Bank of America, N.A., as Administrative Agent, Silicon Valley Bank, as Syndication Agent, Merrill Lynch, Pierce, Fenner & Smith Incorporated, as Sole Lead Arranger and Sole Book Manager, and HSBC. 8-K 001-35083 10.1 10/19/11
Incorporated by Reference | ||||||||||||
Exhibit Number | Exhibit Description | Form | File No. | Exhibit | Filing Date | Filed Herewith | ||||||
| 10.69 | First Amendment to Credit Agreement, dated March 9, 2012, by and among GSI Group Corporation, GSI Group, Inc., Bank of America, N.A., as Administrative Agent, Silicon Valley Bank, and HSBC. | * | ||||||||||
| 21.1 | Subsidiaries of the Registrant. | * | ||||||||||
| 23.1 | Consent of Independent Registered Public Accounting Firm. | * | ||||||||||
| 31.1 | Chief Executive Officer Certification pursuant to Section 302 of the Sarbanes-Oxley Act of 2002. | * | ||||||||||
| 31.2 | Chief Financial Officer Certification pursuant to Section 302 of the Sarbanes-Oxley Act of 2002. | * | ||||||||||
| 32.1 | Chief Executive Officer Certification pursuant to 18 U.S.C. Section 1350, as adopted pursuant to Section 906 of the Sarbanes-Oxley Act of 2002. | * | ||||||||||
| 32.2 | Chief Financial Officer Certification pursuant to 18 U.S.C. Section 1350, as adopted pursuant to Section 906 of the Sarbanes-Oxley Act of 2002. | * | ||||||||||
| 101.INS | XBRL Instance Document. | |||||||||||
| 101.SCH | XBRL Schema Document | |||||||||||
| 101.CAL | XBRL Calculation Linkbase Document. | |||||||||||
| 101.DEF | XBRL Definition Linkbase Document. | |||||||||||
| 101.LAB | XBRL Labels Linkbase Document. | |||||||||||
| 101.PRE | XBRL Presentation Linkbase Document. | |||||||||||
| † | This exhibit constitutes a management contract, compensatory plan, or arrangement. |
Attached as Exhibit 101 to this report are the following formatted in XBRL (Extensible Business Reporting Language): (i) Consolidated Balance Sheets at December 31, 2011 and December 31, 2010, (ii) Consolidated Statements of Operations for the years ended December 31, 2011, December 31, 2010, and December 31, 2009, (iii) Consolidated Statements of Comprehensive Income (Loss) for the years ended December 31, 2011, December 31, 2010 and December 31, 2009, (iv) Consolidated Statements of Stockholders’ Equity for the years ended December 31, 2011, December 31, 2010, and December 31, 2009, (v) Consolidated Statements of Cash Flows for the years ended December 31, 2011, December 31, 2010, and December 31, 2009, and (vi) Notes to Consolidated Financial Statements.
The XBRL related information in Exhibits 101 to this Annual Report on Form 10-K shall not be deemed “filed” or a part of a registration statement or prospectus for purposes of Sections 11 or 12 of the Securities Act of 1933, as amended and is not filed for purposes of Section 18 of the Securities Exchange Act of 1934, as amended, or otherwise subject to the liabilities of those sections.
Pursuant to the requirements of Section 13 or 15(d) of the Securities Exchange Act of 1934, the registrant has duly caused this report to be signed on its behalf by the undersigned, thereunto duly authorized.
| GSI GROUP INC. | ||
| By: | /s/ John A. Roush | |
| John A. Roush | ||
| Chief Executive Officer | ||
Date: March 30, 201114, 2012
Pursuant to the requirements of the Securities Exchange Act of 1934, this report has been signed below by the following persons on behalf of the registrant and in the capacities and on the dates indicated.
Signature | Title | Date | ||
/s/ John A. Roush John A. Roush | Director, Chief Executive Officer | March | ||
/s/
|
| March | ||
/s/ Peter L. Chang Peter L. Chang | Vice President, Corporate Controller (Chief Accounting Officer) | March 14, 2012 | ||
/s/ Stephen W. Bershad Stephen W. | Chairman of the Board of Directors | March | ||
/s/ Eugene I. Davis Eugene I. | Director | March | ||
/s/ Dennis J. Fortino Dennis J. | Director | March | ||
|
|
| ||
/s/ Ira J. Lamel Ira J. | Director | March | ||
/s/ Byron O. Pond Byron O. | Director | March | ||
| ||
146117