UNITED STATES
SECURITIES AND EXCHANGE COMMISSION
Washington, DC 20549
FORM 10-K
FOR ANNUAL AND TRANSITION REPORTS PURSUANT TO SECTIONS 13 OR 15(d) OF THE
SECURITIES EXCHANGE ACT OF 1934
| x | ANNUAL REPORT PURSUANT TO SECTION 13 OR 15(d) OF THE SECURITIES EXCHANGE ACT OF 1934 |
For the fiscal year ended January 31, 20112012
| ¨ | TRANSITION REPORT PURSUANT TO SECTION 13 OR 15(d) OF THE SECURITIES EXCHANGE ACT OF 1934 |
For the transition period from to
Commission File No. 000-22754
URBAN OUTFITTERS, INC.
(Exact Name of Registrant as Specified in Its Charter)
| Pennsylvania | 23-2003332 | |
(State or Other Jurisdiction of Incorporation or Organization) | (I.R.S. Employer Identification No.) | |
| 5000 South Broad Street, Philadelphia, PA | 19112-1495 | |
| (Address of Principal Executive Offices) | (Zip Code) | |
Registrant’s telephone number, including area code: (215) 454-5500
Securities registered pursuant to Section 12(b) of the Act:
Title of Each Class | Name of Exchange on Which Registered | |
| Common Shares, $.0001 par value | The NASDAQ Global Select Market LLC |
Securities registered pursuant to Section 12(g) of the Act: None
Indicate by checkmark if the registrant is a well-known seasoned issuer, as defined in Rule 405 of the Securities Act. Yes x No ¨
Indicate by checkmark if the registrant is not required to file reports pursuant to Section 13 or Section 15(d) of the Act. Yes ¨ No x
Indicate by checkmark whether the registrant (1) has filed all reports required to be filed by Section 13 or 15(d) of the Securities Exchange Act of 1934 during the preceding 12 months (or for such shorter period that the registrant was required to file such reports), and (2) has been subject to such filing requirements for the past 90 days. Yes x No ¨
Indicate by check mark whether the registrant has submitted electronically and posted on its corporate website, if any, every Interactive Data File required to be submitted and posted pursuant to Rule 405 of Regulation S-T during the preceding 12 months (or for such shorter period that the registrant was required to submit and post such files). Yes x No ¨
Indicate by checkmark if disclosure of delinquent filers pursuant to Item 405 of Regulation S-K is not contained herein, and will not be contained, to the best of Registrant’s knowledge, in definitive proxy or information statements incorporated by reference in Part III of this Form 10-K or any amendment to this Form 10-K. x
Indicate by checkmark whether the registrant is a large accelerated filer, an accelerated filer, a non-accelerated filer, or a smaller reporting company. See the definitions of “large accelerated filer,” “accelerated filer” and “smaller reporting company” in Rule 12b-2 of the Exchange Act.
| Large accelerated filer x | Accelerated filer ¨ | |
| Non-accelerated filer ¨ (Do not check if a smaller reporting company) | Smaller reporting company ¨ |
Indicate by a checkmark whether the registrant is a shell company (as defined in Rule 12b-2 of the Act). Yes ¨ No x
The aggregate market value of the voting and non-voting common equity held by non-affiliates computed by reference to the price at which the common equity was last sold, or the average bid and asked price of such common equity, as of the last business day of the registrant’s most recently completed second fiscal quarter, was $4,243,728,212.$3,956,641,654.
The number of shares outstanding of the registrant’s common stock on March 24, 201127, 2012 was 162,255,448.144,706,907.
DOCUMENTS INCORPORATED BY REFERENCE
Certain information required by Items 10, 11, 12, 13 and 14 is incorporated by reference into Part III hereof from portions of the Proxy Statement for the registrant’s 20112012 Annual Meeting of Shareholders.
| PART I | ||||||
| Item 1. | 1 | |||||
| Item 1A. | ||||||
| Item 1B. | 17 | |||||
| Item 2. | ||||||
| Item 3. | ||||||
| Item 4. | ||||||
| PART II | ||||||
| Item 5. | ||||||
| Item 6. | ||||||
Item 7. | Management’s Discussion and Analysis of Financial Condition and Results of Operations | |||||
| Item 7A. | ||||||
| Item 8. | ||||||
| Item 9. | Changes in and Disagreements with Accountants on Accounting and Financial Disclosure | |||||
| Item 9A. | ||||||
| Item 9B. | ||||||
| PART III | ||||||
| Item 10. | ||||||
| Item 11. | ||||||
| Item 12. | Security Ownership of Certain Beneficial Owners and Management and Related Shareholder Matters | |||||
| Item 13. | Certain Relationships and Related Transactions, and Director Independence | |||||
| Item 14. | ||||||
| PART IV | ||||||
| Item 15. | ||||||
| F-1 | ||||||
ThisCertain matters contained in this filing with the United States Securities and Exchange Commission (“SEC”) ismay contain forward-looking statements and are being made pursuant to the “safe harbor” provisions of the Private Securities Litigation Reform Act of 1995. Certain matters contained in this filing may constitute forward-looking statements. When used in this Form 10-K, the words “project,” “believe,” “plan,” “anticipate,” “expect” and similar expressions are intended to identify forward-looking statements, although not all forward-looking statements contain these identifying words. Any one, or all, of the following factors could cause actual financial results to differ materially from those financial results mentioned in the forward-looking statements: the difficulty in predicting and responding to shifts in fashion trends, changes in the level of competitive pricing and promotional activity and other industry factors, overall economic and market conditions and the resultant impact on consumer spending patterns, lowered levels of consumer confidence and higher levels of unemployment, and continuation of lowered levels of consumer spending resulting from the continuing worldwide economic downturn and related debt crisis, any effects of terrorist acts or war, availability of suitable retail space for expansion, timing of store openings, risks associated with international expansion, seasonal fluctuations in gross sales, the departure of one or more key senior managers, import risks, including potential disruptions and changes in duties, tariffs and quotas, the closing of any of our distribution centers, our ability to protect our intellectual property rights, risks associated with internet sales, response to new store concepts, potential difficulty liquidating certain marketable security investments, changes in accounting standards and subjective assumptions, regulatory changes and legal matters and other risks identified in our filings with the SEC, including those set forth in item 1A of this Form 10-K. We disclaim any intent or obligation to update forward-looking statements even if experience or future changes make it clear that actual results may differ materially from any projected results expressed or implied therein.
Unless the context otherwise requires, all references to “Urban Outfitters,” the “Company,” “we,” “us,” “our” or “our company” refer to Urban Outfitters, Inc., together with its subsidiaries.
PART I
General
We are a leading lifestyle specialty retail company that operates under the Urban Outfitters, Anthropologie, Free People, Terrain Leifsdottir and BHLDN brands. We also operate a wholesale segment under the Free People and Leifsdottir brands.brand. We have over 4041 years of experience creating and managing retail stores that offer highly differentiated collections of fashion apparel, accessories and home goods in inviting and dynamic store settings. Our core strategy is to provide unified store environments that establish emotional bonds with the customer. In addition to our retail stores, we offer our products and market our brands directly to the consumer through our e-commerce web sites,websites,www.urbanoutfitters.com,www.anthropologie.com, www.freepeople.com,www.urbanoutfitters.co.uk,www.urbanoutfitters.de,www.urbanoutfitters.fr, www.anthropologie.eu, www.leifsdottir.com,www.shopterrain.comand www.bhldn.comand also through our Urban Outfitters, Anthropologie and Free People catalogs. We have achieved compounded annual sales growth of approximately 16%15% over the past five years, with sales of approximately $2.3$2.5 billion in fiscal 2011.2012.
We opened our first store in 1970 near the University of Pennsylvania campus in Philadelphia.Philadelphia, Pennsylvania. We were incorporated in Pennsylvania in 1976, and opened our second store in Harvard Square, Cambridge, Massachusetts in 1980. The first Anthropologie store opened in a suburb of Philadelphia in October 1992. We started doing business in Europe in June 1998, with our first European store
European Urban Outfitters store located in London. We opened our first Free People store in the Garden State Plaza Mall in Paramus, New Jersey in November 2002. We opened our first Terrain garden center in Glen Mills, Pennsylvania in April 2008. We opened our first European Anthropologie store in London in October 2009. In FebruaryAugust 2011, we launchedopened our first BHLDN a sophisticated and inspired retail brand with a primary focus on all bridal event offerings.store in Houston, Texas.
In 1984 we established the Free People wholesale division to develop, in conjunction with Urban Outfitters, private label apparel lines of young women’s casual wear that could be effectively sold at attractive prices in Urban Outfitters stores. In 2009, we launched Leifsdottir, a sophisticated wholesale brand.
Our fiscal year ends on January 31. All references in this discussion to our fiscal years refer to the fiscal years ended on January 31 in those years. For example, our fiscal 20112012 ended on January 31, 2011.2012.
Our annual report on Form 10-K, quarterly reports on Form 10-Q, current reports on Form 8-K and amendments to those reports filed with, or furnished to, the SEC pursuant to Section 13(a) or 15(d) of the Securities Exchange Act of 1934, as amended, are available free of charge on our investor relations web site,website,www.urbanoutfittersinc.com, as soon as reasonably practicable after we electronically file such material with, or furnish such material to, the SEC. We will voluntarily provide electronic or paper copies (other than exhibits) of our filings free of charge upon written request. You may also obtain any materials we file with, or furnish to, the SEC on its web sitewebsite atwww.sec.gov.
Retail Stores
Urban Outfitters.Outfitters. Urban Outfitters targets young adults aged 18 to 28 through its unique merchandise mix and compelling store environment. We have established a reputation with these young adults, who are culturally sophisticated, self-expressive and concerned with acceptance by their peer group. The product offering includes women’s and men’s fashion apparel, footwear and accessories, as well as an eclectic mix of apartment wares and gifts. Apartment wares range from rugs, pillows and shower curtains to books, candles and novelties. Stores average approximately 9,2009,000 square feet of selling space, and typically carry an estimated 45,00055,000 to 50,00060,000 stock keeping units (“SKUs”). Our stores are located in large metropolitan areas, select university communities, specialty centers and enclosed malls. Our stores accommodate our customers’ propensity not only to shop, but also to congregate with their peers. As of January 31, 2011,2012, we operated 176197 Urban Outfitters stores in North America and Europe, as well as four web siteswebsites and the Urban Outfitters catalog. We plan to open approximately 1923 Urban Outfitters stores, globally, in fiscal 2012.2013. Urban Outfitters’ North American and European store sales accounted for approximately 31.8%31.4% and 5.3%5.9% of consolidated net sales, respectively, for fiscal 2011.2012.
Anthropologie.Anthropologie. Anthropologie tailors its merchandise and inviting store environment to sophisticated and contemporary women aged 28 to 45. Anthropologie’s unique and eclectic product assortment includes women’s casual apparel and accessories, shoes, home furnishings and a diverse array of gifts and decorative items. The home furnishings range from furniture, rugs, lighting and antiques to table top items, bedding and gifts. Stores average approximately 7,3007,200 square feet of selling space, typically carry an estimated 40,00045,000 to 45,00050,000 SKUs and are located in specialty retail centers, upscale street locations and enclosed malls. As of January 31, 2011,2012, we operated 153168 Anthropologie stores in North America and Europe, as well as two web siteswebsites and the Anthropologie catalog. We plan to open approximately 1714 Anthropologie stores, globally, in fiscal 2012.2013. Anthropologie’s North American and European store sales accounted for approximately 35.1%32.8% and 0.8%0.9% of consolidated net sales, respectively, for fiscal 2011.2012.
Free People.People. Our Free People retail stores primarily offer Free People branded merchandise targeted to young contemporary women aged 25 to 30. Free People offers a unique merchandise mix of casual women’s apparel, intimates, shoes, accessories and gifts. Free People retail stores average approximately 1,400 square feet of selling space, carry up to 18,0007,000 SKUs and are located in enclosed malls, upscale street locations and specialty retail centers. The retail channels of Free People expose both our wholesale accounts and retail customers to the full Free People product assortment and store environment. As of January 31, 2011,2012, we operated 4262 Free People stores in the United States, as well as a web sitewebsite and the Free People catalog. We plan to open approximately 1416 new Free People stores in fiscal 2012.2013. Free People retail store sales accounted for approximately 2.3%2.7% of our consolidated net sales for fiscal 2011.2012.
Terrain.Terrain. Terrain is designed to appeal to men and women interested in a creative, sophisticated outdoor living and gardening experience. Terrain creates a compelling shopping environment through its large and free standing site, inspired by the ‘greenhouse.’ Merchandise includes lifestyle home and garden products combined with antiques, live plants, flowers, wellness products and accessories. Our Terrain garden center operates approximately 20,000 square feet of enclosed selling space as well as approximately two acres of outdoor seasonal selling space used for its offering of lifestyle home and garden products, antiques, live plants, accessoriesflowers, wellness products and outdoor furniture.accessories. Terrain also offers a variety of landscape and design service solutions. Terrain also operatessolutions in addition to operating a web site.website. Terrain retail sales accounted for less than 1% of our consolidated net sales for fiscal 2011. We will continue to evaluate locations for future2012. As of January 31, 2012, we operated one Terrain garden centerscenter and plan on opening a second Terrain garden center during the first half of fiscal 2013.
BHLDN.In August 2011, we opened our first BHLDN store in Houston, Texas. The BHLDN brand emphasizes every element that contributes to a wedding. BHLDN offers a curated collection of heirloom quality wedding gowns, bridesmaid frocks, party dresses, assorted jewelry, headpieces, footwear, lingerie and decorations. The store has approximately 3,400 square feet of selling space and is located in a specialty retail center. BHLDN retail sales accounted for less than 1% of our consolidated net sales for fiscal 2012. As of January 31, 2012, we operated one BHLDN store, as well as a website, and we opened a second BHLDN store in Chicago, Illinois during the first quarter of fiscal 2013.
Direct-to-Consumer
Anthropologie offersWe operate a direct-to-consumer catalogDirect-to-Consumer channel which generates sales directly through our websites and catalogs. We also believe that markets select merchandise, mostour Direct-to-Consumer channel increases the reputation and recognition of which is also available in our Anthropologie stores. During fiscal 2011, we circulated approximately 17.6 million catalogsbrands with our target customers and plan to increase circulationhelp support and strengthen our store operations. Direct-to-Consumer sales for all brands combined, increased 1.3% to approximately 23.2 million catalogs20.4% of consolidated net sales in fiscal 2012.
Our Anthropologie European customers are offered a direct-to-consumer catalog that markets selected merchandise, most of which is also offered at our Anthropologie stores located in Europe. The catalog was recently launched in September 2010 and we circulated approximately 126,000 catalogs in Europe during2012, as compared to fiscal 2011.
We planbelieve that our web marketing and social media initiatives are a significant contributor to circulate approximately 595,000 catalogs in Europe duringour Direct-to-Consumer sales growth. For fiscal 2012. We anticipate the number of catalogs circulated to grow consistent with the anticipated demand from our European Anthropologie customers.
Anthropologie operates a web site,which accepts orders directly from customers. The web site captures the spirit of the store by offering a similar yet broader array of apparel, accessories and household and gift merchandise as found in the stores.
Anthropologie also operates a web site targeting our European customers. The web site was launched in March 2010. The web site captures the spirit of our European stores by offering a similar yet broader selection of merchandise as found in the stores. Fulfillment is currently provided by a third-party distribution center located in the United Kingdom. During the second quarter of fiscal 20122013 we anticipate opening self-owned and operated fulfillment and distribution centers in Rushden, England.
Urban Outfitters offers a direct-to-consumer catalog offering select merchandise, most of which is also available in our Urban Outfitters stores. During fiscal 2011, we circulated approximately 14.2 million Urban Outfitters catalogs and plan to increase our circulationinvestment in web marketing and social media initiatives for all of our brands. These increases will be based on our continual evaluation of the customer’s response rate to approximately 15.4 million catalogs inweb marketing initiatives.
During fiscal 2012.
Our Urban Outfitters European customers are offered a direct-to-consumer catalog that markets selected merchandise, most of which is also offered at our Urban Outfitters stores located in Europe. The catalog was recently launched in November 2010 and2012 we circulated approximately 200,000 catalogs in Europe during fiscal 2011. We plan to circulate approximately 800,000 catalogs in Europe during fiscal 2012. We anticipate the number of catalogs circulated to grow consistent with the anticipated demand from our European Urban Outfitters customers.
Urban Outfitters operates a web sitethat accepts orders directly from customers. The web site captures the spirit of the store by offering a similar yet broader selection of merchandise as found in the stores.
Urban Outfitters also operates three web sites targeting our European customers. The web sites capture the spirit of our European stores by offering a similar yet broader selection of merchandise as found in the stores. Fulfillment is currently provided by a third-party distribution center located in the United Kingdom. We expect to be operational at our fulfillment and distribution centers in Rushden, England during the second quarter of fiscal 2012.
Free People offers a direct-to-consumer catalog offering select merchandise most of which is also available in our Free People stores. During fiscal 2011, we circulated approximately 7.647.9 million catalogs and plan to expandacross all brands. Our catalog circulation to approximately 8.8 million catalogs in fiscal 2012.
Free People operates a web site that accepts orders directly from customers. The web site exposes consumers to the product assortment found at Free People retail stores as well as all of the Free People wholesale offerings.
Terrain operates a web site that accepts orders directly from customers. The web site was launched in September 2009. The web site exposes consumers to a portion of the product assortment found at the Terrain retail store.
Leifsdottir operates a web site that accepts orders directly from consumers. The web site was launched in February 2010. The web site exposes consumers to all product offerings from the Leifsdottir concept.
BHLDN launched its website on February 14, 2011. The website accepts orders directly from customers and exposes consumers to all product offerings from the BHLDN concept. A retail store is planned to open during fiscal 2012.
Increases in our catalog circulationlevels are driven by our evaluation of the response rate to each individual catalog. Based upon that evaluation, we adjust the frequency and circulation of our catalog portfolio as needed. In addition, we evaluate the buying pattern of our direct-to-consumerDirect-to-Consumer customers to determine which customers respond to our catalog mailings. We also utilize the services of list rental companiesAccordingly, we plan to identify potential customers that will receive future catalogs.decrease our catalog circulation to approximately 44.7 million catalogs across all brands in fiscal 2013.
We believeAnthropologie. Anthropologie operates a website, which accepts orders directly from customers. The website captures the spirit of the store by offering a similar yet broader array of women’s casual apparel and accessories, shoes, home furnishings, gifts and decorative items as found in our stores. Anthropologie also offers a direct-to-consumer catalog that markets select merchandise, most of which is also available in our web sites increaseAnthropologie stores.
Anthropologie operates a website targeting our European customers. The website captures the reputation and recognitionspirit of our brands withEuropean stores by offering a similar yet broader selection of merchandise as found in our targetEuropean stores. Our Anthropologie European customers are also offered a direct-to-consumer catalog that markets selected merchandise, most of which is also offered at our Anthropologie stores located in Europe.
Urban Outfitters.Urban Outfitters operates a website that accepts orders directly from customers. The website captures the spirit of the store by offering a similar yet broader selection of merchandise as found in our stores. Urban Outfitters offers a direct-to-consumer catalog offering select merchandise, most of which is also available in our Urban Outfitters stores.
Urban Outfitters operates three websites targeting our European customers. These websites capture the spirit of our European stores by offering a similar yet broader selection of merchandise as found in our European stores. Our Urban Outfitters European customers are offered a direct-to-consumer catalog that markets selected merchandise, most of which is also offered at our Urban Outfitters stores located in Europe.
Free People. Free People operates a website that accepts orders directly from customers. The website exposes consumers to a similar yet broader selection of merchandise as found in our stores, as well as all of the Free People wholesale offerings. Free People also offers a direct-to-consumer catalog offering select merchandise most of which is also available in our Free People stores.
Terrain. Terrain operates a website that accepts orders directly from customers. The website exposes consumers to a portion of the product assortment found at the Terrain retail store.
BHLDN.BHLDN launched its website on February 14, 2011. The website accepts orders directly from customers and help support the strength of our stores’ operations. We plan on increasing our spending on investments in web marketing in fiscal 2012 forexposes consumers to all of our brands. These increases will be based on our daily evaluationproduct offerings of the customer’s response rate to our marketing investments.
Direct-to-consumer sales for all brands combined were approximately 19.1% of consolidated net sales for fiscal 2011.BHLDN brand.
Wholesale Operations
The Free People wholesale division was established in 1984 to develop, in conjunction with Urban Outfitters, private label apparel lines of young women’s casual wear that could be effectively sold at attractive prices in Urban Outfitters stores. In order to achieve minimum production lots, Free People wholesale began selling to other retailers throughout the United States. During fiscal 2011,2012, Free People’s range of tops, bottoms, sweaters and dresses were sold worldwide through approximately 1,400 better department and specialty stores, including Bloomingdale’s, Nordstrom, Lord & Taylor, Belk and itsour own Free People stores. Free People currently sells its merchandise under ourFreePeopleand other labels. We also distribute our Free People products in certain department stores using a shop-within-shop sales model. We believe that the shop-within-shop model allows for a more complete merchandising of our Free People products and will give us greater freedom in differentiating the presentation of our products and further strengthening of our brand image. We monitor the styles and products that are popular with our wholesale customers to give us insight into current fashion trends, which helphelps us better serve our retail customers. Free People presently maintains wholesale sales and showroom facilities in New York City, Los Angeles and Chicago. Free People wholesale sales accounted for approximately 4.9%5.1% of consolidated net sales for fiscal 2011.2012.
In addition to selling its merchandise to specialty retailers, Free People wholesale also shares production sourcing with our retail segment. Free People employs its own senior and creative management staff, but shares business support services with the retail segment.
The Leifsdottir wholesale division was established in fiscal 2009. Leifsdottir designs, develops and markets sophisticated women’s contemporary apparel including dresses, tops, bottoms, as well as shoes and accessories. Leifsdottir is sold through luxury department stores including Bloomingdale’s, Nordstrom, Neiman Marcus and Bergdorf Goodman, select specialty stores and our own Anthropologie stores. We also distribute our Leifsdottir products in certain department stores using a shop-within-shop sales model. We believe that the shop-within-shop model allows for a more complete merchandising of our Leifsdottir products and will give us greater freedom in differentiating the presentation of our products and further strengthening our brand image. Leifsdottir presently maintains a wholesale sales and showroom facility in New York City. Leifsdottir wholesale sales accounted for less than 1% of total consolidated net sales for fiscal 2011.
Store Environment
We create a unified environment in our stores that establishes an emotional bond with the customer. Every element of the environment is tailored to the aesthetic preferences of our target customers. Through creative design, much of the existing retail space is modified to incorporate a mosaic of fixtures, finishes and revealed architectural details. In our stores, merchandise is integrated
into a variety of creative vignettes and displays designed to offer our customers an entire look at a distinct lifestyle. This dynamic visual merchandising and display technique provides the connection among the store design, the merchandise and the customer. Essential components of the ambienceambiance of each store may include playing music that appeals to our target customers, using unique signage and employing a staff that understands and identifies with the target customer.
Anthropologie considers it important to create an individualized and tailored store shopping experience for each customer. By providing an inviting and pleasant shopping atmosphere and an attentive sales staff, including, in many stores, in-store customer care managers, we strive to create a sense of community in our Anthropologie stores that encourages our target customers to linger and spend time exploring our stores and product offerings. Anthropologie stores are oftenat times placed in unique and non-traditional retail locations. A majority of our Anthropologie stores opened during fiscal 20112012 were located in specialty retail centers, upscale street locations and enclosed shopping malls. We plan to implement an Anthropologie location expansion strategy in fiscal 2012 similar to our strategy in fiscal 2011.
Our Urban Outfitters stores are oftenat times located in unconventional retail spaces, including a former movie theater, a bank and a stock exchange. A majority of our Urban Outfitters stores that opened in fiscal 20112012 were located in upscale street locations, specialty retail centers and enclosed shopping malls. We plan to implement an Urban Outfitters location expansion strategy in fiscal 2012 similar to our strategy in fiscal 2011.
Our Free People retail stores opened to date are primarily located in enclosed shopping malls, specialty retail centers and upscale street locations. We
For our Anthropologie, Urban Outfitters and Free People stores, we plan to implement a Free People location expansion strategy in fiscal 20122013 similar to our strategy in fiscal 2011.2012.
Our Terrain garden center is a free-standing location on ten acres of land with street-front view and access. We plan to evaluate futureon opening a second Terrain locationsgarden center during the first half of similar venue typefiscal 2013.
Our Houston BHLDN store is located in a specialty retail center. We opened a second BHLDN store in Chicago located in an upscale street location during the first quarter of fiscal 2012.2013.
Buying Operations
Maintaining a constant flow of fashionable merchandise for our retail segment is critically important to the ongoing performance of our stores and direct-to-consumer operations. We maintain our own buying groups that select and develop products to satisfy our target customers and provide us with the appropriate amount and timing of products.products offered. Merchandise managers may supervise several buyers and assistant buyers. Our buyers stay in touch with the evolving tastes of their target customers by shopping at major trade markets, attending national and regional trade shows and staying current with mass media influences, including internet,social media, music, video, film, magazines and pop culture.
Merchandise
Our Urban Outfitters stores, web siteswebsites and catalogs offer a wide array of eclectic merchandise, including women’s and men’s fashion apparel, footwear and accessories and an eclectic mix of apartment wares and gifts. Product offerings in our Anthropologie stores, web sitewebsites and catalogs include women’s casual apparel and accessories, shoes, as well as home furnishings and an eclectic diverse array of gifts and decorative accessories for the home, garden, bed and bath. Our Free People retail stores, web sitewebsite and catalog offer a showcase for casual women’s apparel, intimates, shoes, accessories and gifts, primarily developed and
designed by our Free People wholesale division. Our Terrain garden center and website offers lifestyle home and garden products combined with antiques, live plants, flowers, wellness products and accessories. Our BHLDN retail store and website offers a curated collection of heirloom quality wedding gowns, bridesmaid frocks, party dresses, assorted jewelry, headpieces, footwear, lingerie and decorations. Our merchandise is continuously updated to appeal to our target customers’ changing tastes and is supplied by a large number of domestic and foreign vendors, with new shipments of merchandise arriving at our stores almost daily.
The wide breadth of merchandise offered by our retail segment includes national third-party brands, as well as exclusive merchandise developed and designed internally by our brands. This selection allows us to offer fashionable merchandise and to differentiate our product mix from that of traditional department stores, as well as that of other specialty and direct-to-consumer retailers. Merchandise designed and developed by our brands generally yields higher gross profit margins than third-party branded merchandise, and helps to keep our product offerings current and unique.
The ever-changing mix of products available to our customers allows us to adapt our merchandise to prevailing fashion trends, and, together with the inviting atmosphere of our stores, encourages our core customers to visit our stores frequently.
We seek to select price points for our merchandise that are consistent with the spending patterns of our target customers. As such, our stores carry merchandise at a wide range of price points that may vary considerably within product categories.
Store Operations
We have organized our retail store operations by brand into geographic areas or districts that each withhave a district manager. District managers are responsible for several stores and monitor and supervise individual store managers. Each store manager is responsible for overseeing the daily operations of one of our stores. In addition to a store manager, the staff of a typical Urban Outfitters, Anthropologie, Free People, Terrain and TerrainBHLDN store includes a combination of some or all of the following positions; a visual manager, several department managers and a full and part-time sales and visual staff. The staff of a typical Anthropologie store may also include a customer care manager who helps tailor the shopping experience to the needs of Anthropologie’s target customers. Our Free People retail stores include a store manager, a visual coordinator and full and part-time sales staff. A Terrain garden center may also include merchandise care and maintenance staff. The staff of a BHLDN store also includes a product, bridal and event manager, appointment stylist and a category specialist.
An essential requirement for the success of our stores is our ability to attract, train and retain talented, highly motivated store managers, visual managers and other key employees. In addition to management training programs for both newly hired and existing employees, we have a number of retention programs that offer qualitative and quantitative performance-based incentives to district-level managers, store-level managers and full-time sales associates.
Marketing and Promotion
We believe we have highly effective marketing tools in our catalogswebsites and websites.catalogs. We refresh this media as frequently as daily to reflect the most cutting edge changes in fashion and culture. We also believe that highly visible store locations, creative store design, broad merchandise selection and visual presentation are key enticements for customers to enter and explore our stores and buy merchandise. Consequently, we rely on these factors, as well as the brand recognition created by our direct marketing activities, to draw customers into our stores, rather than on traditional forms of
advertising such as print, radio and television media. Marketing activities for each of our retail store concepts include special event promotions and a variety of public relations activities designed to create community awareness of our stores and products. We also are increasingly active in the burgeoning arena of social media and blogs. We believe that the traditional method of a one-way communication to customers is no longer enough. We believe that by starting a conversation and interacting directly with our customers, most notably via Facebook and Twitter, we are more effective at understanding and serving their fashion needs. We also believe that our blogs continue this conversation. Not only do weour blogs allow us to communicate what inspires us; it allowsus, they allow our customers to tell us what inspires them. This fosters our relationships with our customers and encourages them to continue shopping with us.
Suppliers
To serve our target customers and to recognize changes in fashion trends and seasonality, we purchase merchandise from numerous foreign and domestic vendors. To the extent that our vendors are located overseas or rely on overseas sources for a large portion of their merchandise, any event causing a disruption of imports, such as the imposition of import restrictions, war, acts of terrorism, natural disasters, financial or political instability in any of the countries in which goods we purchase are manufactured, or trade restrictions in the form of tariffs or quotas, or both, disruption in the supply of fabrics or raw materials, increases in the cost of fuel or decreases in the value of the U.S. dollar relative to foreign currencies could adversely affect our business. During fiscal 2011,2012, we did business withpurchased from approximately 3,3003,400 vendors. No single vendor accounted for more than 10.0%10% of merchandise purchased during that time. While certain of our vendors have limited financial resources and production capabilities, we do not believe that the loss of any one vendor would have a material effect on our business.
Company Operations
Distribution. A significant portion of merchandise purchased by our retail businesses is shipped directly to ourWe own a 291,000 square foot distribution centerfacility in Lancaster County, Pennsylvania which we own. In fiscal 2010 we completed construction on an additional 100,000 square feetthat receives and distributes approximately half of our retail store merchandise. This facility provides distribution spaceservices to our east coast retail stores at this facility, bringing it to 291,000 square feet in size.a favorable freight cost per unit, and provides for faster turnaround from selected vendors. This facility has an advanced computerized materialsmaterial handling system and is located approximately 65 miles from our home offices in Philadelphia.Philadelphia, Pennsylvania. We also lease a 214,500 square foot distribution center located in Reno, Nevada, that receives and distributes the remaining half of our retail store merchandise. This facility provides distribution services to our west coast retail stores at a favorable freight cost per unit, and provides for faster turnaround from selected vendors.
We lease a 459,000 square foot fulfillment center located in Trenton, South Carolina. Currently, this facility houses the majority of merchandise distributed bythrough our wholesale and direct-to-consumer channels. This building significantly expanded our fulfillment capacity and provides us with future opportunities for additional growth as it becomes necessary. This facility also
utilizes a state-of-the-art and fully functional tilt tray sorter.an automated material handling system. The property currently accommodates all direct-to-consumer fulfillment related functions, including inventory warehousing, receiving, customer contact operations and customer shipping.
In fiscal 2008April 2011 we executedpurchased land and began construction on a long-term lease to utilize a distribution center in Reno, Nevada, effectively relocating, expanding and bringing our west coast distribution service in-house. In March 2009 we executed an amendment to our long-term lease for an additional 39,000 square feet at this distribution center bringing it to 214,500 square feet in size. This facility services our stores in the western United States at a favorable freight cost per unit, and provides faster turnaround from selected vendors.
We plan to purchase land to construct a 468,000463,000 square foot fulfillment center also located in Reno, Nevada. This centerfacility, which we will own and operate, will be used primarily to house and distribute merchandise to our western United States direct-to-consumer customers, significantly increaseimproving our fulfillment capacitycapability. The facility will include automated material handling systems as well as a data center. We anticipate construction to be completed and provide us with opportunitiesthe facility to be operational during fiscal 2013.
In May 2011, we transitioned the fulfillment and distribution operations for additional growth.
Ourour European stores and direct-to-consumer channel currently utilizesfrom a third party provider over to separate, independently operated, distribution centerand fulfillment facilities located in Essex,Rushden, England. In June 2010 we leased and began construction on aOur 98,000 square foot distribution center and a 142,000 square foot fulfillment center in Rushden, England. We anticipate transitioning all of our European distribution and fulfillment operations to these facilities during the second quarter of fiscal 2012. Our distribution facility will supportsupports our entire European store base and will havehas a state-of-the-art materialsmaterial handling system. Our 142,000 square foot fulfillment facility, which will supportsupports our entire European direct-to-consumer channel, will havehas an advanced cross belt sorter. We believe both of these facilities will support our European growth for the next several years as well as add operational efficiencies when fully operational.years.
Information Systems. Very early in our growth, we recognized the need for high-quality information in order to manage merchandise planning/planning, buying, inventory management and control functions. We invested in a retail software package that met our processing and reporting requirements. We utilize point-of-sale register systems connected by a digital subscriber line (DSL) network to our home offices. These systems provide for register efficiencies, timely customer checkout and instant back office access to register information, as well as for daily updates of sales, inventory data and price changes. Our direct-to-consumer operations, which include the Anthropologie, Urban Outfitters, Free People, Terrain and BHLDN retail websites and the Anthropologie, Free People and Urban Outfitters catalogs, and the Anthropologie, Free People, Urban Outfitters, Leifsdottir, Terrain and BHLDN retail web sites, maintain separate software systems that manage the merchandise and customer information for our in-house customer contact center and fulfillment functions. The Free People and Leifsdottir divisions within our wholesale segment useuses a separate software system for customer service, order entry and allocations, production planning and inventory management. During fiscal 2007, we successfully completed installation of a wholesale customer service system that provides significantly improved functionality and flexibility to help serve our customers. This system has the capability to handle additional workload related to increased order volume and will better suit us over the long term to meet the wholesale segment’s growth needs. We have contracted with a nationally recognized company to provide disaster-recoverydisaster recovery services with respect to our key systems.
During fiscal 2009,2012 we successfully completed athe implementation of our warehousing software system implementation for our wholesale segment at our Trenton, South Carolina fulfillment center. During fiscal 2010 we began implementation of the warehouse software at our Lancaster County, Pennsylvania and Reno, Nevada, retail store distribution centers.centers and it is now deployed across all of our of our distribution facilities worldwide. This implementation will be complete in fiscal 2012. The new software system provides significantly improved scalability and functionality aligningus with a more granular, real-time view of our business growth needs. We believe this upgrade will support our growth needs for the long-term.inventory globally.
During fiscal 2010,2012 we began work oncompleted the implementation of an Order Management System (“OMS”) that willfor all of our brands. The new OMS significantly improveimproves our ability to serve both our store and online customers and will provideprovides for substantial improvements in our back office administration as it relates to supply chain, fulfillment and inventory control. Furthermore, it will integrateintegrates inventory visibility regardless of the channel in which the merchandise was received or sold. We completed the implementation of the OMS for three of our six brands in fiscal 2011 and expect to convert the remaining three brands in fiscal 2012.
During fiscal 2010, we began work on a supply chain management software upgrade that provides us greater visibility into our supply chain process. Additionally, it provides for standardized commercial invoicing that will be automatically matched to the related purchase order. We completed Phase I of this project in fiscal 2011, which included benefits such as a single consistent view of all purchase orders to our vendors regardless of business segment. Phase II, which includes the
implementation of a sourcing management module, is anticipated to be completed during the secondthird quarter of fiscal 2012.2013. This functionality allows our production department to receive component level cost options and work-in-process updates from our vendors in real time
Competition
The specialty retail, direct-to-consumer and the wholesale apparel businesses are each highly competitive. Our retail stores compete on the basis of, among other things, the location of our stores, the breadth, quality, style, and availability of merchandise, the level of customer service offered and merchandise price. Although we feel the eclectic mix of products offered in our retail stores helps differentiate us, it also means that our Urban Outfitters, Anthropologie, Free People, Terrain and TerrainBHLDN stores compete against a wide variety of smaller, independent specialty stores, as well as department stores and national specialty chains. Many of our competitors have substantially greater name recognition as well as financial, marketing and other resources. Our Anthropologie, and Free People and BHLDN stores also face competition from small boutiques that offer an individualized shopping experience similar to the one we strive to provide to our target customers. In addition, some of our suppliers offer products directly to consumers and certain of our competitors.
Along with certain retail segment factors noted above, other key competitive factors for our direct-to-consumer operations include the success or effectiveness of customer mailing lists, response rates, catalog presentation, merchandise delivery and web sitewebsite design and availability. Our direct-to-consumer operations compete against numerous catalogswebsites and web sites,catalogs, which may have a greater volume of circulation and web traffic.traffic or more effective marketing through online media and social networking sites.
Our Free People and Leifsdottir wholesale businesses competebusiness competes with numerous wholesale companies based on the quality, fashion and price of our wholesale product offerings. Many of our wholesale business competitors’ products have a wider distribution network. In addition, certain of our wholesale competitors have greater name recognition, financial and other resources.
Trademarks and Service Marks
We are the registered owner in the United States of certain service marks and trademarks, including, but not limited to “Urban Outfitters”, “Anthropologie”, “Free People”, “Leifsdottir”“BHLDN”, “Terrain”, “BDG Guaranteed Tough”, “Co-Operative”, “Deletta”, “Ecote”, “Eloise”, “Idra”, “Intimately Free People”, “Odille”, “Urban Renewal” and “Urbn.com”. Each mark is renewable indefinitely, contingent upon continued use at the time of renewal. In addition, we currently have pending registration applications with the U.S. Patent and Trademark Office covering certain other marks. We also own marks that have been registered in foreign countries, and have applications for marks pending in additional foreign countries as well. We regard our marks as important to our business due to their name recognition with our customers. We are not aware of any valid claims of infringement or challenges to our right to use any of our marks in the United States.
Employees
As of January 31, 2011,2012, we employed approximately 16,00017,000 people, approximately 40.2%41% of whom were full-time employees. The number of part-time employees fluctuates depending on seasonal needs. Of our total employees, 2%approximately 1% work in the wholesale segment and the remaining 98%99% work in our retail segment. None of our employees are covered by a collective bargaining agreement, and we believe that our relations with our employees are excellent.
Financial Information about Operations
We aggregate our operations into two reportable segments, the retail segment and the wholesale segment. See Note 13,14, “Segment Reporting,” in the notes to our consolidated financial statements for additional information.
Financial Information about Geographical Areas
See Note 13,14, “Segment Reporting,” in the notes to our consolidated financial statements for information regarding net sales from domestic and foreign operations and long-lived assets.
Seasonality
Our business is subject to seasonal fluctuations. See Item 7: Management’s Discussion and Analysis of Financial Condition and Results of Operations—Seasonality and Quarterly Results for additional information.
Our business segments are sensitive to economic conditions, consumer spending, shifts in fashion and industry and demographic conditions.
We are subject to seasonal variations and face numerous business risk factors. Consumer purchases of discretionary retail items and specialty retail products, including our products, may decline during recessionary periods and also may decline at other times when disposable income is lower. A prolonged economic downturn could have a material adverse impact on our business, financial condition or results of operations. There is a risk that consumer sentiment may decline due to economic and/or geo-political factors, which could negatively impact our financial position and results of operations.
Our performance is subject to worldwide economic conditions and their impact on levels of consumer spending remains uncertain and may remain depressed for the foreseeable future. Some of the factors impacting discretionary consumer spending include general economic conditions, wages and employment, consumer debt, reductions in net worth based on severe market declines, residential real estate and mortgage markets, taxation, fuel and energy prices, interest rates, consumer confidence, the European debt crisis and other macroeconomic factors. Consumer purchases of discretionary items, including our merchandise, generally decline during recessionary periods and other periods where disposable income is adversely affected. The recentcurrent downturn in the economy may continue to affect consumer purchases of our merchandise and adversely impact our results of operations and continued growth. The economic conditions may also affect the number of specialty retail businesses and their ability to purchase merchandise from our wholesale segment. It is difficult to predict how long the current uncertain economic, capital and credit market conditions will continue and what impact they will have on our business.
We rely heavily on our ability to identify changes in fashion.
Customer tastes and fashion trends are volatile and can change rapidly. Our success depends in part on our ability to effectively predict and respond to changing fashion tastes and consumer demands, and to translate market trends into appropriate, saleable product offerings. Our inability to effectively determine these changes may lead to higher seasonal inventory levels and a future need to increase markdowns to liquidate our inventory. Compared to our retail segment, our wholesale segment is more sensitive to changes in fashion trends because of longer lead times in the manufacture and sale of its apparel. Our fashion decisions constitute a material risk and may have an adverse effect on our financial condition and results of operations.
We may not be successful in expanding our business and opening new retail stores.
Our growth strategy depends on our ability to open and operate new retail stores on a profitable basis. Our operating complexity will increase as our store base grows, and we may face challenges in managing our future growth. Such growth will require that we continue to expand and improve our operating capabilities, and expand, train and manage our employee base. We may be unable to hire and train a sufficient number of qualified personnel or successfully manage our growth. Our expansion prospects also depend on a number of other factors, many of which are beyond our control, including, among other things, competition, the availability of financing for capital expenditures and working capital requirements, the availability of suitable sites for new store locations on acceptable lease terms,
and the availability of inventory. There can be no assurance that we will be able to achieve our store expansion goals, nor can there be any assurance that our newly opened stores will achieve revenue or profitability levels comparable to those of our existing stores in the time periods estimated by us, or at
all. If our stores fail to achieve, or are unable to sustain, acceptable revenue and profitability levels, we may incur significant costs associated with closing those stores.
We may not be successful expanding our business internationally.
Our current growth strategy also includes plans to continue to open new stores internationally over the next several years. We have limited prior experience operating internationally, where we face established competitors. International stores have different operational characteristics, including employment and labor, transportation, logistics, real estate and legal requirements. Furthermore, consumer demand and behavior, as well as tastes and purchasing trends may differ internationally, and as a result, sales of our merchandise may not be successful, or the margins on those sales may not be in line with these we currently anticipate. Additionally, our ability to conduct business internationally may be adversely impacted by political and economic risks, as well as the global economy. Any differences that we encounter as we expand internationally, may divert financial, operational and managerial resources from our existing operations, which could adversely impact our financial condition and results of operations.
Existing and increased competition in the specialty retail, direct-to-consumer and wholesale apparel businesses may reduce our net revenues, profits and market share.
The specialty retail segment and the wholesale apparel businesses are each highly competitive. Our retail stores compete on the basis of, among other things, the location of our stores, the breadth, quality, style, and availability of merchandise, the level of customer service offered and merchandise price. Our Anthropologie, and Free People and BHLDN stores also face competition from small boutiques that offer an individualized shopping experience similar to the one we strive to provide to our target customers. Additionally, the internet and other new technologies facilitate competitive entry and comparison shopping in our retail segment. We strive to offer a multichannel shopping experience for our Direct-to-Consumer customers and use social media as a way to interact with our customers and enhance their shopping experiences. Multichannel retailing is rapidly evolving and we must keep pace with changing customer expectations and new developments by our competitors. In addition, some of our suppliers offer products directly to consumers and certain of our competitors. Our Free People and Leifsdottir wholesale businesses competebusiness competes with numerous wholesale companies based on the quality, fashion and price of our wholesale product offerings, many of whose products have wider distribution than ours. Many of our competitors have substantially greater name recognition as well as financial, marketing and other resources. We cannot assure you that we will continue to be able to compete successfully against existing or future competitors. Due to difficult economic conditions our competitors may force a markdown or promotional sales environment which could hurt our ability to achieve our historical profit margins. Our expansion into markets served by our competitors and entry of new competitors or expansion of existing competitors into our markets could have a material adverse effect on our business, financial condition and results of operations.
We depend on key personnel and may not be able to retain or replace these employees or recruit additional qualified personnel, which would harm our business.
We believe that we have benefited substantially from the leadership and experience of our senior executives, including our Chairman, President and co-founder, Richard A. Hayne,Chairman of the Board and our Chief Executive Officer, Glen T. Senk.Richard A. Hayne. The loss of the services of any of our senior executives could have a material adverse effect on our business and prospects, as we may not be able to find suitable management personnel to replace departing executives on a timely basis. In addition, if our senior executives do not fully integrate within the structure of our management team and core business, we
may be adversely affected. We do not have an employment agreement with Mr. Hayne, Mr. Senk or any of our other key personnel. In addition, as our business expands, we believe that our future success will depend greatly on our continued ability to attract and retain highly skilled and qualified personnel. There is a high level of competition for personnel in the retail industry. Our inability to meet our staffing requirements in the future could impair our ability to increase revenue and could otherwise harm our business.
We could be materially and adversely affected if any of our distribution centers are closed.
We operate four distribution facilities worldwide to support our retail and wholesale business segments in the United States, Western Europe and Canada, and for fulfillment of catalog and web sitewebsite orders. The merchandise purchased for our United States and Canadian retail operations is shipped directly to our distribution centers in Lancaster County, Pennsylvania and Reno, Nevada while merchandise purchased for our direct-to-consumer and wholesale operations is shipped directly to our fulfillment center in Trenton, South Carolina. The merchandise purchased for our Western Europe
retail and direct-to-consumer operations is shipped to Essex, England. We plan to purchase land to construct a 468,000open an additional 463,000 square foot fulfillment center in Reno, Nevada, in fiscal 20122013 that will further support our direct-to-consumer channel. The merchandise purchased for our Western Europe retail and direct-to-consumer operations is shipped to Rushden, England. If any of our distribution centers were to close for any reason, or we are unable to successfully open the additional distribution facility, the other distribution centers may not be able to support the resulting additional distribution demands. As a result, we could incur significantly higher costs and longer lead times associated with distributing our products to our stores during the time it takes for us to re-open or replace the center.
We rely significantly on foreigninternational sources of production.
We receive a substantial portion of our apparel and other merchandise from foreign sources, both purchased directly in foreign markets and indirectly through domestic vendors with foreign sources. To the extent that our vendors are located overseas or rely on overseas sources for a large portion of their products, any event causing a disruption of imports, including the imposition of import restrictions, war, acts of terrorism and natural disasters could adversely affect our business. If imported goods become difficult or impossible to bring into the United States, and if we cannot obtain such merchandise from other sources at similar costs, our sales and profit margins may be adversely affected. The flow of merchandise from our vendors could also be adversely affected by financial or political instability in any of the countries in which the goods we purchase are manufactured, if the instability affects the production or export of merchandise from those countries. Moreover, in the event of a significant disruption in the supply of the fabrics or raw materials used by our vendors in the manufacture of our products, our vendors may not be able to locate alternative suppliers of materials of comparable quality at an acceptable price, or at all. Trade restrictions in the form of tariffs or quotas, or both, applicable to the products we sell could also affect the importation of those products and could increase the cost and reduce the supply of products available to us. The cost of fuel is a significant component in transportation costs, therefore, increases in the petroleum products can adversely affect our gross margins. In addition, decreases in the value of the U.S. dollar relative to foreign currencies could increase the cost of products we purchase from overseas vendors.
Our operating results fluctuate from period to period.
Our business experiences seasonal fluctuations in net sales and operating income, with a more significant portion of operating income typically realized during the five-month period from August 1 to December 31 of each year (the back-to-school and holiday periods). Any decrease in sales or
margins during this period, or in the availability of working capital needed in the months preceding this period, could have a more material adverse effect on our business, financial condition and results of operations than in other periods. Seasonal fluctuations also affect our inventory levels, as we usually order merchandise in advance of peak selling periods and sometimes before new fashion trends are confirmed by customer purchases. We must carry a significant amount of inventory, especially before the back-to-school and holiday selling periods. If we are not successful in selling our inventory during this period, we may be forced to rely on markdowns or promotional sales to dispose of the inventory or we may not be able to sell the inventory at all, which could have a material adverse effect on our business, financial condition and results of operations.
We may be unable to protect our trademarks and other intellectual property rights.
We believe that our trademarks and service marks are important to our success and our competitive position due to their name recognition with our customers. We devote substantial resources to the establishment and protection of our trademarks and service marks on a worldwide
basis. We are not aware of any valid claims of infringement or challenges to our right to use any of our trademarks and service marks in the United States. Nevertheless, there can be no assurance that the actions we have taken to establish and protect our trademarks and service marks will be adequate to prevent imitation of our products by others or to prevent others from seeking to block sales of our products as a violation of the trademarks, service marks and intellectual property of others. Also, others may assert rights in, or ownership of, trademarks and other intellectual property of ours and we may not be able to successfully resolve these types of conflicts to our satisfaction. In addition, the laws of certain foreign countries may not protect proprietary rights to the same extent as do the laws of the United States.
War, acts of terrorism, or the threat of either may negatively impact availability of merchandise and/or otherwise adversely impact our business.
In the event of war or acts of terrorism, or if either are threatened, our ability to obtain merchandise available for sale in our stores may be negatively impacted. A substantial portion of our merchandise is imported from other countries, see “We rely significantly on foreigninternational sources of production”on page 14.13. If commercial transportation is curtailed or substantially delayed, our business may be adversely impacted, as we may have difficulty shipping merchandise to our distribution centers and stores, as well as fulfilling catalog and web sitewebsite orders. In the event of war or acts of terrorism, or the threat of either, we may be required to suspend operations in some or all of our stores, which could have a material adverse impact on our business, financial condition and results of operations.
We may not be successful in introducing additional store concepts.
We may, from time to time, seek to develop and introduce new concepts or brands in addition to our existingestablished brands, Urban Outfitters, Anthropologie and Free People, Leifsdottir, Terrain and BHLDN brands.People. Our ability to succeed in theseTerrain, BHLDN, and other new concepts could require significant capital expenditures and management attention. Additionally, any new concept is subject to certain risks, including customer acceptance, competition, product differentiation, challenges relating to economies of scale in merchandise sourcing and the ability to attract and retain qualified personnel, including management and designers. There can be no assurance that we will be able to develop and grow these or any other new concepts to a point where they will become profitable, or generate positive cash flow. If we cannot successfully develop and grow these new concepts, our financial condition and results of operations may be adversely impacted.
We may develop new store concepts through acquisitions and we may not be successful in integrating those acquisitions.
Acquisitions involve numerous risks, including the diversion of our management’s attention from other business concerns, the possibility that current operating and financial systems and controls may be inadequate to deal with our growth and the potential loss of key employees.
We also may encounter difficulties in integrating any businesses we may acquire with our existing operations. The success of these transactions depends on our ability to:
successfully merge corporate cultures and operational and financial systems;
realize cost reduction synergies; and
as necessary, retain key management members and technical personnel of acquired companies.
In addition, there may be liabilities that we fail, or are unable, to discover in the course of performing due diligence investigations on any company that we may acquire, or have recently acquired. Also, there may be additional costs relating to acquisitions including, but not limited to, possible purchase price adjustments. Any of our rights to indemnification from sellers to us, even if obtained, may not be enforceable, collectible or sufficient in amount, scope or duration to fully offset the possible liabilities associated with the business or property acquired. Any such liabilities, individually or in the aggregate, could have a material adverse effect on our business and financial condition.
Our internetDirect-to-Consumer sales are subject to operational risk.
We sell merchandise, over the Internetdirectly to our customers through our web sites.websites. Our InternetDirect-to-Consumer operations are subject to numerous risks, including reliance on third party computer hardware/software, rapid technological change, diversion of sales from our stores, liability for online content, violations of state or federal laws, including those relating to online privacy, credit card fraud, risks related to the failure of the computer systems that operate our websites and their related support systems, including computer viruses, telecommunications failures and electronic break-ins and similar disruptions. If our websites were disrupted for any material length of time for the reasons described above or any other reasons, our sales and profitability may suffer. There is no assurance that our InternetDirect-to-Consumer operations will continue to achieve sales and profitability growth.
Manufacturer compliance with our social compliance program requirements.
We have a compliance program that is monitored on an annual basis by our buying offices. Our production facilities are either certified as in compliance with our program, or areas of improvement are identified and corrective follow-up action is taken. All manufacturing facilities are required to follow applicable national labor laws, as well as international compliance standards regarding workplace safety, such as standards that require clean and safe working environments, clearly marked exits and paid overtime. We believe in protecting the safety and working rights of the people who produce the goods sold in our stores and through our wholesale business, while recognizing and respecting cultural and legal differences found throughout the world. We require our outside vendors to register through an online website and agree that they and their suppliers will abide by certain standards and conditions of employment.
Our investments in auction rate securities are subject to risks which may affect the liquidity of these investments and could cause an impairment charge.
Approximately 3.6% of our cash, cash equivalents and marketable securities are invested in “A” or better ratedOur Auction Rate Securities (“ARS”) that represent interests in municipal and student loan related collateralized debt obligations, all of which are rated ‘A” or better and are guaranteed by either government agencies and/or insured by private insurance agencies up to 97% or greater of par value. Historically, investments in ARS have been highly liquid, however, if an auction for the securities we own fails, the investments may not be readily convertible. Liquidity for ARS is typically provided by an auction process that resets the applicable interest rate at pre-determined intervals, usually 7, 28, 35 or 90 days. The principal associated with failed auctions will not be available until either a successful auction occurs, the bond is called by the issuer, a buyer is found from outside the auction process or the debt obligation reaches its maturity. Our ARS had an amortized cost of $33.3$23.0 million and a fair value of
$29.5 $20.2 million as of January 31, 2011.2012. As of January 31, 20112012 all of our ARS have failed to liquidate at auction due to lack of market demand. Based on review of credit quality, collateralization, final stated maturity, estimates of the probability of being called or becoming liquid prior to final maturity, redemptions of similar ARS, previous market activity for same investment security, impact due to extended periods of maximum auction rates and valuation models, we have recorded a $3.8$2.8 million temporary impairment on our ARS as of January 31, 2011.2012. To date, we have collected all interest receivable on outstanding ARS when due and have not been informed by the issuers that accrued interest payments are currently at risk. We do not have the intent to sell the underlying securities prior to their recovery and we believe it is not likely that we will be required to sell the underlying securities prior to their anticipated recovery of full amortized cost. We cannot assure that further impairment to our ARS will not occur.
Our results can be adversely affected by market disruptions.
Market disruptions due to severe weather conditions, natural disasters, health hazards, terrorist activities, financial crises, political crises or other major events or the prospect of these events can affect consumer spending and confidence levels and adversely affect our results or prospects in affected markets. The receipt of proceeds under any insurance we maintain for these purposes may be delayed or the proceeds may be insufficient to fully offset our losses.
Changes in accounting standards and subjective assumptions, estimates and judgments by management related to complex accounting matters could significantly affect our financial results or financial condition.
Generally accepted accounting principles and related accounting pronouncements, implementation guidelines and interpretations with regard to a wide range of matters that are relevant to our business, such as revenue recognition, asset impairment, impairment of goodwill and other intangible assets, inventories, lease obligations, self-insurance, tax matters and litigation, are highly complex and involve many subjective assumptions, estimates and judgments. Changes in these rules or their interpretation or changes in underlying assumptions, estimates or judgments could significantly change our reported or expected financial performance or financial condition.
We are subject to numerous regulations and legal matters that could adversely affect our business.
We are subject to customs, child labor, tax, employment, privacy, truth-in-advertising and other laws, including consumer protection regulations and zoning and occupancy ordinances that regulate retailers generally and/or govern the importation, promotion and sale of merchandise and the operation
of retail stores and distribution centers. Additional legal and regulatory requirements, and the fact that foreign laws occasionally conflict with domestic laws, have increased the complexity of the regulatory environment and the cost of compliance. Although we undertake to monitor changes in these laws, ifIf these laws change without our knowledge, or are violated by importers, designers, manufacturers or distributors, we could experience delays in shipments and receipt of goods or be subject to fines or other penalties under the controlling regulations, any of which could adversely affect our business. Moreover, legal actions may be filed against us from time to time, including class actions. These actions may assert commercial, tort, intellectual property, customer, employment, data privacy, securities or other claims. We may also be impacted by litigation trends, including class action lawsuits involving consumers and shareholders, that could have a material adverse effect on our reputation, the market price of our common shares, or our results of operations, financial condition and cash flows.
Item 1B. Unresolved Staff Comments
We have no outstanding comments with the staff of the SEC.
Since 2006, our home office has been located in several buildings on one campus in the historic core of the Philadelphia, Pennsylvania Navy Yard. The consolidated offices at the Navy yardYard allow for an efficient operation of our Philadelphia-based offices and will help to support our growth needs for the foreseeable future. In fiscal 2011, we completed a 54,000 square foot expansion of our home office and currently occupy 282,000 square feet. We hold options on several adjacent buildings that are available for at least the next ten years to allow for additional expansion if necessary. The expendituresDuring fiscal 2013 we plan to begin construction on two buildings which will expand our Navy Yard facilities inhome offices an additional 77,000 square feet to accommodate our growth. We expect each of these buildings to be completed by the first quarter of fiscal 2011 were capitalized and are being depreciated based on the useful life of the improvements and fixtures.2014.
Our customer contact center is located in Trenton, South Carolina as part of our 459,000 square foot fulfillment center, and occupies approximately 16,000 square feet. We occupy two offices in Europe including approximately 6,900 square feet of space at 24 Market Place in London and approximately 3,500 square feet of space at 24-26 West Street in London. Our European home offices and our customer contact facility are leased properties with varying lease term expirations through 2016.
We own a 291,000 square foot distribution center in Lancaster County, Pennsylvania. During fiscal 2008 we entered into an operatingWe lease for a distribution facility in Reno, Nevada. The Nevada and amended this lease for additional space in 2009. The facility is approximately 214,500 square feet and is primarily used to support our western United States stores. The term of this operating lease is set to expire in 2017 with Company options to renew for up to an additional ten years. In April 2011 we purchased land and began construction on a 463,000 square foot fulfillment center also located in Reno, Nevada. This facility, which we will own and operate, will be used to support our western United States direct-to-consumer customers. We anticipate construction to be completed and the facility to be operational during fiscal 2013. Our distribution and fulfillment centers support our retail segment, with our Trenton, South Carolina facility also supporting the majority of our merchandise distributed by our wholesale segment.
In fiscal 2011, we entered into operating leases for a distribution and fulfillment centercenters in Rushden, England to support our retail and direct-to-consumer channels in Europe. The distribution center will occupyoccupies approximately 98,000 square feet and the fulfillment center will occupyoccupies approximately 142,000 square feet.feet, which also encompasses our European customer contact center. The term of both of these operating leases are set to expire in September 2020.
Improvements in recent years, including those in fiscal 20112012 described in Item 7: Management’s Discussion and Analysis—Liquidity and Capital Resources, were necessary to adequately support our growth. We believe we may need to further expand the square footage of our home office and distribution facilities to support our growth over the next several years. For more information on our distribution center properties, see Item 1: Business—Company Operations—Distribution. We believe that our facilities are well maintained and in good operating condition.
All of our Urban Outfitters, Anthropologie, Free People, Terrain and TerrainBHLDN stores are leased, well maintained and in good operating condition. Our retail stores are typically leased for a term of ten years with renewal options for an additional five to ten years. Total estimated selling square feet for stores open, under lease as of January 31, 2011,2012, by Urban Outfitters, Anthropologie, Free People, Terrain and TerrainBHLDN was approximately 1,621,000, 1,124,000, 58,0001,770,000, 1,214,000, 85,000, 20,000 and 20,000,3,400, respectively. Terrain also utilizes two acres of outdoor space to sell seasonal items, live plants, accessories and outdoor furniture. The average store selling square feet is approximately 9,2009,000 for Urban Outfitters, 7,3007,200 for Anthropologie and 1,400 for Free People. Selling square feet can sometimes change due to floor moves, use of staircases, cash register configuration and other factors.
The following table shows the location of each of our existing retail stores, as of January 31, 2011:2012:
| Urban Outfitters | Anthropologie | Free People | Terrain | Total | ||||||||||||||||
United States: | ||||||||||||||||||||
Alabama | 1 | 2 | — | — | 3 | |||||||||||||||
Arkansas | — | 1 | — | — | 1 | |||||||||||||||
Arizona | 4 | 4 | 1 | — | 9 | |||||||||||||||
California | 33 | 30 | 12 | — | 75 | |||||||||||||||
Colorado | 3 | 3 | 1 | — | 7 | |||||||||||||||
Connecticut | 1 | 3 | 1 | — | 5 | |||||||||||||||
Delaware | 1 | 1 | — | — | 2 | |||||||||||||||
Florida | 8 | 10 | — | — | 18 | |||||||||||||||
Georgia | 4 | 3 | — | — | 7 | |||||||||||||||
Idaho | 1 | 1 | — | — | 2 | |||||||||||||||
Illinois | 9 | 8 | 2 | — | 19 | |||||||||||||||
Indiana | 1 | 1 | — | — | 2 | |||||||||||||||
Kansas | 1 | — | — | — | 1 | |||||||||||||||
Louisiana | 2 | 2 | — | — | 4 | |||||||||||||||
Massachusetts | 6 | 6 | 3 | — | 15 | |||||||||||||||
Maryland | 1 | 4 | — | — | 5 | |||||||||||||||
Michigan | 3 | 2 | — | — | 5 | |||||||||||||||
Minnesota | 2 | 3 | — | — | 5 | |||||||||||||||
Missouri | 2 | 2 | — | — | 4 | |||||||||||||||
Mississippi | — | 1 | — | — | 1 | |||||||||||||||
North Carolina | 3 | 3 | — | — | 6 | |||||||||||||||
Nebraska | 1 | 1 | — | — | 2 | |||||||||||||||
New Jersey | 5 | 8 | 2 | — | 15 | |||||||||||||||
New Mexico | 1 | 1 | — | — | 2 | |||||||||||||||
New York | 15 | 8 | 5 | — | 28 | |||||||||||||||
Nevada | 2 | 2 | — | — | 4 | |||||||||||||||
Ohio | 3 | 3 | — | — | 6 | |||||||||||||||
Oklahoma | — | 1 | — | — | 1 | |||||||||||||||
Oregon | 2 | 2 | — | — | 4 | |||||||||||||||
Pennsylvania | 5 | 5 | 3 | 1 | 14 | |||||||||||||||
Rhode Island | 1 | — | — | — | 1 | |||||||||||||||
South Carolina | 1 | 2 | — | — | 3 | |||||||||||||||
Tennessee | 1 | 2 | 1 | — | 4 | |||||||||||||||
Texas | 8 | 11 | 5 | — | 24 | |||||||||||||||
Utah | 1 | 1 | — | — | 2 | |||||||||||||||
Virginia | 3 | 4 | 2 | — | 9 | |||||||||||||||
Vermont | 1 | — | — | — | 1 | |||||||||||||||
Washington | 4 | 3 | 4 | — | 11 | |||||||||||||||
Wisconsin | 2 | 2 | — | — | 4 | |||||||||||||||
District of Columbia | 2 | 1 | — | — | 3 | |||||||||||||||
Total United States | 144 | 147 | 42 | 1 | 334 | |||||||||||||||
| Urban Outfitters | Anthropologie | Free People | Terrain | BHLDN | Total | |||||||||||||||||||
United States: | ||||||||||||||||||||||||
Alabama | 1 | 2 | — | — | — | 3 | ||||||||||||||||||
Arizona | 4 | 4 | 2 | — | — | 10 | ||||||||||||||||||
Arkansas | — | 1 | — | — | — | 1 | ||||||||||||||||||
California | 35 | 30 | 15 | — | — | 80 | ||||||||||||||||||
Colorado | 3 | 3 | 3 | — | — | 9 | ||||||||||||||||||
Connecticut | 3 | 4 | 2 | — | — | 9 | ||||||||||||||||||
Delaware | 1 | 1 | — | — | — | 2 | ||||||||||||||||||
District of Columbia | 2 | 2 | — | — | — | 4 | ||||||||||||||||||
Florida | 7 | 10 | — | — | — | 17 | ||||||||||||||||||
Georgia | 4 | 3 | 1 | — | — | 8 | ||||||||||||||||||
Idaho | 1 | 1 | — | — | — | 2 | ||||||||||||||||||
Illinois | 9 | 8 | 4 | — | — | 21 | ||||||||||||||||||
Indiana | 3 | 1 | — | — | — | 4 | ||||||||||||||||||
Kansas | 1 | 1 | — | — | — | 2 | ||||||||||||||||||
Louisiana | 2 | 2 | — | — | — | 4 | ||||||||||||||||||
Maine | 1 | — | — | — | — | 1 | ||||||||||||||||||
Maryland | 2 | 4 | 1 | — | — | 7 | ||||||||||||||||||
Massachusetts | 7 | 6 | 5 | — | — | 18 | ||||||||||||||||||
Michigan | 3 | 3 | 1 | — | — | 7 | ||||||||||||||||||
Minnesota | 2 | 4 | — | — | — | 6 | ||||||||||||||||||
Mississippi | — | 1 | — | — | — | 1 | ||||||||||||||||||
Missouri | 2 | 2 | — | — | — | 4 | ||||||||||||||||||
Nebraska | 1 | 1 | — | — | — | 2 | ||||||||||||||||||
Nevada | 2 | 2 | 1 | — | — | 5 | ||||||||||||||||||
New Jersey | 5 | 9 | 3 | — | — | 17 | ||||||||||||||||||
New Mexico | 1 | 1 | — | — | — | 2 | ||||||||||||||||||
| Urban Outfitters | Anthropologie | Free People | Terrain | Total | Urban Outfitters | Anthropologie | Free People | Terrain | BHLDN | Total | ||||||||||||||||||||||||||||||||||
United States (continued): | ||||||||||||||||||||||||||||||||||||||||||||
New York | 16 | 9 | 6 | — | — | 31 | ||||||||||||||||||||||||||||||||||||||
North Carolina | 3 | 4 | 1 | — | — | 8 | ||||||||||||||||||||||||||||||||||||||
Ohio | 3 | 4 | — | — | — | 7 | ||||||||||||||||||||||||||||||||||||||
Oklahoma | — | 2 | — | — | — | 2 | ||||||||||||||||||||||||||||||||||||||
Oregon | 2 | 2 | 1 | — | — | 5 | ||||||||||||||||||||||||||||||||||||||
Pennsylvania | 6 | 5 | 4 | 1 | — | 16 | ||||||||||||||||||||||||||||||||||||||
Rhode Island | 1 | 1 | — | — | — | 2 | ||||||||||||||||||||||||||||||||||||||
South Carolina | 1 | 1 | — | — | — | 2 | ||||||||||||||||||||||||||||||||||||||
Tennessee | 2 | 3 | 1 | — | — | 6 | ||||||||||||||||||||||||||||||||||||||
Texas | 10 | 12 | 6 | — | 1 | 29 | ||||||||||||||||||||||||||||||||||||||
Utah | 1 | 1 | — | — | — | 2 | ||||||||||||||||||||||||||||||||||||||
Vermont | 1 | — | — | — | — | 1 | ||||||||||||||||||||||||||||||||||||||
Virginia | 3 | 5 | 2 | — | — | 10 | ||||||||||||||||||||||||||||||||||||||
Washington | 4 | 3 | 3 | — | — | 10 | ||||||||||||||||||||||||||||||||||||||
Wisconsin | 2 | 2 | — | — | — | 4 | ||||||||||||||||||||||||||||||||||||||
|
|
|
|
|
| |||||||||||||||||||||||||||||||||||||||
Total United States | 157 | 160 | 62 | 1 | 1 | 381 | ||||||||||||||||||||||||||||||||||||||
Canada: | ||||||||||||||||||||||||||||||||||||||||||||
Alberta | 2 | 2 | — | — | 4 | 2 | 2 | — | — | — | 4 | |||||||||||||||||||||||||||||||||
British Columbia | 1 | — | — | — | 1 | 1 | 1 | — | — | — | 2 | |||||||||||||||||||||||||||||||||
Ontario | 4 | 2 | — | — | 6 | 4 | 2 | — | — | — | 6 | |||||||||||||||||||||||||||||||||
Quebec | 3 | — | — | — | 3 | 3 | — | — | — | — | 3 | |||||||||||||||||||||||||||||||||
|
|
|
|
|
| |||||||||||||||||||||||||||||||||||||||
Total Canada | 10 | 4 | — | — | 14 | 10 | 5 | — | — | — | 15 | |||||||||||||||||||||||||||||||||
Europe: | ||||||||||||||||||||||||||||||||||||||||||||
Belgium | 2 | — | — | — | — | 2 | ||||||||||||||||||||||||||||||||||||||
Denmark | 1 | — | — | — | — | 1 | ||||||||||||||||||||||||||||||||||||||
Germany | 3 | — | — | — | — | 3 | ||||||||||||||||||||||||||||||||||||||
Ireland | 3 | — | — | — | — | 3 | ||||||||||||||||||||||||||||||||||||||
Sweden | 1 | — | — | — | — | 1 | ||||||||||||||||||||||||||||||||||||||
United Kingdom | 15 | 2 | — | — | 17 | 20 | 3 | — | — | — | 23 | |||||||||||||||||||||||||||||||||
Denmark | 1 | — | — | — | 1 | |||||||||||||||||||||||||||||||||||||||
Sweden | 1 | — | — | — | 1 | |||||||||||||||||||||||||||||||||||||||
Ireland | 3 | — | — | — | 3 | |||||||||||||||||||||||||||||||||||||||
Belgium | 1 | — | — | — | 1 | |||||||||||||||||||||||||||||||||||||||
Germany | 1 | — | — | — | 1 | |||||||||||||||||||||||||||||||||||||||
|
|
|
|
|
| |||||||||||||||||||||||||||||||||||||||
Total Europe | 22 | 2 | — | — | 24 | 30 | 3 | — | — | — | 33 | |||||||||||||||||||||||||||||||||
|
|
|
|
|
| |||||||||||||||||||||||||||||||||||||||
Global Total | 176 | 153 | 42 | 1 | 372 | 197 | 168 | 62 | 1 | 1 | 429 | |||||||||||||||||||||||||||||||||
|
|
|
|
|
| |||||||||||||||||||||||||||||||||||||||
In addition to the stores listed above, Free People also operates wholesale sales and showroom facilities in Los Angeles, New York City Los Angeles and Chicago that are leased through 2014, 2017 2014 and 2019, respectively. Leifsdottir operates a wholesale sales and showroom facility in New York City that is leased through the year 2014.
We are party to various legal proceedings arising from normal business activities. Management believes that the ultimate resolution of these matters will not have a material adverse effect on our financial position, results of operations or cash flows.
Item 4. (Removed and Reserved)Mine Safety Disclosures
Not applicable.
PART II
| Item 5. | Market for Registrant’s Common Equity, Related Shareholder Matters and Issuer Purchases of Equity Securities |
Our common shares are traded on the NASDAQ Global Select Market under the symbol “URBN.” The following table sets forth, for the periods indicated below, the reported high and low closing sale prices for our common shares as reported on the NASDAQ Global Select Market.
Market Information
| High | Low | |||||||||||||||
Fiscal 2012 | ||||||||||||||||
Quarter ended April 30, 2011 | $ | 39.26 | $ | 29.47 | ||||||||||||
Quarter ended July 31, 2011 | $ | 33.90 | $ | 27.96 | ||||||||||||
Quarter ended October 31, 2011 | $ | 32.90 | $ | 21.47 | ||||||||||||
Quarter ended January 31, 2012 | $ | 30.25 | $ | 23.42 | ||||||||||||
| High | Low | |||||||||||||||
Fiscal 2011 | ||||||||||||||||
Quarter ended April 30, 2010 | $ | 40.56 | $ | 30.83 | $ | 40.84 | $ | 30.48 | ||||||||
Quarter ended July 31, 2010 | $ | 39.41 | $ | 31.96 | $ | 39.41 | $ | 31.50 | ||||||||
Quarter ended October 31, 2010 | $ | 34.97 | $ | 29.28 | $ | 35.11 | $ | 29.03 | ||||||||
Quarter ended January 31, 2011 | $ | 38.46 | $ | 30.31 | $ | 38.95 | $ | 30.18 | ||||||||
Fiscal 2010 | ||||||||||||||||
Quarter ended April 30, 2009 | $ | 19.49 | $ | 14.13 | ||||||||||||
Quarter ended July 31, 2009 | $ | 24.04 | $ | 18.76 | ||||||||||||
Quarter ended October 31, 2009 | $ | 33.86 | $ | 24.43 | ||||||||||||
Quarter ended January 31, 2010 | $ | 35.64 | $ | 30.52 | ||||||||||||
Holders of Record
On March 24, 201127, 2012 there were 107115 holders of record of our common shares.
Dividend Policy
Our current credit facility includes certain limitations on the payment of cash dividends on our common shares. We have not paid any cash dividends since our initial public offering and do not anticipate paying any cash dividends on our common shares in the foreseeable future.
Stock Performance
The following graph and table compares the cumulative total shareholder return on our common shares with the cumulative total return on the Standard and Poor’s 500 Composite Stock Index and the Standard and Poor’s 500 Apparel Retail Index for the period beginning January 31, 20062007 and ending January 31, 2011,2012, assuming the reinvestment of any dividends and assuming an initial investment of $100 in each. The comparisons in this table are required by the SEC and are not intended to forecast or be indicative of possible future performance of the common shares or the referenced indices.
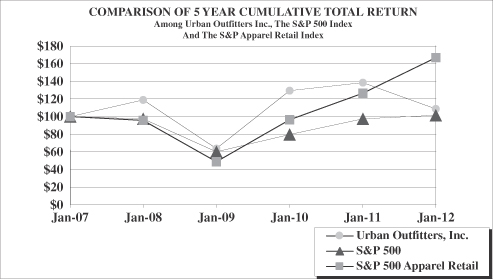
*$100 invested on 1/31/0607 in stock or index, including reinvestment of dividends.
Fiscal years ending January 31.
| Base Period Jan-06 | INDEXED RETURNS Years Ended | Base Period Jan-07 | INDEXED RETURNS Years Ended | |||||||||||||||||||||||||||||||||||||||||||||
Company/Market/Peer Group | Jan-07 | Jan-08 | Jan-09 | Jan-10 | Jan-11 | Jan-08 | Jan-09 | Jan-10 | Jan-11 | Jan-12 | ||||||||||||||||||||||||||||||||||||||
Urban Outfitters Inc. | $ | 100.00 | $ | 89.34 | $ | 106.19 | $ | 57.05 | $ | 115.60 | $ | 123.84 | $ | 100.00 | $ | 118.85 | $ | 63.85 | $ | 129.39 | $ | 138.61 | $ | 108.61 | ||||||||||||||||||||||||
S&P 500 | $ | 100.00 | $ | 114.51 | $ | 111.87 | $ | 68.66 | $ | 91.41 | $ | 111.69 | $ | 100.00 | $ | 97.69 | $ | 59.95 | $ | 79.82 | $ | 97.53 | $ | 101.64 | ||||||||||||||||||||||||
S&P 500 Apparel Retail | $ | 100.00 | $ | 115.06 | $ | 110.04 | $ | 56.13 | $ | 110.98 | $ | 145.72 | $ | 100.00 | $ | 95.64 | $ | 48.78 | $ | 96.46 | $ | 126.65 | $ | 167.02 | ||||||||||||||||||||||||
Equity Compensation Plan Information
The following table shows the status of securities under the Company’s stock incentive plans as of January 31, 2011:
| EQUITY COMPENSATION PLAN | ||||||||||||
| Number of Securities to be Issued Upon Exercise of Outstanding Options, Restricted Shares, Warrants and Rights | Weighted- Average Exercise Price of Outstanding Options, Restricted Shares, Warrants and Rights | No. of Securities Remaining Available for Future Issuance Under Equity Compensation Plan (Excluding Securities Referenced in Column (A)) | ||||||||||
Plan Category | (A) | (B) | (C) | |||||||||
Equity Compensation Plans Approved by Security Holders (1): | ||||||||||||
Securities | 10,253,349 | $ | 24.31 | (2) | 9,834,300 | |||||||
Equity Compensation Plans Not Approved by Security Holders: | ||||||||||||
Securities | — | — | — | |||||||||
Total | 10,253,349 | $ | 24.31 | 9,834,300 | ||||||||
Item 6. Selected Financial Data
The following table sets forth selected consolidated income statement and balance sheet data for the periods indicated. The selected consolidated income statement and balance sheet data for each of the five fiscal years presented below is derived from our consolidated financial statements. The data presented below should be read in conjunction with Item 7: Management’s Discussion and Analysis of Financial Condition and Results of Operations and the Consolidated Financial Statements of the Company and the related notes thereto, which appear elsewhere in this report. The results of operations for past accounting periods are not necessarily indicative of the results to be expected for any future accounting period.
| Fiscal Year Ended January 31, | Fiscal Year Ended January 31, | |||||||||||||||||||||||||||||||||||||||
| 2011 | 2010 | 2009 | 2008 | 2007 | 2012 | 2011 | 2010 | 2009 | 2008 | |||||||||||||||||||||||||||||||
| (in thousands, except share amounts and per share data) | (in thousands, except share amounts and per share data) | |||||||||||||||||||||||||||||||||||||||
Income Statement Data: | ||||||||||||||||||||||||||||||||||||||||
Net sales | $ | 2,274,102 | $ | 1,937,815 | $ | 1,834,618 | $ | 1,507,724 | $ | 1,224,717 | $ | 2,473,801 | $ | 2,274,102 | $ | 1,937,815 | $ | 1,834,618 | $ | 1,507,724 | ||||||||||||||||||||
Gross profit | 936,620 | 786,145 | 713,478 | 576,772 | 451,921 | 860,536 | 936,620 | 786,145 | 713,478 | 576,772 | ||||||||||||||||||||||||||||||
Income from operations | 414,203 | 338,984 | 299,435 | 224,945 | 163,989 | 284,725 | 414,203 | 338,984 | 299,435 | 224,945 | ||||||||||||||||||||||||||||||
Net income | 272,958 | 219,893 | 199,364 | 160,231 | 116,206 | 185,251 | 272,958 | 219,893 | 199,364 | 160,231 | ||||||||||||||||||||||||||||||
Net income per common share—basic | $ | 1.64 | $ | 1.31 | $ | 1.20 | $ | 0.97 | $ | 0.71 | $ | 1.20 | $ | 1.64 | $ | 1.31 | $ | 1.20 | $ | 0.97 | ||||||||||||||||||||
Weighted average common shares outstanding—basic | 166,896,322 | 168,053,502 | 166,793,062 | 165,305,207 | 164,679,786 | 154,025,589 | 166,896,322 | 168,053,502 | 166,793,062 | 165,305,207 | ||||||||||||||||||||||||||||||
Net income per common share—diluted | $ | 1.60 | $ | 1.28 | $ | 1.17 | $ | 0.94 | $ | 0.69 | $ | 1.19 | $ | 1.60 | $ | 1.28 | $ | 1.17 | $ | 0.94 | ||||||||||||||||||||
Weighted average common shares outstanding—diluted | 170,333,550 | 171,230,245 | 170,860,605 | 169,640,585 | 168,652,005 | 156,191,289 | 170,333,550 | 171,230,245 | 170,860,605 | 169,640,585 | ||||||||||||||||||||||||||||||
Balance Sheet Data: | ||||||||||||||||||||||||||||||||||||||||
Working capital | $ | 592,953 | $ | 617,664 | $ | 483,252 | $ | 266,232 | $ | 231,087 | $ | 363,526 | $ | 592,953 | $ | 617,664 | $ | 483,252 | $ | 266,232 | ||||||||||||||||||||
Total assets | 1,794,321 | 1,636,093 | 1,329,009 | 1,142,791 | 899,251 | 1,483,708 | 1,794,321 | 1,636,093 | 1,329,009 | 1,142,791 | ||||||||||||||||||||||||||||||
Total liabilities | 382,773 | 339,318 | 275,234 | 289,360 | 223,968 | 417,440 | 382,773 | 339,318 | 275,234 | 289,360 | ||||||||||||||||||||||||||||||
Total shareholders’ equity | $ | 1,411,548 | $ | 1,296,775 | $ | 1,053,775 | $ | 853,431 | $ | 675,283 | $ | 1,066,268 | $ | 1,411,548 | $ | 1,296,775 | $ | 1,053,775 | $ | 853,431 | ||||||||||||||||||||
Item 7. Management’s Discussion and Analysis of Financial Condition and Results of Operations
Overview
We operate two business segments; a leading lifestyle merchandising retailing segment and a wholesale apparel segment. Our retailing segment consists of our Urban Outfitters, Anthropologie, Free People, Terrain Leifsdottir and BHLDN brands, whose merchandise is sold directly to our customers through our stores, websites, catalogs call centers and web sites.customer contact centers. Our wholesale apparel segment consists of our Free People wholesale division and our Leifsdottir wholesale division. Free People wholesalethat, primarily, designs, develops and markets young women’s contemporary casual apparel. Leifsdottir wholesale designs, develops and markets sophisticated women’s contemporary apparel.
Our comparable retail segment net sales data includes our comparable store and comparable direct-to-consumer channels. A store is included in comparable retail segment net sales data, as presented in this discussion, if it has been open at least one full fiscal year, unless it was materially expanded or remodeled within that year or was not otherwise operating at its full capacity within that year. A direct-to-consumer channel is included in comparable retail segment net sales data, as presented in this discussion, if it has been operational for at least one full fiscal year. Sales from stores and direct-to-consumer channels that do not fall within the definition of a comparable store or channel are considered non-comparable. The effects of foreign currency translation are also considered non-comparable.
Although we have no precise empirical data as it relates to customer traffic or customer conversion rates in our stores, we believe that, based only on our observations, changes in transaction volume, as discussed in our results of operations, may correlate to changes in customer traffic. Transaction volume changes may be caused by a response to our brands’ fashion offerings, our web advertising, circulation of our catalogs and an overall growth in brand recognition as we expand our store base.
Our fiscal year ends on January 31. All references in this discussion to our fiscal years refer to the fiscal years ended on January 31 in those years. For example, our fiscal 20112012 ended on January 31, 2011.
Our historical and long-term goal is to achieve a net sales compounded annual growth rate of 20% or better through a combination of opening new stores, growing comparable store sales, continuing the growth of our direct-to-consumer and wholesale operations and introducing new concepts.2012.
Retail Store
As of January 31, 2011,2012, we operated 176197 Urban Outfitters stores of which 144 are157 were located in the United States, 10 arewere located in Canada and 22 are30 were located in Europe. During fiscal 2011,2012, we opened 21 new Urban Outfitters stores, 1413 of which arewere located withinin the United States 3and 8 of which are located in Canada and 4 of which arewere located in Europe. Urban Outfitters targets young adults aged 18 to 28 through a unique merchandise mix and compelling store environment. Urban Outfitters’ product offering includes women’s and men’s fashion apparel, footwear and accessories, as well as an eclectic mix of apartment wares and gifts. We plan to open additional stores over the next several years, some of which may be outside the United States. Urban Outfitters’ North American and European store sales accounted for approximately 31.8%31.4% and 5.3%5.9% of consolidated net sales, respectively, for fiscal 2011.
We operated 153 Anthropologie stores asAs of January 31, 2011,2012, we operated 168 Anthropologie stores, of which 147 are160 were located in the United States, 4 are5 were located in Canada and 2 are3 were located in Europe. During fiscal 20112012 we opened 1615 new Anthropologie stores, of which 14 are13 were located withinin the United States, 1 iswas located in Canada and 1 iswas located in Europe. Anthropologie tailors its merchandise to sophisticated and contemporary women aged 28 to 45. Anthropologie’s product assortment includes women’s casual apparel and accessories, shoes, home furnishings and a diverse array of gifts and decorative items. We plan to open additional stores over the next several years, some of which may be outside the United States.
Anthropologie’s North American and European store sales accounted for approximately 35.1%32.8% and 0.8%0.9% of consolidated net sales, respectively, for fiscal 2011.2012.
WeAs of January 31, 2012, we operated 4262 Free People stores, as of January 31, 2011, all of which arewere located in the United States. During fiscal 20112012 we opened nine20 new Free People stores and converted one store location to a Free People wholesale showroom.stores. Free People primarily offers private label branded merchandise targeted to young contemporary women aged 25 to 30. Free People provides a unique merchandise mix of casual women’s apparel, intimates, shoes, accessories and gifts. We plan to open additional stores over the next several years.years some of which may be outside the United States. Free People’s retail store sales accounted for approximately 2.3%2.7% of consolidated net sales for fiscal 2011.2012.
WeAs of January 31, 2012, we operated one Terrain garden center, as of January 31, 2011, which iswas located in Glen Mills, Pennsylvania. Terrain is designed to appeal to customers interested in a creative, sophisticated outdoor living and gardening experience. Terrain seeks to create a compelling shopping environment, inspired by the ‘greenhouse.’ The site is large and free standing. Merchandise includes lifestyle home and garden products combined with antiques, live plants, flowers, wellness products and accessories. Terrain also offers a variety of landscape and design services. We are evaluating locations for futureanticipate opening a second Terrain garden centers.center during the first half of fiscal 2013. Terrain garden center sales accounted for less than 1.0% of consolidated net sales for fiscal 2012.
As of January 31, 2012, we operated one BHLDN store, which was located in Houston, Texas. BHLDN offers a curated collection of heirloom quality wedding gowns, bridesmaid frocks, party dresses, assorted jewelry, headpieces, footwear, lingerie and decoration. We opened a second BHLDN store in the first quarter of fiscal 2013. BHLDN store sales accounted for less than 1.0% of consolidated net sales for fiscal 2011.2012.
For all brands combined, we plan to open approximately 5055 to 5560 new stores during fiscal 2012,2013, including one23 Urban Outfitters stores, 16 Free People stores, 14 Anthropologie stores, 1 BHLDN store and approximately 14 new Free People stores. The remaining new stores will be divided approximately evenly between Urban Outfitters and Anthropologie.1 Terrain garden center
Direct-to-Consumer
Anthropologie offersWe operate a direct-to-consumer catalogDirect-to-Consumer channel which generates sales directly through our websites and catalogs. We believe that markets select merchandise, mostour Direct-to-Consumer channel increases the reputation and recognition of which is also availableour brands with our target customers and help support and strengthen our store operations. Direct-to-Consumer sales for all brands combined, increased 1.3% to approximately 20.4% of consolidated net sales in fiscal 2012, as compared to fiscal 2011.
We believe that our Anthropologie stores. web marketing and social media initiatives are a significant contributor to our Direct-to-Consumer sales growth. For fiscal 2013 we plan to increase our investment in web marketing and social media initiatives for all of our brands. These increases will be based on our continual evaluation of the customer’s response rate to web marketing initiatives.
During fiscal 2011,2012 we circulated approximately 17.6 million catalogs. We plan to increase circulation to approximately 23.247.9 million catalogs during fiscal 2012.
across all brands. Our Anthropologie European customers are offered a direct-to-consumer catalog that markets selected merchandise, most of which is also offered at our Anthropologie stores located in Europe. The catalog was launched in September 2010 and we circulated approximately 126,000 catalogs in Europe during fiscal 2011. We plan to circulate approximately 595,000 catalogs in Europe during fiscal 2012. We anticipate the number of catalogs circulated to grow consistent with the anticipated demand from our European Anthropologie customers.
Anthropologie operates a web site that accepts orders directly from customers. The web site captures the spirit of the store by offering a similar yet broader array of apparel, accessories, household and gift merchandise as found in the stores.
Anthropologie also operates a web site that targets our European customers. The web site was launched in March 2010. The web site captures the spirit of our European stores by offering a similar yet broader selection of merchandise as found in our stores. Fulfillment is provided from a third-party distribution center located in the United Kingdom. During the second quarter of fiscal 2012, we anticipate opening our own distribution center in Rushden, England.
Urban Outfitters offers a direct-to-consumer catalog offering selected merchandise, much of which is also available in our Urban Outfitters stores. During fiscal 2011, we circulated approximately 14.2 million Urban Outfitters catalogs. We plan to increase circulation to approximately 15.4 million catalogs during fiscal 2012.
Our Urban Outfitters European customers are offered a direct-to-consumer catalog that markets selected merchandise, most of which is also offered at our Urban Outfitters stores located in Europe. The catalog was launched in November 2010 and we circulated approximately 200,000 catalogs in Europe during fiscal 2011. We plan to circulate approximately 800,000 catalogs in Europe during fiscal 2012. We anticipate the number of catalogs circulated to grow consistent with the anticipated demand from our European Urban Outfitters customers.
Urban Outfitters operates a web site that accepts orders directly from customers. The web site captures the spirit of the store by offering a similar yet broader selection of merchandise as found in the stores.
Urban Outfitters also operates three web sites targeting our European customers. The web sites capture the spirit of our European stores by offering a similar yet broader selection of merchandise as found in our stores. Fulfillment is provided from a third-party distribution center located in the United Kingdom. During the second quarter of fiscal 2012, we anticipate opening our own distribution center in Rushden, England.
Free People offers a direct-to-consumer catalog offering select merchandise most of which is also available in our Free People stores. During fiscal 2011, Free People circulated approximately 7.6 million catalogs. We plan to expand catalog circulation to approximately 8.8 million catalogs during fiscal 2012.
Free People operates a web site that accepts orders directly from customers. The web site exposes consumers to the product assortment found at Free People retail stores as well as all of the Free People wholesale offerings.
Terrain operates a web site that accepts orders directly from customers. The web site was launched in September 2009. The web site exposes consumers to a portion of the product assortment found at the Terrain retail store.
Leifsdottir operates a web site that accepts orders directly from consumers. The web site was launched in September 2009. The web site exposes consumers to all product offerings from the Leifsdottir concept.
BHLDN launched its website on February 14, 2011. The website accepts orders directly from customers and exposes consumers to all product offerings from the BHLDN concept. A retail store is planned to open during fiscal 2012.
Increases in our catalog circulationlevels are driven by our evaluation of the response rate to each individual catalog. Based upon that evaluation, we adjust the frequency and circulation of our catalog portfolio as needed. In addition, we evaluate the buying pattern of our direct-to-consumerDirect-to-Consumer customers to determine which customers respond to our catalog mailings. WeAccordingly, we plan to decrease our catalog circulation to approximately 44.7 million catalogs across all brands in fiscal 2013.
Anthropologie. Anthropologie operates a website, which accepts orders directly from customers. The website captures the spirit of the store by offering a similar yet broader array of women’s casual apparel and accessories, shoes, home furnishings, gifts and decorative items as found in our stores. Anthropologie also utilizeoffers a direct-to-consumer catalog that markets select merchandise, most of which is also available in our Anthropologie stores.
Anthropologie operates a website targeting our European customers. The website captures the services of list rental companies to identify potential customers that will receive future catalogs.
We believe that our web sites increase the reputation and recognitionspirit of our brands withEuropean stores by offering a similar yet broader selection of merchandise as found in our targetEuropean stores. Our Anthropologie European customers are also offered a direct-to-consumer catalog that markets selected merchandise, most of which is also offered at our Anthropologie stores located in Europe.
Urban Outfitters.Urban Outfitters operates a website that accepts orders directly from customers. The website captures the spirit of the store by offering a similar yet broader selection of merchandise as found in our stores. Urban Outfitters offers a direct-to-consumer catalog offering select merchandise, most of which is also available in our Urban Outfitters stores.
Urban Outfitters operates three websites targeting our European customers. These websites capture the spirit of our European stores by offering a similar yet broader selection of merchandise as found in our European stores. Our Urban Outfitters European customers are offered a direct-to-consumer catalog that markets selected merchandise, most of which is also offered at our Urban Outfitters stores located in Europe.
Free People. Free People operates a website that accepts orders directly from customers. The website exposes consumers to a similar yet broader selection of merchandise as found in our stores, as well as all of the Free People wholesale offerings. Free People also offers a direct-to-consumer catalog offering select merchandise most of which is also available in our Free People stores.
Terrain. Terrain operates a website that accepts orders directly from customers. The website exposes consumers to a portion of the product assortment found at the Terrain retail store.
BHLDN.BHLDN launched its website on February 14, 2011. The website accepts orders directly from customers and help support the strength of our stores’ operations. We plan on increasing our spending on investments in web marketing during fiscal 2012 forexposes consumers to all of our brands. These increases will be based on our daily evaluationproduct offerings of the customer’s response rate to our marketing investments.
Direct-to-consumer sales for all brands combined were approximately 19.1% of consolidated net sales for fiscal 2011.BHLDN brand.
Wholesale Operations
The Free People wholesale division designs, develops and markets young women’s contemporary casual apparel. During fiscal 2011,2012, Free People’s range of tops, bottoms, sweaters and dresses were sold worldwide through approximately 1,400 better department and specialty stores, including Bloomingdale’s, Nordstrom, Lord & Taylor, Belk and our own Free People stores. Free People wholesale sales accounted for approximately 4.9%5.1% of consolidated net sales for fiscal 2011.
The Leifsdottir wholesale division was established in fiscal 2009. Leifsdottir wholesale designs, develops and markets sophisticated women’s contemporary apparel including dresses, tops and bottoms, as well as shoes and accessories. Leifsdottir is sold through luxury department stores including Bloomingdale’s, Nordstrom, Neiman Marcus and Bergdorf Goodman, select specialty stores and our own Anthropologie stores. Leifsdottir wholesale sales accounted for less than 1% of total consolidated net sales for fiscal 2011.2012.
Critical Accounting Policies and Estimates
Our consolidated financial statements have been prepared in accordance with generally accepted accounting principles generally accepted in the United States. These generally accepted accounting principles require management to make estimates and assumptions that affect the reported amounts of assets and liabilities and disclosure of contingent assets and liabilities at the date of the financial statements and the reported amounts of net sales and expenses during the reporting period.
Our senior management has reviewed the critical accounting policies and estimates with our audit committee. Our significant accounting policies are described in Note 2 of our consolidated financial statements, “Summary of Significant Accounting Policies.” We believe that the following discussion addresses our critical accounting policies, which are those that are most important to the portrayalpresentation of our financial condition and results of operationscash flows and require management’s most difficult, subjective and complex judgments, often as a result of the need to make estimates about the effect of matters that are inherently uncertain. If actual results were to differ significantly from estimates made, the reported results could be materially affected. We are not currently aware of any reasonably likely events or circumstances that would cause our actual results to be materially different from our estimates.
Revenue Recognition
Revenue is recognized at the point-of-sale for retail store sales or when merchandise is shipped to customers for wholesale and direct-to-consumer sales, net of estimated customer returns. Revenue is recognized at the completion of a job or service for landscape sales. Revenue is presented on a net basis and does not include any tax assessed by a governmental or municipal authority. Payment for merchandise at our stores and through our direct-to-consumer channel is tendered by cash, check, credit card, debit card or gift card. Therefore, our need to collect outstanding accounts receivable for our retail and direct-to-consumer channel is negligible and mainly results from returned checks or unauthorized credit card transactions. We maintain an allowance for doubtful accounts for our wholesale and landscape service accounts receivable, which management reviews on a regular basis and believes is sufficient to cover potential credit losses and billing adjustments. Deposits for custom orders are recorded as a liability and recognized as a sale upon delivery of the merchandise to the customer. These custom orders, typically for upholstered furniture, are not material. Deposits for landscape services are recorded as a liability and recognized as a sale upon completion of service. Landscape services and related deposits are not material.
We account for a gift card transaction by recording a liability at the time the gift card is issued to the customer in exchange for consideration from the customer. A liability is established and remains on our books until the card is redeemed by the customer, at which time we record the redemption of the card for merchandise as a sale, or when we determine the likelihood of redemption is remote. We determine the probability of the gift cards being redeemed to be remote based on historical redemption patterns. Revenues attributable to gift card liabilities relieved after the likelihood of redemption becomes remote are included in sales and are not material. Our gift cards do not expire.
Sales Return Reserve
We record a reserve for estimated product returns where the sale has occurred during the period reported, but the return is likely to occur subsequent to the period reported and may otherwise be considered in-transit. The reserve for estimated in-transit product returns is based on our most recent historical return trends. If the actual return rate or experience is materially higher than our estimate, additional sales returns would be recordedadjusted in the future. As of January 31, 20112012 and 2010,2011, reserves for estimated sales returns in-transit totaled $11.0 million and $11.4 million, representing 2.6% and $9.9 million, representing 3.0% and 2.9% of total liabilities, respectively.
Marketable Securities
OurAll of our marketable securities may beas of January 31, 2012 and 2011, are classified as either held-to-maturity or available-for-sale. Held-to-maturity securities represent those securities that are held at amortized cost and that we have both the intent and the belief that it is not likely that we will be required to sell the security prior to its maturity and recovery of full amortized cost. Interest on these securities, as well as amortization of discounts and premiums, is included in interest income. Available-for-sale securities represent securities that do not meet the classification of held-to-maturity, are not actively tradedavailable-for-sale and are carried at fair value, which approximates amortized cost. Interest on these securities, as well as the amortization of discounts and premiums, is included in interest income in the Consolidated
Statements of Income. Unrealized gains and losses on these securities are considered temporary and therefore are excluded from earnings and are reported as a separate component ofin accumulated other comprehensive loss in shareholders’ equity until realized. Other than temporary impairment losses related to credit losses are considered to be realized losses. When available-for-sale securities are sold, the cost of the securities is specifically identified and is used to determine the realized gain or loss. Securities classified as current assets have maturity dates of
less than one year from the balance sheet date. Securities classified as non-current assets have maturity dates greater than one year from the balance sheet date. Available for saleAvailable-for-sale securities such as ARSauction rate securities that fail at auction and do not liquidate underin the normal course are classified as non-current assets. Successful auctions would be classified as current assets. All of our marketable securities as of January 31, 2011 and 2010 were classified as available-for-sale.
Inventories
We value our inventories, which consist primarily of general consumer merchandise held for sale, at the lower of cost or market. Cost is determined on the first-in, first-out method and includes the cost of merchandise and import related costs, including freight, import taxes and agent commissions. A periodic review of inventory is performed in order to determine if inventory is properly stated at the lower of cost or market. Factors related to current inventories such as future expected consumer demand and fashion trends, current aging, current and anticipated retail markdowns or wholesale discounts and class or type of inventory are analyzed to determine estimated net realizable value. Criteria utilized by the Companythat we utilize to quantify aging trends includes factors such as average selling cycle and seasonality of merchandise, the historical rate at which merchandise has sold below cost during the average selling cycle and the value and nature of merchandise currently priced below original cost. A provision is recorded to reduce the cost of inventories to the estimated net realizable values, if appropriate. The majority of inventory at January 31, 20112012 and 20102011 consisted of finished goods. Unfinished goods and work-in-process were not material to the overall net inventory value. Net inventories as of January 31, 20112012 and January 31, 20102011 totaled $250.1 million and $229.6 million, representing 16.9% and $186.1 million, representing 12.8% and 11.4% of total assets, respectively. Any significant unanticipated changes in the risk factors noted within this report could have a significant impact on the value of our inventories and our reported operating results.
Adjustments to reservesprovisions related to the net realizable value of our inventories are primarily based on the market value of our physical inventories, cycle counts and recent historical trends. Our physical inventories for fiscal 20112012 were performed as of June 20102011 and January 2011.2012. Our estimates generally have been accurate and our reserve methods have been applied on a consistent basis. We expect the amount of our reserves to increase over time as we expand our store base and accordingly, related inventories.
Long-Lived Assets
Our long-lived assets consist principally of store leasehold improvements, buildings and furniture and fixtures, and are included in the “Property and equipment, net” line item in our consolidated balance sheets included in this report. Store leasehold improvements are recorded at cost and are amortized using the straight-line method over the lesser of the applicable store lease term, including lease renewals which are reasonably assured, or the estimated useful life of the leasehold improvements. The typical initial lease term for our stores is ten years. Buildings are recorded at cost and are amortized using the straight-line method over 39 years. Furniture and fixtures are recorded at cost and are amortized using the straight-line method over their useful life, which is typically five years. Net property and equipment as of January 31, 20112012 and January 31, 20102011 totaled $586.3$685.0 million and $540.0$586.3 million, respectively, representing 32.7%46.2% and 33.0%32.7% of total assets, respectively.
In assessing potential impairment of our store relatedthese assets, we periodically evaluate historical and forecasted operating results and cash flows on a store-by-store basis. Newly opened stores may take time to generate positive operating and cash flow results. Factors such as store type (e.g., mall versus free-standing), store location (e.g., urban area versus college campus or suburb), current marketplace awareness of our brands, local customer demographic data and current fashion trends are all considered in determining the time frame required for a store to achieve positive financial results, which, in general, is assumed to be measurable within three years from the date a store location has opened. If economic conditionsfinancial results are substantially different from our expectations, the carrying value of certain of our long-lived assets may become impaired. For fiscal 2012, 2011 2010 and 2009,2010, write-downs of long-lived assets were not material.
We have not historically encountered material early retirement charges related to our long-lived assets. The cost of assets sold or retired and the related accumulated depreciation or amortization is removed from the accounts with any resulting gain or loss included in net income. Maintenance and repairs are charged to selling, general and operating and administrative expense as incurred. Major renovations or improvements that extend the service lives of our assets are capitalized over the extension period or life of the improvement, whichever is less.
As of the date of this report, all of our stores are expected to generate positive annual cash flow before allocation of corporate overhead.
Accounting for Income Taxes
As part of the process of preparing our consolidated financial statements, we are required to estimate our income taxes in each of the tax jurisdictions in which we operate. This process involves estimating our actual current tax obligations together with assessing temporary differences resulting from differing treatment of certain items for tax and accounting purposes, such as depreciation of property and equipment and valuation of inventories. These temporary differences result in deferred tax assets and liabilities, which are included within our consolidated balance sheet. We then assess the likelihood that our deferred tax assets will be recovered from future taxable income. Actual results could differ from this assessment if adequate taxable income is not generated in future periods. Net deferred tax assets as of January 31, 20112012 and January 31, 20102011 totaled $52.1$63.9 million and $43.6$52.1 million, respectively, representing 2.9%4.3% and 2.7%2.9% of total assets, respectively.
To the extent we believe that recovery of an asset is at risk, we establish valuation allowances. To the extent we establish valuation allowances or increase the allowances in a period, we include an expense within the tax provision in the consolidated statementConsolidated Statements of income.
Income. We increased valuation allowances to $2.8 million as of January 31, 2012 from $2.6 million as of January 31, 2011 from $2.2 million as of January 31, 2010. This increase is2011. Valuation allowances are based on evidence of our ability to generate sufficient future taxable income in certain foreign and state jurisdictions. In the future, if enough evidence of our ability to generate sufficient future taxable income in these jurisdictions becomes apparent, we would be required to reduce our valuation allowances, resulting in a reduction in income tax expense in the consolidated statementConsolidated Statements of income.Income. On a quarterly basis, management evaluates the likelihood that we will realize the deferred tax assets and adjusts the valuation allowances, if appropriate.
Our tax liability for uncertain tax positions contains uncertainties because we are required to make assumptions and to apply judgementjudgment to estimate the exposures associated with our various filing positions. Although we believe that the judgementsjudgments and estimates discussed herein are reasonable, actual results may differ, and we may be exposed to losses or gains that could be material.
Accounting for Contingencies
From time to time, we are named as a defendant in legal actions arising from our normal business activities. We account for contingencies such as these in accordance with generally accepted accounting principles in the United States. We are required to record an estimated loss contingency when information available prior to
issuance of our consolidated financial statements indicates that it is probable that an asset has been impaired or a liability has been incurred at the date of the consolidated financial statements and the amount of the loss can be reasonably estimated. Accounting for contingencies arising from contractual disputes or legal proceedings requires management to use its best judgment when estimating an accrual related to such contingencies. As additional information becomes known, our accrual for a loss contingency could fluctuate, thereby creating variability in our results of operations from period to period. Likewise, an actual loss arising from a loss contingency which significantly exceeds the amount accrued in our consolidated financial statements could have a material adverse impact on our operating results for the period in which such actual loss becomes known.
Share-Based Compensation
Accounting for share-based compensation requires measurement of compensation cost for all share-based awards at fair value on the date of grant and recognition of compensation over the service period, net of estimated forfeitures.
We use a Lattice Binomial pricing model to determine the fair value of our stock options and stock appreciation rights. This model uses assumptions including the risk free rate of interest, expected volatility of our stock price and expected life of the options. A Monte Carlo simulation, which utilizes similar assumptions, is used to determine the fair value of performance shares. We review our assumptions and the valuations provided by independent third-party valuation advisors to determine the fair value of share-based compensation awards at the date of grant. The assumptions used in calculating the fair value of these share-based payment awards represent our best estimates, but these estimates involve inherent uncertainties and the application of judgment. Changes in these assumptions can materially affect the fair value estimate.
Additionally, we make certain estimates about the number of awards which will be granted under performance based incentive plans. We record expense for performance based shares based on our current expectations of the probable number of shares that will ultimately be issued. The estimation of share-based awards that will ultimately vest requires judgment, and to the extent actual results or updated estimates differ from our current estimates, such amounts will be recorded as a cumulative adjustment in the period estimates are revised and could be materially different from share-based compensation expense recorded in prior periods.
We are also required to estimate the expected forfeiture rate. We consider many factors when estimating expected forfeitures, including types of awards and historical experience. We revise our forfeiture rates, when necessary, in subsequent periods if actual forfeitures differ from those originally estimated. As a result, if the actual forfeiture rate is different from the estimate at the completion of the vesting period, the share-based compensation expense may not be comparable to amounts recorded in prior periods.
Results of Operations
As a Percentage of Net Sales
The following tables set forth, for the periods indicated, the percentage of our net sales represented by certain income statement data and the change in certain income statement data from period to period. This table should be read in conjunction with the discussion that follows:
| Fiscal Year Ended January 31, | Fiscal Year Ended January 31, | |||||||||||||||||||||||
| 2011 | 2010 | 2009 | 2012 | 2011 | 2010 | |||||||||||||||||||
Net sales | 100.0 | % | 100.0 | % | 100.0 | % | 100.0 | % | 100.0 | % | 100.0 | % | ||||||||||||
Cost of sales, including certain buying, distribution and occupancy costs | 58.8 | 59.4 | 61.1 | 65.2 | 58.8 | 59.4 | ||||||||||||||||||
|
|
| ||||||||||||||||||||||
Gross profit | 41.2 | 40.6 | 38.9 | 34.8 | 41.2 | �� | 40.6 | |||||||||||||||||
Selling, general and administrative expenses | 23.0 | 23.1 | 22.6 | 23.3 | 23.0 | 23.1 | ||||||||||||||||||
|
|
| ||||||||||||||||||||||
Income from operations | 18.2 | 17.5 | 16.3 | 11.5 | 18.2 | 17.5 | ||||||||||||||||||
Interest income | 0.1 | 0.3 | 0.6 | 0.2 | 0.1 | 0.3 | ||||||||||||||||||
Other income | — | — | — | — | — | — | ||||||||||||||||||
Other expenses | — | — | — | — | — | — | ||||||||||||||||||
|
|
| ||||||||||||||||||||||
Income before income taxes | 18.3 | 17.8 | 16.9 | 11.7 | 18.3 | 17.8 | ||||||||||||||||||
Income tax expense | 6.3 | 6.4 | 6.0 | 4.2 | 6.3 | 6.4 | ||||||||||||||||||
|
|
| ||||||||||||||||||||||
Net income | 12.0 | % | 11.4 | % | 10.9 | % | 7.5 | % | 12.0 | % | 11.4 | % | ||||||||||||
|
|
| ||||||||||||||||||||||
Period over Period Change: | ||||||||||||||||||||||||
Net sales | 17.4 | % | 5.6 | % | 21.7 | % | 8.8 | % | 17.4 | % | 5.6 | % | ||||||||||||
Gross profit | 19.1 | % | 10.2 | % | 23.7 | % | -8.1 | % | 19.1 | % | 10.2 | % | ||||||||||||
Income from operations | 22.2 | % | 13.2 | % | 33.1 | % | -31.3 | % | 22.2 | % | 13.2 | % | ||||||||||||
Net income | 24.1 | % | 10.3 | % | 24.4 | % | -32.1 | % | 24.1 | % | 10.3 | % | ||||||||||||
Fiscal 2012 Compared to Fiscal 2011
Net sales in fiscal 2012 increased by 8.8% to $2.47 billion, from $2.27 billion in the prior fiscal year. The $200 million increase was attributable to a $187 million or 8.7% increase, in retail segment net sales and a $13 million or 10.6% increase in our wholesale segment net sales. The growth in our retail segment net sales during fiscal 2012 was driven by increases of $175 million in non-comparable and new store net sales and $71 million, or 16.4%, in direct-to-consumer net sales. A decrease of $59 million, or 3.8%, in comparable store net sales was a partial offset. The net increase in comparable retail segment net sales was comprised of increases of 17.0% and 1.4% at Free People and Urban Outfitters, respectively and a decrease of 3.2% at Anthropologie. The increase in our wholesale segment net sales was due to a $16 million, or a 14.7% increase, at Free People wholesale, partially offset by a $3 million decrease at Leifsdottir wholesale resulting from the discontinuation of wholesale distribution of the Leifsdottir brand, which occurred in the first quarter of fiscal 2012.
The increase in net sales attributable to non-comparable and new stores was primarily the result of opening 57 new stores in fiscal 2012 and 46 new stores in fiscal 2011 that were considered non-comparable during fiscal 2012. Direct-to-consumer net sales in fiscal year 2012 increased over the prior year primarily due to increased traffic to our websites combined with an increase in average order value, which more than offset a decrease in conversion rate. Catalog circulation across all brands increased by 4.1 million, or 9.3%. Comparable store net sales decrease was primarily the result of a
decrease in the average unit sales prices combined with a decrease in the number of transactions. Thus far during the first quarter of fiscal 2013, comparable retail segment net sales are low single-digit positive. The increase in Free People wholesale net sales was driven by increases in transactions and average unit sale prices.
Gross profit rates in fiscal 2012 decreased to 34.8% of net sales, or $861 million, from 41.2% of net sales, or $937 million, in fiscal 2011. This decrease was principally due to increased merchandise markdowns to clear slow-moving inventory, primarily associated with women’s apparel inventory at Anthropologie and Urban Outfitters, as well as deleveraging of store occupancy expense as a result of negative comparable store net sales. Total Company inventory increased 8.9% to $250 million from $230 million in the prior year. Comparable retail segment inventory (which includes our direct-to-consumer channel) grew 1.8%, while comparable store inventories decreased 2.5%. The increase in total Company inventory is primarily related to the acquisition of inventory to stock new stores, our direct-to-consumer channel growth and the launch of our BHLDN brand. The decrease in comparable store inventory was a partial offset.
Selling, general and administrative expenses, as a percentage of net sales for fiscal 2012, increased to 23.3% of net sales versus 23.0% of net sales for fiscal 2011. This increase was primarily due to higher marketing and related e-commerce investments as well as the deleveraging of direct store controllable expenses driven by the negative comparable stores sales in fiscal 2012. These increases were partially offset by lower incentive based compensation versus the prior fiscal year as well as an equity compensation expense reversal due to the departure of an executive officer. In fiscal 2012, selling, general and administrative expenses increased by $54 million, or 10.2%, to $576 million, from $522 million in fiscal 2011. The dollar increase versus the prior year is primarily related to the operating expenses of new and non-comparable stores.
Income from operations decreased to 11.5% of net sales, or $285 million, for fiscal 2012 compared to 18.2% of net sales, or $414 million, for fiscal 2011.
Our annual effective income tax rate for January 31, 2012 increased to 35.9% of income before income taxes for fiscal 2012 compared to 34.6% of income before income taxes for fiscal 2011. The fiscal 2011 effective tax rate was favorably affected by a non-recurring federal rehabilitation credit relating to the expansion of our home office in Philadelphia, Pennsylvania. See Note 8 “Income Taxes” in our notes to the consolidated financial statements, for a reconciliation of the statutory U.S. federal income tax rate to our effective tax rate. We expect the tax rate for fiscal 2013 to be approximately 36.5%.
Fiscal 2011 Compared to Fiscal 2010
Net sales in fiscal 2011 increased by 17.4% to $2.27 billion, from $1.94 billion in the prior fiscal year. The $336 million increase was attributable to a $320 million or 17.5% increase, in retail segment net sales and a $16 million or 15.6% increase in our wholesale segment net sales. The growth in our retail segment net sales during fiscal 2011 was driven by increases of $161 million in non-comparable and new store net sales, $110 million, or 34.0%, in direct-to-consumer net sales and $49 million, or 4%, in comparable store net sales. The increase in comparable retail segment net sales was comprised of 9.8%, 6.9% and 26.7% increases at Anthropologie, Urban Outfitters and Free People, respectively. The increase in our wholesale segment net sales was due to a $15 million, or a 15.9% increase, at Free People wholesale and a $1.0 million, or an 11.9% increase, at Leifsdottir wholesale.
The increase in net sales attributable to non-comparable and new stores was primarily the result of opening 46 new stores in fiscal 2011 and 33 new stores in fiscal 2010 that were considered non-comparable during fiscal 2011. Comparable store net sales increases were primarily the result of an increase in the number of transactions and units sold per transaction, partially offset by a decrease in the average unit sales prices. Direct-to-consumer net sales in fiscal year 2011 increased over the prior year primarily due to increased traffic to our web siteswebsites combined with an increase in average order value, which more than offset a decrease in conversion rate. Catalog circulation across all brands increased by 2.8 million, or 7.7%. Thus far during the first quarter of fiscal 2012, comparable retail segment net sales are low single-digit negative. The increase in Free People wholesale net sales was driven by increases in transactions and average unit sale prices. Leifsdottir’s wholesale net sales increase was a result of an increase in the number of transactions that more than offset a decrease in average unit sale prices.
Gross profit rates in fiscal 2011 increased to 41.2% of net sales, or $937 million, from 40.6% of net sales, or $786 million, in fiscal 2010. This increase was primarily due to improved merchandise margins and leveraging of store occupancy expense driven by positive comparable store sales. Total Company inventory increased 23.3% to $230 million from $186 million in the prior year. The increase is primarily related to the acquisition of inventory to stock new stores and our direct-to-consumer channel growth. Comparable retail segment inventory (which includes our direct-to-consumer channel) grew 9.7%, while comparable store inventories increased 4.4%.
Selling, general and administrative expenses, as a percentage of net sales for fiscal 2011, decreased to 23.0% of net sales versus 23.1% of net sales for fiscal 2010. The decrease in percentage was primarily due to leveraging of direct store fixed and controllable costs driven by the positive retail segment comparable sales. In fiscal 2011, selling, general and administrative expenses increased by $75 million, to $522 million, from $447 million in the prior fiscal year. The dollar increase versus the prior year is primarily related to the operating expenses of new and non-comparable stores.
Income from operations increased to 18.2% of net sales, or $414 million, for fiscal 2011 compared to 17.5% of net sales, or $339 million, for fiscal 2010.
Our annual effective income tax rate for January 31, 2011 decreased to 34.6% of income before income taxes for fiscal 2011 compared to 36.2% of income before income taxes for fiscal 2010. This decrease was due to the favorable mix of earnings in certain foreign jurisdictions and the federal rehabilitation credit included in fiscal 2011. See Note 8 “Income Taxes” in our Notes to the Consolidated Financial Statements, for a reconciliation of the statutory U.S. federal income tax rate to
our effective tax rate. We expect the tax rate for fiscal 2012 to be higher than that of fiscal 2011 due in part to the expiration of the federal rehabilitation credit received in fiscal 2011.
Fiscal 2010 Compared to Fiscal 2009
Net sales in fiscal 2010 increased by 5.6%, to $1.94 billion from $1.83 billion in the prior fiscal year. The $103 million increase was attributable to a $109 million or 6.3% increase, in retail segment net sales that was partially offset by a $6 million or 5.4% decline in our wholesale segment net sales. The growth in our retail segment net sales during fiscal 2010 was driven by an increase of $115 million in non-comparable and new store net sales, and an increase in direct-to-consumer net sales of $53 million or 19.5%. These increases were partially offset by a decline of $35 million or 2.6% in comparable store net sales and $24 million of foreign currency translation adjustments. The increase in comparable retail segment net sales was comprised of 3.3% and 7.1% increases at Anthropologie and Free People, respectively, partially offset by a 1.0% decrease at Urban Outfitters. The decline in our wholesale segment net sales was due to an $11 million or 10.6% decline at Free People wholesale that was partially offset by an increase of $5 million or 185% at Leifsdottir.
The increase in net sales attributable to non-comparable and new stores was primarily the result of opening 33 new stores in fiscal 2010 and 49 new stores in fiscal 2009 that were considered non-comparable during fiscal 2010. Comparable store net sales decreases were primarily the result of decreases in the number of units sold per transaction, that were partially offset by slight increases in average unit sales prices and transactions. Direct-to-consumer net sales in fiscal year 2010 increased over the prior year primarily due to increased traffic to our web sites, which more than offset decreases in conversion rate and average order value. Catalog circulation across all brands decreased by 3 million or 8.2%. The decrease in Free People wholesale net sales was driven by decreases in transactions and average unit sale prices. Leifsdottir wholesale net sales increase was a result of increased transactions that more than offset a decline in average unit sale prices.
Gross profit rates in fiscal 2010 increased to 40.6% of net sales or $786 million from 38.9% of net sales or $713 million in fiscal 2009. This improvement is primarily due to improvements in our initial merchandise margins which were partially offset by a higher rate of store occupancy expense driven by the decrease in comparable store sales. Total inventories at January 31, 2010 increased by $16 million or 9.7% to $186 million from $170 million in the prior fiscal year. The increase is primarily due to the acquisition of inventory to stock new and non-comparable stores. Comparable store inventory at cost decreased by 3%.
Selling, general and administrative expenses during fiscal 2010 increased to 23.1% of net sales or $447 million versus 22.6% of net sales or $414 million for fiscal 2009. The rate increase is primarily due to an increase in incentive based compensation that relates to meeting targeted operating performance goals in fiscal 2010. The dollar increase versus the prior year is primarily related to the operating expenses of new and non-comparable stores.
Income from operations increased to 17.5% of net sales or $339 million for fiscal 2010 compared to 16.3% of net sales or $299 million for fiscal 2009.
Our annual effective income tax rate increased to 36.2% of income for fiscal 2010 compared to 35.6% of income for fiscal 2009. The increase in fiscal 2010’s tax rate is primarily due to a lower
proportion of tax free interest income due to a strategic shift to a mix of lower risk securities versus the prior year’s holdings. See Note 8 “Income Taxes” in the Notes to the Consolidated Financial Statements, for a reconciliation of the statutory U.S. federal income tax rate to our effective tax rate.
Liquidity and Capital Resources
Cash, cash equivalents and marketable securities were $362 million as of January 31, 2012 as compared to $809 million as of January 31, 2011 as compared toand $745 million as of January 31, 2010 and $5212010. The $447 million as of January 31, 2009. The $64 million increasedecrease in cash, cash equivalents and marketable securities during fiscal 20112012 was primarily a result of $385 million from cash provided by operating activities, partially offset by $205$545 million of cash used for share repurchases of our common shares and $144$190 million of cash used for purchases of property and equipment. equipment, partially offset by $283 million of cash provided by operating activities.
Cash used in investingprovided by operating activities, for fiscal 2011 was $362012, decreased by $102 million consisting of $144to $283 million used primarily for the construction of new stores partially offset by $108from $385 million in fiscal 2011. The decrease was primarily due to lower net proceeds from marketable securities.
Cash used in financing activitiesincome in fiscal 2011 of $168 million was primarily related to the repurchase of our common shares pursuant to our share repurchase program partially offset by cash provided by the exercise of stock options and related tax benefits on stock option exercises.2012. Our working capital for fiscal years 2012, 2011 and 2010 and 2009 was $364 million, $593 million $618 million and $483 $618
million, respectively. Changes in working capital primarily relate to changes toin the volume of cash, cash equivalents, marketable securities and inventories relative to inventory-related payables and store-related accruals.
Cash provided by investing activities during fiscal 2012 was $55 million, consisting of $245 million in net proceeds from marketable securities partially offset by $190 million used primarily for the construction of new stores and distribution and fulfillment facilities.
Cash used in financing activities during fiscal 2012 of $532 million was primarily related to the repurchase of our common shares. Cash provided by the exercise of stock options and related tax benefits on stock option exercises was a partial offset.
During the last three years, we have satisfied our cash requirements through our cash flow from operations. Our primary uses of cash have been to repurchase our common shares, open new stores and purchase inventories. We have also used our cash to repurchase shares of our common stock. We continued to invest in our direct-to-consumer efforts, wholesale businesses,technology, distribution and fulfillment facilities, our home office and our international subsidiaries.operations. Cash paid for property and equipment, net of tenant improvement allowances, included in deferred rent, for fiscal 2012, 2011 and 2010 and 2009 were $190 million, $144 million, $109 million, and $113$109 million, respectively and were primarily used to expand and support our store base.
During fiscal 2012,2013, we plan to construct and open approximately 5055 to 5560 new stores, renovate certain existing stores, construct additional distribution andcomplete construction of our fulfillment facilitiesfacility in Rushden, England and Reno, Nevada, continue to expand our home officeoffices in Philadelphia, Pennsylvania, upgrade our systems, increase our catalog circulation by approximately 9 million catalogs to approximately 49 million catalogs,investments in direct-to-consumer marketing and purchase inventory for our stores, direct-to-consumer and wholesale businesses at levels appropriate to maintain our planned sales growth. We plan to increase the level of capital expenditures during fiscal 20122013 to approximately $188$210 million. We believe that our new store, catalogdirect-to-consumer and inventory investments have the ability to generate positive cash flow within a year. We believe improvements to our home office, fulfillment and distribution facilities are necessary to adequately support our growth. We may also enter into one or more acquisitions or transactions related to the expansion of our brands.
During fiscal 2012, we completed the construction of a 98,000 square foot distribution center and a 142,000 square foot fulfillment center, each located in Rushden, England, at a combined cost of approximately $19 million.
During fiscal 2011, we completed a 54,000 square foot expansion of our home office in Philadelphia, Pennsylvania at a cost of approximately $25 million.
During fiscal 2010, we completed a 100,000 square foot addition to our Lancaster, Pennsylvania distribution facility. This facility primarily serves our Midwest and East coast stores. We believe this expansion will help support our growth for the near term.
On February 28, 2006, our Board of Directors approved a stock repurchase program. The program authorizesauthorized the Company to purchase up to 8.0 million common shares. On November 16, 2010 and August 25, 2011, our Board of Directors approved two separate stock repurchase authorizations of 10.0 million common shares. These additional authorizations supplemented the Company’s 2006 stock repurchase program.
During fiscal 2012, we repurchased and retired 20.5 million common shares for approximately $538.3 million. During fiscal 2011 we repurchased and subsequently retired 6.3 million common shares for $201.0 million. We repurchased 1.2 million common shares during fiscal year 2007. During fiscal 2011 we repurchased and subsequently retired
6.4 million common shares for $205.0 million. On November 16, 2010, our BoardAs of Directors authorized the repurchase of 10.0 million additional common shares. This authorization supplements the Company’s 2006 stock repurchase program.
Subsequent to January 31, 2011 and through April 1, 2011, we repurchased and retired 4.8 million2012, there were no common shares for approximately $148.7 million. This activity completes our 2006 repurchase program and leaves approximately 5.6 million shares available for repurchase under the 2010 program.
In addition to shares repurchased under the stock repurchase program, during the fiscal years ended January 31, 2012 and 2011, we settled and subsequently retired 0.3 million and 0.1 million
common shares at a total cost of $7.2 million and $4.0 million, respectively, from employees to meet minimum statutory tax withholding requirements.
On September 21, 2009,April 25, 2011, we amended our renewed and amended line of credit facility (the “Line”) with Wells Fargo Bank, N.A. (the “Bank”).National Association. This amendment added an additional borrowerextended the term of the Line for three years, increased the accordion feature from $100 million to $175 million, reduced the interest rate margin for certain cash advances and modified certain additional guarantors.financial covenants and terms. The Line iscontains a three-year revolving credit facility with an accordion feature allowing an increase in available credit up to $100.0 million atsub-limit for borrowings by our discretion. On May 27, 2010, we executed a fifth amendment to the Line increasing its credit limit to $80.0 million.European subsidiaries that are guaranteed by us. Cash advances bear interest at LIBOR plus 0.50% to 1.60%1.50% based on our achievement of prescribed adjusted debt ratios. The Line subjects us to various restrictive covenants, including maintenance of certain financial ratios and covenants such as fixed charge coverage and adjusted debt. The covenants also include limitations on our capital expenditures, ability to repurchase shares and the payment of cash dividends. On October 31, 2011, we further amended the Line to revise certain financial covenants which included removing the limitation on share repurchases, as well as to join certain of our subsidiaries as additional borrowers and guarantors and release certain others. As of and during the fiscal year ended January 31, 2011,2012, there were no borrowings under the Line and we were in compliance with all covenants under the Line. Outstanding letters of credit and stand-by letters of credit under the Line totaled approximately $55.5$59.7 million as of January 31, 2011.2012. The available credit, including the accordion feature, under the Line totaled approximately $44.5was $115.3 million as of January 31, 2011. We are negotiating a renewal of the Line with the Bank. As part of these negotiations, we were granted an extension of all of the existing terms, covenants and conditions of the Line through April, 2011.2012. We expect the renewalLine to satisfy our letter of credit needs through at least fiscal 2014.
We have entered into agreements that create contractual obligations and commercial commitments. These obligations and commitments will have an impact on future liquidity and the availability of capital resources. Accumulated cash and future cash from operations, as well as available credit under our line of credit facility, are expected to fund such obligations and commitments. The tables noted below present a summary of these obligations and commitments as of January 31, 2011:
Contractual Obligations
| Payments Due by Period (in thousands) | Payments Due by Period (in thousands) | |||||||||||||||||||||||||||||||||||||||
Description | Total Obligations | Less Than One Year | One to Three Years | Three to Five Years | More Than Five Years | Total Obligations | Less Than One Year | One to Three Years | Three to Five Years | More Than Five Years | ||||||||||||||||||||||||||||||
Operating leases (1) | $ | 1,280,955 | $ | 164,289 | $ | 480,931 | $ | 253,011 | $ | 382,724 | $ | 1,389,003 | $ | 185,047 | $ | 519,895 | $ | 263,462 | $ | 420,599 | ||||||||||||||||||||
Purchase orders (2) | 278,079 | 278,079 | — | — | — | 315,890 | 315,890 | — | — | — | ||||||||||||||||||||||||||||||
Construction contracts (3) | 18,004 | 18,004 | — | — | — | 16,292 | 16,292 | — | — | — | ||||||||||||||||||||||||||||||
Tax Contingencies (4) | 798 | 798 | — | — | — | 340 | 340 | — | — | — | ||||||||||||||||||||||||||||||
|
|
|
|
| ||||||||||||||||||||||||||||||||||||
Total contractual obligations | $ | 1,577,836 | $ | 461,170 | $ | 480,931 | $ | 253,011 | $ | 382,724 | $ | 1,721,525 | $ | 517,569 | $ | 519,895 | $ | 263,462 | $ | 420,599 | ||||||||||||||||||||
|
|
|
|
| ||||||||||||||||||||||||||||||||||||
| (1) | Includes store operating leases, which generally provide for payment of direct operating costs in addition to rent. The obligation amounts shown above only reflect our future minimum lease |
payments as the direct operating costs fluctuate over the term of the lease. Additionally, there are |
| (2) | Our merchandise commitments are cancellable with no or limited recourse available to the vendor until the merchandise shipping date. |
| (3) | Includes construction contracts with contractors that are fully liquidated upon the completion of construction, which is typically within 12 months. |
| (4) | Tax contingencies include |
Commercial Commitments
Description | Total Amounts Committed | Amount of Commitment Per Period (in thousands) | Total Amounts Committed | Amount of Commitment Per Period (in thousands) | ||||||||||||||||||||||||||||||||||||
| Less Than One Year | One to Three Years | Three to Five Years | More Than Five Years | Less Than One Year | One to Three Years | Three to Five Years | More Than Five Years | |||||||||||||||||||||||||||||||||
Line of credit (1) | $ | 51,397 | $ | 51,397 | $ | — | $ | — | $ | — | $ | 55,532 | $ | 55,532 | $ | — | $ | — | $ | — | ||||||||||||||||||||
Standby letters of credit | 4,081 | 4,081 | — | — | — | 4,153 | 4,153 | — | — | — | ||||||||||||||||||||||||||||||
|
|
|
|
| ||||||||||||||||||||||||||||||||||||
Total commercial commitments | $ | 55,478 | $ | 55,478 | $ | — | $ | — | $ | — | $ | 59,685 | $ | 59,685 | $ | — | $ | — | $ | — | ||||||||||||||||||||
|
|
|
|
| ||||||||||||||||||||||||||||||||||||
| (1) | Consists primarily of outstanding letter of credit commitments in connection with import inventory purchases. |
Off-Balance Sheet Arrangements
As of and for the three fiscal years ended January 31, 2011,2012, except for operating leases entered into in the normal course of business, we were not party to any material off-balance sheet arrangements that are reasonably likely to have a current or future effect on our financial condition, revenues, expenses, results of operations, liquidity, capital expenditures or capital resources.
Other Matters
Recently Issued Accounting Pronouncements
In January 2010, the Financial Accounting Standards Board (“FASB”) issued an accounting standards update which amendsthat amended fair value measurements and disclosures and aimsaimed to improve the transparency of financial reporting of assets and liabilities measured at fair value. The update requiresrequired new disclosures for transfers in and out of Level 1 and Level 2 and the basis for such transfers. Also required are disclosures for activity in Level 3, including purchase, sale, issuance and settlement
information. Lastly, it clarifiesclarified guidance regarding disaggregation and disclosure of information about valuation techniques and inputs used to measure fair value for both recurring and non-recurring fair value measurements in Level 2 and Level 3 categories. We have adopted the new disclosures and clarificationsprovisions of existing disclosures as ofthis accounting standards update effective February 1, 2010, except for the requirement to disclose purchases, sales, issuances, and settlements related to Level 3 measurements, which were effective for interim and annual reporting periods beginning after December 15, 2009.we adopted February 1, 2011. This adoption had no impact on our financial condition, results of operations or cash flows. We have not adopted
In May 2011, the disclosures about purchases, sales, issuances and settlements in the roll forward of activity in Level 3FASB issued an additional update that amended fair value measurements as these disclosures are effectiveand disclosures. This amendment provides that the inputs and measures used to value assets that fall within Level 3 of the valuation hierarchy be quantitatively presented. Application is required prospectively for fiscal yearsinterim and annual periods beginning after December 15, 2010 and interim periods within those2011. We are required to adopt this update in the first quarter of fiscal years. We do2013. Other than the change in presentation, this accounting standards update will not expect this adoption to have an impact on our financial condition,position and results of operationsoperations.
In June 2011, the FASB issued an accounting standards update that requires an increase in the prominence of other comprehensive income and its components within the financial statements. The update provides entities the option to present the components of net income and other comprehensive income in either one or cash flows.two consecutive financial statements. It also eliminates the option to present other comprehensive income in the statements of shareholders’ equity. Application is to be applied retrospectively and is effective for interim and annual periods beginning after December 15, 2011. We are required to adopt this update in the first quarter of fiscal 2013. Other than the change in presentation, this accounting standards update will not have an impact on our financial position and results of operations.
Seasonality and Quarterly Results
Our business experiences seasonal fluctuations in net sales and operating income, with a more significant portion typically realized from August to December 31stof each year (the back-to-school and holiday periods). The following tables set forth our net sales, gross profit, net income and net income per common share (basic and diluted) for each quarter during the last two fiscal years and the amount of such net sales and net income, respectively, as a percentage of annual net sales and annual net income. The unaudited financial information has been prepared in accordance with accounting principles generally accepted in the United States for interim financial information and with the instructions to Form 10-Q and Article 10 of Regulation S-X. In the opinion of management, all adjustments (consisting of normal recurring accruals) considered necessary for a fair presentation have been included.
| Fiscal 2011 Quarter Ended (1) | Fiscal 2012 Quarter Ended (1) | |||||||||||||||||||||||||||||||
| April 30, 2010 | July 31, 2010 | Oct. 31, 2010 | Jan. 31, 2011 | April 30, 2011 | July 31, 2011 | Oct. 31, 2011 | Jan. 31, 2012 | |||||||||||||||||||||||||
| (dollars in thousands, except per share data) | (dollars in thousands, except per share data) | |||||||||||||||||||||||||||||||
Net sales | $ | 479,961 | $ | 552,159 | $ | 573,592 | $ | 668,390 | $ | 524,019 | $ | 609,181 | $ | 609,953 | $ | 730,648 | ||||||||||||||||
Gross profit | 200,786 | 234,781 | 235,993 | 265,060 | 193,365 | 231,090 | 216,103 | 219,978 | ||||||||||||||||||||||||
Net income | 52,957 | 71,657 | 73,106 | 75,238 | 38,624 | 56,693 | 50,679 | 39,255 | ||||||||||||||||||||||||
Net income per common share—basic | 0.31 | 0.42 | 0.44 | 0.46 | 0.24 | 0.36 | 0.34 | 0.27 | ||||||||||||||||||||||||
Net income per common share—diluted | 0.31 | 0.42 | 0.43 | 0.45 | 0.23 | 0.35 | 0.33 | 0.27 | ||||||||||||||||||||||||
As a Percentage of Fiscal Year: | ||||||||||||||||||||||||||||||||
Net sales | 21 | % | 24 | % | 25 | % | 30 | % | 21 | % | 25 | % | 25 | % | 29 | % | ||||||||||||||||
Net income | 19 | % | 26 | % | 27 | % | 28 | % | 21 | % | 31 | % | 27 | % | 21 | % | ||||||||||||||||
| Fiscal 2010 Quarter Ended (1) | Fiscal 2011 Quarter Ended (1) | |||||||||||||||||||||||||||||||
| April 30, 2009 | July 31, 2009 | Oct. 31, 2009 | Jan. 31, 2010 | April 30, 2010 | July 31, 2010 | Oct. 31, 2010 | Jan. 31, 2011 | |||||||||||||||||||||||||
| (dollars in thousands, except per share data) | (dollars in thousands, except per share data) | |||||||||||||||||||||||||||||||
Net sales | $ | 384,796 | $ | 458,626 | $ | 505,900 | $ | 588,493 | $ | 479,961 | $ | 552,159 | $ | 573,592 | $ | 668,390 | ||||||||||||||||
Gross profit | 143,305 | 187,091 | 210,088 | 245,661 | 200,786 | 234,781 | 235,993 | 265,060 | ||||||||||||||||||||||||
Net income | 30,805 | 49,021 | 62,392 | 77,675 | 52,957 | 71,657 | 73,106 | 75,238 | ||||||||||||||||||||||||
Net income per common share—basic | 0.18 | 0.29 | 0.37 | 0.46 | 0.31 | 0.42 | 0.44 | 0.46 | ||||||||||||||||||||||||
Net income per common share—diluted | 0.18 | 0.29 | 0.36 | 0.45 | 0.31 | 0.42 | 0.43 | 0.45 | ||||||||||||||||||||||||
As a Percentage of Fiscal Year: | ||||||||||||||||||||||||||||||||
Net sales | 20 | % | 24 | % | 26 | % | 30 | % | 21 | % | 24 | % | 25 | % | 30 | % | ||||||||||||||||
Net income | 14 | % | 22 | % | 29 | % | 35 | % | 19 | % | 26 | % | 27 | % | 28 | % | ||||||||||||||||
| (1) | The sum of the quarterly per share amounts may not equal per share amounts reported for year-to-date periods. This is due to changes in the number of weighted average shares outstanding and the effects of rounding for each period. |
Item 7A. Quantitative and Qualitative Disclosures About Market Risk
The Company isWe are exposed to the following types of market risks—fluctuations in the purchase price of merchandise, as well as other goods and services; the value of foreign currencies in relation to the U.S. dollar; and changes in interest rates. Due to the Company’sour inventory turnover rate and itsour historical ability to pass through the impact of any generalized changes in itsour cost of goods to itsour customers through pricing adjustments, commodity and other product risks are not expected to be material. The Company purchases the majorityWe purchase substantially all of itsour merchandise in U.S. dollars, including a portion of the goods for itsour stores located in Canada and Europe.
The Company’sOur exposure to market risk for changes in interest rates relates to itsour cash, cash equivalents and marketable securities. As of January 31, 2012 and 2011, the Company’sour cash, cash equivalents and marketable securities consisted primarily of funds invested in money market accounts, tax-exemptcorporate bonds rated “A” or better, municipal and pre-refunded municipal bonds rated “A” or better, corporate bonds rated “A” or better, federal government agencies, pre-refunded tax-exempt municipal bonds rated “A” or better, treasury bills, auction rate securities (“ARS”) rated A“A” or better, which bear interest at a variable raterates, treasury bills, certificates of deposit, federal government agencies, and FDIC insured corporate bonds. Wecommercial paper. Due to the short average maturity and conservative nature of our investment portfolio, we believe a 100 basis point change in interest rates would not have a material effect on the consolidated financial statements. This is due to the conservative nature of the Company’s investment portfolio and the fact that all securities, with the exception of ARS, mature in three years or less.Condensed Consolidated Financial Statements. As the interest rates on a material portion of our cash, cash equivalents and marketable securities are variable, a change in interest rates earned on the cash, cash equivalents and marketable securities would impact interest income along with cash flows, but would normally not impact the fair market value of the related underlying instruments.
Approximately 3.6% of our cash, cash equivalents and marketable securitiesOur ARS are invested in “A” or better rated ARSissuances that represent interests in municipal and student loan related collateralized debt obligations, all of which are guaranteed by either government agencies and/or insured by private insurance agencies up to 97% or greater of par value. The Company’sOur ARS had an amortized costa par value and fair value of $23.0 million and $20.2 million as of January 31, 2012 and $33.3 million and a fair value of $29.5 million as of January 31, 2011. As of January 31, 2011,2012, all of the ARS we held by the Company failed to liquidate at auction due to lack of market demand. As of January 31, 2010, the Company had $37.6 million of amortized cost and $33.5 million of fair value ARS. Liquidity for these ARS is typically provided by an auction process that resets the applicable interest rate at pre-determined intervals, usually 7, 28, 35 or 90 days. The principal associated with these failed auctions will not be available until either a successful auction occurs, the bond is called by the issuer, a buyer is found from outside the auction process, or the debt obligation reaches its maturity. Based on review of credit quality, collateralization, final stated maturity, estimates of the probability of being called or becoming liquid prior to final maturity, redemptions of similar ARS, previous market activity for the same investment security, impact due to extended periods of maximum auction rates and valuation models, we have recorded $3.8 million and $4.1$2.8 million of temporary impairment charges on our ARS as of January 31, 20112012 and $3.8 million as of January 31, 2010, respectively.2011. To date, we have collected all interest receivablepayable on outstanding ARS when due and expect to continue to do so in the future. We do not have the intent to sell the underlying securities prior to their recovery and we believe that it is not likely that we will be required to sell the underlying securities prior to their anticipated recovery of full amortized cost. As a result of the current illiquidity, the Company haswe have classified all ARS as non-current assets under marketable securities. The Company continuesWe continue to monitor the market for ARS and consider the impact, if any, on the fair value of itsour investments.
Item 8. Financial Statements and Supplementary Data
The information required by this Item is incorporated by reference from Item 7: Management’s Discussion and Analysis of Financial Condition and Results of Operations—Seasonality and Quarterly Results of Operations and from pages F-1 through F-31.F-33.
Item 9. Changes in and Disagreements with Accountants on Accounting and Financial Disclosure
None
Item 9A. Controls and Procedures
Evaluation of Disclosure Controls and Procedures
Management, including our Chief Executive Officer and Chief Financial Officer, evaluated the effectiveness of our disclosure controls and procedures as defined in Rules 13a-15(e) and 15d-15(e) of the Securities Exchange Act of 1934, as amended. Based on this review, the Chief Executive Officer and Chief Financial Officer concluded that the Company’s disclosure controls and procedures were effective as of January 31, 2011.2012.
Management’s Annual Report on Internal Controls Over Financial Reporting
Our management is responsible for establishing and maintaining adequate internal control over financial reporting, as defined in the Securities Exchange Act Rule 13a-15(f). Our system of internal control is designed to provide reasonable, not absolute, assurance regarding the reliability of financial reporting and the preparation of financial statements for external purposes in accordance with generally accepted accounting principles.
Under the supervision and with the participation of our management, including our Chief Executive Officer and Chief Financial Officer, we conducted an evaluation of the design and effectiveness of our internal control over financial reporting based on theInternal Control—Integrated Framework issued by the Committee of Sponsoring Organizations of the Treadway Commission. Based on this evaluation, our management concluded that the Company’s internal control over financial reporting was effective as of January 31, 2011.2012.
The effectiveness of internal control over financial reporting as of January 31, 20112012 was audited by Deloitte & Touche LLP, an independent registered public accounting firm, as stated in their report that is included on page 4239 of this annual report on Form 10-K.
Changes in Internal Control Over Financial Reporting
There were no changes in the Company’s internal control over financial reporting during the Company’s fourth quarter of fiscal 20112012 that have materially affected, or are reasonably likely to materially affect, the Company’s internal control over financial reporting.
None
REPORT OF INDEPENDENT REGISTERED PUBLIC ACCOUNTING FIRM
To the Board of Directors and Shareholders of
Urban Outfitters, Inc.
Philadelphia, Pennsylvania
We have audited the internal control over financial reporting of Urban Outfitters, Inc. and subsidiaries (the “Company”) as of January 31, 2011,2012, based on criteria established in Internal Control—Integrated Framework issued by the Committee of Sponsoring Organizations of the Treadway Commission. The Company’s management is responsible for maintaining effective internal control over financial reporting and for its assessment of the effectiveness of internal control over financial reporting, included in the accompanying Management’s Annual Report on Internal Controls over Financial Reporting. Our responsibility is to express an opinion on the Company’s internal control over financial reporting based on our audit.
We conducted our audit in accordance with the standards of the Public Company Accounting Oversight Board (United States). Those standards require that we plan and perform the audit to obtain reasonable assurance about whether effective internal control over financial reporting was maintained in all material respects. Our audit included obtaining an understanding of internal control over financial reporting, assessing the risk that a material weakness exists, testing and evaluating the design and operating effectiveness of internal control based on the assessed risk, and performing such other procedures as we considered necessary in the circumstances. We believe that our audit provides a reasonable basis for our opinion.
A company’s internal control over financial reporting is a process designed by, or under the supervision of, the company’s principal executive and principal financial officers, or persons performing similar functions, and effected by the company’s board of directors, management, and other personnel to provide reasonable assurance regarding the reliability of financial reporting and the preparation of financial statements for external purposes in accordance with generally accepted accounting principles. A company’s internal control over financial reporting includes those policies and procedures that (1) pertain to the maintenance of records that, in reasonable detail, accurately and fairly reflect the transactions and dispositions of the assets of the company; (2) provide reasonable assurance that transactions are recorded as necessary to permit preparation of financial statements in accordance with generally accepted accounting principles, and that receipts and expenditures of the company are being made only in accordance with authorizations of management and directors of the company; and (3) provide reasonable assurance regarding prevention or timely detection of unauthorized acquisition, use, or disposition of the company’s assets that could have a material effect on the financial statements.
Because of the inherent limitations of internal control over financial reporting, including the possibility of collusion or improper management override of controls, material misstatements due to error or fraud may not be prevented or detected on a timely basis. Also, projections of any evaluation of the effectiveness of the internal control over financial reporting to future periods are subject to the risk that the controls may become inadequate because of changes in conditions, or that the degree of compliance with the policies or procedures may deteriorate.
In our opinion, the Company maintained, in all material respects, effective internal control over financial reporting as of January 31, 2011,2012, based on the criteria established in Internal Control—Integrated Framework issued by the Committee of Sponsoring Organizations of the Treadway Commission.
We have also audited, in accordance with the standards of the Public Company Accounting Oversight Board (United States), the consolidated balance sheet of the Company as of January 31, 2011,2012, and the related consolidated statements of income, shareholders’ equity, and cash flows for the year then ended and our report dated April 1, 20112, 2012 expressed an unqualified opinion on those consolidated financial statements.
/s/ DELOITTE & TOUCHE LLP
Philadelphia, Pennsylvania
April 1, 20112, 2012
PART III
Item 10. Directors, Executive Officers and Corporate Governance
The following table sets forth the name, age and position of each of our executive officers and directors:
Name | Age | Position | ||||
Richard A. Hayne | Chief Executive Officer, President and Chairman of the Board | |||||
| ||||||
Eric F. Artz | Chief Financial Officer | |||||
Glen A. Bodzy | General Counsel and Secretary | |||||
| ||||||
David W. McCreight | 48 | CEO of Anthropologie Group | ||||
Wendy B. McDevitt | ||||||
| ||||||
Freeman M. Zausner | Chief | |||||
Margaret Hayne | President, Free People Brand | |||||
| Chief Accounting Officer | |||||
Scott A. Belair (2)(3) | Director | |||||
Harry S. Cherken, Jr. (1) | Director | |||||
Joel S. Lawson III (2)(3) | Director | |||||
Robert H. Strouse (1) | Director | |||||
Edward N. Antoian (2) | 56 | Director | ||||
| (1) | Member of the Nominating Committee. |
| (2) | Member of the Audit Committee. |
| (3) | Member of the Compensation Committee. |
Mr. Hayne president and director since 1976, co-founded Urban Outfitters in 1970 and has been Chairman of the Board of Directors and President since the Company’s incorporation in 1976. Mr. Hayne served as the Company’s principal executive officer until 2007 and again, beginning in January 2012. Margaret Hayne, President of Free People, is Mr. Hayne’s spouse. Mr. Hayne’s long tenure leading the Company as Chairman of the Board and President, in addition to his tenure as Chief Executive Officer until May 2007, makesprincipal executive officer, and his exceptional leadership skills, make him uniquely qualified to serve as a director. Mr. Hayne brings to the Board his leadership skills and Company and industry expertise.
Mr. Senk, a director since 2004, has served as Chief Executive Officer since May 2007, and prior to that, as President of Anthropologie, Inc. since April 1994. Mr. Senk was named Executive Vice President of Urban Outfitters, Inc. in May 2002, and assumed responsibility for the Company’s Free People brand in May 2003. Prior to joining the Company, Mr. Senk was Senior Vice President and General Merchandise Manager of Williams-Sonoma, Inc. and Chief Executive of the Habitat International Merchandise and Marketing Group in London, England. Mr. Senk began his retail career at Bloomingdale’s, where he served in a variety of roles including Managing Director of Bloomingdale’s By Mail. Mr. Senk serves as a member of the Boards of Directors for Tory Burch, Inc. and David Yurman, Inc. and previously served as a member of the Board of Directors for Bare Escentuals, Inc. Mr. Senk also serves on the board of a nonprofit organization. As the Company’s Chief Executive Officer, Mr. Senk brings his intimate knowledge of the Company’s business, operations, and retail industry to the Board of Directors. He also holds an MBA degree.
Mr. Artz was appointed as Chief Financial Officer of the Company on February 1, 2010. He previously served as Chief Financial Officer of VF Contemporary Brands for two years at VF Corporation. Mr. Artz also served as Chief Operating Officer and Chief Financial Officer of Seven For All Mankind, LLC from November 2006 through August 2007. Mr. Artz had been Vice President of Operations for VF Outdoor from June 2003 through October 2006, and since joining VF Corporation in 1992 served in several financial and operational positions for its divisions in the United States, Europe and Japan. Prior to joining VF Corporation, Mr. Artz, a Certified Public Accountant, worked for Ernst & Young in their audit department. On March 19, 2012, Mr. Artz resigned as Chief Financial Officer of the Company, effective April 3, 2012.
Mr. Bodzy joined Urban Outfitters as its General Counsel in December 1997 and was appointed Secretary in February 1999. Prior to joining the Company, Mr. Bodzy was Vice President, General Counsel and Secretary of Service Merchandise Company, Inc. where hashe was responsible for legal affairs, the store development program and various other corporate areas.
Mr. MurrayMarlow served as the Global President of Urban Outfitters from July 2001 through May 2010. He rejoined the company in February 2012 as the Chief Executive Officer of the Urban
Outfitters Brand. Prior to joining the company in 2001 Mr. Marlow served as Executive Vice President of Merchandising, Product Development and marketing at Chico’s FAS, Inc. Previously Mr. Marlow was President of Henri Bendel, a division of Limited Brands and Senior Vice President/General Merchandise Manager of Marshall Fields. Mr. Marlow began his retail career at Neiman Marcus, where he served in a variety of management roles.
Mr. McCreight, joined the Company in November 2011 as Global PresidentChief Executive Officer of the Urban Outfitters Brand, effective April 12, 2010.Anthropologie Group. Previously, Mr. Murray, joined the Company from VF Corporation, where heMcCreight served as President VF Action Sports Coalition since February 2009, overseeing the Vansof Under Armour from 2008 until 2010 and Reef brands. Prior to assuming that role, Mr. Murray was President of VF’s Vans brandLands’ End from 20042005 to 2009.2008. Mr. Murray had beenMcCreight also held the Chief Marketing Officer for Vans, Inc.position of Senior Vice President of Merchandising at Lands’ End from 20022003 to 20042005 and Senior Vice President Internationaland General Merchandising Manager of Disney Stores from 19982001 to 2002. Prior to joining Vans, Inc.,2003. Mr. Murray held various leadershipMcCreight had been President of Smith and Hawken and began his career with roles inwithin the U.S.merchant organizations at Saks, The May Company and abroad for Reebok International, LTD from 1991 to 1998. Mr. Murray holds a B.A. in Business Studies from Middlesex University.The Limited.
Ms. McDevitt, President of the Terrain Brand and former Global Co-President of the Anthropologie Brand, joined Urban Outfitters in November 1992 and has served within the URBN brands including Director of Administration for URBN, Director of Operations/Stores for Urban Outfitters Europe, Executive Director of Stores and Operations for Anthropologie and Chief Operating Officer for Anthropologie. Prior to joining the Company, Ms. McDevitt worked for Liz Claiborne Inc.
Ms. Wurtzburger, Global Co-President of the Anthropologie Brand, joined Urban Outfitters in 1998 and has served in a senior merchandising role at the Anthropologie brand, including as the Chief Merchandise Officer. Prior to joining the company, Ms. Wurtzburger held buying and merchandising roles with a variety of department and specialty stores including Abraham & Straus, Macy’s West and Mimi Maternity.
Mr. Zausner rejoined the Company in February 2003 as a consultant and in July 2003 became its Chief Administrative Officer. Mr. Zausner originally joined the Company in 1980 and became its Director of Inventory Management in 1988 and its Secretary in 1990. Mr. Zausner retired from the Company in 1996.
Margaret Hayne joined Urban Outfitters in August 1982. She is a 3536 year veteran of the retail and wholesale industry and has served as President of the Free People Brand since March 2007. Margaret Hayne is Richard A. Hayne’s spouse.
Mr. Conforti joined Urban Outfitters in March 2007 as Director of Finance and SEC Reporting and was subsequently promoted to Controller and then Chief Accounting Officer, his current role. Prior to joining the Company, Mr. Conforti, a Certified Public Accountant, worked for AlliedBarton
Security Services, LLC for five years serving as Controller for three years. Mr. Conforti began his career at KPMG in 1998 where he held various audit roles. On March 21, 2012, Mr. Conforti was appointed Chief Financial Officer of the Company, effective April 3, 2012.
Mr. Belair co-founded Urban Outfitters in 1970. He has served as Principal of The ZAC Group, a financial advisory firm, during the last eighteen years. Previously, he was a managing director of Drexel Burnham Lambert Incorporated. Mr. Belair is also a director of Hudson City Bancorp, Inc. (HCBK), and Hudson City Savings Bank, the nation’s largest S&L institution by market capitalization.Bank. He holds an MBA degree and has financial and investment expertise, including financial reporting expertise, as a result of his significant experience as a CPA, financial advisor, and former chief financial officer in the financial services industry, including financial reporting expertise.industry. As a co-founder of the Company, Mr. Belair has been involved with the Company from its inception, and accordingly has a comprehensive understanding of and perspective on its overall business and strategic direction.
Mr. Cherken has been a partner in the law firm of Drinker Biddle & Reath LLP in Philadelphia, Pennsylvania since 1984, is a former managing partner of that firm, and until January 2007has served as Co-Chair of its Real Estate Group. As a real estate lawyer with over 30 years experience representing public and private companies in the acquisition, construction, development, financing, leasing, management, consolidation, and disposition of commercial real estate, he has extensive experience with real estate
transactions, including negotiating real estate transactions and leases on behalf of the Company. Mr. Cherken also holds a Masters in Liberal Arts degree and serves as a trustee of various not for profit institutions.
Mr. Lawson is an independent consultant and private investor. From November 2001 until November 2003, he also served as Executive Director of M&A International Inc., a global organization of merger and acquisition advisory firms. From 1980 until November 2001, Mr. Lawson was Chief Executive Officer of Howard, Lawson & Co., an investment banking and corporate finance firm. Howard, Lawson & Co. became an indirect, wholly-owned subsidiary of FleetBoston Financial Corporation in March 2001. As the former Chief Executive Officer of an investment banking and corporate finance firm, Mr. Lawson has extensive experience in financial and investment matters, including financial reporting expertise. In addition, as the former Executive Director of a global organization of merger and acquisition advisory firms, he has specialized knowledge regarding mergers and acquisitions. He also holds an MBA degree and serves as a director of a non-profit entity.
Mr. Strouse serves as President of Wind River Holdings, L.P. Wind River, which oversees a diversified group of privately owned industrial and service businesses. Through his experience with this private investment company, Mr. Strouse brings to the Board of Directors experience in strategic planning, budgeting, talent recruitment and development, risk management, and corporate development activities. Mr. Strouse is also a former corporate lawyer whose practice, prior to 1998 when he joined Wind River, focused on mergers and acquisitions, corporate governance and SEC reporting.
Mr. Antoian is a Managing Partner and Senior Portfolio Manager at Chartwell Investment Partners, an investment advisory firm, where he has worked since its inception in 1997. He is also a partner and Chief Investment Officer for Zeke Capital Advisors, a financial advisory firm. In addition, Mr. Antoian is the General Partner of Zeke, L.P., a privately offered long-short equity hedge fund. From 1984 until 1997, Mr. Antoian was the Senior Portfolio Manager of Delaware Management Co. Prior to that, Mr. Antoian worked at E.F. Hutton in Institutional Sales, and as a certified public accountant for Price Waterhouse. Mr. Antoian holds an MBA in Finance and has financial and investment experience as a result of his experience as a CPA, financial advisor and portfolio manager. Mr. Antoian also serves as a director of a non-profit entity.
Code of Conduct and Ethics
We have had a written code of conduct for a number of years. Our Code of Conduct and Ethics applies to our Directors and employees, including our President, Chief Executive Officer, Chief Financial Officer and Principal Accounting Officer. The Code includes guidelines relating to compliance with laws, the ethical handling of actual or potential conflicts of interest, the use of corporate opportunities, protection and use of our confidential information, accepting gifts and
business courtesies, compliance with anti-bribery and illegal payment laws, accurate financial reporting, and procedures for promoting compliance with, and reporting violations of, the Code. The Code of Conduct and Ethics is available on our website atwww.urbanoutfittersinc.com. We intend to post any amendments to our Code of Conduct and Ethics on our website and also to disclose any waivers (to the extent applicable to the Company’s President, Chief Executive Officer, Chief Financial Officer or Principal Accounting Officer) on a Form 8-K within the prescribed time period.our website.
Section 16(a) Beneficial Ownership Reporting Compliance
Information required by this item is incorporated herein by reference from the Company’s Proxy Statement for the 20112012 Annual Meeting of Shareholders.
Other Information
Other information required by Item 10 relating to the Company’s directors is incorporated herein by reference from the Company’s Proxy Statement for the 20112012 Annual Meeting of Shareholders.
Item 11. Executive Compensation
Information required by this item is incorporated herein by reference from the Company’s Proxy Statement for the 20112012 Annual Meeting of Shareholders.
Item 12. Security Ownership of Certain Beneficial Owners and Management and Related Shareholder Matters
Information required by this item is incorporated herein by reference from the Company’s Proxy Statement for the 20112012 Annual Meeting of Shareholders.
Item 13. Certain Relationships and Related Transactions, and Director Independence
Information required by this item is incorporated herein by reference from the Company’s Proxy Statement for the 20112012 Annual Meeting of Shareholders.
Item 14. Principal Accountant Fees and Services
Information required by this item is incorporated herein by reference from the Company’s Proxy Statement for the 20112012 Annual Meeting of Shareholders.
PART IV
Item 15. Exhibits and Financial Statement Schedules
(a) The following documents are filed as part of this report:
(1) Financial Statements
Consolidated Financial Statements filed herewith are listed in the accompanying index on page F-1.
(2) Financial Statement Schedule
None
All other schedules are omitted because they are not applicable or not required, or because the required information is included in the consolidated financial statements or notes thereto.
(3) Exhibits
The Exhibits listed below are filed as part of, or incorporated by reference into, this report. The file number for each exhibit incorporated by reference is 000-22754 unless otherwise provided.
Exhibit Number | Description | |
| 3.1 | Amended and Restated Articles of Incorporation incorporated by reference to Exhibit 3.1 of the Company’s Quarterly Report on Form 10-Q filed on September 9, 2004. | |
| 3.2 | Amendment No. 1 to Amended and Restated Articles of Incorporation incorporated by reference to Exhibit 3.2 of the Company’s Quarterly Report on Form 10-Q filed on September 9, 2004. | |
| 3.3 | Amended and Restated Bylaws are incorporated by reference to Exhibit 3.1 of the Company’s Current Report on Form 8-K filed on March 2, 2009. | |
| Amended and Restated Credit Agreement by and among Urban Outfitters, Inc. and Wachovia Bank, National Association is incorporated by reference to Exhibit 10.1 of the Company’s Quarterly Report on Form 10-Q filed on June 8, 2010. | ||
| 10.2 | First Amendment to Amended and Restated Credit Agreement by and among Urban Outfitters, Inc. and Wachovia Bank, National Association is incorporated by reference to Exhibit 10.2 of the Company’s Annual Report on Form 10-K filed on March 30, 2007. | |
| Second Amendment to Amended and Restated Credit Agreement by and among Urban Outfitters, Inc. and Wachovia Bank, National Association is incorporated by reference to Exhibit 10.2 of the Company’s Quarterly Report on Form 10-Q filed on June 8, 2010. | ||
| Third Amendment to the Amended and Restated Credit Agreement by and among Urban Outfitters, Inc. and Wachovia Bank, National Association is incorporated by reference to Exhibit 10.3 of the Company’s Quarterly Report on Form 10-Q filed on June 8, 2010. | ||
| 10.5 | Fourth Amendment to the Amended and Restated Credit Agreement, dated April 25, 2011, by and among Urban Outfitters, Inc. and Wells Fargo Bank, National Association (successor by merger to Wachovia Bank, National Association) is incorporated by reference to Exhibit 10.1 of the Company’s Quarterly Report on Form 10-Q filed on June 8, 2011. | |
Exhibit Number | Description | |
| 10.6 | Fifth Amended and Restated Note, dated May 27, 2010, by and among Urban Outfitters, Inc. and Wells Fargo Bank, National Association is incorporated by reference to Exhibit 10.1 of the Company’s Quarterly Report on Form 10-Q filed on September 8, 2010. | |
|
| |
| Letter Agreement Extension of Amended and Restated Credit Agreement by and among Urban Outfitters, Inc. and Wachovia Bank, National Association as amended, dated December 1, 2010 is incorporated by reference to Exhibit 10.3 of the Company’s Quarterly Report on Form 10-Q filed on December 10, 2010. | ||
| Letter Agreement Extension of Amended and Restated Credit Agreement by and among Urban Outfitters, Inc. and Wells Fargo Bank, N.A. as amended, dated March 9, 2011 is incorporated by reference to Exhibit 10.7 of the Company’s Annual Report on Form 10-K for the fiscal year ended January 31, 2011. | ||
| Amendment No. 5 to Amended and Restated Credit Agreement dated October 31, 2011 is incorporated by reference to Exhibit 10.1 of the Company’s current report on Form 8-K filed on November 4, 2011. | ||
| 10.10+ | Urban Outfitters 2004 Stock Incentive Plan is incorporated by reference to AppendixBof the Company’s Definitive Proxy Statement on Schedule 14A filed on April 26, 2004 and Amendment No. 1 to the Urban Outfitters 2004 Stock Incentive Plan is incorporated by reference to AppendixA of the Company’s Definitive Proxy Statement on Schedule 14A filed on April 25, 2005. | |
| 1997 Stock Option Plan is incorporated by reference to Exhibit 10.6 of the Company’s Annual Report on Form 10-K for fiscal year ended January 31, 1997. | ||
| Urban Outfitters 401(k) Savings Plan is incorporated by reference to Exhibit 10.7 of the Company’s Registration Statement on Form S-8 (file no. 333-84333) filed on August 3, 1999. | ||
| 2000 Stock Incentive Plan is incorporated by reference to AppendixA of the Company’s Definitive Proxy Statement on Schedule 14A filed on April 17, 2000. | ||
| 2008 Stock Incentive Plan is incorporated by reference to AppendixA of the Company’s Definitive Proxy Statement on Schedule 14A filed on March 28, 2008 | ||
| Urban Outfitters Executive Incentive Plan, as amended and restated effective February 1, 2010, is incorporated by reference to AppendixAof the Company’s Definitive Proxy Statement on Schedule 14A filed on April 1, 2010. | ||
| Form of 2004 Plan—Non-Qualified Stock Option Agreement is incorporated by reference to Exhibit 99.1 of the Company’s Current Report on Form 8-K filed on June 18, 2009. | ||
| Form of 2004 Plan—Non-Employee Director Non-Qualified Stock Option Agreement is incorporated by reference to Exhibit 99.2 of the Company’s Current Report on Form 8-K filed on June 18, 2009. | ||
| Form of 2004 Plan—Incentive Stock Option Agreement is incorporated by reference to Exhibit 99.3 of the Company’s Current Report on Form 8-K filed on June 18, 2009. | ||
| Form of 2004—Stock Appreciation Right Agreement is incorporated by reference to Exhibit 99.2 of the Company’s Current Report on Form 8-K filed on September 7, 2010. | ||
| Form of 2004 Plan—Restricted Stock Unit Agreement is incorporated by reference to Exhibit 10.1 of the Company’s Form 10-Q filed on December 10, 2010. | ||
Exhibit Number | Description | |
| Form of 2008 Plan—Non-Qualified Stock Option Agreement is incorporated by reference to Exhibit 99.4 of the Company’s Current Report on Form 8-K filed on June 18, 2009. | ||
| Form of 2008 Plan—Non-Employee Director Non-Qualified Stock Option Agreement is incorporated by reference to Exhibit 99.5 of the Company’s Current Report on Form 8-K filed on June 18, 2009. | ||
|
| |
| Form of 2008 Plan—Incentive Stock Option Agreement is incorporated by reference to Exhibit 99.6 of the Company’s Current Report on Form 8-K filed on June 18, 2009. | ||
| Form of 2008 Plan—Performance Stock Unit Agreement is incorporated by reference to Exhibit 99.1 of the Company’s Current Report on Form 8-K filed on September 7, 2010. | ||
| Form of 2008 Plan—Restricted Stock Unit Agreement is incorporated by reference to Exhibit 10.2 of the Company’s Form 10-Q filed on December 10, 2010. | ||
| 10.26+ | 2008 Plan—Form of Performance/Restricted Stock Unit Agreement is incorporated by reference to Exhibit 10.2 to the Company’s Quarterly Report on Form 10-Q filed on December 12, 2011. | |
| 10.27+ | 2008 Plan—Form of Stock Appreciation Right Agreement is incorporated by reference to Exhibit 10.2 to the Company’s Quarterly Report on Form 10-Q filed on December 12, 2011. | |
| 21.1* | List of Subsidiaries. | |
| 23.1* | Consent of Deloitte & Touche LLP. | |
| 31.1* | Rule 13a-14(a)/15d-14(a) Certification of the Company’s Principal Executive Officer. | |
| 31.2* | Rule 13a-14(a)/15d-14(a) Certification of the Company’s Principal Financial Officer. | |
| 32.1** | Section 1350 Certification of the Company’s Principal Executive Officer. | |
| 32.2** | Section 1350 Certification of the Company’s Principal Financial Officer. | |
| 101.INS** | XBRL Instance Document | |
| 101.SCH** | XBRL Taxonomy Extension Schema | |
| 101.CAL** | XBRL Taxonomy Extension Calculation Linkbase | |
| 101.LAB** | XBRL Taxonomy Extension Label Linkbase | |
| 101.PRE** | XBRL Taxonomy Extension Presentation Linkbase | |
| 101.DEF** | XBRL Taxonomy Extension Definition Linkbase | |
| * | Filed herewith |
| ** | Furnished herewith |
| + | Compensatory plan |
Pursuant to the requirements of Section 13 or 15(d) of the Securities Exchange Act of 1934, the registrant has duly caused this report to be signed on its behalf by the undersigned, thereunto duly authorized.
| URBAN OUTFITTERS, INC. | ||||
| April | By: | /s/ | ||
Chief Executive Officer (Principal Executive Officer) | ||||
Pursuant to the requirements of the Securities Exchange Act of 1934, this report has been signed below by the following persons on behalf of the registrant and in the capacities and on the dates indicated.
Signature | Title | Date | ||
/s/ RICHARD A. HAYNE Richard A. Hayne | Chief Executive Officer, President, Chairman of the Board | April | ||
|
| |||
/s/ ERIC F. ARTZ Eric F. Artz (Principal Financial Officer) | Chief Financial Officer | April | ||
/s/ F
(Principal Accounting Officer) | Chief Accounting Officer | April | ||
/s/ SCOTT A. BELAIR Scott A. Belair | Director | April | ||
/s/ HARRY S. CHERKEN, JR. Harry S. Cherken, Jr. | Director | April | ||
/s/ JOEL S. LAWSON III Joel S. Lawson III | Director | April | ||
/s/ ROBERT H. STROUSE Robert H. Strouse | Director | April | ||
/s/ EDWARD N. ANTOIAN Edward N. Antoian | Director | April 2, 2012 | ||
INDEX TO CONSOLIDATED FINANCIAL STATEMENTS
| Page | ||
Report of Independent Registered Public Accounting Firm—Deloitte & Touche LLP | F-2 | |
Consolidated Balance Sheets as of January 31, | F-3 | |
| F-4 | ||
| F-5 | ||
| F-6 | ||
| F-7 | ||
REPORT OF INDEPENDENT REGISTERED PUBLIC ACCOUNTING FIRM
To the Board of Directors and Shareholders of
Urban Outfitters, Inc.
Philadelphia, Pennsylvania
We have audited the accompanying consolidated balance sheets of Urban Outfitters, Inc. and subsidiaries (the “Company”) as of January 31, 20112012 and 2010,2011, and the related consolidated statements of income, shareholders’ equity, and cash flows for each of the three years in the period ended January 31, 2011.2012. These financial statements are the responsibility of the Company’s management. Our responsibility is to express an opinion on these financial statements based on our audits.
We conducted our audits in accordance with the standards of the Public Company Accounting Oversight Board (United States). Those standards require that we plan and perform the audit to obtain reasonable assurance about whether the financial statements are free of material misstatement. An audit includes examining, on a test basis, evidence supporting the amounts and disclosures in the financial statements. An audit also includes assessing the accounting principles used and significant estimates made by management, as well as evaluating the overall financial statement presentation. We believe that our audits provide a reasonable basis for our opinion.
In our opinion, such consolidated financial statements present fairly, in all material respects, the financial position of Urban Outfitters, Inc. and subsidiaries as of January 31, 20112012 and 2010,2011, and the results of their operations and their cash flows for each of the three years in the period ended January 31, 2011,2012, in conformity with accounting principles generally accepted in the United States of America.
We have also audited, in accordance with the standards of the Public Company Accounting Oversight Board (United States), the Company’s internal control over financial reporting as of January 31, 2011,2012, based on the criteria established in Internal Control—Integrated Framework issued by the Committee of Sponsoring Organizations of the Treadway Commission and our report dated April 1, 20112, 2012 expressed an unqualified opinion on the Company’s internal control over financial reporting.
/s/ DELOITTE & TOUCHE LLP
Philadelphia, Pennsylvania
April 1, 20112, 2012
Consolidated Balance Sheets
(in thousands, except share and per share data)
| January 31, | January 31, | |||||||||||||||
| 2011 | 2010 | 2012 | 2011 | |||||||||||||
| ASSETS | ||||||||||||||||
Current assets: | ||||||||||||||||
Cash and cash equivalents | $ | 340,257 | $ | 159,024 | $ | 145,273 | $ | 340,257 | ||||||||
Marketable securities | 116,420 | 342,512 | 89,854 | 116,420 | ||||||||||||
Accounts receivable, net of allowance for doubtful accounts of $1,015 and $1,284, respectively | 36,502 | 38,405 | ||||||||||||||
Accounts receivable, net of allowance for doubtful accounts of $1,614 and $1,015, respectively | 36,673 | 36,502 | ||||||||||||||
Inventories | 229,561 | 186,130 | 250,073 | 229,561 | ||||||||||||
Prepaid expenses and other current assets | 66,886 | 67,865 | 69,876 | 66,886 | ||||||||||||
Deferred taxes | 14,351 | 12,277 | 5,243 | 14,351 | ||||||||||||
|
| |||||||||||||||
Total current assets | 803,977 | 806,213 | 596,992 | 803,977 | ||||||||||||
|
| |||||||||||||||
Property and equipment, net | 586,346 | 539,961 | 684,979 | 586,346 | ||||||||||||
Marketable securities | 351,988 | 243,445 | 126,913 | 351,988 | ||||||||||||
Deferred income taxes and other assets | 52,010 | 46,474 | 74,824 | 52,010 | ||||||||||||
|
| |||||||||||||||
Total Assets | $ | 1,794,321 | $ | 1,636,093 | $ | 1,483,708 | $ | 1,794,321 | ||||||||
|
| |||||||||||||||
| LIABILITIES AND SHAREHOLDERS’ EQUITY | ||||||||||||||||
Current liabilities: | ||||||||||||||||
Accounts payable | $ | 82,904 | $ | 78,041 | $ | 95,754 | $ | 82,904 | ||||||||
Accrued compensation | 20,212 | 21,913 | 15,630 | 20,212 | ||||||||||||
Accrued expenses and other current liabilities | 107,908 | 88,595 | 122,082 | 107,908 | ||||||||||||
|
| |||||||||||||||
Total current liabilities | 211,024 | 188,549 | 233,466 | 211,024 | ||||||||||||
Deferred rent and other liabilities | 171,749 | 150,769 | 183,974 | 171,749 | ||||||||||||
|
| |||||||||||||||
Total Liabilities | 382,773 | 339,318 | 417,440 | 382,773 | ||||||||||||
|
| |||||||||||||||
Commitments and contingencies (see Note 11) | ||||||||||||||||
Commitments and contingencies (see Note 12) | ||||||||||||||||
Shareholders’ equity: | ||||||||||||||||
Preferred shares; $.0001 par value, 10,000,000 shares authorized, none issued | — | — | — | — | ||||||||||||
Common shares; $.0001 par value, 200,000,000 shares authorized, 164,413,427 and 168,558,371 issued and outstanding, respectively | 17 | 17 | ||||||||||||||
Common shares; $.0001 par value, 200,000,000 shares authorized, 144,633,007 and 164,413,427 issued and outstanding, respectively | 15 | 17 | ||||||||||||||
Additional paid-in capital | 27,603 | 184,620 | — | 27,603 | ||||||||||||
Retained earnings | 1,394,190 | 1,121,232 | 1,077,765 | 1,394,190 | ||||||||||||
Accumulated other comprehensive loss | (10,262 | ) | (9,094 | ) | (11,512 | ) | (10,262 | ) | ||||||||
|
| |||||||||||||||
Total Shareholders’ Equity | 1,411,548 | 1,296,775 | 1,066,268 | 1,411,548 | ||||||||||||
|
| |||||||||||||||
Total Liabilities and Shareholders’ Equity | $ | 1,794,321 | $ | 1,636,093 | $ | 1,483,708 | $ | 1,794,321 | ||||||||
|
| |||||||||||||||
The accompanying notes are an integral part of these consolidated financial statements.
Consolidated Statements of Income
(in thousands, except share and per share data)
| Fiscal Year Ended January 31, | Fiscal Year Ended January 31, | |||||||||||||||||||||||
| 2011 | 2010 | 2009 | 2012 | 2011 | 2010 | |||||||||||||||||||
Net sales | $ | 2,274,102 | $ | 1,937,815 | $ | 1,834,618 | $ | 2,473,801 | $ | 2,274,102 | $ | 1,937,815 | ||||||||||||
Cost of sales, including certain buying, distribution and occupancy costs | 1,337,482 | 1,151,670 | 1,121,140 | 1,613,265 | 1,337,482 | 1,151,670 | ||||||||||||||||||
|
|
| ||||||||||||||||||||||
Gross profit | 936,620 | 786,145 | 713,478 | 860,536 | 936,620 | 786,145 | ||||||||||||||||||
Selling, general and administrative expenses | 522,417 | 447,161 | 414,043 | 575,811 | 522,417 | 447,161 | ||||||||||||||||||
|
|
| ||||||||||||||||||||||
Income from operations | 414,203 | 338,984 | 299,435 | 284,725 | 414,203 | 338,984 | ||||||||||||||||||
Interest income | 4,669 | 6,290 | 11,504 | 5,120 | 4,669 | 6,290 | ||||||||||||||||||
Other income | 486 | 463 | 694 | 553 | 486 | 463 | ||||||||||||||||||
Other expenses | (2,150 | ) | (1,331 | ) | (2,143 | ) | (1,567 | ) | (2,150 | ) | (1,331 | ) | ||||||||||||
|
|
| ||||||||||||||||||||||
Income before income taxes | 417,208 | 344,406 | 309,490 | 288,831 | 417,208 | 344,406 | ||||||||||||||||||
Income tax expense | 144,250 | 124,513 | 110,126 | 103,580 | 144,250 | 124,513 | ||||||||||||||||||
|
|
| ||||||||||||||||||||||
Net income | $ | 272,958 | $ | 219,893 | $ | 199,364 | $ | 185,251 | $ | 272,958 | $ | 219,893 | ||||||||||||
|
|
| ||||||||||||||||||||||
Net income per common share: | ||||||||||||||||||||||||
Basic | $ | 1.64 | $ | 1.31 | $ | 1.20 | $ | 1.20 | $ | 1.64 | $ | 1.31 | ||||||||||||
|
|
| ||||||||||||||||||||||
Diluted | $ | 1.60 | $ | 1.28 | $ | 1.17 | $ | 1.19 | $ | 1.60 | $ | 1.28 | ||||||||||||
|
|
| ||||||||||||||||||||||
Weighted average common shares outstanding: | ||||||||||||||||||||||||
Basic | 166,896,322 | 168,053,502 | 166,793,062 | 154,025,589 | 166,896,322 | 168,053,502 | ||||||||||||||||||
|
|
| ||||||||||||||||||||||
Diluted | 170,333,550 | 171,230,245 | 170,860,605 | 156,191,289 | 170,333,550 | 171,230,245 | ||||||||||||||||||
|
|
| ||||||||||||||||||||||
The accompanying notes are an integral part of these consolidated financial statements.
Consolidated Statements of Shareholders’ Equity
(in thousands, except share data)
| Compre- hensive Income | Common Shares | Additional Paid-in Capital | Retained Earnings | Accumulated Other Compre- hensive Income (Loss) | Total | Compre- hensive Income | Common Shares | Additional Paid-in Capital | Retained Earnings | Accumulated Other Compre- hensive Loss | Total | |||||||||||||||||||||||||||||||||||||||||||||
| Number of Shares | Par Value | |||||||||||||||||||||||||||||||||||||||||||||||||||||||
Balances as of February 1, 2008 | 166,104,615 | $ | 17 | $ | 144,204 | $ | 701,975 | $ | 7,235 | $ | 853,431 | |||||||||||||||||||||||||||||||||||||||||||||
Net income | $ | 199,364 | — | — | — | 199,364 | — | 199,364 | ||||||||||||||||||||||||||||||||||||||||||||||||
Foreign currency translation | (19,866 | ) | — | — | — | — | (19,866 | ) | (19,866 | ) | ||||||||||||||||||||||||||||||||||||||||||||||
Unrealized losses on marketable securities, net of tax | (5,116 | ) | — | — | — | — | (5,116 | ) | (5,116 | ) | ||||||||||||||||||||||||||||||||||||||||||||||
Comprehensive income | $ | 174,382 | ||||||||||||||||||||||||||||||||||||||||||||||||||||||
Share-based compensation | — | — | 3,637 | — | — | 3,637 | ||||||||||||||||||||||||||||||||||||||||||||||||||
Stock options and awards | 1,607,473 | — | 8,891 | — | — | 8,891 | ||||||||||||||||||||||||||||||||||||||||||||||||||
Tax effect of share exercises | — | — | 13,434 | — | — | 13,434 | ||||||||||||||||||||||||||||||||||||||||||||||||||
| Compre- hensive Income | Number of Shares | Par Value | Additional Paid-in Capital | Retained Earnings | Accumulated Other Compre- hensive Loss | Total | ||||||||||||||||||||||||||||||||||||||||||||||||||
Balances as of January 31, 2009 | 167,712,088 | $ | 17 | $ | 170,166 | $ | 901,339 | $ | (17,747 | ) | $ | 1,053,775 | 167,712,088 | $ | 17 | |||||||||||||||||||||||||||||||||||||||||
Net income | $ | 219,893 | — | — | — | 219,893 | — | 219,893 | $ | 219,893 | — | — | — | 219,893 | — | 219,893 | ||||||||||||||||||||||||||||||||||||||||
Foreign currency translation | 7,173 | — | — | — | — | 7,173 | 7,173 | 7,173 | — | — | — | — | 7,173 | 7,173 | ||||||||||||||||||||||||||||||||||||||||||
Unrealized gains on marketable securities, net of tax | 1,480 | — | — | — | — | 1,480 | 1,480 | 1,480 | — | — | — | — | 1,480 | 1,480 | ||||||||||||||||||||||||||||||||||||||||||
| ||||||||||||||||||||||||||||||||||||||||||||||||||||||||
Comprehensive income | $ | 228,546 | $ | 228,546 | ||||||||||||||||||||||||||||||||||||||||||||||||||||
| ||||||||||||||||||||||||||||||||||||||||||||||||||||||||
Share-based compensation | — | — | 4,766 | — | — | 4,766 | — | — | 4,766 | — | — | 4,766 | ||||||||||||||||||||||||||||||||||||||||||||
Stock options and awards | 846,283 | — | 3,250 | — | — | 3,250 | 846,283 | — | 3,250 | — | — | 3,250 | ||||||||||||||||||||||||||||||||||||||||||||
Tax effect of share exercises | — | — | 6,438 | — | — | 6,438 | — | — | 6,438 | — | — | 6,438 | ||||||||||||||||||||||||||||||||||||||||||||
|
|
|
|
|
| |||||||||||||||||||||||||||||||||||||||||||||||||||
Balances as of January 31, 2010 | 168,558,371 | $ | 17 | $ | 184,620 | $ | 1,121,232 | $ | (9,094 | ) | $ | 1,296,775 | 168,558,371 | $ | 17 | $ | 184,620 | $ | 1,121,232 | $ | (9,094 | ) | $ | 1,296,775 | ||||||||||||||||||||||||||||||||
Net income | $ | 272,958 | — | — | — | 272,958 | — | 272,958 | $ | 272,958 | — | — | — | 272,958 | — | 272,958 | ||||||||||||||||||||||||||||||||||||||||
Foreign currency translation | (429 | ) | — | — | — | — | (429 | ) | (429 | ) | (429 | ) | — | — | — | — | (429 | ) | (429 | ) | ||||||||||||||||||||||||||||||||||||
Unrealized losses on marketable securities, net of tax | (739 | ) | — | — | — | — | (739 | ) | (739 | ) | (739 | ) | — | — | — | — | (739 | ) | (739 | ) | ||||||||||||||||||||||||||||||||||||
| ||||||||||||||||||||||||||||||||||||||||||||||||||||||||
Comprehensive income | $ | 271,790 | $ | 271,790 | ||||||||||||||||||||||||||||||||||||||||||||||||||||
| ||||||||||||||||||||||||||||||||||||||||||||||||||||||||
Share-based compensation | — | — | 10,725 | — | — | 10,725 | — | — | 10,725 | — | — | 10,725 | ||||||||||||||||||||||||||||||||||||||||||||
Stock options and awards | 2,256,273 | — | 24,129 | — | — | 24,129 | 2,256,273 | — | 24,129 | — | — | 24,129 | ||||||||||||||||||||||||||||||||||||||||||||
Tax effect of share exercises | — | — | 12,847 | — | — | 12,847 | — | — | 12,847 | — | — | 12,847 | ||||||||||||||||||||||||||||||||||||||||||||
Share Repurchases | (6,401,217 | ) | — | (204,718 | ) | — | — | (204,718 | ) | (6,401,217 | ) | — | (204,718 | ) | — | — | (204,718 | ) | ||||||||||||||||||||||||||||||||||||||
|
|
|
|
|
| |||||||||||||||||||||||||||||||||||||||||||||||||||
Balances as of January 31, 2011 | 164,413,427 | $ | 17 | $ | 27,603 | $ | 1,394,190 | $ | (10,262 | ) | $ | 1,411,548 | 164,413,427 | $ | 17 | $ | 27,603 | $ | 1,394,190 | $ | (10,262 | ) | $ | 1,411,548 | ||||||||||||||||||||||||||||||||
Net income | $ | 185,251 | — | — | — | 185,251 | — | 185,251 | ||||||||||||||||||||||||||||||||||||||||||||||||
Foreign currency translation | (2,285 | ) | — | — | — | — | (2,285 | ) | (2,285 | ) | ||||||||||||||||||||||||||||||||||||||||||||||
Unrealized gains on marketable securities, net of tax | 1,035 | — | — | — | — | 1,035 | 1,035 | |||||||||||||||||||||||||||||||||||||||||||||||||
| ||||||||||||||||||||||||||||||||||||||||||||||||||||||||
Comprehensive income | $ | 184,001 | ||||||||||||||||||||||||||||||||||||||||||||||||||||||
| ||||||||||||||||||||||||||||||||||||||||||||||||||||||||
Share-based compensation | — | — | 3,068 | — | — | 3,068 | ||||||||||||||||||||||||||||||||||||||||||||||||||
Stock options and awards | 993,923 | — | 4,134 | — | — | 4,134 | ||||||||||||||||||||||||||||||||||||||||||||||||||
Tax effect of share exercises | — | — | 8,995 | — | — | 8,995 | ||||||||||||||||||||||||||||||||||||||||||||||||||
Share Repurchases | (20,774,343 | ) | (2 | ) | (43,800 | ) | (501,676 | ) | — | (545,478 | ) | |||||||||||||||||||||||||||||||||||||||||||||
|
|
|
|
|
| |||||||||||||||||||||||||||||||||||||||||||||||||||
Balances as of January 31, 2012 | 144,633,007 | $ | 15 | $ | — | $ | 1,077,765 | $ | (11,512 | ) | $ | 1,066,268 | ||||||||||||||||||||||||||||||||||||||||||||
|
|
|
|
|
| |||||||||||||||||||||||||||||||||||||||||||||||||||
The accompanying notes are an integral part of these consolidated financial statements.
Consolidated Statements of Cash Flows
(in thousands)
| Fiscal Year Ended January 31, | Fiscal Year Ended January 31, | |||||||||||||||||||||||
| 2011 | 2010 | 2009 | 2012 | 2011 | 2010 | |||||||||||||||||||
Cash flows from operating activities: | ||||||||||||||||||||||||
Net income | $ | 272,958 | $ | 219,893 | $ | 199,364 | $ | 185,251 | $ | 272,958 | $ | 219,893 | ||||||||||||
Adjustments to reconcile net income to net cash provided by operating activities: | ||||||||||||||||||||||||
Depreciation and amortization | 101,105 | 92,350 | 81,949 | 108,112 | 101,105 | 92,350 | ||||||||||||||||||
Provision for deferred income taxes | (8,727 | ) | 2,161 | (9,351 | ) | (12,150 | ) | (8,727 | ) | 2,161 | ||||||||||||||
Excess tax benefit on share-based compensation | (12,847 | ) | (6,438 | ) | (13,434 | ) | (8,995 | ) | (12,847 | ) | (6,438 | ) | ||||||||||||
Share-based compensation expense | 10,725 | 4,766 | 3,637 | 3,068 | 10,725 | 4,766 | ||||||||||||||||||
Loss on disposition of property and equipment, net | 119 | 339 | 61 | 857 | 119 | 339 | ||||||||||||||||||
Changes in assets and liabilities: | ||||||||||||||||||||||||
Receivables | 1,835 | (1,825 | ) | (10,726 | ) | (251 | ) | 1,835 | (1,825 | ) | ||||||||||||||
Inventories | (43,372 | ) | (15,544 | ) | (272 | ) | (20,817 | ) | (43,372 | ) | (15,544 | ) | ||||||||||||
Prepaid expenses and other assets | 14,825 | (25,619 | ) | 9,210 | 6,317 | 14,825 | (25,619 | ) | ||||||||||||||||
Accounts payable, accrued expenses and other liabilities | 48,492 | 55,311 | (8,868 | ) | 21,310 | 48,492 | 55,311 | |||||||||||||||||
|
|
| ||||||||||||||||||||||
Net cash provided by operating activities | 385,113 | 325,394 | 251,570 | 282,702 | 385,113 | 325,394 | ||||||||||||||||||
|
|
| ||||||||||||||||||||||
Cash flows from investing activities: | ||||||||||||||||||||||||
Cash paid for property and equipment | (143,642 | ) | (109,260 | ) | (112,553 | ) | (190,010 | ) | (143,642 | ) | (109,260 | ) | ||||||||||||
Cash paid for marketable securities | (463,129 | ) | (806,546 | ) | (809,039 | ) | (169,467 | ) | (463,129 | ) | (806,546 | ) | ||||||||||||
Sales and maturities of marketable securities | 571,236 | 421,040 | 864,685 | 414,769 | 571,236 | 421,040 | ||||||||||||||||||
|
|
| ||||||||||||||||||||||
Net cash used in investing activities | (35,535 | ) | (494,766 | ) | (56,907 | ) | ||||||||||||||||||
Net cash provided by (used in) investing activities | 55,292 | (35,535 | ) | (494,766 | ) | |||||||||||||||||||
|
|
| ||||||||||||||||||||||
Cash flows from financing activities: | ||||||||||||||||||||||||
Exercise of stock options | 24,129 | 3,250 | 8,891 | 4,136 | 24,129 | 3,250 | ||||||||||||||||||
Excess tax benefit from stock option exercises | 12,847 | 6,438 | 13,434 | 8,995 | 12,847 | 6,438 | ||||||||||||||||||
Share repurchases | (204,718 | ) | — | — | (545,478 | ) | (204,718 | ) | — | |||||||||||||||
|
|
| ||||||||||||||||||||||
Net cash (used in) provided by financing activities | (167,742 | ) | 9,688 | 22,325 | (532,347 | ) | (167,742 | ) | 9,688 | |||||||||||||||
|
|
| ||||||||||||||||||||||
Effect of exchange rate changes on cash and cash equivalents | (603 | ) | 2,673 | (6,224 | ) | (631 | ) | (603 | ) | 2,673 | ||||||||||||||
|
|
| ||||||||||||||||||||||
Increase (decrease) in cash and cash equivalents | 181,233 | (157,011 | ) | 210,764 | ||||||||||||||||||||
(Decrease) increase in cash and cash equivalents | (194,984 | ) | 181,233 | (157,011 | ) | |||||||||||||||||||
Cash and cash equivalents at beginning of period | 159,024 | 316,035 | 105,271 | 340,257 | 159,024 | 316,035 | ||||||||||||||||||
|
|
| ||||||||||||||||||||||
Cash and cash equivalents at end of period | $ | 340,257 | $ | 159,024 | $ | 316,035 | $ | 145,273 | $ | 340,257 | $ | 159,024 | ||||||||||||
|
|
| ||||||||||||||||||||||
Supplemental cash flow information: | ||||||||||||||||||||||||
Cash paid during the year for: | ||||||||||||||||||||||||
Income taxes | $ | 121,341 | $ | 137,490 | $ | 115,040 | $ | 120,847 | $ | 121,341 | $ | 137,490 | ||||||||||||
|
|
| ||||||||||||||||||||||
Non-cash investing activities—Accrued capital expenditures | $ | 8,077 | $ | 12,960 | $ | 6,561 | $ | 21,955 | $ | 8,077 | $ | 12,960 | ||||||||||||
|
|
| ||||||||||||||||||||||
The accompanying notes are an integral part of these consolidated financial statements.
NOTES TO CONSOLIDATED FINANCIAL STATEMENTS
(in thousands, except share and per share data)
1. Nature of Business
Urban Outfitters, Inc. (the “Company” or “Urban Outfitters”), which was founded in 1970 and originally operated by a predecessor partnership, was incorporated in the Commonwealth of Pennsylvania in 1976. The principal business activity of the Company is the operation of a general consumer product retail and wholesale business selling to customers through various channels including retail stores, nine websites and five catalogs and ten web sites.catalogs. As of January 31, 20112012 and 2010,2011, the Company operated 372429 and 327372 stores, respectively. Stores located in the United States totaled 381 as of January 31, 2012 and 334 as of January 31, 2011 and 298 as of January 31, 2010.2011. Operations in Europe and Canada included 33 stores and 15 stores as of January 31, 2012, respectively and 24 stores and 14 stores as of January 31, 2011, respectively and 19 stores and 10 stores as of January 31, 2010, respectively. In addition, the Company’s wholesale segment sold and distributed apparel to approximately 1,400 better department and specialty retailers worldwide.
2. Summary of Significant Accounting Policies
Fiscal Year-End
The Company operates on a fiscal year ending January 31 of each year. All references to fiscal years of the Company refer to the fiscal years ended on January 31 in those years. For example, the Company’s fiscal 20112012 ended on January 31, 2011.2012.
Principles of Consolidation
The consolidated financial statementsConsolidated Financial Statements include the accounts of Urban Outfitters, Inc. and all of its subsidiaries. All inter-company transactions and accounts have been eliminated in consolidation.
Use of Estimates
The preparation of financial statements, in conformity with accounting principles generally accepted in the United States, requires management to make estimates and assumptions that affect the reported amounts of assets and liabilities and disclosure of contingent assets and liabilities at the date of the financial statements and the reported amounts of net sales and expenses during the reporting period. Actual results could differ from those estimates.
Cash and Cash Equivalents
Cash and cash equivalents are defined as cash and short-term highly liquid investments with maturities of less than three months at the time of purchase. These short-term highly liquid investments are both readily convertible to known amounts of cash and so near their maturity that they present insignificant risk of changes in value because of changes in interest rates. As of January 31, 20112012 and 2010,2011, cash and cash equivalents included cash on hand, cash in banks and money market accounts.
Marketable Securities
All of the Company’s marketable securities as of January 31, 2012 and 2011, are classified as available-for-sale and are carried at fair value, which approximates amortized cost. Interest on these
URBAN OUTFITTERS, INC.
NOTES TO CONSOLIDATED FINANCIAL STATEMENTS—(Continued)
(in thousands, except share and per share data)
Marketable Securities
The Company’s marketable securities may be classified as either held-to-maturity or available-for-sale. Held-to-maturity securities represent those securities that the Company has both the intent and ability to hold to maturity and are carried at amortized cost. Interest on these securities, as well as the amortization of discounts and premiums, is included in interest income. Available-for-sale securities represent securities that do not meetincome in the classificationConsolidated Statements of held-to-maturity, are not actively traded and are carried at fair value, which approximates amortized cost.Income. Unrealized gains and losses on these securities are considered temporary and therefore are excluded from earnings and are reported as a separate component ofin accumulated other comprehensive loss in shareholders’ equity until realized. Other than temporary impairment losses related to credit losses are considered to be realized losses. When available-for-sale securities are sold, the cost of the securities is specifically identified and is used to determine the realized gain or loss. Securities classified as current have maturity dates of less than one year from the balance sheet date. Securities classified as non-current have maturity dates greater than one year from the balance sheet date. Available for sale securities, such as Auction Rate Securities (“ARS”) that fail at auction and do not liquidate underin the normal course, are classified as non-current assets. Successful auctions would be classified as current assets. Marketable securities as of January 31, 2011 and 2010 were classified as available-for-sale.
Approximately 3.6% of theThe Company’s cash, cash equivalents and marketable securities are invested in “A” or better rated ARS that represent interests in municipal and student loan related collateralized debt obligations, all of which are rated ‘A” or better and are guaranteed by either government agencies and/or insured by private insurance agencies atup to 97% or greater of par value. The Company’s ARS had a fair value of $20.2 million as of January 31, 2012 and $29.5 million as of January 31, 2011 and $33.5 million as of January 31, 2010.2011. As of and subsequent to the end of the current fiscal year, all of the ARS held by the Company failed to liquidate at auction due to a lack of market demand. Liquidity for these ARS was historically provided by an auction process that resets the applicable interest rate at pre-determined intervals, usually 7, 28, 35 or 90 days. The principal associated with these failed auctions will not be available until a successful auction occurs, the bond is called by the issuer, a buyer is found from outside the auction process, or the debt obligation reaches its maturity. Based on review of credit quality, collateralization, final stated maturity, estimates of the probability of being called or becoming illiquid prior to final maturity, redemptions of similar ARS, previous market activity for same investment security, impact due to extended periods of maximum auction rates and valuation models, the Company has recorded $3.8$2.8 million and $4.1$3.8 million of temporary impairment on its ARS as of January 31, 20112012 and January 31, 2010,2011, respectively. To date the Company has collected all interest receivable on outstanding ARS when due and has not been informed by the issuers that accrued interest payments are currently at risk. The Company does not have the intent to sell the underlying securities prior to their recovery and the Company believes it is not likely that it will be required to sell the underlying securities prior to their anticipated recovery of full amortized cost. As a result of the current illiquidity, the Company has classified all ARS as non-current assets under marketable securities. The Company continues to monitor the market for ARS and consider the impact, if any, on the fair value of its investments.
Accounts Receivable
Accounts receivable primarily consists of amounts due from our wholesale customers as well as credit card receivables outstanding with third-party credit card vendors. The Company also includes disclosure about its investments that are in an unrealized loss positionactivity of the allowance for which other-than-temporary impairments have not been recognized.doubtful accounts for the years ended January 31, 2012, 2011 and 2010 was as follows:
| Balance at beginning of year | Additions | Deductions | Balance at end of year | |||||||||||||
Year ended January 31, 2012 | $ | 1,015 | 3,920 | (3,321 | ) | $ | 1,614 | |||||||||
Year ended January 31, 2011 | $ | 1,284 | 2,397 | (2,666 | ) | $ | 1,015 | |||||||||
Year ended January 31, 2010 | $ | 1,229 | 1,791 | (1,736 | ) | $ | 1,284 | |||||||||
URBAN OUTFITTERS, INC.
NOTES TO CONSOLIDATED FINANCIAL STATEMENTS—(Continued)
(in thousands, except share and per share data)
Accounts Receivable
Accounts receivable primarily consists of amounts due from our wholesale customers as well as credit card receivables. The activity of the allowance for doubtful accounts for the years ended January 31, 2011, 2010 and 2009 was as follows:
| Balance at beginning of year | Additions | Deductions | Balance at end of year | |||||||||||||
Year ended January 31, 2011 | $ | 1,284 | $ | 2,397 | $ | (2,666 | ) | $ | 1,015 | |||||||
Year ended January 31, 2010 | $ | 1,229 | $ | 1,791 | $ | (1,736 | ) | $ | 1,284 | |||||||
Year ended January 31, 2009 | $ | 966 | $ | 4,375 | $ | (4,112 | ) | $ | 1,229 | |||||||
Inventories
Inventories, which consist primarily of general consumer merchandise held for sale, are valued at the lower of cost or market. Cost is determined on the first-in, first-out method and includes the cost of merchandise and import related costs, including freight, import taxes and agent commissions. A periodic review of inventory is performed in order to determine if inventory is properly stated at the lower of cost or market. Factors related to current inventories such as future expected consumer demand and fashion trends, current aging, current and anticipated retail markdowns or wholesale discounts, and class or type of inventory are analyzed to determine estimated net realizable value. Criteria utilized by the Company to quantify aging trends include factors such as average selling cycle and seasonality of merchandise, the historical rate at which merchandise has sold below cost during the average selling cycle, and the value and nature of merchandise currently priced below original cost. A provision is recorded to reduce the cost of inventories to the estimated net realizable values, if appropriate. The majority of inventory at January 31, 20112012 and 20102011 consisted of finished goods. Unfinished goods and work-in-process were not material to the overall net inventory value.
Adjustments to reserves related to the net realizable value of inventories are primarily based on the market value of the Company’s physical inventories, cycle counts and recent historical trends. The Company’s physical inventories for fiscal 20112012 were performed as of June 20102011 and January 2011.2012. The Company’s estimates generally have been accurate and theirits reserve methods have been applied on a consistent basis. The Company expects the amount of theirits reserves and related inventories to increase over time as they expand theirit expands its store base and accordingly, related inventories.increases direct-to-consumer sales.
Property and Equipment
Property and equipment are stated at cost and primarily consist of store related leasehold improvements, buildings and furniture and fixtures. Depreciation is typically computed using the straight-line method over five years for furniture and fixtures, the lesser of the lease term or useful life for leasehold improvements, three to ten years for other operating equipment and 39 years for buildings. Major renovations or improvements that extend the service lives of our assets are capitalized over the extension period or life of the improvement, whichever is less.
URBAN OUTFITTERS, INC.
NOTES TO CONSOLIDATED FINANCIAL STATEMENTS—(Continued)
(in thousands, except share and per share data)
The Company reviews long-lived assets for possible impairment whenever events or changes in circumstances indicate the carrying amount may not be recoverable. This determination includes evaluation of factors such as future asset utilization and future net undiscounted cash flows expected to result from the use of the assets. Management believes there has been no material impairment of the Company’s long-lived assets as of January 31, 2011.2012.
Deferred Rent
Rent expense from leases is recorded on a straight-line basis over the lease period. The net excess of rent expense over the actual cash paid is recorded as deferred rent. In addition, certain store leases provide for contingent rentals when sales exceed specified break-point levels that are weighted based
URBAN OUTFITTERS, INC.
NOTES TO CONSOLIDATED FINANCIAL STATEMENTS—(Continued)
(in thousands, except share and per share data)
upon historical cyclicality. For leases where achievement of these levels is considered probable based on cumulative lease year revenue versus the established breakpoint at any given point in time, the Company accrues a contingent rent is accrued. This is expensed in addition to minimumliability and a corresponding rent which is recorded on a straight-line basis over the lease period.expense.
Operating Leases
The Company leases its retail stores under operating leases. Many of the lease agreements contain rent holidays, rent escalation clauses and contingent rent provisions or some combination of these items. The Company recognizes rent expense on a straight-line basis over the accounting lease term.
The Company recordsrecognizes rent expense on a straight-line basis over the lease period commencing on the date that the premise is available from the landlord. The lease period includes the construction period required to make the leased space suitable for operating during which time the Company is not permitted to occupy the space. For purposes of calculating straight-line rent expense, the commencement date of the lease term reflects the date the Company takes possession of the building for initial construction and setup.
The Company classifies tenant improvement allowances in its Consolidated Financial Statementsconsolidated financial statements under deferred rent and amortizes them on a straight-line basis over the related lease period. Tenant improvement allowance activity is presented as part of cash flows from operating activities in the accompanying Consolidated Statements of Cash Flows.
Revenue Recognition
Revenue is recognized at the point-of-sale for retail store sales or when merchandise is shipped to customers for wholesale and direct-to-consumer sales, net of estimated customer returns. Revenue is recognized at the completion of a job or service for landscape sales. Revenue is presented on a net basis and does not include any tax assessed by a governmental or municipal authority. Payment for merchandise at stores and through the Company’s direct-to-consumer channel is tendered by cash, check, credit card, debit card or gift card. Therefore, the Company’s need to collect outstanding accounts receivable for its retail and direct-to-consumer channel is negligible and mainly results from returned checks or unauthorized credit card transactions. The Company maintains an allowance for doubtful accounts for its wholesale and landscape service accounts receivable, which management
URBAN OUTFITTERS, INC.
NOTES TO CONSOLIDATED FINANCIAL STATEMENTS—(Continued)
(in thousands, except share and per share data)
reviews on a regular basis and believes is sufficient to cover potential credit losses and billing adjustments. Deposits for custom orders are recorded as a liability and recognized as a sale upon delivery of the merchandise to the customer. These custom orders, typically for upholstered furniture, are not material. Deposits for landscape services are recorded as a liability and recognized as a sale upon completion of service. Landscape services and related deposits are not material.
The Company accounts for a gift card transaction by recording a liability at the time the gift card is issued to the customer in exchange for consideration from the customer. A liability is established and remains on the Company’s books until the card is redeemed by the customer, at which time the Company records the redemption of the card for merchandise as a sale or when it is determined the
URBAN OUTFITTERS, INC.
NOTES TO CONSOLIDATED FINANCIAL STATEMENTS—(Continued)
(in thousands, except share and per share data)
likelihood of redemption is remote. The Company determines the probability of the gift cards being redeemed to be remote, based on historical redemption patterns. Revenues attributable to gift card liabilities relieved after the likelihood of redemption becomes remote are included in sales and are not material. The Company’s gift cards do not expire.
Sales Return Reserve
The Company records a reserve for estimated product returns where the sale has occurred during the period reported, but the return is likely to occur subsequent to the period reported and may otherwise be considered in-transit. The reserve for estimated in-transit product returns is based on the Company’s most recent historical return trends. If the actual return rate or experience is materially higher than the Company’s estimate, additional sales returns would be recorded in the future. The activity of the sales returns reserve for the years ended January 31, 2012, 2011 2010 and 20092010 was as follows:
| Balance at beginning of year | Additions | Deductions | Balance at end of year | Balance at beginning of year | Additions | Deductions | Balance at end of year | |||||||||||||||||||||||||
Year ended January 31, 2012 | $ | 11,367 | 41,034 | (41,434 | ) | $ | 10,967 | |||||||||||||||||||||||||
Year ended January 31, 2011 | $ | 9,912 | $ | 41,692 | $ | (40,237 | ) | $ | 11,367 | $ | 9,912 | 41,692 | (40,237 | ) | $ | 11,367 | ||||||||||||||||
Year ended January 31, 2010 | $ | 7,547 | $ | 33,889 | $ | (31,524 | ) | $ | 9,912 | $ | 7,547 | 33,889 | (31,524 | ) | $ | 9,912 | ||||||||||||||||
Year ended January 31, 2009 | $ | 6,776 | $ | 28,408 | $ | (27,637 | ) | $ | 7,547 | |||||||||||||||||||||||
Cost of Sales, Including Certain Buying, Distribution and Occupancy Costs
Cost of sales, including certain buying, distribution and occupancy costs includes the following: the cost of merchandise; merchandise markdowns; obsolescence and shrink provisions; store occupancy costs including rent and depreciation; customer shipping costs for direct-to-consumer orders; in-bound and outbound freight; U.S. Customs related taxes and duties; inventory acquisition and purchasing costs; warehousing and handling costs and other inventory acquisition related costs.
Selling, General and Administrative Expenses
Selling, general and administrative expenses includes expenses such as (i)as; direct selling and selling supervisory expenses; (ii)marketing expenses; various corporate expenses such as information systems, finance, loss prevention, talent acquisition, and executive management expenses;expenses and (iii) other associated general expenses.
URBAN OUTFITTERS, INC.
NOTES TO CONSOLIDATED FINANCIAL STATEMENTS—(Continued)
(in thousands, except share and per share data)
Shipping and Handling Fees and Costs
The Company includes shipping and handling revenues in net sales and shipping and handling costs in cost of sales. The Company’s shipping and handling revenues consist of amounts billed to customers for shipping and handling merchandise. Shipping and handling costs include shipping supplies, related labor costs and third-party shipping costs.
URBAN OUTFITTERS, INC.
NOTES TO CONSOLIDATED FINANCIAL STATEMENTS—(Continued)
(in thousands, except share and per share data)
Advertising
The Company expenses the costs of advertising when the advertising occurs, except for direct-to-consumer advertising, which is capitalized and amortized over its expected period of future benefit. Advertising costs primarily relate to our direct-to-consumer marketing expenses which are composedcomprised of web marketing, catalog printing, paper, postage and other costs related to production of photographic images used in our catalogs and on our web sites. Thesewebsites. The catalog printing, paper, postage and other costs are amortized over the period in which the customer responds to the marketing material determined based on historical customer response trends to a similar season’s advertisement. Amortization rates are reviewed on a regular basis during the fiscal year and may be adjusted if the predicted customer response appears materially different than the historical response rate. The Company has the ability to measure the response rate to direct marketing early in the course of the advertisement based on its customers’ reference to a specific catalog or by product placed and sold. The average amortization period for a catalog and related items are typically three months. If there is no expected future benefit, the cost of advertising is expensed when incurred. Advertising costs reported as prepaid expenses were $3,323$3,586 and $3,238$3,323 as of January 31, 20112012 and 2010,2011, respectively. Advertising expenses were $71,684, $58,336 $46,827 and $45,561$46,827 for fiscal 2012, 2011 2010 and 2009,2010, respectively.
Start-up Costs
The Company expenses all start-up and organization costs as incurred, including travel, training, recruiting, salaries and other operating costs.
Web SiteWebsite Development Costs
The Company capitalizes applicable costs incurred during the application and infrastructure development stage and expenses costs incurred during the planning and operating stage. During fiscal 2012, 2011 2010 and 2009,2010, the Company did not capitalize any internal-use software development costs because substantially all costs were incurred during the planning and operating stages, and costs incurred during the application and infrastructure development stage were not material.
Income Taxes
The Company utilizes a balance sheet approach to provide for income taxes. Under this method, deferred tax assets and liabilities are recognized for the expected future tax consequences of net operating loss carryforwards and temporary differences between the carrying amounts and the tax bases of assets and liabilities. The Company files a consolidated United States federal income tax return (see Note 8 for a further discussion of income taxes).
Net Income Per Common Share
Basic net income per common share is computed by dividing net income by the weighted average number of common shares outstanding. Diluted net income per common share is computed by dividing
URBAN OUTFITTERS, INC.
NOTES TO CONSOLIDATED FINANCIAL STATEMENTS—(Continued)
(in thousands, except share and per share data)
Net Income Per Common Share
Basic net income per common share is computed by dividing net income available to common shareholders by the weighted average number of common shares outstanding. Diluted net income per common share is computed by dividing net income available to common shareholders by the weighted average number of common shares and common share equivalents outstanding. Common share equivalents include the effect of stock options, stock appreciation rights (“SAR’s”), restricted sharesstock units (“RSU’s”) and performance share units.units (“PSU’s”).
Accumulated Other Comprehensive IncomeLoss
Comprehensive income is comprised of two subsets—net income and accumulated other comprehensive income.loss. Amounts included in accumulated other comprehensive incomeloss relate to foreign currency translation adjustments and unrealized gains or losses on marketable securities. The foreign currency translation adjustments are not adjusted for income taxes because these adjustments relate to indefinite investments in non-U.S. subsidiaries.subsidiaries for which foreign earnings have been designated as permanently reinvested. Accumulated other comprehensive incomeloss consisted of foreign currency translation losses of $7,752$10,037 and $7,323$7,752 as of January 31, 20112012 and January 31, 2010, respectively. Accumulated other comprehensive income included2011, respectively and unrealized losses, net of tax, on marketable securities of $2,510$1,475 and $1,771$2,510 as of January 31, 20112012 and January 31, 2010,2011, respectively. Gross realized gains and losses are included in other income in the Consolidated Statements of Income and were not material to the Company’s Consolidated Financial Statements for all three years presented.
Foreign Currency Translation
The financial statements of the Company’s foreign operations are translated into U.S. dollars. Assets and liabilities are translated at current exchange rates as of the balance sheet date, equity accounts at historical exchange rates, while revenue and expense accounts are translated at the average rates in effect during the year. Translation adjustments are not included in determining net income, but are included in accumulated other comprehensive incomeloss within shareholders’ equity. As of January 31, 2012, 2011 2010 and 2009,2010, foreign currency translation adjustments resulted in accumulated losses of $7,752, $7,323$10,037 and $14,496,$7,752, respectively.
Concentration of Credit Risk
Financial instruments that potentially subject the Company to concentrations of credit risk consist principally of cash, cash equivalents, marketable securities and accounts receivable. The Company manages the credit risk associated with cash, cash equivalents and marketable securities by investing in high-quality securities held with reputable trustees and, by policy, limiting the amount of credit exposure to any one issue.issuer or issue, as well as providing limitations on investment maturities. The Company’s investment policy requires that the majority of its cash, cash equivalents and marketable securities are invested in corporate and municipal bonds rated “A” or better and federally insured or guaranteed investment vehicles such as federal government agencies, FDIC insured corporate bonds, irrevocable pre-refunded municipal bonds and United States treasury bills. Receivables from third-party credit cards are processed by financial institutions, which are monitored for financial stability. The Company periodically evaluates the financial condition of its wholesale segment customers. The Company’s allowance for doubtful accounts reflects current market conditions and management’s assessment regarding the collectability of its accounts receivable. The Company maintains cash accounts that, at
URBAN OUTFITTERS, INC.
NOTES TO CONSOLIDATED FINANCIAL STATEMENTS—(Continued)
(in thousands, except share and per share data)
allowance for doubtful accounts reflects current market conditions and management’s assessment regarding the collectability of its accounts receivable. The Company maintains cash accounts that, at times, may exceed federally insured limits. The Company has not experienced any losses from maintaining cash accounts in excess of such limits. Management believes that it is not exposed to any significant risks related to its cash accounts.
Recently Issued Accounting Pronouncements
In January 2010, the Financial Accounting Standards Board (“FASB”) issued an accounting standards update which amendsthat amended fair value measurements and disclosures and aimsaimed to improve the transparency of financial reporting of assets and liabilities measured at fair value. The update requiresrequired new disclosures for transfers in and out of Level 1 and Level 2 and the basis for such transfers. Also required are disclosures for activity in Level 3, including purchase, sale, issuance and settlement information. Lastly, it clarifiesclarified guidance regarding disaggregation and disclosure of information about valuation techniques and inputs used to measure fair value for both recurring and non-recurring fair value measurements in Level 2 and Level 3 categories. The Company has adopted the new disclosures and clarificationsprovisions of existing disclosures as ofthis accounting standards update effective February 1, 2010, except for the requirement to disclose purchases, sales, issuances, and settlements related to Level 3 measurements, which were effective for interim and annual reporting periods beginning after December 15, 2009.we adopted February 1, 2011. This adoption had no impact on the Company’s financial condition, results of operations or cash flows. The Company has not adopted
In May 2011, the disclosures about purchases, sales, issuances and settlements in the roll forward of activity in Level 3FASB issued an additional update that amended fair value measurements as these disclosures are effectiveand disclosures. This amendment provides that the inputs and measures used to value assets that fall within Level 3 of the valuation hierarchy be quantitatively presented. Application is required prospectively for fiscal yearsinterim and annual periods beginning after December 15, 2010 and interim periods within those fiscal years.2011. The Company doesis required to adopt the provisions of this update in the first quarter of fiscal 2013. Other than the change in presentation, this accounting standards update will not expect this adoption to have an impact on itsthe Company’s financial condition,position and results of operationsoperations.
In June 2011, the FASB issued an accounting standards update that requires an increase in the prominence of other comprehensive income and its components within the financial statements. The update provides entities the option to present the components of net income and other comprehensive income in either one or cash flows.two consecutive financial statements. It also eliminates the option to present other comprehensive income in the statements of shareholders’ equity. Application is to be applied retrospectively and is effective for interim and annual periods beginning after December 15, 2011. The Company is required to adopt the provisions of this update in the first quarter of fiscal 2013. Other than the change in presentation, this accounting standards update will not have an impact on the Company’s financial position and results of operations.
URBAN OUTFITTERS, INC.
NOTES TO CONSOLIDATED FINANCIAL STATEMENTS—(Continued)
(in thousands, except share and per share data)
3. Marketable Securities
During all periods shown, marketable securities are classified as available-for-sale. The amortized cost, gross unrealized gains (losses) and fair values of available-for-sale securities by major security type and class of security as of January 31, 20112012 and 20102011 are as follows:
| Amortized Cost | Unrealized Gains | Unrealized (Losses) | Fair Value | |||||||||||||||||||||||||||||
As of January 31, 2012 | ||||||||||||||||||||||||||||||||
Short-term Investments: | ||||||||||||||||||||||||||||||||
Corporate bonds | $ | 34,899 | $ | 7 | $ | (28 | ) | $ | 34,878 | |||||||||||||||||||||||
Municipal and pre-refunded municipal bonds | 41,519 | 135 | (10 | ) | 41,644 | |||||||||||||||||||||||||||
Certificate of deposit | 5,225 | — | — | 5,225 | ||||||||||||||||||||||||||||
Federal government agencies | 4,513 | 2 | — | 4,515 | ||||||||||||||||||||||||||||
Commercial paper | 3,580 | 12 | — | 3,592 | ||||||||||||||||||||||||||||
|
|
|
| |||||||||||||||||||||||||||||
| 89,736 | 156 | (38 | ) | 89,854 | ||||||||||||||||||||||||||||
|
|
|
| |||||||||||||||||||||||||||||
Long-term Investments: | ||||||||||||||||||||||||||||||||
Corporate bonds | 60,852 | 277 | (72 | ) | 61,057 | |||||||||||||||||||||||||||
Municipal and pre-refunded municipal bonds | 18,410 | 186 | (6 | ) | 18,590 | |||||||||||||||||||||||||||
Auction rate securities | 22,975 | — | (2,778 | ) | 20,197 | |||||||||||||||||||||||||||
Treasury bills | 14,982 | 6 | — | 14,988 | ||||||||||||||||||||||||||||
Certificate of deposit | 6,970 | — | (1 | ) | 6,969 | |||||||||||||||||||||||||||
Federal government agencies | 5,111 | 2 | (1 | ) | 5,112 | |||||||||||||||||||||||||||
|
|
|
| |||||||||||||||||||||||||||||
| 129,300 | 471 | (2,858 | ) | 126,913 | ||||||||||||||||||||||||||||
|
|
|
| |||||||||||||||||||||||||||||
| $ | 219,036 | $ | 627 | $ | (2,896 | ) | $ | 216,767 | ||||||||||||||||||||||||
| Amortized Cost | Unrealized Gains | Unrealized (Losses) | Fair Value |
|
|
|
| |||||||||||||||||||||||||
As of January 31, 2011 | ||||||||||||||||||||||||||||||||
Short-term Investments: | ||||||||||||||||||||||||||||||||
Municipal and pre-refunded municipal bonds | $ | 42,996 | $ | 48 | $ | (9 | ) | $ | 43,035 | $ | 42,996 | $ | 48 | $ | (9 | ) | $ | 43,035 | ||||||||||||||
Treasury bills | 7,004 | 4 | — | 7,008 | ||||||||||||||||||||||||||||
Federal government agencies | 40,842 | 80 | — | 40,922 | 40,842 | 80 | — | 40,922 | ||||||||||||||||||||||||
FDIC insured corporate bonds | 23,489 | 66 | — | 23,555 | 23,489 | 66 | — | 23,555 | ||||||||||||||||||||||||
Treasury bills | 7,004 | 4 | — | 7,008 | ||||||||||||||||||||||||||||
Variable rate demand notes | 1,900 | — | — | 1,900 | 1,900 | — | — | 1,900 | ||||||||||||||||||||||||
|
|
|
| |||||||||||||||||||||||||||||
| 116,231 | 198 | (9 | ) | 116,420 | 116,231 | 198 | (9 | ) | 116,420 | |||||||||||||||||||||||
|
|
|
| |||||||||||||||||||||||||||||
Long-term Investments: | ||||||||||||||||||||||||||||||||
Corporate bonds | 137,540 | 173 | (154 | ) | 137,559 | |||||||||||||||||||||||||||
Municipal and pre-refunded municipal bonds | 143,711 | 216 | (558 | ) | 143,369 | 143,711 | 216 | (558 | ) | 143,369 | ||||||||||||||||||||||
Corporate bonds | 137,540 | 173 | (154 | ) | 137,559 | |||||||||||||||||||||||||||
Auction rate securities | 33,250 | — | (3,788 | ) | 29,462 | |||||||||||||||||||||||||||
Treasury bills | 23,311 | 34 | — | 23,345 | ||||||||||||||||||||||||||||
Federal government agencies | 18,225 | 30 | (2 | ) | 18,253 | 18,225 | 30 | (2 | ) | 18,253 | ||||||||||||||||||||||
Treasury bills | 23,311 | 34 | — | 23,345 | ||||||||||||||||||||||||||||
Auction rate securities | 33,250 | — | (3,788 | ) | 29,462 | |||||||||||||||||||||||||||
|
|
|
| |||||||||||||||||||||||||||||
| 356,037 | 453 | (4,502 | ) | 351,988 | 356,037 | 453 | (4,502 | ) | 351,988 | |||||||||||||||||||||||
|
|
|
| |||||||||||||||||||||||||||||
| $ | 472,268 | $ | 651 | $ | (4,511 | ) | $ | 468,408 | $ | 472,268 | $ | 651 | $ | (4,511 | ) | $ | 468,408 | |||||||||||||||
|
|
|
| |||||||||||||||||||||||||||||
As of January 31, 2010 | ||||||||||||||||||||||||||||||||
Short-term Investments: | ||||||||||||||||||||||||||||||||
Municipal and pre-refunded municipal bonds | $ | 120,778 | $ | 357 | $ | (5 | ) | $ | 121,130 | |||||||||||||||||||||||
Federal government agencies | 154,470 | 229 | (24 | ) | 154,675 | |||||||||||||||||||||||||||
FDIC insured corporate bonds | 22,219 | 186 | — | 22,405 | ||||||||||||||||||||||||||||
Treasury bills | 42,758 | 43 | — | 42,801 | ||||||||||||||||||||||||||||
Equities | 1,800 | — | (299 | ) | 1,501 | |||||||||||||||||||||||||||
| 342,025 | 815 | (328 | ) | 342,512 | ||||||||||||||||||||||||||||
Long-term Investments: | ||||||||||||||||||||||||||||||||
Municipal and pre-refunded municipal bonds | 35,699 | 302 | (29 | ) | 35,972 | |||||||||||||||||||||||||||
Federal government agencies | 116,625 | 394 | (111 | ) | 116,908 | |||||||||||||||||||||||||||
FDIC insured corporate bonds | 32,652 | 263 | — | 32,915 | ||||||||||||||||||||||||||||
Treasury bills | 24,055 | 90 | — | 24,145 | ||||||||||||||||||||||||||||
Auction rate securities | 37,625 | — | (4,120 | ) | 33,505 | |||||||||||||||||||||||||||
| 246,656 | 1,049 | (4,260 | ) | 243,445 | ||||||||||||||||||||||||||||
| $ | 588,681 | $ | 1,864 | $ | (4,588 | ) | $ | 585,957 | ||||||||||||||||||||||||
Proceeds from the sale and maturities of available-for-sale securities were $414,769, $571,236 $421,040 and $864,685$421,040 in fiscal 2012, 2011 2010 and 2009,2010, respectively. The Company included in otherinterest income, a net realized lossin the Consolidated Statements of $30 during fiscal 2011,Income, a net realized gain of $1,075$1,171 during fiscal 2010 and2012, a net realized loss of $896 during fiscal 2009. Amortization of discounts and premiums, net, resulted in charges of $8,702, $6,204 and $2,444 for fiscal years 2011, 2010, and 2009, respectively.
URBAN OUTFITTERS, INC.
NOTES TO CONSOLIDATED FINANCIAL STATEMENTS—(Continued)
(in thousands, except share and per share data)
realized loss of $30 during fiscal 2011 and a net realized gain of $1,075 during fiscal 2010. Amortization of discounts and premiums, net, resulted in a reduction to interest income of $7,373, $8,702 and $6,204 for fiscal years 2012, 2011, and 2010, respectively.
The following tables show the gross unrealized losses and fair value of the Company’s marketable securities with unrealized losses that are not deemed to be other-than-temporarily impaired aggregated by the length of time that individual securities have been in a continuous unrealized loss position, at January 31, 20112012 and January 31, 2010,2011, respectively.
| January 31, 2011 | January 31, 2012 | |||||||||||||||||||||||||||||||||||||||||||||||
| Less Than 12 Months | 12 Months or Greater | Total | Less Than 12 Months | 12 Months or Greater | Total | |||||||||||||||||||||||||||||||||||||||||||
Description of Securities | Fair Value | Unrealized Losses | Fair Value | Unrealized Losses | Fair Value | Unrealized Losses | Fair Value | Unrealized Losses | Fair Value | Unrealized Losses | Fair Value | Unrealized Losses | ||||||||||||||||||||||||||||||||||||
Corporate bonds | 45,089 | (100 | ) | — | — | 45,089 | (100 | ) | ||||||||||||||||||||||||||||||||||||||||
Municipal and pre-refunded municipal bonds | 103,090 | (567 | ) | — | — | 103,090 | (567 | ) | 9,985 | (9 | ) | 2,954 | (7 | ) | 12,939 | (16 | ) | |||||||||||||||||||||||||||||||
Auction rate securities | — | — | 20,197 | (2,778 | ) | 20,197 | (2,778 | ) | ||||||||||||||||||||||||||||||||||||||||
Treasury bills | 1,039 | — | — | — | 1,039 | — | ||||||||||||||||||||||||||||||||||||||||||
Certificate of deposit | 1,489 | (1 | ) | — | — | 1,489 | (1 | ) | ||||||||||||||||||||||||||||||||||||||||
Federal government agencies | 1,397 | (2 | ) | — | — | 1,397 | (2 | ) | 1,099 | (1 | ) | — | — | 1,099 | (1 | ) | ||||||||||||||||||||||||||||||||
FDIC insured corporate bonds | 67,359 | (154 | ) | — | — | 67,359 | (154 | ) | ||||||||||||||||||||||||||||||||||||||||
Auction rate securities | — | — | 29,462 | (3,788 | ) | 29,462 | (3,788 | ) | ||||||||||||||||||||||||||||||||||||||||
|
|
|
|
|
| |||||||||||||||||||||||||||||||||||||||||||
Total | 171,846 | (723 | ) | 29,462 | (3,788 | ) | 201,308 | (4,511 | ) | 58,701 | (111 | ) | 23,151 | (2,785 | ) | 81,852 | (2,896 | ) | ||||||||||||||||||||||||||||||
|
|
|
|
|
| |||||||||||||||||||||||||||||||||||||||||||
| January 31, 2010 | January 31, 2011 | |||||||||||||||||||||||||||||||||||||||||||||||
| Less Than 12 Months | 12 Months or Greater | Total | Less Than 12 Months | 12 Months or Greater | Total | |||||||||||||||||||||||||||||||||||||||||||
Description of Securities | Fair Value | Unrealized Losses | Fair Value | Unrealized Losses | Fair Value | Unrealized Losses | Fair Value | Unrealized Losses | Fair Value | Unrealized Losses | Fair Value | Unrealized Losses | ||||||||||||||||||||||||||||||||||||
FDIC insured corporate bonds | 67,359 | (154 | ) | — | — | 67,359 | (154 | ) | ||||||||||||||||||||||||||||||||||||||||
Municipal and pre-refunded municipal bonds | 25,468 | (34 | ) | — | — | 25,468 | (34 | ) | 103,090 | (567 | ) | — | — | 103,090 | (567 | ) | ||||||||||||||||||||||||||||||||
Auction rate securities | — | — | 29,462 | (3,788 | ) | 29,462 | (3,788 | ) | ||||||||||||||||||||||||||||||||||||||||
Federal government agencies | 55,988 | (135 | ) | — | — | 55,988 | (135 | ) | 1,397 | (2 | ) | — | — | 1,397 | (2 | ) | ||||||||||||||||||||||||||||||||
Equities | — | — | 1,501 | (299 | ) | 1,501 | (299 | ) | ||||||||||||||||||||||||||||||||||||||||
Auction rate securities | — | — | 37,625 | (4,120 | ) | 37,625 | (4,120 | ) | ||||||||||||||||||||||||||||||||||||||||
|
|
|
|
|
| |||||||||||||||||||||||||||||||||||||||||||
Total | 81,456 | (169 | ) | 39,126 | (4,419 | ) | 120,582 | (4,588 | ) | 171,846 | (723 | ) | 29,462 | (3,788 | ) | 201,308 | (4,511 | ) | ||||||||||||||||||||||||||||||
|
|
|
|
|
| |||||||||||||||||||||||||||||||||||||||||||
As of January 31, 20112012 and 2010,2011, there were a total of 12876 and 53128 issued securities with unrealized loss positions within the Company’s portfolio, respectively. The total unrealized loss position due to write-downsthe impairment of ARS held by the Company that have experienced auction failures as of January 31, 2012 and 2011 was $2,778 and 2010 was $3,788, and $4,120, respectively. The Company deemed all of these securities as temporarily impaired. The unrealized loss positions were primarily due to auction failures of the ARS held and fluctuations in the market interest rates for remaining securities. The Company believes it has the ability to realize the full value of all of these investments upon maturity or redemption.
URBAN OUTFITTERS, INC.
NOTES TO CONSOLIDATED FINANCIAL STATEMENTS—(Continued)
(in thousands, except share and per share data)
As of January 31, 2011,2012, the par value of our ARS was $33,250$22,975 and the estimated fair value was $29,462.$20,197. Our ARS portfolio consists of “A” or better rated ARS that represent interests in municipal and student loan related collateralized debt obligations, all of which are guaranteed by either government agencies and/or insured by private insurance agencies at 97% or greater of par value. To date, we have collected all interest payable on outstanding ARS when due and have not been informed by the issuers that accrued interest payments are currently at risk. The Company does not have the intent to sell the underlying securities prior to their recovery and the Company believes it is not likely that it will be required to sell the underlying securities prior to their anticipated recovery of full amortized cost.
URBAN OUTFITTERS, INC.
NOTES TO CONSOLIDATED FINANCIAL STATEMENTS—(Continued)
(in thousands, except share and per share data)
4. Fair Value of Financial Assets and Financial Liabilities
The Company utilizes a hierarchy that prioritizes fair value measurements based on the types of inputs used for the various valuation techniques (market approach, income approach and cost approach that relate to its financial assets and financial liabilities). The levels of the hierarchy are described as follows:
Level 1: Observable inputs such as quoted prices in active markets for identical assets or liabilities.
Level 2: Inputs other than quoted prices that are observable for the asset or liability, either directly or indirectly; these include quoted prices for similar assets or liabilities in active markets and quoted prices for identical or similar assets or liabilities in markets that are not active.
Level 3: Unobservable inputs that reflect the reporting entity’sCompany’s own assumptions.
Management’s assessment of the significance of a particular input to the fair value measurement requires judgment and may affect the valuation of financial assets and liabilities and their placement within the fair value hierarchy. The Company’s financial assets that are accounted for at fair value on a recurring basis are presented in the table below:
| Marketable Securities Fair Value as of January 31, 2011 | Marketable Securities Fair Value as of January 31, 2012 | |||||||||||||||||||||||||||||||
| Level 1 | Level 2 | Level 3 | Total | Level 1 | Level 2 | Level 3 | Total | |||||||||||||||||||||||||
Assets: | ||||||||||||||||||||||||||||||||
Corporate bonds | $ | 95,935 | $ | — | $ | — | $ | 95,935 | ||||||||||||||||||||||||
Municipal and pre-refunded municipal bonds | $ | — | $ | 186,404 | $ | — | $ | 186,404 | — | 60,234 | — | 60,234 | ||||||||||||||||||||
Auction rate securities | — | — | 20,197 | 20,197 | ||||||||||||||||||||||||||||
Treasury bills | 14,988 | — | — | 14,988 | ||||||||||||||||||||||||||||
Certificates of deposit | — | 12,194 | — | 12,194 | ||||||||||||||||||||||||||||
Federal government agencies | 59,175 | — | — | 59,175 | 9,627 | — | — | 9,627 | ||||||||||||||||||||||||
FDIC insured corporate bonds | 23,555 | — | — | 23,555 | ||||||||||||||||||||||||||||
Corporate bonds | 137,559 | — | — | 137,559 | ||||||||||||||||||||||||||||
Treasury bills | 30,353 | — | — | 30,353 | ||||||||||||||||||||||||||||
Auction rate securities | — | — | 29,462 | 29,462 | ||||||||||||||||||||||||||||
Variable rate demand notes | — | 1,900 | — | 1,900 | ||||||||||||||||||||||||||||
Commercial paper | — | 3,592 | — | 3,592 | ||||||||||||||||||||||||||||
|
|
|
| |||||||||||||||||||||||||||||
| $ | 250,642 | $ | 188,304 | $ | 29,462 | $ | 468,408 | $ | 120,550 | $ | 76,020 | $ | 20,197 | $ | 216,767 | |||||||||||||||||
|
|
|
| |||||||||||||||||||||||||||||
| Marketable Securities Fair Value as of January 31, 2010 | ||||||||||||||||||||||||||||||||
| Level 1 | Level 2 | Level 3 | Total | |||||||||||||||||||||||||||||
Assets: | ||||||||||||||||||||||||||||||||
Municipal and pre-refunded municipal bonds | $ | — | $ | 157,102 | $ | — | $ | 157,102 | ||||||||||||||||||||||||
Federal government agencies | 271,583 | — | — | 271,583 | ||||||||||||||||||||||||||||
FDIC insured corporate bonds | 55,320 | — | — | 55,320 | ||||||||||||||||||||||||||||
Treasury bills | 66,946 | — | — | 66,946 | ||||||||||||||||||||||||||||
Auction rate securities | — | — | 33,505 | 33,505 | ||||||||||||||||||||||||||||
Equities | 1,501 | — | — | 1,501 | ||||||||||||||||||||||||||||
| $ | 395,350 | $ | 157,102 | $ | 33,505 | $ | 585,957 | |||||||||||||||||||||||||
URBAN OUTFITTERS, INC.
NOTES TO CONSOLIDATED FINANCIAL STATEMENTS—(Continued)
(in thousands, except share and per share data)
Level 1 assets consist of financial instruments whose value has been based on quoted market prices for identical financial instruments in an active market.
| Marketable Securities Fair Value as of January 31, 2011 | ||||||||||||||||
| Level 1 | Level 2 | Level 3 | Total | |||||||||||||
Assets: | ||||||||||||||||
Corporate bonds | $ | 137,559 | $ | — | $ | — | $ | 137,559 | ||||||||
Municipal and pre-refunded municipal bonds | — | 186,404 | — | 186,404 | ||||||||||||
Auction rate securities | — | — | 29,462 | 29,462 | ||||||||||||
Treasury bills | 30,353 | — | — | 30,353 | ||||||||||||
Federal government agencies | 59,175 | — | — | 59,175 | ||||||||||||
FDIC insured corporate bonds | 23,555 | — | — | 23,555 | ||||||||||||
Variable rate demand notes | — | 1,900 | — | 1,900 | ||||||||||||
|
|
|
|
|
|
|
| |||||||||
| $ | 250,642 | $ | 188,304 | $ | 29,462 | $ | 468,408 | |||||||||
|
|
|
|
|
|
|
| |||||||||
Level 2 assets consist of financial instruments whose value has been based on quoted prices for similar assets and liabilities in active markets as well as quoted prices for identical or similar assets or liabilities in markets that are not active.
Level 3 consists of financial instruments where there was no active market as of January 31, 20112012 and 2010.2011. As of January 31, 20112012 and 20102011 all of the Company’s level 3 financial instruments consisted of failed ARS of which there was insufficient observable market information to determine fair value. The Company estimated the fair values for these securities by incorporating assumptions that market participants would use in their estimates of fair value. Some of these assumptions included credit quality, collateralization, final stated maturity, estimates of the probability of being called or becoming liquid prior to final maturity, redemptions of similar ARS, previous market activity for the same investment security, impact due to extended periods of maximum auction rates and valuation models. As a result of this review, the Company determined its ARS to have a temporary impairment of $3,788$2,778 and $4,120$3,788 as of January 31, 20112012 and January 31, 2010,2011, respectively. The estimated fair values could change significantly based on future market conditions. The Company will continue to assess the fair value of its ARS for substantive changes in relevant market conditions, changes in its financial condition or other changes that may alter its estimates described above. Failed ARS represented approximately 3.6%
URBAN OUTFITTERS, INC.
NOTES TO CONSOLIDATED FINANCIAL STATEMENTS—(Continued)
(in thousands, except share and 4.5% of the Company’s total cash, cash equivalents and marketable securities as of January 31, 2011 and January 31, 2010, respectively.per share data)
Below is a reconciliation of the beginning and ending ARS securities balances that the Company valued using a Level 3 valuation for the fiscal years ended January 31, 2012 and 2011.
| Fiscal Year Ended January 31, 2012 | Fiscal Year Ended January 31, 2011 | |||||||
Balance at beginning of period | $ | 29,462 | $ | 33,505 | ||||
Total gains (losses) realized/unrealized: | ||||||||
Included in earnings | — | — | ||||||
Included in comprehensive income | 1,010 | 332 | ||||||
Settlements | (10,275 | ) | (4,375 | ) | ||||
Transfers in and/or out of Level 3 | — | — | ||||||
|
|
|
| |||||
Balance at end of period | $ | 20,197 | $ | 29,462 | ||||
|
|
|
| |||||
Unrealized losses included in accumulated other comprehensive loss related to assets still held at reporting date | $ | (2,778 | ) | $ | (3,788 | ) | ||
Total gains for the period included in earnings attributable to the change in unrealized gains or losses related to assets still held at reporting date | $ | — | $ | — | ||||
5. Property and Equipment
Property and equipment is summarized as follows:
| January 31, | ||||||||
| 2012 | 2011 | |||||||
Land | $ | 5,801 | $ | 2,387 | ||||
Buildings | 118,050 | 117,982 | ||||||
Furniture and fixtures | 306,020 | 273,621 | ||||||
Leasehold improvements | 676,644 | 606,020 | ||||||
Other operating equipment | 103,818 | 81,856 | ||||||
Construction-in-progress | 91,433 | 29,295 | ||||||
|
|
|
| |||||
| 1,301,766 | 1,111,161 | |||||||
Accumulated depreciation | (616,787 | ) | (524,815 | ) | ||||
|
|
|
| |||||
Total | $ | 684,979 | $ | 586,346 | ||||
|
|
|
| |||||
Depreciation expense for property and equipment for fiscal years ended 2012, 2011 and 2010.2010 was $100,739, $92,403 and $86,146, respectively.
| Fiscal Year Ended January 31, 2011 | Fiscal Year Ended January 31, 2010 | |||||||
Balance at beginning of period | $ | 33,505 | $ | 38,742 | ||||
Total gains (losses) realized/unrealized: | ||||||||
Included in earnings | — | — | ||||||
Included in other comprehensive income | 332 | 1,163 | ||||||
Purchases, issuances and settlements | (4,375 | ) | (6,400 | ) | ||||
Transfers in and/or out of Level 3 | — | — | ||||||
Balance at end of period | $ | 29,462 | $ | 33,505 | ||||
Unrealized losses included in accumulated other comprehensive income related to assets still held at reporting date | $ | (3,788 | ) | $ | (4,120 | ) | ||
Total gains for the period included in earnings attributable to the change in unrealized gains or losses related to assets still held at reporting date | $ | — | $ | — | ||||
URBAN OUTFITTERS, INC.
NOTES TO CONSOLIDATED FINANCIAL STATEMENTS—(Continued)
(in thousands, except share and per share data)
5. Property and Equipment
Property and equipment is summarized as follows:
| January 31, | ||||||||
| 2011 | 2010 | |||||||
Land | $ | 2,387 | $ | 2,387 | ||||
Buildings | 117,982 | 96,617 | ||||||
Furniture and fixtures | 273,621 | 242,123 | ||||||
Leasehold improvements | 606,020 | 552,095 | ||||||
Other operating equipment | 81,856 | 63,605 | ||||||
Construction-in-progress | 29,295 | 19,869 | ||||||
| 1,111,161 | 976,696 | |||||||
Accumulated depreciation | (524,815 | ) | (436,735 | ) | ||||
Total | $ | 586,346 | $ | 539,961 | ||||
Depreciation expense for property and equipment for fiscal years ended 2011, 2010 and 2009 was $92,403, $86,146 and $79,505, respectively.
6. Accrued Expenses and Other Current Liabilities
Accrued expenses and other current liabilities consist of the following:
| January 31, | January 31, | |||||||||||||||
| 2011 | 2010 | 2012 | 2011 | |||||||||||||
Accrued rents and estimated property taxes | $ | 9,329 | $ | 10,598 | ||||||||||||
Gift certificates and merchandise credits | 30,866 | 25,161 | $ | 34,331 | $ | 30,866 | ||||||||||
Accrued construction | 8,103 | 13,046 | 21,866 | 8,103 | ||||||||||||
Accrued income taxes | 22,466 | 5,216 | 14,462 | 22,466 | ||||||||||||
Sales return reserve | 10,967 | 11,367 | ||||||||||||||
Accrued rents and estimated property taxes | 9,118 | 9,329 | ||||||||||||||
Accrued sales taxes | 7,780 | 5,373 | 9,089 | 7,780 | ||||||||||||
Accrued payroll taxes | 3,980 | 5,901 | ||||||||||||||
Sales return reserve | 11,367 | 9,912 | ||||||||||||||
Other current liabilities | 14,017 | 13,388 | 22,249 | 17,997 | ||||||||||||
|
| |||||||||||||||
Total | $ | 107,908 | $ | 88,595 | $ | 122,082 | $ | 107,908 | ||||||||
|
| |||||||||||||||
7. Line of Credit Facility
On September 21, 2009,April 25, 2011, the Company amended its renewed and amended line of credit facility (the “Line”) with Wells Fargo Bank, N.A. (the “Bank”).National Association. This amendment added an additional borrowerextended the term of the Line for three years, increased the accordion feature from $100 million to $175 million, reduced the interest rate margin for certain cash advances and modified certain additional guarantors.financial covenants and terms. The Line iscontains a three-year revolving credit facility with an accordion feature allowing an increase in available credit up to $100,000 atsub-limit for borrowings by the Company’s discretion. On May 27, 2010,European subsidiaries that are guaranteed by the Company executed a fifth amendment to the Line increasing its credit limit to
URBAN OUTFITTERS, INC.
NOTES TO CONSOLIDATED FINANCIAL STATEMENTS—(Continued)
(in thousands, except share and per share data)
$80,000.Company. Cash advances bear interest at LIBOR plus 0.50% to 1.60%1.50% based on the Company’s achievement of prescribed adjusted debt ratios. The Line subjects the Company to various restrictive covenants, including maintenance of certain financial ratios and covenants such as fixed charge coverage and adjusted debt. The covenants also include limitations on the Company’s capital expenditures, ability to repurchase shares and the payment of cash dividends. On October 31, 2011, the Company further amended the Line to revise certain financial covenants which included removing the limitation on share repurchases, as well as to join certain subsidiaries of the Company as additional borrowers and guarantors and release certain others. As of and for the year ended January 31, 2011,2012, there were no borrowings under the Line. Outstanding letters of credit and stand-by letters of credit under the Line totaled approximately $55,478 and $36,281$59,685 as of January 31, 2011 and January 31, 2010, respectively.2012. The available credit, including the accordion feature, under the Line was $44,522 and $63,719$115,315 as of January 31, 2011 and January 31, 2010, respectively. The Company is negotiating a renewal of the Line with the Bank. As part of these negotiations, the Company was granted an extension of all of the existing terms, covenants and conditions of the Line through April, 2011. The Company expects that such renewal will satisfy its letter of credit needs through at least 2014.2012.
8. Income Taxes
The components of income before income taxes are as follows:
| Fiscal Year Ended January 31, | ||||||||||||
| 2011 | 2010 | 2009 | ||||||||||
Domestic | $ | 374,777 | $ | 333,824 | $ | 297,747 | ||||||
Foreign | 42,431 | 10,582 | 11,743 | |||||||||
| $ | 417,208 | $ | 344,406 | $ | 309,490 | |||||||
The components of the provision for income tax expense are as follows:
| Fiscal Year Ended January 31, | ||||||||||||
| 2011 | 2010 | 2009 | ||||||||||
Current: | ||||||||||||
Federal | $ | 127,390 | $ | 107,350 | $ | 103,907 | ||||||
State | 19,492 | 13,216 | 15,037 | |||||||||
Foreign | 6,095 | 1,786 | 533 | |||||||||
| 152,977 | 122,352 | 119,477 | ||||||||||
Deferred: | ||||||||||||
Federal | (6,698 | ) | 2,960 | (7,917 | ) | |||||||
State | (1,906 | ) | (365 | ) | (462 | ) | ||||||
Foreign | (123 | ) | (434 | ) | (972 | ) | ||||||
| (8,727 | ) | 2,161 | (9,351 | ) | ||||||||
| $ | 144,250 | $ | 124,513 | $ | 110,126 | |||||||
| Fiscal Year Ended January 31, | ||||||||||||
| 2012 | 2011 | 2010 | ||||||||||
Domestic | $ | 261,214 | $ | 374,777 | $ | 333,824 | ||||||
Foreign | 27,617 | 42,431 | 10,582 | |||||||||
|
|
|
|
|
| |||||||
| $ | 288,831 | $ | 417,208 | $ | 344,406 | |||||||
|
|
|
|
|
| |||||||
URBAN OUTFITTERS, INC.
NOTES TO CONSOLIDATED FINANCIAL STATEMENTS—(Continued)
(in thousands, except share and per share data)
The components of the provision for income tax expense are as follows:
| Fiscal Year Ended January 31, | ||||||||||||
| 2012 | 2011 | 2010 | ||||||||||
Current: | ||||||||||||
Federal | $ | 93,244 | $ | 127,390 | $ | 107,350 | ||||||
State | 14,199 | 19,492 | 13,216 | |||||||||
Foreign | 8,287 | 6,095 | 1,786 | |||||||||
|
|
|
|
|
| |||||||
| 115,730 | 152,977 | 122,352 | ||||||||||
|
|
|
|
|
| |||||||
Deferred: | ||||||||||||
Federal | (11,292 | ) | (6,698 | ) | 2,960 | |||||||
State | 124 | (1,906 | ) | (365 | ) | |||||||
Foreign | (982 | ) | (123 | ) | (434 | ) | ||||||
|
|
|
|
|
| |||||||
| (12,150 | ) | (8,727 | ) | 2,161 | ||||||||
|
|
|
|
|
| |||||||
| $ | 103,580 | $ | 144,250 | $ | 124,513 | |||||||
|
|
|
|
|
| |||||||
The Company’s effective tax rate was different than the statutory U.S. federal income tax rate for the following reasons:
| Fiscal Year Ended January 31, | ||||||||||||
| 2011 | 2010 | 2009 | ||||||||||
Expected provision at statutory U.S. federal tax rate | 35.0 | % | 35.0 | % | 35.0 | % | ||||||
State and local income taxes, net of federal tax benefit | 3.2 | 2.3 | 2.6 | |||||||||
Foreign taxes | (2.1 | ) | (0.6 | ) | (1.5 | ) | ||||||
Federal rehabilitation tax credits | (0.8 | ) | — | — | ||||||||
Other | (0.7 | ) | (0.5 | ) | (0.5 | ) | ||||||
Effective tax rate | 34.6 | % | 36.2 | % | 35.6 | % | ||||||
The significant components of deferred tax assets and liabilities as of January 31, 2011 and 2010 are as follows:
| January 31, | ||||||||
| 2011 | 2010 | |||||||
Deferred tax liabilities: | ||||||||
Prepaid expenses | $ | (1,551 | ) | $ | (815 | ) | ||
Depreciation | (15,922 | ) | (32,181 | ) | ||||
Gross deferred tax liabilities | (17,473 | ) | (32,996 | ) | ||||
Deferred tax assets: | ||||||||
Deferred rent | 43,005 | 54,563 | ||||||
Inventories | 5,434 | 5,575 | ||||||
Accounts receivable | 747 | 772 | ||||||
Net operating loss carryforwards | 5,123 | 4,795 | ||||||
Tax uncertainties | 4,433 | 4,594 | ||||||
Accrued salaries and benefits, and other | 13,496 | 8,549 | ||||||
Gross deferred tax assets, before valuation allowances | 72,238 | 78,848 | ||||||
Valuation allowances | (2,622 | ) | (2,196 | ) | ||||
Net deferred tax assets | $ | 52,143 | $ | 43,656 | ||||
Net deferred tax assets are attributed to the jurisdictions in which the Company operates. As of January 31, 2011 and 2010, respectively, $37,170 and $29,655 were attributable to U.S. federal, $13,546 and $11,632 were attributed to state jurisdictions and $1,427 and $2,369 were attributed to foreign jurisdictions.
As of January 31, 2011, certain non-U.S. subsidiaries of the Company had net operating loss carryforwards for tax purposes of approximately $6,965 that do not expire and certain U.S. subsidiaries of the Company had state net operating loss carryforwards for tax purposes of approximately $14,111 that expire from 2016 through 2031. At January 31, 2011, the Company had a
| Fiscal Year Ended January 31, | ||||||||||||
| 2012 | 2011 | 2010 | ||||||||||
Expected provision at statutory U.S. federal tax rate | 35.0 | % | 35.0 | % | 35.0 | % | ||||||
State and local income taxes, net of federal tax benefit | 3.2 | 3.2 | 2.3 | |||||||||
Foreign taxes | (2.1 | ) | (2.1 | ) | (0.6 | ) | ||||||
Federal rehabilitation tax credits | — | (0.8 | ) | — | ||||||||
Other | (0.2 | ) | (0.7 | ) | (0.5 | ) | ||||||
|
|
|
|
|
| |||||||
Effective tax rate | 35.9 | % | 34.6 | % | 36.2 | % | ||||||
|
|
|
|
|
| |||||||
URBAN OUTFITTERS, INC.
NOTES TO CONSOLIDATED FINANCIAL STATEMENTS—(Continued)
(in thousands, except share and per share data)
The significant components of deferred tax assets and liabilities as of January 31, 2012 and 2011 are as follows:
| January 31, | ||||||||
| 2012 | 2011 | |||||||
Deferred tax liabilities: | ||||||||
Prepaid expenses | $ | (1,402 | ) | $ | (1,551 | ) | ||
Depreciation | (4,761 | ) | (15,922 | ) | ||||
|
|
|
| |||||
Gross deferred tax liabilities | (6,163 | ) | (17,473 | ) | ||||
|
|
|
| |||||
Deferred tax assets: | ||||||||
Deferred rent | 37,024 | 43,005 | ||||||
Inventories | 3,093 | 5,434 | ||||||
Accounts receivable | 1,166 | 747 | ||||||
Net operating loss carryforwards | 5,684 | 5,123 | ||||||
Tax uncertainties | 7,651 | 4,433 | ||||||
Accrued salaries and benefits | 13,786 | 13,496 | ||||||
Other temporary differences | 4,437 | — | ||||||
|
|
|
| |||||
Gross deferred tax assets, before valuation allowances | 72,841 | 72,238 | ||||||
|
|
|
| |||||
Valuation allowances | (2,754 | ) | (2,622 | ) | ||||
|
|
|
| |||||
Net deferred tax assets | $ | 63,924 | $ | 52,143 | ||||
|
|
|
| |||||
Net deferred tax assets are attributed to the jurisdictions in which the Company operates. As of January 31, 2012 and 2011, respectively, $48,762 and $37,170 were attributable to U.S. federal, $12,374 and $13,546 were attributed to state jurisdictions and $2,788 and $1,427 were attributed to foreign jurisdictions.
As of January 31, 2012, certain non-U.S. subsidiaries of the Company had net operating loss carryforwards for tax purposes of approximately $10,503 that do not expire and certain U.S. subsidiaries of the Company had state net operating loss carryforwards for tax purposes of approximately $9,114 that expire from 2016 through 2032. As of January 31, 2011, the Company had a full valuation allowance for certain foreign and state net operating loss carryforwards where it was uncertain the carryforwards would be utilized. The Company had no valuation allowance for certain other foreign and state net operating loss carryforwards where management believes it is more likely than not the tax benefit of these carryforwards will be realized. As of January 31, 20112012 and 2010,2011, the non-current portion of net deferred tax assets aggregated $37,789$58,681 and $31,379,$37,789, respectively.
The cumulative amount of the Company’s share of undistributed earnings of non-U.S. subsidiaries for which no deferred taxes have been provided was $68,415$130,219 as of January 31, 2011.2012. These earnings are deemed to be permanently re-invested to finance growth programs.
URBAN OUTFITTERS, INC.
NOTES TO CONSOLIDATED FINANCIAL STATEMENTS—(Continued)
(in thousands, except share and per share data)
A reconciliation of the beginning and ending balances of the total amounts of gross unrecognized tax benefits is as follows:
| January 31, | January 31, | |||||||||||||||||||||||
| 2011 | 2010 | 2009 | 2012 | 2011 | 2010 | |||||||||||||||||||
Balance at the beginning of the period | $ | 7,532 | $ | 7,509 | $ | 7,805 | $ | 7,758 | $ | 7,532 | $ | 7,509 | ||||||||||||
Increases in tax positions for prior years | 43 | 948 | 24 | 3,466 | 43 | 948 | ||||||||||||||||||
Decreases in tax positions for prior years | (592 | ) | (116 | ) | (380 | ) | (310 | ) | (592 | ) | (116 | ) | ||||||||||||
Increases in tax positions for current year | 1,000 | 1,894 | 838 | 360 | 1,000 | 1,894 | ||||||||||||||||||
Settlements | (40 | ) | (924 | ) | (554 | ) | (2,259 | ) | (40 | ) | (924 | ) | ||||||||||||
Lapse in statute of limitations | (185 | ) | (1,779 | ) | (224 | ) | (351 | ) | (185 | ) | (1,779 | ) | ||||||||||||
|
|
| ||||||||||||||||||||||
Balance at the end of the period | $ | 7,758 | $ | 7,532 | $ | 7,509 | $ | 8,664 | $ | 7,758 | $ | 7,532 | ||||||||||||
|
|
| ||||||||||||||||||||||
The total amount of net unrecognized tax benefits that, if recognized, would impact the Company’s effective tax rate were $6,677$3,874 and $6,039$6,677 at January 31, 20112012 and 20102011 respectively. The Company accrues interest and penalties related to unrecognized tax benefits in income tax expense in the Consolidated Statements of Income, which is consistent with the recognition of these items in prior reporting periods. During the years ended January 31, 2012, 2011 2010 and 2009,2010, the Company recognized a benefit of $1,334, $437 $427 and $985$427 in interest and penalties. The Company hadaccrued $2,529 and $3,620 and $3,182 for the payment of interest and penalties accrued atas of January 31, 20112012 and 2010,2011, respectively.
The Company files income tax returns in the U.S. federal jurisdiction and various state and foreign jurisdictions. InDuring the year ended January 2010,31, 2012, the Company received ansettled its Internal Revenue Service examination report from the IRS setting forth proposed adjustments to the Company’s U.S. income tax returns for the periods ended January 31, 2005 through 2008. The Company has submitted an appeal with respect to certainrecognized the tax effect of this settlement for previous and future periods in the proposed adjustments. The timing for resolving such appeal to the IRS is uncertain.end of year balances. The Company is not subject to U.S. federal tax examinationsalso began a new Internal Revenue audit for years before fiscal 2005.periods ended January 31, 2009 and 2010. State and foreign jurisdictions that remain subject to examination range from fiscal 2002 to 20102011 with few exceptions. It is possible that the Federal or any state or foreign examination may be resolved within twelve months. Due to the potential for resolution of Federal appealsaudit and state examinations, and the expiration of various statutes of limitation, it is possible that the Company’s gross unrecognized tax benefits balance may change within the next twelve months by a range of zero to $3,411.
URBAN OUTFITTERS, INC.
NOTES TO CONSOLIDATED FINANCIAL STATEMENTS—(Continued)
(in thousands, except share and per share data)
$3,340.
9. Share-Based Compensation
The Company’s 2008 and 2004 Stock Incentive Plans each authorize up to 10,000,000 common shares, which can be granted as restricted shares,RSU’s, unrestricted shares, incentive stock options, nonqualified stock options, performance share units (“PSU’s”)PSU’s or as stock appreciation rights (“SAR’s”).SAR’s. Awards under these plans generally expire seven or ten years from the date of grant, or thirty days after termination of employment or six months after the date of death or termination due to disability of the grantee. As of January 31, 20112012 there were 9,251,2006,951,650 and 583,100902,516 common shares available to grant under the 2008 and 2004 Stock Incentive Plans, respectively.
A Lattice Binomial pricing model (“Model”) was used to estimate the fair value of stock options and SAR’s. The Model allows for assumptions such as the risk-free rate of interest, volatility and
URBAN OUTFITTERS, INC.
NOTES TO CONSOLIDATED FINANCIAL STATEMENTS—(Continued)
(in thousands, except share and per share data)
exercise rate to vary over time reflecting a more realistic pattern of economic and behavioral occurrences. The Company uses historical data on exercise timing to determine the expected life assumption. The risk-free rate of interest for periods within the contractual life of the award is based on U.S. Government Securities Treasury Constant Maturities over the expected term of the equity instrument. The expected volatility is based on a weighted average of the implied volatility and the Company’s most recent historical volatility.
Based on the Company’s historical experience, it has assumed an annualized forfeiture rate of 5% for its non-vested stock options and SAR’sshare based awards granted during the fiscal years ended January 31, 20112012 and 2010.2011. For stock optionsshare based awards granted in previous years that remain non-vested, an annualized forfeiture rate of 2% has been assumed. The Company will record additional expense if the actual forfeiture rate is lower than it estimated, and will record a recovery of prior expense if the actual forfeiture is higher than estimated.
StockShare based compensation expense, included in the Consolidated Statements of Income, for the fiscal years ended January 31, 2012, 2011 2010 and 20092010 was as follows:
| Fiscal Year Ended January 31, | ||||||||||||
| 2011 | 2010 | 2009 | ||||||||||
| (In thousands) | ||||||||||||
Stock Options | $ | 4,331 | $ | 2,975 | $ | 2,481 | ||||||
Stock Appreciation Rights | 463 | — | — | |||||||||
Performance Share Units | 5,929 | 1,349 | — | |||||||||
Restricted Shares | 2 | 442 | 1,156 | |||||||||
Total | $ | 10,725 | $ | 4,766 | $ | 3,637 | ||||||
URBAN OUTFITTERS, INC.
NOTES TO CONSOLIDATED FINANCIAL STATEMENTS—(Continued)
(in thousands, except share and per share data)
| Fiscal Year Ended January 31, | ||||||||||||
| 2012 | 2011 | 2010 | ||||||||||
Stock Options | $ | 2,886 | $ | 4,331 | $ | 2,975 | ||||||
Stock Appreciation Rights | 1,111 | 463 | — | |||||||||
Performance Share Units (1) | (959 | ) | 5,929 | 1,349 | ||||||||
Restricted Shares | 30 | 2 | 442 | |||||||||
|
|
|
|
|
| |||||||
Total | $ | 3,068 | $ | 10,725 | $ | 4,766 | ||||||
|
|
|
|
|
| |||||||
| (1) | Includes the reversal of $8,800 of previously recognized compensation expense in fiscal 2012, related to 1,054,466 PSU’s, granted to a former executive officer of the Company, that will not vest due to the service requirement not being met. |
Stock Options
The Company grants stock options which generally vest over a period of three orto five years. Stock options become exercisable over the vesting period in installments determined by the administrator, which can vary depending upon each individual grant. Stock options granted to non-employee directors generally vest over a period of one year. The following weighted average assumptions were used in the Model to estimate the fair value of stock options at the date of grant:
| Fiscal 2011 | Fiscal 2010 | Fiscal 2009 | Fiscal 2012 | Fiscal 2011 | Fiscal 2010 | |||||||||||||||||||
Expected life, in years | 4.3 | 4.2 | 4.3 | 3.5 | 4.3 | 4.2 | ||||||||||||||||||
Risk-free interest rate | 1.8 | % | 2.0 | % | 2.5 | % | 0.9 | % | 1.8 | % | 2.0 | % | ||||||||||||
Volatility | 49.9 | % | 51.4 | % | 41.4 | % | 50.0 | % | 49.9 | % | 51.4 | % | ||||||||||||
Dividend rate | — | — | — | — | — | — | ||||||||||||||||||
URBAN OUTFITTERS, INC.
NOTES TO CONSOLIDATED FINANCIAL STATEMENTS—(Continued)
(in thousands, except share and per share data)
The following table summarizes the Company’s stock option activity:
| Fiscal Year Ended January 31, 2011 | Fiscal Year Ended January 31, 2012 | |||||||||||||||||||||||||||||||
| Shares | Weighted Average Exercise Price | Weighted Average Remaining Contractual Term (years) | Aggregate Intrinsic Value | Shares | Weighted Average Exercise Price | Weighted Average Remaining Contractual Term (years) | Aggregate Intrinsic Value | |||||||||||||||||||||||||
Awards outstanding at beginning of year | 10,642,767 | $ | 21.01 | 8,330,683 | $ | 24.31 | ||||||||||||||||||||||||||
Granted | 452,500 | 38.09 | 100,000 | 36.07 | ||||||||||||||||||||||||||||
Exercised | (2,209,834 | ) | 10.92 | (1,912,967 | ) | 14.17 | ||||||||||||||||||||||||||
Forfeited / Cancelled | (489,199 | ) | 23.60 | |||||||||||||||||||||||||||||
Expired | (65,551 | ) | 32.04 | |||||||||||||||||||||||||||||
Forfeited or Expired | (487,066 | ) | 35.01 | |||||||||||||||||||||||||||||
| ||||||||||||||||||||||||||||||||
Awards outstanding at end of year | 8,330,683 | 24.31 | 4.3 | $ | 84,443 | 6,030,650 | 26.86 | 3.5 | $ | 23,918 | ||||||||||||||||||||||
Awards outstanding expected to vest | 8,130,747 | 24.31 | 4.3 | $ | 82,416 | 5,980,827 | 26.86 | 3.5 | $ | 23,344 | ||||||||||||||||||||||
| ||||||||||||||||||||||||||||||||
Awards exercisable at end of year | 6,854,134 | 22.06 | 4.0 | $ | 81,901 | 5,140,725 | $ | 25.63 | 3.3 | $ | 23,377 | |||||||||||||||||||||
| ||||||||||||||||||||||||||||||||
The following table summarizes other information related to stock options during the years ended January 31, 2012, 2011 2010 and 2009:2010:
| Fiscal Year Ended January 31, | ||||||||||||||||||||||||
| 2011 | 2010 | 2009 | Fiscal Year Ended January 31, | |||||||||||||||||||||
| (In thousands, except per share data) | 2012 | 2011 | 2010 | |||||||||||||||||||||
Weighted-average grant date fair value—per share | $ | 12.07 | $ | 8.35 | $ | 10.56 | $ | 10.36 | $ | 12.07 | $ | 8.35 | ||||||||||||
Intrinsic value of awards exercised | $ | 55,100 | $ | 16,613 | $ | 41,622 | $ | 22,615 | $ | 55,100 | $ | 16,613 | ||||||||||||
Net cash proceeds from the exercise of stock options | $ | 24,129 | $ | 3,250 | $ | 8,891 | $ | 4,136 | $ | 24,129 | $ | 3,250 | ||||||||||||
Actual income tax benefit realized from stock option exercises | $ | 12,847 | $ | 6,390 | $ | 13,434 | $ | 8,995 | $ | 12,847 | $ | 6,390 | ||||||||||||
The Company recognized tax benefits, related to stock options of $953, $1,336 $1,034 and $851,$1,034, in the accompanying Consolidated Statements of Income for the fiscal years ended January 31, 2012, 2011 and 2010, respectively. Total unrecognized compensation cost of stock options granted but not yet vested, as of January 31, 2012, was $6,044, which is expected to be recognized over the weighted average period of 2.09 years.
URBAN OUTFITTERS, INC.
NOTES TO CONSOLIDATED FINANCIAL STATEMENTS—(Continued)
(in thousands, except share and per share data)
and 2009, respectively. Total compensation cost of stock options granted but not yet vested, as of January 31, 2011, was $11,971, which is expected to be recognized over the weighted average period of 2.16 years.
The following table summarizes information concerning outstanding and exercisable stock options as of January 31, 2011:2012:
| Awards Outstanding | Awards Exercisable | Awards Outstanding | Awards Exercisable | |||||||||||||||||||||||||||||||||||||
Range of Exercise Prices | Amount Outstanding | Wtd. Avg. Remaining Contractual Life | Wtd. Avg. Exercise Price | Amount Exercisable | Wtd. Avg. Exercise Price | Amount Outstanding | Wtd. Avg. Remaining Contractual Life | Wtd. Avg. Exercise Price | Amount Exercisable | Wtd. Avg. Exercise Price | ||||||||||||||||||||||||||||||
$ 0.00 - $ 3.96 | 182,900 | 0.7 | $ | 1.86 | 182,900 | $ | 1.86 | 41,900 | 0.2 | $ | 2.86 | 41,900 | $ | 2.86 | ||||||||||||||||||||||||||
$ 3.97 - $ 7.92 | 668,300 | 2.4 | 4.70 | 668,300 | 4.70 | 630,500 | 1.4 | 4.72 | 630,500 | 4.72 | ||||||||||||||||||||||||||||||
$11.87 - $15.83 | 2,193,950 | 3.4 | 14.36 | 2,193,950 | 14.36 | 579,000 | 2.4 | 14.38 | 579,000 | 14.38 | ||||||||||||||||||||||||||||||
$15.84 - $19.79 | 167,500 | 5.2 | 19.03 | 86,667 | 19.73 | 138,750 | 4.2 | 19.12 | 80,000 | 19.77 | ||||||||||||||||||||||||||||||
$19.80 - $23.75 | 142,333 | 5.1 | 22.08 | 116,667 | 22.09 | 119,000 | 4.0 | 22.06 | 115,000 | 22.07 | ||||||||||||||||||||||||||||||
$23.76 - $27.71 | 502,000 | 4.6 | 25.61 | 472,000 | 25.65 | 497,000 | 3.6 | 25.62 | 472,000 | 25.65 | ||||||||||||||||||||||||||||||
$27.72 - $31.66 | 2,722,050 | 4.9 | 31.07 | 2,691,550 | 31.07 | 2,512,500 | 3.7 | 31.06 | 2,505,375 | 31.06 | ||||||||||||||||||||||||||||||
$31.67 - $35.62 | 552,100 | 5.6 | 32.84 | 97,840 | 32.71 | 494,600 | 4.5 | 32.98 | 161,960 | 32.62 | ||||||||||||||||||||||||||||||
$35.63 - $39.58 | 1,199,550 | 5.0 | 38.02 | 344,260 | 37.51 | 1,017,400 | 4.0 | 37.60 | 554,990 | 37.78 | ||||||||||||||||||||||||||||||
|
| |||||||||||||||||||||||||||||||||||||||
| 8,330,683 | 4.3 | 24.31 | 6,854,134 | 22.05 | 6,030,650 | 3.5 | $ | 26.86 | 5,140,725 | $ | 25.63 | |||||||||||||||||||||||||||||
|
| |||||||||||||||||||||||||||||||||||||||
Stock Appreciation Rights
The Company granted SAR’s during fiscal 2012 and 2011. There were no SAR’s issued or outstanding during fiscal 2010 or 2009.2010. These SAR’s generally vest over a five year period. Each vested SAR entitles the holder the right to the differential between the value of the Company’s common share price at the date of exercise and the value of the Company’s common share price at the date of grant. As of January 31, 2011,2012, none of these SAR’s had vested. The following weighted average assumptions were used in the Model to estimate the fair value of stock optionsSAR’s at the date of grant:
| ||||
| ||||
| ||||
| ||||
| Fiscal Year Ended January 31, | ||||||||
| 2012 | 2011 | |||||||
Expected life, in years | 4.8 | 5.3 | ||||||
Risk-free interest rate | 0.8 | % | 1.6 | % | ||||
Volatility | 48.8 | % | 47.9 | % | ||||
Dividend rate | — | — | ||||||
URBAN OUTFITTERS, INC.
NOTES TO CONSOLIDATED FINANCIAL STATEMENTS—(Continued)
(in thousands, except share and per share data)
The following table summarizes the Company’s SAR activity:
| Fiscal Year Ended January 31, 2011 | Fiscal Year Ended January 31, 2012 | |||||||||||||||||||||||||||||||
| Shares | Weighted Average Exercise Price | Weighted Average Remaining Contractual Term (years) | Aggregate Intrinsic Value | Awards | Weighted Average Exercise Price | Weighted Average Remaining Contractual Term (years) | Aggregate Intrinsic Value | |||||||||||||||||||||||||
Awards outstanding at beginning of year | — | $ | — | 488,800 | $ | 32.84 | ||||||||||||||||||||||||||
Granted | 495,100 | 32.84 | 208,500 | 26.89 | ||||||||||||||||||||||||||||
Exercised | — | — | — | — | ||||||||||||||||||||||||||||
Forfeited / Cancelled | (6,300 | ) | 32.80 | |||||||||||||||||||||||||||||
Expired | — | — | ||||||||||||||||||||||||||||||
Forfeited or Expired | (46,500 | ) | 32.80 | |||||||||||||||||||||||||||||
| ||||||||||||||||||||||||||||||||
Awards outstanding at end of year | 488,800 | 32.84 | 7.6 | $ | 491 | 650,800 | 30.91 | 7.0 | $ | — | ||||||||||||||||||||||
Awards outstanding expected to vest | 464,360 | 32.84 | 7.6 | $ | 466 | 618,260 | $ | 30.91 | 7.0 | $ | — | |||||||||||||||||||||
| ||||||||||||||||||||||||||||||||
Awards exercisable at end of year | — | — | — | $ | — | — | — | — | $ | — | ||||||||||||||||||||||
| ||||||||||||||||||||||||||||||||
Weighted average grant date fair value — per share | $ | 12.57 | ||||||||||||||||||||||||||||||
Weighted average grant date fair value—per share | $ | 9.50 | ||||||||||||||||||||||||||||||
Total unrecognized compensation cost of SARsSAR’s granted, but not yet vested as of January 31, 20112012 was $5,374,$5,589, which is expected to be recognized over the weighted average period of 4.63.7 years.
Performance Share Units
The Company grants PSU’s which vest based on the achievement of various company performance targets and external market conditions. The fair value of the PSU’s are determined using a Monte Carlo simulation. Once the Company determines that it is probable that the performance targets will be met, compensation expense is recorded for these awards. If any of these criteriaperformance targets are not met, the awards are forfeited. Each PSU is equal to one share of common stockshare with varying maximum award value limitations. PSU’s typically vest over a two to sevenfive year period.
The following table summarizes the Company’s PSU activity for the fiscal year ended January 31, 2011:2012:
| Shares | Weighted Average Fair Value | Shares | Weighted Average Fair Value | |||||||||||||
Non-vested awards outstanding at beginning of year | 1,139,116 | $ | 24.16 | 1,441,366 | $ | 24.57 | ||||||||||
Granted | 400,300 | 24.03 | 2,198,450 | 16.21 | ||||||||||||
Vested | (46,439 | ) | 16.44 | — | — | |||||||||||
Forfeited / Cancelled | (51,611 | ) | 20.99 | |||||||||||||
Forfeited | (1,115,866 | ) | 24.76 | |||||||||||||
| ||||||||||||||||
Non-vested awards outstanding at end of year | 1,441,366 | 24.57 | 2,523,950 | 17.23 | ||||||||||||
| ||||||||||||||||
The aggregate grant date fair value of PSU’s grantedawarded during fiscal 2012, 2011 and 2010 was $35,629, $9,621 and 2009 was $9,621, $26,932, and $1,238, respectively. The aggregate grant date fair value of PSU’s vested during fiscal 2011 was $1,060. No PSU’s vested during fiscal 2010 or 2009. Total unrecognized compensation cost related to non-vested PSU’s as of January 31, 2011 was $29,115 which is expected to be recognized over a weighted average period of 4.8 years.year 2012. The aggregate
URBAN OUTFITTERS, INC.
NOTES TO CONSOLIDATED FINANCIAL STATEMENTS—(Continued)
(in thousands, except share and per share data)
grant date fair value of PSU’s vested during fiscal year 2011 was $1,060. No PSU’s vested during fiscal year 2010. Unrecognized compensation cost related to non-vested PSU’s as of January 31, 2012 was $35,978 which is expected to be recognized over a weighted average period of 4.3 years.
Restricted SharesStock Units
ForThe Company grants RSU’s which vest based on the achievement of specified service and external market conditions. RSU’s typically vest over a three to five year period.
The following table summarizes the Company’s RSU’s activity for the fiscal year ended January 31, 2012:
| Shares | Weighted Average Fair Value | |||||||
Non-vested awards outstanding at beginning of year | 1,000 | $ | 36.64 | |||||
Granted | 10,000 | 20.08 | ||||||
Vested | (334 | ) | 36.64 | |||||
Exercised | — | — | ||||||
Forfeited / Cancelled | — | — | ||||||
|
| |||||||
Non-vested awards outstanding at end of year | 10,666 | 21.11 | ||||||
|
| |||||||
The aggregate grant date fair value of RSU’s awarded during fiscal 2012 and 2011 the Company granted 1,000 restricted shares which vest over a period of three years.was $201 and $37, respectively. There were no restricted shares issued during theRSU’s awarded in fiscal years ended January 31, 2010 and 2009.2010. The aggregate grant date fair value of the restricted sharesRSU’s vested during fiscal year 2012 was $36.64 which was based on the closing price of the Company’s common shares at the date of grant. As of January 31,$12. No RSU’s vested during fiscal years 2011 all grants of restricted shares remain unvested and total2010. Total unrecognized compensation cost for non-vested restricted sharesRSU’s granted as of January 31, 20112012 was $35,$195, which is expected to be recognized over the weighted average period of 2.84.2 years.
10. Shareholders’ Equity
On February 28, 2006, the Company’s Board of Directors approved a stock repurchase program which authorized the Company to repurchase up to 8,000,000 common shares. On November 16, 2010 and August 25, 2011, the Company’s Board of Directors approved two separate stock repurchase authorizations of 10,000,000 additional common shares. These additional authorizations supplemented the Company’s 2006 stock repurchase program.
During the fiscal years ended January 31, 2012 and 2011 the Company repurchased and subsequently retired 20,491,530 and 6,288,447 common shares at a total cost of $538,311 and $200,732, respectively. There were no share repurchases during the fiscal year ended January 31, 2010. The average cost per share of the repurchases for the fiscal years ended January 31, 2012 and 2011 was $26.27 and $31.92, respectively, including commissions. As of January 31, 2012, there were no common shares available for repurchase under the program.
In addition to shares repurchased under the stock repurchase program, during the fiscal years ended January 31, 2012 and 2011, the Company settled and subsequently retired 282,813 and
URBAN OUTFITTERS, INC.
NOTES TO CONSOLIDATED FINANCIAL STATEMENTS—(Continued)
(in thousands, except share and per share data)
112,770 common shares at a total cost of $7,167 and $3,986, respectively, from employees to meet minimum statutory tax withholding requirements.
As a result of the share repurchase activity noted above, the Company reduced the balance of additional paid-in-capital to zero. Subsequent share repurchase activity was recorded as a reduction of retained earnings. During the fiscal year ended January 31, 2012 the Company reduced retained earnings by $501,676 related to these share repurchases.
11. Net Income Per Common Share
The following is a reconciliation of the weighted average common shares outstanding used for the computation of basic and diluted net income per common share:
| Fiscal Year Ended January 31, | Fiscal Year Ended January 31, | |||||||||||||||||||||||
| 2011 | 2010 | 2009 | 2012 | 2011 | 2010 | |||||||||||||||||||
Basic weighted average shares outstanding | 166,896,322 | 168,053,502 | 166,793,062 | 154,025,589 | 166,896,322 | 168,053,502 | ||||||||||||||||||
Effect of dilutive options, non-vested shares and stock appreciation rights | 3,437,228 | 3,176,743 | 4,067,543 | 2,165,700 | 3,437,228 | 3,176,743 | ||||||||||||||||||
|
|
| ||||||||||||||||||||||
Diluted weighted average shares outstanding | 170,333,550 | 171,230,245 | 170,860,605 | |||||||||||||||||||||
Diluted weighted average common shares outstanding | 156,191,289 | 170,333,550 | 171,230,245 | |||||||||||||||||||||
|
|
| ||||||||||||||||||||||
For the fiscal years ended January 31, 2012, 2011 and 2010, and 2009, optionsawards to purchase 3,836,838 common shares ranging in price from $26.85 to $39.58, 1,324,238 awards to purchase common shares ranging in price from $32.89 to $39.58 optionsand 4,331,650 awards to purchase 4,331,650 shares ranging in price from $16.58 to $37.51 and options to purchase 3,351,338common shares ranging in price from $16.58 to $37.51, were excluded from the calculation of diluted net income per common share for the respective fiscal years because the effect wasimpact would be anti-dilutive.
As of January 31, 2012, 2,533,950 contingently issuable awards were excluded from the calculation of diluted net income per common share as they did not meet certain performance criteria.
11.12. Commitments and Contingencies
Leases
The Company leases its stores under non-cancelable operating leases. The following is a schedule by year of the future minimum lease payments for operating leases with original terms in excess of one year:
Fiscal Year | ||||||||
2012 | $ | 164,289 | ||||||
2013 | 166,290 | $ | 185,047 | |||||
2014 | 160,899 | 183,374 | ||||||
2015 | 153,742 | 175,947 | ||||||
2016 | 137,211 | 160,574 | ||||||
2017 | 139,948 | |||||||
Thereafter | 498,524 | 544,113 | ||||||
| ||||||||
Total minimum lease payments | $ | 1,280,955 | $ | 1,389,003 | ||||
| ||||||||
URBAN OUTFITTERS, INC.
NOTES TO CONSOLIDATED FINANCIAL STATEMENTS—(Continued)
(in thousands, except share and per share data)
Amounts noted above include commitments for 2036 executed leases for stores not opened as of January 31, 2011.2012. The majority of our leases allow for renewal options between five and ten years upon expiration of the initial lease term. The store leases generally provide for payment of direct operating costs including real estate taxes. Certain store leases provide for contingent rentals when sales exceed specified levels. Additionally, the Company has entered into store leases that require a percentage of total sales to be paid to landlords in lieu of minimum rent.
Rent expense consisted of the following:
| Fiscal Year Ended January 31, | Fiscal Year Ended January 31, | |||||||||||||||||||||||
| 2011 | 2010 | 2009 | 2012 | 2011 | 2010 | |||||||||||||||||||
Minimum and percentage rentals | $ | 143,919 | $ | 125,651 | $ | 112,907 | $ | 165,901 | $ | 143,919 | $ | 125,651 | ||||||||||||
Contingent rentals | 5,836 | 3,327 | 1,993 | 5,403 | 5,836 | 3,327 | ||||||||||||||||||
|
|
| ||||||||||||||||||||||
Total | $ | 149,755 | $ | 128,978 | $ | 114,900 | $ | 171,304 | $ | 149,755 | $ | 128,978 | ||||||||||||
|
|
| ||||||||||||||||||||||
The Company also has commitments for un-fulfilled purchase orders for merchandise ordered from our vendors in the normal course of business, which are liquidated within 12 months, of $278,079.$315,890. The majority of the Company’s merchandise commitments are cancellable with no or limited recourse available to the vendor until merchandise shipping date. The Company also has commitments related to contracts with construction contractors, fully liquidated upon the completion of construction, which is typically within 12 months, of $18,004.$16,292.
Benefit Plan
Full and part-time U.S. based employees who are at least 18 years of age are eligible after sixthree months of employment to participate in the Urban Outfitters 401(k) Savings Plan (the “Plan”). Under the Plan, employees can defer 1% to 25% of compensation as defined. The Company makes matching contributions in cash of $0.25 per employee contribution dollar on the first 6% of the employee contribution. The employees’ contribution is 100% vested while the Company’s matching contribution vests at 20% per year of employee service. The Company’s contributions were $1,365, $1,308 $1,171 and $1,090$1,171 for fiscal years 2012, 2011 2010 and 2009,2010, respectively.
Contingencies
The Company is party to various legal proceedings arising from normal business activities. Management believes that the ultimate resolution of these matters will not have a material adverse effect on the Company’s financial position, results of operations or cash flows.
12.13. Related Party Transactions
Drinker Biddle & Reath LLP (“DBR”), a law firm, provided general legal services to the Company. Fees paid to DBR during fiscal 2012, 2011 and 2010 were $2,509, $2,707 and 2009 were $2,707, $1,732,
URBAN OUTFITTERS, INC.
NOTES TO CONSOLIDATED FINANCIAL STATEMENTS—(Continued)
(in thousands, except share and $2,670, per share data)
respectively. Harry S. Cherken, Jr., a director of the Company, is a partner at DBR. Fees due to DBR for the fiscal years ended January 31, 2012, 2011 2010 and 20092010 were approximately $251,$273, $251 and $442,$251, respectively.
URBAN OUTFITTERS, INC.
NOTES TO CONSOLIDATED FINANCIAL STATEMENTS—(Continued)
(in thousands, except share and per share data)
The McDevitt Company, a real estate company, acted as a broker in substantially all of the Company’s new real estate transactions during fiscal 2012, 2011 2010 and 2009.2010. The Company has not paid any compensation to The McDevitt Company for such services, but the Company has been advised that The McDevitt Company has received commissions from other parties to such transactions. Wade L. McDevitt is the president and the sole shareholder of The McDevitt Company and brother-in-law of Scott A. Belair, one of the Company’s directors. There were no amounts due to The McDevitt Company as of January 31, 20112012 and January 31, 2010.2011. Mr. McDevitt’s wife, Wendy B. McDevitt, is an executive officer of the Company, serving as Global Co-PresidentPresident of the AnthropologieTerrain Brand.
The Addis Group (“Addis”), an insurance brokerage and risk management consulting company, acted as the Company’s commercial insurance broker and risk management consultant for the years ended January 31, 2012, 2011 2010 and 2009.2010. The Company has not paid any compensation to Addis for such services, but has been advised that Addis has received commissions from other parties to such transactions, to serve as risk manager under one linetransactions. Scott Addis, the brother-in-law of coverage. Scott AddisRichard A. Hayne, Chief Executive Officer, President and Chairman of the Board of the Company, is the President of The Addis Group and the brother-in-law of Richard A. Hayne, Chairman of the Board of Directors and President of the Company.Group. There were no amounts due to or from Addis as of January 31, 20112012 and January 31, 2010.2011.
13.14. Segment Reporting
The Company is a global retailer of lifestyle-oriented general merchandise with two reporting segments—”“Retail” and “Wholesale”. The Company’s Retail segment consists of the aggregation of its five brands operating through 372429 stores under the retail names “Urban Outfitters,” “Anthropologie,” “Free People”, “Terrain” and “Leifsdottir”“BHLDN” and includes their direct marketing campaigns which consist of five catalogs and nine web siteswebsites as of January 31, 2011.2012. Our Retail stores and their direct marketing campaigns are considered an operating segment. Net sales from the Retail segment accounted for more than 94% of total consolidated net sales for the years ended January 31, 2012, 2011 2010 and 2009.2010. The remainder is derived from the Company’s Wholesale segment that manufactures and distributes apparel to theits retail segment and to approximately 1,400 better department and specialty retailers worldwide.
The Company has aggregated its retail stores and associated direct marketing campaigns into a Retail segment based upon their shared management, customer base and economic characteristics. Reporting in this format provides management with the financial information necessary to evaluate the success of the segments and the overall business. The Company evaluates the performance of the segments based on the net sales and pre-tax income from operations (excluding inter-company charges) of the segment. Corporate expenses include expenses incurred and directed by the corporate office that are not allocated to segments. The principal identifiable assets for each operating segment are inventories and property and equipment. Other assets are comprised primarily of general corporate assets, which principally consist of cash and cash equivalents, marketable securities, and other assets,
URBAN OUTFITTERS, INC.
NOTES TO CONSOLIDATED FINANCIAL STATEMENTS—(Continued)
(in thousands, except share and per share data)
and which are typically not allocated to the Company’s segments. The Company accounts for inter-segment sales and transfers as if the sales and transfers were made to third parties making similar volume purchases.
URBAN OUTFITTERS, INC.
NOTES TO CONSOLIDATED FINANCIAL STATEMENTS—(Continued)
(in thousands, except share and per share data)
The accounting policies of the operating segments are the same as the policies described in Note 2, “Summary of Significant Accounting Policies.” Both the retail and wholesale segments are highly diversified. No customer comprises more than 10% of sales. A summary of the information about the Company’s operations by segment is as follows:
| Fiscal Year | Fiscal Year | |||||||||||||||||||||||
| 2011 | 2010 | 2009 | 2012 | 2011 | 2010 | |||||||||||||||||||
Net sales | ||||||||||||||||||||||||
Retail operations | $ | 2,153,792 | $ | 1,833,733 | $ | 1,724,558 | $ | 2,340,794 | $ | 2,153,792 | $ | 1,833,733 | ||||||||||||
Wholesale operations | 124,768 | 109,269 | 120,364 | 140,657 | 124,768 | 109,269 | ||||||||||||||||||
Intersegment elimination | (4,458 | ) | (5,187 | ) | (10,304 | ) | (7,650 | ) | (4,458 | ) | (5,187 | ) | ||||||||||||
|
|
| ||||||||||||||||||||||
Total net sales | $ | 2,274,102 | $ | 1,937,815 | $ | 1,834,618 | $ | 2,473,801 | $ | 2,274,102 | $ | 1,937,815 | ||||||||||||
|
|
| ||||||||||||||||||||||
Income from operations | ||||||||||||||||||||||||
Retail operations | $ | 418,403 | $ | 338,114 | $ | 297,572 | $ | 276,581 | $ | 418,403 | $ | 338,114 | ||||||||||||
Wholesale operations | 23,372 | 22,164 | 28,170 | 26,919 | 23,372 | 22,164 | ||||||||||||||||||
Intersegment elimination | (389 | ) | (202 | ) | (11,209 | ) | (709 | ) | (389 | ) | (202 | ) | ||||||||||||
|
|
| ||||||||||||||||||||||
Total segment operating income | 441,386 | 360,076 | 314,533 | 302,791 | 441,386 | 360,076 | ||||||||||||||||||
General corporate expenses | (27,183 | ) | (21,092 | ) | (15,098 | ) | (18,066 | ) | (27,183 | ) | (21,092 | ) | ||||||||||||
|
|
| ||||||||||||||||||||||
Total income from operations | $ | 414,203 | $ | 338,984 | $ | 299,435 | $ | 284,725 | $ | 414,203 | $ | 338,984 | ||||||||||||
|
|
| ||||||||||||||||||||||
Depreciation expense for property and equipment | ||||||||||||||||||||||||
Retail operations | $ | 91,267 | $ | 85,077 | $ | 78,892 | $ | 99,645 | $ | 91,267 | $ | 85,077 | ||||||||||||
Wholesale operations | 1,136 | 1,069 | 613 | 1,094 | 1,136 | 1,069 | ||||||||||||||||||
|
|
| ||||||||||||||||||||||
Total depreciation expense for property and equipment | $ | 92,403 | $ | 86,146 | $ | 79,505 | $ | 100,739 | $ | 92,403 | $ | 86,146 | ||||||||||||
|
|
| ||||||||||||||||||||||
Inventories | ||||||||||||||||||||||||
Retail operations | $ | 213,420 | $ | 178,567 | $ | 237,825 | $ | 213,420 | ||||||||||||||||
Wholesale operations | 16,141 | 7,563 | 12,248 | 16,141 | ||||||||||||||||||||
|
| |||||||||||||||||||||||
Total inventories | $ | 229,561 | $ | 186,130 | $ | 250,073 | $ | 229,561 | ||||||||||||||||
|
| |||||||||||||||||||||||
Property and equipment, net | ||||||||||||||||||||||||
Retail operations | $ | 582,241 | $ | 535,248 | $ | 681,501 | $ | 582,241 | ||||||||||||||||
Wholesale operations | 4,105 | 4,713 | 3,478 | 4,105 | ||||||||||||||||||||
|
| |||||||||||||||||||||||
Total property and equipment, net | $ | 586,346 | $ | 539,961 | $ | 684,979 | $ | 586,346 | ||||||||||||||||
|
| |||||||||||||||||||||||
Cash paid for property and equipment | ||||||||||||||||||||||||
Retail operations | $ | 142,791 | $ | 107,941 | $ | 111,658 | $ | 189,311 | $ | 142,791 | $ | 107,941 | ||||||||||||
Wholesale operations | 851 | 1,319 | 895 | 699 | 851 | 1,319 | ||||||||||||||||||
|
|
| ||||||||||||||||||||||
Total cash paid for property and equipment | $ | 143,642 | $ | 109,260 | $ | 112,553 | $ | 190,010 | $ | 143,642 | $ | 109,260 | ||||||||||||
|
|
| ||||||||||||||||||||||
URBAN OUTFITTERS, INC.
NOTES TO CONSOLIDATED FINANCIAL STATEMENTS—(Continued)
(in thousands, except share and per share data)
The Company has foreign operations in Europe and Canada. Revenues and long-lived assets, based upon the Company’s domestic and foreign operations, are as follows:
| Fiscal Year | ||||||||||||
| 2011 | 2010 | 2009 | ||||||||||
Net sales | ||||||||||||
Domestic operations | $ | 2,027,074 | $ | 1,752,787 | $ | 1,663,616 | ||||||
Foreign operations | 247,028 | 185,028 | 171,002 | |||||||||
Total net sales | $ | 2,274,102 | $ | 1,937,815 | $ | 1,834,618 | ||||||
Property and equipment, net | ||||||||||||
Domestic operations | $ | 497,521 | $ | 470,401 | ||||||||
Foreign operations | 88,825 | 69,560 | ||||||||||
Total property and equipment, net | $ | 586,346 | $ | 539,961 | ||||||||
URBAN OUTFITTERS, INC.
NOTES TO CONSOLIDATED FINANCIAL STATEMENTS—(Continued)
(in thousands, except share and per share data)
| Fiscal Year | ||||||||||||
| 2012 | 2011 | 2010 | ||||||||||
Net sales | ||||||||||||
Domestic operations | $ | 2,169,976 | $ | 2,027,074 | $ | 1,752,787 | ||||||
Foreign operations | 303,825 | 247,028 | 185,028 | |||||||||
|
|
|
|
|
| |||||||
Total net sales | $ | 2,473,801 | $ | 2,274,102 | $ | 1,937,815 | ||||||
|
|
|
|
|
| |||||||
Property and equipment, net | ||||||||||||
Domestic operations | $ | 557,512 | $ | 497,521 | ||||||||
Foreign operations | 127,467 | 88,825 | ||||||||||
|
|
|
| |||||||||
Total property and equipment, net | $ | 684,979 | $ | 586,346 | ||||||||
|
|
|
| |||||||||
14. Subsequent EventsF-33
Subsequent to January 31, 2011 and through April 1, 2011, the Company has repurchased and retired 4,824,869 common shares for approximately $148,675, which includes commissions, at an average price of $30.81 per share. These repurchases complete the Company’s 2006 stock repurchase program and leaves 5,666,684 shares available for repurchase under the 2010 program which was approved on November 16, 2010.
F-31