| ANNUAL REPORT PURSUANT TO SECTION 13 OR 15(d) | ||
| ¨ | TRANSITION REPORT PURSUANT TO SECTION 13 OR 15(d) | |
| Wisconsin | 39-0168610 | |
(State or other jurisdiction of incorporation or organization) | (I.R.S. Employer Identification No.) | |
| (Title of eachclass) | (Name of each exchange on which registered) | ||||
| Class A Common Stock, par value $0.20 per share | New York Stock Exchange | |||||
| Large accelerated filer | x | Accelerated filer | o | |
| Non-accelerated filer | o | Smaller-reporting company | o | |
| (do not check if a smaller reporting company) | ||||
The Industrial segment is primarily involved in the design, manufacture and distribution of branded hydraulic and mechanical tools to the maintenance, industrial, infrastructure and production automation markets. The Energy segment provides joint integrity products and services, customized offshore vessel mooring solutions, as well as Financial information related to the Company's reportable segments is included in Note 13, "Business Segment, Geographic and Customer Information" in the notes to the consolidated financial statements. excellence process utilizes various continuous improvement techniques to reduce costs and improve efficiencies across all locations and functions worldwide, thereby expanding profit margins. Strong cash flow generation is achieved by maximizing returns on assets and minimizing primary working capital needs. Our LEAD efforts also support our Growth + Innovation (“G + I”) initiative, a Al Masaood Trading. Tig Tesco Intl. energy asset owners. Fleetwood. Financial information related to the Company's geographic areas is included in Note 10, "Income Taxes" and Note 13, "Business Segment, Geographic and Customer Information" in the notes to the consolidated financial statements. Quarter 1 Quarter 2 Quarter 3 Quarter 4 At August 31, Name Position Robert C. Arzbaecher William Gustav H.P. Boel Mark E. Goldstein Sheri R. Grissom Brian K. Kobylinski Andrew G. Lampereur Sheri L. Roberts Theodore C. Wozniak mutual funds. Mr. Goldstein is also a director at Pall Corporation. experience to Actuant. Mr. Lampereur was also a director of Robbins & Myers, Inc. from 2005 through 2013. flows. difficulties in integrating and managing personnel, financial reporting and other systems used by the acquired businesses; the failure of acquired businesses to perform in accordance with our expectations; failure to achieve anticipated synergies between our business units and the business units of acquired businesses; the loss of customers of acquired businesses; or the loss of key managers of acquired businesses. agreements would adversely affect us. attract and retain qualified employees. If we are unable to attract and retain qualified individuals or our costs to do so increase significantly, our operations would be materially adversely affected. Industrial Energy Electrical Engineered Solutions Corporate and other Mine Safety Disclosures The Company’s Class A common stock is traded on the New York Stock Exchange under the symbol ATU. At September 30, Fiscal Period 2011 2010 In fiscal 28, 2012. 2013 Actuant Corporation S&P 500 Dow Jones US Diversified Industrials Statement of Earnings Data(1)(2): Net sales Gross profit Selling, administrative and engineering expenses Restructuring charges Impairment charges Amortization of intangible assets Operating profit Earnings from continuing operations Diluted earnings per share from continuing operations Cash dividends per share Diluted weighted average common shares outstanding Balance Sheet Data(at end of period)(2): Total assets Total debt Weasler Engineering, Inc. Mastervolt Intl. Holding B.V. Selantic Biach Industries Hydrospex Team Hydrotec The Cortland Companies Cortland Cable Company Sanlo, Inc. Superior Plant Services, LLC Templeton, Kenly & Co, Inc. BH Electronics, Inc. T.T. Fijnmechanica B.V. Injectaseal Deutschland GmbH Veha Haaksbergen B.V. Maxima Technologies Statements of Earnings Data: Net sales Cost of products sold Gross profit Selling, administration and engineering expenses Restructuring charges Impairment charges Amortization of intangible assets Operating profit Financing costs, net Other expense (income), net Earnings from continuing operations before income tax expense Income tax expense Earnings from continuing operations Loss from discontinued operations, net of income taxes Net earnings Other Financial Data: Depreciation Capital expenditures resulting subdued demand for our products and services. Consolidated operating profit for fiscal profits and assets. Net Sales Operating Profit Operating Profit % Net Sales Operating Profit Operating Profit % 2012 Energy segment operating profit increased earn-out provision. Net Sales Operating Profit Operating Profit % Net Sales Operating Profit (Loss) Operating Profit % 2012 Engineered Solutions segment operating profit following the refinancing of our Senior Notes in the third quarter of fiscal 2012. Net sales Net gain (loss) on disposal Loss from operations of discontinued businesses(1) Income tax benefit (expense) Loss from discontinued operations, net of income tax for the last three fiscal years: Net cash provided by operating activities Net cash used in investing activities Net cash provided by (used in) financing activities Effect of exchange rate changes on cash Net increase (decrease) in cash and cash equivalents Accounts receivable, net Inventory, net Accounts payable Net primary working capital Our Senior Credit Facility, which See Note Facility. in the range of $35 to 40 million, but could vary from that depending on business and growth opportunities. 2013 Long-term debt Interest on long-term debt Operating leases Acquisition deferred purchase price $7 million at August 31, 2012. We perform an analysis of the historical sales usage of the individual inventory items on hand and a reserve is recorded to adjust inventory cost to market value. The inventory valuation assumptions used are based on historical experience. We believe that such estimates are made based on consistent and appropriate methods; however, actual results may differ from these estimates under different assumptions or conditions. the values of assets in use, and often requires the application of judgment regarding estimates and assumptions. While the ultimate responsibility resides with management, for material acquisitions we retain the services of certified valuation specialists to assist with assigning estimated values to certain acquired assets and assumed liabilities, including intangible assets and tangible long-lived assets. Acquired intangible assets, excluding goodwill, are valued using a discounted cash flow methodology based authority rulings and changes in tax laws, changes in projected levels of taxable income and future tax planning strategies could affect the actual effective tax rate and tax balances recorded liabilities being translated into U.S. dollars, our reporting currency. INDEX TO FINANCIAL STATEMENT SCHEDULEPART IItem 1.Business 1 Item 1. Item 1A. Item 1B. Item 2. Item 3. Item 4. 8 Item 1B.Unresolved Staff Comments12Item 2.Properties12Item 3.Legal Proceedings13Item 4.(Removed and Reserved)13PART IIItem 5.14Item 6. 16Item 7. 17Item 7A. 28Item 8. 29Item 9. Item 9A. Item 9B. 69 Item 9A.Controls and Procedures69Item 9B.Other Information69PART IIIItem 10.70Item 11. 70Item 12. 70Item 13. 70Item 14. 70 PART IVItem 15. 71truck, automotive, agricultural, industrial, production automation, oil & gas, energy, power generation, maintenance, energy, marine, solar, infrastructure, residential and commercial construction, truck, automotive, specialty vehicle and retail electrical Do-It-Yourself (“DIY”)agriculture industries, market acceptance of existing and new products, successful integration of acquisitions and related restructuring, operating margin risk due to competitive pricing and operating efficiencies, supply chain risk, material, labor, or overhead cost increases, foreign currency risk, interest rate risk, commodity risk, the impact of geopolitical activity on the economy, the timing or strength of an economic uncertainty and the impact onrecovery in the Company’s served markets, litigation matters, the Company’s ability to access capital markets and other factors that may be referred to or noted in the Company’s reports filed with the Securities and Exchange Commission from time to time. We disclaim any obligation to publicly update or revise any forward-looking statements as a result of new information, future events or any other reason.fourthree operating and reportable segments as follows: Industrial, Energy Electrical and Engineered Solutions. umbilical, rope and cable solutions to the global oil & gas, power generation and energy markets. The Electrical segment is primarily involved in the design, manufacture and distribution of a broad range of electrical products to the retail DIY, wholesale, original equipment manufacturer (“OEM”), solar, utility, marine and other harsh environmentenergy markets. The Engineered Solutions segment provides highly engineered position and motion control systems to OEMsoriginal equipment manufacturers (“OEM”) in various on and off-highway vehicle markets, as well as, a variety of other products to the industrial and agricultural markets.internalcore sales growth (overall sales growth excluding the impact of acquisitions, divestitures and foreign currency rate changes) that exceeds the annual growth rates of the gross domestic product in the geographic regions in which we operate. In addition to internalcore sales growth, we are focused on acquiring complementary businesses. Following an acquisition, we seek to drive cost reductions, develop additional cross-selling opportunities and deepen customer relationships. We also focus on profit margin expansion and cash flow generation to achieve our financial objectives. Our LEAD (“Lean Enterprise Across Disciplines”) operational new process focused on improvingincreasing core sales growth. The cash flow that results from efficient asset management and improved profitability is used to reduce debt and fund both strategic acquisitions, treasury share repurchases and internal growth opportunities.TheseOur hydraulic and mechanical tools are marketed primarily through ourthe Enerpac, Simplex, Precision Sure-Lock and Milwaukee Cylinder brand names.TheOurThese hydraulic tools operate at very high pressures of approximately 5,000 to 12,000 pounds per square inch and are generally sold by a diverse group of industrial and specialty fluid power distributors to customers in the infrastructure, mining, steel mill, cement, rail, oil & gas, power generation and general maintenance industries. Key industrial distributors include W.W. Grainger, Applied Industrial Technologies, MSC, Maskin K. Lund, Industrial Air Tool and MSC, which collectively generate less than 10% of this segment’s sales. heavy lifting solutions, which combine hydraulics, steel fabrication and electronic controls with engineering and application knowledge, are typically utilized in major infrastructure projects (bridges, stadiums, tunnels and offshore platforms) for heavy lifting, launching & skidding or synchronous lifting applications.railroad, bridge, infrastructure and mining markets.security, reliability, up-time and productivity are key value drivers. Products include joint integrity tools and connectors for oil & gas and power generation installations, mooring solutions, as well as umbilical, rope and cable solutions. In addition to these products, the Energy segment also provides manpower services, including machining, engineering and maintenance activities. The products and services of the Energy segment are distributed and marketed under various brand names (principally Hydratight, D.L. Ricci, Morgrip, Cortland, FibronBX, Puget Sound Rope, Biach, Selantic, Viking SeaTech and Selantic)Jeyco) to OEMs, maintenance and service organizations and energy producers in emerging and developed countries.The Hydratight businesses also provideprovides manpower services where our highly trained technicians perform bolting, machining and joint integrity work for customers. Our joint integrity business operates to world class safety standards while delivering products and services through a localized infrastructure of rental and maintenance depots. Service, product sales and rental revenue each generate approximately one-third of our joint integrity sales. This business maintains strong relationships with a variety of leading firms such as Statoil, BJ Services, Petrobras, Baker Hughes, Bechtel and British Petroleum. umbilical, rope and cable solutions that maximize performance, safety and efficiency for customers in thevarious markets including oil & gas, heavy marine, subsea, ROV and seismic markets.seismic. With its global design and manufacturing capabilities, the Cortland business is able to provide customized synthetic ropes, heavy lift slings, electro-mechanicalspecialized mooring, rigging and towing systems, electro-optical-mechanical cables and umbilicals to customers, including leading firms such as CGG Veritas,Sercel, Expro, General Electric and Sercel.Halliburton. These products are utilized in critical applications, often deployed in harsh environments (sub seaoperating conditions (sub-sea oil & gas production, maintenance and exploration) and are required to meet robust safety standards. Additional custom designed products are also sold tointo a variety of other niche markets including mining, medical, security, aerospace and defense.ElectricalElectrical segment is involved in the design, manufacture and distribution of a broad range of electrical products to the retail DIY, OEM, electrical distribution, power transformation and harsh environment electrical markets. Our Electrical businesses share core competencies in product branding, distribution and channel management, global sourcing and managing the logistics of SKU intensive product lines. The Electrical segment sells its products through a combination of distributors, direct sales personnel and manufacturers’ representatives.The Electrical segment provides the retail DIY market with a variety of electrical tools and consumables such as wire strippers, electrical meters, connectors, terminals, cable ties, staples and other wire management products and conduit bending equipment under the Gardner Bender, Del City and A.W. Sperry brands. These products are sold to leading retailers such as Lowe’s, The Home Depot, Menards, True Value and Ace Hardware, as well as numerous electrical distributors and OEM’s. This segment also sells power transformation products in North America including low voltage, single-phase dry type transformers and custom toroidal transformers under the Acme Electric brand name and high voltage switches under the Turner Electric brand name. These transformers are sold through electrical wholesale distributors, as well as directly to OEMs such as Rockwell Automation, Eaton, Yaskawa and General Electric. Product offerings also include electrical components and systems for the harsh environment and marine markets under the Ancor, Marinco, Guest, Mastervolt and B.E.P Marine brand names. These products are primarily sold to various customers in the industrial, marine, power generation, industrial and retail markets, including West Marine, Applied Materials and Kohler. TheAugust 2013 acquisition of Mastervolt in fiscal 2011 increasedViking SeaTech (“Viking”) further expands the Electrical segment’s product offerings, including batteries, generators, battery chargers, inverters, display panels, wiringEnergy segment's geographic presence, technologies and fully integrated systems,services provided to the global energy market. Headquartered in Aberdeen, Scotland, Viking is an offshore support specialist providing a comprehensive range of equipment and services to the oil & gas industry. Viking servesEuropean solar markets. Solar products (primarily high efficiency solar inverters for residential and small commercial applications) are sold through local distributors and installers.instrumentation and flexible power transmission systems.instrumentation. Products in the Engineered Solutions segment are primarily marketed directly to OEMs through a technical sales organization. Within this segment, engineering capabilities, technical service, quality and established customer relationships are key competitive advantages.70%one-half of this segment’s revenue comes from the vehicle systemsVehicle Systems product line (Power-Packer, Gits and Power Gear brands), which is soldwith sales to the truck, automotive, off-highway and specialty vehicle markets. Products include hydraulic cab-tilt and latching systems which are sold to global heavy duty truck OEMs such as Volvo, Iveco, Scania, Paccar-DAF, FAW and CNHTC and automotive electro-hydraulic convertible top latching and actuation systems. The automotive convertible top actuation systems are utilized on both retractable soft and hard top vehicles manufactured by OEMs such as Daimler, Audi, Volkswagen, Renault, Peugeot, Saab, BMW, Volvo and Nissan. Our diesel engine air flow solutions, such as exhaust gas recirculation (EGR)(“EGR”) systems and air flow actuators, are used by diesel engine and turbocharger manufacturers to reduce emissions, improve fuel efficiency and increase horsepower. Primary end markets include heavy duty truck and off-highway equipment serving customers such as Caterpillar, DAF, Detroit Diesel, Garrett Turbochargers,Cummins, Honeywell and Borg Warner. We also sell actuation systems to various automotive and specialty vehicle OEMscustomers (principally in the defense, recreational vehicle and off-highway markets) such as Honeywell, BorgWarner, Oshkosh BAE Systems and Winnebago.fiscal 2011 acquisitionbroad range of Weasler Engineering further diversified the Engineered Solutions segment. Weasler is a global designer and manufacturer of highly engineered drive train components and systems for agricultural, lawn & turf and industrial markets. The diverse products, technologies and engineered solutions of Weasler Maxima Technologies,Engineering, maximatecc, Elliott Manufacturing Sanlo and Nielsen SessionsSanlo comprise the Other product linesline within the Engineered Solutions segment. Products include severe-duty electronic instrumentation (including displays and clusters, machine controls and sensors), HMI solutions and power transmission products (highly engineered drive trainpower transmission components including drive shafts, torque limiters, gearboxes, torsional dampers and torsional dampers), custom designed flexible shafts and push pull cable assemblies, custom steel cable assemblies and a comprehensive line of case, container and industrial hardware.shafts). These products are sold to a variety of niche markets including agricultural implement, lawn & turf, construction, forestry, industrial, aerospace, material handling and security.worldwide,globally, with our principal markets outside the United States being Europe and Asia. In fiscal 20112013 we derived approximately 48%43% of our net sales from the United States, 35%38% from Europe 12%and the Middle East, 14% from Asia and 5% from other areas. We have operations around the world and this geographic diversity allows us to draw on the skills of a global workforce, provides flexibility to our operations, allows us to drive economies of scale, provides revenue streams that may help offset economic trends that are specific to individual countries and offers us an opportunity to access new markets. In addition, we believe that our future growth depends, in part, on our ability to develop products and sales opportunities that successfully target developing countries. Although international operations are subject to certain risks, we continue to believe that a global presence is key to maintaining strong relationships with many of our global customers.approximated $18were $21 million $15, $17 million and $16$12 million in fiscal 2011, 20102013, 2012 and 2009,2011, respectively. We also incur significant costs in connection with fulfilling custom orders and developing unique solutions for unique customer applications,needs, which are not included in these research and development expense totals.640586 patents (excluding pending applications), we create products that satisfy specific customer needs and make tasks easier and more efficient for our customers. We own numerous United States and foreign patents and trademarks. No individual patent or trademark is believed to be of such importance that its termination would have a material adverse effect on our business.operations.of components we source from a network of global suppliers. We have implemented single piece flow methodology in most of our manufacturing plants, which reduces inventory levels, lowers “re-work” costs and shortens lead times to customers. We manufacture the majority of the products we sell, but strategically source components and finished goods from an established global network of qualified suppliers. Components are purchased frombuilt to our highly engineered specifications by a variety of suppliers, including those in low cost countries such as China, Turkey and Mexico. We have built strong relationships with our key suppliers and, while we single source certain of our components, we believe that in most cases there are several qualified alternative sources.Energy and ElectricalEnergy segments have relatively short order-to-ship cycles, while our OEM oriented Engineered Solutions segment has a longer cycle, and therefore typically has a larger backlog. We had order backlogs of approximately $260$209 million and $204 million at both August 31, 20112013 and 2010,2012, respectively. Substantially all orders are expected to be completed in the nextfilled within twelve months. While we typically enjoy a stronger second half of our fiscal year, our consolidated sales in total are not subject to significant seasonal fluctuations. 2011 2010 22 % 23 % 23 % 23 % 27 % 27 % 28 % 27 % 100 % 100 % 2013 2012 Quarter 1 (September-November) 24 % 24 % Quarter 2 (December - February) 23 % 24 % Quarter 3 (March - May) 27 % 27 % Quarter 4 (June- August) 26 % 25 % 100 % 100 % Employees2011,2013, we employed approximately 6,2006,700 individuals. Our employees are not subject to collective bargaining agreements, with the exception of approximately 375365 U.S. production employees, as well as certain international employees covered by government mandated collective labor agreements. We believe we have a good working relationship with our employees.17,14, “Contingencies and Litigation” in the notes to consolidated financial statements.20112013 are listed below. Age 53 51 President and Chief Executive Officer; Chairman of the BoardL. Axline 57 63Executive Vice President—Global Customer RelationshipsWilliam S. Blackmore55 Executive Vice President—Engineered Solutions Segment 68 66 Executive Vice President; Director 57 55 Executive Vice President and Chief Operating OfficerPresident; Director 49 47 Executive Vice President—Global Human Resources 47 45 Executive Vice President—Industrial Segment and Energy SegmentsChina 50 48 Executive Vice President and Chief Financial Officer 47 Executive Vice President—Energy Segment David L. Scheer 54 52 Executive Vice President—Electrical Segment 55 53 Executive Vice President—Business Development President and Chief Executive Officer and Chairman of the Board of Directors. Mr. Arzbaecher was namedwill continue in his role as Chairman of Board, but will step down as Chief Executive Officer of the Company at the January 2014 Annual Meeting, after having served as President and Chief Executive Officer of the Company in Augustsince 2000. HePrior to that, he served as Vice President and Chief Financial Officer of Actuantthe Company starting in 1994 and Senior Vice President in 1998. He served as Vice President, Finance of Tools & Supplies from 1993 to 1994. He joined Actuantthe Company in 1992 as Corporate Controller. From 1988 through 1991, Mr. Arzbaecher was employed by Grabill Aerospace Industries LTD, where he last held the position of Chief Financial Officer.William L. Axline, Executive Vice President—Global Customer Relationships. In fiscal 2011, Mr. Axline was appointed to the newly created position of Executive Vice President—Global Customer Relationships. Mr. Axline joined Actuant in January 2008 as Executive Vice President of the Electrical Segment. Prior to Actuant, Mr. Axline held the role of Executive Vice President, Chief Operating Officer of Fluidmaster,Arzbaecher is also a director at CF Industries Holding, Inc. from 2003 to 2007. Prior to joining Fluidmaster, he served as President, Chief Executive Officer, of Distribution America,and Fiduciary Management, Inc. from 2001 to 2003 and held the role of Vice President, General Manager at Alltrade, Inc. from 1999 to 2000. Mr. Axline also had over 27 years of leadership experience with The Stanley Works.(“Rexnord”) from 1997 to 2000. Prior to 1997, Mr. Blackmore held various general management positions at Rexnord and Pillar Industries.2530 years currently(in various executive roles) and has served as a member of the Board of Directors and an Executive Vice President in charge ofsince 2000. In addition to his Board responsibilities, Mr. Boel currently oversees our LEAD initiatives. Following the spin-off of the Company’s Electronics segment in fiscal 2000,Mr. Boel has announced that he leftwill retire from the Company as an employee but served as aand not stand for re-election to his Board of Directors role at the January 2014 Annual Meeting.During this time heMr Goldstein was employed by APW Ltd., where he last held the position of Senior Vice President. In September 2002, he rejoined the Company as an employee and was named business leader of the European Electrical business in addition to his Board responsibilities. Prior to the spin-off, he held various positions with Actuant, including President of the Industrial business segment, PresidentCompany and added to the Board of Engineered Solutions EuropeDirectors in August 2013, and President of Enerpac.Mark E. Goldstein,will assume Chief Executive Vice President and Chief Operating Officer.Officer responsibilities after the January 2014 Annual Meeting. Mr. Goldstein has beenwas Actuant’s Chief Operating Officer since fiscal 2007. He joined the Company in fiscal 2001 as the leader of the Gardner Bender business and was appointed Executive Vice President—Tools and Supplies in 2003.increasingly responsible human resourcesresource leadership positions with several leading global organizations including Johns Manville, McKechnie Group and General Electric. Ms. Grissom brings to Actuant over 20 years of global human resources experience.Energy Segments.China. Mr. Kobylinski joined Actuantthe Company in 1993 and progressed through a number of management roles within the Electrical Segment. He became Vice President of Business Development for Actuant in 2002 and was named Global Business Leader, Hydratight in 2005. InFrom 2007 to 2013, he was promoted to the position of Industrial and Energy Segment Leader.Leader and currently serves as the Industrial Segment Leader with responsibility for the Company's China operations. Prior to Actuant,joining the Company, Mr. Kobylinski was employed by Fort Howard Corporation and Federated Insurance.Actuantthe Company in 1993 as Corporate Controller, a position he held until 1996 when he was appointed Vice President of Finance for Gardner Bender. In 1998, Mr. Lampereur was appointed Vice President, General Manager for Gardner Bender. He was appointed to his present position in August 2000. Prior to joining Actuant,the Company, Mr. Lampereur held a number of financial management positions at Terex Corporation.(2005-2010) and Sigma Electric Manufacturing (2002-2005).from 2005 through 2010. Mr. Scheer also previously held various management positions at Rexel USA, Thomas & Betts and Electroline Manufacturing.risk factors discussed in this section should be considered together with other information in the Form 10-Krisks and shoulduncertainties described below are those that we have identified as material, but are not be considered the only risks and uncertainties facing us. If any of the Company.The Company’sevents contemplated by the following risks actually occurs, then our business, financial condition, or results of operations could be materially adversely affected. Additional risks and uncertainties not currently known to us or that we currently believe are immaterial also may adversely impact our business.flows or liquidity may be adversely affected by a prolonged economic downturn or economic uncertainty.gas, marine and electrical)gas) that typically are adversely affected by downward economic cycles. As global economic conditions deteriorate or economic uncertainty continues, our customers may experience deterioration of their businesses, which may delay or lengthen sales cycles. Unforeseen events may also require additional restructuring costs. Although we expect that the related cost savings and realization of efficiencies will offset the restructuring related costs over time, we may not achieve the net benefits. Like most industrial companies, our sensitivity to economic cycles may have a material effect on our financial condition, results of operations, cash flows and liquidity. for acquisitions on terms acceptable to us, our ability to identify acquisition candidates and increased competition for acquisitions. The process of integrating acquired businesses into our existing operations may result in unforeseen operating difficulties and may require additional financial resources and attention from management that would otherwise be available for the ongoing development or expansion of our existing operations. Failure to effectively execute our acquisition strategy or successfully integrate the acquired businesses could have an adverse effect on our financial condition, results of operations, cash flows and liquidity.2011,2013, goodwill and other intangible assets totaled $1,368$1,112 million, or about 67%52% of our total assets. The goodwill results from our acquisitions, representing the excess of cost over the fair value of the net tangible and other identifiable intangible assets we have acquired. We assess annually whether there has been impairment in the value of our goodwill or indefinite-lived intangible assets. If future operating performance at one or more of our reporting units were to fall significantly below current levels, we could be required to recognize a non-cash charge to operating earnings for goodwill or other intangible asset impairment. Any significant goodwill or intangible asset impairment wouldcould negatively affect our financial condition and results of operations. See Note 6, “Impairment Charges”3, “Discontinued Operations” in the notes to consolidated financial statements for more information regarding goodwill and intangible asset impairment charges recognized in fiscal 20102013 and 2009.If2012.failsreviews its operations for businesses which may no longer be aligned with its strategic initiatives and long-term objectives. During fiscal 2013, we announced our intention to divest the Electrical Segment (a discontinued operation at August 31, 2013). Divestitures pose risks and challenges that could negatively impact our business, including required separation/carve-out activities and costs, disputes with buyers or potential impairmentitsour customers do not accept the new products it develops, the Company’swe develop, our business could be adversely affected.productioncommercialization of new products or failure to gain market acceptance of new products and technologies may reduce future sales and adversely affect our competitive position. We continue to invest in the development and marketing of new products through our GrowthG + InnovationI process. There can be no assurance that we will have sufficient resources to make such investments, that we will be able to make the technological advances necessary to maintain competitive advantages or that we can recover major research and development expenses. If we fail to make innovations, launch products with quality problems or the market does not accept our new products, then our financial condition, results of operations, cash flows and liquidity could be adversely affected. A lack of successful new product developments may also cause customers to buy from a competitor or may cause us to have to lower our prices to compete. Our substantial debt level may adversely affect our future performance.ability to service our debt obligations would be harmed if we failfailure to comply with the financial and other covenants in our debt agreements.decreasereduction in our liquidity and impair our ability to pay amounts due on our indebtedness. Moreover, if we are required to repay any of our debt before it becomes due, we may be unable to borrow additional amounts or otherwise obtain the cash necessary to repay that debt, when due, which could seriously harm our business.the Company’sour manufacturing operations and suppliers are located outside the United States. Our international operations present special risks, primarily from currency exchange rate fluctuations, exposure to local economic and political conditions, export and import restrictions, controls on repatriation of cash and exposure to local political conditions. In particular, our results of operations have been significantly affected by fluctuations in foreign currency exchange rates, especially the euroEuro and British pound. For example, since approximately one-third of our revenue is generated in Europe, the weakening of the U.S. dollar against the euro and British pound in fiscal 2011 favorably impacted our results of operations due to the translation of non-U.S. dollar denominated revenues. In addition, there have been several proposals to reform international taxation rules in the United States. We earn a substantial portion of our income from international operations and therefore changes to United States international tax rules may have a material adverse effect on future results of operations or liquidity. To the extent that we expand our international presence, these risks may increase.we useare used in our products include steel, plastic resin, copper, brass, steel wire and rubber. Most of our suppliers are not currently parties to long-term contracts with us. Consequently, we are vulnerable to fluctuations in prices of such raw materials. If market prices for certain materials such as steel, plastic resin and copper rise, it could have a negative effect on our operating results and ability to manufacture our respective products on a timely basis. Factors such as supply and demand, freight costs and transportation availability, inventory levels, the level of imports and general economic conditions may affect the prices of raw materials that we need. If we experience a significant increase in raw material prices, or if we are unable to pass along increases in raw material prices to our customers, our results of operations could be adversely affected. In addition, an increasing portion of our products are sourced from low cost regions. Changes in export laws, taxes and disruptions in transportation routes could adversely impact our results of operations.Chief Operating Officer,President, Chief Financial Officer and executives in charge of our segments. We currently do not have employment agreements with most of these or other officers. The departure of key personnel without adequate replacement could severely disrupt our business operations. Additionally, we need qualified managers and skilled employees with technical and manufacturing industry experience to operate our businesses successfully. From time to time there may be shortages of skilled labor which may make it more difficult and expensive for us topatents,patent, trademark, copyright and trade secret laws, employee and third-party non-disclosure agreements and other contracts to establish and protect our technology and other intellectual property rights. The agreements may be breached or terminated, and we may not have adequate remedies for any breach, and existing trade secrets, patent and copyright law afford us limited protection. Policing unauthorized use of our intellectual property is difficult. A third party could copy or otherwise obtain and use our products or technology without authorization. Litigation may be necessary for us to defend against claims of infringement or to protect our intellectual property rights and could result in substantial cost to us and diversion of our efforts. Further, we might not prevail in such litigation which could harm our business.2011,2013, the Company operated the following facilities in its continuing operations (square footage in thousands): Number of Locations Distribution /
Sales /
Admin Square Footage Manufacturing Total Owned Leased Total 8 12 20 157 496 653 11 16 27 26 485 511 6 7 13 127 624 751 15 3 18 677 716 1,393 1 3 4 353 90 443 41 41 82 1,340 2,411 3,751 Number of Locations Square Footage Manufacturing Total Owned Leased Total Industrial 8 12 20 157 546 703 Energy 11 29 40 40 974 1,014 Engineered Solutions 18 5 23 634 817 1,451 Corporate and other 1 4 5 353 111 464 38 50 88 1,184 2,448 3,632 locationsfacilities are located in the United States, the United Kingdom, the Netherlands, Mexico, Turkey and China. We also maintain a presence in Australia, Austria,Azerbaijan, Brazil, Canada, Finland, France, Germany, Hong Kong, Hungary, India, Indonesia, Italy, Japan, Kazakhstan, Malaysia, Mexico, New Zealand, Norway, Poland, Russia, Singapore, South Africa, South Korea, Spain, TurkeySweden and the United Arab Emirates. See Note 108 “Leases” in the notes to the consolidated financial statements for information with respect to our lease commitments. In addition to the facilities above, we retain responsibility for approximately 14 owned or leasedfour facilities that are now idle and available for sale or sublease.covered byrecoverable through insurance. In our opinion, the resolution of these contingencies is not likely to have a material adverse effect on our financial condition, results of operation or cash flows. For further information refer to Note 17,14, “Contingencies and Litigation” in the notes to consolidated financial statements.(Removed and Reserved)Item 5. Market for Registrant’s Common Equity, Related Shareholder Matters and Issuer Purchases of Equity Securities Market Information2011,2013, there were 1,8091,655 shareholders of record of Actuant Corporation Class A common stock. The high and low sales prices of the common stock were as follows for the previous two fiscal years:
Year High Low June 1, 2011 to August 31, 2011 $ 27.65 $ 17.47 March 1, 2011 to May 31, 2011 29.29 23.94 December 1, 2010 to February 28, 2011 30.41 23.91 September 1, 2010 to November 30, 2010 23.97 20.06 June 1, 2010 to August 31, 2010 $ 21.74 $ 17.47 March 1, 2010 to May 31, 2010 23.87 18.10 December 1, 2009 to February 28, 2010 19.80 15.93 September 1, 2009 to November 30, 2009 17.31 13.37 Fiscal Year Period High Low 2013 June 1, 2013 to August 31, 2013 $ 37.22 $ 31.18 March 1, 2013 to May 31, 2013 34.61 29.16 December 1, 2012 to February 28, 2013 31.77 26.20 September 1, 2012 to November 30, 2012 31.33 25.38 2012 June 1, 2012 to August 31, 2012 $ 29.12 $ 24.23 March 1, 2012 to May 31, 2012 29.97 24.33 December 1, 2011 to February 29, 2012 28.94 20.05 September 1, 2011 to November 30, 2011 24.09 17.63 Dividends2011,2013, the Company declared a dividend of $0.04$0.04 per common share payable on October 14, 201115, 2013 to shareholders of record on September 30, 2011.2013. In fiscal 2010,2012, the Company declared a dividend of $0.040.04 per common share payable on October 15, 201016, 2012 to shareholders of record on September 30, 2010. Period June 1 to June 30, 2013 200,000 $ 31.67 3,658,606 July 1 to July 31, 2013 592,119 33.89 3,066,487 August 1 to August 31, 2013 50,000 34.76 3,016,487 842,119 $ 33.41 20062008 to August 31, 2011.COMPARISON OF 5 YEAR CUMULATIVE TOTAL RETURN.Among Actuant Corporation, the S&P 500 Indexand the Dow Jones US Diversified Industrials Index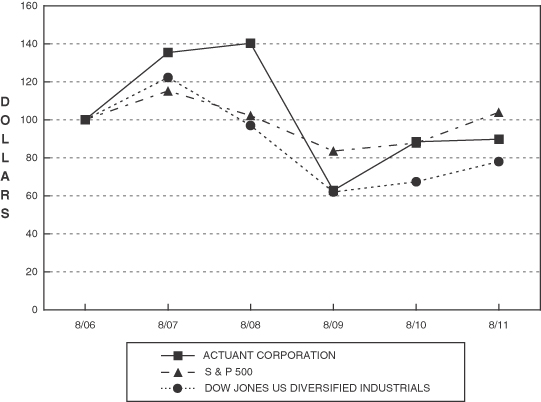
Copyright© 2011
Copyright© 2011 8/06 8/07 8/08 8/09 8/10 8/11 $ 100.00 $ 135.45 $ 140.31 $ 62.94 $ 88.51 $ 89.83 100.00 115.14 102.31 83.63 87.74 103.97 100.00 122.28 97.10 61.98 67.34 78.03 8/08 8/09 8/10 8/11 8/12 8/13 Actuant Corporation $ 100.00 $ 44.86 $ 63.08 $ 64.02 $ 89.83 $ 114.27 S&P 500 100.00 81.75 85.76 101.63 119.92 142.35 Dow Jones US Diversified Industrials 100.00 63.83 69.36 80.36 101.89 123.81 hashave been derived from the consolidated financial statements of the Company. The data should be read in conjunction with these financial statements and “Management’s Discussion and Analysis of Financial Condition and Results of Operations.” Year Ended August 31, 2011 2010 2009 2008 2007 (in millions, except per share data) $ 1,445 $ 1,161 $ 1,118 $ 1,446 $ 1,274 556 427 388 529 452 333 268 250 298 247 2 15 19 — — — — 31 — — 27 22 20 14 10 194 122 68 217 195 125 70 26 126 114 $ 1.68 $ 0.97 $ 0.43 $ 1.98 $ 1.83 0.04 0.04 0.04 0.04 0.04 75,305 74,209 66,064 64,833 63,628 $ 2,057 $ 1,622 $ 1,568 $ 1,668 $ 1,501 525 367 400 574 562 Year Ended August 31, 2013 2012 2011 2010 2009 (in millions, except per share data) Net sales $ 1,280 $ 1,277 $ 1,159 $ 927 $ 876 Gross profit 507 511 465 353 322 Selling, administrative and engineering expenses 292 285 268 221 201 Restructuring charges 2 — 2 11 13 Impairment charges — — — — 26 Amortization of intangible assets 23 22 22 19 17 Operating profit 190 204 173 102 65 Earnings from continuing operations 148 125 110 56 23 Diluted earnings per share from continuing operations $ 1.98 $ 1.68 $ 1.49 $ 0.78 $ 0.39 Cash dividends per share declared 0.04 0.04 0.04 0.04 0.04 Diluted weighted average common shares 74,580 74,940 75,305 74,209 66,064 Total assets $ 2,119 $ 2,007 $ 2,063 $ 1,622 $ 1,568 Total debt 515 398 525 367 400 (1) Results are from continuing operations and exclude the financial results of previously divested businesses (European Electrical, Acme Aerospace and BH Electronics) and discontinued operations (Electrical segment). (2) We have completed various acquisitions that impact the comparability of the selected financial data. The results of operations for these acquisitions are included in our financial results for the period subsequent to their acquisition date. The following table summarizes the significant acquisitions that were completed during the last five fiscal years: Segment Date Completed Sales(a) Engineered Solutions June 2011 $ 85 Electrical December 2010 110 Energy June 2010 10 Energy April 2010 5 Industrial April 2010 25 Industrial April 2010 5 September 2009 Energy 75 Engineered Solutions 25 Energy March 2008 25 Industrial September 2007 35 Electrical July 2007 35 Industrial April 2007 10 Energy January 2007 10 Industrial January 2007 5 Engineered Solutions December 2006 65 (a)Represents approximate annual sales (in millions) at the acquisition date. Acquisition Segment Date Completed Sales (a) Viking SeaTech Energy August 2013 $ 90 CrossControl AB Engineered Solutions July 2012 40 Turotest Medidores Ltda Engineered Solutions March 2012 13 Jeyco Pty Ltd Energy February 2012 20 Weasler Engineering, Inc. Engineered Solutions June 2011 85 Selantic Energy June 2010 10 Biach Industries Energy April 2010 5 Hydrospex Industrial April 2010 25 Team Hydrotec Industrial April 2010 5 The Cortland Companies September 2008 Cortland Cable Company Energy 75 Sanlo, Inc. Engineered Solutions 25 Discusseddiscussed in Item 1, “Business,” we are a global diversified company that manufactures a broad range of industrial products and systems and are organized into fourthree reportable segments, Industrial, Energy Electrical and Engineered Solutions. The Industrial segment is primarily involved in the design, manufacture and distribution of branded hydraulic and mechanical tools to the maintenance, industrial, infrastructure and production automation markets. The Energy segment provides joint integrity products and services, customized offshore vessel mooring solutions, as well as umbilical, rope and cable solutions to the global oil & gas, power generation and energy markets. The Electrical segment designs, manufactures and distributes a broad range of electrical products to the retail DIY, wholesale, OEM, solar, utility, marine and other harsh environment markets. The Engineered Solutions segment provides highly engineered position and motion control systems to OEMs in various vehicle markets, as well as a variety of other products to the industrial and agricultural markets.diversification to our overall enterprise. Most end markets we serve slowed dramatically in fiscal 2009 and into early fiscal 2010, as a result of the global recession. Since then, the majority of our end markets have improved, the result of increased global industrial output, improved worldwide demand for energy, elevated industrial manufacturing activities and increased production of vehicles for the heavy-duty truck, construction, military and agricultural markets.diversification. The long-term sales growth and profitability of our segments will depend not only on improved demand in end markets and the overall economic environment, but also on our ability to identify, consummate and integrate strategic acquisitions, develop and market innovative new products, expand our business activity geographically and continuously improve operational excellence. We remain focused on maintaining our financial strength by continually adjusting our cost structure to reflect changes in demand levels if needed, and by proactively managing working capital and cash flow generation. Our priorities during fiscal 20122014 include a continued focus on operational excellence, cash flow generation and growth initiatives (new product development, market share gains, geographic expansion and strategic acquisitions).Results of OperationsThe comparability of operating results has been impacted by acquisitions, divestitures and the economic conditions that existed in the end markets we serve. The operating results of acquired businesses are included in our consolidated financial statements only since their respective acquisition date. In addition to acquisitions, changes in foreign currency exchange rates also influence our financial results as approximately half of our sales are denominated in currencies other than the U.S. dollar. The year-over-year weakening of the U.S. dollar during fiscal 2011 favorably impacted our operating results due to the translation of non-U.S. dollar denominated results. Impairment charges, restructuring costs and the related benefits from previously completed restructuring projects also impact the comparability of financial results. Since fiscal 2009 we have taken significant actions to address our cost structure, including workforce reductions, consolidation of facilities and the centralization of certain selling and administrative functions. Year Ended August 31, 2011 2010 2009 $ 1,445 100 % $ 1,161 100 % $ 1,118 100 % 889 62 % 734 63 % 730 65 % 556 38 % 427 37 % 388 35 % 333 23 % 268 23 % 250 22 % 2 0 % 15 1 % 19 2 % — 0 % — 0 % 31 3 % 27 2 % 22 2 % 20 2 % 194 13 % 122 11 % 68 6 % 32 2 % 32 3 % 42 4 % 2 0 % 1 0 % (1 ) 0 % 160 11 % 89 8 % 27 2 % 35 2 % 19 2 % 1 0 % 125 9 % 70 6 % 26 2 % (13 ) -1 % (46 ) -4 % (12 ) -1 % $ 112 8 % $ 24 2 % $ 14 1 % $ 25 $ 25 $ 30 23 20 21 Year Ended August 31, 2013 2012 2011 Statements of Earnings Data: Net sales $ 1,280 100 % $ 1,277 100 % $ 1,159 100 % Cost of products sold 773 60 % 765 60 % 694 60 % Gross profit 507 40 % 512 40 % 465 40 % Selling, administrative and engineering expenses 294 23 % 285 22 % 270 23 % Amortization of intangible assets 23 2 % 22 2 % 22 2 % Operating profit 190 15 % 205 16 % 173 15 % Financing costs, net 25 2 % 30 3 % 32 3 % Debt refinancing costs — 0 % 17 1 % — 0 % Other expense, net 2 0 % 3 0 % 3 0 % Earnings from continuing operations before income tax 163 13 % 155 12 % 138 12 % Income tax expense 15 1 % 30 2 % 28 2 % Earnings from continuing operations 148 12 % 125 10 % 110 10 % Earnings (loss) from discontinued operations, net of income taxes (118 ) (9 )% (38 ) (3 )% 1 0 % Net earnings $ 30 3 % $ 87 7 % $ 111 10 % Other Financial Data: Depreciation $ 26 $ 25 $ 25 Capital expenditures 24 23 23 $284$3 million (25%) from $1,161$1,277 million in fiscal 2012 to $1,280 million million in fiscal 2010 to $1,445 million in fiscal 2011.2013. Excluding the $119$48 million of sales from acquired businesses and the $23$8 million favorable million unfavorable impact of foreign currency exchange rate changes, fiscal 20112013 consolidated core sales increased 13%decreased 3%. Consolidated netThe core sales increased by approximately $43 million (4%) from $1,118 milliondecline (compared to 4% core sales growth in fiscal 2009 to $1,161 million in fiscal 2010. Excluding the $14 millionprior year) is the result of sales from acquired businesseschallenging end market conditions and the $12 million favorable impact of foreign currency exchange rate changes, fiscal 2010 consolidated core sales increased 2% compared to the prior year. Changes in net sales at the segment level are discussed in further detail below.2011$194$190 million, compared with $122to $205 million and $68$173 million for fiscal 20102012 and 2009,2011, respectively. In addition to the impact of economic conditions, the comparability of results between periods is impacted by acquisitions, the $31 million impairment charge in fiscal 2009sales levels (operating leverage), product mix, variable incentive compensation expense and the timing and amount of restructuring charges and related benefits. ChangesRefer to Note 13,profit at the segment level are discussed in further detail below.During the fourth quarter of fiscal 2011,delivered its sixth consecutive quarter of year-over-year double digit core sales growth due to robust demand across nearly all geographic regions. This increased sales volume, coupled with the benefits of previous restructuring actions, drove significant year-over-year improvement in operating profits.moderated throughout fiscal 2013, as economic conditions globally weakened. The Industrial segment continues to focus on operational excellence (manufacturing, distribution, sourcing and supply chain management),innovative integrated solutions, the commercialization of new products and the expansion of its business in fast growing regions and vertical markets. Despite tepid economic conditions globally we believe the Industrial segment will continue to generate low single digit core sales growth over the next twelve months, driven by our vertical market initiatives, new product introductions and the benefit of G+I activities. The following table sets forth thesummary results of operations for the Industrial segment for the three most recent fiscal years (in millions): Year Ended August 31, 2011 2010 2009 $ 393 $ 300 $ 287 98 66 67 25.0 % 22.0 % 23.3 % Year Ended August 31, 2013 2012 2011 Net Sales $ 423 $ 419 $ 393 Operating Profit 118 115 98 Operating Profit % 27.8 % 27.4 % 25.0 % 20112013 compared to Fiscal 2010Compared to fiscal 2010, Industrial segment net sales increased $93 million (31%) during fiscal 2011. The acquisition of two Integrated Solutions businesses (Hydrospex and Team Hydrotec) contributed $36 million of sales for the twelve months ended August 31, 2011. Excluding sales from these acquisitions and the weaker U.S. dollar ($8 million), core sales growth for fiscal 2011 was 19%. In addition to generally improved macroeconomic conditions, the increased sales were the result of new product introductions and increased demand from distributors and end users in the mining, oil & gas and general maintenance industries.Industrial segment operating profits reached $98 million for the year ended August 31, 2011 compared to $66 million during fiscal 2010. 20122011 operating profit comparisons were favorably impacted by increased sales volumes and a $6 million reduction in restructuring costs. The expansion of the Industrial segment operating profit margin, despite unfavorable acquisition mix and additional costs associated with growth initiatives, was the result of a lower cost structure from past restructuring actions and increased production levels (higher absorption of fixed manufacturing costs).Fiscal 2010 compared to Fiscal 20092013Fiscal 2010 Industrial segment net sales increased by $13$4 million (5%(1%) to $300$423 million relative. Higher global integrated solutions sales and market share gains contributed to fiscal 2009. Excluding foreign currency rate changes (which favorably impacted fiscal 2010 sales by $6 million) and sales from acquired businesses,the modest core sales declined 1% duringgrowth in a time of global economic weakness and tough prior year comparables. Operating profit was $118 million in fiscal 2010. End markets2013, compared to $115 million in thefiscal 2012, a $3 million (2%) increase. Operating profit and related margins improved in fiscal 2013 due to productivity improvements, slightly higher sales and lower incentive compensation expense, which were somewhat offset by unfavorable product mix.were not significantly impactednet sales increased by the global economic environment until the second quarter of fiscal 2009, and therefore full year fiscal 2010 core sales comparisons were unfavorable. However, sales levels and the core sales trend improved significantly during the second half of fiscal 2010, primarily$26 million (7%) to $419 million, the result of increasingsolid industrial tool demand across most geographies. Excluding the unfavorable impact of foreign currency exchange rate changes ($7 million), year-over-year core sales growth for fiscal 2012 was 9%. Growth + Innovation initiatives, including targeted vertical market strategies on mining and bolting and integrated solutions market share gains, also contributed to sales growth. These higher sales volumes, coupled with favorable product mix and lower incentive compensation costs, resulted in operating profit margin expansion during fiscal 2012. Operating profit in fiscal 2012 grew 17% to $115 million, compared to $98 million in fiscal 2011.comparatively lower sales levelsother sources of energy have driven positive end market demand trends for the Energy segment. The Energy segment continues to focus on expanding its presence in the prior year period (dueglobal energy markets and successfully integrating the recent Viking acquisition. The Energy segment is expected to the impact of the recessiongenerate modest core sales growth in fiscal 2009).Industrial segment operating profit decreased by $1 million (2%) to $66 million in fiscal 2010. Despite increased sales levels, operating profit margins declined,2014, the result of $2 million of incremental restructuring costs in fiscal 2010 (related to the consolidation of facilities), unfavorable acquisition mixsolid maintenance and higher incentive compensation costs, somewhatumbilical activity, offset by cost savingscontinued soft demand from restructuring actions.Energy SegmentBeing a later cycle business, our Energy segment was the last of our four segments to recover from the global recession. Strong core sales growth during fiscal 2011 (including double-digit growth in the second half ofthe year) reflects increased global demandnon-energy markets (defense, marine and easier year-over-year comparisons resulting from the lower overall levels of demand that prevailed during fiscal 2010. Increased worldwide requirements for energy and higher oil prices during fiscal 2011 (despite recent declines) encouraged customers and asset owners to invest in capital projects or complete previously deferred maintenance activities. As a result, we experienced broad based strength across this segment in the second half of fiscal 2011.aerospace). The following table sets forth thesummary results of operations for the Energy segment for the three most recent fiscal years (in millions): Year Ended August 31, 2011 2010 2009 $ 293 $ 236 $ 260 49 31 44 16.8 % 13.1 % 16.9 % Year Ended August 31, 2013 2012 2011 Net Sales $ 363 $ 349 $ 293 Operating Profit 63 62 49 Operating Profit % 17.4 % 17.8 % 16.8 % 20112013 compared to Fiscal 201020112013 increased $57$14 million (24% (4%) to $293$363 million from $236$349 million a year ago. in the prior year. Excluding $17$12 million of sales from acquisitions and the Selantic$3 million unfavorable impact of foreign currency rate changes, year-over-year core sales grew 2% in fiscal 2013 due to overall market growth. Energy segment operating profit was $63 million in fiscal 2013 compared to $62 million in fiscal 2012. Excluding a $3 million favorable adjustment to an acquisition earn out provision in fiscal 2012, fiscal 2013 operating profit improved $4 million (7%), as a result of increased operating leverage (driven by higher sales volumes), favorable product mix and Biach acquisitionslower incentive compensation costs.favorablyunfavorably impacted fiscal 2011 sales by $6 million)$5 million), core sales increased 15%grew 19% in fiscal 2012. The increase wascore sales growth reflects market share gains and continued strong demand for our products, rental assets and technical manpower services across the result of higher activity levels across nearly all of the segment’s primary markets including capital project activity in the oil & gas market, maintenance related spending in North America and emerging markets and strong sales to the power generationglobal energy market.$18 (58% (26%) to $49$62 million in fiscal 20112012 compared to $31$49 million in fiscal 2010.2011. The year-over-year increaseimprovement in operating profit margins is primarily the result of continued productivity improvements, higher sales volumes and significantly increased operating leverage, a $2 million reduction in restructuring charges and favorable adjustment to an acquisition mix, partially offset by higher incentive compensation costs.Fiscal 2010 compared to Fiscal 2009Energy segment net sales in fiscal 2010 were $236 million, a $24 million (9%) reduction compared to fiscal 2009. Excluding sales from acquired businesses and foreign currency changes (which favorably impacted fiscal 2010 sales by $2 million), core sales decreased 10%Despite wide-spread weak demand during the year. This decline reflected the continued deferral of maintenance activities at certain oil & gas installations (especially in mature refinery markets) and lower capital project based revenue. The core sales trend improved slightly during the secondfirst half of fiscal 20102013 partially due to OEM inventory reduction efforts, demand has since improved in the off-highway and heavy-duty truck markets. Although end market demand is anticipated to be modest, we expect core sales growth in emerging markets, alternative energy and adjacent markets.Energythe Engineered Solutions segment operating profit decreased by $13 million (30%) to $31 million for fiscal 2010. Reduced operating profits were primarily due to low sales volumes, unfavorable product mix and an additional $1 million of restructuring costs in fiscal 2010, relative to fiscal 2009.Electrical SegmentMany of the end markets that the Electrical segment serves (including retail DIY, solar, construction and marine) continued to experience weak demand throughout fiscal 2011,2014, the result of ongoing weak consumer confidence, low construction market spendingnew product launches and uncertainty in worldwide economic conditions. Future Electrical segment results will be dependent on fluctuations in commodity costs, the realizationlack of price increases, changes in European solar feed-in tariffs and end market demand.inventory destocking by OEMs. The Electrical segment continues to focus on successfully integrating the Mastervolt businesscommercialization of new products and achieving the relatedexecution of restructuring initiatives to reduce cost savings and synergies.improve market competitiveness. The following table sets forth the results of operations for the Electrical segment (in millions): Year Ended August 31, 2011 2010 2009 $ 286 $ 234 $ 242 21 20 4 7.2 % 8.5 % 1.7 % Fiscal 2011 compared to Fiscal 2010Compared to the prior year, fiscal 2011 Electrical segment net sales increased $52 million (22%) to $286 million, with Mastervolt contributing sales of $49 million since its acquisition in December 2010. Excluding sales from this acquisition and favorable changes in foreign currency exchange rates, core sales were flat for fiscal 2011, compared to the prior year period.Electrical segment operating profit for fiscal 2011 was $21 million compared to $20 million in fiscal 2010. Excluding restructuring costs, operating profits declined in fiscal 2011 as a result of the timing of raw material cost increases and related customer price increases, expedited freight costs and temporary operating inefficiencies as we completed facility consolidations. Unfavorable mix, resulting from the Mastervolt acquisition, also negatively impacted current year operating profit margins, despite the higher sales levels and lower incentive compensation costs.Fiscal 2010 compared to Fiscal 2009Electrical segment net sales decreased by $8 million (3%) to $234 million in fiscal 2010. Foreign currency rate changes favorably impacted fiscal 2010 sales by $2 million. Excluding foreign currency rate changes, core sales declined 4% for the year, reflecting lower demand in the first half of fiscal 2010 across all end markets, especially retail DIY, commercial construction and utility markets.Electrical segment operating profit increased by $16 million, to $20 million for fiscal 2010, including a $5 million non-cash asset impairment charge related to the harsh environment electrical business and $2 million of incremental restructuring charges. Excluding these charges, the improvement in operating profit primarily reflected restructuring related cost savings as we realized the benefits of facility consolidations, reduced headcount and the movement of production and product sourcing to low cost countries.Engineered Solutions SegmentThe Engineered Solutions segment continued to see a rebound in demand from global heavy-duty truck, construction equipment and other markets which resulted in higher sales levels. As expected, year-over-year core sales growth moderated during the second half of fiscal 2011, reflecting tougher fiscal 2010 comparables and the anniversary of prior year new vehicle launches. The acquisition of Weasler in June 2011 is expected to provide future sales and earnings growth opportunities for the segment, by expanding the product offerings (primarily in the North American and European agricultural markets) and providing increased aftermarket sales opportunities. The following table sets forth thesummary results of operations for the Engineered Solutions segment for the three most recent fiscal years (in millions): Year Ended August 31, 2011 2010 2009 $ 473 $ 391 $ 329 64 32 (28 ) 13.4 % 8.2 % (8.5 %) Year Ended August 31, 2013 2012 2011 Net Sales $ 494 $ 508 $ 473 Operating Profit 40 61 64 Operating Profit % 8.2 % 12.0 % 13.4 % 20112013 compared to Fiscal 2010by $82$35 million (21% (7%) from $391to $508 million for the year ended August 31, 2010 to $473 million in the current year.fiscal 2012. Excluding the $26benefit of $84 million of sales generated by the recent Weasler acquisitionfrom acquired businesses and the impact ofheadwind from the weaker U.S. dollarEuro (which favorablyunfavorably impacted fiscal 2011 sales by $8 million)$12 million), core sales growth was 12% for fiscal 2011. The core sales growth reflects improveddeclined 9% from the prior year. This decline resulted from sharply lower demand and reduced production schedules from vehicle OEMs inOEM’s serving the globalconvertible top auto and European and China heavy-duty truck agriculture and construction equipment markets.was $64declined modestly to 2011 and $322012 compared to $64 million in the prior year. Year-over-year operating profit comparisons are impacted by $3 million of fiscal 2011 purchase accounting (Weasler) charges and $4 million of restructuring costs incurred in the prior year. Operating profitmargin expansion wasyear, primarily the result of increased manufacturing volume, continued productivity improvements and the benefits of previously completed restructuring actions, somewhat offset by higher incentive compensation costs and additional costs associated with growth initiatives.Fiscal 2010 compared to Fiscal 2009Engineered Solutions segment net sales increased by $62 million (19%) to $391 million for fiscal 2010. Excluding the $2 million favorable impact of foreign currency rate changes and sales from acquired businesses, core sales increased 15% in fiscal 2010. The core sales increase was a result of a strong rebound in demand in the Vehicle Systems product line (new automotive platforms, growth in China and Europe truck shipments and substantially higher recreational vehicle OEM production) and the impact of prior year inventory destocking by OEMs.Engineered Solutions segment operating profit increased by $60 million from an operating loss of $28 million in fiscal 2009 to an operating profit of $32 million for fiscal 2010. The loss from operations in fiscal 2009 included a $27 million non-cash asset impairment charge related to the RV business and an incremental $5 million of restructuring charges, relative to fiscal 2010. Excluding these charges, operating profit improved during fiscal 2010 due to increasedlower sales and production levels (higher absorption of fixed manufacturing costs), favorableunfavorable product mix, the benefits of completed restructuring activities and the favorable impact of foreign currency rate changes, which were partially offset by increased incentive compensation costs.Restructuring Chargesmix.In fiscal 2009, in response to the dramatic downturn in the worldwide economy, the Company committed to various restructuring initiatives including workforce reductions, plant consolidations to reduce manufacturing overhead, the continued movement of production and product sourcing to low cost countries and the centralization of certain selling and administrative functions. These actions were substantially completed by August 31, 2010, with limited restructuring activity and expense in fiscal 2011, which primarily related to facility exit lease charges. Total restructuring costs were $2 million, $17 million and $21 million for the years ended August 31, 2011, 2010 and 2009, respectively. We believe these restructuring actions better align our resources with strategic growth opportunities, optimize existing manufacturing capabilities, improve our overall cost structure and deliver increased free cash flow and profitability. See Note 4, “Restructuring” in the notes to the consolidated financial statements for further discussion on restructuring charges.Impairment ChargesSignificant adverse developments in the RV market during the first quarter of fiscal 2009, including sharply lower wholesale motorhome shipments by OEM’s, decreased consumer confidence and the lack of financing available to RV dealers and retail customers negatively impacted the financial results of our RV business. As a result, during the first quarter of fiscal 2009, we recognized a $27 million non-cash impairment charge related to the goodwill and long-lived assets of the RV business (Engineered Solutions segment).Difficult economic conditions, low consumer confidence, increased unemployment and tight credit markets during the third quarter of fiscal 2009 also negatively impacted consumer discretionary spending, resulting in a substantial reduction in recreational boating industry sales. During 2009, many OEM boat builders responded to the sharp drop in demand and high levels of finished goods inventory by temporarily suspending operations as well as eliminating brands and permanently closing facilities. As a result, in the third quarter of fiscal 2009, we recognized a $32 million non-cash asset impairment charge related to the goodwill, indefinite lived intangibles and long-lived assets of the harsh environment electrical business (Electrical segment). have not been allocated to our segments. Net financing costs were$25 million, $30 million and $32 million for the years ended August 31, 20112013, 2012 and 2010and $42 million for the year ended August 31, 2009. $10 million reduction in financing costsinterest expense in fiscal 2010, relative to fiscal 2009, was2013 reflects the resultconversion of substantiallyour 2% Convertible Notes into average debt levels and reduced interest rates on variable rate debt.carryforwards. carryforwards to reduce income tax expense. Income tax expense also includes the impact of provision to return adjustments, changes in valuation allowances and reserve requirements for unrecognized tax benefits.20112013 was 21.8%9.4%, compared to 21.1%19.0% and 2.3%20.2% in fiscal 2012 and 2011, respectively. The lower fiscal 2013 effective tax rate reflects the benefits of tax minimization planning, the utilization of tax net operating losses, favorable changes in tax laws, increased foreign tax credit utilization and favorable discrete items. Discrete period income tax benefits in fiscal 2013 included a $10 million reversal of tax reserves established in prior years (as a result of the lapsing of non-U.S. income tax statues of limitations) and an $11 million adjustment to properly state deferred tax balances related to equity compensation programs (see to Note 1, “Summary of Significant Accounting Policies” in the notes to the consolidated financial statements for further discussion). Fiscal 2012 income tax expense included a $6 million discrete income tax benefit resulting from debt refinancing while fiscal 2011 income tax expense included a $4 million benefit from a favorable adjustment to a valuation allowance.2009, respectively.market conditions and regulatory changes. Substantially all of Mastervolt's solar sales are in Europe. Solar demand has been adversely impacted by weak European economic conditions, government subsidy policy changes and budget challenges and the resulting austerity actions that have impacted solar subsidies, consumer confidence and access to credit. As a result of financial challenges facing European governments, significant reductions were made to solar feed in tariff (“FiT”) incentives, which increased the volatility of solar demand, and made investments in solar systems less attractive to potential buyers. Reduced FiT's unfavorably impact our customers' return on investment in solar systems, thereby creating downward pressure on solar inverter pricing. During the fourth quarter of fiscal 2012, reduced incentive schemes were announced and implemented in Mastervolt's key served markets (United Kingdom, France, Belgium, Germany and Italy). The income tax expense recognizedcombination of all of these factors reduced Mastervolt's solar sales and margins. This necessitated several actions, including negotiating lower product cost from Mastervolt's suppliers, increasing our efforts to reduce solar inventory levels, initiating management changes, narrowing the focus of the solar business to certain key markets and product lines and reducing overhead through facility closures and headcount reductions.20112012, excluding the $63 million fourth quarter non-cash impairment charge. Despite the year-over-year improvement in operating results in the second half of fiscal 2012 (relative to operating losses in the prior year comparable periods) the business continued to underperform relative to expectations in its solar product line. While we believe the solar industry will continue to grow, we reduced Mastervolt's long-term sales and 2010 benefited fromprofitability expectations as a result of continued pricing pressure, the utilizationfrequent imbalance between solar industry inverter supply and demand (resulting in excess inventory) and the volatile nature of foreign tax credits, increased taxable earningsend market demand given frequent unfavorable FiT changes. We also reviewed the long-term strategic fit of the Mastervolt business in foreign jurisdictions (with statutory tax rates lower than the U.S. statutory rate)fourth quarter of fiscal 2012, as part of our annual strategic plan and favorable changesportfolio management process. Various actions to address the Mastervolt business, and the solar product line in valuation allowances, whichparticular, were offset somewhat by unfavorable provisionconsidered, including continuing to return adjustmentsoperate and invest in the business, implementing significant restructuring and downsizing actions or exiting the entire business or the solar product line through a possible closure or sale. The adverse business, economic and competitive factors, coupled with the uncertainty regarding the long-term strategic fit of the business, resulted in a $63 million impairment charge during the fourth quarter of fiscal 2012. This consisted of the write-down of $37 million of goodwill and $26 million of indefinite lived intangible assets (tradename). The remaining carrying value of the Mastervolt business was $87 million at August 31, 2012 (including $3 million of net tangible assets and $84 million of intangible assets, goodwill and deferred income taxes).provisionsrestructuring actions including headcount reductions and facility closures in the Electrical segment to respond to weak overall demand and negative year-over-year core sales growth for unrecognized tax benefits.the segment. Following additional portfolio management discussions, we committed to a plan to divest the entire Electrical segment in May 2013. We have engaged an investment bank to assist us in the sale process and believe that a sale will be completed in the first half of fiscal 2014, subject to terms that are usual and customary for the sale of a business. The lower effective tax ratedivestiture will allow us to streamline our business portfolio and refocus on the remaining three segments in a way that better positions the Company to take advantage of our core competencies, current business model and global growth trends. As a result, we recognized an impairment charge in fiscal 20092013 of $159 million, including a write-down of $138 million of goodwill and $21 million of tradenames. Following this write-down, there is no remaining goodwill associated with the resultMastervolt reporting unit and $77 million of the tax benefit on the impairment and restructuring charges being recognized at the domestic tax rate (which is higher than our consolidated global effective tax rate) and the benefit of income tax reserve adjustments resulting from settling tax audits for amounts less than previously accrued and the lapsing of various tax statutes of limitations.Discontinued OperationsDiscontinued operations reflects the results of the divested Europeanremaining North American Electrical (sold in fiscal 2010), and Acme Aerospace and BH Electronics, Inc. (sold in fiscal 2009) businesses. Seegoodwill. Refer to Note 3, “Discontinued Operations” in the notes to the consolidated financial statements for further information.information regarding the carrying value of assets held for sale.: Year Ended August 31, 2011 2010 2009 $ 49 $ 106 $ 146 (16 ) — 18 (1 ) (41 ) (34 ) 4 (5 ) 4 $ (13 ) $ (46 ) $ (12 ) (1)Includes non-cash asset impairment charges of $36 million (European Electrical) and $27 million (BH Electronics) in fiscal 2010 and 2009, respectively. Year Ended August 31, 2013 2012 2011 Net sales $ 286 $ 329 $ 335 Operating profit 34 28 28 Impairment charges (159 ) (62 ) — Net loss on disposal (1) — — (16 ) Income tax benefit (expense) 7 (4 ) (11 ) Income (loss) from discontinued operations, net of taxes $ (118 ) $ (38 ) $ 1 Year Ended August 31, 2011 2010 2009 $ 172 $ 121 $ 147 (331 ) (57 ) (221 ) 158 (37 ) (30 ) 5 2 (7 ) $ 4 $ 29 $ (111 ) Year Ended August 31, 2013 2012 2011 Net cash provided by operating activities $ 194 $ 182 $ 172 Net cash used in investing activities (253 ) (83 ) (331 ) Net cash provided by (used in) financing activities 99 (72 ) 158 Effect of exchange rate changes on cash (4 ) (3 ) 5 Net increase in cash and cash equivalents $ 36 $ 24 $ 4 $172$172 million of cash flow from operations, reflecting improveda combination of strong earnings from continuing operations and effectivethe ongoing focus on working capital management. We utilized thethis cash flow, from operations,as well as borrowings under our Senior Credit Facility and the $4 million of proceeds from the sale of the European Electrical business to fund the $313 million of capital deployed on the acquisitions of Mastervolt and Weasler acquisitions (totaling $313 million) and $23$23 million of capital expenditures.In fiscal 2010, cash flows from operating activities were $121 million. Excluding the $37 million negative impact on working capital due to the expiration of our accounts receivable securitization program, net cash provided by operating activities increased relative to the prior year as a result of increased earnings from continuing operations, effective working capital management and the receipt of income tax refunds. These operating cash flows and the $8 million of proceeds from the sale of a portion of the European Electrical product line in the second quarter of fiscal 2010, funded $46 million of acquisitions and $20 million of capital expenditures, while reducing net debt by $67 million.Effective cash flow management during fiscal 2009 resulted in substantial cash flow from operating activities of $147 million and an improved financial position at August 31, 2009. Operating cash flows benefited from lower working capital, given the decline in sales levels. During fiscal 2009, cash flows from operations, along with the $125 million proceeds from a follow-on equity offering and $38 million of proceeds from the divestiture of two businesses, funded $239 million of business acquisitions (including the acquisition of the Cortland Companies), $21 million of capital expenditures and a net reduction in debt of $147 million. August 31, 2011 August 31, 2010 $ PWC % $ PWC % $ 224 14 % $ 186 15 % 223 14 % 146 12 % (170 ) (11 %) (130 ) (11 %) $ 277 17 % $ 202 16 % Our net primary working capital percentage increased year-over-year from 16% to 17% as of August 31, 2011, primarily due to the fiscal 2011 acquisitions and a conscious effort to increase inventory levels in certain businesses to meet growing customer demand. During fiscal 2011, excluding acquisitions and changes in foreign currency exchange rates, accounts receivable decreased $3 million and inventory increased $29 million, while accounts payable increased $7 million. August 31, 2013 August 31, 2012 $ PWC % $ PWC % Accounts receivable, net $ 219 16 % $ 235 15 % Inventory, net 143 10 % 212 13 % Accounts payable (154 ) (11 )% (175 ) (11 )% Net primary working capital $ 208 15 % $ 272 17 % Liquiditywas expanded and extended during the second quarter of fiscal 2011,matures on July 18, 2018, includes a $600$600 million revolving credit facility, a $100$90 million term loan and a $300$350 million expansion option. There are no requiredQuarterly principal repayments underpayments of $1 million begin on the term loan until March 31, 2012.on September 30, 2014, increasing to $2 million per quarter beginning on September 30, 2015, with the remaining principal due at maturity. At August 31, 2011,2013, we had $44$104 million of cash and cash equivalents and $540$472 million of unused capacity on the revolver (of(all of which $523 million was available for borrowings)to borrow). We believe that the remaining revolver availability under the Senior Credit Facility, combined with our existing cash on hand and anticipated operating cash flows will be adequate to meet operating, debt service, stock buyback, acquisition funding and capital expenditure requirements for the foreseeable future.Holders of our 2% Convertible Notes have the option to require us to repurchase all or a portion of their 2% Convertible Notes for cash on November 15, 2013 and November 15, 2018 at a price equal to 100% of the principal amount, plus accrued interest. Holders may also convert their 2% Convertible Notes into shares of the Company’s Class A common stock prior to the scheduled maturity date under certain conditions. Effective November 2010, we have the ability to redeem all or part of the 2% Convertible Notes for cash, at a redemption price equal to 100% of the principal amount, plus accrued interest.8,5, “Debt” in the notes to the consolidated financial statements for further discussion on the Senior Credit Facility and the 2% Convertible Notes.20112013 net sales.were $23 million, $20 million and $21 million in fiscal 2011, 2010 and 2009, respectively. Capital expenditures(which have historically been funded by operating cash flows.flows) were $24 million in fiscal 2013 and $23 million in both fiscal 2012 and 2011. Capital expenditures for fiscal 20122014 are expected to be approximately $30 million.10,8, “Leases,” in the notes to consolidated financial statements and the “Contractual Obligations” table below for further information.agreements entered into bypayments under leases of businesses that were part of our former Electronics segment, which was spun-off to shareholders in fiscal 2000.we previously divested or spun-off. Some of these businesses were subsequently sold to third parties. If any of these businesses do not fulfill their future lease$3$11 million at August 31, 2011.$9$11 million and $9 million at August 31, 20112013 and 2010,2012, respectively, the majority of which secure self-insured workers compensation liabilities.Off-Balance Sheet ArrangementsAs more fully discussed in Note 5, “Accounts Receivable Securitization” in the notes to consolidated financial statements, we were a party to an accounts receivable securitization arrangement under which we sold certain trade receivables to a wholly owned bankruptcy-remote special purpose subsidiary, which in turn, soldparticipating interests in the receivables to a third party financial institution. We did not renew the arrangement on its September 9, 2009 maturity date and, as a result, utilized availability under the Senior Credit Facility to fund the corresponding $37 million increase in accounts receivable. Payments Due 2012 2013 2014 2015 2016 Thereafter Total $ 3 $ 8 $ 10 $ 10 $ 128 $ 366 $ 525 23 23 23 23 21 31 144 22 18 15 11 8 31 105 1 7 — — — — 8 $ 49 $ 56 $ 48 $ 44 $ 157 $ 428 $ 782 The above table includes deferred purchase price and contingent consideration related to acquisitions completed in fiscal 2011 and previous years.The contractual obligation schedule for long-term debt assumes we do not call the remaining 2% Convertible Notes or have them put back to us prior to their maturity date of November 15, 2023. Payments Due 2014 2015 2016 2017 2018 Thereafter Total Long-term debt (principal) $ — $ 4 $ 9 $ 9 $ 193 $ 300 $ 515 Interest on long-term debt 20 20 20 20 19 61 160 Operating leases 24 19 16 13 10 39 121 Deferred acquisition purchase price 2 3 — 1 — — 6 $ 46 $ 46 $ 45 $ 43 $ 222 $ 400 $ 802 ThoseOnly those obligations that are not cancelable are included in the table.as such, are therefore excluded from the contractual obligationsthis table.at August 31, 2011 (excludedthat are excluded from the contractual obligations table). Our liabilities related to these plans arethis table, summarized in Note 11,9, “Employee Benefit Plans” in the notes to consolidated financial statements.12,10, “Income Taxes” in the notes to consolidated financial statements, we have unrecognized tax benefits of $26$18 million at August 31, 2011.2013. The liability for unrecognized tax benefits was not included in the table of contractual obligations because the timing of the potential settlements of these uncertain tax positions cannot be reasonably estimated.Inventories:Revenue recognition: We recognize revenue when persuasive evidence of an arrangement exists, delivery has occurred, the sales price is fixed or determinable and collectibility of the sales price is reasonably assured. For product sales, delivery does not occur until the passage of title and risk of loss have transferred to the customer (generally when products are shipped). Revenue from services are recognized when the services are provided or ratably over the contract term. We record allowances for discounts, product returns and customer incentives at the time of sale as a reduction of revenue as such allowances can be reliably estimated based on historical experience and known trends. We also offer warranty on our products and accrue for warranty claims at the time of sale based upon the length of the warranty period, historical warranty cost trends and any other related information.18%21% and 23%19% of total inventories at August 31, 20112013 and 2010,2012, respectively). The first-in, first-out or average cost method is used for all other inventories. If the LIFO method were not used, the inventory balance would be higher than the amount in the consolidated balance sheet by approximately $5$6 million at both August 31, 20112013 and 2010, respectively.Assets: Goodwill is tested for impairment annually,Assets:or changes in circumstances indicate thatoccur, we compare the asset might be impaired. We perform impairment reviews forestimated fair value of our reporting units usingto the carrying value to determine if a fair-value method based on our judgmentspotential goodwill impairment exists. If the fair value of a reporting unit is less than its carrying value, an impairment loss, if any, is recorded for the difference between the implied fair value and assumptions.the carrying value of the reporting unit's goodwill. The estimated fair value represents the amount at whichwe think a reporting unit could be bought or sold for in a current transaction between willing parties on an arms-length basis.model.model, which is dependent on a number of assumptions including estimated future revenues and expenses, weighted average cost of capital, capital expenditures and other variables. The estimatedexpected future revenue growth rates and operating profit margins are determined after taking into consideration our historical revenue growth rates and earnings levels, our assessment of future market potential and our expectations of future business performance. Under the discounted cash flow approach, the fair value is compared withcalculated as the carrying amountsum of the projected discounted cash flows over a discrete seven year period plus an estimated terminal value. In certain circumstances we also review a market approach in which a trading multiple is applied to a forecasted EBITDA (earnings before interest, income taxes, depreciation and amortization) of the reporting unit including goodwill.to arrive at the estimated fair value.annual impairment testing performedcarrying value of the North American Electrical reporting unit was $254 million at August 31, 20112012, including $174 million of goodwill from previously completed acquisitions. Key financial assumptions utilized to determine the fair value of the North American Electrical reporting unit included single digit sales growth (including 3% in the terminal year) and a 12.9% discount rate. The estimated future cash flows assumed improved profitability (relative to actual fiscal 2012 results) - driven by savings and efficiencies from the consolidation of manufacturing facilities (which was completed in late fiscal 2012). The assumptions that have the most significant impact on the determination of the fair value of the reporting unit are market valuation multiples, the discount rate and sales growth rates. A 100 basis point increase in the discount rate results in a decrease to the estimated fair value by approximately 9%, while a reduction in the terminal year sales growth rate assumption by 100 basis points would decrease the estimated fair value by approximately 5%. For the remaining seven reporting units, our annual goodwill impairment testing in fiscal 2012 indicated that the estimated fair value of each reporting unit exceeded the carrying value (expressed as a percentage of the carrying value) in excess of 30%.correspondingvolatile nature and recent industry consolidations/exits by suppliers, also negatively impacted market multiple assumptions (consistent with declining valuations of public solar companies). Our decision to divest the Electrical segment in May 2013 also impacted the impairment calculations, shortening the holding period of the businesses and placing more weighting on the market approach to determine the fair value of the reporting units.amount and, as such, no impairment existed. Indefinite-livedvalue of the Electrical segment may be required.TheOn an annual basis, the fair value of the indefinite lived assets, based on a relief of royalty model,income approach, are evaluated to determine if an impairment charge is required. In the fourth quarter of fiscal 2012 we recognized a $26 million impairment of the Mastervolt tradename - the result of a reduction in the assumed royal rate (from 3.5% to 2%) and lower projected long-term Mastervolt solar sales. In the third quarter of fiscal 2013 we also reassessed the recoverability of all Electrical segment tradenames as a result of the plan to divest the segment, and recognized an additional $21 million tradename impairment. The estimated fair value of the tradenames were adversely impacted by further reductions in royalty rate assumptions, an increase in the discount rate and lower projected sales volumes.Refer to Note 6, “Impairment Charges” inDuring the notes tothird quarter of fiscal 2013, we recognized an $11 million impairment of Electrical segment long-lived assets, representing the consolidated financial statements for further discussion on impairment charges recognized in fiscal 2010 and 2009.A considerable amountexcess of management judgment and assumptions are required in performing the impairment tests, principally in determining the fairnet book value of each reporting unit and the indefinite lived intangible assets. While we believe our judgments and assumptions are reasonable, different assumptions could changeassets held for sale over the estimated fair value, less selling costs. We re-assessed our initial estimate of fair value less selling costs (based on additional information available as a result of the sale process) as of August 31, 2013 and recognized an $11 million increase to the carrying value of the Electrical segment assets.therefore, impairment charges could be required.Plans:Plans: We provide a variety of benefits to employees and former employees, including in some cases, pensions and postretirement health care. Plan assets and obligations are recorded based on ana August 31 measurement date utilizing various actuarial assumptions such as discount rates, assumed rates of return and health care cost trend rates. We determine the discount rate assumptions by referencing high-quality long-term bond rates that are matched to the duration of our benefit obligations, with appropriate consideration of local market factors, participant demographics and benefit payment terms.forecasts. At August 31, 20112013 and 2010,2012, the weighted-average discount rate on domestic benefit plans was 5.00%4.9% and 4.60%3.9%, respectively. In estimating the expected return on plan assets, we consider the historical returns on plan assets, forward-looking considerations, inflation assumptions and the impact of the management of the plans’ invested assets. Domestic benefit plan assets consist primarily of participating units in common stock,mutual funds, index funds and bond funds. The expected return on domestic benefit plan assets was 7.90%7.65% and 8.00%7.75% at August 31, 20112013 and 2010,2012, respectively. A 25 basis point change in the assumptions for the discount rate or expected return on plan assets would not materially change fiscal 20122014 domestic benefit plan expense.theany modifications are recorded currently or amortized over future periods. Based on information provided by independent actuaries and other relevant sources, we believe that the assumptions used are reasonable; however, changes in these assumptions could impact our financial position, results of operations or cash flows. See Note 11,9, “Employee Benefit Plans” in the notes to the consolidated financial statements for further discussion.Taxes:Taxes: We recognize deferred tax assets and liabilities for the future tax consequences attributable to differences between financial statement carrying amounts of existing assets and liabilities and their respective tax bases and operating loss and other loss carryforwards. Deferred tax assets and liabilities are measured using enacted tax rates expected to apply to taxable income in the years in which those temporary differences are expected to be recovered or settled. Income tax expense also reflects our best estimates and assumptions regarding, among other things, the level of future taxable income and the effect of various tax planning strategies. FutureHowever, future taxrecorded.Estimates:Estimates: We record reserves or allowances for customer rebates, returns and discounts, doubtful accounts, inventory, incurred but not reported medical claims, environmental matters, warranty claims, workers compensation claims, product and non-product litigation and incentive compensation. These reserves require the use of estimates and judgment. We base our estimates on historical experience and on various other assumptions that are believed to be reasonable under the circumstances. We believe that such estimates are made on a consistent basis and with appropriate assumptions and methods. However, actual results may differ from these estimates.New Accounting PronouncementsThe information required by this Item is provided in Note 1, “Summary of Significant Accounting Policies” in the notes to consolidated financial statements contained in Item 8—Financial Statements and Supplementary Data. exposure to foreign currency exchange fluctuations. Approximately 50% of our revenues are denominated in currencies other than the U.S. dollar. Of those non-U.S. dollar denominated amounts, approximately 55% were denominated in Euro, with the remainder denominated in British pounds and various Asian and other currencies. Our identifiable foreign currency exchange exposure results primarilyrisk relating to receipts from the anticipated purchase of product from affiliates and third partycustomers, payments to suppliers and from the repayment of intercompany loans between subsidiariestransactions denominated in foreign currencies. Under certain conditions, we enter into hedging transactions, primarily forward foreign currency swaps, that enable us to mitigate the potential adverse impact of foreign currency exchange rate risk (see Note 7, “Derivatives” in the notes to the consolidated financial statements for further information). We periodically identify areas where we do not engage in trading or other speculative activities with these transactions, as established policies require that these hedging transactions relate to specific currency exposures.naturally offsetting positionsbeen $75 million and then may purchase hedging instruments to protect against anticipated exposures. At$8 million lower, respectively, for the twelve months ended August 31, 2011 and 2010, there were no material hedging instruments oustanding related2013. This sensitivity analysis assumed that each exchange rate would change in the same directionpurchase of products from affiliatesU.S. dollar and third party suppliers. Ourexcludes the potential effects that changes in foreign currency exchange rates may have on actual sales or price levels. Similarly, a ten percent decline in foreign currency exchange rates relative to the U.S. dollar on our August 31, 2013 financial position is not materially sensitivewould result in a $32 million reduction to fluctuations in exchange ratesequity (accumulated other comprehensive loss), as any gains or losses on foreign currency exposures are generally offset by gainsa result of non U.S. dollar denominated assets and losses on underlying payables and receivables.instruments that are based onis indexed off of LIBOR interest rates. We have periodically utilizedutilize interest rate swap agreements to manage overall financing costs and interest rate risk. As discussed in Note 8,5, “Debt” in the notes to the consolidated financial statements, at August 31, 2011 we were a party to interest rate swap agreements that converted $100 million of floating rate debt to a fixed rate of interest. These swaps were terminated during fiscal 2012 as part of the debt refinancing transaction. A 25 basis point increase or decrease in the applicable interest rates on our unhedged variable rate debt as of August 31, 2013would not haveresult in a material effectcorresponding change in financing costs of approximately $1 million on ouran annual interest expense.basis.Item 8.Financial Statements and Supplementary DataPageINDEX TO CONSOLIDATED FINANCIAL STATEMENTSPage INDEX TO CONSOLIDATED FINANCIAL STATEMENTS 30 31 32 33 34 35 68REPORT OF INDEPENDENT REGISTERED PUBLIC ACCOUNTING FIRM
2013.
Wisconsin
25, 2013
| Year Ended August 31, | ||||||||||||
| 2011 | 2010 | 2009 | ||||||||||
Net sales | $ | 1,445,323 | $ | 1,160,508 | $ | 1,117,625 | ||||||
Cost of products sold | 889,424 | 733,256 | 729,398 | |||||||||
|
|
|
|
|
| |||||||
Gross profit | 555,899 | 427,252 | 388,227 | |||||||||
Selling, administrative and engineering expenses | 332,639 | 267,866 | 250,004 | |||||||||
Restructuring charges | 2,223 | 15,597 | 19,530 | |||||||||
Impairment charges | — | — | 31,321 | |||||||||
Amortization of intangible assets | 27,467 | 22,017 | 19,644 | |||||||||
|
|
|
|
|
| |||||||
Operating profit | 193,570 | 121,772 | 67,728 | |||||||||
Financing costs, net | 32,119 | 31,859 | 41,849 | |||||||||
Other expense (income), net | 2,244 | 711 | (714 | ) | ||||||||
|
|
|
|
|
| |||||||
Earnings from continuing operations before income tax | 159,207 | 89,202 | 26,593 | |||||||||
Income tax expense | 34,711 | 18,846 | 611 | |||||||||
|
|
|
|
|
| |||||||
Earnings from continuing operations | 124,496 | 70,356 | 25,982 | |||||||||
Loss from discontinued operations, net of income taxes | (12,937 | ) | (46,325 | ) | (12,259 | ) | ||||||
|
|
|
|
|
| |||||||
Net earnings | $ | 111,559 | $ | 24,031 | $ | 13,723 | ||||||
|
|
|
|
|
| |||||||
Earnings from continuing operations per share: | ||||||||||||
Basic | $ | 1.82 | $ | 1.04 | $ | 0.45 | ||||||
Diluted | $ | 1.68 | $ | 0.97 | $ | 0.43 | ||||||
Earnings per share: | ||||||||||||
Basic | $ | 1.63 | $ | 0.36 | $ | 0.24 | ||||||
Diluted | $ | 1.50 | $ | 0.35 | $ | 0.24 | ||||||
Weighted average common shares outstanding: | ||||||||||||
Basic | 68,254 | 67,624 | 58,047 | |||||||||
Diluted | 75,305 | 74,209 | 66,064 | |||||||||
The accompanying notes are an integral part of these financial statements.
CONSOLIDATED BALANCE SHEETS
(in thousands, except share and per share amounts)
| August 31, | ||||||||
| 2011 | 2010 | |||||||
A S S E T S | ||||||||
Current Assets | ||||||||
Cash and cash equivalents | $ | 44,221 | $ | 40,222 | ||||
Accounts receivable, net | 223,760 | 185,693 | ||||||
Inventories, net | 223,235 | 146,154 | ||||||
Deferred income taxes | 32,461 | 30,701 | ||||||
Prepaid expenses and other current assets | 22,807 | 12,578 | ||||||
Current assets of discontinued operations | — | 44,802 | ||||||
|
|
|
| |||||
Total Current Assets | 546,484 | 460,150 | ||||||
Property, Plant and Equipment | ||||||||
Land, buildings, and improvements | 51,901 | 48,301 | ||||||
Machinery and equipment | 263,250 | 228,270 | ||||||
|
|
|
| |||||
Gross property, plant and equipment | 315,151 | 276,571 | ||||||
Less: Accumulated depreciation | (186,502 | ) | (168,189 | ) | ||||
|
|
|
| |||||
Property, Plant and Equipment, net | 128,649 | 108,382 | ||||||
Goodwill | 888,466 | 704,889 | ||||||
Other Intangibles, net | 479,406 | 336,978 | ||||||
Other Long-term assets | 13,676 | 11,304 | ||||||
|
|
|
| |||||
Total Assets | $ | 2,056,681 | $ | 1,621,703 | ||||
|
|
|
| |||||
L I A B I L I T I E S A N D S H A R E H O L D E R S’ E Q U I T Y | ||||||||
Current Liabilities | ||||||||
Trade accounts payable | $ | 170,084 | $ | 130,051 | ||||
Accrued compensation and benefits | 71,639 | 53,212 | ||||||
Short-term borrowings | 2,690 | — | ||||||
Income taxes payable | 19,342 | 17,903 | ||||||
Other current liabilities | 66,548 | 74,561 | ||||||
Current liabilities of discontinued operations | — | 37,695 | ||||||
|
|
|
| |||||
Total Current Liabilities | 330,303 | 313,422 | ||||||
Long-term Debt, less current maturities | 522,727 | 367,380 | ||||||
Deferred Income Taxes | 165,945 | 110,230 | ||||||
Pension and Postretirement Benefit Liabilities | 18,864 | 28,072 | ||||||
Other Long-term Liabilities | 99,829 | 62,878 | ||||||
Shareholders’ Equity | ||||||||
Class A common stock, $0.20 par value per share, authorized 168,000,000 shares, issued and outstanding 68,657,234 and 68,056,387 shares, respectively | 13,731 | 13,610 | ||||||
Additional paid-in capital | (154,231 | ) | (175,157 | ) | ||||
Retained earnings | 1,077,192 | 968,373 | ||||||
Accumulated other comprehensive loss | (17,679 | ) | (67,105 | ) | ||||
Stock held in trust | (2,137 | ) | (1,934 | ) | ||||
Deferred compensation liability | 2,137 | 1,934 | ||||||
|
|
|
| |||||
Total Shareholders’ Equity | 919,013 | 739,721 | ||||||
|
|
|
| |||||
Total Liabilities and Shareholders’ Equity | $ | 2,056,681 | $ | 1,621,703 | ||||
|
|
|
| |||||
The accompanying notes are an integral part of these financial statements.
CONSOLIDATED STATEMENTS OF CASH FLOWS
(in thousands)
| Year Ended August 31, | ||||||||||||
| 2011 | 2010 | 2009 | ||||||||||
Operating activities | ||||||||||||
Net earnings | $ | 111,559 | $ | 24,031 | $ | 13,723 | ||||||
Adjustments to reconcile net earnings to cash provided by operating activities: | ||||||||||||
Depreciation and amortization | 52,996 | 51,875 | 51,978 | |||||||||
Net loss (gain) on disposal of businesses | 11,695 | (334 | ) | (15,831 | ) | |||||||
Stock-based compensation expense | 10,758 | 8,399 | 8,609 | |||||||||
Provision (benefit) for deferred income taxes | 6,480 | (2,876 | ) | (17,847 | ) | |||||||
Amortization of debt discount and debt issuance costs | 2,904 | 3,969 | 4,531 | |||||||||
Impairment charges | — | 36,139 | 58,274 | |||||||||
Other non-cash adjustments | (46 | ) | (855 | ) | 1,585 | |||||||
Changes in components of working capital and other: | ||||||||||||
Accounts receivable | (2,564 | ) | (14,507 | ) | 71,215 | |||||||
Expiration of accounts receivable securitization program | — | (37,106 | ) | — | ||||||||
Inventories | (29,909 | ) | (7,964 | ) | 57,963 | |||||||
Prepaid expenses and other assets | 5,876 | 3,817 | 1,075 | |||||||||
Trade accounts payable | 7,158 | 32,727 | (61,932 | ) | ||||||||
Income taxes payable | 4,155 | 16,000 | (9,180 | ) | ||||||||
Accrued compensation and benefits | 12,178 | 27,361 | (25,836 | ) | ||||||||
Other accrued liabilities | (21,674 | ) | (19,590 | ) | 8,388 | |||||||
|
|
|
|
|
| |||||||
Cash provided by operating activities | 171,566 | 121,086 | 146,715 | |||||||||
Investing activities | ||||||||||||
Proceeds from sale of property, plant and equipment | 1,779 | 1,236 | 1,862 | |||||||||
Proceeds from sale of businesses | 3,463 | 7,516 | 38,455 | |||||||||
Capital expenditures | (23,096 | ) | (19,966 | ) | (21,454 | ) | ||||||
Business acquisitions, net of cash acquired | (313,456 | ) | (45,866 | ) | (239,422 | ) | ||||||
|
|
|
|
|
| |||||||
Cash used in investing activities | (331,310 | ) | (57,080 | ) | (220,559 | ) | ||||||
Financing activities | ||||||||||||
Net borrowings (repayments) on revolver and short-term borrowings | 58,204 | (14,313 | ) | 16,657 | ||||||||
Principal repayments on term loans and other debt | — | — | (270,000 | ) | ||||||||
Proceeds from issuance of term loans | 100,000 | — | 115,000 | |||||||||
Repurchases of 2% Convertible Notes | (34 | ) | (22,894 | ) | (9,100 | ) | ||||||
Debt issuance costs | (5,197 | ) | — | (9,158 | ) | |||||||
Proceeds from equity offering, net of transaction costs | — | — | 124,781 | |||||||||
Stock option exercises, related tax benefits and other | 8,235 | 3,315 | 4,024 | |||||||||
Cash dividend | (2,716 | ) | (2,702 | ) | (2,251 | ) | ||||||
|
|
|
|
|
| |||||||
Cash provided by (used in) financing activities | 158,492 | (36,594 | ) | (30,047 | ) | |||||||
Effect of exchange rate changes on cash | 5,251 | 1,425 | (7,273 | ) | ||||||||
|
|
|
|
|
| |||||||
Net increase (decrease) in cash and cash equivalents | 3,999 | 28,837 | (111,164 | ) | ||||||||
Cash and cash equivalents—beginning of year | 40,222 | 11,385 | 122,549 | |||||||||
|
|
|
|
|
| |||||||
Cash and cash equivalents—end of year | $ | 44,221 | $ | 40,222 | $ | 11,385 | ||||||
|
|
|
|
|
| |||||||
The accompanying notes are an integral part of these financial statements.
ACTUANT CORPORATION
CONSOLIDATED STATEMENTS OF SHAREHOLDERS’ EQUITY
(in thousands, except per share amounts)
| Class A Common Stock | Additional Paid-in Capital | Retained Earnings | Accumulated Other Comprehensive Income (Loss) | Stock Held in Trust | Deferred Compensation Liability | Total Shareholders’ Equity | ||||||||||||||||||||||||||
| Shares | Amount | |||||||||||||||||||||||||||||||
Balance at August 31, 2008 | 56,002 | $ | 11,200 | $ | (324,898 | ) | $ | 936,055 | $ | 7,149 | $ | (2,081 | ) | $ | 2,081 | $ | 629,506 | |||||||||||||||
Net earnings | — | — | — | 13,723 | — | — | — | 13,723 | ||||||||||||||||||||||||
Currency translation adjustments | — | — | — | — | (24,940 | ) | — | — | (24,940 | ) | ||||||||||||||||||||||
Fair value of derivatives, net of taxes | — | — | — | — | (535 | ) | — | — | (535 | ) | ||||||||||||||||||||||
Pension and postretirement plan funded status, net of taxes | — | — | — | — | (6,273 | ) | — | — | (6,273 | ) | ||||||||||||||||||||||
|
| |||||||||||||||||||||||||||||||
Total comprehensive loss | (18,025 | ) | ||||||||||||||||||||||||||||||
|
| |||||||||||||||||||||||||||||||
Company stock contribution to employee benefit plans and other | 228 | 46 | 5,198 | — | — | — | — | 5,244 | ||||||||||||||||||||||||
Restricted stock awards | 312 | 62 | (62 | ) | — | — | — | — | — | |||||||||||||||||||||||
Issuance of common stock | 10,925 | 2,185 | 122,441 | — | — | — | — | 124,626 | ||||||||||||||||||||||||
Cash dividend ($0.04 per share) | — | — | — | (2,708 | ) | — | — | — | (2,708 | ) | ||||||||||||||||||||||
Stock based compensation expense | — | — | 8,609 | — | — | — | — | 8,609 | ||||||||||||||||||||||||
Stock option exercises | 233 | 47 | (1,994 | ) | — | — | — | — | (1,947 | ) | ||||||||||||||||||||||
Excess benefit on stock option exercises | — | — | 1,514 | — | — | — | — | 1,514 | ||||||||||||||||||||||||
Stock issued to, acquired for and distributed from rabbi trust | 18 | 3 | 548 | — | — | 315 | (315 | ) | 551 | |||||||||||||||||||||||
|
|
|
|
|
|
|
|
|
|
|
|
|
|
|
| |||||||||||||||||
Balance at August 31, 2009 | 67,718 | 13,543 | (188,644 | ) | 947,070 | (24,599 | ) | (1,766 | ) | 1,766 | 747,370 | |||||||||||||||||||||
Net earnings | — | — | — | 24,031 | — | — | — | 24,031 | ||||||||||||||||||||||||
Currency translation adjustments | — | — | — | — | (34,845 | ) | — | — | (34,845 | ) | ||||||||||||||||||||||
Fair value of derivatives, net of taxes | — | — | — | — | 15 | — | — | 15 | ||||||||||||||||||||||||
Pension and postretirement plan funded status, net of taxes | — | — | — | — | (7,676 | ) | — | — | (7,676 | ) | ||||||||||||||||||||||
|
| |||||||||||||||||||||||||||||||
Total comprehensive loss | (18,475 | ) | ||||||||||||||||||||||||||||||
|
| |||||||||||||||||||||||||||||||
Company stock contribution to employee benefit plans and other | 123 | 24 | 1,963 | — | — | — | — | 1,987 | ||||||||||||||||||||||||
Restricted stock awards | (24 | ) | (5 | ) | 5 | — | — | — | — | — | ||||||||||||||||||||||
Cash dividend ($0.04 per share) | — | — | — | (2,728 | ) | — | — | — | (2,728 | ) | ||||||||||||||||||||||
Stock based compensation expense | — | — | 8,875 | — | — | — | — | 8,875 | ||||||||||||||||||||||||
Stock option exercises | 228 | 46 | 1,686 | — | — | — | — | 1,732 | ||||||||||||||||||||||||
Excess benefit on stock option exercises | — | — | 756 | — | — | — | — | 756 | ||||||||||||||||||||||||
Stock issued to, acquired for and distributed from rabbi trust | 11 | 2 | 202 | — | — | (168 | ) | 168 | 204 | |||||||||||||||||||||||
|
|
|
|
|
|
|
|
|
|
|
|
|
|
|
| |||||||||||||||||
Balance at August 31, 2010 | 68,056 | 13,610 | (175,157 | ) | 968,373 | (67,105 | ) | (1,934 | ) | 1,934 | 739,721 | |||||||||||||||||||||
Net earnings | — | — | — | 111,559 | — | — | — | 111,559 | ||||||||||||||||||||||||
Currency translation adjustments | — | — | — | — | 46,307 | — | — | 46,307 | ||||||||||||||||||||||||
Fair value of derivatives, net of taxes | — | — | — | — | (2,822 | ) | — | — | (2,822 | ) | ||||||||||||||||||||||
Pension and postretirement plan funded status adjustment, net of taxes | — | — | — | — | 5,941 | — | — | 5,941 | ||||||||||||||||||||||||
|
| |||||||||||||||||||||||||||||||
Total comprehensive income | 160,985 | |||||||||||||||||||||||||||||||
|
| |||||||||||||||||||||||||||||||
Company stock contribution to employee benefit plans and other | 138 | 29 | 3,050 | — | — | — | — | 3,079 | ||||||||||||||||||||||||
Restricted stock awards | (31 | ) | (7 | ) | 7 | — | — | — | — | — | ||||||||||||||||||||||
Cash dividend ($0.04 per share) | — | — | — | (2,740 | ) | — | — | — | (2,740 | ) | ||||||||||||||||||||||
Stock based compensation expense | — | — | 11,036 | — | — | — | — | 11,036 | ||||||||||||||||||||||||
Stock option exercises | 484 | 97 | 4,227 | — | — | — | — | 4,324 | ||||||||||||||||||||||||
Excess benefit on stock option exercises | — | — | 2,364 | — | — | — | — | 2,364 | ||||||||||||||||||||||||
Stock issued to, acquired for and distributed from rabbi trust | 10 | 2 | 242 | — | — | (203 | ) | 203 | 244 | |||||||||||||||||||||||
|
|
|
|
|
|
|
|
|
|
|
|
|
|
|
| |||||||||||||||||
Balance at August 31, 2011 | 68,657 | $ | 13,731 | $ | (154,231 | ) | $ | 1,077,192 | $ | (17,679 | ) | $ | (2,137 | ) | $ | 2,137 | $ | 919,013 | ||||||||||||||
|
|
|
|
|
|
|
|
|
|
|
|
|
|
|
| |||||||||||||||||
| Year Ended August 31, | ||||||||||||
| 2013 | 2012 | 2011 | ||||||||||
| Net sales | $ | 1,279,742 | $ | 1,276,521 | $ | 1,159,310 | ||||||
| Cost of products sold | 772,792 | 765,061 | 694,508 | |||||||||
| Gross profit | 506,950 | 511,460 | 464,802 | |||||||||
| Selling, administrative and engineering expenses | 293,866 | 284,920 | 270,392 | |||||||||
| Amortization of intangible assets | 22,939 | 22,026 | 21,523 | |||||||||
| Operating profit | 190,145 | 204,514 | 172,887 | |||||||||
| Financing costs, net | 24,837 | 29,561 | 32,119 | |||||||||
| Debt refinancing costs | — | 16,830 | — | |||||||||
| Other expense, net | 2,359 | 3,493 | 2,747 | |||||||||
| Earnings from continuing operations before income tax | 162,949 | 154,630 | 138,021 | |||||||||
| Income tax expense | 15,372 | 29,354 | 27,833 | |||||||||
| Earnings from continuing operations | 147,577 | 125,276 | 110,188 | |||||||||
| Earnings (loss) from discontinued operations, net of income taxes | (117,529 | ) | (37,986 | ) | 1,371 | |||||||
| Net earnings | $ | 30,048 | $ | 87,290 | $ | 111,559 | ||||||
| Earnings from continuing operations per share: | ||||||||||||
| Basic | $ | 2.02 | $ | 1.79 | $ | 1.61 | ||||||
| Diluted | $ | 1.98 | $ | 1.68 | $ | 1.49 | ||||||
| Earnings per share: | ||||||||||||
| Basic | $ | 0.41 | $ | 1.25 | $ | 1.63 | ||||||
| Diluted | $ | 0.40 | $ | 1.17 | $ | 1.50 | ||||||
| Weighted average common shares outstanding: | ||||||||||||
| Basic | 72,979 | 70,099 | 68,254 | |||||||||
| Diluted | 74,580 | 74,940 | 75,305 | |||||||||
NOTES TO
OF COMPREHENSIVE INCOME
| August 31, | ||||||||||||
| 2013 | 2012 | 2011 | ||||||||||
| Net earnings | $ | 30,048 | $ | 87,290 | $ | 111,559 | ||||||
| Other comprehensive income (loss), net of tax | ||||||||||||
| Foreign currency translation adjustments | (2,918 | ) | (48,571 | ) | 46,307 | |||||||
| Pension and other postretirement benefit plans | ||||||||||||
| Funded status adjustment | 3,442 | (6,358 | ) | 2,766 | ||||||||
| Reclassification adjustment for losses included in net earnings | 125 | — | 2,988 | |||||||||
| Amortization of actuarial losses included in net periodic pension cost | 360 | 183 | 187 | |||||||||
| 3,927 | (6,175 | ) | 5,941 | |||||||||
| Cash flow hedges | ||||||||||||
| Unrealized net loss arising during period | (140 | ) | (80 | ) | (2,822 | ) | ||||||
| Reclassification adjustment for loss (gain) included in net earnings | (57 | ) | 3,033 | — | ||||||||
| (197 | ) | 2,953 | (2,822 | ) | ||||||||
| Total other comprehensive income (loss), net of tax | 812 | (51,793 | ) | 49,426 | ||||||||
| Comprehensive income | $ | 30,860 | $ | 35,497 | $ | 160,985 | ||||||
| August 31, | ||||||||
| 2013 | 2012 | |||||||
| A S S E T S | ||||||||
| Current assets | ||||||||
| Cash and cash equivalents | $ | 103,986 | $ | 68,184 | ||||
| Accounts receivable, net | 219,075 | 234,756 | ||||||
| Inventories, net | 142,549 | 211,690 | ||||||
| Deferred income taxes | 18,796 | 22,583 | ||||||
| Prepaid expenses and other current assets | 28,228 | 24,068 | ||||||
| Assets of discontinued operations | 272,606 | — | ||||||
| Total current assets | 785,240 | 561,281 | ||||||
| Property, plant and equipment | ||||||||
| Land, buildings, and improvements | 52,669 | 49,866 | ||||||
| Machinery and equipment | 305,200 | 242,718 | ||||||
| Gross property, plant and equipment | 357,869 | 292,584 | ||||||
| Less: Accumulated depreciation | (156,373 | ) | (176,700 | ) | ||||
| Property, plant and equipment, net | 201,496 | 115,884 | ||||||
| Goodwill | 734,952 | 866,412 | ||||||
| Other intangibles, net | 376,692 | 445,884 | ||||||
| Other long-term assets | 20,952 | 17,658 | ||||||
| Total assets | $ | 2,119,332 | $ | 2,007,119 | ||||
| L I A B I L I T I E S A N D S H A R E H O L D E R S’ E Q U I T Y | ||||||||
| Current liabilities | ||||||||
| Trade accounts payable | $ | 154,049 | $ | 174,746 | ||||
| Accrued compensation and benefits | 43,800 | 58,817 | ||||||
| Current maturities of debt | — | 7,500 | ||||||
| Income taxes payable | 14,014 | 5,778 | ||||||
| Other current liabilities | 56,899 | 72,165 | ||||||
| Liabilities of discontinued operations | 53,080 | — | ||||||
| Total current liabilities | 321,842 | 319,006 | ||||||
| Long-term debt | 515,000 | 390,000 | ||||||
| Deferred income taxes | 115,865 | 132,653 | ||||||
| Pension and postretirement benefit liabilities | 20,698 | 26,442 | ||||||
| Other long-term liabilities | 65,660 | 87,182 | ||||||
| Shareholders’ equity | ||||||||
| Class A common stock, $0.20 par value per share, authorized 168,000,000 shares, issued 77,001,144 and 75,519,079 shares, respectively | 15,399 | 15,102 | ||||||
| Additional paid-in capital | 49,758 | 7,725 | ||||||
| Treasury stock, at cost, 3,983,513 shares and 2,658,751 shares, respectively | (104,915 | ) | (63,083 | ) | ||||
| Retained earnings | 1,188,685 | 1,161,564 | ||||||
| Accumulated other comprehensive loss | (68,660 | ) | (69,472 | ) | ||||
| Stock held in trust | (3,124 | ) | (2,689 | ) | ||||
| Deferred compensation liability | 3,124 | 2,689 | ||||||
| Total shareholders’ equity | 1,080,267 | 1,051,836 | ||||||
| Total liabilities and shareholders’ equity | $ | 2,119,332 | $ | 2,007,119 | ||||
| Year Ended August 31, | ||||||||||||
| 2013 | 2012 | 2011 | ||||||||||
| Operating activities | ||||||||||||
| Net earnings | $ | 30,048 | $ | 87,290 | $ | 111,559 | ||||||
| Adjustments to reconcile net earnings to cash provided by operating activities: | ||||||||||||
| Non-cash items: | ||||||||||||
| Depreciation and amortization | 53,902 | 54,263 | 52,996 | |||||||||
| Net loss on disposal of business | — | — | 11,695 | |||||||||
| Stock-based compensation expense | 13,440 | 13,346 | 10,758 | |||||||||
| Provision (benefit) for deferred income taxes | (44,265 | ) | (10,524 | ) | 6,480 | |||||||
| Amortization of debt discount and debt issuance costs | 1,940 | 1,990 | 2,904 | |||||||||
| Impairment charges | 158,817 | 62,464 | — | |||||||||
| Non-cash debt refinancing costs | — | 2,254 | — | |||||||||
| Other non-cash adjustments | 328 | — | (46 | ) | ||||||||
| Changes in components of working capital and other: | ||||||||||||
| Accounts receivable | (10,925 | ) | (12,310 | ) | (2,564 | ) | ||||||
| Inventories | 13,714 | 11,532 | (29,909 | ) | ||||||||
| Prepaid expenses and other assets | (4,603 | ) | (2,164 | ) | 5,876 | |||||||
| Trade accounts payable | (9,279 | ) | 5,902 | 7,158 | ||||||||
| Income taxes payable | 594 | (17,903 | ) | 4,155 | ||||||||
| Accrued compensation and benefits | (14,256 | ) | (6,292 | ) | 12,178 | |||||||
| Other accrued liabilities | 4,334 | (7,519 | ) | (21,674 | ) | |||||||
| Cash provided by operating activities | 193,789 | 182,329 | 171,566 | |||||||||
| Investing activities | ||||||||||||
| Proceeds from sale of property, plant and equipment | 1,621 | 8,501 | 1,779 | |||||||||
| Proceeds from sale of business | 4,854 | — | 3,463 | |||||||||
| Capital expenditures | (23,668 | ) | (22,740 | ) | (23,096 | ) | ||||||
| Business acquisitions, net of cash acquired | (235,489 | ) | (69,309 | ) | (313,106 | ) | ||||||
| Cash used in investing activities | (252,682 | ) | (83,548 | ) | (330,960 | ) | ||||||
| Financing activities | ||||||||||||
| Net borrowings (repayments) on revolver | 125,000 | (58,167 | ) | 58,204 | ||||||||
| Principal repayments on term loans | (7,500 | ) | (2,500 | ) | — | |||||||
| Proceeds from issuance of term loans | — | — | 100,000 | |||||||||
| Repurchases of 2% Convertible Notes | — | (102 | ) | (34 | ) | |||||||
| Proceeds from issuance of 5.625% Senior Notes | — | 300,000 | — | |||||||||
| Redemption of 6.875% Senior Notes | — | (250,000 | ) | — | ||||||||
| Payment of deferred acquisition consideration | (5,378 | ) | (958 | ) | (350 | ) | ||||||
| Debt issuance costs | (2,035 | ) | (5,490 | ) | (5,197 | ) | ||||||
| Purchase of treasury shares | (41,832 | ) | (63,083 | ) | — | |||||||
| Stock option exercises, related tax benefits and other | 33,261 | 10,913 | 8,235 | |||||||||
| Cash dividend | (2,911 | ) | (2,748 | ) | (2,716 | ) | ||||||
| Cash provided by (used in) financing activities | 98,605 | (72,135 | ) | 158,142 | ||||||||
| Effect of exchange rate changes on cash | (3,910 | ) | (2,683 | ) | 5,251 | |||||||
| Net increase in cash and cash equivalents | 35,802 | 23,963 | 3,999 | |||||||||
| Cash and cash equivalents—beginning of year | 68,184 | 44,221 | 40,222 | |||||||||
| Cash and cash equivalents—end of year | $ | 103,986 | $ | 68,184 | $ | 44,221 | ||||||
| Common Stock | Additional Paid-in Capital | Treasury Stock | Retained Earnings | Accumulated Other Comprehensive Income (Loss) | Stock Held in Trust | Deferred Compensation Liability | Total Shareholders’ Equity | ||||||||||||||||||||||||||||
Issued Shares | Amount | ||||||||||||||||||||||||||||||||||
| Balance at August 31, 2010 | 68,056 | $ | 13,610 | $ | (175,157 | ) | $ | — | $ | 968,373 | $ | (67,105 | ) | $ | (1,934 | ) | $ | 1,934 | $ | 739,721 | |||||||||||||||
| Net earnings | — | — | — | — | 111,559 | — | — | — | 111,559 | ||||||||||||||||||||||||||
| Other comprehensive income, net of tax | — | — | — | — | — | 49,426 | — | — | 49,426 | ||||||||||||||||||||||||||
| Company stock contribution to employee benefit plans and other | 138 | 29 | 3,050 | — | — | — | — | — | 3,079 | ||||||||||||||||||||||||||
| Restricted stock awards | (31 | ) | (7 | ) | 7 | — | — | — | — | — | — | ||||||||||||||||||||||||
| Cash dividend ($0.04 per share) | — | — | — | — | (2,740 | ) | — | — | — | (2,740 | ) | ||||||||||||||||||||||||
| Stock based compensation expense | — | — | 11,036 | — | — | — | — | — | 11,036 | ||||||||||||||||||||||||||
| Stock option exercises | 484 | 97 | 4,227 | — | — | — | — | — | 4,324 | ||||||||||||||||||||||||||
| Excess tax benefit on stock option exercises | — | — | 2,364 | — | — | — | — | — | 2,364 | ||||||||||||||||||||||||||
| Stock issued to, acquired for and distributed from rabbi trust | 10 | 2 | 242 | — | — | — | (203 | ) | 203 | 244 | |||||||||||||||||||||||||
| Balance at August 31, 2011 | 68,657 | 13,731 | (154,231 | ) | — | 1,077,192 | (17,679 | ) | (2,137 | ) | 2,137 | 919,013 | |||||||||||||||||||||||
| Net earnings | — | — | — | — | 87,290 | — | — | — | 87,290 | ||||||||||||||||||||||||||
| Other comprehensive income, net of tax | — | — | — | — | — | (51,793 | ) | — | — | (51,793 | ) | ||||||||||||||||||||||||
| Company stock contribution to employee benefit plans and other | 277 | 55 | 5,530 | — | — | — | — | — | 5,585 | ||||||||||||||||||||||||||
| Conversion of 2% Convertible Notes | 5,962 | 1,192 | 133,757 | — | — | — | — | — | 134,949 | ||||||||||||||||||||||||||
| Restricted stock awards | 17 | 3 | (3 | ) | — | — | — | — | — | — | |||||||||||||||||||||||||
| Cash dividend ($0.04 per share) | — | — | — | — | (2,918 | ) | — | — | — | (2,918 | ) | ||||||||||||||||||||||||
| Treasury stock repurchases | — | — | — | (63,083 | ) | — | — | — | — | (63,083 | ) | ||||||||||||||||||||||||
| Stock based compensation expense | — | — | 13,346 | — | — | — | — | — | 13,346 | ||||||||||||||||||||||||||
| Stock option exercises | 580 | 116 | 6,434 | — | — | — | — | — | 6,550 | ||||||||||||||||||||||||||
| Excess tax benefit on stock option exercises | — | — | 2,349 | — | — | — | — | — | 2,349 | ||||||||||||||||||||||||||
| Stock issued to, acquired for and distributed from rabbi trust | 26 | 5 | 543 | — | — | — | (552 | ) | 552 | 548 | |||||||||||||||||||||||||
| Balance at August 31, 2012 | 75,519 | 15,102 | 7,725 | (63,083 | ) | 1,161,564 | (69,472 | ) | (2,689 | ) | 2,689 | 1,051,836 | |||||||||||||||||||||||
| Net earnings | — | — | — | — | 30,048 | — | — | — | 30,048 | ||||||||||||||||||||||||||
| Other comprehensive income, net of tax | — | — | — | — | — | 812 | — | — | 812 | ||||||||||||||||||||||||||
| Company stock contribution to employee benefit plans and other | 21 | 5 | 592 | — | — | — | — | — | 597 | ||||||||||||||||||||||||||
| Restricted stock awards | 169 | 34 | (34 | ) | — | — | — | — | — | — | |||||||||||||||||||||||||
| Cash dividend ($0.04 per share) | — | — | — | — | (2,927 | ) | — | — | — | (2,927 | ) | ||||||||||||||||||||||||
| Treasury stock repurchases | — | — | — | (41,832 | ) | — | — | — | — | (41,832 | ) | ||||||||||||||||||||||||
| Stock based compensation expense | — | — | 13,440 | — | — | — | — | — | 13,440 | ||||||||||||||||||||||||||
| Stock option exercises | 1,276 | 255 | 24,585 | — | — | — | — | — | 24,840 | ||||||||||||||||||||||||||
| Excess tax benefit on stock option exercises | — | — | 2,954 | — | — | — | — | — | 2,954 | ||||||||||||||||||||||||||
| Stock issued to, acquired for and distributed from rabbi trust | 16 | 3 | 496 | — | — | — | (435 | ) | 435 | 499 | |||||||||||||||||||||||||
| Balance at August 31, 2013 | 77,001 | $ | 15,399 | $ | 49,758 | $ | (104,915 | ) | $ | 1,188,685 | $ | (68,660 | ) | $ | (3,124 | ) | $ | 3,124 | $ | 1,080,267 | |||||||||||||||
measurement of possible impairment is generally estimated by the ability to recover the balance of assets from expected future operating cash flows on an undiscounted basis. If impairment is determined to exist, any related impairment loss is calculated based on the fair value of the asset. See Note 2013. Beginning balance Warranty reserves of acquired businesses Provision for warranties Warranty payments and costs incurred Warranty reserves of divested businesses Impact of changes in foreign currency rates Ending balance Financing Costs: Financing costs represent interest expense, financing fees and amortization of debt issuance costs, net of interest income. the stock of dampers. Accounts receivable, net Inventories, net Other current assets Property, plant & equipment Goodwill Other intangible assets Trade accounts payable Other current liabilities Deferred income taxes Other non-current liabilities Cash paid, net of cash acquired Net sales As reported Pro forma Earnings from continuing operations As reported Pro forma Basic earnings per share from continuing operations As reported Pro forma Diluted earnings per share from continuing operations As reported Pro forma Net sales Net (loss) gain on disposal Loss from operations of divested businesses(1) Income tax benefit (expense)(2) Loss from discontinued operations, net of income tax Severance and facility consolidation Product line rationalization Other restructuring costs Total restructuring costs Beginning balance Restructuring charges Cash payments Product line rationalization Other non-cash uses of reserve Impact of changes in foreign currency rates Ending balance Balance as of August 31, 2009 Businesses acquired Purchase accounting adjustments Impairment charge Impact of changes in foreign currency rates Balance as of August 31, 2010 Businesses acquired Purchase accounting adjustments Impact of changes in foreign currency rates Balance as of August 31, 2011 Amortizable intangible assets: Customer relationships Patents Trademarks and tradenames Non-compete agreements and other Indefinite lived intangible assets: Tradenames Senior Credit Facility Revolver Term Loan 6.875% Senior notes Other debt Total Senior Indebtedness Convertible subordinated debentures (“2% Convertible Notes”) Total debt Less: current maturities of long-term debt Total long-term debt, less current maturities 2013 year and contain certain financial and non-financial covenants. The Company utilized the net proceeds from this issuance to fund the repurchase of all its then-outstanding Level 1 Valuation: Cash equivalents Investments Level 2 Valuation: Foreign currency forward contracts Interest rate swap contracts consolidated statement of earnings). Reconciliation of benefit obligations: Benefit obligation at beginning of year Interest cost Actuarial (gain) loss Benefits paid Benefit obligation at end of year Reconciliation of plan assets: Fair value of plan assets at beginning of year Actual return on plan assets Company contributions Benefits paid from plan assets Fair value of plan assets at end of year Funded status of the plans (underfunded) Interest cost Expected return on assets Amortization of actuarial loss Net benefit cost (credit) Assumptions for benefit obligations: Discount rate Assumptions for net periodic benefit cost: Discount rate Expected return on plan assets At Cash and cash equivalents Fixed Income securities: Government bonds Corporate bonds Short term funds Equity Securities: U.S. Companies International Companies Total Plan Assets following five years. Benefit obligation Fair value of plan assets Funded status of plans (underfunded) , respectively. These obligations are determined utilizing assumptions consistent with those used for U.S. pension plans and a health care cost trend rate of 2014. Currently payable: Federal Foreign State Deferred: Federal Foreign State Total income tax expense Federal statutory rate State income taxes, net of Federal effect Net effect of foreign tax rates and credits Restructuring and valuation allowance Other items(1) Effective income tax rate Deferred income tax assets: Operating loss and tax credit carryforwards Compensation related liabilities Postretirement benefits Inventory Restructuring and idle facility reserves Book reserves and other items Total deferred income tax assets Valuation allowance Net deferred income tax assets Deferred income tax liabilities: Depreciation and amortization 2% Convertible Note interest Other items Deferred income tax liabilities Net deferred income tax liability 2021. The credit carryforwards for which utilization is uncertain. Beginning balance Increase for tax positions taken in a prior period Decrease for tax positions taken in a prior period Decrease due to settlements Ending balance The Company’s policy is to remit earnings from foreign subsidiaries only to the extent any resultant foreign income taxes are creditable in the United States. Accordingly, the Company does not currently provide for the additional United States and foreign income taxes which would become payable upon remission of undistributed earnings of foreign subsidiaries. Undistributed earnings on which additional income taxes have not been provided amounted to approximately 2013. As of Numerator: Net earnings Plus: 2% Convertible Notes financings costs, net of taxes Net earnings for diluted earnings per share Denominator: Weighted average common shares outstanding for basic earnings per share Net effect of dilutive securities—employee stock compensation plans Net effect of 2% Convertible Notes based on the if-converted method Weighted average common and equivalent shares outstanding for diluted earnings per share Basic Earnings Per Share: Diluted Earnings Per Share: Outstanding on September 1, 2010 Granted Exercised Forfeited Outstanding on August 31, 2011 Exercisable on August 31, 2011 Weighted-average fair value of options granted (per share) Intrinsic value gain of options exercised Cash receipts from exercise of options Outstanding August 31, 2010 Granted Forfeited Vested Outstanding August 31, 2011 Dividend yield Expected volatility Risk-free rate of return Expected forfeiture rate Expected life Currency translation adjustments, net of tax Unrecognized pension and OPEB actuarial losses, net of tax Unrecognized loss on interest rate swap agreements, net of tax Net Sales by Segment: Industrial Energy Electrical Engineered Solutions Net Sales by Reportable Product Line: Industrial Energy Electrical Vehicle Systems Other Operating Profit: Industrial Energy Electrical Engineered Solutions General Corporate Depreciation and Amortization: Industrial Energy Electrical Engineered Solutions General Corporate Capital Expenditures: Industrial Energy Electrical Engineered Solutions General Corporate Discontinued Operations Assets: Industrial Energy Electrical Engineered Solutions General Corporate Assets of discontinued operations taxes. Net Sales: United States Netherlands Germany United Kingdom All other Long-Lived Assets: United States China United Kingdom Netherlands All other obligations. 2013 Net sales Cost of products sold Gross profit Selling, administrative and engineering expenses Restructuring charges Amortization of intangible assets Operating profit Financing costs, net Intercompany expense (income), net Other expense (income), net Earnings from continuing operations before income taxes Income tax expense Net earnings from continuing operations before equity in earnings of subsidiaries Equity in earnings of subsidiaries Earnings from continuing operations Loss from discontinued operations Net Earnings Net sales Cost of products sold Gross profit Selling, administrative and engineering expenses Restructuring charges Amortization of intangible assets Operating profit Financing costs, net Intercompany expense (income), net Other expense (income), net Earnings from continuing operations before income taxes Income tax expense Net earnings from continuing operations before equity in earnings (loss) of subsidiaries Equity in earnings (loss) of subsidiaries Earnings from continuing operations Loss from discontinued operations Net Earnings Net sales Cost of products sold Gross profit Selling, administrative and engineering expenses Restructuring charges Impairment charges Amortization of intangible assets Operating profit (loss) Financing costs, net Intercompany expense (income), net Other income, net Earnings (loss) from continuing operations before income taxes Income tax expense (benefit) Net earnings (loss) from continuing operations before equity in earnings (loss) of subsidiaries Equity in earnings (loss) of subsidiaries Earnings from continuing operations Earnings (loss) from discontinued operations Net Earnings (loss) ASSETS Current Assets Property, Plant & Equipment, net Goodwill Other Intangibles, net Intercompany Receivable Investment in Subsidiaries Other Long-term assets Total Assets LIABILITIES & SHAREHOLDERS’ EQUITY Current Liabilities Long-term Debt Deferred Income Taxes Pension and Post-retirement Benefit Liabilities Other Long-term Liabilities Intercompany Payable Shareholders’ Equity Total Liabilities and Shareholders’ Equity ASSETS Current Assets Property, Plant & Equipment, net Goodwill Other Intangibles, net Intercompany Receivable Investment in Subsidiaries Other Long-term assets Total Assets LIABILITIES & SHAREHOLDERS’ EQUITY Current Liabilities Long-term Debt Deferred Income Taxes Pension and Post-retirement Benefit Liabilities Other Long-term Liabilities Intercompany Payable Shareholders’ Equity Total Liabilities and Shareholders’ Equity Operating Activities Net cash provided by operating activities Investing Activities Proceeds from sale of property, plant & equipment Proceeds from sale of businesses Capital expenditures Business acquisitions, net of cash acquired Cash used in investing activities Financing Activities Net borrowings on revolver and other debt Proceeds from issuance of term loans Repurchases of 2% Convertible Notes Intercompany loan activity Debt issuance costs Stock option exercises, related tax benefits and other Cash dividend Cash provided by financing activities Effect of exchange rate changes on cash Net increase (decrease) in cash and cash equivalents Cash and cash equivalents—beginning of period Cash and cash equivalents—end of period Operating Activities Net cash provided by (used in) operating activities Investing Activities Proceeds from sale of property, plant & equipment Proceeds from sale of businesses Capital expenditures Business acquisitions, net of cash acquired Cash used in investing activities Financing Activities Net repayments on revolver and other debt Repurchases of 2% Convertible Notes Intercompany loan activity Stock option exercises, related tax benefits and other Cash dividend Cash provided by (used in) financing activities Effect of exchange rate changes on cash Net increase in cash and cash equivalents Cash and cash equivalents—beginning of period Cash and cash equivalents—end of period Operating Activities Net cash provided by operating activities Investing Activities Proceeds from sale of property, plant & equipment Proceeds from sale of businesses Capital expenditures Business acquisitions, net of cash acquired Cash used in investing activities Financing Activities Net borrowings on revolver and other debt Principal repayments on term loans and other debt Proceeds from issuance of term loans Repurchases of 2% Convertible Notes Intercompany loan activity Debt issuance costs Proceeds from equity offering, net of transaction costs Stock option exercises, related tax benefits and other Cash dividend Cash provided by financing activities Effect of exchange rate changes on cash Net increase in cash and cash equivalents Cash and cash equivalents—beginning of period Cash and cash equivalents—end of period Net sales Gross profit Restructuring charges Earnings from continuing operations Earnings (loss) from discontinued operations Net earnings Earnings from continuing operations per share: Basic Diluted Earnings (loss) from discontinued operations per share: Basic Diluted Net Earnings per share Basic Diluted Net sales Gross profit Restructuring charges Earnings from continuing operations Loss from discontinued operations Net earnings (loss) Earnings from continuing operations per share: Basic Diluted Loss from discontinued operations per share: Basic Diluted Net earnings (loss) per share Basic Diluted 2013 the Company recognized a Description Allowance for losses—Trade accounts receivable August 31, 2011 August 31, 2010 August 31, 2009 Allowance for losses—Inventory August 31, 2011 August 31, 2010 August 31, 2009 Valuation allowance—Income taxes August 31, 2011 August 31, 2010 August 31, 2009 2013 Information about the Company’s directors is incorporated by reference from the “Election of Directors” section of the Company’s Proxy Statement for its Annual Meeting of Shareholders to be held on January The information required by this item is incorporated by reference from the “Election of Directors,” “Corporate Governance Matters” and the “Executive Compensation” sections (other than the subsection thereof entitled “Report of the Audit Committee”) of the The information required by this item is incorporated by reference from the “Certain Beneficial Owners” and “Executive Compensation—Equity Compensation Plan Information” sections of the The information required by this item is incorporated by reference from the “Certain Relationships and Related Party Transactions” section of the The information required by this item is incorporated by reference from the “Other Information—Independent Public Accountants” section of the fourthree reportable segments. The Industrial segment is primarily involved in the design, manufacture and distribution of branded hydraulic and mechanical tools to the maintenance, industrial, infrastructure and production automation markets. The Energy segment provides joint integrity products and services, customized offshore vessel mooring solutions, as well as umbilical, rope and cable solutions to the global oil & gas, power generation and energy markets. The Electrical segment designs, manufactures and distributes a broad range of electrical products to the retail DIY, wholesale, original equipment manufacturer (“OEM”), solar, utility, marine and other harsh environmentenergy markets. The Engineered Solutions segment provides highly engineered position and motion control systems to OEMs in various vehicle markets, as well as a variety of other products to the industrial and agricultural markets.18%21% and 23%19% of total inventories in 20112013 and 2010,2012, respectively). The first-in, first-out or average cost methods are used for all other inventories. If the LIFO method were not used, inventory balances would be higher than the amounts in the consolidated balance sheets by approximately $5.5$5.8 million and $4.9$6.6 million at August 31, 20112013 and 2010,2012, respectively.ACTUANT CORPORATIONNOTES TO CONSOLIDATED FINANCIAL STATEMENTS—(Continued)6, “Impairment Charges”3, “Discontinued Operations” for details on long-lived asset impairment charges recognized in fiscal 20102012 and 2009.The acquisition of Mastervolt duringDuring fiscal 2011 has increased2012 the required warranty reserve as this business haswas reduced by $7.7 million, the result of a longer basepurchase accounting adjustment to Mastervolt's initial estimated warranty period.reserve. The reserve for future warranty claims is based on historical claim rates and current warranty cost experience. The following is a reconciliation of the changes in accrued product warranty reserves for fiscal years 20112013 and 20102012 (in thousands): 2011 2010 $ 7,868 $ 8,989 17,457 920 9,190 5,153 (12,662 ) (5,959 ) — (939 ) 1,854 (296 ) $ 23,707 $ 7,868 2013 2012 Beginning balance $ 12,869 $ 23,707 Warranty reserves of acquired businesses 981 338 Purchase accounting adjustments — (7,726 ) Provision for warranties 7,907 9,219 Warranty payments and costs incurred (11,616 ) (10,893 ) Discontinued operations reclassification (3,107 ) — Impact of changes in foreign currency rates 379 (1,776 ) Ending balance $ 7,413 $ 12,869 Customer sales are recognized as The Company recognizes revenue when persuasive evidence of an arrangement exists, delivery has occurred, the sales price is fixed or determinable and collectibility of the sales price is reasonably assured. For product sales, delivery does not occur until the passage of title and risk of loss and title passhave transferred to the customer which(generally when products are shipped). Revenue from services is generally upon shipment.recognized when the services are provided or ratably over the contract term. Customer sales are recorded net of allowances for returns and discounts, which are recognized as a deduction from sales at the time of sale. The Company commits to one-time or on-going trade discounts and promotions with customers that require the Company to estimate and accrue the ultimate costs of such programs. The Company maintains an accrual at the end of each period for the earned, but unpaid costs related to the programs. The Company generally does not require collateral or other security for receivables and provides for an allowance for doubtful accounts based on historical experience and a review of its existing receivables. Accounts Receivable are stated net of an allowance for doubtful accounts of $7.2$3.7 million and $7.7$4.4 million at August 31, 20112013 and 2010,2012, respectively.withinin cost of products sold.$17.7$21.0 million $14.5, $17.1 million and $16.2$12.5 million in fiscal 2011, 2010,2013, 2012 and 20092011, respectively. The Company also incurs significant costs in connection with fulfilling custom customer orders and executingdeveloping unique solutions for unique customer applications thatneeds which are not included in these research and development expense totals.(gains)/losses of $2.7$2.7 million $1.5, $3.9 million and $(1.1)$3.3 million in fiscal 2011, 20102013, 2012 and 2009,2011, respectively.Short-term Borrowings: Short-term borrowings consist of foreign and domestic subsidiary overdraft borrowings and the current portion of the Company’s long-term debt. Certain of the Company’s foreign subsidiaries are parties to unsecured non-committed lines of credit with various banks. Interest rates vary depending on the currency being borrowed.ACTUANT CORPORATIONNOTES TO CONSOLIDATED FINANCIAL STATEMENTS—(Continued)and export programs, are recognized as a reduction of the provision for income taxes in the year in which they are available for U.S. tax purposes. Deferred taxes are provided on temporary differences between assets and liabilities for financial and tax reporting purposes as measured by enacted tax rates expected to apply when temporary differences are settled or realized. Future tax benefits are recognized to the extent that realization of those benefits is considered to be more likely than not. A valuation allowance is established for deferred tax assets for which realization is not more likely than not of being realized. The Company has not provided for any residual U.S. income taxes on unremitted earnings of non-U.S. subsidiaries as such earnings are intended to be indefinitely reinvested. The Company recognizes interest and penalties related to unrecognized tax benefits in income tax expense.shareholders’shareholders' equity caption “Accumulated Other Comprehensive Loss.”methods.assumptions. Actual results may differ from these estimates under different assumptions or conditions.Accounting for Derivatives and Hedging Activities: All derivatives are recognized on the balance sheet at their estimated fair value. On the date a derivative contract is entered into, the Company designates the derivative as a hedge of a recognized asset or liability (fair value hedge) or a hedge of a forecasted transaction or of the variability of cash flows to be received or paid related to a recognized asset or liability (cash flow hedge). The Company does not enter into derivatives for speculative purposes. Changes in the value of a fair value hedge are recorded in earnings along with the gain or loss on the hedged asset or liability, while changes in the value of cash flow hedges are recorded in accumulated other comprehensive loss, until earnings are affected by the variability of cash flows.New Accounting Pronouncements: In June 2011, the Financial Accounting Standards Board (FASB) updated the disclosure requirements for comprehensive income. The updated guidance requires companies to disclose the total of comprehensive income, the components of net income and the components of other comprehensive income either in a single continuous statement of comprehensive income or in two separate but consecutive statements. The updated guidance does not affect how earnings per share is calculated or presented. The amended guidance, which must be applied retroactively, is effective for fiscal years, and interim periods within those years, beginning after December 15, 2011, with earlier adoption permitted.In September 2011, the FASB issued an amendment to existing guidance on the testing of goodwill for impairment. Under the revised guidance, entities testing goodwill for impairment have the option of performing a qualitative assessment before calculating the fair value of the reporting unit. If entities determine, on the basis of qualitative factors, that the fair value of the reporting unit is more likely than not less than the carrying amount, the two-step impairment test would be required. The amendment is effective for annual and interim goodwill impairment tests performed for fiscal years beginning after December 15, 2011, with earlier adoption permitted.ACTUANT CORPORATIONNOTES TO CONSOLIDATED FINANCIAL STATEMENTS—(Continued)is continuingincurred acquisition transaction costs of $3.7 million, $1.4 million and $1.9 million in fiscal 2013, 2012 and 2011, respectively, related to evaluatevarious business acquisition activities. initial purchase price, allocations forat the acquisitions completeddate of acquisition, based upon its understanding of the fair value of the acquired assets and assumed liabilities. The Company obtains this information during due diligence and through other sources. If additional information is obtained about these assets and liabilities within the past twelve monthsmeasurement period (not to exceed one year from the date of acquisition), through asset appraisals and learning more about the newly acquired business, the Company will refine its estimates of fair value and adjust the allocations as additional information, relativepurchase price allocation. During fiscal 2013, goodwill related to prior year acquisitions increased by less than $0.1 million, the net result of purchase accounting adjustments to the fair value of acquired assets and assumed liabilities. Total Accounts receivable, net $ 17,225 Inventories 1,582 Property, plant & equipment 99,776 Goodwill 87,734 Other intangible assets 65,360 Other assets 1,755 Trade accounts payable (7,664 ) Deferred income taxes (25,923 ) Other liabilities (4,439 ) Cash paid, net of cash acquired $ 235,406 businesses, becomes known.$153.2$153.2 million of cash. The purchase consideration was funded through the Company’s existing cash balances and borrowings under the revolving credit facility. Weasler, which is headquartered in Wisconsin, is a leading global designer and manufacturer of highly engineered drive train components and systems for agriculture, lawn & turf and industrial equipment. Weasler also supplies a variety of torque limiters, high-end gear boxes, clutches and torsional dampers which will expand the product offerings of the Engineered Solutions segment.$158.2$158.2 million of cash. Mastervolt, which is headquartered in The Netherlands, is a designer, developer and global supplier of highly innovative, branded power electronics, primarily for the solar and marine markets. Mastervolt expands the Electrical Segment’s geographic presence and product offerings to include additional technologies associated with the efficient conversion, control, storage and conditioning of electrical power.$155.9$152.4 million of goodwill (which is not deductible for tax purposes) and $157.5$157.5 million of intangible assets, including $81.5$81.5 million of customer relationships, $69.9$69.9 million of tradenames, $5.5$5.5 million of patents and technologies and $0.6$0.6 million of non-compete agreements. During fiscal 2011, the Company also paid $1.9 million of deferred purchase prices for acquisitions completed in previous years and completed a small product line acquisition for $0.2 million. The Company incurred acquisition transaction costs of $1.9 million and $1.1 million in fiscal 2011 and 2010, respectively, related to various business acquisition activities.The following table summarizes the estimated fair values of the assets acquired and the liabilities assumed at the date of acquisition for the businesses acquired during fiscal 2011 (in thousands): Total $ 33,275 44,406 1,182 18,509 155,864 157,474 (26,244 ) (12,225 ) (41,785 ) (18,884 ) $ 311,572 ACTUANT CORPORATIONNOTES TO CONSOLIDATED FINANCIAL STATEMENTS—(Continued)Fiscal 2010During fiscal 2010, the Company completed four tuck-in acquisitions for $43.9 million of cash (net of cash acquired), $2.5 million of deferred purchase price and $4.5 million of contingent consideration. On April 9, 2010 the Company acquired Team Hydrotec, a Singapore based business that provides engineering and integrated solutions primarily to the infrastructure, energy and industrial markets. This was followed by the acquisition of Hydrospex on April 14, 2010. Headquartered in The Netherlands, Hydrospex is a leading provider of a broad range of heavy-lift technologies including strand jacks and gantries for the global infrastructure, power generation and other industrial markets. The products, technologies, engineering and geographic breadth of both Team Hydrotec and Hydrospex will further strengthen the market positions of the Industrial Segment. On April 27, 2010, the Company completed the acquisition of New Jersey based Biach Industries, which provides custom designed bolt and stud tensioning products and services, predominately for the North American nuclear market. Biach Industries, through its strong customer relationships, engineering expertise and customized products will broaden the product and service offerings of the Energy segment to the global power generation market. Finally, on June 11, 2010 the Company completed the acquisition of Norway based Selantic, which is included in the Energy Segment. Selantic provides custom designed high performance slings, tethers and related products for heavy lifting applications.The purchase price allocations for these acquisitions resulted in the recognition of $37.1 million of goodwill (a portion of which is deductible for tax purposes) and $18.2 million of intangible assets, including $14.5 million of customer relationships, $2.5 million of trade names, $1.2 million of non-compete agreements and patents. During fiscal 2010, the Company also paid $2.0 million of deferred purchase price for acquisitions completed in previous years and incurred acquisition transaction costs of $1.1 million related to various business acquisition activities.Fiscal 2009On September 26, 2008, the Company completed the acquisition of the stock of The Cortland Companies (“Cortland”) for approximately $231.2 million in cash, net of cash acquired. Cortland is a global designer, manufacturer and distributor of custom-engineered electro-mechanical cables and umbilicals, high performance synthetic ropes and value-added steel cable assemblies. The majority of the Cortland businesses are included within the Energy segment, while the steel cable assembly business (Sanlo) is included in the Other product line within the Engineered Solutions segment. The purchase price allocation resulted in $131.1 million assigned to goodwill (a portion of which is deductible for tax purposes), $17.8 million to trade names, $1.3 million to non-compete agreements, $4.3 million to patents and $81.4 million to customer relationships. The amounts assigned to non-compete agreements, patents and customer relationships are being amortized over 3, 8 and 15 years, respectively.In addition to the acquisition of Cortland, the Company also completed several smaller product line acquisitions for an aggregate purchase price of $7.4 million of cash and a deferred purchase price of $2.5 million. During fiscal 2009, the Company also paid approximately $0.8 million in earn-out payments for acquisitions completed in previous years.ACTUANT CORPORATIONNOTES TO CONSOLIDATED FINANCIAL STATEMENTS—(Continued)20082010 (in thousands, except per share amounts). Fiscal Year Ended August 31, 2011 2010 2009 $ 1,445,323 $ 1,160,508 $ 1,117,625 1,494,822 1,365,110 1,297,097 $ 124,496 $ 70,356 $ 25,982 127,703 79,632 23,800 $ 1.82 $ 1.04 $ 0.45 1.87 1.18 0.41 $ 1.68 $ 0.97 $ 0.43 1.74 1.10 0.40 Year Ended August 31, 2013 2012 2011 Net sales As reported $ 1,279,742 $ 1,276,521 $ 1,159,310 Pro forma 1,365,115 1,419,173 1,393,061 Earnings from continuing operations As reported $ 147,577 $ 125,276 $ 110,188 Pro forma 153,946 134,581 125,785 Basic earnings per share from continuing operations As reported $ 2.02 $ 1.79 $ 1.61 Pro forma 2.11 1.92 1.84 Diluted earnings per share from continuing operations As reported $ 1.98 $ 1.68 $ 1.49 Pro forma 2.06 1.81 1.69 Year Ended August 31, 2013 2012 2011 Net sales $ 286,308 $ 328,821 $ 335,318 Operating profit 34,536 28,148 20,029 Impairment charge (159,104 ) (62,464 ) — Net loss on disposal (1) — — (15,829 ) Income tax benefit (expense) 7,039 (3,670 ) (2,829 ) Income (loss) from discontinued operations, net of taxes $ (117,529 ) $ (37,986 ) $ 1,371 2010, the Company divested a portion of its European Electrical business (Electrical segment) for $7.5 million of cash proceeds, which resulted in a net pre-tax gain on disposal of $0.3 million. On February 28, 2011, the Company completed the sale of the remainder of the European Electrical business for total cash proceeds of $3.5$3.5 million, net of transaction costs. As a result of the sale transaction, the Company recognized a pre-tax loss on disposal of $15.8$15.8 million, including an $11.4$11.4 million charge to cover future lease payments on an unfavorable real estate lease ofused by the divested business.In addition, duringfourththird quarter of fiscal 2009, the Company sold the Acme Aerospace (Engineered Solutions segment) and BH Electronics (Electrical segment) businesses in separate transactions for total cash proceeds of $38.5 million, net of transaction costs. As a result of the sale transactions, the Company recognized a net pre-tax gain of $17.8 million in the fourth quarter of fiscal 2009. The results of operations for the divested businesses have been reported as discontinued operations for all periods presented. The following table summarizes the results of discontinued operations (in thousands): Year Ended August 31, 2011 2010 2009 $ 49,305 $ 105,661 $ 145,929 (15,829 ) 334 17,800 (1,157 ) (41,525 ) (33,933 ) 4,049 (5,134 ) 3,874 $ (12,937 ) $ (46,325 ) $ (12,259 ) (1)Includes non-cash asset impairment charges of $36.1 million (European Electrical) and $27.0 million (BH Electronics) in fiscal 2010 and 2009, respectively—see Note 6, “Impairment Charges.”(2)Fiscal 2010 includes incremental tax expense of $4.3 million related to provision to return adjustments and the correction of prior period income tax amounts (correction amounts are immaterial to previously reported periods and the current year).ACTUANT CORPORATIONNOTES TO CONSOLIDATED FINANCIAL STATEMENTS—(Continued)Note 4. RestructuringIn fiscal 2009, in response to the dramatic downturn in the worldwide economy, the Company committed to various restructuring initiatives including workforce reductions, plant consolidations, the transfer of production and product sourcing to lower cost plants or regions and the centralization of certain selling and administrative functions. These actions were substantially completed by August 31, 2010, with limited restructuring activity and expense in fiscal 2011, which primarily related to facility exit lease charges. Total restructuring costs recognized, which impact all segments are as follows (in thousands): Year Ended August 31, 2011 2010 2009 $ 1,459 $ 9,726 $ 15,733 87 1,096 1,313 764 5,872 3,797 $ 2,310 $ 16,694 $ 20,843 Approximately $0.1 million, $1.1 million and $1.3 million of the total restructuring cost recognized in fiscal 2011, 2010 and 2009, respectively, were reported in the Consolidated Statements of Earnings in “Cost of products sold” with the balance reported in “Restructuring charges.”A rollforward of the restructuring reserve (included in Other Current Liabilities and Other Long-term Liabilities in the consolidated balance sheets) is as follows (in thousands): 2011 2010 $ 6,517 $ 9,282 2,310 16,694 (5,251 ) (14,914 ) (87 ) (1,096 ) — (4,571 ) 146 1,122 $ 3,635 $ 6,517 Note 5. Accounts Receivable SecuritizationHistorically, the Company maintained an accounts receivable securitization program under which it sold certain of its trade accounts receivable to a wholly-owned, bankruptcy-remote special purpose subsidiary which, in turn, sold participating interests in its pool of receivables to a third party financial institution. The Company did not renew the securitization program on its September 9, 2009 maturity date and as a result, utilized availability under the Senior Credit Facility to fund the corresponding $37.1 million increase in accounts receivable. Sales of trade receivables from the special purpose subsidiary totaled $352.7 million for the year ended August 31, 2009, while related cash collections during the same period totaled $608.0 million (included in operating activities in the consolidated statement of cash flows). Financing costs related to the accounts receivable securitization program were $1.6 million for the year ended August 31, 2009.Note 6. Impairment ChargesDuring the fourth quarter of fiscal 2010,2013, the Company committed to a plan to divest its Europeanthe entire Electrical business, which designed, manufactured and marketed electrical sockets, switches and other tools and consumables predominately in the European DIY retail market. This plannedsegment. The divestiture was part of the Company’s portfolio management process to focus on businesses that create the most shareholder value. Weak economic conditions throughout Europe and reduced demand in the retail DIY markets, combined with theACTUANT CORPORATIONNOTES TO CONSOLIDATED FINANCIAL STATEMENTS—(Continued)decision to divest the business, causedwill allow the Company to reducestreamline its business portfolio and refocus on the projected sales, operating profitremaining cash flowsglobal growth trends. As a result, the Company recognized a non-cash impairment charge in fiscal 2013 of $159.1 million, including a write-down of $137.8 million of goodwill and $21.3 million of indefinite lived intangible assets (tradename). The impairment charge represents the excess of the business, which resulted innet book value of the assets held for sale over the estimated fair value, less selling costs. As a $36.1 million non-cash assetresult of the impairment charge, to adjustthere is no remaining goodwill associated with the carrying valueMastervolt business and $76.9 million for North American Electrical. The following is a summary of this business to fair value. This impairment charge was recognized inthe August 31, 2013 assets and liabilities of the Electrical segment (in thousands):Accounts receivable, net $ 41,247 Inventories, net 55,142 Property, plant & equipment, net 9,545 Goodwill 76,877 Other intangible assets, net 84,387 Other assets 5,408 Assets of discontinued operations $ 272,606 Trade accounts payable $ 19,824 Other current liabilities 12,984 Deferred income taxes 9,376 Other long-term liabilities 10,896 Liabilities of discontinued operations $ 53,080 2010 and consisted of the write-down of $24.5 million of goodwill, $2.3 million of intangible assets and $9.3 million of property, plant and equipment and other assets. As discussed in Note 3, “Discontinued Operations,”2012, the Company subsequently divested the business in the second quarter of fiscal 2011.During the third quarter of fiscal 2009, the Company recordedrecognized a $31.7 asset impairment charge related to the goodwill and indefinite lived intangibles and long-livedintangible assets of the harsh environment electricalElectrical segment's Mastervolt business. The impairment was the result of business (Electrical segment). Approximately $27.0 million of the impairment charge is includedunderperformance and volatility in the Loss from Discontinued Operations. Poor economic conditions, low consumer confidence, increased unemployment and tight credit markets have negatively impacted consumer discretionary spending, resulting in a substantial reduction in recreational boating industry sales. OEM boat builders responded to the sharp drop in demand and high levels of finished goods inventory by suspending operations as well as eliminating brands and permanently closing facilities. These actions caused the Company to significantly reduce its projections for sales, operating profits and cash flows for the harsh environment electrical business, which resulted in a $14.4 million goodwill impairment charge, a $15.7 million impairment of intangible assets and a $1.6 million impairment of fixed assets. As discussed in Note 3, “Discontinued Operations,” the Company subsequently divested the marine OEM business, BH Electronics, insolar market. During the fourth quarter of fiscal 2009.Significant adverse developments2012, industry-wide solar inverter inventory levels and production capacity exceeded demand, significant pricing competition existed and less favorable government incentive schemes were announced and implemented in Mastervolt's served European markets. This challenging economic and competitive environment, as well as uncertainty regarding the recreational vehicle (“RV”) market in the first quarter of fiscal 2009 had a dramatic effect on the Company’s RV business (Engineered Solutions segment). Its financial results were negatively impacted by lower wholesale motorhome shipments by OEM’s, decreased consumer confidence and the lack of financing as a resultlong-term strategic fit of the global credit crisis. These factors caused the Company to significantly reduce its projections for sales, operating profits and cash flows7.4. Goodwill and otherOther Intangible AssetsAnnual impairmentImpairment tests are performed by the Company annually in the fourth quarter of each fiscal year. As discussed in Note 6, “Impairment Charges” totalTotal cumulative goodwill impairment charges for continuing operations were $61.2$22.2 million at both August 31, 20112013 and 2010.2012. The changes in the carrying amount of goodwill for the years ended August 31, 20112013 and 20102012 are as follows (in thousands): Industrial Energy Electrical Engineered
Solutions Total $ 64,688 $ 228,534 $ 199,229 $ 219,071 $ 711,522 15,630 18,071 — — 33,701 — 1,581 — — 1,581 — — (24,542 ) — (24,542 ) (2,382 ) (7,596 ) (3,148 ) (4,247 ) (17,373 ) 77,936 240,590 171,539 214,824 704,889 200 — 84,478 71,186 155,864 3,192 248 — 140 3,580 4,081 11,447 4,760 3,845 24,133 $ 85,409 $ 252,285 $ 260,777 $ 289,995 $ 888,466 Industrial Energy Electrical Engineered
Solutions Total Balance as of August 31, 2011 $ 85,409 $ 252,285 $ 260,777 $ 289,995 $ 888,466 Businesses acquired — 14,101 — 26,188 40,289 Purchase accounting adjustments — — (3,995 ) 715 (3,280 ) Impairment charge — — (36,557 ) — (36,557 ) Impact of changes in foreign currency rates (4,005 ) (6,865 ) (6,355 ) (5,281 ) (22,506 ) Balance as of August 31, 2012 81,404 259,521 213,870 311,617 866,412 Business acquired — 87,734 — — 87,734 Purchase accounting adjustments — 117 — (100 ) 17 Impairment charge — — (137,804 ) — (137,804 ) Reclassification to discontinued operations — — (76,877 ) — (76,877 ) Divestiture of Nielsen Sessions business — — — (2,556 ) (2,556 ) Impact of changes in foreign currency rates 1,207 (5,469 ) 811 1,477 (1,974 ) Balance as of August 31, 2013 $ 82,611 $ 341,903 $ — $ 310,438 $ 734,952 Weighted
Average
Amortization
Period (Years) August 31, 2011 August 31, 2010 Gross
Carrying
Amount Accumulated
Amortization Net Book
Value Gross
Carrying
Amount Accumulated
Amortization Net Book
Value 16 $ 331,171 $ 73,215 $ 257,956 $ 242,384 $ 53,013 $ 189,371 13 51,169 31,221 19,948 44,987 27,264 17,723 20 38,917 6,571 32,346 6,205 5,103 1,102 4 7,362 5,671 1,691 6,941 4,755 2,186 N/A 167,465 — 167,465 126,596 — 126,596 $ 596,084 $ 116,678 $ 479,406 $ 427,113 $ 90,135 $ 336,978 Weighted
Average
Amortization
Period (Years) August 31, 2013 August 31, 2012 Gross
Carrying
Amount Accumulated
Amortization Net Book
Value Gross
Carrying
Amount Accumulated
Amortization Net Book
ValueAmortizable intangible assets: Customer relationships 15 $ 318,143 $ 95,215 $ 222,928 $ 347,739 $ 93,768 $ 253,971 Patents 11 30,564 18,747 11,817 52,851 34,842 18,009 Trademarks and tradenames 19 24,088 7,356 16,732 43,820 8,670 35,150 Non-compete agreements and other 4 7,034 6,458 576 7,677 6,316 1,361 Indefinite lived intangible assets: Tradenames N/A 124,639 — 124,639 137,393 — 137,393 $ 504,468 $ 127,776 $ 376,692 $ 589,480 $ 143,596 $ 445,884 are due to the impact ofresult from foreign currency exchange rate changes, acquisition and divestiture activitiesimpairment charges and the reclassification of certain tradenames from indefinite lived intangiblesElectrical segment intangible assets to amortizable intangibles.discontinued operations (refer to Note 3, "Discontinued Operations"). Amortization expense recorded on intangible assets for the years ended August 31, 2011, 20102013, 2012 and 20092011 was $27.5$22.9 million $22.0, $22.0 million and $19.7$21.5 million, respectively. Amortization expense for future years is estimated to be: $28.8$24.6 million in each of fiscal years 2014 and 2015, $24.5 million in fiscal 2012, $27.12016, $23.4 million in fiscal 2013, $26.02017, $23.0 million in fiscal 2014, $25.92018 and $132.0 million in fiscal 2015, $25.8 million in fiscal 2016, and $178.3 millionaggregate thereafter. The future amortization expense amounts represent estimates, which may change based on future acquisitions, changes in foreign currency exchange rates or other factors.8.5. Debt August 31, 2011 2010 $ 58,000 $ — 100,000 — 158,000 — 249,432 249,334 — 203 407,432 249,537 117,795 117,843 525,227 367,380 (2,500 ) — $ 522,727 $ 367,380 On February 23, 2011, the Company expanded and extended its August 31, 2013 2012 Senior Credit Facility Revolver $ 125,000 $ — Term Loan 90,000 97,500 215,000 97,500 5.625% Senior Notes 300,000 300,000 Total Senior Indebtedness 515,000 397,500 Less: current maturities of long-term debt — (7,500 ) Total long-term debt, less current maturities $ 515,000 $ 390,000 extending its maturity to February 23, 2016 and increasing total capacity from $400 million to $700 million. The amended Senior Credit Facilitywhich matures on July 18, 2018, provides a $600$600.0 million revolving credit facility, a $100$90.0 million term loan and a $300$350.0 million expansion option, subject to certain conditions. Borrowings are subject to a pricing grid, which can result in increases or decreases to the borrowing spread, depending on the Company’s leverage ratio, ranging from 1.25%1.00% to 2.50% in the case of loans bearing interest at LIBOR and from 0.25%0.00% to 1.25%1.50% in the case of loans bearing interest at the base rate. At As of August 31, 2011,2013, the borrowing spread on LIBOR based borrowings was 1.75%1.25% (aggregating to 2.00% on outstanding term loan borrowings and 2.06% on revolver borrowings)approximately 1.50%). In addition, a non-use fee is payable quarterly on the average unused credit line under the revolver ranging from 0.2%0.15% to 0.4%0.40% per annum. At As of August 31, 20112013 the available and unused credit line under the revolver was $539.7$471.6 million of which $522.6 million was available for borrowings. The $100 million. Quarterly term loan will be repaid in quarterly installmentsprincipal payments of $1.25$1.1 million starting begin on March 31, 2012, increasingSeptember 30, 2014, increase to $2.5$2.3 million per quarter beginning on March 31, 2013,September 30, 2015, with the remaining balanceprincipal due at maturity. The Senior Credit Facility, which is secured by substantially all of the Company’s domestic personal property assets, also contains customary limits and restrictions concerning investments, sales of assets, liens on assets, dividends and other payments. The two financial covenants included in the Senior Credit Facility agreement are a maximum leverage ratio of 3.75:3.75:1 and a minimum fixed chargeinterest coverage ratio of 1.50:3.50:1. The Company was in compliance with all debtits financial covenants at August 31, 2011.June 12, 2007,April 16, 2012, the Company issued $250.0$300.0 million of 6.875%5.625% Senior Notes due 2022 (the “Senior Notes”) at an approximate $1.0 million discount, generating net proceeds of $249.0 million.. The Senior Notes were issued at a price of 99.607% to yield 6.93%, and require no principal installments prior to their June 15, 2017 maturity. The approximate $1.0 million initial issuance discount is being amortized through2022 maturity, require semiannual interest expense over the 10 year life of the Senior Notes. Semiannual interest payments on the Senior Notes are due in December and June of each year.$150.0$150.0 million of Senior Subordinated Convertible Debentures due November 15, 2023 (the “2%“2% Convertible Notes”). Since the issuance date,Prior to fiscal 2012, the Company hashad repurchased (for cash) $32.2$32.2 million of 2% Convertible Notes at an average price of 99.3% of par value. The remaining $117.8In addition, $0.2 million of 2% Convertible Notes are convertiblewere converted into 5,966,953 shares of the Company’s Class A common stock in the first quarter of fiscal 2012. In March 2012, the Company called all of the remaining $117.6 million of 2% Convertible Notes outstanding for cash at par. As a result of the call notice, substantially all of the holders of the 2% Convertible Notes converted them into newly issued shares of the Company’s Class A common stock, at a conversion rate of 50.6554 shares per $1,000 of principal amount which equates to a conversion price(resulting in the issuance ofACTUANT CORPORATION5,951,440NOTES TO CONSOLIDATED FINANCIAL STATEMENTS—(Continued) shares of common stock), while the remaining approximately $19.74 per share. The $0.1 million of 2% Convertible Notes bear interest at a rate of 2.0% annually which is payable on November 15 and May 15 of each year. Beginning with the six-month interest period commencing May 16, 2011, holders also receive contingent interest as the trading pricewere repurchased for cash. The impact of the additional share issuance was already included in the diluted earnings per share calculation on an if-converted method. As a result of the 2% Convertible Notes exceeded 120% of their underlying principal amount over a specified trading period, which effectively increased the interest rate from 2.0% to 2.7%being redeemed for the six month period through November 15, 2011. Contingent interest is re-evaluated every six months immediately proceeding each semi-annual interest period. Since November 2010, the Company has had the ability to redeem all or part of the 2% Convertible Notes for cash at any time, at a redemption price equal to 100% of the principal amount, plus accrued interest. In addition, holders of the 2% Convertible Notes have the option to require the Company to repurchase all or a portion of their 2% Convertible Notes for cash on November 15, 2013 and November 15, 2018, at a repurchase price equal to 100% of the principal amount, plus accrued interest. Holders may also convert their 2% Convertible Notes into shares of the Company’s Class A common stock, $15.6 million of related prior toincome tax benefit was recaptured and repaid in the scheduled maturity date if certain conditions are met.In the thirdfourth quarter of fiscal 2012.havehad a total notional value of $100.0$100.0 million and have maturity dates of March 23, 2016.2016. The interest rate swap contracts paypaid the Company variable interest at the three month LIBOR rate, andwhile the Company payspaid the counterparties a fixed interest rate of approximately 2.06%. These interest rate swap contracts were entered into to synthetically convert $100.0$100.0 million of the Senior Credit Facility variable rate borrowings into fixed rate debt. Based onIn connection with the terms ofdebt refinancing transactions discussed above, the contracts and underlying debt,Company terminated the interest rate swap contracts were determinedon April 3, 2012, which resulted in a cash payment to be effective, and thus qualify as cash flow hedges. As such, any changesthe counterparty of $4.1 million, in full settlement of the fair value of thesethe contracts.contracts are recorded in accumulated other comprehensive loss inagreements. The related tax benefit on the accompanying consolidated balance sheets. The market value of these interest rate swap contractsdebt refinancing charge was a $4.6$6.3 million liability at August 31, 2011 and recognized in Other Long-term Liabilities..$26.1$20.8 million $26.8, $25.9 million and $36.1$26.1 million in fiscal 2011, 20102013, 2012 and 2009,2011, respectively.9.6. Fair Value MeasurementsCompany has nofollowing financial assets orand liabilities, that are recordedmeasured at fair value, using significant unobservable inputs (Level 3). The fair value of financial assets and liabilitiesare included in the consolidated balance sheet are as follows (in thousands): August 31, 2011 2010 $ 1,958 $ 5,092 1,464 1,313 $ (81 ) $ 207 (4,552 ) — August 31, 2013 2012 Level 1 Valuation: Cash equivalents $ 1,092 $ 5,154 Investments 1,793 1,602 Level 2 Valuation: Foreign currency forward contracts $ 143 $ 945 short-term borrowings and its variable rate long-term debt approximated book value at August 31, 20112013 and 20102012 due to their short-term nature and the fact that the interest rates approximated year-end market rates of interest.rates. The fair value of the Company’s outstanding $117.8$300.0 million 2% Convertible of 5.625% Senior Notes was $300.8 million and $309.8 million at August 31, 20112013 and 2010 was $127.9 millionACTUANT CORPORATIONNOTES TO CONSOLIDATED FINANCIAL STATEMENTS—(Continued)and $126.4 million,2012, respectively. The fair value of the Company’s outstanding $250.0 million of Senior Notes was $252.5based on quoted inactive market prices and are therefore classified as Level 2 within the valuation hierarchy.20112013 and 2010. 2012, respectively.valuesvalue of the 2% Convertible Notesforeign currency exchange contracts and Senior Notes were basedthe related non-functional currency asset or liability. The U.S. dollar equivalent notional value of these short duration foreign currency forward contracts was $383.6 million and $197.5 million, at August 31, 2013 and 2012, respectively. Net foreign currency gains related to these derivative instruments was $0.8 million for the year ended August 31, 2013, which offset foreign currency losses from the related revaluation on non-functional currency assets and liabilities (amounts included in other income and expense in the quoted market prices.10.8. Leases2011,2013, future obligations under non-cancelable operating leases (related to continuing operations) were as follows: $22.2$24.1 million in fiscal 2012; $18.12014; $19.1 million in fiscal 2013; $14.62015; $15.9 million in fiscal 2014; $10.92016; $13.3 million in fiscal 2015; $8.42017; $10.3 million in fiscal 2016;2018; and $31.4$38.6 million in aggregate thereafter. Total related rental expense under operating leases was $26.4$26.0 million $22.3, $24.2 million and $28.8$21.1 million in fiscal 2011, 20102013, 2012 and 2009,2011, respectively. As discussed in Note 17,14, “Contingencies and Litigation” the Company is also contingently liable for certain leases entered into by a former subsidiary.11.9. Employee Benefit PlansCompany’s August 31 measurement date (in thousands): 2011 2010 $ 46,967 $ 42,281 2,108 2,306 (2,311 ) 5,275 (2,334 ) (2,895 ) $ 44,430 $ 46,967 $ 25,429 $ 26,786 2,890 1,233 6,427 305 (2,334 ) (2,895 ) 32,412 25,429 $ (12,018 ) $ (21,538 ) ACTUANT CORPORATIONNOTES TO CONSOLIDATED FINANCIAL STATEMENTS—(Continued) 2013 2012 Reconciliation of benefit obligations: Benefit obligation at beginning of year $ 50,870 $ 44,430 Adjustment (280 ) — Interest cost 1,928 2,162 Actuarial (gain) loss (4,983 ) 6,855 Benefits paid (2,489 ) (2,577 ) Benefit obligation at end of year $ 45,046 $ 50,870 Reconciliation of plan assets: Fair value of plan assets at beginning of year $ 33,695 $ 32,412 Actual return on plan assets 2,252 2,911 Company contributions 596 949 Benefits paid from plan assets (2,489 ) (2,577 ) Fair value of plan assets at end of year 34,054 33,695 Funded status of the plans (underfunded) $ (10,992 ) $ (17,175 ) Year ended August 31, 2011 2010 2009 $ 2,108 $ 2,306 $ 2,483 (2,221 ) (2,568 ) (2,934 ) 669 310 78 $ 556 $ 48 $ (373 ) Year ended August 31, 2013 2012 2011 Interest cost $ 1,928 $ 2,162 $ 2,108 Expected return on assets (2,468 ) (2,471 ) (2,221 ) Amortization of actuarial loss 878 675 669 Net benefit cost $ 338 $ 366 $ 556 20112013 and 2010, $12.02012, $12.0 million and $14.3$15.6 million, respectively, of pension plan actuarial gains and losses, which have not yet been recognized in net periodic benefit cost, were included in Accumulated Other Comprehensive Loss,accumulated other comprehensive loss, net of2012, $0.42014, $0.4 million of these actuarial gains and losses are expected to be recognized in net periodic benefit cost.benefitU.S. pension plan obligations as of August 31 and weighted-average assumptions used to determine net periodic benefit cost for the years ended August 31 are as follows: 2011 2010 2009 5.00 % 4.60 % 5.60 % 4.60 % 5.60 % 6.50 % 8.00 % 8.25 % 8.50 % 2013 2012 2011 Assumptions for benefit obligations: Discount rate 4.90 % 3.90 % 5.00 % Assumptions for net periodic benefit cost: Discount rate 3.90 % 5.00 % 4.60 % Expected return on plan assets 7.75 % 7.90 % 8.00 % equitiesequity and fixed income investments are used to maximize the long-term return for plan assets, at a prudent level of risk. The investment portfolio contains a diversified blend of equity and fixed income investments. Within the equity allocation, a blend of growth and value investments are maintained in a variety of market capitalizations and diversified between U.S. and non-U.S. stocks. The Company’s targeted asset allocation as a percentage of total market valueplan assets is 60% to - 80% in equity securities, andwith the remainder invested in fixed income securities and cash. Cash balances are maintained at levels adequate to meet near-term plan expenses and benefit payments. Investment risk is measured and monitored on an ongoing basis.2011,2013, Company’s overall expected long-term rate of return for assets in U.S. pension plans was 7.9%7.65%. The expected long-term rate of return is based on the portfolio as a whole and not on the sum of the returns on individual asset categories. The target return is based on historical returns adjusted to reflect the current view of the long-term investment market.ACTUANT CORPORATIONNOTES TO CONSOLIDATED FINANCIAL STATEMENTS—(Continued)9,6, “Fair Value Measurements.” The U.S. pension plan investment allocations by asset category were as follows (in thousands): Year Ended August 31, 2011 % 2010 % $ 5,703 17.6 % $ 470 1.8 % 554 1.7 % 405 1.6 % 6,677 20.6 % 7,104 27.9 % 107 0.3 % 29 0.1 % 7,338 22.6 % 7,538 29.6 % 14,560 44.9 % 13,712 53.9 % 4,811 14.8 % 3,709 14.6 % 19,371 59.8 % 17,421 68.5 % $ 32,412 100.0 % $ 25,429 100.0 % Year Ended August 31, 2013 % 2012 % Cash and cash equivalents $ 348 1.0 % $ 250 0.7 % Fixed income securities: Government bonds — — 310 0.9 Corporate bonds 8,741 25.7 7,489 22.2 Mutual funds 3,464 10.2 2,678 8.0 12,205 35.9 10,477 31.1 Equity securities: Mutual funds 21,501 63.1 22,968 68.2 Total plan assets $ 34,054 100.0 % $ 33,695 100.0 % 20122014 through 20162018 and $14.3$14.9 million in aggregate for fiscal 2017 through 2021. During fiscal 2012, the Company anticipates contributing $0.9 million to U.S. pension plans.Non-U.S.non-U.S. defined benefit pension plans which cover certain existing and former employees of businesses outside the U.S. Most of the Non-U.S.non-U.S. defined benefit pension plans continue to earn additional benefits. The funded status of these plans at August 31, 2011 and 2010 is summarized as follows (in thousands): 2011 2010 $ 9,035 $ 8,892 7,333 6,479 $ (1,702 ) $ (2,413 ) August 31, 2013 2012 Benefit obligation $ 12,912 $ 12,227 Fair value of plan assets 7,790 7,440 Funded status of plans (underfunded) $ (5,122 ) $ (4,787 ) Non-U.S.non-U.S. plans was $0.4$0.8 million $0.3, $0.5 million and $0.4$0.5 million in fiscal 2011, 20102013, 2012 and 2009,2011, respectively. The weighted average discount rate utilized for determining the benefit obligation at August 31, 20112013 and 20102012 was 5.5%4.3% and 4.3%4.0%, respectively. The plan assets of these non-U.S. pension plans consist primarily of participating units in common stock and bond funds. The Company’s overall expected long-term rate of return on these investments is 4.5%4.6%. During fiscal 2012,2014, the Company anticipates contributing $0.4$0.6 million in aggregate to non-U.S.these pension plans.Post-RetirementPostretirement Health Benefit Planspost-retirementpostretirement health benefits (“OPEB”) to certain existing and former employees of domestic businesses it acquired, thatwho were entitled to thosesuch benefits prior to acquisition. These unfunded plans had a benefit obligation of $3.3$2.9 million and $3.7$3.4 million at August 31, 20112013 and 2010,ACTUANT CORPORATION2012NOTES TO CONSOLIDATED FINANCIAL STATEMENTS—(Continued)8%7.5%, trending downward to 5% by the year 2018, and remaining level thereafter. Net periodic benefit costs (credit) for the other post-retirementpostretirement benefits were $(0.2)was a credit of approximately $0.2 million for each of the three years ended August 31, 2011, 2010,2013, 2012 and 2009.2011. Benefit payments from the plan are funded through participant contributions and Company contributions, which are projected to be $0.3$0.3 million in fiscal 2012.Common Stockcommon stock for its contributions and allocates such sharescontributions. Amounts are allocated to accounts set aside for each employee’s retirement. Employees generally may contribute up to 50% of their compensation to individual accounts within the 401(k) Plan. While contributions vary, the Company generally makes core contributions to employee accounts equal to 3% of each employee’s eligible annual cash compensation, subject to IRS limitations. The Company also maintains a Restoration Plan that allows eligible highly compensated employees (as defined by the Internal Revenue Code) to receive a core contribution as if no IRS limits were in place. Company contributions to the Restoration Plan are made in the form of Actuant common stock and are contributed into each eligible participant’s Deferred Compensation Plan account. In addition, the Company matches approximately 25% of each employee’s contribution up to 6% of the employee’s eligible compensation. Expense recognized related to the 401(k) plan totaled approximately $5.6$4.5 million $2.7, $5.1 million and $1.4$4.6 million for the years ended August 31, 2011, 20102013, 2012 and 2009,2011, respectively.increaseunfunded SERP plan covers certain executive level employees and has a benefit accrual formula based on age and years of service (with Company contributions ranging from 3% to 6% of eligible wages). Expense recognized in expensefiscal 2013 and 2012 for the year ended August 31, 2011 is the result of the full reinstatement of the core contribution, which had been temporarily suspended for fiscal 2009SERP Plan was $0.6 million and the first half of fiscal 2010 (due to adverse economic conditions).$0.7 million, respectively.Common Stock,common stock, or a combination of the two. The fixed income portion of the plan is currently unfunded, and therefore all compensation deferred under the plan is held by the Company and commingled with its general assets. Liabilities of $15.6$23.2 million and $13.0$19.6 million are included in “Other Current Liabilities”current liabilities” and “Other Long-term Liabilities”long-term liabilities” on the consolidated balance sheets at August 31, 20112013 and 2010,2012, respectively, to reflect the unfunded portion of the deferred compensation liability. The Company recorded expense of $1.2$1.6 million $1.0, $1.5 million and $0.9$1.2 million for the years ended August 31, 2011, 20102013, 2012 and 2009,2011, respectively, related tofor non-funded interest on participant deferrals in the fixed income investment option. Company Common Stockcommon stock contributions to fund the plan isare held in a rabbi trust, accounted for in a manner similar to treasury stock and isare recorded at cost in “Stock held in trust” within shareholders’ equity with the corresponding deferred compensation liability also recorded within shareholders’ equity. Since no investment diversification is permitted within the trust, changes in fair value of Actuant common stock are not recognized. The shares held in the trust are included in both the basic and diluted earnings per share calculations. The cost of the shares held in the trust was $1.0$1.9 million and $1.5 million at both August 31, 20112013 and 2010.2012, respectively.the attainment of a $50Actuant’s common stock meeting or exceeding $50 per share Actuant Common Stock price appreciation over an 8 year period.prior to May 1, 2014. The Company recorded expense (income) of $0.1$0.3 million $0.4, $0.1 million and $(2.6)$0.1 million for the years ended August 31, 2011, 20102013, 2012 and 2009,2011, respectively, pursuant to this plan. A related liability of $1.0$1.3 million and $0.9$1.1 million is included in “Other Long-term Liabilities”current liabilities” on the consolidated balance sheets at August 31, 20112013 and 2010,2012, respectively. As of August 31, 20112013 the minimum and maximum payments available under the plan, depending on the attainment of the $50$50 per share stock price appreciation target, are $0$0 and $16.6$10.0 million, respectively.ACTUANT CORPORATIONNOTES TO CONSOLIDATED FINANCIAL STATEMENTS—(Continued)12.10. Income Taxes Year ended August 31, 2011 2010 2009 $ 2,402 $ 9,708 $ — 23,847 15,834 19,491 1,982 784 (1,570 ) 28,231 26,326 17,921 15,297 (4,892 ) (12,439 ) (4,639 ) (2,147 ) (8,053 ) (4,178 ) (441 ) 3,182 6,480 (7,480 ) (17,310 ) $ 34,711 $ 18,846 $ 611 Year ended August 31, 2013 2012 2011 Currently payable: Federal $ 24,809 $ 22,078 $ (78 ) Foreign 13,335 10,396 20,903 State 902 1,534 586 39,046 34,008 21,411 Deferred: Federal (13,514 ) (495 ) 14,948 Foreign (9,942 ) (4,598 ) (4,223 ) State (218 ) 439 (4,303 ) (23,674 ) (4,654 ) 6,422 $ 15,372 $ 29,354 $ 27,833 Year ended August 31, 2011 2010 2009 35.0 % 35.0 % 35.0 % 0.5 0.4 2.0 (13.1 ) (23.5 ) (39.3 ) (2.6 ) (1.9 ) 15.4 2.0 11.1 (10.8 ) 21.8 % 21.1 % 2.3 % (1)Other items for the year ended August 31, 2010 of 11.1% includes provision to return adjustments and additional provisions for unrecognized tax benefits. Other items for the year ended August 31, 2009 of (10.8%) reflects the benefit of income tax reserve adjustments resulting from settling tax audits for amounts less than previously accrued. Year ended August 31, 2013 2012 2011 Federal statutory rate 35.0 % 35.0 % 35.0 % State income taxes, net of Federal effect 0.9 1.2 0.4 Net effect of foreign tax rates and credits (8.8 ) (14.6 ) (14.0 ) NOL utilization and changes in valuation allowance (3.1 ) 0.1 (3.0 ) Tax contingency reserve (5.6 ) (2.2 ) (1.6 ) Prior period correction (1) (6.5 ) — — Other items (2.5 ) (0.5 ) 3.4 Effective income tax rate 9.4 % 19.0 % 20.2 % Year ended August 31, 2011 2010 $ 19,312 $ 21,391 8,122 12,766 7,192 11,126 9,202 6,522 5,674 2,248 16,073 12,949 65,575 67,002 (7,260 ) (8,542 ) 58,315 58,460 (155,022 ) (107,738 ) (34,579 ) (29,346 ) (2,198 ) (905 ) (191,799 ) (137,989 ) $ (133,484 ) $ (79,529 ) The valuation allowance primarily represents a reserve for foreign loss carryforwards for which utilization is uncertain. August 31, 2013 2012 Deferred income tax assets: Operating loss and tax credit carryforwards $ 35,071 $ 16,393 Compensation related liabilities 20,812 9,909 Postretirement benefits 7,731 10,679 Inventory reserves 7,049 8,045 Book reserves and other items 11,523 12,781 Total deferred income tax assets 82,186 57,807 Valuation allowance (22,777 ) (8,153 ) Net deferred income tax assets 59,409 49,654 Deferred income tax liabilities: Depreciation and amortization (129,498 ) (156,751 ) Other items (1,985 ) (2,098 ) Deferred income tax liabilities (131,483 ) (158,849 ) Net deferred income tax liability $ (72,074 ) $ (109,195 ) these foreignthe operating loss and tax credit carryforwards may be carried forward indefinitely, with the remaining $4.1$12.9 million expiring at various dates between 20182014 and 2020.deductibility of the 2% Convertible Notes interest,valuation allowance represents a reserve for operating loss and tax purposes, may have to be recaptured, in part or in whole, if the notes are redeemed or converted at a price below a calculated level. August 31, 2011 2010 2009 $ 28,225 $ 28,541 $ 29,872 4,026 2,868 4,633 (6,072 ) (484 ) — — (2,700 ) (5,964 ) $ 26,179 $ 28,225 $ 28,541 2013 2012 2011 Beginning balance $ 24,608 $ 26,179 $ 28,225 Increase for tax positions taken in a prior period 3,601 3,400 4,026 Decrease for tax positions taken in a prior period (7,622 ) (4,579 ) (6,072 ) Decrease due to settlements (2,581 ) (392 ) — Ending balance $ 18,006 $ 24,608 $ 26,179 2011, 20102013, 2012 and 2009,2011, the Company recognized $5.1$2.9 million $4.2, $4.5 million and $3.5$5.1 million, respectively for the payment of interest and penalties related to unrecognized tax benefits. With few exceptions, the Company is no longer subject to U.S. federal, state and local and foreign income tax examinations by tax authorities in our major tax jurisdictions for years before fiscal 2005.2006. The Company believes it is reasonably possible that the total amount of unrecognized tax benefits could increase or decrease by approximately $3.5up to $4.3 million within the next twelve months.ACTUANT CORPORATIONNOTES TO CONSOLIDATED FINANCIAL STATEMENTS—(Continued)$288.7$427.1 million at August 31, 2011.2013. If all such undistributed earnings were remitted, an additional income tax provision of approximately $61.9$79.8 million would have been necessary as of August 31, 2011. Year Ended August 31, 2013 2012 2011 Domestic $ 67,392 $ 65,685 $ 47,445 Foreign 95,557 88,945 90,576 $ 162,949 $ 154,630 $ 138,021 to non-United States operations were $102.1benefits, growth investments, debt levels, interest rates and the impact of changes in foreign currency exchange rates. In addition, fiscal 2012 domestic pre-tax earnings include a $16.8 million $33.1 million and $43.9 million for the years ended August 31, 2011, 2010 and 2009, respectively. (domestic) debt refinancing charge.$23.1$42.1 million $6.5, $56.5 million and $20.1$23.1 million during the years ended August 31, 2011, 20102013, 2012 and 2009,2011, respectively.13.11. Capital Stock20112013 consisted of 168,000,000 shares of Class A Common Stock, $0.20common stock, $0.20 par value, of which 68,657,23477,001,144 shares were issued and 73,017,631outstanding; 1,500,000 shares of Class B Common Stock, $0.20common stock, $0.20 par value, none of which were issued and outstanding; and 160,000 shares of Cumulative Preferred Stock, $1.00cumulative preferred stock, $1.00 par value (“Preferred Stock”preferred stock”), none of which have been issued. Holders of both classes of the Company’s Common Stockcommon stock are entitled to dividends, as the Company’s board of directors may declare out of funds legally available, subject to any contractual restrictions on the payment of dividends or other distributions on the Common Stock.common stock. If the Company were to issue any of its Preferred Stock,preferred stock, no dividends could be paid or set apart for payment on shares of Common Stock,common stock, unless paid in Common Stock,common stock, until dividends on all of the issued and outstanding shares of Preferred Stockpreferred stock had been paid or set apart for payment and provision had been made for any mandatory sinking fund payments.In the fourth quarter of fiscal 2009, the Company completed a follow-on equity offering of 10,925,000 shares of its Class A common stock. Total proceeds from the offering, net of transactions costs, were $124.8 million, which were used to reduce Senior Credit Facility borrowings.As described in Note 8, “Debt,” the remaining $117.8 million of 2% Convertible Notes are convertible into 5,966,953 shares of the Company’s Class A Common Stock if certain conditions are met.Common Stock.common stock. The share repurchase plan may be implemented from time to time on the open market or in privately negotiated transactions, with repurchased shares available for use in connection with the Company’s stock-based compensation plans and for other corporate purposes. Year Ended August 31, 2011 2010 2009 $ 111,559 $ 24,031 $ 13,723 1,755 1,898 2,429 $ 113,314 $ 25,929 $ 16,152 68,254 67,624 58,047 1,089 661 514 5,962 5,924 7,503 75,305 74,209 66,064 $ 1.63 $ 0.36 $ 0.24 $ 1.50 $ 0.35 $ 0.24 Year Ended August 31, 2013 2012 2011 Numerator: Net earnings $ 30,048 $ 87,290 $ 111,559 Plus: 2% Convertible Notes financings costs, net of taxes — 425 1,755 Net earnings for diluted earnings per share $ 30,048 $ 87,715 $ 113,314 Denominator: Weighted average common shares outstanding for basic earnings per share 72,979 70,099 68,254 Net effect of dilutive securities—employee stock compensation plans 1,601 1,119 1,089 Net effect of 2% Convertible Notes based on the if-converted method — 3,722 5,962 Weighted average common shares outstanding for diluted earnings per share 74,580 74,940 75,305 Basic Earnings Per Share: $ 0.41 $ 1.25 $ 1.63 Diluted Earnings Per Share: $ 0.40 $ 1.17 $ 1.50 20112013, 2012 and 2010,2011, outstanding share based awards to acquire 619,000, 2,582,000 and 4,371,0002,582,000 shares of common stock were not included in the computation of diluted earnings per share because the effect would have been anti-dilutive. The increase in the weighted average common shares outstanding for the years ended August 31, 2011 and 2010 results from the 10,925,000 shares of common stock issued in connection with the follow-on equity offering in the fourth quarter of fiscal 2009.14.12. Stock Plansofficerskey employees and key employeesdirectors under the Actuant Corporation 2009 Omnibus Incentive Plan (the “Plan”). At August 31, 2011, 5,400,0002013, 9,400,000 shares of Class A Common Stockcommon stock were authorized for issuance under the Plan, of which 2,166,3804,503,394 shares were available for future award grants. The Plan permits the Company to grant share-based awards, including stock options and restricted stock, to employees and directors. Options generally have a maximum term of ten years, an exercise price equal to 100% of the fair market value of the Company’s common stock at the date of grant and generally vest 50% after three years and 100% after five years. The Company’s restricted stock grants generally have similar vesting provisions. In addition, in fiscal 2012 the Company began issuing Performance Shares under the Plan. The Performance Shares include a three-year performance period, with vesting based 50% on achievement of an absolute Free Cash Flow Conversion target and 50% on the Company’s Total Shareholder Return (TSR) relative to the S&P 600 SmallCap Industrial index. The provisions of share-based awards may vary by individual grant with respect to vesting period, dividend and voting rights, performance conditions and forfeitures.20112013 is as follows: Shares Weighted-
Average
Exercise Price
(Per Share) Weighted-
Average
Remaining
Contractual
Term Aggregate
Intrinsic Value 5,932,988 $ 19.87 423,977 27.50 (479,610 ) 9.01 (231,550 ) 24.08 5,645,805 $ 21.23 5.4 years $ 10.2 million 3,053,165 $ 20.44 3.6 years $ 8.3 million Shares Weighted-Average
Exercise Price (Per Share) Weighted-Average
Remaining Contractual
Term Aggregate
Intrinsic ValueOutstanding on September 1, 2012 5,289,384 $ 22.33 Granted 276,136 28.70 Exercised (1,278,626 ) 19.48 Forfeited (107,343 ) 22.10 Outstanding on August 31, 2013 4,179,551 $ 23.66 5.3 $ 48.8 million Exercisable on August 31, 2013 2,609,876 $ 23.92 4.2 $ 30.8 million 20112013 and the exercise price which is aggregated for all options outstanding and exercisable. A summary of the weighted-average grant-date fair value of options, total intrinsic value of options exercised, and cash receipts from options exercised is shown below (in thousands, except per share amounts): Year Ended August 31, 2011 2010 2009 $ 10.74 $ 7.56 $ 6.78 7,540 2,607 5,881 4,324 1,732 365 Year Ended August 31, 2013 2012 2011 Weighted-average fair value of options granted (per share) $ 10.49 $ 8.73 $ 10.74 Intrinsic value of options exercised 15,803 7,946 7,540 Cash receipts from exercise of options 24,840 6,550 4,324 20112013 is as follows: Number of
Shares Weighted-
Average Fair Value
at Grant Date
(Per Share) 829,036 $ 19.78 565,259 27.36 (117,148 ) 22.49 (83,225 ) 23.12 1,193,922 $ 22.87 Number of
Shares Weighted-Average Fair Value at Grant Date (Per Share) Outstanding August 31, 2012 1,507,443 $23.85 Granted 430,793 29.18 Forfeited (131,688 ) 22.76 Vested (212,359 ) 20.46 Outstanding August 31, 2013 1,594,189 25.83 2011,2013, there was $27.4$29.8 million of total unrecognized compensation cost related to share-based compensation forawards, including stock options and restricted stock outstanding.awards/units. That cost is expected to be recognized over a weighted average period of 3.52.9 years. The total fair value of shares vested during the fiscal years ended August 31, 20112013 and 20102012 was $2.1$6.2 million and $0.7$3.3 million, respectively. The Company issues previously unissued shares of Class A common stock to satisfy stock option exercises and restricted stock vesting.was calculatedis determined using the Black-Scholes option pricing model for options granted in the first half of fiscal 2005 and a binomial pricing model for options granted thereafter.options. The fair value of Performance Shares with market vesting conditions is determined utilizing a Monte Carlo simulation model. Assumptions used to determine the fair value of each option were based upon historical data and standard industry valuation practices and methodology. The following weighted-average assumptions were used in each fiscal year: Fiscal Year Ended August 31, 2011 2010 2009 0.15 % 0.23 % 0.22 % 39.62 % 40.01 % 38.07 % 2.53 % 2.76 % 1.70 % 15 % 15 % 15 % 6.1 years 6.1 years 6.0 years Fiscal Year Ended August 31, 2013 2012 2011 Dividend yield 0.14 % 0.18 % 0.15 % Expected volatility 38.36 % 39.97 % 39.62 % Risk-free rate of return 0.84 % 1.19 % 2.53 % Expected forfeiture rate 15 % 15 % 15 % Expected life 6.1 years 6.1 years 6.1 years Note 15. Accumulated Other Comprehensive LossAccumulated other comprehensive loss in the accompanying consolidated balance sheets and consolidated statements of shareholders equity consists of the following (in thousands): Year Ended August 31, 2011 2010 $ (4,283 ) $ (50,590 ) (10,574 ) (16,515 ) (2,822 ) — $ (17,679 ) $ (67,105 ) 16.13. Business Segment, Geographic and Customer Informationfourthree reportable segments: Industrial, Energy Electrical and Engineered Solutions. The Industrial segment is primarily involved in the design, manufacture and distribution of branded hydraulic and mechanical tools to the maintenance, industrial, infrastructure and production automation markets. The Energy segment provides joint integrity products and services, customized offshore vessel mooring solutions, as well as umbilical, rope and cable solutions to the global oil & gas, power generation and energy markets. The Electrical segment designs, manufactures and distributes a broad range of electrical products to the retail DIY, wholesale, OEM, utility, marine and other harsh environment markets. The Engineered Solutions segment provides highly engineered position and motion control systems to OEMs in various vehicle markets, as well as a variety of other products to the industrial and agricultural markets. for continuing operations by reportable segment and product line (in thousands): Year Ended August 31, 2011 2010 2009 $ 393,013 $ 299,983 $ 286,851 293,060 235,723 259,490 286,013 233,702 241,988 473,237 391,100 329,296 $ 1,445,323 $ 1,160,508 $ 1,117,625 $ 393,013 $ 299,983 $ 286,851 293,060 235,723 259,490 286,013 233,702 241,988 328,763 284,633 228,031 144,474 106,467 101,265 $ 1,445,323 $ 1,160,508 $ 1,117,625 $ 98,415 $ 66,344 $ 67,451 49,345 30,702 44,092 20,683 19,853 3,327 63,612 31,681 (28,432 ) (38,485 ) (26,808 ) (18,710 ) $ 193,570 $ 121,772 $ 67,728 Year Ended August 31, 2013 2012 2011 Net Sales by Segment: Industrial $ 422,620 $ 419,295 $ 393,013 Energy 363,372 349,163 293,060 Engineered Solutions 493,750 508,063 473,237 $ 1,279,742 $ 1,276,521 $ 1,159,310 Net Sales by Reportable Product Line: Industrial $ 422,620 $ 419,295 $ 393,013 Energy 363,372 349,163 293,060 Vehicle Systems 253,073 279,549 328,763 Other 240,677 228,514 144,474 $ 1,279,742 $ 1,276,521 $ 1,159,310 Operating Profit (Loss): Industrial $ 117,644 $ 114,777 $ 98,415 Energy 63,280 62,205 49,345 Engineered Solutions 40,328 60,851 63,612 General Corporate (31,107 ) (33,319 ) (38,485 ) $ 190,145 $ 204,514 $ 172,887 Depreciation and Amortization: Industrial $ 8,553 $ 8,358 $ 8,655 Energy 18,451 18,115 18,152 Engineered Solutions 16,949 15,093 13,916 General Corporate 2,145 2,030 2,579 Discontinued Operations 7,804 10,667 9,694 $ 53,902 $ 54,263 $ 52,996 Capital Expenditures: Industrial $ 3,524 $ 5,333 $ 3,590 Energy 9,417 8,962 8,978 Engineered Solutions 7,001 3,463 5,966 General Corporate 867 1,905 1,902 Discontinued Operations 2,859 3,077 2,660 $ 23,668 $ 22,740 $ 23,096 Year Ended August 31, 2011 2010 2009 $ 8,655 $ 6,571 $ 6,413 18,152 17,276 17,322 9,694 10,470 8,594 13,916 14,898 16,763 2,579 2,660 2,886 $ 52,996 $ 51,875 $ 51,978 $ 3,590 $ 779 $ 2,804 8,978 7,212 5,568 1,953 5,662 3,731 5,966 4,517 1,568 1,902 1,796 7,783 707 — — $ 23,096 $ 19,966 $ 21,454 August 31, 2011 2010 $ 263,680 $ 241,036 517,428 491,053 547,556 326,129 632,242 434,976 95,775 83,707 — 44,802 $ 2,056,681 $ 1,621,703 August 31, 2013 2012 Assets: Industrial $ 280,110 $ 268,735 Energy 817,547 540,409 Electrical — 437,914 Engineered Solutions 652,581 667,550 General Corporate 96,488 92,511 Assets of discontinued operations 272,606 — $ 2,119,332 $ 2,007,119 benefits and the non-cash asset impairment charges in fiscal 2009 of $26.6 million and $4.7 million in the Engineered Solutions and Electrical segments, respectively.benefits. Corporate assets, which are not allocated, principally represent cash and cash equivalents, capitalized debt issuance costs and deferred income taxes and the fair value of derivative instruments.ACTUANT CORPORATIONNOTES TO CONSOLIDATED FINANCIAL STATEMENTS—(Continued) Year Ended August 31, 2011 2010 2009 $ 702,459 $ 602,546 $ 608,783 258,412 164,822 138,733 56,981 42,882 44,647 122,046 98,027 114,342 305,425 252,231 211,120 $ 1,445,323 $ 1,160,508 $ 1,117,625 August 31, 2011 2010 $ 57,413 $ 48,193 21,022 20,589 20,079 16,440 14,880 12,014 19,699 15,609 $ 133,093 $ 112,845 Year Ended August 31, 2013 2012 2011 Net Sales: United States $ 549,057 $ 599,831 $ 479,070 Netherlands 159,396 185,112 207,787 United Kingdom 144,131 141,037 116,935 Australia 68,255 47,472 27,854 France 52,806 48,681 49,971 All other 306,097 254,388 277,693 $ 1,279,742 $ 1,276,521 $ 1,159,310 August 31, 2013 2012 Long-lived Assets: Norway $ 59,557 $ 941 United Kingdom 54,136 17,672 United States 41,161 50,950 China 19,551 20,166 Netherlands 10,418 12,166 All other 20,358 17,725 $ 205,181 $ 119,620 2.1%, 2.8% and 2.8%less than 3.0% of its sales in each of the last three fiscal 2011, 2010 and 2009, respectively.years. Export sales from domestic operations were less than 7.5%approximately 8.0% of total net sales in each of the periods presented.17.14. Contingencies and Litigation$9.5$10.7 million and $9.1$8.5 million at August 31, 20112013 and 2010,2012, respectively, the majority of which secure self-insured workers compensation liabilities.The Company, in the normal coursethoselease payments under leases if any of thesebusinesses that it previously divested or spun-off, in the event that such businesses are unable to fulfill their obligations thereunder.future lease payment obligations. The discounted present value of future minimum lease payments for these leases was $2.8$10.9 million at August 31, 2011.ACTUANT CORPORATION.NOTES TO CONSOLIDATED FINANCIAL STATEMENTS—(Continued)18.15. Guarantor SubsidiariesJune 12, 2007,April 16, 2012, Actuant Corporation (the “Parent”) issued $250.0$300.0 million of 6.875%5.625% Senior Notes. All of our material domestic wholly owned subsidiaries (the “Guarantors”) fully and unconditionally guarantee (except for certain customary limitations) the 6.875%5.625% Senior Notes on a joint and several basis. There are no significant restrictions on the ability of the Guarantors to make distributions to the Parent. The following tables present the results of operations, financial position and cash flows of Actuant Corporation and its subsidiaries, the Guarantor and non-Guarantor entities, and the eliminations necessary to arrive at the information for the Company on a consolidated basis. Year Ended August 31, 2013 Parent Guarantors Non-Guarantors Eliminations Consolidated Net sales $ 196,531 $ 293,884 $ 789,327 $ — $ 1,279,742 Cost of products sold 65,178 201,704 505,910 — 772,792 Gross profit 131,353 92,180 283,417 — 506,950 Selling, administrative and engineering expenses 69,734 59,358 164,774 — 293,866 Amortization of intangible assets 1,276 10,481 11,182 — 22,939 Operating profit 60,343 22,341 107,461 — 190,145 Financing costs, net 25,270 9 (442 ) — 24,837 Intercompany expense (income), net (21,041 ) 1,082 19,959 — — Other expense (income), net (2,105 ) (571 ) 5,035 — 2,359 Earnings from continuing operations before income tax expense 58,219 21,821 82,909 — 162,949 Income tax expense (benefit) (798 ) 2,009 14,161 — 15,372 Net earnings before equity in earnings (loss) of subsidiaries 59,017 19,812 68,748 — 147,577 Equity in earnings (loss) of subsidiaries (26,527 ) 7,822 2,173 16,532 — Earnings from continuing operations 32,490 27,634 70,921 16,532 147,577 Loss from discontinued operations (2,442 ) (76,634 ) (38,453 ) — (117,529 ) Net earnings (loss) $ 30,048 $ (49,000 ) $ 32,468 $ 16,532 $ 30,048 Comprehensive income (loss) $ 30,860 $ (48,416 ) $ 31,099 $ 17,317 $ 30,860 (In thousands) Year Ended August 31, 2011 Parent Guarantors Non-Guarantors Eliminations Consolidated $ 170,094 $ 523,294 $ 751,935 $ — $ 1,445,323 55,290 365,431 468,703 — 889,424 114,804 157,863 283,232 — 555,899 89,682 96,313 146,644 — 332,639 1,546 218 459 — 2,223 335 14,931 12,201 — 27,467 23,241 46,401 123,928 — 193,570 31,912 (1 ) 208 — 32,119 (16,924 ) 14,670 2,254 — — (4,519 ) 133 6,630 — 2,244 12,772 31,599 114,836 — 159,207 2,873 6,948 24,890 — 34,711 9,899 24,651 89,946 — 124,496 112,364 77,395 6,261 (196,020 ) — 122,263 102,046 96,207 (196,020 ) 124,496 (10,704 ) — (2,233 ) — (12,937 ) $ 111,559 $ 102,046 $ 93,974 $ (196,020 ) $ 111,559 Year Ended August 31, 2012 Parent Guarantors Non-Guarantors Eliminations Consolidated Net sales $ 206,894 $ 328,295 $ 741,332 $ — $ 1,276,521 Cost of products sold 69,902 220,271 474,888 — 765,061 Gross profit 136,992 108,024 266,444 — 511,460 Selling, administrative and engineering expenses 79,742 61,113 144,065 — 284,920 Amortization of intangible assets 1,341 10,515 10,170 — 22,026 Operating profit 55,909 36,396 112,209 — 204,514 Financing costs, net 29,983 (14 ) (408 ) — 29,561 Debt refinancing costs 16,830 — — — 16,830 Intercompany expense (income), net (32,185 ) 6,281 25,904 — — Other expense, net 1,351 1,992 150 — 3,493 Earnings from continuing operations before income tax expense 39,930 28,137 86,563 — 154,630 Income tax expense 6,700 4,677 17,977 — 29,354 Net earnings before equity in earnings of subsidiaries 33,230 23,460 68,586 — 125,276 Equity in earnings of subsidiaries 56,407 14,373 1,649 (72,429 ) — Earnings from continuing operations 89,637 37,833 70,235 (72,429 ) 125,276 (Loss) earnings from discontinued operations (2,347 ) 11,373 (47,012 ) — (37,986 ) Net earnings $ 87,290 $ 49,206 $ 23,223 $ (72,429 ) $ 87,290 Comprehensive income $ 35,497 $ 24,934 $ 6,064 $ (30,998 ) $ 35,497 (In thousands) Year Ended August 31, 2010 Parent Guarantors Non-Guarantors Eliminations Consolidated $ 143,783 $ 456,961 $ 559,764 $ — $ 1,160,508 47,370 333,829 352,057 — 733,256 96,413 123,132 207,707 — 427,252 75,814 87,987 104,065 — 267,866 2,054 7,418 6,125 — 15,597 — 14,463 7,554 — 22,017 18,545 13,264 89,963 — 121,772 31,589 17 253 — 31,859 (21,388 ) 2,610 18,778 — — (55 ) 1,613 (847 ) — 711 8,399 9,024 71,779 — 89,202 2,930 2,355 13,561 — 18,846 5,469 6,669 58,218 — 70,356 18,562 2,011 (3,920 ) (16,653 ) — 24,031 8,680 54,298 (16,653 ) 70,356 — — (46,325 ) — (46,325 ) $ 24,031 $ 8,680 $ 7,973 $ (16,653 ) $ 24,031 Year Ended August 31, 2011 Parent Guarantors Non-Guarantors Eliminations Consolidated Net sales $ 170,094 $ 302,911 $ 686,305 $ — $ 1,159,310 Cost of products sold 55,256 200,332 438,920 — 694,508 Gross profit 114,838 102,579 247,385 — 464,802 Selling, administrative and engineering expenses 87,333 57,288 125,771 — 270,392 Amortization of intangible assets 335 12,060 9,128 — 21,523 Operating profit 27,170 33,231 112,486 — 172,887 Financing costs, net 31,912 (1 ) 208 — 32,119 Intercompany expense (income), net (16,924 ) 14,670 2,254 — — Other expense (income), net (4,519 ) 112 7,154 — 2,747 Earnings from continuing operations before income tax expense 16,701 18,450 102,870 — 138,021 Income tax expense 4,148 2,680 21,005 — 27,833 Net earnings before equity in earnings of subsidiaries 12,553 15,770 81,865 — 110,188 Equity in earnings of subsidiaries 112,364 77,395 6,261 (196,020 ) — Earnings from continuing operations 124,917 93,165 88,126 (196,020 ) 110,188 (Loss) earnings from discontinuing operations (13,358 ) 8,881 5,848 — 1,371 Net earnings $ 111,559 $ 102,046 $ 93,974 $ (196,020 ) $ 111,559 Comprehensive income $ 160,985 $ 130,503 $ 106,875 $ (237,378 ) $ 160,985 (In thousands) Year Ended August 31, 2009 Parent Guarantors Non-Guarantors Eliminations Consolidated $ 139,389 $ 466,415 $ 511,821 $ — $ 1,117,625 52,949 337,903 338,546 — 729,398 86,440 128,512 173,275 — 388,227 54,189 90,944 104,871 — 250,004 2,408 10,026 7,096 — 19,530 — 28,543 2,778 31,321 — 13,881 5,763 — 19,644 29,843 (14,882 ) 52,767 — 67,728 41,025 141 683 — 41,849 (15,797 ) (1,942 ) 17,739 — — (194 ) (435 ) (85 ) — (714 ) 4,809 (12,646 ) 34,430 — 26,593 4,117 (8,872 ) 5,366 — 611 692 (3,774 ) 29,064 — 25,982 398 26,286 (7,678 ) (19,006 ) — 1,090 22,512 21,386 (19,006 ) 25,982 12,633 1,643 (26,535 ) — (12,259 ) $ 13,723 $ 24,155 $ (5,149 ) $ (19,006 ) $ 13,723 August 31, 2013 Parent Guarantors Non-Guarantors Eliminations Consolidated ASSETS Cash and cash equivalents $ 16,122 $ — $ 87,864 $ — $ 103,986 Accounts receivable, net 20,471 40,343 158,261 — 219,075 Inventories, net 27,343 38,948 76,258 — 142,549 Deferred income taxes 13,002 — 5,794 — 18,796 Prepaid expenses and other current assets 7,454 963 19,811 — 28,228 Assets of discontinued operations — 192,129 80,477 — 272,606 Total current assets 84,392 272,383 428,465 — 785,240 Property, plant & equipment, net 7,050 22,801 171,645 — 201,496 Goodwill 62,543 264,502 407,907 — 734,952 Other intangibles, net 13,247 141,258 222,187 — 376,692 Intercompany receivable — 480,633 360,620 (841,253 ) — Investment in subsidiaries 2,086,534 201,779 96,333 (2,384,646 ) — Other long-term assets 12,654 22 8,276 — 20,952 Total assets $ 2,266,420 $ 1,383,378 $ 1,695,433 $ (3,225,899 ) $ 2,119,332 LIABILITIES & SHAREHOLDERS’ EQUITY Trade accounts payable $ 22,194 $ 30,637 $ 101,218 $ — $ 154,049 Accrued compensation and benefits 13,835 2,716 27,249 — 43,800 Income taxes payable 8,135 — 5,879 — 14,014 Other current liabilities 21,268 4,630 31,001 — 56,899 Liabilities of discontinued operations — 23,466 29,614 — 53,080 Total current liabilities 65,432 61,449 194,961 — 321,842 Long-term debt 515,000 — — — 515,000 Deferred income taxes 64,358 — 51,507 — 115,865 Pension and post-retirement benefit liabilities 16,267 — 4,431 — 20,698 Other long-term liabilities 51,479 390 13,791 — 65,660 Intercompany payable 473,617 — 367,636 (841,253 ) — Shareholders’ equity 1,080,267 1,321,539 1,063,107 (2,384,646 ) 1,080,267 Total liabilities and shareholders’ equity $ 2,266,420 $ 1,383,378 $ 1,695,433 $ (3,225,899 ) $ 2,119,332 (In thousands) August 31, 2011 Parent Guarantors Non-Guarantors Eliminations Consolidated $ 87,982 $ 155,067 $ 303,435 $ — 546,484 4,327 37,133 87,189 — 128,649 62,543 432,184 393,739 — 888,466 15,861 216,277 247,268 — 479,406 — 277,157 45,770 (322,927 ) — 1,859,779 379,170 67,794 (2,306,743 ) — 10,862 51 2,763 — 13,676 $ 2,041,354 $ 1,497,039 $ 1,147,958 $ (2,629,670 ) $ 2,056,681 $ 76,300 $ 70,126 $ 183,877 $ — $ 330,303 522,727 — — — 522,727 124,469 — 41,476 — 165,945 16,452 — 2,412 — 18,864 59,466 779 39,584 — 99,829 322,927 — — (322,927 ) — 919,013 1,426,134 880,609 (2,306,743 ) 919,013 $ 2,041,354 $ 1,497,039 $ 1,147,958 $ (2,629,670 ) $ 2,056,681 August 31, 2012 Parent Guarantors Non-Guarantors Eliminations Consolidated ASSETS Cash and cash equivalents $ 12,401 $ 91 $ 55,692 $ — $ 68,184 Accounts receivable, net 20,401 74,006 140,349 — 234,756 Inventories, net 29,658 75,905 106,127 — 211,690 Deferred income taxes 17,942 — 4,641 — 22,583 Prepaid expenses and other current assets 8,157 1,166 14,745 — 24,068 Total current assets 88,559 151,168 321,554 — 561,281 Property, plant & equipment, net 6,944 31,818 77,122 — 115,884 Goodwill 62,543 433,193 370,676 — 866,412 Other intangibles, net 14,522 206,194 225,168 — 445,884 Intercompany receivable — 418,253 307,282 (725,535 ) — Investment in subsidiaries 1,886,478 250,738 90,770 (2,227,986 ) — Other long-term assets 12,297 22 5,339 — 17,658 Total assets $ 2,071,343 $ 1,491,386 $ 1,397,911 $ (2,953,521 ) $ 2,007,119 LIABILITIES & SHAREHOLDERS’ EQUITY Trade accounts payable $ 21,722 $ 44,893 $ 108,131 $ — $ 174,746 Accrued compensation and benefits 23,459 6,646 28,712 — 58,817 Income taxes payable 3,129 — 2,649 — 5,778 Current maturities of debt 7,500 — — — 7,500 Other current liabilities 20,876 11,566 39,723 — 72,165 Total current liabilities 76,686 63,105 179,215 — 319,006 Long-term debt 390,000 — — — 390,000 Deferred income taxes 91,604 — 41,049 — 132,653 Pension and post-retirement benefit liabilities 22,500 — 3,942 — 26,442 Other long-term liabilities 59,929 620 26,633 — 87,182 Intercompany payable 378,788 — 346,747 (725,535 ) — Shareholders’ equity 1,051,836 1,427,661 800,325 (2,227,986 ) 1,051,836 Total liabilities and shareholders’ equity $ 2,071,343 $ 1,491,386 $ 1,397,911 $ (2,953,521 ) $ 2,007,119 (In thousands) August 31, 2010 Parent Guarantors Non-Guarantors Eliminations Consolidated $ 78,548 $ 134,552 $ 247,050 $ — $ 460,150 5,166 41,226 61,990 — 108,382 68,969 417,914 218,006 — 704,889 — 242,310 94,668 — 336,978 — 227,792 212,847 (440,639 ) — 1,511,103 319,196 115,846 (1,946,145 ) — 8,421 130 2,753 — 11,304 $ 1,672,207 $ 1,383,120 $ 953,160 $ (2,386,784 ) $ 1,621,703 $ 70,417 $ 60,983 $ 182,022 $ — $ 313,422 367,380 — — — 367,380 84,694 — 25,536 — 110,230 27,144 972 (44 ) — 28,072 52,672 766 9,440 — 62,878 330,179 — 110,460 (440,639 ) — 739,721 1,320,399 625,746 (1,946,145 ) 739,721 $ 1,672,207 $ 1,383,120 $ 953,160 $ (2,386,784 ) $ 1,621,703 Year Ended August 31, 2013 Parent Guarantors Non-Guarantors Eliminations Consolidated Operating Activities Net cash provided by operating activities $ 81,597 $ 26,095 $ 86,097 $ — $ 193,789 Investing Activities Proceeds from sale of property, plant & equipment 563 206 852 — 1,621 Proceeds from sale of business — — 4,854 — 4,854 Capital expenditures (2,022 ) (4,021 ) (17,625 ) — (23,668 ) Business acquisitions, net of cash acquired — — (235,489 ) — (235,489 ) Cash used in investing activities (1,459 ) (3,815 ) (247,408 ) — (252,682 ) Financing Activities Net borrowings on revolving credit facilities 125,000 — — — 125,000 Intercompany loan activity (179,050 ) (22,371 ) 201,421 — — Principal repayment on term loans (7,500 ) — — — (7,500 ) Payment of deferred acquisition consideration (1,350 ) — (4,028 ) — (5,378 ) Debt issuance costs (2,035 ) — — — (2,035 ) Purchase of treasury shares (41,832 ) — — — (41,832 ) Stock option exercises and related tax benefits 33,261 — — — 33,261 Cash dividend (2,911 ) — — — (2,911 ) Cash provided (used in) financing activities (76,417 ) (22,371 ) 197,393 — 98,605 Effect of exchange rate changes on cash — — (3,910 ) — (3,910 ) Net increase (decrease) in cash and cash equivalents 3,721 (91 ) 32,172 — 35,802 Cash and cash equivalents—beginning of year 12,401 91 55,692 — 68,184 Cash and cash equivalents—end of year $ 16,122 $ — $ 87,864 $ — $ 103,986 (In thousands) Year Ended August 31, 2011 Parent Guarantors Non-Guarantors Eliminations Consolidated $ 92,573 $ 3,122 $ 77,404 $ (1,533 ) $ 171,566 103 313 1,363 — 1,779 — — 3,463 — 3,463 (5,284 ) (4,740 ) (13,072 ) — (23,096 ) (153,409 ) (350 ) (159,697 ) — (313,456 ) (158,590 ) (4,777 ) (167,943 ) — (331,310 ) 58,000 — 204 — 58,204 100,000 — — — 100,000 (34 ) — — — (34 ) (96,454 ) 1,655 94,799 — — (5,197 ) — — — (5,197 ) 8,235 — — — 8,235 (2,716 ) — (1,533 ) 1,533 (2,716 ) 61,834 1,655 93,470 1,533 158,492 — — 5,251 — 5,251 (4,183 ) — 8,182 — 3,999 5,055 — 35,167 — 40,222 $ 872 $ — $ 43,349 $ — $ 44,221 Year Ended August 31, 2012 Parent Guarantors Non-Guarantors Eliminations Consolidated Operating Activities Net cash provided by operating activities $ 97,454 $ 20,363 $ 64,512 $ — $ 182,329 Investing Activities Proceeds from sale of property, plant & equipment 1,909 353 6,239 — 8,501 Capital expenditures (5,062 ) (4,069 ) (13,609 ) — (22,740 ) Business acquisitions, net of cash acquired — — (69,309 ) — (69,309 ) Cash used in investing activities (3,153 ) (3,716 ) (76,679 ) — (83,548 ) Financing Activities Net repayments on revolving credit facilities (57,990 ) — (177 ) — (58,167 ) Intercompany loan activity (11,482 ) (16,556 ) 28,038 — — Principal repayment on term loans (2,500 ) — — — (2,500 ) Repurchases of 2% Convertible Notes (102 ) — — — (102 ) Proceeds from issuance of 5.625% Senior Notes 300,000 — — — 300,000 Redemption of 6.875% Senior Notes (250,000 ) — — — (250,000 ) Payment of deferred acquisition consideration (290 ) — (668 ) — (958 ) Debt issuance costs (5,490 ) — — — (5,490 ) Purchase of treasury shares (63,083 ) — — — (63,083 ) Stock option exercises and related tax benefits 10,913 — — — 10,913 Cash dividend (2,748 ) — — — (2,748 ) Cash provided (used in) financing activities (82,772 ) (16,556 ) 27,193 — (72,135 ) Effect of exchange rate changes on cash — — (2,683 ) — (2,683 ) Net increase in cash and cash equivalents 11,529 91 12,343 — 23,963 Cash and cash equivalents—beginning of year 872 — 43,349 — 44,221 Cash and cash equivalents—end of year $ 12,401 $ 91 $ 55,692 $ — $ 68,184 (In thousands) Year Ended August 31, 2010 Parent Guarantors Non- Guarantors Eliminations Consolidated $ 137,143 $ (6,739 ) $ 42,827 $ (52,145 ) $ 121,086 1 439 796 — 1,236 — — 7,516 — 7,516 (1,219 ) (8,309 ) (10,438 ) — (19,966 ) — (9,374 ) (36,492 ) — (45,866 ) (1,218 ) (17,244 ) (38,618 ) — (57,080 ) (12,608 ) — (1,705 ) — (14,313 ) (22,894 ) — — — (22,894 ) (96,107 ) 55,378 40,729 — — 3,315 — — — 3,315 (2,702 ) (31,395 ) (20,750 ) 52,145 (2,702 ) (130,996 ) 23,983 18,274 52,145 (36,594 ) — — 1,425 — 1,425 4,929 — 23,908 — 28,837 126 — 11,259 — 11,385 $ 5,055 $ — $ 35,167 $ — $ 40,222 Year Ended August 31, 2011 Parent Guarantors Non-Guarantors Eliminations Consolidated Operating Activities Net cash provided by operating activities $ 92,573 $ 3,122 $ 77,404 $ (1,533 ) $ 171,566 Investing Activities Proceeds from sale of property, plant & equipment 103 313 1,363 — 1,779 Proceeds from sale of business — — 3,463 — 3,463 Capital expenditures (5,284 ) (4,740 ) (13,072 ) — (23,096 ) Business acquisitions, net of cash acquired (153,409 ) — (159,697 ) — (313,106 ) Cash used in investing activities (158,590 ) (4,427 ) (167,943 ) — (330,960 ) Financing Activities Net borrowings on revolving credit facilities 58,000 — 204 — 58,204 Proceeds from issuance of term loans 100,000 — — — 100,000 Repurchases of 2% Convertible Notes (34 ) — — — (34 ) Intercompany loan activity (96,454 ) 1,655 94,799 — — Payment of deferred acquisition consideration — (350 ) — — (350 ) Debt issuance costs (5,197 ) — — — (5,197 ) Stock option exercises and related tax benefits 8,235 — — — 8,235 Cash dividend (2,716 ) — (1,533 ) 1,533 (2,716 ) Cash provided by financing activities 61,834 1,305 93,470 1,533 158,142 Effect of exchange rate changes on cash — — 5,251 — 5,251 Net increase (decrease) in cash and cash equivalents (4,183 ) — 8,182 — 3,999 Cash and cash equivalents—beginning of year 5,055 — 35,167 — 40,222 Cash and cash equivalents—end of year $ 872 $ — $ 43,349 $ — $ 44,221 (In thousands) Year Ended August 31, 2009 Parent Guarantors Non-Guarantors Eliminations Consolidated $ 82,428 $ 22,960 $ 85,163 $ (43,836 ) $ 146,715 — 512 1,350 — 1,862 38,455 — — — 38,455 (489 ) (5,275 ) (15,690 ) — (21,454 ) (234,600 ) (3,066 ) (1,756 ) — (239,422 ) (196,634 ) (7,829 ) (16,096 ) — (220,559 ) 15,325 — 1,332 — 16,657 (270,000 ) — — — (270,000 ) 115,000 — — — 115,000 (9,100 ) — — — (9,100 ) 102,579 15,357 (117,936 ) — — (9,158 ) — — — (9,158 ) 124,781 — — — 124,781 4,024 — — — 4,024 (2,251 ) (30,701 ) (13,135 ) 43,836 (2,251 ) 71,200 (15,344 ) (129,739 ) 43,836 (30,047 ) — — (7,273 ) — (7,273 ) (43,006 ) (213 ) (67,945 ) — (111,164 ) 43,132 213 79,204 — 122,549 $ 126 $ — $ 11,259 $ — $ 11,385 19.16. Quarterly Financial Data (Unaudited)20112013 and fiscal 20102012 is as follows: Year Ended August 31, 2011 First Second Third Fourth Total $ 318,412 $ 330,698 $ 392,777 $ 403,436 $ 1,445,323 121,853 125,027 154,038 154,981 555,899 462 358 862 628 2,310 26,661 22,142 38,360 37,333 124,496 (771 ) (14,213 ) (2,002 ) 4,049 (12,937 ) 25,890 7,929 36,358 41,382 111,559 $ 0.39 $ 0.32 $ 0.56 $ 0.55 $ 1.82 0.36 0.30 0.51 0.50 1.68 $ (0.01 ) $ (0.20 ) $ (0.03 ) $ 0.06 $ (0.19 ) (0.01 ) (0.19 ) (0.02 ) 0.05 (0.18 ) $ 0.38 $ 0.12 $ 0.53 $ 0.61 $ 1.63 0.35 0.11 0.49 0.55 1.50 Year Ended August 31, 2010 First Second Third Fourth Total $ 272,640 $ 267,438 $ 310,068 $ 310,362 $ 1,160,508 100,123 96,363 116,186 114,580 427,252 2,831 9,968 1,448 2,447 16,694 13,260 7,895 28,293 20,909 70,356 (1,406 ) (738 ) (6,458 ) (37,723 ) (46,325 ) 11,854 7,157 21,835 (16,814 ) 24,031 $ 0.20 $ 0.12 $ 0.42 $ 0.31 $ 1.04 0.19 0.11 0.39 0.29 0.97 $ (0.02 ) $ (0.01 ) $ (0.10 ) $ (0.56 ) $ (0.68 ) (0.02 ) (0.01 ) (0.09 ) (0.51 ) (0.62 ) $ 0.18 $ 0.11 $ 0.32 $ (0.25 ) $ 0.36 0.17 0.10 0.30 (0.22 ) 0.35 Year Ended August 31, 2013 First Second Third Fourth Total Net sales $ 307,809 $ 300,468 $ 344,205 $ 327,260 $ 1,279,742 Gross profit 124,368 116,178 136,904 129,500 506,950 Earnings from continuing operations 30,551 25,834 46,077 45,115 147,577 Earnings (loss) from discontinued operations 5,792 2,601 (139,060 ) 13,138 (117,529 ) Net earnings (loss) 36,343 28,435 (92,983 ) 58,253 30,048 Earnings from continuing operations per share: Basic $ 0.42 $ 0.35 $ 0.63 $ 0.62 $ 2.02 Diluted 0.41 0.35 0.62 0.60 1.98 Earnings (loss) from discontinued operations per share: Basic $ 0.08 $ 0.04 $ (1.90 ) $ 0.18 $ (1.61 ) Diluted 0.08 0.03 (1.86 ) 0.18 (1.58 ) Net earnings (loss) per share: Basic $ 0.50 $ 0.39 $ (1.27 ) $ 0.80 $ 0.41 Diluted 0.49 0.38 (1.24 ) 0.78 0.40 Year Ended August 31, 2012 First Second Third Fourth Total Net sales $ 309,966 $ 300,919 $ 343,268 $ 322,368 $ 1,276,521 Gross profit 127,015 116,083 138,754 129,608 511,460 Earnings from continuing operations 33,970 27,653 27,737 35,916 125,276 Earnings (loss) from discontinued operations 3,204 4,522 6,664 (52,376 ) (37,986 ) Net earnings (loss) 37,174 32,175 34,401 (16,460 ) 87,290 Earnings from continuing operations per share: Basic $ 0.50 $ 0.41 $ 0.39 $ 0.49 $ 1.79 Diluted 0.46 0.37 0.36 0.48 1.68 Earnings (loss) from discontinued operations per share: Basic $ 0.04 $ 0.06 $ 0.09 $ (0.72 ) $ (0.54 ) Diluted 0.04 0.06 0.09 (0.70 ) (0.51 ) Net earnings (loss) per share: Basic $ 0.54 $ 0.47 $ 0.48 $ (0.23 ) $ 1.25 Diluted 0.50 0.43 0.45 (0.22 ) 1.17 Approximately $1.1 million of expense and $4.1 million of income related to discontinued operations were recorded in and fourth quarters of fiscal 2011, respectively, to correct immaterial errors that should have been recorded in the second quarter of fiscal 2011. Additions Deductions Balance at
Beginning
of Period Charged to
Costs and
Expenses Acquired/
(Divested)/
(Discontinued) Accounts
Written
Off Less
Recoveries Other Balance
at End of
Period $ 7,680 $ 1,021 $ 939 $ (3,048 ) $ 581 $ 7,173 8,633 2,437 (644 ) (2,452 ) (294 ) 7,680 6,830 4,030 117 (2,332 ) (12 ) 8,633 $ 21,982 $ 721 $ 9,149 $ (6,149 ) $ 314 $ 26,017 24,297 6,536 (92 ) (8,076 ) (683 ) 21,982 17,603 10,070 1,529 (4,366 ) (539 ) 24,297 $ 8,542 $ 4,498 $ — $ (5,831 ) $ 51 $ 7,260 20,238 3,670 (8,633 ) (6,601 ) (132 ) 8,542 21,952 11,350 — (12,950 ) (114 ) 20,238 Additions Deductions Description Balance at
Beginning of
Period Charged to
Costs and
Expenses Acquired/
(Divested)/
(Discontinued) Accounts
Written Off
Less
Recoveries Other Balance at
End of
Period Allowance for losses—Trade accounts receivable August 31, 2013 $ 4,375 $ 584 $ (437 ) $ (787 ) $ (34 ) $ 3,701 August 31, 2012 7,173 107 96 (2,740 ) (261 ) 4,375 August 31, 2011 7,680 1,021 939 (3,048 ) 581 7,173 Valuation allowance—Income taxes August 31, 2013 $ 8,153 $ 4,527 $ 11,281 $ (1,184 ) $ — $ 22,777 August 31, 2012 7,260 2,954 — (2,061 ) — 8,153 August 31, 2011 8,542 4,498 — (5,831 ) 51 7,260 Item 9.Changes in and Disagreements with Accountants on Accounting and Financial DisclosureNone.Item 9A.Controls and Procedures2011,2013, the Company’s internal control over financial reporting was effective.Mastervolt International Holding B.V. and Weasler Engineering, Inc.Viking SeaTech ("Viking") from its assessment of internal control over financial reporting as of August 31, 20112013 because they werethe business was acquired by the Company in a purchase business combination during fiscal 2011.on August 27, 2013. Subsequent to the acquisition, certain elements of the acquired businesses’Viking's internal control over financial reporting and related processes were integrated into the Company’s existing systems and internal control over financial reporting. Those controls that were not integrated have been excluded from management’s assessment of the effectiveness of internal control over financial reporting as of August 31, 2011. All2013. Viking is a wholly-owned subsidiary of the fiscal 2011 acquisitions are wholly-owned subsidiariesCompany whose total assets and total revenues excluding integrated elements, represent 20%13% and 5%less than1%, respectively, of the related consolidated financial statement amounts as of and for the year ended August 31, 2011.consolidated financial statements and the effectiveness of internal controls over financial reporting as of August 31, 2011,2013, as stated in their report which is included herein.20112013 that materially affected, or are reasonably likely to materially affect, the Company’s internal control over financial reporting.Item 9B.Other InformationDirectors; Executive Officers and Corporate Governance Directors; Executive Officers and Corporate Governance10, 201214, 2014 (the “2012“2014 Annual Meeting Proxy Statement”). Information about compliance with Section 16(a) of the Exchange Act is incorporated by reference from the “Other Information—Section 16(a) Beneficial Ownership Reporting Compliance” section in the Company’s 20122014 Annual Meeting Proxy Statement. Information about the Company’s Audit Committee, including the members of the committee, and the Company’s Audit Committee financial experts, is incorporated by reference from the “Election of Directors” and “Corporate Governance Matters” sections of the Company’s 20122014 Annual Meeting Proxy Statement. Information about the Company’s executive officers required by this item is contained in the discussion entitled “Executive Officers of the Registrant” in Part I hereof.Executive Compensation2012Security Ownership of Certain Beneficial Owners and Management and Related Stockholder Matters2012Certain Relationships and Related Transactions, and Director Independence2012Principal Accountant Fees and Services2012
Data.” 25, Signature Title / Chairman of the Board BEDI / HALL / FISCHER Robert A. Peterson / WILLIAMS / VANDEURSEN / ALAN HUNTER, JR / Executive Vice President and Chief Financial 2013 Exhibit Description Incorporated Herein By Reference To 3.2 Exhibit Description Incorporated Herein By Reference To Filed Exhibit 21 32.2 Data”.74,67, which is incorporated herein by reference.By: By: s/S/ ANDREW G. LAMPEREUR Andrew G. Lampereur (Principal Financial Officer) 28, 2011 S/ ROBERTs/ ROBERT C. ARZBAECHER Robert C. Arzbaecher President and Chief
Executive Officer/S/ GUSTAV H.P. BOEL Gustav H.P. Boel /s/ GUSTAV H.P. BOEL Director and Executive Vice President Gustav H.P. Boel / S/ GURMINDERs/ GURMINDER S. BEDI Director Gurminder S. Bedi DirectorS/ WILLIAMs/ MARK E. GOLDSTEINDirector and President Mark E. Goldstein /s/ WILLIAM K. HALL Director William K. Hall DirectorS/ THOMASs/ THOMAS J. FISCHER Director Thomas J. Fischer DirectorSignature Title/s/ ROBERT A. PETERSON Director /S/ ROBERT A. PETERSON DirectorS/ DENNISs/ DENNIS K. WILLIAMS Director Dennis K. Williams DirectorS/ HOLLYs/ HOLLY A. VANDEURSEN Director Holly A. VanDeursen DirectorS/s/ R. ALAN HUNTER, JR Director R. Alan Hunter, Jr. DirectorS/ ANDREWs/ ANDREW G. LAMPEREUR Andrew G. Lampereur
Officer (Principal Financial Officer)/S/ MATTHEW P. PAULI Matthew P. Pauli /s/ MATTHEW P. PAULI Corporate Controller and Principal Accounting
OfficerMatthew P. Pauli *Each of the above signatures is affixed as of October 28, 2011.2011 2.0 Share Purchase Agreement, dated November 30, 2010, between Masterhold B.V. and Actuant CorporationFurnished Herewith2.1 Exhibit 2.1(a) Agreement for the Sale and Purchase of Venice Topco Limited, dated August 2, 2013, by and among HSBC Investment Bank Holdings PLC, Actuant Acquisitions Limited, Actuant Corporation and certain other parties theretoX (b) Warranty Deed relating to the Registrant’s Form 8-K filed on December 1, 2010Sale and Purchase of Venice Topco Limited, by and among Actuant Acquisitions Limited and the Management Warrantors that are party thereto 2.1 Stock Purchase Agreement, dated May 19, 2011, between ASCP-Weasler Holdings LLC, ASCP-Weasler Holdings, Inc., Weasler Engineering, Inc. and Actuant CorporationX Exhibit 2.1 to the Registrant’s Form 10-Q filed on July 8, 2011 3.1 3.1 (a) Amended and Restated Articles of Incorporation Exhibit 4.9 to the Registrant’s Form 10-Q for the quarter ended February 28, 2001 (b) Amendment to Amended and Restated Articles of Incorporation Exhibit 3.1(b) of the Registrant’s Form 10-K for the fiscal year ended August 31, 2003 (c) Amendment to Amended and Restated Articles of Incorporation Exhibit 3.1 to the Registrant’s Form 10-K for the fiscal year ended August 31, 2004 (d) Amendment to Amended and Restated Articles of Incorporation Exhibit 3.1 to the Registrant’s Form 8-K filed on July 18, 2006 (e) Amendment of Amended and Restated Articles of Incorporation Exhibit 3.1 to the Registrant’s Form 8-K filed on January 14, 2010 Amended and Restated Bylaws, as amended Exhibit 3.1 to the Registrant’s Form 8-K filed on October 23, 2007 4.1 4.1 June 12, 2007April 16, 2012 by and among Actuant Corporation, the subsidiary guarantors named therein and U.S. Bank National Association as trustee relating to $250,000,000$300 million Actuant Corporation 6.875%5 5/8% Senior Notes due 20172022 Exhibit 4.1 to the Company’s Current Report on Form 8-K filed on June 15, 2007April 18, 2012 4.2Indenture, dated as of November 10, 2003, among Actuant Corporation as issuer and the Subsidiary Guarantors and U.S. Bank National Association relating to $150,000,000 Actuant Corporation 2% Convertible Senior Subordinated Notes Due 2023Exhibit 4.2 to the Registrant’s Form 10-Q for quarter ended November 30, 20034.3Second Amended and Restated Credit Agreement dated November 10, 2008 among Actuant Corporation, the Lenders party thereto and JPMorgan Cash Bank, N.A. as the AgentExhibit 10.0 to the Registrant’s Form 10-Q for the quarter ended November 30, 20084.4Amendment No. 1 dated June 10, 2009 to Second Amended and Restated Credit Agreement dated November 10, 2008 among Actuant Corporation, the foreign subsidiary borrowers party thereto, the financial institutions party thereto and JPMorgan Chase Bank, N.A., as administrative agentExhibit 10.1 to the Registrant’s Form 8-K filed on June 10, 2009
Herewith4.5 Amendment No. 2 dated July 12, 2010 to Second Amended and Restated CreditFurnished Herewith4.2 November 10, 2008 among Actuant Corporation, the foreign subsidiary borrowers party thereto, the financial institutions party thereto and JPMorgan Chase Bank, N.A., as administrative agentApril 16, 2012, relating to $300 million of 5 5/8% Senior Notes due 2022 Exhibit 4.510.1 to the Registrant’sCompany’s Current Report on Form 10-K8-K filed on October 28, 2010April 18, 2012 4.8 Third Amended and Restated Credit Agreement dated February 23, 2011 among Actuant Corporation, the Lenders party thereto and JPMorgan Chase Bank, N.A. as the agent Exhibit 10.1 to the Registrant’s Form 10-Q for the quarter ended February 28, 2011 4.9 Omnibus Amendment No. 1 dated September 23, 2011 among Actuant Corporation, the Lender party thereto and JPMorgan Chase Bank, N.A. as agent Exhibit 4.9 to the Registrant’s Form 10-K for the fiscal year ended August 31, 2011. 4.5 (a) Fourth Amended and Restated Credit Agreement dated July 18, 2013 among Actuant Corporation, the Lenders party thereto and JPMorgan Chase Bank, N.A. as the agent X (b) First Amendment to the Fourth Amended and Restated Credit Agreement dated August 27, 2013 among Actuant Corporation, the Lenders party thereto and JPMorgan Chase Bank, N.A. as the agent X 10.1 Outside Directors’ Deferred Compensation Plan adopted by Board of Directors on May 4, 1995(conformed through the first amendment) Exhibit 10.8 to the Registrant’s Form 10-K for fiscal year ended August 31, 1995 10.2 First Amendment of Actuant Corporation Outside Directors’ Deferred Compensation Plan dated December 25, 2008 Exhibit 10.14 to the Registrant’s Form 10-Q for quarter ended November 30, 2008 10.2 10.3 Actuant Corporation Deferred Compensation Plan (conformed through the third amendment) Exhibit 99.110.3 to the Registrant’s Form S-8 filed on September 2, 200410.4Second Amendment of Actuant Corporation Deferred Compensation Plan dated December 25, 2008Exhibit 10.13 to the Registrant’s Form 10-Q for quarter ended November 30, 200810.5(a) 1996 Stock Plan adopted by board of directors on August 8, 1996 and proposed for shareholder approval on January 8, 1997Annex A to the Registrant’s Proxy Statement dated November 19, 1996 for 1997 Annual Meeting of Shareholders(b) Amendment to 1996 Stock Plan adopted by board of directors on May 8, 1997Exhibit 10.10(b) to the RegistrantsRegistrant's Form 10-K for the fiscal year ended August 31, 19972012 10.6 Actuant Corporation 2010 Employee Stock Purchase Plan Exhibit B to the Registrants Proxy Statement, dated December 4, 2009 10.7 10.4 (a) Actuant Corporation 2001 Stock Plan Exhibit B to the Registrant’s Proxy Statement, dated December 1, 2000 for the 2001 Annual Meeting of Shareholders 10.8 (b) First Amendment to the Actuant Corporation 2001 Stock Plan dated December 25, 2008 Exhibit 10.9 to the Registrant’s Form 10-Q for the quarter ended November 30, 2008 10.9 Description Incorporated Herein By Reference To Filed
HerewithFurnished Herewith 10.5 (a) Actuant Corporation 2002 Stock Plan, as amended (through third amendment) Exhibit 10.26 to the Registrant’s Form 8-K filed on January 20, 2006 (b) Fourth Amendment to the Actuant Corporation 2002 Stock Plan dated November 7, 2008 Exhibit 10.11 to the Registrant’s Form 10-Q for the quarter ended November 30, 2008 10.6 Actuant Corporation 2009 Omnibus Incentive Plan, conformed to reflect the Second Amendment thereto Exhibit 99.1 to the Registrant’s Form 8-K filed on January 17, 2013 10.7 (a) Actuant Corporation 2001 Outside Directors’ Stock Plan Exhibit A to the Registrant’s Proxy Statement, dated December 5, 2005 for the 2006 Annual Meeting of Shareholders 10.10 (b) First Amendment to the Amended and Restated Actuant Corporation 2001 Outside Directors’ Stock Plan dated December 25, 2008 Exhibit 10.10 to the Registrant’s Form 10-Q for the quarter ended November 30, 2008 10.11 Actuant Corporation 2002 Stock Plan, as amended (through third amendment) Exhibit 10.26 to the Registrant’s Form 8-K filed on January 20, 2006 ExhibitDescriptionIncorporated Herein By Reference ToFiledHerewith10.12Fourth Amendment to the Actuant Corporation 2002 Stock Plan dated November 7, 2008Exhibit 10.11 to the Registrant’s Form 10-Q for quarter ended November 30, 200810.13 Actuant Corporation Long Term Incentive Plan Exhibit 10.25 to the Registrant’s Form 8-K filed on July 12, 2006 10.14 Actuant Corporation 2009 Omnibus Incentive Plan Exhibit 99.1 to the Registrants Form 8-K filed on January 14, 2010 10.9 10.15Actuant Corporation Supplemental Executive Retirement PlanX10.16 Form of Indemnification Agreement for Directors and Officers Exhibit 10.35 to the 2002 10-K 10.17 10.10 (a) Form of Actuant Corporation Form of Change in Control Agreement for certain named executivesMessrs. Arzbaecher, Blackmore, Goldstein, Kobylinski, Lampereur, Scheer, Wozniak, Ms. Grissom and Ms. Roberts Exhibit 10.1 to the Registrant’s Form 10-Q for the quarter ended November 30, 20088-K filed on May 2, 2012 (b) Form of Actuant Corporation Change in Control Agreement for Messrs. Axline and Boel Exhibit 10.2 to the Registrant’s Form 8-K filed on May 2, 2012 (c) Amendment to Actuant Corporation Change in Control Agreement for Mr. Scheer X 10.11 Actuant Corporation Executive Officer Bonus Plan Exhibit B to the Registrant's Definitive Proxy statement dated December 3, 2012 Description Incorporated Herein By Reference To Filed
HerewithFurnished Herewith 10.12* Retention Bonus Agreement between Actuant Corporation and Mr. Scheer X 10.13 Consulting Services Agreement between Actuant Corporation and Mr. Boel X 10.14 Consulting Services Agreement between Actuant Corporation and Mr. Axline X 14 Code of Ethics Exhibit 14 of the Registrant’s Form 10-K for the fiscal year ended August 31, 2003 Subsidiaries of the Registrant X 23 Consent of PricewaterhouseCoopers LLP X 24 Power of Attorney See signature page of this report 31.1 Certification of Chief Executive Officer pursuant to Section 302 of the Sarbanes-Oxley Act of 2002 X 31.2 Certification of Chief Financial Officer pursuant to Section 302 of the Sarbanes-Oxley Act of 2002 X 32.1 Certification of Chief Executive Officer pursuant to Section 906 of the Sarbanes-Oxley Act of 2002 X Certification of Chief Financial Officer pursuant to Section 906 of the Sarbanes-Oxley Act of 2002 X 101* Description Incorporated Herein By Reference To Filed
HerewithFurnished Herewith 101 20112013 formatted in Extensible Business Reporting Language (XBRL): (i) the Consolidated Statements of Earnings, (ii) the Consolidated Statements of Comprehensive Income, (iii) the Consolidated Balance Sheets, (iii)(iv) the Consolidated Statements of Cash Flows (iv) the Consolidated Statements of Shareholders’ Equity and (v) related notes, tagged as blocks of texts.the Notes to Consolidated Financial Statements. X *Furnished herewith76