UNITED STATES SECURITIES AND EXCHANGE COMMISSION
|
| |
| þ | ANNUAL REPORT PURSUANT TO SECTION 13 OR 15(d) OF THE SECURITIES EXCHANGE ACT OF 1934 |
For the fiscal year ended October 30, 201126, 2014 |
| |
| ¨ | TRANSITION REPORT PURSUANT TO SECTION 13 OR 15(d) OF THE SECURITIES EXCHANGE ACT OF 1934 |
For the transition period from to
Commission file number 000-06920
(Exact name of registrant as specified in its charter)
|
| |
| Delaware | | 94-1655526 |
(State or other jurisdiction of
incorporation or organization)
| | Identification No.)
|
3050 Bowers Avenue, P.O. Box 58039 Santa Clara, California
| | (Zip Code)
|
| (Address of principal executive offices) | |
Registrant’s telephone number, including area code:
Securities registered pursuant to Section 12(b) of the Act:
|
| |
Title of Each Class | | Name of Each Exchange on Which Registered |
Common Stock, par value $.01 per share | | The NASDAQ Stock Market LLC |
Securities registered pursuant to Section 12(g) of the Act:
Indicate by check mark if the registrant is a well-known seasoned issuer, as defined in Rule 405 of the Securities Act. Yes þ No ¨ Indicate by check mark if the registrant is not required to file reports pursuant to Section 13 or Section 15(d) of the Act. Yes ¨ No þ Indicate by check mark whether the registrant (1) has filed all reports required to be filed by Section 13 or 15(d) of the Securities Exchange Act of 1934 during the preceding 12 months (or for such shorter period that the registrant was required to file such reports), and (2) has been subject to such filing requirements for the past 90 days. Yes þ No ¨ Indicate by check mark whether the registrant has submitted electronically and posted on its corporate Web site, if any, every Interactive Data File required to be submitted and posted pursuant to Rule 405 of Regulation S-T (§232.405 of this chapter) during the preceding 12 months (or for such shorter period that the registrant was required to submit and post such files). Yes þ No ¨ Indicate by check mark if disclosure of delinquent filers pursuant to Item 405 of Regulation S-K (§229.405 of this chapter) is not contained herein, and will not be contained, to the best of registrant’s knowledge, in definitive proxy or information statements incorporated by reference in Part III of this Form 10-K or any amendment to this Form 10-K. þ Indicate by check mark whether the registrant is a large accelerated filer, an accelerated filer, a non-accelerated filer, or a smaller reporting company. See the definitions of “large accelerated filer,” “accelerated filer” and “smaller reporting company” in Rule 12b-2 of the Exchange Act.
(Check one): | | | |
| | |
Large accelerated filer þ | | Accelerated filer ¨ |
| |
Non-accelerated filer ¨ | | Smaller reporting company ¨ |
| | (Do not check if a smaller reporting company) | | Smaller reporting company ¨ |
Indicate by check mark whether the registrant is a shell company (as defined in Rule 12b-2 of the Act). Yes ¨ No þ Aggregate market value of the voting stock held by non-affiliates of the registrant as of May 1, 2011,April 27, 2014, based upon the closing sale price reported by the NASDAQ Global Select Market on that date: $20,652,343,218$22,617,248,500
Number of shares outstanding of the registrant’s Common Stock, $.01 par value, as of November 20, 2011: 1,305,637,099December 12, 2014: 1,221,471,983
DOCUMENTS INCORPORATED BY REFERENCE:
Portions of the definitive Proxy Statement for Applied Materials, Inc.’s 2012 Annual Meeting of Stockholders are incorporated by reference into Part III will be provided in accordance with Instruction G(3) to Form 10-K no later than February 23, 2015.
Caution Regarding Forward-Looking Statements
Certain information in this
This Annual Report on Form 10-K (report or Form 10-K) of Applied Materials, Inc. and its subsidiaries (Applied or the Company), including “Management’s Discussion and Analysis of Financial Condition and Results of Operations” in Item 7,
iscontains forward-looking
in nature. All statements
in this report, including those made by the management of Applied, other than statements of historical fact, are forward-looking statements.that involve risks and uncertainties.
Examples of forward-looking statements include
statementsthose regarding Applied’s future financial or operating results, cash flows and cash deployment strategies, declaration of dividends, share repurchases, business strategies
projectedand priorities, costs
and cost controls, products, competitive positions,
management’smanagement's plans and objectives for future operations, research and development,
strategic acquisitions and investments, the proposed business combination with Tokyo Electron Limited, growth opportunities,
restructuring activities, backlog, working capital, liquidity,
financing plans, investment portfolio and policies,
cost controls, taxes, supply chain, manufacturing, properties,
and legal proceedings and
claims; the acquisition of Varian Semiconductor Equipment Associates, Inc. and other businesses;claims, customer demand and
spending;spending, end-use
demand;demand, market and industry trends and
outlooks; andoutlooks, general economic
conditions. These forward-lookingconditions, and other statements
that are
based on management’s estimates, projections and assumptionsnot historical facts, as
of the date hereof and include the assumptions that underlie such statements.well as their underlying assumptions. Forward-looking statements may contain words such as “may,” “will,” “should,” “could,” “would,” “expect,” “plan,” “anticipate,” “believe,” “estimate,” “potential” and “continue,” the negative of these terms, or other comparable terminology.
Any expectations based on theseAll forward-looking statements are subject to risks and uncertainties and other important factors, including those discussed in Part
II,I, Item 1A, “Risk Factors,” below and elsewhere in this report.
Other risks and uncertainties may be disclosed in Applied’s prior Securities and Exchange Commission (SEC) filings. These and many other factors could affect Applied’s future financial condition and operating results and could cause actual results to differ materially from expectations based on forward-looking statements made in this document or elsewhere by Applied or on its behalf.
Forward-looking statements are based on management’s estimates, projections and expectations as of the date hereof, and Applied undertakes no obligation to revise or update any
forward-lookingsuch statements.
The following information should be read in conjunction with the Consolidated Financial Statements and the accompanying Notes to Consolidated Financial Statements included in this report.
FORM 10-K FOR THE FISCAL YEAR ENDED OCTOBER
30, 201126, 2014
PART I
PART I
Incorporated in 1967, Applied, a Delaware corporation, provides manufacturing equipment, services and software to the global semiconductor, flat panel display, solar photovoltaic (PV) and related industries. Applied’s customers include manufacturers of semiconductor wafers and chips, flat panel liquid crystal
and other displays,
(LCDs), solar PV cells and modules, and other electronic devices. These customers may use what they manufacture in their own end products or sell the items to other companies for use in advanced electronic components.
The Company’sApplied’s fiscal year ends on the last Sunday in October.
Applied is the world’s largest semiconductor fabrication equipment supplier based on revenue, with the capability to provide global deployment and support services. Applied also is the leading supplier of LCD fabrication equipment to the flat panel display industry, and the leading supplier of solar PV manufacturing systems to the solar industry, based on revenue.
Applied operates in four reportable segments: Silicon Systems Group, Applied Global Services, Display, and Energy and Environmental Solutions. Applied manages its business based upon these segments. A summary of financial information for each reportable segment is found in Note 16 of Notes to Consolidated Financial Statements. A discussion of factors that could affect
Applied’s operations is set forth under “Risk Factors” in Item 1A, which is incorporated herein by reference.
Net sales by reportable segment for the past three fiscal years were as follows:
|
| | | | | | | | | | | | | | | | | |
| | 2014 | | 2013 | | 2012 |
| | | | | | | | | | | | |
| | (In millions, except percentages) |
| Silicon Systems Group | $ | 5,978 |
| | 66% | | $ | 4,775 |
| | 64% | | $ | 5,536 |
| | 64% |
| Applied Global Services | 2,200 |
| | 24% | | 2,023 |
| | 27% | | 2,285 |
| | 26% |
| Display | 615 |
| | 7% | | 538 |
| | 7% | | 473 |
| | 5% |
| Energy and Environmental Solutions | 279 |
| | 3% | | 173 |
| | 2% | | 425 |
| | 5% |
| Total | $ | 9,072 |
| | 100% | | $ | 7,509 |
| | 100% | | $ | 8,719 |
| | 100% |
Silicon Systems Group Segment
Applied’s
The Silicon Systems Group segment develops, manufactures and sells
a wide range of manufacturing equipment used to fabricate semiconductor chips, also referred to as integrated circuits (ICs). Most chips are built on a silicon wafer base and include a variety of circuit components, such as transistors and other devices, that are connected by multiple layers of wiring (interconnects). Applied offers systems that perform
most of the primaryvarious processes used in chip fabrication, including
atomic layer deposition (ALD), chemical vapor deposition (CVD), physical vapor deposition (PVD),
etch, electrochemical deposition (ECD), rapid thermal processing (RTP),
ion implantation, chemical mechanical planarization (CMP),
epitaxy (Epi), wet cleaning,
andatomic layer deposition (ALD), wafer metrology and inspection,
as well asand systems that etch or inspect circuit patterns on masks used in the photolithography process. Applied’s semiconductor manufacturing systems are used by integrated device manufacturers and foundries to build and package memory, logic and other types of chips.
Most chips currently
The majority of the Company's new equipment sales are
fabricated using 45 nanometer (nm) and larger linewidth dimensions, although Applied is also working with customers onfor leading-edge technology for advanced
2X nanometer (nm) nodes
using 32nm, 22nm and smaller dimensions. To build a chip, the transistors, capacitors and other circuit components are first created on the surface of the wafer by performing a series of processes to deposit and selectively remove portions of successive film layers. Similar processes are then used to build the layers of wiring structures on the wafer. As the density of the circuit components increases to enable greater computing capability in the same or smaller physical area, the complexity of building the chip also increases, necessitating more process steps to form smaller
transistor structures and more intricate wiring schemes.
A typical, simplified process sequence for building the wiring or interconnect portion of a chip involves initially depositing a dielectric film layer onto the base layer of circuit components using a CVD system. An etch system is then used to create openings and patterns in the dielectric layer. To form the metal interconnects, these openings and patterns are filled with conducting material using PVD and ECD technologies. A CMP step then polishes the wafer to achieve a flat surface. Additional deposition, etch and CMP steps are then performed to build up the layers needed to complete the interconnection of the circuit elements. Advanced chip designs require more than 500 steps involving these and other processes to complete the manufacturing cycle.
While some device manufacturers
Today's advanced interconnects are stillmade using aluminumcopper as the main conducting material for building interconnect structures, most have transitioned to copper.wiring material. Copper has lowerlow resistance than aluminum and can carry morea large amount of current in a smaller area.small area, which allows signals to travel quickly. Applied is thea leading supplier of systems for manufacturing copper-based chips,interconnects, including equipment for depositing, etching and planarizing copperthese multi-layer structures.
To increase the speed of interconnect
layers. Complementingthe transition to copper to improve chip speed is the use ofsignals even further, low dielectric constant (low k) films are used to replace silicon dioxide material as the insulator betweeninsulate the copper wiring structures.wiring. Applied also leads the industry in providingprovides systems for depositing low k dielectric films.
films that enable higher device performance and longer battery life.
The transistor is another key area of the chip where semiconductor manufacturers are improving their device designs to enhance performance. Applied has
the industry’s largest portfolio of technically advancedtechnically-advanced products for building smaller and faster transistors. One method of enhancing chip performance is strain engineering, a technique that stretches or compresses the space between atoms, allowing electrical current to flow more quickly. Multiple strain films are typically used in advanced devices since they have an additive effect on increasing transistor speed. Applied has
a comprehensive portfolio of systems to enable these applications using CVD and epitaxial deposition technologies.
Major chipmakers are integrating
new high dielectric constant (high-k) and metal materials and processes in their transistor gate structures to increase chip performance and reduce power consumption. Applied has
a comprehensive portfolio of fully characterized processes for building these high-k/metal gates. These solutions include an integrated
dielectric gate stack tool that combines
fourmultiple critical
processessteps in a single system,
including a portfolio of metallization technologies using
CVD, ALD and PVD
and an innovative high temperature etch system.Aprocesses.
To address the need for higher performance in a smaller space driven by new consumer products, a new type of chip packaging
at wafer level is
also emerging,
known aswhich enables three-dimensional (3D)
ICs, as new consumer products demand higher performance in a smaller space.ICs. Providing greater functionality in a smaller footprint,
3D-ICs3D ICs stack multiple chips together and electrically connect them using deep holes, called through-silicon via (TSV) structures. Applied has
the industry’s most comprehensive line of production-proven systems and processes required for
the majority of advanced packaging,
manufacturing steps, including etch, CVD, PVD, ECD, wafer cleaning and CMP systems.
To facilitate the adoption of packaging technology, Applied is working with consortiums and other equipment suppliers to lower customers’ implementation costs.Some chip manufacturers have announced that they will be employing the new 3D manufacturing methods to enhance chip performance. One method is based on new 3D transistor designs that replace the traditional two-dimensional gate with a thin 3D gate. This new structure, targeted for the 22nm technology node and below, improves the performance and energy efficiency of the chip. In 2011, the Company introduced the Applied Centura Conforma™ system, which uses conformal plasma doping technology to modify the electrical properties of 3D and planar transistor structures.
Most of Applied’s semiconductor equipment products are single-wafer systems with multiple process chambers attached to a base platform. This enables each wafer to be processed separately in its own environment, allowing precise process control, while the system’s multiple chambers enable simultaneous, high productivity manufacturing. Applied sells most of its single-wafer, multi-chamber systems on fiveeight basic platforms: the Endura®,, Centura®, EnduraProducer®, ProducerCentrisTM, Reflection®, Raider® and Vantage, VIISta® and Vantage® platforms. These platforms support ALD, CVD, ECD, PVD, ECD, etch, ion implantation, and RTP technologies. Over time, the semiconductor industry has migrated to increasingly larger wafers to build chips. The predominant or common wafer size used today for volume production of advanced chips is 300 millimeter (mm), or 12-inch, wafers. Applied offers
a comprehensive range of 300mm systems through its Silicon Systems Group segment.
In addition, Applied
also offers earlier-generation 200mm systems, as well as products and services to support all of its systems, which are reported under its Applied Global Services segment.
The following
summarizes Applied’sdiscusses in more detail the portfolio of products and their associated process technology areas reported under
itsthe Silicon Systems Group segment.
Deposition is a fundamental step in fabricating a chip. During deposition, layers of dielectric (an insulator), barrier, or electrically conductive (typically metal) films are deposited or grown on a wafer. Applied
currently provides equipment to perform four types of deposition: ALD, CVD, ECD and PVD. In addition, Applied’s RTP systems can be used to perform certain types of dielectric deposition.
ALD is an advanced technology in which atoms are deposited one layer at a time to build chip structures. This technology enables customers to fabricate thin films of either conducting or insulating material with uniform coverage in nanometer-sized structures. One of the most critical areas of the transistor is its gate, which is built by depositing layers of dielectric films. At the 22nm node and below, these film layers are so thin that they must be atomically engineered. To meet this challenge, in 2011, Applied introduced itsThe Applied Centura Integrated Gate Stack system withfeatures advanced ALD technology. The systemtechnology that builds ultrathin high-k film layers less than 2nm in thickness — about one hundred thousandth the widththickness.
Chemical Vapor Deposition
CVD is used to deposit dielectric and metal films on a wafer. During the CVD process, gases that contain atoms of the material to be deposited react on the wafer surface, forming a thin film of solid material. Films deposited by CVD may be silicon oxide, single-crystal epitaxial silicon, amorphous silicon, silicon nitride, dielectric anti-reflective coatings, low k dielectric (for
highly efficienthighly-efficient insulating materials), aluminum, titanium, titanium nitride, polysilicon, tungsten, refractory metals or silicides. Applied offers the following CVD products and technologies:
The Applied Producer CVD platform — ThisThe Producer high-throughput platform features Twin-Chamber® modules that have two single-wafer process chambers per unit. Up to three Twin-Chamber modules can be mounted on each Producer platform, giving it a simultaneous processing capacity of six wafers. Many dielectric CVD processes can be performed on this platform. The highest productivity model of this system is the Applied Producer GT, which has achieved rapid customer acceptance due to itsfeatures fast wafer handling performance and compact design. Low k Dielectric Films — Low k dielectric materials are used in copper-based chip designs to further improve interconnect speed. Using conventional CVD equipment, the Applied Producer Black Diamond® family of low k systems provides customers with a proven, cost-effective way to integrate a variety of low k films into advanced interconnect structures. In 2011, the Company introduced itsThe Company's latest third-generation low k technologies are featured on the Applied Producer Black Diamond 3 system and Applied Producer Nanocure 3 system. In addition, the Company offers its Applied Producer OnyxTM process, an innovative film treatment that optimizes the molecular structure of low k films. Together, these products are designed to enable smaller, higher performance and more power-efficient devices at 22nm and below. Lithography-Enabling Solutions — Applied offers several technologies on the Producer system to help chipmakers extend their current 193nm lithography tools, including a line of Applied APF® (advanced patterning film) films and Applied DARC® (dielectric anti-reflective coating) films. Together, they provide a film stack with the precise dimensional control and compatibility needed to cost-effectively pattern nano-scale features without additional integration complexity. Gap Fill Films — There are many steps during the chipmaking process in which veryextremely small and deep, or high aspect ratio (HAR), structures must be filled void-free with a dielectric film. Many of these applications include the deposition of silicon oxides in substrate isolation structures, contacts and interconnects. In addition toApplied's most advanced gap fill system is its Applied Centura Ultima HDP-CVD® (high-density plasma CVD) and Applied Producer HARP™ (high aspect ratio process) systems, the Company offers its breakthrough Applied Producer Eterna™ FCVDEterna™ FCVD™ system. Targeted for 20nm and below chips, the Eterna system delivers a liquid-like film that flows freely into virtually any structure to provide void-free dielectric fill. Strain Engineering Solutions — The Applied Producer HARPHARP�� system also plays a key role in enhancing transistor performance, enabling chipmakers to boost chip speed by depositing strain-inducing dielectric films. Offering the industry’s first integrated stress nitride deposition and ultraviolet (UV) cure solution, the Applied Producer Celera CVD delivers benchmark levels of high-stress tensile silicon nitride films. The Company also offers the Applied Centura SiNgenPlus low pressure CVD system for low temperature silicon nitride films. Used together, and in conjunction with silicon germanium (SiGe) films using Applied’s epitaxial deposition technologies, these systems can provide additive strain engineering benefits.
Through-Silicon Via Films— The Company has a comprehensive portfolio ofApplied offers products for TSV fabrication, including the Applied Producer InVia™InVia™ system. This product uses a uniquean innovative process to deposit the critical oxide liner film layer in HAR TSV structures, enabling robust electrical isolation of the TSV, which is vital for reliable device performance. For applications where higher temperatures can damage the manufacturing process, the Applied Producer Avila™Avila™ CVD system allows high qualityand Applied Producer OptivaTM CVD system allow high-quality dielectric film deposition at stable substrate temperatures attemperatures.
3D NAND and FinFET Films — 3D NAND requires deposition technology for vertical gate formation and complex patterning applications. Applied offers products for FinFET and 3D NAND fabrication, including the Applied Producer XP PrecisionTM CVD system released in 2014, which addresses the deposition challenges presented by vertical 3D architectures. Designed for high-volume manufacturing, the XP Precision system combines production-proven Producer CVD technology with more efficient, faster processing chamber technology.
Copper Interconnect Encapsulation Solutions — In 2014, Applied introduced its Endura VoltaTM CVD Cobalt system for encapsulating copper interconnects in logic chips smaller than the 28nm node. The system deposits a low costconformal cobalt liner and selective cobalt capping layer to provide complete enclosure of ownership.copper lines, improving reliability while reducing yield-limiting issues.
Epitaxial Deposition — Epitaxial silicon (epitaxy or epi) is a layer of pure silicon grown in a uniform crystalline structure on the wafer to form a high quality base for the device circuitry. Epi technology is used in an increasing number of integrated circuitIC devices in both the wafer substrate and transistor areas of a chip to enhance speed. The Applied Centura Epi system integrates pre- and post-epi processes on the same system to improve film quality and reduce production costs. This system is also used for SiGe epi technology, which reduces power usage and increases speed in certain types of advanced chips. For emerging transistor designs, the Applied Centura RP Epi system offers selective epi processes to enable faster transistor switching through strain engineering techniques. Polysilicon Deposition — Polysilicon is a type of silicon used to form portions of the transistor structure within the integrated circuitIC device. The Applied Centura Polygen™Polygen™ LPCVD system is a single-wafer, multi-chamber product that deposits thin polysilicon films at high temperatures to create transistor gate structures. To address the challenging requirements of shrinking gate dimensions, the Applied Centura DPN Gate Stack system integrates chambers for decoupled plasma nitridation (DPN), RTP anneal, and polysilicon deposition on one platform to enable superior film quality and material properties. Tungsten Deposition — Tungsten is used in the contact area of a chip that connects the transistors to the wiring circuitry. In aluminum-based devices, tungsten is also used in the structures that connect the multiple layers of aluminum wiring. Applied has two products for depositing tungsten: the Applied Centura Sprint® Tungsten CVD system for 90nm and below devices and the Applied Centura iSprint® ALD/CVD system for more advanced applications. The latter product combines ALD technologywhich provide tungsten filling capability to 20nm and CVD chambers on the same platform.below.
Electrochemical Deposition
Electrochemical deposition
ECD is a process by which metal atoms from a chemical fluid (an electrolyte) are deposited on the surface of an immersed object.
Its mainOne application
in the semiconductor industry is to deposit copper in interconnect wiring structures. This process step follows the deposition of barrier and seed layers
whichthat prevent the copper from contaminating other areas of the device, improve the adhesion of the copper film and enable electrodeposition to occur.
Another application is wafer level packaging for deposition of copper to fill TSV 3D chip-to-chip connections. Applied offers
two ECD systems:special configurations of the Applied Raider
GTsystem for these ECD
for electroplating advanced chip interconnect structures, and the Applied Raider S ECD for advanced TSV packaging applications.
Physical Vapor Deposition
PVD is a physical process in which atoms of a gas, such as argon, are accelerated toward a metal target. The metal atoms chip off, or sputter away, and are then deposited on the wafer. The Applied Endura PVD system offers
a broad range ofvarious advanced metal deposition processes, including aluminum, aluminum alloys, cobalt,
titanium/titanium nitride, tantalum/tantalum nitride, tungsten/tungsten nitride, nickel, vanadium and copper.
In 2010, Applied celebratedIntroduced 24 years ago, the
20th year of itsCompany's Applied Endura platform is the most successful metal deposition system in the history of the semiconductor industry.The Applied Endura CuBS (copper barrier/seed) PVD system is widely used by customers for fabricating copper-based chips. Using PVD technology, theThe system deposits a tantalum-based barrier film that prevents copper material from entering other areas of the device and then a copper seed layer that primes the structure for the subsequent deposition of bulk copper. The Applied Endura CuBS RFX PVD system extends cost-effective CuBS technology to the 22nm2Xnm node. The Applied Endura Avenir™Avenir™ RF PVD system sequentially deposits themultiple metal film layers that form the heart of the industry’s new, faster, metal gate transistors. The Applied Endura iLB PVD/ALDCVD system advances the state-of-the-art in ALD technology, enablingenables customers to shrink their speed-critical contact structures for 20nm and below devices.
The Applied Endura AmberTM PVD system uses copper reflow technology to achieve rapid, void-free fill of interconnect structures at virtually any device node.
In 2014, Applied introduced the Endura VenturaTM PVD system, incorporating the latest industry-leading PVD technologies. The Ventura system supports the use of titanium in volume manufacturing as an alternative barrier material and expands Applied's comprehensive toolset for wafer level packaging applications, including through silicon vias, redistribution layers, and bump technology used to connect the die to the substrates.
Applied’s Endura system has also been used for many years in back-end applications to deposit metal layers before final bump or wire bonding packaging steps are performed. TheAdditionally, the Applied Charger™® UBM PVD system, which is specifically designed for under-bump metallization (UBM) and other back-end processes, features linear architecture for reliable performance and very high productivity at a low cost per wafer.
Etching is used many times throughout the
integrated circuitIC manufacturing process to selectively remove material from the surface of a wafer. Before etching begins, the wafer is coated with a light-sensitive film, called photoresist. A photolithography process then projects the circuit pattern onto the wafer. Etching removes material only from areas dictated by the photoresist pattern. Applied offers
a wide range of systems for etching dielectric, metal, and silicon films to meet the requirements of advanced processing.
Applied’s Producer Etch system utilizes the Twin-Chamber Producer platform to target cost-sensitive dielectric etch applications. To address advanced dielectric etch applications,For etching silicon, the Applied Centura Enabler® E5 EtchCentris AdvantEdge™ Mesa™ system enables customers to create the 40:1 HAR contact features that are critical to the yield and performance of 32nm and below DRAM and Flash memory chips. The Applied Centura Carina™ system uses innovative, high-temperature technology to deliver the etch capability essential for scaling logic and memory devices with high-k/metal gates at 45nm and below.In 2011, the Company introduced its Applied Centris AdvantEdge™ Mesa™ silicon etch, which features an unprecedented eight process chambers for high wafer output and proprietary system intelligence software to assure every process on every chamber precisely matches. The system also saves on power, water and gas consumption, helping customers to lower operating costs and support their sustainable manufacturing initiatives. TheChip manufacturers are also beginning to employ 3D architectures in advanced memory chips to provide higher-density storage capacity. These structures require the precise etching of exceptionally deep and narrow structures. To meet this industry requirement, Applied offers its Applied Centura MarianaAvatar™TM Trench Etch dielectric etch system provides customers with the capabilitythat can etch holes and trenches up to scale DRAM capacitors by enabling the etching of 80:1 depth-to-width aspect ratio structures. Theratios. Also for 3D chip manufacturing, the Applied Centura Silvia™® system is specifically designed for etching small, deep holes for TSV applications in 3D-ICs. For etching metals, the Applied Opus™ AdvantEdge Metal Etch uses an optimized 5-chamber platform configuration that enables customers to extend aluminum interconnect technology and productivity for flash and DRAM memory applications.
RTP is a process in which a wafer is subjected to rapid bursts of intense heat that can take the wafer from room temperature to more than 1,000 degrees Celsius in less than 10 seconds. A rapid thermal process is used mainly for annealing, which modifies the properties of deposited films. The Applied Centura Radiance®Plusand Applied Vantage RadOx™® RadOx™ RTP systems feature advanced RTP technology with differing platform designs. While the multi-chamber Centura platform offers exceptional process flexibility, the streamlined two-chamber Vantage platform is designed for dedicated high-volume manufacturing. These single-wafer RTP systems are also used for growing high quality oxide and oxynitride films, deposition steps that traditional large batch furnaces can no longer achieve with the necessary precision and control. Applied’s latest RTP systems address the critical need for controlling wafer temperature to increase chip performance and yield. The laser-based Applied Vantage
Astra™Astra™ millisecond anneal system abruptly raises the surface temperature of the wafer locally to modify material properties at the atomic level.
In 2011, the Company introduced theThe Applied Vantage Vulcan system, the first RTP system to heat the wafer entirely from the
backside. This systembackside, brings a new level of precision and control to the anneal process, allowing chipmakers to produce more
high performancehigh-performance devices per wafer.
Ion Implantation
Ion implantation is a key technology for forming transistors and is used many times during chip fabrication. During ion implantation, wafers are bombarded by a beam of electrically-charged ions, called dopants, which change the electrical properties of the exposed surface films. These dopants are accelerated to an energy that permits them to penetrate the substrate at a precise quantity and depth. Dopant concentration is determined by controlling the number of ions in the beam and the number of times the wafer passes through the beam, while the depth of the dopants is determined by the energy of the beam. Ion implantation systems may also be used in other areas of IC manufacturing to modify the material properties of the semiconductor devices, as well as in manufacturing crystalline-silicon solar cells.
Applied offers a line of single-wafer ion implantation equipment that covers the entire energy and current range required to manufacture advanced devices. The VIISta 3000XP implanter delivers the angle precision required for advanced high-energy applications, while the VIISta 900XP implanter provides medium current precision doping. The VIISta PLAD implanter enables manufacturers to rapidly implant high dopant concentrations over the entire wafer using a low-energy process that preserves sensitive circuit features in next-generation devices. The VIISta Trident high current ion implanter provides the precise dose and angle control needed for advanced transistor structures.
Chemical Mechanical Planarization
The CMP process removes material from a wafer to create a flat (planarized) surface. This process allows subsequent photolithography patterning and material deposition steps to occur with greater accuracy, and enablesresulting in more highly uniform film layers to build withminimal heightthickness variations. Applied has led the industry with its 300mm Applied Reflexion® LK system, with features such as integrated cleaning, film measurement and process control capabilities. Applied’s
Applied's latest CMP product, the Applied Reflexion GT system, has an innovative dual-wafer design that increases performance while lowering system costLK PrimeTM,is a critical enabler for FinFET gate and 3D NAND staircase structures.
Metrology and Wafer Inspection
Applied offers several products for
locating, measuring
features and
inspectinganalyzing defects
and features on the wafer during various stages of the fabrication process. These systems enable customers to characterize and control critical dimension (CD) and defect issues, especially at advanced generation technology nodes.
Critical Dimension and Defect Review Scanning Electron Microscopes (CD-SEMs and DR-SEMs) — Scanning electron microscopes (SEMs) use an electron beam to form images of microscopic features of a patterned wafer at extremely high magnification. Applied’s SEM products provide customers with full automation, along with the high accuracy and sensitivity needed for measuring very small CDs. The Applied VeritySEM® 4i 4i+ metrology system uses proprietary SEM imaging technology to enable precise control of the lithography and etching processes, measuring CDs at a precision of less than 0.3nm. Applied’s OPC Check™Check™ software for the VeritySEM system performs automated qualification of OPC-based (optical proximity correction) chip designs, significantly reducing mask (see Mask Making section below) verification time over conventional manual methods.
DR-SEMs review defects on the wafer (such as particles, scratches or residues) that are first located by a defect detection system and then classify the defects to identify their source. The high-throughput, fully automatic Applied
SEMVision™SEMVision™ Defect Analysis products enable customers to use this technology as an integral part of their production lines to analyze
critical defects
as small as 30nm with industry-leading throughput.
The Applied SEMVision G6 system, designed to accelerate time-to-yield for leading-edge chip manufacturing at the 1Xnm node and beyond and enhanced by the Purity™ Automatic Defect Classification (ADC), is the most advanced of the SEMVision family of products.
Wafer Inspection — Using deep ultraviolet (DUV) laser-based technology, defects can be detected on patterned wafers (wafers with printed circuit images) as they move between processing steps. Defects include particles, open circuit lines, and shorts between lines. The Applied UVision® 4 6 wafer inspection system detects yield-limiting defects in the critical patterning layers of 22nm and below logic and memory devices. In 2011, the Company introduced the Applied DFinder system, the first darkfield wafer inspection system to use DUV laser scanning to detect particles as small as 40nm in interconnect layers.
Masks are used by photolithography systems to transfer microscopic circuit designs onto wafers. Since an imperfection in a mask may be replicated on the wafer, the mask must be virtually defect-free. Applied provides systems for etching and inspecting masks.
The Applied Centura Tetra™ X Advanced Reticle Etch system is an advanced etch tool for fabricating leading-edge masks at 22nm and below. Applied’s Tetra line of
Applied's Tetra™ systems
hashave been used by mask makers worldwide to etch the majority of high-end masks
over the last five years.including 28nm/14nm nodes. The
Company also addresses the challenges of detecting defects onApplied Centura Tetra EUV (extreme ultraviolet) Advanced Reticle Etch system fabricates leading-edge masks at 22nm
masks with itsand smaller dimensions. The Applied
Aera3™Aera3™ Mask inspection
system. Usinguses sophisticated aerial imaging technology
the Aera3that allows users to immediately see how the pattern on the mask will appear on the
wafer, revealing only the defects most likely to print and significantly reducing inspection time. These systems also address the challenge of fabricating emerging extreme ultraviolet (EUV)EUV lithography masks.
Ion Implantation
With the acquisition
Applied Global Services Segment
The Applied Global Services segment encompasses
services, products and
services designedintegrated solutions to
improve theoptimize equipment and fab performance and
productivity,productivity. Leveraging the Company's experience with complex manufacturing technology and
reduce the environmental impact, of the fab operations of semiconductor, LCDprocesses, skilled equipment and
solar PV manufacturers. The in-depth expertise and best known methods of Applied’s extensive global support infrastructure enable Applied to continuously support customers’ production requirements. Trained customer engineers and process
support engineers are deployed
at or near customer sites in more than a dozen
countries. These engineers are usually located at or near customers’ fab sites and service over 37,000countries to support approximately 33,000 installed Applied
semiconductor, display and solar manufacturing systems
as well as non-Applied systems.worldwide. Applied offers the following general types of services and
products:products under the Applied Global Services segment:
Fab and Equipment Services — Applied offers a portfolioApplied's fab and equipment services are designed to help customers improve cost of fab-wide operations services to maintainownership, process control and optimize customers’ fabrication facilities.device performance. They include corrective and preventive maintenance programs, comprehensive spare parts packages, and consulting and advanced service offerings.
For example, Applied Performance Services offers customers comprehensive equipment support with performance-based pricing and predictable
costs to enable improved cost of ownership. Included in thiscosts. This program
isincludes Applied’s ExpertConnect remote diagnostic capability, providing
expertspecialized support around the clock.
Applied also offers its Total Parts Management programFabVantage™ Consulting Services are delivered by teams of technology, equipment and engineering experts who provide key insights to help customers solve some of their most difficult manufacturing challenges. Applied’s TechEdge™ advanced service offerings combine equipment and engineering expertise with spare parts manufacturedsoftware and connectivity technologies to Applied’s strict technical specificationsaddress manufacturing issues like excursion control and quality standards.
In addition to advanced 300mm fabs,predictive maintenance.
Legacy Systems — Applied offers a wide range of products and services to extend the performance and productive life of 200mm semiconductor fabs,fabrication plants, including new and remanufactured 200mm equipment, system enhancements and fab transition services. Designed to maximize productivity and lower cost of ownership these products also assist customers in implementing green manufacturing solutions.and extend technology, and fab transition services. Applied’s 200mm systems are available in a broad range of production-proven technologies that provide productive, cost-effective manufacturing solutions for mainstream, as well as specialty processes including CVD, PVD, etch, implant, RTP, CMP, epitaxy, metrologymicro-electro-mechanical systems (MEMS), power transistors and inspection tools.image sensors.
Automation Systems — Applied offers automated factory-level and tool-level control software systems for semiconductor, LCDdisplay and solar PV manufacturing facilities. These enterprise solutions include manufacturing execution systems (MES) to automate the production of wafers, and LCDdisplay and solar substrates,substrates; advanced process control systems,systems; and scheduling and materials handling control systems. The Applied SmartFactory™ MES software is a factory automation solution designed to help accelerate the production ramp of emerging technologies for solar PV, chip-packaging, and LED applications. Applied also offers computerized maintenance management systems, performance tracking, and modeling and simulation tools for improving asset utilization. Applied’s
E3™E3™ equipment engineering system solution, for example, integrates all critical equipment automation and process control components.
The Applied SmartSched™ system is the semiconductor industry’s first predictive scheduling solution for optimizing the movement of wafers during the lithography process to reduce cycle time and increase tool utilization.Thin Film Solar —As a result of Applied’s restructuring of its Energy and Environmental Solutions segment in fiscal 2010, the Company discontinued sales to new customers of its fully-integrated SunFab™ thin film solar production lines, but continues to support existing SunFab customers with services, upgrades and capacity
increases through the Applied Global Services segment. Thin film solar technologies are well-suited for large-scale applications, such as utility scale solar farms and commercial rooftops, where space is not a constraint.
Applied’s products for manufacturing
thin film transistor liquid crystal displays
(TFT- LCDs)(LCDs), organic light-emitting diodes (OLEDs), and other display technologies for televisions, personal computers (PCs),
tablet PCs,tablets, smartphones, and other consumer-oriented
electronic applicationsdevices are reported under its Display segment. While similarities exist between the technologies utilized in chipmaking and
LCDdisplay fabrication, the most significant differences are in the size and composition of the substrate. Substrates used to manufacture
LCDdisplay panels can be more than 120 times larger in area than 300mm wafers and are made of glass, while wafers
used in semiconductor fabrication are made of silicon.
Applied supplies a wide range of systems that process and test different glass substrate sizes. To meet consumer demand for larger, more cost-effective LCD TVs, Applied’s latest generation (Gen) 10 systems can process substrates sized at approximately 2.85 x 3.05 meters, with each substrate enabling the production of up to six 65-inch LCD TV screens.
Applied is also extending its core LCD
equipment technology
into new mobility display segments that require smaller, high-performance LCD or organic LED (OLED) screensto enable ultra-high resolution displays for next-generation smartphones, tablet PCs, and
touch capability.For fabricatingOLED TVs. These higher-performance displays are fabricated using newer materials such as low-temperature polysilicon (LTPS) and metal oxide films in the transistor layer of these panels,the panel to gain significantly faster switching speeds. Applied also offers a line of plasma-enhanced CVD (PECVD) products for depositing LTPS films with its AKT PX family of systems, that use multi-chamber platform architecturewhich are available for a range of display substrate sizes to enable manufacturers to achieve economies of scale.
Applied also offers technology for fabricating advanced metal oxide-based transistors in displays. The AKT-PiVot™ PVD system, which features rotary cathode array technology, deposits indium gallium zinc oxide (IZGO) film to form the transistor channel. The AKT-PECVD system is used to deposit
the dielectric
and semiconducting films. In 2011,film needed to insulate the
Company introduced the Applied AKT-20K PX PECVD systemtransistor gate. Together, these systems offer a cost-effective solution for
manufacturing high-performance LCD and OLED displays for advanced smartphones and tablet PC products. The system deposits highly-uniform low-temperature polysilicon (LTPS) films on 1.95m2glass sheets that are three times larger than the previous standard size, enabling larger,producing smaller, faster switching pixels to create higher resolution screen sizes compared to previous-generation mobile products.The AKT-PiVot™ 55KV system employs high-productivity, cost-efficient PVD technology to deposit metal and transparent conductive oxide films on the substrate. screens.
For manufacturing the color filter of LCD panels, Applied offers the AKT-NEW
ARISTO™ARISTO™ system for transparent conductive oxide film deposition.
Providing customers with new levels of productivity and flexibility, the Company introduced in 2011 theThe Applied AKT-AristoTwin system
is used for manufacturing touch-enabled displays. The
system featuressystem's two independent processing tracks
on a single system, enabling customers to achieve
50% more capacity
using half the manufacturing space.with a smaller footprint than traditional platforms.
To complement these systems, Applied also offers a line of electron beam
array test (EBT) systems for testing substrates during production for defective pixels and other imperfections, including the Gen-10 AKT-90K EBT product. Featuring one of the industry’s fastest and most accurate pixel test technologies,
with the lowest operating cost, the EBT systems’ non-contact test technology enables the safe testing of
thin film transistors (TFTs) used in high-value
LCD TV panels without damaging or scratching the display.
Energy and Environmental Solutions Segment
The Energy and Environmental Solutions segment includes systems for manufacturing wafer-based crystalline silicon (c-Si) cells and modules. These systems are designed to produce products for the generation and conservation of energy. To increase the conversion efficiency and yields of solar PV devices andin order to help reduce the cost per watt of solar-generated electricity,solar generated electricity.
Solar equipment applications include:
Cell manufacturing — Applied offers manufacturing solutionsa comprehensive line of automated metallization and test systems for wafer-based crystalline silicon (c-Si) applications.Applied’s portfolio of solar PV wafer andc-Si cell fabrication technologies has made itmanufacturing. These systems include high-precision printing capability for increasing the leading supplierefficiency of c-Si equipment worldwide in terms of revenue. In addition to innovative technology, these systems offer key manufacturing benefits to customers in high productivity, advanced ultra-thin wafer handling, and extensive automation.
solar cells.
Wafer manufacturing — Applied’s precision wafering systems crop and square silicon ingots into bricks and slice silicon bricks into thin wafers with high productivity and minimal silicon loss.wafers. These wafers are subsequently processed by cell manufacturing systems to create the PV cells used in making c-Si solar panels. TheApplied HCT wire saw cropper and squarer systems cut silicon ingots into bricks with high productivity and minimal silicon loss. The Applied HCT B5 wire saw, a leading wafer slicing system, was designed for large load capacity in volume manufacturing and has a unique four-position architecture that provides the load flexibility for optimizing yield and productivity.
Cell manufacturingIon implantation —Applied offers a comprehensive line of automated metallization and test systemsion implantation technology for c-Si cell manufacturing, a process that enables the volume production of high efficiency c-Si cells with its Applied Baccini products. These systems include high-precision printing capability for increasing the efficiency of c-Si solar cells. In 2011, the Company introduced the Applied Baccini Pegaso™ platform for next-generation solar cell manufacturing. In addition to increasedbetter yield and output, a key feature of the Pegaso system is its proprietary “smart” capabilities which bring a new level of precision and control to the cell manufacturing process. reduced cost.
The system’s modular architecture allows customers to rapidly add modules for additional processing capability, reducing the time, cost and risk of implementing new cell designs.Other products offered under the Energy and Environmental Solutions segment includealso includes high-throughput, roll-to-roll vacuum web coating systems for high-performance deposition of a range of films on flexible substrates for functional, aesthetic or optical properties. The Applied TopMetflexible electronics, packaging and other applications. These include the SmartWEB™TM 4450, is the world’s largest and fastestsystem, a modular platform for sputtering multiple thin layers on flexible roll-to-roll machineplastic substrates for depositing ultra-thin aluminum films formanufacturing flexible packaging applications. The Applied SmartWeb™ system uses PVD technology to deposit critical multi-layer films required for fabricating advanced touch panels, in mobile devicesflexible displays, and other flexible electronic substrates. The system’s modular design allows up to 12 different thin film layers to be deposited simultaneously on flexible material, enabling complex structures to be created in a single pass.applications, at high throughput.
Applied manufactures systems to meet demand represented by order backlog and customer commitments. Backlog consists of: (1) orders for which written authorizations have been accepted and assigned shipment dates are within the next 12 months, or shipment has occurred but revenue has not been recognized; and (2) contractual service revenue and maintenance fees to be earned within the next 12 months;months.
Backlog by reportable segment as of October 26, 2014 and (3) orders for SunFab lines that are anticipated to be recognizedOctober 27, 2013 was as revenue within the next 12 months. follows:
|
| | | | | | | | | | | |
| | 2014 | | 2013 |
| | | | | | | | |
| | (In millions, except percentages) |
| Silicon Systems Group | $ | 1,400 |
| | 48% | | $ | 1,295 |
| | 55% |
| Applied Global Services | 775 |
| | 27% | | 591 |
| | 25% |
| Display | 593 |
| | 20% | | 361 |
| | 15% |
| Energy and Environmental Solutions | 149 |
| | 5% | | 125 |
| | 5% |
| Total | $ | 2,917 |
| | 100% | | $ | 2,372 |
| | 100% |
Applied’s backlog
aton any particular
timedate is not necessarily indicative of actual sales for any future periods, due to the potential for customer changes in delivery schedules or cancellation of orders.
Applied’s backlog decreased from $3.2 billion at October 31, 2010 to $2.4 billion at October 30, 2011. Applied’s backlog on any particular date is not necessarily indicative of actual sales for any succeeding period. Customers may delay delivery of products or cancel orders prior to shipment, subject to possible cancellation penalties. Delays in delivery schedules and/or a reduction of backlog during any particular period could have a material adverse effect on Applied’s business and results of operations.
Manufacturing, Raw Materials and Supplies
Applied’s manufacturing activities consist primarily of assembly, test and integration of various proprietary and commercial parts, components and subassemblies (collectively, parts) that are used to manufacture systems. Applied has implemented a distributed manufacturing model under which manufacturing and supply chain activities are conducted in various countries, including the United States, Europe, Israel, Singapore, Taiwan, and other countries in Asia, and assembly of some systems is completed at customer sites. Applied uses numerous vendors, including contract manufacturers, to supply parts and assembly services for the manufacture and support of its products. Although Applied makes reasonable efforts to assure that parts are available from multiple qualified suppliers, this is not always possible. Accordingly, some key parts may be obtained from only a single supplier or a limited group of suppliers. Applied seeks to reduce costs and to lower the risks of manufacturing and service interruptions by: (1) selecting and qualifying alternate suppliers for key parts; (2) monitoring the financial condition of key suppliers; (3) maintaining appropriate inventories of key parts; (4) qualifying new parts on a timely basis; and (5) locating certain manufacturing operations in close proximity to suppliers and customers.
Research, Development and Engineering
Applied’s long-term growth strategy requires continued development of new
products. Applied’sproducts, including products that enable expansion into new markets. The Company’s significant investment in research, development and engineering (RD&E) has generally enabled it to deliver new products and technologies before the emergence of strong demand, thus allowing customers to incorporate these products into their manufacturing plans at an early stage in the technology selection cycle. Applied works closely with its global customers to design systems and processes that meet their planned technical and production requirements. Product development and engineering organizations are located primarily in the United States, as well as in Europe, Israel, Taiwan, and China. In addition, Applied outsources certain RD&E activities, some of which are performed outside the United States, primarily in
India.India and Singapore. Process support and customer demonstration laboratories are located in the United States, China, Taiwan, Europe, and Israel.
Applied’s investments in RD&E for product development and engineering programs to create or improve products and technologies over the last three years were as follows:
$1.1$1.4 billion
(11(16 percent of net sales) in fiscal
2011, $1.12014, $1.3 billion
(12(18 percent of net sales) in fiscal
20102013, and
$934 million (19$1.2 billion (14 percent of net sales) in fiscal
2009.2012. Applied has spent an average of 13 percent of net sales in RD&E over the last five years. In addition to RD&E for specific product technologies, Applied maintains ongoing programs for automation control systems, materials research, and environmental control that are applicable to its products.
In fiscal 2011, Applied developed logic and memory chip technologies to meet the requirements
Table of manufacturing below the 22nm node. These technologies include low k dielectrics and curing for interconnect structures and high-k dielectric materials and ALD processes for fabricating transistor gates. Applied also focused on processes to help customers build new 3D gate structures. In addition, Applied continued to focus on optimizing the cost-effectiveness of TSV technologies to enable their widespread implementation. TSV is an emerging solution for interconnecting three dimensional chip stacks to provide better device performance, lower power consumption and the integration of heterogeneous devices. Applied is also investing in other new product development areas such as 450mm wafer systems. In the Display sector, Applied developed deposition systems to enable larger OLED, LCD and touch-enabled displays. In solar, Applied focused on screen printing technology to keep pace with cell manufacturers’ new higher-efficiency cell designs. A key development area was “smart” capability, which bring a new level of precision and control to the production process. RD&E also continued the development of products that enable lower-cost production of solar energy, production of LED devices for display backlighting and general lighting, and other products to enable energy conservation.In fiscal 2010, Applied developed new technology to enable next-generation 22nm and below chip designs. These systems were designed to help customers continue their drive to pack more transistors in the same space using high-k/metal gate technologies and double patterning processes. Applied also developed technology for TSVs. In the solar PV area, Applied continued the development of its precision wafering and cell manufacturing products for lowering the cost of producing solar-generated electricity through advanced crystalline silicon technology. RD&E also included activities to develop products that enable lower-cost production of solar energy, production of LED devices for display backlighting and general lighting, and other products to enable energy conservation.
In fiscal 2009, Applied focused on developing systems for semiconductor customers’ new chip designs with 32nm and below geometries, including systems to enable faster transistors using strain engineering and high-k/metal gate technologies, as well as double patterning processes that enable customers to extend their existing 193nm lithography tools through additional technology generations. Applied also focused on developing technology for manufacturing next-generation displays. RD&E also included activities to develop products that enable lower-cost production of solar energy and other products to enable energy conservation.
Contents
Net sales by geographic region,
which are attributed according todetermined by the location of
customers’customers' facilities
to which products were shipped, were as follows:
| | | | | | | | | | | | | | | | | | | | | | | | |
| | | 2011 | | | 2010 | | | 2009 | |
| | | ($) | | | (%) | | | ($) | | | (%) | | | ($) | | | (%) | |
| | | (In millions, except percentages) | |
China | | | 2,574 | | | | 24 | | | | 1,557 | | | | 16 | | | | 635 | | | | 13 | |
Taiwan | | | 2,093 | | | | 20 | | | | 2,750 | | | | 29 | | | | 1,026 | | | | 21 | |
Korea | | | 1,263 | | | | 12 | | | | 1,768 | | | | 19 | | | | 664 | | | | 13 | |
Japan | | | 912 | | | | 9 | | | | 768 | | | | 8 | | | | 718 | | | | 14 | |
Southeast Asia | | | 592 | | | | 5 | | | | 578 | | | | 6 | | | | 252 | | | | 5 | |
| | | | | | | | | | | | | | | | | | | | | | | | |
Asia Pacific | | | 7,434 | | | | 70 | | | | 7,421 | | | | 78 | | | | 3,295 | | | | 66 | |
North America(*) | | | 1,963 | | | | 19 | | | | 1,147 | | | | 12 | | | | 966 | | | | 19 | |
Europe | | | 1,120 | | | | 11 | | | | 981 | | | | 10 | | | | 753 | | | | 15 | |
| | | | | | | | | | | | | | | | | | | | | | | | |
Total | | | 10,517 | | | | 100 | | | | 9,549 | | | | 100 | | | | 5,014 | | | | 100 | |
| | | | | | | | | | | | | | | | | | | | | | | | |
(*) | Primarily the United States. |
|
| | | | | | | | | | | | | | | | | |
| | 2014 | | 2013 | | 2012 |
| | | | | | | | | | | | |
| | (In millions, except percentages) |
| Taiwan | $ | 2,702 |
| | 30% | | $ | 2,640 |
| | 35% | | $ | 2,411 |
| | 28% |
| China | 1,608 |
| | 18% | | 787 |
| | 11% | | 783 |
| | 9% |
| Korea | 965 |
| | 10% | | 924 |
| | 12% | | 1,897 |
| | 22% |
| Japan | 817 |
| | 9% | | 685 |
| | 9% | | 704 |
| | 8% |
| Southeast Asia | 356 |
| | 4% | | 320 |
| | 4% | | 312 |
| | 3% |
| Asia Pacific | 6,448 |
| | 71% | | 5,356 |
| | 71% | | 6,107 |
| | 70% |
| United States | 1,966 |
| | 22% | | 1,473 |
| | 20% | | 1,749 |
| | 20% |
| Europe | 658 |
| | 7% | | 680 |
| | 9% | | 863 |
| | 10% |
| Total | $ | 9,072 |
| | 100% | | $ | 7,509 |
| | 100% | | $ | 8,719 |
| | 100% |
Because of the highly technical nature of its products, Applied markets and sells products worldwide almost entirely through a direct sales force. Approximately 8178 percent of Applied’s fiscal 20112014 net sales were to regions outside of the United States. General economic conditions impact Applied’s business and financial results. From time to time, the markets in which products are sold experience weak economic conditions that may negatively impact sales. Applied’s business is
usually not seasonal in nature, but it is highly cyclical, based on capital equipment investment by major semiconductor, flat panel display, solar PV and other manufacturers. Customers’ expenditures depend on many factors, including: anticipated market demand and pricing for semiconductors,
LCDs,display, solar cells and modules, and other substrates; the development of new technologies; customers’ factory utilization; capital resources and financing; government policies and incentives; and global and regional economic conditions.
In addition, a significant driver in the semiconductor and display industries is end-demand for mobile consumer products, which is characterized by seasonality that impacts the timing of customer investments in manufacturing equipment and, in turn, Applied's business.
Information on net sales to unaffiliated customers and long-lived assets attributable to Applied’s geographic regions is included in Note 16 of Notes to Consolidated Financial Statements. The following companies accounted for at least 10 percent of Applied’s net sales in 2011, 2010, and/fiscal 2014, 2013, or 2009,2012, which were for products in multiple reportable segments. | | | | | | | | | | | | |
| | | 2011 | | | 2010 | | | 2009 | |
Samsung Electronics Co., Ltd. | | | 12 | % | | | 14 | % | | | 10 | % |
Taiwan Semiconductor Manufacturing Company Limited | | | 10 | % | | | 11 | % | | | * | |
Intel Corporation | | | 10 | % | | | * | | | | 12 | % |
|
| | | | | |
| | 2014 | | 2013 | | 2012 |
| Taiwan Semiconductor Manufacturing Company Limited | 21% | | 27% | | 16% |
| Samsung Electronics Co., Ltd. | 12% | | 13% | | 20% |
The industries in which Applied operates are highly competitive and characterized by rapid technological change. Applied’s ability to compete generally depends on its ability to timely commercialize its technology, continually improve its products, and develop new products that meet constantly evolving customer requirements. Significant competitive factors include technical capability and differentiation, productivity,
cost-effectiveness and
cost-effectiveness.the ability to support a global customer base. The importance of these factors varies according to customers’ needs, including product mix and respective product requirements, applications, and the timing and circumstances of purchasing decisions. Substantial competition exists in all areas of Applied’s business. Competitors range from small companies that compete
with a single product and/or in a single region,
which may benefit from policies and regulations that favor domestic companies, to global, diversified
companies with a range ofproducts.companies. Applied’s ability to compete requires a high level of investment in RD&E, marketing and sales, and global customer support activities. Management believes that many of Applied’s products have strong competitive positions.
The competitive environment for each segment is described
below:below.
The semiconductor industry has been increasingly driven by consumer demand for lower-cost electronic products with increased
capability.capability, particularly mobility devices such as smartphones and tablets. As a result, products within the Silicon Systems Group segment are subject to significant changes in customer requirements, including transitions to smaller dimensions, new materials and an increasing number of applications. While certain existing technologies may be adapted to new requirements, some applications create the need for an entirely different technological approach. The rapid pace of technological change can quickly diminish the value of current technologies and products and create opportunities for existing and new competitors. Applied offers a
broad portfoliovariety of
technologically differentiatedtechnologically-differentiated products that must continuously evolve to satisfy customers’ requirements in order to compete
effectively.effectively in the marketplace. Applied allocates resources among its numerous product offerings and therefore may decide not to invest in an individual product to the same degree as competitors who specialize in fewer products. There are a number of competitors serving the semiconductor manufacturing equipment industry, with some offering a single product line and others offering multiple product lines. These competitors range from suppliers serving a single region to global, diversified companies.
Factors that influenced theThe competitive environment for the Silicon Systems Group in fiscal
2011 included a softening2014 reflected continued investment in
the semiconductor industry
despite higherdriven by capacity demand for
tablet computers, laptop computersmobile computing. Foundry customers led capacity additions for advanced technology nodes and
cellular phones. Device supply and demand dynamics led manufacturers to reduce their annual wafer fab equipment (WFE) capital spending, which iswere the
major driverprimary drivers for
net sales of the Silicon Systems Group
net sales.in fiscal 2014.
Products and services within the Applied Global Services segment complement the Silicon Systems Group, Display, and Energy and Environmental Solutions segments’ products, in markets that are characterized by demanding worldwide service requirements and a diverse group of numerous competitors. To compete effectively, Applied offers products and services to
reduce costs, improve tool performance,
lower overall cost of ownership, and increase the productivity and energy efficiency of customers’ fab operations. Significant competitive factors include productivity, cost-effectiveness, and the level of technical service and support. The importance of these factors varies according to customers’ needs and the type of products or services offered.
Customers with more significant operations and/or expertise may require fewer service products than customers who place greater reliance on an outsourcing model. Industry conditions that affected Applied Global Services’ sales of spares and services in fiscal
20112014 were principally
manufacturing capacitysemiconductor manufacturers' wafer starts and
factory utilization
rates of fabs.rates.
Products in the Display segment are generally subject to strong competition from a number of major
competitors.competitors primarily in Asia. Applied holds established market positions with its technically-differentiated
TFT-LCDLCD and OLED manufacturing solutions for PECVD, color filter PVD, PVD array, PVD touch panel, and TFT array testing, although its market position could change quickly due to
customers’customers' evolving requirements. The competitive environment for
Applied’sthe Display segment in fiscal
20112014 was characterized by
increased demand and capacity requirements for mobile devices, such as smartphones and tablets PCs, which drovean increase in demand for
high-performanceTV manufacturing equipment, particularly in China, and continued demand for equipment to manufacture displays
and touch screenfor high-end mobile devices.
Demand for larger LCD
TVs continues to drive investment in display equipment, although the TV
demand and capacity also grew, but not as rapidly as in recent years.manufacturing sector remains susceptible to cyclical conditions. Important factors affecting the competitive position of
Applied’sApplied's Display products
include (i)include: industry trends,
Applied’sApplied's ability to innovate and develop new products, and the extent to which
Applied’sApplied's products are technically-differentiated,
(ii)as well as which customers within a highly concentrated customer base are making capital equipment investments and
(iii) Applied’sApplied's existing position at these customers.
Applied’s
Applied's products within the Energy and Environmental Solutions segment compete in several diverse market areas, including
primarily the c-Si solar equipment market.
All of these markets areThe solar equipment market has been characterized by
extremesignificant pressure to reduce
customers’customers' overall production costs and improve performance.
In fiscal 2014, the solar end-market demand continued to be robust, as the industry further reduced manufacturing costs, enabling PV-generated electricity to reach parity with retail electricity rates in an increasing number of areas around the world. However, investment levels in capital equipment remained low, with spending focused on upgrades and improving conversion efficiencies as global solar PV production capacity exceeds end-demand, and the rationalization of capacity will be an important factor in determining when supply and demand comes back into balance. Adding to market uncertainty are international trade actions that have resulted in the imposition of some import sanctions, with others still under consideration. With respect to its c-Si equipment products, Applied competes with a number of other companies, some of which have significant experience with solar applications and some of which are new entrants to the solar equipment
business.market. The solar industry downturn has affected many of Applied's competitors and customers adversely, with some companies going through extensive financial and organizational restructuring, and in some instances ceasing operations.
Management believes that Applied’s competitive position significantly depends upon the Company’s research, development, engineering, manufacturing and marketing capabilities, and not just on its patent position. However, protection of Applied’s technological assets through enforcement of its intellectual property rights, including patents, is important. Therefore, Applied’s practice is to file patent applications in the United States and other countries for inventions that Applied considers significant. Applied has
a substantial number ofapproximately 10,500 patents in the United States and other countries, and additional applications are pending for new inventions. Although Applied does not consider its business materially dependent upon any one patent, the rights of Applied and the products made and sold under its patents, taken as a whole, are a significant element of Applied’s business. In addition to patents, Applied also possesses other intellectual property, including trademarks, know-how, trade secrets, and copyrights.
Applied enters into patent and technology licensing agreements with other companies when management determines that it is in Applied’s best interest to do so. Applied pays royalties under existing patent license agreements for the use, in several of its products, of certain patented
technologies that are licensed to Applied.technologies. Applied also receives royalties from licenses granted to third parties. Royalties received from or paid to third parties have not been, and are not expected to be, material to Applied’s consolidated results of operations.
In the normal course of business, Applied periodically receives and makes inquiries regarding possible patent infringement. In responding to such inquiries, it may become necessary or useful for Applied to obtain or grant licenses or other rights. However, there can be no assurance that such licenses or rights will be available to Applied on commercially reasonable terms, or at all. If Applied is not able to resolve or settle claims, obtain necessary licenses on commercially reasonable terms, and/or successfully prosecute or defend its position, Applied’s business, financial condition and results of operations could be materially and adversely affected.
Applied maintains a number of environmental, health, and safety programs that are primarily preventive in nature. As part of these programs, Applied regularly monitors ongoing compliance with applicable laws and regulations. In addition, Applied has trained personnel to conduct investigations of any environmental, health, or safety incidents, including,
without limitation,but not limited to, spills, releases, or possible contamination.
Compliance with federal, state and local environmental, health, and safety provisions, including,
without limitation,but not limited to, those regulating the discharge of materials into the environment, remedial agreements, and other actions relating to the environment have not had, and are not expected to have, a material effect on Applied’s capital expenditures, competitive position, financial condition, or results of operations.
The most recent report on Applied’s environmental, health, and safety activities can be found in the Company’s latest Citizenship Report on its website at http://www.appliedmaterials.com/about/cr/sustainability.company/corporate-responsibility/reports. The Citizenship Report is updated periodically. This website address is intended to be an inactive textual reference only. None of the information on, or accessible through, Applied’s website is part of this Form 10-K or is incorporated by reference herein. Employees
EmployeesAt October 30, 2011,26, 2014, Applied employed approximately 13,00014,000 regular employees and 900950 temporary employees. In the high-technology industry, competition for highly-skilled employees is intense. Applied believes that its future success is highly dependent upon its continued ability to attract, retain, and motivate qualified employees. There can be no assurance that Applied will be able to attract, hire, assimilate, motivate, and retain a sufficient number of qualified employees.
Executive Officers of the Registrant
The following table and notes set forth information about Applied’s executive
officers as of October 30, 2011:officers: |
| |
Name of Individual | | Position |
Michael R. Splinter(1) | | Executive Chairman of the Board of Directors |
| Gary E. Dickerson(2) | President, and Chief Executive Officer |
George S. Davis(2)
| | Executive Vice President, Chief Financial Officer |
Mark R. Pinto(3)
| | Executive Vice President, General Manager Energy and Environmental Solutions |
Randhir Thakur(4) | Thakur(3) | Executive Vice President, General Manager, Silicon Systems |
Joseph Flanagan(5)
| Ginetto Addiego(4) | Senior Vice President, Worldwide Operations and Supply ChainEngineering |
Mary Humiston(6)
| | Senior Vice President, Global Human Resources |
Manfred Kerschbaum(7)
| Robert J. Halliday(5) | Senior Vice President, Chief of StaffFinancial Officer |
Joseph J. Sweeney(8)
| Thomas F. Larkins(6) | Senior Vice President, General Counsel and Corporate Secretary |
Chris Bowers(9)
Omkaram Nalamasu(7) | | Group Vice President, Corporate Initiatives |
Thomas T. Edman(10)
| | Group Vice President, General Manager Display Business Group |
Ron Kifer(11)
| | Group Vice President, Chief Information Officer |
Charlie Pappis(12)
| | Group Vice President, General Manager Applied Global Services |
Omkaram Nalamasu(13)
| | CorporateSenior Vice President, Chief Technology Officer |
Thomas S. Timko(14)
Ali Salehpour(8) | Senior Vice President, General Manager, New Markets and Service Group |
| Charles Read(9) | Corporate Vice President, Corporate Controller and Chief Accounting Officer |
| |
| (1) | Mr. Splinter, age 61,64, has been President and Chief Executive OfficerChairman of the Board of Directors of Applied since April 2003September 2013 and Chairman of the Board of Directors since March 2009. Mr. Splinter served as Chief Executive Officer of Applied from April 2003 until September 2013, and also as President from April 2003 to June 2012. Prior to joining Applied, Mr. Splinter was an executive at Intel Corporation, (Intel), a manufacturer of chips and computer, networking and communications products, where Mr. Splinterhe held a number of positions, in his 20 years at Intel, including Executive Vice President and Director of Sales and Marketing, and Executive Vice President and General Manager of the Technology and Manufacturing Group. |
| |
| (2) | Mr. Davis,Dickerson, age 54,57, has been Chief Executive Officer and a member of the Board of Directors of Applied since September 2013. Mr. Dickerson was promoted to Executive Vicenamed President Chief Financial Officerof Applied in December 2009,June 2012, after serving as Senior Vice President, Chief Financial Officer, since December 2006, and appointed Group Vice President, Chief Financial Officerjoining Applied following its acquisition of Varian Semiconductor Equipment Associates, Inc. (Varian) in November 2006. Previously, he2011. Mr. Dickerson had been Group Vice President, General Manager, Corporate Business Development since March 2005. From November 1999 to February 2005, Mr. Davis served as Vice PresidentChief Executive Officer and Corporate Treasurer, where he managed Applied’s worldwide treasury operations and was responsible for investments, tax, financial risk management, and trade and export matters. Mr. Davis joined Applied in 1999. |
(3) | Dr. Pinto, age 52, has held the positiona director of Executive Vice President, General Manager Energy and Environmental SolutionsVarian since January 2011. Dr. Pinto was promoted to Executive Vice President in December 2009 and was previously Senior Vice President, General Manager, Energy and Environmental Solutions and Display as well as corporate Chief Technology Officer.2004. Prior to joining AppliedVarian in January 2004, Dr. Pinto spent 19Mr. Dickerson served 18 years with Bell Laboratories (Bell Labs)KLA-Tencor Corporation (KLA-Tencor), a communications researchsupplier of process control and yield management solutions for the semiconductor and related industries, where he held a variety of operations and product development company,roles, including President and the Lucent Microelectronics Group, which later became Agere SystemsChief Operating Officer. Mr. Dickerson started his semiconductor career in manufacturing and engineering management at General Motors' Delco Electronics Division and then AT&T, Inc., an IC components company, most recently as Vice President of the Analog Products Division. Dr. Pinto holds a Ph.D. in Electrical Engineering from Stanford University. |
(4) | |
| (3) | Dr. Thakur, age 49, was promoted to52, has been Executive Vice President, General Manager, Silicon Systems inGroup since December 2009, after serving as Senior Vice President, General Manager Silicon Systems Group since October 2009. Previously, he wasHe had served as Senior Vice President, General Manager, Thin Film Solar and Display. He was appointedDisplay, and Senior Vice President, General Manager, Strategic Operations when he rejoinedsince rejoining Applied in May 2008. HeDr. Thakur previously was with Applied from 2000 to 2005 in a variety of executive roles, including Group Vice President, General Manager for Front End Products. From September 2005 to May 2008, Dr. Thakur served as Executive Vice President of Technology and Fab Operations at SanDisk Corporation, a data storage solutions manufacturer, and as head of SanDisk’s worldwide operations. Prior to joining Applied in 2000, Dr. Thakur served in leadership roles at Steag Electronic Systems AG, an electronics company, and Micronalso serves on the board of directors of Marvell Technology Inc., a semiconductor manufacturer.Group Ltd. |
(5) | Mr. Flanagan, |
| (4) | Dr. Addiego, age 40, joined Applied as55, has been Senior Vice President, WorldwideEngineering since rejoining Applied in March 2014. He previously was with Applied from 1996 to 2005, leading various product groups as well as global organizations, including Global Operations, Manufacturing, Foundation Engineering, and Supply Chain inInformation Technology. From March 2011 to March 2014, Dr. Addiego was President and Chief Operating Officer of Ultra Clean Technology Corp., a supplier of critical subsystems for the semiconductor capital equipment, medical device, energy, research, and flat panel industries. From February 2010. Prior2005 to joining Applied, Mr. Flanagan held executive positions in global operationsMarch 2011, Dr. Addiego worked at Novellus Systems, Inc., a provider of advanced process equipment for Nortel Networks Corporation, a telecommunications equipment manufacturer, since 2006, includingthe semiconductor industry, where he served as Executive Vice President of Nortel Business Services from August 2009 to February 2010, and SeniorChief Administrative Officer and Executive Vice President of Global Operations from August 2007 until August 2009. Previously, Mr. Flanagan held a number of positions from 1993 to 2006 at General Electric Company (GE), a global infrastructure, finance and media company.Corporate Operations. |
(6) | Ms. Humiston, age 46, was named Senior Vice President, Global Human Resources in July 2011. She was Corporate Vice President, Global Human Resources from July 2009 to June 2010 and then promoted to Group Vice President in July 2010. Prior to July 2009, she served as the Corporate Vice President of Human Resources for both the Energy and Environmental Solutions and Display groups. Prior to joining Applied, Ms. Humiston was Vice President of Human Resources at Honeywell International Inc., which provides technologies to address safety, security and energy, from October 2002 to June 2008, with responsibility for various corporate and international organizations. She previously held executive positions with PeoplePC, an internet service provider; Gap, Inc., an apparel retailer; and GE. |
(7)(5) | Mr. Kerschbaum,Halliday, age 57, was named60, has been Senior Vice President, Chief Financial Officer of Staff in September 2009. Prior to that heApplied since February 2013. He previously served as Senior Vice President, General Manager, Applied Global Services from January 2005 to September 2009. Mr. Kerschbaum was Senior Vice President, Global Operations from July 2004 to January 2005 and from October 2002 to May 2003. From May 2003 to July 2004, he wasa Group Vice President Foundation Engineering and Operations. From January 1996General Manager in Applied’s Silicon Systems Group segment following the completion of Applied’s acquisition of Varian in November 2011. Mr. Halliday had served as Chief Financial Officer of Varian since 2001 and as an Executive Vice President of Varian since 2004. He was Varian's Treasurer from November 2002 to October 2002, he held various positions in Applied Materials North America, most recently as Group Vice President, General Manager, Applied Materials North America. Mr. Kerschbaum has served in various other operations, customer service2006 and engineering positions since joining Applied in 1983.from February 2009 to February 2010. |
(8) | |
| (6) | Mr. Sweeney,Larkins, age 63,53, has held the position ofbeen Senior Vice President, General Counsel and Corporate Secretary of Applied since July 2005, with responsibility forNovember 2012. Previously, Mr. Larkins was employed by Honeywell International Inc., a diversified global legal affairs, intellectual propertytechnology and security. From April 2002 to July 2005, Mr. Sweeneymanufacturing company, where he was Group Vice President, Legal Affairs and Intellectual Property, and Corporate Secretary. Mr. Sweeney joined Applied in 1993. |
(9) | Mr. Bowers, age 51, has been Group Vice President, Corporate Initiatives since October 2009, working on enterprise wide transformation projects. From March 2008 to September 2009, he was GroupSecretary and Deputy General Counsel from 2002 until joining Applied. Mr. Larkins served in various other positions at Honeywell (formerly AlliedSignal) after joining the company in 1997. |
| |
| (7) | Dr. Nalamasu, age 56, has been Senior Vice President, Chief Technology Officer since June 2013, and General Manager of Corporate Services and Chief of Staff, working closely with executives on effective business strategy execution. Prior to joining Applied, Mr. Bowers was a partner at the Hay Group, a global consulting firm, where he held various business leadership and consulting positions from 1992 to 2008. Most recently, he was Director of Client Services in Europe, the Middle East and Africa, and a member of the Hay Group Global R&D Council. Prior to the Hay Group, Mr. Bowers was a member of the U.K. Special Forces. |
(10) | Mr. Edman, age 49, was appointed Group Vice President and General Manager of the Display Business Group in February 2011. Previously, hehad served as Group Vice President, and General Manager of Corporate Business Development and Global Corporate Affairs and MarketingChief Technology Officer from June 2006January 2012 to June 2011. Prior to joining Applied, Mr. Edman served as President2013, and Chief Executive Officer of Applied Films Corporation until the company was acquired by Applied in June 2006, and he held various executive positions at Marubeni Specialty Chemicals, Inc., a distributor of specialty chemicals. Mr. Edman also serves on the governing board of the FlexTech Alliance and on the Board of Directors of TTM Technologies, Inc. as Chairman of its compensation committee. |
(11) | Mr. Kifer, age 60, joined Applied in May 2006 as Group Vice President and Chief Information Officer, Global Information Services. Prior to his appointment, Mr. Kifer spent five years with DHL, a global logistics company, in various executive management roles, most recently as the Senior Vice President and Chief Information Officer for North America, Asia Pacific and Emerging Markets. |
(12) | Mr. Pappis, age 50, has been Group Vice President and General Manager of Applied Global Services since September 2009. He previously held positions in Applied Global Services as Corporate Vice President, and General Manager for the Semiconductor Service Solutions group and as general manager for Equipment Productivity Services. He has held various other management positions since joining Applied in 1986. |
(13) | Dr. Nalamasu, age 53, was promoted to Corporate Vice President and Chief Technology Officer for Applied infrom January 2011.2011 to January 2012. Upon joining Applied in June 2006 tountil January 2011, Dr. Nalamasu was Corporatean Appointed Vice President of Research and served as Deputy Chief Technology Officer and served as General Manager for Applied’sthe Advanced Technologies GroupGroup. From 2002 to 2006, Dr. Nalamasu was Vice President of Research and a NYSTAR Distinguished Professordistinguished professor of Materials Science and Engineering at Rensselaer Polytechnic Institute, where he also served as Vice President of Research from 20022005 to 2006. Prior to that he held various R&DRensselaer, Dr. Nalamasu served in several leadership positionsroles at Bell Labs and later Lucent Technologies, Inc., a telecommunications company, for 17 years.Laboratories. |
(14) | |
| (8) | Mr. Timko,Salehpour, age 43, joined53, has been Senior Vice President, General Manager, New Markets and Service Group since September 2013. He previously served as Group Vice President, General Manager Energy and Environmental Solutions and Display Business Groups, since joining Applied in March 2010November 2012. Prior to Applied, Mr. Salehpour worked at KLA-Tencor for 16 years, where he served as a Senior Vice President and General Manager. |
| |
| (9) | Mr. Read, age 48, has been Corporate Vice President, Corporate Controller and Chief Accounting Officer. From June 2006 until March 2010,Officer of Applied since joining the Company in September 2013. Prior to Applied, Mr. Timko was with Delphi Automotive LLP, a supplier to the automotive, computing, communications, energy and consumer accessories markets, where he was most recently Chief Accounting Officer and Controller. He served as Assistant Controller for The Interpublic Group of Companies,Read worked at Brocade Communications Systems, Inc., a global provider of advertising and marketing services, from December 2004 to June 2006, and previously at Dover Corporation, a manufacturer of industrial products. Mr. Timko began his career in 1991 with PricewaterhouseCoopers LLC, a provider of auditsemiconductor and assurance,software-based network solutions, since October 2002, where he most recently served as Vice President, Corporate Controller. Prior to Brocade, Mr. Read worked at KPMG LLP, an audit, tax and advisory services, and is a certified public accountant.firm, from 1996 to 2002. |
Applied’s website is
http://www.appliedmaterials.com.Applied makes available free of charge, on or through its website, its annual, quarterly and current reports, and any amendments to those reports, as soon as reasonably practicable after electronically filing such reports with, or furnishing them to, the SEC. This website address is intended to be an inactive textual reference only. None of the information on, or accessible through, Applied’s website is part of this Form 10-K or is incorporated by reference herein.
The following factors could materially
and adversely affect Applied’s business, financial condition or results of operations and
cause reputational harm, and they should be carefully considered in evaluating the Company and its business, in addition to other information presented elsewhere in this report.
The industries that Applied serves are volatile and difficult to predict.
As a supplier to the global semiconductor, flat panel display,
solar and
relatedsolar industries, Applied is subject to business cycles, the timing, length and volatility of which can be difficult to predict and which vary by reportable segment. These industries historically have been cyclical due to sudden changes in customers’
requirements for new manufacturing capacity and advanced technology,
requirements and spending, which depend in part on customers’ capacity utilization, production volumes, access to affordable capital, end-use demand,
consumer buying patterns, and inventory levels relative to demand, as well as the rate of technology
transitions.transitions and general economic conditions. These changes have affected the timing and amounts of customers’ purchases and investments in technology, and continue to affect Applied’s orders, net sales, operating expenses and net income.
To meet rapidly changing demand in the industries it serves, Applied must accurately forecast demand and effectively manage its resources and production capacity for each of its segments as well as across multiple
segments. During periods of decreasing demand, Applied must reducesegments, and may incur unexpected or additional costs
andto align its
cost structure with prevailing market conditions; effectively manage its supply chain; and motivate and retain key employees.business operations. During periods of increasing demand for its products, Applied must have sufficient manufacturing capacity and inventory to meet customer demand; effectively manage its supply chain; attract, retain and motivate a sufficient number of qualified employees; and continue to control costs.
IfDuring periods of decreasing demand, Applied
does not accurately forecast and timely and appropriately adapt to changes in its business environment, Applied’s business, financial condition and results of operations may be materially and adversely affected.Applied is exposed to risks as a result of ongoing changes in the various industries in which it operates.
The global semiconductor, flat panel display, solar and related industries in which Applied operates are characterized by ongoing changes affecting some or all of these industries, including:
increasing capital requirements for building and operating new fabrication plants and customers’ ability to raise the necessary capital, particularly when financial market conditions are difficult;
differences in growth rates among the semiconductor, display and solar industries;
the increasing importance of establishing, improving and maintaining strong relationships with customers;
changes in end demand for electronic products over time and the effect of these changes on customers’ businesses and, in turn, on demand for Applied’s products;
abrupt and unforeseen shifts in the nature and amount of customer and end-user demand;
the increasing cost and complexity for customers to move from product design to volume manufacturing, which may slow the adoption rate of new manufacturing technology;
the need to continuallymust reduce the total cost of manufacturing system ownership, due in part to greater demand for lower-cost consumer electronics compared to business information technology spending;
the heightened importance to customers of system reliability and productivity and the effect on demand for fabrication systems as a result of their increasing productivity, device yield and reliability;
the increasing importance of, and difficulties in, developing products with sufficient differentiation to influence customers’ purchasing decisions;
requirements for shorter cycle times for the development, manufacture and installation of manufacturing equipment;
price and performance trends for semiconductor devices, LCDs and solar PVs, and the corresponding effect on demand for such products;
the increasing importance of the availability of spare parts to maximize the time that customers’ systems are available for production;
the increasing role for and complexity of software in Applied products; and
the increasing focus on reducing energy usage and improving the environmental impact and sustainability associated with manufacturing operations.
If Applied does not successfully manage the risks resulting from the ongoing changes in the semiconductor, flat panel display, solar and related industries, its business, financial condition and results of operations could be materially and adversely affected.
Applied is exposed to risks as a result of ongoing changes specific to the semiconductor industry.
The greatest portion of Applied’s consolidated net sales and profitability historically has been derived from sales of manufacturing equipment by the Silicon Systems Group to the global semiconductor industry. In addition, a majority of the revenues of Applied Global Services is from sales of service products to semiconductor manufacturers. The semiconductor industry is characterized by ongoing changes particular to that industry in addition to the general industry changes described in the preceding risk factor, including:
the increasing cost of research and development due to many factors, including: decreasing linewidths on a chip; the use of new materials such as cobalt and yttrium; new and more complex device structures; more applications and process steps; increasing chip design costs; and the increasing cost and complexity of integrated manufacturing processes;
the cost, technical complexity and timing of a proposed industry transition from 300mm to 450mm wafers, and the resulting effect on demand for manufacturing equipment and services;
the need to reduce product development time, despite the increasing difficulty of technical challenges;
the growing number of types and varieties of semiconductors and number of applications across multiple substrate sizes;
changes in demand and differing market growth rates for (i) different electronic products, such as tablets, smartphones, and personal computers, and in turn (ii) different applications/devices, such as NAND Flash, DRAM, logic, foundry and MRAM, and the resulting effect on customers’ capital spending patterns and on Applied’s ability to compete in these market segments;
the increasing cost and complexity for semiconductor manufacturers to move more technically advanced capability and smaller linewidths to volume manufacturing, and the resulting impact on the rates of technology transition and investment in capital equipment;
challenges associated with generating organic growth in light of semiconductor manufacturers’ decreasing rate of capital expenditures as a percentage of revenue, and manufacturers’ increasing allocation of capital investment to markets that Applied does not serve, such as lithography;
the increasing frequency and complexity of technology transitions and inflections, such as ALD, 3-D transistors, advanced interconnect, wafer-level packaging, and extreme ultraviolet lithography (EUV);
shorter cycle times between customers’ order placement and product shipment, which may lead to inventory write-offs and manufacturing inefficiencies that decrease gross margin;
technology developments in related markets, such as lithography, to which Applied may need to adapt;
competitive factors that make it difficult to enhance market position;
the importance of increasing market positions in larger market segments, such as etch and inspection;
the increasing concentration of wafer starts in one country, Korea, where Applied’s service penetration and service-revenue-per-wafer-start have been lower than in other regions; and
the increasing fragmentation of semiconductor markets, leading certain markets to become too small to support the cost of a new fabrication plant, while others require less technologically advanced products.
If Applied does not successfully manage the risks resulting from the ongoing changes occurring in the semiconductor industry, its business, financial condition and results of operations could be materially and adversely affected.
Applied is exposed to risks as a result of ongoing changes specific to the flat panel display industry.
The global flat panel display industry historically has experienced considerable volatility in capital equipment investment levels, due in part to the limited number of LCD manufacturers and the concentrated nature of LCD end-use applications. Recently, industry growth has depended to a considerable extent on consumer demand for increasingly larger and more advanced TVs, as well as smartphones and other mobile devices, which demand is highly sensitive to cost and improvements in technologies and features. In addition to the general industry changes described above in the second risk factor, the display industry is characterized by ongoing changes particular to that industry, including:
the planned expansion of manufacturing facilities in China by Chinese display manufacturers and manufacturers from other countries, and the ability of non-Chinese manufacturers to obtain government approvals on a timely basis;
the slowing rate of transition to larger substrate sizes for LCDs and the resulting effect on capital intensity in the industry and on Applied’s product differentiation, gross margin and return on investment;
the increasing importance of new types of displays, such as low temperature polysilicon (LTPS) and OLEDs, and new touch panel films, such as anti-reflective and anti-fingerprint;
the likelihood and timing of a transition to a new CVD backplane technology, metal oxide; and
uncertainty with respect to future LCD technology end-use applications and growth drivers.
If Applied does not successfully manage the risks resulting from the ongoing changes occurring in the display industry, its business, financial condition and results of operations could be materially and adversely affected.
Applied is exposed to risks as a result of ongoing changes specific to the solar industry.
An increasing portion of Applied’s business is in the emerging solar market, which, in addition to the general industry changes described above in the second risk factor, is characterized by ongoing changes specific to the solar industry, including:
the need to continually decrease the cost-per-watt of electricity produced by solar PV products to at or below grid parity by, among other things, reducing operating costs and increasing throughputs for solar PV manufacturing,align its cost structure with prevailing market conditions; effectively manage its supply chain; and improving the conversion efficiency of solar PVs;
the impact on demand for solar PV products arising from the cost of electricity generated by solar PVs compared to the cost of electricity from the existing grid or other energy sources;
the varying energy policies of governments around the worldmotivate and their effect in influencing the rate of growth of the solar PV market, including the availability and amount of government incentives for solar power such as tax credits, feed-in tariffs, rebates, renewable portfolio standards that require electricity providers to sell a targeted amount of energy from renewable sources, and goals for solar installations on government facilities;
retain key employees.the growing number of solar PV manufacturers and increasing global production capacity for solar PVs, primarily in China;
the filing by U.S. solar manufacturers of a regulatory unfair trade action against solar PVs from China, where most of Applied’s solar equipment sales are concentrated, which could result in the U.S. government’s assessment of duties on solar cells and modules imported from China or other outcomes and, in turn, adversely impact demand for Applied’s products;
the varying levels of operating and industry experience among solar PV manufacturers and the resulting differences in the nature and extent of customer support services requested from Applied;
challenges associated with marketing and selling manufacturing equipment and services to a diverse and diffuse customer base;
the growth of market segments in which Applied does not participate, such as passivation and furnaces;
the increasing number of government-affiliated entities in China that are becoming customers;
the cost of polysilicon and other materials; and
access to affordable financing and capital by customers and end-users.
In addition, current projections for global solar PV production exceed anticipated near-term, end-use demand, which is heavily dependent on installed cost-per-watt, government policies and incentives, and the availability of affordable capital. An oversupply of solar PVs that leads customers to delay or reduce investments in manufacturing capacity and new technology adversely impacts the sales growth rates and/or profitability of Applied’s products. If Applied does not successfully manage the risks resulting from the ongoing changes occurring in the solar industry, its business, financial condition and results of operations could be materially and adversely affected.
Applied is exposed to risks associated with the difficult financial markets and uncertain global economy.
Continuing difficulties
Uncertain global economic conditions and weak or moderate growth in China, Europe, and the United States, along with uncertainties in the financial markets, national debt
and fiscal concerns in various regions, and
uncertainty regarding the global economygovernment austerity measures, are posing challenges
and some governments may implement policies to
control economic growth.the industries in which Applied operates. The markets for semiconductors and flat panel displays in particular depend largely on consumer spending, while the solar market depends in part on government incentives and the availability of financing for PV installations. Economic uncertainty and related factors
including unemployment, inflation and fuel prices, exacerbate negative trends in business and consumer spending and may cause certain Applied customers to push out, cancel, or refrain from placing orders for equipment or services, which may
in turn reduce
Applied's net sales, reduce backlog, and affect Applied’s ability to convert backlog to sales.
DifficultiesUncertain market conditions, difficulties in obtaining capital,
uncertain market conditions, or reduced profitability may also cause some customers to scale back operations, exit businesses, merge with other manufacturers, or file for bankruptcy protection and potentially cease operations,
leading to customers’ reducing research and development funding and/or capital expenditures and,which can also result in
turn, lower sales and/or additional inventory or bad debt expense for Applied. These conditions may
also similarly affect key suppliers, which could impair their ability to deliver parts and result in delays for Applied’s products or added costs. In addition, these conditions may lead to strategic alliances by, or consolidation of, other equipment manufacturers, which could adversely affect Applied’s ability to compete effectively.
Uncertainty about future economic and industry conditions also makes it more challenging for Applied to forecast its operating results, make business decisions, and identify and prioritize the risks that may affect its
business,businesses, sources and uses of cash, financial condition and results of operations. Applied may be required to implement additional cost reduction efforts, including restructuring activities,
and/or modify its business model, which may adversely affect Applied’s ability to capitalize on
opportunities in a market recovery.opportunities. In addition, Applied maintains an investment portfolio that is subject to general credit, liquidity, foreign exchange, market and interest rate risks. The risks to Applied’s investment portfolio may be exacerbated if financial market conditions deteriorate and, as a result, the value and liquidity of the investment portfolio, as well as returns on pension assets, could be negatively impacted and lead to impairment charges. Applied also maintains cash balances in various bank accounts globally in order to fund normal operations. If one or moreany of these financial institutions becomebecomes insolvent, or are taken over by a government, it could limit Applied’s ability to access cash in the affected accounts.
If
Applied is exposed to risks as a result of ongoing changes in the various industries in which it operates.
The global semiconductor, flat panel display, solar and related industries in which Applied operates are characterized by ongoing changes affecting some or all of these industries that impact demand for and/or the profitability of Applied's products, including:
the nature, timing and degree of visibility of changes in end demand for electronic products, including those related to fluctuations in consumer buying patterns tied to seasonality or the introduction of new products, and the effects of these changes on foundry and other customers’ businesses and, in turn, on demand for Applied’s products;
increasing capital requirements for building and operating new fabrication plants and customers’ ability to raise the necessary capital;
differences in growth rates among the semiconductor, display and solar industries;
the increasing importance of establishing, improving and maintaining strong relationships with customers;
the increasing cost and complexity for customers to move from product design to volume manufacturing, which may slow the adoption rate of new manufacturing technology;
the need to continually reduce the total cost of manufacturing system ownership, due in part to greater demand for lower-cost consumer electronics compared to business information technology spending;
the heightened importance to customers of system reliability and productivity and the effect on demand for fabrication systems as a result of their increasing productivity, device yield and reliability;
manufacturers’ ability to reconfigure and re-use fabrication systems;
the increasing importance of, and difficulties in, developing products with sufficient differentiation to influence customers’ purchasing decisions;
requirements for shorter cycle times for the development, manufacture and installation of manufacturing equipment;
price and performance trends for semiconductor devices, displays and solar PVs, and the corresponding effect on demand for such products;
the increasing importance of the availability of spare parts to maximize the time that customers’ systems are available for production;
the increasing role for and complexity of software in Applied products; and
the increasing focus on reducing energy usage and improving the environmental impact and sustainability associated with manufacturing operations.
Applied is exposed to risks as a result of ongoing changes specific to the semiconductor industry.
The largest proportion of Applied’s consolidated net sales and profitability has been and continues to be derived from sales of manufacturing equipment by the Silicon Systems Group to the global semiconductor industry. In addition, a majority of the revenues of Applied Global Services is from sales of service products to semiconductor manufacturers. The semiconductor industry is characterized by ongoing changes particular to this industry that impact demand for and/or the profitability of Applied's semiconductor equipment and service products, including:
the increasing cost of research and development due to many factors, including: decreasing linewidths on a chip, the use of new materials, new and more complex device structures, more applications and process steps, increasing chip design costs, and the increasing cost and complexity of integrated manufacturing processes;
the need to reduce product development time, despite the increasing difficulty of technical challenges;
the growing number of types and varieties of semiconductors and number of applications across multiple substrate sizes;
the increasing cost and complexity for semiconductor manufacturers to move more technically advanced capability and smaller linewidths to volume manufacturing, and the resulting impact on the rates of technology transition and investment in capital equipment;
challenges in generating organic growth given semiconductor manufacturers’ levels of capital expenditures and the allocation of capital investment to market segments that Applied does not serve, such as lithography, or segments where Applied's products have lower relative market presence;
the importance of increasing market positions in under-penetrated segments, such as etch and inspection;
the growing demand for mobility products, such as tablets and smartphones, and corresponding industry investment in devices that require fewer Applied products to manufacture, such as NAND flash memory, than are needed to make devices used in other applications, such as DRAM for personal computers;
the adoption of cloud-based memory storage particularly for mobility products, and the associated inhibiting effect on NAND bit growth rates;
the increasing frequency and complexity of technology transitions and inflections, such as 3-D transistors and advanced interconnects, and Applied’s ability to timely and appropriatelyeffectively anticipate and adapt to these changes;
shorter cycle times between order placements by customers (particularly foundries) and product shipment, which may lead to inventory write-offs and manufacturing inefficiencies that decrease gross margin;
competitive factors that make it difficult to enhance position, including challenges in securing development-tool-of-record (DTOR) and production-tool-of-record (PTOR) positions with customers;
shifts in sourcing strategies by computer and electronics companies that impact the equipment requirements of Applied's foundry customers;
the concentration of new wafer starts in Korea and Taiwan, where Applied’s service penetration and service-revenue-per-wafer-start have been lower than in other regions; and
the increasing fragmentation of semiconductor markets, leading certain markets to become too small to support the cost of a new fabrication plant, while others require less technologically advanced products.
Applied must accurately forecast, and allocate appropriate resources and investment towards addressing, key technology changes and inflections, such as the transition to 20nm devices, in order to enable opportunities for gains. In addition, the proposed industry transition from 300mm to 450mm wafers presents opportunities as well as risks and uncertainties, including those related to cost, technical complexity, timing, and the resulting effect on demand for manufacturing equipment and services.
Applied is exposed to risks as a result of ongoing changes specific to the flat panel display industry.
The global flat panel display industry historically has experienced considerable volatility in capital equipment investment levels, due in part to the limited number of display manufacturers, the concentrated nature of end-use applications, excess production capacity relative to end-use demand, and panel manufacturer profitability. Industry growth has depended primarily on consumer demand for increasingly larger and more advanced TVs and, more recently, on demand for smartphones and other mobile devices, which demand is highly sensitive to cost and improvements in technologies and features. The display industry is characterized by ongoing changes particular to this industry that impact demand for and/or the profitability of Applied's display products, including:
the timing and extent of an expansion of manufacturing facilities in China by Chinese display manufacturers and manufacturers from other countries, and the uncertain macroeconomic environmentability of non-Chinese manufacturers to obtain government approvals on a timely basis;
the rate of transition to larger substrate sizes for TVs and the resulting effect on capital intensity in the industry and on Applied’s product differentiation, gross margin and return on investment;
the importance of new types of display technologies, such as low temperature polysilicon (LTPS), organic light-emitting diode (OLED) and metal oxide, and new touch panel films, such as anti-reflective and anti-fingerprint; and
uncertainty with respect to future display technology end-use applications and growth drivers.
Applied is exposed to risks as a result of ongoing changes specific to the solar industry.
Investment levels in capital equipment for the global solar industry have experienced considerable volatility. In recent years, global solar PV production capacity has exceeded end-use demand, causing customers to significantly reduce or delay investments in manufacturing capacity and new technology, or to cease operations. The global solar market is characterized by ongoing changes specific to this industry that impact demand for and/or the profitability of Applied’s solar products, including:
the need to continually decrease the cost-per-watt of electricity produced by solar PV products to at or below grid parity in more global regions by, among other things, reducing operating costs and increasing throughputs for solar PV manufacturing, and improving the conversion efficiency of solar PVs;
the variability and uncertainty of government energy policies and their effect in influencing the rate of growth of the solar PV market, including the availability and amount of incentives for solar power such as tax credits, feed-in tariffs, rebates, renewable portfolio standards that require electricity providers to sell a targeted amount of energy from renewable sources, and goals for solar installations on government facilities;
the number of solar PV manufacturers and amount of global production capacity for solar PVs, primarily in China;
the filing of regulatory unfair trade proceedings against solar PVs from China, where most of Applied’s solar equipment sales are concentrated, which has resulted in the assessment of duties on solar cells and modules imported from China and led to other trade-related conflicts and outcomes;
the varying levels of operating and industry conditions, or to difficultiesexperience among solar PV manufacturers and the resulting differences in the financial markets. Applied’s business,nature and extent of customer support services requested from Applied;
challenges associated with marketing and selling manufacturing equipment and services to a diverse and diffuse customer base;
the growth of market segments in which Applied does not participate, such as passivation and furnaces;
the availability and condition of used solar equipment, which impacts demand for new equipment;
complexities associated with government-affiliated entities as customers, for example in China;
the financial condition
or results of
operations may be materiallysolar PV customers and
adversely affected.their access to affordable financing and capital; and
solar panel manufacturing overcapacity, which has led to weak industry operating performance and outlooks, deterioration of the solar equipment market, and a worsening of the financial condition of certain customers.
Applied must continually innovate,
commercialize its products, and adapt its business and product offerings to respond to competition and rapid technological changes.
As Applied operates in a highly competitive environment in which innovation is critical, its future success depends on many factors, including the effective commercialization and customer acceptance of its equipment, services and related products. In addition, Applied must successfully execute its growth strategy, including enhancing
market shareits presence in existing markets, expanding into related markets, cultivating new markets and exceeding industry growth rates, while constantly improving its operational performance. The development, introduction and support of a broadening set of products in more collaborative, geographically diverse, open and varied competitive environments have grown
increasinglymore complex and expensive over time. Furthermore, new or improved products may entail higher costs and reduced profits. Applied’s performance may be adversely affected if it does not timely, cost-effectively and successfully:
identify and address technology inflections, market changes, new applications, customer requirements and end-use demand;
develop new products (including disruptive technologies), improve and/or develop new applications for existing products, and adapt similar products for use by customers in different applications and/or markets with varying technical requirements;
appropriately price and achieve market acceptance of its products;
differentiate its products from those of competitors and any disruptive technologies, and meet customers’ performance specifications;
specifications, appropriately price products, and achieve market acceptance;maintain operating flexibility to enable different responses to different markets, customers and applications;
enhance its worldwide operations across all business segments to reduce cycle time, enable continuous quality improvement, reduce costs, and enhance design for manufacturability and design for serviceability;
focus on product development and sales and marketing strategies that address customers' high value problems and foster strong customer relationships;
allocate resources, including people and R&D funding, among Applied’s products and between the development of new products and the enhancement of existing products, as most appropriate and effective for future growth;
reduce the cost and improve the productivity of capital invested in R&D activities;
accurately forecast demand, work with suppliers and meet production schedules for its products;
improve its manufacturing processes and achieve cost efficiencies across product offerings;
adapt to changes in value offered by companies in different parts of the supply chain;
qualify products for evaluation and, in turn, volume manufacturing with its customers; and
implement changes in its design engineering methodology, including those that enable reduction of material costs and cycle time, greater commonality of platforms and types of parts used in different systems, greater effectiveness of product life cycle management, and reduced energy usage and environmental impact.
Applied is exposed to risks associated with a highly concentrated customer base.
Applied’s semiconductor customer base historically has been, and is becoming even more, highly concentrated as a result of economic and industry conditions. In fiscal 2014, three semiconductor manufacturers accounted for approximately 54 percent of Silicon Systems Group net sales and two customers accounted for 33 percent of Applied’s consolidated net sales. Applied’s display customer base is also highly concentrated, while concentration within Applied’s solar customer base varies depending on the product line but is increasing due to challenging industry conditions. Applied’s customer base is also geographically-concentrated. See Item 2, “Management’s Discussion and Analysis of Financial Condition and Results of Operations,” for tabular presentations of net sales by geographic region.
In addition, certain customers have experienced significant ownership or management changes, consolidated with other manufacturers, outsourced manufacturing activities, or engaged in collaboration or cooperation arrangements with other manufacturers. Customers have entered into strategic alliances or industry consortia that have increased the influence of key industry participants in technology decisions made by their partners. Also, certain customers are making an increasingly greater percentage of their respective industry’s capital equipment investments. Further, claims or litigation involving key industry participants have resulted and may continue to result in changes in their sourcing strategies and other outcomes. In this environment, contracts or orders from a relatively limited number of manufacturers have accounted for, and are expected to continue to account for, a substantial portion of Applied’s business. The mix and type of customers, and sales to any single customer, may vary significantly from quarter to quarter and from year to year. As Applied’s products are configured to customer specifications, changing, rescheduling or canceling orders may result in significant, non-recoverable costs. If
customers do not place orders, or they substantially reduce, delay or cancel orders, Applied
doesmay not
successfully manage these challenges, itsbe able to replace the business,
financial condition andwhich could have a material adverse effect on the Company’s results of
operations could be materiallyoperations. Major customers may also seek, and
adversely affected.Operating in multiple industries, and the entry into new markets and industries, entail additional challenges and obligations.
As part of its growth strategy, Applied must successfully expand into related or new markets and industries, either with its existing products or with new products developed internally or obtained through acquisitions. The entry into different markets involves additional challenges, including those arising from:
the need to devote additional resources to develop new products for, and operate in, new markets;
the need to develop new sales and marketing strategies and cultivate relationships with new customers;
differing rates of profitability and growth among multiple businesses;
Applied’s ability to anticipate demand, capitalize on opportunities, and avoid or minimize risks;
the complexity of managing multiple businesses with variations in production planning, execution, supply chain management and logistics;
the adoption of new business models;
the need to undertake activities to grow demand for end-products;
the need to develop and successfully implement adequate new business processes and systems;
Applied’s ability to rapidly expand its operations to meet increased demand and the associated effect on working capital;
new materials, processes and technologies;
the need to attract, motivate and retain employees with skills and expertise in these new areas;
new and more diverse customers and suppliers, including some with limited operating histories, uncertain and/or limited funding, evolving business models and/or locations in regions where Applied does not have, or has limited, operations;
different customer service requirements;
new or different competitors with potentially more financialoccasion receive, pricing, payment, intellectual property-related, or other resources, industry experience and/or established customer relationships;
entry into new industries and countries, with differing levels of government involvement, laws and regulations, and business, employment and safety practices;
third parties’ intellectual property rights; and
the needcommercial terms that are less favorable to comply with, or work to establish, industry standards and practices.
Applied.In addition, Applied has begun applying for and receiving funding from United States and other government agencies for certain strategic development programs to increase its R&D resources and address new market opportunities. As a condition to this government funding, Applied may be subject to certain record-keeping, audit, intellectual property rights-sharing and/or other obligations.
If Applied does not successfully manage the risks resulting from its diversification and entry into new markets and industries, its business, financial condition and results of operations could be materially and adversely affected.
Applied is exposed to the risks of operating a global business.
In fiscal 2011,2014, approximately 8178 percent of Applied’s net sales were to customers in regions outside the United States. Moreover, China now represents the largest market for various electronic products, such as TVs, PCs, and smartphones. Certain of Applied’s R&D and manufacturing facilities, as well as suppliers to Applied, are also located outside the United States, including in Singapore, Taiwan, China, Korea, Israel, Germany Italy and Switzerland.Italy. Applied is also expanding its business and operations in new countries. The global nature of Applied’s business and operations, combined with the need to continually improve the Company’s operating cost structure, presents challenges, including but not limited to those arising from: varying regional and geopolitical business conditions and demands;
political and social attitudes, laws, rules, regulations and policies within countries that favor domestic companies over non-domestic companies, including customer- or government-supported efforts to promote the development and growth of local competitors;
customer- or government-supported efforts to influence Applied to conduct more of its operations and sourcing in a particular country, such as Korea and China;
variations among, and changes in, local, regional, national or international laws and regulations (including intellectual property, labor, tax, and import /exportimport/export laws), as well as the interpretation and application of such laws and regulations;
global trade issues, including those related to the interpretation and application of import and export licenses, as well as international trade disputes;
positions taken by governmental agencies regarding possible national commercial and/or security issues posed by international business operations;
fluctuating raw material, commodity, energy and energy costs;
shipping costs or shipping delays;challenges associated with managing more geographically diverse operations and projects, which requiresrequire an effective organizational structure and appropriate business processes, procedures and controls;
a more diverse workforce with different experience levels, cultures, customs, business practices and worker expectations;
variations in the ability to develop relationships with local customers, suppliers and governments;
fluctuations in interest rates and currency exchange rates, including the relative strength or weakness of the U.S. dollar against the Japanese yen, euro, Taiwanese dollar, Israeli shekel or Chinese yuan;
the need to provide sufficient levels of technical support in different locations around the world;
political instability, natural disasters (such as earthquakes, floods or storms), pandemics, social unrest, terrorism or acts of war in locations where Applied has operations, suppliers or sales, or that may influence the value chain of the industries that Applied serves;
reliance on various information systems, data centers and software applications to conduct many aspects of the Company’s business, which may be vulnerable to cyberattacks by third parties or breached due to employee error, misuse or other causes that could result in business disruptions, loss of confidential information, or other adverse consequences in the event that Applied’s firewalls and security processes and practices are ineffective;
the need for an effective business continuity plan if a disaster or other event occurs that could disrupt business operations;
the need to regularly reassess the size, capability and location of the Company’s global infrastructure and make appropriate changes;
cultural and language differences;
shipping costs and/or delays;
the need to continually improve the Company’s operating cost structure;
difficulties and uncertainties associated with the entry into new countries;
hiring and integration of an increasing percentagenumber of new workers, including in countries such as India and China;
the increasing need for the workforce to be more mobile and work in or travel to different regions;
uncertainties with respect to economic growth rates in various countries; and
uncertainties with respect to growth rates for the manufacture and salessale of semiconductors, LCDsdisplays and solar PVs in the developing economies of certain countries.
Many of these challenges are present in China and Korea, which are experiencing significant growth of customers, suppliers and competitors to Applied. Applied further believes that China and Korea present large potential markets for its products and opportunity for growth over the long term, although at lower projected levels of profitability and margins for certain products than historically have been achieved in other regions.
These challenges may materially and adversely affect Applied’s business, financial condition and results of operations.In addition, in March 2011, Japan experienced a significant earthquake, aftershocks, and tsunami that resulted in widespread damage and business interruptions throughout the country, including those associated with radiation concerns arising from damage to a nuclear power plant. Certain of Applied’s customers and suppliers are located in Japan and Applied also has sales and service centers in the country. While Applied has not experienced any material impact on its business or operations to date and has taken actions to enhance its ability to meet customers’ requirements, Applied cannot predict the extent of the impact the situation in Japan may have, if any, on its future business and operations.
Applied is exposed to risks associated with business combinations, acquisitions and strategic investments.
Applied has made, and in the future may make, acquisitions of or investments in companies, technologies or products in existing, related or new markets for Applied. Business combinations, acquisitions and investments involve numerous risks that vary depending on their scale and nature, including but not limited to:
diversion of management’s attention from other operational matters;
contractual restrictions on the conduct of Applied’s business during the pendency of a highly concentratedproposed transaction;
inability to complete proposed transactions as anticipated or at all and any ensuing obligation to pay a termination fee;
the failure of acquired businesses to meet or exceed expected returns;
requirements imposed by government regulators in connection with their review of a transaction, which may include, among other things, divestitures and/or restrictions on the conduct of Applied’s existing business or the acquired business;
ineffective integration of operations, systems, technologies, products or employees, which can impact the ability to realize anticipated synergies or other benefits;
failure to commercialize purchased technologies;
initial dependence on unfamiliar supply chains or relatively small supply partners;
inability to capitalize on characteristics of new markets that may be significantly different from Applied’s existing markets and where competitors may have stronger market positions and customer
base.relationships;
failure to attract, retain and motivate key employees;
the potential impact of the announcement or consummation of a proposed transaction on relationships with third parties;
potential changes in Applied’s credit rating, which could adversely impact the Company’s access to and cost of capital;
reductions in cash balances and/or increases in debt obligations to finance activities associated with a transaction, which reduce the availability of cash flow for general corporate or other purposes;
exposure to new operational risks, rules, regulations, worker expectations, customs and practices to the extent acquired businesses are located in regions where Applied has not historically conducted business;
challenges associated with managing new, more diverse and more widespread operations, projects and people;
inability to obtain and protect intellectual property rights in key technologies;
inadequacy or ineffectiveness of an acquired company’s internal financial controls, disclosure controls and procedures, and/or environmental, health and safety, anti-corruption, human resource, or other policies or practices;
impairment of acquired intangible assets and goodwill as a result of changing business conditions, technological advancements or worse-than-expected performance of the segment;
the risk of litigation or claims associated with a proposed or completed transaction;
unknown, underestimated and/or undisclosed commitments or liabilities; and
the inappropriate scale of acquired entities’ critical resources or facilities for business needs.
Applied also makes strategic investments in other companies, including companies formed as joint ventures, which may decline in value and/or not meet desired objectives. The success of these investments depends on various factors over which Applied may have limited or no control and, particularly with respect to joint ventures, requires ongoing and effective cooperation with strategic partners. The risks to Applied’s strategic investment portfolio may be exacerbated by unfavorable financial market and macroeconomic conditions and, as a result, the value of the investment portfolio could be negatively impacted and lead to impairment charges.
The proposed business combination with Tokyo Electron Limited may not be completed or, if completed, the intended benefits may not be fully realized.
On September 24, 2013, Applied announced an agreement with Tokyo Electron Limited (TEL), a Japanese corporation and global supplier of semiconductor and flat panel display
customer bases historically have been,production equipment, and
are becoming even more, highly concentrated asprovider of technical support and services for semiconductor, flat panel display and PV panel production equipment, to effect a
result of economic and industry conditions. For example, in fiscal 2011, three semiconductor manufacturers accounted for 52 percent of Silicon Systems Group net sales, and three LCD manufacturers accounted for 54 percent of Display net sales. Further, three customers accounted for 32 percent of Applied’s consolidated net sales in fiscal 2011. Certain customers have experienced significant ownership or management changes, consolidated with other manufacturers, outsourced manufacturing activities, or engaged incollaboration or cooperation arrangements with other manufacturers. In addition, customers have entered into strategic alliances or industry consortia that have increased the influence of key industry participants in technology decisions made by their partners. Also, certain semiconductor and display customers are making an increasingly greater percentagecombination of their respective industry’s capital equipment investments. Customer concentration within Applied’s solar customer base varies depending onbusinesses. Under the product line. For precision wafering systems, five solar manufacturers accounted for 57 percent of net sales in fiscal 2011, whileagreement, which was amended February 14, 2014, the Baccini cell systems business has a more diffuse customer base. Applied’s customer base in eachclosing of the Display and Energy and Environmental Solutions segmentstransaction is also geographically-concentrated. In fiscal 2011, customers in China and Taiwan accounted for a total of 78 percent of net sales forsubject to customary conditions, including regulatory approvals. The proposed business combination is subject to the Display segment, while customers in China accounted for 80 percent of net sales forrisk factors described immediately above, including the Energy and Environmental Solutions segment.
In this environment, contracts or orders from a relatively limited number of manufacturers have accounted for, and are expected to continue to account for, a substantial portion of Applied’s business, which may result in added complexities in managing customer relationships and transactions and make it more challenging for Applied’s business units to generate organic growth. In addition,risks that the mix and type of customers, and sales to any single customer, may vary significantly from quarter to quarter and from year to year. If customers do not place orders, or they substantially reduce, delay or cancel orders, Appliedcombination may not be ableconsummated in a timely manner or at all; that required regulatory approvals may not be obtained or may be subject to replaceconditions that reduce the business. As Applied’sestimated benefits of the combination; that the businesses, operations, systems, technologies, products are configured to customer specifications, changing, rescheduling or canceling ordersemployees of Applied and TEL may resultnot be integrated successfully; and, following completion of the transaction, that ineffective integration, changes in significant, non-recoverable costs. Major customers may also seek, and on occasion receive, pricing, payment, intellectual property-related,laws or regulations, including tax laws or other commercial terms that are less favorablefactors, may impact the combined company’s ability to Applied. These factors could have a material adverserealize anticipated synergies and benefits.
Operating in multiple industries, and the entry into new markets and industries, entail additional challenges and obligations.
As part of its growth strategy, Applied must successfully expand into related or new markets and industries, either with its existing products or with new products developed internally or obtained through acquisitions. The entry into different markets involves additional challenges, including those arising from:
the need to devote additional resources to develop new products for, and operate in, new markets;
the need to develop new sales and technical marketing strategies, cultivate relationships with new customers and meet different customer service requirements;
differing rates of profitability and growth among multiple businesses;
Applied’s ability to anticipate demand, capitalize on opportunities, and avoid or minimize risks;
the complexity of managing multiple businesses with variations in production planning, execution, supply chain management and logistics;
the adoption of new business models, business processes and systems;
Applied’s ability to rapidly expand or reduce its operations to meet increased or decreased demand, respectively, and the associated effect on Applied’sworking capital;
•new materials, processes and technologies;
the need to attract, motivate and retain employees with skills and expertise in these new areas;
new and more diverse customers and suppliers, including some with limited operating histories, uncertain and/or limited funding, evolving business models and/or locations in regions where Applied does not have, or has limited, operations;
new or different competitors with potentially more financial or other resources, industry experience and/or established customer relationships;
entry into new industries and countries, with differing levels of government involvement, laws and regulations, and business, employment and safety practices;
third parties’ intellectual property rights; and
the need to comply with, or work to establish, industry standards and practices.
In addition, Applied from time to time receives funding from United States and other government agencies for certain strategic development programs to increase its research and development resources and address new market opportunities. As a condition
and results of operations.to this government funding, Applied may be subject to certain record-keeping, audit, intellectual property rights-sharing and/or other obligations.
Manufacturing interruptions or delays could affect Applied’s ability to meet customer demand and lead to higher costs, while the failure to estimate customer demand accurately could result in excess or obsolete inventory.
Applied’s business depends on its timely supply of equipment, services and related products that meet the rapidly changing technical and volume requirements of its customers, which depends in part on the timely delivery of parts, components and subassemblies (collectively, parts) from suppliers, including contract manufacturers. Some key parts are subject to long lead-times and/or obtainable only from a single supplier or limited group of suppliers, and some sourcing or subassembly is provided by suppliers located in countries other than the countries where Applied conducts its manufacturing, including China and Korea. Cyclical industry conditions and the volatility of demand for manufacturing equipment increase capital, technical, operational and other risks for
Applied and for companies throughout
Applied’sits supply chain. Further,
the adversethese conditions
in the credit and financial markets and industry slowdowns in recent periods have caused, and may
continue to cause some suppliers to scale back operations, exit businesses, merge with other companies, or file for bankruptcy protection and possibly cease
operations, potentially affecting Applied’s ability to obtain quality parts on a timely basis.operations. Applied may also experience significant interruptions of its manufacturing operations, delays in its ability to deliver products or services, increased costs or customer order cancellations as a result of:
the failure or inability of suppliers to timely deliver sufficient quantities of quality parts on a cost-effective basis;
volatility in the availability and cost of materials, including rare earth elements;
difficulties or delays in obtaining required import or export approvals;
information technology or infrastructure failures;
andnatural disasters or other events beyond Applied's control (such as earthquakes, floods or storms, regional economic downturns, pandemics, social unrest, political instability, terrorism, or acts of war).
, particularly where it conducts manufacturing.If a supplier fails to meet Applied’s requirements concerning quality, cost,
socially-responsible business practices, or other performance factors, Applied may transfer its business to alternative sources, which could entail manufacturing delays, additional costs, or other difficulties. In addition, if Applied needs to rapidly increase its business and manufacturing capacity to meet increases in demand or expedited shipment schedules, this may exacerbate any interruptions in
Applied’s manufacturing operations and supply chain and the associated effect on Applied’s working capital. Moreover, if actual demand for Applied’s products is different than expected, Applied may purchase more/fewer parts than necessary or incur costs for canceling, postponing or expediting delivery of parts. If Applied purchases inventory in anticipation of customer demand that does not materialize, or if customers reduce or delay orders, Applied may incur excess inventory charges. Any or all
Table of these factors could materially and adversely affect Applied’s business, financial condition and results of operations.Applied is exposed to risks associated with acquisitions and strategic investments.
Applied has made, and in the future intends to make, acquisitions of or investments in, companies, technologies or products in existing, related or new markets for Applied. Most recently, in November 2011, Applied completed its acquisition of Varian Semiconductor Associates, Inc. (Varian), which was the Company’s largest acquisition to date. Acquisitions involve numerous risks, including but not limited to:
Contents diversion of management’s attention from other operational matters;
inability to complete acquisitions as anticipated or at all, which in certain circumstances may require Applied to pay a termination fee to the target company;
requirements imposed by government regulators in connection with their review of a transaction, which may include, among other things, divestitures and/or restrictions on the conduct of Applied’s existing business or the acquired business;
ineffective integration of operations, systems, technologies, products or employees of an acquired business;
inability to realize anticipated synergies or other benefits;
failure to commercialize purchased technologies;
initial dependence on unfamiliar supply chains or relatively small supply partners;
inability to capitalize on characteristics of new markets that may be significantly different from Applied’s existing markets and where competitors may have stronger market positions and customer relationships;
failure to attract, retain and motivate key employees from the acquired business;
exposure to new operational risks, rules, regulations, worker expectations, customs and practices to the extent acquired businesses are located in regions where Applied has not historically conducted business;
challenges associated with managing new, more diverse and more widespread operations, projects and people;
inability to obtain and protect intellectual property rights in key technologies;
inadequacy or ineffectiveness of an acquired company’s internal financial controls, disclosure controls and procedures, and/or environmental, health and safety, anti-corruption, human resource, or other policies or practices;
impairment of acquired intangible assets and goodwill as a result of changing business conditions, technological advancements or worse-than-expected performance of the segment;
the risk of litigation or claims associated with a proposed or completed transaction;
unknown, underestimated and/or undisclosed commitments or liabilities; and
the inappropriate scale of acquired entities’ critical resources or facilities for business needs.
Applied also makes strategic investments in other companies, including companies formed as joint ventures, which may decline in value and/or not meet desired objectives. The success of these investments depends on various factors over which Applied may have limited or no control and, particularly with respect to joint ven-
tures, requires ongoing and effective cooperation with strategic partners. The risks to Applied’s strategic investment portfolio may be exacerbated by unfavorable financial market and macroeconomic conditions and, as a result, the value of the investment portfolio could be negatively impacted and lead to impairment charges. Mergers and acquisitions and strategic investments are inherently subject to significant risks. If Applied does not successfully manage the risks associated with acquisitions and strategic investments, its business, financial condition and results of operations could be materially and adversely affected.
Applied used existing cash and incurred debt obligations to acquire Varian that could affect its ability to respond to changes in business conditions or otherwise adversely affect its business.
Applied financed the acquisition of Varian through a combination of existing cash balances and the net proceeds of senior unsecured notes in the aggregate principal amount of $1.75 billion issued on June 8, 2011. The reduction in cash balances, assumed lower interest income, and payments on the debt obligations will reduce the availability of cash flow for general corporate or other purposes, such as further mergers and acquisitions. This in turn may reduce Applied’s flexibility in responding to changes in its businesses and in the industries in which it operates.
The ability to attract, retain and motivate key employees is vital to Applied’s success.
Applied’s success, competitiveness and ability to execute on its global strategies and maintain a culture of innovation depend in large part on its ability to attract, retain and motivate key employees, especially in critical positions and in growing markets.positions. Achieving this objective may be difficult due to many factors, including fluctuations in global economic and industry conditions, management changes, Applied’s organizational structure, competitors’ hiring practices of competitors and other companies, cost reduction activities (including workforce reductions and unpaid shutdowns), availability of career development opportunities, the ability to obtain necessary authorizations for workers to provide services outside their home countries, and the effectiveness of Applied’s compensation and benefit programs, including its share-based programs. IfRestructuring programs present particular challenges to the extent they involve the departure of knowledgeable and experienced employees and the resulting need to identify and train existing or new workers to perform necessary functions, which may result in unexpected costs, reduced productivity, and/or difficulties with respect to internal processes and controls.
Applied is exposed to various risks related to protection and enforcement of intellectual property rights.
Applied’s success depends in significant part on the protection of its intellectual property and other rights. Infringement of Applied’s rights by a third party, such as the unauthorized manufacture or sale of equipment or spare parts, could result in uncompensated lost market and revenue opportunities for Applied. Policing any unauthorized use of intellectual property is difficult and costly and Applied cannot be certain that the measures it has implemented will prevent misuse. Applied’s intellectual property rights may not provide significant competitive advantages if they are circumvented, invalidated, rendered obsolete by the rapid pace of technological change, or if Applied does not successfully attract, retainadequately protect or assert these rights or obtain necessary licenses on commercially reasonable terms. Furthermore, the laws and motivate key employees, practices of other countries, including China, India, Taiwan and Korea, permit the protection and enforcement of Applied’s rights to varying extents, which may not be sufficient to adequately protect Applied’s rights. In addition, changes in intellectual property laws or their interpretation, such as recent changes in U.S. patent laws, may impact Applied's ability to protect and assert its intellectual property rights, increase costs and uncertainties in the prosecution of patent applications and enforcement or defense of issued patents, and diminish the value of Applied's intellectual property.
Applied is exposed to risks related to cybersecurity threats and incidents.
In the conduct of its business, Applied collects, uses, transmits and stores data on information technology systems. This data includes confidential information belonging to Applied or its customers or other business partners, as well as personally-identifiable information of individuals. Applied has experienced, and expects to continue to be subject to, cybersecurity threats and incidents, ranging from employee error or misuse to individual attempts to gain unauthorized access to information systems to sophisticated and targeted measures known as advanced persistent threats, none of which have been material to the Company to date. Applied devotes significant resources to network security, data encryption and other measures to protect its systems and data from unauthorized access or misuse. However, depending on their nature and scope, cybersecurity incidents could result in business disruption; the misappropriation, corruption or loss of confidential information and critical data (Applied's and that of third parties); reputational damage; litigation with third parties; diminution in the value of Applied's investment in research, development and engineering; data privacy issues; and increased cybersecurity protection and remediation costs.
Applied is exposed to various risks related to legal proceedings.
Applied from time to time is, and in the future may be, unableinvolved in legal proceedings or claims regarding patent infringement, intellectual property rights, antitrust, environmental regulations, securities, contracts, product performance, product liability, unfair competition, misappropriation of trade secrets, employment, workplace safety, and other matters. Applied also on occasion receives notification from customers who believe that Applied owes them indemnification or other obligations related to capitalize onclaims made against such customers by third parties.
Legal proceedings and claims, whether with or without merit, and associated internal investigations, may (1) be time-consuming and expensive to prosecute, defend or conduct; (2) divert management’s attention and other Applied resources; (3) inhibit Applied’s ability to sell its
opportunitiesproducts; (4) result in adverse judgments for damages, injunctive relief, penalties and
its business, financial condition and operating results mayfines; and/or (5) negatively affect Applied’s business. There can be
materially and adversely affected.no assurance regarding the outcome of current or future legal proceedings, claims or investigations.
The failure to successfully implement and conduct outsourcing activities and other operational initiatives could adversely affect results of operations.
To better align its costs with market conditions, locate closer to customers, enhance productivity, and improve efficiencies, Applied conducts certain engineering, software development, manufacturing, sourcing and other operations in regions outside the United States, including India, Taiwan, China, and Korea. Applied has implemented a distributed manufacturing model, under which certain manufacturing and supply chain activities are conducted in various countries, including the United States, Europe, Israel, Singapore, Taiwan and other countries in Asia, and assembly of some systems is completed at customer sites. In addition, Applied outsources certain functions to third parties, including companies in the United States, India, China, Korea, Malaysia and other countries. Outsourced functions include contract manufacturing, engineering, customer support, software development, information technology support, finance and administrative activities. The expanding role of third party providers has required changes to Applied’s existing operations and the adoption of new procedures and processes for retaining and managing these providers, as well as redistributing responsibilities as warranted, in order to realize the potential productivity and operational efficiencies, assure quality and continuity of supply, and protect the intellectual property of Applied and its customers, suppliers and other partners. If Applied does not accurately forecast the amount, timing and mix of demand for products, or if contract manufacturers or other outsource providers fail to perform in a timely manner or at satisfactory quality levels, Applied’s ability to meet customer requirements could suffer, particularly during a market upturn.
In addition, Applied
is implementing amust regularly implement or update comprehensive
programprograms and processes to better align its global organizations,
and processes, including initiatives to enhance the Asia supply chain and improve back office and information technology infrastructure for more efficient transaction processing. Applied also is implementing a multi-year, company-wide program to transform certain business processes
or extend established processes, including
the transitionenhancements or replacements to
a singlecertain enterprise resource planning (ERP) software
system to perform various functions.systems. The implementation of additional
func-tionalityfunctionality to the ERP system entails certain risks, including difficulties with changes in business processes that could disrupt Applied’s operations, such as its ability to track orders and timely ship products, project inventory requirements, manage its supply chain and aggregate financial and operational data. TheDuring transitions Applied must continue to rely on legacy information systems, which may be costly or inefficient, while the implementation of new initiatives may not achieve the anticipated benefits and may divert management’s attention from other operational activities, negatively affect employee morale, or have other unintended consequences.
If Applied does not effectively develop and implement its outsourcing and relocation strategies, if required export and other governmental approvals are not timely obtained, if Applied’s third party providers do not perform as anticipated, or if there are delays or difficulties in enhancing business processes, Applied may not realize anticipated productivity improvements or cost efficiencies, and may experience operational difficulties, increased costs (including energy and transportation), manufacturing interruptions or delays, inefficiencies in the structure and/or operation of its supply chain, loss of its intellectual property rights, quality issues,
reputational harm, increased product time-to-market, and/or inefficient allocation of human
resources, any or all of which could materially and adversely affect Applied’s business, financial condition and results of operations.resources.
Applied may incur impairment charges to goodwill or long-lived assets.
Applied has a significant amount of goodwill and other acquired intangible assets related to acquisitions. Goodwill and purchased intangible assets with indefinite useful lives are not amortized, but are reviewed for impairment annually during the fourth quarter of each fiscal year, and more frequently when events or changes in circumstances indicate that the carrying value of an asset may not be recoverable. The review compares the fair value for each of Applied’s reporting units to its associated carrying value, including goodwill. Factors that could lead to impairment of goodwill and intangible assets include adverse industry or economic trends, reduced estimates of future cash flows, declines in the market price of Applied common stock, changes in Applied’s strategies or product portfolio, and restructuring activities. Applied’s valuation methodology for assessing impairment requires management to make judgments and assumptions based on historical experience and projections of future operating performance. Applied may be required to record a chargefuture charges to earnings during the period in which an impairment of goodwill or amortizable intangible assets is determined to exist, which could materially and adversely affect Applied’s resultsexist.
Table of operations.Applied is exposed to various risks related to legal proceedings or claims and protection of intellectual property rights.
Applied from time to time is, and in the future may be, involved in legal proceedings or claims regarding patent infringement, intellectual property rights, antitrust, environmental regulations, securities, contracts, product performance, product liability, unfair competition, misappropriation of trade secrets, employment, workplace safety, and other matters. Applied also on occasion receives notification from customers who believe that Applied owes them indemnification or other obligations related to claims made against such customers by third parties.
In February 2010, the Seoul Prosecutor’s Office for the Eastern District in Korea indicted certain employees of Applied Materials Korea (AMK), including the former head of AMK who at the time of indictment was a vice president of Applied Materials, Inc., along with employees of several other companies, alleging the improper receipt and use of confidential information of Samsung Electronics Co., Ltd. (Samsung), a major customer. Hearings on these matters are ongoing in the Seoul Eastern District Court. Applied and Samsung entered into a settlement agreement effective as of November 1, 2010, which resolves potential civil claims related to this matter and which is separate from and does not affect the criminal proceedings.
Legal proceedings and claims, whether with or without merit, and associated internal investigations, may (1) be time-consuming and expensive to prosecute, defend or conduct; (2) divert management’s attention and other Applied resources; (3) inhibit Applied’s ability to sell its products; (4) result in adverse judgments for damages, injunctive relief, penalties and fines; and/or (5) negatively affect Applied’s business. There can be no assurance regarding the outcome of current or future legal proceedings, claims or investigations. If Applied is not able to favorably resolve or settle legal proceedings or claims, or in the event of any adverse findings against Applied or any of its employees, Applied’s business, financial condition and results of operations could be materially and adversely affected and Applied may suffer harm to its reputation.
Applied’s success depends in significant part on the protection of its intellectual property and other rights. Infringement of Applied’s rights by a third party, such as the unauthorized manufacture or sale of equipment or spare parts, could result in uncompensated lost market and revenue opportunities for Applied. Applied’s intellectual property rights may not provide significant competitive advantages if they are circumvented, invalidated, rendered obsolete by the rapid pace of technological change, or if Applied does not adequately protect or assert these rights. Furthermore, the laws and practices of other countries, including China, India, Taiwan and Korea, permit the protection and enforcement of Applied’s rights to varying extents, which may not be sufficient to adequately protect Applied’s rights. Applied previously entered into an arrangement with one of its competitors to decrease the risk of patent infringement lawsuits in the future. There can be no assurance that the intended results of this arrangement will be achieved or that Applied will be able to adequately protect its intellectual property rights with the restrictions associated with the arrangement. If Applied is not able to favorably resolve or settle claims, obtain or enforce intellectual property rights, obtain necessary licenses on commercially reasonable terms, and/or successfully prosecute or defend its intellectual property position, Applied’s business, financial condition and results of operations could be materially and adversely affected and Applied may suffer harm to its reputation.
Contents
Changes in tax rates or tax assets and liabilities could affect results of operations.
As a global company, Applied is subject to taxation in the United States and various other countries. Significant judgment is required to determine and estimate worldwide tax liabilities. Applied’s future annual and quarterly tax rates could be affected by numerous factors, including changes in the: (1) applicable tax laws; (2) amount and composition of pre-tax income in countries with differing tax rates; (3) plans of the Company to permanently reinvest certain funds held outside of the U.S.; orand (4) valuation of Applied’s deferred tax assets and liabilities. As of
October 26, 2014, Applied intends to permanently reinvest approximately $2.1 billion of these funds outside of the U.S. and does not plan to repatriate these funds. To better align with the
increasingly international nature of its business, Applied
is transitioningconducts certain manufacturing, supply chain, and other operations
intoin Asia, bringing these activities closer to
customers. These changes are expected to result in a reduction of futurecustomers and reducing operating costs.
In Singapore, Applied has received authorization to use tax incentives that provide that
certain income earned in
Singaporecertain countries outside the U.S. will be subject to tax holidays or reduced income tax rates. To obtain the benefit of these tax
provisions,incentives, Applied must meet requirements relating to various activities. Applied’s ability to realize benefits from these
provisionsincentives could be materially affected if, among other things, applicable requirements are not met or
if Applied incurs net losses for which it cannot claim a deduction.
In addition, Applied is subject to regular examination by the Internal Revenue Service and other tax authorities, and from time to time initiates amendments to previously filed tax returns. Applied regularly assesses the likelihood of favorable or unfavorable outcomes resulting from these examinations and amendments to determine the adequacy of its provision for income taxes, which requires estimates and judgments. Although Applied believes its tax estimates are reasonable, there can be no assurance that the tax authorities will agree with such estimates. Applied may have to engage in litigation to achieve the results reflected in the estimates, which may be time-consuming and expensive. There can be no assurance that Applied will be successful or that any final determination will not be materially different from the treatment reflected in Applied’s historical income tax provisions and
accruals, which could materially and adversely affect Applied’s financial condition and results of operations.accruals.
Applied is subject to risks of non-compliance with environmental and safety regulations.
Applied is subject to environmental and safety regulations in connection with its global business operations, including but not limited to: regulations related to the development, manufacture and use of its products; recycling and disposal of materials used in its products or in producing its products; the operation of its facilities; and the use of its real property. The failure or inability to comply with existing or future environmental and safety regulations, such as those related to climate change, could result in: (1) significant remediation liabilities; (2) the imposition of fines; (3) the suspension or termination of the development, manufacture, sale or use of certain of its products; (4) limitations on the operation of its facilities or ability to use its real property; and/or (5) a decrease in the value of its real
property, each of which could have a material adverse effect on Applied’s business, financial condition and results of operations.property.
Applied is exposed to various risks related to the regulatory environment.
Applied is subject to various risks related to: (1) new, different, inconsistent or
even conflicting laws, rules and regulations that may be enacted by executive order, legislative bodies
and/or regulatory agencies in the countries in which Applied operates; (2) disagreements or disputes between national or regional regulatory agencies related to international trade; and (3) the interpretation and application of laws, rules and regulations.
For example, asAs a public company with global operations, Applied is subject to the laws of multiple jurisdictions and the rules and regulations of various governing bodies, including those related to financial and other disclosures, corporate governance, privacy, and anti-corruption. Changes
and ambiguities in laws, regulations and standards
may create uncertainty
and challenges regarding compliance matters. Efforts to comply with new and changing regulations have resulted in, and are likely to continue to result in, increased general and administrative expenses and a diversion of management time and attention from revenue-generating activities to compliance activities.
If Applied is found by a court or regulatory agency not to be in compliance with applicable laws, rules or regulations, Applied could be subject to legal or regulatory sanctions, the public’s and customers’ perception of Applied could decline, and Applied’s business, financial condition and results of operations could be materially and adversely affected. | |
| Item 1B: | Unresolved Staff Comments |
Information concerning Applied’s principal properties at October 30, 201126, 2014 is set forth below: | | | | | |
| | | | | | |
Location | Type | Principal Use | Square Footage | | Type
| | Principal Use
| | Square
Footage | | | Ownership | |
Santa Clara, CA | | Office, Plant & Warehouse | | Headquarters; Marketing; Manufacturing; Distribution; Research, Development,
Engineering; Customer Support | 1,358,000 164,000 |
| | | 1,512,000 | | | | Owned | Leased |
| | | | Manufacturing; Distribution; | | | 250,000 | | | | Leased | |
| | | | Research, Development and
Engineering | | | | | | | | |
Austin, TX | | Office, Plant & Warehouse | Manufacturing | Manufacturing1,676,000 145,000 |
| | | 1,719,000 | | | | Owned | Leased |
| | | | | | | 145,000 | | | | Leased | |
Rehovot, Israel | | Office, Plant & Warehouse | | Manufacturing; Research,
Development, andEngineering
Engineering;Customer Support | 381,000 5,400 |
| | | 442,000 | | | | Owned | Leased |
Alzenau, Germany
| Singapore | Office, Plant & Warehouse | Manufacturing and Customer Support | Manufacturing; Research,408,000 11,000 |
Development andEngineering
| | | 281,000 | | | | Owned Leased | |
Kalispell, MT
| Gloucester, MA | Office, Plant & Warehouse | | Manufacturing; Research,
Development, andEngineering
Engineering;Customer Support | 315,000 125,000 |
| | | 252,000 | | | | Owned | Leased |
Cheseaux, Switzerland
| Tainan, Taiwan | Office, Plant & Warehouse | | Manufacturing; Research,
Development, Engineering;
Manufacturing and Customer Support | 320,000 | | 171,000 | | | | Leased | |
Treviso, Italy
| | Office, Plant & Warehouse | | Manufacturing; Research,
Development, Engineering;
Customer Support | | | 124,000 | | | | Leased | |
Singapore
| | Office, Plant & Warehouse | | Manufacturing and
Customer Support | | | 392,000 | | | | Owned | |
| | | | | | | 5,000 | | | | Leased | |
Tainan, Taiwan
| | Office, Plant & Warehouse | | Manufacturing and
Customer Support | | | 320,000 | | | | Owned | |
Xi’an, China
| | Office, Plant & Warehouse | | Research, Development and
Engineering | | | 567,000 | | | | Owned | |
Hsinchu, Taiwan
| | Office & Warehouse | | Customer Support | | | 90,000 | | | | Owned | |
| | | | | | | 28,000 | | | | Leased | |
Shanghai, China
| | Office & Warehouse | | Customer Support | | | 95,000 | | | | Leased | |
Because of the interrelation of Applied’s operations, properties within a country may be shared by the segments operating within that country. Products in the Silicon Systems Group are manufactured in Austin, Texas;
Singapore; Gloucester, Massachusetts; and Rehovot,
Israel; and Singapore.Israel. Remanufactured
equipment products in the Applied Global Services segment are produced primarily in Austin, Texas. Products in the Display segment are manufactured in
Tainan, Taiwan and Santa Clara,
California; Alzenau, Germany; and Tainan, Taiwan.California. Products in the Energy and Environmental Solutions segment are primarily manufactured in Alzenau, Germany;
Cheseaux, Switzerland; Treviso, Italy; and
Santa Clara, California.Cheseaux, Switzerland.
In addition to the above properties, Applied
also owns and leases
office space for marketing, sales, engineering and customer support offices,
plants and/or warehouse locations in 75 locations throughout the world:
1716 in Europe,
1920 in Japan,
1416 in North America (principally the United States),
107 in China,
3 in India, 7 in Korea,
63 in Southeast Asia, and
23 in Taiwan.
Applied has a manufacturing facility of 261,000 square feet in Austin, Texas availableThese facilities are principally used for
sale.manufacturing; research, development and engineering; and marketing, sales and/or customer support.
Applied also owns
112a total of approximately 150 acres of buildable land in Texas,
that could accommodate approximately 1,708,000 square feet of additional building space, 12.5 acres in California,
that could accommodate approximately 400,000 square feet of additional building space,Massachusetts, Israel and
10 acres in Israel that could accommodate approximately 111,000 square feet of additional building space. Applied also leases 4 acres in Italy that could accommodate
approximately 180,000 square feet of additional building space.
In connection with the acquisition of Varian in November 2011, Applied added owned and leased facilities aggregating 715,000 square feet. These facilities consist of a manufacturing facility located in Gloucester, Massachusetts and multiple international sales and service offices.
Applied considers the properties that it owns or leases as adequate to meet its current and future requirements. Applied regularly assesses the size, capability and location of its global infrastructure and periodically makes adjustments based on these assessments.
The information set forth under “Legal Matters” in Note 15 of Notes to Consolidated Financial Statements is incorporated herein by reference.
| |
| Item 4: | (Removed and Reserved)Mine Safety Disclosures |
None.
| |
| Item 5: | Market for Registrant’s Common Equity, Related Stockholder Matters and Issuer Purchases of Equity Securities |
The following table sets forth the high and low closing sale prices for the periods presented as reported on the NASDAQ Global Select Market.
| | | | | | | | |
| | | Price Range | |
| | | High | | | Low | |
Fiscal 2010 | | | | | | | | |
First quarter | | $ | 14.87 | | | $ | 11.89 | |
Second quarter | | $ | 14.47 | | | $ | 11.80 | |
Third quarter | | $ | 14.00 | | | $ | 11.78 | |
Fourth quarter | | $ | 12.35 | | | $ | 10.37 | |
Fiscal 2011 | | | | | | | | |
First quarter | | $ | 16.10 | | | $ | 12.37 | |
Second quarter | | $ | 16.85 | | | $ | 14.46 | |
Third quarter | | $ | 15.24 | | | $ | 12.27 | |
Fourth quarter | | $ | 12.62 | | | $ | 9.85 | |
|
| | | | | | | |
| | Price Range |
| | High | | Low |
| Fiscal 2014 | | | |
| First quarter | $ | 18.01 |
| | $ | 16.50 |
|
| Second quarter | $ | 20.84 |
| | $ | 16.72 |
|
| Third quarter | $ | 23.27 |
| | $ | 18.67 |
|
| Fourth quarter | $ | 23.11 |
| | $ | 18.92 |
|
| Fiscal 2013 | | | |
| First quarter | $ | 12.83 |
| | $ | 10.15 |
|
| Second quarter | $ | 14.15 |
| | $ | 12.80 |
|
| Third quarter | $ | 16.69 |
| | $ | 14.40 |
|
| Fourth quarter | $ | 18.10 |
| | $ | 14.97 |
|
Applied’s common stock is traded on the NASDAQ Global Select Market under the symbol AMAT. As of
November 20, 2011,December 12, 2014, there were
4,1923,408 registered holders of Applied common stock.
The performance graph below shows the five-year cumulative total stockholder return on Applied common stock during the period from October
29, 200625, 2009 through October
30, 2011.26, 2014. This is compared with the cumulative total return of the Standard & Poor’s 500 Stock Index and the RDG Semiconductor Composite Index over the same period. The comparison assumes $100 was invested on October
29, 200625, 2009 in Applied common stock and in each of the foregoing indices and assumes reinvestment of dividends, if any. Dollar amounts in the graph are rounded to the nearest whole dollar. The performance shown in the graph represents past performance and should not be considered an indication of future performance.
COMPARISON OF 5 YEAR CUMULATIVE TOTAL RETURN*
Among Applied Materials, Inc., the S&P 500 Index
and the RDG Semiconductor Composite Index
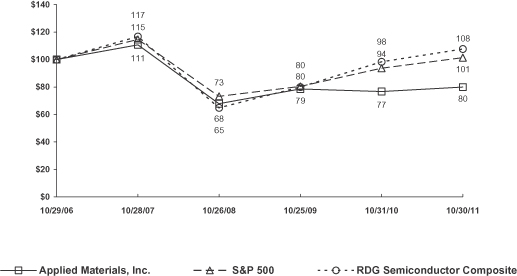
* | $100 invested on 10/29/06 in stock or 10/31/06 in index, including reinvestment of dividends. |
* Assumes $100 invested on 10/25/09 in stock or 10/30/09 in index, including reinvestment of dividends.
Indexes calculated on month-end basis.
Copyright© 2011
“S&P,&P” is a divisionregistered trademark of Standard & Poor’s Financial Services LLC, a subsidiary of The McGraw-Hill Companies, Inc. All rights reserved.
|
| | | | | | | | | | | | | | | | | |
| | 10/25/2009 | | 10/31/2010 | | 10/30/2011 | | 10/28/2012 | | 10/27/2013 | | 10/26/2014 |
| Applied Materials | 100.00 |
| | 97.43 |
| | 101.85 |
| | 88.54 |
| | 151.43 |
| | 183.29 |
|
| S&P 500 Index | 100.00 |
| | 116.52 |
| | 125.94 |
| | 145.09 |
| | 184.52 |
| | 216.39 |
|
| RDG Semiconductor Composite Index | 100.00 |
| | 121.00 |
| | 132.42 |
| | 124.95 |
| | 163.20 |
| | 207.93 |
|
Dividends
During fiscal | | | | | | | | | | | | | | | | | | | | | | | | |
| | | 10/29/06 | | | 10/28/07 | | | 10/26/08 | | | 10/25/09 | | | 10/31/10 | | | 10/30/11 | |
Applied Materials | | | 100.00 | | | | 110.51 | | | | 67.66 | | | | 78.53 | | | | 76.51 | | | | 79.98 | |
S&P 500 Index | | | 100.00 | | | | 114.56 | | | | 73.21 | | | | 80.38 | | | | 93.66 | | | | 101.24 | |
RDG Semiconductor Composite Index | | | 100.00 | | | | 116.74 | | | | 64.72 | | | | 79.94 | | | | 98.31 | | | | 107.61 | |
Dividends2014
The following table summarizes the dividends declared by, Applied’s Board of Directors during fiscal 2011:
| | | | | | |
Date declared
| | Record date
| | Payable date
| | Amount per share
|
December 7, 2010
| | March 2, 2011 | | March 23, 2011 | | $ 0.07 |
March 8, 2011
| | June 1, 2011 | | June 22, 2011 | | $ 0.08 |
June 6, 2011
| | August 31, 2011 | | September 21, 2011 | | $ 0.08 |
September 13, 2011
| | November 23, 2011 | | December 14, 2011 | | $ 0.08 |
declared four quarterly cash dividends of $0.10 per share each. During fiscal 2010,2013, Applied’s Board of Directors declared three quarterly cash dividends in the amount of $0.07$0.10 per share each and one quarterly cash dividend in the amount of $0.06$0.09 per share. During fiscal 2009,2012, Applied’s Board of Directors declared fourthree quarterly cash dividends in the amount of $0.06$0.09 per share each.each and one quarterly cash dividend of $0.08. Dividends declared during fiscal 2011, 20102014, 2013 and 2009 amounted to $4082012 totaled $487 million $361, $469 million and $320$438 million
, respectively. Applied currently anticipates that it will continue to pay cash dividends on a quarterly basis in the future, although the declaration and amount of any future cash dividenddividends are at the discretion of the Board of Directors and will depend on Applied’s financial condition, results of operations, capital requirements, business conditions and other factors, as well as a determination that cash dividends are in the best interests of Applied’s stockholders.
Repurchases of Applied Common Stock
The following table provides information as
During the fourth quarter of
October 30, 2011 with respect to thefiscal 2014, there were no shares of common stock repurchased by
Applied duringApplied. On March 5, 2012, the
fourth quarterBoard of
fiscal 2011. | | | | | | | | | | | | | | | | |
Period | | Total Number of
Shares Purchased | | | Average
Price Paid
per Share | | | Total Number of
Shares Purchased as
Part of Publicly
Announced Program* | | | Maximum Dollar
Value of Shares
That May Yet be
Purchased Under
the Program* | |
| | | (In millions, except per share amounts) | |
Month #1 | | | | | | | | | | | | | | | | |
(August 1, 2011 to August 28, 2011) | | | 0.9 | | | $ | 11.44 | | | | 0.9 | | | $ | 1,347 | |
Month #2 | | | | | | | | | | | | | | | | |
(August 29, 2011 to September 25, 2011) | | | 10.5 | | | $ | 11.08 | | | | 10.5 | | | $ | 1,231 | |
Month #3 | | | | | | | | | | | | | | | | |
(September 26, 2011 to October 30, 2011) | | | 4.5 | | | $ | 10.86 | | | | 4.5 | | | $ | 1,182 | |
| | | | | | | | | | | | | | | | |
Total | | | 15.9 | | | $ | 11.04 | | | | 15.9 | | | | | |
| | | | | | | | | | | | | | | | |
* | On March 8, 2010, the Board of Directors approved a stock repurchase program for up to $2.0 billion in repurchases over the next three years, ending March 2013. |
The following selected financial information has been derived from Applied’s historical audited consolidated financial statements and should be read in conjunction with the consolidated financial statements and the accompanying notes for the corresponding fiscal years:
| | | | | | | | | | | | | | | | | | | | |
Fiscal Year(1) | | 2011 | | | 2010 | | | 2009 | | | 2008 | | | 2007 | |
| | | (In millions, except percentages, per share amounts and number of employees) | |
Net sales | | $ | 10,517 | | | $ | 9,549 | | | $ | 5,014 | | | $ | 8,129 | | | $ | 9,735 | |
Gross margin | | $ | 4,360 | | | $ | 3,715 | | | $ | 1,431 | | | $ | 3,443 | | | $ | 4,492 | |
(% of net sales) | | | 41 | | | | 39 | | | | 29 | | | | 42 | | | | 46 | |
Research, development and engineering | | $ | 1,118 | | | $ | 1,143 | | | $ | 934 | | | $ | 1,104 | | | $ | 1,142 | |
(% of net sales) | | | 11 | | | | 12 | | | | 19 | | | | 14 | | | | 12 | |
Marketing, selling, general and administrative | | $ | 901 | | | $ | 942 | | | $ | 735 | | | $ | 965 | | | $ | 952 | |
(% of net sales) | | | 9 | | | | 10 | | | | 15 | | | | 12 | | | | 10 | |
Operating income (loss) | | $ | 2,398 | | | $ | 1,384 | | | $ | (394 | ) | | $ | 1,355 | | | $ | 2,372 | |
(% of net sales) | | | 23 | | | | 14 | | | | (8 | ) | | | 17 | | | | 24 | |
Income (loss) before income taxes | | $ | 2,378 | | | $ | 1,387 | | | $ | (486 | ) | | $ | 1,409 | | | $ | 2,440 | |
Effective tax rate (%) | | | 19 | | | | 32 | | | | (37 | ) | | | 32 | | | | 30 | |
Net income (loss) | | $ | 1,926 | | | $ | 938 | | | $ | (305 | ) | | $ | 961 | | | $ | 1,710 | |
(% of net sales) | | | 18 | | | | 10 | | | | (6 | ) | | | 12 | | | | 18 | |
Earnings (loss) per diluted share | | $ | 1.45 | | | $ | 0.70 | | | $ | (0.23 | ) | | $ | 0.70 | | | $ | 1.20 | |
Weighted average common shares, diluted | | | 1,330 | | | | 1,349 | | | | 1,333 | | | | 1,375 | | | | 1,427 | |
New orders | | $ | 10,142 | | | $ | 10,249 | | | $ | 4,097 | | | $ | 9,155 | | | $ | 9,677 | |
Order backlog | | $ | 2,392 | | | $ | 3,244 | | | $ | 2,735 | | | $ | 4,848 | | | $ | 3,655 | |
Working capital | | $ | 7,561 | | | $ | 3,877 | | | $ | 3,749 | | | $ | 3,719 | | | $ | 4,226 | |
Long-term debt | | $ | 1,947 | | | $ | 204 | | | $ | 201 | | | $ | 202 | | | $ | 202 | |
Cash dividends declared per common share | | $ | 0.31 | | | $ | 0.27 | | | $ | 0.24 | | | $ | 0.24 | | | $ | 0.23 | |
Stockholders’ equity | | $ | 8,800 | | | $ | 7,536 | | | $ | 7,095 | | | $ | 7,549 | | | $ | 7,821 | |
Total assets | | $ | 13,861 | | | $ | 10,943 | | | $ | 9,574 | | | $ | 11,006 | | | $ | 10,662 | |
Capital expenditures | | $ | 209 | | | $ | 169 | | | $ | 249 | | | $ | 288 | | | $ | 265 | |
Regular employees | | | 12,973 | | | | 13,045 | | | | 12,619 | | | | 14,824 | | | | 14,550 | |
|
| | | | | | | | | | | | | | | | | | | |
| Fiscal Year(1) | 2014 | | 2013 | | 2012 | | 2011 | | 2010 |
| | | | | | | | | | |
| | (In millions, except percentages and per share amounts) |
| New orders | $ | 9,648 |
| | $ | 8,466 |
| | $ | 8,037 |
| | $ | 10,142 |
| | $ | 10,249 |
|
| Net sales | $ | 9,072 |
| | $ | 7,509 |
| | $ | 8,719 |
| | $ | 10,517 |
| | $ | 9,549 |
|
| Gross margin | $ | 3,843 |
| | $ | 2,991 |
| | $ | 3,313 |
| | $ | 4,360 |
| | $ | 3,715 |
|
| (% of net sales) | 42.4 |
| | 39.8 |
| | 38.0 |
| | 41.5 |
| | 38.9 |
|
| Research, development and engineering | $ | 1,428 |
| | $ | 1,320 |
| | $ | 1,237 |
| | $ | 1,118 |
| | $ | 1,143 |
|
| Operating income | $ | 1,520 |
| | $ | 432 |
| | $ | 411 |
| | $ | 2,398 |
| | $ | 1,384 |
|
| (% of net sales) | 16.8 |
| | 5.8 |
| | 4.7 |
| | 22.8 |
| | 14.5 |
|
| Income before income taxes | $ | 1,448 |
| | $ | 350 |
| | $ | 316 |
| | $ | 2,378 |
| | $ | 1,387 |
|
Net income(2) | $ | 1,072 |
| | $ | 256 |
| | $ | 109 |
| | $ | 1,926 |
| | $ | 938 |
|
Earnings per diluted share(2) | $ | 0.87 |
| | $ | 0.21 |
| | $ | 0.09 |
| | $ | 1.45 |
| | $ | 0.70 |
|
| Long-term debt | $ | 1,947 |
| | $ | 1,946 |
| | $ | 1,946 |
| | $ | 1,947 |
| | $ | 204 |
|
| Cash dividends declared per common share | $ | 0.40 |
| | $ | 0.39 |
| | $ | 0.35 |
| | $ | 0.31 |
| | $ | 0.27 |
|
| Total assets | $ | 13,174 |
| | $ | 12,043 |
| | $ | 12,102 |
| | $ | 13,861 |
| | $ | 10,943 |
|
| |
| (1) | Each fiscal year ended on the last Sunday in October. Fiscal 2014, 2013, 2012 and 2011 each contained 52 weeks, while fiscal 2010 contained 53 weeks. |
| |
| (2) | Fiscal 2014 amount differs from the unaudited consolidated financial statements included in Applied’s press release issued on November 13, 2014, reflecting an increase to provision for income taxes of $34 million and a decrease to earnings per diluted share of $0.03. This adjustment is not considered material and does not affect Applied’s previously announced Non-GAAP Adjusted Results. |
| |
| Item 7: | Management’s Discussion and Analysis of Financial Condition and Results of Operations |
Management’s Discussion and Analysis of Financial Condition and Results of Operations (MD&A) is intended to facilitate an understanding of Applied’s business and results of operations. This MD&A should be read in conjunction with Applied’s Consolidated Financial Statements and the accompanying Notes to Consolidated Financial Statements included elsewhere in this Form 10-K. The following discussion contains forward-looking statements and should also be read in conjunction with the cautionary statement set forth at the beginning of this Form 10-K. MD&A consists of the following sections:
| • | | Overview:a summary of Applied’s business and measurements
|
| • | | Results of Operations:a discussion of operating results.
|
| • | | Segment Information:a discussion of segment operating results.
|
| • | | Financial Condition, Liquidity and Capital Resources:an analysis of cash flows, sources and uses of cash, contractual obligations and financial position.
|
| • | | Critical Accounting Policies:a discussion of critical accounting policies that require the exercise of judgments and estimates.
|
Overview: a summary of Applied’s business and measurements
Results of Operations: a discussion of operating results
Segment Information: a discussion of segment operating results
Business Combinations: a summary of announced or completed business combinations and acquisitions
Recent Accounting Pronouncements: a discussion of new accounting pronouncements and its impact to Applied's consolidated financial statements
Financial Condition, Liquidity and Capital Resources: an analysis of cash flows, sources and uses of cash, contractual obligations and financial position
Off-Balance Sheet Arrangements and Contractual Obligations
Critical Accounting Policies and Estimates: a discussion of critical accounting policies that require the exercise of judgments and estimates
Non-GAAP Adjusted Results: a presentation of results reconciling GAAP to non-GAAP adjusted measures
Applied provides manufacturing equipment, services and software to the global semiconductor, flat panel display, solar photovoltaic (PV) and related industries. Applied’s customers include manufacturers of semiconductor wafers and chips, flat panel liquid crystal
and other displays,
(LCDs), solar PV cells and modules, and other electronic devices. These customers may use what they manufacture in their own end products or sell the items to other companies for use in advanced electronic components. Applied operates in four reportable segments: Silicon Systems Group, Applied Global Services, Display, and Energy and Environmental Solutions. A summary of financial information for each reportable segment is found in Note 16 of Notes to Consolidated Financial Statements. A discussion of factors that could affect Applied’s operations is set forth under “Risk Factors” in
Part I, Item 1A, which is incorporated herein by reference. Product development and manufacturing activities occur primarily in
North America,the United States, Europe, Israel, and Asia. Applied’s broad range of equipment and service products are highly technical and are sold primarily through a direct sales force.
Applied’s results
historically have beenare driven primarily by worldwide demand for semiconductors, which in turn depends on end-user demand for electronic products. Each of Applied’s businesses is subject to
highly cyclical industry conditions, as demand for manufacturing equipment and services can change depending on supply and demand for chips,
LCDs,display technologies, solar PVs and other electronic devices, as well as other factors, such as global economic and market conditions, and
the nature and timing of technological advances in fabrication processes.
In addition, a significant driver in the semiconductor and display industries is end-demand for mobile consumer products, which is characterized by seasonality that impacts the timing of customer investments in manufacturing equipment and, in turn, Applied's business. In light of these conditions, Applied's results can vary significantly year-over-year, as well as quarter-over-quarter.
Applied's strategic priorities for fiscal 2015 include growing its presence in wafer fab and display equipment and services, and improving profitability in solar, as well as expanding Applied's overall available market.
On September 24, 2013, Applied announced an agreement with Tokyo Electron Limited (TEL), a Japanese corporation and global supplier of semiconductor, and flat panel display production equipment, and provider of technical support and services for semiconductor, flat panel display and PV panel production equipment, to effect a combination of their respective businesses into a new combined company. The combination is expected to bring together leading technologies and products and create an expanded set of capabilities in precision materials engineering and patterning. In June 2014, the shareholders of Applied and TEL approved the proposed business combination. Under the agreement, which was amended February 14, 2014, the closing of the transaction is subject to customary conditions, including regulatory approvals.
Results of Operations
The following table presents certain significant measurements for the past three fiscal years:
| | | | | | | | | | | | | | | | | | | | |
| | | | | | | | | | | | Change | |
Fiscal Year | | 2011 | | | 2010 | | | 2009 | | | 2011 over 2010 | | | 2010 over 2009 | |
| | | (In millions, except per share amounts and percentages) | |
New orders | | $ | 10,142 | | | $ | 10,249 | | | $ | 4,097 | | | $ | (107 | ) | | $ | 6,152 | |
Net sales | | $ | 10,517 | | | $ | 9,549 | | | $ | 5,014 | | | $ | 968 | | | $ | 4,535 | |
Gross margin | | $ | 4,360 | | | $ | 3,715 | | | $ | 1,431 | | | $ | 645 | | | $ | 2,284 | |
Gross margin percent | | | 41 | % | | | 39 | % | | | 29 | % | | | 2 points | | | | 10 points | |
Operating income (loss) | | $ | 2,398 | | | $ | 1,384 | | | $ | (394 | ) | | $ | 1,014 | | | $ | 1,778 | |
Operating margin percent | | | 23 | % | | | 14 | % | | | (8 | )% | | | 9 points | | | | 22 points | |
Net income (loss) | | $ | 1,926 | | | $ | 938 | | | $ | (305 | ) | | $ | 988 | | | $ | 1,243 | |
Earnings (loss) per diluted share | | $ | 1.45 | | | $ | 0.70 | | | $ | (0.23 | ) | | $ | 0.75 | | | $ | 0.93 | |
|
| | | | | | | | | | | | | | | | | | | |
| | | | | | | | Change |
| Fiscal Year | 2014 | | 2013 | | 2012 | | 2014 over 2013 | | 2013 over 2012 |
| | | | | | | | | | |
| | (In millions, except per share amounts and percentages) |
| New orders | $ | 9,648 |
| | $ | 8,466 |
| | $ | 8,037 |
| | $ | 1,182 |
| | $ | 429 |
|
| Net sales | $ | 9,072 |
| | $ | 7,509 |
| | $ | 8,719 |
| | $ | 1,563 |
| | $ | (1,210 | ) |
| Gross margin | $ | 3,843 |
| | $ | 2,991 |
| | $ | 3,313 |
| | $ | 852 |
| | $ | (322 | ) |
| Gross margin percent | 42.4 | % | | 39.8 | % | | 38.0 | % | | 2.6 points | | 1.8 points |
| Operating income | $ | 1,520 |
| | $ | 432 |
| | $ | 411 |
| | $ | 1,088 |
| | $ | 21 |
|
| Operating margin | 16.8 | % | | 5.8 | % | | 4.7 | % | | 11.0 points | | 1.1 points |
Net income(1) | $ | 1,072 |
| | $ | 256 |
| | $ | 109 |
| | $ | 816 |
| | $ | 147 |
|
Earnings per diluted share(1) | $ | 0.87 |
| | $ | 0.21 |
| | $ | 0.09 |
| | $ | 0.66 |
| | $ | 0.12 |
|
| Non-GAAP Adjusted Results | | | | | | | | | |
| Non-GAAP adjusted gross margin | $ | 4,002 |
| | $ | 3,160 |
| | $ | 3,566 |
| | $ | 842 |
| | $ | (406 | ) |
| Non-GAAP adjusted gross margin percent | 44.1 | % | | 42.1 | % | | 40.9 | % | | 2.0 points | | 1.2 points |
| Non-GAAP adjusted operating income | $ | 1,781 |
| | $ | 1,032 |
| | $ | 1,379 |
| | $ | 749 |
| | $ | (347 | ) |
| Non-GAAP adjusted operating margin percent | 19.6 | % | | 13.7 | % | | 15.8 | % | | 5.9 points | | (2.1) points |
| Non-GAAP adjusted net income | $ | 1,314 |
| | $ | 718 |
| | $ | 960 |
| | $ | 596 |
| | $ | (242 | ) |
| Non-GAAP adjusted earnings per diluted share | $ | 1.07 |
| | $ | 0.59 |
| | $ | 0.75 |
| | $ | 0.48 |
| | $ | (0.16 | ) |
| |
| (1) | Fiscal 2014 amount differs from the unaudited consolidated financial statements included in Applied’s press release issued on November 13, 2014, reflecting an increase to provision for income taxes of $34 million and a decrease to earnings per diluted share of $0.03. This adjustment is not considered material and does not affect Applied’s previously announced Non-GAAP Adjusted Results. |
Reconciliations of non-GAAP adjusted measures are presented under "Non-GAAP Adjusted Results" below. Fiscal 20112014, 2013 and 20092012 each contained 52 weeks each, whileweeks.
Mobility, including the increasing technological functionality of mobile devices, continued to be the largest driver of semiconductor industry spending in fiscal
2010 contained 53 weeks.Financial results2014. During the year, demand for fiscal 2011 over fiscal 2010 reflected a decrease in total new orders, while net sales increased to a record level and net income also increased. The decline in new orders reflected softeningadvanced mobile chips drove continued demand for semiconductor LCD and solar equipment in the second half of the year. The semiconductor industry was negatively impacted by uncertainty in the macroeconomic environment whereas the LCD and solar equipment industries were negatively impacted by overcapacity.foundry customers. In the fourth quarter of fiscal 2011, new orders were $1.6 billion, down 33 percent from the prior quarter. For fiscal 2011, net sales increased year-over-year primarily due to increased industry investment in crystalline-silicon (c-Si) solar equipment and higher sales of spares and refurbished semiconductor equipment. Operating income for fiscal 2011 included favorable adjustments to restructuring reserves of $60 million, offset in part by asset impairment charges of $30 million, and a net gain on sale of facilities of $27 million. In fiscal 2010, Applied incurred charges totaling $486 million that included a plan to restructure its Energy and Environmental Solutions segment.
Financial results for fiscal 2010 over fiscal 2009 reflected significantly increased demand for manufacturing equipment and services due to more favorable global economic and industry conditions. The increase in total orders from fiscal 2009 was primarily due to increasedaddition, demand for semiconductor equipment from memory customers improved as manufacturers invested in technology upgrades. Mobility also represents a significant driver of display industry spending, which has resulted in continued manufacturing capacity expansion for mobile applications. Demand for larger LCD TVs is also driving investment in display equipment, although the TV manufacturing sector remains susceptible to cyclical conditions. Investment in solar equipment remained low during fiscal 2014, despite continued end-market growth, due to ongoing excess manufacturing capacity in the industry.
Applied expects the mobility trend to remain the main growth driver for the semiconductor industry, and c-Si solar PV products, partially offsetin turn for the Silicon Systems Group, in 2015. The growth in the semiconductor manufacturing equipment industry is expected to be driven by decreasedfoundry and memory spending. Applied also expects display equipment investment to remain healthy in 2015.
Fiscal 2013 was characterized by strong demand for
SunFab™ thin film solar lines. Net sales increased during fiscal 2010 compared to fiscal 2009, due primarily to higher sales of semiconductor
and display equipment. In fiscal 2010, Applied incurred charges totaling $486 million that included a plan to restructure its Energy and Environmental Solutions segment, consisting of inventory-related charges of $330 million related to SunFab thin film solar equipment
asset impairment charges of $108 million, employee severance charges of $45 million, and other costs of $3 million. This action was in response to adverse market conditions for thin film solar, including delays in utility-scale solar adoption, solar panel manufacturers’ challenges in obtaining affordable capital, changes and uncertainty in government renewable energy policies, and competitive pressure from
c-Si solar technologies. As part of the restructuring, Applied discontinued sales to newfoundry customers
of its fully-integrated SunFab lines but continued to offer individual tools for thin film solar manufacturing. Applied is supporting existing SunFab customers with services, upgrades and capacity increases through its Applied Global Services segment and is continuing RD&E efforts to improve thin film panel efficiency and high-productivity deposition. Also in fiscal 2010, Applied incurred charges totaling $84 million associated with a restructuring program to reduce its global workforce as of October 25, 2009driven by
approximately 1,000 positions over a period of 18 months.Fiscal 2009 financial results reflected significantly reduced demand for manufacturing equipment and services due to extremely unfavorable global economic and industry conditions, particularly in the first half of fiscal 2009. Negative trends in consumer spending and pervasive economic uncertainty led some customers to dramatically reduce factory operations and to reduce their spending.advanced mobile chips. In the second half of fiscal 2009,2013, demand from foundry customers softened, reflecting seasonal consumer buying patterns for mobility products, while demand from memory and logic customers improved. Mobility also represented a significant driver of display industry spending, and demand for mobile display equipment remained strong during fiscal 2013. Fiscal 2013 was also characterized by a recovery in demand for TV manufacturing equipment compared to weak industry levels in fiscal 2012, resulting from higher consumer demand in emerging markets and for larger LCD TVs. Investment in solar equipment remained low during fiscal 2013 due to continued excess manufacturing capacity in the industry.
Fiscal 2012 was characterized by significant fluctuations in demand for semiconductor
equipment, coupled with an extremely weak market environment for display and
display equipment increased, but was still down significantly from fiscal 2008 levels. Fiscal 2009 financial results included charges associated with restructuring programs.In November 2011,solar equipment. Applied completed its acquisition of Varian Semiconductor Equipment Associates, Inc. (Varian) for an aggregate purchase pricein the first quarter of approximately $4.2 billion, net of cash acquired. The acquisition enhances Applied’s product portfolio with market-leading ion implantation technology and is expected to enable Applied to becomefiscal 2012. Mobility was the greatest influence on semiconductor industry leader in transistor technologies.
Results of Operations
The following table presents certain quarterly and full fiscal year financial information:
| | | | | | | | | | | | | | | | | | | | |
| | | Fiscal Quarter | | | Fiscal
Year | |
| | | First | | | Second | | | Third | | | Fourth | | |
| | | (In millions, except per share amounts) | |
2011: | | | | | | | | | | | | | | | | | | | | |
New orders | | $ | 2,971 | | | $ | 3,185 | | | $ | 2,390 | | | $ | 1,596 | | | $ | 10,142 | |
Net sales | | $ | 2,686 | | | $ | 2,862 | | | $ | 2,787 | | | $ | 2,182 | | | $ | 10,517 | |
Gross margin | | $ | 1,136 | | | $ | 1,189 | | | $ | 1,184 | | | $ | 852 | | | $ | 4,360 | |
Operating income | | $ | 674 | | | $ | 677 | | | $ | 687 | | | $ | 361 | | | $ | 2,398 | |
Net income | | $ | 506 | | | $ | 489 | | | $ | 476 | | | $ | 456 | | | $ | 1,926 | |
Earnings per diluted share | | $ | 0.38 | | | $ | 0.37 | | | $ | 0.36 | | | $ | 0.34 | | | $ | 1.45 | |
2010: | | | | | | | | | | | | | | | | | | | | |
New orders | | $ | 1,965 | | | $ | 2,533 | | | $ | 2,725 | | | $ | 3,026 | | | $ | 10,249 | |
Net sales | | $ | 1,849 | | | $ | 2,296 | | | $ | 2,518 | | | $ | 2,886 | | | $ | 9,549 | |
Gross margin | | $ | 711 | | | $ | 927 | | | $ | 860 | | | $ | 1,217 | | | $ | 3,715 | |
Operating income | | $ | 116 | | | $ | 386 | | | $ | 183 | | | $ | 699 | | | $ | 1,384 | |
Net income | | $ | 83 | | | $ | 264 | | | $ | 123 | | | $ | 468 | | | $ | 938 | |
Earnings per diluted share | | $ | 0.06 | | | $ | 0.20 | | | $ | 0.09 | | | $ | 0.35 | | | $ | 0.70 | |
2009: | | | | | | | | | | | | | | | | | | | | |
New orders | | $ | 903 | | | $ | 649 | | | $ | 1,072 | | | $ | 1,473 | | | $ | 4,097 | |
Net sales | | $ | 1,333 | | | $ | 1,020 | | | $ | 1,134 | | | $ | 1,526 | | | $ | 5,014 | |
Gross margin | | $ | 392 | | | $ | 156 | | | $ | 325 | | | $ | 559 | | | $ | 1,431 | |
Operating income (loss) | | $ | (196 | ) | | $ | (293 | ) | | $ | (77 | ) | | $ | 173 | | | $ | (394 | ) |
Net income (loss) | | $ | (133 | ) | | $ | (255 | ) | | $ | (55 | ) | | $ | 138 | | | $ | (305 | ) |
Earnings (loss) per diluted share | | $ | (0.10 | ) | | $ | (0.19 | ) | | $ | (0.04 | ) | | $ | 0.10 | | | $ | (0.23 | ) |
Demand for manufacturing equipment historically has been volatile as a result of sudden changes in chip, LCD, and solar PV supply and demand and other factors, including global economic and market conditions and rapid technological advances in fabrication processes. Applied’s business was subject to cyclical industry conditionsspending in fiscal 2011, 2010 and 2009. As a result of these conditions and the changing global economic environment, there2012. Investment levels for display equipment were significant fluctuationslow in Applied’s quarterly new orders and net sales, both within and across the three fiscal years. As of the end of fiscal 2011, the semiconductor, display and solar equipment industries were each in a capacity-driven downturn. The nature and timing of a recovery in capital equipment investment are expected to depend largely on the macroeconomic environment.
New Orders
New orders by geographic region, which are attributed according to the location of customers’ facilities, were as follows:
| | | | | | | | | | | | | | | | | | | | | | | | | | | | | | | | |
| | | 2011 | | | Change
2011 over 2010 | | | 2010 | | | Change
2010 over 2009 | | | 2009 | |
| | | ($) | | | (%) | | | (%) | | | ($) | | | (%) | | | (%) | | | ($) | | | (%) | |
| | | (In millions, except percentages) | |
Taiwan | | | 2,235 | | | | 22 | | | | (19 | ) | | | 2,760 | | | | 27 | | | | 342 | | | | 625 | | | | 15 | |
China | | | 2,066 | | | | 20 | | | | (4 | ) | | | 2,155 | | | | 21 | | | | 188 | | | | 749 | | | | 18 | |
Korea | | | 1,286 | | | | 13 | | | | (25 | ) | | | 1,703 | | | | 17 | | | | 205 | | | | 559 | | | | 14 | |
Japan | | | 1,001 | | | | 10 | | | | 35 | | | | 741 | | | | 7 | | | | 40 | | | | 531 | | | | 13 | |
Southeast Asia | | | 463 | | | | 5 | | | | (31 | ) | | | 675 | | | | 7 | | | | 173 | | | | 247 | | | | 6 | |
| | | | | | | | | | | | | | | | | | | | | | | | | | | | | | | | |
Asia Pacific | | | 7,051 | | | | 70 | | | | (12 | ) | | | 8,034 | | | | 79 | | | | 196 | | | | 2,711 | | | | 66 | |
North America(*) | | | 2,069 | | | | 20 | | | | 54 | | | | 1,348 | | | | 13 | | | | 90 | | | | 711 | | | | 17 | |
Europe | | | 1,022 | | | | 10 | | | | 18 | | | | 867 | | | | 8 | | | | 28 | | | | 675 | | | | 17 | |
| | | | | | | | | | | | | | | | | | | | | | | | | | | | | | | | |
Total | | | 10,142 | | | | 100 | | | | (1 | ) | | | 10,249 | | | | 100 | | | | 150 | | | | 4,097 | | | | 100 | |
| | | | | | | | | | | | | | | | | | | | | | | | | | | | | | | | |
(*) | Primarily the United States. |
New orders of $10.1 billion for fiscal 2011 were down 1 percent from fiscal 2010. The decrease was primarily attributable2012 due to decreased capacity requirements for larger flat panel televisions, while demand for semiconductormobility products, such as smartphones and tablets, significantly influenced equipment from memory customers and decreasedspending. In the solar industry, fiscal 2012 was characterized by excess manufacturing capacity, which led to significantly reduced demand for LCDcrystalline-silicon (c-Si) equipment, partially offset by increased demand for touch panel tools from display customers and increased demand for c-Si equipment from solar manufacturers. Customers in China and Taiwan together represented 42 percent of total new orders for fiscal 2011.
From fiscal 2009 to fiscal 2010, new orders more than doubled to $10.2 billion. The increase was principally due to greater demand for semiconductor equipment and services, primarily from memory and foundry customers, as well as increased demand for c-Si solar manufacturing productsweak operating performance and display equipment. The increase in new orders reflected the general recovery in the semiconductor equipment industry and the LCD market from the steep downturn experienced in fiscal 2009. Customers in Taiwan and China together represented 48 percent of total new orders for fiscal 2010.
outlook.
New
orders decreased 55 percent to $4.1 billion in fiscal 2009 compared to fiscal 2008. The decrease in new orders was across all segments, and particularly in the semiconductor and display businesses, reflecting the challenging economic and industry conditions prevalent during fiscal 2009. Customer demand for semiconductor and LCD equipment began to recover in the second half of fiscal 2009. Customers in China, North America, and Europe combined represented 52 percent of total new orders for fiscal 2009.Orders
New orders by reportable segment for the past three fiscal years were as follows:
| | | | | | | | | | | | | | | | | | | | | | | | | | | | | | | | |
| | | 2011 | | | Change
2011 over 2010 | | | 2010 | | | Change
2010 over 2009 | | | 2009 | |
| | | ($) | | | (%) | | | (%) | | | ($) | | | (%) | | | (%) | | | ($) | | | (%) | |
| | | (In millions, except percentages) | |
Silicon Systems Group | | | 5,489 | | | | 54 | | | | (5 | ) | | | 5,759 | | | | 56 | | | | 243 | | | | 1,677 | | | | 41 | |
Applied Global Services | | | 2,333 | | | | 23 | | | | 7 | | | | 2,183 | | | | 21 | | | | 85 | | | | 1,179 | | | | 29 | |
Display | | | 636 | | | | 6 | | | | (20 | ) | | | 799 | | | | 8 | | | | 178 | | | | 287 | | | | 7 | |
Energy and Environmental Solutions | | | 1,684 | | | | 17 | | | | 12 | | | | 1,508 | | | | 15 | | | | 58 | | | | 955 | | | | 23 | |
| | | | | | | | | | | | | | | | | | | | | | | | | | | | | | | | |
Total | | | 10,142 | | | | 100 | | | | (1 | ) | | | 10,249 | | | | 100 | | | | 150 | | | | 4,098 | | | | 100 | |
| | | | | | | | | | | | | | | | | | | | | | | | | | | | | | | | |
For
|
| | | | | | | | | | | | | | | | | | | | | |
| | 2014 | | Change
2014 over 2013 | | 2013 | | Change
2013 over 2012 | | 2012 |
| | | | | | | | | | | | | | | | |
| | (In millions, except percentages) |
| Silicon Systems Group | $ | 6,132 |
| | 64% | | 11% | | $ | 5,507 |
| | 65% | | 4% | | $ | 5,294 |
| | 66% |
| Applied Global Services | 2,433 |
| | 25% | | 16% | | 2,090 |
| | 25% | | (8)% | | 2,274 |
| | 28% |
| Display | 845 |
| | 9% | | 20% | | 703 |
| | 8% | | 157% | | 274 |
| | 4% |
| Energy and Environmental Solutions | 238 |
| | 2% | | 43% | | 166 |
| | 2% | | (15)% | | 195 |
| | 2% |
| Total | $ | 9,648 |
| | 100% | | 14% | | $ | 8,466 |
| | 100% | | 5% | | $ | 8,037 |
| | 100% |
New orders increased in fiscal 2011 as compared2014 from fiscal 2013 across all segments, primarily due to fiscal 2010, new orders by segment as well as the relative share of total newhigher demand for semiconductor equipment, semiconductor spares and services, and display equipment. New orders for the Silicon Systems Group and Display decreased, whileApplied Global Services continued to comprise a majority of Applied's consolidated total new orders.
New orders
for fiscal 2013 increased compared to fiscal 2012, primarily due to a recovery in demand for display manufacturing equipment and increased demand in semiconductor equipment, partially offset by
segmentlower demand for service products, as well as
depressed demand for c-Si solar equipment due to excess manufacturing capacity in the
relativeshare ofsolar industry.
New orders by geographic region, determined by the product shipment destination specified by the customer, were as follows:
|
| | | | | | | | | | | | | | | | | | | | | |
| | 2014 | | Change
2014 over 2013 | | 2013 | | Change
2013 over 2012 | | 2012 |
| | | | | | | | | | | | | | | | |
| | (In millions, except percentages) |
| Taiwan | $ | 2,740 |
| | 28% | | (5)% | | $ | 2,885 |
| | 34% | | 34% | | $ | 2,155 |
| | 27% |
| China | 1,517 |
| | 16% | | 13% | | 1,339 |
| | 16% | | 232% | | 403 |
| | 5% |
| Korea | 1,086 |
| | 11% | | 19% | | 915 |
| | 11% | | (49)% | | 1,784 |
| | 22% |
| Japan | 1,031 |
| | 11% | | 25% | | 822 |
| | 10% | | 37% | | 600 |
| | 7% |
| Southeast Asia | 412 |
| | 4% | | 17% | | 351 |
| | 4% | | 24% | | 283 |
| | 4% |
| Asia Pacific | 6,786 |
| | 70% | | 8% | | 6,312 |
| | 75% | | 21% | | 5,225 |
| | 65% |
| United States | 2,200 |
| | 23% | | 55% | | 1,419 |
| | 17% | | (29)% | | 1,995 |
| | 25% |
| Europe | 662 |
| | 7% | | (10)% | | 735 |
| | 8% | | (10)% | | 817 |
| | 10% |
| Total | $ | 9,648 |
| | 100% | | 14% | | $ | 8,466 |
| | 100% | | 5% | | $ | 8,037 |
| | 100% |
The changes in new orders from customers in Applied Global Servicesthe United States, Japan, Taiwan and Energy and Environmental Solutions increased. ForKorea for fiscal 2010 as2014 compared to fiscal 2009, new orders increased2013 primarily reflected changes in all segments, with the relative share of total new orders increasing significantly forcustomers mix in the Silicon Systems Group, while the relative shareincrease in new orders from China resulted from increased demand from display manufacturing equipment.
The recovery in demand for display manufacturing equipment in fiscal 2013 led to the increase in new orders from customers in China. The change in the composition of new orders
from customers in
Applied Global ServicesTaiwan, Korea, Japan and
Energy and Environmental Solutions decreased by 8 percentage points each.Applied’s backlogthe United States was $2.4 billion at October 30, 2011 as comparedprimarily related to $3.2 billion at October 31, 2010. Backlog adjustments were negative for fiscal 2011 and totaled $504 million, consisting primarily of orders with revised shipment dates outside of Applied’s order policy and included $124 millionchanges in customer cancellations. Backlog decreased in fiscal 2011 from fiscal 2010 primarily due to decreases in new orders for the Silicon Systems Group and Display, reflecting decreased demand for semiconductor equipmentequipment.
Changes in backlog during fiscal 2014 and a weaker LCD market, respectively. 2013 were as follows:
|
| | | | | | | |
| | 2014 | | 2013 |
| | (In millions) |
| Beginning balance | $ | 2,372 |
| | $ | 1,606 |
|
| New orders | 9,648 |
| | 8,466 |
|
| Net sales | (9,072 | ) | | (7,509 | ) |
| Net adjustments | (31 | ) | | (191 | ) |
| Ending balance | $ | 2,917 |
| | $ | 2,372 |
|
Backlog consists of: (1) orders for which written authorizations have been accepted and assigned shipment dates are within the next 12 months, or shipment has occurred but revenue has not been recognized; and (2) contractual service revenue and maintenance fees to be earned within the next 12 months; and (3) orders for SunFab lines that are anticipated to be recognized as revenue within the next 12 months. Applied’s backlog at any particular time is not necessarily indicative of actual sales for any future periods, due to the potential for customer changes in delivery schedules or cancellation of orders. Approximately 80 percent of the backlog as of the end of fiscal 2014 is anticipated to be shipped within the first two quarters of fiscal 2015.
Applied’s backlog was $2.9 billion at October 26, 2014 compared to $2.4 billion at October 27, 2013. Backlog adjustments were negative for fiscal 2014 and totaled $31 million, consisting of financial debookings, foreign exchange and other adjustments.
Backlog by reportable segment as of October 26, 2014 and October 27, 2013 was as follows:
|
| | | | | | | | | | | | | |
| | 2014 | | Change
2014 over 2013 | | 2013 |
| | | | | | | | | | |
| | (In millions, except percentages) |
| Silicon Systems Group | $ | 1,400 |
| | 48% | | 8% | | $ | 1,295 |
| | 55% |
| Applied Global Services | 775 |
| | 27% | | 31% | | 591 |
| | 25% |
| Display | 593 |
| | 20% | | 64% | | 361 |
| | 15% |
| Energy and Environmental Solutions | 149 |
| | 5% | | 19% | | 125 |
| | 5% |
| Total | $ | 2,917 |
| | 100% | | 23% | | $ | 2,372 |
| | 100% |
Backlog increased in fiscal 2014 from fiscal 2013 across all segments. The increase in backlog was primarily due to increases in demand for display manufacturing equipment and semiconductor spares and services. In the fourth quarter of fiscal
2011,2014 approximately
4544 percent of net sales in the Silicon Systems Group, Applied’s largest business segment, were for orders received and shipped within the
quarter.Backlog by reportable segment asquarter, down from 49 percent in the fourth quarter of October 30, 2011 and October 31, 2010 was as follows:
| | | | | | | | | | | | | | | | | | | | |
| | | 2011 | | | Change
2011 over 2010 | | | 2010 | |
| | | ($) | | | (%) | | | (%) | | | ($) | | | (%) | |
| | | (In millions, except percentages) | |
Silicon Systems Group | | | 913 | | | | 38 | | | | (17 | ) | | | 1,099 | | | | 34 | |
Applied Global Services | | | 662 | | | | 28 | | | | (15 | ) | | | 779 | | | | 24 | |
Display | | | 337 | | | | 14 | | | | (33 | ) | | | 505 | | | | 16 | |
Energy and Environmental Solutions | | | 480 | | | | 20 | | | | (44 | ) | | | 861 | | | | 26 | |
| | | | | | | | | | | | | | | | | | | | |
Total | | | 2,392 | | | | 100 | | | | (26 | ) | | | 3,244 | | | | 100 | |
| | | | | | | | | | | | | | | | | | | | |
fiscal 2013.
Net Sales
Net sales by geographic region, which are attributed according to the location of customers’ facilities, were as follows:
| | | | | | | | | | | | | | | | | | | | | | | | | | | | | | | | |
| | | 2011 | | | Change
2011 over 2010 | | | 2010 | | | Change
2010 over 2009 | | | 2009 | |
| | | ($) | | | (%) | | | (%) | | | ($) | | | (%) | | | (%) | | | ($) | | | (%) | |
| | | (In millions, except percentages) | |
China | | | 2,574 | | | | 24 | | | | 65 | | | | 1,557 | | | | 16 | | | | 145 | | | | 635 | | | | 13 | |
Taiwan | | | 2,093 | | | | 20 | | | | (24 | ) | | | 2,750 | | | | 29 | | | | 168 | | | | 1,026 | | | | 21 | |
Korea | | | 1,263 | | | | 12 | | | | (29 | ) | | | 1,768 | | | | 19 | | | | 166 | | | | 664 | | | | 13 | |
Japan | | | 912 | | | | 9 | | | | 19 | | | | 768 | | | | 8 | | | | 7 | | | | 718 | | | | 14 | |
Southeast Asia | | | 592 | | | | 5 | | | | 2 | | | | 578 | | | | 6 | | | | 129 | | | | 252 | | | | 5 | |
| | | | | | | | | | | | | | | | | | | | | | | | | | | | | | | | |
Asia Pacific | | | 7,434 | | | | 70 | | | | — | | | | 7,421 | | | | 78 | | | | 125 | | | | 3,295 | | | | 66 | |
North America(*) | | | 1,963 | | | | 19 | | | | 72 | | | | 1,147 | | | | 12 | | | | 19 | | | | 966 | | | | 19 | |
Europe | | | 1,120 | | | | 11 | | | | 14 | | | | 981 | | | | 10 | | | | 30 | | | | 753 | | | | 15 | |
| | | | | | | | | | | | | | | | | | | | | | | | | | | | | | | | |
Total | | | 10,517 | | | | 100 | | | | 10 | | | | 9,549 | | | | 100 | | | | 90 | | | | 5,014 | | | | 100 | |
| | | | | | | | | | | | | | | | | | | | | | | | | | | | | | | | |
(*) | Primarily the United States. |
Net sales of $10.5 billion for fiscal 2011 increased 10 percent from fiscal 2010, primarily due to increased industry investment in c-Si solar equipment and higher sales of spares and refurbished semiconductor equipment.
Customers in China, North America, and Taiwan combined represented 63 percent of total net sales in fiscal 2011. Net sales of $9.5 billion for fiscal 2010 increased 90 percent from fiscal 2009, primarily due to higher sales of semiconductor equipment. Customers in Taiwan and Korea combined represented 48 percent of total net sales in fiscal 2010. Net sales decreased 38 percent to $5.0 billion in fiscal 2009 compared to fiscal 2008, as a result of significantly lower sales of equipment and services to semiconductor and display customers, partially offset by increased sales of solar manufacturing equipment. Customers in Taiwan and North America combined represented 40 percent of total net sales in fiscal 2009.
Net sales by reportable segment for the past three fiscal years were as follows:
| | | | | | | | | | | | | | | | | | | | | | | | | | | | | | | | |
| | | 2011 | | | Change
2011 over 2010 | | | 2010 | | | Change
2010 over 2009 | | | 2009 | |
| | | ($) | | | (%) | | | (%) | | | ($) | | | (%) | | | (%) | | | ($) | | | (%) | |
| | | (In millions, except percentages) | |
Silicon Systems Group | | | 5,415 | | | | 51 | | | | 2 | | | | 5,304 | | | | 56 | | | | 171 | | | | 1,960 | | | | 39 | |
Applied Global Services | | | 2,413 | | | | 23 | | | | 29 | | | | 1,865 | | | | 20 | | | | 34 | | | | 1,397 | | | | 28 | |
Display | | | 699 | | | | 7 | | | | (22 | ) | | | 899 | | | | 9 | | | | 79 | | | | 502 | | | | 10 | |
Energy and Environmental Solutions | | | 1,990 | | | | 19 | | | | 34 | | | | 1,481 | | | | 15 | | | | 28 | | | | 1,155 | | | | 23 | |
| | | | | | | | | | | | | | | | | | | | | | | | | | | | | | | | |
Total | | | 10,517 | | | | 100 | | | | 10 | | | | 9,549 | | | | 100 | | | | 90 | | | | 5,014 | | | | 100 | |
| | | | | | | | | | | | | | | | | | | | | | | | | | | | | | | | |
|
| | | | | | | | | | | | | | | | | | | | | |
| | 2014 | | Change
2014 over 2013 | | 2013 | | Change
2013 over 2012 | | 2012 |
| | | | | | | | | | | | | | | | |
| | (In millions, except percentages) |
| Silicon Systems Group | $ | 5,978 |
| | 66% | | 25% | | $ | 4,775 |
| | 64% | | (14)% | | $ | 5,536 |
| | 64% |
| Applied Global Services | 2,200 |
| | 24% | | 9% | | 2,023 |
| | 27% | | (11)% | | 2,285 |
| | 26% |
| Display | 615 |
| | 7% | | 14% | | 538 |
| | 7% | | 14% | | 473 |
| | 5% |
| Energy and Environmental Solutions | 279 |
| | 3% | | 61% | | 173 |
| | 2% | | (59)% | | 425 |
| | 5% |
| Total | $ | 9,072 |
| | 100% | | 21% | | $ | 7,509 |
| | 100% | | (14)% | | $ | 8,719 |
| | 100% |
Net sales for all segments increased in fiscal 2014 compared to fiscal 2013. The increase primarily reflected increased customer investments in semiconductor and display equipment, as well as semiconductor spares and services. The Silicon Systems Group remains the largest contributor of net sales.
For fiscal 20112013 as compared to fiscal 2010,2012, net sales in Display increased, reflecting the Silicon Systems Group remained essentially flatrecovery of TV manufacturing equipment investment, while net sales across all other segments decreased. The decrease primarily reflected continued excess manufacturing capacity in Energythe solar industry and Environment Solutionslower investments in semiconductor equipment, spares and Applied Global Servicesservices.
Net sales by geographic region, determined by the location of customers' facilities to which products were shipped, were as follows:
|
| | | | | | | | | | | | | | | | | | | | | |
| | 2014 | | Change
2014 over 2013 | | 2013 | | Change
2013 over 2012 | | 2012 |
| | | | | | | | | | | | | | | | |
| | (In millions, except percentages) |
| Taiwan | $ | 2,702 |
| | 30% | | 2% | | $ | 2,640 |
| | 35% | | 9% | | $ | 2,411 |
| | 28% |
| China | 1,608 |
| | 18% | | 104% | | 787 |
| | 11% | | 1% | | 783 |
| | 9% |
| Korea | 965 |
| | 10% | | 4% | | 924 |
| | 12% | | (51)% | | 1,897 |
| | 22% |
| Japan | 817 |
| | 9% | | 19% | | 685 |
| | 9% | | (3)% | | 704 |
| | 8% |
| Southeast Asia | 356 |
| | 4% | | 11% | | 320 |
| | 4% | | 3% | | 312 |
| | 3% |
| Asia Pacific | 6,448 |
| | 71% | | 20% | | 5,356 |
| | 71% | | (12)% | | 6,107 |
| | 70% |
| United States | 1,966 |
| | 22% | | 33% | | 1,473 |
| | 20% | | (16)% | | 1,749 |
| | 20% |
| Europe | 658 |
| | 7% | | (3)% | | 680 |
| | 9% | | (21)% | | 863 |
| | 10% |
| Total | $ | 9,072 |
| | 100% | | 21% | | $ | 7,509 |
| | 100% | | (14)% | | $ | 8,719 |
| | 100% |
Net sales from customers in China increased for fiscal 2014 compared to fiscal 2013 primarily due to greater investments in semiconductor, display and solar manufacturing equipment, while net sales from customers in the United States increased due to increased demand for c-Si equipment, and spare parts and refurbished equipment, respectively. Net saleshigher investments in Display reflected a decrease during fiscal 2011 as compared to fiscal 2010 due to a weaker LCD market. For fiscal 2011 as compared to fiscal 2010, the relative share of total net sales in the Silicon Systems Group decreased, while the relative share of total net sales in Energy and Environmental Solutions increased. semiconductor equipment.
The increase in
Energy and Environmental Solutions’ relative share of total net sales
from customers in China in fiscal 2013 was
primarily due to
increasedthe recovery in demand for
c-Sidisplay manufacturing equipment.
The changes in net sales from customers in Korea, the United States and Taiwan were primarily related to changes in customer demand for semiconductor equipment.
Gross margins for the past three fiscal years were as follows:
| | | | | | | | | | | | | | | | | | | | |
| | | | | | | | | | | | Change | |
| | | 2011 | | | 2010 | | | 2009 | | | 2011 over 2010 | | | 2010 over 2009 | |
| | | (In millions, except percentages) | |
Gross margin | | $ | 4,360 | | | $ | 3,715 | | | $ | 1,431 | | | $ | 645 | | | $ | 2,284 | |
Gross margin (% of net sales) | | | 41 | % | | | 39 | % | | | 29 | % | | | 2 points | | | | 10 points | |
The increase in
|
| | | | | | | | | | | | | | | | | | | |
| | | | | | | | Change |
| | 2014 | | 2013 | | 2012 | | 2014 over 2013 | | 2013 over 2012 |
| | | | | | | | | | |
| | (In millions, except percentages) |
| Gross margin | $ | 3,843 |
| | $ | 2,991 |
| | $ | 3,313 |
| | $ | 852 |
| | $ | (322 | ) |
| Gross margin (% of net sales) | 42.4 | % | | 39.8 | % | | 38.0 | % | | 2.6 points | | 1.8 points |
| Non-GAAP Adjusted Results | | | | | | | | | |
| Non-GAAP adjusted gross margin | $ | 4,002 |
| | $ | 3,160 |
| | $ | 3,566 |
| | $ | 842 |
| | $ | (406 | ) |
| Non-GAAP adjusted gross margin (% of net sales) | 44.1 | % | | 42.1 | % | | 40.9 | % | | 2.0 points | | 1.2 points |
Reconciliations of non-GAAP adjusted measures are presented under "Non-GAAP Adjusted Results" below.
Gross margin and non-GAAP gross margin as a percentage of net salesincreased in fiscal 2011 from2014 compared to fiscal 2010 was principally attributable to the absence of inventory-related charges incurred in fiscal 2010 associated with SunFab thin film solar equipment. The increase in gross margin as a percentage of net sales in fiscal 2010 from fiscal 2009 was principally attributable to2013 primarily reflecting higher net sales, morethe recovery of a regional customs duty assessment charge recorded in fiscal 2013, sales of display and solar tools that had been written down previously, lower manufacturing costs and change in product mix.
Gross margin and non-GAAP adjusted gross margin decreased in fiscal 2013 compared to fiscal 2012 primarily reflecting lower sales. Gross margin percent and non-GAAP adjusted gross margin percent increased in fiscal 2013 compared to fiscal 2012 despite lower sales, due primarily to lower inventory charges, a favorable product mix, improved factory utilization, and continuedmaterial cost control measures, offset in part by inventory-related charges of $330 million associated with SunFab thin film solar equipment, which loweredreductions. Gross margin and non-GAAP adjusted gross margin for fiscal 2010 by approximately 3 percentage points. Gross margin during fiscal 2011, 20102014, 2013 and 20092012 included $48$53 million $32, $50 million and $28$54 million, respectively, of share-based compensation expense.
Research, Development and Engineering
Research, Development and Engineering (RD&E) expenses for the past three fiscal years were as follows:
| | | | | | | | | | | | | | | | | | | | |
| | | | | | | | | | | | Change | |
| | | 2011 | | | 2010 | | | 2009 | | | 2011 over 2010 | | | 2010 over 2009 | |
| | | (In millions) | |
Research, development and engineering | | $ | 1,118 | | | $ | 1,143 | | | $ | 934 | | | $ | (25 | ) | | $ | 209 | |
|
| | | | | | | | | | | | | | | | | | | |
| | | | | | | | Change |
| | 2014 | | 2013 | | 2012 | | 2014 over 2013 | | 2013 over 2012 |
| | | | | | | | | | |
| | (In millions) |
| Research, development and engineering | $ | 1,428 |
| | $ | 1,320 |
| | $ | 1,237 |
| | $ | 108 |
| | $ | 83 |
|
Applied’s future operating results depend to a considerable extent on its ability to maintain a competitive advantage in the equipment and service products it provides.
AppliedManagement believes that it is critical to continue to make substantial investments in RD&E to assure the availability of innovative technology that meets the current and projected requirements of its customers’ most advanced designs. Applied
historically has maintained
and intends to continue its commitment to investing in RD&E in order to continue to offer new products and technologies.
RD&E expenses were $1.1 billion (11 percent of net sales) in fiscal 2011, $1.1 billion (12 percent of net sales) in fiscal 2010, and $934 million (19 percent of net sales) in fiscal 2009. RD&E expense during fiscal 2011, 2010 and 2009 included $46 million, $43 million and $50 million, respectively, of share-based compensation expense. Development cycles range from 12 to 36 months depending on whether the product is an enhancement of an existing product, which typically has a shorter development cycle, or a new product, which typically has a longer development cycle. Most of Applied’s existing products resulted from internal development activities and innovations involving new technologies, materials and processes. In certain instances, Applied acquires technologies, either in existing or new product areas, to complement its existing technology capabilities and to reduce time to market.
In fiscal
2011,2014, Applied
developed logic and memory chip technologies to meet the requirements of manufacturing below the 22nm node. These systems were designed to help semiconductor customers continue their drive to pack more transistorsincreased its investments primarily in the
same space using high-k/metal gate technologiesareas of 3D chip technology and
double patterning processes. These technologies include low k dielectrics300mm product development. Applied's 3D RD&E investments were focused on products for overcoming the challenges of FinFET and
curing for interconnect structures3D NAND designs at sub-2x nanometer nodes and
high-k dielectric materials and ALD processes for fabricating transistor gates.enabling cost-effective manufacturing of these high-performance 3D chips. Applied also
focused on processes to help customers builddeveloped new
three-dimensional (3D) gate structures. In addition, Applied continued to focus on optimizing the cost-effectiveness of through-silicon via (TSV) technologies to enable their widespread implementation. TSV technologies permit interconnecting 3D chip stacks to enable better device performance, lower power consumption and the integration of heterogeneous devices. Applied is also investing in other new product development areas such as 450mm wafer systems. In the Display sector, Applied developed deposition systems to enable larger OLED, LCD and touch-enabled displays. In solar, Applied focused on screen printing technology to keep pace with cell manufacturers’ new higher-efficiency cell designs. Another key development area was “smart” capability, which brings a new level of precision and control to the PV production process.In fiscal 2010, Applied developed newapplications for its epitaxial technology to enable the industry’s transition to NMOS transistors at the 20nm node, thereby enabling chip makers to build faster devices and deliver next-generation 22nmmobile computing power.
RD&E expenses increased in fiscal 2014 compared to the prior year and below chip designs. Applied also developed technology for TSVs. Inin fiscal 2013 compared to fiscal 2012, reflecting the solar PV area, Applied continued theimpact of ongoing product development initiatives. As part of its precision waferinggrowth strategy, Applied has taken certain actions, including workforce reductions and cell manufacturing products for lowering the costreprioritization of producing solar-generated electricity through advanced c-Si technology. RD&E also included activities to develop products that enable lower-cost production of solar energy, production of LED devices for display backlighting and general lighting, and other productsexisting spend, to enable energy conservation.Inincreased funding for investments in technical capabilities and critical RD&E programs in current and new markets, with a focus on semiconductor technologies. RD&E expense during fiscal 2009, Applied focused on developing systems
2014, 2013 and 2012 included $66 million, $53 million and $54 million, respectively, of share-based compensation expense. Marketing and Selling
Marketing and selling expenses for semiconductor customers’ new chip designsthe past three fiscal years were as follows:
|
| | | | | | | | | | | | | | | | | | | |
| | | | | | | | Change |
| | 2014 | | 2013 | | 2012 | | 2014 over 2013 | | 2013 over 2012 |
| | | | | | | | | | |
| | (In millions) |
| Marketing and selling | $ | 423 |
| | $ | 433 |
| | $ | 481 |
| | $ | (10 | ) | | $ | (48 | ) |
The decrease in marketing and selling expenses for fiscal 2014 compared to fiscal 2013 was mainly due to headcount reductions. The decrease in marketing and selling expenses for fiscal 2013 compared to fiscal 2012 was primarily attributable to savings from restructuring programs along with 32nma reduction in the bad debt provision during the year as a result of lower risk exposures among display and below geometries, including systems to enable faster transistors using strain engineeringsolar customers. Marketing and high-k/metal gate technologies, as well as double patterning processes that enable customers to extend their existing 193nm lithography tools through additional technology generations. Applied also focused on developing technology for manufacturing next-generation displays. RD&E alsoselling expenses during fiscal 2014, 2013 and 2012 included activities to develop products that enable lower-cost production$23 million, $20 million and $22 million, respectively, of solar energy and other products to enable energy conservation.Selling, share-based compensation expense.
General and Administrative
Selling, general
General and administrative
(SG(G&A) expenses for the past three fiscal years were as follows:
| | | | | | | | | | | | | | | | | | | | |
| | | | | | | | | | | | Change | |
| | | 2011 | | | 2010 | | | 2009 | | | 2011 over 2010 | | | 2010 over 2009 | |
| | | (In millions) | |
Selling, general and administrative | | $ | 901 | | | $ | 942 | | | $ | 735 | | | $ | (41 | ) | | $ | 207 | |
The decrease in SG
|
| | | | | | | | | | | | | | | | | | | |
| | | | | | | | Change |
| | 2014 | | 2013 | | 2012 | | 2014 over 2013 | | 2013 over 2012 |
| | | | | | | | | | |
| | (In millions) |
| General and administrative | $ | 467 |
| | $ | 465 |
| | $ | 595 |
| | $ | 2 |
| | $ | (130 | ) |
G&A expenses for fiscal 20112014 increased slightly compared to fiscal 2010 reflected lower expenses as2013 primarily due to integration planning costs associated with the announced business combination with TEL, partially offset by a resultgain on the sale of foreign exchange option contracts associated with the restructuring of the Energybusiness combination and Environmental Solutions segment that occurredproceeds from a favorable litigation outcome. The decrease in fiscal 2010. SGG&A expenses for fiscal 2011 included $19 million in transaction2013 compared to fiscal 2012 was primarily due to the absence of certain costs incurred during fiscal 2012 associated with the acquisition of Varian, announced on May 4, 2011. SG&A expenses for fiscal 2010 included $10 million in transactionsavings from restructuring programs, and lower share-based compensation expense, partially offset by costs associatedwith the acquisition of Semitool, Inc. The increase in SG&A expenses in fiscal 2010 from fiscal 2009 reflected the elimination of temporary salary reductions and shutdowns that occurred in fiscal 2009, and the resumption of variable compensation programs. SG&A expenses were 9 percent of net sales in fiscal 2011, 10 percent of net sales in fiscal 2010, and 15 percent of net sales in fiscal 2009. SGproposed business combination with TEL. G&A expenses during fiscal 2011, 2010
2014, 2013 and 20092012 included $52$35 million $51, $34 million and $69$52 million respectively, of share-based compensation expense.
Impairment of Goodwill
In the fourth quarter of fiscal 2014, Applied performed an annual qualitative assessment to test goodwill for all of its reporting units for impairment. Applied determined that it was more likely than not that each of its reporting units' fair values exceeded its respective carrying values and that it was not necessary to perform the two-step goodwill impairment test for any of its reporting units.
During fiscal 2013 and 2012, the solar industry faced a deterioration in market conditions associated with manufacturing overcapacity and weak operating performance and outlook, resulting in uncertainties regarding the timing and nature of a recovery in solar capital equipment expenditures. Applied performed a two-step goodwill impairment test and, as a result, recorded $224 million and $421 million of goodwill impairment charges in its Energy and Environmental Solutions segment in fiscal 2013 and 2012, respectively. In fiscal 2013, Applied also performed an impairment test for long-lived assets associated with the Energy and Environmental Solutions reporting unit and determined that the majority of intangible assets were impaired, mostly due to the lower long-term revenue and profitability outlook associated with products related to these intangible assets. Accordingly, during fiscal 2013, Applied recorded an impairment charge of $54 million related to these intangible assets, which was the amount by which the carrying value of these intangible assets exceeded their estimated fair value, based on discounted projected cash flows.
The evaluation of goodwill and intangible assets for impairment requires the exercise of significant judgment. In the event of future changes in business conditions, Applied will reassess and update its forecasts and estimates used in future impairment analyses. If the results of these analyses are lower than current estimates, a material impairment charge may result at that time.
For further details, see Note 9 of Notes to Consolidated Financial Statements.
Restructuring and Asset Impairments
Restructuring and asset impairment expenses for the past three fiscal years were as follows:
| | | | | | | | | | | | | | | | | | | | |
| | | 2011 | | | 2010 | | | 2009 | | | Change | |
| | | | | | 2011 over 2010 | | | 2010 over 2009 | |
| | | (In millions) | | | | | | | |
Restructuring and asset impairments, net | | $ | (30 | ) | | $ | 246 | | | $ | 156 | | | $ | (276 | ) | | $ | 90 | |
Results
|
| | | | | | | | | | | | | | | | | | | |
| | | | | | | | Change |
| | 2014 | | 2013 | | 2012 | | 2014 over 2013 | | 2013 over 2012 |
| | | | | | | | | | |
| | (In millions) |
| Restructuring and asset impairments, net | $ | 5 |
| | $ | 63 |
| | $ | 168 |
| | $ | (58 | ) | | $ | (105 | ) |
On October 3, 2012, Applied announced a restructuring plan (the 2012 Global Restructuring Plan) to realign its global workforce and enhance its ability to invest for fiscal 2011 included favorable adjustmentsgrowth. Under this plan, Applied implemented a voluntary retirement program and other workforce reduction actions that affected approximately 1,300 positions. As of $60 millionJanuary 26, 2014, principal activities related to restructuring program charges recordedthis plan were complete. During fiscal 2014, 2013 and 2012, Applied recognized $5 million, $39 million and $106 million, respectively, of employee-related costs in prior years offsetconnection with the 2012 Global Restructuring Plan. Total costs incurred in implementing this plan were $150 million, none of which were allocated to the operating segments.
On May 10, 2012, Applied announced a plan (the 2012 EES Restructuring Plan) to restructure its Energy and Environmental Solutions segment in light of challenging industry conditions affecting the solar photovoltaic and light-emitting diode (LED) equipment markets. As part by asset impairment charges of $30 million primarilythe 2012 EES Restructuring Plan, Applied relocated certain manufacturing, business operations and customer support functions of its precision wafering systems business and ceased LED development activities. This plan impacted approximately 300 positions globally. As of October 27, 2013, principal activities related to certain intangible assets.Results forthis plan were complete. Total costs incurred in implementing this plan were
$87 million, of which $13 million were inventory-related charges. During fiscal 2010 included2013 and 2012, Applied recognized $26 million and $48 million, respectively, of restructuring charges of $129 million related to two restructuring programs announced in fiscal 2010, and asset impairment charges in connection with the 2012 EES Restructuring Plan. As of $117 million primarily related to a plan to restructure the Energy and Environmental Solutions segment.Results for fiscal 2009 included restructuring charges of $141 million primarilyOctober 26, 2014, there were no remaining severance accruals associated with a restructuring program announcedreserves under this program.
Also in fiscal
2009,2013 and
asset impairment charges2012, Applied incurred $2 million and $14 million, respectively, of
$15 million related to wafer cleaning equipment.severance and other employee-related costs in connection with the integration of Varian.
For further details, see Note 11 of Notes to Consolidated Financial Statements.
Gain on Sale
Interest Expense and
incurred a loss of $1 million on the transaction. In the third quarter of fiscal 2011, Applied received $60 million in proceeds from the sale of another property located in North America and incurred a gain of $28 million on the transaction.Interest and Other Expenses
Interest and other expenses for the past three fiscal years were as follows:
| | | | | | | | | | | | | | | | | | | | |
| | | 2011 | | | 2010 | | | 2009 | | | Change | |
| | | | | 2011 over 2010 | | | 2010 over 2009 | |
| | | (In millions) | | | | | | | |
Interest and other expense | | $ | 59 | | | $ | 21 | | | $ | 21 | | | $ | 38 | | | $ | — | |
The increase in interest and other expense for fiscal 2011 from fiscal 2010 was primarily due to interest of $31 million payable on senior unsecured notes issued in fiscal 2011 and to fees of $8 million associated with a bridge loan facility that was entered into and terminated during fiscal 2011. Interest and other expense for fiscal 2010 compared to fiscal 2009 remained essentially flat.
Interest and Other Income, net
Interest
expense and interest and other income, net for the past three fiscal years
waswere as follows:
| | | | | | | | | | | | | | | | | | | | |
| | | 2011 | | | 2010 | | | 2009 | | | Change | |
| | | | | 2011 over 2010 | | | 2010 over 2009 | |
| | | (In millions) | | | | | | | |
Interest and other income, net | | $ | 42 | | | $ | 37 | | | $ | 48 | | | $ | 5 | | | $ | (11 | ) |
The increase
|
| | | | | | | | | | | | | | | | | | | |
| | | | | | | | Change |
| 2014 | | 2013 | | 2012 | 2014 over 2013 | | 2013 over 2012 |
| | | | | | | | | | |
| | (In millions) |
| Interest expense | $ | 95 |
| | $ | 95 |
| | $ | 95 |
| | $ | — |
| | $ | — |
|
| Interest and other income, net | $ | 23 |
| | $ | 13 |
| | $ | — |
| | $ | 10 |
| | $ | 13 |
|
Interest expenses incurred were primarily associated with the senior unsecured notes issued in June 2011 to fund a portion of the consideration and certain costs associated with the acquisition of Varian. Interest expense remained flat during fiscal 2014 from the prior year and in fiscal 2013 compared to fiscal 2012.
Interest income primarily includes interest
earned on cash and investments and realized gains on sale of securities. Interest and other income,
net increased in fiscal
2011 from2014 compared to fiscal
2010 was2013 primarily due to
an increase inrealized gains
realized on
salesales of
investment securities. The decrease in interestsecurities recorded during fiscal 2014, partially offset by increased impairments of strategic investments. Interest and other income,
net increased in fiscal
20102013 from fiscal
2009 was2012 primarily due to
a decrease in interest rates.decreased impairments of strategic investments.
Income tax expenses for the past three fiscal years were as follows:
| | | | | | | | | | | | | | | | | | | | |
| | | 2011 | | | 2010 | | | 2009 | | | Change | |
| | | | | 2011 over 2010 | | | 2010 over 2009 | |
| | | (In millions, except percentages) | | | | | | | |
Provision (benefit) for income taxes | | $ | 452 | | | $ | 449 | | | $ | (181 | ) | | $ | 3 | | | $ | 630 | |
Effective income tax rate | | | 19 | % | | | 32 | % | | | (37 | )% | | | (13) points | | | | 69 points | |
|
| | | | | | | | | | | | | | | | | | | |
| | | | | | | | Change |
| 2014 | | 2013 | | 2012 | | 2014 over 2013 | | 2013 over 2012 |
| | | | | | | | | | |
| | (In millions, except percentages) |
| Provision for income taxes | $ | 376 |
| | $ | 94 |
| | $ | 207 |
| | $ | 282 |
| | $ | (113 | ) |
| Effective income tax rate | 26.0 | % | | 26.9 | % | | 65.5 | % | | (0.9) point | | (38.6) points |
The effective tax rate for fiscal 20112014 was lower than the rate for the fiscal 20102013 due primarily due to an increasenondeductible goodwill impairment charges in income in jurisdictions outsidefiscal 2013, offset by resolutions and changes related to prior years and expiration of the U.S. with lowerfederal research and development tax rates and a favorable U.S. Internal Revenue Service audit settlement. credit.
The effective tax rate for fiscal 2011 further benefited from tax incentives offered in several jurisdictions2013 was significantly lower than the rate for fiscal 2012 due primarily to the geographic composition of Applied's pre-tax income, lower nondeductible goodwill impairment charges, and from the December 2010 reinstatement of the U.S. R&Dfederal research and development tax credit retroactive to its prior expiration in December 2009. The change2012. These reductions were partially offset by a lower benefit in the fiscal 2010 tax rate2013 from the fiscal 2009 rate was principally attributable to the income before taxes for fiscal 2010 as opposed to the net loss before taxes incurred in fiscal 2009. The effective income tax rate for fiscal 2010 did not include the impactU.S. federal domestic production deduction.
Applied reports financial results in four segments: Silicon Systems Group, Applied Global Services, Display, and Energy and Environmental Solutions. A description of the products and services, as well as financial data, for each reportable segment can be found in Note 16 of Notes to Consolidated Financial Statements. Applied does not allocate to its reportable segments certain operating expenses that it manages separately at the corporate level. These unallocated costs include costs for share-based compensation; certain management, finance, legal, human
resources,resource, and RD&E functions provided at the corporate level; and unabsorbed information technology and occupancy. In addition, Applied does not allocate to its reportable segments restructuring and asset impairment charges and any associated adjustments related to restructuring actions, unless these
charges or adjustmentsactions pertain to a specific reportable segment.
The results for each reportable segment are discussed below.
Silicon Systems Group Segment
The Silicon Systems Group segment includes semiconductor capital equipment for deposition, etch, ion implantation, rapid thermal processing, chemical mechanical planarization, metrology and inspection, and wafer packaging. Development efforts are focused on solving customers’customers' key technical challenges includingin transistor, patterning, interconnect and packaging performance as devices scale to advanced technology nodes. The mobility trend remains the largest influence on industry spending, as it drives device manufacturers to continually improve their ability to deliver high-performance, low-power processors and nanoscale patterning,affordable solid-state storage in a small form factor.
With the acquisition of Varian, Applied acquired ion implantation technology for semiconductor as well as c-Si solar cell manufacturing, which was recorded under the Silicon Systems Group segment in fiscal 2012. In fiscal 2013, Applied began marketing the solar implant products commercially through its Energy and
improving chip manufacturing productivityEnvironmental Solutions segment. Accordingly, effective in the first quarter of fiscal 2013, Applied accounts for its solar implant products under the Energy and Environmental Solutions segment. The effect of the solar implant products was not material to
reduce costs.the operations of either the Silicon Systems Group or Energy and Environmental Solutions segments.
Certain significant measures for the past three fiscal years were as follows:
| | | | | | | | | | | | | | | | | | | | | | | | | | | | |
| | | 2011 | | | 2010 | | | 2009 | | | Change | |
| | | | | 2011 over 2010 | | | 2010 over 2009 | |
| | | (In millions, except percentages) | |
New orders | | $ | 5,489 | | | $ | 5,759 | | | $ | 1,677 | | | $ | (270 | ) | | | (5)% | | | $ | 4,082 | | | | 243% | |
Net sales | | | 5,415 | | | | 5,304 | | | | 1,960 | | | | 111 | | | | 2% | | | | 3,344 | | | | 171% | |
Operating income | | | 1,764 | | | | 1,892 | | | | 201 | | | | (128 | ) | | | (7)% | | | | 1,691 | | | | 841% | |
Operating margin | | | 33 | % | | | 36 | % | | | 10 | % | | | | | | | (3) points | | | | | | | | 26 points | |
New
|
| | | | | | | | | | | | | | | | | | | | | | | |
| | | | | | | | Change |
| 2014 | | 2013 | | 2012 | 2014 over 2013 | | 2013 over 2012 |
| | | | | | | | | | | | | | |
| | (In millions, except percentages and ratios) |
| New orders | $ | 6,132 |
| | $ | 5,507 |
| | $ | 5,294 |
| | $ | 625 |
| | 11% | | $ | 213 |
| | 4% |
| Net sales | 5,978 |
| | 4,775 |
| | 5,536 |
| | 1,203 |
| | 25% | | (761 | ) | | (14)% |
| Book to bill ratio | 1.0 |
| | 1.2 |
| | 1.0 |
| | | | | | | | |
| Operating income | 1,391 |
| | 876 |
| | 1,243 |
| | 515 |
| | 59% | | (367 | ) | | (30)% |
| Operating margin | 23.3 | % | | 18.3 | % | | 22.5 | % | | | | 5.0 points | | | | (4.2) points |
| Non-GAAP Adjusted Results | | | | | | | | | | | | | |
| Non-GAAP adjusted operating income | $ | 1,565 |
| | $ | 1,050 |
| | $ | 1,537 |
| | 515 |
| | 49% | | (487 | ) | | (32)% |
| Non-GAAP adjusted operating margin | 26.2 | % | | 22.0 | % | | 27.8 | % | | | | 4.2 points | | | | (5.8) points |
Reconciliations of non-GAAP adjusted measures are presented under "Non-GAAP Adjusted Results" below.
The composition of new orders for the Silicon Systems Group by end use application for the past three fiscal years
werewas as follows:
| | | | | | | | | | | | |
| | | 2011 | | | 2010 | | | 2009 | |
Foundry | | | 47 | % | | | 41 | % | | | 33 | % |
Memory | | | 28 | % | | | 43 | % | | | 38 | % |
Logic and other | | | 25 | % | | | 16 | % | | | 29 | % |
| | | | | | | | | | | | |
| | | 100 | % | | | 100 | % | | | 100 | % |
| | | | | | | | | | | | |
The following
|
| | | | | |
| | 2014 | | 2013 | | 2012 |
| Foundry | 52% | | 58% | | 62% |
| Memory | 35% | | 27% | | 22% |
| Logic and other | 13% | | 15% | | 16% |
| | 100% | | 100% | | 100% |
One region accounted for at least 30 percent of total net sales for the Silicon Systems Group segment for one or more of the past three fiscal years:
| | | | | | | | | | | | | | | | | | | | | | | | | | | | |
| | | 2011 | | | 2010 | | | 2009 | | | Change | |
| | | | | | 2011 over 2010 | | | 2010 over 2009 | |
| | | (In millions, except percentages) | |
Taiwan | | $ | 1,309 | | | $ | 1,976 | | | $ | 508 | | | $ | (667 | ) | | | (34 | )% | | $ | 1,468 | | | | 289 | % |
In fiscal 2011, customers
|
| | | | | | | | | | | | | | | | | | | | | | | |
| | | | | | | | Change |
| | 2014 | | 2013 | | 2012 | 2014 over 2013 | | 2013 over 2012 |
| | | | | | | | | | | | | | |
| | (In millions, except percentages) |
| Taiwan | $ | 2,186 |
| | $ | 2,171 |
| | $ | 1,744 |
| | $ | 15 |
| | 1% | | $ | 427 |
| | 24% |
Customers in Taiwan accounted for 2437 percent, 45 percent and 32 percent of total net sales for the Silicon Systems Group segment compared toin fiscal 2014, 2013 and 2012, respectively. Customers in the United States, China and Korea together contributed 47 percent, 37 percent and 54 percent of the total net sales for this segment in fiscal 2010,2014, 2013 and 26 percent2012, respectively.
Financial results in
the Silicon Systems Group for fiscal
2009.Fiscal 2011 financial results reflected decreased demand for semiconductor manufacturing equipment2014 compared to fiscal 2010, particularly2013 reflected the overall increase in wafer fab equipment spending in the second halfsemiconductor industry. The increase in new orders and net sales in fiscal 2014 compared to fiscal 2013 primarily reflected increased demand and spending from memory customers, as well as continued demand from foundry customers. Three customers accounted for approximately 54 percent of net sales and three customers accounted for 75 percent of new orders in this segment in fiscal 2011, due primarily2014. Operating income and non-GAAP adjusted operating income for fiscal 2014 increased compared to uncertain global economic conditions.fiscal 2013, reflecting the increase in net sales, partially offset by changes in product mix and higher RD&E spend. In the fourth quarter of fiscal 2011,2014, new orders were $925 million,$1.3 billion, a decrease of 2515 percent compared to the prior quarter. For fiscal 2011, new orders decreased by $270 million to $5.5 billion compared to fiscal 2010. The decrease in new orders wasquarter, primarily due to reduced demandlower orders from memory and foundry customers. Net sales increased by $111 million to $5.4 billion for fiscal 2011 compared to fiscal 2010. The increase in net sales was primarily due to increased investment by logic customers. Three customers accounted for 52 percent of net sales in this segment in fiscal 2011. Approximately 4544 percent of net sales in the fourth quarter of fiscal 20112014 were for orders received and shipped within the quarter, downwhich increased slightly from 4943 percent in the third quarter of fiscal 2011. 2014.
The
book to bill ratio (new orders divided by net sales) decreased to 1.0 for fiscal 2011, reflecting decreased demand, compared to 1.1 for fiscal 2010. Operating income in fiscal 2011 was $1.8 billion, a decrease of $128 million from the prior year. The decrease was due in part to a settlement agreement between Applied and Samsung Electronics Co., Ltd (Samsung) that provided for volume-based rebates and other incentives to Samsung. The decrease was also due to operating expenses incurred as a result of headcount increases during fiscal 2011. In 2011, Applied introduced the Applied Centura Conforma system which uses conformal plasma doping technology to modify the electrical properties of 3D and planar transistor structures.Fiscal 2010 financial results reflected increased demand for manufacturing equipment over fiscal 2009 due to improved global economic and industry conditions. New orders increased by $4.1 billion to $5.8 billion for fiscal 2010 compared to fiscal 2009. The significant increase in new orders wasin fiscal 2013 compared to fiscal 2012 primarily reflected increased demand from memory and foundry customers andcustomers. Net sales decreased in fiscal 2013 from the prior year due to a lesser extent logic customers, which reflected the general recoveryoverall decreased wafer fab equipment spending in the semiconductor equipment industry. The majority of fiscal 2010 new orders were for customers’ capacity expansions, while fiscal 2009 orders were primarily for customers’ new technology investments. Net sales increased by $3.3 billion to $5.3 billion in fiscal 2010 compared to fiscal 2009. The increase in net sales was primarily due to increased investment by memory and foundry customers. FourThree customers accounted for 51approximately 65 percent of new orders and net sales in this segment in fiscal 2010. Approximately 61 percent of net sales in the fourth quarter of fiscal 2010 were for orders received and shipped within the quarter. The book to bill ratio (new orders divided by net sales) increased to 1.1 for fiscal 2010, reflecting increased demand, compared to 0.9 for fiscal 2009.2013. Operating income increased by $1.7 billion to $1.9 billion for fiscal 2010 compared to fiscal 2009. The increase inand non-GAAP adjusted operating income for fiscal 2010 was due to considerably higher revenue from semiconductor equipment sales and reflected the general recovery in the semiconductor equipment industry during fiscal 2010. Results for fiscal 2010 included Semitool, which was acquired by Applied during the first quarter of fiscal 2010. In 2010, Applied introduced its Applied Reflexion GT CMP system, for fabricating copper interconnects and its Applied Centura AdvantEdge Mesa silicon etch system for fabricating nano-scale circuit features with angstrom-level precision.
The Company also introduced the Applied Producer EternaFCVD system, which is targeted for 20nm and below chips and delivers a liquid-like film that flows freely into virtually any structure to provide void-free dielectric fill.
Fiscal 2009 financial results reflected significantly reduced demand for manufacturing equipment due to extremely unfavorable global economic and industry conditions. Silicon Systems Group new orders2013 decreased by $2.4 billion to $1.7 billion in fiscal 2009 compared to fiscal 2008. The decrease in new orders reflected significantly lower demand, primarily from memory and logic customers. Net sales decreased by $2.0 billion to $2.0 billion in fiscal 2009 compared to fiscal 2008. The2012, reflecting the decrease in net sales, was due to decreased capital investments, primarily by memory customers. The book to bill ratio decreased to 0.9 for fiscal 2009, reflecting significantly decreased demand, compared to 1.0 for fiscal 2008. Operating income decreased by $1.0 billion to $201 millionchanges in fiscal 2009 compared to fiscal 2008. The decrease in operating income was due to significantly lower sales resulting in lower factory absorption, partially offset by lower operating expenses from cost control initiatives. Operating income for fiscal 2009 also reflected an increase in bad debt expense. After an operating loss in the first halfproduct mix and higher RD&E spend.
Applied Global Services Segment
The Applied Global Services segment encompasses
technically differentiated products,integrated solutions to optimize equipment and fab performance and productivity, including spares,
upgrades, services,
certainremanufactured earlier generation equipment
products, and
remanufactured equipment, to improve operating efficiency, reduce operating costs, and lessen the environmental impact offactory automation software for semiconductor, display and solar
customers’ factories.products. Customer demand for products and services is fulfilled through a global distribution system with trained service engineers located in close proximity to customer sites.
In fiscal 2010, as part of the restructuring of the Energy and Environmental Solutions segment, Applied discontinued sales to new customers of its fully-integrated SunFab thin film solar production lines but continued to offer individual tools for thin film solar manufacturing. Applied is supporting existing SunFab customers with services, upgrades and capacity increases through its Applied Global Services segment as these products are considered to have reached a particular stage in the product lifecycle and, effective in the first quarter of fiscal 2011, Applied accounts for these products under its Applied Global Services segment.
Certain significant measures for the past three fiscal years were as follows:
| | | | | | | | | | | | | | | | | | | | | | | | | | | | |
| | | 2011 | | | 2010 | | | 2009 | | | Change | |
| | | | | 2011 over 2010 | | | 2010 over 2009 | |
| | | (In millions, except percentages) | |
New orders | | $ | 2,333 | | | $ | 2,183 | | | $ | 1,179 | | | $ | 150 | | | | 7% | | | $ | 1,004 | | | | 85% | |
Net sales | | | 2,413 | | | | 1,865 | | | | 1,397 | | | | 548 | | | | 29% | | | | 468 | | | | 34% | |
Operating income | | | 482 | | | | 337 | | | | 115 | | | | 145 | | | | 43% | | | | 222 | | | | 193% | |
Operating margin | | | 20 | % | | | 18 | % | | | 8 | % | | | | | | | 2 points | | | | | | | | 10 points | |
Fiscal 2011 financial results reflected
|
| | | | | | | | | | | | | | | | | | | | | | | | |
| | | | | | | | Change |
| 2014 | | 2013 | | 2012 | 2014 over 2013 | | 2013 over 2012 |
| | | | | | | | | | | | | | |
| | (In millions, except percentages and ratios) |
| New orders | $ | 2,433 |
| | $ | 2,090 |
| | $ | 2,274 |
| | $ | 343 |
| | 16% | | $ | (184 | ) | | (8 | )% |
| Net sales | 2,200 |
| | 2,023 |
| | 2,285 |
| | 177 |
| | 9% | | (262 | ) | | (11 | )% |
| Book to bill ratio | 1.1 |
| | 1.0 |
| | 1.0 |
| | | | | | | | |
| Operating income | 573 |
| | 436 |
| | 502 |
| | 137 |
| | 31% | | (66 | ) | | (13 | )% |
| Operating margin | 26.0 | % | | 21.6 | % | | 22.0 | % | | | | 4.4 points | | | | (0.4) point |
| Non-GAAP Adjusted Results | | | | | | | | | | | | | |
| Non-GAAP adjusted operating income | 576 |
| | 443 |
| | 530 |
| | 133 |
| | 30% | | (87 | ) | | (16 | )% |
| Non-GAAP adjusted operating margin | 26.2 | % | | 21.9 | % | | 23.2 | % | | | | 4.3 points | | | | (1.3) points |
Reconciliations of non-GAAP adjusted measures are presented under "Non-GAAP Adjusted Results" below.
There were no individual regions that accounted for at least 30 percent of total net sales for the Applied Global Services segment for any of the past three fiscal years.
New orders and net sales for fiscal 2014 increased compared to fiscal 2013 mainly due to increased demand for semiconductor spares and services, overas well as 200mm equipment systems and equipment upgrades. Operating income and non-GAAP adjusted operating income increased in fiscal 2010. In the fourth quarter of fiscal 2011, new orders were $564 million, a decrease of 8 percent2014 compared to the prior quarter. For fiscal 2011, new orders increased by $150 million to $2.3 billion compared to fiscal 2010. The increase in new orders was due primarily to higher demand for spare parts and refurbished equipment. Net sales increased by $548 million to $2.4 billion for fiscal 2011, a record foryear, reflecting the segment, compared to fiscal 2010. The increase in net sales as well as the recovery of a regional customs duty assessment charge recorded in fiscal 2013.
For fiscal 2013, new orders and net sales decreased compared to fiscal 2012 due primarily to lower demand and investments for semiconductor spares and services. The decrease in net sales was
primarilyalso due to
higherlower investments in display upgrades. Fiscal 2012 net sales
in spare parts and refurbished equipment andalso included
$71$85 million in sales for
twoa thin film solar
projects. The book to bill ratio decreased to 1.0 for fiscal 2011, compared to 1.2 for fiscal 2010. The decrease for fiscal 2011 reflected a higher increase in net sales year-over-year relative to demand.production line. Operating income
increased by $145 million to $482 million forand non-GAAP adjusted operating income decreased in fiscal
20112013 compared to fiscal
2010. The increase in operating income for fiscal 2011 primarily reflected increased sales of spare parts and refurbished equipment.Fiscal 2010 financial results reflected increased demand for manufacturing services over fiscal 2009 due to improved global economic and industry conditions. New orders increased by $1.0 billion to $2.2 billion for fiscal 2010 compared to fiscal 2009. The increase in new orders was due primarily to higher demand for spare parts and refurbished equipment, reflecting customers’ higher factory utilization rates. Net sales increased by $468 million to $1.9 billion for fiscal 2010 compared to fiscal 2009. The increase in net sales was primarily due to higher sales in spare parts. The book to bill ratio increased to 1.2 for fiscal 2010, reflecting increased demand, compared to 0.8 for fiscal 2009. Operating income increased by $222 million to $337 million for fiscal 2010 compared to fiscal 2009. The increase in operating income for fiscal 2010 primarily reflected increased sales of spare parts.
Fiscal 2009 financial results reflected significantly reduced demand for manufacturing services due to extremely unfavorable global economic and industry conditions, as well as a significant reduction in the installed base of 200mm systems. New orders decreased by $1.1 billion to $1.2 billion in fiscal 2009 compared to fiscal 2008, due primarily to decreased demand for spares and refurbished equipment arising from semiconductor manufacturers’ low wafer production volumes. Net sales decreased by $932 million to $1.4 billion in fiscal 2009 compared to fiscal 2008,2012, reflecting lower sales of spares and refurbished equipment. Operating income decreased by $430a $20 million to $115 million in fiscal 2009 compared to fiscal 2008 as a result of lower sales volumes, which led to lower infrastructure cost absorption,customs duty assessment, partially offset by lower operating expenses from cost control initiatives. Operating income for fiscal 2009 also included an increase in bad debt expense. In the second halfspending controls.
The Display segment encompasses products for manufacturing
LCDsliquid crystal displays (LCDs), organic light-emitting diodes (OLEDs), and other display technologies for TVs, personal computers (PCs),
tablet PCs,tablets, smart phones, and other consumer-oriented devices. The segment is focused on expanding
market share by differentiation with larger-scale substrates,its presence through technologically-differentiated equipment for manufacturing large-scale TVs; entry into new markets such as
the LTPSlow temperature polysilicon (LTPS), metal oxide, and touch panel
sectors,sectors; and development of products
tothat enable cost reductions through productivity and uniformity.
Display industry growth depends primarily on consumer demand for increasingly larger and more advanced LCD TVs and high resolution displays for next generation mobile devices.
Certain significant measures for the past three fiscal years were as follows:
| | | | | | | | | | | | | | | | | | | | | | | | | | | | |
| | | 2011 | | | 2010 | | | 2009 | | | Change | |
| | | | | 2011 over 2010 | | | 2010 over 2009 | |
| | | (In millions, except percentages) | |
New orders | | $ | 636 | | | $ | 799 | | | $ | 287 | | | $ | (163 | ) | | | (20)% | | | $ | 512 | | | | 179% | |
Net sales | | | 699 | | | | 899 | | | | 502 | | | | (200 | ) | | | (22)% | | | | 397 | | | | 79% | |
Operating income | | | 147 | | | | 267 | | | | 51 | | | | (120 | ) | | | (45)% | | | | 216 | | | | 424% | |
Operating margin | | | 21 | % | | | 30 | % | | | 10 | % | | | | | | | (9) points | | | | | | | | 20 points | |
|
| | | | | | | | | | | | | | | | | | | | | | | |
| | | | | | | | Change |
| 2014 | | 2013 | | 2012 | 2014 over 2013 | | 2013 over 2012 |
| | | | | | | | | | | | | | |
| | (In millions, except percentages and ratios) |
| New orders | $ | 845 |
| | $ | 703 |
| | $ | 274 |
| | $ | 142 |
| | 20% | | $ | 429 |
| | 157% |
| Net sales | 615 |
| | 538 |
| | 473 |
| | 77 |
| | 14% | | 65 |
| | 14% |
| Book to bill ratio | 1.4 |
| | 1.3 |
| | 0.6 |
| | | | | | | | |
| Operating income | 129 |
| | 74 |
| | 25 |
| | 55 |
| | 74% | | 49 |
| | 196% |
| Operating margin | 21.0 | % | | 13.8 | % | | 5.3 | % | | | | 7.2 points | | | | 8.5 points |
| Non-GAAP Adjusted Results | | | | | | | | | | | | | |
| Non-GAAP adjusted operating income | $ | 131 |
| | $ | 80 |
| | $ | 32 |
| | 51 |
| | 64% | | 48 |
| | 150% |
| Non-GAAP adjusted operating margin | 21.3 | % | | 14.9 | % | | 6.8 | % | | | | 6.4 points | | | | 8.1 points |
Reconciliations of non-GAAP adjusted measures are presented under "Non-GAAP Adjusted Results" below.
The following regions accounted for at least 30 percent of total net sales for the Display segment for one or more of the past three fiscal years:
| | | | | | | | | | | | | | | | | | | | | | | | | | | | |
| | | 2011 | | | 2010 | | | 2009 | | | Change | |
| | | | | | 2011 over 2010 | | | 2010 over 2009 | |
| | | (In millions, except percentages) | |
China | | $ | 330 | | | $ | 162 | | | $ | 53 | | | $ | 168 | | | | 104 | % | | $ | 109 | | | | 206 | % |
Taiwan | | $ | 216 | | | $ | 311 | | | $ | 165 | | | $ | (95 | ) | | | (31) | % | | $ | 146 | | | | 88 | % |
Korea | | $ | 111 | | | $ | 334 | | | $ | 144 | | | $ | (223 | ) | | | (67) | % | | $ | 190 | | | | 132 | % |
|
| | | | | | | | | | | | | | | | | | | | | | | |
| | | | | | | | Change |
| | 2014 | | 2013 | | 2012 | 2014 over 2013 | | 2013 over 2012 |
| | | | | | | | | | | | | | |
| | (In millions, except percentages) |
| Taiwan | $ | 22 |
| | $ | 50 |
| | $ | 179 |
| | $ | (28 | ) | | (56)% | | $ | (129 | ) | | (72)% |
| China | $ | 491 |
| | $ | 260 |
| | $ | 133 |
| | $ | 231 |
| | 89% | | $ | 127 |
| | 95% |
| Korea | $ | 99 |
| | $ | 175 |
| | $ | 88 |
| | $ | (76 | ) | | (43)% | | $ | 87 |
| | 99% |
In fiscal
2011,2014, 2013, and 2012, customers in China accounted for
4780 percent,
48 percent and 28 percent, respectively, of
the Display segment's total net
sales for the Display segment compared to 18 percent in fiscal 2010, and 11 percent in fiscal 2009. Customers in Taiwan accounted for 31 percent of total net sales for the segment in fiscal 2011 compared to 35 percent in fiscal 2010, and 33 percent in fiscal 2009.sales. Customers in Korea
and Taiwan together accounted for
1620 percent of total net sales for the Display segment in fiscal
20112014 compared to
3742 percent in fiscal
2010,2013, and
2957 percent in fiscal
2009.Fiscal 20112012. The increase in net sales from customers in China reflected TV manufacturing capacity expansion, while the decrease in net sales from customers in Korea and Taiwan primarily related to lower sales of mobile display manufacturing equipment.
New orders and net sales for fiscal 2014 increased compared to the prior year reflecting strong TV manufacturing capacity expansions. Operating income and non-GAAP adjusted operating financial results reflected a cyclical downturnincome increased over the prior year, due primarily to higher net sales, sales of tools for which inventory had been written down previously, better installation and warranty performance, and material and manufacturing cost reductions, partially offset by increased research and development expenses. Four customers accounted for approximately 87 percent of new orders for the Display segment in demandfiscal 2014, with two customers accounting for equipment to manufacture LCD products that resultedapproximately 50 percent of new orders. Four customers accounted for approximately 77 percent of net sales for this segment in an extremely low levelfiscal 2014, with one customer accounting for approximately 40 percent of net sales. In the fourth quarter of fiscal 2014, new orders were $130 million, down 56 percent from the prior quarter, primarily reflecting continued variability in industry order patterns. Net sales in the fourth quarter of fiscal 2011. In the fourth quarter of fiscal 2011, new orders2014 were $20$190 million, a decrease of 91up 60 percent compared to the prior quarter. For fiscal 2011,quarter as a result of shipment of TV manufacturing equipment to customers in China.
Fiscal 2013 operating results reflected a recovery in demand for TV manufacturing equipment and continued demand for advanced mobile display equipment, which resulted in increased new orders,
decreased by $163 million to $636 millionnet sales, operating income and non-GAAP adjusted operating income compared to fiscal
2010. The decrease in new orders reflected customers’ decisions to delay investment in new LCD TV capacity, which was partially offset by increased demand for LTPS and touch panel systems, although this demand also softened in the fourth quarter of fiscal 2011 as an initial build-out of manufacturing capacity was absorbed. Net sales decreased by $200 million to $699 million for fiscal 2011 compared to fiscal 2010. The decrease in net sales reflected a decline in spending for LCD TV products, as customers delayed their investments, including plans for manufacturing in China, partially offset by increased demand for equipment to manufacture new mobile devices like smart phones and tablets. The book to bill ratio remained flat at 0.9 for fiscal 2011. Operating income decreased by $120 million to $147 million for fiscal 2011 compared to fiscal 2010. The decrease in operating income for fiscal 2011 reflected an unfavorable product mix. Three2012. Two customers accounted for
54approximately 50 percent of net sales for the Display segment in fiscal
2011. The decrease in operating margin in fiscal 2011 compared to fiscal 2010 was due to changes in product mix. In 2011, the Company introduced the Applied AKT-20K PX PECVD system for manufacturing high-performance OLED and LCD displays and the Applied AKT-AristoTwin system for manufacturing touch-enabled displays.Fiscal 2010 operating financial results reflected increased demand for LCD equipment over fiscal 2009 due to improved global economic and industry conditions. New orders increased by $512 million to $799 million for fiscal 2010 compared to fiscal 2009. The increase in new orders reflected the general recovery in the LCD market, as customers increased production levels in response to strong end-demand for flat panel TVs and notebook computers. Net sales increased by $397 million to $899 million for fiscal 2010 compared to fiscal 2009. The increase in net sales reflected strong market demand for LCD products. Five customers accounted for 71 percent of net sales for the Display segment in fiscal 2010. The book to bill ratio increased to 0.9 for fiscal 2010, reflecting increased demand, compared to 0.6 for fiscal 2009. Operating income increased by $216 million to $267 million for fiscal 2010 compared to fiscal 2009. The increase in operating income was due to a significant increase in net sales and improved gross margin driven by an increase in volume.
Fiscal 2009 financial results reflected significantly reduced demand for LCD equipment due to extremely unfavorable global economic and industry conditions. New orders decreased significantly to $287 million in fiscal 2009 compared to $1.5 billion in fiscal 2008, which reflected the slowdown in the display industry from fiscal 2008 when display manufacturers added capacity. Net sales decreased by $474 million to $502 million in fiscal 2009 compared to fiscal 2008 as a result of significantly lower orders. Operating income decreased to $51 million in fiscal 2009 from $301 million in fiscal 2008. Operating income decreased due to significantly lower revenue, partially offset by lower operating expenses due to cost control initiatives. The book to bill ratio decreased to 0.6 for fiscal 2009, reflecting significantly decreased demand, compared to 1.5 for fiscal 2008.
2013.
Energy and Environmental Solutions Segment
The Energy and Environmental Solutions segment includes products for fabricating
c–Sicrystalline-silicon (c-Si), solar
PVs,PV wafers and cells, as well as high throughput roll-to-roll
coating systemsdeposition equipment for flexible electronics,
packaging and
web products.other applications. This business is focused on delivering solutions to generate and conserve energy, with an emphasis on lowering the cost to produce solar
power by providingmodules and increasing conversion efficiency. While end-demand for solar PVs has been robust over the last several years, investment in capital equipment
remained low as global PV production capacity exceeds anticipated demand. The solar equipment environment improved slightly in fiscal 2014 compared to
enhance manufacturing scale and efficiency. Until the
first quarter of fiscal 2011, the Energy and Environmental Solutions segment included the fully-integrated SunFab production line for manufacturing thin film solar panels. During the third quarter of fiscal 2010, Applied announced a plan to restructure its Energy and Environmental Solutions segment in response to adverse market conditions for thin film solar and as a result, Applied discontinued sales of SunFab lines to new customers, but is offering individual tools for thin film solar manufacturing. Applied is supporting existing SunFab line customers with services, upgrades and capacity increases through its Applied Global Services segment, and effective in the first quarter of fiscal 2011, Applied accounts for these products under its Applied Global Services segment.previous year.
Certain significant measures for the past three fiscal years were as follows:
| | | | | | | | | | | | | | | | | | | | | | | | | | | | |
| | | 2011 | | | 2010 | | | 2009 | | | Change | |
| | | | | 2011 over 2010 | | | 2010 over 2009 | |
| | | (In millions, except percentages) | |
New orders | | $ | 1,684 | | | $ | 1,508 | | | $ | 955 | | | $ | 176 | | | | 12% | | | $ | 553 | | | | 58% | |
Net sales | | | 1,990 | | | | 1,481 | | | | 1,155 | | | | 509 | | | | 34% | | | | 326 | | | | 28% | |
Operating income (loss) | | | 453 | | | | (466 | ) | | | (234 | ) | | | 919 | | | | 197% | | | | (232 | ) | | | (99%) | |
Operating margin | | | 23 | % | | | (31 | %) | | | (20 | %) | | | | | | | 54 points | | | | | | | | (11) points | |
|
| | | | | | | | | | | | | | | | | | | | | | | |
| | | | | | | | Change |
| 2014 | | 2013 | | 2012 | 2014 over 2013 | | 2013 over 2012 |
| | | | | | | | | | | | | | |
| | (In millions, except percentages and ratios) |
| New orders | $ | 238 |
| | $ | 166 |
| | $ | 195 |
| | $ | 72 |
| | 43% | | $ | (29 | ) | | (15)% |
| Net sales | 279 |
| | 173 |
| | 425 |
| | 106 |
| | 61% | | (252 | ) | | (59)% |
| Book to bill ratio | 0.9 |
| | 1.0 |
| | 0.5 |
| | | | | | | | |
| Operating income (loss) | 15 |
| | (433 | ) | | (668 | ) | | 448 |
| | 103% | | 235 |
| | 35% |
| Operating margin | 5.4 | % | | (250.3 | )% | | (157.2 | )% | | | | 255.7 points | | | | (93.1) points |
| Non-GAAP Adjusted Results | | | | | | | | | | | | | |
| Non-GAAP adjusted operating income (loss) | 21 |
| | (115 | ) | | (184 | ) | | 136 |
| | 118% | | 69 |
| | 38% |
| Non-GAAP adjusted operating margin | 7.5 | % | | (66.5 | )% | | (43.3 | )% | | | | 74.0 points | | | | (23.2) points |
Reconciliations of non-GAAP adjusted measures are presented under "Non-GAAP Adjusted Results" below.
The following
regionsregion accounted for at least 30 percent of total net sales for the Energy and Environmental Solutions segment for one or more of the past three fiscal years:
| | | | | | | | | | | | | | | | | | | | | | | | | | | | |
| | | 2011 | | | 2010 | | | 2009 | | | Change | |
| | | | | | 2011 over 2010 | | | 2010 over 2009 | |
| | | (In millions, except percentages) | |
China | | $ | 1,584 | | | $ | 935 | | | $ | 442 | | | $ | 649 | | | | 69 | % | | $ | 493 | | | | 112 | % |
Europe | | $ | 58 | | | $ | 372 | | | $ | 452 | | | $ | (314 | ) | | | (84) | % | | $ | (80 | ) | | | (18 | %) |
|
| | | | | | | | | | | | | | | | | | | | | | | | | |
| | | | | | | | Change |
| | 2014 | | 2013 | | 2012 | 2014 over 2013 | | 2013 over 2012 |
| | | | | | | | | | | | | | |
| | (In millions, except percentages) |
| China | $ | 173 |
| | $ | 100 |
| | $ | 210 |
| | $ | 73 |
| | 73 | % | | $ | (110 | ) | | (52 | )% |
In fiscal 2011,2014, customers in China accounted for 8062 percent of total net sales for the Energy and Environmental Solutions segment compared to 6358 percent in fiscal 20102013, and 3849 percent in fiscal 2009. Customers in Europe accounted for 3 percent of total2012.
New orders and net sales for
the segment in fiscal
20112014 increased compared to
25 percent in fiscal
2010, and 39 percent in fiscal 2009.Fiscal 2011 financial results reflected increased demand for c-Si products in the first half of the year, which rapidly declined in the second half of fiscal 20112013 but remained at low levels due to continued excess manufacturing capacity in the solar industry. One customer accounted for approximately 23 percent of net sales for this segment during fiscal 2014. Operating margin and customers’ decreased accessnon-GAAP adjusted operating margin increased for fiscal 2014 compared to capital.prior year, reflecting increased net sales, lower inventory charges, sales of solar tools that were written down previously and continued cost reduction measures, proceeds from a favorable litigation outcome, and spending controls. In the fourth quarter of fiscal 2011,2014, new orders were $86$44 million, a decrease of 73 percent compared todown from $66 million in the prior quarter, and net sales were $48 million, down 53 percent from the prior quarter. For fiscal 2011,
Fiscal 2013 financial results continued to reflect excess manufacturing capacity in the solar industry, which resulted in low levels of new orders
increased by $176 million to $1.7 billion compared to fiscal 2010. The increase in new orders for fiscal 2011 reflected significantly increased demand for c-Si equipment, particularly wafering and
metallization products. The increased demand was partially driven by government incentives for solar. Net sales increased by $509 million to $2.0 billion for fiscal 2011 compared to fiscal 2010. The increase in net sales,
for fiscal 2011 primarily reflected higher sales to c-Si customers. Net sales in fiscal 2010 included $539 million from sales of SunFab thin film lines. There were no sales of SunFab thin film lines recognized in the Energy and
Environmental Solutions segment in fiscal 2011. In fiscal 2011, customers in China accounted for an increased proportion of the Energy and Environment Solutions segment’s results compared to prior years, including 78 percent of new orders. The book to bill ratio decreased to 0.8 for fiscal 2011 compared to 1.0 for fiscal 2010. The decrease for fiscal 2011 reflected a higher increase in net sales year-over-year relative to demand. The Energy and Environmental Solutions segment reported operating income of $453 million for fiscal 2011 compared toconsequently an operating loss
of $466 million for
fiscal 2010.the segment. Operating loss for fiscal
20102013 included
$278 million of goodwill and intangible asset impairment charges,
totaling $486as well as restructuring and asset impairment charges of $25 million associated with the
Energy2012 EES Restructuring Plan discussed above. Details on goodwill and
Environmental Solutionsintangible asset impairment and restructuring
plan announced in July 2010. The increase in operating income for fiscal 2011 was also attributable to significantly higher net sales of c-Si equipment and
included favorable adjustments of $36 million related to the restructuring program announced in the third quarter of fiscal 2010. The increase in operating margin for fiscal 2011 was due to higher manufacturing volume for c-Si equipment. In 2011, the Applied Baccini Pegaso platform for next-generation solar cell manufacturing was introduced.In fiscal 2010, Applied incurred charges of $486 million that included a plan to restructure its Energy and Environmental Solutions segment as described above, consisting of inventory-related charges of $330 million related to SunFab thin film solar equipment, asset impairment charges are also included in Note 9 and Note 11 of $108 million, employee severance charges of $45 million, and other costs of $3 million.
Fiscal 2010 financial results compared to fiscal 2009 reflected increased demand for c-Si products, offset by reduced demand for SunFab thin film solar manufacturing lines duethe Notes to the challenging market conditionsConsolidated Financial Statements.
Business Combinations
Tokyo Electron Limited
On September 24, 2013, Applied and Tokyo Electron Limited (TEL) entered into a Business Combination Agreement, which was amended on February 14, 2014, to effect a strategic combination of their respective businesses into a new combined company. TEL, a Japanese corporation, is a global supplier of semiconductor and flat panel display production equipment, and a provider of technical support and services for
utility-scale solar. New orders increased by $553 million to $1.5 billionsemiconductor, flat panel display and photovoltaic panel production equipment. Under the terms of the Business Combination Agreement, TEL shareholders will receive 3.25 shares of the new combined company for
fiscal 2010 compared to fiscal 2009. The increase in orders reflected increased demand for c-Si products, particularly wafering and metallization products, offset by reduced demand for SunFab lines. Net sales increased by $326 million to $1.5 billion forfiscal 2010 compared to fiscal 2009. Net sales for fiscal 2010 primarily reflected higher sales to c-Si customers than in fiscal 2009. The relativeevery TEL share held. Applied shareholders will receive one share of the segment’s net sales attributablenew combined company for every Applied share held. Based on the number of shares of Applied common stock and shares of TEL common stock expected to SunFab customers decreasedbe issued and outstanding immediately prior to 36 percentthe closing of the transaction, it is anticipated that, immediately following the transaction, former Applied stockholders and former TEL shareholders will own approximately 68% and 32%, respectively, of the new combined company.
The new combined company, Eteris N.V., will have dual headquarters in fiscal 2010 from 44 percent in fiscal 2009. For fiscal 2010, customers in ChinaTokyo and Europe accounted for 88 percentSanta Clara and dual listing of total net sales in this segment. The book to bill ratio increased to 1.0 for fiscal 2010 compared to 0.8 for fiscal 2009. The operating lossits shares on the Tokyo Stock Exchange and NASDAQ, and will be incorporated in the EnergyNetherlands. In June 2014, the shareholders of Applied and Environmental Solutions segment increased by $232 millionTEL approved the proposed business combination. The closing of the transaction remains subject to $466 millioncustomary conditions, including regulatory approvals. It is expected that the combined company will commence a $3.0 billion stock repurchase program targeted to be executed within 12 months following the closing of the transaction.
The Business Combination Agreement contains mutual pre-closing covenants, including the obligation of Applied and TEL to conduct their businesses in the ordinary course consistent in all material respects with past practices. The agreement also contains termination rights for
fiscal 2010 compared to fiscal 2009. The increase in operating loss was primarilyApplied and TEL and provides that upon certain events, such as a termination due to
restructuring, asset impairment and inventory-related chargesa change in recommendation by the other party or a termination relating to certain tax rulings, a termination fee of
$486$400 million
recognized in the second and third quarters of fiscal 2010, and lower net sales to SunFab customers, partially offset by increased sales of c-Si products and cost control initiatives. Results for the fourth quarter of fiscal 2010 reflected customer final acceptance of two SunFab lines.Fiscal 2009 financial results reflected reduced demand for c-Si products over fiscal 2008 offset in part by higher demand for SunFab lines. New orders of $955 million in fiscal 2009 decreased from $1.3 billion in fiscal 2008. The decrease in new orders was primarily due to decreased demand from c-Si customers and reflected the challenging global economic environment, solar manufacturers’ difficulties in obtaining cost-effective capital, and a decrease in end demand. Net sales of $1.2 billion in fiscal 2009 increased from $819 million in fiscal 2008 due to an increase in sales for SunFab lines. The operating loss of $234 million in fiscal 2009 increased from $206 million in fiscal 2008 due to an increase in RD&E expenses and unfavorable gross margins associated with initial SunFab line start-ups, offset in part by cost control initiatives. The book to bill ratio decreased to 0.8 for fiscal 2009, reflecting significantly decreased demand, compared to 1.6 for fiscal 2008. In 2009, Applied introduced its Baccini Esatto Technology, a high precision, multi-step printing capability designed to increase the efficiency of c-Si solar cells.
Business Combinations
On May 4, 2011, Applied and is payable.
Varian Semiconductor Equipment Associates, Inc. (Varian),
On November 10, 2011, Applied completed the acquisition of Varian, a public company manufacturer of semiconductor processing equipment and the leading supplier of ion implantation equipment used by chip makers
around the world, announced the signingglobally, for an aggregate purchase price of
a definitive merger agreement$4.2 billion in cash, net of cash acquired and assumed earned equity awards of $27 million, pursuant to an Agreement and Plan of Merger dated
as of May 3,
2011, under which Applied agreed2011. Applied's primary reasons for this acquisition were to
acquire Variancomplement existing product offerings and to provide opportunities for
$63 per share in cash.In November 2011, Applied completed its acquisition of Varian. Beginning in the first quarter of fiscal 2012, thefuture growth. The acquired business will beis primarily included in results for the Silicon Systems Group and Applied Global Services segments.
The aggregate purchase price of the acquisition was approximately $4.2 billion, net of cash acquired, and is expected to result in an increase in goodwill of approximately $2.5 billion and intangible assets of up to $1.5 billion.
Applied funded the transaction with a combination of existing cash balances and debt. On June 8, 2011, Applied issued senior unsecured notes
(the Notes) in the aggregate principal amount of $1.75 billion and used the net proceeds of the Notes to fund a portion of the consideration and certain costs associated with the acquisition.
The indenture governing the Notes includes certain covenants with which Applied was in compliance at October 30, 2011. See Note 10 of Notes to
5Consolidated Financial Statements for additional discussion of long-term debt.
Varian designs, markets, manufactures and services ion implantation systems. These systems are primarily used in the manufacture of transistors, which are a basic building block of ICs or microchips. Ion implantation systems create a beam of electrically charged particles called ions, which are implanted into transistor structures at precise locations and depths, changing the electrical properties of the semiconductor device. These implantation systems may also be used in other areas of IC manufacture for modifying the material properties of the semiconductor devices, as well as in manufacturing crystalline-silicon solar cells and LEDs.
On December 21, 2009, Applied acquired Semitool, Inc., a public company based in the state of Montana, for a purchase price of $323 million in cash, net of cash acquired, pursuant to a tender offer and subsequent short-form merger. The acquired business is a leading supplier of electrochemical plating and wafer surface preparation equipment used by semiconductor packaging and manufacturing companies globally. Applied’s primary reasons for this acquisition were to complement its existing product offerings and to provide opportunities for future growth. The acquired business is included in results for the Silicon Systems Group segment.
Semitool is a leading provider of wet chemical processing equipment, targeting wafer surface preparation and ECD plating applications for all areas of wafer fabrication, including device packaging. Semitool’s solutions address critical applications within the semiconductor manufacturing process, and enable its customers to manufacture more advanced semiconductor devices that feature higher levels of performance.
In November 2009, Applied acquired substantially all the assets, including the intellectual property, of Advent Solar, a developer of advanced technology for c-Si solar photovoltaic cells and modules (PVs), for a purchase price of $14 million. This acquisition complemented Applied’s portfolio of solar PV technologies and enhanced Applied’s opportunities in the c-Si equipment market. The acquisition is included in results for the Energy and Environmental Solutions segment.
For further details, see Note
98 of Notes to Consolidated Financial Statements.
Recent Accounting Pronouncements
In
September 2011,May 2014, the
FASBFinancial Accounting Standards Board (FASB) issued authoritative guidance
that requires revenue recognition to
allow entitiesdepict the transfer of promised goods or services to
use a
qualitative approachcustomer in an amount that reflects the consideration to
test goodwillwhich the entity expects to be entitled in exchange for
impairment.those goods or services. This
authoritativenew standard will supersede most current revenue recognition guidance,
permits an entity to first perform a qualitative assessment to determine whether it is more likely than not that the fair value of a reporting unit is less than its carrying value. If it is concluded that this is the case, it is necessary to perform the two-step goodwill impairment test. Otherwise, the two-step goodwill impairment test is not required. Thisincluding industry-specific guidance. The guidance
is effective for annual and interim goodwill impairment tests performed for fiscal years beginning after December 15, 2011 and earlier adoption is permitted. Applied elected to adopt this authoritative guidance in fiscal 2011. The implementation of this authoritative guidance had no impact on Applied’s financial position or results of operations.In June 2011, the FASB issued authoritative guidance on the presentation of comprehensive income to require an entity to present the total of comprehensive income, the components of net income, and the components of other comprehensive income either in a single continuous statement of comprehensive income or in two separate but consecutive statements. This authoritative guidance eliminates the option to present the components of other comprehensive income as part of the statement of equity. This guidance isbecomes effective for Applied in the first quarter of fiscal 2012, with early adoption permitted,2018, and shouldcan be applied retrospectively. The implementationeither retrospectively or as a cumulative-effect adjustment as of the date of adoption. Early adoption is prohibited. Applied is currently evaluating the effect of this authoritativenew guidance will change only the presentation of comprehensive income and will have no impact on Applied’sApplied's financial position or resultsand its ongoing financial reporting, including the selection of operations.
a transition method.
In May 2011,April 2014, the FASB issued authoritative guidance that raises the threshold for a disposal transaction to providequalify as a consistent definitiondiscontinued operation and requires additional disclosures about discontinued operations and disposals of fair value and ensureindividually significant components that the fair value measurement and disclosure requirements are similar between U.S. GAAP and International Financial Reporting Standards. Thisdo not qualify as discontinued operations. The authoritative guidance limits the highest-and-best-use measure to nonfinancial assets, permits certain financial assets and liabilities with offsetting positions in market or counterparty credit risks to be measured at a net basis, and provides guidance on the applicability of premiums and discounts. This authoritative guidance also expands the disclosures on Level 3 inputs by requiring quantitative disclosure of the unobservable inputs and assumptions, as well as description of the valuation processes and the sensitivity of the fair value to changes in unobservable inputs. The new guidance will bebecomes effective prospectively for Applied in the first quarter of fiscal 2012. The implementation of this2016. Early adoption is permitted, but only for disposals that have not been reported in financial statements previously issued.
In July 2013, the FASB issued authoritative guidance
is not expectedthat will require an unrecognized tax benefit to
havebe presented as a
material impact on Applied’s financial position or results of operations.In December 2010, the FASB amended its existing guidance for goodwill and other intangible assets. This authoritative guidance modifies Step 1 of the goodwill impairment test for reporting units with zero or negative carrying amounts. For those reporting units, an entity is required to perform Step 2 of the goodwill impairment test if there are qualitative factors indicating that it is more likely than not that a goodwill impairment exists. The qualitative factors are consistent with the existing guidance which requires goodwillreduction of a reporting unit to be testeddeferred tax asset for impairment between annual tests if an event occursa net operating loss carryforward, a similar tax loss or circumstances change that would more likely than not reduce the fair value of a reporting unit below its carrying amount. Thistax credit carryforward, with certain exceptions. The authoritative guidance becomes effective for Applied in the first quarter of fiscal 2012.2015, with early adoption permitted. The implementation of this authoritative guidance is not expected to have a materialsignificant impact on Applied’sApplied's financial position or resultsposition.
Financial Condition, Liquidity and Capital Resources
Applied’s cash, cash equivalents and investments increased to $7.2$4.1 billion at October 30, 201126, 2014 from $3.9$2.9 billion at October 31, 2010, due primarily to the receipt of proceeds from the issuance of $1.75 billion of senior unsecured notes discussed below and cash provided by operating activities of $2.4 billion.27, 2013
. Cash, cash equivalents and investments consist of the following:
| | | | | | | | | | | | |
| | | October 30,
2011 | | | October 31,
2010 | | | October 25,
2009 | |
| | | (In millions) | |
Cash and cash equivalents | | $ | 5,960 | | | $ | 1,858 | | | $ | 1,577 | |
Short-term investments | | | 283 | | | | 727 | | | | 638 | |
Long-term investments | | | 931 | | | | 1,307 | | | | 1,052 | |
| | | | | | | | | | | | |
Total cash, cash-equivalents and investments | | $ | 7,174 | | | $ | 3,892 | | | $ | 3,267 | |
| | | | | | | | | | | | |
|
| | | | | | | |
| | October 26,
2014 | | October 27,
2013 |
| | | | |
| | (In millions) |
| Cash and cash equivalents | $ | 3,002 |
| | $ | 1,711 |
|
| Short-term investments | 160 |
| | 180 |
|
| Long-term investments | 935 |
| | 1,005 |
|
| Total cash, cash-equivalents and investments | $ | 4,097 |
| | $ | 2,896 |
|
Sources and Uses of Cash
A summary of cash provided by (used in) operating, investing, and financing activities is as follows:
| | | | | | | | | | | | |
| | | 2011 | | | 2010 | | | 2009 | |
| | | (In millions) | |
Cash provided by operating activities | | $ | 2,426 | | | $ | 1,723 | | | $ | 333 | |
Cash provided by (used in) investing activities | | $ | 710 | | | $ | (862 | ) | | $ | 112 | |
Cash provided by (used in) financing activities | | $ | 960 | | | $ | (576 | ) | | $ | (281 | ) |
Applied generated cash from operating activities of $2.4 billion in fiscal 2011, $1.7 billion in fiscal 2010, and $333 million in fiscal 2009. The primary sources of cash
|
| | | | | | | | | | | |
| | 2014 | | 2013 | | 2012 |
| | | | | | |
| | (In millions) |
| Cash provided by operating activities | $ | 1,800 |
| | $ | 623 |
| | $ | 1,851 |
|
| Cash provided by (used in) investing activities | $ | (161 | ) | | $ | 215 |
| | $ | (4,660 | ) |
| Cash used in financing activities | $ | (348 | ) | | $ | (519 | ) | | $ | (1,754 | ) |
Operating Activities
Cash from operating activities for fiscal 2011 were2014 was $1.8 billion, which reflects net income as adjusted to excludefor the effect of non-cash charges includingand changes in working capital components. Non-cash charges included depreciation, amortization, share-based compensation, unrealized loss on derivatives associated with announced business combination, restructuring and asset impairments and changesdeferred income taxes. The increase in componentscash from operating activities from fiscal 2013 to fiscal 2014 was primarily due to higher business volume and improved working capital performance.
Applied discounted $29 million of working capital.letters of credit issued by customers in fiscal 2014. Applied utilizeddid not utilize programs to discount letters of credit issued by customers of $211 million in fiscal 2011, $230 million in fiscal 2010,2013 and $299 million in fiscal 2009.2012. Discounting of letters of credit depends on many factors, including the willingness of financial institutions to discount the letters of credit and the cost of such arrangements. Applied factored accounts receivable and discounted promissory notes of $80$45 million in fiscal 2011, $1572014, and $93 million in fiscal 2010, and $43 million2012. There was no factoring of accounts receivable or discounting of promissory notes in fiscal 2009. 2013.
Applied’s working capital was $4.1 billion at October 26, 2014 and $3.2 billion at October 27, 2013.
Days sales, inventory and payable outstanding were 62 at the end of fiscal 2011, 58 ateach of the end of fiscal 2010, and 75 at the end of fiscal 2009. periods indicated are:
|
| | | | | |
| | 2014 | | 2013 | | 2012 |
| | | | | | |
| Days sales outstanding | 67 | | 75 | | 67 |
| Days inventory outstanding | 109 | | 108 | | 109 |
| Days payable outstanding | 43 | | 44 | | 34 |
Days sales outstanding varies due to the timing of shipments and the payment terms.
Applied’s working capital was $7.6 billionDays sales outstanding decreased at
October 30, 2011, $3.9 billion at October 31, 2010the end of fiscal 2014 compared to fiscal 2013 primarily due to an increase in revenue and
$3.7 billion at October 25, 2009. Duringbetter linearity. The days sales outstanding in fiscal
2011, Applied received2012 included a
U.S. federal income tax refundfavorable impact from the timing of
$276 million including interest. Duringthe sale of thin film production line during the year. Days inventory outstanding remained flat in fiscal
2010, Applied received a U.S. federal income tax refund of approximately $130 million for the carryback of Applied’s net operating loss2012, 2013 and 2014. The increase in days payable outstanding from fiscal
20092012 to fiscal
2005.2013 primarily reflected an increase in accounts payable due to increase in inventory purchases near the end of the period to support projected customer demand.
Investing Activities
Applied generated $710used $161 million of cash from investing activities in 2011. Applied used $862 million of cash for investing activities in fiscal 20102014 and $4.7 billion in fiscal 2012. Applied generated $112$215 million ofin cash from investing activities in fiscal 2009.2013. Capital expenditures were $209$241 million in fiscal 2011, $1692014, $197 million in fiscal 2010, $2492013, and $162 million in fiscal 2009.2012. Capital expenditures in fiscal 2011 was offset by $99 million in proceeds received from the sale of two properties located2014 were primarily for demonstration and test equipment and infrastructure improvements in North America, including creation of a new pilot operation facility and $31 million in proceeds received from completed divestiture of certain assets held for sale.distribution center. Capital expenditures for bothin fiscal 2010 and fiscal 20092013 were primarily for the implementation of an enterprise resource planning software systemdemonstration and the construction of a solar R&D/demonstration centertest equipment as well as laboratory tools and equipment upgrades in Xi’an,China.North America. Capital expenditures in fiscal 2012 were primarily for fiscal 2010various information technology expenditures in North America, including the addition of Varian, and fiscal 2009 also included investment to construct a facilityexpansion of semiconductor assembly centers in Singapore. Proceeds from sales and maturities of investments, net of purchases of investments, totaled $789
$67 million for in fiscal 20112014 and $361$406 million in fiscal 2009. Purchases2013, while purchases of investments, net of proceeds from sales and maturities of investments, totaled $370$308 million in fiscal 2010.2012. Investing activities also included investments in technology and acquisitions of companies to allow Applied to access new market opportunities or emerging technologies. In fiscal 2010,2012, Applied acquired Semitool, a public company based in the state of Montana,Varian for $323 million,$4.2 billion, net of cash acquired. See Note 9
Applied’s investment portfolio consists principally of
Notesinvestment grade money market mutual funds, U.S. Treasury and agency securities, municipal bonds, corporate bonds and mortgage-backed and asset-backed securities, as well as equity securities. Applied regularly monitors the credit risk in its investment portfolio and takes appropriate measures, which may include the sale of certain securities, to
Consolidated Financial Statements for additional details.Applied generated $960 million of cash from financing activitiesmanage such risks prudently in fiscal 2011, consisting primarily of net proceeds received from the issuance of senior unsecured notes of $1.75 billion, as discussed further below. accordance with its investment policies.
Financing Activities
Applied used cash forin financing activities in the amount of $576$348 million for in fiscal 20102014, $519 million in fiscal 2013, and $281 million for$1.8 billion in fiscal 2009. Financing2012 which activities included payment of cash dividends to stockholders and issuances and repurchases of common stock. Applied did not repurchase any shares of its common stock during fiscal 2014. Cash used to repurchase shares totaled $468$245 million in fiscal 2011, $350 million2013 and $1.4 billion in fiscal 2010, and $23 million2012. The majority of these repurchases were made under a share repurchase program approved in fiscal 2009. In March 2010,2012 by Applied’s Board of Directors approved a new stock repurchase program authorizing up to $2.0$3.0 billion in repurchases over the next three years ending in March 2013.2015, of which $1.6 billion remained available for future stock repurchases at October 26, 2014. Proceeds from stock issuances related to equity compensation awards were $95$137 million in fiscal 2011, $1292014, $182 million in fiscal 2010,2013, and $62$96 million in fiscal 2009.The following table summarizes the dividends declared by
2012. During fiscal 2014, Applied’s Board of Directors during fiscal 2011: | | | | | | |
Date declared
| | Record date
| | Payable date
| | Amount per share
|
December 7, 2010
| | March 2, 2011 | | March 23, 2011 | | $ 0.07 |
March 8, 2011
| | June 1, 2011 | | June 22, 2011 | | $ 0.08 |
June 6, 2011
| | August 31, 2011 | | September 21, 2011 | | $ 0.08 |
September 13, 2011
| | November 23, 2011 | | December 14, 2011 | | $ 0.08 |
declared four quarterly cash dividends of
$0.10 per share each. During fiscal 2010,2013, Applied’s Board of Directors declared three quarterly cash dividends in the amount of $0.07$0.10 per share each and one quarterly cash dividend in the amount of $0.06$0.09 per share. During fiscal 2009,2012, Applied’s Board of Directors declared fourthree quarterly cash dividends in the amount of $0.06$0.09 per share each quarter.and one quarterly cash dividend of $0.08 per share. Cash paid in dividends during fiscal 2011, 20102014, 2013 and 20092012 amounted to $397$485 million $349, $456 million and $319$434 million, respectively. Applied currently anticipates that cash dividends will continue to be paid on a quarterly basis, although the declaration of any future cash dividend is at the discretion of the Board of Directors and will depend on Applied’s financial condition, results of operations, capital requirements, business conditions and other factors, as well as a determination by the Board of Directors that cash dividends are in the best interests of Applied’s stockholders. Applied has credit facilities for unsecured borrowings in various currencies of up to $1.6$1.6 billion, of which $1.5$1.5 billion is comprised of a committed four-year revolving credit agreement with a group of banks that is scheduled to expire in May 2015.2017. This agreement provides for borrowings in United States dollars at interest rates keyed to one of the two rates selected by Applied for each advance and includes financial and other covenants. These covenants with whichrequire Applied to maintain certain minimum financial ratios. Applied was in compliance with all such covenants at October 30, 2011.26, 2014. Remaining credit facilities in the amount of approximately $105$75 million are with Japanese banks. Applied’s ability to borrow under these facilities is subject to bank approval at the time of the borrowing request, and any advances will be at rates indexed to the banks’ prime reference rate denominated in Japanese yen. No amounts were outstanding under any of these facilities at both October 30, 201126, 2014 and October 31, 2010.27, 2013, and Applied has not utilized these credit facilities. In connection with the proposed business combination with TEL, Applied intends to amend or replace its undrawn $1.5 billion unsecured revolving credit agreement.
In fiscal 2011, Applied established a short-term commercial paper program of up to $1.5 billion. At October 30, 2011,26, 2014 and October 27, 2013, Applied did not have any commercial paper outstanding.In June 2011,
Applied issued senior unsecured notes
(the Notes) in the aggregate principal amount of
$1.75$1.95 billion. The following table summarizes the
Notes issued in June 2011: | | | | | | | | | | | | | | | | | | | | |
Due Date | | Principal
Amount | | | Stated
Interest Rate | | | Effective
Interest Rate | | | Interest
Pay Date | | | Interest Pay Date | |
| | | (In millions) | | | | | | | | | | |
June 15, 2016 | | $ | 400 | | | | 2.650 | % | | | 2.666 | % | | | June 15 | | | | December 15 | |
June 15, 2021 | | | 750 | | | | 4.300 | % | | | 4.326 | % | | | June 15 | | | | December 15 | |
June 15, 2041 | | | 600 | | | | 5.850 | % | | | 5.879 | % | | | June 15 | | | | December 15 | |
| | | | | | | | | | | | | | | | | | | | |
| | $ | 1,750 | | | | | | | | | | | | | | | | | |
| | | | | | | | | | | | | | | | | | | | |
notes issued:
|
| | | | | | | |
| Due Date | Principal Amount | | Effective Interest Rate | | Interest Payment Dates |
| | (In millions) | | | | |
| 2.650% Senior Notes Due 2016 | $ | 400 |
| | 2.666% | | June 15, December 15 |
| 7.125% Senior Notes Due 2017 | 200 |
| | 7.190% | | April 15, October 15 |
| 4.300% Senior Notes Due 2021 | 750 |
| | 4.326% | | June 15, December 15 |
| 5.850% Senior Notes Due 2041 | 600 |
| | 5.879% | | June 15, December 15 |
| | $ | 1,950 |
| | | | |
The indenture governing the Notesnotes includes certain covenants with which Applied was in compliance at October 30, 2011.26, 2014. See Note 10 of Notes to Consolidated Financial Statements for additional discussion of long-term debt.In November 2011,
Others
During fiscal 2014 and 2013, Applied completeddid not record any additional bad debt provision but released $16 million and $13 million, respectively, of its acquisitionallowance for doubtful accounts as a result of Varian. The aggregate purchase pricean overall lower risk profile of the acquisition was approximately $4.2 billion, net of cash acquired. See Business Combinations section above.Applied's customers. While Applied funded the transaction with a combination of existing cash balances, including proceeds from the Notes. Following the acquisition of Varian Applied’s cash, cash equivalentsbelieves that its allowance for doubtful accounts at October 26, 2014 is adequate, it will continue to closely monitor customer liquidity and investments totaled approximately $3.0 billion. After completion of the acquisition, Applied’s credit ratings remained unchanged. The Company’s long-term credit ratings are “A3” with Moody’s Investors Services and “A-” with Standard and Poor’s Ratings Services. The Company’s short term credit ratings, which were initiated in July, 2011, are “P-2” with Moody’s Investors Services and “A-2” with Standard and Poor’s Ratings Services.In the ordinary course of business, Applied provides standby letters of credit or other guarantee instruments to third parties as required for certain transactions initiated by either Applied or its subsidiaries. economic conditions.
As of October 30, 2011, the maximum potential amount of future payments that Applied could be required to make under these guarantee agreements was26, 2014, approximately $58 million. Applied has not recorded any liability in connection with these guarantee agreements beyond that required to appropriately account for the underlying transaction being guaranteed. Applied does not believe, based on historical experience and information currently available, that it is probable that any amounts will be required to be paid under these guarantee agreements.Applied also has agreements with various banks to facilitate subsidiary banking operations worldwide, including overdraft arrangements, issuance of bank guarantees, and letters of credit. As of October 30, 2011, Applied Materials Inc. has provided parent guarantees to banks for approximately $191 million to cover these services.
Applied’s investment portfolio consists principally of investment grade money market mutual funds, U.S. Treasury and agency securities, municipal bonds, corporate bonds and mortgage-backed and asset-backed securities, as well as equity securities. Applied regularly monitors the credit risk in its investment portfolio and takes appropriate measures, which may include the sale of certain securities, to manage such risks prudently in accordance with its investment policies.
As of October 30, 2011, less than $470 million$2.7 billion of cash, cash equivalents, and marketable securities was held by foreign subsidiaries of Applied. If these funds are needed for Applied’s operations in the U.S., Applied may be requiredsubject to accrue and pay U.S. taxes to repatriate these funds. Applied’s intent isif repatriated for U.S. operations. Of this amount, Applied intends to permanently reinvest approximately $2.1 billion of these funds outside of the U.S. and its current plans dodoes not demonstrate a needplan to repatriate these funds tofunds. For the remaining cash, cash equivalents and marketable securities held by foreign subsidiaries, U.S.
taxes have been provided for in the financial statements.
Although cash requirements will fluctuate based on the timing and extent of factors such as those discussed above, Applied’s management believes that cash generated from operations, together with the liquidity provided by existing cash balances and borrowing capability, will be sufficient to satisfy Applied’s liquidity requirements for the next 12 months. For further details regarding Applied’s operating, investing and financing activities, see the Consolidated Statements of Cash Flows in this report.
For details on standby letters of credit and other agreements with banks, see Off-Balance Sheet Arrangements
During below.
Off-Balance Sheet Arrangements
In the ordinary course of business, Applied provides standby letters of credit or other guarantee instruments to third parties as required for certain transactions initiated by either by Applied or its subsidiaries. As of October 30, 2011,26, 2014, the maximum potential amount of future payments that Applied could be required to make under these guarantee agreements was $58 million.approximately $46 million. Applied has not recorded any liability in connection with these guarantee agreements beyond that required to appropriately account for the underlying transaction being guaranteed. Applied does not believe, based on historical experience and information currently available, that it is probable that any amounts will be required to be paid under these guarantee agreements. Applied also has agreements with various banks to facilitate subsidiary banking operations worldwide, including overdraft arrangements, issuance of bank guarantees, and letters of credit. As of October 30, 2011,26, 2014, Applied Materials Inc. has provided parent guarantees to banks for approximately $191$102 million to cover these services.arrangements.
Applied also has operating leases for various facilities. Total rentalrent expense for operating leases was $44$37 million for fiscal 2011, $442014, $36 million for fiscal 2010,2013, and $55$38 million for fiscal 2009.2012. The following table summarizes Applied’s contractual obligations as of October 30, 2011: | | | | | | | | | | | | | | | | | | | | |
| | | Payments Due by Period | |
Contractual Obligations | | Total | | | Less Than
1 Year | | | 1-3
Years | | | 3-5
Years | | | More Than
5 Years | |
| | | (In millions) | |
Long-term debt obligations | | $ | 1,951 | | | $ | — | | | $ | 1 | | | $ | 400 | | | $ | 1,550 | |
Interest expense associated with long-term debt obligations | | | 1,515 | | | | 94 | | | | 184 | | | | 184 | | | | 1,053 | |
Operating lease obligations | | | 108 | | | | 33 | | | | 36 | | | | 18 | | | | 21 | |
Purchase obligations* | | | 3,184 | | | | 3,153 | | | | 29 | | | | 2 | | | | — | |
Other long-term liabilities | | | 221 | | | | 42 | | | | 57 | | | | 42 | | | | 80 | |
| | | | | | | | | | | | | | | | | | | | |
| | $ | 6,979 | | | $ | 3,322 | | | $ | 307 | | | $ | 646 | | | $ | 2,704 | |
| | | | | | | | | | | | | | | | | | | | |
|
| | | | | | | | | | | | | | | | | | | |
| | Payments Due by Period |
| Contractual Obligations | Total | | Less Than 1 Year | | 1-3 Years | | 3-5 Years | | More Than 5 Years |
| | | | | | | | | | |
| | (In millions) |
| Long-term debt obligations | $ | 1,950 |
| | $ | — |
| | $ | 600 |
| | $ | — |
| | $ | 1,350 |
|
| Interest expense associated with long-term debt obligations | 1,238 |
| | 92 |
| | 174 |
| | 135 |
| | 837 |
|
| Operating lease obligations | 70 |
| | 28 |
| | 28 |
| | 9 |
| | 5 |
|
Purchase obligations1 | 1,565 |
| | 1,527 |
| | 38 |
| | — |
| | — |
|
Other long-term liabilities2 | 254 |
| | — |
| | 55 |
| | 30 |
| | 169 |
|
| | $ | 5,077 |
| | $ | 1,647 |
| | $ | 895 |
| | $ | 174 |
| | $ | 2,361 |
|
______________________
* | |
1 | Represents Applied’s agreements to purchase goods and services consisting of Applied’s (a) outstanding purchase orders for goods and services; and (b) contractual requirements to make specified minimum payments even if Applied does not take delivery of the contracted goods. |
| |
2 | Other long-term liabilities do not include noncurrent income taxes payable, noncurrent deferred income taxes payable and certain tax-related liabilities due to the uncertainty in the timing of future payments. |
In addition to the contractual obligations disclosed above, the CompanyApplied has certain tax obligations. Gross interest and penalties and unrecognized tax benefits that are not expected to result in payment or receipt of cash within one year have been reported as non-current liabilities on the Consolidated Balance Sheet. As of October 30, 2011,26, 2014, the gross liability for unrecognized tax benefits was $59 million, exclusive of interest and penalties.$134 million. Increases or decreases to interest and penalties on uncertain tax positions are included in provision for income taxes in the Consolidated Statement of Operations. Interest and penalties related to uncertain tax positions were $1$25 million as of October 30, 201126, 2014 and $6$7 million as of October 31, 2010. All $1 million in interest27, 2013, and penalties iswere classified as long-term payablea noncurrent liability in the Consolidated Balance Sheets. At this time, the CompanyApplied is unable to make a reasonably reliable estimate of the timing of payments in individual years due to uncertainties in the timing of tax audit outcomes and, accordingly, such amounts are not included in the above contractual obligationobligations table.
Critical Accounting Policies and Estimates
The preparation of consolidated financial statements and related disclosures in conformity with accounting principles generally accepted in the United States of America requires management to make judgments, assumptions and estimates that affect the amounts reported. Note 1 of Notes to Consolidated Financial Statements
describes the significant accounting policies used in the preparation of the consolidated financial statements. Certain of these significant accounting policies are considered to be critical accounting policies.
A critical accounting policy is defined as one that is both material to the presentation of Applied’s consolidated financial statements and that requires management to make difficult, subjective or complex judgments that could have a material effect on Applied’s financial condition or results of operations. Specifically, these policies have the following attributes: (1) Applied is required to make assumptions about matters that are highly uncertain at the time of the estimate; and (2) different estimates Applied could reasonably have used, or changes in the estimate that are reasonably likely to occur, would have a material effect on Applied’s financial condition or results of operations.
Estimates and assumptions about future events and their effects cannot be determined with certainty. Applied bases its estimates on historical experience and on various other assumptions believed to be applicable and reasonable under the circumstances. These estimates may change as new events occur, as additional information is obtained and as Applied’s operating environment changes. These changes have historically been minor and have been included in the consolidated financial statements as soon as they became known. In addition, management is periodically faced with uncertainties, the outcomes of which are not within its control and will not be known for prolonged periods of time. These uncertainties include those discussed in Part I, Item 1A, “Risk Factors.” Based on a critical assessment of its accounting policies and the underlying judgments and uncertainties affecting the application of those policies, management believes that Applied’s consolidated financial statements are fairly stated in accordance with accounting principles generally accepted in the United States of America, and provide a meaningful presentation of Applied’s financial condition and results of operations.
Management believes that the following are critical accounting
policies:policies and estimates:
Applied recognizes revenue when all four revenue recognition criteria have been met: persuasive evidence of an arrangement exists; delivery has occurred or services have been rendered;
seller’ssales price
to buyer is fixed or determinable; and collectability is probable. Each sale arrangement may contain commercial terms that differ from other arrangements. In addition, Applied frequently enters into contracts that contain multiple deliverables. Judgment is required to properly identify the accounting units of the multiple deliverable transactions and to determine the manner in which revenue should be allocated among the accounting units. Moreover, judgment is used in interpreting the commercial terms and determining when all criteria of revenue recognition have been met in order for revenue recognition to occur in the appropriate accounting period. While changes in the allocation of the estimated sales price between the units of accounting will not affect the amount of total revenue recognized for a particular sales arrangement, any material changes in these allocations could impact the timing of revenue recognition, which could have a material effect on Applied’s financial condition and results of operations.
In 2009, the Financial Accounting Standards Board issued amended revenue recognition guidance for arrangements with multiple deliverables and certain software sold with tangible products. This guidance eliminated the residual method of revenue recognition and allows the use of management’s best estimate of selling price for individual elements of an arrangement when vendor specific evidence or third party evidence is unavailable. Applied implemented this guidance prospectively beginning in the first quarter of fiscal 2010 for transactions that were initiated or materially modified during fiscal 2010. The implementation of the new guidance had an insignificant impact on reported net sales compared to net sales under previous guidance, as the new guidance did not change the units of accounting within sales arrangements and the elimination of the residual method for the allocation of arrangement consideration had an inconsequential impact on the amount and timing of reported net sales.
Applied provides for the estimated cost of warranty when revenue is recognized. Estimated warranty costs are determined by analyzing specific product, current and historical configuration statistics and regional warranty
support costs. Applied’s warranty obligation is affected by product and component failure rates, material usage and labor costs incurred in correcting product failures during the warranty period. As Applied’s customer engineers and process support engineers are highly trained and deployed globally, labor availability is a significant factor in determining labor costs. The quantity and availability of critical replacement parts is another significant factor in estimating warranty costs. Unforeseen component failures or exceptional component performance can also result in changes to warranty costs. If actual warranty costs differ substantially from Applied’s estimates, revisions to the estimated warranty liability would be required, which could have a material adverse effect on Applied’s business, financial condition and results of operations.
Allowance for Doubtful Accounts
Applied maintains an allowance for doubtful accounts for estimated losses resulting from the inability of its customers to make required payments. This allowance is based on historical experience, credit evaluations, specific customer collection history and any customer-specific issues Applied has identified. Changes in circumstances, such as an unexpected material adverse change in a major customer’s ability to meet its financial obligation to Applied or its payment trends, may require Applied to further adjust its estimates of the recoverability of amounts due to Applied, which could have a material adverse effect on Applied’s business, financial condition and results of operations.
Inventories are generally stated at the lower of cost or market, with cost determined on a first-in, first-out basis. The carrying value of inventory is reduced for estimated obsolescence by the difference between its cost and the estimated market value based upon assumptions about future demand. Applied evaluates the inventory carrying value for potential excess and obsolete inventory exposures by analyzing historical and anticipated demand. In addition, inventories are evaluated for potential obsolescence due to the effect of known and anticipated engineering change orders and new products. If actual demand were to be substantially lower than estimated, additional adjustments for excess or obsolete inventory may be required, which could have a material adverse effect on Applied’s business, financial condition and results of operations.
Goodwill and Intangible Assets
Applied reviews goodwill and intangible assets for impairment whenever events or changes in circumstances indicate that the carrying amount of these assets may not be recoverable, and also annually reviews goodwill and intangibles with indefinite lives for impairment. Intangible assets, such as purchased technology, are generally recorded in connection with a business acquisition. The value assigned to intangible assets is usually based on estimates and judgments regarding expectations for the success and life cycle of products and technology acquired. If actual product acceptance differs significantly from the estimates, Applied may be required to record an impairment charge to reduce the carrying value of the reporting unit to its
realizableestimated fair value. The fair value of a reporting unit is estimated using both the income approach and the market approach taking into account such factors as future anticipated operating results and estimated cost of capital. Management uses significant judgment when assessing goodwill for potential impairment, especially in emerging markets. A severe decline in market
valueconditions could result in an unexpected impairment charge for impaired goodwill, which could have a material adverse effect on Applied’s business, financial condition and results of operations.
The effective tax rate is highly dependent upon the geographic composition of worldwide earnings, tax regulations governing each region,
non-tax deductiblenondeductible expenses incurred in connection with acquisitions and availability of tax credits. Management carefully monitors the changes in many factors and adjusts the effective
income tax rate as required. If actual results differ from these estimates, Applied could be required to record a valuation allowance on deferred tax assets or adjust its effective
income tax rate, which could have a material adverse effect on Applied’s business, financial condition and results of operations.
Applied accounts for income taxes by recognizing deferred tax assets and liabilities using statutory tax rates for the effect of temporary differences between the book and tax bases of recorded assets and liabilities, net operating losses and tax credit
carryforwards.carryovers. Deferred tax assets are also reduced by a valuation allowance if it is more likely than not that a portion of the deferred tax asset will not be realized. Management has determined that it is more likely than not that Applied’s future taxable income will be sufficient to realize its deferred tax assets, net of existing valuation allowance.
The calculation of tax liabilities involves significant judgment in estimating the impact of uncertainties in the application of complex tax laws. Resolution of these uncertainties in a manner inconsistent with Applied’s expectations could have a material impact on Applied’s results of operations and financial condition.
Non-GAAP
Adjusted Results
Management uses non-GAAP
adjusted results to evaluate
the Company’s operating and financial performance in light of business objectives and for planning purposes. Applied believes these measures enhance investors’ ability to review the Company’s business from the same perspective as
the Company’s management and facilitate comparisons of this period’s results with prior periods. The non-GAAP
adjusted results presented below exclude the impact of the following, where applicable:
certain items related to acquisitions or the announced business combination; restructuring
and asset impairment charges and any associated
adjustment related to restructuring actions, certain discrete tax items, certain acquisition-related costs, investmentadjustments; impairments
andof assets, goodwill, or investments; gain or loss on sale of
facilities.strategic investments or facilities; and certain tax items. These non-GAAP
adjusted measures are not in accordance with GAAP and may differ from non-GAAP methods of accounting and reporting used by other companies. The presentation of this additional information should not be considered a substitute for results prepared in accordance with GAAP.
Non-GAAP operating income
The following tables present a reconciliation of the GAAP and non-GAAP adjusted consolidated results for
the past three fiscal
2011 and 2010 were $2.4 billion and $1.7 billion, respectively. Non-GAAP operating loss for fiscal 2009 was $142 million.Non-GAAP net income for fiscal 2011 and 2010 were $1.7 billion or $1.30 per share and $1.2 billion or $0.88 per share, respectively. Non-GAAP net loss for fiscal 2009 was $69 million or $0.05 per share.
years:
APPLIED MATERIALS, INC.
UNAUDITED RECONCILIATION OF GAAP TO NON-GAAP ADJUSTED RESULTS
|
| | | | | | | | | | | | |
| | | 2014 | | 2013 | | 2012 |
| | | (In millions, except percentages) |
| Non-GAAP Adjusted Gross Margin | | | | | | |
| Reported gross margin - GAAP basis | | $ | 3,843 |
| | $ | 2,991 |
| | $ | 3,313 |
|
Certain items associated with acquisitions1 | | 158 |
| | 166 |
| | 253 |
|
| Acquisition integration costs | | 1 |
| | 3 |
| | — |
|
| Non-GAAP adjusted gross margin | | $ | 4,002 |
| | $ | 3,160 |
| | $ | 3,566 |
|
| Non-GAAP adjusted gross margin percent (% of net sales) | | 44.1 | % | | 42.1 | % | | 40.9 | % |
| Non-GAAP Adjusted Operating Income | | | | | | |
| Reported operating income - GAAP basis | | $ | 1,520 |
| | $ | 432 |
| | $ | 411 |
|
| Impairment of goodwill and intangible assets | | — |
| | 278 |
| | 421 |
|
Certain items associated with acquisitions1 | | 183 |
| | 201 |
| | 298 |
|
| Acquisition integration costs | | 34 |
| | 38 |
| | 81 |
|
| Loss (gain) on derivative associated with announced business combination, net | | (30 | ) | | 7 |
| | — |
|
Certain items associated with announced business combination4 | | 73 |
| | 17 |
| | — |
|
Restructuring charges and asset impairments2, 3 | | 5 |
| | 63 |
| | 168 |
|
| Gain on sale of facility | | (4 | ) | | (4 | ) | | — |
|
| Non-GAAP adjusted operating income | | $ | 1,781 |
| | $ | 1,032 |
| | $ | 1,379 |
|
| Non-GAAP adjusted operating margin percent (% of net sales) | | 19.6 | % | | 13.7 | % | | 15.8 | % |
| Non-GAAP Adjusted Net Income | | | | | | |
Reported net income - GAAP basis5 | | $ | 1,072 |
| | $ | 256 |
| | $ | 109 |
|
| Impairment of goodwill and intangible assets | | — |
| | 278 |
| | 421 |
|
Certain items associated with acquisitions1 | | 183 |
| | 201 |
| | 298 |
|
| Acquisition integration costs | | 34 |
| | 38 |
| | 81 |
|
| Loss (gain) on derivative associated with announced business combination, net | | (30 | ) | | 7 |
| | — |
|
Certain items associated with announced business combination4 | | 73 |
| | 17 |
| | — |
|
Restructuring charges and asset impairments2, 3 | | 5 |
| | 63 |
| | 168 |
|
| Impairment (gain on sale) of strategic investments, net | | (9 | ) | | 1 |
| | 17 |
|
| Gain on sale of facility | | (4 | ) | | (4 | ) | | — |
|
| Reinstatement of federal R&D tax credit | | — |
| | (13 | ) | | — |
|
Resolution of prior years’ income tax filings and other tax items5 | | 28 |
| | (24 | ) | | (22 | ) |
| Income tax effect of non-GAAP adjustments | | (38 | ) | | (102 | ) | | (112 | ) |
| Non-GAAP adjusted net income | | $ | 1,314 |
| | $ | 718 |
| | $ | 960 |
|
|
| |
| 1 | These items are incremental charges attributable to completed acquisitions, consisting of amortization of purchased intangible assets. |
| |
| 2 | Results for the twelve months ended October 27, 2013 included $39 million of employee-related costs, net, related to the restructuring program announced on October 3, 2012, and restructuring and asset impairment charges of $26 million related to the restructuring program announced on May 10, 2012, partially offset by a favorable adjustment of $2 million related to other restructuring plans. |
| |
| 3 | Results for the twelve months ended October 28, 2012 included employee-related costs of $106 million related to the restructuring program announced on October 3, 2012, restructuring and asset impairment charges of $48 million related to the restructuring program announced on May 10, 2012, and severance charges of $14 million related to the integration of Varian. |
| |
| 4 | These items are incremental charges related to the announced business combination agreement with Tokyo Electron Limited, consisting of acquisition-related and integration planning costs. |
| |
| 5 | Fiscal 2014 amount differs from the unaudited consolidated financial statements included in Applied’s press release issued on November 13, 2014, reflecting an increase to provision for income taxes of $34 million. This adjustment is not considered material and does not affect Applied’s previously announced Non-GAAP Adjusted Results. |
APPLIED MATERIALS, INC.
UNAUDITED RECONCILIATION OF GAAP TO NON-GAAP ADJUSTED RESULTS
|
| | | | | | | | | | | | |
| | | 2014 | | 2013 | | 2012 |
| | | (In millions, except per share amounts) |
| Non-GAAP Adjusted Earnings Per Diluted Share | | | | | | |
Reported earnings per diluted share - GAAP basis1 | | $ | 0.87 |
| | $ | 0.21 |
| | $ | 0.09 |
|
| Impairment of goodwill and intangible assets | | — |
| | 0.21 |
| | 0.33 |
|
| Certain items associated with acquisitions | | 0.13 |
| | 0.14 |
| | 0.19 |
|
| Acquisition integration costs | | 0.02 |
| | 0.02 |
| | 0.05 |
|
| Gain on derivative associated with announced business combination, net | | (0.02 | ) | | — |
| | — |
|
| Certain items associated with announced business combination | | 0.05 |
| | 0.01 |
| | — |
|
| Restructuring charges and asset impairments | | — |
| | 0.03 |
| | 0.10 |
|
| Impairment of strategic investments, net | | — |
| | — |
| | 0.01 |
|
Reinstatement of federal R&D tax credit and resolution of prior years’ income tax filings and other tax items1 | | 0.02 |
| | (0.03 | ) | | (0.02 | ) |
| Non-GAAP adjusted earnings per diluted share | | $ | 1.07 |
| | $ | 0.59 |
| | $ | 0.75 |
|
| Weighted average number of diluted shares | | 1,231 |
| | 1,219 |
| | 1,277 |
|
|
| |
| 1 | Fiscal 2014 amount differs from the unaudited consolidated financial statements included in Applied’s press release issued on November 13, 2014, reflecting an increase to provision for income taxes of $34 million and a decrease to earnings per diluted share of $0.03. This adjustment is not considered material and does not affect Applied’s previously announced Non-GAAP Adjusted Results. |
The following table presents a reconciliation of the GAAP and non-GAAP
adjusted segment results for the past three fiscal years:
UNAUDITED RECONCILIATION OF GAAP TO NON-GAAP
ADJUSTED RESULTS
| | | | | | | | | | | | |
| | | Twelve Months Ended | |
| (In millions, except per share amounts) | | October 30,
2011 | | | October 31,
2010 | | | October 25,
2009 | |
Non-GAAP Operating Income (Loss) | | | | | | | | | | | | |
Reported operating income (loss) GAAP basis | | $ | 2,398 | | | $ | 1,384 | | | $ | (394 | ) |
Certain items associated with acquisitions1 | | | 51 | | | | 91 | | | | 96 | |
Varian and Semitool deal cost | | | 19 | | | | 10 | | | | — | |
Restructuring charges and asset impairments2,3,4 | | | (30 | ) | | | 246 | | | | 156 | |
Gain on sale of facilities, net | | | (27 | ) | | | — | | | | — | |
| | | | | | | | | | | | |
Non-GAAP operating income | | $ | 2,411 | | | $ | 1,731 | | | $ | (142 | ) |
| | | | | | | | | | | | |
Non-GAAP Net Income (Loss) | | | | | | | | | | | | |
Reported net income (loss) GAAP basis | | $ | 1,926 | | | $ | 938 | | | $ | (305 | ) |
Certain items associated with acquisitions1 | | | 51 | | | | 91 | | | | 96 | |
Varian and Semitool deal cost | | | 19 | | | | 10 | | | | — | |
Restructuring charges and asset impairments2,3,4 | | | (30 | ) | | | 246 | | | | 156 | |
Impairment of equity method investment and strategic investments | | | 3 | | | | 13 | | | | 84 | |
Gain on sale of facilities, net | | | (27 | ) | | | — | | | | — | |
Reinstatement of federal R&D tax credit | | | (13 | ) | | | — | | | | — | |
Resolution of audits of prior years’ income tax filings | | | (203 | ) | | | — | | | | — | |
Income tax effect of non-GAAP adjustments | | | (3 | ) | | | (117 | ) | | | (100 | ) |
| | | | | | | | | | | | |
Non-GAAP net income | | $ | 1,723 | | | $ | 1,181 | | | $ | (69 | ) |
| | | | | | | | | | | | |
Non-GAAP Earnings (Loss) Per Diluted Share | | | | | | | | | | | | |
Reported earnings (loss) per diluted share GAAP basis | | $ | 1.45 | | | $ | 0.70 | | | $ | (0.23 | ) |
Certain items associated with acquisitions | | | 0.03 | | | | 0.05 | | | | 0.05 | |
Varian and Semitool deal cost | | | 0.01 | | | | 0.01 | | | | — | |
Restructuring charges and asset impairments | | | (0.01 | ) | | | 0.12 | | | | 0.08 | |
Impairment of equity method investment and strategic investments | | | — | | | | — | | | | 0.05 | |
Gain on sale of facilities, net | | | (0.02 | ) | | | — | | | | — | |
Reinstatement of federal R&D tax credit and resolution of audits of prior years’ income tax filings | | | (0.16 | ) | | | — | | | | — | |
Non-GAAP earnings (loss) per diluted share | | $ | 1.30 | | | $ | 0.88 | | | $ | (0.05 | ) |
Weighted average number of diluted shares | | | 1,330 | | | | 1,349 | | | | 1,333 | |
|
| | | | | | | | | | | | |
| | | 2014 | | 2013 | | 2012 |
| | | (In millions, except percentages) |
| SSG Non-GAAP Adjusted Operating Income | | | | | | |
| Reported operating income - GAAP basis | | $ | 1,391 |
| | $ | 876 |
| | $ | 1,243 |
|
Certain items associated with acquisitions1 | | 172 |
| | 175 |
| | 253 |
|
| Acquisition integration costs | | 2 |
| | (2 | ) | | 37 |
|
Restructuring charges and asset impairments2 | | — |
| | 1 |
| | 4 |
|
| Non-GAAP adjusted operating income | | $ | 1,565 |
| | $ | 1,050 |
| | $ | 1,537 |
|
| Non-GAAP adjusted operating margin percent (% of net sales) | | 26.2 | % | | 22.0 | % | | 27.8 | % |
| AGS Non-GAAP Adjusted Operating Income | | | | | | |
| Reported operating income - GAAP basis | | $ | 573 |
| | $ | 436 |
| | $ | 502 |
|
Certain items associated with acquisitions1 | | 3 |
| | 5 |
| | 13 |
|
Restructuring charges and asset impairments2, 3 | | — |
| | 2 |
| | 15 |
|
| Non-GAAP adjusted operating income | | $ | 576 |
| | $ | 443 |
| | $ | 530 |
|
| Non-GAAP adjusted operating margin percent (% of net sales) | | 26.2 | % | | 21.9 | % | | 23.2 | % |
| Display Non-GAAP Adjusted Operating Income | | | | | | |
| Reported operating income - GAAP basis | | $ | 129 |
| | $ | 74 |
| | $ | 25 |
|
Certain items associated with acquisitions1 | | 2 |
| | 6 |
| | 7 |
|
| Non-GAAP adjusted operating income | | $ | 131 |
| | $ | 80 |
| | $ | 32 |
|
| Non-GAAP adjusted operating margin percent (% of net sales) | | 21.3 | % | | 14.9 | % | | 6.8 | % |
| EES Non-GAAP Adjusted Operating Income (Loss) | | | | | | |
| Reported operating income (loss) - GAAP basis | | $ | 15 |
| | $ | (433 | ) | | $ | (668 | ) |
Certain items associated with acquisitions1 | | 6 |
| | 15 |
| | 25 |
|
| Impairment of goodwill and intangible assets | | — |
| | 278 |
| | 421 |
|
Restructuring charges and asset impairments2, 3 | | — |
| | 25 |
| | 38 |
|
| Non-GAAP adjusted operating income (loss) | | $ | 21 |
| | $ | (115 | ) | | $ | (184 | ) |
| Non-GAAP adjusted operating margin percent (% of net sales) | | 7.5 | % | | (66.5 | )% | | (43.3 | )% |
1 |
| |
| 1 | These items are incremental charges attributable to completed acquisitions, consisting of inventory fair value adjustments on products sold and amortization of purchased intangible assets. |
| |
| 2 | Results for fiscal 2011 included favorable adjustments of $36 million related to a restructuring program announced on July 21, 2010, $19 million related to a restructuring program announced on November 11, 2009, and $5 million related to a restructuring program announced on November 12, 2008, offset by asset impairment charges of $30 million primarily related to certain intangible assets.
|
3 | Results for fiscal 2010the twelve months ended October 27, 2013 included asset impairment charges of $108 million and restructuring charges of $45 million related to a restructuring program announced on July 21, 2010, restructuring charges of $84 million associated with a restructuring program announced on November 11, 2009, and asset impairment charges of $9$26 million related to a facility held for sale. |
4 | Results for fiscal 2009 included restructuring charges of $141 million primarily associated with athe restructuring program announced on November 12, 2008May 10, 2012 and severance charges of $2 million related to the integration of Varian. |
| |
| 3 | Results for the twelve months ended October 28, 2012 included restructuring and asset impairment charges of $15$43 million related to wafer cleaning equipment.the restructuring program announced on May 10, 2012 and severance charges of $14 million related to the integration of Varian. |
Note: The reconciliation of GAAP and non-GAAP adjusted segment results above does not include certain operating expenses that are managed separately at the corporate level and certain expenses that are not absorbed by the segments, which are reported within corporate and unallocated costs and included in consolidated operating income.
| |
| Item 7A: | Quantitative and Qualitative Disclosures About Market Risk |
Applied is exposed to interest rate risk related to its investment portfolio and debt issuances. Applied’s investment portfolio includes fixed-income securities with a fair value of approximately $1.1$1.0 billion at October 30, 2011.26, 2014. These securities are subject to interest rate risk and will decline in value if interest rates increase. Based on Applied’s investment portfolio at October 30, 2011,26, 2014, an immediate 100 basis point increase in interest rates would result in a decrease in the fair value of the portfolio of approximately $19$16 million. While an increase in interest rates reduces the fair value of the investment portfolio, Applied will not realize the losses in the consolidated statement of operations unless the individual fixed-income securities are sold prior to recovery or the loss is determined to be other-than-temporary. At October 30, 2011,26, 2014, the carrying amount of debt issued by Applied was $1.9 billion with an estimated fair value of $2.2 billion. A hypothetical decrease in interest rates of 100 basis points would result in an increase in the fair value of Applied’s debt issuances of approximately $215$180 million at October 30, 2011.26, 2014.
Certain operations of Applied are conducted in foreign currencies, such as Japanese yen, euro, Israeli shekel, Taiwanese dollar and Swiss franc. Applied enters into currency forward exchange and option contracts to hedge a portion of, but not all, existing and anticipated foreign currency denominated transactions generally expected to occur within the next 24 months. Gains and losses on these contracts are generally recognized in income at the time that the related transactions being hedged are recognized. Because the effect of movements in currency exchange rates on currency forward exchange and option contracts generally offsets the related effect on the underlying items being hedged, these financial instruments are not expected to subject Applied to risks that would otherwise result from changes in currency exchange rates. Applied does not use derivative financial instruments for trading or speculative purposes. Net
In certain cases, Applied uses derivatives to hedge specific foreign currency
gainsexposures. During fiscal 2014 and
losses were2013, as part of an overall risk management strategy, Applied purchased foreign exchange option contracts to limit its foreign exchange risk associated with the announced business combination with TEL in the event there is a significant weakening in the Japanese yen as compared to the U.S. dollar. The derivatives used to hedge the currency exposure did not
materialqualify for
hedge accounting treatment. At October 26, 2014, the fair value of the foreign exchange currency option contracts was approximately $52 million. Applied recorded an unrealized loss of $12 million during the fourth quarter of fiscal
2011.2014 related to such contracts. Changes in the exchange rate between the U.S. dollar and the Japanese yen would impact Applied's consolidated financial statements. The future maximum loss exposure on this option contract is generally limited to its fair value as of the most recent balance sheet date. For further details, see Note 5 of Notes to Consolidated Financial Statements.
| |
| Item 8: | Financial Statements and Supplementary Data |
The consolidated financial statements required by this Item are set forth on the pages indicated at Item 15(a).
| |
| Item 9: | Changes in and Disagreements with Accountants on Accounting and Financial Disclosure |
| |
| Item 9A: | Controls and Procedures |
Disclosure Controls and Procedures
As of the end of the period covered by this report, management of Applied conducted an evaluation, under the supervision and with the participation of Applied’s Chief Executive Officer and Chief Financial Officer, of the effectiveness of the design and operation of Applied’s disclosure controls and procedures, as such term is defined in Rule 13a-15(e) of the Securities Exchange Act of 1934 (the Exchange Act). Based upon that evaluation, Applied’s Chief Executive Officer and Chief Financial Officer concluded that Applied’s disclosure controls and procedures were effective as of the end of the period covered by this report in ensuring that information
required to be disclosed was recorded, processed, summarized and reported within the time periods specified in the SEC’s rules and forms, and to provide reasonable assurance that information required to be disclosed by Applied in such reports is accumulated and communicated to the Company’s management, including its Chief Executive Officer and Chief Financial Officer, as appropriate to allow timely decisions regarding required disclosure.
Management’s Report on Internal Control over Financial Reporting
Applied’s management is responsible for establishing and maintaining adequate internal control over financial reporting, as such term is defined in Rule 13a-15(f) of the Exchange Act. Under the supervision and with the participation of Applied’s Chief Executive Officer and Chief Financial Officer, management of Applied conducted an evaluation of the effectiveness of Applied’s internal control over financial reporting based upon the framework in “Internal Control — Integrated
Framework”Framework (1992)” issued by the Committee of Sponsoring Organizations of the Treadway Commission. Based on that evaluation, Applied’s management concluded that Applied’s internal control over financial reporting was effective as of October
30, 2011.26, 2014.
KPMG LLP, an independent registered public accounting firm, has audited the consolidated financial statements included in this Form 10-K and, as part of the audit, has issued a report, included herein, on the effectiveness of Applied’s internal control over financial reporting as of October
30, 2011.26, 2014.
Changes in Internal Control over Financial Reporting
During the fourth quarter of fiscal
2011,2014, there were no changes in the internal control over financial reporting that materially affected, or are reasonably likely to materially affect, Applied’s internal control over financial reporting.
Inherent Limitations of Disclosure Controls and Procedures and Internal Control over Financial Reporting
It should be noted that any system of controls, however well designed and operated, can provide only reasonable, and not absolute, assurance that the objectives of the system will be met. In addition, the design of any control system is based in part upon certain assumptions about the likelihood of future events.
| |
| Item 9B: | Other Information |
PART III
| |
| Item 10: | Directors, Executive Officers and Corporate Governance |
Except for the information regarding executive officers required by Item 401 of Regulation S-K (which is included in Part I, Item 1 of this Annual Report on Form 10-K, under “Executive Officers of the Registrant”) and code of ethics (which is set forth below), the information required by this item will be provided in accordance with Instruction G(3) to Form 10-K no later than February 23, 2015.
Applied has implemented the Standards of Business Conduct, a code of ethics with which every person who works for Applied and every member of the Board of Directors is expected to comply. If any substantive amendments are made to the Standards of Business Conduct or any waiver is granted, including any implicit waiver, from a provision of the code to Applied’s Chief Executive Officer, Chief Financial Officer or Chief Accounting Officer, Applied will disclose the nature of such amendment or waiver on its website or in a report on Form 8-K. The above information, including the Standards of Business Conduct, is available on Applied’s website under the Governance section at http://www.appliedmaterials.com/investor-relations. This website address is intended to be an inactive, textual reference only. None of the materials on, or accessible through, this website is part of this report or is incorporated by reference herein.
| |
| Item 11: | Executive Compensation |
The information required by this Item will be provided in accordance with Instruction G(3) to Form 10-K no later than February 23, 2015.
| |
| Item 12: | Security Ownership of Certain Beneficial Owners and Management and Related Stockholder Matters |
Except for the information regarding securities authorized for issuance under equity compensation plans (which is set forth below), the information required by this Item will be provided in accordance with Instruction G(3) to Form 10-K no later than February 23, 2015.
The following table summarizes information with respect to options and other equity awards under Applied’s equity compensation plans as of October 26, 2014:
Equity Compensation Plan Information
|
| | | | | | | | | | | |
| Plan Category | (a) Number of Securities to be Issued Upon Exercise of Outstanding Options, Warrants and Rights(1) | | | (b) Weighted Average Exercise Price of Outstanding Options, Warrants and Rights(2) | | (c) Number of Securities Available for Future Issuance Under Equity Compensation Plans (Excluding Securities Reflected in Column(a)) | |
| | | | | | | | |
| | (In millions, except prices) | |
| Equity compensation plans approved by security holders | 34 |
| | | $ | 15.06 |
| | 167 |
| (3) |
| Equity compensation plans not approved by security holders | 1 |
| (4) | | $ | 5.85 |
| | 11 |
| (5) |
| Total | 35 |
| | | $ | 10.87 |
| | 178 |
| |
| |
| (1) | Includes only options, restricted stock units performance shares and performance units outstanding under Applied’s equity compensation plans, as no stock warrants or other rights were outstanding as of October 26, 2014. |
| |
| (2) | The weighted average exercise price calculation does not take into account any restricted stock units, and performance shares or performance units as they have a de minimis purchase price. |
| |
| (3) | Includes 23 million shares of Applied common stock available for future issuance under the Applied Materials, Inc. Employees’ Stock Purchase Plan. Of these 23 million shares, 1 million are subject to purchase during the purchase period in effect as of October 26, 2014. |
| |
| (4) | Includes options to purchase 1 million shares of Applied common stock assumed through various mergers and acquisitions, after giving effect to the applicable exchange ratios. The assumed options had a weighted average exercise price of $5.85 per share. No further shares are available for issuance under the plans under which these assumed awards were granted. |
| |
| (5) | Includes 11 million shares of Applied common stock available for future issuance under the Applied Materials, Inc. Stock Purchase Plan for Offshore Employees. Of these 11 million shares, 1 million are subject to purchase during the purchase period in effect as of October 26, 2014. |
Applied has the following equity compensation plans that have not been approved by stockholders:
Stock Purchase Plan for Offshore Employees. The Stock Purchase Plan for Offshore Employees (the Offshore ESPP) was adopted effective as of October 16, 1995 for the benefit of employees of Applied’s participating affiliates (other than United States citizens or residents). The Offshore ESPP provides for the grant of options to purchase shares of Applied common stock through payroll deductions pursuant to one or more offerings. The administrator of the Offshore ESPP (the Board of Directors of Applied or a committee appointed by the Board) determines the terms and conditions of all options prior to the start of an offering, including the purchase price of shares, the number of shares covered by the option and when the option may be exercised. All options granted as part of an offering must be granted on the same date. As of October 26, 2014, a total of 36 million shares have been authorized for issuance under the Offshore ESPP, and 11 million shares remain available for issuance.
Applied Materials Profit Sharing Scheme. The Applied Materials Profit Sharing Scheme was adopted effective July 3, 1996 to enable employees of Applied Materials Ireland Limited and its participating subsidiaries to purchase Applied common stock at 100% of fair market value on the purchase date. Under this plan, eligible employees may elect to forego a certain portion of their base salary and certain bonuses they have earned and that otherwise would be payable in cash to purchase shares of Applied common stock at full fair market value. Since the eligible employees pay full fair market value for the shares, there is no reserved amount of shares under this plan and, accordingly, the table above does not include any set number of shares available for future issuance under the plan.
| |
| Item 13: | Certain Relationships and Related Transactions, and Director Independence |
The information required by this Item will be provided in accordance with Instruction G(3) to Form 10-K no later than February 23, 2015.
| |
| Item 14: | Principal Accounting Fees and Services |
The information required by this Item will be provided in accordance with Instruction G(3) to Form 10-K no later than February 23, 2015.
PART IV
| |
| Item 15: | Exhibits, Financial Statement Schedules |
(a) The following documents are filed as part of this Annual Report on Form 10-K:
|
| | |
| | Page Number |
| (1) | Financial Statements: | |
| | |
| | |
| | |
| | |
| | |
| | |
| | |
| | |
| | |
| | |
| | |
| | |
| | |
| | |
| | |
| (2) | Exhibits: | |
| | |
| | |
| | |
All other schedules are omitted because they are not applicable or the required information is shown in the Consolidated Financial Statements or Notes thereto.
REPORT OF INDEPENDENT REGISTERED PUBLIC ACCOUNTING FIRM
The Board of Directors and Stockholders
We have audited the accompanying consolidated balance sheets of Applied Materials, Inc. and subsidiaries (the Company) as of October 26, 2014 and October 27, 2013, and the related consolidated statements of operations, comprehensive income, stockholders’ equity, and cash flows for each of the years in the three‑year period ended October 26, 2014. These consolidated financial statements are the responsibility of the Company’s management. Our responsibility is to express an opinion on these consolidated financial statements based on our audits.
We conducted our audits in accordance with the standards of the Public Company Accounting Oversight Board (United States). Those standards require that we plan and perform the audit to obtain reasonable assurance about whether the financial statements are free of material misstatement. An audit includes examining, on a test basis, evidence supporting the amounts and disclosures in the financial statements. An audit also includes assessing the accounting principles used and significant estimates made by management, as well as evaluating the overall financial statement presentation. We believe that our audits provide a reasonable basis for our opinion.
In our opinion, the consolidated financial statements referred to above present fairly, in all material respects, the financial position of Applied Materials, Inc. and subsidiaries as of October 26, 2014 and October 27, 2013, and the results of their operations and their cash flows for each of the years in the three‑year period ended October 26, 2014, in conformity with U.S. generally accepted accounting principles.
We also have audited, in accordance with the standards of the Public Company Accounting Oversight Board (United States), Applied Materials, Inc.’s internal control over financial reporting as of October 26, 2014, based on criteria established in Internal Control - Integrated Framework (1992) issued by the Committee of Sponsoring Organizations of the Treadway Commission (COSO), and our report dated December 17, 2014 expressed an unqualified opinion on the effectiveness of the Company’s internal control over financial reporting.
Santa Clara, California
December 17, 2014
REPORT OF INDEPENDENT REGISTERED PUBLIC ACCOUNTING FIRM
The Board of Directors and Stockholders
Applied Materials, Inc.:
We have audited Applied Materials, Inc.’s (the Company) internal control over financial reporting as of October 30, 2011,26, 2014, based on criteria established in Internal Control —- Integrated Framework (1992) issued by the Committee of Sponsoring Organizations of the Treadway Commission (COSO). The Company’s management is responsible for maintaining effective internal control over financial reporting and for its assessment of the effectiveness of internal control over financial reporting, included in the accompanying Management’s Report on Internal Control over Financial Reporting in Item 9A. Our responsibility is to express an opinion on the Company’s internal control over financial reporting based on our audit. We conducted our audit in accordance with the standards of the Public Company Accounting Oversight Board (United States). Those standards require that we plan and perform the audit to obtain reasonable assurance about whether effective internal control over financial reporting was maintained in all material respects. Our audit included obtaining an understanding of internal control over financial reporting, assessing the risk that a material weakness exists, and testing and evaluating the design and operating effectiveness of internal control based on the assessed risk. Our audit also included performing such other procedures as we considered necessary in the circumstances. We believe that our audit provides a reasonable basis for our opinion.
A company’s internal control over financial reporting is a process designed to provide reasonable assurance regarding the reliability of financial reporting and the preparation of financial statements for external purposes in accordance with generally accepted accounting principles. A company’s internal control over financial reporting includes those policies and procedures that (1) pertain to the maintenance of records that, in reasonable detail, accurately and fairly reflect the transactions and dispositions of the assets of the company; (2) provide reasonable assurance that transactions are recorded as necessary to permit preparation of financial statements in accordance with generally accepted accounting principles, and that receipts and expenditures of the company are being made only in accordance with authorizations of management and directors of the company; and (3) provide reasonable assurance regarding prevention or timely detection of unauthorized acquisition, use, or disposition of the company’s assets that could have a material effect on the financial statements.
Because of its inherent limitations, internal control over financial reporting may not prevent or detect misstatements. Also, projections of any evaluation of effectiveness to future periods are subject to the risk that controls may become inadequate because of changes in conditions, or that the degree of compliance with the policies or procedures may deteriorate.
In our opinion, Applied Materials, Inc. maintained, in all material respects, effective internal control over financial reporting as of October 30, 2011,26, 2014, based on criteria established in Internal Control —- Integrated Framework (1992) issued by the Committee of Sponsoring Organizations of the Treadway Commission.Commission (COSO).
We also have audited, in accordance with the standards of the Public Company Accounting Oversight Board (United States), the consolidated balance sheets of Applied Materials, Inc. and subsidiaries as of October
30, 201126, 2014 and October
31, 2010,27, 2013, and the related consolidated statements of operations,
stockholders’ equity and comprehensive income,
(loss),stockholders’ equity, and cash flows for each of the years in the three-year period ended October
30, 2011. In connection with26, 2014, and our
audits of the consolidated financial statements, we also have audited financial statement schedule II. Our report dated December
6, 201117, 2014 expressed an unqualified opinion on those consolidated financial
statements and financial statement schedule.statements.
Mountain View,
December
6, 2011PART III
Pursuant to Paragraph G(3)17, 2014
Table of the General Instructions to Form 10-K, portions of the information required by Part III of Form 10-K are incorporated by reference from Applied’s Proxy Statement to be filed with the SEC in connection with the 2012 Annual Meeting of Stockholders (the Proxy Statement).Item 10: | Directors, Executive Officers and Corporate Governance |
(1) Information regarding directors, including director nominations, and Applied’s audit committee and audit committee financial expert, appears in the Proxy Statement under “Election of Directors,” and is incorporated herein by reference.
(2) For information with respect to Executive Officers, see Part I, Item 1 of this Annual Report on Form 10-K, under “Executive Officers of the Registrant.”
(3) Information regarding Section 16(a) beneficial ownership reporting compliance appears in the Proxy Statement under “Section 16(a) Beneficial Ownership Reporting Compliance,” and is incorporated herein by reference.
Applied has implemented the Standards of Business Conduct, a code of ethics with which every person who works for Applied and every member of the Board of Directors is expected to comply. If any substantive amendments are made to the Standards of Business Conduct or any waiver is granted, including any implicit waiver, from a provision of the code to Applied’s Chief Executive Officer, Chief Financial Officer or Chief Accounting Officer, Applied will disclose the nature of such amendment or waiver on its website or in a report on Form 8-K. The above information, including the Standards of Business Conduct, is available on Applied’s website under the Corporate Governance section athttp://investors.appliedmaterials.com.This website address is intended to be an inactive, textual reference only. None of the material on, or accessible through, this website is part of this report or is incorporated by reference herein.
Item 11: | Executive Compensation |
Information regarding executive compensation appears in the Proxy Statement under “Executive Compensation and Related Information” and is incorporated herein by reference.
Information regarding compensation committee interlocks and insider participation appears in the Proxy Statement under “Compensation Committee Interlocks and Insider Participation” and is incorporated herein by reference.
Information regarding the compensation committee report appears in the Proxy Statement under “Human Resources and Compensation Committee Report” and is incorporated herein by reference.
Item 12: | Security Ownership of Certain Beneficial Owners and Management and Related Stockholder Matters |
Information regarding the security ownership of certain beneficial owners and management appears in the Proxy Statement, under “Principal Stockholders,” and is incorporated herein by reference.
The following table summarizes information with respect to options and other equity awards under Applied’s equity compensation plans as of October 30, 2011:
Equity Compensation Plan Information
| | | | | | | | | | | | |
Plan Category | | (a)
Number of
Securities to be
Issued Upon Exercise
of Outstanding Options,
Warrants and
Rights(1) | | | (b)
Weighted Average
Exercise Price of
Outstanding Options,
Warrants and
Rights(2) | | | (c)
Number of Securities
Available for Future
Issuance Under Equity
Compensation Plans
(Excluding Securities
Reflected in
Column(a)) | |
| | | (In millions, except prices) | |
Equity compensation plans approved by security holders | | | 47 | | | $ | 10.85 | | | | 137 | (3) |
Equity compensation plans not approved by security holders | | | 11 | (4) | | $ | 16.98 | | | | 73 | (5) |
| | | | | | | | | | | | |
Total | | | 58 | | | $ | 13.05 | | | | 210 | |
| | | | | | | | | | | | |
(1) | Includes only options and restricted stock units (also referred to as “performance shares” under the Applied Materials, Inc. Employee Stock Incentive Plan) outstanding under Applied’s equity compensation plans, as no stock warrants or other rights were outstanding as of October 30, 2011. |
(2) | The weighted average exercise price calculation does not take into account any restricted stock units as they have a de minimis purchase price. |
(3) | Includes 50 million shares of Applied common stock available for future issuance under the Applied Materials, Inc. Employees’ Stock Purchase Plan. Of these 50 million shares, 2 million are subject to purchase during the purchase period in effect as of October 30, 2011. |
(4) | Includes options to purchase 1 million shares of Applied common stock assumed through various mergers and acquisitions, after giving effect to the applicable exchange ratios. The assumed options had a weighted average exercise price of $14.09 per share. No further shares are available for issuance under the plans under which these assumed awards were granted. |
(5) | Includes 3 million shares of Applied common stock available for future issuance under the Applied Materials, Inc. Stock Purchase Plan for Offshore Employees. Of these 3 million shares, 1 million are subject to purchase during the purchase period in effect as of October 30, 2011. |
In addition to the options and other equity awards under Applied’s plans as of October 30, 2011 described above, subsequent to the end of fiscal year 2011 and as part of the acquisition of Varian in November 2011, Applied assumed certain outstanding options under Varian’s two stock plans then in effect. After giving effect to the merger exchange ratio, these Varian options were converted into options to purchase 5 million shares of Applied common stock. The converted options had a weighted average exercise price of $4.85 per share. No further shares are available for issuance under the Varian plans.
Applied has the following equity compensation plans that have not been approved by stockholders:
2000 Global Equity Incentive PlanThe 2000 Global Equity Incentive Plan (the 2000 Plan) was adopted effective as of June 21, 2000. The 2000 Plan provides for the grant of non-qualified stock options to employees other than officers and directors. The administrator of the 2000 Plan (either the Board of Direc-
tors of Applied or a committee appointed by the Board) determines the terms and conditions of all stock options granted; provided, however, that (1) the exercise price generally may not be less than 100 percent of the fair market value (on the date of grant) of the stock covered by the option, and (2) the term of options can be no longer than 10 years (or 13 years in the event of death). A total of 147 million shares have been authorized for issuance under the 2000 Plan, and 70 million shares remain available for issuance as of October 30, 2011.
Stock Purchase Plan for Offshore EmployeesThe Stock Purchase Plan for Offshore Employees (the Offshore ESPP) was adopted effective as of October 16, 1995 for the benefit of employees of Applied’s participating affiliates (other than United States citizens or residents). The Offshore ESPP provides for the grant of options to purchase shares of Applied common stock through payroll deductions pursuant to one or more offerings. The administrator of the Offshore ESPP (the Board of Directors of Applied or a committee appointed by the Board) determines the terms and conditions of all options prior to the start of an offering, including the purchase price of shares, the number of shares covered by the option and when the option may be exercised. All options granted as part of an offering must be granted on the same date. Prior to December 7, 2009, a total of 16 million shares had been authorized for issuance under the Offshore ESPP. Effective December 7, 2009, Applied amended the Offshore ESPP to increase the number of shares available for issuance under such plan by 5 million shares and correspondingly amended the stockholder-approved Applied Materials, Inc. Employees’ Stock Purchase Plan (the U.S. ESPP) to reduce the number of shares available for issuance under such plan by 5 million shares. Accordingly, as of October 30, 2011 a total of 21 million shares have been authorized for issuance under the Offshore ESPP, and 3 million shares remain available for issuance. These plan amendments did not result in any increase in the total aggregate number of shares authorized for issuance under the Offshore ESPP and the U.S. ESPP.
Nonemployee Director Share Purchase PlanThe Applied Materials, Inc. Nonemployee Director Share Purchase Plan was adopted effective March 22, 2005. The Nonemployee Director Share Purchase Plan provides a method by which non-employee directors may purchase Applied common stock at 100% of fair market value on the purchase date by foregoing cash they have earned as retainer fees or meeting fees. The shares generally are purchased at the same time the directors otherwise would have been paid the fees in cash. Since the directors pay full fair market value for the shares, there is no reserved amount of shares under this plan and, accordingly, the table above does not include any set number of shares available for future issuance under the plan.
Applied Materials Profit Sharing SchemeThe Applied Materials Profit Sharing Scheme was adopted effective July 3, 1996 to enable employees of Applied Materials Ireland Limited and its participating subsidiaries to purchase Applied common stock at 100% of fair market value on the purchase date. Under this plan, eligible employees may elect to forego a certain portion of their base salary and certain bonuses they have earned and that otherwise would be payable in cash to purchase shares of Applied common stock at full fair market value. Since the eligible employees pay full fair market value for the shares, there is no reserved amount of shares under this plan and, accordingly, the table above does not include any set number of shares available for future issuance under the plan.
Item 13: | Certain Relationships and Related Transactions, and Director Independence |
The information appearing in the Proxy Statement under the heading “Certain Relationships and Related Transactions” is incorporated herein by reference.
The information appearing in the Proxy Statement under the heading “Director Independence” is incorporated herein by reference.
Item 14: | Principal Accounting Fees and Services |
Information regarding principal accounting fees and services and the audit committee’s preapproval policies and procedures appears in the Proxy Statement under the headings “Fees Paid to KPMG LLP” and “Policy on Audit Committee’s Pre-Approval of Audit and Permissible Non-audit Services of Independent Registered Public Accounting Firm,” is incorporated herein by reference.
ContentsPART IV
Item 15: | Exhibits and Financial Statement Schedules |
(a) The following documents are filed as part of this Annual Report on Form 10-K:
All other schedules are omitted because they are not applicable or the required information is shown in the Consolidated Financial Statements or Notes thereto.
CONSOLIDATED STATEMENTS OF OPERATIONS
| | | | | | | | | | | | |
Fiscal Year | | 2011 | | | 2010 | | | 2009 | |
| | | (In millions, except per share amounts) | |
Net sales | | $ | 10,517 | | | $ | 9,549 | | | $ | 5,014 | |
Cost of products sold | | | 6,157 | | | | 5,834 | | | | 3,583 | |
| | | | | | | | | | | | |
Gross margin | | | 4,360 | | | | 3,715 | | | | 1,431 | |
Operating expenses: | | | | | | | | | | | | |
Research, development and engineering | | | 1,118 | | | | 1,143 | | | | 934 | |
Selling, general and administrative | | | 901 | | | | 942 | | | | 735 | |
Restructuring charges and asset impairments (Note 11) | | | (30 | ) | | | 246 | | | | 156 | |
Gain on sale of facilities, net (Note 7) | | | (27 | ) | | | — | | | | — | |
| | | | | | | | | | | | |
Total operating expenses | | | 1,962 | | | | 2,331 | | | | 1,825 | |
Income (loss) from operations | | | 2,398 | | | | 1,384 | | | | (394 | ) |
Pre-tax loss of equity-method investment | | | — | | | | — | | | | 35 | |
Impairments of investments and strategic investments (Notes 3 and 4) | | | 3 | | | | 13 | | | | 84 | |
Interest and other expenses (Note 10) | | | 59 | | | | 21 | | | | 21 | |
Interest and other income, net | | | 42 | | | | 37 | | | | 48 | |
| | | | | | | | | | | | |
Income (loss) before income taxes | | | 2,378 | | | | 1,387 | | | | (486 | ) |
Provision (benefit) for income taxes | | | 452 | | | | 449 | | | | (181 | ) |
| | | | | | | | | | | | |
Net income (loss) | | $ | 1,926 | | | $ | 938 | | | $ | (305 | ) |
| | | | | | | | | | | | |
Earnings (loss) per share: | | | | | | | | | | | | |
Basic | | $ | 1.46 | | | $ | 0.70 | | | $ | (0.23 | ) |
Diluted | | $ | 1.45 | | | $ | 0.70 | | | $ | (0.23 | ) |
Weighted average number of shares: | | | | | | | | | | | | |
Basic | | | 1,319 | | | | 1,340 | | | | 1,333 | |
Diluted | | | 1,330 | | | | 1,349 | | | | 1,333 | |
|
| | | | | | | | | | | |
| Fiscal Year | 2014 | | 2013 | | 2012 |
| | (In millions, except per share amounts) |
| Net sales | $ | 9,072 |
| | $ | 7,509 |
| | $ | 8,719 |
|
| Cost of products sold | 5,229 |
| | 4,518 |
| | 5,406 |
|
| Gross margin | 3,843 |
| | 2,991 |
| | 3,313 |
|
| Operating expenses: | | | | | |
| Research, development and engineering | 1,428 |
| | 1,320 |
| | 1,237 |
|
| Marketing and selling | 423 |
| | 433 |
| | 481 |
|
| General and administrative | 467 |
| | 465 |
| | 595 |
|
| Impairment of goodwill and intangible assets | — |
| | 278 |
| | 421 |
|
| Restructuring charges and asset impairments | 5 |
| | 63 |
| | 168 |
|
| Total operating expenses | 2,323 |
| | 2,559 |
| | 2,902 |
|
| Income from operations | 1,520 |
| | 432 |
| | 411 |
|
| Interest expense | 95 |
| | 95 |
| | 95 |
|
| Interest and other income, net | 23 |
| | 13 |
| | — |
|
| Income before income taxes | 1,448 |
| | 350 |
| | 316 |
|
| Provision for income taxes | 376 |
| | 94 |
| | 207 |
|
| Net income | $ | 1,072 |
| | $ | 256 |
| | $ | 109 |
|
| Earnings per share: | | | | | |
| Basic | $ | 0.88 |
| | $ | 0.21 |
| | $ | 0.09 |
|
| Diluted | $ | 0.87 |
| | $ | 0.21 |
| | $ | 0.09 |
|
| Weighted average number of shares: | | | | | |
| Basic | 1,215 |
| | 1,202 |
| | 1,266 |
|
| Diluted | 1,231 |
| | 1,219 |
| | 1,277 |
|
See accompanying Notes to Consolidated Financial Statements.
CONSOLIDATED
BALANCE SHEETS | | | | | | | | |
| | | October 30,
2011 | | | October 31,
2010 | |
| | | (In millions, except per share
amounts) | |
| ASSETS | |
Current assets: | | | | | | | | |
Cash and cash equivalents (Notes 3 and 4) | | $ | 5,960 | | | $ | 1,858 | |
Short-term investments (Notes 3 and 4) | | | 283 | | | | 727 | |
Accounts receivable, net (Note 6) | | | 1,532 | | | | 1,831 | |
Inventories (Note 7) | | | 1,701 | | | | 1,547 | |
Deferred income taxes, net (Note 14) | | | 580 | | | | 513 | |
Other current assets | | | 299 | | | | 289 | |
| | | | | | | | |
Total current assets | | | 10,355 | | | | 6,765 | |
Long-term investments (Notes 3 and 4) | | | 931 | | | | 1,307 | |
Property, plant and equipment, net (Note 7) | | | 866 | | | | 963 | |
Goodwill (Note 8) | | | 1,335 | | | | 1,336 | |
Purchased technology and other intangible assets, net (Note 8) | | | 211 | | | | 287 | |
Deferred income taxes and other assets (Note 14) | | | 163 | | | | 285 | |
| | | | | | | | |
Total assets | | $ | 13,861 | | | $ | 10,943 | |
| | | | | | | | |
| LIABILITIES AND STOCKHOLDERS’ EQUITY | |
Current liabilities: | | | | | | | | |
Current portion of long-term debt (Note 10) | | $ | — | | | $ | 1 | |
Accounts payable and accrued expenses (Note 7) | | | 1,520 | | | | 1,766 | |
Customer deposits and deferred revenue (Note 7) | | | 1,116 | | | | 847 | |
Income taxes payable (Note 14) | | | 158 | | | | 274 | |
| | | | | | | | |
Total current liabilities | | | 2,794 | | | | 2,888 | |
Long-term debt (Note 10) | | | 1,947 | | | | 204 | |
Employee benefits and other liabilities (Note 13) | | | 320 | | | | 315 | |
| | | | | | | | |
Total liabilities | | | 5,061 | | | | 3,407 | |
| | | | | | | | |
Commitments and contingencies (Note 15) | | | | | | | | |
Stockholders’ equity (Note 12): | | | | | | | | |
Preferred stock: $.01 par value per share; 1 shares authorized; no shares issued | | | — | | | | — | |
Common stock: $.01 par value per share; 2,500 shares authorized; 1,306 and 1,328 shares outstanding at 2011 and 2010, respectively | | | 13 | | | | 13 | |
Additional paid-in capital | | | 5,616 | | | | 5,406 | |
Retained earnings | | | 13,029 | | | | 11,511 | |
Treasury stock: 573 and 537 shares at 2011 and 2010, respectively, net | | | (9,864 | ) | | | (9,396 | ) |
Accumulated other comprehensive income | | | 6 | | | | 2 | |
| | | | | | | | |
Total stockholders’ equity | | | 8,800 | | | | 7,536 | |
| | | | | | | | |
Total liabilities and stockholders’ equity | | $ | 13,861 | | | $ | 10,943 | |
| | | | | | | | |
STATEMENTS OF COMPREHENSIVE INCOME
|
| | | | | | | | | | | |
| Fiscal Year | 2014 | | 2013 | | 2012 |
| | (In millions) |
| Net income | $ | 1,072 |
| | $ | 256 |
| | $ | 109 |
|
| Other comprehensive income (loss), net of tax: | | | | | |
| Change in unrealized net gain on investments | (1 | ) | | 9 |
| | (1 | ) |
| Change in unrealized net gain on derivative investments | (2 | ) | | 1 |
| | 1 |
|
| Change in defined and postretirement benefit plans | (33 | ) | | 18 |
| | (65 | ) |
| Change in cumulative translation adjustments | (2 | ) | | (5 | ) | | (2 | ) |
| Other comprehensive income (loss), net of tax | (38 | ) | | 23 |
| | (67 | ) |
| Comprehensive income | $ | 1,034 |
| | $ | 279 |
| | $ | 42 |
|
See accompanying Notes to Consolidated Financial Statements.
APPLIED MATERIALS,
INCINC.
CONSOLIDATED
STATEMENTS OF STOCKHOLDERS’ EQUITYAND COMPREHENSIVE INCOME (LOSS)
| | | | | | | | | | | | | | | | | | | | | | | | | | | | | | | | |
| | | | | | Additional
Paid-In
Capital | | | | | | | | | | | | Accumulated
Other
Comprehensive
Income (Loss) | | | Total | |
| | | Common Stock | | | | Retained
Earnings | | | Treasury Stock | | | |
| | | Shares | | | Amount | | | | | Shares | | | Amount | | | |
| | | (In millions) | |
Balance at October 26, 2008 | | | 1,331 | | | $ | 13 | | | $ | 5,096 | | | $ | 11,601 | | | | 513 | | | $ | (9,134 | ) | | $ | (27 | ) | | $ | 7,549 | |
Components of comprehensive loss, net of tax: | | | | | | | | | | | | | | | | | | | | | | | | | | | | | | | | |
Net loss | | | — | | | | — | | | | — | | | | (305 | ) | | | — | | | | — | | | | — | | | | (305 | ) |
Change in unrealized net gain on investments | | | — | | | | — | | | | — | | | | — | | | | — | | | | — | | | | 45 | | | | 45 | |
Change in unrealized net gain on derivative instruments | | | — | | | | — | | | | — | | | | — | | | | — | | | | — | | | | (8 | ) | | | (8 | ) |
Change in defined benefit plan liability | | | — | | | | — | | | | — | | | | — | | | | — | | | | — | | | | (12 | ) | | | (12 | ) |
Change in retiree medical benefit | | | — | | | | — | | | | — | | | | — | | | | — | | | | — | | | | (1 | ) | | | (1 | ) |
Translation adjustments | | | — | | | | — | | | | — | | | | — | | | | — | | | | — | | | | 1 | | | | 1 | |
| | | | | | | | | | | | | | | | | | | | | | | | | | | | | | | | |
Comprehensive loss | | | | | | | | | | | | | | | | | | | | | | | | | | | | | | | (280 | ) |
Change in measurement date to apply authoritative guidance on defined benefit plans | | | — | | | | — | | | | — | | | | (2 | ) | | | — | | | | — | | | | — | | | | (2 | ) |
Dividends | | | — | | | | — | | | | — | | | | (320 | ) | | | — | | | | — | | | | — | | | | (320 | ) |
Share-based compensation | | | — | | | | — | | | | 147 | | | | — | | | | — | | | | — | | | | — | | | | 147 | |
Issuance under stock plans, net of a tax detriment of $13 and other | | | 12 | | | | — | | | | (48 | ) | | | (40 | ) | | | (7 | ) | | | 111 | | | | — | | | | 23 | |
Common stock repurchases | | | (2 | ) | | | — | | | | — | | | | — | | | | 2 | | | | (23 | ) | | | — | | | | (23 | ) |
| | | | | | | | | | | | | | | | | | | | | | | | | | | | | | | | |
Balance at October 25, 2009 | | | 1,341 | | | $ | 13 | | | $ | 5,195 | | | $ | 10,934 | | | | 508 | | | $ | (9,046 | ) | | $ | (2 | ) | | $ | 7,094 | |
Components of comprehensive income, net of tax: | | | | | | | | | | | | | | | | | | | | | | | | | | | | | | | | |
Net income | | | — | | | | — | | | | — | | | | 938 | | | | — | | | | — | | | | — | | | | 938 | |
Change in unrealized net gain on investments | | | — | | | | — | | | | — | | | | — | | | | — | | | | — | | | | 4 | | | | 4 | |
Change in unrealized net gain on derivative instruments | | | — | | | | — | | | | — | | | | — | | | | — | | | | — | | | | 4 | | | | 4 | |
Change in defined benefit plan liability | | | — | | | | — | | | | — | | | | — | | | | — | | | | — | | | | (6 | ) | | | (6 | ) |
Translation adjustments | | | — | | | | — | | | | — | | | | — | | | | — | | | | — | | | | 2 | | | | 2 | |
| | | | | | | | | | | | | | | | | | | | | | | | | | | | | | | | |
Comprehensive income | | | | | | | | | | | | | | | | | | | | | | | | | | | | | | | 942 | |
Dividends | | | — | | | | — | | | | — | | | | (361 | ) | | | — | | | | — | | | | — | | | | (361 | ) |
Share-based compensation | | | — | | | | — | | | | 126 | | | | — | | | | — | | | | — | | | | — | | | | 126 | |
Issuance under stock plans, net of a tax detriment of $28 and other | | | 16 | | | | — | | | | 85 | | | | — | | | | — | | | | — | | | | — | | | | 85 | |
Common stock repurchases | | | (29 | ) | | | — | | | | — | | | | — | | | | 29 | | | | (350 | ) | | | — | | | | (350 | ) |
| | | | | | | | | | | | | | | | | | | | | | | | | | | | | | | | |
Balance at October 31, 2010 | | | 1,328 | | | $ | 13 | | | $ | 5,406 | | | $ | 11,511 | | | | 537 | | | $ | (9,396 | ) | | $ | 2 | | | $ | 7,536 | |
Components of comprehensive income, net of tax: | | | | | | | | | | | | | | | | | | | | | | | | | | | | | | | | |
Net income | | | — | | | | — | | | | — | | | | 1,926 | | | | — | | | | — | | | | — | | | | 1,926 | |
Change in unrealized net gain on investments | | | — | | | | — | | | | — | | | | — | | | | — | | | | — | | | | (8 | ) | | | (8 | ) |
Change in unrealized net gain on derivative instruments | | | — | | | | — | | | | — | | | | — | | | | — | | | | — | | | | (4 | ) | | | (4 | ) |
Change in defined benefit plan liability | | | — | | | | — | | | | — | | | | — | | | | — | | | | — | | | | 14 | | | | 14 | |
Translation adjustments | | | — | | | | — | | | | — | | | | — | | | | — | | | | — | | | | 2 | | | | 2 | |
| | | | | | | | | | | | | | | | | | | | | | | | | | | | | | | | |
Comprehensive income | | | | | | | | | | | | | | | | | | | | | | | | | | | | | | | 1,930 | |
Dividends | | | — | | | | — | | | | — | | | | (408 | ) | | | — | | | | — | | | | — | | | | (408 | ) |
Share-based compensation | | | — | | | | — | | | | 146 | | | | — | | | | — | | | | — | | | | — | | | | 146 | |
Issuance under stock plans, net of a tax detriment of $5 and other | | | 14 | | | | — | | | | 64 | | | | — | | | | — | | | | — | | | | — | | | | 64 | |
Common stock repurchases | | | (36 | ) | | | — | | | | — | | | | — | | | | 36 | | | | (468 | ) | | | — | | | | (468 | ) |
| | | | | | | | | | | | | | | | | | | | | | | | | | | | | | | | |
Balance at October 30, 2011 | | | 1,306 | | | $ | 13 | | | $ | 5,616 | | | $ | 13,029 | | | | 573 | | | $ | (9,864 | ) | | $ | 6 | | | $ | 8,800 | |
| | | | | | | | | | | | | | | | | | | | | | | | | | | | | | | | |
BALANCE SHEETS
|
| | | | | | | |
| | October 26,
2014 | | October 27,
2013 |
| | | | |
| | (In millions, except per share amounts) |
| ASSETS |
| Current assets: | | | |
| Cash and cash equivalents | $ | 3,002 |
| | $ | 1,711 |
|
| Short-term investments | 160 |
| | 180 |
|
| Accounts receivable, net | 1,670 |
| | 1,633 |
|
| Inventories | 1,567 |
| | 1,413 |
|
| Other current assets | 568 |
| | 705 |
|
| Total current assets | 6,967 |
| | 5,642 |
|
| Long-term investments | 935 |
| | 1,005 |
|
| Property, plant and equipment, net | 861 |
| | 850 |
|
| Goodwill | 3,304 |
| | 3,294 |
|
| Purchased technology and other intangible assets, net | 951 |
| | 1,103 |
|
| Deferred income taxes and other assets | 156 |
| | 149 |
|
| Total assets | $ | 13,174 |
| | $ | 12,043 |
|
| | | | |
| LIABILITIES AND STOCKHOLDERS’ EQUITY |
| Current liabilities: | | | |
| Accounts payable and accrued expenses | $ | 1,883 |
| | $ | 1,649 |
|
| Customer deposits and deferred revenue | 940 |
| | 794 |
|
| Total current liabilities | 2,823 |
| | 2,443 |
|
| Long-term debt | 1,947 |
| | 1,946 |
|
| Other liabilities | 536 |
| | 566 |
|
| Total liabilities | 5,306 |
| | 4,955 |
|
| Commitments and contingencies (Note 15) |
| |
|
| Stockholders’ equity: | | | |
| Preferred stock: $.01 par value per share; 1 shares authorized; no shares issued | — |
| | — |
|
| Common stock: $.01 par value per share; 2,500 shares authorized; 1,221 and 1,204 shares outstanding at 2014 and 2013, respectively | 12 |
| | 12 |
|
| Additional paid-in capital | 6,384 |
| | 6,151 |
|
| Retained earnings | 13,072 |
| | 12,487 |
|
| Treasury stock: 717 shares at 2014 and 2013, net | (11,524 | ) | | (11,524 | ) |
| Accumulated other comprehensive loss | (76 | ) | | (38 | ) |
| Total stockholders’ equity | 7,868 |
| | 7,088 |
|
| Total liabilities and stockholders’ equity | $ | 13,174 |
| | $ | 12,043 |
|
See accompanying Notes to Consolidated Financial Statements.
APPLIED MATERIALS,
INC.INC
CONSOLIDATED STATEMENTS OF
CASH FLOWS | | | | | | | | | | | | |
Fiscal Year | | 2011 | | | 2010 | | | 2009 | |
| | | (In millions) | |
Cash flows from operating activities: | | | | | | | | | | | | |
Net income (loss) | | $ | 1,926 | | | $ | 938 | | | $ | (305 | ) |
Adjustments required to reconcile net income (loss) to cash provided by operating activities: | | | | | | | | | | | | |
Depreciation and amortization | | | 246 | | | | 305 | | | | 291 | |
Net loss (gain) on dispositions and fixed asset retirements | | | (13 | ) | | | 20 | | | | 24 | |
Provision for bad debts | | | 5 | | | | 17 | | | | 63 | |
Restructuring charges and asset impairments | | | (30 | ) | | | 246 | | | | 156 | |
Deferred income taxes | | | 122 | | | | (186 | ) | | | 19 | |
Net recognized loss on investments | | | 19 | | | | 20 | | | | 10 | |
Pre-tax loss of equity method investment | | | — | | | | — | | | | 35 | |
Impairments of investments | | | — | | | | 13 | | | | 84 | |
Share-based compensation | | | 146 | | | | 126 | | | | 147 | |
Changes in operating assets and liabilities, net of amounts acquired: | | | | | | | | | | | | |
Accounts receivable | | | 292 | | | | (767 | ) | | | 587 | |
Inventories | | | (163 | ) | | | 145 | | | | 360 | |
Other current assets | | | (23 | ) | | | 179 | | | | 36 | |
Other assets | | | (38 | ) | | | (7 | ) | | | (7 | ) |
Accounts payable and accrued expenses | | | (221 | ) | | | 469 | | | | (660 | ) |
Customer deposits and deferred revenue | | | 267 | | | | (23 | ) | | | (362 | ) |
Income taxes payable | | | (89 | ) | | | 262 | | | | (229 | ) |
Employee benefits and other liabilities | | | (20 | ) | | | (34 | ) | | | 84 | |
| | | | | | | | | | | | |
Cash provided by operating activities | | | 2,426 | | | | 1,723 | | | | 333 | |
| | | | | | | | | | | | |
Cash flows from investing activities: | | | | | | | | | | | | |
Capital expenditures | | | (209 | ) | | | (169 | ) | | | (249 | ) |
Cash paid for acquisitions, net of cash acquired | | | — | | | | (323 | ) | | | — | |
Proceeds from sale of facilities and dispositions | | | 130 | | | | — | | | | — | |
Proceeds from sales and maturities of investments | | | 1,926 | | | | 1,408 | | | | 1,317 | |
Purchases of investments | | | (1,137 | ) | | | (1,778 | ) | | | (956 | ) |
| | | | | | | | | | | | |
Cash provided by (used in) investing activities | | | 710 | | | | (862 | ) | | | 112 | |
| | | | | | | | | | | | |
Cash flows from financing activities: | | | | | | | | | | | | |
Debt borrowings (repayments), net | | | 1,744 | | | | (6 | ) | | | (1 | ) |
Payments of debt issuance costs | | | (14 | ) | | | — | | | | — | |
Proceeds from common stock issuances | | | 95 | | | | 129 | | | | 62 | |
Common stock repurchases | | | (468 | ) | | | (350 | ) | | | (23 | ) |
Payments of dividends to stockholders | | | (397 | ) | | | (349 | ) | | | (319 | ) |
| | | | | | | | | | | | |
Cash provided by (used in) financing activities | | | 960 | | | | (576 | ) | | | (281 | ) |
| | | | | | | | | | | | |
Effect of exchange rate changes on cash and cash equivalents | | | 6 | | | | (3 | ) | | | 1 | |
| | | | | | | | | | | | |
Increase in cash and cash equivalents | | | 4,102 | | | | 282 | | | | 165 | |
Cash and cash equivalents — beginning of year | | | 1,858 | | | | 1,576 | | | | 1,411 | |
| | | | | | | | | | | | |
Cash and cash equivalents — end of year | | $ | 5,960 | | | $ | 1,858 | | | $ | 1,576 | |
| | | | | | | | | | | | |
Supplemental cash flow information: | | | | | | | | | | | | |
Cash payments for income taxes | | $ | 761 | | | $ | 388 | | | $ | 207 | |
Cash refunds from income taxes | | $ | 289 | | | $ | 201 | | | $ | 72 | |
Cash payments for interest | | $ | 14 | | | $ | 14 | | | $ | 14 | |
STOCKHOLDERS’ EQUITY
|
| | | | | | | | | | | | | | | | | | | | | | | | | | | | | |
| | Common Stock | | Additional Paid-In Capital | | Retained Earnings | | Treasury Stock | | Accumulated Other Comprehensive Income (Loss) | | Total |
| | Shares | | Amount | | | | Shares | | Amount | | |
| | | | | | | | | | | | | | | | |
| | (In millions) |
| Balance at October 30, 2011 | 1,306 |
| | $ | 13 |
| | $ | 5,616 |
| | $ | 13,029 |
| | 573 |
| | $ | (9,864 | ) | | $ | 6 |
| | $ | 8,800 |
|
| Net income | — |
| | — |
| | — |
| | 109 |
| | — |
| | — |
| | — |
| | 109 |
|
| Other comprehensive loss, net of tax | — |
| | — |
| | — |
| | — |
| | — |
| | — |
| | (67 | ) | | (67 | ) |
| Dividends | — |
| | — |
| | — |
| | (438 | ) | | — |
| | — |
| | — |
| | (438 | ) |
| Share-based compensation | — |
| | — |
| | 182 |
| | — |
| | — |
| | — |
| | — |
| | 182 |
|
| Stock options assumed in connection with acquisition | — |
| | — |
| | 11 |
| | — |
| | — |
| | — |
| | — |
| | 11 |
|
| Issuance under stock plans, net of a tax detriment of $12 and other | 17 |
| | — |
| | 54 |
| | — |
| | — |
| | — |
| | — |
| | 54 |
|
| Common stock repurchases | (126 | ) | | (1 | ) | | — |
| | — |
| | 126 |
| | (1,415 | ) | | — |
| | (1,416 | ) |
| Balance at October 28, 2012 | 1,197 |
| | $ | 12 |
| | $ | 5,863 |
| | $ | 12,700 |
| | 699 |
| | $ | (11,279 | ) | | $ | (61 | ) | | $ | 7,235 |
|
| Net income | — |
| | — |
| | — |
| | 256 |
| | — |
| | — |
| | — |
| | 256 |
|
| Other comprehensive income, net of tax | — |
| | — |
| | — |
| | — |
| | — |
| | — |
| | 23 |
| | 23 |
|
| Dividends | — |
| | — |
| | — |
| | (469 | ) | | — |
| | — |
| | — |
| | (469 | ) |
| Share-based compensation | — |
| | — |
| | 162 |
| | — |
| | — |
| | — |
| | — |
| | 162 |
|
| Issuance under stock plans, net of a tax benefit of $14 and other | 25 |
| | — |
| | 126 |
| | — |
| | — |
| | — |
| | — |
| | 126 |
|
| Common stock repurchases | (18 | ) | | — |
| | — |
| | — |
| | 18 |
| | (245 | ) | | — |
| | (245 | ) |
| Balance at October 27, 2013 | 1,204 |
| | $ | 12 |
| | $ | 6,151 |
| | $ | 12,487 |
| | 717 |
| | $ | (11,524 | ) | | $ | (38 | ) | | $ | 7,088 |
|
| Net income | — |
| | — |
| | — |
| | 1,072 |
| | — |
| | — |
| | — |
| | 1,072 |
|
| Other comprehensive loss, net of tax | — |
| | — |
| | — |
| | — |
| | — |
| | — |
| | (38 | ) | | (38 | ) |
| Dividends | — |
| | — |
| | — |
| | (487 | ) | | — |
| | — |
| | — |
| | (487 | ) |
| Share-based compensation | — |
| | — |
| | 177 |
| | — |
| | — |
| | — |
| | — |
| | 177 |
|
| Issuance under stock plans, net of a tax benefit of $27 and other | 17 |
| | — |
| | 56 |
| | — |
| | — |
| | — |
| | — |
| | 56 |
|
| Balance at October 26, 2014 | 1,221 |
| | $ | 12 |
| | $ | 6,384 |
| | $ | 13,072 |
| | 717 |
| | $ | (11,524 | ) | | $ | (76 | ) | | $ | 7,868 |
|
See accompanying Notes to Consolidated Financial Statements.
CONSOLIDATED STATEMENTS OF CASH FLOWS
|
| | | | | | | | | | | |
| Fiscal Year | 2014 | | 2013 | | 2012 |
| | | | | | |
| | (In millions) |
| Cash flows from operating activities: | | | | | |
| Net income | $ | 1,072 |
| | $ | 256 |
| | $ | 109 |
|
| Adjustments required to reconcile net income to cash provided by operating activities: | | | | | |
| Depreciation and amortization | 375 |
| | 410 |
| | 422 |
|
| Impairment of goodwill and intangible assets | — |
| | 278 |
| | 421 |
|
| Restructuring charges and asset impairments | 5 |
| | 63 |
| | 168 |
|
| Unrealized loss on derivative associated with announced business combination | 21 |
| | 7 |
| | — |
|
| Deferred income taxes and other | 36 |
| | (91 | ) | | 222 |
|
| Share-based compensation | 177 |
| | 162 |
| | 182 |
|
| Changes in operating assets and liabilities, net of amounts acquired: | | | | | |
| Accounts receivable | (21 | ) | | (404 | ) | | 493 |
|
| Inventories | (154 | ) | | (141 | ) | | 679 |
|
| Other assets | 5 |
| | (70 | ) | | 46 |
|
| Accounts payable and accrued expenses | 79 |
| | 21 |
| | (435 | ) |
| Customer deposits and deferred revenue | 146 |
| | 39 |
| | (412 | ) |
| Income taxes payable | 142 |
| | 57 |
| | (34 | ) |
| Other liabilities | (83 | ) | | 36 |
| | (10 | ) |
| Cash provided by operating activities | 1,800 |
| | 623 |
| | 1,851 |
|
| Cash flows from investing activities: | | | | | |
| Capital expenditures | (241 | ) | | (197 | ) | | (162 | ) |
| Cash paid for acquisitions, net of cash acquired | (12 | ) | | (1 | ) | | (4,190 | ) |
| Proceeds from sale of facilities | 25 |
| | 7 |
| | — |
|
| Proceeds from sales and maturities of investments | 878 |
| | 1,013 |
| | 1,019 |
|
| Purchases of investments | (811 | ) | | (607 | ) | | (1,327 | ) |
| Cash provided by (used in) investing activities | (161 | ) | | 215 |
| | (4,660 | ) |
| Cash flows from financing activities: | | | | | |
| Proceeds from common stock issuances and others, net | 137 |
| | 182 |
| | 96 |
|
| Common stock repurchases | — |
| | (245 | ) | | (1,416 | ) |
| Payments of dividends to stockholders | (485 | ) | | (456 | ) | | (434 | ) |
| Cash used in financing activities | (348 | ) | | (519 | ) | | (1,754 | ) |
| Effect of exchange rate changes on cash and cash equivalents | — |
| | — |
| | (5 | ) |
| Increase (decrease) in cash and cash equivalents | 1,291 |
| | 319 |
| | (4,568 | ) |
| Cash and cash equivalents — beginning of year | 1,711 |
| | 1,392 |
| | 5,960 |
|
| Cash and cash equivalents — end of year | $ | 3,002 |
| | $ | 1,711 |
| | $ | 1,392 |
|
| Supplemental cash flow information: | | | | | |
| Cash payments for income taxes | $ | 195 |
| | $ | 196 |
| | $ | 243 |
|
| Cash refunds from income taxes | $ | 111 |
| | $ | 102 |
| | $ | 79 |
|
| Cash payments for interest | $ | 92 |
| | $ | 92 |
| | $ | 94 |
|
See accompanying Notes to Consolidated Financial Statements.
APPLIED MATERIALS, INC.
NOTES TO CONSOLIDATED FINANCIAL STATEMENTS
| |
| Note 1 | Summary of Significant Accounting Policies |
Principles of Consolidation and Basis of Presentation
The consolidated financial statements include the accounts of Applied Materials, Inc. and its subsidiaries (Applied or the Company) after elimination of intercompany balances and transactions. All references to a fiscal year apply to Applied’s fiscal year which ends on the last Sunday in October. Fiscal
20112014, 2013 and
20092012 contained 52 weeks
each, while fiscal 2010 contained 53 weeks.each. Each fiscal quarter of
20112014, 2013 and
20092012 contained 13 weeks.
The first quarter of fiscal 2010 contained 14 weeks, while the second, third, and fourth quarters of fiscal 2010 contained 13 weeks.
Certain prior year amounts have been reclassified to conform to current year presentation.
The preparation of financial statements in conformity with accounting principles generally accepted in the United States of America requires management to make judgments, estimates and assumptions that affect the amounts reported in the financial statements and accompanying notes. Actual results could differ materially from those estimates. On an ongoing basis, Applied evaluates its estimates, including those related to accounts receivable and sales allowances, fair values of financial instruments, inventories, intangible assets and goodwill, useful lives of intangible assets and property and equipment, fair values of share-based awards, and income taxes, among others. Applied bases its estimates on historical experience and on various other assumptions that are believed to be reasonable, the results of which form the basis for making judgments about the carrying values of assets and liabilities.
All highly-liquid investments with a remaining maturity of three months or less at the time of purchase are considered to be cash equivalents. Cash equivalents consist primarily of investments in institutional money market funds.
All of Applied’s investments,
except equity investments held in privately-held companies, are classified as available-for-sale at the respective balance sheet dates. Investments classified as available-for-sale are recorded at fair value based upon quoted market prices, and any temporary difference between the cost and fair value of an investment is presented as a separate component of accumulated other comprehensive income (loss). The specific identification method is used to determine the gains and losses on investments.
Interest earned on cash and investments, as well as realized gains and losses on sale of securities, are included in interest income in the accompanying Consolidated Statements of Operations.
Equity investments in privately-held companies are generally accounted for under the cost method of accounting and are periodically assessed for other-than-temporary impairment when an event or circumstance indicates that an other-than-temporary decline in value may have occurred.
Allowance for Doubtful Accounts
Applied maintains an allowance for doubtful accounts for estimated losses resulting from the inability of its customers to make required payments. This allowance is based on historical experience, credit evaluations, specific customer collection history and any customer-specific issues Applied has identified. Changes in circumstances, such as an unexpected material adverse change in a major customer’s ability to meet its financial obligation to Applied or its payment trends, may require Applied to further adjust its estimates of the recoverability of amounts due to Applied. Bad debt expense and any reversals are recorded in marketing and selling expense in the Consolidated Statement of Operations.
APPLIED MATERIALS, INC.
NOTES TO CONSOLIDATED FINANCIAL STATEMENTS — (Continued)
Inventories are stated at the lower of cost or market, with cost determined on a first-in, first-out (FIFO) basis. Applied adjusts inventory carrying value for estimated obsolescence equal to the difference between the cost of inventory and the estimated market value based upon assumptions about future demand and market conditions. Applied fully reserves for inventories and noncancelable purchase orders for inventory deemed obsolete. Applied performs periodic reviews of inventory items to identify excess inventories on hand by comparing on-hand balances to anticipated usage using recent historical activity as well as anticipated or forecasted demand. If estimates of customer demand diminish further or market conditions become less favorable than those projected by Applied, additional inventory adjustments may be required.
During fiscal 2010, Applied incurred inventory-related charges, including $330 million associated with SunFab™ thin film solar equipment.APPLIED MATERIALS, INC.
NOTES TO CONSOLIDATED FINANCIAL STATEMENTS — (Continued)
Property, Plant and Equipment
Property, plant and equipment is stated at cost. Depreciation is provided over the estimated useful lives of the assets using the straight-line method. Estimated useful lives for financial reporting purposes are as follows: buildings and improvements, 3 to 30 years; demonstration and manufacturing equipment, 3 to 5 years; software, 3 to 5 years; and furniture, fixtures and other equipment, 3 to 15 years. Land improvements are amortized over the shorter of 15 years or the estimated useful life. Leasehold improvements are amortized over the shorter of five years or the lease term.
Goodwill and indefinite-lived assets are not amortized, but are reviewed for impairment annually during the fourth quarter of each fiscal year.year and whenever events or changes in circumstances indicate that the carrying value of an asset may not be recoverable. Purchased technology and other intangible assets are presented at cost, net of accumulated amortization, and are amortized over their estimated useful lives of 1 to 15 years using the straight-line method.
Applied reviews long-lived assets for impairment whenever events or changes in circumstances indicate that the carrying amount of these assets
or asset group may not be recoverable. Applied assesses these assets for impairment based on estimated future cash flows from these assets.
Business Combinations
Effective in the first quarter of fiscal 2010, Applied adopted revised authoritative guidance on business combinations that covers the measurement of acquirer shares issued as consideration for a business combination, the recognition of contingent consideration, the accounting for pre-acquisition gain and loss contingencies, the recognition of capitalized in-process research and development, the accounting for acquisition-related restructuring cost accruals, the treatment of acquisition-related transaction costs, and the recognition of changes in the acquirer’s income tax valuation allowance. This authoritative guidance also revised the accounting for both increases and decreases in a parent’s controlling ownership interest.
Research, Development and Engineering Costs
Research, development and engineering costs are expensed as incurred.
Sales and Value Added Taxes
Taxes collected from customers and remitted to governmental authorities are presented on a net basis in the accompanying Consolidated Statements of Operations.
Warranty
Applied provides for the estimated cost of warranty when revenue is recognized. Estimated warranty costs are determined by analyzing specific product, current and historical configuration statistics and regional warranty support costs. Applied's warranty obligation is affected by product and component failure rates, material usage and labor costs incurred in correcting product failures during the warranty period. If actual warranty costs differ substantially from Applied's estimates, revisions to the estimated warranty liability would be required.
Income tax expense is based on pretax earnings. Deferred tax assets and liabilities are recognized for the expected tax consequences of temporary differences between the book and tax bases of recorded assets and liabilities, net operating losses and tax credit carryforwards.
Restructuring
From time to time, Applied initiates restructuring activities to appropriately align its cost structure relative to prevailing economic and industry conditions and associated customer demand as well as in connection with certain acquisitions. Costs associated with restructuring actions can include termination benefits and related charges in addition to facility closure, contract termination and other related activities. Costs associated with restructuring activities are included in restructuring charges and asset impairments in the Consolidated Statements of Operations.
APPLIED MATERIALS, INC.
NOTES TO CONSOLIDATED FINANCIAL STATEMENTS — (Continued)
Applied recognizes revenue when all four revenue recognition criteria have been met: persuasive evidence of an arrangement exists; delivery has occurred or services have been rendered; seller’s price to buyer is fixed or
APPLIED MATERIALS, INC.
NOTES TO CONSOLIDATED FINANCIAL STATEMENTS — (Continued)
determinable; and collectability is probable. Applied’s shipping terms are customarily FOB Applied shipping point or equivalent terms. Applied’s revenue recognition policy generally results in revenue recognition at the following points: (1) for all transactions where legal title passes to the customer upon shipment or delivery, Applied recognizes revenue upon shipmentpassage of title for all products that have been demonstrated to meet product specifications prior to shipment; the portion of revenue associated with certain installation-related tasks is deferred, and that revenue is recognized upon completion of the installation-related tasks; (2) for products that have not been demonstrated to meet product specifications prior to shipment, revenue is recognized at customer technical acceptance; (3) for transactions where legal title does not pass at shipment or delivery, revenue is recognized when legal title passes to the customer, which is generally at customer technical acceptance; and (4) for arrangements containing multiple elements and initiated at or prior to October 25, 2009, the last day of fiscal 2009, the revenue relating to the undelivered elements is deferred at their estimated relative fair values until delivery of the deferred elements; and (5) for arrangements initiated or materially modified subsequent to October 25, 2009 containing multiple elements, the revenue relating to the undelivered elements is deferred using the relative selling price method utilizing estimated sales prices until delivery of the deferred elements. Applied limits the amount of revenue recognition for delivered elements to the amount that is not contingent on the future delivery of products or services, future performance obligations or subject to customer-specified return or adjustment. In cases where Applied has sold products that have been demonstrated to meet product specifications prior to shipment, Applied believes that at the time of delivery, it has an enforceable claim to amounts recognized as revenue. The completed contract method is used for SunFab™ thin film production lines. Spare parts revenue is generally recognized upon shipment, and services revenue is generally recognized over the period that the services are provided.
Applied elected to early adopt amended accounting standards issued by the Financial Accounting Standards Board (FASB) for multiple deliverable revenue arrangements on a prospective basis for applicable transactions originating or materially modified after October 25, 2009. The standard changed the requirements for establishing separate units of accounting in a multiple element arrangement and requires the allocation of arrangement consideration to each deliverable to be based on the relative selling price. The FASB also amended the accounting standards for revenue recognition to exclude software that is contained in a tangible product from the scope of software revenue guidance when the software is essential to the tangible product’s functionality. Implementation of this new authoritative guidance had an insignificant impact on reported net sales compared to net sales under previous guidance, as the new guidance did not change the units of accounting within sales arrangements and the elimination of the residual method for the allocation of arrangement consideration had an inconsequential impact on the amount and timing of reported net sales.
For fiscal 2010 and subsequent periods, when
When a sales arrangement contains multiple elements, such as hardware and services and/or software products, Applied allocates revenue to each element based on a selling price hierarchy. The selling price for a deliverable is based on its vendor specific objective evidence (VSOE) if available, third party evidence (TPE) if VSOE is not available, or estimated selling price (ESP) if neither VSOE nor TPE is available. Applied generally utilizes the ESP due to the nature of its products. In multiple element arrangements where more-than-incidental software deliverables are included, revenue is allocated to each separate unit of accounting for each of the non-software deliverables and to the software deliverables as a group using the relative selling prices of each of the deliverables in the arrangement based on the aforementioned selling price hierarchy. If the arrangement contains more than one software deliverable, the arrangement consideration allocated to the software deliverables as a group is then allocated to each software deliverable using the guidance for recognizing software
revenue, as amended.revenue.
Derivative Financial Instruments
Applied uses financial instruments, such as forward exchange and currency option contracts, to hedge a portion of, but not all, existing and anticipated foreign currency denominated transactions typically expected to occur within 24 months. The terms of currency instruments used for hedging purposes are generally consistent
APPLIED MATERIALS, INC.
NOTES TO CONSOLIDATED FINANCIAL STATEMENTS — (Continued)
with the timing of the transactions being hedged. The purpose of Applied’s foreign currency management is to mitigate the effect of exchange rate fluctuations on certain foreign currency denominated revenues, costs and eventual cash flows. All of Applied’s derivative financial instruments are recorded at fair value based upon quoted market prices for comparable instruments. For derivative instruments designated and qualifying as cash flow hedges of anticipated foreign currency denominated transactions, the effective portion of the gain or loss on these hedges is reported as a component of accumulated other comprehensive income (loss) in stockholders’ equity, and is reclassified into earnings when the hedged transaction affects earnings. If the transaction being hedged fails to occur, or if a portion of any derivative is ineffective, the gain or loss on the associated financial instrument is recorded promptly in earnings. For derivative instruments used to hedge existing foreign currency denominated assets or liabilities, the gain or loss on these hedges is recorded promptly in earnings to offset the changes in the fair value of the assets or liabilities being hedged. Applied does not use derivative financial instruments for trading or speculative purposes.
Foreign
Currency TranslationCurrencies
As of October 30, 2011,26, 2014, primarily all of Applied’s subsidiaries use the United States dollar as their functional currency. Accordingly, assets and liabilities of these subsidiaries are translatedremeasured using exchange rates in effect at the end of the period, except for non-monetary assets, such as inventories and property, plant and equipment, which are translatedremeasured using historical exchange rates. RevenuesForeign currency-denominated revenues and costs are translatedremeasured using average exchange rates for the period, except for costs related to those balance sheet items that are translatedremeasured using historical exchange rates. The resulting translationremeasurement gains and losses are included in general and administrative expenses in the Consolidated Statements of Operations as incurred.
APPLIED MATERIALS, INC.
NOTES TO CONSOLIDATED FINANCIAL STATEMENTS — (Continued)
Concentrations of Credit Risk
Financial instruments that potentially subject Applied to significant concentrations of credit risk consist principally of cash equivalents, investments, trade accounts receivable and derivative financial instruments used in hedging activities. Applied invests in a variety of financial instruments, such as, but not limited to, certificates of deposit, corporate and municipal bonds, United States Treasury and agency securities, and asset-backed and mortgage-backed securities, and, by policy, limits the amount of credit exposure with any one financial institution or commercial issuer. Applied performs ongoing credit evaluations of its customers’ financial condition and generally requires no collateral to secure accounts receivable. Applied maintains an allowance reserve for potentially uncollectible accounts receivable based on its assessment of the collectability of accounts receivable. Applied regularly reviews the allowance by considering factors such as historical experience, credit quality, age of the accounts receivable balances, and current economic conditions that may affect a customer’s ability to pay. In addition, Applied utilizes letters of credit to mitigate credit risk when considered appropriate. Applied is exposed to credit-related losses in the event of nonperformance by counterparties to derivative financial instruments, but does not expect any counterparties to fail to meet their obligations.
In some instances, Applied has entered into security arrangements which require the counterparties to post collateral to further mitigate credit exposure.
Recent Accounting Pronouncements
In
September 2011,May 2014, the
FASBFinancial Accounting Standards Board (FASB) issued authoritative guidance
that requires revenue recognition to
allow entitiesdepict the transfer of promised goods or services to
use a
qualitative approachcustomer in an amount that reflects the consideration to
test goodwillwhich the entity expects to be entitled in exchange for
impairment.those goods or services. This
authoritativenew standard will supersede most current revenue recognition guidance,
permits an entity to first perform a qualitative assessment to determine whether it is more likely than not that the fair value of a reporting unit is less than its carrying value. If it is concluded that this is the case, it is necessary to perform the two-step goodwill impairment test. Otherwise, the two-step goodwill impairment test is not required. Thisincluding industry-specific guidance. The guidance
is effective for annual and interim goodwill impairment tests performed for fiscal years beginning after December 15, 2011 and earlier adoption is permitted. Applied elected to adopt this authoritative guidance in fiscal 2011. The implementation of this authoritative guidance had no impact on Applied’s financial position or results of operations.APPLIED MATERIALS, INC.
NOTES TO CONSOLIDATED FINANCIAL STATEMENTS — (Continued)
In June 2011, the FASB issued authoritative guidance on the presentation of comprehensive income to require an entity to present the total of comprehensive income, the components of net income, and the components of other comprehensive income either in a single continuous statement of comprehensive income or in two separate but consecutive statements. This authoritative guidance eliminates the option to present the components of other comprehensive income as part of the statement of equity. This guidance isbecomes effective for Applied in the first quarter of fiscal 2012, with early adoption permitted,2018, and shouldcan be applied retrospectively. The implementationeither retrospectively or as a cumulative-effect adjustment as of the date of adoption. Early adoption is prohibited. Applied is currently evaluating the effect of this authoritativenew guidance will change only the presentation of comprehensive income and will have no impact on Applied’sApplied's financial position, or results of operations.
operations and its ongoing financial reporting, including the selection of a transition method.
In
May 2011,April 2014, the FASB issued authoritative guidance
that raises the threshold for a disposal transaction to
providequalify as a
consistent definitiondiscontinued operation and requires additional disclosures about discontinued operations and disposals of
fair value and ensureindividually significant components that
the fair value measurement and disclosure requirements are similar between U.S. GAAP and International Financial Reporting Standards. Thisdo not qualify as discontinued operations. The authoritative guidance
limits the highest-and-best-use measure to nonfinancial assets, permits certain financial assets and liabilities with offsetting positions in market or counterparty credit risks to be measured on a net basis, and provides guidance on the applicability of premiums and discounts. This authoritative guidance also expands the disclosures on Level 3 inputs by requiring quantitative disclosure of the unobservable inputs and assumptions, as well as description of the valuation processes and the sensitivity of the fair value to changes in unobservable inputs. The new guidance will bebecomes effective
prospectively for Applied in the first quarter of fiscal
2012. The implementation of this authoritative guidance2016. Early adoption is
permitted, but only for disposals that have not
expected to have a material impact on Applied’sbeen reported in financial
position or results of operations.statements previously issued.
In
December 2010, the FASB amended its existing guidance for goodwill and other intangible assets. This authoritative guidance modifies Step 1 of the goodwill impairment test for reporting units with zero or negative carrying amounts. For those reporting units, an entity is required to perform Step 2 of the goodwill impairment test if there are qualitative factors indicating that it is more likely than not that a goodwill impairment exists. The qualitative factors are consistent with the existing guidance which requires goodwill of a reporting unit to be tested for impairment between annual tests if an event occurs or circumstances change that would more likely than not reduce the fair value of a reporting unit below its carrying amount. This authoritative guidance becomes effective for Applied in the first quarter fiscal 2012. The implementation of this authoritative guidance is not expected to have a material impact on Applied’s financial position or results of operations.In December 2010,July 2013, the FASB issued authoritative guidance on business combinations. This authoritative guidance requiresthat will require an unrecognized tax benefit to be presented as a public entity that presents comparative financial statements to disclose the revenue and earningsreduction of the combined entity as though the business combinations that occurred during the current year had occurred as of the beginning of the prior annual reporting period. In addition, this authoritative guidance expands the supplemental pro forma disclosures to include a description of the nature and amount of material, nonrecurring pro forma adjustments directly attributable to the business combination included in the reported pro forma revenue and earnings. This authoritative guidance is effective prospectivelydeferred tax asset for business combinations for which the acquisition date is ona net operating loss carryforward, a similar tax loss or after the beginning of the first annual reporting period beginning on or after December 15, 2010. Thisa tax credit carryforward, with certain exceptions. The authoritative guidance becomes effective for Applied in the first quarter of fiscal 2012.
2015, with early adoption permitted. The guidance is not expected to have a significant impact on Applied's financial position.
APPLIED MATERIALS, INC.
NOTES TO CONSOLIDATED FINANCIAL STATEMENTS — (Continued)
| |
| Note 2 | Earnings (Loss) Per Share |
Basic earnings (loss) per share is determined using the weighted average number of common shares outstanding during the period. Diluted earnings (loss) per share is determined using the weighted average number of common shares and potential common shares (representing the dilutive effect of stock options, restricted stock units, and employee stock purchase plansplan shares) outstanding during the period. Applied’s net income (loss) has not been adjusted for any period presented for purposes of computing basic or diluted earnings (loss) per share due to the Company’s non-complex capital structure. For purposes
|
| | | | | | | | | | | |
| | 2014 | | 2013 | | 2012 |
| | | | | | |
| | (In millions, except per share amounts) |
| Numerator: | | | | | |
| Net income | $ | 1,072 |
| | $ | 256 |
| | $ | 109 |
|
| Denominator: | | | | | |
| Weighted average common shares outstanding | 1,215 |
| | 1,202 |
| | 1,266 |
|
| Effect of dilutive stock options, restricted stock units and employee stock purchase plan shares | 16 |
| | 17 |
| | 11 |
|
| Denominator for diluted earnings per share | 1,231 |
| | 1,219 |
| | 1,277 |
|
| Basic earnings per share | $ | 0.88 |
| | $ | 0.21 |
| | $ | 0.09 |
|
| Diluted earnings per share | $ | 0.87 |
| | $ | 0.21 |
| | $ | 0.09 |
|
| Potentially dilutive securities | 1 |
| | 2 |
| | 9 |
|
Potentially dilutive securities attributable to outstanding stock options and restricted stock units were excluded from the calculation of
computing diluted earnings
(loss) per share
weightedbecause the combined exercise price, average
potential common shares do not includeunamortized fair value and assumed tax benefits upon the exercise of options and the vesting of restricted stock
options with an exercise priceunits were greater than the average
fair market
valueprice of Applied common stock,
for the period as the effectand therefore their inclusion would
behave been anti-dilutive.
NOTES TO CONSOLIDATED FINANCIAL STATEMENTS — (Continued)
Potential common shares have not been included in the calculation of diluted net loss per share for the fiscal year ended October 25, 2009 as the effect would be anti-dilutive. As such, the numerator and the denominator used in computing both basic and diluted net loss per share for the fiscal year ended October 25, 2009 are the same.
| | | | | | | | | | | | |
| | | 2011 | | | 2010 | | | 2009 | |
| | | (In millions, except per share amounts) | |
Numerator: | | | | | | | | | | | | |
Net income (loss) | | $ | 1,926 | | | $ | 938 | | | $ | (305 | ) |
Denominator: | | | | | | | | | | | | |
Weighted average common shares outstanding | | | 1,319 | | | | 1,340 | | | | 1,333 | |
Effect of dilutive stock options, restricted stock units and employee stock purchase plans shares | | | 11 | | | | 9 | | | | — | |
| | | | | | | | | | | | |
Denominator for diluted earnings (loss) per share | | | 1,330 | | | | 1,349 | | | | 1,333 | |
| | | | | | | | | | | | |
Basic earnings (loss) per share | | $ | 1.46 | | | $ | 0.70 | | | $ | (0.23 | ) |
Diluted earnings (loss) per share | | $ | 1.45 | | | $ | 0.70 | | | $ | (0.23 | ) |
| | | |
Potentially dilutive securities | | | 16 | | | | 34 | | | | 85 | |
| |
| Note 3 | Cash, Cash Equivalents and Investments |
Summary of Cash, Cash Equivalents and Investments
The following tables summarize Applied’s cash, cash equivalents and investments by security type:
| | | | | | | | | | | | | | | | |
October 30, 2011 | | Cost | | | Gross
Unrealized
Gains | | | Gross
Unrealized
Losses | | | Estimated
Fair Value | |
| | | (In millions) | |
Cash | | $ | 297 | | | $ | — | | | $ | — | | | $ | 297 | |
| | | | | | | | | | | | | | | | |
Cash equivalents: | | | | | | | | | | | | | | | | |
Money market funds | | | 5,663 | | | | — | | | | — | | | | 5,663 | |
| | | | | | | | | | | | | | | | |
Total Cash equivalents | | | 5,663 | | | | — | | | | — | | | | 5,663 | |
| | | | | | | | | | | | | | | | |
Total Cash and Cash equivalents | | $ | 5,960 | | | $ | — | | | $ | — | | | $ | 5,960 | |
| | | | | | | | | | | | | | | | |
Short-term and long-term investments: | | | | | | | | | | | | | | | | |
U.S. Treasury and agency securities | | $ | 184 | | | $ | 1 | | | $ | — | | | $ | 185 | |
Obligations of states and political subdivisions | | | 371 | | | | 2 | | | | — | | | | 373 | |
U.S. commercial paper, corporate bonds and medium-term notes | | | 256 | | | | 3 | | | | 1 | | | | 258 | |
Other debt securities* | | | 307 | | | | 3 | | | | 1 | | | | 309 | |
| | | | | | | | | | | | | | | | |
Total fixed income securities | | | 1,118 | | | | 9 | | | | 2 | | | | 1,125 | |
Publicly traded equity securities | | | 8 | | | | 19 | | | | — | | | | 27 | |
Equity investments in privately-held companies | | | 62 | | | | — | | | | — | | | | 62 | |
| | | | | | | | | | | | | | | | |
Total short-term and long-term investments | | $ | 1,188 | | | $ | 28 | | | $ | 2 | | | $ | 1,214 | |
| | | | | | | | | | | | | | | | |
Total Cash, Cash equivalents and Investments | | $ | 7,148 | | | $ | 28 | | | $ | 2 | | | $ | 7,174 | |
| | | | | | | | | | | | | | | | |
|
| | | | | | | | | | | | | | | |
| October 26, 2014 | Cost | | Gross Unrealized Gains | | Gross Unrealized Losses | | Estimated Fair Value |
| | | | | | | | |
| | (In millions) |
| Cash | $ | 508 |
| | $ | — |
| | $ | — |
| | $ | 508 |
|
| Cash equivalents: | | | | | | | |
| Money market funds | 2,494 |
| | — |
| | — |
| | 2,494 |
|
| Total Cash equivalents | 2,494 |
| | — |
| | — |
| | 2,494 |
|
| Total Cash and Cash equivalents | $ | 3,002 |
| | $ | — |
| | $ | — |
| | $ | 3,002 |
|
| Short-term and long-term investments: | | | | | | | |
| U.S. Treasury and agency securities | $ | 62 |
| | $ | — |
| | $ | — |
| | $ | 62 |
|
| Non-U.S. government securities* | 14 |
| | — |
| | — |
| | 14 |
|
| Municipal securities | 391 |
| | 2 |
| | — |
| | 393 |
|
| Commercial paper, corporate bonds and medium-term notes | 223 |
| | 1 |
| | — |
| | 224 |
|
| Asset-backed and mortgage-backed securities | 287 |
| | 1 |
| | 2 |
| | 286 |
|
| Total fixed income securities | 977 |
| | 4 |
| | 2 |
| | 979 |
|
| Publicly traded equity securities | 19 |
| | 31 |
| | — |
| | 50 |
|
| Equity investments in privately-held companies | 66 |
| | — |
| | — |
| | 66 |
|
| Total short-term and long-term investments | $ | 1,062 |
| | $ | 35 |
| | $ | 2 |
| | $ | 1,095 |
|
| Total Cash, Cash equivalents and Investments | $ | 4,064 |
| | $ | 35 |
| | $ | 2 |
| | $ | 4,097 |
|
_________________________
* Includes agency debt securities guaranteed by non-U.S. governments, which consist of Germany and Canada.
NOTES TO CONSOLIDATED FINANCIAL STATEMENTS — (Continued)
| | | | | | | | | | | | | | | | |
October 31, 2010 | | Cost | | | Gross
Unrealized
Gains | | | Gross
Unrealized
Losses | | | Estimated
Fair Value | |
| | | (In millions) | |
Cash | | $ | 701 | | | $ | — | | | $ | — | | | $ | 701 | |
| | | | | | | | | | | | | | | | |
Cash equivalents: | | | | | | | | | | | | | | | | |
Money market funds | | | 1,139 | | | | — | | | | — | | | | 1,139 | |
Obligations of states and political subdivisions | | | 18 | | | | — | | | | — | | | | 18 | |
| | | | | | | | | | | | | | | | |
Total Cash equivalents | | | 1,157 | | | | — | | | | — | | | | 1,157 | |
| | | | | | | | | | | | | | | | |
Total Cash and Cash equivalents | | $ | 1,858 | | | $ | — | | | $ | — | | | $ | 1,858 | |
| | | | | | | | | | | | | | | | |
Short-term and long-term investments: | | | | | | | | | | | | | | | | |
U.S. Treasury and agency securities | | $ | 665 | | | $ | 8 | | | $ | — | | | $ | 673 | |
Obligations of states and political subdivisions | | | 500 | | | | 5 | | | | — | | | | 505 | |
U.S. commercial paper, corporate bonds and medium-term notes | | | 502 | | | | 7 | | | | — | | | | 509 | |
Other debt securities* | | | 261 | | | | 3 | | | | 1 | | | | 263 | |
| | | | | | | | | | | | | | | | |
Total fixed income securities | | | 1,928 | | | | 23 | | | | 1 | | | | 1,950 | |
Publicly traded equity securities | | | 9 | | | | 16 | | | | — | | | | 25 | |
Equity investments in privately-held companies | | | 59 | | | | — | | | | — | | | | 59 | |
| | | | | | | | | | | | | | | | |
Total short-term and long-term investments | | $ | 1,996 | | | $ | 39 | | | $ | 1 | | | $ | 2,034 | |
| | | | | | | | | | | | | | | | |
Total Cash, Cash equivalents and Investments | | $ | 3,854 | | | $ | 39 | | | $ | 1 | | | $ | 3,892 | |
| | | | | | | | | | | | | | | | |
* | Other debt securities consist primarily of investment grade asset-backed and mortgage-backed securities. |
|
| | | | | | | | | | | | | | | |
| October 27, 2013 | Cost | | Gross Unrealized Gains | | Gross Unrealized Losses | | Estimated Fair Value |
| | | | | | | | |
| | (In millions) |
| Cash | $ | 611 |
| | $ | — |
| | $ | — |
| | $ | 611 |
|
| Cash equivalents: | | | | | | | |
| Money market funds | 1,095 |
| | — |
| | — |
| | 1,095 |
|
| Municipal securities | 5 |
| | — |
| | — |
| | 5 |
|
| Total Cash equivalents | 1,100 |
| | — |
| | — |
| | 1,100 |
|
| Total Cash and Cash equivalents | $ | 1,711 |
| | $ | — |
| | $ | — |
| | $ | 1,711 |
|
| Short-term and long-term investments: | | | | | | | |
| U.S. Treasury and agency securities | $ | 170 |
| | $ | — |
| | $ | — |
| | $ | 170 |
|
| Non-U.S. government securities | 11 |
| | — |
| | — |
| | 11 |
|
| Municipal securities | 379 |
| | 2 |
| | — |
| | 381 |
|
| Commercial paper, corporate bonds and medium-term notes | 218 |
| | 2 |
| | 1 |
| | 219 |
|
| Asset-backed and mortgage-backed securities | 268 |
| | 2 |
| | 2 |
| | 268 |
|
| Total fixed income securities | 1,046 |
| | 6 |
| | 3 |
| | 1,049 |
|
| Publicly traded equity securities | 27 |
| | 33 |
| | — |
| | 60 |
|
| Equity investments in privately-held companies | 76 |
| | — |
| | — |
| | 76 |
|
| Total short-term and long-term investments | $ | 1,149 |
| | $ | 39 |
| | $ | 3 |
| | $ | 1,185 |
|
| Total Cash, Cash equivalents and Investments | $ | 2,860 |
| | $ | 39 |
| | $ | 3 |
| | $ | 2,896 |
|
Maturities of Investments
The following table summarizes the contractual maturities of Applied’s investments at October 30, 2011: | | | | | | | | |
| | | Cost | | | Estimated
Fair Value | |
| | | (In millions) | |
Due in one year or less | | $ | 253 | | | $ | 254 | |
Due after one through five years | | | 556 | | | | 559 | |
Due after five years | | | 3 | | | | 3 | |
No single maturity date | | | 376 | | | | 398 | |
| | | | | | | | |
| | $ | 1,188 | | | $ | 1,214 | |
| | | | | | | | |
26, 2014
: |
| | | | | | | |
| | Cost | | Estimated Fair Value |
| | | | |
| | (In millions) |
| Due in one year or less | $ | 151 |
| | $ | 151 |
|
| Due after one through five years | 539 |
| | 542 |
|
| No single maturity date** | 372 |
| | 402 |
|
| | $ | 1,062 |
| | $ | 1,095 |
|
_________________________
** Securities with no single maturity date include publicly-traded and privately-held equity securities, and asset-backed and mortgage-backed securities.
NOTES TO CONSOLIDATED FINANCIAL STATEMENTS — (Continued)
Gains and Losses on Investments
Gross realized gains and losses on sales of investments during fiscal 2011, 2010,2014, 2013, and 20092012 were as follows: | | | | | | | | | | | | |
| | | 2011 | | | 2010 | | | 2009 | |
| | | (In millions) | |
Gross realized gains | | $ | 20 | | | $ | 6 | | | $ | 9 | |
Gross realized losses | | $ | 4 | | | $ | 2 | | | $ | 10 | |
|
| | | | | | | | | | | |
| | 2014 | | 2013 | | 2012 |
| | | | | | |
| | (In millions) |
| Gross realized gains | $ | 27 |
| | $ | 7 |
| | $ | 3 |
|
| Gross realized losses | $ | 2 |
| | $ | 2 |
| | $ | 3 |
|
At October 30, 2011, Applied had a26, 2014, gross unrealized loss of $2 millionlosses related to itsApplied's investment portfolio due to a decrease in the fair value of certain fixed income securities.were not material. Applied regularly reviews its investment portfolio to identify and evaluate investments that have indications of possible impairment. Factors considered in determining whether an unrealized loss was considered to be temporary, or other-than-temporary and therefore impaired, include: the length of time and extent to which fair value has been lower than the cost basis; the financial condition, credit quality and near-term prospects of the investee; and whether it is more likely than not that Applied will be required to sell the security prior to recovery. Generally, the contractual terms of investments in marketable securities do not permit settlement at prices less than the amortized cost of the investments. Applied determined that the gross unrealized losses on its marketable securities at October 30, 201126, 2014, October 27, 2013 and October 31, 201028, 2012 were temporary in nature and therefore it did not recognize any impairment of its marketable securities for fiscal 20112014, 2013 or fiscal 2010.2012. During fiscal 2009,2014, 2013 and 2012, Applied determined that the gross unrealized losses oncertain of its marketable securities at October 25, 2009equity investments held in privately-held companies were other than temporary in natureother-than-temporarily impaired and, thereforeaccordingly, recognized $2 million in impairment charges associated with its marketable securities.of $15 million, The following table provides$6 million and $17 million, respectively. These impairment charges are included in interest and other income, net in the fair market valueConsolidated Statement of Applied’s investments with unrealized losses that are not deemed to be other-than-temporarily impaired as of October 30, 2011.
| | | | | | | | | | | | | | | | |
| | | In Loss Position for
Less Than 12 Months | | | Total | |
| | | Fair Value | | | Gross
Unrealized
Losses | | | Fair Value | | | Gross
Unrealized
Losses | |
| | | (In millions) | |
U.S. commercial paper, corporate bonds and medium-term notes | | $ | 38 | | | $ | 1 | | | $ | 38 | | | $ | 1 | |
Other debt securities | | | 77 | | | | 1 | | | | 77 | | | | 1 | |
| | | | | | | | | | | | | | | | |
Total | | $ | 115 | | | $ | 2 | | | $ | 115 | | | $ | 2 | |
| | | | | | | | | | | | | | | | |
The following table provides the fair market value of Applied’s investments with unrealized losses that are not deemed to be other-than-temporarily impaired as of October 31, 2010.
| | | | | | | | | | | | | | | | |
| | | In Loss Position for
Less Than 12 Months | | | Total | |
| | | Fair Value | | | Gross
Unrealized
Losses | | | Fair Value | | | Gross
Unrealized
Losses | |
| | | (In millions) | |
Other debt securities | | $ | 56 | | | $ | 1 | | | $ | 56 | | | $ | 1 | |
| | | | | | | | | | | | | | | | |
Operations.
Unrealized gains and temporary losses on investments classified as available-for-sale are included within accumulated other comprehensive income
(loss), net of any related tax effect. Upon realization, those amounts are reclassified from accumulated other comprehensive income
(loss) to results of operations.
NOTES TO CONSOLIDATED FINANCIAL STATEMENTS — (Continued)
| |
| Note 4 | Fair Value Measurements |
Applied’s financial assets are measured and recorded at fair value, except for equity investments
held in privately-held companies. These equity investments are generally accounted for under the cost method of accounting and are periodically assessed for other-than-temporary impairment when events or circumstances indicate that an other-than-temporary decline in value may have occurred. Applied’s nonfinancial assets, such as goodwill, intangible assets, and property, plant and equipment, are recorded at cost and are assessed for impairment when events or circumstances indicate that an other-than-temporary decline in value may have occurred.
Applied uses the following fair value hierarchy, which prioritizes the inputs to valuation techniques used to measure fair value into three levels and bases the categorization within the hierarchy upon the lowest level of input that is available and significant to the fair value measurement:
Level 1 — Quoted prices in active markets for identical assets or liabilities;
Level 2 — Observable inputsInputs other than Level 1 that are observable, either directly or indirectly, such as quoted prices for similar assets or liabilities, quoted prices in markets that are not active, or other inputs that are observable or can be corroborated by observable market data for substantially the full term of the assets or liabilities; and
Level 3 — Unobservable inputs that are supported by little or no market activity and that are significant to the fair value of the assets or liabilities.
Applied’s investments
are comprisedconsist primarily of debt securities that are classified as available-for-sale and recorded at their fair values. In determining the fair value of investments, Applied uses pricing information from pricing services that value securities based on quoted market prices and models that utilize observable market inputs. In the event a fair value estimate is unavailable from a pricing service, Applied generally obtains non-binding price quotes from brokers. Applied then reviews the information provided by the pricing services or brokers to determine the fair value of its short-term and long-term investments. In addition, to validate pricing information obtained from pricing services, Applied periodically performs supplemental analysis on a sample of securities. Applied reviews any significant unanticipated differences identified through this analysis to determine the appropriate fair value.
Investments with remaining effective maturities of 12 months or less from the balance sheet date are classified as short-term investments. Investments with remaining effective maturities of more than 12 months from the balance sheet date are classified as long-term investments. As of October 30, 2011,26, 2014, substantially all of Applied’s available-for-sale, short-term and long-term investments were recognized at fair value that was determined based upon observable inputs.
NOTES TO CONSOLIDATED FINANCIAL STATEMENTS — (Continued)
Assets
and Liabilities Measured at Fair Value on a Recurring Basis
Financial assets and liabilities (excluding cash balances) measured at fair value on a recurring basis are summarized below as of October 30, 201126, 2014 and October 31, 2010: | | | | | | | | | | | | | | | | | | | | | | | | | | | | | | | | |
| | | October 30, 2011 | | | October 31, 2010 | |
| | | Level 1 | | | Level 2 | | | Level 3 | | | Total | | | Level 1 | | | Level 2 | | | Level 3 | | | Total | |
| | | (In millions) | | | (In millions) | |
Assets: | | | | | | | | | | | | | | | | | | | | | | | | | | | | | | | | |
Money market funds | | $ | 5,663 | | | $ | — | | | $ | — | | | $ | 5,663 | | | $ | 1,139 | | | $ | — | | | $ | — | | | $ | 1,139 | |
U.S. Treasury and agency securities | | | 109 | | | | 76 | | | | — | | | | 185 | | | | 153 | | | | 520 | | | | — | | | | 673 | |
U.S. commercial paper, corporate bonds and medium-term notes | | | — | | | | 258 | | | | — | | | | 258 | | | | — | | | | 509 | | | | — | | | | 509 | |
Obligations of states and political subdivisions | | | — | | | | 373 | | | | — | | | | 373 | | | | — | | | | 523 | | | | — | | | | 523 | |
Other debt securities | | | — | | | | 309 | | | | — | | | | 309 | | | | — | | | | 263 | | | | — | | | | 263 | |
Publicly traded equity securities | | | 27 | | | | — | | | | — | | | | 27 | | | | 25 | | | | — | | | | — | | | | 25 | |
Foreign exchange derivative assets | | | — | | | | 1 | | | | — | | | | 1 | | | | — | | | | 6 | | | | — | | | | 6 | |
| | | | | | | | | | | | | | | | | | | | | | | | | | | | | | | | |
Total | | $ | 5,799 | | | $ | 1,017 | | | $ | — | | | $ | 6,816 | | | $ | 1,317 | | | $ | 1,821 | | | $ | — | | | $ | 3,138 | |
| | | | | | | | | | | | | | | | | | | | | | | | | | | | | | | | |
Liabilities: | | | | | | | | | | | | | | | | | | | | | | | | | | | | | | | | |
Foreign exchange derivative liabilities | | $ | — | | | $ | (1 | ) | | $ | — | | | $ | (1 | ) | | $ | — | | | $ | (1 | ) | | $ | — | | | $ | (1 | ) |
| | | | | | | | | | | | | | | | | | | | | | | | | | | | | | | | |
Total | | $ | — | | | $ | (1 | ) | | $ | — | | | $ | (1 | ) | | $ | — | | | $ | (1 | ) | | $ | — | | | $ | (1 | ) |
| | | | | | | | | | | | | | | | | | | | | | | | | | | | | | | | |
27, 2013
: |
| | | | | | | | | | | | | | | | | | | | | | | |
| | October 26, 2014 | | October 27, 2013 |
| | Level 1 | | Level 2 | | Total | | Level 1 | | Level 2 | | Total |
| | | | | | | | | | | | |
| | (In millions) |
| Assets: | | | | | | | | | | | |
| Money market funds | $ | 2,494 |
| | $ | — |
| | $ | 2,494 |
| | $ | 1,095 |
| | $ | — |
| | $ | 1,095 |
|
| U.S. Treasury and agency securities | 43 |
| | 19 |
| | 62 |
| | 66 |
| | 104 |
| | 170 |
|
| Non-U.S. government securities | — |
| | 14 |
| | 14 |
| | — |
| | 11 |
| | 11 |
|
| Municipal securities | — |
| | 393 |
| | 393 |
| | — |
| | 386 |
| | 386 |
|
| Commercial paper, corporate bonds and medium-term notes | — |
| | 224 |
| | 224 |
| | — |
| | 219 |
| | 219 |
|
| Asset-backed and mortgage-backed securities | — |
| | 286 |
| | 286 |
| | — |
| | 268 |
| | 268 |
|
| Publicly traded equity securities | 50 |
| | — |
| | 50 |
| | 60 |
| | — |
| | 60 |
|
| Foreign exchange derivative assets | — |
| | 52 |
| | 52 |
| | — |
| | 20 |
| | 20 |
|
| Total | $ | 2,587 |
| | $ | 988 |
| | $ | 3,575 |
| | $ | 1,221 |
| | $ | 1,008 |
| | $ | 2,229 |
|
There were no significant transfers in and out ofbetween Level 1 and Level 2 fair value measurements during fiscal 2014 and 2013 and Applied did not have any financial assets measured at fair value on a recurring basis within Level 3 fair value measurements during either the fiscal years ended as of October 30, 201126, 2014 or October 31, 2010.27, 2013
. Assets and Liabilities Measured at Fair Value on a Non-recurring Basis
Equity investments in privately-held companies are generally accounted for under the cost method of accounting and are periodically assessed for other-than-temporary impairment when an event or circumstance indicates that an other-than-temporary decline in value may have occurred. If Applied determines that an other-than-temporary impairment has occurred, the investment will be written down to its estimated fair value based on available information, such as pricing in recent rounds of financing, current cash positions, earnings and cash flow forecasts, recent operational performance and any other readily available market data. Equity investments in privately-held companies totaled $62$66 million at October 30, 2011,26, 2014, of which $40$57 million of investments were accounted for under the cost method of accounting and $22$9 million of investments had been measured at fair value on a non-recurring basis within Level 3 fair value measurements due to an other-than-temporary decline in value. Equity investments in privately-held companies totaled $59$76 million at October 31, 2010,27, 2013, of which $40$66 million of investments were accounted for under the cost method of accounting and $19$10 million of investments had been measured at fair value on a non-recurring basis within Level 3 fair value measurements due to an other-than-temporary decline in value. During fiscal 2011,2014, 2013 and 2012, Applied determined that certain of its equity investments held in privately-held companies were other-than-temporarily impaired and, accordingly, recognized impairment charges in the amount of $3 million. During$15 million, $6 million and $17 million, respectively.
In fiscal 2010,2013 and 2012, Applied determined that certain of its equity investments in privately-held companies were other-than-temporarily impairedrecorded goodwill and accordingly, recognizedintangible asset impairment charges inrelated to the amountEnergy and Environmental Solutions segment. The inputs used to measure the fair value of $13 million. Impairment charges associated with financialgoodwill and intangible assets for fiscal 2009 totaled $84 million, consisting of theAPPLIED MATERIALS, INC.
NOTES TO CONSOLIDATED FINANCIAL STATEMENTS — (Continued)
following: equity method investment, $45 million; publicly-traded equity securities, $20 million; equity investments in privately-held companies, $17 million; Energy and marketable securities, $2 million.
The following tables present the balances of equity securities at October 30, 2011 and October 31, 2010 that had been measured atEnvironmental Solutions segment are classified as a Level 3 fair value on a non-recurring basis,measurement due to the significance of unobservable inputs using company-specific information. The valuation methodology used to estimate the process described above,fair value of goodwill and the impairment charges recorded during the fiscal year then ended:
| | | | | | | | | | | | | | | | |
| | | Level 1 | | | Level 2 | | | Level 3 | | | Impairment of
Equity Investments
in Privately-Held
Companies | |
| | | (In millions) | |
Equity investments in privately-held companies measured at fair value on a non-recurring basis during fiscal 2011 | | $ | — | | | $ | — | | | $ | 22 | | | $ | 3 | |
| | | | | | | | | | | | | | | | |
| | | | | | | | | | | | | | | | |
| | | Level 1 | | | Level 2 | | | Level 3 | | | Impairment of
Equity Investments
in Privately-Held
Companies | |
| | | (In millions) | |
Equity investments in privately-held companies measured at fair value on a non-recurring basis during fiscal 2010 | | $ | — | | | $ | — | | | $ | 19 | | | $ | 13 | |
| | | | | | | | | | | | | | | | |
intangible assets is discussed in Note 9, Goodwill, Purchased Technology and Other Intangible Assets.
Other
OtherThe carrying amounts of Applied’s financial instruments, including cash and cash equivalents, accounts receivable, notes payable, and accounts payable and accrued expenses, approximate fair value due to thetheir short maturities of these financial instruments.maturities. At October 30, 2011,26, 2014, the carrying amount of long-term debt was $1.9$1.9 billion and the estimated fair value was $2.2 billion.$2.2 billion. At October 31, 2010,27, 2013, the carrying amount of long-term debt was $206 million$1.9 billion and the estimated fair value was $238 million.$2.1 billion. The estimated fair value of long-term debt is determined by Level 2 inputs and is based primarily on quoted market prices for the same or similar issues.
APPLIED MATERIALS, INC.
NOTES TO CONSOLIDATED FINANCIAL STATEMENTS — (Continued)
| |
| Note 5 | Derivative Instruments and Hedging Activities |
Derivative Financial Instruments
Applied conducts business in a number of foreign countries, with certain transactions denominated in local currencies, such as the Japanese yen, euro, Israeli shekel, Taiwanese dollar and Swiss franc. Applied uses derivative financial instruments, such as forward exchange contracts and currency option contracts, to hedge certain forecasted foreign currency denominated transactions expected to occur typically within the next 24 months.months. The purpose of Applied’s foreign currency management is to mitigate the effect of exchange rate fluctuations on certain foreign currency denominated revenues, costs and eventual cash flows. The terms of currency instruments used for hedging purposes are generally consistent with the timing of the transactions being hedged. Applied does not use derivative financial instruments for trading or speculative purposes. Derivative instruments and hedging activities, including foreign currency exchange contracts, are recognized on the balance sheet at fair value. Changes in the fair value of derivatives that do not qualify for hedge treatment, as well as the ineffective portion of any hedges, are recognized currently in earnings. All of Applied’s derivative financial instruments are recorded at their fair value in other current assets or in accounts payable and accrued expenses.
APPLIED MATERIALS, INC.NOTES TO CONSOLIDATED FINANCIAL STATEMENTS — (Continued)
Hedges related to anticipated transactions are designated and documented at the inception of the hedge as cash flow hedges and are typically entered into once per month. Cash flow hedges are evaluated for effectiveness quarterly. The effective portion of the gain or loss on these hedges is reported as a component of accumulated other comprehensive income or loss (AOCI) in stockholders’ equity and is reclassified into earnings when the hedged transaction affects earnings. The majority of the after-tax net income or loss related to derivative instruments included in AOCI at October 30, 201126, 2014 is expected to be reclassified into earnings within 12 months.months. Changes in the fair value of currency forward exchange and option contracts due to changes in time value are excluded from the assessment of effectiveness. Both ineffective hedge amounts and hedge components excluded from the assessment of effectiveness are recognized in earnings. If the transaction being hedged is no longer probable to occur, or if a portion of any derivative is deemed to be ineffective, Applied promptly recognizes the gain or loss on the associated financial instrument in general and administrative expenses. The amount recognized due to discontinuance of cash flow hedges that were probable not to occur by the end of the originally specified time period was not significant for fiscal 20112014, 2013 or 2010. The amount recognized due to discontinuance of cash flow hedges that were probable not to occur by the end of the originally specified time period was $25 million for fiscal 2009.
2012.
Additionally, forward exchange contracts are generally used to hedge certain foreign currency denominated assets or liabilities. These derivatives are typically entered into once per month and are not designated for hedge accounting treatment. Accordingly, changes in the fair value of these hedges are recorded in earnings to offset the changes in the fair value of the assets or liabilities being hedged.
Fair
During the fourth quarters of fiscal 2013 and fiscal 2014, Applied purchased foreign exchange option contracts to limit its foreign exchange risk associated with the announced business combination with Tokyo Electron Limited (TEL). The derivatives used to hedge our currency exposure did not qualify for hedge accounting treatment. These derivatives are marked to market at the end of each reporting period with gains and losses recognized as general and administrative expenses. At October 27, 2013, the fair value of the foreign exchange option contracts was approximately $17 million, and the Company recognized an unrealized loss of $7 million during fiscal 2013 related to such contracts. During fiscal 2014, the derivatives purchased in fiscal 2013 were sold, and the Company recorded gains of $51 million and $42 million, respectively, for the three and twelve month periods ended October 26, 2014. Concurrently, during the fourth quarter of fiscal 2014, the Company purchased new foreign exchange option contracts for the same purpose with an extended maturity. At October 26, 2014, the fair value of the option contracts purchased in fiscal 2014 was approximately $52 million and Applied recorded an unrealized loss of $12 million in fiscal 2014 related to these option contracts. The cash flow impacts of these derivatives have been classified as operating cash flows in the Consolidated Statements of Cash Flows. To further mitigate credit exposure in connection with these foreign exchange option contracts, the Company entered into security arrangements with certain counterparties, which require the counterparties to post collateral amounting to the approximate fair value of the derivative contracts. The cash collateral is included in cash and cash equivalents in the Consolidated Statements of Financial Position, with the corresponding liability included in accounts payable and accrued expenses.
Other than the foreign exchange option contracts discussed in the preceding paragraph, the fair values of other derivative instruments at October 26, 2014 and October 27, 2013were as follows: | | | | | | | | | | | | | | | | | | | | |
| | | | | Asset Derivatives | | | | | Liability Derivatives | |
| | | Balance Sheet Location | | October 30,
2011 | | | October 31,
2010 | | | Balance Sheet
Location | | October 30,
2011 | | | October 31,
2010 | |
| | | | | (In millions) | | | | | (In millions) | |
Derivatives Designated as Hedging Instruments | | | | | | | | | | | | | | | | |
Foreign exchange contracts | | Other current assets | | $ | 1 | | | $ | 5 | | | Accrued
expenses | | $ | 1 | | | $ | 1 | |
| | | | | | | | | | | | | | | | | | | | |
| | | | | | |
Derivatives Not Designated as Hedging Instruments | | | | | | | | | | | | | | | | |
Foreign exchange contracts | | Other current assets | | $ | — | | | $ | 1 | | | Accrued
expenses | | $ | — | | | $ | — | |
| | | | | | | | | | | | | | | | | | | | |
Total derivatives | | | | $ | 1 | | | $ | 6 | | | | | $ | 1 | | | $ | 1 | |
| | | | | | | | | | | | | | | | | | | | |
not material.
NOTES TO CONSOLIDATED FINANCIAL STATEMENTS — (Continued)
The effecteffects of derivative instruments on the Consolidated StatementStatements of Operations for fiscal years ended October 30, 20112014 and October 31, 20102013 were as follows: | | | | | | | | | | | | | | | | | | | | | | | | | | |
| | | | | 2011 | | | 2010 | |
| | | | | Effective Portion | | | Ineffective Portion
and Amount
Excluded from
Effectiveness
Testing | | | Effective Portion | | | Ineffective
Portion and
Amount
Excluded
from
Effectiveness
Testing | |
| | | Location of Gain
or (Loss)
Reclassified
from AOCI into
Income or
Recognized in
Income | | Gain or
(Loss)
Recognized
in AOCI | | | Gain or
(Loss)
Reclassified
from AOCI
into
Income | | | Gain or
(Loss)
Recognized in
Income | | | Gain or
(Loss)
Recognized
in AOCI | | | Gain or
(Loss)
Reclassified
from AOCI
into
Income | | | Gain or
(Loss)
Recognized
in Income | |
| | | | | (In millions) | | | (In millions) | |
Derivatives in Cash Flow
Hedging Relationships | | | | | | | | | | | | | | | | | | | | |
Foreign exchange contracts | | Cost of products sold | | $ | (4 | ) | | $ | (1 | ) | | $ | (6 | ) | | $ | 1 | | | $ | (4 | ) | | $ | (2 | ) |
Foreign exchange contracts | | General and administrative | | | — | | | | 4 | | | | (1 | ) | | | — | | | | (1 | ) | | | (2 | ) |
Foreign exchange contracts | | Research, development and engineering | | | — | | | | — | | | | — | | | | — | | | | (1 | ) | | | — | |
| | | | | | | | | | | | | | | | | | | | | | | | | | |
Total | | | | $ | (4 | ) | | $ | 3 | | | $ | (7 | ) | | $ | 1 | | | $ | (6 | ) | | $ | (4 | ) |
| | | | | | | | | | | | | | | | | | | | | | | | | | |
| | | | | | | | | | |
| | | | | 2011 | | | 2010 | |
| | | Location of
Gain or
(Loss)
Recognized in
Income | | Amount of
Gain or
(Loss)
Recognized
in Income | |
| | | (In millions) | |
Derivatives Not Designated as Hedging Instruments | | | | | | | | |
Foreign exchange contracts | | General and
administrative | | $ | (4 | ) | | $ | (20 | ) |
| | | | | | | | | | |
Total | | | | $ | (4 | ) | | $ | (20 | ) |
| | | | | | | | | | |
Derivative-related activity in accumulated other comprehensive loss, net of taxes, was as follows:
| | | | | | | | |
| | | 2011 | | | 2010 | |
| | | (In millions) | |
Unrealized gain on derivative instruments at beginning of year | | $ | 4 | | | $ | — | |
Increase (decrease) in fair value of derivative instruments | | | (2 | ) | | | 2 | |
Gain (loss) reclassified into earnings, net | | | (2 | ) | | | 2 | |
| | | | | | | | |
Unrealized gain, net, on derivative instruments at end of year | | $ | — | | | $ | 4 | |
| | | | | | | | |
APPLIED MATERIALS, INC.
NOTES TO CONSOLIDATED FINANCIAL STATEMENTS — (Continued)
|
| | | | | | | | | | | | | | | | | | | | | | | | | |
| | | | 2014 | | 2013 |
| Effective Portion | | Ineffective Portion and Amount
Excluded from
Effectiveness
Testing | | Effective Portion | | Ineffective Portion and Amount
Excluded from
Effectiveness
Testing |
| | Location of Gain or
(Loss) Reclassified
from AOCI into
Income | | Gain or
(Loss)
Recognized
in AOCI | | Gain or (Loss)
Reclassified
from AOCI into
Income | | Gain or (Loss)
Recognized in
Income | | Gain or
(Loss)
Recognized
in AOCI | | Gain or (Loss)
Reclassified
from AOCI into
Income | | Gain or (Loss)
Recognized in
Income |
| | | | (In millions) |
| Derivatives in Cash Flow Hedging Relationships | | | | | | | | | | | | | |
| Foreign exchange contracts | Cost of products sold | | $ | 7 |
| | $ | 8 |
| | $ | (2 | ) | | $ | 29 |
| | $ | 21 |
| | $ | (3 | ) |
| Foreign exchange contracts | General and administrative | | — |
| | 1 |
| | (2 | ) | | — |
| | 7 |
| | (1 | ) |
| Total | | | $ | 7 |
| | $ | 9 |
| | $ | (4 | ) | | $ | 29 |
| | $ | 28 |
| | $ | (4 | ) |
|
| | | | | | | | | |
| | | | Amount of Gain or (Loss) Recognized in Income |
Location of Gain or
(Loss) Recognized
in Income | | 2014 | | 2013 |
| | | | (In millions) |
| Derivatives Not Designated as Hedging Instruments | | | | | |
| Foreign exchange contracts | General and
administrative | | $ | 49 |
| | $ | 19 |
|
| Total | | | $ | 49 |
| | $ | 19 |
|
Credit Risk Contingent Features
If Applied’s credit rating were to fall below investment grade, it would be in violation of credit risk contingent provisions of the derivative instruments discussed above, and certain counterparties to the derivative instruments could request immediate payment on derivative instruments in net liability positions. The aggregate fair value of all derivative instruments with credit-risk related contingent features that were in a net liability position was immaterial as of October 30, 2011.26, 2014
and October 27, 2013. Entering into foreign exchange contracts with banks exposes Applied to credit-related losses in the event of the banks’ nonperformance. However, Applied’s exposure is not considered significant.
APPLIED MATERIALS, INC.
NOTES TO CONSOLIDATED FINANCIAL STATEMENTS — (Continued)
| |
| Note 6 | Accounts Receivable, Net |
Applied has agreements with various financial institutions to sell accounts receivable and discount promissory notes from selected customers. Applied also discounts letters of credit through various financial institutions. Applied sells its accounts receivable without recourse. Applied, from time to time, also discounts letters of credit issued by customers through various financial institutions. The discounting of letters of credit depends on many factors, including the willingness of financial institutions to discount the letters of credit and the cost of such arrangements. Details of discounted letters of credit, factored accounts receivable and discounted promissory notes for fiscal years ended October 30, 2011, 26, 2014, October 31, 201027, 2013 and October 25, 200928, 2012 were as follows: | | | | | | | | | | | | |
| | | 2011 | | | 2010 | | | 2009 | |
| | | (In millions) | |
Discounted letters of credit | | $ | 211 | | | $ | 230 | | | $ | 299 | |
Factored accounts receivable and discounted promissory notes | | | 80 | | | | 157 | | | | 43 | |
| | | | | | | | | | | | |
Total | | $ | 291 | | | $ | 387 | | | $ | 342 | |
| | | | | | | | | | | | |
|
| | | | | | | | | | | |
| | 2014 | | 2013 | | 2012 |
| | | | | | |
| | (In millions) |
| Discounted letters of credit | $ | 29 |
| | $ | — |
| | $ | — |
|
| Factored accounts receivable and discounted promissory notes | 45 |
| | — |
| | 93 |
|
| Total | $ | 74 |
| | $ | — |
| | $ | 93 |
|
Financing charges on the sale of receivables and discounting of letters of credit are included in interest expense in the accompanying Consolidated Statements of Operations and were not material for all years presented.
Accounts receivable are presented net of allowance for doubtful accounts of $73$58 million at October 30, 201126, 2014 and $74$74 million at October 31, 2010. 27, 2013. Changes in allowance for doubtful accounts were as follows:
|
| | | | | | | | | | | |
| | 2014 | | 2013 | | 2012 |
| | (In millions) |
| Beginning balance | $ | 74 |
| | $ | 87 |
| | $ | 73 |
|
| Provision | — |
| | — |
| | 14 |
|
Deductions1 | (16 | ) | | (13 | ) | | — |
|
| Ending balance | $ | 58 |
| | $ | 74 |
| | $ | 87 |
|
1 Fiscal 2014 and 2013 deductions represent releases of allowance for doubtful accounts credited to expense as a result of an overall lower risk profile of Applied's customers.
Applied sells its products principally to manufacturers within the semiconductor, display and solar industries. While Applied believes that its allowance for doubtful accounts is adequate and represents Applied’sits best estimate as of October 30, 2011, Applied will continue26, 2014, it continues to closely monitor customer liquidity and otherindustry and economic conditions, which may result in changes to Applied’s estimates regarding collectability.Note 7 | Balance Sheet Detail |
| | | | | | | | |
| | | October 30,
2011 | | | October 31,
2010 | |
| | | (In millions) | |
Inventories | | | | | | | | |
Customer service spares | | $ | 328 | | | $ | 324 | |
Raw materials | | | 407 | | | | 260 | |
Work-in-process | | | 336 | | | | 500 | |
Finished goods | | | 630 | | | | 463 | |
| | | | | | | | |
| | $ | 1,701 | | | $ | 1,547 | |
| | | | | | | | |
NOTES TO CONSOLIDATED FINANCIAL STATEMENTS — (Continued)
| |
| Note 7 | Balance Sheet Detail |
|
| | | | | | | |
| | October 26,
2014 | | October 27,
2013 |
| | | | |
| | (In millions) |
| Inventories | | | |
| Customer service spares | $ | 316 |
| | $ | 283 |
|
| Raw materials | 405 |
| | 361 |
|
| Work-in-process | 316 |
| | 292 |
|
| Finished goods | 530 |
| | 477 |
|
| | $ | 1,567 |
| | $ | 1,413 |
|
Included in finished goods inventory is $224$104 million at October 30, 2011,26, 2014, and $148$136 million at October 31, 2010,27, 2013, of newly-introduced systems at customer locations where the sales transaction did not meet Applied’s revenue recognition criteria as set forth in Note 1. Finished goods inventory includes $140$192 million and $117$177 million of evaluation inventory at October 30, 201126, 2014 and October 31, 2010,27, 2013, respectively. | | | | | | | | | | |
| | | Useful Life | | October 30,
2011 | | | October 31,
2010 | |
| | | (In years) | | (In millions) | |
Property, Plant and Equipment, Net | | | | | | |
Land and improvements | | | | $ | 163 | | | $ | 227 | |
Buildings and improvements | | 3-30 | | | 1,155 | | | | 1,234 | |
Demonstration and manufacturing equipment | | 3-5 | | | 686 | | | | 670 | |
Furniture, fixtures and other equipment | | 3-15 | | | 722 | | | | 719 | |
Construction in progress | | | | | 12 | | | | 19 | |
| | | | | | | | | | |
Gross property, plant and equipment | | | | | 2,738 | | | | 2,869 | |
Accumulated depreciation | | | | | (1,872 | ) | | | (1,906 | ) |
| | | | | | | | | | |
| | | | $ | 866 | | | $ | 963 | |
| | | | | | | | | | |
In fiscal 2011, Applied received $99 million in proceeds from the sale
|
| | | | | | | |
| | October 26,
2014 | | October 27,
2013 |
| | | | |
| | (In millions) |
| Other Current Assets | | | |
| Deferred income taxes, net | $ | 232 |
| | $ | 323 |
|
| Prepaid expenses | 172 |
| | 135 |
|
| Prepaid income taxes and income taxes receivable | 79 |
| | 178 |
|
| Other | 85 |
| | 69 |
|
| | $ | 568 |
| | $ | 705 |
|
|
| | | | | | | | | |
| | Useful Life | | October 26,
2014 | | October 27,
2013 |
| | | | | | |
| | (In years) | | (In millions) |
| Property, Plant and Equipment, Net | | | |
| Land and improvements | | | $ | 156 |
| | $ | 167 |
|
| Buildings and improvements | 3-30 | | 1,227 |
| | 1,217 |
|
| Demonstration and manufacturing equipment | 3-5 | | 829 |
| | 792 |
|
| Furniture, fixtures and other equipment | 3-15 | | 575 |
| | 589 |
|
| Construction in progress | | | 61 |
| | 52 |
|
| Gross property, plant and equipment | | | 2,848 |
| | 2,817 |
|
| Accumulated depreciation | | | (1,987 | ) | | (1,967 | ) |
| | | | $ | 861 |
| | $ | 850 |
|
Table of two properties located in North America and recognized a net gain of $27 million on the transactions. Applied also completed the divestiture of certain assets held for sale for proceeds of $31 million. | | | | | | | | |
| | | October 30,
2011 | | | October 31,
2010 | |
| | | (In millions) | |
Accounts Payable and Accrued Expenses | | | | | | | | |
Accounts payable | | $ | 484 | | | $ | 658 | |
Compensation and employee benefits | | | 455 | | | | 435 | |
Warranty | | | 168 | | | | 155 | |
Dividends payable | | | 104 | | | | 93 | |
Other accrued taxes | | | 81 | | | | 99 | |
Interest payable | | | 31 | | | | 1 | |
Restructuring reserve | | | 11 | | | | 104 | |
Other | | | 186 | | | | 221 | |
| | | | | | | | |
| | $ | 1,520 | | | $ | 1,766 | |
| | | | | | | | |
Other accrued expenses included contractual termination obligation charges of $2 million and $40 million as of October 30, 2011 and October 31, 2010, respectively.
| | | | | | | | |
| | | October 30,
2011 | | | October 31,
2010 | |
| | | (In millions) | |
Customer Deposits and Deferred Revenue | | | | | | | | |
Customer deposits | | $ | 249 | | | $ | 407 | |
Deferred revenue | | | 867 | | | | 440 | |
| | | | | | | | |
| | $ | 1,116 | | | $ | 847 | |
| | | | | | | | |
Contents
NOTES TO CONSOLIDATED FINANCIAL STATEMENTS — (Continued)
Depreciation expense was $191 million, $211 million and $198 million for fiscal 2014, 2013 and 2012, respectively.
During fiscal 2013 and 2012, fixed asset impairment charges of $12 million and $20 million, respectively were recorded in relation to the Energy and Environmental Solutions segment restructuring plan, as discussed in Note 11, Restructuring Charges and Asset Impairments.
|
| | | | | | | |
| | October 26,
2014 | | October 27,
2013 |
| | | | |
| | (In millions) |
| Accounts Payable and Accrued Expenses | | | |
| Accounts payable | $ | 613 |
| | $ | 582 |
|
| Compensation and employee benefits | 524 |
| | 417 |
|
| Warranty | 113 |
| | 102 |
|
| Income taxes payable | 142 |
| | 73 |
|
| Dividends payable | 122 |
| | 121 |
|
| Other accrued taxes | 51 |
| | 41 |
|
| Interest payable | 30 |
| | 30 |
|
| Restructuring reserve | 9 |
| | 39 |
|
| Other | 279 |
| | 244 |
|
| | $ | 1,883 |
| | $ | 1,649 |
|
|
| | | | | | | |
| | October 26,
2014 | | October 27,
2013 |
| | | | |
| | (In millions) |
| Customer Deposits and Deferred Revenue | | | |
| Customer deposits | $ | 286 |
| | $ | 175 |
|
| Deferred revenue | 654 |
| | 619 |
|
| | $ | 940 |
| | $ | 794 |
|
Applied typically receives deposits on future deliverables from customers in the Energy and Environmental Solutions and Display segments. In certain instances, customer deposits may be received from customers in the Applied Global Services segment.
|
| | | | | | | |
| | October 26,
2014 | | October 27,
2013 |
| | | | |
| | (In millions) |
| Other Liabilities | | | |
| Deferred income taxes | $ | 32 |
| | $ | 71 |
|
| Income taxes payable | 225 |
| | 174 |
|
| Defined and postretirement benefit plans | 208 |
| | 193 |
|
| Other | 71 |
| | 128 |
|
| | $ | 536 |
| | $ | 566 |
|
APPLIED MATERIALS, INC.
NOTES TO CONSOLIDATED FINANCIAL STATEMENTS — (Continued)
| |
| Note 8 | Business Combinations |
Tokyo Electron Limited
On September 24, 2013, Applied and TEL entered into a Business Combination Agreement, which was amended on February 14, 2014, to effect a strategic combination of their respective businesses into a new combined company. TEL, a Japanese corporation, is a global supplier of semiconductor and flat panel display production equipment, and a provider of technical support and services for semiconductor, flat panel display and photovoltaic panel production equipment. Under the terms of the Business Combination Agreement, TEL shareholders will receive 3.25 shares of the new combined company for every TEL share held. Applied shareholders will receive one share of the new combined company for every Applied share held. Based on the number of shares of Applied common stock and shares of TEL common stock expected to be issued and outstanding immediately prior to the closing of the transaction, it is anticipated that, immediately following the transaction, former Applied stockholders and former TEL shareholders will own approximately 68% and 32%, respectively, of the new combined company.
The new combined company, Eteris N.V., will have dual headquarters in Tokyo and Santa Clara, and dual listing of its shares on the Tokyo Stock Exchange and NASDAQ, and will be incorporated in the Netherlands. In June 2014, the shareholders of Applied and TEL approved the proposed business combination. The closing of the transaction remains subject to customary conditions, including regulatory approvals. It is expected that the combined company will commence a $3.0 billion stock repurchase program targeted to be executed within 12 months following the closing of the transaction.
The Business Combination Agreement contains mutual pre-closing covenants, including the obligation of Applied and TEL to conduct their businesses in the ordinary course consistent in all material respects with past practices. The agreement also contains termination rights for Applied and TEL and provides that upon certain events, such as a termination due to a change in recommendation by the other party or a termination relating to certain tax rulings, a termination fee of $400 million is payable.
Varian Semiconductor Equipment Associates, Inc.
On November 10, 2011, Applied completed the acquisition of Varian, a public company manufacturer of semiconductor processing equipment and the leading supplier of ion implantation equipment used by chip makers globally, for an aggregate purchase price of $4.2 billion in cash, net of cash acquired and assumed earned equity awards of $27 million, pursuant to an Agreement and Plan of Merger dated as of May 3, 2011.
Applied allocated the purchase price of this acquisition to tangible and identifiable intangible assets acquired and liabilities assumed, based on their estimated fair values. These estimates were determined through established and generally accepted valuation techniques. Applied recorded $2.6 billion in goodwill, of which $1.8 billion was allocated to the Silicon Systems Group segment, and the remainder was allocated to the Applied Global Services segment.
The following table summarizes the allocation of the assets acquired and liabilities assumed at the acquisition date:
|
| | | |
| | Estimated Fair Values |
| | (In millions) |
| Fair value of net tangible assets acquired | $ | 892 |
|
| Goodwill | 2,604 |
|
| Purchased intangible assets | 1,365 |
|
| Purchase price allocated | $ | 4,861 |
|
APPLIED MATERIALS, INC.
NOTES TO CONSOLIDATED FINANCIAL STATEMENTS — (Continued)
The following table presents details of the purchase price allocated to purchased intangible assets of Varian at the acquisition date:
|
| | | | | |
| | Useful Life | | Purchased Intangible Assets |
| | (In years) | | (In millions) |
| Developed technology | 1 - 7 | | $ | 987 |
|
| Customer relationships | 15 | | 150 |
|
| In-process technology | | | 142 |
|
| Patents and trademarks | 10 | | 69 |
|
| Backlog | 1 | | 7 |
|
| Covenant not to compete | 2 | | 10 |
|
| Total purchased intangible assets | | | $ | 1,365 |
|
Other
From time to time, Applied makes acquisitions of or investments in companies related to existing or new markets for Applied. Applied completed an acquisition during fiscal 2014 which was not significant to Applied's consolidated results of operations and financial position. Substantially all of the consideration was allocated to goodwill and acquisition-related intangible assets. See Note 9 Goodwill, Purchased Technology and Other Intangible Assets for more information.
APPLIED MATERIALS, INC.
NOTES TO CONSOLIDATED FINANCIAL STATEMENTS — (Continued)
| |
| Note 9 | Goodwill, Purchased Technology and Other Intangible Assets |
Goodwill and Purchased Intangible Assets
Applied’s methodology for allocating the purchase price relating to purchase acquisitions is determined through established and generally accepted valuation techniques. Goodwill is measured as the excess of the
cost of the acquisitionpurchase price over the sum of the amounts assigned to tangible and identifiable intangible assets acquired less liabilities assumed. Applied assigns assets acquired (including goodwill) and liabilities assumed to one or more reporting units as of the date of acquisition. Typically, acquisitions relate to a single reporting unit and thus do not require the allocation of goodwill to multiple reporting units. If the products obtained in an acquisition are assigned to multiple reporting units, the goodwill is distributed to the respective reporting units as part of the purchase price allocation process.
Goodwill and purchased intangible assets with indefinite useful lives are not amortized, but are reviewed for impairment annually during the fourth quarter of each fiscal year and whenever events or changes in circumstances indicate that the carrying value of an asset may not be recoverable. The process of evaluating the potential impairment of goodwill and intangible assets requires significant judgment, especially in emerging markets. Applied regularly monitors current business conditions and
considers other factors including, but not limited to, adverse industry or economic trends, restructuring actions and lower projections of profitability that may impact future operating results.
In fiscal 2011, Applied adopted authoritative guidance which allow entities to use a qualitative approach to
To test goodwill for impairment. This authoritative guidance permits an entity toimpairment, Applied first performperforms a qualitative assessment to determine whether it is more likely than not that the fair value of a reporting unit is less than its carrying value. If it is concluded that this is the case, it is necessary to performApplied then performs the two-step goodwill impairment test. Otherwise, the two-step goodwill impairment test is not required. Under the two-step goodwill impairment test, Applied would, in the first step, compare the estimated fair value of each reporting unit to its carrying value. Applied determines the fair value of each of its reporting units based on a weighting of income and market approaches. If the carrying value of a reporting unit exceeds its fair value, Applied would then perform the second step of the impairment test in order to determine the implied fair value of the reporting unit’s goodwill. If Applied determines that the carrying value of a reporting unit’s goodwill exceeds its implied fair value, Applied would record an impairment charge equal to the difference. Applied’s reporting units are consistent with the reportable segments identified in Note 16, Industry Segment Operations, which are based on the manner in which Applied operates its business and the nature of those operations. Applied determines
In the fair valuefourth quarter of each of its reporting units based on a weighting of income and market approaches. Under the income approach, Applied calculates the fair value of a reporting unit based on the present value of estimated future cash flows. Estimated future cash flows will be impacted by a number of factors including anticipated future operating results, estimated cost of capital and/or discount rates. Under the market approach, Applied estimates the fair value based on market multiples of revenue or earnings for comparable companies, as appropriate. If the fair value of the reporting unit exceeds the carrying value of the net assets assigned to that unit, goodwill is not impaired and no further testing is performed. If the carrying value of the net assets assigned to the reporting unit exceeds the fair value of the reporting unit, then Applied would perform the second step of the impairment test in order to determine the implied fair value of the reporting unit’s goodwill. Applied would then allocate the fair value of the reporting unit to all of the assets and liabilities of that unit, as if Applied had acquired the reporting unit in a business combination, with the fair value of the reporting unit being the “purchase price.” The excess of the “purchase price” over the carrying amounts assigned to assets and liabilities represents the implied fair value of goodwill. If Applied determined that the carrying value of a reporting unit’s goodwill exceeded its implied fair value, Applied would record an impairment charge equal to the difference.fiscal
APPLIED MATERIALS, INC.2014NOTES TO CONSOLIDATED FINANCIAL STATEMENTS — (Continued)
, Applied performed aan annual qualitative assessment to test goodwill for impairment in the fourth quarterall of fiscal 2011 andits reporting units for impairment. Applied determined that it was more likely than not that each of its reporting unitsunits' fair valuevalues exceeded itstheir respective carrying valuevalues and that it was not necessary to perform the two-step goodwill impairment test.
At October 31, 2010,test for any of its reporting units.
During fiscal 2013 and 2012, the purchased intangible assetssolar industry faced a deterioration in market conditions associated with indefinite lives consisted primarilymanufacturing overcapacity and weak operating performance and outlook, resulting in uncertainties regarding the timing and nature of a trade name. In fiscal 2011,recovery in solar capital equipment expenditures. Applied negotiated the divestiture of certain assetsperformed a two-step goodwill impairment test and, determined the trade name, which was included in assets held for sale, to be impaired, and, accordingly, recorded $18 million of impairment charges.In fiscal 2011, Applied transferred its SunFab thin film solar product from the Energy and Environmental Solutions segment to the Applied Global Services segment. Asas a result, of this transfer, Applied reallocated $17recorded
$224 million and $421 million of goodwill fromimpairment charges in its Energy and Environmental Solutions segment in fiscal 2013 and 2012, respectively. As of October 27, 2014, accumulated goodwill impairment charges amounted to $645 million all of which were recorded in the Energy and Environmental Solutions segment. In fiscal 2013, Applied also performed an impairment test for long-lived assets associated with the Energy and Environmental Solutions reporting unit and determined that the majority of intangible assets were impaired, mostly due to the lower long-term revenue and profitability outlook associated with products related to these intangible assets. Accordingly, during fiscal 2013, Applied recorded an impairment charge of $54 million related to these intangible assets, which was the amount by which the carrying value of these intangible assets exceeded their estimated fair value, based on discounted projected cash flows.
APPLIED MATERIALS, INC.
NOTES TO CONSOLIDATED FINANCIAL STATEMENTS — (Continued)
Applied utilized an equal weighting of both the discounted cash flow method of the income approach and the guideline company method of the market approach to estimate the fair value of the Energy and Environmental Solutions reporting unit. The estimates used in the impairment testing were consistent with the discrete forecasts that Applied uses to manage its business, and considered the significant developments that occurred during the quarter. Under the discounted cash flow method, cash flows beyond the discrete forecasts were estimated using a terminal growth rate, which considered the long-term earnings growth rate specific to the Energy and Environmental Solutions reporting unit. The estimated future cash flows were discounted to present value using a discount rate that was the value-weighted average of the reporting unit's estimated cost of equity and debt derived using both known and estimated market metrics, and was adjusted to reflect risk factors that considered both the timing and risks associated with the estimated cash flows. The tax rate used in the discounted cash flow method reflected the international structure currently in place, which is consistent with the market participant perspective. Under the guideline company method, market multiples were applied to forecasted revenues and earnings before interest, taxes, depreciation and amortization. The market multiples used were consistent with comparable publicly-traded companies.
The evaluation of goodwill and intangible assets for impairment requires the exercise of significant judgment. In the event of future changes in business conditions, Applied
Global Services segment.will be required to reassess and update its forecasts and estimates used in future impairment analyses. If the results of these future analyses are lower than current estimates, a material impairment charge may result at that time.
Details of goodwill and other indefinite-lived intangible assets were as follows:
| | | | | | | | | | | | | | | | | | | | | | | | |
| | | October 30, 2011 | | | October 31, 2010 | |
| | | Goodwill | | | Other
Intangible
Assets | | | Total | | | Goodwill | | | Other
Intangible
Assets | | | Total | |
| | | (In millions) | |
Silicon Systems Group | | $ | 381 | | | $ | — | | | $ | 381 | | | $ | 381 | | | $ | — | | | $ | 381 | |
Applied Global Services | | | 193 | | | | — | | | | 193 | | | | 177 | | | | 18 | | | | 195 | |
Display | | | 116 | | | | — | | | | 116 | | | | 116 | | | | — | | | | 116 | |
Energy and Environmental Solutions | | | 645 | | | | — | | | | 645 | | | | 662 | | | | — | | | | 662 | |
| | | | | | | | | | | | | | | | | | | | | | | | |
Carrying amount | | $ | 1,335 | | | $ | — | | | $ | 1,335 | | | $ | 1,336 | | | $ | 18 | | | $ | 1,354 | |
| | | | | | | | | | | | | | | | | | | | | | | | |
|
| | | | | | | | | | | | | | | | | | | | | | | |
| | October 26, 2014 | | October 27, 2013 |
| | Goodwill | | Other Intangible Assets | | Total | | Goodwill | | Other Intangible Assets | | Total |
| | | | | | | | | | | | |
| | (In millions) |
| Silicon Systems Group | $ | 2,151 |
| | $ | 103 |
| | $ | 2,254 |
| | $ | 2,151 |
| | $ | 142 |
| | $ | 2,293 |
|
| Applied Global Services | 1,027 |
| | 6 |
| | 1,033 |
| | 1,027 |
| | — |
| | 1,027 |
|
| Display | 126 |
| | 18 |
| | 144 |
| | 116 |
| | — |
| | 116 |
|
| Carrying amount | $ | 3,304 |
| | $ | 127 |
| | $ | 3,431 |
| | $ | 3,294 |
| | $ | 142 |
| | $ | 3,436 |
|
Other intangible assets that are not subject to amortization consist primarily of in-process technology, which will be subject to amortization upon commercialization. The fair value assigned to in-process technology was determined using the income approach taking into account estimates and judgments regarding risks inherent in the development process, including the likelihood of achieving technological success and market acceptance. If an in-process technology project is abandoned, the acquired technology attributable to the project will be written-off.
During fiscal 2014, goodwill and other indefinite lived intangible assets decreased by $5 million primarily due to commercialization of in-process technology in the Silicon Systems Group segment, partially offset by increases in goodwill and in-process technology as a result of an acquisition in the Display segment. The acquisition is not material to the consolidated financial position and results of operations of Applied.
A summary of Applied's purchased technology and intangible assets is set forth below:
|
| | | | | | | |
| | October 26,
2014 | | October 27,
2013 |
| | | | |
| | (In millions) |
| Purchased technology, net | $ | 636 |
| | $ | 748 |
|
| Intangible assets - finite-lived, net | 188 |
| | 213 |
|
| Intangible assets - indefinite-lived | 127 |
| | 142 |
|
| Total | $ | 951 |
| | $ | 1,103 |
|
APPLIED MATERIALS, INC.
NOTES TO CONSOLIDATED FINANCIAL STATEMENTS — (Continued)
Finite-Lived Purchased Intangible Assets
Applied amortizes purchased intangible assets with finite lives using the straight-line method over the estimated economic lives of the assets, ranging from 1 to 15 years. Applied evaluates long-lived assets for impairment whenever events or changes in circumstances indicate the carrying value of an asset group may not be recoverable. Applied assesses the fair value of the assets based on the amount of the undiscounted future cash flow that the assets are expected to generate and recognizes an impairment loss when estimated undiscounted future cash flow expected to result from the use of the asset, plus net proceeds expected from disposition of the asset, if any, are less than the carrying value of the asset. When Applied identifies an impairment, Applied reduces the carrying value of the group of assets to comparable market values, when available and appropriate, or to its estimated fair value based on a discounted cash flow approach.
Intangible assets, such as purchased technology, are generally recorded in connection with a business acquisition. The value assigned to intangible assets is usually based on estimates and judgments regarding expectations for the success and life cycle of products and technology acquired. Applied evaluates the useful lives of its intangible assets each reporting period to determine whether events and circumstances require revising the remaining period of amortization. In addition, Applied reviews intangible assets for impairment when events or changes in circumstances indicate their carrying value may not be recoverable. Management considers such indicators as significant differences in actual product acceptance from the estimates, changes in the competitive and economic
environment,environments, technological advances, and changes in cost structure.
APPLIED MATERIALS, INC.
NOTES TO CONSOLIDATED FINANCIAL STATEMENTS — (Continued)
Details of finite-lived intangible assets were as follows:
| | | | | | | | | | | | | | | | | | | | | | | | |
| | | October 30, 2011 | | | October 31, 2010 | |
| | | Purchased
Technology | | | Other
Intangible
Assets | | | Total | | | Purchased
Technology | | | Other
Intangible
Assets | | | Total | |
| | | (In millions) | |
Silicon Systems Group | | $ | 310 | | | $ | 20 | | | $ | 330 | | | $ | 310 | | | $ | 20 | | | $ | 330 | |
Applied Global Services | | | 28 | | | | 40 | | | | 68 | | | | 32 | | | | 61 | | | | 93 | |
Display | | | 110 | | | | 33 | | | | 143 | | | | 110 | | | | 33 | | | | 143 | |
Energy and Environmental Solutions | | | 105 | | | | 232 | | | | 337 | | | | 105 | | | | 232 | | | | 337 | |
| | | | | | | | | | | | | | | | | | | | | | | | |
Gross carrying amount | | $ | 553 | | | $ | 325 | | | $ | 878 | | | $ | 557 | | | $ | 346 | | | $ | 903 | |
| | | | | | | | | | | | | | | | | | | | | | | | |
Silicon Systems Group | | $ | (256 | ) | | $ | (8 | ) | | $ | (264 | ) | | $ | (247 | ) | | $ | (6 | ) | | $ | (253 | ) |
Applied Global Services | | | (20 | ) | | | (31 | ) | | | (51 | ) | | | (19 | ) | | | (43 | ) | | | (62 | ) |
Display | | | (102 | ) | | | (25 | ) | | | (127 | ) | | | (96 | ) | | | (23 | ) | | | (119 | ) |
Energy and Environmental Solutions | | | (48 | ) | | | (177 | ) | | | (225 | ) | | | (37 | ) | | | (163 | ) | | | (200 | ) |
| | | | | | | | | | | | | | | | | | | | | | | | |
Accumulated amortization | | $ | (426 | ) | | $ | (241 | ) | | $ | (667 | ) | | $ | (399 | ) | | $ | (235 | ) | | $ | (634 | ) |
| | | | | | | | | | | | | | | | | | | | | | | | |
Carrying amount | | $ | 127 | | | $ | 84 | | | $ | 211 | | | $ | 158 | | | $ | 111 | | | $ | 269 | |
| | | | | | | | | | | | | | | | | | | | | | | | |
In
|
| | | | | | | | | | | | | | | | | | | | | | | |
| | October 26, 2014 | | October 27, 2013 |
| | Purchased Technology | | Other Intangible Assets | | Total | | Purchased Technology | | Other Intangible Assets | | Total |
| | | | | | | | | | | | |
| | (In millions) |
| Gross carrying amount: | | | | | | | | | | | |
| Silicon Systems Group | $ | 1,346 |
| | $ | 252 |
| | $ | 1,598 |
| | $ | 1,301 |
| | $ | 252 |
| | $ | 1,553 |
|
| Applied Global Services | 28 |
| | 44 |
| | 72 |
| | 28 |
| | 44 |
| | 72 |
|
| Display | 110 |
| | 33 |
| | 143 |
| | 110 |
| | 33 |
| | 143 |
|
| Energy and Environmental Solutions | 5 |
| | 17 |
| | 22 |
| | 5 |
| | 15 |
| | 20 |
|
| Gross carrying amount | $ | 1,489 |
| | $ | 346 |
| | $ | 1,835 |
| | $ | 1,444 |
| | $ | 344 |
| | $ | 1,788 |
|
| Accumulated amortization: | | | | | | | | | | | |
| Silicon Systems Group | $ | (716 | ) | | $ | (77 | ) | | $ | (793 | ) | | $ | (562 | ) | | $ | (58 | ) | | $ | (620 | ) |
| Applied Global Services | (24 | ) | | (44 | ) | | (68 | ) | | (23 | ) | | (42 | ) | | (65 | ) |
| Display | (110 | ) | | (31 | ) | | (141 | ) | | (110 | ) | | (29 | ) | | (139 | ) |
| Energy and Environmental Solutions | (3 | ) | | (6 | ) | | (9 | ) | | (1 | ) | | (2 | ) | | (3 | ) |
| Accumulated amortization | $ | (853 | ) | | $ | (158 | ) | | $ | (1,011 | ) | | $ | (696 | ) | | $ | (131 | ) | | $ | (827 | ) |
| Carrying amount | $ | 636 |
| | $ | 188 |
| | $ | 824 |
| | $ | 748 |
| | $ | 213 |
| | $ | 961 |
|
APPLIED MATERIALS, INC.
NOTES TO CONSOLIDATED FINANCIAL STATEMENTS — (Continued)
Details of amortization expense by segment for fiscal 2011, Applied entered into an agreement to divest certain assets held in the Applied Global Services segment2014, 2013 and determined certain identified purchased technology2012 were as follows:
|
| | | | | | | | | | | |
| | 2014 | | 2013 | | 2012 |
| | | | | | |
| | (In millions) |
| Silicon Systems Group | $ | 173 |
| | $ | 172 |
| | $ | 183 |
|
| Applied Global Services | 3 |
| | 5 |
| | 9 |
|
| Display | 2 |
| | 6 |
| | 7 |
|
| Energy and Environmental Solutions | 6 |
| | 16 |
| | 25 |
|
| Total | $ | 184 |
| | $ | 199 |
| | $ | 224 |
|
For fiscal 2014, 2013 and finite-lived intangible assets, which were included in the assets held for sale, to be impaired, and, accordingly, recorded $6 million of impairment charges. The gross carrying amount of the divested amortized intangible assets was approximately $25 million. In fiscal 2010, Applied incurred intangible impairment charges of $31 million related to a plan to restructure its Energy and Environmental Solutions segment.Amortization
2012, amortization expense was $52 million, $82 million and $89 million for fiscal 2011, 2010 and 2009, respectively.charged to the following categories:
|
| | | | | | | | | | | |
| | 2014 | | 2013 | | 2012 |
| | | | | | |
| | (In millions) |
| Cost of products sold | $ | 159 |
| | $ | 166 |
| | $ | 185 |
|
| Research, development and engineering | 1 |
| | 1 |
| | 1 |
|
| Marketing and selling | 21 |
| | 26 |
| | 30 |
|
| General and administrative | 3 |
| | 6 |
| | 8 |
|
| Total | $ | 184 |
| | $ | 199 |
| | $ | 224 |
|
As of October 30, 2011,26, 2014, future estimated amortization expense is expected to be as follows: | | | | |
| | | Amortization
Expense | |
| | | (In millions) | |
2012 | | | 50 | |
2013 | | | 48 | |
2014 | | | 40 | |
2015 | | | 25 | |
2016 | | | 17 | |
Thereafter | | | 31 | |
| | | | |
| | $ | 211 | |
| | | | |
Note 9 | Business Combinations |
Varian Semiconductor Equipment Associates, Inc.
On May 4, 2011, Applied and Varian Semiconductor Equipment Associates, Inc. (Varian), a public company manufacturer
|
| | | |
| | Amortization Expense |
| | (In millions) |
| 2015 | 182 |
|
| 2016 | 175 |
|
| 2017 | 171 |
|
| 2018 | 170 |
|
| 2019 | 30 |
|
| Thereafter | 96 |
|
| Total | $ | 824 |
|
NOTES TO CONSOLIDATED FINANCIAL STATEMENTS — (Continued)
As described in Note 17, Subsequent Events, on November 10, 2011, Applied completed its acquisition of Varian. Applied’s primary reasons for this acquisition were to complement its existing product offerings and to provide opportunities for future growth. Beginning in the first quarter of fiscal 2012, the acquired business will be included in results for the Silicon Systems Group and Applied Global Services segments.
The aggregate purchase price of the acquisition was approximately $4.2 billion, net of cash acquired, and Applied funded the transaction with a combination of existing cash, including proceeds from long-term debt issued in June 2011. See Note 10 for additional discussion of long-term debt.
Semitool, Inc. and Advent Solar
On December 21, 2009, Applied acquired Semitool, Inc. (Semitool), a public company based in the state of Montana, for a purchase price of $323 million in cash, net of cash acquired, pursuant to a tender offer and subsequent short-form merger. The acquired business is a leading supplier of electrochemical plating and wafer surface preparation equipment used by semiconductor packaging and manufacturing companies globally. Applied’s primary reasons for this acquisition were to complement its existing product offerings and to provide opportunities for future growth. The acquired business is included in results for the Silicon Systems Group segment.
In November 2009, Applied acquired substantially all the assets, including the intellectual property, of Advent Solar, a developer of advanced technology for c-Si solar photovoltaic cells and modules (PVs), for a purchase price of $14 million.
Applied allocated the purchase price of each of these acquisitions to tangible assets, liabilities and identifiable intangible assets acquired, based on their estimated fair values. The excess of purchase price over the aggregate fair values was recorded as goodwill. The fair value assigned to identifiable intangible assets acquired was based on estimates and assumptions made by management. These estimates were determined through established and generally accepted calculation techniques. Applied calculated the fair value of the tangible and intangible assets acquired to allocate the purchase prices at the respective acquisition dates. Based upon these calculations, the purchase prices for the above acquisitions were allocated as follows:
| | | | |
Fair Market Values | | Acquisitions
2010 | |
| | | (In millions) | |
Cash and cash equivalents | | $ | 39 | |
Accounts receivable, net | | | 38 | |
Inventories | | | 62 | |
Other current assets | | | 4 | |
Property and equipment, net | | | 46 | |
Goodwill | | | 165 | |
Purchased intangible assets | | | 93 | |
| | | | |
Total assets acquired | | | 447 | |
Accounts payable and accrued expenses | | | (47 | ) |
Other liabilities | | | (25 | ) |
| | | | |
Total liabilities assumed | | | (72 | ) |
| | | | |
Purchase price allocated | | $ | 375 | |
| | | | |
APPLIED MATERIALS, INC.
NOTES TO CONSOLIDATED FINANCIAL STATEMENTS — (Continued)
| | | | | | |
| | | Useful
Life | | Purchased
Intangible Assets
2010 | |
| | | (In years) | | (In millions) | |
Developed technology | | 6 - 10 | | $ | 66 | |
Customer relationships | | 8 | | | 11 | |
Trade names | | 3 - 10 | | | 6 | |
Patents and trademarks | | 7 - 10 | | | 5 | |
Backlog | | 1 | | | 4 | |
Other | | 5 | | | 1 | |
| | | | | | |
Total purchased intangible assets | | | | $ | 93 | |
| | | | | | |
The results of operations of Semitool were not material in relation to those of Applied for any of the periods presented herein.
Goodwill is not amortized but is reviewed at least annually for impairment and purchased technology is amortized over its useful life of 1 to 15 years.
| |
| Note 10 | Borrowing Facilities and Long-Term Debt |
Applied has credit facilities for unsecured borrowings in various currencies of up to $1.6$1.6 billion, of which $1.5$1.5 billion is comprised of a committed four-year revolving credit agreement with a group of banks that is scheduled to expire in May 2015.2017. This agreement provides for borrowings in United States dollars at interest rates keyed to one of the two rates selected by Applied for each advance and includes financial and other covenants with which Applied was in compliance at October 30, 2011.covenants. Remaining credit facilities in the amount of approximately $105$75 million are with Japanese banks. Applied’s ability to borrow under these facilities is subject to bank approval at the time of the borrowing request, and any advances will be at rates indexed to the banks’ prime reference rate denominated in Japanese yen. No amounts were outstanding under any of these facilities at both October 30,26, 2014 and October 27, 2013 and Applied has not utilized these credit facilities. In connection with the proposed business combination with TEL, Applied intends to amend or replace its undrawn $1.5 billion unsecured revolving credit agreement. In fiscal 2011, Applied established a short-term commercial paper program of up to $1.5 billion. At October 26, 2014 and October 31, 2010.27, 2013, Applied did not have any commercial paper outstanding.
Long-term debt outstanding as of October 30, 201126, 2014 and October 27, 2013 was as follows: | | | | | | | | | | | | | | | | |
Due Date | | Principal
Amount | | | Stated
Interest Rate | | | Effective
Interest Rate | | | Interest
Pay Date | | Interest
Pay Date |
| | | (In millions) | | | | | | | | |
June 15, 2016 | | $ | 400 | | | | 2.650 | % | | | 2.666 | % | | June 15 | | December 15 |
October 15, 2017 | | | 200 | | | | 7.125 | % | | | 7.190 | % | | April 15 | | October 15 |
June 15, 2021 | | | 750 | | | | 4.300 | % | | | 4.326 | % | | June 15 | | December 15 |
June 15, 2041 | | | 600 | | | | 5.850 | % | | | 5.879 | % | | June 15 | | December 15 |
Other debt | | | 1 | | | | | | | | | | | | | |
| | | | | | | | | | | | | | | | |
| | | 1,951 | | | | | | | | | | | | | |
Total unamortized discount | | | (4 | ) | | | | | | | | | | | | |
| | | | | | | | | | | | | | | | |
Total long-term debt | | $ | 1,947 | | | | | | | | | | | | | |
| | | | | | | | | | | | | | | | |
|
| | | | | | | | | | | |
| | Principal Amount | | | | |
| | October 26,
2014 | | October 27,
2013 | | Effective Interest Rate | | Interest Pay Dates |
| | (In millions) | | | | |
| 2.650% Senior Notes Due 2016 | $ | 400 |
| | $ | 400 |
| | 2.666% | | June 15, December 15 |
| 7.125% Senior Notes Due 2017 | 200 |
| | 200 |
| | 7.190% | | April 15, October 15 |
| 4.300% Senior Notes Due 2021 | 750 |
| | 750 |
| | 4.326% | | June 15, December 15 |
| 5.850% Senior Notes Due 2041 | 600 |
| | 600 |
| | 5.879% | | June 15, December 15 |
| | 1,950 |
| | 1,950 |
| | | | |
| Total unamortized discount | (3 | ) | | (4 | ) | | | | |
| Total long-term debt | $ | 1,947 |
| | $ | 1,946 |
| | | | |
NOTES TO CONSOLIDATED FINANCIAL STATEMENTS — (Continued)
Long-term debt outstanding as of October 31, 2010 was as follows:
| | | | | | | | | | | | | | | | | | | | |
Due Date | | Principal
Amount | | | Stated
Interest Rate | | | Effective
Interest Rate | | | Interest
Pay Date | | | Interest
Pay Date | |
| | | (In millions) | | | | | | | | | | | | | |
October 15, 2017 | | $ | 200 | | | | 7.125 | % | | | 7.190 | % | | | April 15 | | | | October 15 | |
Other debt | | | 5 | | | | | | | | | | | | | | | | | |
| | | | | | | | | | | | | | | | | | | | |
| | | 205 | | | | | | | | | | | | | | | | | |
Current portion | | | (1 | ) | | | | | | | | | | | | | | | | |
| | | | | | | | | | | | | | | | | | | | |
Total long-term debt | | $ | 204 | | | | | | | | | | | | | | | | | |
| | | | | | | | | | | | | | | | | | | | |
In June 2011, Applied issued senior unsecured notes due 2016, 2021, and 2041 in the aggregate principal amount of $1.75 billion (collectively, the Notes) pursuant to the terms of an indenture and first supplemental indenture (collectively, the Indenture). The Indenture contains certain covenants with which Applied was in compliance at October 30, 2011. The Notes were sold in a public offering pursuant to a registration statement on Form S-3 and related preliminary prospectus supplement filed with the Securities and Exchange Commission (SEC) on June 1, 2011, and a related final prospectus supplement filed with the SEC on June 2, 2011. Applied used the net proceeds of the Notes to fund a portion of the consideration payable in, and certain costs associated with, Applied’s acquisition of Varian.
Applied has debt agreements that contain financial and other covenants. These covenants require Applied to maintain certain minimum financial ratios. At October 30, 2011, Applied was in compliance with all such covenants.
Note | |
| Note 11 | Restructuring Charges and Asset Impairments |
From time to time, Applied initiates restructuring activities to appropriately align its cost structure relative to prevailing economic and industry conditions and associated customer demand as well as in connection with certain acquisitions. Costs associated with restructuring actions can include termination benefits and related charges in addition to facility closure, contract termination and other related activities.
The following table summarizes major components of the restructuring and asset impairment charges during fiscal 2011, 20102014, 2013 and 2009: | | | | | | | | | | | | |
| | | 2011 | | | 2010 | | | 2009 | |
| | | (In millions) | |
Provision for restructuring reserves, severance | | $ | (60 | ) | | $ | 129 | | | $ | 142 | |
Provision for restructuring reserves, facilities | | | — | | | | — | | | | (3 | ) |
Asset impairments | | | 30 | | | | 117 | | | | 17 | |
| | | | | | | | | | | | |
Total | | $ | (30 | ) | | $ | 246 | | | $ | 156 | |
| | | | | | | | | | | | |
|
| | | | | | | | | | | |
| | 2014 | | 2013 | | 2012 |
| | | | | | |
| | (In millions) |
| 2012 Global Restructuring Plan | | | | | |
| Severance and other employee-related costs | $ | 5 |
| | $ | 39 |
| | $ | 106 |
|
| 2012 EES Restructuring Plan | | | | | |
| Severance and other employee-related costs | — |
| | 8 |
| | 27 |
|
| Contract cancellation and other costs | — |
| | 6 |
| | 1 |
|
| Asset impairments | — |
| | 12 |
| | 20 |
|
| Others | | | | | |
| Severance and other employee-related costs | — |
| | 2 |
| | 14 |
|
| Contract cancellation and other costs | — |
| | (4 | ) | | — |
|
| | $ | 5 |
| | $ | 63 |
| | $ | 168 |
|
Restructuring and asset impairment charges were recorded as follows:
|
| | | | | | | | | | | |
| | 2014 | | 2013 | | 2012 |
| | | | | | |
| | (In millions) |
| Silicon Systems Group | $ | — |
| | $ | 1 |
| | $ | 4 |
|
| Applied Global Services | — |
| | 2 |
| | 15 |
|
| Energy and Environmental Solutions | — |
| | 25 |
| | 38 |
|
| Corporate Unallocated | 5 |
| | 35 |
| | 111 |
|
| Total | $ | 5 |
| | $ | 63 |
| | $ | 168 |
|
NOTES TO CONSOLIDATED FINANCIAL STATEMENTS — (Continued)
Changes in restructuring reserves for fiscal 2011, 2010, and 2009 related to other restructuring plans and facilities realignment programs initiated in prior periods were as follows:
| | | | | | | | | | | | |
| | | Severance | | | Facilities | | | Total | |
| | | (In millions) | |
Balance, October 26, 2008 | | | 5 | | | | 15 | | | | 20 | |
Provision for restructuring reserves | | | 145 | | | | — | | | | 145 | |
Consumption of reserves | | | (121 | ) | | | (7 | ) | | | (128 | ) |
Adjustment of restructuring reserves | | | (3 | ) | | | (3 | ) | | | (6 | ) |
| | | | | | | | | | | | |
Balance, October 25, 2009 | | | 26 | | | | 5 | | | | 31 | |
Provision for restructuring reserves | | | 149 | | | | — | | | | 149 | |
Consumption of reserves | | | (56 | ) | | | — | | | | (56 | ) |
Adjustment of restructuring reserves | | | (20 | ) | | | — | | | | (20 | ) |
| | | | | | | | | | | | |
Balance, October 31, 2010 | | $ | 99 | | | $ | 5 | | | $ | 104 | |
Consumption of reserves | | | (33 | ) | | | — | | | | (33 | ) |
Adjustment of restructuring reserves | | | (60 | ) | | | — | | | | (60 | ) |
| | | | | | | | | | | | |
Balance, October 30, 2011 | | $ | 6 | | | $ | 5 | | | $ | 11 | |
| | | | | | | | | | | | |
2012 Global Restructuring Plan
On July 21, 2010,October 3, 2012, Applied announced a restructuring plan (the 2012 Global Restructuring Plan) to realign its global workforce and enhance its ability to invest for growth. Under this plan, Applied implemented a voluntary retirement program and other workforce reduction actions. The voluntary retirement program was available to certain U.S. employees who met minimum age and length of service requirements, as well as other business-specific criteria. Applied implemented other workforce reduction actions globally across multiple business segments and functions, the extent of which depended on the number of employees who participated in the voluntary retirement program and other considerations. A total of approximately 1,300 positions were affected under this plan. As of January 26, 2014, principal activities related to this plan were complete.
During fiscal 2014, 2013 and 2012, Applied recognized $5 million, $39 million and $106 million, respectively, of employee-related costs in connection with the 2012 Global Restructuring Plan. Total costs incurred in implementing this plan were $150 million, none of which were allocated to the operating segments.
2012 EES Restructuring Plan
On May 10, 2012, Applied announced a plan (the 2012 EES Restructuring Plan) to restructure its Energy and Environmental Solutions segment which was expected to impact between 400 to 500in light of challenging industry conditions affecting the solar photovoltaic and light-emitting diode (LED) equipment markets. As part of this plan, Applied relocated certain manufacturing, business operations and customer support functions of its precision wafering systems business and ceased LED development activities. The 2012 EES Restructuring Plan also impacted certain LED support activities in the Applied Global Services segment. The 2012 EES Restructuring Plan impacted approximately 300 positions globally. As of October 27, 2013, principal activities related to this plan were complete. Total costs incurred in implementing this plan were $87 million, of which $13 million were inventory-related charges.
During fiscal 2010,2013 and 2012, Applied incurred employee severancerecognized $26 million and $48 million respectively, of restructuring and asset impairment charges of $45 million associatedin connection with this program. During fiscal 2011, as a result of changesthe 2012 EES Restructuring Plan. These costs were reported in Applied’s operating environmentthe Energy and business requirements,Environmental Solutions and Applied revised its workforce reduction under this program to approximately 200 positions and recorded a favorable adjustment of $36 million.Global Services segments. As of October 30, 2011,26, 2014, there were no remaining severance accruals associated with restructuring reserves under this program.
Integration of Varian and Prior Year Restructuring Plans
During fiscal 2013 and 2012, Applied also recognized $2 million and $14 million, respectively, of severance and other employee-related costs in connection with the
integration of Varian. These costs were reported in the Silicon Systems Group and Applied Global Services segments. As of October 26, 2014, there were no remaining severance accrual associated with restructuring reserves under this
program was $1 million.On November 11, 2009, Applied announced a restructuring program to reduce its global workforce asprogram.
Table of October 25, 2009 by approximately 1,300 to 1,500 positions, or 10 to 12 percent, over a period of 18 months. During the first quarter of fiscal 2010, Applied recorded restructuring charges of $104 million associated with this program. During the third quarter of fiscal 2010, as a result of changes in business requirements, Applied revised its global workforce reduction under this program to approximately 1,000 positions and recorded a favorable adjustment of $20 million. The improved economic environment continued in the first half of fiscal 2011, and as a result Applied recorded an additional favorable adjustment of $19 million. As of October 30, 2011, the remaining severance accrual associated with restructuring reserves under this program was $5 million.In November 12, 2008, Applied initiated a restructuring program to reduce its global workforce by approximately 2,000 positions. During fiscal 2009, Applied incurred employee severance charges of $145 million associated with this program and $17 million in asset impairments. The restructuring charges consisted of employee-related costs to reduce the Company’s workforce through a combination of attrition, voluntary separation and other workforce reduction programs. During fiscal 2011, Applied favorably adjusted the severance accrual associated with this program by $5 million. As of October 30, 2011, no severance accrual remained under this program.
In fiscal 2011, Applied incurred impairment charges of $24 million associated with certain intangible assets and purchased technology. See Note 8 of the Notes to Consolidated Financial Statements. Applied also incurred asset impairment charges of $3 million related to certain fixed assets.
In fiscal 2010, Applied recorded asset impairment charges of $108 million related to the restructuring of its Energy and Environmental Solutions segment and of $9 million to write down a facility to its estimated fair value
Contents
NOTES TO CONSOLIDATED FINANCIAL STATEMENTS — (Continued)
based on prices
Changes in restructuring reserves for comparable local properties. The facility was reclassifiedfiscal 2014, 2013, and 2012 were as an asset held for sale. In fiscal 2011, Applied recorded additional impairment chargesfollows:
|
| | | | | | | | | | | | | | | | | | | | | | | |
| | 2012 Global Restructuring Plan | | 2012 EES Restructuring Plan | | Others | | |
| | Severance and Other Employee-Related Costs | | Severance and Other Employee-Related Costs | | Contract Cancellation and Other Costs | | Severance and Other Employee-Related Costs | | Contract Cancellation and Other Costs | | Total |
| | | | | | | | | | | | |
| | (In millions) |
| Balance, October 30, 2011 | $ | — |
| | $ | — |
| | $ | — |
| | $ | 6 |
| | $ | 5 |
| | $ | 11 |
|
| Provision for restructuring reserves | 106 |
| | 27 |
| | 1 |
| | 14 |
| | — |
| | 148 |
|
| Consumption of reserves | — |
| | (11 | ) | | — |
| | (15 | ) | | — |
| | (26 | ) |
| Balance, October 28, 2012 | $ | 106 |
| | $ | 16 |
| | $ | 1 |
| | $ | 5 |
| | $ | 5 |
| | $ | 133 |
|
| Provision for restructuring reserves | 35 |
| | 7 |
| | 8 |
| | 2 |
| | — |
| | 52 |
|
| Consumption of reserves | (111 | ) | | (18 | ) | | (2 | ) | | (5 | ) | | — |
| | (136 | ) |
| Adjustment of restructuring reserves | (4 | ) | | — |
| | (2 | ) | | — |
| | (4 | ) | | (10 | ) |
| Balance, October 27, 2013 | $ | 26 |
| | $ | 5 |
| | $ | 5 |
| | $ | 2 |
| | $ | 1 |
| | $ | 39 |
|
| Provision for restructuring reserves | 7 |
| | — |
| | — |
| | — |
| | — |
| | 7 |
|
| Consumption of reserves | (27 | ) | | (5 | ) | | (1 | ) | | (2 | ) | | — |
| | (35 | ) |
| Adjustment of restructuring reserves | (2 | ) | | — |
| | — |
| | — |
| | — |
| | (2 | ) |
| Balance, October 26, 2014 | $ | 4 |
| | — |
| | 4 |
| | $ | — |
| | $ | 1 |
|
| $ | 9 |
|
APPLIED MATERIALS, INC.
NOTES TO CONSOLIDATED FINANCIAL STATEMENTS — (Continued)
| |
| Note 12 | Stockholders’ Equity, Comprehensive Income and Share-Based Compensation |
Accumulated Other Comprehensive Income (Loss)
Components
Changes in the components of
accumulated other comprehensive income (loss), on an after-tax basis where applicable,AOCI, net of tax, were as follows:
| | | | | | | | |
| | | October 30,
2011 | | | October 31,
2010 | |
| | | (In millions) | |
Unrealized gain on investments, net | | $ | 17 | | | $ | 25 | |
Unrealized gain on derivative instruments qualifying as cash flow hedges | | | — | | | | 4 | |
Pension liability | | | (25 | ) | | | (39 | ) |
Cumulative translation adjustments | | | 14 | | | | 12 | |
| | | | | | | | |
| | $ | 6 | | | $ | 2 | |
| | | | | | | | |
|
| | | | | | | | | | | | | | | | | | | |
| | Unrealized Gain on Investments, Net | | Unrealized Gain on Derivative Instruments Qualifying as Cash Flow Hedges | | Defined and Postretirement Benefit Plans | | Cumulative Translation Adjustments | | Total |
| | (in millions) | | |
| Balance at October 27, 2013 | $ | 25 |
| | $ | 2 |
| | $ | (72 | ) | | $ | 7 |
| | $ | (38 | ) |
| Other comprehensive income (loss) before reclassifications | 8 |
| | 4 |
| | (36 | ) | | (2 | ) | | (26 | ) |
| Amounts reclassified out of AOCI | (9 | ) | | (6 | ) | | 3 |
| | — |
| | (12 | ) |
| Other comprehensive loss, net of tax | (1 | ) | | (2 | ) | | (33 | ) | | (2 | ) | | (38 | ) |
| Balance at October 26, 2014 | $ | 24 |
| | $ | — |
| | $ | (105 | ) | | $ | 5 |
| | $ | (76 | ) |
On March 8, 2010, Applied’s5, 2012, Applied's Board of Directors approved a new stock repurchase program authorizing up to $2.0$3.0 billion in repurchases over the next three years ending in March 2013.2015. Under this authorization, Applied renewedpurchases shares of its systematiccommon stock repurchase program and may also make supplementalon the open market. At October 26, 2014, $1.6 billion remained available for future stock repurchases from time to time, depending on market conditions,under this repurchase program.
Applied did not repurchase any shares of its common stock
price and other factors.during fiscal 2014. The following table summarizes Applied’s stock repurchases for fiscal 2011, 2010,2013 and 2009:
| | | | | | | | | | | | |
| | | 2011 | | | 2010 | | | 2009 | |
| | | (In millions, except per share amounts) | |
Shares of common stock repurchased | | | 36 | | | | 29 | | | | 2 | |
Cost of stock repurchased | | $ | 468 | | | $ | 350 | | | $ | 23 | |
Average price paid per share | | $ | 12.88 | | | $ | 12.15 | | | $ | 11.80 | |
2012:
|
| | | | | | | |
| | 2013 | | 2012 |
| | | | |
| | (In millions, except per share amounts) |
| Shares of common stock repurchased | 18 |
| | 126 |
|
| Cost of stock repurchased | $ | 245 |
| | $ | 1,416 |
|
| Average price paid per share | $ | 13.60 |
| | $ | 11.22 |
|
Applied records treasury stock purchases under the cost method using the first-in, first-out (FIFO) method. Upon reissuance of treasury stock, amounts in excess of the acquisition cost are credited to additional paid in capital. If Applied reissues treasury stock at an amount below its acquisition cost and additional paid in capital associated with prior treasury stock transactions is insufficient to cover the difference between the acquisition cost and the reissue price, this difference is recorded against retained earnings. During fiscal 2009, shares
Table of treasury stock were issued under Applied’s Employee Stock Purchase Plans at an aggregate value that was less than the treasury stock’s acquisition price, resulting in $40 million being recorded against retained earnings.Dividends
The following table summarizes the dividends declared by Applied’s Board of Directors during fiscal 2011:
| | | | | | |
Date declared
| | Record date
| | Payable date
| | Amount per share
|
December 7, 2010
| | March 2, 2011 | | March 23, 2011 | | $ 0.07 |
March 8, 2011
| | June 1, 2011 | | June 22, 2011 | | $ 0.08 |
June 6, 2011
| | August 31, 2011 | | September 21, 2011 | | $ 0.08 |
September 13, 2011
| | November 23, 2011 | | December 14, 2011 | | $ 0.08 |
Contents
NOTES TO CONSOLIDATED FINANCIAL STATEMENTS — (Continued)
Dividends
During fiscal 2010,2014, Applied’s Board of Directors declared four quarterly cash dividends of $0.10 per share each. During fiscal 2013, Applied’s Board of Directors declared three quarterly cash dividends in the amount of $0.07$0.10 per share each and one quarterly cash dividend in the amount of $0.06$0.09 per share. During fiscal 2009,2012, Applied’s Board of Directors declared fourthree quarterly cash dividends in the amount of $0.06$0.09 per share each quarter.and one quarterly cash dividend of $0.08 per share. Dividends declared during fiscal 2011, 20102014, 2013 and 20092012 amounted to $408$487 million $361, $469 million and $320$438 million, respectively. Applied currently anticipates that cash dividends will continue to be paid on a quarterly basis, although the declaration of any future cash dividend is at the discretion of the Board of Directors and will depend on Applied’s financial condition, results of operations, capital requirements, business conditions and other factors, as well as a determination by the Board of Directors that cash dividends are in the best interests of Applied’s stockholders.
Applied has adopted stock plans that permita stockholder-approved equity plan, the Employee Stock Incentive Plan, which permits grants to employees of share-based awards, including stock options, restricted stock, and restricted stock units, (also referred to as “performance shares” under Applied’s principal equity compensation plan, the Employee Stock Incentive Plan).performance shares and performance units. In addition, the Employee Stock Incentive Planplan provides for the automatic grant of restricted stock units to non-employee directors and permits the grant of share-based awards to non-employee directors and consultants. Share-based awards made beginning in March 2012 under the plan may be subject to accelerated vesting under certain circumstances in the event of a change in control of Applied. Applied also has two Employee Stock Purchase Plans, one generally for United States employees and a second for employees of international subsidiaries (collectively, ESPP), which enable eligible employees to purchase Applied common stock. During fiscal 2011, 2010,2014, 2013, and 2009,2012, Applied recognized share-based compensation expense related to stock options, ESPP shares, restricted stock, restricted stock units, performance shares and restricted stock.performance units. Total share-based compensation and related tax benefits were as follows: | | | | | | | | | | | | |
| | | 2011 | | | 2010 | | | 2009 | |
| | | (In millions) | |
Share-based compensation | | $ | 146 | | | $ | 126 | | | $ | 147 | |
Tax benefit recognized | | $ | 42 | | | $ | 38 | | | $ | 41 | |
|
| | | | | | | | | | | |
| | 2014 | | 2013 | | 2012 |
| | | | | | |
| | (In millions) |
| Share-based compensation | $ | 177 |
| | $ | 162 |
| | $ | 182 |
|
| Tax benefit recognized | $ | 50 |
| | $ | 45 |
| | $ | 52 |
|
The effect of share-based compensation on the results of operations for fiscal 2011, 2010,2014, 2013, and 20092012 was as follows: | | | | | | | | | | | | |
| | | 2011 | | | 2010 | | | 2009 | |
| | | (In millions) | |
Cost of products sold | | $ | 48 | | | $ | 32 | | | $ | 28 | |
Research, development, and engineering | | | 46 | | | | 43 | | | | 50 | |
Selling, general and administrative | | | 52 | | | | 51 | | | | 69 | |
| | | | | | | | | | | | |
Total share-based compensation | | $ | 146 | | | $ | 126 | | | $ | 147 | |
| | | | | | | | | | | | |
|
| | | | | | | | | | | |
| | 2014 | | 2013 | | 2012 |
| | | | | | |
| | (In millions) |
| Cost of products sold | $ | 53 |
| | $ | 50 |
| | $ | 54 |
|
| Research, development, and engineering | 66 |
| | 53 |
| | 54 |
|
| Marketing and selling | 23 |
| | 20 |
| | 22 |
|
| General and administrative | 35 |
| | 34 |
| | 52 |
|
| Restructuring charge | — |
| | 5 |
| | — |
|
| Total | $ | 177 |
| | $ | 162 |
| | $ | 182 |
|
The cost associated with share-based awards that are subject solely to time-based vesting requirements, less expected forfeitures, is recognized over the awards’ service period for the entire award on a straight-line basis. The cost associated with performance-based equity awards is recognized for each tranche over the service period, based on an assessment of the likelihood that the applicable performance goals will be achieved.
At October 30, 2011,26, 2014, Applied had $219$241 million in total unrecognized compensation expense, net of estimated forfeitures, related to grants of stock options, restricted stock units and restricted stock,share-based awards and shares issued under Applied’s ESPP, which will be recognized over a weighted average period of 2.62.5 years. At October 30, 2011,26, 2014, there were 157176 million shares available for stock option, restricted stock unit, restricted stock grants and otherof share-based awards under the Employee Stock Incentive Plan, and an additional 5434 million shares available for issuance under the ESPP.
NOTES TO CONSOLIDATED FINANCIAL STATEMENTS — (Continued)
Applied grants options to purchase, at future dates, shares of its common stock to employees and consultants. The exercise price of each stock option equals the fair market value of Applied common stock on the date of grant. Options typically vest over three to four years, subject to the grantee’s continued service with Applied through the scheduled vesting date, and expire no later than seven years from the grant date. The fair value of each option grant is estimated on the date of grant using the Black-Scholes option pricing model. This model was developed for use in estimating the value of publicly traded options that have no vesting restrictions and are fully transferable. Applied’s employee stock options have characteristics significantly different from those of publicly traded options. There were no stock options granted during fiscal
2011 and 2010.2014. The weighted average assumptions used in the model for
the stock options granted
in fiscal 2009and assumed are outlined
in the following table: | | | | |
| | 2009 | |
Stock Options:
| | | | |
Dividend yield
| | | 2.8 | % |
Expected volatility
| | | 49.9 | % |
Risk-free interest rate
| | | 1.26 | % |
Expected life (in years)
| | | 3.0 | |
The computation of the expected volatility assumption used in the Black-Scholes calculations for new grants is based on a combination of historical and implied volatilities. When establishing the expected life assumption, Applied periodically reviews historical employee exercise behaviorbelow:
|
| | | | | |
| | 2013 | | 2012 |
| Stock Options: | | | |
| Dividend yield | 2.7 | % | | 2.6 | % |
| Expected volatility | 29.5 | % | | 38.7 | % |
| Risk-free interest rate | 1.44 | % | | 0.52 | % |
| Expected life (in years) | 4.5 |
| | 3.3 |
|
Information with respect to
option grants.The weighted average grant date fair value ofstock options granted during fiscal 2009 was $2.52.
Options outstanding had an aggregate intrinsic value of $58 million, $73 million and $109 million at October 30, 2011, October 31, 2010, and October 25, 2009, respectively. The total grant date fair value of options granted during fiscal 2009 was $62 million. The total intrinsic value of options exercised during fiscal 2011, 2010 and 2009 was $23 million, $15 million and $1 million, respectively. The total fair value of options that vested during fiscal 2011, 2010 and 2009 was $17 million, $21 million and $14 million, respectively. Cash received from stock option exercises was $41 million, $78 million and $9 million, during fiscal 2011, 2010 and 2009, respectively. The actual tax benefit realized for the tax deductions from options exercised for fiscal 2011, 2010 and 2009 totaled $11 million, $4 million and $0.4 million, respectively.
is as follows:
|
| | | | | | | | | | | |
| | 2014 | | 2013 | | 2012 |
| | (In millions) |
| Aggregate intrinsic value of outstanding stock options | $ | 19 |
| | $ | 49 |
| | $ | 43 |
|
| Total intrinsic value of stock options exercised | $ | 39 |
| | $ | 63 |
| | $ | 21 |
|
| Total fair value of stock options vested | $ | 1 |
| | $ | 4 |
| | $ | 41 |
|
| Cash received from stock option exercises | $ | 29 |
| | $ | 88 |
| | $ | 33 |
|
| Actual tax benefit realized from options exercised | $ | 12 |
| | $ | 19 |
| | $ | 7 |
|
Stock option activity for fiscal 2011, 20102014, 2013 and 20092012 was as follows: | | | | | | | | | | | | | | | | | | | | | | | | |
| | | 2011 | | | 2010 | | | 2009 | |
| | | Shares | | | Weighted
Average
Exercise
Price | | | Shares | | | Weighted
Average
Exercise
Price | | | Shares | | | Weighted
Average
Exercise
Price | |
| | | (In millions, except per share amounts) | |
Outstanding, beginning of year | | | 51 | | | $ | 15.04 | | | | 73 | | | $ | 14.72 | | | | 61 | | | $ | 17.71 | |
Granted and assumed | | | — | | | $ | — | | | | — | | | $ | — | | | | 24 | | | $ | 8.58 | |
Exercised | | | (5 | ) | | $ | 9.21 | | | | (7 | ) | | $ | 10.88 | | | | (1 | ) | | $ | 11.44 | |
Canceled and forfeited | | | (16 | ) | | $ | 20.28 | | | | (15 | ) | | $ | 15.64 | | | | (11 | ) | | $ | 17.73 | |
| | | | | | | | | | | | | | | | | | | | | | | | |
Outstanding, end of year | | | 30 | | | $ | 13.05 | | | | 51 | | | $ | 15.04 | | | | 73 | | | $ | 14.72 | |
| | | | | | | | | | | | | | | | | | | | | | | | |
Exercisable, end of year | | | 24 | | | $ | 14.23 | | | | 37 | | | $ | 17.39 | | | | 50 | | | $ | 17.53 | |
|
| | | | | | | | | | | | | | | | | | | | |
| | 2014 | | 2013 | | 2012 |
| | Shares | | Weighted Average Exercise Price | | Shares | | Weighted Average Exercise Price | | Shares | | Weighted Average Exercise Price |
| | | | | | | | | | | | |
| | (In millions, except per share amounts) |
| Outstanding, beginning of year | 6 |
| | $ | 9.12 |
| | 21 |
| | $ | 10.53 |
| | 30 |
| | $ | 13.05 |
|
| Granted and assumed in Varian acquisition | — |
| | $ | — |
| | 1 |
| | $ | 15.06 |
| | 5 |
| | $ | 4.85 |
|
| Exercised | (4 | ) | | $ | 7.85 |
| | (11 | ) | | $ | 8.16 |
| | (4 | ) | | $ | 7.30 |
|
| Canceled and forfeited | — |
| | $ | — |
| | (5 | ) | | $ | 17.62 |
| | (10 | ) | | $ | 16.76 |
|
| Outstanding, end of year | 2 |
| | $ | 10.87 |
| | 6 |
| | $ | 9.12 |
| | 21 |
| | $ | 10.53 |
|
| Exercisable, end of year | 1 |
| | $ | 7.97 |
| | 5 |
| | $ | 7.90 |
| | 20 |
| | $ | 10.71 |
|
NOTES TO CONSOLIDATED FINANCIAL STATEMENTS — (Continued)
The following table summarizes information with respect to options outstanding and exercisable at October 30, 2011: | | | | | | | | | | | | | | | | | | | | | | | | | | | | |
| | | Options Outstanding | | | Options Exercisable | |
Range of Exercise Prices | | Number of
Shares | | | Weighted
Average
Exercise
Price | | | Weighted
Average
Remaining
Contractual
Life | | | Aggregate
Intrinsic
Value | | | Number of
Shares | | | Weighted
Average
Exercise
Price | | | Aggregate
Intrinsic
Value | |
| | | (In millions) | | | | | | (In years) | | | (In millions) | | | (In millions) | | | | | | (In millions) | |
$0.01 — $9.99 | | | 14 | | | $ | 8.58 | | | | 2.36 | | | $ | 58 | | | | 8 | | | $ | 8.58 | | | $ | 33 | |
$10.00 — $19.99 | | | 16 | | | $ | 17.08 | | | | 0.82 | | | | — | | | | 16 | | | $ | 17.08 | | | | — | |
$20.00 — $29.99 | | | — | | | $ | 21.91 | | | | 2.14 | | | | — | | | | — | | | $ | 21.91 | | | | — | |
| | | | | | | | | | | | | | | | | | | | | | | | | | | | |
| | | 30 | | | $ | 13.05 | | | | 1.56 | | | $ | 58 | | | | 24 | | | $ | 14.23 | | | $ | 33 | |
| | | | | | | | | | | | | | | | | | | | | | | | | | | | |
Options exercisable and expected to become exercisable | | | 30 | | | $ | 13.08 | | | | 1.55 | | | $ | 58 | | | | | | | | | | | | | |
26, 2014
: |
| | | | | | | | | | | | | | | | | | | | | | | |
| | Options Outstanding | | Options Exercisable |
Range of Exercise Prices | Number of Shares | | Weighted Average Exercise Price | | Weighted Average Remaining Contractual Life | | Aggregate Intrinsic Value | | Number of Shares | | Weighted Average Exercise Price | | Aggregate Intrinsic Value |
| | (In millions) | | | | (In years) | | (In millions) | | (In millions) | | | | (In millions) |
| $3.36 — $9.99 | 1 |
| | $ | 5.31 |
| | 1.81 | | $ | 12 |
| | 1 |
| | $ | 5.30 |
| | $ | 12 |
|
| $10.00 — $15.06 | 1 |
| | $ | 14.96 |
| | 5.59 | | 7 |
| | — |
| | $ | 14.71 |
| | 2 |
|
| | 2 |
| | $ | 10.87 |
| | 3.99 | | $ | 19 |
| | 1 |
| | $ | 7.97 |
| | $ | 14 |
|
| Options exercisable and expected to become exercisable | 2 |
| | $ | 10.87 |
| | 3.99 | | $ | 19 |
| | | | | | |
Option prices at the lower end of the range were principally attributable to stock options assumed in connection with the Varian acquisition in fiscal year 2012.
Restricted Stock Units,
and Restricted Stock,
Performance Shares and Performance Units
Restricted stock units are converted into shares of Applied common stock upon vesting on a one-for-one basis. Restricted stock has the same rights as other issued and outstanding shares of Applied common stock except these shares generally have no right to dividends and are held in escrow until the award vests. Performance shares and performance units are awards that result in a payment to a grantee, generally in shares of Applied common stock on a one-for-one basis if performance goals and/or other vesting criteria established by the Human Resources and Compensation Committee of Applied's Board of Directors (the Committee) are achieved or the awards otherwise vest. Restricted stock units, and awards of restricted stock, performance shares and performance units typically are scheduled to vest over three to four years. Vesting of restricted stock unitsyears and restricted stockvesting is usually is subject to the grantee’s continued service with Applied and, in some cases, achievement of specified performance goals. The compensation expense related to thesethe service-based awards is determined using the fair market value of Applied common stock on the date of the grant, and the compensation expense is recognized over the vesting period. Beginning in fiscal 2007, Applied initiated a performance-based equity award program for named
Restricted stock, performance shares and performance units granted to certain executive officers
and other key employees. Awardsare subject to the achievement of
restricted stock units or restricted stock granted under this programspecified performance goals (performance-based awards)
. These performance-based awards become eligible to vest only if
specific performance goals
set by the Human Resources and Compensation Committee of Applied’s Board of Directors (the Committee) are achieved and then
actually will vest only if the grantee remains employed by Applied through each applicable vesting date.
The performance goals These performance-based awards require the achievement of targeted levels of adjusted annual operating profit margin levels compared to Applied’s peer companies in at least one of the four fiscal years beginning withmargin. For the fiscal year of the grant and that Applied’s annual adjusted operating profit margin is positive in such year. An award that has2013 performance-based awards, additional shares become eligible for time-based vesting basedif Applied achieves certain levels of total shareholder return (TSR) relative to a peer group, comprised of companies in the Standard & Poor's 500 Information Technology Index, measured at the end of a two-year period.
The fair value of these performance-based awards is estimated on achievementthe date of grant and assumes that the specified performance goals will be achieved. If the goals are achieved, these awards vest as to 25%over a specified remaining service period of the award on December 19 of each of thegenerally three or four calendar years, starting in the calendar year of the grant, provided that the grantee remains employed by Applied through each scheduled vesting date. Performance-based awards that do not become eligible for time-based vesting in a particular year may become eligible for time-based vesting in subsequent years up until the fourth fiscal year after grant, after which they are forfeited if the required performance goals have not been achieved. The fair value of these performance-based awards is estimated using the fair market value of Applied common stock on the date of the grant and assumes that the specified performance goals will be achieved. If achieved, these awards vest over a specified remaining service period as described above. If the performance goals are not met as of the end of the performance period, no compensation expense is recognized and any previously recognized compensation expense is reversed. The expected cost of each award is reflected over the service period and is reduced for estimated forfeitures. The Committee approved the grant
NOTES TO CONSOLIDATED FINANCIAL STATEMENTS — (Continued)
earned, subject to additional time-based vesting requirements. With respect to the performance-based awards granted in fiscal 2010, as of October 30, 2011, 82 percent of the awards had been earned, subject to additional time-based vesting requirements. The remaining 18 percent of the awards may still be earned, depending on future performance in one or both of fiscal years 2012 and 2013. As of October 30, 2011, 90 percent of the performance-based awards granted in fiscal 2008, were earned.
A summary of the changes in restricted stock units, restricted stock, performance shares and performance units outstanding under Applied’s equity compensation plans during fiscal 20112014, 2013 and 2012 are presented below: | | | | | | | | | | | | | | | | |
| | | Shares | | | Weighted
Average
Grant Date
Fair Value | | | Weighted
Average
Remaining
Contractual Term | | | Aggregate
Intrinsic
Value | |
| | | (In millions, except per share amounts) | |
Non-vested restricted stock units and restricted stock at October 31, 2010 | | | 18 | | | $ | 13.33 | | | | 2.8 Years | | | $ | 227 | |
Granted | | | 17 | | | | 12.62 | | | | | | | | | |
Vested | | | (5 | ) | | | 14.64 | | | | | | | | | |
Canceled | | | (2 | ) | | | 13.11 | | | | | | | | | |
| | | | | | | | | | | | | | | | |
Non-vested restricted stock units and restricted stock at October 30, 2011 | | | 28 | | | | 12.64 | | | | 2.8 | | | $ | 345 | |
| | | | | | | | | | | | | | | | |
Non-vested restricted stock units and restricted stock expected to vest | | | 24 | | | | 12.52 | | | | 2.7 | | | $ | 304 | |
|
| | | | | | | | | | | | |
| | Shares | | Weighted Average Grant Date Fair Value | | Weighted Average Remaining Contractual Term | | Aggregate Intrinsic Value |
| | | | | | | | |
| | (In millions, except per share amounts) |
| Non-vested restricted stock units, restricted stock, performance shares and performance units at October 30, 2011 | 28 |
| | $ | 12.64 |
| | 2.8 years | | $ | 345 |
|
| Granted | 19 |
| | $ | 10.61 |
| | | | |
| Vested | (9 | ) | | $ | 12.87 |
| | | | |
| Canceled | (2 | ) | | $ | 12.26 |
| | | | |
| Non-vested restricted stock units, restricted stock, performance shares and performance units at October 28, 2012 | 36 |
| | $ | 11.53 |
| | 2.6 years | | $ | 376 |
|
| Granted | 19 |
| | $ | 10.55 |
| | | | |
| Vested | (11 | ) | | $ | 11.44 |
| | | | |
| Canceled | (6 | ) | | $ | 11.28 |
| | | | |
| Non-vested restricted stock units, restricted stock, performance shares and performance units at October 27, 2013 | 38 |
| | $ | 11.11 |
| | 2.4 years | | $ | 662 |
|
| Granted | 11 |
| | $ | 16.58 |
| | | | |
| Vested | (13 | ) | | $ | 11.13 |
| | | | |
| Canceled | (3 | ) | | $ | 11.72 |
| | | | |
| Non-vested restricted stock units, restricted stock, performance shares and performance units at October 26, 2014 | 33 |
| | $ | 12.59 |
| | 2.3 years | | $ | 698 |
|
| Non-vested restricted stock units, restricted stock, performance shares and performance units expected to vest | 30 |
| | $ | 12.47 |
| | 2.1 years | | $ | 630 |
|
At October 26, 2014, 1 million additional performance-based awards could be earned upon certain levels of achievement of Applied's TSR relative to a peer group at a future date.
The actual tax benefit realized for the tax deductions from vested restricted stock units totaled $22$61 million in eachfiscal 2014, $42 million in fiscal 2013 and $27 million in fiscal 2012.
APPLIED MATERIALS, INC.
NOTES TO CONSOLIDATED FINANCIAL STATEMENTS — (Continued)
Employee Stock Purchase Plans
Under the ESPP, substantially all employees may purchase Applied common stock through payroll deductions at a price equal to 85 percent of the lower of the fair market value of Applied common stock at the beginning or end of each 6-month6-month purchase period, subject to certain limits. Based on the Black-Scholes option pricing model, the weighted average estimated fair value of purchase rights under the ESPP was $3.03$4.56 per share for the year ended October 30, 2011, $2.7626, 2014, $3.08 per share for the year ended October 31, 201027, 2013 and $3.19$2.73 per share for the year ended October 25, 2009.28, 2012. The number of shares issued under the ESPP during fiscal 2011, 2010October 26, 2014, October 27, 2013 and 2009October 28, 2012 was 6 million 5 million and , 7 million and 7 million, respectively. At October 30, 2011,26, 2014, there were 5434 million available for future issuance under the ESPP. Compensation expense is calculated using the fair value of the employees’ purchase rights under the Black-Scholes model. Underlying assumptions used in the model for fiscal 2011, 20102014, 2013 and 20092012 are outlined in the following table: | | | | | | | | | | | | |
| | | 2011 | | | 2010 | | | 2009 | |
ESPP: | | | | | | | | | | | | |
Dividend yield | | | 2.53 | % | | | 2.44 | % | | | 2.37 | % |
Expected volatility | | | 31.1 | % | | | 33.3 | % | | | 58.8 | % |
Risk-free interest rate | | | 0.09 | % | | | 0.19 | % | | | 0.33 | % |
Expected life (in years) | | | 0.5 | | | | 0.5 | | | | 0.5 | |
APPLIED MATERIALS, INC.
NOTES TO CONSOLIDATED FINANCIAL STATEMENTS — (Continued)
|
| | | | | | | | |
| | 2014 | | 2013 | | 2012 |
| ESPP: | | | | | |
| Dividend yield | 1.96 | % | | 2.80 | % | | 3.01 | % |
| Expected volatility | 26.3 | % | | 24.8 | % | | 29.6 | % |
| Risk-free interest rate | 0.06 | % | | 0.09 | % | | 0.13 | % |
| Expected life (in years) | 0.5 |
| | 0.5 |
| | 0.5 |
|
Note | |
| Note 13 | Employee Benefit Plans |
Applied has various employee bonus plans. A discretionary bonus plan provides for the distribution of a percentage of pre-tax income to Applied employees who are not participants in other performance-based incentive plans, up to a maximum percentage of eligible compensation. Other plans provide for bonuses to Applied’s executives and other key contributors based on the achievement of profitability and/or other specified performance criteria. Charges under these plans were $319$290 million for fiscal 2011, $3202014, $269 million for fiscal 2010,2013, and no$271 million charges for fiscal 2009.2012. Employee Savings and Retirement Plan
Applied’s Employee Savings and Retirement Plan (401(k)(the 401(k) Plan) is qualified under Sections 401(a) and (k) of the Internal Revenue Code.Code (the Code). Eligible employees may make salary deferral and catch-up contributions under the 401(k) Plan on a pre-tax basis. basis and/or (effective as of the first payroll period beginning on or after December 22, 2012) on a Roth basis, subject to an annual dollar limit established by the Code.
Applied matches a percentage100% of each participant’sparticipant salary and/or Roth deferral contributions with cash contributions.up to the first 3% of eligible contribution and then 50% of every dollar between 4% and 6% of eligible contribution. Applied does not make matching contributions on any catch-up contributions made by participants. Plan participants who were employed by Applied or any of its affiliates on or after January 1, 2010 became 100% vested in their Applied matching contribution account balances. Participants may direct that funds held in their 401(k) Plan accounts, including any AppliedApplied’s matching contributions be invested in any of the diversified investment funds available under the 401(k) Plan or within certain limits in the Applied Materials, Inc. Common Stock Fund (Stock Fund), which invests solely in shares of Applied common stock. The Stock Fund is a non-leveraged employee stock ownership plan (within the meaning of Section 4975(e)(7) of the Internal Revenue Code) and, as a result, participants have the option of specifying that any future cash dividends paid on shares held in the Stock Fund be either reinvested in the Stock Fund or distributed directly to them in cash no later than 90 days after the calendar year for which the dividends were paid. Applied’s matching contributions under this plan were approximately $27$29 million for fiscal 2011; $25 million,, net of $1$1 million in forfeitures for fiscal 2010;2014 and $24fiscal 2013 and $37 million net of $1 million in forfeitures, for fiscal 2009.2012.
APPLIED MATERIALS, INC.
NOTES TO CONSOLIDATED FINANCIAL STATEMENTS — (Continued)
Defined Benefit Pension Plans of Foreign Subsidiaries and Other Post-Retirement Benefits
Several of Applied’s foreign subsidiaries have defined benefit pension plans covering substantially all of their eligible employees. Benefits under these plans are typically based on years of service and final average compensation levels. The plans are managed in accordance with applicable local statutes and practices. Applied deposits funds for certain of these plans with insurance companies, pension trustees, government-managed accounts, and/or accrues the expense for the unfunded portion of the benefit obligation on its Consolidated Financial Statements. Applied’s practice is to fund the various pension plans in amounts sufficient to meet the minimum requirements as established by applicable local governmental oversight and taxing authorities. Depending on the design of the plan, local custom and market circumstances, the liabilities of a plan may exceed qualified plan assets. The differences between the aggregate projected benefit obligations and aggregate plan assets of these plans have been recorded as liabilities by Applied and are included in
employee benefitsother liabilities and accrued expenses in the Consolidated Balance Sheets.
In fiscal 2009, Applied changed the measurement date for its defined and postretirement benefit plan assets and obligations from an interim date to Applied’s fiscal year end.Applied also has a U.S. post-retirement plan that provides certain medical and vision benefits to eligible retirees who are at least age 55 and whose years of service plus their age equals at least 65 at their date of retirement. An eligible retiree also may elect coverage for an eligible spouse or domestic partner who is not eligible for Medicare. Coverage under the plan generally ends for both the retiree and spouse or domestic partner upon becoming eligible for Medicare. In addition, Applied also has a post-retirement benefit plan as a result of the acquisition of Varian. Applied’s liability under thisthese post-retirement plan,plans, which was included in other long-term liabilities in the Consolidated Balance Sheets, was $13$34 million at October 30, 201126, 2014 and $12 million at October 31, 2010.27, 2013
.
NOTES TO CONSOLIDATED FINANCIAL STATEMENTS — (Continued)
A summary of the changes in benefit obligations and plan assets, which includes post-retirement benefits, for fiscal 2011October 26, 2014 and 2010October 27, 2013 is presented below. | | | | | | | | |
| | | 2011 | | | 2010 | |
| | | (In millions, except percentages) | |
Change in projected benefit obligation | | | | | | | | |
Beginning projected benefit obligation | | $ | 309 | | | $ | 279 | |
Service cost | | | 15 | | | | 13 | |
Interest cost | | | 14 | | | | 13 | |
Plan participants’ contributions | | | 1 | | | | 1 | |
Actuarial (gain) loss | | | (26 | ) | | | 25 | |
Curtailments, settlements and special termination benefits | | | (9 | ) | | | (9 | ) |
Foreign currency exchange rate changes | | | 5 | | | | (7 | ) |
Benefits paid | | | (8 | ) | | | (6 | ) |
Plan amendments and business combinations | | | 2 | | | | — | |
| | | | | | | | |
Ending projected benefit obligation | | $ | 303 | | | $ | 309 | |
| | | | | | | | |
Ending accumulated benefit obligation | | $ | 273 | | | $ | 279 | |
| | | | | | | | |
Range of assumptions to determine benefit obligations | | | | | | | | |
Discount rate | | | 1.7% - 6.5% | | | | 1.5% - 5.6% | |
Rate of compensation increase | | | 2.0% - 5.0% | | | | 2.0% - 5.0% | |
Change in plan assets | | | | | | | | |
Beginning fair value of plan assets | | $ | 162 | | | $ | 110 | |
Return on plan assets | | | 3 | | | | 7 | |
Employer contributions | | | 26 | | | | 61 | |
Plan participants’ contributions | | | 1 | | | | 1 | |
Foreign currency exchange rate changes | | | 2 | | | | (3 | ) |
Divestitures, settlements and business combinations | | | (3 | ) | | | (8 | ) |
Benefits paid | | | (8 | ) | | | (6 | ) |
| | | | | | | | |
Ending fair value of plan assets | | $ | 183 | | | $ | 162 | |
| | | | | | | | |
Funded status | | $ | (120 | ) | | $ | (147 | ) |
| | | | | | | | |
Amounts recognized in the consolidated balance sheets | | | | | | | | |
Noncurrent asset | | $ | 13 | | | $ | — | |
Current liability | | | (3 | ) | | | (3 | ) |
Noncurrent liability | | | (130 | ) | | | (144 | ) |
| | | | | | | | |
Total | | $ | (120 | ) | | $ | (147 | ) |
| | | | | | | | |
Estimated amortization from accumulated other comprehensive loss into net periodic benefit cost over the next fiscal year | | | | | | | | |
Actuarial loss | | | 1 | | | | 2 | |
| | | | | | | | |
Total | | $ | 1 | | | $ | 2 | |
| | | | | | | | |
Amounts recognized in accumulated other comprehensive loss | | | | | | | | |
Net actuarial loss | | $ | 27 | | | $ | 48 | |
Prior service cost (credit) | | | (4 | ) | | | (4 | ) |
| | | | | | | | |
Total | | $ | 23 | | | $ | 44 | |
| | | | | | | | |
Plans with projected benefit obligations in excess of plan assets | | | | | | | | |
Projected benefit obligation | | $ | 259 | | | $ | 309 | |
Fair value of plan assets | | $ | 126 | | | $ | 162 | |
Plans with accumulated benefit obligations in excess of plan assets | | | | | | | | |
Accumulated benefit obligation | | $ | 225 | | | $ | 225 | |
Fair value of plan assets | | $ | 116 | | | $ | 106 | |
|
| | | | | | | |
| | 2014 | | 2013 |
| | | | |
| | (In millions, except percentages) |
| Change in projected benefit obligation | | | |
| Beginning projected benefit obligation | $ | 445 |
| | $ | 434 |
|
| Service cost | 17 |
| | 20 |
|
| Interest cost | 17 |
| | 15 |
|
| Plan participants’ contributions | 1 |
| | 1 |
|
| Actuarial (gain) loss | 62 |
| | (16 | ) |
| Curtailments, settlements and special termination benefits | (26 | ) | | (8 | ) |
| Foreign currency exchange rate changes | (22 | ) | | 10 |
|
| Benefits paid | (12 | ) | | (10 | ) |
| Plan amendments and business combinations | (3 | ) | | (1 | ) |
| Ending projected benefit obligation | $ | 479 |
| | $ | 445 |
|
| Ending accumulated benefit obligation | $ | 446 |
| | $ | 409 |
|
| Range of assumptions to determine benefit obligations | | | |
| Discount rate | 1.0% - 4.4% |
| | 1.1% - 4.5% |
|
| Rate of compensation increase | 2.0% - 4.0% |
| | 2.0% - 4.7% |
|
| Change in plan assets | | | |
| Beginning fair value of plan assets | $ | 248 |
| | $ | 214 |
|
| Return on plan assets | 20 |
| | 18 |
|
| Employer contributions | 48 |
| | 24 |
|
| Plan participants’ contributions | 1 |
| | 1 |
|
| Foreign currency exchange rate changes | (11 | ) | | 8 |
|
| Divestitures, settlements and business combinations | (26 | ) | | (7 | ) |
| Benefits paid | (12 | ) | | (10 | ) |
| Ending fair value of plan assets | $ | 268 |
| | $ | 248 |
|
| Funded status | $ | (211 | ) | | $ | (197 | ) |
| Amounts recognized in the consolidated balance sheets | | | |
| Noncurrent asset | $ | 17 |
| | $ | 9 |
|
| Current liability | (3 | ) | | (4 | ) |
| Noncurrent liability | (225 | ) | | (202 | ) |
| Total | $ | (211 | ) | | $ | (197 | ) |
| Estimated amortization from accumulated other comprehensive loss into net periodic benefit cost over the next fiscal year | | | |
| Actuarial loss | $ | 6 |
| | $ | 4 |
|
| Prior service cost (credit) | — |
| | — |
|
| Total | $ | 6 |
| | $ | 4 |
|
| Amounts recognized in accumulated other comprehensive loss | | | |
| Net actuarial loss | $ | 134 |
| | $ | 91 |
|
| Prior service cost (credit) | (1 | ) | | 2 |
|
| Total | $ | 133 |
| | $ | 93 |
|
| Plans with projected benefit obligations in excess of plan assets | | | |
| Projected benefit obligation | $ | 326 |
| | $ | 438 |
|
| Fair value of plan assets | $ | 98 |
| | $ | 233 |
|
| Plans with accumulated benefit obligations in excess of plan assets | | | |
| Accumulated benefit obligation | $ | 297 |
| | $ | 269 |
|
| Fair value of plan assets | $ | 98 |
| | $ | 99 |
|
NOTES TO CONSOLIDATED FINANCIAL STATEMENTS — (Continued)
| | | | | | | | |
| | | 2011 | | | 2010 | |
Plan assets — allocation | | | | | | | | |
Equity securities | | | 37 | % | | | 38 | % |
Debt securities | | | 28 | % | | | 29 | % |
Cash | | | 4 | % | | | — | |
Other | | | 31 | % | | | 33 | % |
|
| | | | | |
| | 2014 | | 2013 |
| Plan assets — allocation | | | |
| Equity securities | 39 | % | | 37 | % |
| Debt securities | 38 | % | | 36 | % |
| Insurance contracts | 15 | % | | 19 | % |
| Other investments | 5 | % | | 5 | % |
| Cash | 3 | % | | 3 | % |
The following table presents a summary of the ending fair value of the plan assets:
| | | | | | | | | | | | | | | | | | | | | | | | | | | | | | | | |
| | | October 30, 2011 | | | October 31, 2010 | |
| | | Level 1 | | | Level 2 | | | Level 3 | | | Total | | | Level 1 | | | Level 2 | | | Level 3 | | | Total | |
| | | (In millions) | | | (In millions) | |
Equity securities | | $ | 67 | | | $ | — | | | $ | — | | | $ | 67 | | | $ | 62 | | | $ | — | | | $ | — | | | $ | 62 | |
Debt securities | | | 51 | | | | — | | | | — | | | | 51 | | | | 46 | | | | — | | | | — | | | | 46 | |
Insurance contracts | | | — | | | | — | | | | 48 | | | | 48 | | | | — | | | | — | | | | 44 | | | | 44 | |
Commingled funds | | | — | | | | 10 | | | | — | | | | 10 | | | | — | | | | 10 | | | | — | | | | 10 | |
Cash | | | 7 | | | | — | | | | — | | | | 7 | | | | — | | | | — | | | | — | | | | — | |
| | | | | | | | | | | | | | | | | | | | | | | | | | | | | | | | |
Total | | $ | 125 | | | $ | 10 | | | $ | 48 | | | $ | 183 | | | $ | 108 | | | $ | 10 | | | $ | 44 | | | $ | 162 | |
| | | | | | | | | | | | | | | | | | | | | | | | | | | | | | | | |
|
| | | | | | | | | | | | | | | | | | | | | | | | | | | | | | | |
| | October 26, 2014 | | October 27, 2013 |
| | Level 1 | | Level 2 | | Level 3 | | Total | | Level 1 | | Level 2 | | Level 3 | | Total |
| | | | | | | | | | | | | | | | |
| | (In millions) |
| Equity securities | $ | 38 |
| | $ | 66 |
| | $ | — |
| | $ | 104 |
| | $ | 27 |
| | $ | 65 |
| | $ | — |
| | $ | 92 |
|
| Debt securities | 8 |
| | 94 |
| | — |
| | 102 |
| | 6 |
| | 84 |
| | — |
| | 90 |
|
| Insurance contracts | — |
| | — |
| | 41 |
| | 41 |
| | — |
| | — |
| | 47 |
| | 47 |
|
| Other investments | — |
| | 12 |
| | — |
| | 12 |
| | — |
| | 12 |
| | — |
| | 12 |
|
| Cash | 9 |
| | — |
| | — |
| | 9 |
| | 7 |
| | — |
| | — |
| | 7 |
|
| Total | $ | 55 |
| | $ | 172 |
| | $ | 41 |
| | $ | 268 |
| | $ | 40 |
| | $ | 161 |
| | $ | 47 |
| | $ | 248 |
|
The following table presents the activity in Level 3 instruments during fiscal 2011: | | | | | | | | |
| | | 2011 | | | 2010 | |
| | | Level 3 | | | Level 3 | |
| | | (In millions) | |
Balance, beginning of year | | $ | 44 | | | $ | 11 | |
Actual return on plan assets: | | | | | | | | |
Relating to assets still held at reporting date | | | 1 | | | | — | |
Purchases, sales, settlements, net | | | 2 | | | | 32 | |
Actual return on transfers in and/or out of Level 3, net | | | — | | | | — | |
Currency impact | | | 1 | | | | 1 | |
| | | | | | | | |
Balance, end of year | | $ | 48 | | | $ | 44 | |
| | | | | | | | |
|
| | | | | | | |
| | 2014 | | 2013 |
| | | | |
| | (In millions) |
| Balance, beginning of year | $ | 47 |
| | $ | 49 |
|
| Actual return on plan assets: | | | |
| Relating to assets still held at reporting date | — |
| | (1 | ) |
| Purchases, sales, settlements, net | (2 | ) | | (4 | ) |
| Currency impact | (4 | ) | | 3 |
|
| Balance, end of year | $ | 41 |
| | $ | 47 |
|
Applied’s investment strategy for its defined benefit plans is to invest plan assets in a prudent manner, maintaining well-diversified portfolios with the long-term objective of meeting the obligations of the plans as they come due. Asset allocation decisions are typically made by plan fiduciaries with input from Applied’s international pension
oversight committee. Applied’s asset allocation strategy incorporates a sufficient equity exposure in order for the plans to benefit from the expected
better long-term
outperformanceperformance of equities relative to the plans’ liabilities. Applied retains investment managers, where appropriate, to manage the assets of the plans. Performance of investment managers is monitored by plan fiduciaries with the assistance of local investment consultants. The investment managers make investment decisions within the guidelines set forth by plan fiduciaries. Risk management practices include diversification across asset classes and investment styles, and periodic rebalancing toward target asset allocation ranges. Investment managers may use derivative instruments for efficient portfolio management purposes. Plan assets do not include any of Applied’s own equity or debt securities.
NOTES TO CONSOLIDATED FINANCIAL STATEMENTS — (Continued)
A summary of the components of net periodic benefit costs and the weighted average assumptions used for net periodic benefit cost and benefit obligation calculations for fiscal 2011, 20102014, 2013 and 20092012 is presented below. | | | | | | | | | | | | |
| | | 2011 | | | 2010 | | | 2009 | |
| | | (In millions, except percentages) | |
Components of net periodic benefit cost | | | | | | | | | | | | |
Service cost | | $ | 15 | | | $ | 13 | | | $ | 13 | |
Interest cost | | | 14 | | | | 13 | | | | 12 | |
Expected return on plan assets | | | (11) | | | | (7) | | | | (7) | |
Amortization of actuarial loss | | | 2 | | | | 1 | | | | 1 | |
Settlement loss | | | 2 | | | | 1 | | | | 1 | |
Curtailment gain | | | (4) | | | | — | | | | (2) | |
| | | | | | | | | | | | |
Net periodic benefit cost | | $ | 18 | | | $ | 21 | | | $ | 18 | |
| | | | | | | | | | | | |
Weighted average assumptions | | | | | | | | | | | | |
Discount rate | | | 4.33% | | | | 4.76% | | | | 5.00% | |
Expected long-term return on assets | | | 6.39% | | | | 6.92% | | | | 7.43% | |
Rate of compensation increase | | | 3.42% | | | | 3.30% | | | | 3.67% | |
|
| | | | | | | | | | | |
| | 2014 | | 2013 | | 2012 |
| | | | | | |
| | (In millions, except percentages) |
| Components of net periodic benefit cost | | | | | |
| Service cost | $ | 17 |
| | $ | 20 |
| | $ | 16 |
|
| Interest cost | 17 |
| | 15 |
| | 14 |
|
| Expected return on plan assets | (14 | ) | | (12 | ) | | (11 | ) |
| Amortization of actuarial loss and prior service credit | 4 |
| | 6 |
| | — |
|
| Settlement and curtailment loss | 3 |
| | — |
| | 6 |
|
| Net periodic benefit cost | $ | 27 |
| | $ | 29 |
| | $ | 25 |
|
| Weighted average assumptions | | | | | |
| Discount rate | 3.68 | % | | 3.46 | % | | 4.53 | % |
| Expected long-term return on assets | 5.64 | % | | 5.38 | % | | 5.91 | % |
| Rate of compensation increase | 3.29 | % | | 3.07 | % | | 3.09 | % |
Asset return assumptions are derived based on actuarial and statistical methodologies, from analysis of long-term historical data relevant to the country in which each plan is in effect and the investments applicable to the corresponding plan. The discount rate for each plan was derived by reference to appropriate benchmark yields on high quality corporate bonds, allowing for the approximate duration of both plan obligations and the relevant benchmark yields.
Future expected benefit payments for the pension plans and the post-retirement plan over the next ten fiscal years are: $11 million in fiscal 2012, $11 million in fiscal 2013, $16 million in fiscal 2014, $17 million in fiscal 2015, $17 million in fiscal 2016, and $98 million collectively for fiscal years 2017 through 2021. are as follows:
|
| | | |
| | Benefit Payments |
| | (In millions) |
| 2015 | $ | 12 |
|
| 2016 | 13 |
|
| 2017 | 13 |
|
| 2018 | 14 |
|
| 2019 | 14 |
|
| 2020-2024 | 81 |
|
| | $ | 147 |
|
Company contributions to these plans for fiscal 20122015 are expected to be approximately $24 million.$9 million. Executive Deferred Compensation Plans
Applied sponsors two unfunded deferred compensation plans, the Executive Deferred Compensation Plan (Predecessor EDCP) and the 2005 Executive Deferred Compensation Plan (2005 EDCP), under which certain employees may elect to defer a portion of their following year’s eligible earnings. The Predecessor EDCP was frozen as of December 31, 2004 such that no new deferrals could be made under the plan after that date and the plan would qualify for “grandfather” relief under Section 409A of the Internal Revenue Code. The Predecessor EDCP participant accounts continue to be maintained under the plan and credited with deemed interest. The 2005 EDCP was implemented by Applied effective as of January 1, 2005 and is intended to comply with the requirements of Section 409A of the Internal Revenue Code. The ability to elect new deferrals of compensation under the 2005 EDCP was suspended effective as of October 1, 2014. In addition, Applied also sponsors a non-qualified deferred compensation plan as a result of the acquisition of Varian. Amounts payable, including accrued deemed interest, totaled $59$40 million at October 30, 2011 and $6626, 2014, of which $35 million at October 31, 2010, which werewas included in accounts payable and accrued expenses and $5 million was included in other long-term liabilities in the Consolidated Balance Sheets. Amounts payable, including accrued deemed interest, totaled
$49 million at October 27, 2013, which was included in other liabilities in the Consolidated Balance Sheets. Under the Predecessor EDCP and 2005 EDCP, in the event of change of control (as defined under these plans), the distribution of all deferred balances would be required.
NOTES TO CONSOLIDATED FINANCIAL STATEMENTS — (Continued)
The components of income (loss) from operations before income taxes for fiscal 2011, 20102014, 2013 and 20092012 were as follows: | | | | | | | | | | | | |
| | | 2011 | | | 2010 | | | 2009 | |
| | | (In millions) | |
U.S. | | $ | 1,257 | | | $ | 787 | | | $ | (555 | ) |
Foreign | | | 1,121 | | | | 600 | | | | 69 | |
| | | | | | | | | | | | |
| | $ | 2,378 | | | $ | 1,387 | | | $ | (486 | ) |
| | | | | | | | | | | | |
|
| | | | | | | | | | | |
| | 2014 | | 2013 | | 2012 |
| | | | | | |
| | (In millions) |
| U.S. | $ | 612 |
| | $ | 194 |
| | $ | 381 |
|
| Foreign | 836 |
| | 156 |
| | (65 | ) |
| | $ | 1,448 |
| | $ | 350 |
| | $ | 316 |
|
The components of the provision (benefit) for income taxes for fiscal 2011, 20102014, 2013 and 20092012 were as follows: | | | | | | | | | | | | |
| | | 2011 | | | 2010 | | | 2009 | |
| | | (In millions) | |
Current: | | | | | | | | | | | | |
U.S. | | $ | 290 | | | $ | 463 | | | $ | (197 | ) |
Foreign | | | 206 | | | | 134 | | | | 23 | |
State | | | 5 | | | | 34 | | | | (37 | ) |
| | | | | | | | | | | | |
| | | 501 | | | | 631 | | | | (211 | ) |
| | | | | | | | | | | | |
Deferred: | | | | | | | | | | | | |
U.S. | | | (95 | ) | | | (160 | ) | | | 25 | |
Foreign | | | (23 | ) | | | 4 | | | | 10 | |
State | | | 69 | | | | (26 | ) | | | (5 | ) |
| | | | | | | | | | | | |
| | | (49 | ) | | | (182 | ) | | | 30 | |
| | | | | | | | | | | | �� |
| | $ | 452 | | | $ | 449 | | | $ | (181 | ) |
| | | | | | | | | | | | |
|
| | | | | | | | | | | |
| | 2014 | | 2013 | | 2012 |
| | | | | | |
| | (In millions) |
| Current: | | | | | |
| U.S. | $ | 270 |
| | $ | 3 |
| | $ | 74 |
|
| Foreign | 97 |
| | 72 |
| | 75 |
|
| State | 27 |
| | 2 |
| | 8 |
|
| | 394 |
| | 77 |
| | 157 |
|
| Deferred: | | | | | |
| U.S. | (9 | ) | | 34 |
| | 52 |
|
| Foreign | (3 | ) | | (19 | ) | | (4 | ) |
| State | (6 | ) | | 2 |
| | 2 |
|
| | (18 | ) | | 17 |
| | 50 |
|
| | $ | 376 |
| | $ | 94 |
| | $ | 207 |
|
A reconciliation between the statutory U.S. federal income tax rate of 35 percent and Applied’s actual effective income tax rate for fiscal 2011, 20102014, 2013 and 20092012 is presented below: | | | | | | | | | | | | |
| | | 2011 | | | 2010 | | | 2009 | |
Tax provision (benefit) at U.S. statutory rate | | | 35.0 | % | | | 35.0 | % | | | (35.0 | )% |
Favorable resolutions from audits of prior years’ income tax filings | | | (6.9 | ) | | | — | | | | (2.9 | ) |
Effect of foreign operations taxed at various rates | | | (10.1 | ) | | | (3.0 | ) | | | — | |
State income taxes, net of federal benefit | | | 1.6 | | | | 0.9 | | | | (3.9 | ) |
Research and other tax credits | | | (1.2 | ) | | | (0.3 | ) | | | (2.0 | ) |
Export sales/production benefit | | | (0.8 | ) | | | (1.2 | ) | | | — | |
Equity method investment loss/impairment | | | — | | | | — | | | | 5.7 | |
Share-based compensation | | | 0.4 | | | | 0.6 | | | | 2.4 | |
Other | | | 1.0 | | | | 0.4 | | | | (1.5 | ) |
| | | | | | | | | | | | |
| | | 19.0 | % | | | 32.4 | % | | | (37.2 | )% |
| | | | | | | | | | | | |
|
| | | | | | | | |
| | 2014 | | 2013 | | 2012 |
| Tax provision at U.S. statutory rate | 35.0 | % | | 35.0 | % | | 35.0 | % |
| Resolutions from prior years’ income tax filings | 2.0 |
| | (4.7 | ) | | (6.0 | ) |
| Effect of foreign operations taxed at various rates | (10.9 | ) | | (21.1 | ) | | (8.5 | ) |
| State income taxes, net of federal benefit | 1.0 |
| | 0.8 |
| | 2.0 |
|
| Research and other tax credits | (0.3 | ) | | (5.4 | ) | | (1.0 | ) |
| Production benefit | (1.3 | ) | | (1.0 | ) | | (8.0 | ) |
| Acquisition costs | 0.8 |
| | — |
| | — |
|
| Goodwill impairment | — |
| | 22.5 |
| | 47.0 |
|
| Share-based compensation | 0.4 |
| | 2.2 |
| | 4.0 |
|
| Other | (0.7 | ) | | (1.4 | ) | | 1.0 |
|
| | 26.0 | % | | 26.9 | % | | 65.5 | % |
The effective tax rate for fiscal 2014 was lower than the rate for fiscal 2013 due primarily to nondeductible goodwill impairment charges in fiscal 2013, offset by resolutions and changes related to prior years and expiration of the U.S. federal research and development tax credit. The effective tax rate for fiscal 2013 was significantly lower than the rate for fiscal 2012 due primarily to the geographic composition of Applied's pre-tax income, lower nondeductible goodwill impairment charges, and reinstatement of the U.S. federal research and development tax credit retroactive to its expiration in December 2012. These reductions were partially offset by a lower benefit in fiscal 2013 from the U.S. federal domestic production deduction.
NOTES TO CONSOLIDATED FINANCIAL STATEMENTS — (Continued)
In the reconciliation between the statutory U.S. federal income tax rate and the actual effective income tax rate for fiscal 2014, the effect of foreign operations taxed at various rates represents the difference between an income tax provision at the U.S. federal statutory income tax rate and the recorded income tax provision, with the difference expressed as a percentage of worldwide income before income taxes. This effect is substantially related to the tax effect of foreign income before income taxes generated in jurisdictions with lower statutory tax rates. The foreign operations with the most significant effective tax rate impact are Singapore and Israel. The fiscal 2014 statutory tax rates for Singapore and Israel are 17% and 26.5%, respectively. Applied has been granted tax holidays for both jurisdictions that expire in fiscal 2025 and fiscal 2017, respectively, excluding potential renewals and subject to certain conditions with which Applied expects to comply. The tax benefit arising from these tax holidays was $85 million for fiscal 2014 or $0.07 per diluted share.
Deferred income taxes reflect the net tax effects of temporary differences between the carrying amounts of assets and liabilities for financial reporting purposes and the amounts used for income tax purposes. The components of deferred income tax assets and liabilities
arewere as follows:
| | | | | | | | |
| | | October 30,
2011 | | | October 31,
2010 | |
| | | (In millions) | |
Deferred tax assets: | | | | | | | | |
Inventory reserves and basis difference | | $ | 214 | | | $ | 228 | |
Installation and warranty reserves | | | 31 | | | | 39 | |
Foreign tax credits on undistributed foreign earnings | | | 112 | | | | 18 | |
Accrued liabilities | | | 250 | | | | 217 | |
Restructuring reserves | | | 4 | | | | 40 | |
Deferred revenue | | | 53 | | | | 47 | |
Capital loss carryforward | | | 4 | | | | 18 | |
Tax credits and net operating losses | | | 39 | | | | 65 | |
Deferred compensation | | | 21 | | | | 26 | |
Share-based compensation | | | 49 | | | | 46 | |
Intangibles | | | 10 | | | | 22 | |
| | | | | | | | |
Gross deferred tax assets | | | 787 | | | | 766 | |
Valuation allowance | | | (13 | ) | | | (13 | ) |
| | | | | | | | |
Total deferred tax assets | | | 774 | | | | 753 | |
| | | | | | | | |
Deferred tax liabilities: | | | | | | | | |
Depreciation | | | (61 | ) | | | (43 | ) |
Purchased technology | | | (86 | ) | | | (113 | ) |
Other | | | (44 | ) | | | (49 | ) |
| | | | | | | | |
Total gross deferred tax liabilities | | | (191 | ) | | | (205 | ) |
| | | | | | | | |
Net deferred tax assets | | $ | 583 | | | $ | 548 | |
| | | | | | | | |
|
| | | | | | | |
| | October 26,
2014 | | October 27,
2013 |
| | | | |
| | (In millions) |
| Deferred tax assets: | | | |
| Allowance for doubtful accounts | $ | 26 |
| | $ | 27 |
|
| Inventory reserves and basis difference | 128 |
| | 134 |
|
| Installation and warranty reserves | 18 |
| | 14 |
|
| Accrued liabilities | 123 |
| | 138 |
|
| Deferred revenue | 32 |
| | 27 |
|
| Tax credits and net operating losses | 160 |
| | 182 |
|
| Deferred compensation | 44 |
| | 33 |
|
| Share-based compensation | 57 |
| | 60 |
|
| Fixed assets | 16 |
| | (34 | ) |
| Other | 27 |
| | 13 |
|
| Gross deferred tax assets | 631 |
| | 594 |
|
| Valuation allowance | (173 | ) | | (116 | ) |
| Total deferred tax assets | 458 |
| | 478 |
|
| Deferred tax liabilities: | | | |
| Intangible assets | (92 | ) | | (82 | ) |
| Undistributed foreign earnings | (87 | ) | | (75 | ) |
| Foreign exchange | (12 | ) | | (18 | ) |
| Total gross deferred tax liabilities | (191 | ) | | (175 | ) |
| Net deferred tax assets | $ | 267 |
| | $ | 303 |
|
The following table presents the breakdown between current and non-current net deferred tax assets and liabilities:
| | | | | | | | |
| | | October 30,
2011 | | | October 31,
2010 | |
| | | (In millions) | |
Current deferred tax asset | | $ | 580 | | | $ | 513 | |
Non-current deferred tax asset | | | 78 | | | | 112 | |
Current deferred tax liability | | | (1 | ) | | | (2 | ) |
Non-current deferred tax liability | | | (74 | ) | | | (75 | ) |
| | | | | | | | |
| | $ | 583 | | | $ | 548 | |
| | | | | | | | |
|
| | | | | | | |
| | October 26,
2014 | | October 27,
2013 |
| | | | |
| | (In millions) |
| Current deferred tax asset | $ | 232 |
| | $ | 323 |
|
| Non-current deferred tax asset | 67 |
| | 53 |
|
| Current deferred tax liability | — |
| | (2 | ) |
| Non-current deferred tax liability | (32 | ) | | (71 | ) |
| | $ | 267 |
| | $ | 303 |
|
APPLIED MATERIALS, INC.
NOTES TO CONSOLIDATED FINANCIAL STATEMENTS — (Continued)
Current deferred tax liabilities are included in accounts payable and accrued expenses on the Consolidated Balance Sheets and non-current deferred tax liabilities are included in
employee benefits and other liabilities on the Consolidated Balance Sheets.
APPLIED MATERIALS, INC.
NOTES TO CONSOLIDATED FINANCIAL STATEMENTS — (Continued)
A valuation allowance is recorded to reflect the estimated amount of deferred tax assets that may not be realized.
InDuring fiscal
2011,2014, the valuation allowance against
capital losscurrent state research and development credit carryforwards
was released due to recognition of sufficient capital gains. Aincreased by $39 million and the valuation allowance
was established against
California Research and Development Credit carryforward where it is believed that it is not more likely than not that the carryforward will be realized.The Company has been grantedforeign deferred tax holidays for certain of its subsidiaries in Singapore and Israel. The tax benefit arising from these tax holidays was $128 million for 2011 ($0.10 per diluted share), The tax holidays expire at various times through 2025, excluding potential renewals, and are subject to certain conditions with which the Company expects to comply.
assets increased by $18 million.
For fiscal 2011,2014, U.S. income taxes have not been provided for approximately $1.0$2.7 billion of cumulative undistributed earnings of several non-U.S.foreign subsidiaries. Applied intends to reinvest these earnings indefinitely in operations outside of the U.S. If these earnings were distributed to the United States in the form of dividends or otherwise, or if the shares of the relevant foreign subsidiaries were sold or otherwise transferred, the CompanyApplied would be subject to additional U.S. income taxes (subject to an adjustment for foreign tax credits) and foreign withholding taxes. Determination of the amount of unrecognized deferred income tax liability related to these earnings is not practicable. At October
30, 2011,26, 2014, Applied has
a Californiastate research and development tax credit
carryforwardcarryforwards of
$13$146 million, including $112 million of credits that are carried over until exhausted and $34 million which
are carried over for 15 years and begin to expire in fiscal 2021. Applied has
an unlimited life. Applied also hasa net operating loss
carryforwardscarryover in
foreignstate jurisdictions of
$64 million. The carryforwards have lives ranging from five years$45 million which begin to
indefinite.expire in fiscal 2018. Management believes it is more likely than not that all loss and tax credit
carryforwardscarryovers at October
30, 2011,26, 2014, net of valuation allowance, will be utilized in future periods.
Applied’s income taxes payable have been reduced by the tax benefits associated with employee stock option transactions. These benefits, credited directly to stockholders’ equity amounted to $4 million for fiscal 2011, $2 million for fiscal 2010, and $1 million for fiscal 2009 with a corresponding reduction to taxes payable, of $4amounted to $27 million in fiscal 2011, $2 million for fiscal 2010, and $12014, $11 million for fiscal 2009.2013, and
$2 million for fiscal 2012. Applied maintains liabilities for uncertain tax positions. These liabilities involve considerable judgment and estimation and are continuously monitored by management based on the best information available. A reconciliation of the beginning and ending balances of the total amounts of gross unrecognized tax benefits is as follows:
| | | | | | | | |
| | | 2011 | | | 2010 | |
| | | (In millions) | |
Beginning balance of gross unrecognized tax benefits | | $ | 328 | | | $ | 325 | |
Settlements with tax authorities | | | (314 | ) | | | — | |
Increases in tax positions for current years | | | 45 | | | | 3 | |
Decreases in tax positions for prior years | | | — | | | | — | |
| | | | | | | | |
Ending balance of gross unrecognized tax benefits | | $ | 59 | | | $ | 328 | |
| | | | | | | | |
As of October 30, 2011, Applied had unrecognized tax benefits, net of federal deduction for state tax, of $59 million, all of which, if recognized, would result in a reduction of Applied’s effective tax rate.
As of October 30, 2011,
|
| | | | | | | |
| | 2014 | | 2013 |
| | | | |
| | (In millions) |
| Beginning balance of gross unrecognized tax benefits | $ | 194 |
| | $ | 174 |
|
| Settlements with tax authorities | (143 | ) | | (15 | ) |
| Lapses of statutes of limitation | (2 | ) | | (15 | ) |
| Increases in tax positions for current year | 52 |
| | 48 |
|
| Increases in tax positions for prior years | 42 |
| | 2 |
|
| Decreases in tax positions for prior years | (9 | ) | | — |
|
| Ending balance of gross unrecognized tax benefits | $ | 134 |
| | $ | 194 |
|
In the gross liability for unrecognized tax benefits was $59 million, exclusive of interest and penalties. Increases or decreases to interest and penalties on uncertain tax positions are included in provision for income taxes in the Consolidated Statement of Operations. InterestOperations, tax expense of $18 million was realized in fiscal 2014 and a tax benefit of $1 million was realized in fiscal 2013 related to interest and penalties related to uncertainon unrecognized tax positions were $1benefits. The liability for interest and penalties was $25 million as of October 30, 201126, 2014 and $6$7 million as of October 31, 2010. All $1 million in interest27, 2013 and penalties werewas classified as a long-termnon-current liability in the Consolidated Balance Sheets.APPLIED MATERIALS, INC.
NOTES TO CONSOLIDATED FINANCIAL STATEMENTS — (Continued)
Included in the ending balance of unrecognized tax benefits for fiscal 2014 and fiscal 2013 are $124 million and $183 million, respectively, of tax benefits that, if recognized, would affect the effective tax rate. Also included in the ending balance of unrecognized tax benefits for fiscal 2014 and fiscal 2013 are $9 million and $10 million respectively, of tax benefits that, if recognized, would result in adjustments to other tax accounts, primarily deferred taxes.
In fiscal 2011,2014, Applied received a refund of $276$18 million, including interest, as a result of settling an audit of fiscal 2008 through fiscal 2012 in Korea, and received a refund of $17 million, including interest, as a result of settling an Internal Revenue Service (IRS) audit of Varian for fiscal years 20062010. These settlements resulted in the recognition of a tax benefit of $3 million in the Consolidated Statement of Operations. In fiscal 2013, Applied received a refund of $31 million, including interest, as a result of settling an IRS audit of fiscal 2008 and 2007.fiscal 2009. This resulted in the recognition of a tax benefit of $176$12 million in the Consolidated Statement of OperationsOperations. In fiscal 2013, Applied paid $14 million to the IRS as part of an ongoing audit of Varian for fiscal 2011, which2010 through fiscal 2012. No tax expense or benefit was netrecognized.
APPLIED MATERIALS, INC.
NOTES TO CONSOLIDATED FINANCIAL STATEMENTS — (Continued)
A number of Applied’s tax returns remain subject to examination by taxing authorities. These include U.S. federal returns for fiscal 20082010 and later years, California returns for fiscal 20062010 and later years, tax returns for certain other states for fiscal 20062010 and later years, and tax returns in certain jurisdictions outside of the United States for fiscal 20042007 and later years.years
. The timing of the resolution of income tax examinations, as well as the amounts and timing of various tax payments that may be part of the settlement process, is highly uncertain. This could cause large fluctuations in the balance sheet classification of current assets and non-current assets and liabilities. Applied
does not expect a material change in unrecognized tax benefits incontinues to have ongoing negotiations with various taxing authorities throughout the
next 12 months.year.
| |
| Note 15 | Warranty, Guarantees, Commitments and Contingencies |
Leases
LeasesApplied leases some of its facilities and equipment under non-cancelable operating leases and has options to renew most leases, with rentals to be negotiated. Total rent expense was $44$37 million for fiscal 2011, $442014, $36 million for fiscal 2010,2013, and $55$38 million for fiscal 2009.
2012.
As of October 30, 2011,26, 2014, future minimum lease payments isare expected to be as follows: | | | | |
| | | Lease Payments | |
| | | (In millions) | |
2012 | | $ | 33 | |
2013 | | | 22 | |
2014 | | | 14 | |
2015 | | | 10 | |
2016 | | | 8 | |
Thereafter | | | 21 | |
| | | | |
| | $ | 108 | |
| | | | |
|
| | | |
| | Lease Payments |
| | (In millions) |
| 2015 | $ | 28 |
|
| 2016 | 18 |
|
| 2017 | 10 |
|
| 2018 | 6 |
|
| 2019 | 3 |
|
| Thereafter | 5 |
|
| | $ | 70 |
|
Warranty
WarrantyChanges in the warranty reserves during fiscal 20112014 and 20102013 were as follows:
| | | | | | | | |
| | | 2011 | | | 2010 | |
| | | (In millions) | |
Beginning balance | | $ | 155 | | | $ | 117 | |
Provisions for warranty | | | 170 | | | | 152 | |
Consumption of reserves | | | (157 | ) | | | (114 | ) |
| | | | | | | | |
Ending balance | | $ | 168 | | | $ | 155 | |
| | | | | | | | |
APPLIED MATERIALS, INC.
NOTES TO CONSOLIDATED FINANCIAL STATEMENTS — (Continued)
|
| | | | | | | |
| | 2014 | | 2013 |
| | | | |
| | (In millions) |
| Beginning balance | $ | 102 |
| | $ | 119 |
|
| Provisions for warranty | 115 |
| | 103 |
|
| Consumption of reserves | (104 | ) | | (120 | ) |
| Ending balance | $ | 113 |
| | $ | 102 |
|
Applied products are generally sold with a 12-month warranty period following installation. The provision for the estimated cost of warranty is recorded when revenue is recognized. Parts and labor are covered under the terms of the warranty agreement. The warranty provision is based on historical experience by product, configuration and geographic region. Quarterly warranty consumption is generally associated with sales that occurred during the preceding four quarters, and quarterly warranty provisions are generally related to the current quarter’s sales.
APPLIED MATERIALS, INC.
NOTES TO CONSOLIDATED FINANCIAL STATEMENTS — (Continued)
Guarantees
GuaranteesIn the ordinary course of business, Applied provides standby letters of credit or other guarantee instruments to third parties as required for certain transactions initiated by either Applied or its subsidiaries. As of October 30, 2011,26, 2014, the maximum potential amount of future payments that Applied could be required to make under these guarantee agreements was approximately $58 million.$46 million. Applied has not recorded any liability in connection with these guarantee agreements beyond that required to appropriately account for the underlying transaction being guaranteed. Applied does not believe, based on historical experience and information currently available, that it is probable that any amounts will be required to be paid under these guarantee agreements.
Applied also has agreements with various banks to facilitate subsidiary banking operations worldwide, including overdraft arrangements, issuance of bank guarantees, and letters of credit. As of October 30, 2011,26, 2014, Applied Materials Inc. has provided parent guarantees to banks for approximately $191$102 million to cover these services.arrangements.
Legal Matters
Varian Shareholder Litigation
In connection with the proposed acquisition of Varian announced in May 2011, the Louisiana Municipal Police Employees Retirement Systems filed a lawsuit (the “LMPERS lawsuit”) on July 23, 2011, for itself and on behalf of a putative class of Varian stockholders, in the U.S. District Court for the District of Massachusetts against Varian and its directors, as well as Applied and Applied’s acquisition subsidiary. The LMPERS complaint alleged that Varian’s directors breached their fiduciary duties in connection with the transaction and that Applied aided and abetted such alleged breaches. The lawsuit sought, among other things, an order rescinding the Merger Agreement, an injunction preventing consummation of the transaction, a constructive trust in favor of the plaintiff class, and attorneys’ fees. On July 25, 2011, plaintiff in the LMPERS lawsuit filed motions for expedited discovery and for a preliminary injunction to prevent a shareholder vote on the merger. The Court denied plaintiff’s motion for expedited discovery on August 1, 2011 and denied plaintiff’s motion for a preliminary injunction on August 8, 2011. On August 30, 2011, the LMPERS plaintiff voluntarily dismissed its lawsuit without prejudice.
Jusung
Applied has been engaged in several lawsuits and patent and administrative proceedings with Jusung Engineering Co., Ltd. and/or Jusung Pacific Co., Ltd. (Jusung) in Taiwan and South Korea since 2003, and more recently in China, involving technology used in manufacturing LCDs. Applied believes that it has meritorious claims and defenses against Jusung that it intends to pursue vigorously.
In 2004, Applied filed a complaint for patent infringement against Jusung in the Hsinchu District Court in Taiwan seeking damages and a permanent injunction for infringement of a patent related to chemical vapor deposition (CVD) equipment. Jusung filed a counterclaim against Applied. On December 31, 2010, the Hsinchu District Court announced that it had ruled against Applied and dismissed the lawsuit and Jusung’s counterclaim. Applied appealed the dismissal of its lawsuit and Jusung appealed the dismissal of its counterclaim. Jusung
APPLIED MATERIALS, INC.
NOTES TO CONSOLIDATED FINANCIAL STATEMENTS — (Continued)
unsuccessfully sought invalidation of Applied’s CVD patent in the Taiwanese Intellectual Property Office (TIPO). In September 2010, the Taipei Supreme Administrative Court dismissed Jusung’s appeal of the TIPO’s decision. In 2009, Jusung filed a second action with the TIPO seeking invalidation of Applied’s CVD patent, which action remains pending.
In 2006, Applied filed an action in the TIPO challenging the validity of a Jusung patent related to separability of the transfer chamber on a CVD tool. Jusung sued Applied and AKT America in Hsinchu District Court in Taiwan alleging infringement of the same patent. In March 2009, the Hsinchu District Court dismissed Jusung’s lawsuit, and in October, 2010, the Taiwan Intellectual Property Court dismissed Jusung’s appeal. Separately, the TIPO granted Applied’s request for invalidation and also revoked Jusung’s patent. In January 2010, the Taiwan Intellectual Property Court granted Jusung’s appeal of the TIPO decision revoking its patent and remanded the matter to the TIPO for reconsideration of validity. TIPO subsequently granted another party’s request for invalidation of Jusung’s patent. Jusung appealed to the Taiwan Intellectual Property Court and Applied intervened in the appeal. On May 12, 2011, the Taiwan Intellectual Property Court dismissed Jusung’s appeal. Jusung has appealed this decision to the Taipei Supreme Administrative Court. In November 2009, Applied filed an action in China with the Patent Reexamination Board of the State Intellectual Property Office seeking to invalidate this patent. On June 18, 2010, the Patent Reexamination Board issued a decision invalidating Jusung’s patent in China. Jusung appealed to the Beijing No. 1 Intermediate People’s Court and on June 13, 2011, this Court dismissed Jusung’s appeal. Jusung appealed this decision to the Beijing High People’s Court in July 2011, and Jusung’s appeal remains pending.
In 2006, Jusung filed a complaint of private prosecution in the Taipei District Court of Taiwan alleging that Applied’s outside counsel received from the Court and used a copy of an expert report that Jusung had filed in the ongoing patent infringement lawsuits that Jusung had intended to remain confidential. The complaint names as defendants Applied’s outside counsel in Taiwan, as well as Michael R. Splinter, Applied’s Chairman, President and Chief Executive Officer, as the statutory representative of Applied. The Taipei District Court dismissed the private prosecution complaint, and the matter was transferred to the Taipei District Attorney’s Office. The Taipei District Attorney’s Office issued five separate rulings not to prosecute, each of which Jusung appealed. In the first five instances, the Taiwan High Court District Attorney returned the matter to the Taipei District Attorney’s Office for further consideration. In response to the sixth ruling not to prosecute, the Taiwan High Court District Attorney dismissed Jusung’s appeal. Jusung subsequently petitioned to the Taipei District Court for a trial and Jusung’s petition remains pending.
Korea Criminal Proceedings
In February 2010, the Seoul Prosecutor’sEastern District Court began hearings on indictments brought by the Seoul Prosecutor's Office for the Eastern District of Korea (the Prosecutor’sProsecutor's Office) indictedalleging that employees of several companies for the alleged improper receiptimproperly received and use ofused confidential information belonging to Samsung Electronics Co., Ltd. (Samsung), a major Applied customer based in Korea. The Prosecutor’s Office did not name Applied or any of its subsidiaries as a party to the criminal action. The individuals charged included the former head of Applied Materials Korea (AMK), who at the time of the indictment was a vice president of Applied Materials, Inc., and certain other AMK employees. Neither Applied nor any of its subsidiaries was named as a party to the proceedings. Hearings on these matters are ongoingconcluded in November 2012 and the Seoul Eastern DistrictCourt issued its decision on February 7, 2013. As part of the ruling, nine AMK employees (including the former head of AMK) were acquitted of all charges, while one AMK employee was found guilty on some of the charges and received a suspended jail sentence. The Prosecutor's Office and various individuals appealed the matter to the High Court. Applied and Samsung entered into a settlement agreement effective as of November 1, 2010, which resolves potential civil claims relatedOn June 20, 2014, the High Court rendered its decision, finding all defendants not guilty, including all ten AMK employees. The prosecutor has appealed the High Court decision to this matter, which is separate from and does not affect the criminal proceedings.Korean Supreme Court.
Other Matters
From time to time, Applied receives notification from third parties, including customers and suppliers, seeking indemnification, litigation support, payment of money or other actions by Applied in connection with claims made against them. In addition, from time to time, Applied receives notification from third parties claiming that Applied may be or is infringing or misusing their intellectual property or other rights. Applied also is subject to various other legal proceedings and claims, both asserted and unasserted, that arise in the ordinary course of business.
APPLIED MATERIALS, INC.
NOTES TO CONSOLIDATED FINANCIAL STATEMENTS — (Continued)
Although the outcome of the above-described matters,
or these claims and proceedings cannot be predicted with certainty, Applied does not believe that any
of these proceedings or other claims will have a material
adverse effect on its consolidated financial condition or results of operations.
APPLIED MATERIALS, INC.
NOTES TO CONSOLIDATED FINANCIAL STATEMENTS — (Continued)
| |
| Note 16 | Industry Segment Operations |
Applied’s four reportable segments are: Silicon Systems Group, Applied Global Services, Display, and Energy and Environmental Solutions. As defined under the accounting literature, Applied’s chief operating decision-maker has been identified as the President and Chief Executive Officer, who reviews operating results to make decisions about allocating resources and assessing performance for the entire company.Company. Segment information is presented based upon Applied’s management organization structure as of October 30, 201126, 2014 and the distinctive nature of each segment. Future changes to this internal financial structure may result in changes to Applied’s reportable segments. Each reportable segment is separately managed and has separate financial results that are reviewed by Applied’s chief operating decision-maker. Each reportable segment contains closely related products that are unique to the particular segment. Segment operating income is determined based upon internal performance measures used by Applied’s chief operating decision-maker.
Applied derives the segment results directly from its internal management reporting system. The accounting policies Applied uses to derive reportable segment results are substantially the same as those used for external reporting purposes. Management measures the performance of each reportable segment based upon several metrics including orders, net sales and operating income. Management uses these results to evaluate the performance of, and to assign resources to, each of the reportable segments. Applied does not allocate to its reportable segments certain operating expenses that it manages separately at the corporate level, which include costs related to share-based compensation; certain management, finance, legal, human resources, and research, development and engineering functions provided at the corporate level; and unabsorbed information technology and occupancy. In addition, Applied does not allocate to its reportable segments restructuring and asset impairment charges and any associated adjustments related to restructuring actions, unless these
charges or adjustmentsactions pertain to a specific reportable segment. Segment operating income excludes interest income/expense and other financial charges and income taxes. Management does not consider the unallocated costs in measuring the performance of the reportable segments.
In fiscal 2010, as part of the restructuring of the Energy and Environmental Solutions segment, Applied discontinued marketing of its fully-integrated SunFab production lines but continued to offer individual tools for thin film solar manufacturing. Applied is supporting existing SunFab customers with services, upgrades and capacity increases through its Applied Global Services segment as these products are considered to have reached a particular stage in the product lifecycle. Effective in the first quarter of fiscal 2011, Applied accounts for thin film products under its Applied Global Services segment.
The Silicon Systems Group segment includes semiconductor capital equipment for etch, rapid thermal processing, deposition, chemical mechanical planarization, metrology and inspection,
wafer packaging, and
wafer packaging.ion implantation.
The Applied Global Services segment includes technically differentiated products and services to improve operating efficiency, reduce operating costs and lessen the environmental impact of semiconductor, display and solar
customers’customers' factories. Applied Global Services’ products consist of spares, services, certain earlier generation products, remanufactured equipment, and products that have reached a particular stage in the product lifecycle. Customer demand for these products and services is fulfilled through a global distribution system with trained service engineers located in close proximity to customer sites.
The Display segment includes products for manufacturing LCDs,
organic light-emitting diodes (OLEDs), and other display technologies for TVs, personal computers,
video-enabled devicestablets, smart phones, and
touch panel applications.APPLIED MATERIALS, INC.
NOTES TO CONSOLIDATED FINANCIAL STATEMENTS — (Continued)
other consumer-oriented devices.
The Energy and Environmental Solutions segment includes products for fabricating crystalline-silicon (c-Si) solar photovoltaic cells and modules, high throughput roll-to-roll coating systemsdeposition equipment for flexible electronics and web products, and systems usedother applications.
In November 2011, Applied completed its acquisition of Varian. Beginning in the
manufacturefirst quarter of
energy-efficient glass.fiscal 2012, the acquired business is primarily included in the results for the Silicon Systems Group and Applied Global Services segments, with certain corporate functions included in corporate and unallocated costs.
With the acquisition of Varian, Applied acquired ion implantation technology for semiconductor as well as for c-Si solar cell manufacturing, which was recorded under the Silicon Systems Group segment in fiscal 2012. In fiscal 2013, Applied began marketing the solar implant products commercially through its Energy and Environmental Solutions segment. Accordingly, effective in the first quarter of fiscal 2013, Applied accounts for its solar implant products under the Energy and Environmental Solutions segment. The effect of the solar implant products was not material to the operations of either the Silicon Systems Group or Energy and Environmental Solutions segments.
APPLIED MATERIALS, INC.
NOTES TO CONSOLIDATED FINANCIAL STATEMENTS — (Continued)
Information for each reportable segment as of October 30, 2011, 26, 2014, October 31, 201027, 2013 and October 25, 200928, 2012 and for the fiscal years then ended, is as follows: | | | | | | | | | | | | | | | | | | | | |
| | | Net Sales | | | Operating
Income (Loss) | | | Depreciation/
Amortization | | | Capital
Expenditures | | | Segment
Assets | |
| | | (In millions) | |
2011: | | | | | | | | | | | | | | | | | | | | |
Silicon Systems Group | | $ | 5,415 | | | $ | 1,764 | | | $ | 52 | | | $ | 59 | | | $ | 2,036 | |
Applied Global Services | | | 2,413 | | | | 482 | | | | 13 | | | | 7 | | | | 1,337 | |
Display | | | 699 | | | | 147 | | | | 7 | | | | 31 | | | | 459 | |
Energy and Environmental Solutions | | | 1,990 | | | | 453 | | | | 34 | | | | 16 | | | | 1,438 | |
| | | | | | | | | | | | | | | | | | | | |
Total Segment | | $ | 10,517 | | | $ | 2,846 | | | $ | 106 | | | $ | 113 | | | $ | 5,270 | |
| | | | | | | | | | | | | | | | | | | | |
2010: | | | | | | | | | | | | | | | | | | | | |
Silicon Systems Group | | $ | 5,304 | | | $ | 1,892 | | | $ | 66 | | | $ | 39 | | | $ | 2,317 | |
Applied Global Services | | | 1,865 | | | | 337 | | | | 25 | | | | 5 | | | | 1,285 | |
Display | | | 899 | | | | 267 | | | | 8 | | | | 5 | | | | 419 | |
Energy and Environmental Solutions | | | 1,481 | | | | (466 | ) | | | 57 | | | | 41 | | | | 1,402 | |
| | | | | | | | | | | | | | | | | | | | |
Total Segment | | $ | 9,549 | | | $ | 2,030 | | | $ | 156 | | | $ | 90 | | | $ | 5,423 | |
| | | | | | | | | | | | | | | | | | | | |
2009: | | | | | | | | | | | | | | | | | | | | |
Silicon Systems Group | | $ | 1,960 | | | $ | 201 | | | $ | 53 | | | $ | 23 | | | $ | 1,195 | |
Applied Global Services | | | 1,397 | | | | 115 | | | | 34 | | | | 15 | | | | 1,043 | |
Display | | | 502 | | | | 51 | | | | 12 | | | | 15 | | | | 445 | |
Energy and Environmental Solutions | | | 1,155 | | | | (234 | ) | | | 80 | | | | 51 | | | | 1,853 | |
| | | | | | | | | | | | | | | | | | | | |
Total Segment | | $ | 5,014 | | | $ | 133 | | | $ | 179 | | | $ | 104 | | | $ | 4,536 | |
| | | | | | | | | | | | | | | | | | | | |
In fiscal 2011, Applied entered into an agreement to divest certain assets held in the Applied Global Services segment and determined certain identified intangible assets and purchased technology to be impaired.
|
| | | | | | | | | | | | | | | | | | | |
| | Net Sales | | Operating Income (Loss) | | Depreciation/ Amortization | | Capital Expenditures | | Segment Assets |
| | | | | | | | | | |
| | (In millions) |
| 2014: | | | | | | | | | |
| Silicon Systems Group | $ | 5,978 |
| | $ | 1,391 |
| | $ | 268 |
| | $ | 134 |
| | $ | 5,508 |
|
| Applied Global Services | 2,200 |
| | 573 |
| | 11 |
| | 7 |
| | 2,042 |
|
| Display | 615 |
| | 129 |
| | 5 |
| | 4 |
| | 423 |
|
| Energy and Environmental Solutions | 279 |
| | 15 |
| | 9 |
| | 1 |
| | 173 |
|
| Total Segment | $ | 9,072 |
| | $ | 2,108 |
| | $ | 293 |
| | $ | 146 |
| | $ | 8,146 |
|
| 2013: | | | | | | | | | |
| Silicon Systems Group | $ | 4,775 |
| | $ | 876 |
| | $ | 260 |
| | $ | 118 |
| | $ | 5,525 |
|
| Applied Global Services | 2,023 |
| | 436 |
| | 13 |
| | 7 |
| | 1,958 |
|
| Display | 538 |
| | 74 |
| | 8 |
| | 6 |
| | 293 |
|
| Energy and Environmental Solutions | 173 |
| | (433 | ) | | 22 |
| | 1 |
| | 183 |
|
| Total Segment | $ | 7,509 |
| | $ | 953 |
| | $ | 303 |
| | $ | 132 |
| | $ | 7,959 |
|
| 2012: | | | | | | | | | |
| Silicon Systems Group | $ | 5,536 |
| | $ | 1,243 |
| | $ | 256 |
| | $ | 71 |
| | $ | 5,106 |
|
| Applied Global Services | 2,285 |
| | 502 |
| | 17 |
| | 8 |
| | 2,035 |
|
| Display | 473 |
| | 25 |
| | 8 |
| | 1 |
| | 278 |
|
| Energy and Environmental Solutions | 425 |
| | (668 | ) | | 38 |
| | 6 |
| | 513 |
|
| Total Segment | $ | 8,719 |
| | $ | 1,102 |
| | $ | 319 |
| | $ | 86 |
| | $ | 7,932 |
|
Operating results for fiscal 20112014, 2013 and 2012 included impairmentrestructuring charges of $24 million, which were reportedand asset impairments as discussed in the Applied Global Services segment.In fiscal 2010, Applied recorded charges related to a plan to restructure its Energydetail in Note 11, Restructuring Charges and Environmental Solutions segment totaling $405 million, which included inventory related charges of $247 million related to SunFab thin film solar equipment, asset impairment charges of $110 million, employee severance charges of $45 million, and other costs of $3 million. These charges were reported in the Energy and Environmental Solutions segment. Operating results in the Energy and Environmental Solutions segment for fiscal 2011 included favorable adjustments of $36 million related to this restructuring program.
Asset Impairments.
APPLIED MATERIALS, INC.NOTES TO CONSOLIDATED FINANCIAL STATEMENTS — (Continued)
Reconciliations of segment operating results to Applied consolidated totals for fiscal 2011, 20102014, 2013 and 20092012 are as follows:
| | | | | | | | | | | | |
| | | 2011 | | | 2010 | | | 2009 | |
| | | (In millions) | |
Total segment operating income | | $ | 2,846 | | | $ | 2,030 | | | $ | 133 | |
Corporate and unallocated costs | | | (496 | ) | | | (553 | ) | | | (371 | ) |
Restructuring charges and asset impairments | | | 21 | | | | (93 | ) | | | (156 | ) |
Gain on sale of facility | | | 27 | | | | — | | | | — | |
| | | | | | | | | | | | |
Income (loss) from operations | | $ | 2,398 | | | $ | 1,384 | | | $ | (394 | ) |
| | | | | | | | | | | | |
|
| | | | | | | | | | | |
| | 2014 | | 2013 | | 2012 |
| | | | | | |
| | (In millions) |
| Total segment operating income | $ | 2,108 |
| | $ | 953 |
| | $ | 1,102 |
|
| Corporate and unallocated costs | (540 | ) | | (462 | ) | | (580 | ) |
| Restructuring charges and asset impairments | (5 | ) | | (35 | ) | | (111 | ) |
| Certain items associated with announced business combination | (73 | ) | | (17 | ) | | — |
|
| Gain (loss) on derivative associated with announced business combination | 30 |
| | (7 | ) | | — |
|
| Income from operations | $ | 1,520 |
| | $ | 432 |
| | $ | 411 |
|
Corporate and unallocated costs for fiscal 2012 included deal and other costs related to completed acquisitions of $45 million.
APPLIED MATERIALS, INC.
NOTES TO CONSOLIDATED FINANCIAL STATEMENTS — (Continued)
Reconciliations of depreciation and amortization expense to Applied consolidated totals for fiscal 2011, 20102014, 2013 and 20092012 are as follows: | | | | | | | | | | | | |
| | | 2011 | | | 2010 | | | 2009 | |
| | | (In millions) | |
Total segment depreciation and amortization | | $ | 106 | | | $ | 156 | | | $ | 179 | |
Depreciation on shared facilities and information technology assets | | | 140 | | | | 149 | | | | 112 | |
| | | | | | | | | | | | |
Consolidated depreciation and amortization | | $ | 246 | | | $ | 305 | | | $ | 291 | |
| | | | | | | | | | | | |
|
| | | | | | | | | | | |
| | 2014 | | 2013 | | 2012 |
| | | | | | |
| | (In millions) |
| Total segment depreciation and amortization | $ | 293 |
| | $ | 303 |
| | $ | 319 |
|
| Depreciation on shared facilities and information technology assets | 82 |
| | 107 |
| | 103 |
|
| Consolidated depreciation and amortization | $ | 375 |
| | $ | 410 |
| | $ | 422 |
|
Reconciliations of capital expenditures to Applied consolidated totals for fiscal 2011, 20102014, 2013 and 20092012 are as follows: | | | | | | | | | | | | |
| | | 2011 | | | 2010 | | | 2009 | |
| | | (In millions) | |
Total segment capital expenditures | | $ | 113 | | | $ | 90 | | | $ | 104 | |
Shared facilities and information technology assets | | | 96 | | | | 79 | | | | 145 | |
| | | | | | | | | | | | |
Consolidated capital expenditures | | $ | 209 | | | $ | 169 | | | $ | 249 | |
| | | | | | | | | | | | |
|
| | | | | | | | | | | |
| | 2014 | | 2013 | | 2012 |
| | | | | | |
| | (In millions) |
| Total segment capital expenditures | $ | 146 |
| | $ | 132 |
| | $ | 86 |
|
| Shared facilities and information technology assets | 95 |
| | 65 |
| | 76 |
|
| Consolidated capital expenditures | $ | 241 |
| | $ | 197 |
| | $ | 162 |
|
Reconciliations of segment assets to Applied consolidated totals as of October 30, 2011, 26, 2014, and October 31, 2010 and October 25, 200927, 2013 are as follows: | | | | | | | | | | | | |
| | | October 30,
2011 | | | October 31,
2010 | | | October 25,
2009 | |
| | | (In millions) | |
Total segment assets | | $ | 5,270 | | | $ | 5,423 | | | $ | 4,536 | |
Cash and investments | | | 7,174 | | | | 3,892 | | | | 3,267 | |
Allowance for bad debts | | | (73 | ) | | | (74 | ) | | | (68 | ) |
Deferred income taxes | | | 658 | | | | 625 | | | | 455 | |
Other current assets | | | 90 | | | | 93 | | | | 337 | |
Common property, plant and equipment | | | 620 | | | | 740 | | | | 821 | |
Other assets | | | 122 | | | | 244 | | | | 226 | |
| | | | | | | | | | | | |
Consolidated total assets | | $ | 13,861 | | | $ | 10,943 | | | $ | 9,574 | |
| | | | | | | | | | | | |
|
| | | | | | | |
| | October 26,
2014 | | October 27,
2013 |
| | | | |
| | (In millions) |
| Total segment assets | $ | 8,146 |
| | $ | 7,959 |
|
| Cash and investments | 4,060 |
| | 2,896 |
|
| Allowance for bad debts | (58 | ) | | (74 | ) |
| Deferred income taxes | 299 |
| | 376 |
|
| Other current assets | 147 |
| | 203 |
|
| Common property, plant and equipment | 522 |
| | 541 |
|
| Other assets | 58 |
| | 142 |
|
| Consolidated total assets | $ | 13,174 |
| | $ | 12,043 |
|
NOTES TO CONSOLIDATED FINANCIAL STATEMENTS — (Continued)
For geographical reporting, revenue
is attributed to theby geographic location
in whichis determined by the
location of customers’ facilities
are located.to which products were shipped. Long-lived assets consist primarily of property, plant and equipment and equity-method investments, and are attributed to the geographic location in which they are located. Net sales and long-lived assets by geographic region were as follows:
| | | | | | | | |
| | | Net Sales | | | Long-lived
Assets | |
| | | (In millions) | |
2011: | | | | | | | | |
North America(1) | | $ | 1,963 | | | $ | 623 | |
| | | | | | | | |
China | | | 2,574 | | | | 81 | |
Taiwan | | | 2,093 | | | | 33 | |
Korea | | | 1,263 | | | | 8 | |
Europe | | | 1,120 | | | | 128 | |
Japan | | | 912 | | | | 7 | |
Southeast Asia | | | 592 | | | | 71 | |
| | | | | | | | |
Total outside North America | | | 8,554 | | | | 328 | |
| | | | | | | | |
Consolidated total | | $ | 10,517 | | | $ | 951 | |
| | | | | | | | |
2010: | | | | | | | | |
North America(1) | | $ | 1,147 | | | $ | 715 | |
| | | | | | | | |
China | | | 1,557 | | | | 78 | |
Taiwan | | | 2,750 | | | | 32 | |
Korea | | | 1,768 | | | | 5 | |
Europe | | | 981 | | | | 95 | |
Japan | | | 768 | | | | 5 | |
Southeast Asia | | | 578 | | | | 65 | |
| | | | | | | | |
Total outside North America | | | 8,402 | | | | 280 | |
| | | | | | | | |
Consolidated total | | $ | 9,549 | | | $ | 995 | |
| | | | | | | | |
2009: | | | | | | | | |
North America(1) | | $ | 966 | | | $ | 803 | |
| | | | | | | | |
China | | | 635 | | | | 98 | |
Taiwan | | | 1,026 | | | | 33 | |
Korea | | | 664 | | | | 5 | |
Europe | | | 753 | | | | 115 | |
Japan | | | 718 | | | | 7 | |
Southeast Asia | | | 252 | | | | 57 | |
| | | | | | | | |
Total outside North America | | | 4,048 | | | | 315 | |
| | | | | | | | |
Consolidated total | | $ | 5,014 | | | $ | 1,118 | |
| | | | | | | | |
(1) | Primarily the United States. |
|
| | | | | | | |
| | Net Sales | | Long-lived Assets |
| | | | |
| | (In millions) |
| 2014: | | | |
| United States | $ | 1,966 |
| | $ | 636 |
|
| Taiwan | 2,702 |
| | 34 |
|
| China | 1,608 |
| | 61 |
|
| Korea | 965 |
| | 12 |
|
| Japan | 817 |
| | 5 |
|
| Europe | 658 |
| | 99 |
|
| Southeast Asia | 356 |
| | 77 |
|
| Total outside United States | 7,106 |
| | 288 |
|
| Consolidated total | $ | 9,072 |
| | $ | 924 |
|
| 2013: | | | |
| United States | $ | 1,473 |
| | $ | 620 |
|
| Taiwan | 2,640 |
| | 37 |
|
| China | 787 |
| | 65 |
|
| Korea | 924 |
| | 8 |
|
| Japan | 685 |
| | 4 |
|
| Europe | 680 |
| | 99 |
|
| Southeast Asia | 320 |
| | 81 |
|
| Total outside United States | 6,036 |
| | 294 |
|
| Consolidated total | $ | 7,509 |
| | $ | 914 |
|
| 2012: | | | |
| United States | $ | 1,749 |
| | $ | 666 |
|
| Taiwan | 2,411 |
| | 36 |
|
| China | 783 |
| | 74 |
|
| Korea | 1,897 |
| | 9 |
|
| Japan | 704 |
| | 6 |
|
| Europe | 863 |
| | 110 |
|
| Southeast Asia | 312 |
| | 87 |
|
| Total outside United States | 6,970 |
| | 322 |
|
| Consolidated total | $ | 8,719 |
| | $ | 988 |
|
APPLIED MATERIALS, INC.NOTES TO CONSOLIDATED FINANCIAL STATEMENTS — (Continued)
The following companies accounted for at least 10 percent of Applied’s net sales in fiscal 2011, 2010, and/2014, 2013, or 2009,2012, which were for products in multiple reportable segments.
| | | | | | | | | | | | |
| | | 2011 | | | 2010 | | | 2009 | |
Samsung Electronics Co., Ltd. | | | 12 | % | | | 14 | % | | | 10 | % |
Taiwan Semiconductor Manufacturing Company Limited | | | 10 | % | | | 11 | % | | | * | |
Intel Corporation | | | 10 | % | | | * | | | | 12 | % |
|
| | | | | | | | |
| | 2014 | | 2013 | | 2012 |
| Taiwan Semiconductor Manufacturing Company Limited | 21 | % | | 27 | % | | 16 | % |
| Samsung Electronics Co., Ltd. | 12 | % | | 13 | % | | 20 | % |
APPLIED MATERIALS, INC.
NOTES TO CONSOLIDATED FINANCIAL STATEMENTS — (Continued)
On November 10, 2011, Applied completed its acquisition of Varian. The aggregate purchase price of the acquisition was approximately $4.2 billion, net of cash acquired. The transaction was funded with a combination of cash and proceeds of long-term debt issued in June 2011. Following the acquisition of Varian Applied’s cash, cash equivalents and investments totaled approximately $3.0 billion.
Note 18 | Unaudited Quarterly Consolidated Financial Data |
| | | | | | | | | | | | | | | | | | | | |
| | | Fiscal Quarter | | | | |
| | | First | | | Second | | | Third | | | Fourth | | | Fiscal Year | |
| | | (In millions, except per share amounts) | |
2011: | | | | | | | | | | | | | | | | | | | | |
Net sales | | $ | 2,686 | | | $ | 2,862 | | | $ | 2,787 | | | $ | 2,182 | | | $ | 10,517 | |
Gross margin | | $ | 1,136 | | | $ | 1,189 | | | $ | 1,184 | | | $ | 852 | | | $ | 4,360 | |
Net income | | $ | 506 | | | $ | 489 | | | $ | 476 | | | $ | 456 | | | $ | 1,926 | |
Earnings per diluted share | | $ | 0.38 | | | $ | 0.37 | | | $ | 0.36 | | | $ | 0.34 | | | $ | 1.45 | |
2010: | | | | | | | | | | | | | | | | | | | | |
Net sales | | $ | 1,849 | | | $ | 2,296 | | | $ | 2,518 | | | $ | 2,886 | | | $ | 9,549 | |
Gross margin | | $ | 711 | | | $ | 927 | | | $ | 860 | | | $ | 1,217 | | | $ | 3,715 | |
Net income | | $ | 83 | | | $ | 264 | | | $ | 123 | | | $ | 468 | | | $ | 938 | |
Earnings per diluted share | | $ | 0.06 | | | $ | 0.20 | | | $ | 0.09 | | | $ | 0.35 | | | $ | 0.70 | |
|
| | | | | | | | | | | | | | | | | | | |
| | Fiscal Quarter | | |
| | First | | Second | | Third | | Fourth | | Fiscal Year |
| | | | | | | | | | |
| | (In millions, except per share amounts) |
| 2014: | | | | | | | | | |
| Net sales | $ | 2,190 |
| | $ | 2,353 |
| | $ | 2,265 |
| | $ | 2,264 |
| | $ | 9,072 |
|
| Gross margin | $ | 891 |
| | $ | 1,001 |
| | $ | 992 |
| | $ | 959 |
| | $ | 3,843 |
|
| Net income | $ | 253 |
| | $ | 262 |
| | $ | 301 |
| | $ | 256 |
| | $ | 1,072 |
|
| Earnings per diluted share | $ | 0.21 |
| | $ | 0.21 |
| | $ | 0.24 |
| | $ | 0.21 |
| | $ | 0.87 |
|
| 2013: | | | | | | | | | |
| Net sales | $ | 1,573 |
| | $ | 1,973 |
| | $ | 1,975 |
| | $ | 1,988 |
| | $ | 7,509 |
|
| Gross margin | $ | 582 |
| | $ | 808 |
| | $ | 806 |
| | $ | 795 |
| | $ | 2,991 |
|
| Net income (loss) | $ | 34 |
| | $ | (129 | ) | | $ | 168 |
| | $ | 183 |
| | $ | 256 |
|
| Earnings (loss) per diluted share | $ | 0.03 |
| | $ | (0.11 | ) | | $ | 0.14 |
| | $ | 0.15 |
| | $ | 0.21 |
|
REPORT OF INDEPENDENT REGISTERED PUBLIC ACCOUNTING FIRM
The Board
Table of Directors and StockholdersApplied Materials, Inc.:
We have audited the accompanying consolidated balance sheets of Applied Materials, Inc. and subsidiaries (the Company) as of October 30, 2011 and October 31, 2010, and the related consolidated statements of operations, stockholders’ equity and comprehensive income (loss), and cash flows for each of the years in the three-year period ended October 30, 2011. In connection with our audits of the consolidated financial statements, we also have audited financial statement schedule II. These consolidated financial statements and financial statement schedule are the responsibility of the Company’s management. Our responsibility is to express an opinion on these consolidated financial statements and financial statement schedule based on our audits.
We conducted our audits in accordance with the standards of the Public Company Accounting Oversight Board (United States). Those standards require that we plan and perform the audit to obtain reasonable assurance about whether the financial statements are free of material misstatement. An audit includes examining, on a test basis, evidence supporting the amounts and disclosures in the financial statements. An audit also includes assessing the accounting principles used and significant estimates made by management, as well as evaluating the overall financial statement presentation. We believe that our audits provide a reasonable basis for our opinion.
In our opinion, the consolidated financial statements referred to above present fairly, in all material respects, the financial position of Applied Materials, Inc. and subsidiaries as of October 30, 2011 and October 31, 2010, and the results of their operations and their cash flows for each of the years in the three-year period ended October 30, 2011, in conformity with U.S. generally accepted accounting principles. Also in our opinion, the related financial statement schedule, when considered in relation to the basic consolidated financial statements taken as a whole, presents fairly, in all material respects, the information set forth therein.
As discussed in Note 1 to the consolidated financial statements, the Company adopted Accounting Standards Codification Topic 805,Business Combinations, during the year ended October 31, 2010.
We also have audited, in accordance with the standards of the Public Company Accounting Oversight Board (United States), Applied Materials, Inc.’s internal control over financial reporting as of October 30, 2011, based on criteria established in Internal Control—Integrated Framework issued by the Committee of Sponsoring Organizations of the Treadway Commission (COSO), and our report dated December 6, 2011 expressed an unqualified opinion on the effectiveness of the Company’s internal control over financial reporting.
Contents Mountain View, California
December 6, 2011
These Exhibits are numbered in accordance with the Exhibit Table of Item 601 of Regulation S-K:
|
| | | | | |
| | | Incorporated by Reference |
| Exhibit No. | Description | Form | File No. | Exhibit No. | Filing Date |
| 2.1** | Business Combination Agreement, dated as of September 24, 2013, between Applied Materials, Inc. and Tokyo Electron Limited | 8-K | 000-06920 | 2.1 | 9/24/2013 |
| 2.2** | Amendment No.1 to Business Combination Agreement, dated as of February 14, 2014, by and among Applied Materials, Inc., Tokyo Electron Limited and TEL-Applied Holdings B.V. | 8-K | 000-06920 | 2.1 | 2/18/2014 |
| 3.1 | Certificate of Incorporation of Applied Materials, Inc., as amended and restated through March 10, 2009 | 10-Q | 000-06920 | 3.1 | 6/3/2009 |
| 3.2 | Certificate of Designation, Preferences and Rights of the Terms of the Series A Junior Participating Preferred Stock dated as of July 9, 1999 | 10-Q | 000-06920 | 3(i)(a) | 9/14/1999 |
| 3.3 | Bylaws of Applied Materials, Inc., amended and restated to December 6, 2011 | 8-K | 000-06920 | 3.1 | 12/7/2011 |
| 4.1 | Form of Indenture (including form of debt security) between Applied Materials, Inc. and Harris Trust Company of California, as Trustee | 8-K | 000-06920 | 4.1 | 8/17/1994 |
| 4.2 | Indenture, dated June 8, 2011, by and between Applied Materials, Inc. and U.S. Bank National Association, as Trustee | 8-K | 000-06920 | 4.1 | 6/10/2011 |
| 4.3 | First Supplemental Indenture, dated June 8, 2011, by and between Applied Materials, Inc. and U.S. Bank National Association, as Trustee | 8-K | 000-06920 | 4.2 | 6/10/2011 |
| 10.1* | Applied Materials, Inc. Executive Deferred Compensation Plan, as amended and restated on April 1, 1995 | 10-Q | 000-06920 | 10.24 | 6/7/1995 |
| 10.2* | Amendment No. 1 to the Applied Materials, Inc. Executive Deferred Compensation Plan | 10-Q | 000-06920 | 10.1 | 9/9/1998 |
| 10.3* | Amendment No. 2 to the Applied Materials, Inc. Executive Deferred Compensation Plan | 10-Q | 000-06920 | 10.2 | 9/9/1998 |
| 10.4 | Form of Indemnification Agreement between Applied Materials, Inc. and Non-Employee Directors | 10-K | 000-06920 | 10.44 | 1/31/2000 |
| 10.5 | Form of Indemnification Agreement between Applied Materials, Inc. and certain of its officers | 10-K | 000-06920 | 10.46 | 1/31/2000 |
| 10.6 | Applied Materials, Inc. Profit Sharing Scheme (Ireland) | S-8 | 333-45011 | 4.1 | 1/27/1998 |
| 10.7* | Applied Materials, Inc. amended and restated Relocation Policy | 8-K | 000-06920 | 10.46 | 10/31/2005 |
| 10.8* | Amendment No. 3 to the Applied Materials, Inc. Executive Deferred Compensation Plan | 10-K | 000-06920 | 10.46 | 12/14/2005 |
| 10.9* | Amendment No. 4 to the Applied Materials, Inc. Executive Deferred Compensation Plan | 10-K | 000-06920 | 10.47 | 12/14/2005 |
| 10.10* | Applied Materials Inc. Employee Financial Assistance Plan, amended and restated as of December 18, 2008 | 10-Q | 000-06920 | 10.58 | 3/3/2009 |
| 10.11* | Form of Non-Qualified Stock Option Grant Agreement for use under the Applied Materials Employee Stock Incentive Plan, as amended | 10-Q | 000-06920 | 10.45 | 5/30/2007 |
| 10.12* | Applied Materials, Inc. amended and restated 2005 Executive Deferred Compensation Plan | 8-K | 000-06920 | 10.49 | 7/13/2007 |
| | | | | | |
| | | | | | |
| | | | | | |
| | | | | | |
|
| | | | | |
| | | Incorporated by Reference |
| Exhibit No. | Description | Form | File No. | Exhibit No. | Filing Date |
| 10.13* | Form of Non-Qualified Stock Option Grant Agreement for use under the Applied Materials, Inc. Employee Stock Incentive Plan, as amended | 10-K | 000-06920 | 10.50 | 12/14/2007 |
| 10.14* | Form of Restricted Stock Agreement for use under the Applied Materials, Inc. Employee Stock Incentive Plan, as amended | 10-Q | 000-06920 | 10.57 | 8/29/2008 |
| 10.15 | Deed of Amendment to Applied Materials Profit Sharing Scheme, dated February 7, 2006, to amend Clause 20 of the Trust Deed thereunder | 10-K | 000-06920 | 10.48 | 12/12/2008 |
| 10.16 | Deed of Amendment to Applied Materials Profit Sharing Scheme, dated February 7, 2006, to amend the definition of Eligible Employee in the First Schedule to the Trust Deed thereunder. | 10-K | 000-06920 | 10.49 | 12/12/2008 |
| 10.17* | Amendment No. 5 to the Applied Materials, Inc. Executive Deferred Compensation Plan | 10-K | 000-06920 | 10.50 | 12/12/2008 |
| 10.18* | Amendment No. 6 to the Applied Materials, Inc. Executive Deferred Compensation Plan | 10-Q | 000-06920 | 10.59 | 3/3/2009 |
| 10.19* | Amendment No. 1 to the Applied Materials, Inc. 2005 Executive Deferred Compensation Plan | 10-K | 000-06920 | 10.51 | 12/12/2008 |
| 10.20* | Amendment No. 2 to the Applied Materials, Inc. 2005 Executive Deferred Compensation Plan | 10-Q | 000-06920 | 10.60 | 3/3/2009 |
| 10.21* | Form of Performance Shares Agreement for use under the Applied Materials, Inc. Employee Stock Incentive Plan, as amended | 10-K | 000-06920 | 10.56 | 12/12/2008 |
| 10.22* | Form of Performance Shares Agreement for Nonemployee Directors for use under the Applied Materials, Inc. Employee Stock Incentive Plan, as amended | 10-Q | 000-06920 | 10.61 | 3/3/2009 |
| 10.23* | Form of Non-Qualified Stock Option Agreement for Employees for use under the Applied Materials, Inc. Employee Stock Incentive Plan, as amended | 10-Q | 000-06920 | 10.63 | 3/3/2009 |
| 10.24* | Amendment No. 7 to the Applied Materials, Inc. Executive Deferred Compensation Plan | 10-Q | 000-06920 | 10.67 | 6/9/2010 |
| 10.25* | Amendment No. 3 to the Applied Materials, Inc. 2005 Executive Deferred Compensation Plan | 10-Q | 000-06920 | 10.68 | 6/9/2010 |
| 10.26* | Form of Performance Share Agreement for use under the Applied Materials, Inc. Employee Stock Incentive Plan, as amended | 10-Q | 000-06920 | 10.71 | 6/9/2010 |
| 10.27* | Form of Restricted Stock Agreement for use under the Applied Materials, Inc. Employee Stock Incentive Plan, as amended | 10-Q | 000-06920 | 10.72 | 6/9/2010 |
| 10.28* | Amendment No. 8 to the Applied Materials, Inc. Executive Deferred Compensation Plan | 10-Q | 000-06920 | 10.60 | 2/28/2011 |
| 10.29* | Amendment No. 4 to the Applied Materials, Inc. 2005 Executive Deferred Compensation Plan | 10-Q | 000-06920 | 10.61 | 2/28/2011 |
| 10.30 | Credit Agreement, dated as of May 25, 2011, among Applied Materials, Inc., JPMorgan Chase Bank, N.A., as administrative agent, and other lenders named therein | 10-Q/A | 000-06920 | 10.64 | 11/18/2011 |
| 10.31* | Form of Performance Unit Agreement for use under the Applied Materials, Inc. Employee Stock Incentive Plan, as amended | 10-Q | 000-06920 | 10.1 | 2/27/2012 |
| 10.32* | Applied Materials, Inc. Employee Stock Incentive Plan, amended and restated effective March 6, 2012 | 8-K | 000-06920 | 10.1 | 3/9/2012 |
| | | | | | |
| | | | | | |
|
| | | | | |
| | | Incorporated by Reference |
| Exhibit No. | Description | Form | File No. | Exhibit No. | Filing Date |
| 10.33* | Applied Materials, Inc. Senior Executive Bonus Plan, amended and restated effective March 6, 2012 | 8-K | 000-06920 | 10.2 | 3/9/2012 |
| 10.34* | Form of Restricted Stock Unit Agreement for use under the amended and restated Applied Materials, Inc. Employee Stock Incentive Plan | 10-Q | 000-06920 | 10.3 | 5/24/2012 |
| 10.35* | Form of Restricted Stock Unit Agreement for Nonemployee Directors for use under the amended and restated Applied Materials, Inc. Employee Stock Incentive Plan | 10-Q | 000-06920 | 10.4 | 5/24/2012 |
| 10.36* | Form of Performance Shares Agreement for use under the amended and restated Applied Materials, Inc. Employee Stock Incentive Plan | 10-Q | 000-06920 | 10.5 | 5/24/2012 |
| 10.37 | Amendment No. 1 and Extension Agreement, dated as of May 25, 2012, to Credit Agreement, dated as of May 25, 2011, among Applied Materials, Inc., JPMorgan Chase Bank, N.A. as administrative agent, and other lenders named therein | 8-K | 000-06920 | 10.1 | 5/30/2012 |
| 10.38* | Form of Restricted Stock Agreement for use under the amended and restated Applied Materials, Inc. Employee Stock Incentive Plan | 10-Q | 000-06920 | 10.3 | 8/23/2012 |
| 10.39* | Applied Materials, Inc. Employees' Stock Purchase Plan, amended and restated effective October 28, 2012 | 10-K | 000-06920 | 10.54 | 12/5/2012 |
| 10.40* | Applied Materials, Inc. Stock Purchase Plan for Offshore Employees, amended and restated effective October 28, 2012 | 10-K | 000-06920 | 10.55 | 12/5/2012 |
| 10.41 | Extension Agreement, dated as of May 25, 2013, to Credit Agreement, dated as of May 25, 2011, as amended, among Applied Materials, Inc., JPMorgan Chase Bank, N.A. as administrative agent and the lenders parties thereto | 8-K | 000-06920 | 10.1 | 5/28/2013 |
| 10.42* | Offer Letter, dated August 14, 2013, between Applied Materials, Inc. and Gary E. Dickerson | 10-Q | 000-06920 | 10.2 | 8/22/2013 |
| 10.43* | Offer Letter, dated August 15, 2013, between Applied Materials, Inc. and Michael R. Splinter | 10-Q | 000-06920 | 10.3 | 8/22/2013 |
| 10.44* | Form of Non-Qualified Stock Option Agreement for Employees for use under the Applied Materials, Inc. Employee Stock Incentive Plan, as amended | 10-Q | 000-06920 | 10.4 | 8/22/2013 |
| 10.45* | Offer Letter, dated May 3, 2011, between Applied Materials, Inc. and Robert J. Halliday | 10-K | 000-06920 | 10.52 | 12/4/2013 |
| 10.46* | Form of Retention Bonus and Equity Award Amendment Agreement entered into between Applied Materials, Inc. and certain officers identified in the attached schedule | 10-K | 000-06920 | 10.53 | 12/4/2013 |
| 10.47* | Retention and Equity Award Amendment Agreement, dated December 20, 2013, between Applied Materials, Inc. and Michael R. Splinter | 10-Q | 000-06920 | 10.1 | 2/20/2014 |
| 10.48* | Form of Performance Unit Agreement for use under the Applied Materials, Inc. Employee Stock Incentive Plan, as amended | 10-Q | 000-06920 | 10.2 | 2/20/2014 |
| 10.49* | Form of Letter of Understanding for Long-Term Assignment† | | | | |
| 10.50* | Applied Materials, Inc. Applied Incentive Plan, amended and restated effective October 28, 2013† | | | | |
| 10.51* | Amendment No. 5 to the Applied Materials, Inc. 2005 Executive Deferred Compensation Plan† | | | | |
| | | | | | |
| | | | | | |
| | | | | | |
| | | | | | |
| | | | | | |
|
| | | | | |
Exhibit No.
| | Description
Incorporated by Reference |
2.1**Exhibit No. | | Agreement and Plan of Merger dated as of May 3, 2011, among Applied Materials, Inc., Barcelona Acquisition Corp. and Varian Semiconductor Equipment Associates, Inc., incorporated by reference to Applied’s Form 8-K (file no. 000-06920) filed on May 4, 2011. |
3.1 | | Certificate of Incorporation of Applied Materials, Inc., as amended and restated through March 10, 2009, incorporated by reference to Applied’s Form 10-Q for the quarter ended April 26, 2009 (file no. 000-06920) filed June 3, 2009. |
3.2 | | Certificate of Designation, Preferences and Rights of the Terms of the Series A Junior Participating Preferred Stock dated as of July 9, 1999, incorporated by reference to Applied’s Form 10-Q for the quarter ended August 1, 1999 (file no. 000-06920) filed September 14, 1999. |
3.3 | | Bylaws of Applied Materials, Inc., as amended and restated through December 8, 2008, incorporated by reference to Applied’s Form 8-K (file no. 000-06920) filed December 10, 2008. |
4.1 | Description | Form of Indenture (including form of debt security) between Applied Materials, Inc. and Harris Trust Company of California, as Trustee, incorporated by reference to Applied’s Form 8-K (file no. 000-06920) filed August 17, 1994. |
4.2 | File No. | Indenture, dated June 8, 2011, by and between Applied Materials, Inc. and U.S. Bank National Association, incorporated by reference to Applied’s Form 8-K (file no. 000-06920) filed June 10, 2011. |
4.3 | | First Supplemental Indenture, dated June 8, 2011, by and between Applied Materials, Inc. and U.S. Bank National Association, incorporated by reference to Applied’s Form 8-K (file no. 000-06920) filed June 10, 2011. |
10.1* | | Applied Materials, Inc. Executive Deferred Compensation Plan, as amended and restated on April 1, 1995, incorporated by reference to Applied’s Form 10-Q for the quarter ended April 30, 1995 (file no. 000-06920) filed June 7, 1995. |
10.2* | | Amendment No. 1 to the Applied Materials, Inc. Executive Deferred Compensation Plan, incorporated by reference to Applied’s Form 10-Q for the quarter ended July 26, 1998 (file no. 000-06920) filed September 9, 1998. |
10.3* | | Amendment No. 2 to the Applied Materials, Inc. Executive Deferred Compensation Plan, incorporated by reference to Applied’s Form 10-Q for the quarter ended July 26, 1998 (file no. 000-06920) filed September 9, 1998. |
10.4 | | Form of Indemnification Agreement between Applied Materials, Inc. and Non-Employee Directors, dated June 11, 1999, incorporated by reference to Applied’s Form 10-K for fiscal year 1999 (file no. 333-88777) filed January 31, 2000. |
10.5 | | Form of Indemnification Agreement between Applied Materials, Inc. and certain of its officers, incorporated by reference to Applied’s Form 10-K for fiscal year 1999 (file no. 333-88777) filed January 31, 2000. |
10.6* | | Applied Materials, Inc. amended and restated 2000 Global Equity Incentive Plan, incorporated by reference to Applied’s Form 10-K for fiscal year 2002 (file no. 000-06920) filed January 23, 2003. |
10.7 | | Applied Materials Profit Sharing Scheme, incorporated by reference to Applied’s S-8 (file no. 333-45011) filed January 27, 1998. |
10.8* | | Term Sheet for employment of Michael R. Splinter, as amended and restated December 8, 2008, incorporated by reference to Applied’s Form 10-Q for the quarter ended January 25, 2009 (file no. 000-06920) filed March 3, 2009. |
10.9 | | Binding Memorandum of Understanding between Applied Materials, Inc. and Novellus Systems, Inc. dated September 20, 2004, incorporated by reference to Applied’s Form 8-K (file no. 000-06920) filed September 24, 2004. (Confidential treatment has been granted for the redacted portions of the agreement.) |
| | |
Exhibit No. | | Description
|
10.10* | | Applied Materials, Inc. Nonemployee Director Share Purchase Plan, incorporated by reference to Applied’s Form 10-Q for the quarter ended May 1, 2005 (file no. 000-06920) filed May 31, 2005. |
10.11* | | Election Form to Receive Shares in lieu of Retainer and/or Meeting Fees for use under the Applied Materials, Inc. Nonemployee Director Share Purchase Plan, incorporated by reference to Applied’s Form 10-Q for the quarter ended May 1, 2005 (file no. 000-06920) filed May 31, 2005. |
10.12* | | Applied Materials, Inc. amended and restated Relocation Policy, incorporated by reference to Applied’s Form 8-K (file no. 000-06920) filed October 31, 2005. |
10.13* | | Amendment No. 3 to the Applied Materials, Inc. Executive Deferred Compensation Plan, incorporated by reference to Applied’s Form 10-K for fiscal year 2005 (file no. 000-06920) filed December 14, 2005. |
10.14* | | Amendment No. 4 to the Applied Materials, Inc. Executive Deferred Compensation Plan, incorporated by reference to Applied’s Form 10-K for fiscal year 2005 (file no. 000-06920) filed December 14, 2005. |
10.15* | | Form of Non-Qualified Stock Option Grant Agreement for use under the Applied Materials Employee Stock Incentive Plan, as amended, incorporated by reference to Applied’s Form 10-Q for the quarter ended July 30, 2006 (file no. 000-06920) filed August 31, 2006. |
10.16* | | Form of Non-Qualified Stock Option Grant Agreement for use under the Applied Materials, Inc. 2000 Global Equity Incentive Plan, as amended, incorporated by reference to Applied’s Form 10-Q for the quarter ended July 30, 2006 (file no. 000-06920) filed August 31, 2006. |
10.17* | | Form of Performance Shares Agreement for use under the Applied Materials, Inc. Employee Stock Incentive Plan, as amended, incorporated by reference to Applied’s Form 10-Q for the quarter ended July 30, 2006 (file no. 000-06920) filed August 31, 2006. |
10.18* | | Applied Materials, Inc. amended and restated Employee Financial Assistance Plan (as of December 18, 2008), incorporated by reference to Applied’s Form 10-Q for the quarter ended January 25, 2009 (file no. 000-06920) filed March 3, 2009. |
10.19* | | Form of Non-Qualified Stock Option Grant Agreement for use under the Applied Materials, Inc. Employee Stock Incentive Plan, as amended, incorporated by reference to Applied’s Form 10-Q for the quarter ended April 29, 2007 (file no. 000-06920) filed May 30, 2007. |
10.20* | | Form of Non-Qualified Stock Option Grant Agreement for use under the Applied Materials, Inc. 2000 Global Equity Incentive Plan, as amended, incorporated by reference to Applied’s Form 10-Q for the quarter ended April 29, 2007 (file no. 000-06920) filed May 30, 2007. |
10.21* | | Form of Performance Share Agreement for use under the Applied Materials, Inc. Employee Stock Incentive Plan, as amended, incorporated by reference to Applied’s Form 10-Q for the quarter ended April 29, 2007 (file no. 000-06920) filed May 30, 2007. |
10.22* | | Form of Restricted Stock Agreement for use under the Applied Materials, Inc. Employee Stock Incentive Plan, as amended, incorporated by reference to Applied’s Form 10-Q for the quarter ended April 29, 2007 (file no. 000-06920) filed May 30, 2007. |
10.23* | | Applied Materials, Inc. amended and restated 2005 Executive Deferred Compensation Plan, incorporated by reference to Applied’s Form 8-K (file no. 000-06920) filed July 13, 2007. |
10.24* | | Form of Performance Shares Agreement for use under the Applied Materials, Inc. Employee Stock Incentive Plan, as amended, incorporated by reference to Applied’s Form 10-K for fiscal year 2007 (file no. 000-06920) filed December 14, 2007. |
10.25* | | Form of Performance Shares Agreement for Nonemployee Directors for use under the Applied Materials, Inc. Employee Stock Incentive Plan, as amended, incorporated by reference to Applied’s Form 10-K for fiscal year 2007 (file no. 000-06920) filed December 14, 2007. |
10.26* | | Form of Non-Qualified Stock Option Grant Agreement for use under the Applied Materials, Inc. Employee Stock Incentive Plan, as amended, incorporated by reference to Applied’s Form 10-K for fiscal year 2007 (file no. 000-06920) filed December 14, 2007. |
| | |
Exhibit No.
| | Description
|
10.27* | | Form of Restricted Stock Agreement for use under the Applied Materials, Inc. Employee Stock Incentive Plan, as amended, incorporated by reference to Applied’s Form 10-K for fiscal year 2007 (file no. 000-06920) filed December 14, 2007. |
10.28* | | Form of Non-Qualified Stock Option Grant Agreement for use under the Applied Materials, Inc. 2000 Global Equity Incentive Plan, as amended, incorporated by reference to Applied’s Form 10-K for fiscal year 2007 (file no. 000-06920) filed December 14, 2007. |
10.29* | | Form of Restricted Stock Agreement for use under the Applied Materials, Inc. Employee Stock Incentive Plan, as amended, incorporated by reference to Applied’s Form 10-Q for the quarter ended July 27, 2008 (file no. 000-06920) filed August 29, 2008. |
10.30 | | Deed of Amendment to Applied Materials Profit Sharing Scheme, dated February 7, 2006, to amend Clause 20 of the Trust Deed thereunder, incorporated by reference to Applied’s Form 10-K for fiscal year 2008 (file no. 000-06920) filed December 12, 2008. |
10.31 | | Deed of Amendment to Applied Materials Profit Sharing Scheme, dated February 7, 2006, to amend the definition of Eligible Employee in the First Schedule to the Trust Deed thereunder, incorporated by reference to Applied’s Form 10-K for fiscal year 2008 (file no. 000-06920) filed December 12, 2008. |
10.32* | | Amendment No. 5 to the Applied Materials, Inc. Executive Deferred Compensation Plan, incorporated by reference to Applied’s Form 10-K for fiscal year 2008 (file no. 000-06920) filed December 12, 2008. |
10.33* | | Amendment No. 6 to the Applied Materials, Inc. Executive Deferred Compensation Plan, incorporated by reference to Applied’s Form 10-Q for the quarter ended January 25, 2009 (file no. 000-06920) filed March 3, 2009, incorporated by reference to Applied’s Form 10-K for fiscal year 2008 (file no. 000-06920) filed December 12, 2008. |
10.34* | | Amendment No. 1 to the Applied Materials, Inc. 2005 Executive Deferred Compensation Plan, incorporated by reference to Applied’s Form 10-K for fiscal year 2008 (file no. 000-06920) filed December 12, 2008. |
10.35* | | Amendment No. 2 to the Applied Materials, Inc. 2005 Executive Deferred Compensation Plan, incorporated by reference to Applied’s Form 10-Q for the quarter ended January 25, 2009 (file no. 000-06920) filed March 3, 2009. |
10.36* | | Applied Materials, Inc. amended and restated Employee Stock Incentive Plan, incorporated by reference to Applied’s Form 10-K for fiscal year 2008 (file no. 000-06920) filed December 12, 2008. |
10.37* | | Form of Performance Shares Agreement for use under the Applied Materials, Inc. Employee Stock Incentive Plan, as amended, incorporated by reference to Applied’s Form 10-K for fiscal year 2008 (file no. 000-06920) filed December 12, 2008. |
10.38* | | Form of Performance Shares Agreement for Nonemployee Directors for use under the Applied Materials, Inc. Employee Stock Incentive Plan, as amended, incorporated by reference to Applied’s Form 10-Q for the quarter ended January 25, 2009 (file no. 000-06920) filed March 3, 2009. |
10.39* | | Form of Non-Qualified Stock Option Agreement for Employees for use under the Applied Materials, Inc. Employee Stock Incentive Plan, as amended, incorporated by reference to Applied’s Form 10-Q for the quarter ended January 25, 2009 (file no. 000-06920) filed March 3, 2009. |
10.40* | | Form of Non-Qualified Stock Option Agreement for use under the Applied Materials, Inc. 2000 Global Equity Incentive Plan, as amended, incorporated by reference to Applied’s Form 10-Q for the quarter ended January 25, 2009 (file no. 000-06920) filed March 3, 2009. |
10.41* | | Separation Agreement and Release between Applied Materials, Inc. and Thomas M. St. Dennis dated October 5, 2009, incorporated by reference to Applied’s Form 10-K for fiscal year 2009 (file no. 000-06920) file December 11, 2009. |
| | |
Exhibit No.
| | Description
|
10.42* | | Applied Materials, Inc. Stock Purchase Plan for Offshore Employees, amended and restated effective December 7, 2009, incorporated by reference to Applied’s Form S-8 (file no. 333-165035) filed February 23, 2010. |
10.43* | | Applied Materials, Inc. Employees’ Stock Purchase Plan, amended and restated effective February 23, 2010, incorporated by reference to Applied’s Post-Effective Amendment No. 2 to Registration Statement on Form S-8 (file no. 333-143377) filed February 23, 2010. |
10.44* | | Amendment No. 7 to the Applied Materials, Inc. Executive Deferred Compensation Plan, incorporated by reference to Applied’s Form 10-Q for the quarter ended May 2, 2010 (file no. 000-06920) filed June 9, 2010. |
10.45* | | Amendment No. 3 to the Applied Materials, Inc. 2005 Executive Deferred Compensation Plan, incorporated by reference to Applied’s Form 10-Q for the quarter ended May 2, 2010 (file no. 000-06920) filed June 9, 2010. |
10.46* | | Amended and Restated Applied Materials, Inc. Senior Executive Bonus Plan, incorporated by reference to Applied’s Form 10-Q for the quarter ended May 2, 2010 (file no. 000-06920) filed June 9, 2010. |
10.47* | | Form of Performance Share Agreement for use under the Applied Materials, Inc. Employee Stock Incentive Plan, as amended, incorporated by reference to Applied’s Form 10-Q for the quarter ended May 2, 2010 (file no. 000-06920) filed June 9, 2010. |
10.48* | | Form of Restricted Stock Agreement for use under the Applied Materials, Inc. Employee Stock Incentive Plan, as amended, incorporated by reference to Applied’s Form 10-Q for the quarter ended May 2, 2010 (file no. 000-06920) filed June 9, 2010. |
10.49* | | Retirement Agreement and Release between Applied Materials, Inc. and Franz Janker dated July 10, 2010, incorporated by reference to Applied’s Form 10-Q for the quarter ended August 1, 2010 (file no. 000-06920) filed September 3, 2010. |
10.50* | | Amended and Restated Applied Materials, Inc. Applied Incentive Plan, incorporated by reference to Applied’s Form 10-K for the fiscal year ended October 31, 2011 (file no. 000-06920) filed December 10, 2010. |
10.51* | | Amendment No. 8 to the Applied Materials, Inc. Executive Deferred Compensation Plan, incorporated by reference to Applied’s Form 10-Q for the quarter ended January 30, 2011 (file no. 000-06920) filed February 28, 2011. |
10.52* | | Amendment No. 4 to the Applied Materials, Inc. 2005 Executive Deferred Compensation Plan, incorporated by reference to Applied’s Form 10-Q for the quarter ended January 30, 2011 (file no. 000-06920) filed February 28, 2011. |
10.53 | | Settlement Agreement between Applied Materials, Inc. and Samsung Electronics Co., Ltd. dated November 1, 2010, incorporated by reference to Applied’s Form 10-Q/A for the quarter ended January 30, 2011 (file no. 000-06920) filed May 19, 2011. (Confidential treatment has been granted for the redacted portions of the agreement.) |
10.54 | | Bridge Loan Agreement, dated as of May 25, 2011, among Applied Materials, Inc., JPMorgan Chase Bank, N.A., as administrative agent, and other lenders named therein, incorporated by reference to Applied’s Form 10-Q/A for the quarter ended July 31, 2011 (file no. 000-06920) filed November 18, 2011. |
10.55 | | Credit Agreement, dated as of May 25, 2011, among Applied Materials, Inc., JPMorgan Chase Bank, N.A., as administrative agent, and other lenders named therein, incorporated by reference to Applied’s Form 10-Q/A for the quarter ended July 31, 2011 (file no. 000-06920) filed November 18, 2011.Filing Date |
| 21 | | Subsidiaries of Applied Materials, Inc. † | | | | |
| 23 | | Consent of Independent Registered Public Accounting Firm, KPMG LLP.LLP† | | | | |
| 24 | | Power of Attorney |
| | |
Exhibit No.
Attorney† | | Description
| | |
| 31.1 | | Certification of Chief Executive Officer Pursuant to Section 302 of the Sarbanes-Oxley Act of 2002.2002† | | | | |
| 31.2 | | Certification of Chief Financial Officer Pursuant to Section 302 of the Sarbanes-Oxley Act of 2002.2002† | | | | |
| 32.1 | | Certification Pursuant to 18 U.S.C. Section 1350, as adopted pursuant to Section 906 of the Sarbanes-Oxley Act of 2002.2002‡ | | | | |
| 32.2 | | Certification Pursuant to 18 U.S.C. Section 1350, as adopted pursuant to Section 906 of the Sarbanes-Oxley Act of 2002.2002‡ | | | | |
| 101.INS | | XBRL Instance DocumentDocument‡ | | | | |
| 101.SCH | | XBRL Taxonomy Extension Schema DocumentDocument‡ | | | | |
| 101.CAL | | XBRL Taxonomy Extension Calculation Linkbase DocumentDocument‡ | | | | |
| 101.DEF | | XBRL Taxonomy Extension Definition Linkbase DocumentDocument‡ | | | | |
| 101.LAB | | XBRL Taxonomy Extension Label Linkbase DocumentDocument‡ | | | | |
| 101.PRE | | XBRL Taxonomy Extension Presentation Linkbase DocumentDocument‡ | | | | |
|
| |
| * | Indicates a management contract or compensatory plan or arrangement, as required by Item 15(a)3. |
|
| |
| ** | Schedules and certain exhibits to this agreement have been omitted pursuant to Item 601(b)(2) of Regulation S-K. Applied hereby undertakes to furnish supplementally copies of any of the omitted schedules and exhibits upon request by the Securities and Exchange Commission. |
Pursuant to the requirements of Section 13 or 15(d) of the Securities Exchange Act of 1934, the registrant has duly caused this report to be signed on its behalf by the undersigned, thereunto duly authorized.
|
| |
| APPLIED MATERIALS, INC. |
| |
| By: | | /S/ MICHAEL R. SPLINTERGARY E. DICKERSON |
| Gary E. Dickerson |
| | Michael R. Splinter |
| | President, Chief Executive Officer |
Dated: December 6, 201117, 2014
Pursuant to the requirements of the Securities Exchange Act of 1934, this report has been signed below by the following persons on behalf of the registrant and in the capacities and on the dates indicated.
| | | | |
| | Title
| | Date
|
| | |
/S/ MICHAEL R. SPLINTER
Michael R. Splinter
| | President, Chief Executive Officer (Principal
Executive Officer)
| | December 6, 2011 |
| | |
/S/ GEORGE S. DAVIS
George S. Davis
| | Executive Vice President, Chief
Financial Officer
(Principal Financial Officer)
| | December 6, 2011 |
| | |
/S/ THOMAS S. TIMKO
Thomas S. Timko
| | Corporate Vice President, Corporate
Controller and Chief Accounting
Officer (Principal Accounting Officer)
| | December 6, 2011 |
| | |
Directors:
| | | | |
| | |
| Title | Date |
/S/ GARY E. DICKERSON | President, Chief Executive Officer (Principal Executive Officer) | December 17, 2014 |
| Gary E. Dickerson | |
/S/ ROBERT J. HALLIDAY | Senior Vice President, Chief Financial Officer (Principal Financial Officer) | December 17, 2014 |
| Robert J. Halliday | |
/S/ CHARLES W. READ | Corporate Vice President, Corporate Controller and Chief Accounting Officer (Principal Accounting Officer) | December 17, 2014 |
| Charles W. Read | |
| Directors: | | |
| * | | |
| Michael R. Splinter | | Executive Chairman of the Board | December 17, 2014 |
| * | | December 6, 2011 |
| | |
*
Aart J. de Geus | | Director | | December 6, 201117, 2014 |
| * | | |
*
Stephen R. Forrest
| | Director
| | December 6, 2011 |
| | |
*
Thomas J. Iannotti
| | Director
| | December 6, 2011 |
| | |
*
Susan M. James
| | Director
| | December 6, 2011 |
| | |
*
Alexander A. Karsner
| | Director
| | December 6, 2011 |
| | |
*
Gerhard H. Parker
| | Director
| | December 6, 2011 |
| | | | |
| | |
Title
Gary E. Dickerson | Director | December 17, 2014 |
| * | | Date
|
| Stephen R. Forrest | Director | December 17, 2014 |
* | | |
| Thomas J. Iannotti | Director | December 17, 2014 |
| * | | |
| Susan M. James | Director | December 17, 2014 |
| * | | |
| Alexander A. Karsner | Director | December 17, 2014 |
| * | | |
| Gerhard H. Parker | Director | December 17, 2014 |
| * | | |
| Dennis D. Powell | Director | December 17, 2014 |
| * | | |
| Willem P. Roelandts | Director | December 17, 2014 |
| * | | December 6, 2011 |
| James E. Rogers | Director | December 17, 2014 |
* Willem P. Roelandts
| | Director
| | December 6, 2011 |
| | |
*
James E. Rogers
| | Director
| | December 6, 2011 |
| | |
*
Robert H. Swan | | Director | | December 6, 201117, 2014 |
Representing a majority of the members of the Board of Directors.
| | |
| |
| * By | | /s/ MICHAEL R. SPLINTERGARY E. DICKERSON |
| | Michael R. SplinterGary E. Dickerson |
| | Attorney-in-Fact** |
| |
| ** | By authority of the power of attorney filed herewith. |
SCHEDULE
SCHEDULE II
VALUATION AND QUALIFYING ACCOUNTS
ALLOWANCE FOR DOUBTFUL ACCOUNTS
| | | | | | | | | | | | | | | | | | | | |
Fiscal Year | | Balance at
Beginning of
Fiscal Year | | | Additions —
Charged to
Income | | | Deductions —
Recoveries | | | Deductions —
Not Charged to
Income | | | Balance at
End of
Fiscal Year | |
| | | (In millions) | |
2011 | | $ | 74 | | | $ | 5 | | | $ | (6 | ) | | $ | — | | | $ | 73 | |
2010 | | $ | 67 | | | $ | 17 | | | $ | (7 | ) | | $ | (3 | ) | | $ | 74 | |
2009 | | $ | 5 | | | $ | 63 | | | $ | (1 | ) | | $ | — | | | $ | 67 | |
124